Attached files
| file | filename |
|---|---|
| EX-99.1 - EXHIBIT 99.1 - Bonanza Creek Energy, Inc. | ex991123116.htm |
| EX-32.2 - EXHIBIT 32.2 - Bonanza Creek Energy, Inc. | ex32212312016.htm |
| EX-32.1 - EXHIBIT 32.1 - Bonanza Creek Energy, Inc. | ex32112312016.htm |
| EX-31.2 - EXHIBIT 31.2 - Bonanza Creek Energy, Inc. | ex31212312016.htm |
| EX-31.1 - EXHIBIT 31.1 - Bonanza Creek Energy, Inc. | ex31112312016.htm |
| EX-23.2 - EXHIBIT 23.2 - Bonanza Creek Energy, Inc. | ex232123116.htm |
| EX-23.1 - EXHIBIT 23.1 - Bonanza Creek Energy, Inc. | ex231123116.htm |
| EX-21.1 - EXHIBIT 21.1 - Bonanza Creek Energy, Inc. | ex211123116.htm |
| EX-10.34 - EXHIBIT 10.34 - Bonanza Creek Energy, Inc. | ex1034123116.htm |
UNITED STATES
SECURITIES AND EXCHANGE COMMISSION
Washington, D.C. 20549
____________________________
Form 10-K
x | ANNUAL REPORT PURSUANT TO SECTION 13 OR 15(d) OF THE SECURITIES EXCHANGE ACT OF 1934 |
For the fiscal year ended December 31, 2016 | |
OR | |
¨ | TRANSITION REPORT PURSUANT TO SECTION 13 OR 15(d) OF THE SECURITIES EXCHANGE ACT OF 1934 |
Commission file number: 001-35371
Bonanza Creek Energy, Inc.
(Exact name of registrant as specified in its charter)
Delaware (State or other jurisdiction of incorporation or organization) | 61-1630631 (I.R.S. Employer Identification No.) |
410 17th Street, Suite 1400 Denver, Colorado (Address of principal executive offices) | 80202 (Zip Code) |
(720) 440-6100
(Registrant’s telephone number, including area code)
Securities Registered Pursuant to Section 12(b) of the Act:
(Title of Class) | (Name of Exchange) | |
Common Stock, par value $0.001 per share | New York Stock Exchange | |
Securities Registered Pursuant to Section 12(g) of the Act: None
Indicate by check mark if the registrant is a well-known seasoned issuer, as defined in Rule 405 of the Securities Act. Yes ¨ No x
Indicate by check mark if the registrant is not required to file reports pursuant to Section 13 or Section 15(d) of the Act. Yes ¨ No x
Indicate by check mark whether the registrant (1) has filed all reports required to be filed by Section 13 or 15(d) of the Securities Exchange Act of 1934 during the preceding 12 months (or for such shorter period that the registrant was required to file such reports), and (2) has been subject to such filing requirements for the past 90 days. Yes x No ¨
Indicate by check mark whether the registrant has submitted electronically and posted on its corporate Web site, if any, every Interactive Data File required to be submitted and posted pursuant to Rule 405 of Regulation S T (§ 232.405 of this chapter) during the preceding 12 months (or for such shorter period that the registrant was required to submit and post such files). Yes x No ¨
Indicate by check mark if disclosure of delinquent filers pursuant to Item 405 of Regulation S-K is not contained herein, and will not be contained, to the best of registrant’s knowledge, in definitive proxy or information statements incorporated by reference in Part III of this Form 10-K or any amendment to this Form 10-K. x
Indicate by check mark whether the registrant is a large accelerated filer, an accelerated filer, a non-accelerated filer, or a smaller reporting company. See the definitions of “large accelerated filer”, “accelerated filer” and “smaller reporting company” in Rule 12b-2 of the Exchange Act.
Large accelerated filer ¨ | Accelerated filer x | Non-accelerated filer ¨ (Do not check if a smaller reporting company) | Smaller reporting company ¨ |
Indicate by check mark whether the registrant is a shell company (as defined in Rule 12b-2 of the Act). Yes ¨ No x
The aggregate market value of the registrant’s voting and non-voting common equity held by non-affiliates on June 30, 2016, based upon the closing price of $2.01 of the registrant’s common stock as reported on the New York Stock Exchange, was approximately $99,210,201. Excludes approximately 261,200 shares of the registrant’s common stock held by executive officers, directors and stockholders that the registrant has concluded, solely for the purpose of the foregoing calculation, were affiliates of the registrant.
Number of shares of registrant’s common stock outstanding as of March 10, 2017: 49,680,903
Documents Incorporated By Reference:
Portions of the registrant’s definitive proxy statement, will be filed with the Securities and Exchange Commission within 120 days of December 31, 2016, as incorporated by reference into Part III of this report for the year ended December 31, 2016.
1
BONANZA CREEK ENERGY, INC.
FORM 10-K
FOR THE YEAR ENDED DECEMBER 31, 2016
TABLE OF CONTENTS
PAGE | |||
2
Information Regarding Forward-Looking Statements
This Annual Report on Form 10-K contains various statements, including those that express belief, expectation or intention, as well as those that are not statements of historic fact, that are forward-looking statements within the meaning of Section 27A of the Securities Act of 1933, as amended, and Section 21E of the Securities and Exchange Act of 1934, as amended. When used in this Annual Report on Form 10-K, the words “could,” “believe,” “anticipate,” “intend,” “estimate,” “expect,” “may,” “continue,” “predict,” “potential,” “project,” “plan” “will,” and similar expressions are intended to identify forward-looking statements, although not all forward-looking statements contain such identifying words.
Forward-looking statements include statements related to, among other things:
• | the Company's business strategies and intent to maximize liquidity; |
• | reserves estimates; |
• | estimated sales volumes; |
• | amount and allocation of forecasted capital expenditures and plans for funding capital expenditures and operating expenses; |
• | ability to modify future capital expenditures; |
• | ability to consummate the multiple transactions associated with the Company’s current bankruptcy court proceeding; |
• | the Wattenberg Field being a premier oil and resource play in the United States; |
• | anticipated costs; |
• | compliance with debt covenants; |
• | ability to fund and satisfy obligations related to ongoing operations; |
• | compliance with government regulations, including environmental, health and safety regulations and liabilities thereunder; |
• | adequacy of gathering systems and continuous improvement of such gathering systems; |
• | impact from the lack of available gathering systems and processing facilities in certain areas; |
• | natural gas, oil and natural gas liquid prices and factors affecting the volatility of such prices; |
• | impact of lower commodity prices; |
• | sufficiency of impairments; |
• | the ability to use derivative instruments to manage commodity price risk and ability to use such instruments in the future; |
• | our drilling inventory and drilling intentions; |
• | our estimated revenues and losses; |
• | the timing and success of specific projects; |
• | our implementation of long reach laterals in the Wattenberg Field; |
• | our use of multi-well pads to develop the Niobrara and Codell formations; |
• | intention to continue to optimize enhanced completion techniques and well design changes; |
• | stated working interest percentages; |
• | management and technical team; |
• | outcomes and effects of litigation, claims and disputes; |
• | primary sources of future production growth; |
• | full delineation of the Niobrara B and C benches in our legacy acreage; |
• | our ability to replace oil and natural gas reserves; |
3
• | our ability to convert PUDs to producing properties within five years of their initial proved booking; |
• | impact of recently issued accounting pronouncements; |
• | impact of the loss a single customer or any purchaser of our products; |
• | timing and ability to meet certain volume commitments related to purchase and transportation agreements; |
• | the impact of customary royalty interests, overriding royalty interests, obligations incident to operating agreements, liens for current taxes and other industry-related constraints; |
• | our financial position; |
• | our cash flow and liquidity; |
• | the adequacy of our insurance; and |
• | other statements concerning our operations, economic performance and financial condition. |
We have based these forward-looking statements on certain assumptions and analyses we have made in light of our experience and our perception of historical trends, current conditions and expected future developments as well as other factors we believe are appropriate under the circumstances. They can be affected by inaccurate assumptions or by known or unknown risks and uncertainties. Many such factors will be important in determining actual future results. The actual results or developments anticipated by these forward-looking statements are subject to a number of risks and uncertainties, many of which are beyond our control, and may not be realized or, even if substantially realized, may not have the expected consequences. Actual results could differ materially from those expressed or implied in the forward-looking statements.
Factors that could cause actual results to differ materially include, but are not limited to, the following:
• | the risk factors discussed in Part I, Item 1A of this Annual Report on Form 10-K; |
• | further declines or volatility in the prices we receive for our oil, natural gas liquids and natural gas; |
• | general economic conditions, whether internationally, nationally or in the regional and local market areas in which we do business; |
• | ability of our customers to meet their obligations to us; |
• | our access to capital; |
• | our ability to obtain in a timely manner confirmation of a successful plan of reorganization in the Company’s current bankruptcy court proceeding; |
• | our ability to generate sufficient cash flow from operations, borrowings or other sources to enable us to fully develop our undeveloped acreage positions; |
• | the presence or recoverability of estimated oil and natural gas reserves and the actual future sales volume rates and associated costs; |
• | uncertainties associated with estimates of proved oil and gas reserves; |
• | the possibility that the industry may be subject to future local, state, and federal regulatory or legislative actions (including additional taxes and changes in environmental regulation); |
• | environmental risks; |
• | seasonal weather conditions; |
• | lease stipulations; |
• | drilling and operating risks, including the risks associated with the employment of horizontal drilling techniques; |
• | our ability to acquire adequate supplies of water for drilling and completion operations; |
• | availability of oilfield equipment, services and personnel; |
• | exploration and development risks; |
• | competition in the oil and natural gas industry; |
• | management’s ability to execute our plans to meet our goals; |
• | our ability to attract and retain key members of our senior management and key technical employees; |
4
• | our ability to maintain effective internal controls; |
• | access to adequate gathering systems and pipeline take-away capacity to provide adequate infrastructure for the products of our drilling program; |
• | our ability to secure firm transportation for oil and natural gas we produce and to sell the oil and natural gas at market prices; |
• | costs and other risks associated with perfecting title for mineral rights in some of our properties; |
• | continued hostilities in the Middle East and other sustained military campaigns or acts of terrorism or sabotage; and |
• | other economic, competitive, governmental, legislative, regulatory, geopolitical and technological factors that may negatively impact our businesses, operations or pricing. |
All forward-looking statements speak only as of the date of this Annual Report on Form 10-K. We disclaim any obligation to update or revise these statements unless required by law, and you should not place undue reliance on these forward-looking statements. Although we believe that our plans, intentions and expectations reflected in or suggested by the forward-looking statements we make in this Annual Report on Form 10-K are reasonable, we can give no assurance that these plans, intentions or expectations will be achieved. We disclose important factors that could cause our actual results to differ materially from our expectations under Item 1A. Risk Factors and Item 7. Management’s Discussion and Analysis of Financial Condition and Results of Operations and elsewhere in this Annual Report on Form 10-K. These cautionary statements qualify all forward-looking statements attributable to us or persons acting on our behalf.
GLOSSARY OF OIL AND NATURAL GAS TERMS
We have included below the definitions for certain terms used in this Annual Report on Form 10-K:
“3-D seismic data.” Geophysical data that depict the subsurface strata in three dimensions. 3-D seismic data typically provide a more detailed and accurate interpretation of the subsurface strata than 2-D, or two-dimensional, seismic data.
“Analogous reservoir.” Analogous reservoirs, as used in resources assessments, have similar rock and fluid properties, reservoir conditions (depth, temperature, and pressure) and drive mechanisms, but are typically at a more advanced stage of development than the reservoir of interest and thus may provide concepts to assist in the interpretation of more limited data and estimation of recovery. When used to support proved reserves, an “analogous reservoir” refers to a reservoir that shares the following characteristics with the reservoir of interest:
(i) | Same geological formation (but not necessarily in pressure communication with the reservoir of interest); |
(ii) | Same environment of deposition; |
(iii) | Similar geological structure; and |
(iv) | Same drive mechanism. |
“Asset Sale.” Any direct or indirect sale, lease (including by means of production payments and reserve sales and a sale and lease-back transaction), transfer, issuance or other disposition, or a series of related sales, leases, transfers, issuances or dispositions that are part of a common plan, of (a) shares of capital stock of a subsidiary (b) all or substantially all of the assets of any division or line of business of the Company or any subsidiary or (c) any other assets of the Company or any subsidiary outside of the ordinary course of business.
“Bbl.” One stock tank barrel, or 42 U.S. gallons liquid volume, used herein in reference to crude oil, condensate or natural gas liquids.
“Bcf.” One billion cubic feet of natural gas.
“Boe.” One stock tank barrel of oil equivalent, calculated by converting natural gas and natural gas liquids volumes to equivalent oil barrels at a ratio of six Mcf to one Bbl of oil.
“British thermal unit” or “BTU.” The heat required to raise the temperature of a one-pound mass of water from 58.5 to 59.5 degrees Fahrenheit.
5
“Basin.” A large natural depression on the earth’s surface in which sediments generally brought by water accumulate.
“Central processing facility.” Production facility for treating, gathering, storing and delivering oil and gas production from nearby wells.
“Completion.” The process of treating a drilled well followed by the installation of permanent equipment for the production of crude oil or natural gas, or in the case of a dry hole, the reporting of abandonment to the appropriate agency.
“Condensate.” A mixture of hydrocarbons that exists in the gaseous phase at original reservoir temperature and pressure, but that, when produced, is in the liquid phase at surface pressure and temperature.
“Developed acreage.” The number of acres that are allocated or assignable to productive wells or wells capable of production.
“Development costs.” Costs incurred to obtain access to proved reserves and to provide facilities for extracting, treating, gathering and storing the oil and gas. More specifically, development costs, including depreciation and applicable operating costs of support equipment and facilities and other costs of development activities, are costs incurred to: (i) gain access to and prepare well locations for drilling, including surveying well locations for the purpose of determining specific development drilling sites, clearing ground, draining, road building, and relocating public roads, gas lines, and power lines, to the extent necessary in developing the proved reserves; (ii) drill and equip development wells, development-type stratigraphic test wells, and service wells, including the costs of platforms and of well equipment such as casing, tubing, pumping equipment, and the wellhead assembly; (iii) acquire, construct, and install production facilities such as lease flow lines, separators, treaters, heaters, manifolds, measuring devices, and production storage tanks, natural gas cycling and processing plants, and central utility and waste disposal systems; and (iv) provide improved recovery systems.
“Development well.” A well drilled within the proved area of a natural gas or oil reservoir to the depth of a stratigraphic horizon known to be productive.
“Differential.” The difference between a benchmark price of oil and natural gas, such as the NYMEX crude oil spot, and the wellhead priced received.
“Deterministic method.” The method of estimating reserves or resources using a single value for each parameter (from the geoscience, engineering or economic data) in the reserves calculation.
“Dry hole.” Exploratory or development well that does not produce oil or gas in commercial quantities.
“Economically producible.” The term economically producible, as it relates to a resource, means a resource which generates revenue that exceeds, or is reasonably expected to exceed, the costs of the operation. The value of the products that generate revenue shall be determined at the terminal point of oil and gas producing activities.
“Environmental assessment.” A study that can be required pursuant to federal law to assess the potential direct, indirect and cumulative impacts of a project.
“ERISA.” Employee Retirement Income Security Act of 1974.
“Estimated ultimate recovery (EUR).” Estimated ultimate recovery is the sum of reserves remaining as of a given date and cumulative production as of that date.
“Exploratory well.” A well drilled to find a new field or to find a new reservoir in a field previously found to be productive of oil or gas in another reservoir. Generally, an exploratory well is any well that is not a development well, an extension well, a service well, or a stratigraphic test well.
“Extension well.” A well drilled to extend the limits of a known reservoir.
“Field.” An area consisting of a single reservoir or multiple reservoirs all grouped on or related to the same individual geological structural feature and/or stratigraphic condition. There may be two or more reservoirs in a field which are separated vertically by intervening impervious strata, or laterally by local geologic barriers, or by both. Reservoirs that are associated by being in overlapping or adjacent fields may be treated as a single or common operational field. The geological terms “structural
6
feature” and “stratigraphic condition” are intended to identify localized geological features as opposed to the broader terms of basins, trends, provinces, plays, areas-of-interest, etc.
“Finding and development costs.” Calculated by dividing the amount of total capital expenditures for oil and natural gas activities, by the amount of estimated net proved reserves added through discoveries, extensions, infill drilling, acquisitions, and revisions of previous estimates less sales of reserves, during the same period.
“Formation.” A layer of rock which has distinct characteristics that differ from nearby rock.
“GAAP.” Generally accepted accounting principles in the United States.
“HH.” Henry Hub index.
“Horizontal drilling.” A drilling technique used in certain formations where a well is drilled vertically to a certain depth and then drilled at a right angle within a specified interval.
‘‘Hydraulic fracturing.” The process of injecting water, proppant and chemicals under pressure into the formation to fracture the surrounding rock and stimulate production.
‘‘Infill drilling.” The addition of wells in a field that decreases average well spacing.
“LIBOR.” London interbank offered rate.
“MBbl.” One thousand barrels of oil or other liquid hydrocarbons.
“MBoe.” One thousand Boe.
“Mcf.” One thousand cubic feet.
“MMBoe.” One million Boe.
“MMBtu.” One million British Thermal Units.
“MMcf.” One million cubic feet.
“Net acres.” The percentage of total acres an owner has out of a particular number of acres, or a specified tract. An owner who has 50% interest in 100 acres owns 50 net acres.
“Net production.” Production that is owned by the registrant and produced to its interest, less royalties and production due others.
“Net revenue interest.” Economic interest remaining after deducting all royalty interests, overriding royalty interests and other burdens from the working interest ownership.
“Net well.” Deemed to exist when the sum of fractional ownership working interests in gross wells equals one. The number of net wells is the sum of the fractional working interest owned in gross wells expressed as whole numbers and fractions of whole numbers.
“NGL.” Natural gas liquid.
“NYMEX.” The New York Mercantile Exchange.
“Oil and gas producing activities.” Defined as (i) the search for crude oil, including condensate and natural gas liquids, or natural gas in their natural states and original locations; (ii) the acquisition of property rights or properties for the purpose of further exploration or for the purpose of removing the oil or gas from such properties; (iii) the construction, drilling and production activities necessary to retrieve oil and gas from their natural reservoirs, including the acquisition, construction, installation, and maintenance of field gathering and storage systems, such as lifting the oil and gas to the surface and gathering, treating and field processing (as in the case of processing gas to extract liquid hydrocarbons); and (iv) extraction of saleable
7
hydrocarbons, in the solid, liquid, or gaseous state, from oil sands, shale, coal beds, or other nonrenewable natural resources which are intended to be upgraded into synthetic oil or gas, and activities undertaken with a view to such extraction.
“PDNP.” Proved developed non-producing reserves.
“PDP.” Proved developed producing reserves.
“Percentage-of-proceeds.” A processing contract where the processor receives a percentage of the sold outlet stream, dry gas, NGLs or a combination, from the mineral owner in exchange for providing the processing services. In the Mid-Continent region, we are both a producer and, through ownership of gas plants, a processor, our sales volumes include volumes processed through the gas plants directly related to our working interest and volumes for which we are contractually entitled pursuant to the processing of gas from third party interests.
“Play.” A term applied to a portion of the exploration and production cycle following the identification by geologists and geophysicists of areas with potential oil and gas reserves.
“Plugging and abandonment.” The sealing off of fluids in the strata penetrated by a well so that the fluids from one stratum will not escape into another or to the surface. Regulations of many states require plugging of abandoned wells.
“Pooling.” Pooling, either contractually or statutorily through regulatory actions, allows an operator to combine multiple leased tracts to create a governmental spacing unit for one or more productive formations. (Pooling is also known as unitization or communitization.). Ownership interests are calculated within the pooling/spacing unit according to the net acreage contributed by each tract within the pooling/spacing unit.
“Possible reserves.” Those additional reserves that are less certain to be recovered than probable reserves.
“Probable reserves.” Those additional reserves that are less certain to be recovered than proved reserves but which, together with proved reserves, are as likely as not to be recovered.
“Production costs.” Costs incurred to operate and maintain wells and related equipment and facilities, including depreciation and applicable operating costs of support equipment and facilities and other costs of operating and maintaining those wells and related equipment and facilities. They become part of the cost of oil and gas produced. Examples of production costs (sometimes called lifting costs) are (a) costs of labor to operate the wells and related equipment and facilities; (b) repairs and maintenance; (c) materials, supplies, and fuel consumed and supplies utilized in operating the wells and related equipment and facilities; (d) property taxes and insurance applicable to proved properties and wells and related equipment and facilities; and (e) severance taxes. Some support equipment or facilities may serve two or more oil and gas producing activities and may also serve transportation, refining, and marketing activities. To the extent that the support equipment and facilities are used in oil and gas producing activities, their depreciation and applicable operating costs become exploration, development or production costs, as appropriate. Depreciation, depletion, and amortization of capitalized acquisition, exploration, and development costs are not production costs but also become part of the costs of oil and gas produced along with production (lifting) costs identified above.
“Productive well.” An exploratory, development or extension well that is not a dry well.
“Proppant.” Sized particles mixed with fracturing fluid to hold fractures open after a hydraulic fracturing treatment. In addition to naturally occurring sand grains, man-made or specially engineered proppants, such as resin-coated sand or high-strength ceramic materials like sintered bauxite, may also be used. Proppant materials are carefully sorted for size and sphericity to provide an efficient conduit for production of fluid from the reservoir to the wellbore.
“Proved developed reserves.” Proved reserves that can be expected to be recovered through existing wells with existing equipment and operating methods or in which the cost of the required equipment is relatively minor compared to the cost of a new well.
“Proved reserves.” Those quantities of oil and gas which, by analysis of geoscience and engineering data, can be estimated with reasonable certainty to be economically producible—from a given date forward, from known reservoirs and under existing economic conditions, operating methods and government regulations—prior to the time at which contracts providing the right to operate expire, unless evidence indicates that renewal is reasonably certain, regardless of whether deterministic or probabilistic methods are used for the estimation. The project to extract the hydrocarbons must have commenced, or the operator must be reasonably certain that it will commence the project, within a reasonable time.
8
(i) | The area of the reservoir considered as proved includes: |
(a) | The area identified by drilling and limited by fluid contacts, if any, and |
(b) | Adjacent undrilled portions of the reservoir that can, with reasonable certainty, be judged to be continuous with it and to contain economically producible oil or gas on the basis of available geoscience and engineering data. |
(ii) | In the absence of data on fluid contacts, proved quantities in a reservoir are limited by the lowest known hydrocarbons (LKH) as seen in a well penetration unless geoscience, engineering, or performance data and reliable technology establishes a lower contact with reasonable certainty. |
(iii) | Where direct observation from well penetrations has defined a highest known oil (HKO) elevation and the potential exists for an associated gas cap, proved oil reserves may be assigned in the structurally higher potions of the reservoir only if geoscience, engineering, or performance data and reliable technology establish the higher contact with reasonable certainty. |
(iv) | Reserves that can be produced economically through application of improved recovery techniques (including, but not limited to, fluid injection) are included in the proved classification when: |
(a) | Successful testing by a pilot project in an area of the reservoir with properties no more favorable than in the reservoir as a whole, the operation of an installed program in the reservoir or an analogous reservoir, or other evidence using reliable technology establishes the reasonable certainty of the engineering analysis on which the project or program was based, and |
(b) | The project has been approved for development by all necessary parties and entities, including governmental entities. |
(v) | Existing economic conditions include prices and costs at which economic producibility from a reservoir is to be determined. The price shall be the average price during the 12-month period prior to the ending date of the period covered by the report, determined as an unweighted arithmetic average of the first-day-of-the-month price for each month within such period, unless prices are defined by contractual arrangements, excluding escalations based upon future conditions. |
“Proved undeveloped reserves” or “PUD.” Proved reserves that are expected to be recovered from new wells on undrilled acreage, or from existing wells where a relatively major expenditure is required for recompletion. Reserves on undrilled acreage shall be limited to those directly offsetting development spacing areas that are reasonably certain of production when drilled, unless evidence using reliable technology exists that establishes reasonable certainty of economic producibility at greater distances. Undrilled locations can be classified as having undeveloped reserves only if a development plan has been adopted indicating that they are scheduled to be drilled within five years, unless specific circumstances justify a longer time. Under no circumstances shall estimates for proved undeveloped reserves be attributable to any acreage for which an application of fluid injection or other improved recovery technique is contemplated, unless such techniques have been proved effective by actual projects in the same reservoir or an analogous reservoir, or by other evidence using reliable technology establishing reasonable certainty.
“PV-10.” A non-GAAP financial measure that represents inflows from proved crude oil and natural gas reserves, less future development and production costs, discounted at 10% per annum to reflect timing of future cash inflows and using the twelve-month unweighted arithmetic average of the first-day-of-the-month commodity prices (after adjustment for differentials in location and quality) for each of the preceding twelve months. Please refer to the footnote 2 of the Proved Reserves table in Item 1 of this Annual Report on Form 10-K for additional discussion.
“Reasonable certainty.” If deterministic methods are used, reasonable certainty means a high degree of confidence that the quantities will be recovered. If probabilistic methods are used, there should be at least a 90 percent probability that the quantities actually recovered will equal or exceed the estimate. A high degree of confidence exists if the quantity is much more likely to be achieved than not, and, as changes due to increased availability of geoscience (geological, geophysical and geochemical) engineering, and economic data are made to estimated ultimate recovery (“EUR”) with time, reasonably certain estimated ultimate recovery is much more likely to increase or remain constant than to decrease.
9
"Reclamation." The process to restore the land and other resources to their original state prior to the effects of oil and gas development.
“Recompletion.” The process of re-entering an existing wellbore that is either producing or not producing and completing new reservoirs in an attempt to establish or increase existing production.
“Reserves.” Estimated remaining quantities of oil and gas and related substances anticipated to be economically producible, as of a given date, by application of development projects to known accumulations. In addition, there must exist, or there must be a reasonable expectation that there will exist, the legal right to produce or a revenue interest in the production, installed means of delivering oil and gas or related substances to market, and all permits and financing required to implement the project.
“Reserve replacement percentage.” The sum of sales of reserves, reserve extensions and discoveries, reserve acquisitions, and reserve revisions of previous estimates for a specified period of time divided by production for that same period.
“Reservoir.” A porous and permeable underground formation containing a natural accumulation of producible crude oil and/or natural gas that is confined by impermeable rock or water barriers and is individual and separate from other reservoirs.
“Resource play.” Drilling programs targeted at regionally distributed oil or natural gas accumulations. Successful exploitation of these reservoirs is dependent upon new technologies such as horizontal drilling and multi-stage fracture stimulation to access large rock volumes in order to produce economic quantities of oil or natural gas.
“Royalty interest.” An interest in an oil and natural gas property entitling the owner to a share of oil, natural gas or NGLs produced and sold unencumbered by expenses of drilling, completing and operating of the affected well.
“Sales volumes.” All volumes for which a reporting entity is entitled to proceeds, including production, net to the reporting entity’s interest and third party production obtained from percentage-of-proceeds contracts and sold by the reporting entity.
“Service well.” A service well is drilled or completed for the purpose of supporting production in an existing field. Wells in this class are drilled for the following specific purposes: gas injection, water injection, steam injection, air injection, salt-water disposal, water supply for injection, observation, or injection for in-situ combustion.
“Spacing.” Spacing as it relates to a spacing unit is defined by the governing authority having jurisdiction to designate the size in acreage of a productive reservoir along with the appropriate well density for the designated spacing unit size. Typical spacing for conventional wells is 40 acres for oil wells and 640 acres for gas wells.
“Standard reach lateral equivalent well.” Equates to a ratio of one well to one well for a standard reach lateral well, one and half wells to one well for a medium reach lateral well, and two wells to one well for an extended reach lateral well.
“Three stream.” The separate reporting of NGLs extracted from the natural gas stream and sold as a separate product.
“Undeveloped acreage.” Those leased acres on which wells have not been drilled or completed to a point that would permit the production of economic quantities of oil or gas regardless of whether such acreage contains proved reserves.
“Undeveloped reserves.” Undeveloped oil and gas reserves are reserves of any category that are expected to be recovered from new wells on undrilled acreage, or from existing wells where a relatively major expenditure is required for recompletion. Also referred to as “undeveloped oil and gas reserves.”
“Working interest.” The right granted to the lessee of a property to explore for and to produce and own oil, gas, or other minerals. The working interest owners bear the exploration, development, and operating costs on either a cash, penalty, or carried basis.
“Workover.” Operations on a producing well to restore or increase production.
“WTI.” West Texas Intermediate index.
10
11
PART I
Item 1. Business
When we use the terms “Bonanza Creek,” the “Company,” “we,” “us,” or “our” we are referring to Bonanza Creek Energy, Inc. and its consolidated subsidiaries unless the context otherwise requires. We have included certain technical terms important to an understanding of our business under Glossary of Oil and Natural Gas Terms above. Throughout this document we make statements that may be classified as “forward-looking” Please refer to the Information Regarding Forward-Looking Statements section above for an explanation of these types of statements.
Overview
Bonanza Creek is an independent energy company engaged in the acquisition, exploration, development and production of onshore oil and associated liquids-rich natural gas in the United States. Bonanza Creek Energy, Inc. was incorporated in Delaware on December 2, 2010 and went public in December 2011.
Our oil and liquids-weighted assets are concentrated primarily in the Wattenberg Field in Colorado and the Dorcheat Macedonia Field in southern Arkansas. In addition, we own and operate oil-producing assets in the North Park Basin in Colorado and the McKamie Patton Field in southern Arkansas. The Wattenberg Field is one of the premier oil and gas resource plays in the United States benefiting from a low cost structure, strong production efficiencies, established reserves and prospective drilling opportunities, which allows for predictable production and reserve growth.
Bankruptcy Proceedings under Chapter 11
Restructuring Support Agreement
On December 23, 2016, the Company entered into a Restructuring Support Agreement (the “RSA”) with (i) holders of approximately 51% in aggregate principal amount of the Company’s 5.75% Senior Notes due 2023 and 6.75% Senior Notes due 2021 and (ii) NGL Energy Partners, LP and NGL Crude Logistics, LLC.
The RSA contemplates, among other things, (a) the equitization of the Company’s unsecured obligations pursuant to the Plan, including approximately $800 million in principal amount of Senior Notes, (b) a fully backstopped rights offering for the purchase of $200 million of common stock of reorganized Bonanza Creek Energy, Inc., and (c) the entry into a new crude oil purchase agreement between the Company and NGL Crude Logistics, LLC.
Voluntary Chapter 11 Bankruptcy Proceedings
On January 4, 2017 (the “Petition Date”), the Company and all of its direct and indirect subsidiaries (collectively, the “Debtors”) filed voluntary petitions (the “Bankruptcy Petitions,” and the cases commenced thereby, collectively, the “Chapter 11 Cases”) under chapter 11 of title 11 of the United States Code (the “Bankruptcy Code”) in the United States Bankruptcy Court for the District of Delaware (the “Bankruptcy Court”) to pursue the Debtors’ Joint Prepackaged Plan of Reorganization Under Chapter 11 of the Bankruptcy Code (as amended, restated, supplemented or otherwise modified from time to time, the “Prepackaged Plan”). The Debtors are authorized to operate their businesses as debtors in possession under the jurisdiction of the Bankruptcy Court and in accordance with the applicable provisions of the Bankruptcy Code and orders of the Bankruptcy Court.
The Bankruptcy Court has granted on a final basis all of the first day motions filed by the Debtors seeking relief that would minimize the impact of the Chapter 11 Cases on the Company's operations, customers and employees. As a result, the Company is not only authorized to conduct business activities in the ordinary course and generally pay all associated obligations for the period following the Petition Date without further Bankruptcy Court approval, but it is also currently authorized to pay and has paid, subject to certain limitations, obligations that arose prior to the Petition Date related to employee wages and benefits, services and supplies provided by vendors in the ordinary course of business and mineral interests held by royalty holders and other partners. In general, during the pendency of the Chapter 11 Cases, all transactions outside the ordinary course of our business require the prior approval of the Bankruptcy Court. As a result of the automatic stay under the Bankruptcy Code, which became effective upon the commencement of the Chapter 11 Cases, most judicial or administrative actions against the Company by its creditors to collect on or otherwise exercise rights or remedies with respect to claims that arose before the Petition Date are stayed during the pendency of the Chapter 11 Cases.
A hearing to consider confirmation of the Prepackaged Plan and approval of the Debtors’ Disclosure Statement is currently scheduled to begin on April 3, 2017.
12
For the duration of our Chapter 11 proceedings, our operations and our ability to develop and execute our business plan are subject to the risks and uncertainties associated with our Chapter 11 cases as described in Item 1A, “Risk Factors.” As a result of these risks and uncertainties, our assets, liabilities, officers and/or directors could be significantly different following the outcome of the Chapter 11 proceedings, and the description of our operations, properties and capital plans included in this Annual Report may not accurately reflect our operations, properties and capital plans following the Chapter 11 process.
For a further description of these matters, see Note 19 - Subsequent Events.
Our Business Strategies
We scaled back our capital expenditures to match our liquidity constraints and current commodity pricing environment. We invested $21.7 million on capital projects in 2016 versus $404.0 million in 2015.
While faced with these liquidity restraints, we have taken various steps to reduce our operating costs. During 2016, we eliminated unnecessary costs and negotiated with our primary suppliers and service providers resulting in a 33% reduction in our lease operating expenses.
Our strategy is to operate a development program on contiguous acreage blocks that have high working interest, allowing us to control the pace and magnitude of our future capital expenditures and provide efficient resource development through multi-well pads and centralized facilities. Upon emergence from bankruptcy, management currently intends to operate a one-rig program in 2017 to drill 61 operated standard reach lateral equivalent wells that are within close proximity to the Company's existing infrastructure to keep costs down.
In 2016, we successfully drilled ten and completed 13 gross productive operated wells and participated in drilling seven and completing eight gross productive non-operated wells. We had six gross operated wells and seven gross non-operated wells drilled and awaiting completion as of December 31, 2016. Our sales volumes during the fourth quarter of 2016 were 18,239 Boe/d, a 36% decrease over the comparable period in 2015.
The following tables summarize our estimated proved reserves, PV-10 reserve value, sales volumes, and projected capital spend as of December 31, 2016:
Natural | ||||||||||||
Crude | Natural | Gas | Total | |||||||||
Oil | Gas | Liquids | Proved | |||||||||
Estimated Proved Reserves | (MBbls) | (MMcf) | (MBbls) | (MBoe) | ||||||||
Developed | ||||||||||||
Rocky Mountain | 18,735 | 62,097 | 8,792 | 37,877 | ||||||||
Mid-Continent | 7,578 | 23,875 | 1,159 | 12,716 | ||||||||
26,313 | 85,972 | 9,951 | 50,593 | |||||||||
Undeveloped | ||||||||||||
Rocky Mountain | 23,783 | 52,073 | 7,596 | 40,057 | ||||||||
Mid-Continent | — | — | — | — | ||||||||
23,783 | 52,073 | 7,596 | 40,057 | |||||||||
Total Proved | 50,096 | 138,045 | 17,547 | 90,650 | ||||||||
13
Sales Volumes for | |||||||||||||||||||||||||||
the Year Ended | Net Proved | ||||||||||||||||||||||||||
Estimated Proved Reserves at | December 31, | Undeveloped | |||||||||||||||||||||||||
December 31, 2016(1) | 2016 | Drilling | |||||||||||||||||||||||||
Average Net | Projected | Locations | |||||||||||||||||||||||||
Total | Daily Sales | 2017 Capital | as of | ||||||||||||||||||||||||
Proved | % of | % Proved | PV-10 | Volumes | % of | Expenditures | December 31, | ||||||||||||||||||||
(MBoe) | Total | Developed | ($ in MM)(2) | (Boe/d) | Total | ($ in millions) | 2016 | ||||||||||||||||||||
Rocky Mountain | 77,934 | 86 | % | 49 | % | $ | 201.4 | 17,619 | 81 | % | $ | 160-175 | 163.4 | ||||||||||||||
Mid-Continent(3) | 12,716 | 14 | % | 100 | % | 75.5 | 4,063 | 19 | % | 3-5 | — | ||||||||||||||||
Total | 90,650 | 100 | % | 56 | % | $ | 276.9 | 21,682 | 100 | % | $ | 163-180 | 163.4 | ||||||||||||||
_____________________
(1) | Proved reserves and related future net revenue and PV-10 were calculated using prices equal to the twelve-month unweighted arithmetic average of the first-day-of-the-month commodity prices for each of the preceding twelve months, which were $42.75 per Bbl WTI and $2.48 per MMBtu HH. Adjustments were then made for location, grade, transportation, gravity, and Btu content, which resulted in a decrease of $4.33 per Bbl of crude oil and a decrease of $0.41 per MMBtu of natural gas. |
(2) | PV-10 is a non-GAAP financial measure and represents the present value of estimated future cash inflows from proved crude oil, natural gas, and natural gas liquid reserves, less future development and production costs, discounted at 10% per annum to reflect timing of future cash inflows using the twelve-month unweighted arithmetic average of the first-day-of-the-month commodity prices, after adjustment for differentials in location and quality, for each of the preceding twelve months. We believe that PV-10 provides useful information to investors as it is widely used by professional analysts and sophisticated investors when evaluating oil and gas companies. We believe that PV-10 is relevant and useful for evaluating the relative monetary significance of our reserves. Professional analysts and sophisticated investors may utilize the measure as a basis for comparison of the relative size and value of our reserves to other companies’ reserves. Because there are many unique factors that can impact an individual company when estimating the amount of future income taxes to be paid, we believe the use of a pre-tax measure is valuable in evaluating the Company and our reserves. PV-10 is not intended to represent the current market value of our estimated reserves. PV-10 differs from Standardized Measure of Discounted Future Net Cash Flows (“Standardized Measure”) because it does not include the effect of future income taxes. Please refer to the Reconciliation of PV-10 to Standardized Measure presented in the “Reserves” subsection of Item 1 below. |
(3) | Mid-Continent sales volumes were 4,063 Boe/d for 2016, which is comprised of 3,653 Boe/d of production net to our interest and 410 Boe/d sales volumes from our percentage-of-proceeds contracts. |
Our Operations
Our operations are mainly focused in the Wattenberg Field in the Rocky Mountain region and in the Dorcheat Macedonia Field in the Mid-Continent region.
Rocky Mountain Region
The two main areas in which we operate in the Rocky Mountain region are the Wattenberg Field in Weld County, Colorado and the North Park Basin in Jackson County, Colorado. As of December 31, 2016, our estimated proved reserves in the Rocky Mountain region were 77,934 MBoe, which represented 86% of our total estimated proved reserves and contributed 17,619 Boe/d, or 81%, of sales volumes during 2016.
Wattenberg Field - Weld County, Colorado. Our operations are in the oil and liquids-weighted extension area of the Wattenberg Field targeting the Niobrara and Codell formations. As of December 31, 2016, our Wattenberg position consisted of approximately 96,000 gross (67,000 net) acres.
The Wattenberg Field is now primarily developed for the Niobrara and Codell formations using horizontal drilling and multi-stage fracture stimulation techniques. We believe the Niobrara B and C benches have been fully delineated on our legacy acreage, while the Codell formation has been delineated on our western acreage. Our northern acreage is in the early stages of delineation.
Our estimated proved reserves at December 31, 2016 in the Wattenberg Field were 77,730 MBoe. As of December 31, 2016, we had a total of 628 gross producing wells, of which 406 were horizontal wells, and our sales volumes during 2016 were
14
17,543 Boe/d. Our sales volumes for the fourth quarter of 2016 were 14,508 Boe/d. As of December 31, 2016, our working interest for all producing wells averaged approximately 89% and our net revenue interest was approximately 73%.
We drilled and participated in drilling 18 gross (9.5 net) standard reach lateral equivalent wells and one vertical well in 2016 in the Wattenberg Field. In 2016, we completed and participated in completing a total of 27 gross (14.0 net) standard reach lateral equivalent wells and one vertical well in the Wattenberg Field. As of December 31, 2016, we have an identified drilling inventory of approximately 210 gross (163.4 net) proved undeveloped (“PUD”) drilling locations (226 gross standard reach lateral equivalents) on our acreage.
During the year, in the Niobrara benches, we drilled two extended reach lateral operated wells, six standard reach lateral operated wells and one vertical operated well and we completed four medium reach lateral operated wells, eight standard reach lateral operated wells and one vertical operated well. In addition, we drilled one Codell standard reach lateral operated well. We also participated in the drilling of six standard reach lateral wells (0.01 net) and the completion of five extended reach lateral wells (0.5 net) in the Niobrara formation.
Upon emergence from bankruptcy, based on the plan provided to signatories to the RSA, management currently intends to operate a one-rig program with an intermittent second rig to satisfy leasehold obligations within the Wattenberg Field in 2017. The capital requirements expected for this program range from $160.0 million to $175.0 million for the time period from May to December 2017. This program contemplates drilling and completing 61 gross operated standard reach lateral equivalent wells, participating in economic non-operated wells that are proposed and investing a modest amount on infrastructure. The capital budget is dependent on emergence from bankruptcy and approval from a newly appointed board and could vary, given, for example, that we observed evidence of an increase in drilling and completion costs since year end.
North Park Basin - Jackson County, Colorado. We control approximately 19,000 gross (15,000 net) acres in the North Park Basin in Jackson County, Colorado, all prospective for the Niobrara oil shale. We operate the North and South McCallum Fields, which currently produce light oil, which is trucked to market.
In the North Park Basin, our estimated proved reserves as of December 31, 2016 were approximately 204 MBoe, consisting of 100% crude oil, and our sales volumes during 2016 were 76 Boe/d. Our sales volumes in the North Park Basin for the fourth quarter of 2016 were 72 Boe/d. There were no wells drilled during 2016 in the North Park Basin.
None of our 2017 capital budget is assigned to the North Park Basin.
Mid-Continent Region
In southern Arkansas, we target the oil-rich Cotton Valley sands in the Dorcheat Macedonia and McKamie Patton Fields. As of December 31, 2016, our estimated proved reserves in the Mid-Continent region were 12,716 MBoe, which is inclusive of a reduction of 7.8 MMBoe of PUDs due to an inability to demonstrate a commitment to deploy capital into this program during 2016, 69% of which were oil and NGLs and 100% of which were proved developed. We currently have 308 gross producing vertical wells. During 2016, no wells were drilled in the Mid-Continent region; however, the Company recompleted 32 wells in the Cotton Valley formation. We achieved a sales volume rate for 2016 of 4,063 Boe/d, of which 70% was from oil and NGLs, and a sales volume rate for the fourth quarter of 2016 of 3,658 Boe/d. We have a 2017 capital budget of $3.0 million to $5.0 million for the Mid-Continent region.
Dorcheat Macedonia. In the Dorcheat Macedonia Field, we average an approximate 89% working interest and an approximate 74% net revenue interest on all producing wells. The majority of our acreage is held by unitization or production. Our production during 2016 was approximately 3,485 Boe/d (3,895 Boe/d sales volumes). During the fourth quarter of 2016, our production was 3,173 Boe/d (3,583 Boe/d sales volumes). Our proved reserves in this field are approximately 11,604 MBoe. Due to the Company having no plans to drill within the Mid-Continent region, we wrote off all 96 PUD locations that were previously recorded.
Other Mid-Continent. We own additional interests in the McKamie Patton Field in the Mid-Continent region near the Dorcheat Macedonia Field. As of December 31, 2016, our estimated proved reserves were approximately 1,112 MBoe, and sales volumes during 2016 were approximately 168 Boe/d. During the fourth quarter of 2016, our production was 76 Boe/d.
Gas Processing Facilities. Our Mid-Continent gas processing facilities are located in Lafayette and Columbia counties in Arkansas and are strategically located to serve our production in the region. Our McKamie Gas Plant has been idle since 2015 and our Dorcheat Macedonia Field Gas Plant has a current capacity of 24 MMcf/d with 54,000 gallons per day of
15
associated NGL capacity. Our ownership of these facilities and related gathering pipeline provides us with the benefit of controlling processing and compression of our natural gas production.
Reserves
Estimated Proved Reserves
The summary data with respect to our estimated proved reserves presented below has been prepared in accordance with rules and regulations of the Securities and Exchange Commission (the “SEC”) applicable to companies involved in oil and natural gas producing activities. Our reserve estimates do not include probable or possible reserves, categories which SEC rules do permit us to disclose in public reports. Our estimated proved reserves for the years ended December 31, 2016, 2015 and 2014 were determined using the preceding twelve month unweighted arithmetic average of the first-day-of-the-month prices. For a definition of proved reserves under the SEC rules, please see the Glossary of Oil and Natural Gas Terms included in the beginning of this report.
Reserve estimates are inherently imprecise and estimates for undeveloped properties are more imprecise than reserve estimates for producing oil and gas properties. Accordingly, these estimates are expected to change as new information becomes available. The PV-10 values shown in the following table are not intended to represent the current market value of our estimated proved reserves. Neither prices nor costs have been escalated. The actual quantities and present values of our estimated proved reserves may vary from what we have estimated.
The table below summarizes our estimated proved reserves as of December 31, 2016, 2015 and 2014 for each of the regions and currently producing fields in which we operate. The proved reserve estimates as of December 31, 2016, 2015 and 2014 are based on reports prepared by our internal corporate reservoir engineering group, of which 100% were audited by Netherland, Sewell & Associates, Inc. (“NSAI”), our third-party independent reserve engineers. For more information regarding our independent reserve engineers, please see Independent Reserve Engineers below. The information in the following table is not intended to represent the current market value of our proved reserves nor does it give any effect to or reflect our commodity derivatives or current commodity prices.
At December 31, | |||||||||
Region/Field | 2016 | 2015 | 2014 | ||||||
(MMBoe) | |||||||||
Rocky Mountain | 78.0 | 80.1 | 68.1 | ||||||
Wattenberg | 77.8 | 79.8 | 67.8 | ||||||
North Park | 0.2 | 0.3 | 0.3 | ||||||
Mid-Continent | 12.7 | 21.2 | 21.4 | ||||||
Dorcheat Macedonia | 11.6 | 20.1 | 19.9 | ||||||
McKamie Patton | 1.1 | 1.1 | 1.5 | ||||||
Total | 90.7 | 101.3 | 89.5 | ||||||
16
The following table sets forth more information regarding our estimated proved reserves at December 31, 2016, 2015 and 2014:
At December 31, | ||||||||||
2016 | 2015 | 2014 | ||||||||
Reserve Data(1): | ||||||||||
Estimated proved reserves: | ||||||||||
Oil (MMBbls) | 50.1 | 57.4 | 54.7 | |||||||
Natural gas (Bcf) | 138.0 | 144.2 | 188.6 | |||||||
Natural gas liquids (MMBbls) | 17.5 | 19.9 | 3.4 | |||||||
Total estimated proved reserves (MMBoe)(2) | 90.7 | 101.3 | 89.5 | |||||||
Percent oil and liquids | 75 | % | 76 | % | 65 | % | ||||
Estimated proved developed reserves: | ||||||||||
Oil (MMBbls) | 26.3 | 28.9 | 28.3 | |||||||
Natural gas (Bcf) | 86.0 | 77.5 | 94.5 | |||||||
Natural gas liquids (MMBbls) | 10.0 | 10.4 | 2.2 | |||||||
Total estimated proved developed reserves (MMBoe)(2) | 50.6 | 52.2 | 46.3 | |||||||
Percent oil and liquids | 72 | % | 75 | % | 66 | % | ||||
Estimated proved undeveloped reserves: | ||||||||||
Oil (MMBbls) | 23.8 | 28.5 | 26.4 | |||||||
Natural gas (Bcf) | 52.0 | 66.7 | 94.1 | |||||||
Natural gas liquids (MMBbls) | 7.5 | 9.6 | 1.2 | |||||||
Total estimated proved undeveloped reserves (MMBoe)(2) | 40.1 | 49.2 | 43.2 | |||||||
Percent oil and liquids | 78 | % | 77 | % | 64 | % | ||||
____________________
(1) | Proved reserves were calculated using the preceding twelve month unweighted arithmetic average of the first-day-of-the-month prices, which were $42.75 per Bbl WTI and $2.48 per MMBtu HH, $50.28 per Bbl WTI and $2.59 per MMBtu HH, and $94.99 per Bbl WTI and $4.35 per MMBtu HH for the years ended December 31, 2016, 2015 and 2014, respectively. Adjustments were made for location and grade. |
(2) | Determined using the ratio of 6 Mcf of natural gas to one Bbl of crude oil. |
Proved developed oil and gas reserves are reserves that can be expected to be recovered through existing wells with existing equipment and operating methods. Proved undeveloped oil and gas reserves are reserves that are expected to be recovered from new wells on undrilled acreage, or from existing wells where a relatively major expenditure is required for completion. Proved undeveloped reserves on undrilled acreage are limited to those directly offsetting development spacing areas that are reasonably certain of production when drilled, unless evidence using reliable technology exists that establishes reasonable certainty of economic productivity at greater distances.
Proved undeveloped locations in our December 31, 2016 reserve report are included in our development plan and are scheduled to be drilled within five years from their initial proved booking date. The Company’s management evaluated the proved undeveloped drilling plan using NYMEX strip prices, the liquidation model for general and administrative costs, the cash from the rights offering as contemplated in the RSA and the cash flows from existing properties. The Company's PUD conversion was 3%, 16% and 21% for the years ended December 31, 2016, 2015 and 2014, respectively. The Company suspended all drilling and completion activities after the first quarter of 2016; as such, 2016 was deemed an anomaly to the Company's PUD conversion standards. The Company currently intends to operate a one-rig program upon emergence from bankruptcy and fully anticipates being able to convert the remaining Rocky Mountain region PUDs within the allotted five-year window assuming drilling and completion activities resumes in the second quarter of 2017. The Company wrote off 100% of its PUDs within the Mid-Continent region as there are no current funded commitments to drill within the region as of December 31, 2016. The reliable technologies used to establish our proved reserves are a combination of pressure performance, geologic mapping, offset productivity, electric logs, and production data.
Estimated proved reserves at December 31, 2016 were 90.7 MMBoe, a 10% decrease from estimated proved reserves of 101.3 MMBoe at December 31, 2015. Approximately 86% of our December 31, 2016 proved reserves are attributed to the Rocky Mountain region, and 99.7% of the Rocky Mountain proved reserves in turn are attributed to the Wattenberg Field. The
17
net decrease in our reserves of 10.6 MMBoe is the result of 2016 production of 7.8 MMBoe coupled with writing off 16.4 MMBoe of PUDs and 1.9 MMBoe of other engineering revisions offset by additions in extensions, discoveries and infills of 10.8 MMBoe and net positive cost revisions (reserve prices less drilling and completion costs and LOE) of 4.7 MMBoe.
The 10.8 MMBoe addition in extensions, discoveries and infills is primarily the result of completing five operated and six non-operated unproved horizontal locations in the Niobrara formation that were in progress at year-end 2015, and drilling and completing three non-operated unproved horizontal wells and one operated unproved vertical well in the Niobrara formation in the Wattenberg Field during 2016, and adding 42 infill PUD locations near existing central processing facilities (“CPFs”). These infill locations offset PDP wells drilled prior to 2016. In the engineering revision category, 38 proved undeveloped locations were written off because they were not in close proximity to existing CPFs or CPFs that were planned to be built in 2016 but were not due to liquidity contraints. New drilling in 2017 will begin around the existing CPF's, as they can be hooked up immediately upon completion. For the year ending December 31, 2016, approximately 85% of the Company's development drilling in the Wattenberg Field was in the Niobrara formation, 15% in the Codell. The majority of the proved undeveloped locations are spaced on 80 acres within each bench. Thirty-six of the Niobrara locations are planned to be drilled on 80/40 geometry. An 80/40 well is where the locations in one formation are spaced on 80 acre units, while the lower locations, also spaced 80 acres apart, are offset 40 acres from the bench above.
Total Company positive engineering revisions as of December 31, 2016, were 28,625 Mboe, of which 32,899 Mboe were related to positive reserve changes in the Wattenberg Field and 4,416 Mboe were related to negative reserve changes in the Dorcheat Macedonia Field. The overall positive engineering revision is offset by a negative pricing revision of 39,222 Mboe in the Wattenberg Field and 2,778 Mboe in the Dorcheat Macedonia Field. The negative pricing revision of 42,143 Mboe for the Company resulted from a decrease in average commodity price from $50.28 per Bbl WTI and $2.59 per MMBTU HH for the year ended December 31, 2015 to $42.75 per Bbl WTI and $2.48 per MMBTU HH for the year ended December 31, 2016. The majority of the positive revisions in the Wattenberg Field resulted from a combination of decreased drilling and completion costs and a continued decrease in the LOE which had begun in 2015. The total proved undeveloped location count in the Wattenberg Field is 210 (226 standard reach lateral equivalents) and was 204 as of December 31, 2015. Our five-year plans include the drilling of these proved undeveloped locations. The 2017 drilling program included in the year-end 2016 reserves is a one-rig program estimated to convert 25% of our year end 2016 proved undeveloped reserves in the Wattenberg Field. There are nine horizontal proved undeveloped locations in the Wattenberg Field that would expire in 2017 if they are not drilled this year. If we begin drilling in the second quarter of 2017, operate a single-rig program in 2017 and 2018, add one additional rig for six months in 2019 and revert to a one-rig program thereafter, all remaining PUD locations will be developed within their five-year windows. The PUD locations in the Dorcheat Macedonia Field were all demoted because they would not be drilled within their five-year window under the current drilling plan, which is focused on the Wattenberg Field.
Total Company positive engineering revisions as of December 31, 2015, were 37,174 Mboe, of which 30,086 Mboe (81%) related to reserve changes in the Wattenberg Field. This positive engineering revision was offset by a negative pricing revision of 21,417 Mboe in the Wattenberg Field. The majority of the positive revisions in the Wattenberg Field resulted from a combination of decreased drilling and completion costs, $3.0 million per standard reach lateral well as of December 31, 2015 compared to $4.2 million at December 31, 2014, a 29% decrease, and an increase in productivity from horizontal proved developed producing wells, which increased the offsetting proved undeveloped reserves. The increase in PDP reserves was primarily attributed to the installation of infrastructure in the east side of our Wattenberg Field acreage, which removed the producing constraint that inhibited productivity over the prior two years of development in that area. Another significant contribution to the positive reserve revision in the Wattenberg Field results from a contract change as of January 1, 2015, which gives our Company ownership of the natural gas liquids from our gas production. This conversion from two-stream (wet gas and oil) to three-stream (dry gas, natural gas liquids and oil) added 8,560 Mboe to our proved reserves as of December 31, 2015. With the addition of 45 horizontal proved undeveloped locations in the Wattenberg Field to the proved reserves at December 31, 2015, the total proved undeveloped location count was 204 (220 standard reach lateral equivalents) and was 226 as of December 31, 2014. A negative pricing revision of 28,810 Mboe for the Company resulted from a decrease in average commodity price from $94.99 per Bbl WTI and $4.35 per MMBTU HH for the year ended December 31, 2014 to $50.28 per Bbl WTI and $2.59 per MMBTU HH for the year ended December 31, 2015.
Estimated proved reserves at December 31, 2014 were 89.5 MMBoe, a 28% increase from estimated proved reserves of 69.8 MMBoe at December 31, 2013. The net increase in reserves of 19.7 MMBoe was the result of additions in extensions and discoveries of 20.2 MMBoe, primarily due to the development of the Niobrara B and C benches and the Codell formations in the Wattenberg Field, coupled with a net positive revision of 7.1 MMBoe (engineering and pricing) and net acquisitions (acquisitions less divestitures) of 0.8 MMBoe offset by 8.4 MMBoe in production. The addition in extension and discoveries was primarily the result of drilling and completing 99 unproved horizontal locations (including 12 non-operated) in the Niobrara and the Codell formations in the Wattenberg Field during 2014 and the addition of 37 new horizontal proved undeveloped locations directly offsetting new wells brought online in 2014. As of December 31, 2014, approximately 70% of
18
our horizontal development in the Wattenberg Field was in the Niobrara B formation, the majority of which was on 80-acre spacing. The net positive engineering revision was primarily the result of adding new Niobrara B proved undeveloped locations on 80-acre spacing, directly offsetting economic proved producing Niobrara B wells drilled prior to 2014, diagonal offsets to economic Niobrara B proved producing wells and a relatively small number of locations greater than one offset to economic Niobrara B proved producing wells but within developed areas and surrounded by Niobrara B proved producing wells. A total of 119 horizontal proved undeveloped locations were added to the proved reserves at December 31, 2014 of which 86 (72%) were direct offsets to economic proved producing wells (drilled in 2014 or prior to 2014), 21 (18%) were direct offsets in a diagonal pattern to economic proved producing wells and 12 (10%) were greater than one offset from economic proved producing wells. The reasonable certainty of the reserves associated with the latter two categories of proved undeveloped locations was based on analysis of the immediate surrounding productivity of the Niobrara B bench and detailed geologic mapping. All Niobrara proved undeveloped locations were spaced on 80 acres. The positive engineering revision was offset by a small negative performance revision of approximately 540 MBoe. A negative pricing revision of 0.25 MMBoe resulted from a decrease in average commodity price from $96.91 per Bbl WTI and $3.67 per MMBTU HH for the year ended December 31, 2013 to $94.99 per Bbl WTI and $4.35 per MMBTU HH for the year ended December 31, 2014.
Reconciliation of PV-10 to Standardized Measure
PV-10 is derived from the Standardized Measure, which is the most directly comparable GAAP financial measure. PV-10 is a computation of the Standardized Measure on a pre-tax basis. PV-10 is equal to the Standardized Measure at the applicable date, before deducting future income taxes, discounted at 10%. We believe that the presentation of PV-10 is relevant and useful to investors because it presents the discounted future net cash flows attributable to our estimated net proved reserves prior to taking into account future corporate income taxes, and it is a useful measure for evaluating the relative monetary significance of our oil and natural gas properties. Further, investors may utilize the measure as a basis for comparison of the relative size and value of our reserves to other companies. We use this measure when assessing the potential return on investment related to our oil and natural gas properties. PV-10, however, is not a substitute for the Standardized Measure. Neither our PV-10 measure or the Standardized Measure purport to present the fair value of our oil and natural gas reserves.
The following table provides a reconciliation of PV-10 to Standardized Measure at December 31, 2016, 2015 and 2014:
December 31, | ||||||||||||
2016 | 2015 | 2014 | ||||||||||
(in millions) | ||||||||||||
PV-10 | $ | 276.9 | $ | 327.8 | $ | 1,340.5 | ||||||
Present value of future income taxes discounted at 10%(1) | — | — | (233.1 | ) | ||||||||
Standardized Measure | $ | 276.9 | $ | 327.8 | $ | 1,107.4 | ||||||
____________________________
(1) The tax basis of our oil and gas properties as of December 31, 2016 and 2015 provides more tax deduction than income generated from our oil and gas properties when the reserve estimates were prepared using $42.75 per Bbl WTI and $2.48 per MMBTU HH and $50.28 per Bbl WTI and $2.59 per MMBTU HH, respectively.
Proved Undeveloped Reserves
Net Reserves, MBoe | |||||||||
At December 31, | |||||||||
2016 | 2015 | 2014 | |||||||
Beginning of year | 49,184 | 43,246 | 37,603 | ||||||
Converted to proved developed | (1,352 | ) | (6,994 | ) | (7,791 | ) | |||
Additions from capital program | — | 2,308 | 5,596 | ||||||
Acquisitions | — | 1,541 | — | ||||||
Revisions | (7,775 | ) | 9,083 | 7,838 | |||||
End of year | 40,057 | 49,184 | 43,246 | ||||||
At December 31, 2016, our proved undeveloped reserves were 40,057 MBoe, all of which are scheduled to be drilled within five years of their initial proved booking date. During 2016, the Company converted 3% of its proved undeveloped
19
reserves (seven gross wells representing net reserves of 1,352 MBoe) at a cost of $16.2 million. Our 2016 capital program was shut down after the first quarter, and no proved undeveloped locations were added as a result of drilling. The net decrease in our PUD reserves was mainly the result of demoting 7.8 MMBoe of PUDs in the Mid-Continent region, as drilling is now focused entirely on the Wattenberg Field. Thirty-eight Wattenberg proved undeveloped locations that were not in areas with existing CPF's were demoted and were replaced with 42 infill proved undeveloped locations that are near existing CPFs. Current plans are to begin drilling the new and existing proved undeveloped locations within close proximity to existing CPFs upon emergence from bankruptcy.
At December 31, 2015, our proved undeveloped reserves were 49,184 MBoe, all of which were scheduled to be drilled within five years of their initial proved booking date. During 2015, the Company converted 16% of its proved undeveloped reserves (52 gross wells representing net reserves of 6,994 MBoe) at a cost of $121.0 million. Executing our 2015 capital program resulted in the addition of 2,308 MBoe (17 gross wells) in proved undeveloped reserves in the Wattenberg Field. A small acquisition within the field limits of the Dorcheat Macedonia Field added 14 gross proved undeveloped locations and 1,541 MBoe to our reserves. The positive engineering revision of 9,083 MBoe was primarily the result of adding 28 gross new proved undeveloped locations in the Wattenberg Field on 80-acre spacing, the majority directly offsetting economic proved producing wells drilled prior to 2015, and an increase in proved undeveloped reserves in the eastern portion of the Wattenberg Field resulting from increased productivity due to the installation of infrastructure, which eliminated a production constraint thereby allowing productivity to rise, proved developed reserves to increase, and associated proved undeveloped reserves to increase by an estimated 3.0 MMBoe.
At December 31, 2014, our proved undeveloped reserves were 43,246 MBoe, all of which were scheduled to be drilled within five years of their initial proved booking date. During 2014, the Company converted 21% of its proved undeveloped reserves (58 gross wells representing net reserves of 7,791 MBoe) at a cost of $116.9 million. Executing our 2014 capital program resulted in the addition of 5,596 MBoe (45 gross wells) in proved undeveloped reserves. The positive engineering revision of 7,838 MBoe was primarily the result of adding 49 new proved undeveloped locations in the Wattenberg Field on 80-acre spacing, directly offsetting economic proved producing wells drilled prior to 2014, 21 diagonal offsets to economic proved producing wells and 12 gross proved undeveloped locations positioned greater than one offset to economic proved producing wells but within developed areas and surrounded by proved producing wells. Also included in the revision category was the removal from proved undeveloped locations of 15 horizontal locations in the Wattenberg Field that were no longer spaced on 80 acres following the 2014 capital drilling program and all of the vertical proved undeveloped locations in the Wattenberg Field that have been replaced by horizontal wells or are expected to be replaced in the future. Proved undeveloped locations remaining in the category from December 31, 2013 received a downward revision of 214 Mboe.
Internal controls over reserves estimation process
Our policies regarding internal controls over the recording of reserves estimates require reserves to be in compliance with SEC definitions and guidance and prepared in accordance with Standards Pertaining to the Estimating and Auditing of Oil and Gas Reserves Information promulgated by the Society of Petroleum Engineers. The Company’s Reserves Committee reviews significant reserve changes on an annual basis and our third-party independent reserve engineers, NSAI, is engaged by and has direct access to the Reserves Committee. NSAI audited 100% of our estimated proved reserves at December 31, 2016, 2015 and 2014.
Responsibility for compliance in reserves estimation is delegated to our internal corporate reservoir engineering group managed by John E. Vorwerk. Mr. Vorwerk is our Corporate Reserves Manager. Mr. Vorwerk attended the Colorado School of Mines and graduated in 1976 with a Bachelor of Science degree in Geological Engineering. He also received a Master of Science degree in Mineral Economics from the Colorado School of Mines in 1991. Mr. Vorwerk has been in the petroleum industry for 41 years, and has been a Registered Professional Engineer since 1981. He has been directly involved in evaluations and the estimation of reserves and resources, and has worked in the corporate reserves function for over 21 years. He has been employed at Bonanza for three years, and has been the Corporate Reserves Manager for the past two and a half years. Collectively with Mr. Vorwerk, our internal corporate reservoir engineering group has over 85 years of industry experience.
Our technical team works with our banking syndicate members for a valuation of our reserves by the banks in our lending group and their engineers in determining the borrowing base under our revolving credit facility.
Independent Reserve Engineers
The reserves estimates for the years ended December 31, 2016, 2015 and 2014 shown herein have been independently audited by NSAI, a worldwide leader of petroleum property analysis for industry and financial organizations and government agencies. NSAI was founded in 1961 and performs consulting petroleum engineering services under Texas Board of Professional Engineers Registration No. F-2699. Within NSAI, the technical persons primarily responsible for auditing the
20
estimates set forth in the NSAI audit letter incorporated herein are Mr. Dan Paul Smith and Mr. John G. Hattner. Mr. Smith, a Licensed Professional Engineer in the State of Texas (No. 49093), has been practicing consulting petroleum engineering at NSAI since 1980 and has over 7 years of prior industry experience. He graduated from Mississippi State University in 1973 with a Bachelor of Science Degree in Petroleum Engineering. Mr. Hattner, a Licensed Professional Geoscientist in the State of Texas, Geology (No. 559), has been practicing consulting petroleum geoscience at NSAI since 1991, and has over 11 years of prior industry experience. He graduated from University of Miami, Florida, in 1976 with a Bachelor of Science Degree in Geology; from Florida State University in 1980 with a Master of Science Degree in Geological Oceanography; and from Saint Mary's College of California in 1989 with a Master of Business Administration Degree. Both technical principals meet or exceed the education, training, and experience requirements set forth in the Standards Pertaining to the Estimating and Auditing of Oil and Gas Reserves Information promulgated by the Society of Petroleum Engineers; both are proficient in judiciously applying industry standard practices to engineering and geoscience evaluations as well as applying SEC and other industry reserves definitions and guidelines.
Production, Revenues and Price History
The recent collapse in oil prices was among the most severe on record. The daily NYMEX WTI oil spot price went from a high of $107.62 per Bbl in 2014 to a low of $26.19 per Bbl in 2016. The drop in crude oil pricing was due in large part to increased production levels, crude oil inventories and recessed global economic growth. Oil prices are also impacted by real or perceived geopolitical risks in oil producing regions, the relative strength of the U.S. dollar, weather and the global economy. Gas prices were under downward pressure during 2015 and the first half of 2016 due to excess supply leading to higher levels of gas in storage when compared to the five-year average. These depressed oil prices lead to dramatic cuts in the exploration and production budgets which incrementally reduced oil supply, and have helped prices rebound off of the lows experienced in the first quarter of 2016. With better pricing in the beginning of 2017, compared to 2016, we expect increased industry activity which could moderate the magnitude of price increases throughout the year.
Sensitivity Analysis
If oil and natural gas SEC prices declined by 10%, our proved reserve volumes would decrease by 8% and our PV-10 value as of December 31, 2016 would decrease by approximately 42% or $116.2 million. The PV-10 value of our Rocky Mountain region, primarily our Wattenberg assets, would decrease by 48% or $97.5 million.
The Company incurred an immaterial impairment of proved properties of $10.0 million on its Mid-Continent assets resulting from a received bid while the assets were held for sale, but these assets are no longer held for sale as of December 31, 2016. We do not anticipate triggering additional impairments in 2017 when analyzing price changes only. However, upon emergence from bankruptcy, there could be additional impairments due to the assigned enterprise value of the Company.
Production
The following table sets forth information regarding oil, natural gas, and natural gas liquids production, sales prices, and production costs for the periods indicated. For additional information on price calculations, please see information set forth in Part II, Item 7. Management’s Discussion and Analysis of Financial Condition and Results of Operations.
21
For the Years Ended December 31, | ||||||||||||
2016 | 2015 | 2014(1) | ||||||||||
Oil: | ||||||||||||
Total Production (MBbls) | 4,309.9 | 6,072.3 | 5,618.7 | |||||||||
Wattenberg Field | 3,470.7 | 5,029.6 | 4,486.4 | |||||||||
Dorcheat Macedonia Field | 750.0 | 923.2 | 1,025.6 | |||||||||
Average sales price (per Bbl), including derivatives(4) | $ | 39.68 | $ | 62.10 | $ | 84.00 | ||||||
Average sales price (per Bbl), excluding derivatives(4) | $ | 35.42 | $ | 40.98 | $ | 81.95 | ||||||
Natural Gas: | ||||||||||||
Total Production (MMcf) | 11,906.3 | 14,110.9 | 15,316.1 | |||||||||
Wattenberg Field | 9,574.8 | 11,020.8 | 11,372.7 | |||||||||
Dorcheat Macedonia Field | 2,331.4 | 3,090.5 | 4,030.6 | |||||||||
Average sales price (per Mcf), including derivatives(5) | $ | 1.88 | $ | 2.01 | $ | 5.16 | ||||||
Average sales price (per Mcf), excluding derivatives(5) | $ | 1.88 | $ | 1.82 | $ | 5.11 | ||||||
Natural Gas Liquids: | ||||||||||||
Total Production (MBbls) | 1,491.1 | 1,675.9 | 260.6 | |||||||||
Wattenberg Field | 1,354.3 | 1,489.9 | 16.8 | |||||||||
Dorcheat Macedonia Field | 136.8 | 186 | 243.8 | |||||||||
Average sales price (per Bbl), including derivatives | $ | 12.39 | $ | 9.49 | $ | 49.14 | ||||||
Average sales price (per Bbl), excluding derivatives | $ | 12.39 | $ | 9.49 | $ | 49.14 | ||||||
Oil Equivalents: | ||||||||||||
Total Production (MBoe) | 7,785.4 | 10,100.0 | 8,365.6 | |||||||||
Wattenberg Field | 6,420.8 | 8,356.3 | 6,398.6 | |||||||||
Dorcheat Macedonia Field | 1,275.4 | 1,624.2 | 1,874.7 | |||||||||
Average Daily Production (Boe/d) | 21,271.7 | 27,671.2 | 22,919.3 | |||||||||
Wattenberg Field | 17,543.4 | 22,894.1 | 17,530.5 | |||||||||
Dorcheat Macedonia Field | 3,484.5 | 4,450 | 5,136.3 | |||||||||
Average Production Costs (per Boe)(3)(2) | $ | 7.25 | $ | 7.56 | $ | 8.66 | ||||||
_________________________
(1) | Amounts reflect results for continuing operations and exclude results for discontinued operations related to non-core properties in California sold during 2014. |
(2) | Excludes ad valorem and severance taxes. |
(3) | Represents lease operating expense and gas plant and midstream operating expense per Boe using total production volumes of 7,785.4 MBoe, 10,100.0 MBoe and 8,365.6 MBoe for 2016, 2015 and 2014, respectively. Total production volumes exclude volumes from our percentage-of-proceeds contracts in our Mid-Continent region of 150.1 MBoe, 219.4 MBoe and 215.3 MBoe for 2016, 2015 and 2014, respectively. |
(4) | Crude oil sales includes $0.5 million and $0.2 million of oil transportation revenues from third parties, which do not have associated sales volumes, for the years ended December 31, 2016 and 2015, respectively. There was no oil transportation revenues for the year ended December 31, 2014. |
(5) | Natural gas sales includes $1.5 million and $0.8 million of gas gathering revenues from third parties, which do not have associated sales volumes, for the years ended December 31, 2016 and 2015, respectively. There was no gas gathering transportation revenues for the year ended December 31, 2014. |
Principal Customers
Three of our customers, Silo Energy, LLC, Lion Oil Trading & Transportation, Inc., and Duke Energy Field Services comprised 50%, 18%, and 14%, respectively, of our total revenue for the year ended December 31, 2016. No other single non-affiliated customer accounted for 10% or more of our oil and natural gas sales in 2016. We believe the loss of any one customer would not have a material effect on our financial position or results of operations because there are numerous potential customers for our production.
22
Delivery Commitments
We have entered into two purchase agreements to deliver a fixed determinable quantity of crude oil within the Wattenberg Field. The first agreement took effect during the second quarter of 2015 for 12,580 gross barrels per day over an initial five-year term. The second agreement took effect during the fourth quarter of 2016 for 15,000 gross barrels per day over an initial seven-year term. The aggregate financial commitment fee for both agreements is approximately $437.1 million at December 31, 2016. While the volume commitment may be met with Company volumes or third-party volumes, the Company has been required to make periodic deficiency payments for current shortfalls in delivering the minimum monthly volume commitments. Amending one of these agreements and terminating the other is contemplated within our bankruptcy case. Please refer to Note 8 - Commitments and Contingencies for additional discussion.
Productive Wells
The following table sets forth the number of producing oil and natural gas wells in which we owned a working interest at December 31, 2016.
Oil(2) | Natural Gas(1) | Total(2) | Operated(2) | ||||||||||||||||||||||||
Gross | Net | Gross | Net | Gross | Net | Gross | Net | ||||||||||||||||||||
Rocky Mountain | 681 | 567.6 | — | — | 681 | 567.6 | 594 | 551.6 | |||||||||||||||||||
Mid-Continent | 308 | 264.5 | — | — | 308 | 264.5 | 308 | 264.5 | |||||||||||||||||||
Total(2) | 989 | 832.1 | — | — | 989 | 832.1 | 902 | 816.1 | |||||||||||||||||||
__________________________
(1) | All gas production is associated gas from producing oil wells. |
(2) | Count came from internal production reporting system. |
Acreage
The following table sets forth certain information regarding the developed and undeveloped acreage in which we own a working interest as of December 31, 2016 for each of the areas where we operate along with the PV-10 values of each. Acreage related to royalty, overriding royalty and other similar interests is excluded from this summary.
Undeveloped | ||||||||||||||||||||||
Developed Acres | Acres | Total Acres | ||||||||||||||||||||
Gross | Net | Gross | Net | Gross | Net | PV-10 | ||||||||||||||||
Rocky Mountain | 74,856 | 61,200 | 40,409 | 20,914 | 115,265 | 82,114 | $ | 201,434 | ||||||||||||||
Wattenberg Field | 60,173 | 49,378 | 35,505 | 17,949 | 95,678 | 67,327 | 201,245 | |||||||||||||||
Other Rocky Mountain | 14,683 | 11,822 | 4,904 | 2,965 | 19,587 | 14,787 | 189 | |||||||||||||||
Mid-Continent | 11,795 | 10,036 | 2,505 | 1,285 | 14,300 | 11,321 | 75,521 | |||||||||||||||
Dorcheat Macedonia Field | 4,919 | 3,443 | 1,481 | 684 | 6,400 | 4,127 | 61,561 | |||||||||||||||
Other Mid-Continent | 6,876 | 6,593 | 1,024 | 601 | 7,900 | 7,194 | 13,960 | |||||||||||||||
Total | 86,651 | 71,236 | 42,914 | 22,199 | 129,565 | 93,435 | $ | 276,955 | ||||||||||||||
Undeveloped acreage
We critically review and consider at-risk leasehold with attention to our ability either to convert term leasehold to held-by-production status or obtain term extensions. We focus primarily on the core fields of development where reserve bookings are prevalent. Decisions to let leasehold expire generally relate to areas out of our core fields of development or do not pose material impacts to development plans or reserves.
23
The following table sets forth the number of net undeveloped acres by area as of December 31, 2016 that will expire over the next three years unless production is established within the spacing units covering the acreage or the applicable leases are extended prior to the expiration dates:
Expiring 2017 | Expiring 2018 | Expiring 2019 | ||||||||||||||||
Gross | Net | Gross | Net | Gross | Net | |||||||||||||
Rocky Mountain | 6,241 | 4,597 | 7,047 | 4,071 | 1,659 | 444 | ||||||||||||
Mid-Continent | 260 | 212 | 42 | 8 | 40 | 9 | ||||||||||||
Total | 6,501 | 4,809 | 7,089 | 4,079 | 1,699 | 453 | ||||||||||||
Drilling Activity
The following table describes the exploratory and development wells we drilled and completed during the years ended December 31, 2016, 2015 and 2014.
For the Years Ended December 31, | ||||||||||||||||||
2016 | 2015 | 2014 | ||||||||||||||||
Gross | Net | Gross | Net | Gross | Net | |||||||||||||
Exploratory | ||||||||||||||||||
Productive Wells | — | — | — | — | — | — | ||||||||||||
Dry Wells | — | — | 2 | 1.8 | — | — | ||||||||||||
Total Exploratory | — | — | 2 | 1.8 | — | — | ||||||||||||
Development | ||||||||||||||||||
Productive Wells | 4 | 3.9 | 92 | 76.1 | 142 | 124.3 | ||||||||||||
Dry Wells | — | — | 2 | 1.4 | — | — | ||||||||||||
Total Development | 4 | 3.9 | 94 | 77.5 | 142 | 124.3 | ||||||||||||
Total | 4 | 3.9 | 96 | 79.3 | 142 | 124.3 | ||||||||||||
The following table describes the present operated drilling activities as of December 31, 2016.
As of December 31, 2016 | ||||||
Gross | Net | |||||
Exploratory | ||||||
Rocky Mountain | — | — | ||||
Mid-Continent | — | — | ||||
Total Exploratory | — | — | ||||
Development | ||||||
Rocky Mountain | 6 | 4.5 | ||||
Mid-Continent | — | — | ||||
Total Development | 6 | 4.5 | ||||
Total | 6 | 4.5 | ||||
Capital Expenditure Budget
Upon emergence from bankruptcy, management currently intends to operate a one-rig program, with capital expenditures ranging from $160.0 million to $180.0 million for the time period from May to December 2017. The Wattenberg Field capital budget ranges from $160.0 million to $175.0 million to drill 23 operated standard reach lateral wells and 19 operated extended reach lateral wells. The Wattenberg program will also consist of a modest infrastructure investment as well as participation in economic non-operated wells. The remaining capital budget of $3.0 million to $5.0 million is slated for recompletions within the Mid-Continent region. Actual capital expenditures could vary significantly based on, among other
24
things, emergence from bankruptcy, approval by the newly appointed board, market conditions, commodity prices, the final amount of the rights offering effectuated pursuant to the RSA, and changes in the borrowing base under our revolving credit facility. We have observed evidence of an increase in drilling and completion costs since year-end, which would impact actual capital expenditures.
Title to Properties
Our properties are subject to customary royalty interests, overriding royalty interests, obligations incident to operating agreements, liens for current taxes and other industry‑related constraints, including leasehold restrictions. We do not believe that any of these burdens materially interfere with our use of the properties in the operation of our business. We believe that we have satisfactory title to or rights in all of our producing properties. We undergo thorough title review and receive title opinions from legal counsel before we commence drilling operations, subject to the availability and examination of accurate title records. Although in certain cases, title to our properties is subject to interpretation of multiple conveyances, deeds, reservations, and other constraints, we believe that none of these will materially detract from the value of our properties or from our interest therein or will materially interfere with the operation of our business.
Competition
The oil and natural gas industry is highly competitive and we compete with a substantial number of other companies that have greater resources. Many of these companies explore for, produce and market oil and natural gas, carry on refining operations and market the resultant products on a worldwide basis. The primary areas in which we encounter substantial competition are in locating and acquiring desirable leasehold acreage for our drilling and development operations, locating and acquiring attractive producing oil and gas properties, attracting and retaining qualified personnel, and obtaining transportation for the oil and gas we produce in certain regions. There is also competition between producers of oil and gas and other industries producing alternative energy and fuel. Furthermore, competitive conditions may be substantially affected by various forms of energy legislation and/or regulation considered from time to time by federal, state and local governments; however, it is not possible to predict the nature of any such legislation or regulation that may ultimately be adopted or its effects upon our future operations. Such laws and regulations may, however, substantially increase the costs of exploring for, developing or producing gas and oil and may prevent or delay the commencement or continuation of a given operation. The effect of these risks cannot be accurately predicted.
Further, oil prices and natural gas prices do not necessarily fluctuate in direct relationship to each other. Because approximately 75% of our estimated proved reserves as of December 31, 2016 were oil and natural gas liquids reserves, our financial results are more sensitive to movements in oil prices. During the year ended December 31, 2016, the daily NYMEX WTI oil spot price ranged from a high of $54.01 per Bbl to a low of $26.19 per Bbl, and the NYMEX natural gas HH spot price ranged from a high of $3.80 per MMBtu to a low of $1.49 per MMBtu.
Insurance Matters
As is common in the oil and gas industry, we will not insure fully against all risks associated with our business either because such insurance is not available or because premium costs are considered prohibitive. A loss not fully covered by insurance could have a material adverse effect on our financial position, results of operations or cash flows.
Regulation of the Oil and Natural Gas Industry
Our operations are substantially affected by federal, state and local laws and regulations. In particular, oil and natural gas production and related operations are, or have been, subject to price controls, taxes and numerous other laws and regulations. All of the jurisdictions in which we own or operate properties for oil and natural gas production have statutory provisions regulating the exploration for and production of oil and natural gas, including provisions related to permits for the drilling of wells, bonding requirements to drill or operate wells, the location of wells, the method of drilling and casing wells, the surface use and restoration of properties upon which wells are drilled, sourcing and disposal of water used in the drilling and completion process, and the abandonment of wells. Our operations are also subject to various conservation laws and regulations. These include regulation of the size of drilling and spacing units or proration units, the number of wells which may be drilled in an area, and the unitization or pooling of oil and natural gas wells, and regulations that generally prohibit the venting or flaring of natural gas and that impose certain requirements regarding the ratability or fair apportionment of production from fields and individual wells.
Failure to comply with applicable laws and regulations can result in substantial penalties. Our competitors in the oil and natural gas industry are subject to the same regulatory requirements and restrictions that affect our operations. The regulatory burden on the industry can increase the cost of doing business and negatively affect profitability. Because such laws
25
and regulations are frequently amended through various rulemakings, it is difficult, and we are often unable to predict the future costs or impact of compliance. Additional proposals and proceedings that affect the natural gas industry are regularly considered by Congress, the states and various municipalities, the Federal Energy Regulatory Commission (“FERC”), and the courts. We cannot predict when or whether any such proposals or proceedings may become effective and if the outcomes will negatively affect our operations.
We believe that continued substantial compliance with existing requirements will not have a material adverse effect on our financial position, cash flows or results of operations. However, current regulatory requirements may change, currently unforeseen incidents may occur or past non-compliance with laws or regulations may be discovered.
Regulation of transportation of oil
Our sales of crude oil are affected by the availability, terms and cost of transportation. Interstate transportation of oil by pipeline is regulated by FERC pursuant to the Interstate Commerce Act (“ICA”), the Energy Policy Act of 1992 and the rules and regulations promulgated under those laws. The ICA and its implementing regulations require that tariff rates for interstate service on oil pipelines, including interstate pipelines that transport crude oil and refined products (collectively referred to as “petroleum pipelines”) be just and reasonable and non‑discriminatory and that such rates and terms and conditions of service be filed with FERC.
Intrastate oil pipeline transportation rates are subject to regulation by state regulatory commissions. The basis for intrastate oil pipeline regulation, and the degree of regulatory oversight and scrutiny given to intrastate oil pipeline rates, varies from state to state. Insofar as effective interstate and intrastate rates are equally applicable to all comparable shippers, we believe that the regulation of oil transportation rates will not affect our operations in any way that is of material difference from those of our competitors who are similarly situated.
Regulation of transportation and sales of natural gas
Historically, the transportation and sale for resale of natural gas in interstate commerce have been regulated by agencies of the U.S. federal government, primarily FERC. FERC regulates interstate natural gas transportation rates and service conditions, which affects the marketing of natural gas that we produce, as well as the revenues we receive for sales of our natural gas.
In the past, the federal government has regulated the prices at which natural gas could be sold. While sales by producers of natural gas can currently be made at uncontrolled market prices, Congress could reenact price controls in the future. Deregulation of wellhead natural gas sales began with the enactment of the Natural Gas Policy Act (“NGPA”) and culminated in adoption of the Natural Gas Wellhead Decontrol Act which removed controls affecting wellhead sales of natural gas effective January 1, 1993. The transportation and sale for resale of natural gas in interstate commerce is regulated primarily under the Natural Gas Act (“NGA”), and by regulations and orders promulgated under the NGA by FERC. In certain limited circumstances, intrastate transportation and wholesale sales of natural gas may also be affected directly or indirectly by laws enacted by Congress and by FERC regulations.
FERC issued a series of orders in 1996 and 1997 to implement its open access policies. As a result, the interstate pipelines’ traditional role as wholesalers of natural gas has been greatly reduced and replaced by a structure under which pipelines provide transportation and storage service on an open access basis to others who buy and sell natural gas. Although FERC’s orders do not directly regulate natural gas producers, they are intended to foster increased competition within all phases of the natural gas industry.
The Domenici Barton Energy Policy Act of 2005 (“EP Act of 2005”), is a comprehensive compilation of tax incentives, authorized appropriations for grants and guaranteed loans, and significant changes to the statutory policy that affects all segments of the energy industry. Among other matters, the EP Act of 2005 amends the NGA to add an anti-market manipulation provision which makes it unlawful for any entity to engage in prohibited behavior to be prescribed by FERC. The EP Act of 2005 provides FERC with the power to assess civil penalties of up to $1,000,000 per day for violations of the NGA and increases FERC’s civil penalty authority under the NGPA from $5,000 per violation per day to $1,000,000 per violation per day. The civil penalty provisions are applicable to entities that engage in the sale of natural gas for resale in interstate commerce. On January 19, 2006, FERC issued Order No. 670, a rule implementing the anti-market manipulation provision of the EP Act of 2005, and subsequently denied rehearing. The rules make it unlawful: (1) in connection with the purchase or sale of natural gas subject to the jurisdiction of FERC, or the purchase or sale of transportation more accessible to natural gas services subject to the jurisdiction of FERC, for any entity, directly or indirectly, to use or employ any device, scheme or artifice to defraud; (2) to make any untrue statement of material fact or omit to make any such statement necessary to make the statements made not misleading; or (3) to engage in any act or practice that operates as a fraud or deceit upon any person. The
26
new anti-market manipulation rule does not apply to activities that relate only to intrastate or other non-jurisdictional sales or gathering, but does apply to activities of gas pipelines and storage companies that provide interstate services, as well as otherwise non-jurisdictional entities to the extent the activities are conducted “in connection with” gas sales, purchases or transportation subject to FERC jurisdiction, which now includes the annual reporting requirements under Order 704. The anti-market manipulation rule and enhanced civil penalty authority reflect an expansion of FERC’s NGA enforcement authority.
Gathering service, which occurs upstream of jurisdictional transmission services, is regulated by the states onshore and in state waters. Although its policy is still in flux, FERC has reclassified certain jurisdictional transmission facilities as non-jurisdictional gathering facilities, which has the tendency to increase our costs of getting gas to point of sale locations. State regulation of natural gas gathering facilities generally includes various safety, environmental and, in some circumstances, nondiscriminatory-take requirements. Although nondiscriminatory-take regulation has not generally been affirmatively applied by state agencies, natural gas gathering may receive greater regulatory scrutiny in the future.
Section 1(b) of the NGA exempts natural gas gathering facilities from regulation by FERC as a natural gas company under the NGA. We believe that the natural gas pipelines in our gathering systems meet the traditional tests FERC has used to establish a pipeline’s status as a gatherer not subject to regulation as a natural gas company. However, the distinction between FERC-regulated transmission services and federally unregulated gathering services is the subject of ongoing litigation, so the classification and regulation of our gathering facilities are subject to change based on future determinations by FERC, the courts or Congress.
Our sales of natural gas are also subject to requirements under the Commodity Exchange Act (“CEA”), and regulations promulgated thereunder by the Commodity Futures Trading Commission (“CFTC”). The CEA prohibits any person from manipulating or attempting to manipulate the price of any commodity in interstate commerce or futures on such commodity. The CEA also prohibits knowingly delivering or causing to be delivered false or misleading or knowingly inaccurate reports concerning market information or conditions that affect or tend to affect the price of a commodity.
Intrastate natural gas transportation is also subject to regulation by state regulatory agencies. The basis for intrastate regulation of natural gas transportation and the degree of regulatory oversight and scrutiny given to intrastate natural gas pipeline rates and services varies from state to state. Insofar as such regulation within a particular state will generally affect all intrastate natural gas shippers within the state on a comparable basis, we believe that the regulation of similarly situated intrastate natural gas transportation in any states in which we operate and ship natural gas on an intrastate basis will not affect our operations in any way that is of material difference from those of our competitors. Like the regulation of interstate transportation rates, the regulation of intrastate transportation rates affects the marketing of natural gas that we produce, as well as the revenues we receive for sales of our natural gas.
Changes in law and to FERC policies and regulations may adversely affect the availability and reliability of firm and/or interruptible transportation service on interstate pipelines, and we cannot predict what future action FERC will take. We do not believe, however, that any regulatory changes will affect us in a way that materially differs from the way they will affect other natural gas producers, gatherers and marketers with which we compete.
Regulation of production
The production of oil and natural gas is subject to regulation under a wide range of local, state and federal statutes, rules, orders and regulations. Federal, state and local statutes and regulations require permits for drilling operations, drilling bonds and reports concerning operations. The states in which we own and operate properties have regulations governing conservation matters, including provisions for the spacing and unitization or pooling of oil and natural gas properties, the regulation of well spacing and well density, and procedures for proper plugging and abandonment of wells. The intent of these regulations is to promote the efficient recovery of oil and gas reserves while reducing waste and protecting correlative rights. By collaborating with industry's exploration and development operations, these regulations effectively identify where wells can be drilled, well densities by geologic formation along with the proper spacing and pooling unit size to effectively drain the resources. Operators can apply for exceptions to such regulations including applications to increase well densities to more effectively recover the oil and gas resources. Moreover, each state generally imposes a production or severance tax with respect to the production and sale of oil, natural gas and natural gas liquids within its jurisdiction.
We own interests in properties located onshore in three U.S. states. These states regulate drilling and operating activities by requiring, among other things, permits for the drilling of wells, maintaining bonding requirements in order to drill or operate wells, and regulating the location of wells, the method of drilling and casing wells, the surface use and restoration of properties upon which wells are drilled and the plugging and abandonment of wells. The laws of these states also govern a number of environmental and conservation matters, including the handling and disposing or discharge of waste materials, the
27
size of drilling and spacing units or proration units and the density of wells that may be drilled, and the unitization and pooling of oil and gas properties.
Regulation of derivatives
The Dodd-Frank Wall Street Reform and Consumer Protection Act (the “Dodd-Frank Act”) was passed by Congress and signed into law in July 2010. The Dodd-Frank Act is designed to provide a comprehensive framework for the regulation of the over-the-counter derivatives market with the intent to provide greater transparency and reduction of risk between counterparties. The Dodd-Frank Act subjects swap dealers and major swap participants to capital and margin requirements and requires many derivative transactions to be cleared on exchanges. The Dodd-Frank Act provides for a potential exemption from these clearing and cash collateral requirements for commercial end-users.
Environmental, Health and Safety Regulation
Our natural gas and oil exploration and production operations are subject to numerous stringent federal, regional, state and local laws and regulations governing safety and health, the discharge of materials into the environment or otherwise relating to environmental protection, non-compliance with which can result in substantial administrative, civil and criminal penalties and other sanctions, including suspension or cessation of operations. These laws and regulations may require the acquisition of permits before drilling or other regulated activity commences; restrict the types, quantities and concentrations of various substances that can be released into the environment; govern the sourcing and disposal of water used in the drilling and completion process; limit or prohibit drilling activities that impact threatened or endangered species or that occur in certain areas and on certain lands lying within wilderness, wetlands, frontier and other protected areas; require some form of remedial action to prevent or mitigate pollution from former operations such as plugging abandoned wells or closing earthen pits; establish specific safety and health criteria addressing worker protection and impose substantial liabilities for pollution resulting from operations or failure to comply with regulatory filings. In addition, these laws and regulations may restrict the rate of production.
The following is a summary of the more significant existing environmental and health and safety laws and regulations to which we are subject and for which compliance may have a material adverse impact on our capital expenditures, results of operations or financial position.
Hazardous substances and waste handling
The Comprehensive Environmental Response, Compensation and Liability Act of 1980 (“CERCLA”), also known as the Superfund law, and comparable state laws impose liability without regard to fault or the legality of the original conduct on certain classes of persons who are considered to be responsible for the release of a “hazardous substance” into the environment. These persons include current and prior owners or operators of the site where the release occurred and entities that disposed or arranged for the disposal of the hazardous substances found at the site. Under CERCLA, these potentially “responsible persons” may be subject to strict, joint and several liability for the costs of cleaning up the hazardous substances that have been released into the environment, for damages to natural resources, and for the costs of certain health studies, and it is not uncommon for neighboring landowners and other third parties to file claims for personal injury and property damage allegedly caused by the hazardous substances released into the environment. We are able to control directly the operation of only those wells with respect to which we act as operator. Notwithstanding our lack of direct control over wells operated by others, the failure of an operator other than us to comply with applicable environmental regulations may, in certain circumstances, be attributed to us. We generate materials in the course of our operations that may be regulated as hazardous substances but we are not aware of any liabilities for which we may be held responsible that would materially or adversely affect us.
We currently own or lease, and have in the past owned or leased, properties that have been used for numerous years to explore and produce oil and natural gas. Although we have utilized operating and disposal practices that were standard in the industry at the time, hydrocarbons and wastes may have been disposed of or released on or under the properties owned or leased by us or on or under the other locations where these hydrocarbons and wastes have been taken for treatment or disposal. In addition, certain of these properties have been operated by third parties whose treatment and disposal or release of hydrocarbons and wastes were not under our control. These properties and wastes disposed thereon may be subject to CERCLA, RCRA and analogous state laws. Under these laws, we could be required to remove or remediate previously disposed wastes (including wastes disposed of or released by prior owners or operators), to clean up contaminated property (including groundwater contaminated by prior owners or operators), to pay for damages for the loss or impairment of natural resources, and to take measures to prevent future contamination from our operations.
28
In addition, other laws require the reporting on use of hazardous and toxic chemicals. For example, in October 2015, EPA granted, in part, a petition filed by several national environmental advocacy groups to add the oil and gas extraction industry to the list of industries required to report releases of certain “toxic chemicals” under the Toxic Release Inventory (“TRI”) program under the Emergency Planning and Community Right-to-Know Act. EPA determined that natural gas processing facilities may be appropriate for addition to TRI applicable facilities and in January 2017, EPA issued a proposed rule to include natural gas processing facilities in the TRI program.
Pipeline safety and maintenance
Pipelines, gathering systems and terminal operations are subject to increasingly strict safety laws and regulations. Both the transportation and storage of refined products and crude oil involve a risk that hazardous liquids may be released into the environment, potentially causing harm to the public or the environment. In turn, such incidents may result in substantial expenditures for response actions, significant government penalties, liability for natural resources damages, and significant business interruption. The U.S. Department of Transportation has adopted safety regulations with respect to the design, construction, operation, maintenance, inspection and management of our pipeline and storage facilities. These regulations contain requirements for the development and implementation of pipeline integrity management programs, which include the inspection and testing of pipelines and the correction of anomalies. These regulations also require that pipeline operation and maintenance personnel meet certain qualifications and that pipeline operators develop comprehensive spill response plans.
There have been recent initiatives to strengthen and expand pipeline safety regulations and to increase penalties for violations. The Pipeline Safety, Regulatory Certainty, and Job Creation Act was signed into law in early 2012. In addition, the Pipeline and Hazardous Materials Safety Administration (“PHMSA”) has issued new rules to strengthen federal pipeline safety enforcement programs. In 2015, PHMSA proposed to expand its regulations in a number of ways, including through the increased regulation of gathering lines, even in rural areas. In 2016, PHMSA increased its regulations to require crude oil sampling and reporting as an offeror and increased its civil penalty structure.
Air emissions
The Clean Air Act (“CAA”) and comparable state laws and regulations restrict the emission of air pollutants from many sources, including oil and gas operations, and impose various monitoring and reporting requirements. These laws and regulations may require us to obtain pre-approval for the construction or modification of certain projects or facilities expected to produce or significantly increase air emissions, obtain and comply with stringent air permit requirements or utilize specific equipment or technologies to control emissions. Obtaining required air permits can significantly delay the development of certain oil and natural gas projects. Over the next several years, we may be required to incur certain capital expenditures for air pollution control equipment or other air emissions related issues.
For example, on August 16, 2012, the EPA published final rules under the CAA that subject oil and natural gas production, processing, transmission and storage operations to regulation under the New Source Performance Standards (“NSPS”) and National Emission Standards for Hazardous Air Pollutants programs. With regards to production activities, these final rules require, among other things, the reduction of volatile organic compound emissions from three subcategories of fractured and refractured gas wells for which well completion operations are conducted: wildcat (exploratory) and delineation gas wells; low reservoir pressure non-wildcat and non-delineation gas wells; and all “other” fractured and refractured gas wells. These regulations also establish specific new requirements regarding emissions from production-related wet seal and reciprocating compressors and from pneumatic controllers and storage vessels. The EPA issued revised rules in 2013 and 2014 in response to requests for reconsideration from industry and the environmental community. Most recently, as part of the reconsideration, in May 2016 the EPA issued amendments to the NSPS rules focused on achieving additional methane and volatile organic compound reductions from oil and natural gas operations. Among other things, these amendments impose new requirements for leak detection and repair, control requirements for oil well completions, and additional control requirements for gathering, boosting, and compressor stations. Concurrently with these methane rules, the EPA finalized a new rule regarding source determinations and permitting requirements for the onshore oil and gas industry under the CAA. The EPA also published Control Technique Guidelines aimed at providing states with guidance on Reasonable Achievable Control Technology for the oil and gas industry in areas of ozone non-attainment.
On October 1, 2015, EPA finalized its rule lowering the existing 75 part per billion ("ppb") national ambient air quality standard ("NAAQS") for ozone under the CAA to 70 ppb. Also in 2015, the State of Colorado received a bump-up in its existing ozone non-attainment status from “marginal” to “moderate.” Oil and natural gas operations in ozone nonattainment areas, including in Colorado, may be subject to increased regulatory burdens in the form of more stringent emission controls, emission offset requirements, and increased permitting delays and costs. In addition, in February 2014, the Colorado Department of Public Health and Environment’s Air Quality Control Commission (“AQCC”) adopted new and revised air quality regulations that impose stringent new requirements to control emissions from existing and new oil and gas facilities in
29
Colorado. The proposed regulations include new control, monitoring, recordkeeping, and reporting requirements on oil and gas operators in Colorado. For example, the new regulations impose Storage Tank Emission Management (“STEM”) requirements for certain new and existing storage tanks. The STEM requirements require us to install costly emission control technologies as well as monitoring and recordkeeping programs at most of our new and existing well production facilities. The new Colorado regulations also impose a Leak Detection and Repair (“LDAR”) program for well production facilities and compressor stations. The LDAR program primarily targets hydrocarbon (i.e., methane) emissions from the oil and gas sector in Colorado and represents a significant new use of state authority regarding these emissions.
Compliance with these and other air pollution control and permitting requirements has the potential to delay the development of oil and natural gas projects and increase our costs of development and production, which costs could be significant.
Climate change
In response to findings that emissions of carbon dioxide, methane and other greenhouse gases (“GHGs”) present an endangerment to public health and the environment, the EPA has adopted regulations under existing provisions of the CAA that, among other things, establish Prevention of Significant Deterioration (“PSD”) construction and Title V operating permit requirements for certain large stationary sources that include potential major sources of GHG emissions. In June 2014, the United States Supreme Court ruled in Utility Air Regulatory Group v. EPA, No. 12‑1146. The Supreme Court upheld part of the EPA’s GHG-related regulations but struck down other portions of the rules. Specifically, the Supreme Court ruled that sources subject to the PSD or Title V programs because of non-GHG emissions could still potentially be subject to certain “best available control technology” requirements applicable to their GHG emissions. Under the Court’s opinion, sources subject to the PSD or Title V programs due solely to their GHG emissions, however, can no longer be subject to EPA’s GHG permitting requirements. The D.C. Circuit issued an amendment judgment following remand, and EPA intends to conduct future rulemaking to make revisions conforming to the court rulings. In May 2016, the EPA also finalized a rule regarding source determination, including defining the term “adjacent” under the CAA, which affects how major sources, including GHG major sources, are regulated. These EPA rulemakings will have nominal effect on our operations because the rule clarified our existing presumption on “adjacent" and presents no conflict with the State of Colorado regulations. In addition, the EPA has adopted rules requiring the monitoring and reporting of GHGs from specified onshore and offshore oil and gas production sources in the United States on an annual basis, which include certain of our operations. We are monitoring GHG emissions from our operations in accordance with the GHG emissions reporting rule.
Congress has, from time to time, considered legislation to reduce emissions of GHGs. In addition, a number of state and regional efforts have emerged that are aimed at tracking and/or reducing GHG emissions by means of cap and trade programs that typically require major sources of GHG emissions, such as electric power plants, to acquire and surrender emission allowances in return for emitting those GHGs. Most recently, the EPA finalized rules to further reduce GHG emissions, primarily from coal-fired power plants, under its Clean Power Plan. The Clean Power Plan and associated BLM Venting and Flaring rule may become subject to the Congressional Review Act given the focus of the Trump administration on reduced regulation. If fully implemented, the Clean Power Plan could affect the demand for products we supply or otherwise affect our operations. If Congress undertakes comprehensive tax reform in the coming year, it is possible that such reform may include a carbon tax, which could impose additional direct costs on operations and reduce demand for refined products. In January 2015, the EPA announced a comprehensive strategy intended to further reduce methane emissions from the oil and gas sector, which already has resulted in the final May 2016 amendments to the 2012 NSPS and the related source determination rule noted above and may result in additional regulation. Although it is not possible at this time to predict how legislation or new regulations that may be adopted to address GHG emissions would impact our business, any such future laws and regulations imposing reporting obligations on, or limiting emissions of GHGs from our equipment and operations could require us to incur costs to reduce emissions of GHGs associated with our operations. Severe limitations on GHG emissions could adversely affect demand for the oil and natural gas we produce.
Water discharges
The Federal Water Pollution Control Act or the Clean Water Act (“CWA”) and analogous state laws impose restrictions and controls regarding the discharge of pollutants into certain surface waters. In 2016, the definition of waters of the United States was substantially expanded which may have effect on our current and future operations. The Trump administration has identified this rule change as one that may be rescinded using the Congressional Review Act or other means. Pursuant to these laws and regulations, we may be required to obtain and maintain approvals or permits for the discharge of wastewater or storm water and are required to develop and implement spill prevention, control and countermeasure plans, also referred to as “SPCC plans,” in connection with on‑site storage of significant quantities of oil. As properties are acquired, we determine the need for new or updated SPCC plans and, where necessary, will develop or update such plans to implement physical and operation controls, the costs of which are not expected to be material. In June 2015, the EPA and the U.S. Army
30
Corps of Engineers adopted a new regulatory definition of "waters of the U.S.," which governs which waters and wetlands are subject to the CWA. This final rule has been stayed pending the resolution of ongoing litigation, and in February 2017, President Trump signed an executive order directing EPA to begin rescinding or revising this final rule. In June 2016, EPA finalized new CWA pretreatment standards that would prevent onshore unconventional oil and natural gas wells from discharging wastewater pollutants to publicly-owned treatment facilities.
Endangered Species Act
The federal Endangered Species Act restricts activities that may affect endangered and threatened species or their habitats. A final rule amending how critical habitat is designated was finalized in 2016. Some of our facilities may be located in areas that are designated as habitat for endangered or threatened species. The designation of previously unidentified endangered or threatened species could cause us to incur additional costs or become subject to operating restrictions or bans in the affected areas.
Employee health and safety
We are subject to a number of federal and state laws and regulations, including the federal Occupational Safety and Health Act (the “OSH Act”), and comparable state statutes, whose purpose is to protect the health and safety of workers. In 2016, there were substantial revisions to the OSHA regulations that may have impact to our operations. These changes include among other items; record keeping and reporting, revised crystalline silica standard, naming oil and gas as a high hazard industry, requirements for a safety and health management system. In addition, the OSH Act’s hazard communication standard, the EPA community right-to-know regulations under Title III of the federal Superfund Amendment and Reauthorization Act and comparable state statutes require that information be maintained concerning hazardous materials used or produced in our operations, and that this information be provided to employees, state and local government authorities and citizens.
Hydraulic fracturing
Regulations relating to hydraulic fracturing. We are subject to extensive federal, state, and local laws and regulations concerning health, safety, and environmental protection. Government authorities frequently add to those requirements, and both oil and gas development generally and hydraulic fracturing specifically are receiving increasing regulatory attention. Our operations utilize hydraulic fracturing, an important and commonly used process in the completion of oil and natural gas wells in low-permeability formations. Hydraulic fracturing involves the injection of water, proppant, and chemicals under pressure into rock formations to stimulate hydrocarbon production.
States have historically regulated oil and gas exploration and production activity, including hydraulic fracturing. State governments in the areas where we operate have adopted or are considering adopting additional requirements relating to hydraulic fracturing that could restrict its use in certain circumstances or make it more costly to utilize. Such measures may address any risk to drinking water, the potential for hydrocarbon migration and disclosure of the chemicals used in fracturing. Colorado, for example, comprehensively updated its oil and gas regulations in 2008 and adopted significant additional amendments in 2011 and 2013. Among other things, the updated and amended regulations require operators to reduce methane emissions associated with hydraulic fracturing, compile and report additional information regarding well bore integrity, publicly disclose the chemical ingredients used in hydraulic fracturing, increase the minimum distance between occupied structures and oil and gas wells, undertake additional mitigation for nearby residents, and implement additional groundwater testing. In 2014, the State enacted legislation to increase the potential sanctions for statutory, regulatory and other violations. Among other things, this legislation and its implementing regulations mandate monetary penalties for certain types of violations, require a penalty to be assessed for each day of violation and significantly increase the maximum daily penalty amount. Most recently, Colorado adopted rules imposing additional permitting requirements for certain large scale facilities in urban mitigation areas and additional notice requirements prior to engaging in operations near certain municipalities. Any enforcement actions or requirements of additional studies or investigations by governmental authorities where we operate could increase our operating costs and cause delays or interruptions of our operations.
The federal Safe Drinking Water Act (“SDWA”) and comparable state statutes may restrict the disposal, treatment or release of water produced or used during oil and gas development. Subsurface emplacement of fluids, primarily via disposal wells or enhanced oil recovery (“EOR”) wells, is governed by federal or state regulatory authorities that, in some cases, include the state oil and gas regulatory or the state’s environmental authority. The federal Energy Policy Act of 2005 amended the Underground Injection Control provisions of the SDWA to expressly exclude certain hydraulic fracturing from the definition of “underground injection,” but disposal of hydraulic fracturing fluids and produced water or their injection for EOR is not excluded. Congress has considered bills to repeal this SDWA exemption for hydraulic fracturing. If enacted, hydraulic fracturing operations could be required to meet additional federal permitting and financial assurance requirements, adhere to
31
certain construction specifications, fulfill monitoring, reporting, and recordkeeping obligations, meet plugging and abandonment requirements, and provide additional public disclosure of chemicals used in the fracturing process.
Federal agencies are also considering additional regulation of hydraulic fracturing. The EPA has published guidance for issuing underground injection permits that would regulate hydraulic fracturing using diesel fuel. This guidance eventually could encourage other regulatory authorities to adopt permitting and other restrictions on the use of hydraulic fracturing. In addition, on October 21, 2011, the EPA announced its intention to propose regulations under the CWA to regulate wastewater discharges from hydraulic fracturing and other natural gas production. As noted above, in June 2016, EPA finalized regulations that address discharges of wastewater pollutants from onshore unconventional extraction facilities to publicly-owned treatment works. The EPA is also collecting information as part of a nationwide study into the effects of hydraulic fracturing on drinking water. The EPA issued a progress report regarding the study in December 2012, which described generally the continuing focus of the study, but did not provide any data, findings, or conclusions regarding the safety of hydraulic fracturing operations. In June 2015, the EPA released a draft assessment of the potential impacts to drinking water resources from hydraulic fracturing. The Agency will finalize the assessment following public comment and review. The results of this study could result in additional regulations, which could lead to operational burdens similar to those described above. The EPA also has initiated a stakeholder and potential rulemaking process under the Toxic Substances Control Act (“TSCA”) to obtain data on chemical substances and mixtures used in hydraulic fracturing. The EPA has not indicated when it intends to issue a proposed rule, but it issued an Advanced Notice of Proposed Rulemaking in May 2014, seeking public comment on a variety of issues related to the TSCA rulemaking. As noted above, in January 2017, the EPA issued a proposed rule to include natural gas processing facilities in the TRI program. The United States Department of the Interior also finalized a new rule regulating hydraulic fracturing activities on federal lands, including requirements for disclosure, well bore integrity and handling of flowback water. This rule has been stayed pending the outcome of ongoing litigation. In early 2016, the Bureau of Land Management (“BLM”) proposed rules related to further controlling the venting and flaring of natural gas on BLM land which the U.S. House of Representative passed resolution to repeal. The U.S. Occupational Safety and Health Administration has proposed stricter standards for worker exposure to silica, which would apply to use of sand as a proppant for hydraulic fracturing. In addition, the Department of Labor and the Department of Justice, Environment and Natural Resources Division released a Memorandum of Understanding announcing an inter-agency effort to increase the enforcement of workplace safety crimes that occur in conjunction with environmental crimes.
Apart from these ongoing federal and state initiatives, local governments are adopting new requirements on hydraulic fracturing and other oil and gas operations. Voters in Colorado have proposed or advanced initiatives restricting or banning oil and gas development in Colorado. Any successful bans or moratoriums where we operate could increase the costs of our operations, impact our profitability, and even prevent us from drilling in certain locations.
At this time, it is not possible to estimate the potential impact on our business of recent state and local actions or the enactment of additional federal or state legislation or regulations affecting hydraulic fracturing. The adoption of future federal, state or local laws or implementing regulations imposing new environmental obligations on, or otherwise limiting, our operations could make it more difficult and more expensive to complete oil and natural gas wells, increase our costs of compliance and doing business, delay or prevent the development of certain resources (including especially shale formations that are not commercial without the use of hydraulic fracturing), or alter the demand for and consumption of our products and services. We cannot assure you that any such outcome would not be material, and any such outcome could have a material and adverse impact on our cash flows and results of operations.
Our use of hydraulic fracturing. We use hydraulic fracturing as a means to maximize production of oil and gas from formations having low permeability such that natural flow is restricted. Fracture stimulation has been used for decades in both the Rocky Mountains and Mid-Continent.
Typical hydraulic fracturing treatments are made up of water, chemical additives and sand. We utilize major hydraulic fracturing service companies who track and report additive chemicals that are used in fracturing as required by the appropriate government agencies. Each of these companies fracture stimulate a multitude of wells for the industry each year.
We periodically review our plans and policies regarding oil and gas operations, including hydraulic fracturing, in order to minimize any potential environmental impact. Our operations are subject to close supervision by state and federal regulators (including the BLM with respect to federal acreage), who frequently inspect our fracturing operations.
National Environmental Policy Act
Natural gas and oil exploration and production activities on federal lands are subject to the National Environmental Policy Act (“NEPA”). NEPA requires federal agencies, including the Departments of Interior and Agriculture, to evaluate major
32
agency actions having the potential to significantly impact the environment. In the course of such evaluations, an agency prepares an Environmental Assessment to evaluate the potential direct, indirect and cumulative impacts of a proposed project. If impacts are considered significant, the agency will prepare a more detailed environmental impact study that is made available for public review and comment. All of our current exploration and production activities, as well as proposed exploration and development plans, on federal lands require governmental permits that are subject to the requirements of NEPA. The vast majority of our exploration and production activities are not on federal lands. This environmental impact assessment process has the potential to delay or limit, or increase the cost of, the development of natural gas and oil projects on federal lands. Authorizations under NEPA also are subject to protest, appeal or litigation, which can delay or halt projects.
Oil Pollution Act
The Oil Pollution Act of 1990 (“OPA”) establishes strict liability for owners and operators of facilities that are the site of a release of oil into waters of the U.S. The OPA and its associated regulations impose a variety of requirements on responsible parties related to the prevention of oil spills and liability for damages resulting from such spills. A “responsible party” under the OPA includes owners and operators of certain onshore facilities from which a release may affect waters of the U.S. The OPA assigns liability to each responsible party for oil cleanup costs and a variety of public and private damages. While liability limits apply in some circumstances, a party cannot take advantage of liability limits if the spill was caused by gross negligence or willful misconduct or resulted from violation of a federal safety, construction or operating regulation. If the party fails to report a spill or to cooperate fully in the cleanup, liability limits likewise do not apply. Few defenses exist to the liability imposed by the OPA. The OPA imposes ongoing requirements on a responsible party, including the preparation of oil spill response plans and proof of financial responsibility to cover environmental cleanup and restoration costs that could be incurred in connection with an oil spill.
State laws
Our properties located in Colorado are subject to the authority of the Colorado Oil and Gas Conservation Commission (the “COGCC”), as well as other state agencies. The COGCC recently approved new rules regarding minimum setbacks, groundwater monitoring, large-scale facilities in urban mitigation areas, and public notice requirements that are intended to prevent or mitigate environmental impacts of oil and gas development and include the permitting of wells. Over the past several years, the COGCC has also approved new rules regarding various other matters, including wellbore integrity, hydraulic fracturing, well control waste management, spill reporting, and an increase in potential sanctions for COGCC rule’s violations. Depending on how these and any other new rules are applied, they could add substantial increases in well costs for our Colorado operations. The rules could also impact our ability and extend the time necessary to obtain drilling permits, which would create substantial uncertainty about our ability to meet future drilling plans and thus production and capital expenditure targets. The State of Colorado also created a task force to make recommendations for minimizing land use and other conflicts concerning the location of new oil and gas facilities. In February 2015, the task force concluded their deliberations and agreed upon nine consensus proposals which were sent to Governor Hickenlooper for his review. Three of the proposals require further legislative action, while the other six proposals require rulemaking or other regulatory action. The proposals support (i) a senate bill that would postpone expiration of recently adopted regulations, regarding air emissions; (ii) tasking the COGCC with crafting new rules related to siting of “large-scale” pads and facilities; (iii) requiring the industry to provide advance information about development plans to local governments; (iv) improving the COGCC’s local government liaison and designee programs; (v) adding 11 full-time staffers to the COGCC; (vi) bolstering the inspection staff and equipment for monitoring oil and gas facility air emissions and setting up a hotline for citizen health complaints at the Colorado Department of Public Health and Environment; (vii) creating a statewide oil and gas information clearinghouse; (viii) studying ways to ameliorate the impact of oil and gas truck traffic and (ix) creating a compliance-assistance program at the COGCC to help operators comply with the state's changing rules and ensure consistent enforcement of rules by state inspectors. A number of additional proposals did not receive sufficient task force support to be included with the nine consensus proposals, but may nevertheless be forwarded to the Governor as well.
In 2015 and into 2016, COGCC implemented two of these recommendations (in particular items (ii) and (iii) identified above). With respect to recommendation (ii) above, the COGCC finalized rules to permit “large-scale facilities” in “urban mitigation areas.” With respect to recommendation (iii) above, the COGCC finalized rules to require operators to provide certain municipalities with public notice prior to engaging in operations.
In 2016, the Colorado Supreme Court ruled that the cities of Fort Collins and Longmont do not have authority to ban oil and gas operations within their jurisdictional limits. Although we do not own or operate within any of these municipal areas, the Colorado Supreme Court decision has bearing on our ability to continue to operate in Colorado. Further, Weld County completed implementation of a local government permitting process for land use approval. We do not expect that the local government issues will have any material impact on our operations.
33
Employees
As of December 31, 2016, we employed 231 people and also utilized the services of independent contractors to perform various field and other services. Our future success will depend partially on our ability to attract, retain and motivate qualified personnel. We are not a party to any collective bargaining agreements and have not experienced any strikes or work stoppages.
Offices
As of December 31, 2016, we leased 83,463 square feet of office space in Denver, Colorado at 410 17th Street where our principal offices are located and leased 7,780 square feet near our operations in Weld County, Colorado, where we have a field office and storage facilities. We also own field offices in Evans, Colorado and Magnolia, Arkansas.
Available information
We are required to file annual, quarterly and current reports, proxy statements and other information with the SEC. You may read and copy any documents filed by us with the SEC at the SEC’s Public Reference Room at 100 F Street, N.E., Washington, D.C. 20549. You may obtain information on the operation of the Public Reference Room by calling the SEC at 1‑800‑SEC‑0330. Our filings with the SEC are also available to the public from commercial document retrieval services and at the SEC’s website at http://www.sec.gov.
Our common stock is listed and traded on the New York Stock Exchange under the symbol “BCEI.” Our reports, proxy statements and other information filed with the SEC can also be inspected and copied at the New York Stock Exchange, 20 Broad Street, New York, New York 10005.
We also make available on our website at http://www.bonanzacrk.com all of the documents that we file with the SEC, free of charge, as soon as reasonably practicable after we electronically file such material with the SEC. Information contained on our website, other than the documents listed below, is not incorporated by reference into this Annual Report on Form 10‑K.
Item 1A. Risk Factors.
Our business involves a high degree of risk. If any of the following risks, or any risk described elsewhere in this Annual Report on Form 10-K, actually occurs, our business, financial condition or results of operations could suffer. The risks described below are not the only ones facing us. Additional risks not presently known to us or which we currently consider immaterial also may adversely affect us.
Risks Related to Bankruptcy:
We are subject to risks and uncertainties associated with our Chapter 11 cases.
On January 4, 2017, the Company along with six of its subsidiaries, including Bonanza Creek Energy Operating Company, LLC, Bonanza Creek Energy Resources, LLC, Holmes Eastern Company, LLC, Rocky Mountain Infrastructure, LLC, Bonanza Creek Energy Upstream LLC, and Bonanza Creek Energy Midstream, LLC, filed voluntary petitions seeking relief under Chapter 11 of the United States Bankruptcy Code.
Our operations and ability to develop and execute our business plan, our financial condition, our liquidity and our continuation as a going concern, are subject to the risks and uncertainties associated with our bankruptcy. These risks include the following:
• | our ability to prosecute, confirm and consummate a plan of reorganization with respect to the Chapter 11 cases; |
• | the high costs of bankruptcy cases and related fees; |
• | our ability to obtain sufficient financing to allow us to emerge from bankruptcy and execute our business plan post-emergence; |
• | our ability to maintain our relationships with our suppliers, service providers, customers, employees, and other third parties; |
• | our ability to maintain contracts that are critical to our operations; |
• | our ability to safely and efficiently re-start operations after a protracted period of minimal activity; |
34
• | our ability to execute competitive contracts with third party contractors while tainted with a bankruptcy legacy; |
• | our ability to execute our business plan in the current commodity price environment; |
• | our ability to attract, motivate and retain key employees; |
• | the ability of third parties to seek and obtain court approval to terminate contracts and other agreements with us; |
• | our ability to retain our current management team if a trustee is appointed; |
• | the ability of third parties to seek and obtain court approval to convert the Chapter 11 cases to a Chapter 7 proceeding; and |
• | the actions and decisions of our creditors and other third parties who have interests in our Chapter 11 cases that may be inconsistent with our plans. |
Delays in our Chapter 11 cases increase the risks of our being unable to reorganize our business and emerge from bankruptcy and increase our costs associated with the bankruptcy process.
These risks and uncertainties could affect our business and operations in various ways. For example, negative events or publicity associated with our Chapter 11 cases could adversely affect our relationships with our suppliers, service providers, customers, employees, and other third parties, which in turn could adversely affect our operations and financial condition. Also, pursuant to the Bankruptcy Code, we need the prior approval of the Bankruptcy Court for transactions outside the ordinary course of business, which may limit our ability to respond timely to certain events or take advantage of certain opportunities. We also need Bankruptcy Court confirmation of the Plan. Because of the risks and uncertainties associated with our Chapter 11 cases, we cannot accurately predict or quantify the ultimate impact of events that occur during our Chapter 11 cases will have on our business, financial condition and results of operations, and there is no certainty as to our ability to continue as a going concern.
We may not be able to obtain confirmation of a Chapter 11 plan of reorganization.
To emerge successfully from Bankruptcy Court protection as a viable entity, we must meet certain statutory requirements with respect to adequacy of disclosure with respect to a Chapter 11 plan of reorganization, solicit and obtain the requisite acceptances of such a reorganization plan and fulfill other statutory conditions for confirmation of such a plan. Although we have distributed to our creditors a disclosure statement with respect to the Plan and our solicitation of the Plan has been completed, certain parties in interest have filed objections to the Plan in an effort to persuade the Bankruptcy Court that we have not satisfied the confirmation requirements under section 1129 of the Bankruptcy Code. Those objections have not yet been addressed or ruled on by the Bankruptcy Court. The precise requirements and evidentiary showing for confirming a plan, notwithstanding its rejection by one or more impaired classes of claims or equity interests, depends upon a number of factors including, without limitation, the status and seniority of the claims or equity interests in the rejecting class (i.e., secured claims or unsecured claims, subordinated or senior claims, preferred or common stock).
A confirmation hearing on the Prepackaged Plan has been scheduled to begin on April 3, 2017, but it is possible that hearing could be delayed. It is also possible that the Bankruptcy Court will not confirm the Prepackaged Plan. If the Prepackaged Plan is not confirmed by the Bankruptcy Court, it is unclear whether we would be able to reorganize our business and what, if anything, holders of claims against us would ultimately receive with respect to their claims.
Even if a Chapter 11 plan of reorganization is consummated, we may not be able to achieve our stated goals and continue as a going concern.
Even if the Prepackaged Plan or another Chapter 11 plan of reorganization is consummated, we will continue to face a number of risks, including further deterioration in commodity prices or other changes in economic conditions, changes in our industry, changes in demand for our oil and gas and increasing expenses. Accordingly, we cannot guarantee that the Plan or any other Chapter 11 plan of reorganization will achieve our stated goals.
Our proposed Prepackaged Plan contemplates a $200 million rights offering that would strengthen our liquidity at emergence. However, if this rights offering is not approved by the Bankruptcy Court or otherwise does not occur, and even if our debts are reduced or discharged through a different confirmed plan, we may need to raise additional funds through public or private debt or equity financing or other various means to fund our business after the completion of our Chapter 11 cases. Our access to additional financing is, and for the foreseeable future will likely continue to be, extremely limited, if it is available at all. Therefore, adequate funds may not be available when needed or may not be available on favorable terms, if they are available at all. Our ability to continue as a going concern is dependent upon our ability to raise additional capital. As a result, we cannot give any assurance of our ability to continue as a going concern, even if a plan is confirmed.
35
We have substantial liquidity needs and may not be able to obtain sufficient liquidity to confirm a plan of reorganization and exit bankruptcy.
Although we have lowered our capital budget and reduced the scale of our operations significantly, our business remains capital intensive. In addition to the cash requirements necessary to fund ongoing operations, we have incurred significant professional fees and other costs in connection with our Chapter 11 cases and expect that we will continue to incur significant professional fees and costs throughout our Chapter 11 cases. Although we currently have $80.6 million of cash on hand, there are no assurances that our current liquidity is sufficient to allow us to satisfy our obligations related to the Chapter 11 cases, allow us to proceed with the confirmation of a Chapter 11 plan of reorganization and allow us to emerge from bankruptcy. We can provide no assurance that we will be able to secure additional interim financing or exit financing sufficient to meet our liquidity needs or, if sufficient funds are available, offered to us on acceptable terms.
In certain instances, a Chapter 11 case may be converted to a case under Chapter 7 of the Bankruptcy Code.
Upon a showing of cause, the Bankruptcy Court may convert our Chapter 11 case to a case under Chapter 7 of the Bankruptcy Code. In such event, a Chapter 7 trustee would be appointed or elected to liquidate our assets for distribution in accordance with the priorities established by the Bankruptcy Code. We believe that liquidation under Chapter 7 would result in significantly smaller distributions being made to our creditors than those provided for in our Plan because of (i) the likelihood that the assets would have to be sold or otherwise disposed of in a distressed fashion over a short period of time rather than in a controlled manner and as a going concern, (ii) additional administrative expenses involved in the appointment of a Chapter 7 trustee, and (iii) additional expenses and claims, some of which would be entitled to priority, that would be generated during the liquidation and from the rejection of leases and other executory contracts in connection with a cessation of operations.
We believe it is highly likely that the shares of our existing common stock will be canceled in our Chapter 11 cases.
The Prepackaged Plan provides, among other things, that upon our emergence from bankruptcy, our existing common stock will be canceled, and the holders of our existing common stock will receive 4.5 percent of our post-emergence common stock (subject to dilution from a $200 million rights offering, a new management incentive plan, and warrants for existing equity holders) plus warrants to acquire up to 7.5 percent of the post-emergence common stock. If the Prepackaged Plan is confirmed by the Bankruptcy Court, the existing shareholders’ post-emergence shares of common stock and warrants may be subject to further dilution due to subsequent capital raising activities. Additionally, the Prepackaged Plan may not be confirmed by the Bankruptcy Court, in which case, the chance that the existing shareholders will receive little or no distribution in our Chapter 11 cases may increase. Accordingly, any trading in shares of our common stock during the pendency of the Chapter 11 cases is highly speculative.
We may be subject to claims that will not be discharged in our Chapter 11 cases, which could have a material adverse effect on our financial condition and results of operations.
The Bankruptcy Code provides that the confirmation of a Chapter 11 plan of reorganization discharges a debtor from substantially all debts arising prior to confirmation. With few exceptions, all claims that arose prior to confirmation of the plan of reorganization (i) would be subject to compromise and/or treatment under the plan of reorganization and (ii) would be discharged in accordance with the Bankruptcy Code and the terms of the plan of reorganization. Any claims not ultimately discharged through a Chapter 11 plan of reorganization could be asserted against the reorganized entities and may have an adverse effect on our financial condition and results of operations on a post-reorganization basis.
Our financial results may be volatile and may not reflect historical trends.
During the Chapter 11 cases, we expect our financial results to continue to be volatile as asset impairments, asset dispositions, restructuring activities and expenses, contract terminations and rejections, and claims assessments may significantly impact our consolidated financial statements. As a result, our historical financial performance is likely not indicative of our financial performance after the date of the bankruptcy filing.
In addition, if we emerge from Chapter 11, the amounts reported in subsequent consolidated financial statements may materially change relative to historical consolidated financial statements, including as a result of revisions to our operating plans pursuant to a plan of reorganization. We expect to be required to adopt fresh start accounting, in which case our assets and liabilities will be recorded at fair value as of the fresh start reporting date, which may differ materially from the recorded values of assets
36
and liabilities on our consolidated balance sheets. Our financial results after the application of fresh start accounting also may be different from historical trends.
Transfers of our equity, or issuances of equity in connection with our Chapter 11 cases, may impair our ability to utilize our federal income tax net operating loss carryforwards and depreciation, depletion and amortization deductions in future years.
Under federal income tax law, a corporation is generally permitted to deduct from taxable income net operating losses carried forward from prior years. We have net operating loss carryforwards of approximately $618.5 million as of December 31, 2016. Our ability to utilize our net operating loss carryforwards to offset future taxable income and to reduce federal income tax liability is subject to certain requirements and restrictions. If we experience an “ownership change,” as defined in section 382 of the Internal Revenue Code, then our ability to use our net operating loss carryforwards and amortizable tax basis in our properties may be substantially limited, which could have a negative impact on our financial position and results of operations. Generally, there is an “ownership change” if one or more stockholders owning 5% or more of a corporation’s common stock have aggregate increases in their ownership of such stock of more than 50 percentage points over the prior three-year period. Following the implementation a plan of reorganization, it is possible that an “ownership change” may be deemed to occur. Under section 382 of the Internal Revenue Code, absent an applicable exception, if a corporation undergoes an “ownership change,” the amount of its net operating losses that may be utilized to offset future taxable income generally is subject to an annual limitation. Further, future deductions for depreciation, depletion and amortization could be limited if the fair value of our assets is determined to be less than the tax basis.
Our plan for reorganizing the Company may be delayed or altered due to actions by current equity security holders who disagree with our approach to restructuring.
Certain holders of the Bonanza Creek Energy, Inc.’s common shares have formed an ad hoc committee of equity security holders (the “Ad Hoc Equity Committee”) and have filed motions and other pleadings in the Chapter 11 Cases adverse to the Restructuring contemplated by the RSA. In particular, on February 3, 2017, the Ad Hoc Equity Committee filed a motion (the “Trustee Motion”) for an order appointing a trustee pursuant to section 1104(a) of the Bankruptcy Code or, in the alternative, appointing an examiner pursuant to section 1104(c) of the Bankruptcy Code. If the Trustee Motion were granted with respect to the Ad Hoc Equity Committee’s request for the appointment of a trustee, then the Debtors would cease to be debtors in possession and the affairs and management of the business would be controlled by a court-appointed trustee.
Risks Related to Our Business
Further declines, in oil and, to a lesser extent, natural gas prices, will adversely affect our business, financial condition or results of operations and our ability to meet our capital expenditure obligations or targets and financial commitments.
The price we receive for our oil and, to a lesser extent, natural gas and NGLs, heavily influences our revenue, profitability, cash flows, liquidity, the borrowing base under any revolving credit facility that we are able to enter into following emergence from our Chapter 11 cases, access to capital, present value and quality of our reserves, the nature and scale of our operations and future rate of growth. Oil and natural gas are commodities and, therefore, their prices are subject to wide fluctuations in response to relatively minor changes in supply and demand. In recent years, the markets for oil and natural gas have been volatile. These markets will likely continue to be volatile in the future. Further, oil prices and natural gas prices do not necessarily fluctuate in direct relation to each other. Because approximately 75% of our estimated proved reserves as of December 31, 2016 were oil and NGLs, our financial results are more sensitive to movements in oil prices. Since mid-2014, the price of crude oil has significantly declined. As a result, we experienced significant decreases in crude oil revenues and recorded asset impairment charges due to commodity price declines. A prolonged period of low market prices for oil, natural gas and NGLs, like the current commodity price environment, or further declines in the market prices for oil and natural gas, will result in capital expenditures being further curtailed and will adversely affect our business, financial condition and liquidity and our ability to meet obligations, targets or financial commitments. During the year ended December 31, 2016, the daily NYMEX WTI oil spot price ranged from a high of $54.01 per Bbl to a low of $26.19 per Bbl, and the NYMEX natural gas HH spot price ranged from a high of $3.80 per MMBtu to a low of $1.49 per MMBtu. As of March 10, 2016, the daily NYMEX WTI oil spot price and NYMEX natural gas HH spot price was $48.49 per Bbl and $3.01 per MMBtu, respectively.
The prices we receive for our production, and the levels of our production, depend on numerous factors beyond our control. These factors include, but are not limited to, the following:
• | worldwide and regional economic conditions impacting the global supply and demand for oil and natural gas; |
• | the actions from members of the Organization of Petroleum Exporting Countries and other oil producing nations; |
• | the price and quantity of imports of foreign oil and natural gas; |
37
• | political conditions in or affecting other oil-producing and natural gas-producing countries, including the current conflicts in the Middle East and conditions in South America and Russia; |
• | the level of global oil and natural gas exploration and production; |
• | the level of global oil and natural gas inventories; |
• | localized supply and demand fundamentals and transportation availability; |
• | weather conditions and natural disasters; |
• | domestic and foreign governmental regulations; |
• | speculation as to the future price of oil and the speculative trading of oil and natural gas futures contracts; |
• | the price and availability of competitors' supplies of oil and natural gas; |
• | technological advances affecting energy consumption; |
• | variability in subsurface reservoir characteristics, particularly in areas with immature development history; |
• | the availability of pipeline capacity and infrastructure; and |
• | the price and availability of alternative fuels. |
Substantially all of our production is sold to purchasers under contracts at market-based prices. Declines in commodity prices may have the following effects on our business:
• | reduction of our revenues, profit margins, operating income and cash flows; |
• | reduction in the amount of crude oil, natural gas and NGLs that we can produce economically and may lead to reduced liquidity and the inability to pay our liabilities as they come due; |
• | certain properties in our portfolio becoming economically unviable; |
• | delay or postponement of some of our capital projects; |
• | significant reductions in future capital programs, resulting in a reduced ability to develop our reserves; |
• | limitations on our financial condition, liquidity and/or ability to finance planned capital expenditures and operations; |
• | reduction to the borrowing base under our revolving credit facility or limitations in our access to sources of capital, such as equity or debt; |
• | declines in our stock price; |
• | refinery industry demand for crude oil; |
• | storage availability for crude oil; |
• | the ability of our vendors, suppliers, and customers to continue operations due to the prevailing adverse market conditions; |
• | asset impairment charges resulting from reductions in the carrying values of our crude oil and natural gas properties at the date of assessment. |
Our production is not hedged, and we are exposed to fluctuations in the price of oil and will be affected by continuing and prolonged declines in the price of oil and natural gas.
Oil and natural gas prices are volatile, and the Company currently has none of its anticipated future production hedged. As a result, all of our future production will be sold at market prices, exposing us to the fluctuations in the price of oil and natural gas, unless we enter into new hedging transactions. To the extent that the price of oil and natural gas decline below current levels, our results of operations and financial condition would be materially adversely impacted. See the Derivative Activity section in Part I, Item I of this Annual Report on Form 10-K for a summary of our hedging activity.
38
Due to reduced commodity prices and lower operating cash flows we may be unable to maintain adequate liquidity and our ability to make interest payments in respect of our indebtedness could be adversely affected.
Recent declines in commodity prices have caused a reduction in our available liquidity, and we are now in bankruptcy. While we anticipate that substantially all of our $800.0 million of long-term unsecured indebtedness will be discharged upon confirmation of a plan of reorganization, we will continue to have substantial capital needs upon emergence from bankruptcy, including in connection with the continued development of our oil and gas assets. We may not have the ability to generate sufficient cash flows from operations and, therefore, sufficient liquidity to meet our anticipated working capital, debt service and other liquidity needs.
Concerns over general economic, business or industry conditions may have a material adverse effect on our results of operations, liquidity and financial condition.
Concerns over global economic conditions, energy costs, geopolitical issues, inflation, the availability and cost of credit, the European, Asian and the United States financial markets have contributed to increased economic uncertainty and diminished expectations for the global economy. In addition, continued hostilities in the Middle East and the occurrence or threat of terrorist attacks in the United States or other countries could adversely affect the global economy. These factors, combined with volatility in commodity prices, business and consumer confidence and unemployment rates, have precipitated an economic slowdown. Concerns about global economic growth have had a significant adverse impact on global financial markets and commodity prices. If the economic climate in the United States or abroad deteriorates, worldwide demand for petroleum products could diminish further, which could impact the price at which we can sell our production, affect the ability of our vendors, suppliers and customers to continue operations and ultimately adversely impact our results of operations, liquidity and financial condition.
Borrowings under our revolving credit facility are limited by our borrowing base, which is subject to periodic redetermination.
We anticipate that the borrowing base under our revolving credit facility upon our emergence from bankruptcy will be redetermined on a periodic basis based upon a number of factors, including commodity prices and reserve levels. In addition, our lenders will also have substantial flexibility to reduce our borrowing base due to subjective factors. Upon a redetermination, we could be required to repay a portion of our bank debt to the extent our outstanding borrowings at such time exceed the redetermined borrowing base. We may not have sufficient funds to make such repayments, which could result in a default under the terms of the facility and an acceleration of the loans thereunder requiring us to negotiate renewals, arrange new financing or sell significant assets, all of which could have a material adverse effect on our business and financial results.
Drilling for and producing oil and natural gas are high-risk activities with many uncertainties that could adversely affect our business, financial condition or results of operations.
Our future financial condition and results of operations will depend on the success of our exploitation, exploration, development and production activities. Our oil and natural gas exploration and production activities are subject to numerous risks beyond our control, including the risk that drilling will not result in commercially viable oil or natural gas production. Our decisions to purchase, explore, develop or otherwise exploit drilling locations or properties will depend in part on the evaluation of data obtained through geophysical and geological analyses, production data and engineering studies, the results of which are often inconclusive or subject to varying interpretations. For a discussion of the uncertainty involved in these processes, see Our estimated proved reserves are based on many assumptions that may turn out to be inaccurate. Any significant inaccuracies in these reserve estimates or underlying assumptions will materially affect the quantities and present value of our reserves below. Our cost of drilling, completing and operating wells is often uncertain before drilling commences. Overruns in budgeted expenditures are common risks that can make a particular project uneconomical. Further, many factors, including, but not limited to, the following, may result in substantial losses, including personal injury or loss of life, penalties, damage or destruction of property and equipment, and curtailments, delays or cancellations of our scheduled drilling projects:
• | shortages of or delays in obtaining equipment and qualified personnel; |
• | facility or equipment malfunctions; |
• | unexpected operational events; |
• | unanticipated environmental liabilities; |
• | pressure or irregularities in geological formations; |
• | adverse weather conditions, such as blizzards, ice storms, tornadoes, floods, and fires; |
39
• | reductions in oil and natural gas prices; |
• | delays imposed by or resulting from compliance with regulatory requirements, such as permitting delays; |
• | proximity to and capacity of transportation facilities; |
• | title problems; |
• | safety concerns, and |
• | limitations in the market for oil and natural gas. |
Our estimated proved reserves and our ultimate number of prospective well development locations are based on many assumptions that may turn out to be inaccurate. Any significant inaccuracies in these reserve estimates or underlying assumptions will materially affect the quantities and present value of our reserves.
The process of estimating oil and natural gas reserves and the production possible from our oil and gas wells is complex. It requires interpretations of available technical data and many assumptions, including assumptions relating to current and future economic conditions and commodity prices. Any significant inaccuracies in these interpretations or assumptions could materially affect the estimated quantities and present value of reserves shown in this Annual Report on Form 10-K. See Estimated Proved Reserves under Part I, Item 1 of this Annual Report on Form 10-K for information about our estimated oil and natural gas reserves and the PV-10 (a non-GAAP financial measure) as of December 31, 2016, 2015 and 2014.
In order to prepare our estimates, we must project production rates and the timing of development expenditures. We must also analyze available geological, geophysical, production and engineering data. The extent, quality and reliability of this data can vary. The process also requires economic assumptions about matters such as oil and natural gas prices, drilling and operating expenses, capital expenditures, taxes and availability of funds, and given the current volatility in pricing, such assumptions are difficult to make. Although the reserve information contained herein is reviewed by independent reserve engineers, estimates of oil and natural gas reserves are inherently imprecise particularly as they relate to state-of-the-art technologies being employed such as the combination of hydraulic fracturing and horizontal drilling.
Actual future production, oil and natural gas prices, revenues, taxes, development expenditures, operating expenses and quantities of recoverable oil and natural gas reserves will vary from our estimates. Any significant variance could materially affect the estimated quantities and present value of reserves shown in this Annual Report on Form 10-K and our impairment charges. In addition, we may adjust estimates of proved reserves to reflect production history, results of exploration and development, prevailing oil and natural gas prices and other factors, many of which are beyond our control.
The present value of future net revenues from our proved reserves will not necessarily be the same as the current market value of our estimated oil and natural gas reserves.
You should not assume that the present value of future net revenues from our proved reserves is the current market value of our estimated oil and natural gas reserves. In accordance with SEC requirements for the years ended December 31, 2016, 2015 and 2014, we based the estimated discounted future net revenues from our proved reserves on the unweighted arithmetic average of the first-day-of-the-month commodity prices for the preceding twelve months (after adjustment for location and quality differentials), without giving effect to derivative transactions. Actual future net revenues from our oil and natural gas properties will be affected by factors such as:
• | actual prices we receive for oil and natural gas and hedging instruments; |
• | actual cost of development and production expenditures; |
• | the amount and timing of actual production; |
• | the amount and timing of future development costs; |
• | wellbore productivity realizations above or below type curve forecast models; |
• | the supply and demand of oil and natural gas; and |
• | changes in governmental regulations or taxation. |
The timing of both our production and our incurrence of expenses in connection with the development and production of oil and natural gas properties will affect the timing and amount of actual future net revenues from proved reserves, and thus
40
their actual present value. In addition, the 10% discount factor (the factor required by the SEC) used when calculating discounted future net revenues may not be the most appropriate discount factor based on interest rates in effect from time to time and risks associated with us or the oil and natural gas industry in general.
As a result of the sustained decrease in prices for oil, natural gas and NGLs, we have taken write-downs of the carrying value of our properties and may be required to take further write-downs if oil and natural gas prices remain depressed or decline further or if we have substantial downward adjustments to our estimated proved reserves, increases in our estimates of development costs or deterioration in our drilling results.
We review our proved oil and natural gas properties for impairment whenever events and circumstances indicate that a decline in the recoverability of their carrying value may have occurred. Based on specific market factors and circumstances at the time of prospective impairment reviews, and the continuing evaluation of development plans, production data, economics and other factors, from time to time, we may be required to write-down the carrying value of our oil and natural gas properties. A write-down constitutes a non-cash charge to earnings. Oil, natural gas and NGL prices have significantly declined since mid-2014 and have remained depressed through 2016. Due to a bid received while assets were held for sale, we recorded a $10.0 million impairment of oil and gas properties for the year ended December 31, 2016. Additionally, given the history of price volatility in the oil and natural gas markets, prices could remain depressed or decline further or other events may arise that would require us to record further impairments of the book values associated with oil and natural gas properties. Accordingly, we may incur significant impairment charges in the future which could have a material adverse effect on our results of operations and could reduce our earnings and stockholders’ equity for the periods in which such charges are taken.
We intend to pursue the further development of our properties in the Wattenberg Field through horizontal drilling. Horizontal drilling operations can be more operationally challenging and costly relative to our historic vertical drilling operations.
Horizontal drilling is generally more complex and more expensive on a per well basis than vertical drilling. As a result, there is greater risk associated with a horizontal well drilling program. Risks associated with our horizontal drilling program include, but are not limited to, the following, any of which could materially and adversely impact the success of our horizontal drilling program and thus, our cash flows and results of operations:
• | landing our well bore in the desired drilling zone; |
• | effectively controlling the level of pressure flowing from particular wells; |
• | staying in the desired drilling zone while drilling horizontally through the formation; |
• | running our casing the entire length of the wellbore; |
• | running tools and other equipment consistently through the horizontal wellbore; |
• | fracture stimulating the planned number of stages; |
• | preventing downhole communications with other wells; |
• | successfully cleaning out the well bore after completion of the final fracture stimulation stage; and |
• | designing and maintaining efficient forms of artificial lift throughout the life of the well. |
Ultimately, the success of these drilling and completion techniques can only be evaluated over time as more wells are drilled and production profiles are established over a sufficiently long time period. If our drilling results are less than anticipated or we are unable to execute our drilling program because of capital constraints, lease expirations, access to gathering systems, limited takeaway capacity or depressed natural gas and oil prices, the return on our investment in these areas may not be as attractive as anticipated. Further, as a result of any of these developments, we could incur material impairments of our oil and gas properties and the value of our undeveloped acreage could decline in the future.
Our ability to produce natural gas and oil economically and in commercial quantities could be impaired if we are unable to acquire adequate supplies of water for our drilling operations or are unable to dispose of or recycle the water we use at a reasonable cost and in accordance with applicable environmental rules.
The hydraulic fracture stimulation process on which we depend to produce commercial quantities of oil and natural gas requires the use and disposal of significant quantities of water. Our inability to secure sufficient amounts of water (including as a result of droughts), or to dispose of or recycle the water used in our operations, could adversely impact our operations. The imposition of new environmental initiatives and regulations could include restrictions on our ability to conduct
41
certain operations such as hydraulic fracturing or disposal of waste, including, but not limited to, produced water, drilling fluids and other wastes associated with the exploration, development or production of natural gas. Compliance with environmental regulations and permit requirements governing the withdrawal, storage and use of surface water or groundwater necessary for hydraulic fracturing of wells may increase our operating costs and cause delays, interruptions or termination of our operations, the extent of which cannot be predicted, and all of which could have an adverse effect on our operations and financial condition.
The unavailability or high cost of additional drilling rigs, equipment, supplies, personnel and oilfield services could adversely affect our ability to execute our exploration and development plans within our budget and on a timely basis.
Shortages or the high cost of drilling rigs, equipment, supplies, personnel or oilfield services could delay or adversely affect our development and exploration operations or cause us to incur significant expenditures that are not provided for in our capital budget, which could have a material adverse effect on our business, financial condition or results of operations and may lead to reduced liquidity and the inability to pay our liabilities as they come due.
Our exploration, development and exploitation projects require substantial capital expenditures. We may be unable to obtain needed capital or financing on satisfactory terms, which could lead to expiration of our leases or a decline in our oil and natural gas reserves or anticipated production volumes.
Our exploration, development and exploitation activities are capital intensive. We make and expect to continue to make substantial capital expenditures in our business for the development, exploitation, production and acquisition of oil and natural gas reserves. Until such time as we obtain confirmation of a plan of reorganization in our bankruptcy proceeding and enter into a new revolving credit facility or obtain a different, comparable source of liquidity, there can be no assurance that we will have sufficient capital to meet these needs Without sufficient capital, we may face a further curtailment of our operations relating to development of our drilling locations, which in turn could lead to a possible expiration of our undeveloped leases and a decline in our oil and natural gas reserves, and an adverse effect on our business, financial condition and results of operations.
Increased costs of capital could adversely affect our business.
Recent and continuing disruptions and volatility in the global financial markets may lead to an increase in interest rates or a contraction in credit availability, impacting our ability to finance our operations. Our business and operating results can be harmed by factors such as the terms and cost of capital, increases in interest rates or a reduction in credit rating. Changes in any one or more of these factors could cause our cost of doing business to increase, limit our access to capital, limit our ability to pursue acquisition opportunities, reduce our cash flows available for drilling, render us unable to replace reserves and production and place us at a competitive disadvantage.
Concentration of our operations in a few core areas may increase our risk of production loss.
Our assets and operations are concentrated in two core areas: the Wattenberg Field in Colorado and the Dorcheat Macedonia Field in southern Arkansas. These core areas currently provide approximately 99% of our current sales volumes and the vast majority of our development projects.
The Wattenberg and Dorcheat Macedonia Fields represent 81% and 19%, respectively, of our 2016 total sales volumes. Because our operations are not as diversified geographically as some of our competitors, the success of our operations and our profitability may be disproportionately exposed to the effect of any regional events, including: fluctuations in prices of crude oil, natural gas and NGLs produced from wells in the area, accidents or natural disasters, restrictive governmental regulations and curtailment of production or interruption in the availability of gathering, processing or transportation infrastructure and services, and any resulting delays or interruptions of production from existing or planned new wells. Similarly, the concentration of our assets within a small number of producing formations exposes us to risks, such as changes in field-wide rules, which could adversely affect development activities or production relating to those formations. In addition, in areas where exploration and production activities are increasing, as has been the case in recent years in the Wattenberg Field, we are subject to increasing competition for drilling rigs, oilfield equipment, services, supplies and qualified personnel, which may lead to periodic shortages or delays. These constraints and the resulting shortages or high costs could delay our operations and materially increase our operating and capital costs.
We do not maintain business interruption (loss of production) insurance for our oil and gas producing properties. Loss of production or limited access to reserves in either of our core operating areas could have a significant negative impact on our cash flows and profitability.
42
We have limited control over activities on properties in which we own an interest but we do not operate, which could reduce our production and revenues.
We do not operate all of the properties in which we have an interest. As a result, we may have a limited ability to exercise influence over normal operating procedures, expenditures or future development of underlying properties and their associated costs. For all of the properties that are operated by others, we are dependent on their decision-making with respect to day-to-day operations over which we have little control. The failure of an operator of wells in which we have an interest to adequately perform operations, or an operator’s breach of applicable agreements, could reduce production and revenues we receive from that well. The success and timing of our drilling and development activities on properties operated by others depend upon a number of factors outside of our control, including the timing and amount of capital expenditures, the available expertise and financial resources, the inclusion of other participants and the use of technology. Our lack of control over non-operated properties also makes it more difficult for us to forecast capital expenditures, revenues, production and related matters.
We are dependent on third party pipeline, trucking and rail systems to transport our production and, in the Wattenberg Field, gathering and processing systems to prepare our production. These systems have limited capacity and at times have experienced service disruptions. Curtailments, disruptions or lack of availability in these systems interfere with our ability to market the oil and natural gas we produce, and could materially and adversely affect our cash flow and results of operations.
Market conditions or the unavailability of satisfactory oil and natural gas transportation arrangements may hinder our access to oil and natural gas markets or delay our production getting to market. The marketability of our oil and natural gas and production, particularly from our wells located in the Wattenberg Field, depends in part on the availability, proximity and capacity of gathering, processing, pipeline, trucking and rail systems. The amount of oil and natural gas that can be produced and sold is subject to limitation in certain circumstances, such as pipeline interruptions due to scheduled and unscheduled maintenance, excessive pressure, physical damage to the gathering or transportation system, or lack of contracted capacity on such systems. A portion of our production may also be interrupted, or shut in, from time to time for numerous other reasons, including as a result of accidents, maintenance, weather, field labor issues or disruptions in service. Curtailments and disruptions in these systems may last from a few days to several months. Any significant curtailment in gathering, processing or pipeline system capacity, significant delay in the construction of necessary facilities or lack of availability of transport, would interfere with our ability to market the oil and natural gas we produce, and could materially and adversely affect our cash flow and results of operations, and the expected results of our drilling program.
Currently, there are no natural gas pipeline systems that service wells in the North Park Basin, which is prospective for the Niobrara formation. In addition, we are not aware of any plans to construct a facility necessary to process natural gas produced from this basin. If neither we nor a third party constructs the required pipeline system and processing facility, we may not be able to fully develop our resources in the North Park Basin.
The development of our proved undeveloped reserves may take longer and may require higher levels of capital expenditures than we currently anticipate. Therefore, our undeveloped reserves may not be ultimately developed or produced.
Approximately 44% of our total proved reserves were classified as proved undeveloped as of December 31, 2016. Development of these reserves may take longer and require higher levels of capital expenditures than we currently anticipate or that may be available to us. Delays in the development of our reserves or increases in costs to drill and develop such reserves will reduce the value of our estimated proved undeveloped reserves and future net revenues estimated for such reserves and may result in some projects becoming uneconomic. In addition, delays in the development of reserves could cause us to have to reclassify our proved reserves as unproved reserves.
Unless we replace our oil and natural gas reserves, our reserves and production will decline, which would adversely affect our business, financial condition and results of operations.
In general, production from oil and gas properties declines as reserves are depleted, with the rate of decline depending on reservoir characteristics. Our current proved reserves will decline as reserves are produced and, therefore, our level of production and cash flows will be affected adversely unless we conduct successful exploration and development activities or acquire properties containing proved reserves. Thus, our future oil and natural gas production and, therefore, our cash flow and income are highly dependent upon our level of success in finding or acquiring additional reserves. However, we cannot assure you that our future acquisition, development and exploration activities will result in any specific amount of additional proved reserves or that we will be able to drill productive wells at acceptable costs.
43
We may incur substantial losses and be subject to substantial liability claims as a result of our oil and natural gas operations. Additionally, we may not be insured for, or our insurance may be inadequate to protect us against, these risks, including those related to our hydraulic fracturing operations.
Our oil and natural gas exploration and production activities are subject to all of the operating risks associated with drilling for and producing oil and natural gas, including, but not limited to, the possibility of:
• | environmental hazards, such as spills, uncontrollable flows of oil, natural gas, brine, well fluids, natural gas, hazardous air pollutants or other pollution into the environment, including groundwater and shoreline contamination; |
• | releases of natural gas and hazardous air pollutants or other substances into the atmosphere (including releases at our gas processing facilities); |
• | hazards resulting from the presence of hydrogen sulfide (H2S) or other contaminants in natural gas we produce; |
• | abnormally pressured formations resulting in well blowouts, fires or explosions; |
• | mechanical difficulties, such as stuck oilfield drilling and service tools and casing collapse; |
• | cratering (catastrophic failure); |
• | downhole communication leading to migration of contaminants; |
• | personal injuries and death; and |
• | natural disasters. |
Any of these risks could adversely affect our ability to conduct operations or result in substantial losses to us as a result of:
• | injury or loss of life; |
• | damage to and destruction of property, natural resources and equipment; |
• | pollution and other environmental damage; |
• | regulatory investigations and penalties; |
• | suspension of our operations; and |
• | repair and remediation costs. |
The presence of H2S, a toxic, flammable and colorless gas, is a common risk in the oil and gas industry and may be present in small amounts for brief periods from time to time at our well locations. Additionally, at one of our Arkansas properties, we produce a small amount of gas from four wells where we have identified the presence of H2S at levels that would be hazardous in the event of an uncontrolled gas release or unprotected exposure. In addition, our operations in Arkansas and Colorado are susceptible to damage from natural disasters such as flooding, wildfires or tornados, which involve increased risks of personal injury, property damage and marketing interruptions. The occurrence of one of these operating hazards may result in injury, loss of life, suspension of operations, environmental damage and remediation and/or governmental investigations and penalties. The payment of any of these liabilities could reduce, or even eliminate, the funds available for exploration and development, or could result in a loss of our properties.
As is customary in the oil and gas industry, we maintain insurance against some, but not all, of these potential risks and losses. Although we believe the coverage and amounts of insurance that we carry are consistent with industry practice, we do not have insurance protection against all risks that we face, because we choose not to insure certain risks, insurance is not available at a level that balances the costs of insurance and our desired rates of return, or actual losses exceed coverage limits. Insurance costs will likely continue to increase which could result in our determination to decrease coverage and retain more risk to mitigate those cost increases. In addition, pollution and environmental risks generally are not fully insurable. If we incur substantial liability, and the damages are not covered by insurance or are in excess of policy limits, then our business, results of operations and financial condition may be materially adversely affected.
Because hydraulic fracturing activities are part of our operations, they are covered by our insurance against claims made for bodily injury, property damage and clean-up costs stemming from a sudden and accidental pollution event. However,
44
we may not have coverage if the operator is unaware of the pollution event and unable to report the “occurrence” to the insurance company within the required time frame. We also do not have coverage for gradual, long-term pollution events.
Under certain circumstances, we have agreed to indemnify third parties against losses resulting from our operations. Pursuant to our surface leases, we typically indemnify the surface owner for clean-up and remediation of the site. As owner and operator of oil and gas wells and associated gathering systems and pipelines, we typically indemnify the drilling contractor for pollution emanating from the well, while the contractor indemnifies us against pollution emanating from its equipment.
Drilling locations that we decide to drill may not yield oil or natural gas in commercially viable quantities.
We describe some of our drilling locations and our plans to explore those drilling locations in this Annual Report on Form 10-K. Our drilling locations are in various stages of evaluation, ranging from a location that is ready to drill to a location that will require substantial additional evaluation. There is no way to predict in advance of drilling and testing whether any particular location will yield oil or natural gas in sufficient quantities to recover drilling or completion costs or to be economically viable. Prior to drilling, the use of 2-D and 3-D seismic technologies, various other technologies and the study of producing fields in the same area will not enable us to know conclusively whether oil or natural gas will be present or, if present, whether oil or natural gas will be present in sufficient quantities to be economically viable. In addition, the use of 2-D and 3-D seismic data and other technologies requires greater pre-drilling expenditures than traditional drilling strategies, and we could incur greater drilling and testing expenses as a result of such expenditures which may result in a reduction in our returns or increase our losses. Even if sufficient amounts of oil or natural gas exist, we may damage the potentially productive hydrocarbon bearing formation or experience mechanical difficulties while drilling or completing the well, resulting in a reduction in production from the well or abandonment of the well. If we drill any dry holes in our current and future drilling locations, our profitability and the value of our properties will likely be reduced. We cannot assure you that the analogies we draw from available data from other wells, more fully explored locations or producing fields will be applicable to our drilling locations. Further, initial production rates reported by us or other operators may not be indicative of future or long-term production rates. In sum, the cost of drilling, completing and operating any well is often uncertain, and new wells may not be productive.
Our potential drilling locations are scheduled to be developed over several years, making them susceptible to uncertainties that could materially alter the occurrence or timing of their drilling. In addition, we may not be able to raise the substantial amount of capital that would be necessary to drill a substantial portion of our potential drilling locations.
Our management has identified and scheduled drilling locations as an estimation of our future multi-year drilling activities on our existing acreage. These potential drilling locations, including those without proved undeveloped reserves, represent a significant part of our growth strategy. Our ability to drill and develop these locations is subject to a number of uncertainties, including uncertainty in the level of reserves, the availability of capital to us and other participants, seasonal conditions, regulatory approvals, oil, natural gas and NGL prices, availability of permits, costs and drilling results. Because of these uncertainties, we do not know if the numerous potential drilling locations we have identified will ever be drilled or if we will be able to produce oil or natural gas from these or any other potential drilling locations. Pursuant to existing SEC rules and guidance, subject to limited exceptions, proved undeveloped reserves may only be booked if they relate to wells scheduled to be drilled within five years of the date of booking, and we may therefore be required to downgrade to probable or possible any proved undeveloped reserves that are not developed within this five-year time frame. These limitations may limit our potential to book additional proved undeveloped reserves as we pursue our drilling program.
Certain of our undeveloped leasehold acreage is subject to leases that will expire over the next several years unless production is established on units containing the acreage.
The terms of our oil and gas leases stipulate that the lease will terminate if not held by production, rentals, or production. As of the filing date of this report, the majority of our acreage in Arkansas was held by unitization, production, or drilling operations and therefore not subject to lease expiration. As of the filing date of this report, approximately 9,341 net acres of our properties in the Rocky Mountain region were not held by production. For these properties, if production in paying quantities is not established on units containing these leases during the next year, then approximately 4,809 net acres will expire in 2017, approximately 4,079 net acres will expire in 2018, and approximately 453 net acres will expire in 2019 and thereafter. While some expiring leases may contain predetermined extension payments, other expiring leases will require us to negotiate new leases at the time of lease expiration. It is possible that market conditions at the time of negotiation could require us to agree to new leases on less favorable terms to us than the terms of the expired leases. If our leases expire, we will lose our right to develop the related properties.
45
We may incur losses as a result of title deficiencies.
The existence of a title deficiency can diminish the value of an acquired leasehold interest and can adversely affect our results of operations and financial condition. Title insurance covering mineral leasehold interests is not generally available. As is industry standard, we may rely upon a land professional’s careful examination of public records prior to purchasing or leasing a mineral interest. Once a mineral or leasehold interest has been acquired, we typically defer the expense of obtaining further title verification by a practicing title attorney until approval to drill the related drilling block is required. We perform the necessary curative work to correct deficiencies in the marketability of the title and we have compliance and control measures to ensure any associated business risk is approved by the appropriate Company authority. In cases involving more serious title deficiencies, all or part of a mineral or leasehold interest may be determined to be invalid or unleased, and, as a result, the target area may be deemed to be undrillable until owners can be contacted and curative measures performed to perfect title. In other cases, title deficiencies may result in our failure to have paid royalty owners correctly. Certain title deficiencies may also result in litigation to effectively agree or render a decision upon title ownership. Additional title issues are present in some of our southern Arkansas operations where significant delays in the title examination process are possible due to, among other challenges, the large volume of instruments contained in abstracts, poor indexing at the county clerk and recorder’s office, unrecorded conveyances, misfiling of instruments, instruments with missing or inadequate legal descriptions and unclear conveyance terms.
We face various risks associated with the trend toward increased activism against oil and gas exploration and development activities.
Opposition toward oil and gas drilling and development activity has been growing globally and is particularly pronounced in the United States. Companies in the oil and gas industry are often the target of activist efforts from both individuals and non-governmental organizations regarding safety, environmental compliance and business practices. Anti-development activists are working to, among other things, reduce access to federal and state government lands and delay or cancel certain projects such as the development of oil or gas shale plays. For example, environmental activists continue to advocate for increased regulations or bans on shale drilling in the United States, even in jurisdictions that are among the most stringent in their regulation of the industry. In fact, New York State enacted a permanent moratorium on all hydraulic fracturing operations, which became final in June 2015. Future activist efforts could result in the following:
• | delay or denial of drilling permits; |
• | shortening of lease terms or reduction in lease size; |
• | restrictions on installation or operation of production, gathering or processing facilities; |
• | restrictions on the use of certain operating practices, such as hydraulic fracturing, or the disposal of related waste materials, such as hydraulic fracturing fluids and produced water; |
• | increased severance and/or other taxes; |
• | cyber-attacks; |
• | legal challenges or lawsuits; |
• | negative publicity about us or the oil and gas industry in general; |
• | increased costs of doing business; |
• | reduction in demand for our products; and |
• | other adverse effects on our ability to develop our properties and expand production. |
We may need to incur significant costs associated with responding to these initiatives. Complying with any resulting additional legal or regulatory requirements that are substantial could have a material adverse effect on our business, financial condition and results of operations.
We are subject to health, safety and environmental laws and regulations that may expose us to significant costs and liabilities.
We are subject to stringent and complex federal, state and local laws and regulations governing health and safety aspects of our operations, the discharge of materials into the environment and the protection of the environment. These laws and regulations may impose on our operations numerous requirements, including the obligation to obtain a permit before
46
conducting drilling or underground injection activities; restrictions on the types, quantities and concentration of materials that may be released into the environment; limitations or prohibitions of drilling activities that impact threatened or endangered species or that occur on certain lands lying within wilderness, wetlands and other protected areas; the application of specific health and safety criteria to protect workers; and the responsibility for cleaning up any pollution resulting from operations. Numerous governmental authorities, such as the EPA and analogous state agencies, have the power to enforce compliance with these laws and regulations and the permits issued under them, oftentimes requiring difficult and costly actions. Failure to comply with these laws and regulations may result in the assessment of administrative, civil and criminal penalties; the imposition of investigatory or remedial obligations; the issuance of injunctions limiting or preventing some or all of our operations; delays in granting permits, or even the cancellation of leases.
There is an inherent risk of incurring significant environmental costs and liabilities in the performance of our operations, some of which may be material, due to our handling of petroleum hydrocarbons and wastes, our emissions into air and water, the underground injection or other disposal of our wastes, the use and disposition of hydraulic fracturing fluids, and historical industry operations and waste disposal practices. Under certain environmental laws and regulations, we may be liable for the full cost of removing or remediating contamination, regardless of whether we were at fault, and even when multiple parties contributed to the release and the contaminants were released in compliance with all applicable laws. In addition, accidental spills or releases on our properties may expose us to significant liabilities that could have a material adverse effect on our financial condition or results of operations. Aside from government agencies, the owners of properties where our wells are located, the owners or operators of facilities where our petroleum hydrocarbons or wastes are taken for reclamation or disposal, and other private parties may be able to sue us to enforce compliance with environmental laws and regulations, collect penalties for violations, or obtain damages for any related personal injury, property, or natural resource damage. Some sites we operate are located near current or former third-party oil and natural gas operations or facilities, and there is a risk that historic contamination has migrated from those sites to ours. Changes in environmental laws and regulations occur frequently, and any changes that result in more stringent or costly requirements could require us to make significant expenditures to attain and maintain compliance or may otherwise have a material adverse effect on our own results of operations, competitive position or financial condition. We may not be able to recover some or any of these costs from insurance.
New environmental legislation or regulatory initiatives, including those related to hydraulic fracturing, could result in increased costs and additional operating restrictions or delays.
We are subject to extensive federal, state, and local laws and regulations concerning health, safety, and environmental protection. Governmental authorities frequently add to those requirements, and both oil and gas development generally, and hydraulic fracturing specifically, are receiving increasing regulatory attention. Our operations utilize hydraulic fracturing, an important and commonly used process in the completion of oil and natural gas wells in low-permeability formations. Hydraulic fracturing involves the injection of water, proppant, and chemicals under pressure into rock formations to stimulate hydrocarbon production.
In August 2012, the EPA issued final NSPS (known as “Quad O”) that establish new air emission controls for natural gas processing operations, as well as for oil and natural gas production. Among other things, Quad O imposes reduced emission completion (or “green completion”) requirements and also imposes stringent control and other standards on certain storage tanks, compressors and associated equipment. After several parties challenged the Quad O regulations in court, the EPA administratively reconsidered certain requirements. As a result of such administrative reconsideration, the EPA issued final amendments to the Quad O regulations in September 2013 and December 2014. In May 2016, the EPA finalized amendments to Quad O, now called Quad Oa, focused on achieving additional reductions in methane and volatile organic compound emissions at oil and natural gas operations. These rules, among other things, require leak detection and repair, additional control requirements for pneumatic controllers and pumps, and additional control requirements for oil well completions, gathering, boosting, and compressor stations. At this point, we cannot predict the cost to comply with such air regulatory requirements.
On December 17, 2014, the EPA proposed to revise and lower the existing 75 ppb NAAQS for ozone under the federal Clean Air Act to a range within 65-70 ppb. On October 1, 2015, EPA finalized a rule lowering the standard to 70 ppb. This lowered ozone NAAQS could result in an expansion of ozone nonattainment areas across the United States, including areas in which we operate. In a related development, in 2015 the State of Colorado received a bump-up to its existing ozone non-attainment status from “marginal” to “moderate.” This increased status will result in additional requirements under the CAA for the State of Colorado and will include a state rulemaking to implement such requirements. This rulemaking process started in early 2017. Oil and natural gas operations in ozone nonattainment areas may be subject to increased regulatory burdens in the form of more stringent emission controls, emission offset requirements, and increased permitting delays and costs.
In February 2014, the Colorado Department of Public Health and Environment’s Air Quality Control Commission finalized regulations imposing strict new requirements relating to air emissions from oil and gas facilities in Colorado that are
47
even more stringent than comparable federal rules. These new Colorado rules include storage tank control, monitoring, recordkeeping and reporting requirements as well as leak detection and repair requirements for both well production facilities and compressor stations and associated equipment. These new requirements, which represent the first time a state has directly regulated methane (a greenhouse gas) emissions from the upstream oil and gas sector, have and will continue to impose additional costs on our operations.
Some activists have attempted to link hydraulic fracturing to various environmental problems, including potential adverse effects to drinking water supplies as well as migration of methane and other hydrocarbons and increased earthquakes. The federal government is studying the environmental risks associated with hydraulic fracturing and evaluating whether to adopt additional regulatory requirements. For example, the EPA has commenced a multi-year study of the potential impacts of hydraulic fracturing on drinking water resources. A draft assessment was published for public comment in 2015. The assessment concludes that while there are mechanisms by which hydraulic fracturing can impact drinking water resources, there was no evidence that these mechanisms have led to widespread, systemic impacts on drinking water resources in the United States. EPA’s science advisory board, however, has subsequently questioned several elements and conclusions in EPA’s draft assessment. In addition, in 2011, the EPA announced its intention to propose regulations under the federal Clean Water Act to regulate wastewater discharges from hydraulic fracturing and other natural gas production. EPA published these proposed rules in early 2015. The EPA also has issued guidance for issuing underground injection permits for hydraulic fracturing operations that use diesel fuel under the agency’s SDWA authority.
In the United States Congress, bills have been introduced that would amend the SDWA to eliminate an existing exemption for certain hydraulic fracturing activities from the definition of “underground injection,” thereby requiring the oil and natural gas industry to obtain SDWA permits for fracturing not involving diesel fuels, and to require disclosure of the chemicals used in the process. If adopted, such legislation could establish an additional level of regulation and permitting at the federal level, but some form of chemical disclosure is already required by most oil and gas producing states. At this time, it is not clear what action, if any, the United States Congress will take on this exemption.
Moreover, the U.S. Department of the Interior finalized new rules for hydraulic fracturing activities on federal lands that, in general, would cover disclosure of fracturing fluid components, well bore integrity, and handling of flowback water. The rule, while final, has been stayed pending the outcome of ongoing litigation. The BLM also proposed rules to address venting and flaring on BLM land, which the U.S. House of Representatives has passed a bill to repeal, and the U.S. Occupational Safety and Health Administration has proposed stricter standards for worker exposure to silica, which would apply to use of sand as a proppant for hydraulic fracturing.
Apart from these ongoing federal initiatives, state governments where we operate have moved to impose stricter requirements on hydraulic fracturing and other aspects of oil and gas production. Colorado, for example, comprehensively updated its oil and gas regulations in 2008 and adopted significant additional amendments in 2011, 2014 and 2015. Among other things, the updated and amended regulations require operators to reduce methane emissions associated with hydraulic fracturing, compile and report additional information regarding well bore integrity, publicly disclose the chemical ingredients used in hydraulic fracturing, increase the minimum distance between occupied structures and oil and gas wells, undertake additional mitigation for nearby residents, implement additional groundwater testing and incur increased monetary penalties for violations of the State’s oil and gas conservation commission rules and regulations. Similarly, in February 2015, a task force created by the State of Colorado aimed at making recommendations for minimizing land use and other conflicts concerning the location of new oil and gas facilities agreed upon nine consensus proposals which were sent to Governor Hickenlooper for his review. Three of the proposals require further legislative action, while the other six proposals require rulemaking or other regulatory action. The proposals support (i) a senate bill that would postpone expiration of recently adopted regulations regarding air emissions; (ii) tasking the COGCC with crafting new rules related to siting of “large-scale” pads and facilities; (iii) requiring the industry to provide advance information about development plans to local governments; (iv) improving the COGCC’s local government liaison and designee programs; (v) adding 11 full-time staffers to the COGCC to improve inspections and field operations; (vi) bolstering the inspection staff and equipment for monitoring oil and gas facility air emissions and setting up a hotline for citizen health complaints at the Colorado Department of Public Health and Environment; (vii) creating a statewide oil and gas information clearinghouse; (viii) studying ways to ameliorate the impact of oil and gas truck traffic and (ix) creating a compliance-assistance program at the COGCC to help operators comply with the state's changing rules and ensure consistent enforcement of rules by state inspectors. A number of additional proposals did not receive sufficient task force support to be included with the nine consensus proposals, but may nevertheless be forwarded to the Governor as well. In early 2016, COGCC finalized a rulemaking to implement two of the nine recommendations noted above (numbers (ii) and (iii) specifically). With regard to recommendation (ii), the COGCC finalized rules applicable to the permitting of large-scale facilities in urban mitigation areas. For recommendation (iii), the COGCC finalized rules requiring operators to provide certain municipalities with notice prior to engaging in certain operations.
48
In some instances certain local governments are adopting new requirements on hydraulic fracturing and other oil and gas operations. Some counties in Colorado, for instance, have amended their land use regulations to impose new requirements on oil and gas development, while other local governments have entered memoranda of agreement with oil and gas producers to accomplish the same objective. In addition, voters in Colorado have proposed or advanced ballot initiatives restricting or banning oil and gas development in Colorado. Because a substantial portion of our operations and reserves are located in Colorado, the risks we face with respect to such ballot initiatives are greater than other companies with more geographically diverse operations. The adoption of future federal, state or local laws or implementing regulations imposing new environmental obligations on, or otherwise limiting, our operations could make it more difficult and more expensive to complete oil and natural gas wells, increase our costs of compliance and doing business, delay or prevent the development of certain resources (including especially shale formations that are not commercial without the use of hydraulic fracturing), or alter the demand for and consumption of our products and services. We cannot assure you that any such outcome would not be material, and any such outcome could have a material adverse impact on our cash flows and results of operations.
Climate change laws and regulations restricting emissions of “greenhouse gases” could result in increased operating costs and reduced demand for the oil and natural gas that we produce, while the physical effects of climate change could disrupt our production and cause us to incur significant costs in preparing for or responding to those effects.
There is a growing belief that human-caused (anthropogenic) emissions of GHGs may be linked to climate change. Climate change and the costs that may be associated with its impacts and the regulation of GHGs have the potential to affect our business in many ways, including negatively impacting the costs we incur in providing our products and services and the demand for and consumption of our products and services (due to potential changes in both costs and weather patterns).
In December 2009, the EPA determined that atmospheric concentrations of carbon dioxide, methane and certain other GHGs present an endangerment to public health and welfare, because such gases are, according to the EPA, contributing to the warming of the earth’s atmosphere and other climatic changes. Consistent with its findings, the EPA has proposed or adopted various regulations under the Clean Air Act to address GHGs. Among other things, the EPA began limiting emissions of GHGs from new cars and light duty trucks beginning with the 2012 model year. In addition, in 2010 the EPA published a final rule to address the permitting of GHG emissions from stationary sources under the Prevention of Significant Deterioration, or “PSD,” and Title V permitting programs. Under this rule, the EPA imposed certain GHG permitting requirements on the largest major sources first. As noted above, in June 2014, the United States Supreme Court invalidated part of the EPA’s stationary source GHG program in Utility Air Regulatory Group v. EPA, No. 12-1146. Specifically, the Supreme Court ruled that major sources subject to the PSD or Title V programs because of non-GHG emissions could potentially be still subject to certain “best available control technology” requirements applicable to their GHG emissions. Under the Supreme Court’s opinion, sources subject to the PSD or Title V programs due solely to their GHG emissions can no longer be subject to the EPA’s GHG permitting requirements. The D.C. Circuit issued an amended judgment following remand, and the EPA intends to conduct future rulemaking to revise its GHG major stationary source permitting program to conform to the court rulings. In a related development, in May 2016, the EPA finalized a rule to further define “adjacency” under the CAA for purposes of determining and permitting major stationary sources, including GHG major sources.
The EPA also adopted regulations requiring the reporting of GHG emissions from specific categories of higher GHG emitting sources in the United States, including certain oil and natural gas production facilities, which include certain of our operations, beginning in 2012 for emissions occurring in 2011. Information in such report may form the basis for further GHG regulation. Further, the EPA has continued with its comprehensive strategy for further reducing methane emissions from oil and gas operations, with a final rule being issued In May 2016 as part of the 2012 Quad O reconsideration known as “Quad Oa.” The EPA’s GHG rules could adversely affect our operations and restrict or delay our ability to obtain air permits for new or modified facilities.
Moreover, Congress has from time to time considered adopting legislation to reduce emissions of GHGs or promote the use of renewable fuels. As an alternative, some proponents of GHG controls have advocated mandating a national “clean energy” standard. The EPA recently finalized rules for both new and existing power plants known as the “Clean Power Plan” designed to decrease GHG emissions from these sources. We are unable to predict how, or if, the Clean Power Plan will affect our operations. In addition, the United States reached agreement during the December 2015 United Nations climate change conference to reduce its GHG emissions by 26-28% by 2025 compared with 2005 levels, and also to provide periodic updates on its progress.
In the meantime, many states already have taken such measures, which have included renewable energy standards, development of GHG emission inventories or cap and trade programs. Cap and trade programs typically work by requiring major sources of emissions or major producers of fuels to acquire and surrender emission allowances, with the number of available allowances reduced each year until the overall GHG emission reduction goal is achieved. These allowances would be expected to escalate significantly in cost over time.
49
The adoption of legislation or regulatory programs to reduce emissions of GHGs could require us to incur increased operating costs, such as costs to purchase and operate emissions control systems, to acquire emissions allowances or comply with new regulatory or reporting requirements. If we are unable to recover or pass through a significant level of our costs related to complying with climate change regulatory requirements imposed on us, it could have a material adverse effect on our results of operations and financial condition. Any such legislation or regulatory programs could also increase the cost of consuming, and thereby reduce demand for, the oil and natural gas we produce. Consequently, legislation and regulatory programs to reduce emissions of GHGs could have an adverse effect on our business, financial condition and results of operations.
Competition in the oil and natural gas industry is intense, making it more difficult for us to acquire properties, market oil and natural gas and secure trained personnel.
Our ability to acquire additional drilling locations and to find and develop reserves in the future will depend heavily on our financial resources and ability to evaluate and select suitable properties and to consummate transactions in a highly competitive environment for acquiring properties, marketing oil and natural gas and securing equipment and trained personnel. Also, there is substantial competition for capital available for investment in the oil and natural gas industry. Many of our competitors possess and employ financial, technical and personnel resources substantially greater than ours. Those companies may be able to pay more for productive oil and natural gas properties and exploratory drilling locations or to identify, evaluate, bid for and purchase a greater number of properties and locations than our financial or personnel resources permit. Furthermore, these companies may also be better able to withstand unsuccessful drilling attempts, sustained periods of volatility in financial markets and generally adverse global and industry-wide economic conditions, and may be better able to absorb the burdens resulting from changes in relevant laws and regulations, which would adversely affect our competitive position. In addition, companies may be able to offer better compensation packages to attract and retain qualified personnel than we are able to offer. We may not be able to compete successfully in the future in acquiring prospective reserves, developing reserves, marketing hydrocarbons, attracting and retaining quality personnel and raising additional capital, which could have a material adverse effect on our business.
If we fail to retain our existing senior management or technical personnel or attract qualified new personnel, such failure could adversely affect our operations. The volatility in commodity prices and business performance may affect our ability to retain senior management and the loss of these key employees may affect our business, financial condition and results of operations.
To a large extent, we depend on the services of our senior management and technical personnel. The loss of the services of our senior management, technical personnel, or any of the vice presidents of the Company, could have a material adverse effect on our operations or strategy. The volatility in commodity prices and our business performance may affect our ability to incentivize and retain senior management or key employees. Our current bankruptcy proceeding also has significant potential to adversely affect our ability to retain senior management and key employees. Competition for experienced senior management, technical and other professional personnel remains strong. If we cannot retain our current personnel or attract additional experienced personnel, our ability to compete could be adversely affected. Also, the loss of experienced personnel could lead to a loss of technical expertise. We do not maintain, nor do we plan to obtain, any insurance against the loss of any of these individuals.
Our derivative activities could result in financial losses or could reduce our income.
To achieve more predictable cash flows and to reduce our exposure to adverse fluctuations in the prices of oil and natural gas, we may in the future enter into derivative arrangements for a portion of our oil and natural gas production, including collars and fixed-price swaps. We have not in the past designated any of our derivative instruments as hedges for accounting purposes and have recorded all derivative instruments on our balance sheet at fair value. Changes in the fair value of our derivative instruments are recognized in earnings. Accordingly, our earnings may fluctuate significantly as a result of changes in the fair value of our derivative instruments.
Derivative arrangements also expose us to the risk of financial loss in some circumstances, including when:
• | production is less than the volume covered by the derivative instruments; |
• | the counterparty to the derivative instrument defaults on its contract obligations; or |
• | there is an increase in the differential between the underlying price in the derivative instrument and actual prices received. |
50
In addition, these types of derivative arrangements may limit the benefit we would receive from increases in the prices for oil and natural gas and may expose us to cash margin requirements.
We are exposed to credit risks of our hedging counterparties, third parties participating in our wells and our customers.
Our principal exposures to credit risk are through receivables resulting from commodity derivatives instruments, which were zero at December 31, 2016 (but would increase if we resume a hedging program), joint interest and other receivables of $6.8 million at December 31, 2016 and the sale of our oil, natural gas and NGLs production of $14.5 million in receivables at December 31, 2016, which we market to energy marketing companies, refineries and affiliates.
Joint interest receivables arise from billing entities who own partial interest in the wells we operate. These entities participate in our wells primarily based on their ownership in leases on which we wish to drill. We can do very little to choose who participates in our wells.
We are also subject to credit risk due to concentration of our oil, natural gas and NGLs receivables with significant customers. This concentration of customers may impact our overall credit risk since these entities may be similarly affected by changes in economic and other conditions. For the year ended December 31, 2016, sales to Silo Energy, LLC, Lion Oil Trading & Transport, Inc., and Duke Energy Field Services accounted for approximately 50%, 18% and 14%, respectively, of our total sales. Beginning in 2017 and continuing for seven years, we have contracted to sell all of our crude oil produced for a one-rig program in the Wattenberg Field to NGL Crude Logistics, LLC.
We are exposed to credit risk in the event of default of our counterparty, principally with respect to hedging agreements but also insurance contracts and bank lending commitments. We do not require most of our customers to post collateral. The inability or failure of our significant customers to meet their obligations to us or their insolvency or liquidation may adversely affect our financial results. Deterioration in the credit markets may impact the credit ratings of our current and potential counterparties and affect their ability to fulfill their existing obligations to us and their willingness to enter into future transactions with us.
Current or proposed financial legislation and rulemaking could have an adverse effect on our ability to use derivative instruments to reduce the effect of commodity price, interest rate and other risks associated with our business.
The Dodd-Frank Act establishes, among other provisions, federal oversight and regulation of the over-the-counter derivatives market and entities that participate in that market. The Dodd-Frank Act also establishes margin requirements and certain transaction clearing and trade execution requirements. The Dodd-Frank Act may require us to comply with margin requirements in our derivative activities, although the application of those provisions to us is uncertain at this time. The financial reform legislation may also require the counterparties to our derivative instruments to spin off some of their derivatives activities to separate entities, which may not be as creditworthy as the current counterparties.
The Dodd-Frank Act and any new regulations could significantly increase the cost of derivative contracts (including through requirements to post collateral, which could adversely affect our available liquidity), materially alter the terms of derivative contracts, reduce the availability of derivatives to protect against risks we encounter, reduce our ability to monetize or restructure our existing derivative contracts and increase our exposure to less creditworthy counterparties. If we reduce our use of derivative as a result of the Dodd-Frank Act and regulations, our results of operations may be more volatile and our cash flows may be less predictable, which could adversely affect our ability to plan for and fund capital expenditures.
We may be involved in legal cases that may result in substantial liabilities.
Like many oil and gas companies, we are from time to time involved in various legal and other cases, such as title, royalty or contractual disputes, regulatory compliance matters and personal injury or property damage matters, in the ordinary course of our business. Such legal cases are inherently uncertain and their results cannot be predicted. Regardless of the outcome, such cases could have an adverse impact on us because of legal costs, diversion of management and other personnel and other factors. In addition, it is possible that a resolution of one or more such cases could result in liability, penalties or sanctions, as well as judgments, consent decrees or orders requiring a change in our business practices, which could materially and adversely affect our business, operating results and financial condition. Accruals for such liability, penalties or sanctions may be insufficient. Judgments and estimates to determine accruals or range of losses related to legal and other cases could change from one period to the next, and such changes could be material.
51
We are subject to federal, state, and local taxes, and may become subject to new taxes and certain federal income tax deductions currently available with respect to oil and gas exploration and development may be eliminated as a result of future legislation.
The federal, state and local governments in the areas in which we operate impose taxes on the oil and natural gas products we sell, and, for many of our wells, sales and use taxes on significant portions of our drilling and operating costs. Many states have raised state taxes on energy sources or state taxes associated with the extraction of hydrocarbons and additional increases may occur. In addition, there has been a significant amount of discussion by legislators and presidential administrations concerning a variety of energy tax proposals.
There have been proposals for legislative changes that, if enacted into law, would eliminate certain key U.S. federal income tax incentives currently available to oil and natural gas exploration and production companies. Such changes include, but are not limited to, (i) the repeal of the percentage depletion allowance for oil and gas properties; (ii) the elimination of current deductions for intangible drilling and development costs; (iii) the elimination of the deduction for certain U.S. production activities; and (iv) an extension of the amortization period for certain geological and geophysical expenditures. It is unclear whether these or similar changes will be enacted and, if enacted, how soon any such changes could become effective. Any such changes in U.S. federal income tax law could eliminate or defer certain tax deductions within the industry that are currently available with respect to oil and gas exploration and development, and any such change could negatively affect our financial condition, results of operations and cash flow.
Changes to federal tax deductions, as well as any changes to or the imposition of new state or local taxes (including production, severance or similar taxes) could negatively affect our financial condition and results of operations.
We are subject to cyber security risks. A cyber incident could occur and result in information theft, data corruption, operational disruption or financial loss.
The oil and gas industry has become increasingly dependent on digital technologies to conduct certain exploration, development, production, processing and distribution activities. For example, we depend on digital technologies to interpret seismic data, manage drilling rigs, production equipment and gathering and transportation systems, conduct reservoir modeling and reserves estimation and process and record financial and operating data. Pipelines, refineries, power stations and distribution points for both fuels and electricity are becoming more interconnected by computer systems. At the same time, cyber incidents, including deliberate attacks or unintentional events, have increased. Our technologies, systems, networks and those of our vendors, suppliers and other business partners may become the target of cyber-attacks or information security breaches that could result in the unauthorized release, gathering, monitoring, misuse, loss or destruction of proprietary and other information, or other disruption of our business operations. In addition, weaknesses in the cyber security of our vendors, suppliers, and other business partners could facilitate an attack on our technologies, systems and networks. In addition, certain cyber incidents, such as surveillance, may remain undetected for an extended period. Given the politically sensitive nature of hydraulic fracturing and the controversy generated by its opponents, our technologies, systems and networks may be of particular interest to certain groups with political agendas, which may seek to launch cyber-attacks as a method of promoting their message. Our systems and insurance coverage for protecting against cyber security risks may not be sufficient.
We depend on digital technology, including information systems and related infrastructure, as well as cloud applications and services, to process and record financial and operating data, communicate with our employees and business parties, analyze seismic and drilling information, estimate quantities of oil and gas reserves as well as other activities related to our business. Our business partners, including vendors, service providers, purchasers of our production and financial institutions, are also dependent on digital technology. The technologies needed to conduct our oil and gas exploration and development activities make certain information the target of theft or misappropriation.
Although to date we have not experienced any material losses relating to cyber-attacks, we may suffer such losses in the future.
Risks Relating to our Common Stock
We do not intend to pay, and we are currently prohibited from paying, dividends on our common stock and, consequently, our stockholders’ only opportunity to achieve a return on their investment is if the price of our stock appreciates.
We do not plan to declare dividends on shares of our common stock in the foreseeable future. Additionally, we are currently prohibited from making any cash dividends pursuant to the terms of our revolving credit facility and our Senior Notes. Consequently, our stockholders’ only opportunity to achieve a return on their investment in us will be if the market price of our common stock appreciates, which may not occur, and the stockholders sell their shares at a profit. There is no guarantee that the price of our common stock will ever exceed the price that the stockholders paid.
52
We have experienced recent volatility in the market price and trading volume of our common stock and may continue to do so in the future.
The trading price of shares of our common stock has fluctuated widely and in the future may be subject to similar fluctuations. As an example, during the year ended December 31, 2016, the sales price of our common stock ranged from a low of $0.60 per share to a high of $5.50 per share. The trading price of our common stock may be affected by a number of factors, including our bankruptcy proceeding, the volatility of oil, natural gas, and NGL prices, our operating results, changes in our earnings estimates, additions or departures of key personnel, our financial condition and liquidity, drilling activities, legislative and regulatory changes, general conditions in the oil and natural gas exploration and development industry, general economic conditions, and general conditions in the securities markets. In particular, a significant or extended decline in oil, natural gas and NGL prices could have a material adverse effect our sales price of our common stock. Other risks described in this annual report could also materially and adversely affect our share price.
Although our common stock is listed on the New York Stock Exchange, we cannot assure you that an active public market will continue for our common stock or that will be able to continue to meet the listing requirements of the NYSE. If an active public market for our common stock does not continue, the trading price and liquidity of our common stock will be materially and adversely affected. If there is a thin trading market or "float" for our stock, the market price for our common stock may fluctuate significantly more than the stock market as a whole. Without a large float, our common stock would be less liquid than the stock of companies with broader public ownership and, as a result, the trading prices of our common stock may be more volatile. In addition, in the absence of an active public trading market, investors may be unable to liquidate their investment in us.
Our certificate of incorporation and bylaws, as well as Delaware law, contain provisions that could discourage acquisition bids or merger proposals, even if such acquisition or merger may be in our stockholders’ best interests.
Our certificate of incorporation authorizes our board of directors to issue preferred stock without stockholder approval. If our board of directors elects to issue preferred stock, it could be more difficult for a third party to acquire us. In addition, some provisions of our certificate of incorporation and bylaws could make it more difficult for a third party to acquire control of us, even if the change of control would be beneficial to our stockholders, including:
• | a classified board of directors, so that only approximately one-third of our directors are elected each year; |
• | advance notice provisions for stockholder proposals and nominations for elections to the board of directors to be acted upon at meetings of stockholders; and |
• | limitations on the ability of our stockholders to call special meetings or act by written consent. |
Delaware law prohibits us from engaging in any business combination with any “interested stockholder,” meaning generally that a stockholder who beneficially owns more than 15% of our stock cannot acquire us for a period of three years from the date this person became an interested stockholder, unless various conditions are met, such as approval of the transaction by our board of directors.
Item 1B. Unresolved Staff Comments.
None.
Item 2. Properties.
The information required by Item 2. is contained in Item 1. Business and is incorporated herein by reference.
Item 3. Legal Proceedings.
From time to time, we are subject to legal proceedings and claims that arise in the ordinary course of business. Like other gas and oil producers and marketers, our operations are subject to extensive and rapidly changing federal and state environmental, health and safety and other laws and regulations governing air emissions, wastewater discharges, and solid and hazardous waste management activities. As of the date of this filing, there are no material pending or overtly threatened legal actions against us that of which we are aware.
During 2015, the Company voluntarily instigated an internal audit of its storage tank facilities located in the Wattenberg Field (the “Audit”). The purpose of the Audit was to determine compliance with applicable air quality regulations. Based on the results of the Audit, the Company self-reported in December 2015 and January 2016 several potential noncompliance issues to the Colorado Department of Public Health and Environment (“CDPHE”) under Colorado’s Environmental Audit Privilege and Immunity Law (the “Environmental Audit Law”). Independently, in October 2015, CDPHE issued to the Company a compliance advisory (the “Compliance Advisory”) for certain facilities that was closely related to the matters voluntarily disclosed as a result of the Audit.
53
The Company has vigorously defended against the CDPHE allegations of violation while also cooperating with CDPHE in its investigation and firmly asserting the Company’s right to civil penalty immunity for voluntarily disclosed violations under the Environmental Audit Law. In February 2017, following further interaction between the CDPHE and the Company, the CDPHE proposed settlement terms under which the Company would be required to pay an administrative penalty in excess of $100,000 and perform certain mitigation projects and adopt certain procedures and processes addressing the monitoring, reporting, and reduction of emissions with respect to the Company’s storage tank facilities in the Wattenberg Field. The Company believes that the terms of settlement offered to the Company are part of a broader enforcement initiative the CDPHE is taking with multiple operators in the Wattenberg Field.
Although the Company intends to continue working with the CDPHE in an attempt to reach a consensual resolution of the relevant compliance matters, the Company firmly believes that the proposed terms of settlement are neither mandated by the applicable air quality regulations nor consistent with the Company’s historical practices or its rights under the Environmental Audit Law. It is not possible to determine at this time whether the Company will ultimately be subject to any civil penalty assessment in connection with the resolution of compliance issues identified in the Audit and the Compliance Advisory.
For discussion of our ongoing bankruptcy proceedings, see Part I, Item 1. Business subsection Bankruptcy Proceedings under Chapter 11.
Item 4. Mine Safety Disclosures.
Not applicable.
PART II
Item 5. Market for Registrant’s Common Equity, Related Stockholder Matters and Issuer Purchases of Equity Securities.
Market for Registrant’s Common Equity. Our common stock is listed on the NYSE under the symbol “BCEI”. On March 10, 2017, the sale price of our common stock, as reported on the NYSE, was $1.20 per share.
The following table sets forth the high and low intra-day sales prices per share of our common stock as reported on the NYSE.
High | Low | |||||||
2015 | ||||||||
1st Quarter | $ | 30.81 | $ | 20.23 | ||||
2nd Quarter | 30.69 | 17.35 | ||||||
3rd Quarter | 18.18 | 3.93 | ||||||
4th Quarter | 9.54 | 3.72 | ||||||
2016 | ||||||||
1st Quarter | $ | 5.50 | $ | 0.88 | ||||
2nd Quarter | 4.67 | 1.25 | ||||||
3rd Quarter | 2.35 | 0.60 | ||||||
4th Quarter | 2.35 | 0.67 | ||||||
Holders. As of March 10, 2017, there were approximately 268 registered holders of our common stock.
Dividends. We have not paid any cash dividends since our inception. Covenants contained in our revolving credit facility and the indentures governing our Senior Notes restrict the payment of cash dividends on our common stock. We currently intend to retain all future earnings for the development and growth of our business, and we do not anticipate declaring or paying any cash dividends to holders of our common stock in the foreseeable future.
54
Issuer Purchases of Equity Securities. The following table contains information about our acquisition of equity securities during the quarter and year ended December 31, 2016.
Maximum | ||||||||||||
Total Number of | Number of | |||||||||||
Total | Shares | Shares that May | ||||||||||
Number of | Average Price | Purchased as Part of | Be Purchased | |||||||||
Shares | Paid per | Publicly Announced | Under Plans or | |||||||||
Purchased(1) | Share | Plans or Programs | Programs | |||||||||
January 1, 2016 - March 31, 2016 | 109,433 | $ | 2.02 | — | — | |||||||
April 1, 2016 - June 30, 2016 | 5,762 | $ | 2.65 | — | — | |||||||
July 1, 2016 - September 30, 2016 | 7,916 | $ | 1.13 | — | — | |||||||
October 1, 2016 - October 31, 2016 | 421 | $ | 1.06 | — | — | |||||||
November 1, 2016 - November 30, 2016 | 3,226 | $ | 0.99 | — | — | |||||||
December 1, 2016 - December 31, 2016 | 1,146 | $ | 1.59 | — | — | |||||||
Total | 127,904 | $ | 1.96 | — | — | |||||||
_________________________
(1) | Represent shares that employees surrendered back to us that equaled in value the amount of taxes needed for payroll tax withholding obligations upon the vesting of restricted stock awards. These repurchases were not part of a publicly announced plan or program to repurchase shares of our common stock, nor do we have a publicly announced plan or program to repurchase shares of our common stock. |
Sale of Unregistered Securities. We had no sales of unregistered securities during the quarter ended December 31, 2016.
Stock Performance Graph. The following performance graph shall not be deemed “filed” for purposes of Section 18 of the Securities Exchange Act of 1934, as amended (the “Exchange Act”), or otherwise subject to liabilities under that section and shall not be deemed to be incorporated by reference into any filing under the Securities Act of 1933, as amended, or the Exchange Act, except as shall be expressly set forth by specific reference in such filing.
The following graph compares the cumulative total stockholder return for the Company’s common stock, the Standard and Poor’s 500 Stock Index (the “S&P 500 Index”) and the Standard and Poor’s 500 Oil & Gas Exploration & Production Index (“S&P O&G E&P Index”). The measurement points in the graph below are December 14, 2011 (the first trading day of our common stock on the NYSE) and each fiscal quarter thereafter through December 31, 2016. The graph assumes that $100 was invested on December 14, 2011 in each of the common stock of the Company, the S&P 500 Index and the S&P O&G E&P Index and assumes reinvestment of any dividends. The stock price performance on the following graph is not necessarily indicative of future stock price performance.
55
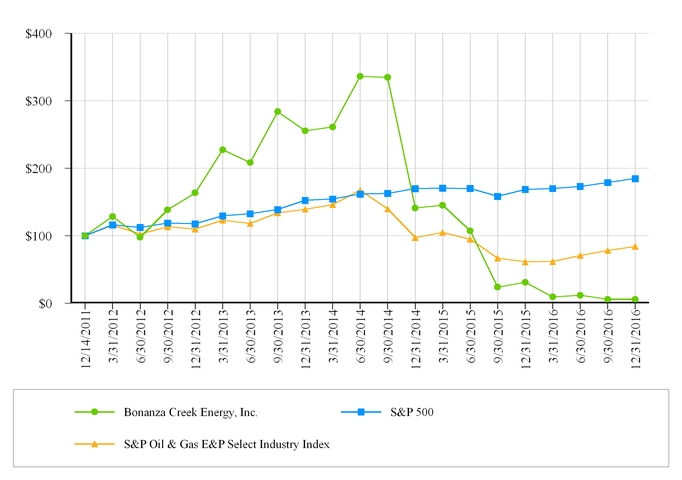
56
Item 6. Selected Financial Data.
The selected historical financial data should be read in conjunction with Management’s Discussion and Analysis of Financial Condition and Results of Operations below and financial statements and the notes to those financial statements in Part I, Item 8 of this Annual Report on Form 10-K.
The following tables set forth selected historical financial data of the Company as of and for the period indicated.
______________________
For the Years Ended December 31, | ||||||||||||||||||||
2012 | 2013 | 2014 | 2015 | 2016 | ||||||||||||||||
(in thousands, except per share amounts) | ||||||||||||||||||||
Statement of Operations Data: | ||||||||||||||||||||
Total operating net revenues (1) | $ | 231,205 | $ | 421,860 | $ | 558,633 | $ | 292,679 | $ | 195,295 | ||||||||||
Income (loss) from operations (1) | 77,903 | 146,995 | (47,506 | ) | (907,444 | ) | (129,110 | ) | ||||||||||||
Net income (loss) | 46,523 | 69,184 | 20,283 | (745,547 | ) | (198,950 | ) | |||||||||||||
Basic net income (loss) per common share | $ | 1.17 | $ | 1.72 | $ | 0.50 | $ | (15.57 | ) | $ | (4.04 | ) | ||||||||
Basic weighted-average common shares outstanding | 39,052 | 39,337 | 40,139 | 47,874 | 49,268 | |||||||||||||||
Diluted net income (loss) per common share | $ | 1.17 | $ | 1.71 | $ | 0.49 | $ | (15.57 | ) | $ | (4.04 | ) | ||||||||
Diluted weighted-average common shares outstanding | 39,052 | 39,403 | 40,290 | 47,874 | 49,268 | |||||||||||||||
Balance Sheet Data: | ||||||||||||||||||||
Cash and cash equivalents | $ | 4,268 | $ | 180,582 | $ | 2,584 | $ | 21,341 | $ | 80,565 | ||||||||||
Property and equipment, net (excludes assets held for sale) | 943,175 | 1,267,249 | 1,756,477 | 922,344 | 1,018,968 | |||||||||||||||
Oil and gas properties held for sale, net of accumulated depreciation, depletion, and amortization | 582 | 360 | — | 214,922 | — | |||||||||||||||
Total assets | 1,002,490 | 1,541,812 | 1,990,086 | 1,259,641 | 1,134,478 | |||||||||||||||
Debt | ||||||||||||||||||||
Credit facility | 158,000 | — | 33,000 | 79,000 | 191,667 | |||||||||||||||
Senior Notes, net of unamortized premium and deferred financing costs | — | 504,724 | 791,616 | 792,666 | 793,698 | |||||||||||||||
Total stockholders’ equity | $ | 578,518 | $ | 656,028 | $ | 740,071 | $ | 209,407 | $ | 19,061 | ||||||||||
Selected Cash Flow Data: | ||||||||||||||||||||
Net cash provided by operating activities | $ | 156,911 | $ | 295,685 | $ | 339,958 | $ | 226,023 | $ | 14,563 | ||||||||||
Net cash used in investing activities | (304,552 | ) | (453,893 | ) | (837,232 | ) | (452,573 | ) | (67,401 | ) | ||||||||||
Net cash provided by financing activities | $ | 149,819 | $ | 334,522 | $ | 319,276 | $ | 245,307 | $ | 112,062 | ||||||||||
Sales Volumes: | ||||||||||||||||||||
Oil (MBbls) | 2,191.0 | 3,887.2 | 5,618.7 | 6,072.3 | 4,309.9 | |||||||||||||||
Natural gas (MMcf) | 5,473.2 | 9,975.9 | 15,395.8 | 14,551.1 | 12,231.3 | |||||||||||||||
Natural gas liquids (MBbls) | 284.7 | 352.8 | 396.3 | 1,821.9 | 1,587.0 | |||||||||||||||
Estimated Proved Reserves: | ||||||||||||||||||||
Oil (MMBbls) | 30.2 | 43.6 | 54.7 | 57.4 | 50.1 | |||||||||||||||
Natural gas (Bcf) | 118.5 | 139.6 | 188.6 | 144.2 | 138.0 | |||||||||||||||
Natural gas liquids (MMBbls) | 3.1 | 2.9 | 3.4 | 19.9 | 17.5 | |||||||||||||||
Total proved reserves (MMBoe) | 53.0 | 69.8 | 89.5 | 101.3 | 90.7 | |||||||||||||||
Average Sales Price (before derivatives): | ||||||||||||||||||||
Oil (MBbls) | $ | 89.08 | $ | 91.84 | $ | 81.95 | $ | 40.98 | $ | 35.42 | ||||||||||
Natural gas (MMcf) | $ | 3.62 | $ | 4.66 | $ | 5.11 | $ | 1.82 | $ | 1.88 | ||||||||||
Natural gas liquids (MBbls) | $ | 55.54 | $ | 51.74 | $ | 49.14 | $ | 9.49 | $ | 12.39 | ||||||||||
Average Sales Price (after derivatives): | ||||||||||||||||||||
Oil (MBbls) | $ | 88.40 | $ | 88.82 | $ | 84.00 | $ | 62.10 | $ | 39.68 | ||||||||||
Natural gas (MMcf) | $ | 3.76 | $ | 4.70 | $ | 5.16 | $ | 2.01 | $ | 1.88 | ||||||||||
Natural gas liquids (MBbls) | $ | 55.54 | $ | 51.74 | $ | 49.14 | $ | 9.49 | $ | 12.39 | ||||||||||
Expense per BOE: | ||||||||||||||||||||
Lease operating expense and gas plant and midstream operating expense | $ | 9.06 | $ | 8.09 | $ | 8.44 | $ | 7.40 | $ | 7.12 | ||||||||||
Severance and ad valorem taxes | $ | 4.04 | $ | 4.61 | $ | 5.88 | $ | 1.81 | $ | 1.93 | ||||||||||
Depreciation, depletion, and amortization | $ | 19.54 | $ | 23.75 | $ | 26.66 | $ | 23.73 | $ | 14.01 | ||||||||||
General and administrative | $ | 9.27 | $ | 9.40 | $ | 9.51 | $ | 6.81 | $ | 9.71 | ||||||||||
(1) | Amounts reflect results for continuing operations and exclude results for discontinued operations related to non-core properties in California sold or held for sale as of December 31, 2014, 2013 and 2012. |
57
58
Item 7. Management’s Discussion and Analysis of Financial Condition and Results of Operations.
Executive Summary
We are a Denver-based exploration and production company focused on the extraction of oil and associated liquids-rich natural gas in the United States. Our oil and liquids-weighted assets are concentrated primarily in the Wattenberg Field in Colorado and the Dorcheat Macedonia Field in southern Arkansas.
Effective as of January 1, 2015, the Company revised the agreements with its natural gas processors in the Rocky Mountain region to report operated sales volumes on a three-stream basis, which allows for separate reporting of NGLs extracted from the natural gas stream and sold as a separate product. The contract revisions necessitated a change in our reporting of sales volumes. Years prior to 2015 sales volumes, revenues, and prices have not been reclassified to conform to the current presentation given the prospective nature of the agreements. The NGL volumes identified by the Company’s gas purchasers are converted to an oil equivalent. The Company believes that this conversion will more accurately convey its production and sales volumes and will allow results to be more comparable with those of our peers. This revision will increase reserves volumes, sales volumes and the percentage of sales volumes that relate to NGLs.
Bankruptcy Proceedings under Chapter 11
Restructuring Support Agreement
On December 23, 2016, the Company entered into a Restructuring Support Agreement (the “RSA”) with (i) holders of approximately 51% in aggregate principal amount of the Company’s 5.75% Senior Notes due 2023 and 6.75% Senior Notes due 2021 and (ii) NGL Energy Partners, LP and NGL Crude Logistics, LLC.
The RSA contemplates, among other things, (a) the equitization of the Company’s unsecured obligations pursuant to the Plan, including approximately $800 million in principal amount of Senior Notes, (b) a fully backstopped rights offering for the purchase of $200 million of common stock of reorganized Bonanza Creek Energy, Inc., and (c) the entry into a new crude oil purchase agreement between the Company and NGL Crude Logistics, LLC.
Voluntary Chapter 11 Bankruptcy Proceedings
On January 4, 2017 (the “Petition Date”), the Company and all of its direct and indirect subsidiaries (collectively, the “Debtors”) filed voluntary petitions (the “Bankruptcy Petitions,” and the cases commenced thereby, collectively, the “Chapter 11 Cases”) under chapter 11 of title 11 of the United States Code (the “Bankruptcy Code”) in the United States Bankruptcy Court for the District of Delaware (the “Bankruptcy Court”) to pursue the Debtors’ Joint Prepackaged Plan of Reorganization Under Chapter 11 of the Bankruptcy Code (as amended, restated, supplemented or otherwise modified from time to time, the “Prepackaged Plan”). The Debtors are authorized to operate their businesses as debtors in possession under the jurisdiction of the Bankruptcy Court and in accordance with the applicable provisions of the Bankruptcy Code and orders of the Bankruptcy Court.
The Bankruptcy Court has granted on a final basis all of the first day motions filed by the Debtors seeking relief that would minimize the impact of the Chapter 11 Cases on the Company's operations, customers and employees. As a result, the Company is not only authorized to conduct business activities in the ordinary course and generally pay all associated obligations for the period following the Petition Date without further Bankruptcy Court approval, but it is also currently authorized to pay and has paid, subject to certain limitations, obligations that arose prior to the Petition Date related to employee wages and benefits, services and supplies provided by vendors in the ordinary course of business and mineral interests held by royalty holders and other partners. In general, during the pendency of the Chapter 11 Cases, all transactions outside the ordinary course of our business require the prior approval of the Bankruptcy Court. As a result of the automatic stay under the Bankruptcy Code, which became effective upon the commencement of the Chapter 11 Cases, most judicial or administrative actions against the Company by its creditors to collect on or otherwise exercise rights or remedies with respect to claims that arose before the Petition Date are stayed during the pendency of the Chapter 11 Cases.
A hearing to consider confirmation of the Prepackaged Plan and approval of the Debtors’ Disclosure Statement is currently scheduled to begin on April 3, 2017.
For a further description of these matters, see Note 19 - Subsequent Events.
Financial and Operating Results
59
Our 2016 financial and operational results include:
• | Total liquidity of $38.9 million at December 31, 2016, consisting of, year-end cash balance net of the borrowing base deficiency under the revolving credit facility, as compared with $405.3 million, consisting of, year-end cash balance plus funds available under our revolving credit facility at December 31, 2015. Please refer to Liquidity and Capital Resources below for additional discussion; |
• | Lease operating expense in aggregate and on a per Boe basis was down 33% and 13%, respectively, from 2015 due to decreased operating costs and reduced activity levels; |
• | Cash flows provided by operating activities of $14.6 million, as compared with $226.0 million in 2015. Please refer to Liquidity and Capital Resources below for additional discussion; |
• | Full year capital expenditures were $21.7 million; |
• | Net loss of $199.0 million, as compared with a net loss of $745.5 million for 2015; |
• | Decreased sales volumes by 23% to 7.9 MMBoe in 2016 from 10.3 MMBoe in 2015, with oil and NGL production representing 74% of total sales volumes; |
• | Decreased proved reserves by 10% to 90.7 MMBoe as of December 31, 2016, from 101.3 MMBoe as of December 31, 2015. |
Business Strategies and Outlook for 2017
Our strategy is to operate a development program on contiguous acreage blocks that have high working interest, allowing us to control the pace and magnitude of our future capital expenditures and provide efficient resource development through multi-well pads and centralized facilities. Upon emergence from bankruptcy, management currently intends to operate a one-rig program in 2017 to drill 61 operated standard reach lateral equivalent wells that are within close proximity to the Company's existing infrastructure to keep costs down. Actual capital expenditures could vary significantly based on, among other things, emergence from bankruptcy, approval from a newly appointed board, market conditions, commodity prices, the final amount of the rights offering effectuated pursuant to the RSA, and changes in the borrowing base under our revolving credit facility. We have also observed evidence of an increase in drilling and completion costs since year end, which will have an impact on our 2017 capital expenditures.
Results of Operations
The following discussion and analysis should be read in conjunction with our consolidated financial statements and the notes thereto contained in Part II, Item 8 of this Annual Report on Form 10-K. Comparative results of operations for the period indicated are discussed below.
60
The table below presents revenues, sales volumes, and average sales prices for the years ended December 31, 2016 and 2015:
For the Years Ended December 31, | ||||||||||||||
2016 | 2015 | Change | Percent Change | |||||||||||
(In thousands, except percentages) | ||||||||||||||
Operating Revenues: | ||||||||||||||
Crude oil sales(1) | $ | 152,673 | $ | 248,862 | $ | (96,189 | ) | (39 | )% | |||||
Natural gas sales(2) | 22,962 | 26,528 | (3,566 | ) | (13 | )% | ||||||||
Natural gas liquids sales | 19,660 | 17,289 | 2,371 | 14 | % | |||||||||
Product revenue | $ | 195,295 | $ | 292,679 | $ | (97,384 | ) | (33 | )% | |||||
Sales Volumes: | ||||||||||||||
Crude oil (MBbls) | 4,309.9 | 6,072.3 | (1,762.4 | ) | (29 | )% | ||||||||
Natural gas (MMcf) | 12,231.3 | 14,551.1 | (2,319.8 | ) | (16 | )% | ||||||||
Natural gas liquids (MBbls) | 1,587.0 | 1,821.9 | (234.9 | ) | (13 | )% | ||||||||
Crude oil equivalent (MBoe)(3) | 7,935.5 | 10,319.4 | (2,383.9 | ) | (23 | )% | ||||||||
Average Sales Prices (before derivatives): | ||||||||||||||
Crude oil (per Bbl) | $ | 35.42 | $ | 40.98 | $ | (5.56 | ) | (14 | )% | |||||
Natural gas (per Mcf) | $ | 1.88 | $ | 1.82 | $ | 0.06 | 3 | % | ||||||
Natural gas liquids (per Bbl) | $ | 12.39 | $ | 9.49 | $ | 2.90 | 31 | % | ||||||
Crude oil equivalent (per Boe)(3) | $ | 24.61 | $ | 28.36 | $ | (3.75 | ) | (13 | )% | |||||
Average Sales Prices (after derivatives)(4): | ||||||||||||||
Crude oil (per Bbl) | $ | 39.68 | $ | 62.10 | $ | (22.42 | ) | (36 | )% | |||||
Natural gas (per Mcf) | $ | 1.88 | $ | 2.01 | $ | (0.13 | ) | (6 | )% | |||||
Natural gas liquids (per Bbl) | $ | 12.39 | $ | 9.49 | $ | 2.90 | 31 | % | ||||||
Crude oil equivalent (per Boe)(3) | $ | 26.92 | $ | 41.06 | $ | (14.14 | ) | (34 | )% | |||||
_____________________________
(1) | Crude oil sales includes $0.5 million and $0.2 million of oil transportation revenues from third parties, which do not have associated sales volumes, for the years ended December 31, 2016 and 2015, respectively. |
(2) | Natural gas sales includes $1.5 million and $0.8 million of gas gathering revenues from third parties, which do not have associated sales volumes, for the years ended December 31, 2016 and 2015, respectively. |
(3) | Determined using the ratio of 6 Mcf of natural gas to 1 Bbl of crude oil. |
(4) | The derivatives economically hedge the price we receive for crude oil and natural gas. For the years ended December 31, 2016 and 2015, the derivative cash settlement gain for oil contracts was $18.3 million and $128.3 million, respectively, and the derivative cash settlement gain for gas contracts was $2.7 million for the year ended December 31, 2015. Please refer to Part II, Item 8, Note 13 - Derivatives for additional disclosures. |
Revenues decreased by 33% to $195.3 million for the year ended December 31, 2016 compared to $292.7 million for the year ended December 31, 2015 largely due to a 23% decrease in sales volumes coupled with a 13% decrease in oil equivalent pricing. The decreased volumes are a direct result of the Company suspending all drilling and completion activities after the first quarter of 2016. During the period from December 31, 2015 through December 31, 2016, we drilled 17 gross (8.4 net) and completed 21 gross (13.0 net) wells in the Rocky Mountain region and drilled no wells in the Mid-Continent region.
61
The following table summarizes our operating expenses for the periods indicated.
For the Years Ended December 31, | ||||||||||||||
2016 | 2015 | Change | Percent Change | |||||||||||
(In thousands, except percentages) | ||||||||||||||
Operating Expenses: | ||||||||||||||
Lease operating expense | $ | 43,671 | $ | 65,038 | $ | (21,367 | ) | (33 | )% | |||||
Gas plant and midstream operating expense | 12,826 | 11,368 | 1,458 | 13 | % | |||||||||
Severance and ad valorem taxes | 15,304 | 18,629 | (3,325 | ) | (18 | )% | ||||||||
Exploration | 946 | 15,827 | (14,881 | ) | (94 | )% | ||||||||
Depreciation, depletion and amortization | 111,215 | 244,921 | (133,706 | ) | (55 | )% | ||||||||
Impairment of oil and gas properties | 10,000 | 740,478 | (730,478 | ) | (99 | )% | ||||||||
Abandonment and impairment of unproved properties | 24,692 | 33,543 | (8,851 | ) | (26 | )% | ||||||||
Unused commitments | 7,686 | — | 7,686 | 100 | % | |||||||||
Contract settlement expense | 21,000 | — | 21,000 | 100 | % | |||||||||
General and administrative expense | 77,065 | 70,319 | 6,746 | 10 | % | |||||||||
Operating expenses | $ | 324,405 | $ | 1,200,123 | $ | (875,718 | ) | (73 | )% | |||||
Selected Costs ($ per Boe): | ||||||||||||||
Lease operating expense | $ | 5.50 | $ | 6.30 | $ | (0.80 | ) | (13 | )% | |||||
Gas plant and midstream operating expense | 1.62 | 1.10 | 0.52 | 47 | % | |||||||||
Severance and ad valorem taxes | 1.93 | 1.81 | 0.12 | 7 | % | |||||||||
Exploration | 0.12 | 1.53 | (1.41 | ) | (92 | )% | ||||||||
Depreciation, depletion and amortization | 14.01 | 23.73 | (9.72 | ) | (41 | )% | ||||||||
Impairment of oil and gas properties | 1.26 | 71.76 | (70.50 | ) | (98 | )% | ||||||||
Abandonment and impairment of unproved properties | 3.11 | 3.25 | (0.14 | ) | (4 | )% | ||||||||
Unused commitments | 0.97 | — | 0.97 | 100 | % | |||||||||
Contract settlement expense | 2.65 | — | 2.65 | 100 | % | |||||||||
General and administrative expense | 9.71 | 6.81 | 2.90 | 43 | % | |||||||||
Operating expenses | $ | 40.88 | $ | 116.29 | $ | (75.41 | ) | (65 | )% | |||||
Operating expenses, excluding impairments and abandonments, unused commitments and contract settlement expense | $ | 32.89 | $ | 41.28 | (8.39 | ) | (20 | )% | ||||||
Lease operating expense. Our lease operating expense decreased $21.4 million or 33%, to $43.7 million for the year ended December 31, 2016 from $65.0 million for the year ended December 31, 2015 and decreased on an equivalent basis from $6.30 per Boe to $5.50 per Boe. The majority of the decrease is due to continued operating cost reductions along with decreased activity levels. The Company reduced operating costs and negotiated contract reductions resulting in decreased well servicing costs of $10.1 million, compression costs of $4.9 million and pumping and gauging costs of $2.7 million during the year ended December 31, 2016 when compared to the same period in 2015.
Gas plant and midstream operating expense. Our gas plant and midstream operating expense increased $1.5 million to $12.8 million for the year ended December 31, 2016 from $11.4 million for the year ended December 31, 2015 and increased on an equivalent basis from $1.10 per Boe to $1.62 per Boe. The increase in aggregate and on an equivalent basis is due to the start-up and continued buildout of RMI, which began in May of 2015.
Severance and ad valorem taxes. Our severance and ad valorem taxes decreased by 18%, or $3.3 million to $15.3 million for the year ended December 31, 2016 from $18.6 million for the year ended December 31, 2015. Severance and ad
62
valorem taxes primarily correlate to revenue. Revenues decreased by 33% for the year ended December 31, 2016 when compared to the same period in 2015, which was offset by a tax refund received during the third quarter of 2015.
Exploration. Our exploration expense decreased $14.9 million to $0.9 million during the year ended December 31, 2016 from $15.8 million for the year ended December 31, 2015. During the year ended December 31, 2016, we incurred minimal exploration charges. During the year ended December 31, 2015 we incurred charges of $5.6 million and $8.5 million for exploratory wells located in the North Park Basin and outside of our current development area in southern Arkansas, respectively, which we were unable to assign economic proved reserves. During 2015, we also paid $1.0 million and $0.7 million in geological and geophysical expenses and delay rentals, respectively.
Depreciation, depletion and amortization. Our depreciation, depletion and amortization expense decreased $133.7 million, or 55%, to $111.2 million for the year ended December 31, 2016 from $244.9 million for the year ended December 31, 2015 and decreased on an equivalent basis from $23.73 per Boe to $14.01 per Boe. The Company realized significant proved property impairments during the fourth quarter of 2015 resulting in a 50% decrease in the net proved property depletable base from the year ended December 31, 2015 to December 31, 2016.
Impairment of oil and gas properties. For the year ended December 31, 2016 we incurred an impairment of proved properties of $10.0 million, a $730.5 million decrease from the year ended December 31, 2015. We impaired our Mid-Continent assets by $10.0 million based on the most recent bid received during the first quarter of 2016, when it was held for sale. For the year ended December 31, 2015, we impaired our Mid-Continent assets by $321.2 million due to their depressed fair value upon classification as held for sale and our Rocky Mountain assets by $419.3 million due to low commodity prices. Please refer to Note 1 - Summary of Significant Accounting Policies in Part II, Item 8 of this Annual Report on Form 10-K for additional discussion on our impairment policy and practice.
Abandonment and impairment of unproved properties. For the year ended December 31, 2016 we incurred an abandonment and impairment of unproved properties of $24.7 million, an $8.9 million decrease from the prior year. Our 2016 abandonment and impairment charges related to non-core leases expiring within the Wattenberg Field. During the year ended December 31, 2015, we incurred $24.8 million of impairment charges relating to non-core leases expiring within the Wattenberg Field and $8.7 million of impairment charges to fully impair the North Park Basin due to a strategic shift in our development plan.
Unused commitments. For the year ended December 31, 2016, we incurred $7.7 million in unused commitment fees. During 2015, we did not incur any fees of this nature. The unused commitment fees in 2016 of $4.3 million and $3.4 million are the result of water commitment deficiency payments and purchase and transportation agreement deficiency payments, respectively. Please see Note 8 - Commitments and Contingencies in Part II, Item 8 of this Annual Report on Form 10-K for additional discussion.
Contract settlement expense. For the year ended December 31, 2016 we incurred a $21.0 million loss to settle our crude oil purchase agreement with Silo as part of our bankruptcy process. There were no material settlements during 2015. Please see Note 8 - Commitments and Contingencies in Part II, Item 8 of this Annual Report on Form 10-K for additional discussion.
General and administrative expense. Our general and administrative expense increased $6.7 million, or 10%, to $77.1 million for the year ended December 31, 2016 from $70.3 million for the comparable period in 2015 and increased on an equivalent basis to $9.71 per Boe from $6.81 per Boe. The increase in general and administrative expense in 2016 on an aggregate and equivalent basis is due to $20.4 million of advisory fees related to our restructuring efforts and an increase of $1.2 million in severance payments. These cost increases were offset by a decrease in salaries and wages, including benefits of $9.3 million and stock compensation of $5.7 million due to reductions in workforce that have occurred since December 31, 2015.
Derivative gain (loss). Our derivative loss increased $67.8 million to an $11.2 million loss for the year ended December 31, 2016 from a gain of $56.6 million for the comparable period in 2015. The decrease is related to a reduction of hedged volumes throughout 2016 and decreased contract prices at the time of conversion from three-way collars to swap and puts at the end of the first quarter of 2016 bringing them closer to realized prices during the year ended December 31, 2016 when compared to the same period in 2015. Please refer to Note 13 - Derivatives in Part II, Item 8 of this Annual Report on Form 10-K for additional discussion.
63
Interest expense. Our interest expense for the year ended December 31, 2016 increased 9% to $62.1 million compared to $57.1 million for the year ended December 31, 2015. The interest expense increase is a result of increased average debt outstanding for the year ended December 31, 2016 of $1.0 billion, compared to $847.9 million for the comparable period in 2015. Total interest expense is comprised primarily of interest expense attributable to the Senior Notes including amortization of the premium and financing costs, which was $52.3 million and $52.1 million for the years ended December 31, 2016 and 2015, respectively.
Income tax benefit (expense). Our estimate for federal and state income tax benefit for the years ended December 31, 2016 and 2015 was zero and $164.9 million, respectively. We are allowed to deduct various items for tax reporting purposes that are capitalized for purposes of financial statement presentation. Our effective tax rate for the years ended December 31, 2016 and 2015 was 0.0% and 18.1%, respectively. As of December 31, 2015, a full valuation was placed against the net deferred tax assets, which caused effective tax rate to differ from the U.S. statutory income tax rate.
Year Ended December 31, 2015 Compared to Year Ended December 31, 2014
The table below presents revenues, sales volumes, and average sales prices for the years ended December 31, 2015 and 2014:
For the Years Ended December 31, | ||||||||||||||
2015(1) | 2014(4) | Change | Percent Change | |||||||||||
(In thousands, except percentages) | ||||||||||||||
Operating Revenues: | ||||||||||||||
Crude oil sales(5) | $ | 248,862 | $ | 460,442 | $ | (211,580 | ) | (46 | )% | |||||
Natural gas sales(6) | 26,528 | 78,714 | (52,186 | ) | (66 | )% | ||||||||
Natural gas liquids sales | 17,289 | 19,470 | (2,181 | ) | (11 | )% | ||||||||
CO2 sales | — | 7 | (7 | ) | (100 | )% | ||||||||
Product revenue | $ | 292,679 | $ | 558,633 | $ | (265,954 | ) | (48 | )% | |||||
Sales Volumes: | ||||||||||||||
Crude oil (MBbls) | 6,072.3 | 5,618.7 | 453.6 | 8 | % | |||||||||
Natural gas (MMcf) | 14,551.1 | 15,395.8 | (844.7 | ) | (5 | )% | ||||||||
Natural gas liquids (MBbls) | 1,821.9 | 396.2 | 1,425.7 | 360 | % | |||||||||
Crude oil equivalent (MBoe)(2) | 10,319.4 | 8,580.9 | 1,738.5 | 20 | % | |||||||||
Average Sales Prices (before derivatives): | ||||||||||||||
Crude oil (per Bbl) | $ | 40.98 | $ | 81.95 | $ | (40.97 | ) | (50 | )% | |||||
Natural gas (per Mcf) | $ | 1.82 | $ | 5.11 | $ | (3.29 | ) | (64 | )% | |||||
Natural gas liquids (per Bbl) | $ | 9.49 | $ | 49.14 | $ | (39.65 | ) | (81 | )% | |||||
Crude oil equivalent (per Boe)(2) | $ | 28.36 | $ | 65.10 | $ | (36.74 | ) | (56 | )% | |||||
Average Sales Prices (after derivatives)(3): | ||||||||||||||
Crude oil (per Bbl) | $ | 62.10 | $ | 84.00 | $ | (21.90 | ) | (26 | )% | |||||
Natural gas (per Mcf) | $ | 2.01 | $ | 5.16 | $ | (3.15 | ) | (61 | )% | |||||
Natural gas liquids (per Bbl) | $ | 9.49 | $ | 49.14 | $ | (39.65 | ) | (81 | )% | |||||
Crude oil equivalent (per Boe)(2) | $ | 41.06 | $ | 66.53 | $ | (25.47 | ) | (38 | )% | |||||
________________________________
(1) | Effective as of January 1, 2015, the Company revised the agreements with its natural gas processors in the Rocky Mountain region to report operated sales volumes on a three-stream basis, which allows for separate reporting of NGLs extracted from the natural gas stream and sold as a separate product. The contract revisions necessitated a change in our reporting of sales volumes. Prior period sales volumes, revenues, and prices have not been reclassified to conform to the current presentation given the prospective nature of the agreements. |
(2) | Determined using the ratio of 6 Mcf of natural gas to 1 Bbl of crude oil. |
64
(3) | The derivatives economically hedge the price we receive for crude oil and natural gas. For the years ended December 31, 2015 and 2014, the derivative cash settlement gain for oil contracts was $128.3 million and $11.5 million, respectively, and the derivative cash settlement gain for gas contracts was $2.7 million and $0.7 million, respectively. Please refer to Part II, Item 8, Note 13 - Derivatives for additional disclosures. |
(4) | Amounts reflect results for continuing operations and exclude results for discontinued operations related to non‑core properties in California sold or held for sale as of December 31, 2014. |
(5) | Crude oil sales includes $0.2 million of oil transportation revenues from third parties, which do not have associated sales volumes, for the year ended December 31, 2015. There was no oil transportation revenues for the year ended December 31, 2014. |
(6) | Natural gas sales includes $0.8 million of gas gathering revenues from third parties, which do not have associated sales volumes, for the year ended December 31, 2015. There was no gas gathering revenues for the year ended December 31, 2014. |
Revenues decreased by 48% to $292.7 million for the year ended December 31, 2015 compared to $558.6 million for the year ended December 31, 2014 largely due to a 56% decrease in oil equivalent pricing. The decreased pricing was offset by increased sales volumes of 20% for the year ended December 31, 2015 compared to the same period in 2014. The increased volumes are a direct result of $404.0 million expended for drilling and completion during 2015. During the period from December 31, 2014 through December 31, 2015, we drilled 84 gross (66 net) and completed 95 gross (77.1 net) wells in the Rocky Mountain region and drilled 24 gross (22.2 net) and completed 21 gross (19.4 net) wells in the Mid-Continent region.
For the Years Ended December 31, | ||||||||||||||
2015 | 2014(2) | Change | Percent Change | |||||||||||
(In thousands, except percentages) | ||||||||||||||
Operating Expenses: | ||||||||||||||
Lease operating expense | $ | 65,038 | $ | 59,884 | $ | 5,154 | 9 | % | ||||||
Gas plant and midstream operating expense | 11,368 | 12,527 | (1,159 | ) | (9 | )% | ||||||||
Severance and ad valorem taxes | 18,629 | 50,430 | (31,801 | ) | (63 | )% | ||||||||
Exploration | 15,827 | 5,346 | 10,481 | 196 | % | |||||||||
Depreciation, depletion and amortization | 244,921 | 228,789 | 16,132 | 7 | % | |||||||||
Impairment of oil and gas properties | 740,478 | 167,592 | 572,886 | 342 | % | |||||||||
Abandonment and impairment of unproved properties | 33,543 | — | 33,543 | 100 | % | |||||||||
General and administrative expense | 70,319 | 81,571 | (11,252 | ) | (14 | )% | ||||||||
Operating Expenses | $ | 1,200,123 | $ | 606,139 | $ | 593,984 | 98 | % | ||||||
Selected Costs ($ per Boe)(1): | ||||||||||||||
Lease operating expense | $ | 6.30 | $ | 6.98 | $ | (0.68 | ) | (10 | )% | |||||
Gas plant and midstream operating expense | 1.10 | 1.46 | (0.36 | ) | (25 | )% | ||||||||
Severance and ad valorem taxes | 1.81 | 5.88 | (4.07 | ) | (69 | )% | ||||||||
Exploration | 1.53 | 0.62 | 0.91 | 147 | % | |||||||||
Depreciation, depletion and amortization | 23.73 | 26.66 | (2.93 | ) | (11 | )% | ||||||||
Impairment of oil and gas properties | 71.76 | 19.53 | 52.23 | 267 | % | |||||||||
Abandonment and impairment of unproved properties | 3.25 | — | 3.25 | 100 | % | |||||||||
General and administrative expense | 6.81 | 9.51 | (2.70 | ) | (28 | )% | ||||||||
Operating Expenses | $ | 116.29 | $ | 70.64 | $ | 45.65 | 65 | % | ||||||
Operating expenses, excluding impairments and abandonments | $ | 41.28 | $ | 51.11 | $ | (9.83 | ) | (19 | )% | |||||
_______________________________
(1) | Effective as of January 1, 2015, the Company revised the agreements with its natural gas processors in the Rocky Mountain region to report operated sales volumes on a three stream basis, which allows for separate reporting of NGLs extracted from the natural gas stream and sold as a separate product. The contract revisions necessitated a change in our reporting of sales volumes. Prior period sales volumes, revenues, and prices have not been reclassified to conform to the current presentation given the prospective nature of the agreements. |
65
(2) | Amounts reflect results for continuing operations and exclude results for discontinued operations related to non-core properties in California sold or held for sale as of December 31, 2014. |
Lease operating expense. Our lease operating expense increased $5.2 million or 9%, to $65.0 million for the year ended December 31, 2015 from $59.9 million for the year ended December 31, 2014 and decreased on an equivalent basis from $6.98 per Boe to $6.30 per Boe. The increase in aggregate lease operating expense was related to the 20% increase in sales volumes during the year ended December 31, 2015 when compared to the same period in 2014. During the year ended December 31, 2015, the largest component of lease operating expense was compression, which increased $4.0 million over the comparable period in 2014. The Company reduced operating costs and negotiated contract reductions while increasing production for the year ended December 31, 2015, driving the per equivalent barrel rate down when compared to the same period in 2014.
Gas plant and midstream operating expense. Our gas plant and midstream operating expense decreased by 9%, to $11.4 million for the year ended December 31, 2015 from $12.5 million for the year ended December 31, 2014. The decrease is primarily due to the Company idling the McKamie gas plant during the second quarter of 2015, which was partially offset by RMI beginning operations in May of 2015.
Severance and ad valorem taxes. Our severance and ad valorem taxes decreased $31.8 million to $18.6 million for the year ended December 31, 2015 from $50.4 million for the year ended December 31, 2014. Severance and ad valorem taxes primarily correlate to revenue. Revenues decreased by 48% for the year ended December 31, 2015 when compared to the same period in 2014 causing the severance and ad valorem taxes to decrease. Severance and ad valorem taxes were further reduced by a tax refund received during 2015. Additionally, our ad valorem tax credits available for deduction increased in 2015 when compared to the same period in 2014 due to continued development of the Wattenberg Field which further reduced our effective severance tax rate.
Exploration. Our exploration expense increased $10.5 million to $15.8 million during the year ended December 31, 2015 from $5.3 million for the year ended December 31, 2014. During the year ended December 31, 2015, we incurred charges for exploratory wells located in both the North Park Basin and outside of our current development area in southern Arkansas for $5.6 million and $8.5 million, respectively, which we were unable to assign economic proved reserves, and paid $1.0 million and $0.7 million in geological and geophysical expenses and delay rentals, respectively. In 2014, we incurred $3.4 million of seismic charges for an acquisition project within the Wattenberg Field, a $1.0 million dry hole charge related to a vertical well within the Wattenberg Field drilled to test the Lyons formation, and $0.9 million in delay rentals.
Depreciation, depletion and amortization. Our depreciation, depletion and amortization expense increased $16.1 million, or 7%, to $244.9 million for the year ended December 31, 2015 from $228.8 million for the year ended December 31, 2014 and decreased on an equivalent basis from $26.66 per Boe to $23.73 per Boe. The decrease in equivalent basis was primarily due to depreciation ceasing once assets were deemed held for sale coupled with a 20% increase in sales volumes.
Impairment of oil and gas properties. Our impairment of proved properties increased $572.9 million to $740.5 million for the year ended December 31, 2015 when compared to year ended December 31, 2014. We impaired our Mid-Continent assets by $321.2 million due to their depressed fair value from low commodity prices upon classification as held for sale and our Rocky Mountain assets by $419.3 million due to low commodity prices. For the year ended December 31, 2014, we impaired $127.3 million of proved properties within the Dorcheat Macedonia Field due to low commodity prices, $25.0 million of non-core proved properties within the McKamie Patton Field due to low commodity prices, and $15.3 million of proved properties in our McCallum Field due to low commodity prices and a strategic shift to horizontal drilling. Please refer to Note 1 - Summary of Significant Accounting Policies in Part II, Item 8 of this Annual Report on Form 10-K for additional discussion on our impairment policy and practice.
Abandonment and impairment of unproved properties. Our abandonment and impairment of unproved properties increased to $33.5 million for the year ended December 31, 2015 when compared to the year ended December 31, 2014. We incurred $24.8 million of impairment charges relating to non-core leases expiring within the Wattenberg Field and $8.7 million of impairment charges to fully impair the North Park Basin due to a strategic shift in our development plan. There were no unproved properties abandoned or impaired during the year ended December 31, 2014.
General and administrative expense. Our general and administrative expense decreased $11.3 million, or 14%, to $70.3 million for the year ended December 31, 2015 from $81.6 million for the comparable period in 2014 and decreased on an equivalent basis to $6.81 per Boe from $9.51 per Boe. The decrease in general and administrative expense for the year ended
66
December 31, 2015 when compared to the same period in 2014 was primarily due to executive departure costs that occurred in 2014. The decrease in equivalent basis was caused by the 20% increase in sales volumes outpacing the change in the expense.
Derivative gain. Our derivative gain decreased $65.0 million to $56.6 million for the year ended December 31, 2015 from a gain of $121.6 million for the comparable period in 2014. The decrease in gain is related to a reduction in hedged volumes during the year ended December 31, 2015 when compared to the year ended December 31, 2014. Please refer to Note 13 - Derivatives in Part II, Item 8 of this Annual Report on Form 10-K for additional discussion.
Interest expense. Our interest expense for the year ended December 31, 2015 increased 23% to $57.1 million compared to $46.4 million for the year ended December 31, 2014 due to the average debt outstanding for the year ended December 31, 2015 being $847.9 million as compared to $644.4 million for the comparable period in 2014. Interest expense, including amortization of the premium and financing costs, on the Senior Notes for the years ended December 31, 2015 and 2014 was $52.1 million and $42.3 million, respectively.
Income tax benefit (expense). Our estimate for federal and state income tax benefit for the year ended December 31, 2015 was $164.9 million as compared to income tax expense of $11.0 million for the year ended December 31, 2014. We are allowed to deduct various items for tax reporting purposes that are capitalized for purposes of financial statement presentation. Our effective tax rate for the year ended December 31, 2015 was 18.1% as compared to 39.3% for the year ended December 31, 2014. These rates differ from the U.S. statutory income tax rate primarily due to the effects of state income taxes and a valuation allowance being placed against net deferred tax assets.
Results for Discontinued Operations
During June of 2012, the Company began marketing, with an intent to sell, all of its oil and gas properties in California. The Company determined, at that time, that our intent to sell out of an entire region qualified for discontinued operations accounting and these assets have been presented as discontinued operations in the accompanying statements of operations.
The majority of these properties were sold in 2012. The remaining property located in the Midway Sunset Field sold on March 21, 2014 for approximately $6.0 million and resulted in a $5.5 million gain.
The operating results before income taxes for our California properties for the year ended December 31, 2014 were net revenues of $0.4 million, and operating expenses of $0.4 million, as compared to net revenues of $1.7 million, and operating expenses of $2.3 million for the year ended December 31, 2013. Sales volumes for the years ended December 31, 2014 and 2013 were 10 Boe/d and 47 Boe/d, respectively.
Liquidity and Capital Resources
Our primary sources of liquidity have historically included cash from operating activities, borrowings under the revolving credit facility, proceeds from sales of assets and, from time to time, proceeds from capital market transactions, including the offering of debt and equity securities. Our cash flows from operating activities are subject to significant volatility due to changes in commodity prices for our crude oil, NGL and natural gas products, as well as variations in our production. The prices for these commodities are driven by a number of factors beyond our control, including global and regional product supply and demand, weather, product distribution, refining and processing capacity and other supply chain dynamics, among other factors.
Since the first quarter of 2016, the Company’s liquidity outlook has deteriorated due to the Company's inability to sell assets given current market conditions and counterparty concerns about the Company's liquidity and current capital structure, borrowing base reductions that have occurred during 2016, continuation of depressed commodity prices and the inability to access the debt and capital markets. The Company is currently in default on its revolving credit facility and Senior Notes. The lenders and noteholders had the option to accelerate the repayment of their respective debts at the time of default. The Company did not receive a notice of acceleration prior to filing for bankruptcy.
Currently, our liquidity is $38.9 million, which is comprised of our available cash on hand of $80.6 million reduced by our borrowing base deficiency of $41.7 million as of December 31, 2016.
Upon our emergence from bankruptcy, which we anticipate in the first half of 2017, we expect to have a new four-year senior secured revolving credit facility in place which is intended to provide us with an initial borrowing base equal to our
67
outstanding balance under our existing revolving credit agreement of $191.7 million. As contemplated in the RSA we will have access to the net proceeds of a $200 million rights offering. After emergence from bankruptcy, management currently intends on investing $160.0 million to $180.0 million in a one-rig program in 2017 to drill 61 operated standard reach lateral equivalent wells that are within close proximity to the Company's existing infrastructure. Actual capital expenditures could vary significantly.
While we are in default on our indebtedness and have filed for bankruptcy, we will no longer be able to represent that we can comply with the credit default or bankruptcy covenants of different agreements to which we are a party. There can be no assurances regarding our ability to successfully develop, confirm and consummate one or more plans of reorganization or other alternative restructuring transactions that satisfies the conditions of the Bankruptcy Code and, is approved by the Bankruptcy Court.
The following table summarizes our cash flows and other financial measures for the periods indicated.
For the Years Ended December 31, | |||||||||||
2016 | 2015 | 2014 | |||||||||
(in thousands) | |||||||||||
Net cash provided by operating activities | $ | 14,563 | $ | 226,023 | $ | 339,958 | |||||
Net cash used in investing activities | (67,401 | ) | (452,573 | ) | (837,232 | ) | |||||
Net cash provided by financing activities | 112,062 | 245,307 | 319,276 | ||||||||
Cash and cash equivalents | 80,565 | 21,341 | 2,584 | ||||||||
Acquisition of oil and gas properties | 98 | 16,270 | 179,566 | ||||||||
Exploration and development of oil and gas properties | 52,344 | 425,918 | 641,204 | ||||||||
Cash flows provided by operating activities
During 2016, we generated $14.6 million of cash provided by operating activities, a decrease of $211.5 million from the comparable period in 2015. The decrease in cash flows from operating activities resulted primarily from a 13% decrease in crude oil equivalent pricing and a 23% decrease in sales volumes and a $112.7 million decrease in derivative cash settlements during the year ended December 31, 2016 as compared to the year ended December 31, 2015. The decrease in cash flows from operating activities of $113.9 million from December 31, 2014 to December 31, 2015 resulted primarily from a 56% decrease in crude oil equivalent pricing and a $31.8 million reduction in severance and ad valorem taxes paid that were partially offset by a 20% increase in sales volumes and $118.8 million increase in derivative cash settlements. See Results of Operations above for more information on the factors driving these changes.
Cash flows used in investing activities
Expenditures for development of oil and natural gas properties are the primary use of our capital resources. Net cash used in investing activities for the year ended December 31, 2016 decreased $385.2 million as compared to the same period in 2015. For the year ended December 31, 2016, cash used for the acquisition of oil and gas properties was $98,000 and cash used for the development of oil and natural gas properties was $52.3 million. Net cash used in investing activities for the year ended December 31, 2015 decreased $384.7 million as compared to the same period in 2014. For the year ended December 31, 2015, cash used for the acquisition of oil and gas properties was $16.3 million and cash used for the development of oil and natural gas properties was $425.9 million. For the year ended December 31, 2014, cash used for the acquisition of oil and gas properties was $179.6 million and cash used for the development of oil and natural gas properties was $641.2 million.
Cash flows provided by financing activities
Net cash provided by financing activities for the year ended December 31, 2016 decreased $133.2 million, compared to the same period in 2015. The decrease was primarily due to $202.7 million of net proceeds from the sale of common stock that occurred during 2015 that did not occur in 2016 and was offset by an increase in net borrowings under the revolving credit facility of $66.7 million in 2016 when compared to 2015. Net cash provided by financing activities for the year ended December 31, 2015 decreased $74.0 million, compared to the same period in 2014. The decrease was primarily due to $202.7 million of net proceeds from the sale of common stock that occurred during the year plus net borrowings of $46.0 million from
68
our revolving credit facility compared to $292.9 million of net proceeds from the sale of Senior Notes plus net borrowings of $33.0 million from our revolving credit facility during the year ended December 31, 2014.
Credit facility
Revolving Credit Facility
The administrative agent of our $1.0 billion revolving credit facility is KeyBank National Association. The revolving credit facility provides for interest rates plus an applicable margin to be determined based on the London Interbank Offered Rate (“LIBOR”) or a bank base rate (“Base Rate”), at the Company’s election. LIBOR borrowings bear interest at LIBOR plus 1.50% to 2.50% depending on the utilization level, and the Base Rate borrowings bear interest at the “Bank Prime Rate,” as defined in the revolving credit facility, plus 0.50% to 1.50%. The applicable lenders under the revolving credit facility deemed the Company in default due to a covenant violation on November 14, 2016 causing the then outstanding balance under the revolving credit facility to bear interest at the Bank Prime Rate plus the applicable utilization margin and 2% penalty fee.
Our approved borrowing base under the revolving credit facility, which was $150.0 million as of December 31, 2016, is redetermined semiannually as early as April and October of each year and up to one additional time between such scheduled determinations upon our request or upon the request of the required lenders (defined as lenders holding 662/3% of the aggregate commitments). The borrowing base is determined by the value of our oil and gas reserves but also takes into consideration such information as a repayment analysis of the Company's debt and the forecasted financial condition of the Company. The borrowing base is redetermined (i) in the sole discretion of the administrative agent and all of the lenders, (ii) in accordance with their customary internal standards and practices for valuing and redetermining the value of oil and gas properties in connection with reserve based oil and natural gas loan transactions, (iii) in conjunction with the most recent engineering report and other information received by the administrative agent and the lenders relating to our proved reserves and (iv) based upon the estimated value of our proved reserves as determined by the administrative agent and the lenders.
As of December 31, 2016, the Company had $191.7 million outstanding under the revolving credit facility and had a borrowing base deficiency of $41.7 million to be paid back in five remaining monthly installments of $8.3 million, with no additional available borrowing capacity. The Company filed for Chapter 11 under the Bankruptcy Code on January 4, 2017, allowing the Company a stay from making any further deficiency payments. For additional discussion, please refer to Note 19 - Subsequent Events. The revolving credit facility may be used only to finance development of oil and gas properties, for working capital and for other general corporate purposes.
Our obligations under the revolving credit facility are secured by first priority liens on all of our property and assets (whether real, personal, or mixed, tangible or intangible), including our proved reserves and our oil and gas properties (which term is defined to include fee mineral interests, term mineral interests, leases, subleases, farm-outs, royalties, overriding royalties, net profit interests, carried interests, production payments, back in interests and reversionary interests). The revolving credit facility is guaranteed by the Company and all of its direct and indirect subsidiaries.
The applicable margin varies on a daily basis based on the percentage outstanding under the borrowing base. We incur quarterly commitment fees based on the unused amount of the borrowing base ranging from 0.375% and 0.50% per annum. We may prepay loans under the revolving credit facility at any time without premium or penalty (other than customary LIBOR breakage costs).
The revolving credit facility contains various covenants limiting our ability to:
• | grant or assume liens; |
• | incur or assume indebtedness; |
• | grant negative pledges or agree to restrict dividends or distributions from subsidiaries; |
• | sell, transfer, assign or convey assets, or engage in certain mergers or acquisitions; |
• | make certain distributions; |
• | make certain loans, advances and investments; |
• | engage in transactions with affiliates; |
69
• | enter into sale and leaseback, take-or-pay or hydrocarbon prepayment transactions; or |
• | enter into certain swap agreements. |
The revolving credit facility also contains covenants requiring us to maintain:
• | a current ratio (i.e., the ratio of current assets to current liabilities, excluding unsettled derivatives and the current portion of long-term debt) of not less than 1.0 to 1.0 (current assets include, as of the date of calculation, the aggregate of all lenders’ unused commitment amounts); |
• | a maximum senior secured debt (defined as borrowings under the revolving credit facility, balances drawn under letters of credit, and any outstanding second lien debt) to trailing twelve-month earnings before interest, income taxes, depreciation, depletion, and amortization, exploration expense and other non-cash charges (“EBITDAX”) covenant that must not exceed 2.50 to 1.00; and |
• | a minimum interest coverage ratio calculated by dividing trailing twelve-month EBITDAX by trailing twelve-month interest expense that must exceed 2.50 to 1.00. |
The revolving credit facility contains customary events of default, including:
• | failure to pay any principal, interest, fees, expenses or other amounts when due; |
• | the failure of any representation or warranty to be materially true and correct when made; |
• | failure to observe any agreement, obligation or covenant in the credit agreement, subject to cure periods for certain failures; |
• | a cross-default for the payment of any other indebtedness of at least $2 million; |
• | bankruptcy or insolvency; |
• | judgments against us or our subsidiaries, in excess of $2 million, that are not stayed; |
• | certain ERISA events involving us or our subsidiaries; and |
• | a change in control (as defined in the revolving credit facility), including the ownership by a “person” or “group” (as defined under the Securities and Exchange Act of 1934, as amended, but excluding certain permitted stockholders) directly or indirectly, of more than 35% of our common stock, other than certain of our current stockholders. |
As of December 31, 2016, and through the filing date of this report, we were no longer in compliance with our minimum interest coverage ratio requirement allowing the applicable lenders to give notice of acceleration as a result of this non-compliance. As of December 31, 2016, the Company had not received a notice of acceleration. Upon filing for bankruptcy, the Company was granted a stay from creditors exercising any remedy efforts. The Company and its lenders have negotiated the terms of a revised revolving credit facility that would become effective upon our emergence from bankruptcy.
Contractual Obligations
70
We have the following contractual obligations and commitments as of December 31, 2016:
Less than | More than | |||||||||||||||||||
Total | 1 Year | 1 - 3 Years | 3 - 5 Years | 5 Years | ||||||||||||||||
(in thousands) | ||||||||||||||||||||
Contractual Obligation | ||||||||||||||||||||
Senior Notes | $ | 800,000 | $ | — | $ | — | $ | 500,000 | $ | 300,000 | ||||||||||
Interest on Senior Notes(1) | 249,829 | 51,000 | 102,000 | 78,094 | 18,735 | |||||||||||||||
Revolving credit facility(2) | 191,667 | 191,667 | — | — | — | |||||||||||||||
Delivery commitments(3) | 437,069 | 89,611 | 179,222 | 99,250 | 68,986 | |||||||||||||||
Operating leases(3) | 10,725 | 2,767 | 5,659 | 2,299 | — | |||||||||||||||
Asset retirement obligations(4) | 136,971 | 2,673 | 3,724 | 7,909 | 122,665 | |||||||||||||||
Total | $ | 1,826,261 | $ | 337,718 | $ | 290,605 | $ | 687,552 | $ | 510,386 | ||||||||||
___________________
(1) | Amounts represent the interest to be paid on the Company's Senior Notes up through their contractual maturities of 2021 and 2023. |
(2) | The revolving credit facility matures in September 2017. |
(3) | The Company has two purchase and transportation agreements, one of which has been terminated and the other's terms have been amended subsequent to year end and subject to confirmation. Please refer to Note 8 - Commitments and Contingencies to our consolidated financial statements for additional discussion on these agreements and for a description of our operating leases. |
(4) | Amounts represent our estimated future retirement obligations on an undiscounted basis. The discounted obligations are recorded as liabilities on our accompanying balance sheets as of December 31, 2016. Because these costs typically extend many years into the future, management prepares estimates and makes judgments that are subject to future revisions based upon numerous factors. Please see Note 11 - Asset Retirement Obligation, for additional discussion. |
Critical Accounting Policies and Estimates
The discussion and analysis of our financial condition and results of operations are based upon our consolidated financial statements, which have been prepared in accordance with accounting principles generally accepted in the United States. The preparation of our financial statements requires us to make estimates and assumptions that affect the reported amounts of assets, liabilities, revenues and expenses and related disclosure of contingent assets and liabilities. Certain accounting policies involve judgments and uncertainties to such an extent that there is reasonable likelihood that materially different amounts could have been reported under different conditions, or if different assumptions had been used. We evaluate our estimates and assumptions on a regular basis. We base our estimates on historical experience and various other assumptions that are believed to be reasonable under the circumstances, the results of which form the basis for making judgments about the carrying values of assets and liabilities that are not readily apparent from other sources. Actual results may differ from these estimates and assumptions used in preparation of our consolidated financial statements. We provide expanded discussion of our more significant accounting policies, estimates and judgments below. We believe these accounting policies reflect our more significant estimates and assumptions used in preparation of our consolidated financial statements. See Note 1 - Summary of Significant Accounting Policies to our audited consolidated financial statements for a discussion of additional accounting policies and estimates made by management.
Method of accounting for oil and natural gas properties
Oil and natural gas exploration and development activities are accounted for using the successful efforts method. Under this method, all property acquisition costs and costs of exploratory and development wells are capitalized at cost when incurred, pending determination of whether the well has found proved reserves. If an exploratory well does not find proved reserves, the costs of drilling the well are charged to expense. The costs of development wells are capitalized whether productive or nonproductive. All capitalized well costs and other associated costs and leasehold costs of proved properties are amortized on a unit-of-production basis over the remaining life of proved developed reserves and proved reserves, respectively.
Costs of retired, sold or abandoned properties that constitute a part of an amortization base (partial field) are charged or credited, net of proceeds, to accumulated depreciation, depletion and amortization unless doing so significantly affects the unit-of-production amortization rate for an entire field, in which case a gain or loss is recognized currently. Gains or losses from the disposal of properties are recognized currently.
71
Expenditures for maintenance, repairs and minor renewals necessary to maintain properties in operating condition are expensed as incurred. Major betterments, replacements and renewals are capitalized to the appropriate property and equipment accounts. Estimated dismantlement and abandonment costs for oil and natural gas properties are capitalized, net of salvage, at their estimated net present value and amortized on a unit-of-production basis over the remaining life of the related proved developed reserves.
Unproved properties consist of costs incurred to acquire unproved leases, or lease acquisition costs. Unproved lease acquisition costs are capitalized until the leases expire or when we specifically identify leases that will revert to the lessor, at which time we expense the associated unproved lease acquisition costs. The expensing or expiration of unproved lease acquisition costs are recorded as abandonment or impairment of unproved properties in the statements of operations and comprehensive income in our consolidated financial statements. Lease acquisition costs related to successful exploratory drilling are reclassified to proved properties and depleted on a unit-of-production basis.
For sales of entire working interests in unproved properties, gain or loss is recognized to the extent of the difference between the proceeds received and the net carrying value of the property. Proceeds from sales of partial interests in unproved properties are accounted for as a recovery of costs unless the proceeds exceed the entire cost of the property.
Oil and natural gas reserve quantities and Standardized Measure
Our internal corporate reservoir engineering group prepares, and our third-party petroleum consultant audits our estimates of oil and natural gas reserves and associated future net revenues. While the SEC has adopted rules which allow us to disclose proved, probable and possible reserves, we have elected to disclose only proved reserves in this Annual Report on Form 10-K. The SEC’s revised rules define proved reserves as the quantities of oil and gas, which, by analysis of geoscience and engineering data, can be estimated with reasonable certainty to be economically producible - from a given date forward, from known reservoirs, and under existing economic conditions, operating methods, and government regulations - prior to the time at which contracts providing the right to operate expire, unless evidence indicates that renewal is reasonably certain, regardless of whether deterministic or probabilistic methods are used for the estimation. The project to extract the hydrocarbons must have commenced or the operator must be reasonably certain that it will commence the project within a reasonable time. Our internal corporate reservoir engineering group and our third party petroleum consultant must make a number of subjective assumptions based on their professional judgment in developing reserve estimates. Reserve estimates are updated annually and consider recent production levels and other technical information about each field. Oil and natural gas reserve engineering is a subjective process of estimating underground accumulations of oil and natural gas that cannot be precisely measured. The accuracy of any reserve estimate is a function of the quality of available data and of engineering and geological interpretation and judgment.
Periodic revisions to the estimated reserves and future cash flows may be necessary as a result of a number of factors, including reservoir performance, new drilling, oil and natural gas prices, cost changes, technological advances, new geological or geophysical data, or other economic factors. Accordingly, reserve estimates are generally different from the quantities of oil and natural gas that are ultimately recovered. We cannot predict the amounts or timing of future reserve revisions. If such revisions are significant, they could significantly affect future amortization of capitalized costs and result in impairment of assets that may be material.
Revenue recognition
Revenue from our interests in producing wells is recognized when the product is delivered, at which time the customer has taken title and assumed the risks and rewards of ownership, and collectability is reasonably assured. The sales prices for oil and natural gas are adjusted for transportation and other related deductions. These deductions are based on contractual or historical data and do not require significant judgment.
Subsequently, these revenue deductions are adjusted to reflect actual charges based on third-party documents. Since there is a ready market for oil and natural gas, we sell the majority of production soon after it is produced at various locations.
Impairment of proved properties
We review our proved oil and natural gas properties for impairment whenever events and circumstances indicate that a decline in the recoverability of their carrying value may have occurred and at least annually. We estimate the expected undiscounted future cash flows of our oil and natural gas properties and compare such undiscounted future cash flows to the carrying amount of the oil and natural gas properties to determine if the carrying amount is recoverable. If the carrying amount exceeds the estimated undiscounted future cash flows, we will adjust the carrying amount of the oil and natural gas properties to fair value. The factors used to determine fair value are subject to our judgment and expertise and include, but are not limited to, recent sales prices of comparable properties, the present value of future cash flows, net of estimated operating and
72
development costs using estimates of proved reserves, future commodity pricing, future production estimates, anticipated capital expenditures, and various discount rates commensurate with the risk and current market conditions associated with realizing the expected cash flows projected. Because of the uncertainty inherent in these factors, we cannot predict when or if future impairment charges for proved properties will be recorded.
Impairment of unproved properties
We assess our unproved properties periodically for impairment on a property-by-property basis based on remaining lease terms, drilling results or future plans to develop acreage and record abandonment and impairment expense for any decline in value.
We have historically recognized abandonment and impairment expense for unproved properties at the time when the lease term has expired or sooner if, in management’s judgment, the unproved properties have lost some or all of their carrying value. We consider the following factors in our assessment of the impairment of unproved properties:
• | the remaining amount of unexpired term under our leases; |
• | our ability to actively manage and prioritize our capital expenditures to drill leases and to make payments to extend leases that may be closer to expiration; |
• | our ability to exchange lease positions with other companies that allow for higher concentrations of ownership and development; |
• | our ability to convey partial mineral ownership to other companies in exchange for their drilling of leases; and |
• | our evaluation of the continuing successful results from the application of completion technology in the Wattenberg Field by us or by other operators in areas adjacent to or near our unproved properties. |
The assessment of unproved properties to determine any possible impairment requires significant judgment.
Asset retirement obligations
We record the fair value of a liability for a legal obligation to retire an asset in the period in which the liability is incurred with the corresponding cost capitalized by increasing the carrying amount of the related long-lived asset. For oil and gas properties, this is the period in which the well is drilled or acquired. The asset retirement obligation (“ARO”) for oil and gas properties represents the estimated amount we will incur to plug, abandon and remediate the properties at the end of their productive lives, in accordance with applicable state laws. The liability is accreted to its present value each period and the capitalized cost is depreciated on the unit-of-production method. The accretion expense is recorded as a component of depreciation, depletion and amortization in our consolidated statements of operations and comprehensive income.
We determine the ARO by calculating the present value of estimated cash flows related to the liability. Estimating the future ARO requires management to make estimates and judgments regarding timing, existence of a liability, as well as what constitutes adequate restoration. Inherent in the fair value calculation are numerous assumptions and judgments including the ultimate costs, inflation factors, credit-adjusted discount rates, timing of settlement and changes in the legal, regulatory, environmental and political environments. To the extent future revisions to these assumptions impact the fair value of the existing ARO liability, a corresponding adjustment is made to the related asset.
Derivatives
We record all derivative instruments on the balance sheet as either assets or liabilities measured at their estimated fair value. We have not designated any derivative instruments as hedges for accounting purposes and we do not enter into such instruments for speculative trading purposes. Derivative instruments are adjusted to fair value every accounting period. Derivative cash settlements and gains and losses from valuation changes in the remaining unsettled commodity derivative instruments are reported under derivative gain (loss) in our consolidated statements of operations and comprehensive income.
Stock-based compensation
Restricted Stock Awards. We recognize compensation expense for all restricted stock awards made to employees and directors. Stock-based compensation expense is measured at the grant date based on the fair value of the award and is recognized as an expense on a straight-line basis over the requisite service period, which is generally the vesting period. The
73
fair value of restricted stock grants is based on the value of our common stock on the date of grant. Stock-based compensation expense recorded for restricted stock awards is included in general and administrative expenses on our consolidated statements of operations and comprehensive income.
Performance Stock Units. We recognize compensation expense for all performance stock unit awards made to officers. Stock-based compensation expense is measured at the grant date based on the fair value of the award and is recognized as expense on a straight-line basis over the requisite service period, which is generally the vesting period. The fair value of the performance stock unit is measured at the grant date with a stochastic process method using a Monte Carlo simulation. Stock-based compensation expense recorded for performance stock units is included in general and administrative expenses on our consolidated statements of operations and comprehensive income.
Long Term Incentive Plan Units. We recognize compensation expense for all unit awards made to employees. Stock-based compensation expense is measured at the grant date based on the fair value of the award and is recognized as an expense on a straight-line basis over the requisite service period, which is generally the vesting period. The fair value of unit awards is based on the value of our common stock on the date of grant. Stock-based compensation expense recorded for unit awards is included in general and administrative expenses on our consolidated statements of operations and comprehensive income.
Income taxes
Our provision for taxes includes both federal and state taxes. We record our federal income taxes in accordance with accounting for income taxes under GAAP which results in the recognition of deferred tax assets and liabilities for the expected future tax consequences of temporary differences between the book carrying amounts and the tax basis of assets and liabilities. Deferred tax assets and liabilities are measured using enacted tax rates expected to apply to taxable income in the years in which those temporary differences and carryforwards are expected to be recovered or settled. The effect on deferred tax assets and liabilities of a change in tax rates is recognized in income in the period that includes the enactment date. A valuation allowance would be established to reduce deferred tax assets if it is more likely than not that the related tax benefits will not be realized.
We apply significant judgment in evaluating our tax positions and estimating our provision for income taxes. During the ordinary course of business, there are many transactions and calculations for which the ultimate tax determination is uncertain. The actual outcome of these future tax consequences could differ significantly from our estimates, which could impact our financial position, results of operations and cash flows.
We also account for uncertainty in income taxes recognized in the financial statements in accordance with GAAP by prescribing a recognition threshold and measurement attribute for a tax position taken or expected to be taken in a tax return. Authoritative guidance for accounting for uncertainty in income taxes requires that we recognize the financial statement benefit of a tax position only after determining that the relevant tax authority would more likely than not sustain the position following an audit. For tax positions meeting the more-likely-than-not threshold, the amount recognized in the financial statements is the largest benefit that has a greater than 50% likelihood of being realized upon ultimate settlement with the relevant tax authority. We did not have any uncertain tax positions as of the year ended December 31, 2016.
Recent accounting pronouncements
Effective January 1, 2015, the Company adopted, on a prospective basis, Financial Accounting Standards Board ("FASB") Accounting Standards Update (“Update”) No. 2014-08 - Reporting Discontinued Operations and Disclosures of Disposals of Components of an Entity. The update was aimed at reducing the frequency of disposals reported as discontinued operations by focusing on strategic shifts that have or will have a major effect on an entity’s operations and financial results. Subsequent to adoption of this guidance, the Company determined that assets that were deemed as held for sale during 2015 did not qualify for discontinued operations. As such, the presentation within the accompanying balance sheets and the consolidated statements of operations and comprehensive income reflect them as standard assets held for sale versus our California asset sales that occurred in 2014 and 2012 that were presented as discontinued operations. For additional discussion, please refer to Note 2 - Acquisitions and Divestitures and Note 3 - Assets Held for Sale.
Effective January 1, 2016, the Company adopted, on a retrospective basis, FASB Update No. 2015-02, Consolidation (Topic 810): Amendments to the Consolidation Analysis. This updated clarifies the consolidation reporting guidance in GAAP. There was no impact to the Company’s financial statements or disclosures from the adoption of this standard.
On January 1, 2016, the Company adopted FASB Update No. 2015 -03 - Interest - Imputation of Interest - Simplifying the Presentation of Debt Issuance Costs and Update No. 2015-15, Interest - Imputation of Interest - Presentation and
74
Subsequent Measurement of Debt Issuance Costs Associated with Line-of-Credit Arrangements on a retrospective basis. These updates require capitalized debt issuance costs, except for those related to revolving credit facilities, to be presented in the balance sheet as a direct deduction from the carrying amount of the related debt liability, rather than as an asset. The adoption resulted in a reclassification that reduced other noncurrent assets and senior notes - current portion by $11.5 million as of December 31, 2016 and reduced other noncurrent assets and long-term debt by $13.7 million on the accompanying balance sheets as of December 31, 2015.
Effective December 31, 2016, the Company adopted FASB Updated No. 2014-15, Presentation of Financial Statements-Going Concern (Subtopic 205-40): Disclosure of Uncertainties about an Entity’s Ability to Continue as a Going Concern. This update requires management to evaluate whether there are conditions or events that raise substantial doubt about an entity’s ability to continue as a going concern within one year after the date that the entity’s financial statements are issued, or within one year after the date the entity’s financial statements are available to be issued, and to provide disclosures when certain criteria are met. The Company is a going concern uncertainty and applied this authoritative guidance throughout this Annual Report on Form 10-K. Please see Note 1 - Summary of Significant Accounting Policies in Part II, Item 8 of this Annual Report on Form 10-K for additional discussion.
In May 2014, the FASB issued Update No. 2014-09, Revenue from Contracts with Customers (Topic 606) (“Update 2014-09”) for the recognition of revenue from contracts with customers. Subsequent to the issuance of this Update, the FASB issued additional related Updates as follows:
• | In August 2015, the FASB issued Update No. 2015-14, Revenue from Contracts with Customers (Topic 606): Deferral of the Effective Date. This update deferred the effective date of Update 2014-09 by one year. |
• | In March 2016, the FASB issued Update No. 2016-08, Revenue from Contracts with Customers (Topic 606): Principal versus Agent Considerations (Reporting Revenue Gross versus Net). This update amends the principal versus agent guidance in Update No. 2014-09. |
• | In April 2016, the FASB issued Update No. 2016-10, Revenue from Contracts with Customers (Topic 606): Identifying Performance Obligations and Licensing. This update amends the identification of performance obligations and accounting for licenses in Update 2014-09. |
• | In May 2016, the FASB issued Update No. 2016-12, Revenue from Contracts with Customers (Topic 606): Narrow-Scope Improvements and Practical Expedients. This update amends certain issues in Update 2014-09 on transition, collectibility, noncash consideration, and the presentation of sales taxes and other similar taxes. |
• | In May 2016, the FASB issued Update No. 2016-12, Revenue from Contracts with Customers (Topic 606): Narrow-Scope Improvements and Practical Expedients. This update amends certain issues in Update 2014-09 on transition, collectibility, noncash consideration, and the presentation of sales taxes and other similar taxes. |
• | In December 2016, the FASB issued Update No. 2016-20, Technical Corrections and Improvements to Topic 606, Revenue from Contracts with Customers. This update is meant to improve and clarify or to correct unintended application of narrow aspects of the guidance in Update 2014-09. |
Update 2014-09 and each update have the same effective date and transition requirements. That is, the guidance under these standards is to be applied using a full retrospective method or a modified retrospective method, as outlined in Update 2014-09, and is effective for annual periods, and interim periods within those annual periods, beginning after December 15, 2017. Early adoption is permitted only for annual periods, and interim periods within those annual periods, beginning after December 15, 2016. The Company is currently evaluating the provisions of each of these standards, analyzing their impact on the Company’s contract portfolio, reviewing current accounting policies and practices to identify potential differences that would result from applying the requirements of these standards to the Company’s revenue contracts, and assessing their potential impact on the Company’s financial statements and disclosures. The Company currently plans to apply the modified retrospective method upon adoption and plans to adopt the guidance on the effective date of January 1, 2018.
In July 2015, the FASB issued Update No. 2015-11 - Inventory. The update requires that inventory be measured at the lower of cost or net realizable value. This authoritative guidance is effective for fiscal years beginning after December 15, 2016 and interim periods within those fiscal years. The Company has evaluated the provisions of this guidance and determined that it will not have a material effect on the Company’s financial statements or disclosures.
75
In November 2015, the FASB issued Update No. 2015-17 - Income Taxes to simplify the presentation of deferred income taxes by classifying deferred tax assets and liabilities as noncurrent only. The new guidance is effective for annual periods, and interim periods within those annual periods, beginning after December 15, 2016. Early application is permitted. The Company has evaluated the provisions of this guidance and determined it will not have a material effect on the Company’s financial statements and disclosures.
In January 2016, the FASB issued Update No. 2016-01 – Financial Instruments - Overall to require separate presentation of financial assets and financial liabilities by measurement category and form of financial asset on the balance sheet or the accompanying notes to the financial statements. This authoritative guidance is effective for fiscal years beginning after December 15, 2017 and interim periods within those fiscal years. The Company is currently evaluating the provisions of this guidance and assessing its impact, but does not currently believe it will have a material effect on the Company’s financial statements or disclosures.
In February 2016, the FASB issued Update No. 2016-02 – Leases to increase transparency and comparability among organizations by recognizing lease assets and lease liabilities on the balance sheet and disclosing key information about leasing arrangements. This authoritative guidance is effective for fiscal years beginning after December 15, 2018 and interim periods within those fiscal years. The Company is currently evaluating the provisions of this guidance and assessing its impact, but does not currently believe it will have a material effect on the Company’s financial statements or disclosures.
In March 2016, the FASB issued Update No. 2016-09 – Compensation - Stock Compensation. The update simplifies several aspects of the accounting for share-based payment transactions, including the income tax consequences, classification of awards as either equity or liabilities, and classification on the statement of cash flows. This authoritative guidance is effective for fiscal years beginning after December 15, 2016 and interim periods within those fiscal years. The Company has evaluated the provisions of this guidance and concluded that it will not have a material effect on the Company’s financial statements or disclosures.
In August 2016, the FASB issued Update No. 2016-15 – Classification of Certain Cash Receipts and Cash Payments, which clarifies the presentation of specific cash receipts and cash payments within the statement of cash flows. This authoritative accounting guidance is effective for annual periods, and interim periods within those annual periods, beginning after December 15, 2017. The Company is currently evaluating the provisions of this guidance and assessing its impact, but does not currently believe it will have a material effect on the Company’s financial statements or disclosures.
In November 2016, the FASB issued Update No. 2016-18, Statement of Cash Flows (Topic 230): Restricted Cash. This update clarifies how entities should present restricted cash and restricted cash equivalents in the statement of cash flows. This guidance is to be applied using a retrospective method and is effective for annual periods, and interim periods within those annual periods, beginning after December 15, 2017. Early adoption is permitted. The Company is currently evaluating the provisions of this guidance and assessing its potential impact on the Company’s financial statements and disclosures.
In January 2017, the FASB issued Update No. 2017-01, Business Combinations (Topic 805): Clarifying the Definition of a Business. This update clarifies the definition of a business with the objective of adding guidance to assist entities with evaluating whether transactions should be accounted for as acquisitions (or disposals) of assets or businesses. This guidance is to be applied using a prospective method and is effective for annual periods, and interim periods within those annual periods, beginning after December 15, 2017. Early adoption is permitted. The Company is currently evaluating the provisions of this guidance and assessing its potential impact on the Company’s financial statements and disclosures.
In February 2017, the FASB issued Update No. 2017-05, Other Income-Gains and Losses from the Derecognition of Nonfinancial Assets (Subtopic 610-20): Clarifying the Scope of Asset Derecognition Guidance and Accounting for Partial Sales of Nonfinancial Assets. This update is meant to clarify the scope of ASC Subtopic 610-20, Other Income-Gains and Losses from the Derecognition of Nonfinancial Assets and to add guidance for partial sales of nonfinancial assets. This guidance is to be applied using a full retrospective method or a modified retrospective method as outlined in the guidance and is effective at the same time as Update 2014-09. Further, the Company is required to adopt this guidance at the same time that it adopts the guidance in Update 2014-09. The Company is currently evaluating the provisions of this guidance and assessing its potential impact on the Company’s financial statements and disclosures.
There are no other accounting standards applicable to the Company that would have a material effect on the Company’s financial statements and disclosures that have been issued but not yet adopted by the Company as of December 31, 2016, and through the filing date of this report.
76
Effects of Inflation and Pricing
Inflation in the United States increased to 2.2% in 2016 from 2.0% in 2015 and from 1.3% in 2014, which did not have a material impact on our results of operations for the periods ended December 31, 2016, 2015 and 2014. Although the impact of inflation has been relatively insignificant in recent years, it is still a factor in the United States economy and we tend to experience inflationary pressure on the cost of oilfield services and equipment as increasing oil and gas prices increase drilling activity in our areas of operations. Material changes in prices also impact the current revenue stream, estimates of future reserves, borrowing base calculations, depletion expense, impairment assessments of oil and gas properties, ARO, and values of properties in purchase and sale transactions. Material changes in prices can impact the value of oil and gas companies and their ability to raise capital, borrow money and retain personnel.
Off-Balance Sheet Arrangements
Currently, we do not have any off-balance sheet arrangements.
Item 7A. Quantitative and Qualitative Disclosures About Market Risks.
Oil and Natural Gas Price Risk
Our financial condition, results of operations and capital resources are highly dependent upon the prevailing market prices of oil and natural gas. These commodity prices are subject to wide fluctuations and market uncertainties due to a variety of factors that are beyond our control. Factors influencing oil and natural gas prices include the level of global demand for oil and natural gas, the global supply of oil and natural gas, the establishment of and compliance with production quotas by oil exporting countries, weather conditions which determine the demand for natural gas, the price and availability of alternative fuels, local and global politics, and overall economic conditions. It is impossible to predict future oil and natural gas prices with any degree of certainty. Sustained weakness in oil and natural gas prices may adversely affect our financial condition and results of operations, and may also reduce the amount of oil and natural gas reserves that we can produce economically. Any reduction in our oil and natural gas reserves, including reductions due to price fluctuations, can have an adverse effect on our ability to obtain capital for our exploration and development activities. Similarly, any improvements in oil and natural gas prices can have a favorable impact on our financial condition, results of operations and capital resources. If oil and natural gas SEC prices declined by 10% then our proved reserve volumes would decrease by 8% and our PV-10 value as of December 31, 2016 would decrease by approximately 42% or $116.2 million. The PV-10 value of our Rocky Mountain region, primarily our Wattenberg assets, would decrease by 48% or $97.5 million.
PV-10 is a non-GAAP financial measure. Please refer to Estimated Proved Reserves under Part I, Item 1 of this Annual Report on Form 10-K for management's discussion of this non-GAAP financial measure.
In the past, we have entered into various types of derivative instruments, including commodity price swaps, costless collars, put options, and basis protection swaps to mitigate a portion of our exposure to fluctuations in commodity prices. Our debt defaults and the commencement of our Chapter 11 Cases were events of default under our derivative master agreements thereby providing our derivative counterparties the right to terminate all our derivative positions. As a result, all derivative positions were terminated in the fourth quarter of 2016.
Interest Rates
At December 31, 2016 and through the filing date of this report we had $191.7 million outstanding under our revolving credit facility. Borrowings under our revolving credit facility bear interest at a fluctuating rate that is tied to an adjusted Base Rate or LIBOR, at our option. Any increases in these interest rates can have an adverse impact on our results of operations and cash flow. As of December 31, 2016 and through the filing date of this report, the Company was and is in default and currently bears interest on the amount drawn at the Bank Prime Rate plus the utilization margin plus a 2% fee.
Counterparty and Customer Credit Risk
In connection with our derivatives activity, we have exposure to financial institutions in the form of derivative transactions. We do not currently have any derivative instruments in place, however, we expect that any future derivative transactions we enter into will be with lenders under our credit facility that will carry an investment grade credit rating.
We are also subject to credit risk due to concentration of our oil and natural gas receivables with certain significant customers. Please refer to the section titled Principal Customers under Part I, Item 1 of this Annual Report on Form 10-K for further details about our significant customers. The inability or failure of our significant customers to meet their obligations to
77
us or their insolvency or liquidation may adversely affect our financial results. We review the credit rating, payment history and financial resources of our customers, but we do not require our customers to post collateral.
Marketability of Our Production
The marketability of our production from the Mid-Continent and Rocky Mountain regions depends in part upon the availability, proximity and capacity of third-party refineries, access to regional trucking, pipeline and rail infrastructure, natural gas gathering systems and processing facilities. We deliver crude oil and natural gas produced from these areas through trucking services, pipelines and rail facilities that we do not own. The lack of availability or capacity on these systems and facilities could reduce the price offered for our production or result in the shut-in of producing wells or the delay or discontinuance of development plans for properties.
A portion of our production may also be interrupted, or shut in, from time to time for numerous other reasons, including as a result of accidents, field labor issues or strikes, or we might voluntarily curtail production in response to market conditions. If a substantial amount of our production is interrupted at the same time, it could adversely affect our cash flow.
Currently, there are no natural gas pipeline systems that service wells in the North Park Basin, which is prospective for the Niobrara shale. In addition, we are not aware of any plans to construct a facility necessary to process natural gas produced from this basin. If neither we nor a third-party constructs the required pipeline system and processing facility, we may not be able to fully test or develop our resources in the North Park Basin.
78
Item 8. Financial Statements and Supplementary Data
REPORT OF INDEPENDENT REGISTERED PUBLIC ACCOUNTING FIRM
To the Board of Directors and Stockholders
Bonanza Creek Energy, Inc.
We have audited the accompanying consolidated balance sheets of Bonanza Creek Energy, Inc. and subsidiaries as of December 31, 2016 and 2015, and the related consolidated statements of operations and comprehensive income, stockholders’ equity and cash flows for each of the three years in the period ended December 31, 2016. These financial statements are the responsibility of the Company’s management. Our responsibility is to express an opinion on these financial statements based on our audits.
We conducted our audits in accordance with the standards of the Public Company Accounting Oversight Board (United States). Those standards require that we plan and perform the audit to obtain reasonable assurance about whether the financial statements are free of material misstatement. An audit includes examining, on a test basis, evidence supporting the amounts and disclosures in the financial statements. An audit also includes assessing the accounting principles used and significant estimates made by management, as well as evaluating the overall financial statement presentation. We believe that our audits provide a reasonable basis for our opinion.
In our opinion, the consolidated financial statements referred to above present fairly, in all material respects, the financial position of Bonanza Creek Energy, Inc. and subsidiaries as of December 31, 2016 and 2015, and the results of their operations and their cash flows for each of the three years in the period ended December 31, 2016, in conformity with U.S. generally accepted accounting principles.
The accompanying financial statements have been prepared assuming that the Company will continue as a going concern. As discussed in Note 1 to the financial statements, the Company suffered a significant deterioration in liquidity during 2016, and filed for bankruptcy under Chapter 11 of the Bankruptcy Code on January 4, 2017. This raises substantial doubt about the Company’s ability to continue as a going concern. Management’s plans in regard to these matters are also described in Note 1. The financial statements do not include any adjustments that might result from the outcome of this uncertainty.
We have also audited, in accordance with the standards of the Public Company Accounting Oversight Board (United States), Bonanza Creek Energy, Inc.’s and subsidiaries’ internal control over financial reporting as of December 31, 2016, based on criteria established in Internal Control - Integrated Framework issued by the Committee of Sponsoring Organizations of the Treadway Commission in 2013, and our report dated March 15, 2017 expressed an unqualified opinion on the effectiveness of Bonanza Creek Energy, Inc.’s internal control over financial reporting.
Hein & Associates LLP
Denver, Colorado
March 15, 2017
79
BONANZA CREEK ENERGY, INC. AND SUBSIDIARIES
CONSOLIDATED BALANCE SHEETS
As of December 31, | |||||||
2016 | 2015 | ||||||
(in thousands, except share data) | |||||||
ASSETS | |||||||
Current assets: | |||||||
Cash and cash equivalents | $ | 80,565 | $ | 21,341 | |||
Accounts receivable: | |||||||
Oil and gas sales | 14,479 | 25,322 | |||||
Joint interest and other | 6,784 | 31,224 | |||||
Prepaid expenses and other | 5,915 | 4,078 | |||||
Inventory of oilfield equipment | 4,685 | 8,543 | |||||
Derivative asset | — | 29,566 | |||||
Total current assets | 112,428 | 120,074 | |||||
Property and equipment (successful efforts method), at cost: | |||||||
Proved properties | 2,525,587 | 1,618,970 | |||||
Less: accumulated depreciation, depletion and amortization | (1,694,483 | ) | (943,081 | ) | |||
Total proved properties, net | 831,104 | 675,889 | |||||
Unproved properties | 163,369 | 185,530 | |||||
Wells in progress | 18,250 | 51,196 | |||||
Oil and gas properties held for sale, net of accumulated depreciation, depletion and amortization of $636,917 in 2015 (note 3) | — | 214,922 | |||||
Other property and equipment, net of accumulated depreciation of $11,206 in 2016 and $9,407 in 2015 | 6,245 | 9,729 | |||||
Total property and equipment, net | 1,018,968 | 1,137,266 | |||||
Other noncurrent assets | 3,082 | 2,301 | |||||
Total assets | $ | 1,134,478 | $ | 1,259,641 | |||
LIABILITIES AND STOCKHOLDERS’ EQUITY | |||||||
Current liabilities: | |||||||
Accounts payable and accrued expenses (note 6) | $ | 61,328 | $ | 96,360 | |||
Oil and gas sales distribution payable | 23,773 | 27,613 | |||||
Contractual obligation for land acquisition | — | 12,000 | |||||
Revolving credit facility - current portion (note 7) | 191,667 | — | |||||
Senior Notes - current portion (note 7) | 793,698 | — | |||||
Total current liabilities | 1,070,466 | 135,973 | |||||
Long-term liabilities: | |||||||
Long-term debt (note 7) | — | 871,666 | |||||
Ad valorem taxes | 14,118 | 17,069 | |||||
Asset retirement obligations for oil and gas properties | 30,833 | 14,935 | |||||
Asset retirement obligations for oil and gas properties assets held for sale | — | 10,591 | |||||
Total liabilities | 1,115,417 | 1,050,234 | |||||
Commitments and contingencies (note 8) | |||||||
Stockholders’ equity: | |||||||
Preferred stock, $.001 par value, 25,000,000 shares authorized, none outstanding | — | — | |||||
Common stock, $.001 par value, 225,000,000 shares authorized, 49,660,683 and 49,754,408 issued and outstanding in 2016 and 2015, respectively | 49 | 49 | |||||
Additional paid-in capital | 814,990 | 806,386 | |||||
Retained deficit | (795,978 | ) | (597,028 | ) | |||
Total stockholders’ equity | 19,061 | 209,407 | |||||
Total liabilities and stockholders’ equity | $ | 1,134,478 | $ | 1,259,641 | |||
The accompanying notes are an integral part of these consolidated financial statements
80
BONANZA CREEK ENERGY, INC. AND SUBSIDIARIES
CONSOLIDATED STATEMENTS OF OPERATIONS AND COMPREHENSIVE INCOME
For the Years Ended December 31, | ||||||||||||
2016 | 2015 | 2014 | ||||||||||
(in thousands, except per share data) | ||||||||||||
Operating net revenues: | ||||||||||||
Oil and gas sales | $ | 195,295 | $ | 292,679 | $ | 558,633 | ||||||
Operating expenses: | ||||||||||||
Lease operating expense | 43,671 | 65,038 | 59,884 | |||||||||
Gas plant and midstream operating expense | 12,826 | 11,368 | 12,527 | |||||||||
Severance and ad valorem taxes | 15,304 | 18,629 | 50,430 | |||||||||
Exploration | 946 | 15,827 | 5,346 | |||||||||
Depreciation, depletion and amortization | 111,215 | 244,921 | 228,789 | |||||||||
Impairment of oil and gas properties | 10,000 | 740,478 | 167,592 | |||||||||
Abandonment and impairment of unproved properties | 24,692 | 33,543 | — | |||||||||
Unused commitments | 7,686 | — | — | |||||||||
Contract settlement expense (note 8) | 21,000 | — | — | |||||||||
General and administrative expense (including $8,892, $14,552, and $20,716, respectively, of stock-based compensation) | 77,065 | 70,319 | 81,571 | |||||||||
Total operating expenses | 324,405 | 1,200,123 | 606,139 | |||||||||
Loss from operations | (129,110 | ) | (907,444 | ) | (47,506 | ) | ||||||
Other income (expense): | ||||||||||||
Derivative gain (loss) | (11,234 | ) | 56,558 | 121,615 | ||||||||
Interest expense | (62,058 | ) | (57,052 | ) | (46,447 | ) | ||||||
Gain on termination fee (note 3) | 6,000 | — | — | |||||||||
Other income (loss) | (2,548 | ) | (2,503 | ) | 345 | |||||||
Total other income (expense) | (69,840 | ) | (2,997 | ) | 75,513 | |||||||
Income (loss) from continuing operations before taxes | (198,950 | ) | (910,441 | ) | 28,007 | |||||||
Current income tax expense (note 10) | — | (773 | ) | (149 | ) | |||||||
Deferred income tax benefit (expense) (note 10) | — | 165,667 | (10,876 | ) | ||||||||
Income (loss) from continuing operations | $ | (198,950 | ) | $ | (745,547 | ) | $ | 16,982 | ||||
Discontinued operations: | ||||||||||||
Loss from operations associated with oil and gas properties | — | — | (85 | ) | ||||||||
Gain on sale of oil and gas properties | — | — | 5,496 | |||||||||
Income tax expense | — | — | (2,110 | ) | ||||||||
Gain from discontinued operations | — | — | 3,301 | |||||||||
Net income (loss) | $ | (198,950 | ) | $ | (745,547 | ) | $ | 20,283 | ||||
Comprehensive income (loss) | $ | (198,950 | ) | $ | (745,547 | ) | $ | 20,283 | ||||
Basic income (loss) per share: | ||||||||||||
Income (loss) from continuing operations | $ | (4.04 | ) | $ | (15.57 | ) | $ | 0.42 | ||||
Income from discontinued operations | $ | — | $ | — | $ | 0.08 | ||||||
Net income (loss) per common share | $ | (4.04 | ) | $ | (15.57 | ) | $ | 0.50 | ||||
Diluted income (loss) per share: | ||||||||||||
Income (loss) from continuing operations | $ | (4.04 | ) | $ | (15.57 | ) | $ | 0.41 | ||||
Income from discontinued operations | $ | — | $ | — | $ | 0.08 | ||||||
Net income (loss) per common share | $ | (4.04 | ) | $ | (15.57 | ) | $ | 0.49 | ||||
Basic weighted-average common shares outstanding | 49,268 | 47,874 | 40,139 | |||||||||
Diluted weighted-average common shares outstanding | 49,268 | 47,874 | 40,290 | |||||||||
The accompanying notes are an integral part of these consolidated financial statements
81
BONANZA CREEK ENERGY, INC. AND SUBSIDIARIES
CONSOLIDATED STATEMENTS OF STOCKHOLDERS’ EQUITY
Additional | |||||||||||||||||||
Common Stock | Paid-In | Retained | |||||||||||||||||
Shares | Amount | Capital | Earnings | Total | |||||||||||||||
(in thousands, except share data) | |||||||||||||||||||
Balances, January 1, 2014 | 40,285,919 | $ | 40 | $ | 527,752 | $ | 128,236 | $ | 656,028 | ||||||||||
Restricted common stock issued, net of excess income tax benefit | 309,458 | — | — | — | — | ||||||||||||||
Restricted common stock forfeited | (31,597 | ) | — | — | — | — | |||||||||||||
Restricted stock used for tax withholdings | (130,002 | ) | — | (6,007 | ) | — | (6,007 | ) | |||||||||||
Stock-based compensation | — | — | 20,716 | — | 20,716 | ||||||||||||||
Stock Issued upon acquisition of oil and gas properties | 853,492 | 1 | 49,050 | — | 49,051 | ||||||||||||||
Net income | — | — | — | 20,283 | 20,283 | ||||||||||||||
Balances, December 31, 2014 | 41,287,270 | $ | 41 | $ | 591,511 | $ | 148,519 | $ | 740,071 | ||||||||||
Restricted common stock issued, | 601,282 | 1 | — | — | 1 | ||||||||||||||
Restricted common stock forfeited | (123,574 | ) | (1 | ) | — | — | (1 | ) | |||||||||||
Restricted stock used for tax withholdings | (108,070 | ) | — | (2,683 | ) | — | (2,683 | ) | |||||||||||
Issuance of common stock | 47,500 | — | 326 | — | 326 | ||||||||||||||
Sale of common stock | 8,050,000 | 8 | 202,680 | — | 202,688 | ||||||||||||||
Stock-based compensation | — | — | 14,552 | — | 14,552 | ||||||||||||||
Net loss | — | — | — | (745,547 | ) | (745,547 | ) | ||||||||||||
Balances, December 31, 2015 | 49,754,408 | $ | 49 | $ | 806,386 | $ | (597,028 | ) | $ | 209,407 | |||||||||
Restricted common stock issued | 154,656 | 2 | — | — | 2 | ||||||||||||||
Restricted common stock forfeited | (120,477 | ) | (1 | ) | — | — | (1 | ) | |||||||||||
Restricted stock used for tax withholdings | (127,904 | ) | (1 | ) | (288 | ) | — | (289 | ) | ||||||||||
Stock-based compensation | — | — | 8,892 | — | 8,892 | ||||||||||||||
Net loss | — | — | — | (198,950 | ) | (198,950 | ) | ||||||||||||
Balances, December 31, 2016 | 49,660,683 | $ | 49 | $ | 814,990 | $ | (795,978 | ) | $ | 19,061 | |||||||||
The accompanying notes are an integral part of these consolidated financial statements
82
BONANZA CREEK ENERGY, INC. AND SUBSIDIARIES
CONSOLIDATED STATEMENTS OF CASH FLOWS
For the Years Ended December 31, | |||||||||||
2016 | 2015 | 2014 | |||||||||
(in thousands) | |||||||||||
Cash flows from operating activities: | |||||||||||
Net income (loss) | $ | (198,950 | ) | $ | (745,547 | ) | $ | 20,283 | |||
Adjustments to reconcile net income (loss) to net cash provided by operating activities: | |||||||||||
Depreciation, depletion and amortization | 111,215 | 244,921 | 228,856 | ||||||||
Deferred income tax (benefit) expense | — | (165,667 | ) | 12,986 | |||||||
Impairment of oil and gas properties | 10,000 | 740,478 | 167,592 | ||||||||
Abandonment and impairment of unproved properties | 24,692 | 33,543 | — | ||||||||
Dry hole expense | 872 | 5,630 | — | ||||||||
Stock-based compensation | 8,892 | 14,552 | 20,716 | ||||||||
Amortization of deferred financing costs and debt premium | 3,180 | 2,280 | 1,588 | ||||||||
Accretion of contractual obligation for land acquisition | — | 814 | 1,153 | ||||||||
Derivative (gain) loss | 11,234 | (56,558 | ) | (121,615 | ) | ||||||
Derivative cash settlements | 18,333 | 130,996 | 12,238 | ||||||||
Gain on sale of oil and gas properties | — | — | (5,322 | ) | |||||||
Inventory adjustments | 4,390 | — | — | ||||||||
Other | (323 | ) | 1,429 | (12 | ) | ||||||
Changes in current assets and liabilities: | |||||||||||
Accounts receivable | 35,282 | 35,230 | (21,376 | ) | |||||||
Prepaid expenses and other assets | (1,838 | ) | 8,444 | (10,884 | ) | ||||||
Accounts payable and accrued liabilities | (11,616 | ) | (23,655 | ) | 35,392 | ||||||
Settlement of asset retirement obligations | (800 | ) | (867 | ) | (1,637 | ) | |||||
Net cash provided by operating activities | 14,563 | 226,023 | 339,958 | ||||||||
Cash flows from investing activities: | |||||||||||
Acquisition of oil and gas properties | (98 | ) | (16,270 | ) | (179,566 | ) | |||||
Deposits for acquisitions | — | 1,549 | (1,549 | ) | |||||||
Proceeds from sale of oil and gas properties | — | — | 6,700 | ||||||||
Payments of contractual obligation | (12,000 | ) | (12,000 | ) | (12,000 | ) | |||||
Exploration and development of oil and gas properties | (52,344 | ) | (425,918 | ) | (641,204 | ) | |||||
Natural gas plant capital expenditures | — | (112 | ) | (282 | ) | ||||||
(Increase) decrease in restricted cash | (2,613 | ) | 2,987 | (3,062 | ) | ||||||
Additions to property and equipment - non oil and gas | (346 | ) | (2,809 | ) | (6,269 | ) | |||||
Net cash used in investing activities | (67,401 | ) | (452,573 | ) | (837,232 | ) | |||||
Cash flows from financing activities: | |||||||||||
Proceeds from credit facility | 209,000 | 137,000 | 263,000 | ||||||||
Payments to credit facility | (96,333 | ) | (91,000 | ) | (230,000 | ) | |||||
Proceeds from sale of common stock | — | 209,308 | — | ||||||||
Offering costs related to sale of common stock | — | (6,620 | ) | — | |||||||
Proceeds from sale of Senior Notes | — | — | 300,000 | ||||||||
Offering costs related to sale of Senior Notes | — | (99 | ) | (7,070 | ) | ||||||
Payment of employee tax withholdings in exchange for the return of common stock | (289 | ) | (2,683 | ) | (6,007 | ) | |||||
Deferred financing costs | (316 | ) | (599 | ) | (647 | ) | |||||
Net cash provided by financing activities | 112,062 | 245,307 | 319,276 | ||||||||
Net change in cash and cash equivalents | 59,224 | 18,757 | (177,998 | ) | |||||||
Cash and cash equivalents: | |||||||||||
Beginning of period | 21,341 | 2,584 | 180,582 | ||||||||
End of period | $ | 80,565 | $ | 21,341 | $ | 2,584 | |||||
Supplemental cash flow disclosure: | |||||||||||
Cash paid for interest | $ | 58,900 | $ | 54,566 | $ | 36,325 | |||||
Stock issued for the acquisition of oil and gas properties | $ | — | $ | — | $ | 49,050 | |||||
Stock issued for litigation settlement | $ | — | $ | 326 | $ | — | |||||
83
Cash paid for income taxes | $ | — | $ | 820 | $ | 1,400 | |||||
Contractual obligation for land acquisition | $ | — | $ | 12,000 | $ | 22,033 | |||||
Changes in working capital related to exploration, development and acquisition of oil and gas properties | $ | (30,044 | ) | $ | (50,385 | ) | $ | 1,873 | |||
The accompanying notes are an integral part of these consolidated financial statements
84
BONANZA CREEK ENERGY, INC. AND SUBSIDIARIES
NOTES TO THE CONSOLIDATED FINANCIAL STATEMENTS
NOTE 1 - SUMMARY OF SIGNIFICANT ACCOUNTING POLICIES
Description of Operations
Bonanza Creek Energy, Inc. (“BCEI” or, together with its consolidated subsidiaries, the “Company”) is engaged primarily in acquiring, developing, exploiting and producing oil and gas properties. As of December 31, 2016, the Company’s assets and operations were concentrated primarily in the Wattenberg Field in Colorado and in the Dorcheat Macedonia Field in southern Arkansas.
Basis of Presentation
The consolidated balance sheets include the accounts of the Company and its wholly owned subsidiaries, Bonanza Creek Energy Operating Company, LLC, Bonanza Creek Energy Resources, LLC, Bonanza Creek Energy Upstream LLC, Bonanza Creek Energy Midstream, LLC, Holmes Eastern Company, LLC and Rocky Mountain Infrastructure, LLC. All significant intercompany accounts and transactions have been eliminated. In connection with the preparation of the consolidated financial statements, the Company evaluated subsequent events after the balance sheet date of December 31, 2016, through the filing date of this report.
Use of Estimates
The preparation of the Company’s consolidated financial statements in conformity with accounting principles generally accepted in the United States of America requires management to make estimates and assumptions that affect the reported amounts of oil and gas reserves, assets and liabilities, and disclosure of contingent assets and liabilities at the date of the balance sheet and the reported amounts of revenue and expenses during the reporting period. Actual results could differ from those estimates.
Going Concern Uncertainty
Since the first quarter of 2016, the Company’s liquidity outlook has deteriorated due to a significant reduction in operating cash flow, the Company's inability to sell assets given current market conditions and counterparty concerns about the Company's liquidity and current capital structure, borrowing base reductions that occurred during 2016, continuation of depressed commodity prices and the inability to access the debt and capital markets. In addition, the Company’s senior secured revolving credit agreement (the “revolving credit facility”) is subject to scheduled redeterminations of its borrowing base, semi-annually, as early as April and October of each year, based primarily on reserve report values using lender commodity price expectations at such time as well as other factors within the discretion of the lenders that are party to the revolving credit facility.
As a result of these and other factors, the following issues have adversely impacted the Company’s ability to continue as a going concern:
• | the Company’s ability to comply with financial covenants and ratios in its revolving credit facility and indentures has been affected by continued low commodity prices. Among other things, the Company is required under its revolving credit facility to maintain a minimum interest coverage ratio that must exceed 2.50 to 1.00 and a maximum debt ratio that must not exceed 2.50 to 1.00. Absent a waiver, amendment or forbearance agreement, failure to meet these covenants and ratios would result in an Event of Default (as defined in the revolving credit agreement) and, to the extent the applicable lenders so elect, an acceleration of the Company’s existing indebtedness. As of December 31, 2016, and through the filing date of this report, the Company was no longer in compliance with its minimum interest coverage and maximum debt ratio requirements. The Company entered into a Restructuring Support Agreement (“RSA”) on December 23, 2016 and filed for bankruptcy under Chapter 11 of the Bankruptcy Code on January 4, 2017. The applicable lenders did not elect to accelerate the Company's debt prior to filing for bankruptcy. The Company was granted an automatic stay from collection efforts upon filing for bankruptcy. Please refer to Note 19 - Subsequent Events for more on our bankruptcy proceedings; |
• | because the revolving credit facility borrowing base was reduced in May 2016 to $200.0 million, the Company was overdrawn by $88.0 million and made six mandatory monthly repayments of approximately $14.7 million. The borrowing base was further reduced on October 31, 2016 to $150.0 million, causing the Company to be overdrawn by |
85
$50.0 million, and the Company elected to make mandatory monthly repayments of $8.3 million. Due to the timing of filing for Chapter 11, the Company did not make the monthly repayment due on December 30, 2016, or any subsequent payments, and has been granted a stay from making any further deficiency payments while under the protection of Chapter 11;
• | the Company’s ability to make interest payments as they become due and repay indebtedness upon maturities is impacted by the Company’s liquidity. As of December 31, 2016, the Company faces a $41.7 million borrowing base deficiency under its revolving credit facility and has $80.6 million in cash and cash equivalents; |
• | the Company has two purchase and transportation agreements to deliver fixed determinable quantities of crude oil. The first agreement with Silo Energy, LLC (“Silo”) went into effect during the second quarter of 2015 for 12,580 barrels per day over an initial five-year term. The Company has incurred $3.4 million in minimum volume commitment deficiency payments related to this agreement as of December 31, 2016. Based on current production estimates, assuming no future drilling and completion activity, the anticipated shortfall in delivering the minimum volume commitments could result in potential deficiency payments of $44.8 million for 2017 through April 2020, when the agreement expires. Subject to bankruptcy court confirmation, the Company terminated its purchase agreement with Silo on February 1, 2017 and entered into a settlement agreement pursuant to which Silo will receive value of approximately $21.0 million. The second purchase agreement with NGL Crude Logistics, LLC (“NGL”) became effective on November 1, 2016 for 15,000 barrels per day over an initial seven-year term. Based on current production estimates at December 31, 2016, assuming no future drilling and completion activity, the anticipated shortfall in delivering the minimum volume commitments could result in potential deficiency payments of $165.2 million for 2017 through October 2023, when the second agreement expires. The NGL purchase agreement is contemplated to be amended as part of the RSA. Please refer to Note 8 - Commitments and Contingencies for additional discussion; and |
• | if the revolving credit facility is accelerated, then an Event of Default (as defined in the underlying indentures) under the Company's 6.75% Senior Notes due 2021 (“6.75% Senior Notes”) and 5.75% Senior Notes due 2023 (“5.75% Senior Notes”, and together with the 6.75% Senior Notes referred to as the “Senior Notes”) would occur. If an Event of Default occurs, the trustee or the holders of at least 25% in aggregate principal amount of the then outstanding notes, may declare the entire principal under the Senior Notes to be due and payable immediately. The revolving credit facility and Senior Notes have cross default clauses. Filing for protection under Chapter 11 of the Bankruptcy Code is an event of default under our revolving credit facility and Senior Notes. Upon filing for bankruptcy under Chapter 11, the Company was granted a stay from collection efforts. As of December 31, 2016, the revolving credit facility and Senior Notes had not been accelerated. |
Due to covenant violations, the Company classified the revolving credit facility and Senior Notes as current liabilities in the December 31, 2016 accompanying balance sheets.
The Company has taken steps to rectify its going concern uncertainty. The Company has filed for bankruptcy under Chapter 11 under the Bankruptcy Code and has entered into an RSA which if approved contemplates a $200.0 million rights offering allowing the Company to operate a one-rig program upon emergence from bankruptcy.
The significant risks and uncertainties described above raise substantial doubt about the Company’s ability to continue as a going concern. The consolidated financial statements have been prepared on a going concern basis of accounting, which contemplates continuity of operations, realization of assets, and satisfaction of liabilities and commitments in the normal course of business. The consolidated financial statements do not include any adjustments that might result from the outcome of the going concern uncertainty or the outcome of the Chapter 11 filing. There is no guarantee that post emergence from bankruptcy the Company will be a going concern.
See Note 7 - Long-Term Debt, Note 8 - Commitment and Contingencies and Note 19 - Subsequent Events for additional details about the Company’s debt, commitments and bankruptcy proceedings.
Cash and Cash Equivalents
The Company considers all highly liquid investments with original maturity dates of three months or less to be cash equivalents. The carrying value of cash and cash equivalents approximate fair value due to the short-term nature of these instruments.
86
Accounts Receivable
The Company’s accounts receivables are generated from oil and gas sales and from joint interest owners on properties that the Company operates. The Company accrues an allowance on a receivable when, based on the judgment of management, it is probable that a receivable will not be collected and the amount of any allowance may be reasonably estimated. For receivables from joint interest owners, the Company usually has the ability to withhold future revenue disbursements to satisfy the outstanding balance. The Company’s oil and gas receivables are typically collected within one to two months and the Company has experienced minimal bad debts.
Inventory of Oilfield Equipment
Inventory consists of material and supplies used in connection with the Company’s drilling program. These inventories are stated at the lower of cost or market, which approximates fair value.
Oil and Gas Producing Activities
The Company follows the successful efforts method of accounting for its oil and gas exploration and development costs. Under this method of accounting, all property acquisition costs and costs of exploratory and development wells will be capitalized at cost when incurred, pending determination of whether economically recoverable reserves have been found. If an exploratory well does not find economically recoverable reserves, the costs of drilling the well and other associated costs are charged to dry hole expense. The costs of development wells are capitalized whether the well is productive or nonproductive. Costs incurred to maintain wells and their related equipment and leases as well as operating costs are charged to expense as incurred. Geological and geophysical costs are expensed as incurred.
Depletion, depreciation and amortization (“DD&A”) of capitalized costs of proved oil and gas properties are provided for on a field-by-field basis using the units-of-production method based upon proved reserves. The computation of DD&A takes into consideration restoration, dismantlement, and abandonment costs and anticipated proceeds from salvaging equipment.
The Company assesses its proved oil and gas properties for impairment whenever events or circumstances indicate that the carrying value of the assets may not be recoverable. The impairment test compares undiscounted future net cash flows to the assets net book value. If the net capitalized costs exceed future net cash flows, then the cost of the property is written down to fair value. The factors used to determine fair value are subject to the Company’s judgment and expertise and include, but are not limited to, recent sales prices of comparable properties, the present value of future cash flows on all developed proved reserves and risk adjusted probable and possible reserves, net of estimated operating and development costs, future commodity pricing based on our internal budgeting model originating from the NYMEX strip price adjusted for basis differential, future production estimates, anticipated capital expenditures, and various discount rates commensurate with the risk and current market conditions associated with realizing the expected cash flows projected.
The Company assesses its unproved properties periodically for impairment on a property-by-property basis, which requires significant judgment. The Company considers the following factors in its assessment of the impairment of unproved properties:
• | the remaining amount of unexpired term under leases; |
• | its ability to actively manage and prioritize its capital expenditures to drill leases and to make payments to extend leases that may be closer to expiration; |
• | its ability to exchange lease positions with other companies that allow for higher concentrations of ownership and development; |
• | its ability to convey partial mineral ownership to other companies in exchange for their drilling of leases; |
• | its evaluation of the continuing successful results from the application of completion technology by the Company or by other operators in areas adjacent to or near its unproved properties; |
• | its evaluation of the current fair market value of acreage; and |
• | strategic shifts in development areas. |
87
For additional discussion, please refer to Note 4 - Impairments.
The Company records the fair value of an asset retirement obligation as an asset and a liability when there is a legal obligation associated with the retirement of a long-lived asset and the amount can be reasonably estimated. The increase in carrying value is included in proved properties in the accompanying consolidated balance sheets (“accompanying balance sheets”). For additional discussion, please refer to Note 11 - Asset Retirement Obligations.
Gains and losses arising from sales of oil and gas properties will be included in income. However, a partial sale of proved properties within an existing field that does not significantly affect the unit-of-production depletion rate will be accounted for as a normal retirement with no gain or loss recognized. The sale of a partial interest within a proved property is accounted for as a recovery of cost. The partial sale of unproved property is accounted for as a recovery of cost when there is uncertainty of the ultimate recovery of the cost applicable to the interest retained.
Natural Gas Plants
Natural gas plants are recorded at cost and are deemed part of the upstream oil and gas producing activities of the Company as they primarily serve Company wells and have limited viability on their own. The natural gas plants are depleted on a units-of-production method.
Other Property and Equipment
Other property and equipment such as office furniture and equipment, buildings, and computer hardware and software are recorded at cost. Cost of renewals and improvements that substantially extend the useful lives of the assets are capitalized. Maintenance and repair costs are expensed as incurred. Depreciation is calculated using the straight-line method over the estimated useful lives of the assets, which range from three to ten years.
Assets Held for Sale
Assets are classified as held for sale when the Company commits to a plan to sell the assets and there is reasonable certainty that the sale will take place within one year. Upon classification as held for sale, long-lived assets are no longer depreciated or depleted, and a measurement for impairment is performed to identify and expense any excess of carrying value over fair value less estimated costs to sell. Any subsequent decreases to the estimated fair value less the costs to sell impact the measurement of assets held for sale. Any properties deemed held for sale as of the balance sheet date are presented separately on the accompanying balance sheets at the lower of net book value or fair value less cost to sell. For additional discussion, please refer to Note 3 - Assets Held for Sale.
Revenue Recognition
The Company records revenues, net of royalties, discounts, and allowances, as applicable, from the sales of crude oil, natural gas and natural gas liquids (“NGLs”) when delivery to the customer has occurred and title has transferred. This occurs when oil or gas has been delivered to a pipeline or a tank lifting has occurred. At the end of each month, the Company estimates the amount of production delivered to the purchaser and the price the Company will receive. The Company factors in historical performance, quality and transportation differentials, commodity prices, and other factors when deriving revenue estimates. Payment is generally received within 30 to 90 days after the date of production. The Company has interests with other producers in certain properties in which case the Company uses the entitlement method to account for gas imbalances. The Company had no material gas imbalances as of December 31, 2016 and 2015.
For gathering and processing services, the Company either receives fees or commodities from natural gas producers depending on the type of contract. Under the percentage-of-proceeds contract type, the Company is paid for its services by keeping a percentage of the NGLs produced and a percentage of the residue gas resulting from processing the natural gas. Commodities received are, in turn, sold and recognized as revenue in accordance with the criteria outlined above.
Income Taxes
The Company accounts for income taxes under the liability method, which requires recognition of deferred tax assets and liabilities for the expected future tax consequences of events that have been included in the balance sheet or tax returns. Under this method, deferred tax assets and liabilities are determined based on the difference between the financial statements and tax basis of assets and liabilities using enacted tax rates in effect for the year in which the differences are expected to reverse.
88
Uncertain Tax Positions
The Company recognizes interest and penalties related to uncertain tax positions in income tax expense. The tax returns for 2015, 2014 and 2013 are still subject to audit by the Internal Revenue Service. There were no uncertain tax positions.
Concentrations of Credit Risk
The Company maintains cash balances in excess of the Federal Deposit Insurance Corporation (FDIC) insured limit.
The Company is exposed to credit risk in the event of nonpayment by counterparties whose creditworthiness is continuously evaluated. For the years ended December 31, 2016 and 2015 Silo Energy Company accounted for 50% and 31%, respectively, Lion Oil Trading & Transportation, Inc. accounted for 18% and 16%, respectively, Plains Marketing LP accounted for 0% and 11%, respectively, and Duke Energy Field Services accounted for 14% and 11%, respectively, of our oil and natural gas sales. For the year ended December 31, 2014, Plains Marketing LP accounted for 29%, Lion Oil Trading & Transportation, Inc. accounted for 19%, and High Sierra Crude Oil & Marketing accounted for 11% of our oil and natural gas sales.
Oil and Gas Derivative Activities
The Company is exposed to commodity price risk related to oil and gas prices. To mitigate this risk, the Company enters into oil and gas forward contracts. The contracts, which were generally placed with major financial institutions or with counterparties which management believes to be of high credit quality, may take the form of futures contracts, swaps, options, or collars. The oil contracts are indexed to NYMEX WTI prices, and natural gas contracts are indexed to NYMEX HH prices, which have a high degree of historical correlation with actual prices received by the Company, before differentials. The Company recognizes all derivative instruments on the balance sheet as either assets or liabilities at fair value. For additional discussion, please refer to Note 13 - Derivatives.
Earnings Per Share
Earnings per basic and diluted share are calculated under the two-class method. Pursuant to the two-class method, the Company’s unvested restricted stock awards with non-forfeitable rights to dividends are considered participating securities. Under the two-class method, earnings per basic share is calculated by dividing net income available to shareholders by the weighted-average number of common shares outstanding during the period. The two-class method includes an earnings allocation formula that determines earnings per share for each participating security according to undistributed earnings for the period. Net income available to shareholders is reduced by the amount allocated to participating restricted shares to arrive at the earnings allocated to common stock shareholders for purposes of calculating earnings per share. Participating shares are not contractually obligated to share in the losses of the Company, and therefore, the entire net loss is allocated to the outstanding shares. Earnings per diluted share is computed on the basis of the weighted-average number of common shares outstanding during the period plus the dilutive effect of any potential common shares outstanding during the period using the more dilutive of the treasury method or two-class method. In periods of net loss, shares that are dilutive become anti-dilutive. For additional discussion, please refer to Note 14 - Earnings Per Share.
Stock-Based Compensation
The Company measures the cost of employee services received in exchange for an award of equity instruments based on the grant-date fair value of the award. For additional discussion, please refer to Note 9 - Stock-Based Compensation.
Fair Value of Financial Instruments
The Company’s financial instruments consist of cash and cash equivalents, trade receivables, trade payables, accrued liabilities, revolving credit facility, senior notes, and derivative instruments. Cash and cash equivalents, trade receivables, trade payables and accrued liabilities are carried at cost and approximate fair value due to the short-term nature of these instruments. Our revolving credit facility has a variable interest rate so it approximates fair value. Our senior notes are recorded at cost, and their fair value is disclosed within Note 12 - Fair Value Measurements. Derivative instruments are recorded at fair value. The book value of the contractual obligation for land acquisition approximates fair value due to it being discounted at a market-based interest rate.
89
Prior Year Reclassifications
Certain prior year balances have been reclassified to conform to the current year presentation, and such reclassifications had no impact on net income (loss) or stockholders’ equity previously reported.
Recently Issued and Adopted Accounting Standards
Effective January 1, 2015, the Company adopted, on a prospective basis, Financial Accounting Standards Board ("FASB") Accounting Standards Update (“Update”) No. 2014-08 - Reporting Discontinued Operations and Disclosures of Disposals of Components of an Entity. The update was aimed at reducing the frequency of disposals reported as discontinued operations by focusing on strategic shifts that have or will have a major effect on an entity’s operations and financial results. Subsequent to adoption of this guidance, the Company determined that assets that were deemed as held for sale during 2015 did not qualify for discontinued operations. As such, the presentation within the accompanying balance sheets and the consolidated statements of operations and comprehensive income (“accompanying statements of operations”) reflect them as standard assets held for sale versus our California asset sales that occurred in 2014 and 2012 that were presented as discontinued operations. For additional discussion, please refer to Note 2 - Acquisitions and Divestitures and Note 3 - Assets Held for Sale.
Effective January 1, 2016, the Company adopted, on a retrospective basis, FASB Update No. 2015-02, Consolidation (Topic 810): Amendments to the Consolidation Analysis. This updated clarifies the consolidation reporting guidance in GAAP. There was no impact to the Company’s financial statements or disclosures from the adoption of this standard.
On January 1, 2016, the Company adopted FASB Update No. 2015 -03 - Interest - Imputation of Interest - Simplifying the Presentation of Debt Issuance Costs and Update No. 2015-15, Interest - Imputation of Interest - Presentation and Subsequent Measurement of Debt Issuance Costs Associated with Line-of-Credit Arrangements on a retrospective basis. These updates require capitalized debt issuance costs, except for those related to revolving credit facilities, to be presented in the balance sheet as a direct deduction from the carrying amount of the related debt liability, rather than as an asset. The adoption resulted in a reclassification that reduced other noncurrent assets and senior notes - current portion by $11.5 million as of December 31, 2016 and reduced other noncurrent assets and long-term debt by $13.7 million on the accompanying balance sheets as of December 31, 2015.
Effective December 31, 2016, the Company adopted FASB Updated No. 2014-15, Presentation of Financial Statements-Going Concern (Subtopic 205-40): Disclosure of Uncertainties about an Entity’s Ability to Continue as a Going Concern. This update requires management to evaluate whether there are conditions or events that raise substantial doubt about an entity’s ability to continue as a going concern within one year after the date that the entity’s financial statements are issued, or within one year after the date the entity’s financial statements are available to be issued, and to provide disclosures when certain criteria are met. The Company is a going concern uncertainty and applied this authoritative guidance throughout this Annual Report on Form 10-K. Please see the going concern uncertainty subsection within this footnote for additional discussion.
In May 2014, the FASB issued Update No. 2014-09, Revenue from Contracts with Customers (Topic 606) (“Update 2014-09”) for the recognition of revenue from contracts with customers. Subsequent to the issuance of this Update, the FASB issued additional related Updates as follows:
• | In August 2015, the FASB issued Update No. 2015-14, Revenue from Contracts with Customers (Topic 606): Deferral of the Effective Date. This update deferred the effective date of Update 2014-09 by one year. |
• | In March 2016, the FASB issued Update No. 2016-08, Revenue from Contracts with Customers (Topic 606): Principal versus Agent Considerations (Reporting Revenue Gross versus Net). This update amends the principal versus agent guidance in Update No. 2014-09. |
• | In April 2016, the FASB issued Update No. 2016-10, Revenue from Contracts with Customers (Topic 606): Identifying Performance Obligations and Licensing. This update amends the identification of performance obligations and accounting for licenses in Update 2014-09. |
• | In May 2016, the FASB issued Update No. 2016-12, Revenue from Contracts with Customers (Topic 606): Narrow-Scope Improvements and Practical Expedients. This update amends certain issues in Update 2014-09 on transition, collectibility, noncash consideration, and the presentation of sales taxes and other similar taxes. |
90
• | In May 2016, the FASB issued Update No. 2016-12, Revenue from Contracts with Customers (Topic 606): Narrow-Scope Improvements and Practical Expedients. This update amends certain issues in Update 2014-09 on transition, collectibility, noncash consideration, and the presentation of sales taxes and other similar taxes. |
• | In December 2016, the FASB issued Update No. 2016-20, Technical Corrections and Improvements to Topic 606, Revenue from Contracts with Customers. This update is meant to improve and clarify or to correct unintended application of narrow aspects of the guidance in Update 2014-09. |
Update 2014-09 and each update have the same effective date and transition requirements. That is, the guidance under these standards is to be applied using a full retrospective method or a modified retrospective method, as outlined in Update 2014-09, and is effective for annual periods, and interim periods within those annual periods, beginning after December 15, 2017. Early adoption is permitted only for annual periods, and interim periods within those annual periods, beginning after December 15, 2016. The Company is currently evaluating the provisions of each of these standards, analyzing their impact on the Company’s contract portfolio, reviewing current accounting policies and practices to identify potential differences that would result from applying the requirements of these standards to the Company’s revenue contracts, and assessing their potential impact on the Company’s financial statements and disclosures. The Company currently plans to apply the modified retrospective method upon adoption and plans to adopt the guidance on the effective date of January 1, 2018.
In July 2015, the FASB issued Update No. 2015-11 - Inventory. The update requires that inventory be measured at the lower of cost or net realizable value. This authoritative guidance is effective for fiscal years beginning after December 15, 2016 and interim periods within those fiscal years. The Company has evaluated the provisions of this guidance and determined that it will not have a material effect on the Company’s financial statements or disclosures.
In November 2015, the FASB issued Update No. 2015-17 - Income Taxes to simplify the presentation of deferred income taxes by classifying deferred tax assets and liabilities as noncurrent only. The new guidance is effective for annual periods, and interim periods within those annual periods, beginning after December 15, 2016. Early application is permitted. The Company has evaluated the provisions of this guidance and determined it will not have a material effect on the Company’s financial statements and disclosures.
In January 2016, the FASB issued Update No. 2016-01 – Financial Instruments - Overall to require separate presentation of financial assets and financial liabilities by measurement category and form of financial asset on the balance sheet or the accompanying notes to the financial statements. This authoritative guidance is effective for fiscal years beginning after December 15, 2017 and interim periods within those fiscal years. The Company is currently evaluating the provisions of this guidance and assessing its impact, but does not currently believe it will have a material effect on the Company’s financial statements or disclosures.
In February 2016, the FASB issued Update No. 2016-02 – Leases to increase transparency and comparability among organizations by recognizing lease assets and lease liabilities on the balance sheet and disclosing key information about leasing arrangements. This authoritative guidance is effective for fiscal years beginning after December 15, 2018 and interim periods within those fiscal years. The Company is currently evaluating the provisions of this guidance and assessing its impact, but does not currently believe it will have a material effect on the Company’s financial statements or disclosures.
In March 2016, the FASB issued Update No. 2016-09 – Compensation - Stock Compensation. The update simplifies several aspects of the accounting for share-based payment transactions, including the income tax consequences, classification of awards as either equity or liabilities, and classification on the statement of cash flows. This authoritative guidance is effective for fiscal years beginning after December 15, 2016 and interim periods within those fiscal years. The Company has evaluated the provisions of this guidance and concluded that it will not have a material effect on the Company’s financial statements or disclosures.
In August 2016, the FASB issued Update No. 2016-15 – Classification of Certain Cash Receipts and Cash Payments, which clarifies the presentation of specific cash receipts and cash payments within the statement of cash flows. This authoritative accounting guidance is effective for annual periods, and interim periods within those annual periods, beginning after December 15, 2017. The Company is currently evaluating the provisions of this guidance and assessing its impact, but does not currently believe it will have a material effect on the Company’s financial statements or disclosures.
In November 2016, the FASB issued Update No. 2016-18, Statement of Cash Flows (Topic 230): Restricted Cash. This update clarifies how entities should present restricted cash and restricted cash equivalents in the statement of cash flows. This guidance is to be applied using a retrospective method and is effective for annual periods, and interim periods within those
91
annual periods, beginning after December 15, 2017. Early adoption is permitted. The Company is currently evaluating the provisions of this guidance and assessing its potential impact on the Company’s financial statements and disclosures.
In January 2017, the FASB issued Update No. 2017-01, Business Combinations (Topic 805): Clarifying the Definition of a Business. This update clarifies the definition of a business with the objective of adding guidance to assist entities with evaluating whether transactions should be accounted for as acquisitions (or disposals) of assets or businesses. This guidance is to be applied using a prospective method and is effective for annual periods, and interim periods within those annual periods, beginning after December 15, 2017. Early adoption is permitted. The Company is currently evaluating the provisions of this guidance and assessing its potential impact on the Company’s financial statements and disclosures.
In February 2017, the FASB issued Update No. 2017-05, Other Income-Gains and Losses from the Derecognition of Nonfinancial Assets (Subtopic 610-20): Clarifying the Scope of Asset Derecognition Guidance and Accounting for Partial Sales of Nonfinancial Assets. This update is meant to clarify the scope of ASC Subtopic 610-20, Other Income-Gains and Losses from the Derecognition of Nonfinancial Assets and to add guidance for partial sales of nonfinancial assets. This guidance is to be applied using a full retrospective method or a modified retrospective method as outlined in the guidance and is effective at the same time as Update 2014-09. Further, the Company is required to adopt this guidance at the same time that it adopts the guidance in Update 2014-09. The Company is currently evaluating the provisions of this guidance and assessing its potential impact on the Company’s financial statements and disclosures.
There are no other accounting standards applicable to the Company that would have a material effect on the Company’s financial statements and disclosures that have been issued but not yet adopted by the Company as of December 31, 2016, and through the filing date of this report.
NOTE 2 - ACQUISITIONS AND DIVESTITURES
In July 2014, the Company acquired approximately 34,000 net acres of oil and gas properties, leasehold mineral interests and related assets located in the Wattenberg Field (“Wattenberg Field Acquisition”) from a private operator. The Company paid approximately $174.6 million (inclusive of customary acquisition costs) in cash and issued 853,492 shares of the Company’s common stock valued at $57.47 per share, the market price at the time of closing, for the acquired assets. The Wattenberg Field Acquisition had an effective date of June 1, 2014 and closed on July 8, 2014. The results of operations for the Wattenberg Field Acquisition have been included in the Company’s consolidated financial statements from the date of closing. The Wattenberg Field Acquisition was recorded using the purchase method of accounting.
On July 31, 2012, the Company acquired leases to approximately 5,600 net acres in the Wattenberg Field from the State of Colorado, State Board of Land Commissioners for $57.0 million. The Company paid approximately $12.0 million at closing and $12.0 million in each of July 2013, July 2014, July 2015, and May 2016.
Discontinued Operations
During June 2012, the Company sold the majority of its oil and gas properties in California classifying them as discontinued operations with its remaining property being sold in the first quarter of 2014 for approximately $6.0 million. The Company recorded a gain on sale of oil and gas properties in the amount of $5.5 million for the year ended December 31, 2014.
NOTE 3 - ASSETS HELD FOR SALE
As of December 31, 2015, the accompanying balance sheets present $214.9 million of assets held for sale, net of accumulated depreciation, depletion and amortization, which consists of the Company’s Rocky Mountain Infrastructure, LLC subsidiary (“RMI”), all assets within the Company's Mid-Continent region and all assets in the North Park Basin. There is a corresponding asset retirement obligation liability of approximately $10.6 million for assets held for sale recorded in the asset retirement obligations for assets held for sale financial statement line item in the accompanying balance sheets. There were no other material assets or liabilities associated with the assets held for sale. For the year ended December 31, 2015, the Company recorded write-downs to fair value less estimated costs to sell of $321.2 million for its Mid-Continent region assets. These write-downs are recorded in the impairment of oil and gas properties line item in the accompanying statements of operations.
During the second quarter of 2016, when it was determined to not sell these assets, these assets were placed back into assets held for use in the proved properties, unproved properties and wells in progress financial statement line items in the accompanying balance sheets, including the corresponding asset retirement obligation liability. During the second quarter of 2016, the Company recorded $3.0 million of catch-up depletion on the RMI assets for the nine months that the assets were
92
classified as held for sale and recorded a $6.0 million gain on termination fee shown in the accompanying statements of operations. The fair value of the Mid-Continent region was lower than the carrying value of the assets prior to classification as held for sale less any depletion that would have been recognized had the assets continuously been held and used, and therefore, no catch-up depletion was recorded for those assets.
NOTE 4 - IMPAIRMENTS
During the first quarter of 2016, the Company impaired its oil and gas properties in the Mid-Continent region by $10.0 million, based upon the most recent bid received while the assets were held for sale. The Company also recorded unproved properties impairments of $24.7 million for non-core leases expiring within the Wattenberg Field. For additional discussion, please refer to Note 12 - Fair Value Measurements.
For the year ended December 31, 2015, the Company impaired its assets held for sale within the Mid-Continent region to their fair value resulting in proved property impairments of $321.2 million and $419.3 million of proved property impairments in the Rocky Mountain region due to low commodity prices. The Company incurred unproved properties impairments of $24.8 million for non-core lease expirations in the Wattenberg Field and $8.7 million of impairment charges to fully impair the North Park Basin due to a change in the Company's development plan during the year.
For the year ended December 31, 2014, the Company impaired its Dorcheat Macedonia Field, McKamie Patton Field, and McCallum Field due to low commodity prices to their fair values resulting in proved property impairments of $127.3 million, $25.0 million and $15.3 million, respectively.
NOTE 5 - OTHER NONCURRENT ASSETS
The Company has unamortized deferred financing costs related to its revolving credit facility, which are classified as other noncurrent assets in the accompanying balance sheets. In accordance with authoritative guidance, the deferred financing costs related to the Company's Senior Notes are now presented as a reduction of the Senior Notes on the accompanying balance sheets and are not included below.
As of December 31, | ||||||||
2016 | 2015 | |||||||
(in thousands) | ||||||||
Restricted cash | 2,855 | 241 | ||||||
Deferred financing costs - revolving credit facility | 227 | 2,060 | ||||||
Other noncurrent assets | $ | 3,082 | $ | 2,301 | ||||
NOTE 6 - ACCOUNTS PAYABLE AND ACCRUED EXPENSES
Accounts payable and accrued expenses contain the following:
As of December 31, | |||||||
2016 | 2015 | ||||||
(in thousands) | |||||||
Drilling and completion costs | $ | 2,415 | $ | 32,459 | |||
Accounts payable trade | 1,140 | 1,085 | |||||
Accrued general and administrative cost | 17,539 | 10,643 | |||||
Lease operating expense | 2,895 | 4,731 | |||||
Accrued reclamation cost | — | 162 | |||||
Accrued interest | 14,209 | 14,231 | |||||
Silo contract settlement accrual | 7,228 | — | |||||
Production and ad valorem taxes and other | 15,902 | 33,049 | |||||
Total accounts payable and accrued expenses | $ | 61,328 | $ | 96,360 | |||
93
NOTE 7 - LONG-TERM DEBT
Long-term debt consisted of the following as of December 31, 2016 and 2015:
As of December 31, | |||||||
2016 | 2015 | ||||||
(in thousands) | |||||||
Revolving credit facility | $ | 191,667 | $ | 79,000 | |||
6.75% Senior Notes due 2021 | 500,000 | 500,000 | |||||
Unamortized premium on 6.75% Senior Notes | 5,165 | 6,392 | |||||
5.75% Senior Notes due 2023 | 300,000 | 300,000 | |||||
Less debt issuance costs - Senior Notes | (11,467 | ) | (13,726 | ) | |||
Total debt, net | 985,365 | 871,666 | |||||
Less current portion(1) | (985,365 | ) | — | ||||
Total long-term debt | $ | — | $ | 871,666 | |||
______________________________________
(1) Due to covenant violations, the Company classified the Senior Notes as current liabilities. Please refer to the going concern uncertainty subsection in Note 1 - Summary of Significant Accounting Policies and Note 19 - Subsequent Events for additional discussion.
Revolving Credit Facility
The revolving credit facility, dated March 29, 2011, as amended, with a syndication of banks, provides for a total credit facility size of $1.0 billion. The revolving credit facility provides for interest rates plus an applicable margin to be determined based on LIBOR or a base rate, at the Company’s election. LIBOR borrowings bear interest at LIBOR plus 1.50% to 2.50% depending on the utilization level, and the base rate borrowings bear interest at the “Bank Prime Rate,” as defined in the revolving credit facility, plus 0.50% to 1.50%. The applicable lenders under the revolving credit facility deemed the Company in default due to a covenant violation on November 14, 2016 causing the then outstanding balance under the revolving credit facility to bear interest at the Bank Prime Rate plus the applicable utilization margin and 2% penalty fee.
The borrowing base on the revolving credit facility was reduced on May 20, 2016 from $475.0 million to $200.0 million, and was further reduced from $200.0 million to $150.0 million on October 31, 2016. The borrowing base is redetermined semiannually, as early as April and October of each year. The revolving credit facility is collateralized by substantially all of the Company’s assets and matures on September 15, 2017. As of December 31, 2016, the Company had $191.7 million outstanding under the revolving credit facility and had a borrowing base deficiency of $41.7 million to be paid back in five remaining monthly installments of $8.3 million, with no additional available borrowing capacity. The Company filed for bankruptcy under Chapter 11 of the Bankruptcy Code on January 4, 2017, granting the Company a stay from making any further deficiency payments.
The revolving credit facility restricts, among other items, certain dividend payments, additional indebtedness, asset sales, loans, investments and mergers. The revolving credit facility also contains certain financial covenants, which require the maintenance of certain financial and leverage ratios, as defined by the revolving credit facility. The revolving credit facility contains a ratio of maximum senior secured debt to trailing twelve-month EBITDAX (defined as earnings before interest expense, income tax expense, depreciation, depletion and amortization expense, and exploration expense and other non-cash charges) that must not exceed 2.50 to 1.00 and a minimum interest coverage ratio that must exceed 2.50 to 1.00. The maximum senior secured debt ratio is calculated by dividing borrowings under the revolving credit facility, balances drawn under letters of credit, and any outstanding second lien debt divided by trailing twelve-month EBITDAX. The minimum interest coverage ratio is calculated by dividing trailing twelve-month EBITDAX by trailing twelve-month interest expense. The revolving credit facility also contains a minimum current ratio covenant of 1.00 to 1.00. The revolving credit facility agreement states that the current ratio is to exclude the current portion of long-term debt, as such the classification of the Company's long-term debt to current liabilities did not impact the current ratio. The Company is no longer in compliance with its minimum interest coverage or maximum debt ratio requirements thus allowing the applicable lenders to give notice of acceleration as a result of this non-compliance. As of December 31, 2016, the Company had not received a notice of acceleration.
5.75% Senior Notes
94
On July 15, 2014, the Company issued $300.0 million aggregate principal amount of 5.75% Senior Notes that mature on February 1, 2023. Interest on the 5.75% Senior Notes began accruing on July 15, 2014, and interest is payable on February 1 and August 1 of each year, beginning on February 1, 2015. The 5.75% Senior Notes are guaranteed on a senior unsecured basis by the Company’s existing and future subsidiaries that incur or guarantee certain indebtedness, including indebtedness under the revolving credit facility. The net proceeds from the sale of the 5.75% Senior Notes were $293.4 million after deductions of $6.6 million of expenses and underwriting discounts and commissions.
At any time prior to August 1, 2017, subject to certain limitations, the Company may redeem up to 35% of the aggregate principal amount of the 5.75% Senior Notes at a redemption price of 105.75% of the principal amount, plus accrued and unpaid interest, with an amount of cash not greater than the net cash proceeds of an equity offering. The Company may redeem all or a part of the 5.75% Senior Notes at any time prior to August 1, 2018 subject to a “make-whole” premium and accrued and unpaid interest. On or after August 1, 2018, the Company may redeem all or a part of the 5.75% Senior Notes at the redemption price of 102.875% for 2018, 101.438% for 2019, and 100.0% for 2020 and thereafter, during the twelve-month period beginning on August 1 of each applicable year, in each case, plus accrued and unpaid interest.
6.75% Senior Notes
On April 9, 2013, the Company issued $300.0 million aggregate principal amount of 6.75% Senior Notes that mature on April 15, 2021. Interest on the Senior Notes began accruing on April 9, 2013, and interest is payable on April 15 and October 15 of each year, which began on October 15, 2013. On November 15, 2013, the Company issued an additional $200.0 million aggregate principal amount of 6.75% Senior Notes as an additional issuance of its existing 6.75% Senior Notes. The 6.75% Senior Notes are guaranteed on a senior unsecured basis by the Company’s existing and future subsidiaries that incur or guarantee certain indebtedness, including indebtedness under the Company’s revolving credit facility. The net proceeds from the sale of the 6.75% Senior Notes were $496.7 million after the premium and deduction of $12.3 million of expenses and underwriting discounts and commissions.
The Company may redeem all or a part of the 6.75% Senior Notes at any time prior to April 15, 2017 at the redemption price equal to 100% of the principal amount, plus the applicable “make-whole” premium and accrued and unpaid interest. On or after April 15, 2017, the Company may redeem all or a part of the 6.75% Senior Notes at the redemption price of 103.375% for 2017, 101.688% for 2018, and 100.0% for 2019 and thereafter, during the twelve-month period beginning on April 15 of each applicable year, plus accrued and unpaid interest.
On November 12, 2013 and July 15, 2014, the Company filed automatic registration statements on Form S‑3 to register the 5.75% Senior Notes and 6.75% Senior Notes, respectively, and guarantees of the Senior Notes. As of December 31, 2016, all of the existing subsidiaries of the Company are guarantors of the Senior Notes, and all such subsidiaries are 100% owned by the Company. The guarantees by the subsidiaries are full and unconditional (except for customary release provisions) and constitute joint and several obligations of the subsidiaries. The Company has no independent assets or operations unrelated to its investments in its consolidated subsidiaries. There are no significant restrictions on the Company’s ability or the ability of any subsidiary guarantor to obtain funds from its subsidiaries by such means as a dividend or loan.
The revolving credit facility and Senior Notes have cross default clauses. The noteholders had the option to give notice of acceleration as of year-end. The Company did not receive a notice of acceleration from the noteholders.
Please refer to Note 19 - Subsequent Events for additional discussion about the Company's bankruptcy proceedings.
95
NOTE 8 - COMMITMENTS AND CONTINGENCIES
Legal Proceedings
From time to time, the Company is involved in various commercial and regulatory claims, litigation and other legal proceedings that arise in the ordinary course of its business. The Company assesses these claims in an effort to determine the degree of probability and range of possible loss for potential accrual in its consolidated financial statements. In accordance with accounting authoritative guidance, an accrual is recorded for a loss contingency when its occurrence is probable and damages can be reasonably estimated based on the most likely anticipated outcome or the minimum amount within a range of possible outcomes. Because legal proceedings are inherently unpredictable and unfavorable resolutions could occur, assessing contingencies is highly subjective and requires judgments about uncertain future events. When evaluating contingencies, the Company may be unable to provide a meaningful estimate due to a number of factors, including the procedural status of the matter in question, the presence of complex or novel legal theories, and/or the ongoing discovery and development of information important to the matters. The Company regularly reviews contingencies to determine the adequacy of its accruals and related disclosures. No claims have been made, nor is the Company aware of any material uninsured liability which the Company may have, as it relates to any environmental cleanup, restoration or the violation of any rules or regulations. As of the filing date of this report, there were no material pending or overtly threatened legal actions against the Company of which it is aware.
In February 2017, the Colorado Department of Public Health and Environment (“CDPHE”) proposed settlement terms under which the Company would be required to pay an administrative penalty in excess of $100,000 and perform certain mitigation projects and adopt certain procedures and processes addressing the monitoring, reporting, and reduction of emissions with respect to the Company’s storage tank facilities in the Wattenberg Field. The Company believes that the terms of settlement offered to the Company are part of a broader enforcement initiative the CDPHE is taking with multiple operators in the Wattenberg Field.
Although the Company intends to continue working with the CDPHE in an attempt to reach a consensual resolution of the relevant compliance matters, the Company firmly believes that the proposed terms of settlement are neither mandated by the applicable air quality regulations nor consistent with the Company’s historical practices or its rights under the Environmental Audit Law. It is not possible to determine at this time whether the Company will ultimately be subject to any civil penalty assessment in connection with the resolution of compliance issues identified in the Audit and the Compliance Advisory.
For discussion of our ongoing bankruptcy proceedings please see Note 19 - Subsequent Events.
Commitments
In October 2014, the Company entered into two purchase agreements to deliver fixed determinable quantities of crude oil. The first agreement with Silo went into effect during the second quarter of 2015 for 12,580 barrels per day over an initial five-year term. While the volume commitment may be met with Company volumes or third-party volumes, delegated by the Company, the Company will be required to make periodic deficiency payments for any shortfalls in delivering the minimum volume commitments. The Company incurred $3.4 million as of December 31, 2016 in deficiency payments to Silo on the minimum volume commitments. Based on current production estimates, assuming no future drilling and completion activity, the anticipated shortfall in delivering the minimum volume commitments could result in potential deficiency payments of $44.8 million for 2017 through April 2020, when the agreement expires. Subject to bankruptcy court confirmation, the Company terminated its purchase agreement with Silo on February 1, 2017, and entered into a settlement agreement pursuant to which Silo will receive value of approximately $21.0 million. The estimated settlement allows Silo (i) to retain the $5.0 million adequate assurance deposit it currently maintains, (ii) to retain the Company's $8.7 million crude oil revenue receivable due to the Company for December 2016 production, (iii) to receive an additional cash payment of $4.5 million on the date of emergence from bankruptcy, and (iv) to receive a $2.7 million payment to be settled in equity or cash on the date of emergence from bankruptcy. The $21.0 million settlement is shown in the contract settlement expense line item in the accompanying statements of operations as of December 31, 2016.
The second purchase agreement, with NGL, took effect in the fourth quarter of 2016 for 15,000 barrels per day over an initial seven-year term. Based on current production estimates, assuming no future drilling and completion activity, the anticipated shortfall in delivering the minimum volume commitments could result in potential deficiency payments of $165.2 million for 2017 through October 2023, when the agreement expires.
96
The NGL purchase agreement is contemplated to be amended pursuant to the RSA, which is subject to bankruptcy court confirmation. The amendment waives any existing and future deficiency payments throughout 2017. The terms of the amended NGL purchase agreement consists of an agreed upon one-rig program volume commitment not to exceed 20,000 barrels per day for a term commencing upon our emergence from bankruptcy and expiring on December 31, 2023. The Company does not anticipate incurring deficiencies once the contemplated minimum volume commitments go into affect in 2018. The aggregate financial commitment fee, assuming the maximum commitment volumes and base differential, is $246.4 million as of January 1, 2017.
Please refer to Note 19 - Subsequent Events for additional discussion on the Company's bankruptcy proceedings.
The Company rents office facilities under various non-cancelable operating lease agreements. The annual minimum payments on the purchase and transportation and operating lease agreements for the next five years and total minimum lease payments thereafter are presented below:
Commitments | ||||
(in thousands) | ||||
2017 | $ | 92,378 | ||
2018 | 92,420 | |||
2019 | 92,462 | |||
2020 | 55,543 | |||
2021 | 46,006 | |||
2022 and thereafter | 68,985 | |||
Total | $ | 447,794 | ||
The Company’s office leases extend through 2020. Rent expense for the years ended December 31, 2016, 2015 and 2014 was $2.8 million, $2.6 million and $2.0 million, respectively. The Company has filed with the Bankruptcy Court to reject its Denver office lease, as permitted under the Bankruptcy Code, and enter into a new office lease agreement that would extend through February 2022. We currently sublease a portion of our Denver office lease, pursuant to which, the Company would receive a total of $2.1 million payable through 2020.
NOTE 9 - STOCK-BASED COMPENSATION
Management Incentive Plan
On December 23, 2010, the Company established the Management Incentive Plan (the “Plan”) for the benefit of certain employees, officers and other individuals performing services for the Company. The maximum number of shares of Class B common stock available under the Plan was 10,000 and these shares were converted into 437,787 shares of our restricted common stock upon completion of the Company’s initial public offering. The conversion rate was determined based on a formula factoring in the rate of return to the pre-IPO common stockholders. The 437,787 shares of common stock that were granted were valued at the IPO stated price of $17.00 per share and vested over a three-year period. There was no stock-based compensation expense during 2016 and 2015, as all common stock granted under the Plan was fully vested as of December 31, 2014 with no unrecognized compensation expense remaining. Stock-based compensation expense of $4.8 million was recorded during the year ended December 31, 2014.
Long Term Incentive Plan
The Company’s 2011 Long Term Incentive Plan, as amended and restated (the “LTIP”), has different forms of equity issuances allowed under it as further described in this section. The Company anticipates that all outstanding LTIP awards that have not vested by the time of the Company's emergence from bankruptcy will be canceled pursuant to the terms of the Plan of Reorganization.
Restricted Stock under the Long Term Incentive Plan
The Company grants shares of restricted stock to directors, eligible employees and officers under its LTIP. Each share of restricted stock represents one share of the Company’s common stock to be released from restriction upon completion of the
97
vesting period. The awards typically vest in one-third increments over three years. Each share of restricted stock is entitled to a non-forfeitable dividend, if the Company were to declare one, and has the same voting rights as a share of the Company’s common stock. Shares of restricted stock are valued at the closing price of the Company’s common stock on the grant date and are recognized as general and administrative expense over the vesting period of the award.
The Company granted no shares of restricted stock under the LTIP during 2016. The Company granted 568,832 and 297,030 shares of restricted stock under the LTIP to certain employees during 2015 and 2014, respectively. The fair value of the restricted stock granted in 2015 and 2014 was $13.8 million and $13.9 million, respectively. The Company recognized compensation expense of $6.1 million, $11.1 million and $13.9 million for the years ended December 31, 2016, 2015 and 2014, respectively. As of December 31, 2016 unrecognized compensation cost was $3.8 million and will be amortized through 2017.
In 2016, 2015 and 2014, the Company issued 113,044, 32,450 and 12,919 shares, respectively, of restricted common stock under the LTIP to its non-employee directors. The Company recognized compensation expense of $0.7 million for the years ended December 31, 2016, 2015 and 2014, respectively. These awards vest approximately one year after issuance.
A summary of the status and activity of non-vested restricted stock is presented below:
For the Years Ended December 31, | ||||||||||||||||||||
2016 | 2015 | 2014 | ||||||||||||||||||
Restricted Stock | Weighted- Average Grant-Date Fair Value | Restricted Stock | Weighted- Average Grant-Date Fair Value | Restricted Stock | Weighted- Average Grant-Date Fair Value | |||||||||||||||
Non-vested at beginning of year | 731,818 | $ | 29.47 | 589,529 | $ | 37.66 | 836,002 | $ | 25.11 | |||||||||||
Granted | 113,044 | $ | 0.98 | 601,282 | $ | 24.04 | 309,949 | $ | 45.87 | |||||||||||
Vested | (355,498 | ) | $ | 31.68 | (335,419 | ) | $ | 32.09 | (524,818 | ) | $ | 25.95 | ||||||||
Forfeited | (120,477 | ) | $ | 27.34 | (123,574 | ) | $ | 34.86 | (31,604 | ) | $ | 32.73 | ||||||||
Non-vested at end of year | 368,887 | $ | 19.45 | 731,818 | $ | 29.47 | 589,529 | $ | 37.66 | |||||||||||
Cash flows resulting from excess tax benefits are to be classified as part of cash flows from financing activities. Excess tax benefits are realized tax benefits from tax deductions for vested restricted stock in excess of the deferred tax asset attributable to stock compensation costs for such restricted stock. The Company recorded no excess tax benefits for the years ended December 31, 2016, 2015 and 2014.
Performance Stock Units under the Long Term Incentive Plan
The Company grants performance stock units (“PSUs”) to certain officers under its LTIP. The number of shares of the Company’s common stock that may be issued to settle PSUs ranges from zero to two times the number of PSUs awarded. PSUs are determined at the end of each annual measurement period over the course of the three-year performance cycle in an amount up to two-thirds of the target number of PSUs that are eligible for vesting (such that an amount equal to 200% of the target number of PSUs may be earned during the performance cycle) although no stock is actually awarded to the participant until the end of the entire three-year performance cycle. Any PSUs that have not vested at the end of the applicable measurement period are forfeited. The performance criterion for the PSUs is based on a comparison of the Company’s total shareholder return (“TSR”) for the measurement period compared with the TSRs of a group of peer companies for the same measurement period. Compensation expense associated with PSUs is recognized as general and administrative expense over the measurement period. The TSR for the Company and each of the peer companies is determined by dividing (A)(i) the average share price for the last 30 trading days of the applicable measuring period, minus (ii) the average share price for the 30 trading days immediately preceding the beginning of the applicable measuring period, by (B) the average share price for the 30 trading days immediately preceding the beginning of the applicable measuring period. The number of earned shares of the Company's common stock will be calculated based on which quartile its TSR percentage ranks as of the end of the annual measurement period relative to the other companies in the comparator group.
98
The fair value of the PSUs was measured at the grant date with a stochastic process method using a Monte Carlo simulation. A stochastic process is a mathematically defined equation that can create a series of outcomes over time. These outcomes are not deterministic in nature, which means that by iterating the equations multiple times, different results will be obtained for those iterations. In the case of the Company’s PSUs, the Company cannot predict with certainty the path its stock price or the stock prices of its peers will take over the performance period. By using a stochastic simulation, the Company can create multiple prospective stock pathways, statistically analyze these simulations, and ultimately make inferences regarding the most likely path the stock price will take. As such, because future stock prices are stochastic, or probabilistic with some direction in nature, the stochastic method, specifically the Monte Carlo Model, is deemed an appropriate method by which to determine the fair value of the PSUs. Significant assumptions used in this simulation include the Company’s expected volatility, risk-free interest rate based on U.S. Treasury yield curve rates with maturities consistent with the measurement period, as well as the volatilities for each of the Company’s peers.
The following table presents the assumptions used to determine the fair value of the PSUs granted during the years ended December 31, 2015 and 2014.
For the Years Ended | |||||
2015 | 2014 | ||||
Expected term of award | 3 | 3 | |||
Risk-free interest rate | 0.15% - 0.99% | 0.12% - 0.9% | |||
Expected volatility | 65 | % | 40% - 45% | ||
The Company granted no PSUs under the LTIP during 2016. During 2015 and 2014, the Company granted 144,363 and 82,312 PSUs, respectively, under the LTIP to certain officers. The fair value of the PSUs granted in 2015 and 2014 was $4.8 million and $3.5 million, respectively. The Company recognized compensation expense of $1.8 million, $2.8 million and $1.3 million for the years ended December 31, 2016, 2015 and 2014, respectively. As of December 31, 2016, unrecognized compensation expense for PSUs was $1.3 million and will be amortized through 2018.
A summary of the status and activity of PSUs is presented in the following table:
For the Years Ended December 31, | ||||||||||||||||||||
2016 | 2015 | 2014 | ||||||||||||||||||
PSU | Weighted-Average Grant-Date Fair Value | PSU | Weighted-Average Grant-Date Fair Value | PSU | Weighted-Average Grant-Date Fair Value | |||||||||||||||
Non-vested at beginning of year(1) | 114,833 | $ | 35.27 | 94,173 | $ | 37.55 | 40,191 | $ | 32.05 | |||||||||||
Granted(1) | — | $ | — | 144,363 | $ | 33.44 | 82,312 | $ | 41.94 | |||||||||||
Vested(1) | (59,725 | ) | $ | 36.61 | (107,053 | ) | $ | 34.84 | (28,330 | ) | $ | 42.50 | ||||||||
Forfeited(1) | (33,570 | ) | $ | 35.55 | (16,650 | ) | $ | 37.00 | — | $ | — | |||||||||
Non-vested at end of year(1) | 21,538 | $ | 33.31 | 114,833 | $ | 35.27 | 94,173 | $ | 37.55 | |||||||||||
___________________________
(1) | The number of awards assumes that the associated performance condition is met at the target amount. The final number of shares of the Company’s common stock issued may vary depending on the performance multiplier, which ranges from zero to two, depending on the level of satisfaction of the performance condition. |
During the year ended December 31, 2016, the third tranche of the 2014 awards and the second tranche of the 2015 awards both had a zero-times multiplier, in accordance with the terms of the respective PSU awards. During the year ended December 31, 2015, the first tranche of the 2015 awards, the second tranche of the 2014 awards and the 2013 awards had a zero-times multiplier, 1.00-times multiplier and 0.91-times multiplier, respectively, in accordance with the terms of the respective PSU awards. During the year ended December 31, 2014, the first tranche of the 2014 awards had a 1.33-times multiplier, in accordance with the terms of the respective PSU awards. The earned shares are settled and released at the end of the three-year performance cycle.
Long Term Incentive Plan Units
During the year end December 31, 2016, the Company granted 2,958,558 of LTIP units (“units”) for a total fair value $2.9 million, that will settle in shares of the Company's common stock upon vesting. The units vest in one-third increments
99
over three years. The units contain a share price cap of $26 that incrementally decreases the number of shares of the Company's common stock that will be released upon vesting if the Company's common stock were to exceed the share price cap.
Total expense recorded for the units for the year ended December 31, 2016 was $871,000. As of December 31, 2016, there was $1.5 million of total unrecognized compensation expense related to unvested units to be amortized through 2019.
A summary of the status and activity of non-vested units for the year ended December 31, 2016 is presented below.
For the Year Ended | ||||||
December 31, 2016 | ||||||
LTIP Units | Weighted- Average Grant-Date Fair Value | |||||
Non-vested at beginning of year | — | $ | — | |||
Granted | 2,958,558 | $ | 0.99 | |||
Vested | — | $ | — | |||
Forfeited | (515,156 | ) | $ | 0.98 | ||
Non-vested at end of year | 2,443,402 | $ | 0.99 | |||
401(k) Plan
The Company has a defined contribution pension plan (the “401(k) Plan”) that is subject to the Employee Retirement Income Security Act of 1974. The 401(k) Plan allows eligible employees to contribute up to the contribution limits established under the IRC. The Company matches each employee’s contribution up to six percent of the employee’s base salary. The Company’s matching contributions to the 401(k) Plan were $2.0 million, $1.9 million and $1.4 million for the years ended December 31, 2016, 2015 and 2014, respectively.
NOTE 10 - INCOME TAXES
Deferred tax assets and liabilities are measured by applying the provisions of enacted tax laws to determine the amount of taxes payable or refundable currently or in future years related to cumulative temporary differences between the tax bases of assets and liabilities and amounts reported in the Company’s balance sheet. The tax effect of the net change in the cumulative temporary differences during each period in the deferred tax assets and liabilities determines the periodic provision for deferred taxes. The provision for income taxes consists of the following:
For the Years Ended December 31, | ||||||||||||
2016 | 2015 | 2014 | ||||||||||
(in thousands) | ||||||||||||
Current tax expense (benefit) | ||||||||||||
Federal | $ | — | $ | (192 | ) | $ | 165 | |||||
State | — | 965 | (16 | ) | ||||||||
Deferred tax expense (benefit) | — | (165,667 | ) | 12,986 | ||||||||
Total income tax expense (benefit) | $ | — | $ | (164,894 | ) | $ | 13,135 | |||||
100
Temporary differences between the financial statement carrying amounts and tax bases of assets and liabilities that give rise to the net deferred tax liability result from the following components:
As of December 31, | ||||||||
2016 | 2015 | |||||||
(in thousands) | ||||||||
Deferred tax liabilities: | ||||||||
Oil and gas properties | $ | 4,136 | $ | — | ||||
Derivative asset | — | 11,328 | ||||||
Total deferred tax liabilities | 4,136 | 11,328 | ||||||
Deferred tax assets: | ||||||||
Federal and state tax net operating loss carryforward | 234,544 | 82,013 | ||||||
Oil and gas properties | — | 93,712 | ||||||
Reclamation costs | 11,841 | 9,907 | ||||||
Stock compensation | 6,694 | 3,907 | ||||||
Accrued compensation | 2,228 | — | ||||||
Settlement liabilities | 2,761 | — | ||||||
AMT credit | 403 | 402 | ||||||
State bonus depreciation addback | 1,481 | 1,613 | ||||||
Other long-term liabilities | 406 | 322 | ||||||
Total deferred tax assets | 260,358 | 191,876 | ||||||
Less: Valuation allowance | 256,222 | 180,548 | ||||||
Total deferred tax assets after valuation allowance | 4,136 | 11,328 | ||||||
Total non-current net deferred tax liability | $ | — | $ | — | ||||
The Company has $618.5 million and $306.2 million of net operating loss carryovers for federal income tax purposes of which $14.4 million and $14.5 million is not recorded as a benefit for financial statement purposes as it relates to tax deductions that are different from the stock-based compensation expense recorded for financial statement purposes as of December 31, 2016 and 2015, respectively. The federal net operating loss carryforward begins to expire in 2031. The benefit of these excess tax deductions will not be recognized for financial statement purposes until the related deductions reduce taxes payable.
Federal income tax expense differs from the amount that would be provided by applying the statutory United States federal income tax rate to income before income taxes primarily due to the effect of state income taxes, rate changes, and other permanent differences, as follows:
For the Years Ended December 31, | ||||||||||||
2016 | 2015 | 2014 | ||||||||||
(in thousands) | ||||||||||||
Federal statutory tax expense (benefit) | $ | (69,633 | ) | $ | (318,654 | ) | $ | 11,696 | ||||
Increase (decrease) in tax resulting from: | ||||||||||||
State tax expense net of federal benefit | (6,358 | ) | (30,178 | ) | 1,106 | |||||||
Rate change and other | 317 | 3,390 | 333 | |||||||||
Valuation allowance | 75,674 | 180,548 | — | |||||||||
Total income tax expense (benefit) | $ | — | $ | (164,894 | ) | $ | 13,135 | |||||
101
Reconciliation of the Company’s effective tax rate to the expected federal tax rate of 35% in 2016, 2015, and 2014 is as follows:
For the Years Ended December 31, | |||||||||
2016 | 2015 | 2014 | |||||||
Expected federal tax rate | 35.00 | % | 35.00 | % | 35.00 | % | |||
State income taxes | 3.2 | % | 3.31 | % | 3.29 | % | |||
Change in tax rate | (0.16 | )% | (0.37 | )% | 1.01 | % | |||
Valuation allowance | (38.04 | )% | (19.83 | )% | — | % | |||
Effective tax rate | — | % | 18.11 | % | 39.30 | % | |||
During the year ended December 31, 2016, the decrease in tax rate was primarily due to placing a valuation allowance against net deferred tax assets. There was no deferred income tax benefit or expense in the accompanying statements of operations. The valuation allowance increased to $256.2 million in 2016 due to continued deterioration of our operational results. Net operating losses are inherently subject to changes in ownership.
During the year ended December 31, 2015, the decrease in tax rate was primarily due to placing a valuation allowance against net deferred tax assets. Total deferred income tax benefit in the accompanying statements of operations $165.7 million. The valuation allowance increased to $181.7 million in 2015.
During the year ended December 31, 2014, the increase in tax rate was primarily due to an increase in permanent differences. Total deferred income tax expense in the accompanying statements of operations is $13.0 million.
The Company had no unrecognized tax benefits as of December 31, 2016, 2015 and 2014.
NOTE 11 - ASSET RETIREMENT OBLIGATIONS
The Company recognizes an estimated liability for future costs to abandon its oil and gas properties. The fair value of the asset retirement obligation is recorded as a liability when incurred, which is typically at the time the asset is acquired or placed in service. There is a corresponding increase to the carrying value of the asset which is included in the proved properties line item in the accompanying balance sheets. The Company depletes the amount added to proved properties and recognizes expense in connection with accretion of the discounted liability over the remaining estimated economic lives of the properties.
The Company’s estimated asset retirement obligation liability is based on historical experience in abandoning wells, estimated economic lives, estimated costs to abandon the wells and regulatory requirements. The liability is discounted using the credit-adjusted risk-free rate estimated at the time the liability is incurred and ranges from 8% to 18%. A reconciliation of the Company’s asset retirement obligation is as follows:
As of December 31, | ||||||||
2016 | 2015 | |||||||
(in thousands) | ||||||||
Beginning of year | $ | 25,688 | $ | 21,626 | ||||
Additional liabilities incurred | 90 | 560 | ||||||
Accretion expense | 2,601 | 1,944 | ||||||
Liabilities settled | (691 | ) | (469 | ) | ||||
Revisions to estimate | 3,145 | 2,027 | ||||||
End of year | $ | 30,833 | $ | 25,688 | ||||
Revisions to the liability could occur due to changes in the estimated economic lives, abandonment costs of the wells, inflation rates, credit-adjusted risk-free rates, along with newly enacted regulatory requirements. In 2016, accretion expense increased over 2015 primarily due to the increase in the credit-adjusted risk-free rate that was in place for the majority of the year. Revisions to estimates for the year ended December 31, 2016 were a result of decreased estimated economic well lives coupled with a decrease in the credit-adjusted risk-free rate applied at year-end and an increase in the inflation rate on wells
102
that had an asset retirement obligation as of the beginning of the year.
For the year ended December 31, 2015, the Company has accrued approximately 162,000 of asset retirement obligations in accounts payable and accrued expenses on the accompanying balance sheets. The Company has accrued $10.6 million of asset retirement obligations in the asset retirement obligations for assets held for sale on the accompanying balance sheets for the year ended December 31, 2015. For additional discussion, please refer to Note 6 - Accounts Payable and Accrued Expenses.
NOTE 12 - FAIR VALUE MEASUREMENTS
The Company follows fair value measurement authoritative guidance, which defines fair value, establishes a framework for using fair value to measure assets and liabilities, and expands disclosures about fair value measurements. The authoritative accounting guidance defines fair value as the price that would be received to sell an asset or paid to transfer a liability in an orderly transaction between market participants at the measurement date. The statement establishes a hierarchy for inputs used in measuring fair value that maximizes the use of observable inputs and minimizes the use of unobservable inputs by requiring that the most observable inputs be used when available. Observable inputs are inputs that market participants would use in pricing the asset or liability developed based on market data obtained from sources independent of the Company. Unobservable inputs are inputs that reflect the Company’s assumptions of what market participants would use in pricing the asset or liability developed based on the best information available in the circumstances. The hierarchy is broken down into three levels based on the reliability of the inputs as follows:
Level 1: Quoted prices are available in active markets for identical assets or liabilities
Level 2: Quoted prices in active markets for similar assets and liabilities, quoted prices for identical or similar instruments in markets that are not active, and model-derived valuations whose inputs are observable or whose significant value drivers are observable
Level 3: Significant inputs to the valuation model are unobservable
Financial and non-financial assets and liabilities are to be classified based on the lowest level of input that is significant to the fair value measurement. The Company’s assessment of the significance of a particular input to the fair value measurement requires judgment and may affect the valuation of the fair value of assets and liabilities and their placement within the fair value hierarchy levels.
The following tables present the Company’s financial and non-financial assets and liabilities that were accounted for at fair value as of December 31, 2016 and 2015 and their classification within the fair value hierarchy:
As of December 31, 2016 | |||||||||||
Level 1 | Level 2 | Level 3 | |||||||||
(in thousands) | |||||||||||
Unproved properties(2) | $ | — | $ | — | $ | 162,682 | |||||
Asset retirement obligations(3) | $ | — | $ | — | $ | 3,145 | |||||
As of December 31, 2015 | |||||||||||
Level 1 | Level 2 | Level 3 | |||||||||
(in thousands) | |||||||||||
Derivative assets(1) | $ | — | $ | 29,566 | $ | — | |||||
Unproved properties(2) | $ | — | $ | — | $ | 185,530 | |||||
Proved properties(2) | $ | — | $ | — | $ | 811,913 | |||||
Asset retirement obligations(3) | $ | — | $ | — | $ | 2,027 | |||||
_______________________________
(1) | This represents a financial asset or liability that is measured at fair value on a recurring basis. |
(2) | This represents non-financial assets that are measured at fair value on a nonrecurring basis due to impairments. This is the fair value of the asset base that was subjected to impairment and does not reflect the entire asset balance as presented on |
103
the accompanying balance sheets. Please refer to the Proved Oil and Gas Properties and Unproved Oil and Gas Properties sections below for additional discussion.
(3) | This represents the revision to estimates of the asset retirement obligation, which is a non-financial liability that is measured at fair value on a nonrecurring basis. Please refer to the Asset Retirement Obligation section below for additional discussion. |
Derivatives
Fair value of all derivative instruments are estimated with industry-standard models that consider various assumptions, including quoted forward prices for commodities, time value of money, volatility factors and current market and contractual prices for the underlying instruments, as well as other relevant economic measures. All valuations were compared against counterparty statements to verify the reasonableness of the estimate. The Company’s commodity swaps and collars were validated by observable transactions for the same or similar commodity options using the NYMEX futures index, and were designated as Level 2 within the valuation hierarchy.
Proved Oil and Gas Properties
Proved oil and gas property costs are evaluated for impairment and reduced to fair value when there is an indication that the carrying costs exceed the sum of the undiscounted cash flows. Depending on the availability of data, the Company uses Level 3 inputs and either the income valuation technique, which converts future amounts to a single present value amount, to measure the fair value of proved properties through an application of risk-adjusted discount rates and price forecasts selected by the Company’s management, or the market valuation approach. The calculation of the risk-adjusted discount rate is a significant management estimate based on the best information available. Management believes that the risk-adjusted discount rate is representative of current market conditions and reflects the following factors: estimates of future cash payments, expectations of possible variations in the amount and/or timing of cash flows, the risk premium and nonperformance risk. The price forecast is based on the Company's internal budgeting model derived from the NYMEX strip pricing, adjusted for management estimates and basis differentials. Future operating costs are also adjusted as deemed appropriate for these estimates. Proved properties classified as held for sale are valued using a market approach, based on an estimated selling price, as evidenced by the most current bid prices received from third parties. If a relevant estimated selling price is not available, the Company utilizes the income valuation technique discussed above. The Company impaired its oil and gas properties in the Mid-Continent region which had a carrying value of $110.0 million to its fair value of $100.0 million and recognized an impairment of $10.0 million for the year ended December 31, 2016. The Company impaired the Dorcheat Macedonia Field which had a carrying value of $431.2 million to its fair value of $110.0 million and recognized an impairment of $321.2 million for the year ended December 31, 2015. The Company impaired the Rocky Mountain region which had a carrying value of $1.1 billion to its fair value of $701.9 million and recognized an impairment of $419.3 million for the year ended December 31, 2015. For additional discussion on impairments, please refer to Note 4 - Impairments.
Unproved Oil and Gas Properties
Unproved oil and gas property costs are evaluated for impairment and reduced to fair value when there is an indication that the carrying costs may not be fully recoverable. To measure the fair value of unproved properties, the Company uses Level 3 inputs and the income valuation technique, which takes into account the following significant assumptions: future development plans, risk weighted potential resource recovery, remaining lease life and estimated reserve values. Unproved properties classified as held for sale are valued using a market approach, based on an estimated selling price, as evidenced by the most current bid prices received from third parties. If a relevant estimated selling price is not available, the Company uses the price received for similar acreage in recent transactions by the Company or other market participants in the principal market. The Company impaired non-core acreage in the Wattenberg Field due to lease expirations, which had a carrying value of $187.4 million to its fair value of $162.7 million and recognized an impairment of unproved properties for the year ended December 31, 2016 of 24.7 million. The Company impaired non-core acreage in the Wattenberg Field due to lease expirations, which had a carrying value of $210.3 million to its fair value of $185.5 million and recognized an impairment of unproved properties for the year ended December 31, 2015 of $24.8 million.The Company also fully impaired the North Park Basin in June 2015, due to a change in the Company’s development plan, recognizing an impairment of unproved properties of $8.7 million.
Asset Retirement Obligation
104
The Company utilizes the income valuation technique to determine the fair value of the asset retirement obligation liability at the point of inception by applying a credit-adjusted risk-free rate, which takes into account the Company’s credit risk, the time value of money, and the current economic state, to the undiscounted expected abandonment cash flows. Upon completion of wells and natural gas plants, the Company records an asset retirement obligation at fair value using Level 3 assumptions. Given the unobservable nature of the inputs, the initial measurement of the asset retirement obligation liability is deemed to use Level 3 inputs. The Company had 3.1 million and 2.0 million of asset retirement obligations recorded at fair value as of December 31, 2016 and 2015, respectively.
Long-term Debt
As of December 31, 2016, the Company had $500.0 million of outstanding 6.75% Senior Notes and $300.0 million of outstanding 5.75% Senior Notes, all of which are unsecured senior obligations. The 6.75% Senior Notes are recorded at cost, plus the unamortized premium and net of deferred financing costs, on the accompanying balance sheets at $498.4 million and $498.1 million as of December 31, 2016 and 2015, respectively. The fair value of the 6.75% Senior Notes as of December 31, 2016 and 2015 was $371.9 million and $301.3 million, respectively. The 5.75% Senior Notes are recorded at cost, net of deferred financing costs, on the accompanying balance sheets at $295.3 million and $294.5 million as of December 31, 2016 and 2015. The fair value of the 5.75% Senior Notes as of December 31, 2016 and 2015 was $222.0 million and $163.1 million, respectively. The Senior Notes are measured using Level 1 inputs based on a secondary market trading price. The Company’s revolving credit facility approximates fair value as the applicable interest rates are floating. The outstanding balance under the revolving credit facility as of December 31, 2016 and 2015 was $191.7 million and $79.0 million, respectively.
NOTE 13 - DERIVATIVES
The Company enters into commodity derivative contracts to mitigate a portion of its exposure to potentially adverse market changes in commodity prices and the associated impact on cash flows. All contracts are entered into for other-than-trading purposes. The Company’s derivatives include swaps and collar arrangements for oil and none of the derivative instruments qualify as having hedging relationships.
In a typical commodity swap agreement, if the agreed upon published third-party index price is lower than the swap fixed price, the Company receives the difference between the index price and the agreed upon swap fixed price. If the index price is higher than the swap fixed price, the Company pays the difference.
Derivative Assets and Liabilities Fair Value
The Company’s commodity derivatives are measured at fair value and are included in the accompanying balance sheets as derivative assets and liabilities. As of December 31, 2016, and as of the filing date of this report, the Company did not have any commodity derivative contracts in place.
The following table contain a summary of all the Company’s derivative positions reported on the accompanying balance sheets as of December 31, 2015:
As of December 31, 2015 | |||||
Balance Sheet Location | Fair Value | ||||
(in thousands) | |||||
Derivative Assets: | |||||
Commodity contracts | Current assets | $ | 29,566 | ||
Commodity contracts | Noncurrent assets | — | |||
Derivative Liabilities: | |||||
Commodity contracts | Current liabilities | — | |||
Commodity contracts | Long-term liabilities | — | |||
Total derivative asset | $ | 29,566 | |||
The following table summarizes the components of the derivative gain (loss) presented on the accompanying statements of operations:
105
For the Years Ended December 31, | ||||||||||||
2016 | 2015 | 2014 | ||||||||||
(in thousands) | ||||||||||||
Derivative cash settlement gain (loss): | ||||||||||||
Oil contracts(1) | $ | 18,333 | $ | 128,258 | $ | 11,523 | ||||||
Gas contracts | — | 2,738 | 715 | |||||||||
Total derivative cash settlement gain (loss)(2) | $ | 18,333 | $ | 130,996 | $ | 12,238 | ||||||
Change in fair value gain (loss) | $ | (29,567 | ) | $ | (74,438 | ) | $ | 109,377 | ||||
Total derivative gain (loss)(2) | $ | (11,234 | ) | $ | 56,558 | $ | 121,615 | |||||
___________________________
(1) | During the year ended December 31, 2015, the Company paid $10.5 million to convert its three-way collars, that settled during the third and fourth quarters of 2015, to two-way collars. |
(2) | Total derivative gain (loss) and the derivative cash settlement gain for the years ended December 31, 2016, 2015 and 2014 is reported in the derivative (gain) loss and derivative cash settlements line items on the accompanying statements of cash flows within the net cash provided by operating activities. |
NOTE 14 - EARNINGS PER SHARE
The Company issues shares of restricted stock entitling the holders to receive non-forfeitable dividends, if and when, the Company was to declare a dividend, before vesting, thus making the awards participating securities. The awards are included in the calculation of earnings per share under the two-class method. The two-class method allocates earnings for the period between common shareholders and unvested participating shareholders and losses to common shareholders only.
The Company issues units, which represent the right to receive, upon vesting, shares of the Company's common stock on a one to one basis up to a share price of $26. In the event the price of the Company's common stock were to exceed $26, the number of shares distributed would be adjusted downward so that the shares distributed would represent a value equivalent to $26 per share.
The Company issues PSUs, which represent the right to receive, upon settlement of the PSUs, a number of shares of the Company’s common stock that range from zero to two times the number of PSUs granted on the award date. The number of potentially dilutive shares related to PSUs is based on the number of shares, if any, that would be issuable at the end of the respective reporting period, assuming that date was the end of the measurement period applicable to such PSUs. Please refer to Note 9 - Stock-Based Compensation for additional discussion.
106
The following table sets forth the calculation of income (loss) per basic and diluted shares from continuing and discontinued operations and net income (loss) for the years ended December 31, 2016, 2015 and 2014:
For the Years Ended December 31, | ||||||||||||
2016 | 2015 | 2014 | ||||||||||
(in thousands, except per share amounts) | ||||||||||||
Income (loss) from continuing operations: | ||||||||||||
Income (loss) from continuing operations | $ | (198,950 | ) | $ | (745,547 | ) | $ | 16,982 | ||||
Less: undistributed income to unvested restricted stock | — | — | 315 | |||||||||
Undistributed income (loss) to common shareholders | (198,950 | ) | (745,547 | ) | 16,667 | |||||||
Basic income (loss) per common share from continuing operations | $ | (4.04 | ) | $ | (15.57 | ) | $ | 0.42 | ||||
Diluted income (loss) per common share from continuing operations | $ | (4.04 | ) | $ | (15.57 | ) | $ | 0.41 | ||||
Income from discontinued operations: | ||||||||||||
Income from discontinued operations | $ | — | $ | — | $ | 3,301 | ||||||
Less: undistributed income to unvested restricted stock | — | — | 62 | |||||||||
Undistributed income to common shareholders | — | — | 3,239 | |||||||||
Basic income per common share from discontinued operations | $ | — | $ | — | $ | 0.08 | ||||||
Diluted income per common share from discontinued operations | $ | — | $ | — | $ | 0.08 | ||||||
Net income (loss): | ||||||||||||
Net income (loss) | $ | (198,950 | ) | $ | (745,547 | ) | $ | 20,283 | ||||
Less: undistributed income to unvested restricted stock | — | — | 377 | |||||||||
Undistributed income (loss) to common shareholders | (198,950 | ) | (745,547 | ) | 19,906 | |||||||
Basic net income (loss) per common share | $ | (4.04 | ) | $ | (15.57 | ) | $ | 0.50 | ||||
Diluted net income (loss) per common share | $ | (4.04 | ) | $ | (15.57 | ) | $ | 0.49 | ||||
Weighted-average shares outstanding - basic | 49,268 | 47,874 | 40,139 | |||||||||
Add: dilutive effect of contingent PSUs | — | — | 151 | |||||||||
Weighted-average shares outstanding - diluted | 49,268 | 47,874 | 40,290 | |||||||||
The Company was in a net loss position for the years ended December 31, 2016 and 2015, which made the 519,362 and 277,634 potentially dilutive shares, anti-dilutive. The Company had no anti-dilutive shares for the year ended and 2014. The participating shareholders are not contractually obligated to share in the losses of the Company, and therefore, the entire net loss is allocated to the outstanding common shareholders.
NOTE 15 - CAPITAL STOCK
On February 6, 2015, the Company completed a public offering of 8,050,000 shares of its common stock generating net proceeds of $202.7 million after deducting underwriter discounts, commissions and offering expenses of approximately $6.6 million. The Company used a portion of the net proceeds to repay all of the then outstanding borrowings under its revolving credit facility and for general corporate purposes, including its drilling and development program and other capital expenditures.
NOTE 16 - OIL AND GAS ACTIVITIES
The Company’s oil and natural gas activities are entirely within the United States. Costs incurred in oil and natural gas producing activities are as follows:
107
For the Years Ended December 31, | ||||||||||||
2016 | 2015 | 2014 | ||||||||||
(in thousands) | ||||||||||||
Acquisition(1) | $ | 97 | $ | 16,270 | $ | 228,616 | ||||||
Development(2)(3) | 31,209 | 393,187 | 659,633 | |||||||||
Exploration | 74 | 6,284 | 5,345 | |||||||||
Total(4) | $ | 31,380 | $ | 415,741 | $ | 893,594 | ||||||
_________________________
(1) | Acquisition costs for unproved properties for the years ended December 31, 2016, 2015 and 2014 were $97,000, $15.3 million and $202.7 million, respectively. There were no acquisition costs for proved properties for the year ended December 31, 2016 and $1.0 million and $25.9 million, for the years ended December 31, 2015 and 2014, respectively. |
(2) | Development costs include workover costs of $6.0 million, $10.0 million and $9.8 million charged to lease operating expense during the years ended December 31, 2016, 2015 and 2014, respectively. |
(3) | Includes amounts relating to asset retirement obligations of $3.1 million, $2.4 million and $6.3 million for the years ended December 31, 2016, 2015 and 2014, respectively. |
Suspended Well Costs
The Company did not incur any exploratory wells costs during the year ended December 31, 2016. During the year ended December 31, 2015, the Company incurred $9.5 million of drilling costs for three exploratory wells, one of which was located in the North Park Basin and the other two were outside of the Company's current development area in southern Arkansas and deemed them all dry holes by the end of 2015. During the year ended December 31, 2014, the Company incurred drilling costs for one exploratory well of $1.0 million and deemed it a dry hole by the end of 2014.
NOTE 17 - DISCLOSURES ABOUT OIL AND GAS PRODUCING ACTIVITIES (UNAUDITED)
The proved reserve estimates at December 31, 2016, 2015 and 2014 are internally generated with an audit performed by NSAI, our third party independent reserve engineers. The estimates of proved reserves are inherently imprecise and are continually subject to revision based on production history, results of additional exploration and development, price changes and other factors.
108
All of BCEI’s oil, natural gas liquids, and natural gas reserves are attributable to properties within the United States. A summary of BCEI’s changes in quantities of proved oil, natural gas liquids, and natural gas reserves for the years ended December 31, 2016, 2015 and 2014 are as follows:
Natural | Natural | ||||||||
Oil | Gas | Gas Liquids | |||||||
(MBbl)(1) | (MMcf) | (MBbl)(1) | |||||||
Balance-December 31, 2013 | 46.482 | 139.614 | — | ||||||
Extensions and discoveries(2) | 13.222 | 41.963 | — | ||||||
Production | (6.018 | ) | (14.114 | ) | — | ||||
Sales of minerals in place | (0.043 | ) | (0.073 | ) | — | ||||
Purchases of minerals in place | 0.709 | 1.214 | — | ||||||
Revisions to previous estimates(3) | 3.76 | 19.947 | — | ||||||
Balance-December 31, 2014 | 58.112 | 188.551 | — | ||||||
Three stream conversion adjustment | (3.352 | ) | — | 3.352 | |||||
Extensions and discoveries(2) | 6.936 | 15.849 | 2.43 | ||||||
Production | (6.072 | ) | (14.11 | ) | (1.676 | ) | |||
Purchases of minerals in place | 0.719 | 3.521 | 0.234 | ||||||
Revisions to previous estimates(3) | 1.05 | (49.584 | ) | 15.578 | |||||
Balance-December 31, 2015 | 57.393 | 144.227 | 19.918 | ||||||
Extensions, discoveries and infills(2) | 6.133 | 15.128 | 2.142 | ||||||
Production | (4.31 | ) | (11.907 | ) | (1.491 | ) | |||
Sales of minerals in place | (0.1 | ) | (0.343 | ) | (0.035 | ) | |||
Revisions to previous estimates(3) | (9.02 | ) | (9.06 | ) | (2.987 | ) | |||
Balance-December 31, 2016 | 50.096 | 138.045 | 17.547 | ||||||
Proved developed reserves: | |||||||||
December 31, 2014 | 30.542 | 94.494 | — | ||||||
December 31, 2015 | 28.892 | 77.48 | 10.359 | ||||||
December 31, 2016 | 26.313 | 85.972 | 9.951 | ||||||
Proved undeveloped reserves: | |||||||||
December 31, 2014 | 27.57 | 94.057 | — | ||||||
December 31, 2015 | 28.501 | 66.747 | 9.559 | ||||||
December 31, 2016 | 23.783 | 52.073 | 7.596 | ||||||
________________________
(1) | Natural gas liquid reserves were classified with oil reserves through December 31, 2014. Natural gas liquids are separately accounted for effective as of January 1, 2015, resulting in three-stream presentation. Effective January 1, 2015 the Company revised the agreements with its natural gas processors in the Rocky Mountain region to sell and report operated sales volumes on a three stream basis, which allows for separate reporting of NGLs extracted from the natural gas stream and sold as a separate product. The contract revisions necessitated a change in the Company's reporting of estimated reserve volumes. Prior period estimated reserve volumes have not been reclassified to conform to the current presentation given the prospective nature of the agreements. |
(2) | At December 31, 2016, horizontal development in the Wattenberg Field resulted in additions of 1,632 MBoe and infill down-spacing within the Wattenberg Field resulted in 9,164 MBoe to the additions, extensions and infills category. |
At December 31, 2015, horizontal development in the Wattenberg Field resulted in additions in extensions and discoveries of 11,708 MBoe, which is 97% of our total additions of 12,008 MBoe. The remainder of the additions were the result of vertical drilling during the year in the Dorcheat Macedonia Field, Mid-Continent region.
109
At December 31, 2014, horizontal development in the Wattenberg Field, Rocky Mountain region, resulted in additions in extensions and discoveries of 18,980 MBoe, which is 94% of our total additions of 20,216 MBoe. The remainder of the additions came from our Dorcheat Madedonia Field, Mid-Continent region.
(3) | As of December 31, 2016, the Company revised its proved reserves downward by 13,517 MBoe. The commodity prices at December 31, 2016 decreased to $42.75 per Bbl WTI and $2.48 per MMBtu HH from $50.28 per Bbl WTI and $2.59 per MMBtu HH at December 31, 2015. The negative effects of commodity price reductions on reserves were offset by lower cost estimates to drill and complete future development locations in the Wattenberg Field along with lower operating cost estimates across the Company's operations to reflect a positive reserves adjustment (net of price reductions) of 4,652 MBoe. Also, all future proved undeveloped locations in the Mid-Continent region were demoted to non-proved reserves resulting in a negative revision of 7,761 MBoe. In the Wattenberg Field, certain proved undeveloped locations totaling 8,611 MBoe were demoted due to them not being centric to current infrastructure. The Company also had negative other engineering revisions of 1,797 MBoe in 2016. |
As of December 31, 2015, the Company revised its proved reserves upward by 8,364 Mboe. The Company was successful in offsetting the negative pricing revision of 28,810 Mboe that resulted from a decrease in commodity price from $94.99 per Bbl WTI and $4.35 per MMBtu HH for the year ended December 31, 2014 to $50.28 per Bbl WTI and $2.59 per MMBtu HH for the year ended December 31, 2015, by reducing the costs to drill and complete wells in both the Rocky Mountain and Mid-Continent regions and improving reserves by increasing productivity of proved developed producing wells in the Wattenberg Field horizontal program. Total positive engineering revisions as of December 31, 2015, were 37,174 MBoe, of which 30,086 MBoe (81%) related to reserve changes in the Wattenberg Field. In the Wattenberg Field, the majority of the positive revisions resulted from a combination of decreased drilling and completion costs of 29% ($3.0 million per standard reach lateral well as of December 31, 2015 compared to $4.2 million as of December 31, 2014) and an increase in productivity from horizontal proved developed producing wells which increased the offsetting proved undeveloped reserves. The increase in proved developed producing reserves is primarily attributed to the installation of infrastructure in the east side of the Wattenberg Field. Another significant contribution to the positive reserve revision in the Wattenberg Field is a contract change as of January 1, 2015 which gives the Company ownership of the natural gas liquids from the Company's gas production. This conversion from two stream (wet gas and oil) to three stream (dry gas, natural gas liquids and oil) added 8,560 MBoe to the Company's proved reserves as of December 31, 2015.
As of December 31, 2014, we revised our proved reserves upward by 7,333 Mboe, excluding pricing revisions, due primarily to the addition of 49 new proved undeveloped locations on 80-acre spacing, directly offsetting economic proved producing wells drilled prior to 2014, 21 diagonal offsets to economic proved producing wells and 12 proved undeveloped locations greater than one offset to economic proved producing wells but within developed areas and surrounded by proved producing wells. As of December 31, 2014, approximately 70% of our horizontal development in the Wattenberg Field was in the Niobrara B formation. A total of 119 horizontal proved undeveloped locations were added to the proved reserves at December 31, 2014 to either extensions and discoveries or revisions to previous estimates. The positive engineering revision was offset by a small negative performance revision of approximately 540 MBoe. A small negative pricing revision of 248 MBoe resulted from a decrease in average commodity price from $96.91 per Bbl WTI and $3.67 per MMBtu HH for the year ended December 31, 2013 to $94.99 per Bbl WTI and $4.35 per MMBtu HH for the year ended December 31, 2014.
The standardized measure of discounted future net cash flows relating to proved oil and natural gas reserves were prepared in accordance with accounting authoritative guidance. Future cash inflows were computed by applying prices to estimated future production. Future production and development costs are computed by estimating the expenditures to be incurred in developing and producing the proved oil and natural gas reserves at year-end, based on costs and assuming continuation of existing economic conditions.
Future income tax expenses are calculated by applying appropriate year-end tax rates to future pretax net cash flows relating to proved oil and natural gas reserves. Future income tax expenses give effect to permanent differences, tax credits and loss carryforwards relating to the proved oil and natural gas reserves. Future net cash flows are discounted at a rate of 10% annually to derive the standardized measure of discounted future net cash flows. This calculation procedure does not necessarily result in an estimate of the fair market value or the present value of the Company's oil and natural gas properties.
110
The standardized measure of discounted future net cash flows relating to proved oil and natural gas reserves are as follows:
For the Years Ended December 31, | ||||||||||||
2016 | 2015 | 2014 | ||||||||||
(in thousands) | ||||||||||||
Future cash flows | $ | 2,424,415 | $ | 3,122,574 | $ | 5,780,745 | ||||||
Future production costs | (1,365,765 | ) | (1,706,607 | ) | (2,257,572 | ) | ||||||
Future development costs | (468,804 | ) | (697,045 | ) | (952,041 | ) | ||||||
Future income tax expense | — | — | (457,625 | ) | ||||||||
Future net cash flows | 589,846 | 718,922 | 2,113,507 | |||||||||
10% annual discount for estimated timing of cash flows | (312,891 | ) | (391,106 | ) | (1,006,131 | ) | ||||||
Standardized measure of discounted future net cash flows | $ | 276,955 | $ | 327,816 | $ | 1,107,376 | ||||||
Future cash flows as shown above were reported without consideration for the effects of derivative transactions outstanding at period end.
The changes in the standardized measure of discounted future net cash flows relating to proved oil and natural gas reserves are as follows:
For the Years Ended December 31, | ||||||||||||
2016 | 2015 | 2014 | ||||||||||
(in thousands) | ||||||||||||
Beginning of period | $ | 327,816 | $ | 1,107,376 | $ | 925,283 | ||||||
Sale of oil and gas produced, net of production costs | (123,494 | ) | (197,643 | ) | (435,792 | ) | ||||||
Net changes in prices and production costs | (126,536 | ) | (1,117,624 | ) | (331,930 | ) | ||||||
Extensions, discoveries and improved recoveries | 22,800 | 76,429 | 492,144 | |||||||||
Development costs incurred | 19,701 | 84,180 | 116,958 | |||||||||
Changes in estimated development cost | 281,062 | 178,003 | (15,131 | ) | ||||||||
Purchases of minerals in place | — | (971 | ) | 30,919 | ||||||||
Sales of minerals in place | 16 | — | (1,173 | ) | ||||||||
Revisions of previous quantity estimates | (182,938 | ) | (170,277 | ) | 122,169 | |||||||
Net change in income taxes | — | 233,086 | 68,856 | |||||||||
Accretion of discount | 32,782 | 134,046 | 122,722 | |||||||||
Changes in production rates and other | 25,746 | 1,211 | 12,351 | |||||||||
End of period | $ | 276,955 | $ | 327,816 | $ | 1,107,376 | ||||||
The average wellhead prices used in determining future net revenues related to the standardized measure calculation as of December 31, 2016, 2015 and 2014 were calculated using the twelve-month arithmetic average of first-day-of-the-month price inclusive of adjustments for quality and location.
For the Years Ended December 31, | ||||||||||||
2016 | 2015 | 2014 | ||||||||||
Oil (per Bbl) | $ | 38.42 | $ | 44.00 | $ | 84.28 | ||||||
Gas (per Mcf) | $ | 2.07 | $ | 2.33 | $ | 5.24 | ||||||
Natural gas liquids (per Bbl) | $ | 12.12 | 12.90 | N/A | ||||||||
111
NOTE 18 - QUARTERLY FINANCIAL DATA (UNAUDITED)
The following is a summary of the unaudited quarterly financial data for the years ended December 31, 2016 and 2015:
Three Months Ended | ||||||||||||||||
March 31 | June 30 | September 30 | December 31 | |||||||||||||
(in thousands, except per share data) | ||||||||||||||||
2016 | ||||||||||||||||
Oil and gas sales | $ | 44,174 | $ | 54,530 | $ | 49,325 | $ | 47,266 | ||||||||
Operating profit (loss)(1) | (2,446 | ) | 5,054 | 5,162 | 4,509 | |||||||||||
Net loss | (47,237 | ) | (49,477 | ) | (34,902 | ) | (67,334 | ) | ||||||||
Basic net loss per common share | $ | (0.96 | ) | $ | (1.00 | ) | $ | (0.71 | ) | $ | (1.37 | ) | ||||
Diluted net loss per common share | $ | (0.96 | ) | $ | (1.00 | ) | $ | (0.71 | ) | $ | (1.37 | ) | ||||
2015 | ||||||||||||||||
Oil and gas sales | $ | 73,076 | $ | 90,422 | $ | 72,149 | $ | 57,032 | ||||||||
Operating loss(1) | (11,688 | ) | (4,546 | ) | (9,133 | ) | (21,910 | ) | ||||||||
Net loss | (18,421 | ) | (41,164 | ) | (112,299 | ) | (573,663 | ) | ||||||||
Basic net loss per common share | $ | (0.41 | ) | $ | (0.83 | ) | $ | (2.25 | ) | $ | (12.08 | ) | ||||
Diluted net loss per common share | $ | (0.41 | ) | $ | (0.83 | ) | $ | (2.25 | ) | $ | (12.08 | ) | ||||
_________________________
(1) | Oil and gas sales less lease operating expense, gas plant and midstream operating expense, severance and ad valorem taxes, depreciation, and depletion and amortization. |
NOTE 19 - SUBSEQUENT EVENTS
Chapter 11 Proceedings
On January 4, 2017, the Company and certain of its subsidiaries (collectively with the Company, the “Debtors”) filed voluntary petitions (the “Bankruptcy Petitions,” and the cases commenced thereby, the “Chapter 11 Cases”) under Chapter 11 of the United States Bankruptcy Code (the “Bankruptcy Code”) in the United States Bankruptcy Court for the District of Delaware (the “Bankruptcy Court”) to pursue the Debtors’ Joint Prepackaged Plan of Reorganization Under Chapter 11 of the Bankruptcy Code (as proposed, the “Prepackaged Plan”). The Bankruptcy Court has granted the Debtors' motion seeking to administer all of the Debtors' Chapter 11 Cases jointly under the caption In re Bonanza Creek Energy, Inc., et al (Case No. 17-10015). The Debtors will continue to operate their businesses as “debtors in possession” under the jurisdiction of the Bankruptcy Court and in accordance with the applicable provisions of the Bankruptcy Code and orders of the Bankruptcy Court. The Bankruptcy Court has granted all of the first day motions filed by the Debtors that were designed primarily to minimize the impact of the Chapter 11 proceedings on the Company's operations, customers and employees. As a result, the Company is not only able to conduct normal business activities and pay all associated obligations for the period following its bankruptcy filing, but it is also authorized to pay and has paid pre-petition employee wages and benefits, pre-petition amounts owed to certain lienholders and vendors providing services and supplies to lease operations, pre-petition amounts owed to counterparts that transport or purchase the Company’s production, and funds belonging to third parties, including royalty holders and joint working interest owners. During the pendency of the Chapter 11 case, all transactions outside the ordinary course of our business require the prior approval of the Bankruptcy Court.
The subsidiary Debtors in the Chapter 11 Cases are: Bonanza Creek Energy Operating Company, LLC; Bonanza Creek Energy Resources, LLC; Holmes Eastern Company, LLC; Rocky Mountain Infrastructure, LLC; Bonanza Creek Energy Upstream LLC; and Bonanza Creek Energy Midstream, LLC.
As of January 4, 2017, the Company had approximately (i) $191.7 million outstanding under its revolving credit facility, (ii) $531.9 million in outstanding obligations under the 6.75% Senior Notes and (iii) $335.2 million outstanding under the 5.75% Senior Notes. The revolving credit facility and Senior Notes provide that as a result of the commencement of the Chapter 11 Cases, the principal and accrued interest due thereunder shall be immediately due and payable. Any efforts to enforce such payment obligations under the Debt Instruments are automatically stayed as a result of the filing of the
112
Bankruptcy Petitions, and the creditors’ rights of enforcement in respect of the Debt Instruments are subject to the applicable provisions of the Bankruptcy Code and orders of the Bankruptcy Court.
A confirmation hearing on the Prepackaged Plan and the associated Disclosure Statement is currently scheduled to begin on April 3, 2017.
Automatic Stay
Subject to certain specific exceptions under the Bankruptcy Code, the Chapter 11 filings automatically stayed most judicial or administrative actions against the Company and the Chapter 11 Subsidiaries as well as efforts by creditors to collect on or otherwise exercise rights or remedies with respect to pre-petition claims. As a result, for example, most creditor actions to obtain possession of property from us or any of the Chapter 11 Subsidiaries, or to create, perfect or enforce any lien against our property or any of the Chapter 11 Subsidiaries, or to collect on or otherwise exercise rights or remedies with respect to a pre-petition claim are stayed.
Restructuring Support Agreement
On December 23, 2016, Bonanza Creek Energy, Inc. and its subsidiaries entered into a Restructuring Support Agreement (the “RSA”) with (i) holders (collectively, the “Supporting Noteholders”) of approximately 51% in aggregate principal amount of Bonanza’s 5.75% Senior Notes due 2023 and 6.75% Senior Notes due 2021 and (ii) NGL Energy Partners, LP and NGL Crude Logistics, LLC (collectively, and together with the Company and the Supporting Noteholders, the “RSA Parties”).
The RSA provides for, among other things, (a) the equitization of the Company’s unsecured obligations pursuant to the Plan, including approximately $800 million in principal amount of Senior Notes, (b) a fully backstopped rights offering for the purchase of $200 million of common stock of reorganized Bonanza Creek Energy, Inc. (“Reorganized Bonanza”), and (c) the entry into a new crude oil purchase agreement between the Company and NGL Crude Logistics, LLC (collectively the “Restructuring Transactions”).
The RSA contains certain covenants on the part of each of the RSA Parties, including limitations on the Company’s ability to pursue transactions other than the Restructuring, commitments by the Supporting Noteholders and NGL to vote in favor of the Plan, commitments by the RSA Parties to negotiate in good faith to finalize the documents and agreements governing the Restructuring and otherwise facilitate the Restructuring Transactions. The RSA also provides for customary conditions to the obligations of the parties and for termination by mutual agreement or upon the occurrence of certain events, including without limitation, the failure to achieve certain milestones.
Plan of Reorganization
The Plan, which is subject to approval of the Bankruptcy Court, contemplates that, among other things, on the effective date of the Plan (the “Effective Date”):
• | The Senior Notes and existing common shares of Bonanza (“Existing Common Shares”) will be canceled, and Reorganized Bonanza will issue (i) new common shares (the “New Common Shares”), (ii) three (3) year warrants (the “Warrants”) entitling their holders upon exercise thereof, on a pro rata basis, to 7.5% of the total outstanding New Common Shares at a per share price based upon a total equity value of $1,450,000,000 of the Reorganized Bonanza, and (iii) rights (the “Subscription Rights”) to acquire the New Common Shares offered in connection with the Rights Offering (“Rights Offering Equity”), each of which will be distributed as set forth below; |
• | Holders of allowed claims (“RBL Claims”) on account of debt arising under the revolving credit facility shall be entitled to receive, in full and final satisfaction of its allowed RBL Claim; |
• | Holders of allowed general unsecured claims against Bonanza shall be entitled to receive their ratable share of: (a) 29.4% of the New Common Shares, subject to dilution by the Rights Offering Equity, the Management Incentive Plan (as defined in the Plan) and the Warrants and (b) 37.8% of the Subscription Rights; |
• | Holders of allowed general unsecured claims against Bonanza Creek Operating, shall receive their ratable share of 17.6% of the New Common Shares subject to dilution by the Rights Offering Equity, the Management Incentive Plan and the Warrants. |
113
• | Holders of allowed general unsecured claims against Debtors other than Bonanza and Bonanza Creek Operating, shall receive their ratable share of: (a) 48.5% of the New Common Shares, subject to dilution by the Rights Offering Equity, the Management Incentive Plan (as defined in the Plan) and the Warrants and (b) 62.2% of the Subscription Rights; |
• | Holders of Existing Common Shares shall neither receive any distributions nor retain any property on account thereof pursuant to the Plan. Notwithstanding the foregoing, on or as soon as reasonably practicable after the Effective Date, holders of Existing Common Shares shall receive, in exchange for the releases by such holders of the Released Parties (as defined in the Plan), their ratable share of (i) 4.5% of the New Common Shares, subject to dilution by the Rights Offering Equity, the Management Incentive Plan and the Warrants and (ii) the Warrants (the “Settlement Consideration”); provided, however, that any holder of Existing Common Shares that opts not to grant the voluntary releases contained in section 11.8 of the Plan shall not be entitled to receive its ratable share of the Settlement Consideration; |
• | Holders of allowed Administrative Expense Claims, Priority Tax Claims, Other Priority Claims, and Unsecured Trade Claims (each as defined in the Plan) shall be entitled to payment in full in cash or other treatment that will render such claim unimpaired under section 1124 of the Bankruptcy Code; |
• | Holders of allowed Other Secured Claims (as defined in the Plan) shall be entitled to payment in full in cash; reinstatement of the legal, equitable and contractual rights of the holder of such claim; a distribution of the proceeds of the sale or disposition of the collateral securing such claim, in each case, solely to the extent of the value of the holder’s secured interest in such collateral; return of collateral securing such claim; or other treatment that will render such claim unimpaired under section 1124 of the Bankruptcy Code. |
Executory Contracts
Subject to certain exceptions, under the Bankruptcy Code, the Company and the Chapter 11 Subsidiaries may assume, assign, or reject certain executory contracts and unexpired leases subject to the approval of the Bankruptcy Court and fulfillment of certain other conditions. The rejection of an executory contract or unexpired lease is generally treated as a pre-petition breach of such executory contract or unexpired lease and, subject to certain exceptions, relieves the Company and the Chapter 11 Subsidiaries of performing their future obligations under such executory contract or unexpired lease but may give rise to a general unsecured claim against us or the applicable Chapter 11 Subsidiaries for damages caused by such rejection. The assumption of an executory contract or unexpired lease generally requires the Company and the Chapter 11 Subsidiaries to cure existing monetary defaults under such executory contract or unexpired lease and provide adequate assurance of future performance. Any description of the treatment of an executory contract or unexpired lease with the Company or any of the Chapter 11 Subsidiaries, including any description of the obligations under any such executory contract or unexpired lease, is qualified by and subject to any rights we have with respect to executory contracts and unexpired leases under the Bankruptcy Code.
On February 3, 2017, the Company and the Chapter 11 Subsidiaries filed motions (the “9019 Motions”) to approve settlements with Silo Energy, LLC and NGL pursuant to Rule 9019 of the Federal Rules of Bankruptcy Procedure and to authorize the termination and release with Silo and the assumption of certain amended agreements with NGL pursuant to section 365 of the Bankruptcy Code. As set forth in detail in the 9019 Motions, the settlements provide for the material modification of the agreements and certain claims, guarantees, and payments in favor of the Company. The hearing to consider the 9019 Motions is scheduled for April 3, 2017. Please refer to Note 8 - Commitments and Contingencies for additional discussion.
Chapter 11 Filing Impact on Creditors and Shareholders
Under the priority requirements established by the Bankruptcy Code, unless creditors agree otherwise, pre-petition liabilities to creditors and post-petition liabilities must be satisfied in full before the holders of our existing common stock are entitled to receive any distribution or retain any property under a plan of reorganization. The ultimate recovery to creditors, if any, will not be determined until confirmation and implementation of the Plan. The outcome of the Chapter 11 proceedings remains uncertain at this time and, as a result, we cannot accurately estimate the amounts or value of distributions that creditors may receive.
Backstop Commitment Agreement
On December 23, 2016, the Company entered into a backstop commitment agreement (the “Backstop Commitment Agreement”) with the Supporting Noteholders party thereto (collectively, the “Backstop Parties”), whereby each Backstop Party agreed to backstop the Rights Offering in a certain specified amount (collectively, the “Backstop Commitments”).
114
Pursuant to the Backstop Commitment Agreement, each of the Backstop Parties, severally and not jointly, agreed to participate in the Rights Offering and purchase the Rights Offering Shares in accordance with the percentages set forth in the Backstop Commitment Agreement (the “Backstop Party Percentages”) to the extent unsubscribed under the Rights Offering. In exchange for providing the Backstop Commitments, the Company has agreed to pay the Backstop Parties, subject to approval by the Bankruptcy Court, a backstop commitment fee in an amount equal to six percent of the aggregate amount of the Backstop Commitments payable in New Common Shares issued at the same price as the Rights Offering Equity, and to reimburse the administrative expenses incurred by the Backstop Parties in connection with the Backstop Commitment Agreement.
The Backstop Commitment Agreement will be terminable by the Company and/or the Requisite Commitment Parties (as defined in the Backstop Commitment Agreement) upon certain customary events specified therein, including, among others, (i) the termination of the RSA, (ii) the failure to meet certain specified milestones, or (iii) (A) the Bankruptcy Court approves or authorizes the Company to enter into an Alternative Transaction (as defined in the Backstop Commitment Agreement) or (B) entry by the Company into any contract providing for the consummation of any Alternative Transaction or files any motion or application seeking authority to propose, join in or participate in the formation of, any actual or proposed Alternative Transaction. The Company may be required to pay a termination fee in the amount of $8,000,000 to non-defaulting Backstop Parties if the Backstop Commitment Agreement is terminated under certain conditions.
Restrictions on Trading of Our Equity Securities to Protect Our Use of Net Operating Losses
The Bankruptcy Court has issued a final order pursuant to Sections 105(a), 362(a)(3) and 541 of the Bankruptcy Code enabling us and the Chapter 11 Subsidiaries to avoid limitations on the use of our income tax net operating loss carryforwards and certain other tax attributes by imposing certain notice procedures and transfer restrictions on the trading of our equity securities. In general, the order applies to any person that, directly or indirectly, beneficially owns (or would beneficially own as a result of a proposed transfer) at least 5.0 percent of our outstanding common stock (a “Substantial Stockholder”), and requires that each Substantial Stockholder file with the Bankruptcy Court and serve us with notice of such status. Under the order, prior to any proposed acquisition or disposition of equity securities that would result in an increase or decrease in the amount of our equity securities owned by a Substantial Stockholder, or that would result in a person or entity becoming a Substantial Stockholder, such person or entity is required to file with the Bankruptcy Court and notify us of such acquisition or disposition. We have the right to seek an injunction from the Bankruptcy Court to prevent certain acquisitions or sales of our common stock if the acquisition or sale would pose a material risk of adversely affecting our ability to utilize such tax attributes.
Risks Associated with Chapter 11 Proceedings
For the duration of our Chapter 11 proceedings, our operations and our ability to develop and execute our business plan are subject to the risks and uncertainties associated with the Chapter 11 proceedings as described in Item 1A, “Risk Factors.” As a result of these risks and uncertainties, our assets, liabilities, officers and/or directors could be significantly different following the outcome of the Chapter 11 proceedings, and the description of our operations, properties and capital plans included in this Annual Report may not accurately reflect our operations, properties and capital plans following the Chapter 11 process.
Item 9. Changes in and Disagreements with Accountants on Accounting and Financial Disclosure.
None.
Item 9A. Controls and Procedures.
Evaluation of Disclosure Controls and Procedures
Our management, with the participation of our principal executive officer and principal financial officer, evaluated the effectiveness of our disclosure controls and procedures as of December 31, 2016. The term “disclosure controls and procedures,” as defined in Rules 13a-15(e) and 15d-15(e) under the Exchange Act, means controls and other procedures of a company that are designed to ensure that information required to be disclosed by a company in the reports that it files or submits under the Exchange Act is recorded, processed, summarized and reported, within the time periods specified in SEC rules and forms. Disclosure controls and procedures include, without limitation, controls and procedures designed to ensure that information required to be disclosed by a company in the reports that it files or submits under the Exchange Act is accumulated and communicated to the company’s management, including its principal executive and principal financial officers and internal audit function, as appropriate to allow timely decisions regarding required disclosure. Based on the evaluation of our disclosure controls and procedures as of December 31, 2016, our principal executive officer and principal financial officer concluded that, as of such date, our disclosure controls and procedures were effective at the reasonable assurance level.
115
Management recognizes that any controls and procedures, no matter how well designed and operated, can provide only reasonable assurance of achieving their objectives and management necessarily applies its judgment in evaluating the cost‑benefit relationship of possible controls and procedures. To assist management, we have established an internal audit function to verify and monitor our internal controls and procedures. The Company’s internal control system is supported by written policies and procedures, contains self-monitoring mechanisms and is audited by the internal audit function. Appropriate actions are taken by management to correct deficiencies as they are identified.
Management’s Assessment of Internal Control Over Financial Reporting
The Company’s management is responsible for establishing and maintaining adequate internal control over financial reporting, as defined in Exchange Act Rule 13a-15(f). The Company’s internal control over financial reporting is a process designed under the supervision of the Company’s Chief Executive Officer and Principal Financial Officer to provide reasonable assurance regarding the reliability of financial reporting and the preparation of consolidated financial statements for external purposes in accordance with accounting principles generally accepted in the United States. Because of its inherent limitations, internal control over financial reporting may not detect or prevent misstatements. Also, projections of any evaluation of the effectiveness to future periods are subject to the risk that controls may become inadequate because of changes in conditions, or that the degree of compliance with the policies or processes may deteriorate.
As of December 31, 2016, management assessed the effectiveness of our internal control over financial reporting based on the criteria for effective internal control over financial reporting established in Internal Control-Integrated Framework, issued by the Committee of Sponsoring Organizations of the Treadway Commission in 2013. Based on the assessment, management determined that the Company maintained effective internal control over financial reporting as of December 31, 2016, based on those criteria. Management included in its assessment of internal control over financial reporting all consolidated entities.
Hein & Associates LLP, the independent registered public accounting firm that audited the consolidated financial statements included in this Annual Report on Form 10-K, has issued an attestation report on the effectiveness of internal control over financial reporting as of December 31, 2016, which is included in the consolidated financial statements in Item 8, Part II of this Annual Report on Form 10-K.
Changes in Internal Control over Financial Reporting
There were no changes in our internal control over financial reporting identified in management’s evaluation pursuant to Rules 13a-15(d) or 15d-15(d) of the Exchange Act during the year ended December 31, 2016 that materially affected, or are reasonably likely to materially affect, our internal control over financial reporting.
REPORT OF INDEPENDENT REGISTERED PUBLIC ACCOUNTING FIRM
To the Board of Directors and Stockholders
Bonanza Creek Energy Inc.
We have audited Bonanza Creek Energy, Inc. and subsidiaries’ internal control over financial reporting as of December 31, 2016, based on criteria established in Internal Control - Integrated Framework issued by the Committee of Sponsoring Organizations of the Treadway Commission in 2013. Bonanza Creek Energy, Inc.’s management is responsible for maintaining effective internal control over financial reporting and for its assessment of the effectiveness of internal control over financial reporting included in the accompanying Management’s Assessment of on Internal Control Over Financial Reporting. Our responsibility is to express an opinion on the company’s internal control over financial reporting based on our audit.
We conducted our audit in accordance with the standards of the Public Company Accounting Oversight Board (United States). Those standards require that we plan and perform the audit to obtain reasonable assurance about whether effective internal control over financial reporting was maintained in all material respects. Our audit included obtaining an understanding of internal control over financial reporting, assessing the risk that a material weakness exists, and testing and evaluating the design and operating effectiveness of internal control based on the assessed risk. Our audit also included performing such other procedures as we considered necessary in the circumstances. We believe that our audit provides a reasonable basis for our opinion.
A company’s internal control over financial reporting is a process designed to provide reasonable assurance regarding the reliability of financial reporting and the preparation of financial statements for external purposes in accordance with generally accepted accounting principles. A company’s internal control over financial reporting includes those policies and procedures that (a) pertain to the maintenance of records that, in reasonable detail, accurately and fairly reflect the transactions and dispositions of the assets of the company; (b) provide reasonable assurance that transactions are recorded as necessary to permit preparation of financial
116
statements in accordance with generally accepted accounting principles, and that receipts and expenditures of the company are being made only in accordance with authorizations of management and directors of the company; and (c) provide reasonable assurance regarding prevention or timely detection of unauthorized acquisition, use, or disposition of the company’s assets that could have a material effect on the financial statements.
Because of its inherent limitations, internal control over financial reporting may not prevent or detect misstatements. Also, projections of any evaluation of effectiveness to future periods are subject to the risk that controls may become inadequate because of changes in conditions, or that the degree of compliance with the policies or procedures may deteriorate.
In our opinion, Bonanza Creek Energy, Inc. maintained, in all material respects, effective internal control over financial reporting as of December 31, 2016, based on criteria established in Internal Control - Integrated Framework issued by the Committee of Sponsoring Organizations of the Treadway Commission in 2013.
We have also audited, in accordance with the standards of the Public Company Accounting Oversight Board (United States), the consolidated balance sheets of Bonanza Creek Energy, Inc. and subsidiaries as of December 31, 2016 and 2015, and the related consolidated statements of operations and comprehensive income, stockholders’ equity, and cash flows for each of the three years in the period ended December 31, 2016, and our report dated March 15, 2017 expressed an unqualified opinion. Our report dated March 15, 2017 contains an explanatory paragraph that states there is substantial doubt about the Company’s ability to continue as a going concern.
Hein & Associates LLP
Denver, Colorado
March 15, 2017
Item 9B. Other Information.
None.
117
PART III
Item 10. Directors, Executive Officers and Corporate Governance.
The information required by this item will be incorporated by reference in a future filing with the SEC within 120 days after the end of the fiscal year ended December 31, 2016.
Our board of directors has adopted a Code of Business Conduct and Ethics applicable to all officers, directors and employees, which is available on our website (www.bonanzacrk.com) under “Corporate Governance” under the “For Investors” tab. We will provide a copy of this document to any person, without charge, upon request, by writing to us at Bonanza Creek Energy, Inc., Investor Relations, 410 17th Street, Suite 1400, Denver, Colorado 80202. We intend to satisfy the disclosure requirement under Item 406(c) of Regulation S‑K regarding an amendment to, or waiver from, a provision of our Code of Business Conduct and Ethics by posting such information on our website at the address and the location specified above.
Item 11. Executive Compensation.
The information required by this item will be incorporated by reference in a future filing with the SEC within 120 days after the end of the fiscal year ended December 31, 2016.
Item 12. Security Ownership of Certain Beneficial Owners and Management and Related Stockholder Matters.
The information required by this item will be incorporated by reference in a future filing with the SEC within 120 days after the end of the fiscal year ended December 31, 2016.
Item 13. Certain Relationships and Related Transaction and Director Independence.
The information required by this item will be incorporated by reference in a future filing with the SEC within 120 days after the end of the fiscal year ended December 31, 2016.
Item 14. Principal Accounting Fees and Services.
The information required by this item will be incorporated by reference in a future filing with the SEC within 120 days after the end of the fiscal year ended December 31, 2016.
118
PART IV
Item 15. Exhibits, Financial Statement Schedules.
(a) | The following documents are filed as a part of this Annual Report on Form 10-K or incorporated herein by reference: |
(1) | Financial Statements: |
See Item 8. Financial Statements and Supplementary Data.
(2) | Financial Statement Schedules: |
None.
(3) | Exhibits: |
The information required by this Item is set forth on the exhibit index that follows the signature page to this Annual Report on Form 10-K.
119
SIGNATURES
Pursuant to the requirements of Section 13 or 15(d) of the Securities Exchange Act of 1934, the registrant has duly caused this report to be signed on its behalf by the undersigned, thereunto duly authorized.
BONANZA CREEK ENERGY, INC. | ||
By: | /s/ Richard J. Carty | |
Richard J. Carty, President and Chief Executive Officer (principal executive officer) | ||
March 15, 2017
KNOW ALL MEN BY THESE PRESENTS, that each person whose signature appears below constitutes and appoints Richard J. Carty, Scott A. Fenoglio, Cyrus D. Marter IV and Wade E. Jaques and each of them severally, his true and lawful attorney or attorneys-in-fact and agents, with full power to act with or without the others and with full power of substitution and resubstitution, to execute in his name, place and stead, in any and all capacities, any or all amendments to this report, and to file the same, with all exhibits thereto, and other documents in connection therewith, with the Securities and Exchange Commission, granting unto said attorneys-in-fact and agents and each of them, full power and authority to do and perform in the name of on behalf of the undersigned, in any and all capacities, each and every act and thing necessary or desirable to be done in and about the premises, to all intents and purposes and as fully as they might or could do in person, hereby ratifying, approving and confirming all that said attorneys-in-fact and agents or their substitutes may lawfully do or cause to be done by virtue hereof.
120
Pursuant to the requirements of the Securities Exchange Act of 1934, this annual report has been signed by the following persons on behalf of the registrant and in the capacities and on the dates indicated.
Date: | March 15, 2017 | By: | /s/ Richard J. Carty |
Richard J. Carty, President, Chief Executive Officer, and Director (principal executive officer) | |||
Date: | March 15, 2017 | By: | /s/ Scott A. Fenoglio |
Scott A. Fenoglio, Senior Vice President, Finance & Planning (principal financial officer) | |||
Date: | March 15, 2017 | By: | /s/ Wade E. Jaques |
Wade E. Jaques, Vice President and Chief Accounting Officer (principal accounting officer) | |||
Date: | March 15, 2017 | By: | /s/ James A. Watt |
James A. Watt, Chairman of the Board | |||
Date: | March 15, 2017 | By: | /s/ Kevin A. Neveu |
Kevin A. Neveu, Director | |||
Date: | March 15, 2017 | By: | /s/ Gregory P. Raih |
Gregory P. Raih, Director | |||
Date: | March 15, 2017 | By: | /s/ Jeff E. Wojahn |
Jeff E. Wojahn, Director | |||
121
INDEX TO EXHIBITS
Exhibit Number | Description | |
3.1 | Second Amended and Restated Certificate of Incorporation of Bonanza Creek Energy, Inc., filed with the Secretary of State of the State of Delaware on December 16, 2011 (incorporated by reference to Exhibit 3.1 to the Current Report on Form 8‑K filed on December 22, 2011) | |
3.2 | Third Amended and Restated Bylaws of Bonanza Creek Energy, Inc. (incorporated by reference to Exhibit 3.1 to the Current Report on Form 8‑K filed on August 1, 2013) | |
4.1 | Form of Senior Debt Indenture (incorporated by reference to Exhibit 4.4 to the Registration Statement on Form S‑3 filed on January 15, 2013) | |
4.2 | Form of Subordinated Debt Indenture (incorporated by reference to Exhibit 4.5 to the Registration Statement on Form S‑3 filed on January 15, 2013) | |
4.3 | Registration Rights Agreement, dated April 9, 2013, among Bonanza Creek Energy, Inc., the guarantors named therein and Wells Fargo Securities, LLC, as representative of the initial purchasers named therein (incorporated by reference to Exhibit 4.2 of the Current Report on Form 8‑K filed on April 11, 2013) | |
4.4 | Indenture, dated as of April 9, 2013, among Bonanza Creek Energy, Inc., the guarantors named therein and Wells Fargo Bank, National Association, as trustee (incorporated by reference to Exhibit 4.1 of the Current Report on Form 8‑K filed on April 11, 2013) | |
4.5 | Indenture, dated July 18, 2014, among Bonanza Creek Energy, Inc., the subsidiary guarantors named therein and Wells Fargo Bank, National Association, as trustee (incorporated by reference to Exhibit 4.1 to the Current Report on Form 8-K filed on July 18, 2014) | |
4.6 | First Supplemental Indenture, dated July 18, 2014, among Bonanza Creek Energy, Inc., the subsidiary guarantors named therein and Wells Fargo Bank, National Association, as trustee (incorporated by reference to Exhibit 4.2 to the Current Report on Form 8-K filed on July 18, 2014) | |
4.7 | First Supplemental Indenture, dated January 27, 2015, among Rocky Mountain Infrastructure, LLC, Bonanza Creek Energy, Inc., the subsidiary guarantors named therein and Wells Fargo Bank, National Association, as trustee (incorporated by reference to Exhibit 4.7 to the Annual Report on Form 10-K filed on February 27, 2015). | |
4.8 | Second Supplemental Indenture, dated January 27, 2015, among Rocky Mountain Infrastructure, LLC, Bonanza Creek Energy, Inc., the subsidiary guarantors named therein and Wells Fargo Bank, National Association, as trustee (incorporated by reference to Exhibit 4.8 to the Annual Report on Form 10-K filed on February 27, 2015). | |
10.1 | Credit Agreement, dated as of March 29, 2011, among Bonanza Creek Energy, Inc., BNP Paribas, as Administrative Agent, and the lenders party thereto (incorporated by reference to Exhibit 10.1 to the Registration Statement on Form S‑1 filed on June 7, 2011) | |
10.2 | Amendment No. 1, dated as of April 29, 2011, to the Credit Agreement, among Bonanza Creek Energy, Inc., BNP Paribas, as Administrative Agent, and the lenders party thereto (incorporated by reference to Exhibit 10.2 to the Registration Statement on Form S‑1 filed on June 7, 2011) | |
10.3 | Amendment No. 2 & Agreement, dated as of September 15, 2011, to the Credit Agreement, among Bonanza Creek Energy, Inc., BNP Paribas, as Administrative Agent, and the lenders party thereto (incorporated by reference to Exhibit 10.14 to the Registration Statement on Form S‑1/A filed on November 4, 2011) | |
10.4 | Resignation, Consent and Appointment Agreement and Amendment Agreement, dated of April 6, 2012, by and among BNP Paribas, in its capacity as Administrative Agent and Issuing Lender, and the other parties thereto (incorporated by reference to Exhibit 10.1 to the Quarterly Report on Form 10‑Q filed on May 11, 2012) | |
10.5 | Amendment No. 3 & Agreement, dated as of May 8, 2012, to the Credit Agreement among Bonanza Creek Energy, Inc., KeyBank National Association, as Administrative Agent, and the lenders party thereto (incorporated by reference to Exhibit 10.2 to the Quarterly Report on Form 10‑Q filed on May 11, 2012) | |
10.6 | Amendment No. 4, dated as of July 31, 2012 to the Credit Agreement among Bonanza Creek Energy, Inc., Key Bank National Association, as Administrative Agent, and the lenders party thereto (incorporated by reference to Exhibit 10.5 to the Quarterly Report on Form 10‑Q filed on August 13, 2012) | |
10.7 | Amendment No. 5, dated as of October 30, 2012, to the Credit Agreement among Bonanza Creek Energy, Inc., KeyBank National Association, as Administrative Agent, and the lenders party thereto (incorporated by reference to Exhibit 10.2 to the Quarterly Report on Form 10‑Q filed on November 9, 2012) | |
10.8 | Amendment No. 6, dated as of March 29, 2013, to the Credit Agreement among Bonanza Creek Energy, Inc., KeyBank National Association, as Administrative Agent, and the lenders party thereto (incorporated by reference to Exhibit 10.1 to the Quarterly Report on Form 10‑Q filed on May 10, 2013) | |
122
10.9 | Amendment No. 7, dated as of May 16, 2013 to the Credit Agreement among Bonanza Creek Energy, Inc., Key Bank National Association, as Administrative Agent, and the lenders party thereto (incorporated by reference to Exhibit 10.7 to the Quarterly Report on Form 10‑Q filed on August 9, 2013) | |
10.10 | Amendment No. 8, dated as of November 6, 2013, to the Credit Agreement, among Bonanza Creek Energy, Inc., the Guarantors, KeyBank National Association, as Administrative Agent and as Issuing Lender, and the lenders party thereto (incorporated by reference to Exhibit 99.1 to the Current Report on Form 8‑K filed on November 8, 2013) | |
10.11 | Amendment No. 9 and Agreement, dated as of May 14, 2014, to the Credit Agreement, among Bonanza Creek Energy, Inc., the Guarantors, KeyBank National Association, as Administrative Agent and as Issuing Lender, and the lenders party thereto (incorporated by reference to Exhibit 10.1 to the Current Report on Form 8‑K filed on May 20, 2014) | |
10.12 | Amendment No. 10 and Agreement, dated as of September 30, 2014, to the Credit Agreement, among Bonanza Creek Energy, Inc., the Guarantors, KeyBank National Association, as Administrative Agent and as Issuing Lender, and the lenders party thereto (incorporated by reference to Exhibit 10.1 to the Current Report on Form 8‑K filed on October 3, 2014) | |
10.13 | Amendment No. 11 and Agreement, dated as of May 13, 2015, to the Credit Agreement, among Bonanza Creek Energy, Inc., the Guarantors, KeyBank National Association, as Administrative Agent and as Issuing Lender, and the lenders party thereto (incorporated by reference to Exhibit 10.1 to the Current Report on Form 8‑K filed on May 15, 2015) | |
10.14 | Letter Agreement and Amendment No. 12, dated as of October 19, 2015, to the Credit Agreement, among Bonanza Creek Energy, Inc., the Guarantors, KeyBank National Association, as Administrative Agent and as Issuing Lender, and the lenders party thereto (incorporated by reference to Exhibit 10.1 to the Current Report on Form 8‑K filed on October 20, 2015) | |
10.15 | Registration Rights Agreement, among Bonanza Creek Energy, Inc., Project Black Bear LP, Her Majesty the Queen in Right of Alberta, in her own capacity and as a trustee/nominee for certain designated entities and certain other stockholders of the Registrant (incorporated by reference to Exhibit 10.3 to the Registration Statement on Form S‑1/A filed on July 25, 2011) | |
10.16* | Form of Indemnity Agreement between Bonanza Creek Energy, Inc. and each of its directors and executive officers (incorporated by reference to Exhibit 10.4 to the Registration Statement on Form S‑1/A filed on July 25, 2011) | |
10.17* | Bonanza Creek Energy, Inc. Amended and Restated 2011 Long Term Incentive Plan (incorporated by reference to Exhibit 10.1 to the Current Report on Form 8-K filed on June 5, 2015) | |
10.18* | Form of Restricted Stock Agreement (Employee) under the Bonanza Creek Energy, Inc. Amended and Restated 2011 Long Term Incentive Plan (incorporated by reference to Exhibit 10.4 to the Quarterly Report on Form 10‑Q filed on July 28. 2015) | |
10.19* | Form of Restricted Stock Agreement (Director) under the Bonanza Creek Energy, Inc. Amended and Restated 2011 Long Term Incentive Plan (incorporated by reference to Exhibit 10.5 to the Quarterly Report on Form 10‑Q filed on July 28, 2015) | |
10.20* | Form of Performance Share Agreement for 2013 grants (incorporated by reference to Exhibit 10.3 of the Current Report on Form 8‑K filed on March 29, 2013) | |
10.21* | Form of Performance Share Agreement for 2014 grants (incorporated by reference to Exhibit 10.2 of the Quarterly Report on Form 10-Q filed on May 9, 2014) | |
10.22* | Form of Performance Stock Unit Agreement for 2015 grants (incorporated by reference to Exhibit 10.2 of the Quarterly Report on Form 10-Q filed on May 8, 2015). | |
10.23* | Employment Letter Agreement effective March 21, 2014 between Bonanza Creek Energy, Inc. and Wade E. Jaques (incorporated by reference to Exhibit 10.1 to the Current Report on Form 8‑K filed on March 24, 2014) | |
10.24* | Employment Letter Agreement dated November 11, 2014, between Bonanza Creek Energy, Inc. and Richard J. Carty (incorporated by reference to Exhibit 10.1 to the Current Report on Form 8‑K filed on November 14, 2014) | |
10.25* | Performance Share Agreement dated November 11, 2014, between Bonanza Creek Energy, Inc. and Richard J. Carty (incorporated by reference to Exhibit 10.2 to the Current Report on Form 8-K filed on November 14, 2014) | |
10.26* | Form of Employment Letter Agreement (incorporated by reference to Exhibit 10.2 of the Current Report on Form 8‑K filed on March 29, 2013) | |
10.27* | Bonanza Creek Energy, Inc. Amended and Restated Executive Change in Control and Severance Plan (incorporated by reference to Exhibit 10.3 of the Quarterly Report on Form 10‑Q filed on July 28, 2015) | |
10.28 | Membership Interest Purchase Agreement dated November 5, 2015 by and among Bonanza Creek Energy Operating Company, LLC and Meritage Midstream Services IV, LLC (incorporated by reference to Exhibit 10.1 of the Current Report on Form 8-K filed on November 10, 2015). | |
123
10.29 | Purchase and Sale Agreement by and between DJ Resources, LLC, Bonanza Creek Energy Operating Company, LLC and Bonanza Creek Energy, Inc. dated May 21, 2014 (incorporated by reference to Exhibit 10.1 of the Current Report on Form 8-K filed on May 23, 2014). | |
10.30 | Separation Agreement dated March 23, 2016, between Bonanza Creek Energy, Inc. and William Cassidy (incorporated by reference to Exhibit 10.3 of the Quarterly Report on Form 10‑Q filed on May 5, 2016) | |
10.31 | Separation Agreement dated March 22, 2016, between Bonanza Creek Energy, Inc. and Christopher Humber (incorporated by reference to Exhibit 10.3 of the Quarterly Report on Form 10‑Q filed on May 5, 2016) | |
10.32 | Long Term Incentive Plan Agreement (incorporated by reference to Exhibit 10.3 of the Quarterly Report on Form 10‑Q filed on August 1, 2016) | |
10.33 | Separation Agreement dated June 15, 2016, between Bonanza Creek Energy, Inc. and Marvin Chronister (incorporated by reference to Exhibit 10.3 of the Quarterly Report on Form 10‑Q filed on August 1, 2016) | |
10.34† | Employment Letter Agreement dated September 28, 2016, between Bonanza Creek Energy, Inc. and Scott Fenoglio | |
10.35 | Restructuring Support Agreement, dated as of December 23, 2016 (incorporated by reference to Exhibit 10.1 to Bonanza Creek Energy, Inc.’s Current Report on Form 8-K filed on December 23, 2016). | |
10.36 | Backstop Commitment Agreement, dated as of December 23, 2016 (incorporated by reference to Exhibit 10.1 to Bonanza Creek Energy, Inc.’s Current Report on Form 8-K filed on December 23, 2016). | |
10.37 | Stipulation dated February 1, 2017 among the Debtors, the Ad Hoc Noteholder Group and Silo (incorporated by reference to Exhibit 10.1 to Bonanza Creek Energy, Inc.’s Current Report on Form 8-K filed on February 3, 2017). | |
21.1† | List of subsidiaries | |
23.1† | Consent of Hein & Associates LLP | |
23.2† | Consent of Independent Petroleum Engineers, Netherland, Sewell & Associates, Inc. | |
31.1† | Certification of the Chief Executive Officer pursuant to Rule 13a‑ 14(a) | |
31.2† | Certification of the Chief Financial Officer pursuant to Rule 13a‑ 14(a) | |
32.1† | Certification of the Chief Executive Officer pursuant to 18 U.S.C. Section 1350, as adopted pursuant to Section 906 of the Sarbanes‑Oxley Act of 2002 (furnished herewith) | |
32.2† | Certification of the Chief Financial Officer pursuant to 18 U.S.C. Section 1350, as adopted pursuant to Section 906 of the Sarbanes‑Oxley Act of 2002 (furnished herewith) | |
99.1† | Report of Independent Petroleum Engineers, Netherland, Sewell & Associates, Inc. for reserves as of December 31, 2016 | |
101† | The following material from the Bonanza Creek Energy, Inc. Annual Report on Form 10‑K for the year ended December 31, 2016 (and related periods), formatted in XBRL (Extensible Business Reporting Language) include (i) the Condensed Consolidated Balance Sheets, (ii) the Condensed Consolidated Statements of Operations and Comprehensive Income, (iii) the Condensed Consolidated Statements of Stockholders’ Equity, (iv) the Condensed Consolidated Statements of Cash Flows, and (v) Notes to the Condensed Consolidated Financial Statements, tagged as blocks of text | |
_________________________
* Management Contract or Compensatory Plan or Arrangement
† Filed or furnished herewith
124