Attached files
| file | filename |
|---|---|
| EX-32.2 - EXHIBIT 32.2 - UNITED INSURANCE HOLDINGS CORP. | exh32231dec16.htm |
| EX-32.1 - EXHIBIT 32.1 - UNITED INSURANCE HOLDINGS CORP. | exh32131dec16.htm |
| EX-31.2 - EXHIBIT 31.2 - UNITED INSURANCE HOLDINGS CORP. | exh31231dec16.htm |
| EX-31.1 - EXHIBIT 31.1 - UNITED INSURANCE HOLDINGS CORP. | exh31131dec16.htm |
| EX-12.1 - EXHIBIT 12.1 - UNITED INSURANCE HOLDINGS CORP. | exh12131dec16.htm |
UNITED STATES SECURITIES AND EXCHANGE COMMISSION
WASHINGTON, D.C. 20549
___________________________________
FORM 10-K
___________________________________
ANNUAL REPORT PURSUANT TO SECTION 13 OR 15(d)
OF THE SECURITIES EXCHANGE ACT OF 1934
For the fiscal year ended December 31, 2016
Commission File Number 001-35761
United Insurance Holdings Corp.
Delaware | 75-3241967 | |||
(State of Incorporation) | (IRS Employer Identification Number) | |||
800 2nd Avenue S
St. Petersburg, Florida 33701
727-895-7737
Securities registered pursuant to Section 12(b) of the Act: | ||||
COMMON STOCK, $0.0001 PAR VALUE PER SHARE | NASDAQ Stock Market LLC | |||
Securities registered pursuant to Section 12(g) of the Act: | ||||
PREFERRED SHARE PURCHASE RIGHTS | ||||
Indicate by check mark if the registrant is a well-known seasoned issuer, as defined in Rule 405 of the Securities Act. Yes £ No R
Indicate by check mark if the registrant is not required to file reports pursuant to Section 13 or Section 15(d) of the Act. Yes £ No R
Indicate by check mark whether the registrant (1) has filed all reports required to be filed by Section 13 or 15(d) of the Securities Exchange Act of 1934 during the preceding 12 months (or for such shorter period that the registrant was required to file such reports), and (2) has been subject to such filing requirements for the past 90 days. Yes R No £
Indicate by check mark whether the registrant has submitted electronically and posted on its corporate Web site, if any, every Interactive Data File required to be submitted and posted pursuant to Rule 405 of Regulation S-T during the preceding 12 months (or for such shorter period that the registrant was required to submit and post such files). Yes R No £
Indicate by check mark if disclosure of delinquent filers pursuant to Item 405 of Regulation S-K (§ 229.405 of this chapter) is not contained herein, and will not be contained, to the best of registrant’s knowledge, in definitive proxy or information statements incorporated by reference in Part III of this Form 10-K or any amendment to this Form 10-K. £
Indicate by check mark whether the registrant is a large accelerated filer, an accelerated filer, a non-accelerated filer or a smaller reporting company. See definitions of “large accelerated filer,” “accelerated filer” and “smaller reporting company” in Rule 12b-2 of the Exchange Act.
Large accelerated filer | £ | Accelerated filer | þ | |
Non-accelerated filer | £ | Smaller reporting company | £ | |
Indicate by check mark whether the registrant is a shell company (as defined in Rule 12b-2 of the Exchange Act). Yes £ No R
Non-affiliates held common stock issued by the registrant with an aggregate market value of $277,928,371 as of June 30, 2016, calculated using the closing sales price reported for such date on the NASDAQ Stock Market. For purposes of this disclosure, shares of common stock held by persons who hold more than 10% of the outstanding shares of common stock and shares held by executive officers and directors of the registrant have been excluded because such persons may be deemed to be affiliates. This determination of executive officer or affiliate status is not necessarily a conclusive determination for other purposes.
As of March 15, 2017, 21,676,125 shares of common stock, par value $0.0001 per share, were outstanding.
DOCUMENTS INCORPORATED BY REFERENCE
Part III of this Form 10-K incorporates by reference certain information from the Proxy Statement for the 2017 Annual Meeting of Stockholders to be filed with the Securities and Exchange Commission within 120 days after the end of our fiscal year ended December 31, 2016.
UNITED INSURANCE HOLDINGS CORP.
Forward-Looking Statements | ||
Item 1. Business | ||
Item 1A. Risk Factors | ||
Item 1B. Unresolved Staff Comments | ||
Item 2. Properties | ||
Item 3. Legal Proceedings | ||
Item 4. Mine Safety Disclosures | ||
Part II. | ||
Item 5. Market for Registrant's Common Equity, Related Stockholder Matters and Issuer Purchases of Equity Securities | ||
Item 6. Selected Financial Data | ||
Item 7. Management's Discussion and Analysis of Financial Condition and Results of Operations | ||
Item 7A. Quantitative and Qualitative Disclosures about Market Risk | ||
Item 8. Financial Statements and Supplementary Data | ||
Auditor's Report | ||
Consolidated Balance Sheets | ||
Consolidated Statements of Comprehensive Income | ||
Consolidated Statements of Stockholders' Equity | ||
Consolidated Statements of Cash Flows | ||
Notes to Consolidated Financial Statements | ||
Item 9. Changes in and Disagreements with Accountants on Accounting and Financial Disclosure | ||
Item 9A. Controls and Procedures | ||
Item 9B. Other Information | ||
Part III. | ||
Item 10. Directors, Executive Officers and Corporate Governance | ||
Item 11. Executive Compensation | ||
Item 12. Security Ownership of Certain Beneficial Owners and Management and Related Stockholder Matters | ||
Item 13. Certain Relationships and Related Transactions, and Director Independence | ||
Item 14. Principal Accounting Fees and Services | ||
Part IV. | ||
Item 15. Exhibits, Financial Statement Schedules | ||
Exhibit Index | ||
Item 16. Form 10-K Summary | ||
Signatures | ||
Throughout this Annual Report on Form 10-K (Annual Report), we present amounts in all tables in thousands, except for share amounts, per share amounts, policy counts or where more specific language or context indicates a different presentation. In the narrative sections of this Annual Report, we show full values rounded to the nearest thousand.
2
UNITED INSURANCE HOLDINGS CORP.
FORWARD-LOOKING STATEMENTS
Statements in this Form 10-K for the year ended December 31, 2016 or in documents incorporated by reference contains “forward-looking statements” within the meaning of the Private Securities Reform Litigation Act of 1995. These forward-looking statements include statements about anticipated growth in revenues, earnings per share, estimated unpaid losses on insurance policies, investment returns and expectations about our liquidity, and our ability to meet our investment objectives and to manage and mitigate market risk with respect to our investments. These statements are based on current expectations, estimates and projections about the industry and market in which we operate, and management’s beliefs and assumptions. Without limiting the generality of the foregoing, words such as “may,” “will,” “expect,” "endeavor," "project," “believe,” “anticipate,” “intend,” “could,” “would,” “estimate,” or “continue” or the negative variations thereof or comparable terminology are intended to identify forward-looking statements. Forward-looking statements are not guarantees of future performance and involve certain known and unknown risks and uncertainties that could cause actual results to differ materially from those expressed or implied by such statements. The risks and uncertainties include, without limitation:
• | the regulatory, economic and weather conditions present in the states in which we operate; |
• | the impact of new federal or state regulations that affect the property and casualty insurance market; |
• | the cost, viability and availability of reinsurance; |
• | assessments charged by various governmental agencies; |
• | pricing competition and other initiatives by competitors; |
• | our ability to attract and retain the services of senior management; |
• | the outcome of litigation pending against us, including the terms of any settlements; |
• | dependence on investment income and the composition of our investment portfolio and related market risks; |
• | our exposure to catastrophic events and severe weather conditions; |
• | downgrades in our financial strength ratings; |
• | risks and uncertainties relating to our acquisitions including our ability to successfully integrate the acquired companies; and |
• | other risks and uncertainties described under "Risk Factors" below. |
We caution you to not place reliance on these forward-looking statements, which are valid only as of the date they were made. We undertake no obligation to update or revise any forward-looking statements to reflect new information or the occurrence of unanticipated events or otherwise. In addition, we prepare our financial statements in accordance with U.S. generally accepted accounting principles (GAAP), which prescribes when we may reserve for particular risks, including litigation exposures. Accordingly, our results for a given reporting period could be significantly affected if and when we establish a reserve for a major contingency. Therefore, the results we report in certain accounting periods may appear to be volatile and past results may not be indicative of results in future periods.
These forward-looking statements are subject to numerous risks, uncertainties and assumptions about us described in our filings with the Securities and Exchange Commission (SEC). The forward-looking events that we discuss in this Form 10-K are valid only as of the date of this Form 10-K and may not occur, or may have different consequences, in light of the risks, uncertainties and assumptions that we describe from time to time in our filings with the SEC. A detailed discussion of these and other risks and uncertainties that could cause actual results and events to differ materially from our forward-looking statements is included in the section entitled “RISK FACTORS” in Part I, Item 1A of this Form 10-K. Except as required by applicable law, we undertake no obligation and disclaim any obligation to publicly update or revise any forward-looking statements, whether as a result of new information, future events or otherwise.
3
UNITED INSURANCE HOLDINGS CORP.
PART I
Item 1. Business
INTRODUCTION
Company Overview
United Insurance Holdings Corp. serves as the holding company for United Property & Casualty Insurance Company and its affiliated companies (referred to in this document as we, our, us, the Company or UPC Insurance). We conduct our business principally through the seven wholly owned operating subsidiaries shown below. Collectively, including United Insurance Holdings Corp., we refer to these entities as “UPC Insurance,” which is the preferred brand identification we are establishing for our Company.
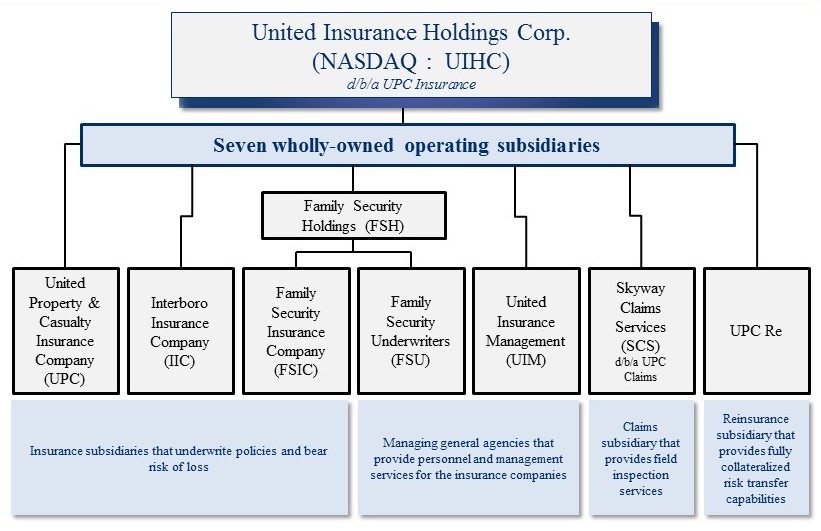
UPC Insurance is primarily engaged in the homeowners' property and casualty insurance business in the United States. We currently write in Connecticut, Florida, Georgia, Hawaii, Louisiana, Massachusetts, New Jersey, New York, North Carolina, Rhode Island, South Carolina, and Texas, and we are licensed to write in Alabama, Delaware, Maryland, Mississippi, New Hampshire, and Virginia. Our target market currently consists of areas where the perceived threat of natural catastrophe has caused large national insurance carriers to reduce their concentration of policies. In such areas we believe an opportunity exists for UPC Insurance to write profitable business. We manage our risk of catastrophic loss primarily through sophisticated pricing algorithms, avoidance of policy concentration, and the use of a comprehensive catastrophe reinsurance program. UPC Insurance has been operating continuously in Florida since 1999, and has successfully managed its business through various hurricanes, tropical storms, and other weather related events. We believe our record of successful risk management and experience in writing business in catastrophe-exposed areas provides us a competitive advantage as we grow our business in other states facing similar perceived threats.
We conduct our operations under one business segment.
4
UNITED INSURANCE HOLDINGS CORP.
Our Strategy
The Company's vision is: "to be the premier provider of property insurance in catastrophe exposed areas."
Our mission is to build a sustainable franchise that delivers quality insurance products in select markets in order to produce superior risk-adjusted returns for investors. Our strategy is to grow in our target markets by building a team of insurance professionals that can (i) provide agents and policyholders quality insurance products with world-class service and systems; (ii) raise and manage capital to support business growth; and (iii) build and maintain relationships with external partners. We believe the team of professionals we have assembled has proven its ability to do each of these things, thereby providing us a source of sustainable competitive advantage as we continue to grow our footprint.
Our emphasis on growing in areas with an ongoing threat of natural catastrophes exposes our company to risk and volatility. We manage the inherent volatility associated with our risk profile in three primary ways: 1) strategically, through geographic and product diversification; 2) financially, through the use of robust reinsurance programs, low financial and operating leverage, and a conservative investment approach; and 3) operationally, by insourcing key insurance functions and establishing strong external distribution partnerships.
To achieve our goals in 2017, UPC Insurance seeks to:
• | Grow our premium base in existing states; |
• | Complete our merger with AmCo Holding Company; |
• | Expand our product offerings in several states where we can leverage existing distribution capabilities; |
• | Utilize and add strategic partnerships to expand distribution and service capabilities in all states; |
• | Improve the efficiency of our catastrophe reinsurance programs; and |
• | Leverage investments in technology and analytics to manage exposure growth and improve profitability. |
Corporate Information
On December 11, 2012, in connection with an underwritten public offering of 5,000,000 shares of our common stock, we were approved to begin trading our common stock on The NASDAQ Capital Market (NASDAQ). On February 3, 2015, we successfully completed the acquisition of FSH and its two wholly owned subsidiaries in an all-stock transaction which resulted in the issuance of 503,857 shares of our common stock. On April 29, 2016, we completed the acquisition of IIC. The purchase price for IIC consisted of $48,450,000 in cash, $8,550,000 in a note payable, and an accrued liability for $3,471,000 which we paid during July 2016.
Our principal executive offices are located at 800 2nd Avenue S, St. Petersburg, FL 33701 and our telephone number at that location is (727) 895-7737.
Recent Events
On February 22, 2017, our Board of Directors declared a $0.06 per share quarterly cash dividend. For additional information regarding this declaration, see Part II, Item 5 of this report.
During the fourth quarter of 2016, we assumed more than 3,100 wind-only residential policies from Citizens Property Insurance Company (Citizens), representing approximately $4,600,000 of annualized premiums. We also assumed more than 3,900 wind-only policies from the Texas Windstorm Insurance Association (TWIA), representing approximately $6,600,000 of annualized premiums. The total amount of assumed premium may be reduced by additional opt outs and cancellations by policyholders.
During the fourth quarter of 2016, Hurricane Matthew impacted Florida and Georgia before making landfall in South Carolina and also impacting North Carolina. We write property insurance in all four states and are working diligently to provide claim service to our insureds who were impacted by the storm. We have received over 5,000 claims related to Hurricane Matthew and incurred approximately $30,000,000 of pre-tax catastrophe losses, net of reinsurance recoveries, during the fourth quarter of 2016 from this event.
On August 17, 2016, we entered into a Merger Agreement with AmCo Holding Company (AmCo), a North Carolina corporation and a wholly owned subsidiary of RDX Holding, LLC (RDX), to acquire AmCo and its two wholly owned
5
UNITED INSURANCE HOLDINGS CORP.
subsidiaries, American Coastal and BlueLine Cayman Holdings, through a series of mergers. American Coastal is engaged in the commercial residential property and casualty insurance business and writes coverage for Florida condominiums, homeowners' associations, apartments and townhomes through AmRisc, its managing general agent. BlueLine Cayman Holdings is a Cayman Islands holding company that holds an interest in BlueLine Re, a protected cell whose sole business is the entry into and performance of quota share agreements. At the effective time of the mergers, each issued and outstanding share of common stock of AmCo will be converted into shares of common stock of UIHC equal to 209,563.55 multiplied by the lesser of (a) one and (b) a fraction, the numerator of which is 130% of $14.81 and the denominator of which is the 30-day trailing volume-weighted average closing stock price of UIHC common stock as of the day of the closing of the mergers. Immediately following the completion of the mergers, current UIHC stockholders and RDX members will own approximately 51% and 49% of the outstanding shares of UIHC common stock, respectively.
PRODUCTS AND DISTRIBUTION
Homeowners policies and related coverage account for the vast majority of the business that we write, but we are diversifying by product as well as geography. We offer the following insurance products:
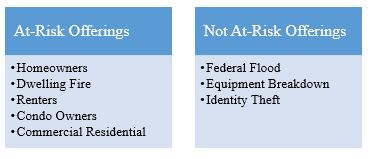
On our flood, equipment breakdown and identity theft policies, we earn a commission while retaining no risk of loss, since all such risk is ceded to other private companies and the federal government via the National Flood Insurance Program. Policies we issue under our homeowners' programs in the various states where we conduct business provide structure, content and liability coverage. We offer standardized policies for a broad range of exposures, and our policies include coverage options for standard single-family homeowners, renters, and condominium unit owners.
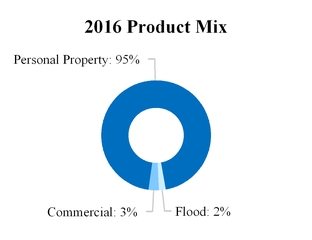
In 2016, personal property policies (by which we mean both standard homeowners', dwelling fire, renters and condo owners' policies) produced written premium of $669,007,000 and accounted for 95% of our total gross written premium. The remaining product mix is categorized between commercial residential and flood and has been distributed as seen below for 2016 and 2015.

We have developed a unique and proprietary homeowners' product we refer to as "UPC 1.0". This new product uses a granular approach to pricing for catastrophe perils. Our objective is to create specific geographic areas such that within each territory or "catastrophe band" the expected losses are within a specified range of error or approximation from a central estimate. These areas may have millions of data points that help us create distance-to-coast factors that provide a sophisticated
6
UNITED INSURANCE HOLDINGS CORP.
market segmentation that is highly correlated to our risk exposure and reinsurance costs. UPC 1.0 has been filed and approved for use in Florida, Connecticut, Georgia, Louisiana, New Jersey, South Carolina and Texas and we plan to file it for use in all our states.
We currently market and distribute our policies to consumers through approximately 12,000 independent agents representing over 7,500 agencies. UPC Insurance has focused on the independent agency distribution channel since its inception, and we believe we have built significant credibility and loyalty with the independent agent communities in the states in which we operate. We recruit, train and appoint the full-service insurance agencies that distribute our products. Typically, a full-service agency is small to medium in size and represents several insurance companies for both personal and commercial product lines. We depend heavily upon our independent agents to produce new business for us. We compensate our independent agents primarily with fixed-rate commissions that we believe are consistent with those generally prevailing in the market. In addition to our relationships with individual agencies, we have important relationships with aggregators of underlying agency demand. The two most significant of these relationships are with Allstate in Florida, which, through its Ivantage program, refers homeowners to our company and other partner companies, and with the Florida Association of Insurance Agents (FAIA), which serves as a conduit between UPC Insurance and many smaller agencies in Florida with whom we do not have direct appointments.
Our sales representatives monitor and support our agents and also have the principal responsibility for recruiting and training our new agents. We manage our relationships with independent agents through periodic business reviews using established benchmarks and goals for premium volume and profitability.
7
UNITED INSURANCE HOLDINGS CORP.
GEOGRAPHIC MARKETS
UPC Insurance Company began operations in Florida in 1999, and has operated continuously there since that time. In 2010, we began writing business outside of Florida and we currently write business in twelve states. The table below shows the years in which we began to actively write in each state:
State | Year Became Active |
Florida | 1999 |
South Carolina | 2010 |
Massachusetts | 2011 |
Rhode Island | 2012 |
North Carolina | 2013 |
New Jersey | 2013 |
Texas | 2013 |
Louisiana | 2014 |
Georgia | 2015 |
Hawaii | 2015 |
Connecticut | 2016 |
New York | 2016 |
UPC Insurance is also licensed to write, but has not commenced writing business in Alabama, Delaware, Maryland, Mississippi, New Hampshire, and Virginia. It is a fundamental part of our strategy to diversify our operations outside of Florida and to write in multiple states where the perceived threat of natural catastrophes has caused large national insurance companies to reduce their concentration.
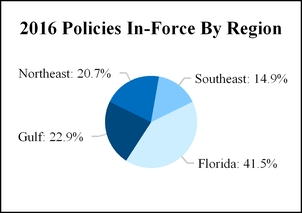
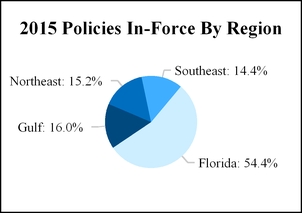
The table below shows the geographic distribution of our 451,155 policies in-force as of December 31, 2016, and 347,015 policies in-force as of December 31, 2015.
Policies In-Force By Region (1) | 2016 Policies | % | 2015 Policies | % | ||||||||
Florida | 187,414 | 41.5 | % | 188,748 | 54.4 | % | ||||||
Gulf | 103,207 | 22.9 | 55,555 | 16.0 | ||||||||
Northeast | 93,258 | 20.7 | 52,738 | 15.2 | ||||||||
Southeast | 67,276 | 14.9 | 49,974 | 14.4 | ||||||||
Total | 451,155 | 100.0 | % | 347,015 | 100.0 | % | ||||||
(1) Each region is comprised of the following states: Gulf includes Hawaii, Louisiana and Texas, Northeast includes Connecticut, Massachusetts, New Jersey, New York and Rhode Island, and Southeast includes Georgia, North Carolina and South Carolina.
8
UNITED INSURANCE HOLDINGS CORP.
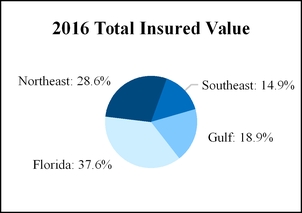
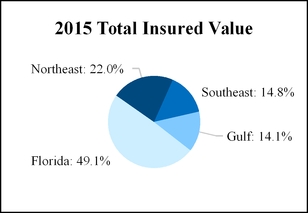
As of December 31, 2016, our total insured value of all polices in-force was approximately $214,114,964,000, an increase of $54,509,072,000, or 34.2%, from the same date in 2015. We have approximately 37.6% of our total insured value in Florida compared to roughly 49.1% as of December 31, 2015. The following table provides evidence of our improving geographic diversification by illustrating the breakdown of total insured value:
Total Insured Value By Region (1) | 2016 TIV | % | 2015 TIV | % | ||||||||||
Florida | $ | 80,444,296 | 37.6 | % | $ | 78,539,211 | 49.1 | % | ||||||
Northeast | 61,327,280 | 28.6 | 34,920,238 | 22.0 | ||||||||||
Gulf | 40,411,989 | 18.9 | 22,467,968 | 14.1 | ||||||||||
Southeast | 31,931,399 | 14.9 | 23,678,475 | 14.8 | ||||||||||
Total | $ | 214,114,964 | 100.0 | % | $ | 159,605,892 | 100.0 | % | ||||||
(1) Each region is comprised of the following states: Gulf includes Hawaii, Louisiana and Texas, Northeast includes Connecticut, Massachusetts, New Jersey, New York and Rhode Island, and Southeast includes Georgia, North Carolina and South Carolina.
9
UNITED INSURANCE HOLDINGS CORP.
COMPETITION
Our target market for homeowners' insurance, our primary product offering, includes the 18 states in which we are currently licensed plus the State of Maine where we plan to obtain a license at some point in the future. The following table summarizes the homeowners' insurance market countrywide for the year ending December 31, 2016, the date for which the most current data is available:
Countrywide Property Insurance Market - 2016 Homeowners DWP * | ||||||||
2016 Rank | Company Name | Direct Written Premium | Market Share | |||||
1 | State Farm Group | $ | 17,613,109 | 19.3 | % | |||
2 | Allstate Insurance Group | 7,903,530 | 8.7 | % | ||||
3 | Liberty Mutual Group | 6,164,379 | 6.8 | % | ||||
4 | Farmers Insurance Group | 5,515,277 | 6.0 | % | ||||
5 | USAA Group | 5,341,021 | 5.9 | % | ||||
6 | Travelers Group | 3,387,144 | 3.7 | % | ||||
7 | Nationwide Corp. Group | 3,299,236 | 3.6 | % | ||||
8 | American Family Insurance Group | 2,855,835 | 3.1 | % | ||||
9 | Chubb Ltd. Group | 2,697,841 | 3.0 | % | ||||
10 | Erie Insurance Group | 1,538,085 | 1.7 | % | ||||
11 | Auto Owners Group | 1,246,574 | 1.4 | % | ||||
12 | Metropolitan Group | 1,135,803 | 1.2 | % | ||||
13 | Hartford Fire & Casualty Group | 1,113,000 | 1.2 | % | ||||
14 | American International Group | 1,093,643 | 1.2 | % | ||||
15 | Progressive Group | 925,018 | 1.0 | % | ||||
16 | Universal Insurance Holdings Group | 880,902 | 1.0 | % | ||||
17 | CSAA Insurance Group | 874,444 | 1.0 | % | ||||
18 | Auto Club Enterprises Insurance Group | 857,774 | 0.9 | % | ||||
19 | Amica Mutual Group | 777,210 | 0.9 | % | ||||
20 | Country Insurance & Financial Services Group | 672,139 | 0.7 | % | ||||
21 | AmTrust, NGH Group | 668,332 | 0.7 | % | ||||
22 | United Insurance Holdings Group | 627,825 | 0.7 | % | ||||
23 | Tower Hill Insurance Group | 607,919 | 0.7 | % | ||||
24 | Assurant, Inc. Group | 558,206 | 0.6 | % | ||||
25 | The Hanover Insurance Group | 551,336 | 0.6 | % | ||||
Total - Top 25 Insurers | 68,905,582 | 75.6 | % | |||||
Total - All Insurers | $ | 91,276,900 | 100.0 | % | ||||
* The information displayed in the table above is compiled and published by the National Association of Insurance Commissioners (NAIC) as of December 31, 2016 based on information filings submitted annually by all licensed insurance companies. The information above is presented on a consolidated or aggregated basis for each insurance company group. The amounts shown in the table above are also on a statutory basis and exclude non-Homeowners lines of business that are included in the Company's total direct written premium for 2016.
We compete primarily on the basis of product features, the strength of our distribution network, high-quality service to our agents and policyholders, and our reputation for long-term financial stability and commitment. Our long and successful track record writing homeowners insurance in catastrophe-exposed areas has enabled us to develop sophisticated pricing techniques that endeavor to accurately reflect the risk of loss while allowing us to be competitive in our target markets. This pricing segmentation approach allows us to offer products in areas that have a high demand for property insurance yet are under-served by the national carriers.
10
UNITED INSURANCE HOLDINGS CORP.
We price our product at levels that we project will generate an acceptable underwriting profit. We try to be extremely granular in our approach, so that our price can accurately reflect the risk and profitability of each potential customer. In our pricing algorithm, we consider insurance credit scores (where allowable) and historical attritional loss costs for the rating territory in which the customer resides, as well as projected reinsurance costs based on the specific geographic and structural characteristics of the home. In addition to the specific characteristics of the policy being priced, we also evaluate the reinsurance cost of each incremental policy on our portfolio as a whole. In this regard, we seek to optimize our portfolio by diversifying our geographic exposure in order to limit our probable maximum loss, total insured value and average annual loss. We use the output from third-party modeling software to analyze our risk exposures, including wind exposures, by zip code or street address as part of the optimization process.
We have established underwriting guidelines designed to provide a uniform approach to our risk selection and designed to achieve underwriting profitability. Our underwriters review the property inspection report during their risk evaluation and if the policy does not meet our underwriting criteria, we have the right to cancel the policy within 90 days in Florida and within 60 days in other states.
We strive to provide excellent service to our independent agents and our policyholders. We continue to enhance our web-based systems which allow our agents to prepare and process new policies and policy changes online and deliver policy declarations quickly. We work with a select group of third party vendors to develop, manage and maintain our information technology systems. This allows us to obtain up-to-date technology at a reasonable cost and to achieve economies of scale without incurring significant fixed-overhead expenses. As agent and consumer behaviors evolve we continue to enhance our technology platforms to offer solutions that meet their needs.
REGULATION
We are subject to extensive regulation in the markets we serve, primarily at the state level. In general, these regulations are designed to protect the interests of insurance policyholders. They have a substantial effect on our business and relate to a wide variety of matters, including insurer solvency, reserve adequacy, insurance company licensing and examination, agent and adjuster licensing, policy forms, rate setting, the nature and amount of investments, claims practices, participation in shared markets and guaranty funds, transactions with affiliates, the payment of dividends, underwriting standards, statutory accounting methods, trade practices, and corporate governance. Some of these matters are discussed in more detail below. From time to time, individual states and/or the National Association of Insurance Commissioners (NAIC) propose new regulations and/or legislation that affect us. We can neither predict whether any of these proposals in the various jurisdictions might be adopted, nor what effect, if any, their adoption may have on our results of operations or financial condition. For a discussion of statutory financial information and regulatory contingencies, see Note 13 to our Notes to Consolidated Financial Statements which is incorporated in this Part I, Item 1 by reference.
Our insurance affiliates provide audited statutory financial statements to the various insurance regulatory authorities. With regard to periodic examinations of an insurance company's affairs, insurance regulatory authorities, in general, defer to the insurance regulatory authority in the state in which an insurer is domiciled; however, insurance regulatory authorities from any state in which we operate may conduct examinations at their discretion. UPC is domiciled in Florida, FSIC is domiciled in Hawaii, and IIC is domiciled in New York.
The ratio of gross and net premiums written to statutory surplus is a common measure of operating leverage used in the property-casualty insurance industry and serves as an indicator of a company’s premium growth capacity. Florida state law requires insurance companies to maintain premium-to-surplus ratios not in excess of 10:1 and 4:1 for gross premiums-to-surplus and net premiums-to-surplus, respectively. The table below shows the premium-to-surplus ratios for our Florida regulated entity at December 31, 2016 and 2015.
December 31, | ||||||
2016 | 2015 | |||||
UPC (1) | ||||||
Gross premiums-to-surplus ratio | 3.7 | 3.7 | ||||
Net premiums-to-surplus ratio | 2.2 | 2.5 | ||||
(1) Florida insurance statute §624.4095 requires property insurance premiums to be multiplied by a factor of 90%
for the purposes of this calculation
11
UNITED INSURANCE HOLDINGS CORP.
Risk-Based Capital Requirements
To enhance the regulation of insurer solvency, the NAIC has published risk-based capital (RBC) guidelines for insurance companies designed to assess capital adequacy and to raise the level of protection statutory surplus provides for policyholders. The guidelines measure three major areas of risk facing property and casualty insurers: (i) underwriting risks, which encompass the risk of adverse loss developments and inadequate pricing; (ii) declines in asset values arising from credit risk; and (iii) other business risks. Most states, including Florida, Hawaii and New York, have enacted the NAIC guidelines as statutory requirements, and insurers having less statutory surplus than required will be subject to varying degrees of regulatory action, depending on the level of capital inadequacy. Insurance regulatory authorities could require our insurance subsidiaries to cease operations in the event it fails to maintain the required statutory capital.
The level of required risk-based capital is calculated and reported annually. There are five outcomes to the RBC calculation set forth by the NAIC which are as follows:
1. | No Action Level - If RBC is greater than 200%, no further action is required. |
2. | Company Action Level - If RBC is between 150% -200%, the insurer must prepare a report to the regulator outlining a comprehensive financial plan that identifies conditions that contributed to the insurer's financial condition and proposes corrective actions. |
3. | Regulatory Action Level - If RBC is between 100% -150%, the state insurance commissioner is required to perform any examinations or analyses to the insurer's business and operations that he or she deems necessary as well as issuing appropriate corrective orders. |
4. | Authorized Control Level - If RBC is between 70% - 100%, this is the first point that the regulator may take control of the insurer even if the insurer is still technically solvent and is in addition to all the remedies available at the higher action levels. |
5. | Mandatory Control Level - If RBC is less than 70%, the regulator is required to take steps to place the insurer under its control regardless of the level of capital and surplus. |
At December 31, 2016, UPC's, FSIC's, and IIC's RBC ratios were 339%, 433%, and 867% respectively.
Underwriting and Marketing Restrictions
During the past several years, various regulatory and legislative bodies have adopted or proposed new laws or regulations to address the cyclical nature of the insurance industry, catastrophic events and insurance capacity and pricing. These regulations (i) created “market assistance plans” under which insurers are induced to provide certain coverage; (ii) restrict the ability of insurers to reject insurance coverage applications, to rescind or otherwise cancel certain policies in mid-term, and to terminate agents; (iii) restrict certain policy non-renewals and require advance notice on certain policy non-renewals; and (iv) limit rate increases or decrease rates permitted to be charged.
Most states also have insurance laws requiring that rate schedules and other information be filed with the insurance regulatory authority, either directly or through a rating organization with which the insurer is affiliated. The insurance regulatory authority may disapprove a rate filing if it finds that the rates are inadequate, excessive or unfairly discriminatory.
Most states require licensure or insurance regulatory authority approval prior to the marketing of new insurance products. Typically, licensure review is comprehensive and includes a review of a company’s business plan, solvency, reinsurance, character of its officers and directors, rates, forms and other financial and non-financial aspects of a company. The insurance regulatory authorities may prohibit entry into a new market by not granting a license or by withholding approval.
Limitations on Dividends by Insurance Subsidiaries
As a holding company with no significant business operations of our own, we rely on payments from our insurance affiliates as one of the principal sources of cash to pay dividends and meet our obligations. Our insurance affiliates are regulated as property and casualty insurance companies and their ability to pay dividends is restricted by Florida, Hawaii and New York law.
12
UNITED INSURANCE HOLDINGS CORP.
The state laws of Florida, Hawaii, and New York permit an insurer to pay dividends or make distributions out of that part of statutory surplus derived from net operating profit and net realized capital gains or adjusted net investment income. The state laws further provide calculations to determine the amount of dividends or distributions that can be made without the prior approval of the insurance regulatory authorities and the amount of dividends or distributions that would require prior approval of the insurance regulatory authorities in those states. Statutory risk-based capital requirements may further restrict our insurance affiliates' ability to pay dividends or make distributions if the amount of the intended dividend or distribution would cause statutory surplus to fall below minimum risk-based capital requirements.
For additional information regarding those restrictions, see Part II, Item 5 of this report.
Insurance Holding Company Regulation
As a holding company of insurance subsidiaries, we are subject to laws governing insurance holding companies in Florida, Hawaii and New York. These laws, among other things, (i) require us to file periodic information with the insurance regulatory authority, including information concerning our capital structure, ownership, financial condition and general business operations, (ii) regulate certain transactions between our affiliates and us, including the amount of dividends and other distributions and the terms of surplus notes and (iii) restrict the ability of any one person to acquire certain levels of our voting securities without prior regulatory approval. Any purchaser of 5% or more of the outstanding shares of our common stock could be presumed to have acquired control of us unless the insurance regulatory authority, upon application, determines otherwise.
Insurance holding company regulations also govern the amount any affiliate of the holding company may charge our insurance affiliates for services (i.e., management fees and commissions). We have a long-term management agreement between UPC and UIM, which presently provides for monthly management fees. The Florida Office of Insurance Regulation must approve any changes to this agreement.
We also have a management agreement between FSIC and FSU, which presently provides for monthly management fees. The Hawaii Insurance Division must approve any changes to this agreement.
The New York Department of Financial Services does not permit the use of a managing general agent and therefore we do not have a management agreement between IIC and any other company. Instead, UPC Insurance allocates a portion of relevant expenses to IIC for statutory accounting purposes.
FINANCIAL STABILITY RATING
Financial stability ratings are important to insurance companies in establishing their competitive position and such ratings may impact an insurance company’s ability to write policies. Demotech maintains a letter-scale financial stability rating system ranging from A** (A double prime) to L (licensed by insurance regulatory authorities); they have assigned our insurance subsidiaries a financial stability rating of A, which is the third highest of six rating levels. According to Demotech, "Regardless of the severity of a general economic downturn or deterioration in the insurance cycle, insurers earning a Financial Stability Rating of A possess Exceptional financial stability related to maintaining surplus as regards policyholders at an acceptable level.” With a financial stability rating of A, we expect our property insurance policies will be acceptable to the secondary mortgage marketplace and mortgage lenders. This rating is intended to provide an independent opinion of an insurer’s financial strength and is not an evaluation directed at our investors. At least annually, based on year-to-date results as of the third quarter, Demotech reviews our rating and may revise it upward or downward or revoke it at their sole discretion.
EMPLOYEES
As of March 2017, we have 167 full time employees, which includes our executive officers. We are neither party to any collective bargaining agreements nor have we experienced any work stoppages or strikes as a result of labor disputes. We believe we have good working relationships with our employees.
AVAILABLE INFORMATION
We make available, free of charge through our website, www.upcinsurance.com, our Annual Report, Quarterly Reports on Form 10-Q, Current Reports on Form 8-K and all amendments to those reports filed or furnished pursuant to Section 13(a) or 15(d) of the Securities Exchange Act of 1934 as soon as reasonably practicable after we electronically file such materials with, or furnish them to, the SEC.
13
UNITED INSURANCE HOLDINGS CORP.
These reports may also be obtained at the SEC’s Public Reference Room at 100 F Street NE, Washington, D.C. 20549. Information on the operation of the Public Reference Room is available by calling the SEC at 1-800-SEC-0330. You may also access this information at the SEC’s website (www.sec.gov). This site contains reports, proxy and information statements and other information regarding issuers that file electronically with the SEC.
14
UNITED INSURANCE HOLDINGS CORP.
Item 1A. Risk Factors
Many factors affect our business and results of operations, some of which are beyond our control. Additional risks and uncertainties we are unaware of, or we currently deem immaterial, also may become important factors that affect us. If any of the following risks occur, our business, financial conditions or results of operations may be materially and adversely affected. In that event, the trading price of our securities could decline, and our stockholders could lose all or part of their investment in our securities. This discussion contains forward-looking statements. See the section entitled FORWARD-LOOKING STATEMENTS for a discussion of uncertainties, risks and assumptions associated with these statements.
RISKS RELATED TO OUR BUSINESS
As a property and casualty insurer, we may experience significant losses, and our financial results may vary from period to period, due to our exposure to catastrophic events and severe weather conditions, the incidence and severity of which could be affected by climate change.
Our property and casualty insurance operations expose us to risks arising from catastrophes. Catastrophes can be caused by various natural events, including hurricanes, windstorms, earthquakes, hail, severe winter weather and fires; they can also be man-made, such as terrorist attacks (including those involving nuclear, biological, chemical or radiological events) or consequences of war or political instability. We may incur catastrophe losses that exceed the amount of:
•catastrophe losses that we experienced in prior years;
•catastrophe losses that, using third-party catastrophe modeling software, we projected could be incurred;
•catastrophe loss estimates that we used to develop prices for our products; or
•our current reinsurance coverage (which would cause us to have to pay such excess losses).
The incidence and severity of weather conditions are largely unpredictable, but the frequency and severity of property claims generally increase when severe weather conditions occur. Climate change, to the extent that it may affect weather patterns, may cause an increase in the frequency and/or the severity of catastrophic events or severe weather conditions which, in addition to the attendant increase in claims-related costs, may also cause an increase in our reinsurance costs and/or negatively impact our ability to provide homeowners insurance to our policyholders in the future. Governmental entities may also respond to climate change by enacting laws and regulations that may increase our cost of providing homeowners insurance in the future, which could adversely affect demand.
Catastrophes may have a material adverse effect on our results of operations during any reporting period due to increases in our loss and loss adjustment expense. Catastrophes may also cause us to increase our reserve for unpaid losses and loss adjustment expenses, which could materially harm our financial condition and our liquidity and could impair our ability to raise capital on acceptable terms or at all. In addition to catastrophes, the accumulation of losses from several smaller weather-related events in any reporting period may have a similar impact to our results of operations and financial condition.
Because we conduct a significant portion of our business in Florida, our financial results substantially depend on the regulatory, economic and weather conditions present in that state.
A significant portion of our policies in-force is concentrated in Florida. Moreover, if our proposed merger with AmCo Holding Company (“AmCo”) and its wholly owned subsidiaries (including American Coastal Insurance Company) is completed, our risk exposure in Florida will significantly increase because substantially all of AmCo’s business is conducted in respect of risk located in the State of Florida. Therefore, the prevailing regulatory, legal, economic, political, demographic, competitive, weather and other conditions in Florida will likely have a more significant impact on our revenues and profitability compared to such conditions in other jurisdictions in which we operate. Furthermore, changes in conditions could make doing business in Florida less attractive for us, which could have a more pronounced effect on us than it would on other insurance companies that are more geographically diversified.
In addition, due to Florida’s climate, we are subject to increased exposure to certain catastrophic events such as hurricanes, as well as an increased risk of losses. The occurrence of one or more catastrophic events or other conditions affecting losses in Florida may cause a material adverse effect on our results of operations and financial condition.
15
UNITED INSURANCE HOLDINGS CORP.
Our diversification strategy may not be effective.
Although we intend to continue focusing on Florida as a key market for our insurance products, we plan to take advantage of prudent opportunities to expand our core business into other states where we believe the potential for underwriting profit is strong. However, we may not be successful in this diversification strategy due to several factors, including the difficulties of finding appropriate expansion opportunities and the challenges of operating in new and unfamiliar markets.
Because we rely on insurance agents, the loss of these agent relationships or our ability to attract new agents could have an adverse impact on our business.
We currently market our policies to a broad range of prospective policyholders through approximately 12,000 independent agents representing over 7,000 agencies. Many of these agents are independent insurance agents that own their customer relationships, and our agency contracts with them limit our ability to directly solicit business from our existing policyholders. Independent agents commonly represent other insurance companies and we do not control their activities. Historically, we have used marketing relationships with two well-known national insurance companies that do not write new homeowners insurance policies in Florida and two associations of independent insurance agents in Florida to attract and retain agents and agency groups. The loss of these marketing relationships could adversely impact our ability to attract new agents or retain our agency network. Failure to grow or maintain our agency relationships or a failure to attract new agents could adversely affect sales of our insurance products.
Additionally, AmCo’s subsidiary, American Coastal Insurance Company (“American Coastal”), has an exclusive contract with AmRisc, pursuant to which AmRisc serves as American Coastal’s exclusive managing general agent for binding and writing commercial residential property lines for condominium, townhome and homeowners association insurance written in Florida. Under that contract, AmRisc must produce a certain volume of business for American Coastal. Therefore, if our proposed acquisition of AmCo (including American Coastal) is completed, failure of AmRisc to produce the required volume of business could cause the combined company to lose substantial premiums and could require us to seek one or more alternative managing general agents. If we were unable to find a replacement managing general agent or otherwise increase the production of premiums, our revenues could decrease, which could have a material adverse effect on our business, financial condition and results of operations.
Actual claims incurred may exceed our loss reserves for claims, which could adversely affect our results of operations and financial condition.
Loss reserves represent our estimate of ultimate unpaid losses for claims that have been reported and claims that have been incurred but not yet reported. Loss reserves do not represent an exact calculation of liability, but instead represent our best estimate, generally utilizing actuarial expertise, historical information and projection techniques at a given reporting date.
The process of estimating our loss reserves involves a high degree of judgment and is subject to a number of variables. These variables can be affected by both internal and external events, such as changes in claims handling procedures, economic inflation, legal trends, legislative changes, and varying judgments and viewpoints of the individuals involved in the estimation process, among others.
Because of the inherent uncertainty in estimating loss reserves, including reserves for catastrophes, additional liabilities resulting from one insured event, or an accumulation of insured events, may exceed our existing loss reserves. If our reserves are inadequate, it may cause us to overstate our earnings for the periods during which our reserves for expected losses was insufficient.
Our financial results may vary from period to period based on the timing of our collection of government-levied assessments from our policyholders.
Our insurance affiliates are subject to assessments levied by various governmental and quasi-governmental entities in the states in which we operate. While we may have the ability to recover these assessments from policyholders through policy surcharges in some states in which we operate, our payment of the assessments and our recoveries may not offset each other in the same reporting period in our financial statements and may cause a material adverse effect on our results of operations in a particular reporting period.
16
UNITED INSURANCE HOLDINGS CORP.
Our failure to implement and maintain adequate internal controls over financial reporting in our business could have a material adverse effect on our business, financial condition, results of operations and stock price.
“Internal controls over financial reporting” refer to those procedures within a company that are designed to reasonably ensure the accuracy of the company’s financial statements. Section 404 of the Sarbanes-Oxley Act of 2002 requires our management to annually assess the effectiveness of our internal controls over financial reporting. Based on its most recent assessment, management believes that our internal controls during 2016 and 2015 were effective.
If we fail to achieve and maintain adequate internal controls, or if we have material weaknesses in our internal controls, in each case in accordance with applicable standards, we may be unable to conclude on an ongoing basis that we have effective internal controls over financial reporting in accordance with Section 404. Because effective internal controls are necessary for us to produce reliable financial reports, our business, financial condition and results of operations could be harmed, investors could lose confidence in our reported financial information, and the market price for our stock could decline if our internal controls are ineffective or if material weaknesses in our internal controls are identified. Moreover, if we complete our merger with AmCo, any deficiencies or material weaknesses in AmCo’s internal controls over financial reporting could also have a material adverse impact on the combined company for the above-mentioned reasons.
If we experience difficulties with technology, data security and/or outsourcing relationships, our ability to conduct our business could be negatively impacted.
While technology can streamline many business processes and ultimately reduce the cost of operations, technology initiatives present certain risks. Our business is highly dependent upon our information technology systems and upon our contractors' and third-party administrators' ability to perform, in an efficient and uninterrupted fashion, necessary business functions such as the processing of policies and the adjusting of claims. Because our information technology and telecommunications systems interface with and often depend on these third-party systems, we could experience service denials if demand for such service exceeds capacity or a third-party system fails or experiences an interruption. If sustained or repeated, such a business interruption, system failure or service denial could result in a deterioration of our ability to write and process new and renewal business, provide customer service, pay claims in a timely manner or perform other necessary business functions.
Despite our implementation of security measures, our information technology systems are vulnerable to computer viruses, natural disasters, unauthorized access, cyber-attacks, system failures and similar disruptions. A material breach in the security of our information technology systems and data could include the theft of our confidential or proprietary information, including trade secrets and the personal information of our customers, claimants and employees. From time to time, we have experienced threats to our data and information technology systems, including malware and computer virus attacks, unauthorized access, system failures and disruptions. To the extent that any disruptions or security breaches result in a loss or damage to our data or inappropriate disclosure of proprietary or confidential information, it could cause significant damage to our reputation, adversely affect our relationships with our customers, result in litigation, increased costs and/or regulatory penalties, and ultimately harm our business. Third parties to whom we outsource certain of our functions are also subject to the risks outlined above, any one of which may result in our incurring substantial costs and other negative consequences, including a material adverse effect on our business, financial condition, results of operations and liquidity.
Loss of key vendor relationships or failure of a vendor to protect personal information of our customers, claimants or employees could affect our operations.
We rely on services and products provided by many third-party vendors. These include, for example, vendors of computer hardware and software and vendors of services such as claim adjustment services and human resource benefits management services. In the event that one or more of our vendors suffers a bankruptcy or otherwise becomes unable to continue to provide products or services, or fails to protect personal information of our customers, claimants or employees, we may suffer operational impairments and financial losses. Moreover, in the event of a data breach involving any of our third-party vendors, our customers’ data and personal information could also be put at risk. For example, many of the recent significant data breaches were a result of security breaches of third-party vendors. Any such data breach involving our third-party vendors could result in significant mitigation or legal expenses for us, which could materially and adversely affect our results of operations and financial condition.
17
UNITED INSURANCE HOLDINGS CORP.
Our success has been and will continue to be greatly influenced by our ability to attract and retain the services of senior management.
Our senior executive officers play an integral role in the development and management of our business. We cannot guarantee that any such officers will continue their employment with us. Additionally, we do not maintain any key person life insurance policies on any of our officers or employees. The loss of the services of any of our senior executive officers could have an adverse effect on our business, financial condition, results of operations, cash flows and/or future prospects.
Our acquisitions and other strategic transactions may be difficult to integrate, divert management resources, result in unanticipated costs or dilute our stockholders.
Part of our continuing business strategy is to evaluate opportunities to merge with and acquire companies that complement our business model or make other strategic transactions that facilitate or expedite the accomplishment of our business goals. Even if we enter into an agreement in respect of a merger with or acquisition of another business, we may not be able to finalize a transaction after significant investment of time and resources, including our proposed merger with AmCo. Further, we may not have the ability to finalize a transaction due to a lack of regulatory approval or imposition of a burdensome condition by the regulator.
In connection with an acquisition or merger, we could incur debt, amortization expenses related to intangible assets, large and immediate write-offs, assume liabilities or issue stock that would dilute our current stockholders' percentage of ownership. As a result, there is a risk of transaction related litigation. Such transactions could pose numerous risks to our operations, including:
• | incurring substantial unanticipated integration costs; |
• | assimilating the acquired businesses may divert significant management attention and financial resources from our other operations and could disrupt our ongoing business; |
• | acquisitions and mergers could result in the loss of key employees, particularly those of the acquired operations; |
• | difficulty retaining the acquired business' customers; |
• | failing to realize the strategic benefits or the potential cost savings or other financial benefits of the acquisitions or mergers; and |
• | incurring unanticipated liabilities or claims from the acquired businesses and contractually-based time and monetary limitations on the seller's obligation to indemnify us for such liabilities or claims. |
We are also subject to a certain level of risk regarding the actual condition of the businesses that we acquire. Until we actually assume operating control of such businesses and their assets and operations, we may not be able to ascertain the actual value or understand the potential liabilities of the acquired entities and their operations. As a result, we may not be able to complete acquisitions or mergers or integrate the operations, products or personnel gained through any such acquisition or merger without a material adverse effect on our business, financial condition and results of operations, including our proposed merger with AmCo, which has not yet been consummated.
RISKS RELATED TO THE INSURANCE INDUSTRY
Because we are operating in a highly competitive market, we may lack the resources to increase or maintain our market share.
The property and casualty insurance industry is highly competitive, and we believe it will remain highly competitive for the foreseeable future. The principal competitive factors in our industry are price, service, commission structure and financial condition. We compete with other property and casualty insurers that write coverage in the same geographic areas in which we write coverage and some of those insurers have greater financial resources and have a longer operating history than we do. In addition, our competitors may offer products for alternative forms of risk protection that we presently do not offer, which could adversely affect the sales of our products. Competition could limit our ability to retain existing business or to write new business at adequate rates, and such limitation may cause a material adverse effect on our results of operations and financial position.
18
UNITED INSURANCE HOLDINGS CORP.
Changes in state regulation may adversely affect our results of operation and financial condition.
As an insurance company, we are subject to the laws and regulations of the various states in which we operate. From time to time, states have passed legislation, and regulators have taken action, that has the effect of limiting the ability of insurers to manage catastrophe risk, such as legislation prohibiting insurers from reducing exposures or withdrawing from catastrophe-prone areas, or mandating that insurers participate in residual markets. In addition, following catastrophes, legislative initiatives and court decisions can seek to expand insurance coverage for catastrophe claims beyond the original intent of the policies, which could cause our actual loss and loss adjustment expense to exceed our estimates. Further, our ability to increase pricing to the extent necessary to offset rising costs of catastrophes requires approval of insurance regulatory authorities.
One example of such legislation occurred following the 2004 and 2005 hurricane seasons, when the Florida legislature required all insurers issuing replacement cost policies to pay the full replacement cost of damaged properties without depreciation, whether or not the insureds repaired or replaced the damaged property. Under prior law, insurers paid the depreciated amount of damaged property on covered losses until an insured commenced repairs or replacement. Under the current law, there is an increase in disputes over the amount of loss, since full payment is made before actual repairs begin and without documentation supporting the actual cost of repair. Despite our efforts to promptly calculate and pay meritorious amounts, our operating results have been affected by the change in law, coupled with a claims environment in Florida that creates opportunities for fraudulent or overstated claims.
Our ability or willingness to manage our catastrophe exposure by raising prices, modifying underwriting terms or reducing exposure to certain geographies may be limited due to considerations of public policy, the evolving political environment and our ability to penetrate other geographic markets, which may cause a material adverse effect on our results of operations, financial condition and cash flows. We cannot predict whether and to what extent the adoption of new legislation and regulations would affect our ability to manage our exposure to catastrophic events.
The insurance industry is heavily regulated and further restrictive regulation may reduce our profitability and limit our growth.
The insurance industry is extensively regulated and supervised. Insurance regulatory authorities generally design insurance rules and regulations to protect the interests of policyholders, and not necessarily the interests of insurers, their stockholders, and other investors. We are subject to comprehensive regulation and supervision by state insurance departments in all states in which our insurance subsidiaries are domiciled, as well as all states in which they are licensed, sell insurance products, issue policies, or handle claims. The regulations of each state are unique and complex and subject to change, and certain states may have regulations that conflict with the regulations of other states in which we operate. As a result, we are subject to the risk that compliance with the regulations in one state may not result in compliance with the regulations in another state.
State statutes and administrative rules generally require each insurance company to register with the department of insurance in its state of domicile and to furnish information concerning the operations of the companies within the holding company system which may materially affect the operations, management or financial condition of the insurers. As part of its registration, each insurance company must identify material agreements, relationships and transactions with affiliates, including loans, investments, asset transfers, transactions outside of the ordinary course of business, certain management, service, and cost sharing agreements, reinsurance transactions, dividends, and other financial and non-financial components of an insurer’s business. Some states impose restrictions or require prior regulatory approval of specific corporate actions, which may adversely affect our ability to operate, innovate, obtain necessary rate adjustments in a timely manner or grow our business profitably. Our ability to comply with these laws and regulations, and to obtain necessary regulatory action in a timely manner is, and will continue to be, critical to our success.
Currently, the federal government's role in regulating or dictating the policies of insurance companies is limited. However, from time to time Congress has considered and may in the future consider proposals that would increase the role of the federal government in insurance regulation, either in addition to or in lieu of state regulation.
In recent years, the state insurance regulatory framework has come under increased federal scrutiny. Changes in federal legislation, regulation and/or administrative policies in several areas, including changes in financial services regulation and federal taxation, could negatively affect the insurance industry and us. In addition, Congress and some federal agencies from time to time investigate the current condition of insurance regulation in the United States to determine whether to impose federal or national regulation or to allow an optional federal charter, similar to the option available to most banks. Further, the NAIC and state insurance regulators continually reexamine existing laws and regulations, specifically focusing on modifications to holding company regulations, interpretations of existing laws and the development of new laws and
19
UNITED INSURANCE HOLDINGS CORP.
regulations. We cannot predict what effect, if any, proposed or future legislation or NAIC initiatives may have on the manner in which we conduct our business.
As part of potential, or future, industry-wide investigations, we may from time to time receive requests for information from government agencies and authorities at the state or federal level. If we are subpoenaed for information by government agencies and authorities, potential outcomes could include law enforcement proceedings or settlements resulting in fines, penalties and/or changes in business practices that could cause a material adverse effect on our results of operations. In addition, these investigations may result in changes to laws and regulations affecting the industry.
Changes to insurance laws or regulations, or new insurance laws and regulations, may be more restrictive than current laws or regulations and could significantly increase our compliance costs, which could have a material adverse effect on our results of operations and our prospects for future growth. Additionally, our failure to comply with certain provisions of applicable insurance laws and regulations could result in significant fines or penalties being levied against us and may cause a material adverse effect on our results of operations or financial condition.
Our inability to obtain reinsurance on acceptable terms would increase our loss exposure or limit our ability to underwrite policies.
We use, and we expect to continue to use, reinsurance to help manage our exposure to property risks. Reinsurance is insurance for insurers and is fundamentally a promise by the reinsurer to pay possible future claims in exchange for the payment of a premium by the insurance company seeking reinsurance. The availability and cost of reinsurance are each subject to prevailing market conditions beyond our control, which can affect business volume and profitability. We may be unable to maintain our current reinsurance coverage, to obtain additional reinsurance coverage in the event our current reinsurance coverage is exhausted by a catastrophic event, or to obtain other reinsurance coverage in adequate amounts or at acceptable rates. Similar risks exist whether we are seeking to replace coverage terminated during the applicable coverage period or to renew or replace coverage upon its expiration. We provide no assurance that we can obtain sufficient reinsurance to cover losses resulting from one or more storms or other events in the future, or that we can obtain such reinsurance in a timely or cost-effective manner. If we are unable to renew our expiring coverage or to obtain new reinsurance coverage, either our net exposure to risk would increase or, if we are unwilling to accept an increase in net risk exposures, we would have to reduce the amount of risk we underwrite. Either increasing our net exposure to risk or reducing the amount of risk we underwrite may cause a material adverse effect on our results of operations and our financial condition.
Our inability to collect from our reinsurers on our reinsurance claims could cause a material adverse effect on our results of operation and financial condition.
We use reinsurance as a tool to manage risks associated with our business. However, we remain primarily liable as the direct insurer on all risks that we obtain reinsurance for. Our reinsurance agreements do not eliminate our obligation to pay claims to insured. As a result, we are subject to counterparty risk with respect to our ability to recover amounts due from reinsurers. The risk could arise in two situations: (i) our reinsurers may dispute some of our reinsurance claims based on contract terms, and we may ultimately receive partial or no payment, or (ii) the amount of losses that reinsurers incur related to worldwide catastrophes may materially harm the financial condition of our reinsurers and cause them to default on their obligations.
While we will attempt to manage these risks through underwriting guidelines, collateral requirements and other oversight mechanisms, our efforts may not be successful. As a result, our exposure to counterparty risk under our reinsurance agreements may cause a material adverse effect on our results of operations, financial condition and cash flow.
Our investments are subject to market risks that may result in reduced returns or losses.
We invest a portion of the premiums we collect in various securities and expect returns from our investments in these securities to contribute to our overall profitability. Accordingly, fluctuations in interest rates or in the fixed-maturity, equity or alternative-investment markets may cause a material adverse effect on our results of operations.
Changes in the general interest rate environment will affect our returns on, and the fair value of, our fixed-maturity and short-term investments. A decline in interest rates reduces the interest rate payable on new fixed income investments, thereby negatively impacting our net investment income. Conversely, rising interest rates reduce the fair value of existing fixed maturities. In addition, defaults under, or impairments of, any of these investments as a result of financial problems with the issuer and, where applicable, its guarantor could reduce our net investment income and net realized investment gains or result in investment losses.
20
UNITED INSURANCE HOLDINGS CORP.
We are subject to risks associated with potential declines in credit quality related to specific issuers and a general weakening in the economy. While we have put in place procedures designed to monitor the credit risk of our invested assets, it is possible that we may experience credit or default losses in our portfolio, which could adversely affect our results of operations and financial condition.
We may decide to invest an additional portion of our assets in equity securities or other investments, which are subject to greater volatility than fixed maturities. General economic conditions, stock market conditions and many other factors beyond our control can adversely affect the fair value of our equity securities or other investments, and could adversely affect our realization of net investment income. As a result of these factors, we may not realize an adequate return on our investments, we may incur losses on sales of our investments and we may be required to write down the value of our investments, which could reduce our net investment income and net realized investment gains or result in investment losses.
The fair value of our investment portfolio is also subject to valuation uncertainties. The valuation of investments is more subjective when the markets for these investments are illiquid and may increase the risk that the estimated fair value of our investment portfolio is not reflective of prices at which actual transactions would occur.
Our determination of the amount of other-than-temporary impairment to record varies by investment type and is based upon our periodic evaluation and assessment of known and inherent risks associated with the respective investment type. We revise our evaluations and assessments as conditions change and new information becomes available, and we reflect changes in other-than-temporary impairments in our Consolidated Statements of Comprehensive Income. We base our assessment of whether other-than-temporary impairments have occurred on our case-by-case evaluation of the underlying reasons for the decline in fair value. However, we may not accurately assess whether the impairment of one or more of our investments is temporary or other-than-temporary and the recorded amounts for other-than-temporary impairments in our financial statements may be inadequate. Furthermore, historical trends may not be indicative of future impairments and additional impairments may need to be recorded in the future.
Our portfolio may benefit from certain tax laws, including those governing dividends-received deductions and tax credits. Federal and/or state tax legislation could be enacted that would lessen or eliminate some or all of these tax advantages and could adversely affect the value of our investment portfolio. This result could occur in the context of deficit reduction or various types of fundamental tax reform.
The property and casualty insurance and reinsurance industry is historically cyclical and the pricing and terms for our products may decline, which would adversely affect our profitability.
Historically, the financial performance of the property and casualty insurance and reinsurance industry has been cyclical, characterized by periods of severe price competition and excess underwriting capacity, or soft markets, followed by periods of high premium rates and shortages of underwriting capacity, or hard markets. We cannot predict when such a period may occur or how long any given hard or soft market will last. Downturns in the property and casualty market may cause a material adverse effect on our results of operations and our financial condition.
Losses from legal actions may be material to our operating results, cash flows and financial condition.
Trends in the insurance industry regarding claims and coverage issues, such as increased litigation, the willingness of courts to expand covered causes of loss, and the escalation of loss severity may contribute to increased litigation costs and increase our loss exposure under the policies that we underwrite.
As industry practices and legal, judicial, social and other environmental conditions change, unexpected and unintended issues related to claims and coverage may emerge. Examples of emerging claims and coverage issues include, but are not limited to:
• | judicial expansion of policy coverage and the impact of new theories of liability; |
• | plaintiffs targeting property and casualty insurers in purported class-action litigation relating to claims-handling and other practices; and |
• | adverse changes in loss cost trends, including inflationary pressures in home repair costs. |
Loss severity in the property and casualty insurance industry may increase and may be driven by the effects of these and other unforeseen emerging claims and coverage issues. Multiparty or class action claims may present additional exposure to substantial economic, non-economic or punitive damage awards. The loss of even one of these claims, if it resulted in a
21
UNITED INSURANCE HOLDINGS CORP.
significant award or a judicial ruling that was otherwise detrimental, could create a precedent in our industry that could have a material adverse effect on our results of operations and financial condition. This risk of potential liability may make reasonable settlements of claims more difficult to obtain.
We may be named a defendant in a number of legal actions relating to those emerging claim and coverage issues. The propensity of policyholders and third party claimants to litigate and the willingness of courts to expand causes of loss and the size of awards may result in increased costs associated with litigation, render our loss reserves inadequate, and may be material to our operating results and cash flows for a particular quarter or annual period and to our financial condition. In addition, claims and coverage issues may not become apparent to us for some time after our issuance of the affected insurance policies. As a result, we may not know the full extent of liability under insurance policies we issue for many years after the policies are issued.
A downgrade in our financial strength rating could adversely impact our business volume and our ability to access additional debt or equity financing.
Financial strength ratings have become increasingly important to an insurer’s competitive position. Rating agencies review their ratings periodically, and our current ratings may not be maintained in the future. A downgrade in our rating could negatively impact our business volumes, as it is possible demand for our products in certain markets may be reduced or our ratings could fall below minimum levels required to maintain existing business. Additionally, we may find it more difficult to access the capital markets and we may incur higher borrowing costs. If significant losses, such as those resulting from one or more major catastrophes, or significant reserve additions were to cause our capital position to deteriorate significantly, or if one or more rating agencies substantially increase their capital requirements, we may need to raise equity capital in the future to maintain our ratings or limit the extent of a downgrade. For example, a trend of more frequent and severe weather-related catastrophes may lead rating agencies to substantially increase their capital requirements.
We cannot guarantee that our insurance affiliates, UPC, FSIC and IIC will maintain their current A (Exceptional) ratings by Demotech. Any downgrade of this rating could impact the acceptability of our products to mortgage lenders that require homeowners to buy insurance, reduce our ability to retain and attract policyholders and agents and damage our ability to compete, which may cause a material adverse effect on our results of operations and financial condition.
RISKS RELATED TO AN INVESTMENT IN OUR COMMON STOCK
Future sales of substantial amounts of our common stock by us or our existing stockholders could cause our stock price to decrease.
We have registered up to $75,000,000 of our securities (including our common stock), which we may sell from time to time in one or more offerings. Additional equity financings or other share issuances by us could adversely affect the market price of our common stock. Sales by existing stockholders of a large number of shares of our common stock in the public trading market (or in private transactions), or the perception that such additional sales could occur, could cause the market price of our common stock to decrease. Additionally, if we complete our merger with AmCo, we will issue shares representing approximately 49% of the issued and outstanding common stock of the combined company (on a pro forma basis) as consideration in the merger. Assuming our merger with AmCo is consummated, our existing shareholders will incur substantial dilution and will own approximately 51% of our issued and outstanding common stock on a pro forma basis.
Dividend payments on our common stock in the future are uncertain.
We have paid dividends on our common stock in the past. However, the declaration and payment of dividends will be at the discretion of our Board of Directors and will be dependent upon our profits, financial requirements and other factors, including legal and regulatory restrictions on the payment of dividends from our subsidiaries, general business conditions and such other factors as our Board of Directors deems relevant. Therefore, investors who purchase our common stock may only realize a return on their investment if the value of our common stock appreciates.
If we complete our merger with AmCo, the substantial ownership of our common stock by R. Daniel Peed and his affiliates may allow him to exert significant control over us.
If we complete our merger with AmCo, R. Daniel Peed, the controlling member of RDX Holding, LLC (“RDX”), which is the parent company of AmCo, will beneficially own approximately 32% of our issued and outstanding common stock. Mr. Peed also expects to receive a proxy from another member of RDX who will beneficially own approximately 8% of our issued and outstanding common stock upon consummation of our merger with AmCo. As a result, Mr. Peed may be able to exert
22
UNITED INSURANCE HOLDINGS CORP.
substantial control over us. Moreover, Mr. Peed’s interests may conflict with the interests of other holders of our common stock and he may take actions affecting us with which other stockholders may disagree. Mr. Peed may have the ability to exert significant influence over the following:
• | the nomination, election and removal of our Board of Directors; |
• | the adoption of amendments to our charter documents; |
• | management and policies; and |
• | the outcome of any corporate transaction or other matter submitted to our stockholders for approval, including mergers, consolidations and the sale of all or substantially all of our assets. |
Additionally, upon consummation of our proposed merger with AmCo, we will enter into a stockholder’s agreement with the members of RDX, including Mr. Peed, which will provide those shareholders with rights that our other shareholders will not have, including the right to appoint three of the 10 members of our Board of Directors and registration rights with respect to the shares being issued in the merger. Although the stockholder’s agreement requires shares beneficially owned by Mr. Peed and his affiliates to be voted in proportion to the votes cast by other stockholders on any proposal on which our stockholders are entitled to vote, this restriction will terminate on the earlier of (i) the fifth anniversary of the closing date of our merger with AmCo and (ii) the date that Mr. Peed and his affiliates beneficially own less than 25% of our voting securities.
Provisions in our charter documents and the shareholder rights plan that we adopted may make it harder for others to obtain control of us even though some stockholders might consider such a development to be favorable.
Our charter and bylaws contain provisions that may discourage unsolicited takeover proposals our stockholders may consider to be in their best interests. Our Board of Directors is divided into two classes, each of which will generally serve for a term of two years with only one class of directors being elected in each year. At a given annual meeting, only a portion of our Board of Directors may be considered for election. Since our “staggered board” may prevent our stockholders from replacing a majority of our Board of Directors at certain annual meetings, it may entrench our management and discourage unsolicited
stockholder proposals that may be in the best interests of our stockholders.
Further, our Board of Directors has the ability to designate the terms of and issue a new series of preferred stock.
We have also adopted a shareholder rights plan that could make it more difficult for a third party to acquire, or could discourage a third party from acquiring, our Company or a large block of our common stock. A third party that acquires 20% or more of our common stock could suffer substantial dilution of its ownership interest under the terms of the shareholder rights plan through the issuance of common stock to all stockholders other than the acquiring person. In certain circumstances the foregoing threshold may be reduced to 15%.
Together these provisions may make the removal of our management more difficult and may discourage transactions that otherwise could involve payment of a premium over prevailing market prices for our securities.
Additionally, we have taken action to render our rights plan to be inapplicable to the issuance of shares to RDX (and its members) in connection with our proposed merger with AmCo by reason of the approval, execution, announcement or consummation of the transactions contemplated by the merger agreement.
Item 1B. Unresolved Staff Comments
None.
23
UNITED INSURANCE HOLDINGS CORP.
Item 2. Properties
On September 5, 2014, we acquired approximately 40,000 square feet of commercial office space and associated property located at 800 2nd Avenue South, St. Petersburg, Florida, for use as our principal executive offices. We completed the renovation of that property in 2015 and moved our principal executive offices in December 2015.
On September 9, 2015, we acquired approximately 7,800 square feet of commercial office space at 724 2nd Avenue South, St. Petersburg, FL. The building is currently unoccupied but is being held for future use and expansion purposes.
During 2016, we renewed our lease of approximately 800 square feet of office space at 7192 Kalanianaole Highway, Honolulu, Hawaii. We paid approximately $22.08 per square foot in 2015 and approximately $23.16 per square foot during 2016.
Item 3. Legal Proceedings
We are involved in claims-related legal actions arising in the ordinary course of business. We accrue amounts resulting from claims-related legal actions in unpaid losses and loss adjustment expenses during the period that we determine an unfavorable outcome becomes probable and we can estimate the amounts. Management makes revisions to our estimates based on its analysis of subsequent information that we receive regarding various factors, including: (i) per claim information; (ii) company and industry historical loss experience; (iii) judicial decisions and legal developments in the awarding of damages; and (iv) trends in general economic conditions, including the effects of inflation.
At December 31, 2016, we were not involved in any material non claims-related legal actions.
Item 4. Mine Safety Disclosures
Not applicable.
24
UNITED INSURANCE HOLDINGS CORP.
PART II
Item 5. Market for Registrant's Common Equity, Related Stockholder Matters and Issuer Purchases of Equity Securities
MARKET INFORMATION
Our common stock trades on the NASDAQ Capital Market (NASDAQ) under the symbol "UIHC". We have one class of authorized common stock for 50,000,000 shares at a par value of $0.0001 per share.
The table below sets forth, for the calendar quarter indicated, the high and low sales prices of our common stock as reported on NASDAQ.
Sales Prices | |||||||
High | Low | ||||||
2016 | |||||||
Fourth Quarter | $ | 17.04 | $ | 9.52 | |||
Third Quarter | 17.16 | 14.29 | |||||
Second Quarter | 19.73 | 14.50 | |||||
First Quarter | 20.04 | 13.46 | |||||
2015 | |||||||
Fourth Quarter | 19.77 | 12.83 | |||||
Third Quarter | 16.79 | 12.12 | |||||
Second Quarter | 22.98 | 13.78 | |||||
First Quarter | 28.43 | 20.23 | |||||
HOLDERS OF COMMON EQUITY
As of March 15, 2017, we had 4,260 holders of record of our common stock.
DIVIDENDS
We declared and paid dividends per share each quarter during 2016 and 2015 as follows:
2016 | 2015 | ||||||
Quarterly data, per share | |||||||
First Quarter | $ | 0.05 | $ | 0.05 | |||
Second Quarter | $ | 0.06 | $ | 0.05 | |||
Third Quarter | $ | 0.06 | $ | 0.05 | |||
Fourth Quarter | $ | 0.06 | $ | 0.05 | |||
Total Dividends Paid | $ | 4,974,000 | $ | 4,302,000 | |||
Any future dividend payments will be at the discretion of our Board of Directors and will depend upon our profits, financial requirements and other factors, including legal and regulatory restrictions on the payment of dividends, general business conditions and such other factors as our Board of Directors deems relevant.
25
UNITED INSURANCE HOLDINGS CORP.
Under Florida law, a Florida-domiciled insurer like UPC, may not pay any dividend or distribute cash or other property to its shareholders except out of its available and accumulated surplus funds which are derived from realized net operating profits on its business and net realized capital gains. Additionally, Florida-domiciled insurers may not make dividend payments or distributions to shareholders without the prior approval of the insurance regulatory authority if the dividend or distribution would exceed the larger of:
1. | the lesser of: |
a. | 10% of the insurer's capital surplus, or |
b. | net income, not including realized capital gains, plus a two-year carryforward |
2. | 10% of the insurer's capital surplus with dividends payable constrained to unassigned funds minus 25% of unrealized capital gains, or |
3. | the lesser of: |
a. | 10% of the insurer's capital surplus, or |
b. | net investment income plus a three-year carryforward with dividends payable constrained to unassigned funds minus 25% of unrealized capital gains. |
Alternatively, UPC may pay a dividend or distribution without the prior written approval of the insurance regulatory authority when:
1. | the dividend is equal to or less than the greater of: |
a. | 10% of the insurer's surplus as to policyholders derived from realized net operating profits on its business and net realized capital gains, or |
b. | The insurer's entire net operating profits and realized net capital gains derived during the immediately preceding calendar year, and: |
i. | The insurer will have surplus as to policyholders equal to or exceeding 115% of the minimum required statutory surplus as to policyholders after the dividend or distribution is made, and |
ii. | The insurer files a notice of the dividend or distribution with the insurance regulatory authority at least ten business days prior to the dividend payment or distribution, and |
iii. | The notice includes a certification by an officer of the insurer attesting that, after the payment of the dividend or distribution the insurer will have at least 115% of required statutory surplus as to policyholders. |
Except as provided above, a Florida-domiciled insurer may only pay a dividend or make a distribution (i) subject to prior approval by the insurance regulatory authority, or (ii) 30 days after the insurance regulatory authority has received notice of intent to pay such dividend or distribution and has not disapproved it within such time. As of December 31, 2016 we are in compliance with these requirements.
Under the insurance regulation of Hawaii, the maximum amount of dividends that FSIC, Inc. may pay to its parent company without prior approval from the Insurance Commissioner is:
1. | the lesser of: |
a. | 10% of the insurer's surplus as of December 31 of the preceding year, or |
b. | 10% of the net income, not including realized capital gains, for the twelve-month period ending December 31 of the preceding year. |
26
UNITED INSURANCE HOLDINGS CORP.
In performing the net income test, property and casualty insurers may carry-forward income from the previous two calendar years that has not already been paid out as dividends. This carry-forward shall be computed by taking the net income from the second and third preceding calendar years, not including realized capital gains, less dividends paid in the second and immediately preceding calendar years. As of December 31, 2016 we are in compliance with these requirements.
Under the insurance regulations of New York, no company may declare or distribute any dividend to shareholders which, together with all dividends declared or distributed by it during the next preceding twelve months, exceeds:
1.the lesser of:
a. | 10% of the insurer's surplus to policyholders as shown on its latest statement on file with the Superintendent, or |
b.100% of "adjusted net investment income" during that period.
N.Y. Ins. Law 4105(a)(2) (McKinney 2000) defines "adjusted net investment income" to mean:
Net investment income for the twelve months immediately preceding the declaration or distribution of the current dividend increased by the excess, if any, of net investment income over dividends declared or distributed during the period commencing 36 months prior to the declaration or distribution of the current dividend and ending 12 months prior thereto.
Under an agreement with the New York Department of Financial Services, we will not issue dividends on behalf of IIC within two years of the acquisition date. As of December 31, 2016 we are in compliance with these requirements.
See Note 13 to our Notes to Consolidated Financial Statements for further discussion of restrictions on future payments of dividends by our insurance affiliates.
PERFORMANCE GRAPH
Set forth below is a line graph comparing the dollar change in the cumulative total shareholder return on our common stock from December 31, 2010 through December 31, 2016 as compared to the cumulative total return of the Russell 2000 index, the NASDAQ Insurance index and the S&P Insurance ETF (KIE). The cumulative total shareholder return is a concept used to compare the performance of a company's stock over time and is the ratio of the stock price change plus the cumulative amount of dividends over the specified time period (assuming dividend reinvestment), to the stock price at the beginning of the time period. The chart depicts the value on each December 31 from 2011 through 2016 of a $100 investment made on December 31, 2010 with all dividends reinvested.
27
UNITED INSURANCE HOLDINGS CORP.
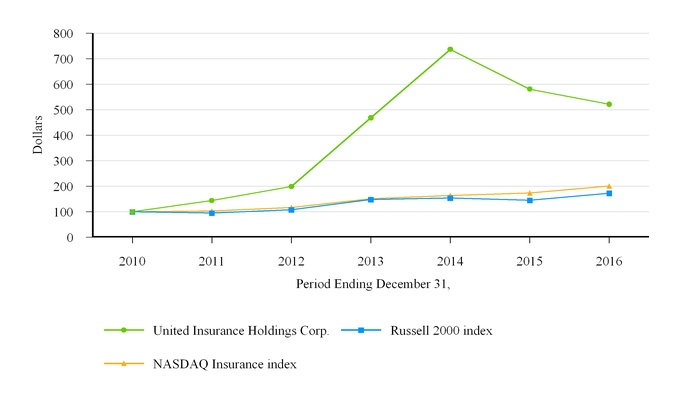
December 31, | |||||||||||||||||||||||||||
2010 | 2011 | 2012 | 2013 | 2014 | 2015 | 2016 | |||||||||||||||||||||
United Insurance Holdings Corp. | $ | 100.00 | $ | 143.55 | $ | 198.68 | $ | 469.44 | $ | 737.16 | $ | 581.00 | $ | 522.22 | |||||||||||||
Russell 2000 index | 100.00 | 94.55 | 108.38 | 148.49 | 153.73 | 144.95 | 173.18 | ||||||||||||||||||||
NASDAQ Insurance index | 100.00 | 103.09 | 117.01 | 150.69 | 163.56 | 174.12 | 201.34 | ||||||||||||||||||||
The foregoing performance graph and data shall not be deemed "filed" as part of this Annual Report for purposes of Section 18 of the Securities Exchange Act of 1934 or otherwise subject to the liabilities of that section and should not be deemed incorporated by reference into any other filing of the Company under the Securities Act of 1933 or the Securities Exchange Act of 1934, except to the extent the Company specifically incorporates it by reference into such filing.
RECENT SALES OF UNREGISTERED SECURITIES
During 2016, we did not have any unregistered sales of our equity securities.
REPURCHASES OF EQUITY SECURITIES
During 2016, we did not repurchase any of our equity securities.
28
UNITED INSURANCE HOLDINGS CORP.
Item 6. Selected Financial Data
The following selected consolidated financial data should be read in conjunction with Item 7 - MANAGEMENT'S DISCUSSION AND ANALYSIS OF FINANCIAL CONDITION AND RESULTS OF OPERATIONS and our consolidated financial statements and the related notes appearing in Item 8 - FINANCIAL STATEMENTS AND SUPPLEMENTARY DATA of this Annual Report. The consolidated statements of income data for the years ended December 31, 2016, 2015 and 2014 and the consolidated balance sheet data at December 31, 2016 and 2015 are derived from our audited financial statements appearing in Item 8 of this Annual Report. The consolidated statements of income data for the years ended December 31, 2013 and 2012 and the balance sheet data for the years ended December 31, 2014, 2013 and 2012 are derived from our audited consolidated financial statements that are not included in this Annual Report. The historical results shown below are not necessarily indicative of the results to be expected in any future period.
As of and for the Years Ended December 31, | |||||||||||||||||||
2016 | 2015 | 2014 | 2013 | 2012 | |||||||||||||||
Income Statement Data: | |||||||||||||||||||
Revenue: | |||||||||||||||||||
Gross premiums written | $ | 708,156 | $ | 569,736 | $ | 436,753 | $ | 381,352 | $ | 254,909 | |||||||||
Gross premiums earned | 666,829 | 504,215 | 400,695 | 316,708 | 226,254 | ||||||||||||||
Net premiums earned | $ | 456,931 | $ | 335,958 | $ | 264,850 | $ | 197,378 | $ | 121,968 | |||||||||
Net investment income and realized gains | 11,226 | 10,039 | 6,775 | 3,742 | 5,243 | ||||||||||||||
Other revenue | 18,960 | 11,572 | 8,605 | 6,960 | 4,023 | ||||||||||||||
Total revenue | $ | 487,117 | $ | 357,569 | $ | 280,230 | $ | 208,080 | $ | 131,234 | |||||||||
Expenses: | |||||||||||||||||||
Loss and loss adjustment expenses | 298,353 | 183,108 | 118,077 | 98,830 | 58,409 | ||||||||||||||
Other operating expenses | 181,138 | 132,569 | 97,410 | 74,397 | 57,241 | ||||||||||||||
Interest expense | 723 | 326 | 410 | 367 | 355 | ||||||||||||||
Total expenses | $ | 480,214 | $ | 316,003 | $ | 215,897 | $ | 173,594 | $ | 116,005 | |||||||||
Income before income taxes | 7,003 | 41,860 | 64,410 | 34,487 | 15,714 | ||||||||||||||
Provision for income taxes | 1,305 | 14,502 | 23,397 | 14,145 | 6,009 | ||||||||||||||
Net income | $ | 5,698 | $ | 27,358 | $ | 41,013 | $ | 20,342 | $ | 9,705 | |||||||||
Earnings per share | |||||||||||||||||||
Basic | $ | 0.27 | $ | 1.29 | $ | 2.06 | $ | 1.26 | $ | 0.91 | |||||||||
Diluted | $ | 0.26 | $ | 1.28 | $ | 2.05 | $ | 1.26 | $ | 0.91 | |||||||||
Cash dividends declared per share | $ | 0.23 | $ | 0.20 | $ | 0.16 | $ | 0.12 | $ | 0.08 | |||||||||
Return on average equity, trailing twelve months | 2.4 | % | 12.4 | % | 27.2 | % | 20.8 | % | 16.1 | % | |||||||||
Ceded ratio(1) | 31.5 | % | 33.4 | % | 33.9 | % | 37.7 | % | 46.1 | % | |||||||||
Ratios to net premiums earned: | |||||||||||||||||||
Loss and loss adjustment expenses | 65.3 | % | 54.5 | % | 44.6 | % | 50.0 | % | 47.9 | % | |||||||||
Expenses | 39.6 | % | 39.5 | % | 36.8 | % | 37.7 | % | 46.9 | % | |||||||||
Combined Ratio | 104.9 | % | 94.0 | % | 81.4 | % | 87.7 | % | 94.8 | % | |||||||||
Effect of current year catastrophe losses on combined ratio | 12.2 | % | 8.5 | % | 0.3 | % | 1.8 | % | 3.0 | % | |||||||||
Effect of prior year (favorable) development on combined ratio | 3.7 | % | (0.7 | )% | (1.5 | )% | 2.1 | % | 0.5 | % | |||||||||
Underlying Combined Ratio(2) | 89.0 | % | 86.2 | % | 82.6 | % | 83.8 | % | 91.3 | % | |||||||||
(1) Calculated as ceded premiums earned divided by gross premiums earned.
(2) Underlying combined ratio, a measure that is not based on accounting principles generally accepted in the United States of America (GAAP), is reconciled above to the combined ratio, the most directly comparable GAAP measure. Additional information regarding non-GAAP financial measures presented in this document is in the "Definitions of Non-GAAP Measures" in Part II Item 7 of this document.
29
UNITED INSURANCE HOLDINGS CORP.
As of and for the Years Ended December 31, | |||||||||||||||||||
2016 | 2015 | 2014 | 2013 | 2012 | |||||||||||||||
Balance Sheet Data: | |||||||||||||||||||
Cash and invested assets | $ | 679,335 | $ | 537,500 | $ | 443,018 | $ | 326,548 | $ | 223,385 | |||||||||
Prepaid reinsurance premiums | 132,564 | 79,399 | 63,827 | 55,268 | 49,916 | ||||||||||||||
Total Assets | $ | 999,686 | $ | 740,021 | $ | 584,169 | $ | 441,230 | $ | 314,715 | |||||||||
Unpaid loss and loss adjustment expenses | $ | 140,855 | $ | 76,792 | $ | 54,436 | $ | 47,451 | $ | 35,692 | |||||||||
Unearned premiums | 372,223 | 304,653 | 229,486 | 193,428 | 128,785 | ||||||||||||||
Reinsurance payable | 99,891 | 64,542 | 45,254 | 39,483 | 26,063 | ||||||||||||||
Notes payable | 54,175 | 12,353 | 13,529 | 14,706 | 15,882 | ||||||||||||||
Total Liabilities | $ | 758,359 | $ | 500,810 | $ | 380,406 | $ | 333,643 | $ | 225,628 | |||||||||
Total Stockholders' Equity | $ | 241,327 | $ | 239,211 | $ | 203,763 | $ | 107,587 | $ | 89,087 | |||||||||
Statutory Surplus | $ | 212,298 | $ | 150,860 | $ | 126,249 | $ | 78,362 | $ | 68,007 | |||||||||
30
UNITED INSURANCE HOLDINGS CORP.
Item 7. Management's Discussion and Analysis of Financial Condition and Results of Operations
The following discussion and analysis of our financial condition and results of operations should be read in conjunction with our consolidated financial statements and related notes appearing elsewhere in this Form 10-K. This discussion and analysis contains forward-looking statements that involve risks, uncertainties and assumptions. The actual results may differ materially from those anticipated in these forward-looking statements as a result of certain factors, including, but not limited to, those which are not within our control.
EXECUTIVE SUMMARY
Overview
UIHC serves as the holding company for UPC and its affiliated companies. We conduct our business principally through seven wholly owned operating subsidiaries: UPC, UIM, FSIC, FSU, Skyway Claims Services, LLC (our claims adjusting affiliate), UPC Re (our reinsurance affiliate) and IIC. Collectively, including United Insurance Holdings Corp., we refer to these entities as “UPC Insurance,” which is the preferred brand identification we are establishing for our Company.
UPC Insurance is primarily engaged in the homeowners' property and casualty insurance business in the United States. We currently write in Connecticut, Florida, Georgia, Hawaii, Louisiana, Massachusetts, New Jersey, New York, North Carolina, Rhode Island, South Carolina and Texas, and we are licensed to write in Alabama, Delaware, Maryland, Mississippi, New Hampshire, and Virginia. Our target market currently consists of areas where the perceived threat of natural catastrophe has caused large national insurance carriers to reduce their concentration of policies. In such areas we believe an opportunity exists for UPC Insurance to write profitable business.
We manage our risk of catastrophic loss primarily through sophisticated pricing algorithms, avoidance of policy concentration, and the use of a comprehensive catastrophe reinsurance program. UPC Insurance has been operating continuously in Florida since 1999, and has successfully managed its business through various hurricanes, tropical storms, and other weather related events. We believe our record of successful risk management and experience in writing business in catastrophe-exposed areas provides us with a competitive advantage as we grow our business in other states facing similar perceived threats.
The following discussion highlights significant factors influencing the consolidated financial position and results of operations of UPC Insurance. In evaluating our results of operations, we use premiums written and earned, policies in-force and new and renewal policies by geographic concentration. We also consider the impact of catastrophe losses and prior year development on our loss ratios, expense ratios and combined ratios. In monitoring our investments, we use credit quality, investment income, cash flows, realized gains and losses, unrealized gains and losses, asset diversification and portfolio duration. To evaluate our financial condition, we consider the following factors: liquidity, financial strength, ratings, book value per share and return on equity.
Recent Events
During the fourth quarter of 2016, Hurricane Matthew impacted Florida and Georgia before making landfall in South Carolina and also impacting North Carolina. We write property insurance in all four states and are working diligently to provide claim service to our insureds who were impacted by the storm. We have received over 5,000 claims related to Hurricane Matthew and incurred approximately $30,000,000 of pre-tax catastrophe losses, net of reinsurance recoverable, during the fourth quarter of 2016 from this event.
On February 22, 2017, our Board of Directors declared a $0.06 per share quarterly cash dividend payable on March 15, 2017, to stockholders of record on March 8, 2017.
On August 17, 2016, we entered into a Merger Agreement with AmCo Holding Company (AmCo), a North Carolina corporation and a wholly owned subsidiary of RDX Holding, LLC (RDX), to acquire AmCo and its two wholly owned subsidiaries, American Coastal and BlueLine Cayman Holdings, through a series of mergers. American Coastal is engaged in the commercial residential property and casualty insurance business and writes coverage for Florida condominiums, homeowners' associations, apartments and townhomes through AmRisc, its managing general agent. BlueLine Cayman Holdings is a Cayman Islands holding company that holds an interest in BlueLine Re, a protected cell whose sole business is the entry into and performance of quota share agreements. At the effective time of the mergers, each issued and outstanding
31
UNITED INSURANCE HOLDINGS CORP.
share of common stock of AmCo will be converted into shares of common stock of UIHC equal to 209,563.55 multiplied by the lesser of (a) one and (b) a fraction, the numerator of which is 130% of $14.81 and the denominator of which is the 30-day trailing volume-weighted average closing stock price of UIHC common stock as of the day of the closing of the mergers. Immediately following the completion of the mergers, current UIHC stockholders and RDX members will own approximately 51% and 49% of the outstanding shares of UIHC common stock, respectively.
2016 Highlights
($ in thousands, except per share, ratios and policies in-force) | Year Ended December 31, | |||||||
2016 | 2015 | |||||||
Gross written premium | $ | 708,156 | $ | 569,736 | ||||
Net premium earned | $ | 456,931 | $ | 335,958 | ||||
Investment income | $ | 10,679 | $ | 9,212 | ||||
Net realized gains | $ | 547 | $ | 827 | ||||
Total revenues | $ | 487,117 | $ | 357,569 | ||||
Losses and loss adjustment expenses | $ | 298,353 | $ | 183,108 | ||||
Total expenses | $ | 480,214 | $ | 316,003 | ||||
Consolidated net income | $ | 5,698 | $ | 27,358 | ||||
Net income per diluted share | $ | 0.26 | $ | 1.28 | ||||
Combined ratio (1) | 104.9 | % | 94.0 | % | ||||
Return on average equity, trailing twelve months | 2.4 | % | 12.4 | % | ||||
Policies in-force | 451,155 | 347,015 | ||||||
(1) Combined ratio is the sum of the loss ratio, net and the expense ratio, net.
($ in thousands, except per share and ratios) | December 31, 2016 | December 31, 2015 | % Change | |||||||
Investment and Cash holdings | $ | 679,335 | $ | 537,500 | 26.4 | % | ||||
Book value per share | $ | 11.15 | $ | 11.11 | 0.4 | % | ||||
32
UNITED INSURANCE HOLDINGS CORP.
CONSOLIDATED NET INCOME
Year Ended December 31, | ||||||||||||
2016 | 2015 | 2014 | ||||||||||
REVENUE: | ||||||||||||
Gross premiums written | $ | 708,156 | $ | 569,736 | $ | 436,753 | ||||||
Increase in gross unearned premiums | (41,327 | ) | (65,521 | ) | (36,058 | ) | ||||||
Gross premiums earned | 666,829 | 504,215 | 400,695 | |||||||||
Ceded premiums earned | (209,898 | ) | (168,257 | ) | (135,845 | ) | ||||||
Net premiums earned | 456,931 | 335,958 | 264,850 | |||||||||
Net investment income | 10,679 | 9,212 | 6,795 | |||||||||
Net realized gains (losses) | 547 | 827 | (20 | ) | ||||||||
Other revenue | 18,960 | 11,572 | 8,605 | |||||||||
Total revenue | 487,117 | 357,569 | 280,230 | |||||||||
EXPENSES: | ||||||||||||
Losses and loss adjustment expenses | 298,353 | 183,108 | 118,077 | |||||||||
Policy acquisition costs | 117,658 | 87,401 | 65,657 | |||||||||
Operating expenses | 20,524 | 15,316 | 11,746 | |||||||||
General and administrative expenses | 42,956 | 29,852 | 20,007 | |||||||||
Interest expense | 723 | 326 | 410 | |||||||||
Total expenses | 480,214 | 316,003 | 215,897 | |||||||||
Income before other income | 6,903 | 41,566 | 64,333 | |||||||||
Other income | 100 | 294 | 77 | |||||||||
Income before income taxes | 7,003 | 41,860 | 64,410 | |||||||||
Provision for income taxes | 1,305 | 14,502 | 23,397 | |||||||||
Net income | $ | 5,698 | $ | 27,358 | $ | 41,013 | ||||||
Net income per diluted share | $ | 0.26 | $ | 1.28 | $ | 2.05 | ||||||
Book value per share | $ | 11.15 | $ | 11.11 | $ | 9.75 | ||||||
Return on average equity, trailing twelve months | 2.4 | % | 12.4 | % | 27.2 | % | ||||||
Loss ratio, net1 | 65.3 | % | 54.5 | % | 44.6 | % | ||||||
Expense ratio, net2 | 39.6 | % | 39.5 | % | 36.8 | % | ||||||
Combined ratio (CR)3 | 104.9 | % | 94.0 | % | 81.4 | % | ||||||
Effect of current year catastrophe losses on CR | 12.2 | % | 8.5 | % | 0.3 | % | ||||||
Effect of prior year development on CR | 3.7 | % | (0.7 | )% | (1.5 | )% | ||||||
Underlying combined ratio4 | 89.0 | % | 86.2 | % | 82.6 | % | ||||||
1 Loss ratio, net is calculated as losses and loss adjustment expenses relative to net premiums earned.
2 Expense ratio is calculated as the sum of all operating expenses less interest expense relative to net premiums earned.
3 Combined ratio is the sum of the loss ratio, net and the expense ratio, net.
4 Underlying combined ratio, a measure that is not based on accounting principles generally accepted in the United States of America (GAAP), is reconciled above to the combined ratio, the most directly comparable GAAP measure. Additional information regarding non-GAAP financial measures presented in this document is in the "Definitions of Non-GAAP Measures" section of this document.
Definitions of Non-GAAP Measures
We believe that investors' understanding of UPC Insurance's performance is enhanced by our disclosure of the following non-GAAP measures. Our methods for calculating these measures may differ from those used by other companies and therefore comparability may be limited.
Combined ratio excluding the effects of current year catastrophe losses and reserve development (underlying combined ratio) is a non-GAAP ratio, which is computed as the difference between three GAAP operating ratios: the combined ratio, the effect of current year catastrophe losses on the combined ratio and the effect of prior year development on the combined ratio. We believe that this ratio is useful to investors and it is used by management to reveal the trends in our business that may be
33
UNITED INSURANCE HOLDINGS CORP.
obscured by current year catastrophe losses, losses from lines in run-off and prior year development. Current year catastrophe losses cause our loss trends to vary significantly between periods as a result of their incidence of occurrence and magnitude, and can have a significant impact on the combined ratio. Prior year development is caused by unexpected loss development on historical reserves. We believe it is useful for investors to evaluate these components separately and in the aggregate when reviewing our performance. The most direct comparable GAAP measure is the combined ratio. The underlying combined ratio should not be considered as a substitute for the combined ratio and does not reflect the overall profitability of our business.
Net Loss and LAE excluding the effects of current year catastrophe losses and reserve development (underlying Loss and LAE) is a non-GAAP measure which is computed as the difference between loss and LAE, current year catastrophe losses and prior year reserve development. We use underlying loss and LAE figures to analyze our loss trends that may be impacted by current year catastrophe losses and prior year development on our reserves. As discussed previously, these three items can have a significant impact on our loss trend in a given period. The most direct comparable GAAP measure is net loss and LAE. The underlying loss and LAE figure should not be considered a substitute for net losses and LAE and does not reflect the overall profitability of our business.
Consolidated net loss ratio excluding the effects of current year catastrophe losses, reserve development (underlying loss ratio) is a non-GAAP ratio, which is computed as the difference between three GAAP operating ratios: the consolidated net loss ratio, the effect of current year catastrophe losses on the loss ratio, and the effect of prior year development on the loss ratio. We believe that this ratio is useful to investors and it is used by management to reveal the trends in our consolidated net loss ratio that may be obscured by current year catastrophe losses and prior year development. As discussed previously, these two items can have a significant impact on our consolidated net loss ratio in a given period. The most direct comparable GAAP ratio is our net consolidated Loss and LAE ratio. The underlying loss ratio should not be considered as a substitute for net consolidated loss ratio and does not reflect the overall profitability of our business.
RECENT ACCOUNTING STANDARDS
Please refer to Note 2(r) in our Notes to Consolidated Financial Statements for a discussion of recent accounting standards that may affect us.
APPLICATION OF CRITICAL ACCOUNTING ESTIMATES
The preparation of financial statements in conformity with U.S. generally accepted accounting principles (GAAP) requires management to adopt accounting policies and make estimates and assumptions that affect amounts reported in the consolidated financial statements. The most critical estimates include those used in determining:
• | reserves for unpaid losses, |
• | fair value of investments, |
• | investment portfolio impairments, and |
• | goodwill. |
In making these determinations, management makes subjective and complex judgments that frequently require estimates about matters that are inherently uncertain. Many of these policies, estimates and related judgments are common in the insurance industry. It is reasonably likely that changes in these estimates could occur from time to time and result in a material impact on our consolidated financial statements.
34
UNITED INSURANCE HOLDINGS CORP.
Reserves for Unpaid Losses and Loss Adjustment Expenses
Reserves for unpaid losses and loss adjustment expenses represent the most significant accounting estimate inherent in the preparation of our financial statements. These reserves represent management’s best estimate of the amount we will ultimately pay for losses and we base the amount upon the application of various actuarial reserve estimation techniques as well as considering other material facts and circumstances known at the balance sheet date.
As discussed in Note 10 in our Notes to Consolidated Financial Statements, we determine our ultimate losses by using multiple actuarial methods to determine an actuarial estimate within a relevant range of indications that we calculate using generally accepted actuarial techniques. Our selection of the actuarial estimate is influenced by the analysis of our historical loss and claims experience since inception. For each accident year, we estimate the ultimate incurred losses for both reported and unreported claims. In establishing this estimate, we reviewed the results of various actuarial methods discussed in Note 10 in our Notes to Consolidated Financial Statements.
Fair Value of Investments
Fair value is defined as the price that would be received to sell an asset or paid to transfer a liability in an orderly transaction between market participants at the measurement date. We are responsible for the determination of fair value of financial assets and the supporting assumptions and methodologies. We use quoted prices from active markets and we use an independent third-party valuation service to assist us in determining fair value. We obtain only one single quote or price for each financial instrument.
As discussed in Note 3 in our Notes to Consolidated Financial Statements, we value our investments at fair value using quoted prices from active markets, to the extent available. For securities for which quoted prices in active markets are unavailable, we use observable inputs such as quoted prices in inactive markets, quoted prices in active markets for similar instruments, benchmark interest rates, broker quotes and other relevant inputs. We have several investments in limited partnerships that require us to use unobservable inputs.
Investment Portfolio Impairments
For investments classified as available for sale, the difference between fair value and cost or amortized cost for fixed income securities and cost for equity securities is reported as a component of accumulated other comprehensive income on our Consolidated Balance Sheet and is not reflected in our net income of any period until reclassified to net income upon the consummation of a transaction with an unrelated third party or when a write-down is recorded due to an other-than-temporary decline in fair value. We have a portfolio monitoring process to identify and evaluate each fixed income and equity security whose carrying value may be other-than-temporarily impaired.
For each fixed income security in an unrealized loss position, we assess whether management with the appropriate authority has made the decision to sell or whether it is more likely than not we will be required to sell the security before recovery of the amortized cost basis for reasons such as liquidity, contractual or regulatory purposes. If a security meets either of these criteria, the security's decline in fair value is considered other-than-temporary and is recorded in earnings.
If we have not made the decision to sell the fixed income security and it is not more likely than not we will be required to sell the fixed income security before recovery of its amortized cost basis, we evaluate whether we expect to receive cash flows sufficient to recover the entire amortized cost basis of the security. We use our best estimate of future cash flows expected to be collected from the fixed income security, discounted at the security's original or current effective rate, as appropriate, to calculate a recovery value and determine whether a credit loss exists. The determination of cash flow estimates is inherently subjective and methodologies may vary depending on facts and circumstances specific to the security. All reasonably available information relevant to the collectability of the security, including past events, current conditions, and reasonable and supportable assumptions and forecasts, are considered when developing the estimate of cash flows expected to be collected. That information generally includes, but is not limited to, the remaining payment terms of the security, prepayment speeds, the financial condition and future earnings potential of the issue or issuer, expected defaults, expected recoveries, the value of underlying collateral, vintage, geographic concentration, available reserves or escrows, current subordination levels, third party guarantees and other credit enhancements. Other information, such as industry analyst reports and forecasts, sector credit ratings, financial condition of the bond insurer for insured fixed income securities, and other market data relevant to the realizability of contractual cash flows, may also be considered. The estimated fair value of collateral will be used to estimate recovery value if we determine that the security is dependent on the liquidation of collateral for ultimate settlement. If the
35
UNITED INSURANCE HOLDINGS CORP.
estimated recovery value is less than the amortized cost of the security, a credit loss exists and an other-than-temporary impairment for the difference between the estimated recovery value and amortized cost is recorded in earnings. The portion of the unrealized loss related to factors other than credit remains classified in accumulated other comprehensive income. If we determine that the fixed income security does not have sufficient cash flow or other information to estimate a recovery value for the security, we may conclude that the entire decline in fair value is deemed to be credit related and the loss is recorded in earnings.
There are a number of assumptions and estimates inherent in evaluating impairments of equity securities and determining if they are other-than-temporary, including: (1) our ability and intent to hold the investment for a period of time sufficient to allow for an anticipated recovery in value; (2) the length of time and extent to which the fair value has been less than cost; (3) the financial condition, near-term and long-term prospects of the issue or issuer, including relevant industry specific market conditions and trends, geographic location and implications of rating agency actions and offering prices; and (4) the specific reasons that a security is in an unrealized loss position, including overall market conditions which could affect liquidity.
Once assumptions and estimates are made, any number of changes in facts and circumstances could cause us to subsequently determine that a fixed income or equity security is other-than-temporarily impaired, including: (1) general economic conditions that are worse than previously forecasted or that have a greater adverse effect on a particular issuer or industry sector than originally estimated; (2) changes in the facts and circumstances related to a particular issue or issuer's ability to meet all of its contractual obligations; and (3) changes in facts and circumstances that result in changes to management's intent to sell or result in our assessment that it is more likely than not we will be required to sell before recovery of the amortized cost basis of a fixed income security or cause a change in our ability or intent to hold an equity security until it recovers in value. Changes in assumptions, facts and circumstances could result in additional charges to earnings in future periods to the extent that losses are realized. The charge to earnings, while potentially significant to net income, would not have a significant effect on stockholders' equity, since our securities are designated as available for sale and carried at fair value and as a result, any related unrealized loss, net of taxes would already be reflected as a component of accumulated other comprehensive income in stockholders' equity.
The determination of the amount of other-than-temporary impairment is an inherently subjective process based on periodic evaluations of the factors described above. Such evaluations and assessments are revised as conditions change and new information becomes available. We update our evaluations quarterly and reflect changes in other-than-temporary impairments in results of operations as such evaluations are revised. The use of different methodologies and assumptions in the determination of the amount of other-than-temporary impairments may have a material effect on the amounts presented within the consolidated financial statements
See Note 2(b) in our Notes to Consolidated Financial Statements for further information regarding our impairment testing.
36
UNITED INSURANCE HOLDINGS CORP.
Measurement of Goodwill and Related Impairment
Goodwill is the excess of cost over the estimated fair value of net assets acquired. Goodwill is not amortized but is tested for impairment at least annually or more frequently if events or circumstances, such as adverse changes in the business climate, indicate that there may be justification for conducting an interim test. We test goodwill for impairment by either performing a qualitative assessment or a two-step quantitative test and goodwill is impaired when it is determined that carrying value of a reporting unit is in excess of the fair value of that reporting unit. The valuation methodologies utilized are subject to key judgments and assumptions that are sensitive to change. Estimates of fair value are inherently uncertain and represent only management’s reasonable expectation regarding future developments.
As discussed in Note 2 in our Notes to Consolidated Financial Statements, the qualitative assessment is an assessment of historical information and relevant events and circumstances to determine whether it is more likely than not that the fair value of a reporting unit is less than its carrying amount, including goodwill. We may elect not to perform the qualitative assessment and perform a two-step quantitative impairment test.
ANALYSIS OF FINANCIAL CONDITION - DECEMBER 31, 2016 COMPARED TO DECEMBER 31, 2015
The following discussion and analysis of our financial condition and results of operations should be read in conjunction with our accompanying consolidated financial statements and related notes.
Investments
With respect to our investments, we primarily attempt to preserve capital, maximize after-tax investment income, maintain liquidity and minimize risk. To accomplish our goals, we purchase debt securities in sectors that we believe represent the most attractive relative value, and we maintain a moderate equity exposure. We must comply with applicable state insurance regulations that prescribe the type, quality and concentrations of investments our insurance affiliates can make; therefore, our current investment policy limits investment in non-investment-grade fixed maturities and limits total investment amounts in preferred stock, common stock and mortgage notes receivable. We do not invest in derivative securities.
Two outside asset management companies, which have the authority and discretion to buy and sell securities for us, manage our investments subject to (i) the guidelines established by our Board of Directors, and (ii) the direction of management. We direct our asset managers to make changes and to hold, buy or sell securities in our portfolios. The Investment Committee of our Board of Directors reviews and approves our investment policy on a regular basis.
Our cash, cash equivalents and investment portfolios totaled $679,335,000 at December 31, 2016 compared to $537,500,000 at December 31, 2015. The increase is a result of the addition of the IIC portfolio during 2016.
The following table summarizes our investments, by type:
37
UNITED INSURANCE HOLDINGS CORP.
December 31, 2016 | December 31, 2015 | ||||||||||||
Fair Value | Percent of Total | Fair Value | Percent of Total | ||||||||||
U.S. government and agency securities | $ | 149,952 | 22.1 | % | $ | 81,647 | 15.2 | % | |||||
Foreign governments | 2,061 | 0.3 | % | 2,075 | 0.4 | % | |||||||
States, municipalities and political subdivisions | 169,112 | 24.9 | % | 155,905 | 29.0 | % | |||||||
Public utilities | 7,730 | 1.1 | % | 8,493 | 1.6 | % | |||||||
Corporate securities | 164,536 | 24.2 | % | 146,758 | 27.2 | % | |||||||
Redeemable preferred stocks | 1,125 | 0.2 | % | 1,820 | 0.3 | % | |||||||
Total fixed maturities | 494,516 | 72.8 | % | 396,698 | 73.7 | % | |||||||
Mutual fund | — | — | % | 26,343 | 4.9 | % | |||||||
Public utilities | 1,507 | 0.2 | % | 1,352 | 0.3 | % | |||||||
Common stocks | 24,048 | 3.6 | % | 20,694 | 3.9 | % | |||||||
Nonredeemable preferred stocks | 2,843 | 0.4 | % | 2,417 | 0.4 | % | |||||||
Total equity securities | 28,398 | 4.2 | % | 50,806 | 9.5 | % | |||||||
Other long-term investments | 5,733 | 0.8 | % | 5,210 | 1.0 | % | |||||||
Total investments | $ | 528,647 | 77.8 | % | $ | 452,714 | 84.2 | % | |||||
Cash and cash equivalents | $ | 150,688 | 22.2 | % | $ | 84,786 | 15.8 | % | |||||
Total cash, cash equivalents and investments | $ | 679,335 | 100.0 | % | $ | 537,500 | 100.0 | % | |||||
We classify all of our investments as available-for-sale. Our investments at December 31, 2016 and 2015 consisted mainly of U.S. government and agency securities, states, municipalities and political subdivisions and securities of investment-grade corporate issuers. Our equity holdings consisted mainly of securities issued by companies in the energy, consumer products, financial, technology and industrial sectors. Most of the corporate bonds we hold reflected a similar diversification. At December 31, 2016, approximately 90% of our fixed maturities were U.S. Treasuries, or corporate bonds rated “A” or better, and 10% were corporate bonds rated “BBB” or “BB”.
At December 31, 2016, securities in an unrealized loss position for a period of twelve months or longer reflected unrealized losses of $236,000; approximately $26,000 of the total related to one fixed maturity security, while twenty-four equity securities reflected unrealized losses of $210,000. We currently have no plans to sell these twenty-five securities, and we expect to fully recover our cost basis. We reviewed all of our securities and determined that we did not need to record impairment charges at December 31, 2016. Similarly, we did not record impairment charges at December 31, 2015.
Reinsurance Payable
We follow industry practice of reinsuring a portion of our risks. Reinsurance involves transferring, or "ceding", all or a portion of the risk exposure on policies we write to another insurer, known as a reinsurer. To the extent that our reinsurers are unable to meet the obligations they assume under our reinsurance agreements, we remain primarily liable for the entire insured loss under the policies we write.
During the second quarter of 2016, we placed our reinsurance program for the 2016 hurricane season. We purchased catastrophe excess of loss reinsurance protection of $1,515,197,000. The contracts reinsure for personal lines property excess catastrophe losses caused by multiple perils including hurricanes, tropical storms, and tornadoes. The agreements were effective as of June 1, 2016, for a one-year term and incorporate the mandatory coverage required by and placed with the Florida Hurricane Catastrophe Fund. The private agreements provide coverage against severe weather events such as hurricanes, tropical storms and tornadoes. Effective January 1, 2017, we placed a reinsurance agreement to provide coverage against accumulated losses from specified catastrophe events, that will expire on December 31, 2017.
See Note 9 in our Notes to Consolidated Financial Statements for additional information regarding our reinsurance program.
38
UNITED INSURANCE HOLDINGS CORP.
Unpaid Losses and Loss Adjustments
We generally use the term "loss(es)" to collectively refer to both loss and loss adjusting expenses. We establish reserves for both reported and unreported unpaid losses that have occurred at or before the balance sheet date for amounts we estimate we will be required to pay in the future, including provisions for claims that have been reported but are unpaid at the balance sheet date and for obligations on claims that have been incurred but not reported at the balance sheet date. Our policy is to establish these loss reserves after considering all information known to us at each reporting period. At any given point in time, our loss reserve represents our best estimate of the ultimate settlement and administration costs of our insured claims incurred and unpaid.
Unpaid losses and loss adjustment expenses totaled $140,855,000 and $76,792,000 as of December 31, 2016 and December 31, 2015, respectively.
Since the process of estimating loss reserves requires significant judgment due to a number of variables, such as fluctuations in inflation, judicial decisions, legislative changes and changes in claims handling procedures, our ultimate liability will likely differ from these estimates. We revise our reserve for unpaid losses as additional information becomes available, and reflect adjustments, if any, in our earnings in the periods in which we determine the adjustments as necessary.
See Note 10 in our Notes to Unaudited Consolidated Financial Statements for additional information regarding our losses and loss adjustments.
RESULTS OF OPERATIONS - 2016 COMPARED TO 2015
Revenues
Net income for the year ended December 31, 2016 was $5,698,000, or $0.26 per diluted share, compared to $27,358,000, or $1.28 per diluted share for the year ended December 31, 2015. The decrease in net income was primarily due to increases in loss and loss adjustment expenses during 2016 as compared to 2015.
Our total gross written premium increased by $138,420,000, or 24.3%, to $708,156,000 for the year ended December 31, 2016 from $569,736,000 for the year ended December 31, 2015, primarily due to the strong organic growth in new and renewal business generated in our Gulf and Northeast regions. Increases in direct written premium of over $159,335,000 were partially offset by reductions in assumed premium as we sharply curtailed our takeout activity in 2016 compared to the prior year. The breakdown of the year-over-year changes in both direct written and assumed premiums by region is shown in the table below.
Direct and Assumed Written Premium By Region (1) | 2016 | 2015 | Change | |||||||||
Florida | $ | 336,591 | $ | 314,588 | $ | 22,003 | ||||||
Gulf | 160,520 | 91,303 | 69,217 | |||||||||
Northeast | 123,964 | 73,128 | 50,836 | |||||||||
Southeast | 87,176 | 69,897 | 17,279 | |||||||||
Total direct written premium | $ | 708,251 | $ | 548,916 | $ | 159,335 | ||||||
Assumed premium (2) | (95 | ) | 20,820 | (20,915 | ) | |||||||
Total gross written premium | $ | 708,156 | $ | 569,736 | $ | 138,420 | ||||||
(1) Each region is comprised of the following states: Gulf includes Hawaii, Louisiana and Texas, Northeast includes Connecticut, Massachusetts, New Jersey, New York and Rhode Island, and Southeast includes Georgia, North Carolina and South Carolina.
(2) Assumed premiums written includes $1,610,000 of homeowners premium assumed from Maidstone Insurance Company in conjunction with the IIC acquisition in 2016, as well as premiums assumed from Citizens Property insurance Corporation (Citizens) in 2015 and 2016 as well as the Texas Windstorm Insurance Association in 2016.
39
UNITED INSURANCE HOLDINGS CORP.
New and Renewal Policies* By Region (1) | 2016 | 2015 | Change | ||||||
Florida | 192,921 | 175,284 | 17,637 | ||||||
Gulf | 105,334 | 58,752 | 46,582 | ||||||
Northeast | 89,512 | 54,172 | 35,340 | ||||||
Southeast | 69,018 | 52,522 | 16,496 | ||||||
Total | 456,785 | 340,730 | 116,055 | ||||||
(1) Each region is comprised of the following states: Gulf includes Hawaii, Louisiana and Texas, Northeast includes Connecticut, Massachusetts, New Jersey, New York and Rhode Island, and Southeast includes Georgia, North Carolina and South Carolina.
* Only includes new and renewal homeowner, commercial and dwelling fire policies written during the year.
We expect our gross written premium growth to continue as we increase our policies in-force in the states in which we currently write policies and as we expand into other states in which we are currently licensed to write property and casualty insurance.
40
UNITED INSURANCE HOLDINGS CORP.
Expenses
Expenses for the year ended December 31, 2016 increased $164,211,000, or 52.0%, to $480,214,000 for the year ended December 31, 2016 from $316,003,000 for the same period in 2015, primarily due to increased losses, policy acquisition costs, operating costs and general and administrative expenses. The calculation of our underlying loss and combined ratios is shown below.
Year Ended December 31, | |||||||||||
2016 | 2015 | Change | |||||||||
Net Loss and LAE | $ | 298,353 | $ | 183,108 | $ | 115,245 | |||||
% of Gross earned premiums | 44.7 | % | 36.3 | % | 8.4 | pts | |||||
% of Net earned premiums | 65.3 | % | 54.5 | % | 10.8 | pts | |||||
Less: | |||||||||||
Current year catastrophe losses | $ | 55,842 | $ | 28,565 | $ | 27,277 | |||||
Prior year reserve development | 16,988 | (2,368 | ) | 19,356 | |||||||
Underlying loss and LAE* | $ | 225,523 | $ | 156,911 | $ | 68,612 | |||||
% of Gross earned premiums | 33.8 | % | 31.1 | % | 2.7 | pts | |||||
% of Net earned premiums | 49.4 | % | 46.7 | % | 2.7 | pts | |||||
Policy acquisition costs | $ | 117,658 | $ | 87,401 | $ | 30,257 | |||||
Operating and underwriting | 20,524 | 15,316 | 5,208 | ||||||||
General and administrative | 42,956 | 29,852 | 13,104 | ||||||||
Total Operating Expenses | $ | 181,138 | $ | 132,569 | $ | 48,569 | |||||
% of Gross earned premiums | 27.2 | % | 26.3 | % | 0.9 | pts | |||||
% of Net earned premiums | 39.6 | % | 39.5 | % | 0.1 | pts | |||||
Interest Expense | $ | 723 | $ | 326 | $ | 397 | |||||
Total Expenses | $ | 480,214 | $ | 316,003 | $ | 164,211 | |||||
Combined Ratio - as % of gross earned premiums | 71.9 | % | 62.6 | % | 9.3 | pts | |||||
Underlying Combined Ratio - as % of gross earned premiums* | 61.0 | % | 57.4 | % | 3.6 | pts | |||||
Combined Ratio - as % of net earned premiums | 104.9 | % | 94.0 | % | 10.9 | pts | |||||
Underlying Combined Ratio - as % of net earned premiums* | 89.0 | % | 86.2 | % | 2.8 | pts | |||||
* | Underlying Loss and LAE is a non-GAAP measure and is reconciled above to Net Loss and LAE, the most directly comparable GAAP measure. Additional information regarding non-GAAP financial measures presented in this document is in the "Definitions of Non-GAAP Measures" in Part II, Item 7 of this document. |
Loss and LAE increased $115,245,000, or 62.9%, to $298,353,000 for the year ended December 31, 2016 from $183,108,000 for the year ended December 31, 2015. Loss and LAE expense as a percentage of net earned premiums increased 10.8 points to 65.3% for the year, compared to 54.5% for the same period last year. Excluding catastrophe losses and reserve development, our gross underlying loss and LAE ratio for the year was 33.8%, an increase of 2.7 points from 31.1% during 2015, due primarily to an increase in fire and weather related losses as well as lower average premiums. Retained catastrophe losses of $55,842,000 during 2016 included losses from spring storms in Florida and Texas, the August Louisiana storms, Hurricane Hermine, Tropical Storm Colin, Hurricane Matthew, and certain other losses not covered by our reinsurance programs. Prior year loss reserve development of $16,988,000 for the year was driven primarily by non-catastrophe claims in Florida for accident year 2015.
Policy acquisition costs increased $30,257,000, or 34.6%, to $117,658,000 for the year ended December 31, 2016 from $87,401,000 for the year ended December 31, 2015. These costs vary directly with changes in gross premiums earned and were generally consistent with our growth in premium production and higher average market commission rates outside of Florida.
41
UNITED INSURANCE HOLDINGS CORP.
Operating expenses increased by $5,208,000, or 34.0%, to $20,524,000 for the year ended December 31, 2016 from $15,316,000 for the year ended December 31, 2015, primarily due to increased costs related to our ongoing growth and continuing expansion into new states.
General and administrative expenses increased $13,104,000, or 43.9%, to $42,956,000 for the year ended December 31, 2016 from $29,852,000 for the year ended December 31, 2015, primarily due to increases in personnel costs related to our continued growth and higher depreciation and amortization costs resulting from the acquisition of IIC during the second quarter of 2016.
We experienced unfavorable reserve development in the current year and its historical impact on our net loss and net underlying loss ratios is outlined in the following table.
Historical Reserve Development | |||||||||||||||||||
($ in thousands, except ratios) | 2012 | 2013 | 2014 | 2015 | 2016 | ||||||||||||||
Prior year reserve development (unfavorable) | $ | (670 | ) | $ | (4,078 | ) | $ | 4,037 | $ | 2,368 | $ | (16,988 | ) | ||||||
Development as a % of earnings before interest and taxes | 4.3 | % | 11.7 | % | 6.2 | % | 5.7 | % | 219.9 | % | |||||||||
Consolidated net loss ratio (LR) | 47.9 | % | 50.0 | % | 44.6 | % | 54.5 | % | 65.3 | % | |||||||||
Prior year reserve unfavorable (favorable) development on LR | 0.6 | % | 2.1 | % | (1.5 | )% | (0.7 | )% | 3.7 | % | |||||||||
Current year catastrophe losses on LR | 3.0 | % | 1.8 | % | 0.3 | % | 8.5 | % | 12.2 | % | |||||||||
Underlying net loss ratio* | 44.3 | % | 46.1 | % | 45.8 | % | 46.7 | % | 49.4 | % | |||||||||
* Underlying Net Loss Ratio is a non-GAAP measure and is reconciled above to the Consolidated Net Loss Ratio, the most directly comparable GAAP measure. Additional information regarding non-GAAP financial measures presented in this document is in the "Definitions of Non-GAAP Measures" Part II Item 7 of this document.
Overall our attritional loss experience by accident year excluding catastrophes has been trending upwards for the last two accident years due to lower premiums per unit of exposure resulting from our growth outside of Florida and higher overall frequency and severity of water-related losses.
42
UNITED INSURANCE HOLDINGS CORP.
RESULTS OF OPERATIONS - 2015 COMPARED TO 2014
Revenues
Net Income for the year ended December 31, 2015 was $27,358,000, compared to $41,013,000 for the twelve months ended December 31, 2014. The decrease in net income was primarily driven by an increase in losses and loss adjustment expense (LAE) resulting from multiple current year catastrophe events totaling $28,565,000. Our gross written premium increased by $132,983,000, or 30.4%, to $569,736,000 primarily due to strong organic growth in new and renewal business outside of Florida. The breakdown of the year-over-year growth in total gross written premiums broken down by region and direct versus assumed is shown in the following table:
Direct and Assumed Written Premium By Region (1) | 2015 | 2014 | Change | |||||||||
Florida | $ | 314,588 | $ | 304,604 | $ | 9,984 | ||||||
Gulf | 91,303 | 13,034 | 78,269 | |||||||||
Northeast | 73,128 | 53,348 | 19,780 | |||||||||
Southeast | 69,897 | 46,783 | 23,114 | |||||||||
Total direct written premium | $ | 548,916 | $ | 417,769 | $ | 131,147 | ||||||
Assumed premium (2) | 20,820 | 18,984 | 1,836 | |||||||||
Total gross written premium | $ | 569,736 | $ | 436,753 | $ | 132,983 | ||||||
(1) Each region is comprised of the following states: Gulf includes Hawaii, Louisiana and Texas, Northeast includes Massachusetts, New Jersey, New York and Rhode Island, and Southeast includes Georgia, North Carolina and South Carolina.
(2) All assumed premiums shown above are from policy assumptions from Citizens that are written in Florida and are shown net of opt-outs.
New and Renewal Policies* By Region (1) | 2015 | 2014 | Change | ||||||
Florida | 175,284 | 168,668 | 6,616 | ||||||
Gulf | 58,752 | 9,865 | 48,887 | ||||||
Northeast | 54,172 | 39,816 | 14,356 | ||||||
Southeast | 52,522 | 32,392 | 20,130 | ||||||
Total | 340,730 | 250,741 | 89,989 | ||||||
(1) Each region is comprised of the following states: Gulf includes Hawaii, Louisiana and Texas, Northeast includes Massachusetts, New Jersey, and Rhode Island, and Southeast includes Georgia, North Carolina and South Carolina.
* Only includes new and renewal homeowner, commercial and dwelling fire policies written during the year.
We expect our gross written premium growth to continue as we increase our policies-in-force in the states in which we write policies and as we expand into other states that we are licensed to write property and casualty insurance.
43
UNITED INSURANCE HOLDINGS CORP.
Expenses
Expenses for the twelve months ended December 31, 2015 increased $100,106,000, or 46.4%, to $316,003,000 for the year ended December 31, 2015 from $215,897,000 for the same period in 2014, primarily due to increased losses, policy acquisition costs, operating costs and general and administrative expenses. The calculation of our underlying loss and combined ratios is shown below:
Year Ended December 31, | |||||||||||
2015 | 2014 | Change | |||||||||
Net Loss and LAE | $ | 183,108 | $ | 118,077 | $ | 65,031 | |||||
% of Gross earned premiums | 36.3 | % | 29.5 | % | 6.8pts | ||||||
% of Net earned premiums | 54.5 | % | 44.6 | % | 9.9pts | ||||||
Less: | |||||||||||
Current year catastrophe losses | $ | 28,565 | $ | 829 | $ | 27,736 | |||||
Prior year reserve development | (2,368 | ) | (4,037 | ) | 1,669 | ||||||
Underlying loss and LAE* | $ | 156,911 | $ | 121,285 | $ | 35,626 | |||||
% of Gross earned premiums | 31.1 | % | 30.3 | % | 0.8pts | ||||||
% of Net earned premiums | 46.7 | % | 45.8 | % | 0.9pts | ||||||
Policy acquisition costs | $ | 87,401 | $ | 65,657 | $ | 21,744 | |||||
Operating and underwriting | 15,316 | 11,746 | 3,570 | ||||||||
General and administrative | 29,852 | 20,007 | 9,845 | ||||||||
Total Operating Expenses | $ | 132,569 | $ | 97,410 | $ | 35,159 | |||||
% of Gross earned premiums | 26.3 | % | 24.3 | % | 2.0pts | ||||||
% of Net earned premiums | 39.5 | % | 36.8 | % | 2.7pts | ||||||
Interest Expense | $ | 326 | $ | 410 | $ | (84 | ) | ||||
Total Expenses | $ | 316,003 | $ | 215,897 | $ | 100,106 | |||||
Combined Ratio - as % of gross earned premiums | 62.6 | % | 53.8 | % | 8.8pts | ||||||
Underlying Combined Ratio - as % of gross earned premiums* | 57.4 | % | 54.6 | % | 2.8pts | ||||||
Combined Ratio - as % of net earned premiums | 94.0 | % | 81.4 | % | 12.6pts | ||||||
Underlying Combined Ratio - as % of net earned premiums* | 86.2 | % | 82.6 | % | 3.6pts | ||||||
* | Underlying Loss and LAE is a non-GAAP measure and is reconciled above to Net Loss and LAE, the most directly comparable GAAP measure. Additional information regarding non-GAAP financial measures presented in this document is in the "Definitions of Non-GAAP Measures" section of this document. |
Losses and LAE increased $65,031,000, or 55.1% to $183,108,000 for the year ended December 31, 2015, from $118,077,000 in 2014 primarily due to the growth of policies in-force and a $27,736,000 increase in current year catastrophe losses. Current year catastrophe losses increased to $28,565,000 for the twelve months ended December 31, 2015 from $829,000, for the same period in 2014.
Policy acquisition costs increased $21,744,000, or 33.1% to $87,401,000 for the year ended December 31, 2015 from
$65,657,000 for the same period in 2014, primarily due to our ongoing growth in gross earned premium.
Operating expenses increased $3,570,000, or 30.4% to $15,316,000 for the year ended December 31, 2015 from $11,746,000 for the same period in 2014 due to increased costs related our ongoing growth and continuing expansion into new states.
General and administrative expenses increased $9,845,000, or 49.2%, to $29,852,000 for the year ended December 31, 2015, from $20,007,000 for the same period in 2014 primarily due to an increase in personnel costs and infrastructure development related to our continued growth and ongoing systems migrations.
44
UNITED INSURANCE HOLDINGS CORP.
LIQUIDITY AND CAPITAL RESOURCES
We generate cash through premium collections, reinsurance recoveries, investment income, the sale or maturity of invested assets and the issuance of additional shares of our stock. We use our cash to pay reinsurance premiums, claims and related costs, policy acquisition costs, salaries and employee benefits, other expenses and stockholder dividends, as well as to purchase investments.
As a holding company, we do not conduct any business operations of our own and as a result, we rely on cash dividends or intercompany loans from our management affiliates to pay our general and administrative expenses. Insurance regulatory authorities in the states in which we operate heavily regulate our insurance affiliates, including restricting any dividends paid by our insurance affiliates and requiring approval of any management fees our insurance affiliates pay to our management affiliates for services rendered; however, nothing restricts our non-insurance company subsidiaries from paying us dividends other than state corporate laws regarding solvency. In accordance with Florida law, UPC may pay dividends or make distributions out of that part of its statutory surplus derived from its net operating profit and its net realized capital gains. Under the insurance regulatory laws of Hawaii, FSIC may pay dividends or make distributions out of its statutory surplus or net income less realized capital gains. In accordance with New York state law, IIC may pay dividends or make distributions out of its statutory surplus not to exceed 10% of the insurer's surplus or adjusted net investment income. See Part II Item 5 for additional information regarding the limitations on dividend payments by our insurance affiliates. The risk-based capital guidelines published by the National Association of Insurance Commissioners may further restrict the ability of our insurance affiliates to pay dividends or make distributions if the amount of the intended dividend or distribution would cause their respective surplus as regards policyholders to fall below minimum risk-based capital guidelines. Most states, including Florida, Hawaii and New York, have adopted the NAIC requirements, and insurers having less surplus as regards policyholders than required will be subject to varying degrees of regulatory action, depending on the level of capital inadequacy. State insurance regulatory authorities could require us to cease operations in the event we fail to maintain the statutory surplus required in our insurance affiliates.
Our non-insurance company subsidiaries may pay us dividends from any positive net cash flows that they generate. Our management affiliates pay us dividends primarily using cash from the collection of management fees from our insurance affiliates, pursuant to the management agreements in effect between those entities.
On April 29, 2016, we acquired all of the outstanding common stock of IIC for $60,471,000. We paid $48,450,000 in cash at closing and issued an $8,550,000 promissory note to the Seller, which will mature 18 months from the acquisition date and bear interest at an annual rate of 6%. Please refer to Note 11 in the Notes to Consolidated Financial Statements for a discussion on the additional terms associated with this note. The purchase price also consisted of an accrued liability of $3,471,000 which was paid during July 2016.
On May 26, 2016, we issued a $5,200,000, 15-year term note payable to Branch Banking &Trust (BB&T) with the intent to use the funds to purchase, renovate, furnish and equip our home office. The note bears interest at 1.65% in excess of the one month LIBOR. The interest rate resets monthly and was 2.44% at December 31, 2016. Please refer to Note 11 in the Notes to Consolidated Financial Statements for a discussion on the additional terms associated with this note.
On December 5, 2016, we issued $30,000,000 of senior notes to private investors. The notes bear interest at 5.75% in excess of the three month LIBOR. The notes will mature ten years after the issue date, have no scheduled amortization, and may be redeemed at par value any time without a pre-payment penalty. Please refer to Note 11 in the Notes to Consolidated Financial Statements for a discussion on the additional terms associated with these notes.
During the first quarter of 2016 we contributed $5,000,000 of capital to FSIC, during the second quarter of 2016 we contributed $6,000,000 of capital to UPC Re, and during the fourth quarter of 2016 we contributed $30,000,000 of capital to UPC. We will continue to contribute capital as required to fund the growing operations of our insurance affiliates. We did not contribute any capital to our insurance affiliates during 2015; however, we contributed $30,845,000 of capital during 2014.
Operating Activities
During the year ended December 31, 2016, our operations generated cash of $65,747,000, compared to generating $98,319,000 of cash during the same period in 2015. The $32,572,000 year over year decrease in operating cash was primarily driven by a $107,163,000 increase in claims payments as a result of the increase in exposures and payments on claims from current and prior accident years and an increase in reinsurance payments of $62,568,000 because we purchased more reinsurance coverage under our 2016-2017 contracts than we purchased under our 2015-2016 contracts. Operating expenses and agents' commission payments increased $29,381,000 and $22,727,000, respectively, due to our continuing growth. Partially
45
UNITED INSURANCE HOLDINGS CORP.
offsetting these increases in cash outflows was the increase in cash inflows related to an increase in premiums collected of $173,688,000. In addition, we paid $7,194,000 of income taxes during the year ended December 31, 2016 compared to paying $13,223,000 of income taxes for the same period in 2015.
Investing Activities
During the year ended December 31, 2016, our investing activities used $49,757,000 of cash compared to using $67,015,000 of cash in 2015. The $17,258,000 year over year decrease in investing cash used was primarily a result of fewer investments purchased during the year ended December 31, 2016 compared to the same period in 2015. In addition, our investments in property and equipment decreased $7,767,000 primarily due to the renovation of our new headquarters which occurred in 2015. Partially offsetting the decrease in investing cash used in 2016 was $32,896,000 of cash used in the acquisition of IIC, while in 2015 the acquisition of FSH provided $14,467,000 of cash.
See Note 3 in our Notes to Consolidated Financial Statements for a table that summarizes our fixed maturities at December 31, 2016, by contractual maturity periods.
Financing Activities
During the year ended December 31, 2016, our financing activities provided cash of $49,912,000 compared to using $(7,909,000) of cash in 2015. The increase in cash provided by financing activity primarily relates to the $35,200,000 in net proceeds from borrowings generated during 2016, while no such borrowings proceeds were generated during 2015. See Note 11 in our Notes to Consolidated Financial statements for additional information on the borrowings. In addition, repayments of borrowings decreased $2,043,000 because we paid off the outstanding loan payable balance acquired in the FSH transaction during the first quarter of 2015, while no such repayment occurred in 2016.
We believe our current capital resources, together with cash provided from our operations, will be sufficient to meet currently anticipated working capital requirements. We cannot provide assurance, however, that such will be the case in the future.
OFF-BALANCE SHEET ARRANGEMENTS
At December 31, 2016, we had no off-balance-sheet arrangements.
CONTRACTUAL OBLIGATIONS
The following table summarizes our expected payments for contractual obligations at December 31, 2016:
Payment Due by Period | |||||||||||||||||||
Total | Less than 1 Year | 1-3 Years | 4-5 Years | More than 5 Years | |||||||||||||||
Leases (1) | $ | 553 | $ | 182 | $ | 223 | $ | 148 | $ | — | |||||||||
Service agreements (2) | 16,613 | 4,025 | 5,949 | 4,567 | 2,072 | ||||||||||||||
Long-term debt (3) | 54,175 | 9,969 | 2,945 | 2,947 | 38,314 | ||||||||||||||
Employment agreements (4) | 188 | 188 | — | — | — | ||||||||||||||
Unpaid loss and loss adjustment expenses (5) | 140,855 | 86,859 | 38,938 | 11,808 | 3,250 | ||||||||||||||
Total | $ | 212,384 | $ | 101,223 | $ | 48,055 | $ | 19,470 | $ | 43,636 | |||||||||
(1) | Represents operating and capital leases for our insurance subsidiaries. |
(2) Represents agreements entered into to purchase goods and services in the normal course of business.
(3) | Represents principal payments over the life of the SBA Note debt. Also includes a note payable for $8,550,000 which we are obligated to pay as consideration for the IIC transaction, a $5,200,000 term note payable to BB&T, and $30,000,000 senior notes payable. See Note 11 in our Notes to Consolidated Financial Statements for additional information regarding our long-term debt. |
(4) | Represents base salary for the unfulfilled portion of the original employment agreements with certain executive officers. |
(5) | As of December 31, 2016, UPC, FSIC, and IIC had unpaid loss and loss adjustment expenses (LAE) of $140,855,000. The specific amounts and timing of obligations related to known and unknown reserves and related LAE reserves are not set contractually, and the amounts and timing of these obligations are unknown. Nonetheless, based upon our cumulative claims paid over the last 17 years, we estimate that the loss and LAE reserves will be paid in the periods shown above. While we believe that historical performance of loss payment patterns is a |
46
UNITED INSURANCE HOLDINGS CORP.
reasonable source for projecting future claims payments, there is inherent uncertainty in this estimated projected settlement of loss and LAE reserves, and as a result these estimates will differ, perhaps significantly, from actual future payments.
RELATED PARTY TRANSACTIONS
See Note 16 in our Notes to Consolidated Financial Statements for a discussion of our related party transactions.
Item 7A. Quantitative and Qualitative Disclosures About Market Risk
Our investment objective is to preserve capital, maximize after-tax investment income, maintain liquidity and minimize risk. Our current investment policy limits investment in non-investment grade debt securities, and limits total investments in preferred stock, common stock and mortgage notes receivables. We also comply with applicable laws and regulations that further restrict the type, quality and concentration of our investments. In general, these laws and regulations permit investments, within specified limits and subject to certain qualifications, in federal, state and municipal obligations, corporate bonds, and preferred and common equity securities.
Our investment policy was established by the Investment Committee of our Board of Directors (Board) and is reviewed and updated regularly. Pursuant to this investment policy, our entire portfolio is classified as available for sale and we report any unrealized gains or losses, net of deferred income taxes, as a component of other comprehensive income within our stockholders’ equity. We do not hold any securities that are classified as held to maturity and we do not hold any securities for trading or speculation. We do not utilize any swaps, options, futures or forward contracts to hedge or enhance our investment portfolio.
INTEREST RATE RISK
Our fixed-maturities are sensitive to potential losses resulting from unfavorable changes in interest rates. We manage the risk by analyzing anticipated movements in interest rates and considering our future capital and liquidity requirements.
The following table illustrates the impact of hypothetical changes in interest rates on the fair value of our fixed-maturities at December 31, 2016:
Percentage | |||||||||||
Increase | |||||||||||
Change in | (Decrease) in | ||||||||||
Estimated | Estimated | Estimated | |||||||||
Hypothetical Change in Interest Rates | Fair Value | Fair Value | Fair Value | ||||||||
300 basis point increase | $ | 439,257 | $ | (55,259 | ) | (11.2 | )% | ||||
200 basis point increase | $ | 457,677 | $ | (36,839 | ) | (7.4 | )% | ||||
100 basis point increase | $ | 476,096 | $ | (18,420 | ) | (3.7 | )% | ||||
Fair value | $ | 494,516 | $ | — | — | % | |||||
100 basis point decrease | $ | 512,913 | $ | 18,397 | 3.7 | % | |||||
200 basis point decrease | $ | 529,433 | $ | 34,917 | 7.1 | % | |||||
300 basis point decrease | $ | 536,625 | $ | 42,109 | 8.5 | % | |||||
Our calculations of the potential effects of hypothetical interest rate changes are based on several assumptions, including maintenance of the existing composition of fixed-maturity investments, and should not be indicative of future results. Based on our analysis, a 300 basis point decrease or increase in interest rates from the December 31, 2016 period end rates would not have a material impact on our results of operations or cash flows.
CREDIT RISK
Credit risk can expose us to potential losses arising principally from adverse changes in the financial condition of the issuer of our fixed-maturities. We mitigate this risk by investing in fixed-maturities that are generally investment grade and by diversifying our investment portfolio to avoid concentrations in any single issuer or market sector.
47
UNITED INSURANCE HOLDINGS CORP.
The following table presents the composition of our fixed-maturity portfolio by rating at December 31, 2016:
% of Total | ||||||||||||||
Amortized | Amortized | % of Total | ||||||||||||
Comparable Rating | Cost | Cost | Fair Value | Fair Value | ||||||||||
AAA | $ | 58,500 | 11.7 | % | $ | 58,070 | 11.7 | % | ||||||
AA+, AA, AA- | 286,161 | 57.5 | 283,622 | 57.4 | ||||||||||
A+, A, A- | 102,851 | 20.7 | 102,561 | 20.7 | ||||||||||
BBB+, BBB, BBB- | 49,601 | 10.0 | 49,758 | 10.1 | ||||||||||
BB+, BB, BB- | 503 | 0.1 | 505 | 0.1 | ||||||||||
Total | $ | 497,616 | 100.0 | % | $ | 494,516 | 100.0 | % | ||||||
EQUITY PRICE RISK
Our equity investment portfolio at December 31, 2016 consists of common stocks and non-redeemable preferred stocks. We may incur potential losses due to adverse changes in equity security prices. We manage this risk primarily through industry and issuer diversification and asset allocation techniques.
The following table illustrates the composition of our equity portfolio at December 31, 2016:
% of Total | |||||||
Stocks by Sector | Fair Value | Fair Value | |||||
Consumer, Non-cyclical | $ | 7,878 | 27.7 | % | |||
Industrial | 5,182 | 18.3 | |||||
Financial | 4,319 | 15.2 | |||||
Consumer, Cyclical | 2,916 | 10.3 | |||||
Technology | 2,857 | 10.1 | |||||
Utilities | 2,707 | 9.5 | |||||
Communications | 948 | 3.3 | |||||
Basic Materials | 799 | 2.8 | |||||
Energy | 792 | 2.8 | |||||
Total | $ | 28,398 | 100.0 | % | |||
48
UNITED INSURANCE HOLDINGS CORP.
Item 8. Financial Statements and Supplementary Data
REPORT OF INDEPENDENT REGISTERED PUBLIC ACCOUNTING FIRM
To the Board of Directors and Stockholders
United Insurance Holdings Corp.
We have audited the accompanying consolidated balance sheets of United Insurance Holdings Corp. and subsidiaries (the “Company”) as of December 31, 2016 and 2015, and the related consolidated statements of comprehensive income, stockholders' equity, and cash flows for each of the three years in the period ended December 31, 2016, and the financial statement schedules of United Insurance Holdings Corp. listed in Item 15. These financial statements and financial statement schedules are the responsibility of the Company's management. Our responsibility is to express an opinion on these financial statements and schedule based on our audits.
We conducted our audits in accordance with the standards of the Public Company Accounting Oversight Board (United States). Those standards require that we plan and perform the audit to obtain reasonable assurance about whether the financial statements are free of material misstatement. An audit includes examining, on a test basis, evidence supporting the amounts and disclosures in the financial statements. An audit also includes assessing the accounting principles used and significant estimates made by management, as well as evaluating the overall financial statement presentation. We believe that our audits provide a reasonable basis for our opinion.
In our opinion, the consolidated financial statements referred to above present fairly, in all material respects, the financial position of United Insurance Holdings Corp. and subsidiaries as of December 31, 2016 and 2015, and the results of its operations and its cash flows for each of the three years in the period ended December 31, 2016, in conformity with U.S. generally accepted accounting principles. Also, in our opinion, the related financial statement schedules, when considered in relation to the basic consolidated financial statements taken as a whole, present fairly in all material respects the information set forth therein.
We have also audited, in accordance with the standards of the Public Company Accounting Oversight Board (United States), United Insurance Holdings Corp. and subsidiaries internal control over financial reporting as of December 31, 2016, based on criteria established in Internal Control - Integrated Framework issued by the Committee of Sponsoring Organizations of the Treadway Commission in 2013, and our report dated March 15, 2017 expressed an unqualified opinion on the effectiveness of United Insurance Holdings Corp’s internal control over financial reporting.
/s/ RSM US LLP |
Omaha, Nebraska |
March 15, 2017 |
49
UNITED INSURANCE HOLDINGS CORP.
Consolidated Balance Sheets
December 31, | ||||||||
2016 | 2015 | |||||||
ASSETS | ||||||||
Investments available for sale, at fair value: | ||||||||
Fixed maturities (amortized cost of $497,616 and $396,415, respectively) | $ | 494,516 | $ | 396,698 | ||||
Equity securities (adjusted cost of $24,074 and $48,679, respectively) | 28,398 | 50,806 | ||||||
Other investments (amortized cost of $5,493 and $4,980, respectively) | 5,733 | 5,210 | ||||||
Total investments | 528,647 | 452,714 | ||||||
Cash and cash equivalents | 150,688 | 84,786 | ||||||
Accrued investment income | 3,735 | 2,915 | ||||||
Property and equipment, net | 17,860 | 17,135 | ||||||
Premiums receivable, net | 38,883 | 41,170 | ||||||
Reinsurance recoverable on paid and unpaid losses | 24,028 | 2,961 | ||||||
Prepaid reinsurance premiums | 132,564 | 79,399 | ||||||
Goodwill | 14,254 | 3,413 | ||||||
Deferred policy acquisition costs | 65,473 | 46,732 | ||||||
Other assets | 23,554 | 8,796 | ||||||
Total assets | $ | 999,686 | $ | 740,021 | ||||
LIABILITIES AND STOCKHOLDERS' EQUITY | ||||||||
Liabilities: | ||||||||
Unpaid losses and loss adjustment expenses | $ | 140,855 | $ | 76,792 | ||||
Unearned premiums | 372,223 | 304,653 | ||||||
Reinsurance payable | 99,891 | 64,542 | ||||||
Other liabilities | 91,215 | 42,470 | ||||||
Notes payable, net | 54,175 | 12,353 | ||||||
Total liabilities | 758,359 | 500,810 | ||||||
Commitments and contingencies (Note 13) | ||||||||
Stockholders' Equity: | ||||||||
Preferred stock, $0.0001 par value; 1,000,000 shares authorized; none issued or outstanding | — | — | ||||||
Common stock, $0.0001 par value; 50,000,000 shares authorized; 21,858,697 and 21,736,431 issued; 21,646,614 and 21,524,348 outstanding, respectively | 2 | 2 | ||||||
Additional paid-in capital | 99,353 | 97,163 | ||||||
Treasury shares, at cost; 212,083 shares | (431 | ) | (431 | ) | ||||
Accumulated other comprehensive income | 822 | 1,620 | ||||||
Retained earnings | 141,581 | 140,857 | ||||||
Total Stockholders' Equity | 241,327 | 239,211 | ||||||
Total Liabilities and Stockholders' Equity | $ | 999,686 | $ | 740,021 | ||||
See accompanying notes to consolidated financial statements.
50
UNITED INSURANCE HOLDINGS CORP.
Consolidated Statements of Comprehensive Income
Year Ended December 31, | ||||||||||||
2016 | 2015 | 2014 | ||||||||||
REVENUE: | ||||||||||||
Gross premiums written | $ | 708,156 | $ | 569,736 | $ | 436,753 | ||||||
Increase in gross unearned premiums | (41,327 | ) | (65,521 | ) | (36,058 | ) | ||||||
Gross premiums earned | 666,829 | 504,215 | 400,695 | |||||||||
Ceded premiums earned | (209,898 | ) | (168,257 | ) | (135,845 | ) | ||||||
Net premiums earned | 456,931 | 335,958 | 264,850 | |||||||||
Investment income | 10,679 | 9,212 | 6,795 | |||||||||
Net realized gains (losses) | 547 | 827 | (20 | ) | ||||||||
Other revenue | 18,960 | 11,572 | 8,605 | |||||||||
Total revenue | 487,117 | 357,569 | 280,230 | |||||||||
EXPENSES: | ||||||||||||
Losses and loss adjustment expenses | 298,353 | 183,108 | 118,077 | |||||||||
Policy acquisition costs | 117,658 | 87,401 | 65,657 | |||||||||
Operating expenses | 20,524 | 15,316 | 11,746 | |||||||||
General and administrative expenses | 42,956 | 29,852 | 20,007 | |||||||||
Interest expense | 723 | 326 | 410 | |||||||||
Total expenses | 480,214 | 316,003 | 215,897 | |||||||||
Income before other income | 6,903 | 41,566 | 64,333 | |||||||||
Other income | 100 | 294 | 77 | |||||||||
Income before income taxes | 7,003 | 41,860 | 64,410 | |||||||||
Provision for income taxes | 1,305 | 14,502 | 23,397 | |||||||||
Net income | $ | 5,698 | $ | 27,358 | $ | 41,013 | ||||||
OTHER COMPREHENSIVE INCOME: | ||||||||||||
Change in net unrealized gain (loss) on investments | (629 | ) | (3,070 | ) | 6,367 | |||||||
Reclassification adjustment for net realized investment (gains) losses | (547 | ) | (827 | ) | 20 | |||||||
Income tax benefit (expense) related to items of other comprehensive income | 378 | 1,506 | (2,468 | ) | ||||||||
Total comprehensive income | $ | 4,900 | $ | 24,967 | $ | 44,932 | ||||||
Weighted average shares outstanding | ||||||||||||
Basic | 21,417,486 | 21,218,233 | 19,933,652 | |||||||||
Diluted | 21,614,443 | 21,452,540 | 20,045,907 | |||||||||
Earnings per share | ||||||||||||
Basic | $ | 0.27 | $ | 1.29 | $ | 2.06 | ||||||
Diluted | $ | 0.26 | $ | 1.28 | $ | 2.05 | ||||||
Dividends declared per share | $ | 0.23 | $ | 0.20 | $ | 0.16 | ||||||
See accompanying notes to consolidated financial statements.
51
UNITED INSURANCE HOLDINGS CORP.
Consolidated Statements of Stockholders' Equity
Additional Paid-in Capital | Treasury Stock | Accumulated Other Comprehensive Income (loss) | Retained Earnings | Total Stockholders' Equity | |||||||||||||||||||||||
Common Stock | |||||||||||||||||||||||||||
Shares | Amount | ||||||||||||||||||||||||||
December 31, 2013 | 16,209,315 | $ | 2 | $ | 27,800 | $ | (431 | ) | $ | 92 | $ | 80,124 | $ | 107,587 | |||||||||||||
Net income | — | — | — | — | — | 41,013 | 41,013 | ||||||||||||||||||||
Other comprehensive income | — | — | — | — | 3,919 | — | 3,919 | ||||||||||||||||||||
Restricted stock award | 95,099 | — | 539 | — | — | — | 539 | ||||||||||||||||||||
Issuance of common stock, net of costs | 4,600,000 | — | 54,041 | — | — | — | 54,041 | ||||||||||||||||||||
Cash dividends on common stock | — | — | — | — | — | (3,336 | ) | (3,336 | ) | ||||||||||||||||||
December 31, 2014 | 20,904,414 | 2 | 82,380 | (431 | ) | 4,011 | 117,801 | 203,763 | |||||||||||||||||||
Net income | — | — | — | — | — | 27,358 | 27,358 | ||||||||||||||||||||
Other comprehensive income | — | — | — | — | (2,391 | ) | — | (2,391 | ) | ||||||||||||||||||
Restricted stock award | 116,077 | — | 1,789 | — | — | — | 1,789 | ||||||||||||||||||||
Issuance of common stock, net of costs | 503,857 | — | 12,994 | — | — | — | 12,994 | ||||||||||||||||||||
Cash dividends on common stock | — | — | — | — | — | (4,302 | ) | (4,302 | ) | ||||||||||||||||||
December 31, 2015 | 21,524,348 | 2 | 97,163 | (431 | ) | 1,620 | 140,857 | 239,211 | |||||||||||||||||||
Net income | — | — | — | — | — | 5,698 | 5,698 | ||||||||||||||||||||
Other comprehensive income | — | — | — | — | (798 | ) | — | (798 | ) | ||||||||||||||||||
Restricted stock award | 89,323 | — | 1,677 | — | — | — | 1,677 | ||||||||||||||||||||
Issuance of common stock | 32,943 | — | 513 | — | — | — | 513 | ||||||||||||||||||||
Cash dividends on common stock | — | — | — | — | — | (4,974 | ) | (4,974 | ) | ||||||||||||||||||
December 31, 2016 | 21,646,614 | $ | 2 | $ | 99,353 | $ | (431 | ) | $ | 822 | $ | 141,581 | $ | 241,327 | |||||||||||||
See accompanying notes to consolidated financial statements.
52
UNITED INSURANCE HOLDINGS CORP.
Consolidated Statements of Cash Flows
Year Ended December 31, | ||||||||||||
2016 | 2015 | 2014 | ||||||||||
OPERATING ACTIVITIES | ||||||||||||
Net income | $ | 5,698 | $ | 27,358 | $ | 41,013 | ||||||
Adjustments to reconcile net income to net cash provided by operating activities: | ||||||||||||
Depreciation and amortization | 11,713 | 3,328 | 801 | |||||||||
Bond amortization and accretion | 3,677 | 1,997 | 1,522 | |||||||||
Net realized (gains) losses | (547 | ) | (827 | ) | 20 | |||||||
Provision for uncollectible premiums | 64 | 272 | 73 | |||||||||
Deferred income taxes, net | 2,210 | 2,305 | (1,181 | ) | ||||||||
Stock based compensation | 1,947 | 1,974 | 649 | |||||||||
Changes in operating assets and liabilities: | ||||||||||||
Accrued investment income | (172 | ) | (676 | ) | (487 | ) | ||||||
Premiums receivable | 5,409 | (8,577 | ) | (5,366 | ) | |||||||
Reinsurance recoverable on paid and unpaid losses | (18,459 | ) | (893 | ) | 358 | |||||||
Prepaid reinsurance premiums | (53,165 | ) | (15,572 | ) | (8,559 | ) | ||||||
Deferred policy acquisition costs, net | (18,741 | ) | (14,807 | ) | (6,739 | ) | ||||||
Other assets | (11,006 | ) | (3,897 | ) | (1,493 | ) | ||||||
Unpaid losses and loss adjustment expenses | 39,096 | 19,966 | 6,985 | |||||||||
Unearned premiums | 41,327 | 65,521 | 36,058 | |||||||||
Reinsurance payable | 36,391 | 18,290 | 5,771 | |||||||||
Other liabilities | 20,305 | 2,557 | (507 | ) | ||||||||
Net cash provided by operating activities | 65,747 | 98,319 | 68,918 | |||||||||
INVESTING ACTIVITIES | ||||||||||||
Proceeds from sales and maturities of investments available for sale | 187,522 | 199,575 | 219,893 | |||||||||
Purchases of investments available for sale | (201,234 | ) | (270,141 | ) | (305,013 | ) | ||||||
Proceeds from acquisition | — | 14,467 | — | |||||||||
Purchase of subsidiary, net of cash acquired | (32,896 | ) | — | — | ||||||||
Cost of property, equipment and capitalized software acquired | (3,149 | ) | (10,916 | ) | (6,346 | ) | ||||||
Net cash used in investing activities | (49,757 | ) | (67,015 | ) | (91,466 | ) | ||||||
FINANCING ACTIVITIES | ||||||||||||
Tax withholding payment related to net settlement of equity awards | (270 | ) | (185 | ) | (110 | ) | ||||||
Repayments of borrowings | (1,379 | ) | (3,422 | ) | (1,177 | ) | ||||||
Proceeds from borrowings | 35,200 | — | — | |||||||||
Payments of debt issuance costs | (596 | ) | — | — | ||||||||
Dividends | (4,974 | ) | (4,302 | ) | (3,336 | ) | ||||||
Bank overdrafts | 21,931 | — | (367 | ) | ||||||||
Proceeds from issuance of common stock, net of costs | — | — | 54,041 | |||||||||
Net cash provided by (used in) financing activities | 49,912 | (7,909 | ) | 49,051 | ||||||||
Increase in cash | 65,902 | 23,395 | 26,503 | |||||||||
Cash and cash equivalents at beginning of period | 84,786 | 61,391 | 34,888 | |||||||||
Cash and cash equivalents at end of period | $ | 150,688 | $ | 84,786 | $ | 61,391 | ||||||
Supplemental Cash Flows Information | ||||||||||||
Interest paid | $ | 285 | $ | 296 | $ | 389 | ||||||
Income taxes paid | $ | 7,194 | $ | 13,223 | $ | 27,901 | ||||||
See accompanying notes to consolidated financial statements.
53
UNITED INSURANCE HOLDINGS CORP. Notes to Consolidated Financial Statements December 31, 2016 |
1) ORGANIZATION, CONSOLIDATION AND PRESENTATION
(a)Business
United Insurance Holdings Corp. is a property and casualty insurance holding company that sources, writes, and services residential and commercial property and casualty insurance policies using a network of agents and three wholly owned insurance subsidiaries. Our primary insurance subsidiary is UPC, which was formed in Florida in 1999 and has operated continuously since that time. Our other subsidiaries include UIM, the managing general agent that manages substantially all aspects of UPC's business; Skyway Claims Services, LLC (our claims adjusting affiliate) that provides services to our insurance affiliates; and UPC Re (our reinsurance affiliate) that provides a portion of the reinsurance protection purchased by our insurance affiliates. On February 3, 2015, we acquired FSH and its two wholly owned subsidiaries, FSIC and FSU via merger. On April 29, 2016, we acquired IIC via merger. See Note 4 in our Notes to Consolidated Financial Statements for additional information regarding these acquisitions.
Our primary product is homeowners' insurance, which we currently offer in Connecticut, Florida, Georgia, Hawaii, Louisiana, Massachusetts, New Jersey, New York, North Carolina, Rhode Island, South Carolina, and Texas, under authorization from the insurance regulatory authorities in each state. We are also licensed to write property and casualty insurance in Alabama, Delaware, Maryland, Mississippi, New Hampshire, and Virginia; however, we have not commenced writing in these states.
We conduct our operations under one business segment.
(b)Consolidation and Presentation
We prepare our consolidated financial statements in conformity with U.S. generally accepted accounting principles (GAAP). While preparing our consolidated financial statements, we make estimates and assumptions that affect the reported amounts of assets and liabilities and disclosures of contingent assets and liabilities at the date of the consolidated financial statements, as well as reported amounts of revenues and expenses during the reporting period. Accordingly, actual results could differ from those estimates. Reported amounts that require us to make extensive use of estimates include our reserves for unpaid losses and loss adjustment expenses, reinsurance recoverable, deferred policy acquisition costs, investments and goodwill. Except for the captions on our Consolidated Balance Sheets and Consolidated Statements of Comprehensive Income, we generally use the term loss(es) to collectively refer to both loss and loss adjustment expenses.
We include all of our subsidiaries in our consolidated financial statements, eliminating all significant intercompany balances and transactions during consolidation.
2) SIGNIFICANT ACCOUNTING POLICIES
(a) | Cash and Cash Equivalents |
Our cash and cash equivalents include demand deposits with financial institutions and short-term, highly-liquid instruments with original maturities of three months or less when purchased.
(b) | Investments |
We currently classify all of our investments in fixed maturities, equity securities and other investments as available-for-sale, and report them at fair value. Subsequent to our acquisition of available-for-sale securities, we record changes in value through the date of disposition as unrealized holding gains and losses, net of tax effects, and include them as a component of comprehensive income. We include realized gains and losses, which we calculate using the specific-identification method for determining the cost of securities sold, in net income. We amortize any premium or discount on fixed maturities over the remaining maturity period of the related securities using the effective interest method, and we report the amortization in net investment income. We recognize dividends and interest income when earned.
54
UNITED INSURANCE HOLDINGS CORP. Notes to Consolidated Financial Statements December 31, 2016 |
Quarterly, we perform an assessment of our investments to determine if any are other-than-temporarily impaired. An investment is impaired when the fair value of the investment declines to an amount less than the cost or amortized cost of that investment. As part of our assessment process, we determine whether the impairment is temporary or other-than-temporary. We base our assessment on both quantitative criteria and qualitative information, considering a number of factors including, but not limited to: how long the security has been impaired; the amount of the impairment; whether, in the case of equity securities, we intend to hold, and have the ability to hold, the security for a period sufficient for us to recover our cost basis, or whether, in the case of debt securities, we intend to sell the security or it is more likely than not that we will have to sell the security before we recover the amortized cost; the financial condition and near-term prospects of the issuer; whether the issuer is current on contractually-obligated interest and principal payments; key corporate events pertaining to the issuer and whether the market decline was affected by macroeconomic conditions.
If we determine that an equity security has incurred an other-than-temporary impairment, we permanently reduce the cost of the security to fair value and recognize an impairment charge in net income. If a debt security is impaired and we either intend to sell the security or it is more likely than not that we will have to sell the security before we are able to recover the amortized cost, then we record the full amount of the impairment in net income. If we determine that an impairment of a debt security is other-than-temporary and we neither intend to sell the security nor it is more likely than not that we will have to sell the security before we are able to recover its cost or amortized cost, then we separate the impairment into (a) the amount of impairment related to credit loss and (b) the amount of impairment related to all other factors. We record the amount of the impairment related to the credit loss as an impairment charge in net income, and we record the amount of the impairment related to all other factors in accumulated other comprehensive income.
A large portion of our investment portfolio consists of fixed maturities, which may be adversely affected by changes in interest rates as a result of governmental monetary policies, domestic and international economic and political conditions and other factors beyond our control. A rise in interest rates would decrease the net unrealized holding gains of our investment portfolio, offset by our ability to earn higher rates of return on funds reinvested. Conversely, a decline in interest rates would increase the net unrealized holding gains of our investment portfolio, offset by lower rates of return on funds reinvested.
(c)Fair Value
See Note 3 in our Notes to Consolidated Financial Statements for a discussion regarding the fair value measurement of our investments at December 31, 2016.
(d)Premiums
We recognize premiums as revenue, net of ceded reinsurance amounts, on a daily pro rata basis over the contract period of the related policies that are in force. For any portion of premiums not earned at the end of the reporting period, we record an unearned premium liability.
Premiums receivable represents amounts due from our policyholders for billed premiums and related policy fees. We perform a policy-level evaluation to determine the extent to which the balance of premium receivable exceeds the balance of unearned premium. We then age any resulting exposure based on the last date the policy was billed to the policyholder, and we establish an allowance for credit losses for any amounts outstanding for more than 90 days. When we receive payments on amounts previously charged off, we credit bad debt expense in the period we receive the payment. The balances of our allowance for uncollectible premiums totaled $144,000 and $132,000 at December 31, 2016 and 2015, respectively.
When we receive premium payments from policyholders prior to the effective date of the related policy, we record an advance premiums liability. On the policy effective date, we reduce the advance premium liability and record the premiums as described above.
(e)Policy Acquisition Costs
We incur policy acquisition costs that vary with, and are directly related to, the production of new business. We capitalize policy acquisition costs to the extent recoverable, then we amortize those costs over the contract period of the related policy.
55
UNITED INSURANCE HOLDINGS CORP. Notes to Consolidated Financial Statements December 31, 2016 |
At each reporting date, we determine whether we have a premium deficiency. A premium deficiency would result if the sum of our expected losses, deferred policy acquisition costs, and policy maintenance costs (such as costs to store records and costs incurred to collect premiums and pay commissions) exceeded our related unearned premiums plus investment income.
Should we determine that a premium deficiency exists, we would write off the unrecoverable portion of deferred policy acquisition costs and record a liability to the extent the deficiency exceeded the deferred policy acquisition costs.
(f)Debt Issuance Costs
We record our debt issuance costs associated with a recognized debt liability as a direct deduction from the carrying amount of the corresponding debt liability. These costs are then amortized over the life of the liability using the effective interest method.
(g)Long-lived Assets
i)Property and Equipment
We record our property and equipment, at cost less accumulated depreciation and amortization. We use the straight-line method of calculating depreciation over the estimated useful lives of the assets. We periodically review estimated useful lives and, where appropriate, we make changes prospectively. We charge maintenance and repair costs to expense as incurred.
ii)Capitalized Software
We capitalize certain direct development costs associated with internal-use software. We expect to amortize the capitalized software costs related to our new data warehouse over its expected seven year useful life. We amortize the costs related to our new policy administration and claims processing systems over their expected seven-year useful lives.
See Note 7 in our Notes to Consolidated Financial Statements for a discussion of our property, equipment and capitalized software, including our properties, that were purchased during 2016 and 2015.
iii)Impairment of Long-lived Assets
We annually review our long-lived assets, including intangible assets, to determine if their carrying amounts are recoverable. If the non-discounted future cash flows expected to result from the use and eventual disposition of the assets are less than their carrying amounts, we reduce their carrying amounts to fair value and recognize an impairment loss.
(h)Unpaid Losses and Loss Adjustment Expenses
Our reserves for unpaid losses represent the estimated ultimate cost of settling all reported claims plus all claims we incurred related to insured events that have occurred as of the reporting date, but that policyholders have not yet reported to us.
We estimate our reserves for unpaid losses using individual case-basis estimates for reported claims and actuarial estimates for IBNR claims, and we continually review and adjust our estimated losses as necessary based on our historical experience and as we obtain new information. If our unpaid loss reserves prove to be deficient or redundant, we increase or decrease the liability in the period in which we identify the difference, thereby impacting net income. Though our estimate of the ultimate cost of settling all reported and unreported claims may change at any point in the future, a reasonable possibility exists that our estimate may vary significantly in the near term from the estimated amounts included in our consolidated financial statements.
On our Consolidated Balance Sheets, we report our reserves for unpaid losses gross of the amounts related to unpaid losses recoverable from reinsurers. On our Consolidated Statements of Comprehensive Income, we report losses net of amounts ceded to reinsurers. We do not discount our loss reserves for financial statement purposes.
(i)Managing General Agent Fees and Policy Fees
Our policy fees consist of the managing general agent fee and a pay-plan fee. Regulatory authorities in Florida, Georgia, Louisiana, New Jersey and Rhode Island allow managing general agents to charge policyholders a $25 fee on each policy
56
UNITED INSURANCE HOLDINGS CORP. Notes to Consolidated Financial Statements December 31, 2016 |
written. The regulatory authority in Hawaii allows managing general agents to charge policyholders a $50 fee on each policy written, while the regulatory authority in Texas allows managing general agents to charge policyholders a $25 or $75 fee, depending on the type of policy issued. Regulatory authorities in Massachusetts and Texas also allow managing general agents to charge a $25 inspection fee and regulatory authorities in Louisiana allow managing general agents to charge up to a $125 inspection fee, depending on the type of homeowner policy issued. We defer such fees as unearned revenue and then include them in income on a pro rata basis over the term of the underlying policies. We record our pay-plan fees, which we charge to all policyholders that pay their premium in more than one installment, as income when collected. We report all policy-related fees in other revenue on our Consolidated Statements of Comprehensive Income.
(j)Reinsurance
We follow industry practice of reinsuring a portion of our risks. Reinsurance involves transferring, or "ceding", all or a portion of the risk exposure on policies we write to another insurer, known as a reinsurer. To the extent that our reinsurers are unable to meet the obligations they assume under our reinsurance agreements, we remain liable for the entire insured loss.
Our reinsurance agreements are short-term, prospective contracts. We record an asset, prepaid reinsurance premiums, and a liability, reinsurance payable, for the entire contract amount upon commencement of our new reinsurance agreements. We amortize our prepaid reinsurance premiums over the 12-month contract period.
We record amounts recoverable from our reinsurers on paid losses plus an estimate of amounts recoverable on unpaid losses. The estimate of amounts recoverable on unpaid losses is a function of our liability for unpaid losses associated with the reinsured policies; therefore, the amount changes in conjunction with any changes to our estimate of unpaid losses. Though our estimate of amounts recoverable from reinsurers on unpaid losses may change at any point in the future because of its relation to our reserves for unpaid losses, a reasonable possibility exists that our estimate may change significantly in the near term from the amounts included in our consolidated financial statements.
We estimate uncollectible amounts receivable from reinsurers based on an assessment of factors including the creditworthiness of the reinsurers and the adequacy of collateral obtained, where applicable. We recorded no bad debt expense related to reinsurance during the years ended December 31, 2016, 2015 or 2014.
(k)Assessments
We record guaranty fund and other insurance-related assessments imposed upon us as an expense in the period the regulatory agency imposes the assessment. To recover Florida Insurance Guaranty Association (FIGA) assessments, we calculate and begin collecting a policy surcharge that will allow us to collect the entire assessment over a 12-month period, based on our estimate of the number of policies we expect to write. We then submit an information only filing, pursuant to Florida Statute 631.57(3)(h), to the insurance regulatory authority requesting formal approval of the policy FIGA surcharge. The process may be repeated in successive 12-month periods until we collect the entire assessment. We record the recoveries as revenue in the period that we collect the cash. While current regulations allow us to recover from policyholders the amount of assessments imposed upon us, our payment of the assessments and our recoveries may not offset each other in the same fiscal period in our consolidated financial statements.
Where permitted by law or regulatory authority, we collect assessments imposed upon policyholders as a policy surcharge and we record the amounts collected as a liability until we remit the amounts to the regulatory agency that imposed the assessment. During 2016, we received an assessment for $415,000 from the North Carolina Joint Underwriting Association related to Hurricane Matthew. We did not receive any additional significant assessments from regulatory authorities in the states in which our insurance affiliates operate.
(l)Income Taxes
We recognize deferred tax assets and liabilities for the future tax consequences attributable to differences between the financial statement carrying amounts of existing assets and liabilities and their respective tax bases. We measure deferred tax assets and liabilities using enacted tax rates expected to apply to taxable income in the years in which we expect to recover or settle those temporary differences. Should a change in tax rates occur, we recognize the effect on deferred tax assets and
57
UNITED INSURANCE HOLDINGS CORP. Notes to Consolidated Financial Statements December 31, 2016 |
liabilities in operations in the period that includes the enactment date. Realization of our deferred income tax assets depends upon our generation of sufficient future taxable income.
We recognize the financial statement benefit of a tax position only after determining that the relevant tax authority would more likely than not sustain the position following an audit. For tax positions meeting the more likely than not threshold, the amount recognized in the consolidated financial statements is the largest benefit that has a greater than 50% likelihood of being realized upon ultimate settlement with the relevant taxing authority.
We record any income tax penalties and income-tax-related interest as income tax expense in the period incurred. We did not incur any material tax penalties or income-tax-related interest during the years ended December 31, 2016, 2015 or 2014.
(m)Advertising Costs
We expense all advertising costs when we incur those costs. For the years ended December 31, 2016, 2015 and 2014, we incurred advertising costs of $907,000, $2,630,000, and $1,819,000, respectively.
(n)Earnings Per Share
We report both basic earnings per share and diluted earnings per share. To calculate basic earnings per share, we divide net income attributable to common stockholders by the weighted-average number of common stock shares outstanding during the period. We calculate diluted earnings per share by dividing net income attributable to common stockholders by the weighted-average number of common stock shares, common stock equivalents, and restricted shares outstanding during the period.
(o)Concentrations of Risk
Our current operations subject us to the following concentrations of risk:
•a concentration of revenue because we write primarily homeowners policies
• | a geographic concentration resulting from the fact that, though we now operate in twelve states, we still write approximately 47% of our gross written premium in Florida |
• | a group concentration of credit risk with regard to our reinsurance recoverable, since all of our reinsurers engage in similar activities and have similar economic characteristics that could cause their ability to repay us to be similarly affected by changes in economic or other conditions |
• | a concentration of credit risk with regard to our cash, because we choose to deposit all our cash at six financial institutions |
We mitigate our geographic and group concentrations of risk by entering into reinsurance contracts with financially-stable reinsurers, and by securing irrevocable letters of credit from reinsurers when necessary.
With regard to our cash balances held at financial institutions, we had $159,288,000 and $72,405,000 in excess of Federal Deposit Insurance Corporation (FDIC) insurance limits at December 31, 2016 and 2015, respectively. The $86,883,000 increase in excess of FDIC insurance limits is the result of holding more cash and at the end of 2016 than we did in 2015.
(p)Goodwill
Goodwill is the excess of cost over the estimated fair value of net assets acquired. We attribute all goodwill associated with the acquisition of FSIC and IIC to one reporting unit.
Goodwill is not amortized but is tested for impairment at least annually or more frequently if events or circumstances, such as adverse changes in the business climate, indicate that there may be justification for conducting an interim test. The goodwill impairment process requires a comparison of the estimated fair value of a reporting unit to its carrying value. We test goodwill for impairment by either performing a qualitative assessment or a two-step quantitative test. The qualitative assessment is an
58
UNITED INSURANCE HOLDINGS CORP. Notes to Consolidated Financial Statements December 31, 2016 |
assessment of historical information and relevant events and circumstances to determine whether it is more likely than not that the fair value of the reporting unit is less than its carrying amount, including goodwill. We may elect not to perform the qualitative assessment for our reporting unit and perform a two-step quantitative impairment test. In performing the two-step quantitative impairment test, we may use a market multiple valuation approach and a discounted cash flow valuation approach.
The market multiple valuation approach utilizes market multiples of companies with similar businesses and the projected operating earnings of the reporting unit. The discounted cash flow valuation approach requires judgments about revenues, operating earnings projections, capital market assumptions and discount rates. The key inputs, judgments and assumptions necessary in determining estimated fair value of the reporting units include projected operating earnings, current book value, the level of economic capital required to support the mix of business, long-term growth rates, comparative market multiples, control premium, the account value of in-force business, projections of new and renewal business, as well as margins on such business, the level of interest rates, credit spreads, equity market levels, and the discount rate that we believe is appropriate for the respective reporting unit.
When testing goodwill for impairment, we also considers our market capitalization in relation to the aggregate estimated fair value of our reporting unit. We apply significant judgment when determining the estimated fair value of our reporting unit and when assessing the relationship of market capitalization to the aggregate estimated fair value of our reporting unit.
The valuation methodologies utilized are subject to key judgments and assumptions that are sensitive to change. Estimates of fair value are inherently uncertain and represent only management’s reasonable expectation regarding future developments. These estimates and the judgments and assumptions upon which the estimates are based will, in all likelihood, differ in some respects from actual future results. Declines in the estimated fair value of our reporting unit could result in goodwill impairments in future periods which could materially adversely affect our results of operations or financial position.
For the 2016 annual goodwill impairment test, we utilized the qualitative assessment and determined it was not more likely than not that the fair value of the reporting unit tested using the qualitative assessment was less than its carrying amount and, therefore no further testing was needed for the reporting unit. We determined that the fair values of the reporting unit was in excess of the carrying value and, therefore goodwill was not impaired.
(q)Intangible Assets
Identifiable intangible assets that are amortized generally represent the cost of client relationships, trade names and agency agreements acquired. In valuing these assets, we make assumptions regarding useful lives and projected growth rates, and significant judgment is required. We periodically reviews identifiable intangibles for impairment as events or changes in circumstances indicate that the carrying amount of such assets may not be recoverable. If the carrying amounts of the assets exceed their respective fair values, additional impairment tests are performed to measure the amount of the impairment loss, if any.
Non-amortizing intangible assets generally represent the cost of insurance licenses acquired. Non-amortizing intangible assets are tested for impairment in the fourth quarter of each fiscal year by comparing the fair value of the licenses acquired to their carrying values. We established fair value for purposes of impairment testing using the income approach. If the carrying value of a license acquired exceeds its fair value, an impairment loss is recognized equal to that excess. For 2016, we determined that the fair values of the intangible assets were not impaired.
(r)Accounting Pronouncements
Adopted Policies
In May 2015, the FASB issued Accounting Standards Update No. 2015-09, which requires expanded disclosures for insurance entities that issue short-duration contracts. The expanded disclosures are designed to provide additional insight into an insurance entity's significant estimates made in measuring the liability for unpaid claims and claim adjustment expenses. The disclosures include information about incurred and paid claims development by accident years, on a net basis after reinsurance, for the number of years' claims incurred typically remain outstanding, not to exceed ten years. Each period presented in the disclosure about claims development that precedes the current reporting period is considered required supplementary information. The expanded disclosures also include information about significant changes in methodologies and assumptions, a
59
UNITED INSURANCE HOLDINGS CORP. Notes to Consolidated Financial Statements December 31, 2016 |
reconciliation of incurred and paid claims development to the carrying amount of the liability for unpaid claims and claim adjustment expenses, the total amount of incurred but not reported liabilities plus expected development, the incidence of claims including the methodology used to determine the incidence of claims, and claim duration. The guidance is effective for annual periods beginning after December 15, 2015, and interim periods beginning after December 15, 2016, and is to be applied retrospectively. The new guidance affects disclosures only and therefore, the adoption as of December 31, 2016 had no impact on the Company's results of operations or financial position.
Pending Policies
We have evaluated recent accounting pronouncements that have had or may have a significant effect on our financial statements or on our disclosures.
In August 2016, the FASB issued Accounting Standards Update No. 2016-15, Statement of Cash Flows (Topic 230) (ASU 2016-15). This update is intended to address eight specific cash flow issues with the objective of reducing the existing diversity in practice in how certain cash receipts and cash payments are presented and classified in the statement of cash flows under Topic 230. The cash flow issues impacting our company include the presentation and classification of debt prepayment or debt extinguishment costs and contingent consideration payments made after a business combination. ASU 2016-15 is effective for annual periods beginning after December 15, 2017, including interim periods within those annual periods, with early adoption permitted. We do not intend to early adopt and are assessing the impact of adopting this new accounting standard on our consolidated financial statements and related disclosures.
In June 2016, the FASB issued Accounting Standards Update No. 2016-13, Financial Instruments- Credit Losses (Topic 326): Measurement of Credit Losses on Financial Instruments (ASU 2016-13). This update is intended to replace the incurred loss impairment methodology in current GAAP with a method that reflects expected credit losses and requires consideration of a broader range of reasonable and supportable information to inform credit loss estimates. ASU 2016-13 will provide users with more useful information regarding the expected credit losses on financial instruments and other commitments to extend credit held by a reporting entity at each reporting date. In addition, credit losses on available-for-sale debt securities will now have to be presented as an allowance rather than as a write-down. ASU 2016-13 is effective for fiscal years beginning after December 15, 2019, including interim periods within those fiscal years with early adoption permitted for certain requirements. We do not intend to early adopt and are assessing the impact of adopting this new accounting standard on our consolidated financial statements and related disclosures.
In March 2016, the FASB issued Accounting Standards Update No. 2016-09, Compensation - Stock Compensation (Topic 718): Improvements to Employee Share-Based Payment Accounting (ASU 2016-09). This update is intended to simplify several aspects of the accounting for share-based payment transactions, including the income tax consequences, classification of awards as either equity or liabilities, and classification on the statement of cash flows. ASU 2016-09 is effective for annual periods beginning after December 15, 2016, including interim periods within those annual periods, with early adoption permitted for certain requirements. We do not intend to early adopt and are assessing the impact of adopting this new accounting standard on our consolidated financial statements and related disclosures.
In February 2016, the FASB issued Accounting Standards Update No. 2016-02, Leases (Topic 842) (ASU 2016-02). This updated is intended to replace existing lease guidance by requiring a lessee to recognize substantially all leases (whether operating or finance leases) on the balance sheet as a right-of-use asset and an associated least liability. Short-term leases of 12 months or less are excluded from this amendment. ASU 2016-02 is effective for fiscal years beginning after December 15, 2018, including interim periods within those fiscal years, with early adoption permitted. We do not intend to early adopt and are assessing the impact of adopting this new accounting standard on our consolidated financial statements and related disclosures.
In January 2016, the FASB issued Accounting Standards Update No. 2016-01, Recognition and Measurement of Financial Assets and Financial Liabilities (ASU 2016-01). This update substantially revises standards for the recognition, measurement and presentation of financial instruments. This standard revises an entity's accounting related to (1) the classification and measurement of investments in equity securities and (2) the presentation of certain fair value changes for financial liabilities measured at fair value. It also amends certain disclosure requirements associated with the fair value of financial instruments. ASU 2016-01 is effective for annual periods beginning after December 15, 2017, including interim periods within those annual periods, with early adoption permitted for certain requirements. We are assessing the impact of adopting this new accounting standard on our consolidated financial statements and related disclosures.
60
UNITED INSURANCE HOLDINGS CORP. Notes to Consolidated Financial Statements December 31, 2016 |
3) INVESTMENTS
The following table details the difference between cost or adjusted/amortized cost and estimated fair value, by major investment category, at December 31, 2016 and 2015:
Cost or Adjusted/Amortized Cost | Gross Unrealized Gains | Gross Unrealized Losses | Fair Value | ||||||||||||
December 31, 2016 | |||||||||||||||
U.S. government and agency securities | $ | 151,656 | $ | 189 | $ | 1,893 | $ | 149,952 | |||||||
Foreign governments | 2,031 | 30 | — | 2,061 | |||||||||||
States, municipalities and political subdivisions | 170,636 | 1,027 | 2,551 | 169,112 | |||||||||||
Public utilities | 7,687 | 116 | 73 | 7,730 | |||||||||||
Corporate securities | 164,424 | 1,238 | 1,126 | 164,536 | |||||||||||
Redeemable preferred stocks | 1,182 | 5 | 62 | 1,125 | |||||||||||
Total fixed maturities | 497,616 | 2,605 | 5,705 | 494,516 | |||||||||||
Public utilities | 1,343 | 164 | — | 1,507 | |||||||||||
Other common stocks | 19,815 | 4,552 | 319 | 24,048 | |||||||||||
Nonredeemable preferred stocks | 2,916 | 10 | 83 | 2,843 | |||||||||||
Total equity securities | 24,074 | 4,726 | 402 | 28,398 | |||||||||||
Other investments | 5,493 | 267 | 27 | 5,733 | |||||||||||
Total investments | $ | 527,183 | $ | 7,598 | $ | 6,134 | $ | 528,647 | |||||||
December 31, 2015 | |||||||||||||||
U.S. government and agency securities | $ | 81,973 | $ | 148 | $ | 474 | $ | 81,647 | |||||||
Foreign government | 2,038 | 37 | — | 2,075 | |||||||||||
States, municipalities and political subdivisions | 154,004 | 2,391 | 490 | 155,905 | |||||||||||
Public utilities | 8,398 | 128 | 33 | 8,493 | |||||||||||
Corporate securities | 148,170 | 880 | 2,292 | 146,758 | |||||||||||
Redeemable preferred stocks | 1,832 | 37 | 49 | 1,820 | |||||||||||
Total fixed maturities | 396,415 | 3,621 | 3,338 | 396,698 | |||||||||||
Mutual funds | 26,357 | — | 14 | 26,343 | |||||||||||
Public utilities | 1,342 | 44 | 34 | 1,352 | |||||||||||
Other common stocks | 18,624 | 2,615 | 545 | 20,694 | |||||||||||
Nonredeemable preferred stocks | 2,356 | 67 | 6 | 2,417 | |||||||||||
Total equity securities | 48,679 | 2,726 | 599 | 50,806 | |||||||||||
Other investments | 4,980 | 230 | — | 5,210 | |||||||||||
Total investments | $ | 450,074 | $ | 6,577 | $ | 3,937 | $ | 452,714 | |||||||
61
UNITED INSURANCE HOLDINGS CORP. Notes to Consolidated Financial Statements December 31, 2016 |
When we sell investments, we calculate the gain or loss realized on the sale by comparing the sales price (fair value) to the cost or adjusted/amortized cost of the security sold. We determine the cost or adjusted/amortized cost of the security sold using the specific-identification method. The following tables detail our realized gains (losses) by major investment category for the years ended December 31, 2016, 2015 and 2014:
2016 | 2015 | 2014 | |||||||||||||||||||||
Gains (Losses) | Fair Value at Sale | Gains (Losses) | Fair Value at Sale | Gains (Losses) | Fair Value at Sale | ||||||||||||||||||
Fixed maturities | $ | 1,811 | $ | 56,484 | $ | 727 | $ | 87,141 | $ | 92 | $ | 5,598 | |||||||||||
Equity securities | 64 | 13,253 | 1,895 | 7,790 | 298 | 111,325 | |||||||||||||||||
Total realized gains | 1,875 | 69,737 | 2,622 | 94,931 | 390 | 116,923 | |||||||||||||||||
Fixed maturities | (1,136 | ) | 24,464 | (595 | ) | 38,485 | (228 | ) | 11,389 | ||||||||||||||
Equity securities | (192 | ) | 37,790 | (1,200 | ) | 4,172 | (182 | ) | 1,529 | ||||||||||||||
Total realized losses | (1,328 | ) | 62,254 | (1,795 | ) | 42,657 | (410 | ) | 12,918 | ||||||||||||||
Net realized investment gains (losses) | $ | 547 | $ | 131,991 | $ | 827 | $ | 137,588 | $ | (20 | ) | $ | 129,841 | ||||||||||
The table below summarizes our fixed maturities at year end by contractual maturity periods. Actual results may differ as issuers may have the right to call or prepay obligations, with or without penalties, prior to the contractual maturity of those obligations.
December 31, 2016 | |||||||||||||
Cost or Amortized Cost | Percent of Total | Fair Value | Percent of Total | ||||||||||
Due in one year or less | $ | 36,973 | 7.4 | % | $ | 36,974 | 7.5 | % | |||||
Due after one year through five years | 273,784 | 55.0 | % | 272,822 | 55.1 | % | |||||||
Due after five years through ten years | 142,452 | 28.6 | % | 140,416 | 28.4 | % | |||||||
Due after ten years | 44,407 | 9.0 | % | 44,304 | 9.0 | % | |||||||
Total | $ | 497,616 | 100.0 | % | $ | 494,516 | 100.0 | % | |||||
The following table summarizes our net investment income by major investment category:
Year Ended December 31, | |||||||||||
2016 | 2015 | 2014 | |||||||||
Fixed maturities | $ | 9,170 | $ | 8,092 | $ | 5,866 | |||||
Equity securities | 996 | 859 | 734 | ||||||||
Cash and cash equivalents | 141 | 25 | 9 | ||||||||
Other investments | 352 | 222 | 166 | ||||||||
Other assets | 20 | 14 | 20 | ||||||||
Investment income | $ | 10,679 | $ | 9,212 | $ | 6,795 | |||||
Investment expenses | (587 | ) | (267 | ) | (312 | ) | |||||
Net investment income | $ | 10,092 | $ | 8,945 | $ | 6,483 | |||||
62
UNITED INSURANCE HOLDINGS CORP. Notes to Consolidated Financial Statements December 31, 2016 |
Portfolio monitoring
We have a comprehensive portfolio monitoring process to identify and evaluate each fixed income and equity security whose carrying value may be other-than-temporarily impaired.
For each fixed income security in an unrealized loss position, we determine if the loss is temporary or other-than-temporary. If our management decides to sell the security or determines that it is more likely than not that we will be required to sell the security before recovery of the cost or amortized cost basis for reasons such as liquidity needs, contractual or regulatory requirements, then the security's decline in fair value is considered other-than-temporary and is recorded in earnings.
If we have not made the decision to sell the fixed income security and it is not more likely than not that we will be required to sell the fixed income security before recovery of its amortized cost basis, we evaluate whether we expect the security to receive cash flows sufficient to recover the entire cost or amortized cost basis of the security. We calculate the estimated recovery value by discounting the best estimate of future cash flows at the security's original or current effective rate, as appropriate, and compare this to the cost or amortized cost of the security. If we do not expect to receive cash flows sufficient to recover the entire cost or amortized cost basis of the fixed income security, the credit loss component of the impairment is recorded in earnings, with the remaining amount of the unrealized loss related to other factors recognized in other comprehensive income.
For equity securities, we consider various factors, including whether we have the intent and ability to hold the equity security for a period of time sufficient to recover its cost basis. If we lack the intent and ability to hold to recovery, or if we believe the recovery period is extended, the equity security's decline in fair value is considered other-than-temporary and is recorded in earnings.
Our portfolio monitoring process includes a quarterly review of all securities to identify instances where the fair value of a security compared to its cost or amortized cost (for fixed income securities) or cost (for equity securities) is below established thresholds. The process also includes the monitoring of other impairment indicators such as ratings, ratings downgrades and payment defaults. The securities identified, in addition to other securities for which we may have a concern, are evaluated for potential other-than-temporary impairment using all reasonably available information relevant to the collectability or recovery of the security. Inherent in our evaluation of other-than-temporary impairment for these fixed income and equity securities are assumptions and estimates about the financial condition and future earnings potential of the issue or issuer. Some of the factors that may be considered in evaluating whether a decline in fair value is other-than-temporary are: (1) the financial condition, near-term and long-term prospects of the issue or issuer, including relevant industry specific market conditions and trends, geographic location and implications of rating agency actions and offering prices; (2) the specific reasons that a security is in an unrealized loss position, including overall market conditions which could affect liquidity; and (3) the length of time and extent to which the fair value has been less than amortized cost or cost.
63
UNITED INSURANCE HOLDINGS CORP. Notes to Consolidated Financial Statements December 31, 2016 |
The following table presents an aging of our unrealized investment losses by investment class:
Less Than Twelve Months | Twelve Months or More | ||||||||||||||||||||
Number of Securities* | Gross Unrealized Losses | Fair Value | Number of Securities* | Gross Unrealized Losses | Fair Value | ||||||||||||||||
December 31, 2016 | |||||||||||||||||||||
U.S. government and agency securities | 186 | $ | 1,893 | $ | 111,216 | — | $ | — | $ | — | |||||||||||
States, municipalities and political subdivisions | 201 | 2,551 | 136,360 | — | — | — | |||||||||||||||
Public utilities | 8 | 73 | 2,222 | — | — | — | |||||||||||||||
Corporate securities | 215 | 1,100 | 88,605 | 1 | 26 | 1,021 | |||||||||||||||
Redeemable preferred stocks | 7 | 62 | 764 | — | — | — | |||||||||||||||
Total fixed maturities | 617 | 5,679 | 339,167 | 1 | 26 | 1,021 | |||||||||||||||
Other common stocks | 16 | 140 | 2,450 | 17 | 179 | 1,732 | |||||||||||||||
Nonredeemable preferred stocks | 12 | 52 | 1,830 | 7 | 31 | 369 | |||||||||||||||
Total equity securities | 28 | 192 | 4,280 | 24 | 210 | 2,101 | |||||||||||||||
Other investments | 1 | 27 | 987 | — | — | — | |||||||||||||||
Total | 646 | $ | 5,898 | $ | 344,434 | 25 | $ | 236 | $ | 3,122 | |||||||||||
December 31, 2015 | |||||||||||||||||||||
U.S. government and agency securities | 73 | $ | 265 | $ | 44,786 | 21 | $ | 209 | $ | 11,250 | |||||||||||
States, municipalities and political subdivisions | 61 | 463 | 56,971 | 5 | 27 | 7,620 | |||||||||||||||
Public utilities | 8 | 4 | 1,961 | 1 | 29 | 1,015 | |||||||||||||||
Corporate securities | 242 | 2,025 | 92,429 | 9 | 267 | 10,047 | |||||||||||||||
Redeemable preferred stocks | 7 | 49 | 746 | — | — | — | |||||||||||||||
Total fixed maturities | 391 | 2,806 | 196,893 | 36 | 532 | 29,932 | |||||||||||||||
Mutual funds | 1 | 14 | 26,343 | — | — | — | |||||||||||||||
Public utilities | 4 | 34 | 697 | — | — | — | |||||||||||||||
Other common stocks | 63 | 497 | 6,665 | 3 | 48 | 118 | |||||||||||||||
Nonredeemable preferred stocks | 19 | 6 | 1,161 | — | — | — | |||||||||||||||
Total equity securities | 87 | 551 | 34,866 | 3 | 48 | 118 | |||||||||||||||
Total | 478 | $ | 3,357 | $ | 231,759 | 39 | $ | 580 | $ | 30,050 | |||||||||||
* This amount represents the actual number of discrete securities, not the number of shares of those securities. The numbers are not presented in thousands.
During our quarterly evaluations of our securities for impairment, we determined that none of our investments in debt and equity securities or limited partnership investments that reflected an unrealized loss position were other-than-temporarily impaired. The issuers of our debt securities continue to make interest payments on a timely basis. We do not intend to sell nor is it likely that we would be required to sell the debt securities before we recover our amortized cost basis. The near-term prospects of all the issuers of the equity securities we own indicate we could recover our cost basis, and we also do not intend to sell these securities until their value equals or exceeds their cost. The limited partnership continues to make interest payments on a timely basis and we do not intend to sell nor is it likely that we would be required to sell our investment in the partnership before we recover our amortized cost.
During the years ended December 31, 2016, 2015 and 2014, we recorded no other-than-temporary impairment charges.
64
UNITED INSURANCE HOLDINGS CORP. Notes to Consolidated Financial Statements December 31, 2016 |
Fair value measurement
Fair value is defined as the price that would be received to sell an asset or paid to transfer a liability in an orderly transaction between market participants at the measurement date. The hierarchy for inputs used in determining fair value maximizes the use of observable inputs and minimizes the use of unobservable inputs by requiring that observable inputs be used when available. Assets and liabilities recorded on the Audited Consolidated Balance Sheets at fair value are categorized in the fair value hierarchy based on the observability of inputs to the valuation techniques as follows:
Level 1: Assets and liabilities whose values are based on unadjusted quoted prices for identical assets or liabilities in an active market that we can access.
Level 2: Assets and liabilities whose values are based on the following:
(a) Quoted prices for similar assets or liabilities in active markets;
(b) Quoted prices for identical or similar assets or liabilities in markets that are not active; or
(c) Valuation models whose inputs are observable, directly or indirectly, for substantially the full term of the asset or liability.
Level 3: Assets and liabilities whose values are based on prices or valuation techniques that require inputs that are both unobservable and significant to the overall fair value measurement. Unobservable inputs reflect our estimates of the assumptions that market participants would use in valuing the assets and liabilities.
We estimate the fair value of our investments using the closing prices on the last business day of the reporting period, obtained from active markets such as the NYSE, NASDAQ, and NYSE MKT. For securities for which quoted prices in active markets are unavailable, we use a third-party pricing service that utilizes quoted prices in active markets for similar instruments, benchmark interest rates, broker quotes and other relevant inputs to estimate the fair value of those securities for which quoted prices are unavailable. Our estimates of fair value reflect the interest rate environment that existed as of the close of business on December 31, 2016 and 2015. Changes in interest rates subsequent to December 31, 2016 may affect the fair value of our investments.
The fair value for our fixed-maturities is initially calculated by a third-party pricing service. Valuation service providers typically obtain data about market transactions and other key valuation model inputs from multiple sources, and through the use of proprietary models, produce valuation information in the form of a single fair value for individual fixed income and other securities for which a fair value has been requested. The inputs used by the valuation service providers include, but are not limited to, market prices from recently completed transactions and transactions of comparable securities, interest rate yield curves, credit spreads, liquidity spreads, currency rates, and other information, as applicable. Credit and liquidity spreads are typically implied from completed transactions and transactions of comparable securities. Valuation service providers also use proprietary discounted cash flow models that are widely accepted in the financial services industry and similar to those used by other market participants to value the same financial information. The valuation models take into account, among other things, market observable information as of the measurement date, as described above, as well as the specific attributes of the security being valued including its term, interest rate, credit rating, industry sector, and where applicable, collateral quality and other issue or issuer specific information. Executing valuation models effectively requires seasoned professional judgment and experience.
For our Level 3 assets, our internal pricing methods are primarily based on models using discounted cash flow methodologies that determine a single best estimate of fair value for individual financial instruments. In addition, our models use a discount rate and internally assigned credit ratings as inputs (which are generally consistent with any external ratings) and those we use to report our holdings by credit rating. Market related inputs used in these fair values, which we believe are representative of inputs other market participants would use to determine fair value of the same instruments include: interest rate yield curves, quoted market prices of comparable securities, credit spreads, and other applicable market data. As a result of the significance of non-market observable inputs, including internally assigned credit ratings as described above, judgment is required in developing these fair values. The fair value of these financial assets may differ from the amount actually received if we were to sell the asset. Moreover, the use of different valuation assumptions may have a material effect on the fair values on the financial assets.
65
UNITED INSURANCE HOLDINGS CORP. Notes to Consolidated Financial Statements December 31, 2016 |
Any change in the estimated fair value of our securities would impact the amount of unrealized gain or loss we have recorded, which could change the amount we have recorded for our investments and other comprehensive income on our Consolidated Balance Sheets.
The carrying amounts for the following financial instrument categories approximate their fair values at December 31, 2016 and 2015 because of their short-term nature: cash and cash equivalents, accrued investment income, premiums receivable, reinsurance recoverable, reinsurance payable, other assets, and other liabilities. The carrying amount of the notes payable to the Florida State Board of Administration, the Branch Banking & Trust Corporation (BB&T), and our senior notes payable approximate fair value as the interest rates are variable. The carrying amount of our note payable with Interboro, LLC approximates fair value due to the short term nature of the loan.
The following table presents the fair value of our financial instruments measured on a recurring basis by level at December 31, 2016 and December 31, 2015:
December 31, 2016 | Total | Level 1 | Level 2 | Level 3 | |||||||||||
U.S. government and agency securities | $ | 149,952 | $ | — | $ | 149,952 | $ | — | |||||||
Foreign governments | 2,061 | — | 2,061 | — | |||||||||||
States, municipalities and political subdivisions | 169,112 | — | 169,112 | — | |||||||||||
Public utilities | 7,730 | — | 7,730 | — | |||||||||||
Corporate securities | 164,536 | — | 164,536 | — | |||||||||||
Redeemable preferred stocks | 1,125 | 1,125 | — | — | |||||||||||
Total fixed maturities | 494,516 | 1,125 | 493,391 | — | |||||||||||
Public utilities | 1,507 | 1,507 | — | — | |||||||||||
Other common stocks | 24,048 | 24,048 | — | — | |||||||||||
Nonredeemable preferred stocks | 2,843 | 2,843 | — | — | |||||||||||
Total equity securities | 28,398 | 28,398 | — | — | |||||||||||
Other investments | 5,733 | 300 | 3,735 | 1,698 | |||||||||||
Total investments | $ | 528,647 | $ | 29,823 | $ | 497,126 | $ | 1,698 | |||||||
December 31, 2015 | |||||||||||||||
U.S. government and agency securities | $ | 81,647 | $ | — | $ | 81,647 | $ | — | |||||||
Foreign governments | 2,075 | — | 2,075 | — | |||||||||||
States, municipalities and political subdivisions | 155,905 | — | 155,905 | — | |||||||||||
Public utilities | 8,493 | — | 8,493 | — | |||||||||||
Corporate securities | 146,758 | — | 146,758 | — | |||||||||||
Redeemable preferred stocks | 1,820 | 1,820 | — | — | |||||||||||
Total fixed maturities | 396,698 | 1,820 | 394,878 | — | |||||||||||
Mutual Funds | 26,343 | 26,343 | — | — | |||||||||||
Public utilities | 1,352 | 1,352 | — | — | |||||||||||
Other common stocks | 20,694 | 20,694 | — | — | |||||||||||
Nonredeemable preferred stocks | 2,417 | 2,417 | — | — | |||||||||||
Total equity securities | 50,806 | 50,806 | — | — | |||||||||||
Other investments | 5,210 | 300 | 3,055 | 1,855 | |||||||||||
Total investments | $ | 452,714 | $ | 52,926 | $ | 397,933 | $ | 1,855 | |||||||
66
UNITED INSURANCE HOLDINGS CORP. Notes to Consolidated Financial Statements December 31, 2016 |
The table below presents the rollforward of our Level 3 investments held at fair value during the year ended December 31, 2016:
Other Investments | ||||
December 31, 2015 | $ | 1,855 | ||
Transfers in | — | |||
Partnership income | 143 | |||
Return of capital | (311 | ) | ||
Unrealized gains in accumulated other comprehensive income | 11 | |||
December 31, 2016 | $ | 1,698 | ||
We are responsible for the determination of fair value and the supporting assumptions and methodologies. We gain assurance on the overall reasonableness and consistent application of valuation methodologies and inputs and compliance with accounting standards through the execution of various processes and controls designed to provide assurance that our assets and liabilities are appropriately valued. For fair values received from third parties, our processes are designed to provide assurance that the valuation methodologies and inputs are appropriate and consistently applied, the assumptions are reasonable and consistent with the objective of determining fair value, and the fair values are accurately recorded.
At the end of each quarter, we determine whether we need to transfer the fair values of any securities between levels of the fair value hierarchy and, if so, we report the transfer as of the end of the quarter. During 2016, we transferred no investments between levels. We used unobservable inputs to derive our estimated fair value for Level 3 investments and the unobservable inputs are significant to the overall fair value measurement.
For our investments in U.S. government securities that do not have prices in active markets, agency securities, state and municipal governments, and corporate bonds, we obtain the fair values from our investment custodians which use a third-party valuation service. The valuation service calculates prices for our investments in the aforementioned security types on a month-end basis by using several matrix-pricing methodologies that incorporate inputs from various sources. The model the valuation service uses to price U.S. government securities and securities of states and municipalities incorporates inputs from active market makers and inter-dealer brokers. To price corporate bonds and agency securities, the valuation service calculates non-call yield spreads on all issuers, uses option-adjusted yield spreads to account for any early redemption features, then adds final spreads to the U.S. Treasury curve at 3 p.m. (ET) as of quarter end. Since the inputs the valuation service uses in their calculations are not quoted prices in active markets, but are observable inputs, they represent Level 2 inputs.
67
UNITED INSURANCE HOLDINGS CORP. Notes to Consolidated Financial Statements December 31, 2016 |
Other investments
We acquired investments in limited partnerships, recorded in the other investments line of our Consolidated Balance Sheets, that are currently being accounted for at fair value utilizing a discounted cash flow methodology. The estimated fair value of our investments in the limited partnership interests was $5,433,000. We have fully funded our investments in DCR VI, DCR VII, and RCH VI; however, we are still obligated to fund an additional $425,000 and $760,000 for our investments in Kayne Anderson Senior Credit Fund II, L.P. (Kayne) and Blackstone Alternative Solutions 2015 Trust (Blackstone), respectively.
The information presented in the table below is as of December 31, 2016.
Initial Investment | Book Value | Unrealized Gain | Unrealized Loss | Fair Value | ||||||||||||||||
DCR Mortgage Partners VI, L.P. | $ | 382 | $ | 444 | $ | 267 | $ | — | $ | 711 | ||||||||||
RCH Mortgage Fund VI Investors, LP | 1,000 | 1,014 | — | 27 | 987 | |||||||||||||||
Total Level 3 limited partnership investments | 1,382 | 1,458 | 267 | 27 | 1,698 | |||||||||||||||
Kayne Senior Credit Fund II, L.P. | 1,575 | 1,450 | — | — | 1,450 | |||||||||||||||
DCR Mortgage Partners VII, L.P. | 2,000 | 2,045 | — | — | 2,045 | |||||||||||||||
Blackstone Alternative Solutions 2015 Trust | 240 | 240 | — | — | 240 | |||||||||||||||
Total Level 2 limited partnership investments | 3,815 | 3,735 | — | — | 3,735 | |||||||||||||||
Total limited partnership investments | $ | 5,197 | $ | 5,193 | $ | 267 | $ | 27 | $ | 5,433 | ||||||||||
Other short-term investments | 300 | 300 | — | — | 300 | |||||||||||||||
Total other investments | $ | 5,497 | $ | 5,493 | $ | 267 | $ | 27 | $ | 5,733 | ||||||||||
On December 6, 2016, we entered into a participation agreement with United Capital Funding (UC Funding), that was
recorded in other assets, at cost. We invested $1,000,000 in cash with UC Funding which they are utilizing to factor receivables
from another company.
On October 20, 2015, we acquired our investment in DCR Mortgage Partners VII, L.P. (DCR VII), a limited partnership, that is currently being accounted for at cost. Our total investment in the partnership is $2,000,000 and we are not required to fund any additional amounts in excess of our initial investment. When the funding for the partnership closes, DCR VII will acquire and manage performing, sub-performing, and non-performing loans secured by income-producing commercial real estate. As the limited partnership was still in the formation phase at December 31, 2016, the cost basis of our investment approximated its fair value.
In October 2015, we started funding our investment in Blackstone. Blackstone is a private placement offered by The Blackstone Group, L.P. (NYSE: BX), a publicly traded investment firm with approximately $336 billion in assets under management. The Blackstone Group is one of the largest independent alternative asset managers in the world providing a broad range of opportunities in four key alternative investment categories: private equity, real estate, credit and hedge funds.
Blackstone is not a fund of funds and will generally participate directly in deals originated by The Blackstone Group during its three-year investment period. All deals will have been evaluated and approved by a Blackstone Group investment committee providing diversified exposure to private market investments across many of The Blackstone Group’s alternative investment strategies. Blackstone invests substantially all of its assets in investments in which other Blackstone Group investment vehicles, managed accounts or other Blackstone Group affiliates participate and also generally parallels the Blackstone Group annual employee investment program.
Our investment in Blackstone is currently being accounted for at cost. Our total investment in the partnership is $240,000. We are obligated to fund an additional amount of $760,000 to reach our initial $1,000,000 commitment. As the limited partnership is still in the formation phase, the cost basis of our investment approximated its fair value at December 31, 2016.
68
UNITED INSURANCE HOLDINGS CORP. Notes to Consolidated Financial Statements December 31, 2016 |
In December 2014, we began funding our investment in the Kayne Anderson Senior Credit Fund II (KSCF). KSCF is a private placement offered by Kayne Anderson Capital Advisors, L.P., an S.E.C. registered investment advisor with approximately $25 billion in assets under management. KSCF will deploy its assets across a variety of loan types with three to five year maturities in senior secured positions to support acquisitions, growth, add-ons, recapitalizations, restructuring and bridge financing. KSCF’s investment strategies include upstream oil and gas companies, energy infrastructure, specialized real estate, middle market credit, growth private equity and distressed municipal opportunities.
On September 27, 2013, we acquired our investment in RCH Mortgage Fund VI Investors, LP (RCH). RCH is a limited partnership that acquires and manages performing, sub-performing, and non-performing loans secured by income-producing commercial real estate.
On September 25, 2012, we acquired our investment in DCR Mortgage Partners VI, L.P. (DCR VI). DCR VI is a limited partnership that acquires and manages performing, sub-performing, and non-performing loans secured by income-producing commercial real estate.
The following table summarizes the quantitative impact that the significant unobservable inputs used to estimate the fair value of our Level 3 investments has on the estimated fair value of our investments shown in the tables above. Due to Kayne, DCR VII, and Blackstone being carried at cost, we have excluded them from the table below. The DCR VI and RCH investments were valued using a duration of 60 months for both periods presented below.
Fair Value | Valuation | Rate | ||||||||
Impact | Technique | Unobservable Input | Adjustment | |||||||
December 31, 2016 | ||||||||||
DCR VI | $ | (56 | ) | Discounted cash flow | Discount rate based on D&B paydex scale | 2.35% | ||||
RCH | $ | (341 | ) | Discounted cash flow | Discount rate based on D&B paydex scale | 7.35% | ||||
December 31, 2015 | ||||||||||
DCR VI | $ | (88 | ) | Discounted cash flow | Discount rate based on D&B paydex scale | 2.35% | ||||
RCH | $ | (341 | ) | Discounted cash flow | Discount rate based on D&B paydex scale | 7.35% | ||||
4) | ACQUISITION |
We account for business acquisitions in accordance with the acquisition method of accounting, which requires, among other things, that most assets acquired, liabilities assumed, and earn-out consideration be recognized at their fair values as of the acquisition date. Measurement period adjustments to provisional purchase price allocations are recognized in the period in which they are determined as it the accounting had been competed on the acquisition date.
On April 29, 2016, we completed the acquisition of IIC. The purchase price for IIC consisted of $48,450,000 in cash, $8,550,000 in note payable and an accrued liability for $3,471,000 paid during July 2016. The acquisition of IIC supports the Company's growth strategy and further strengthens the Company's overall position in the property and casualty insurance market in the state of New York.
The purchase price consisted of the following amounts:
Cash | $ | 48,450 | ||
Notes payable | 8,550 | |||
Accrued liability | 3,471 | |||
Total purchase price | $ | 60,471 | ||
69
UNITED INSURANCE HOLDINGS CORP. Notes to Consolidated Financial Statements December 31, 2016 |
The operations of IIC are included in our Consolidated Statements of Comprehensive Income effective April 29, 2016. We have one year from the acquisition date to finalize the allocation of the purchase price of IIC. The fair value of the net liabilities assumed, the intangible assets and the related goodwill are preliminary and may be subject to change upon completing the final valuation assessment. The preliminary purchase price allocation is as follows:
Cash and cash equivalents | $ | 15,554 | |
Investments | 66,527 | ||
Premium and agents' receivable | 3,186 | ||
Reinsurance receivable | 1,042 | ||
Intangible assets | 5,877 | ||
Insurance contract asset | 8,334 | ||
Goodwill | 10,841 | ||
Other assets | 3,980 | ||
Unpaid losses and loss adjustment expenses | (24,967 | ) | |
Unearned premiums | (26,243 | ) | |
Advanced premiums | (1,472 | ) | |
Deferred taxes | (109 | ) | |
Other liabilities | (2,079 | ) | |
Total purchase price | $ | 60,471 | |
The unaudited pro forma financial information has been prepared as if the IIC acquisition had taken place on January 1, 2015. The unaudited pro forma information is not necessarily indicative of the results that we would have achieved had the transaction taken place on January 1, 2015, and the unaudited pro forma information does not purport to be indicative of future financial operating results.
For the Year Ended December 31, 2016 | For the Year Ended December 31, 2015 | |||||||||||||||||||||||
As | Pro Forma | As | Pro Forma | |||||||||||||||||||||
Reported | Adjustments(1) | Pro Forma | Reported | Adjustments(2) | Pro Forma | |||||||||||||||||||
Revenues | $ | 487,117 | $ | 18,963 | $ | 506,080 | $ | 357,569 | $ | 56,362 | $ | 413,931 | ||||||||||||
Net income | $ | 5,698 | $ | 8,187 | $ | 13,885 | $ | 27,358 | $ | 5,692 | $ | 33,050 | ||||||||||||
Diluted earnings per share | $ | 0.26 | $ | 0.38 | $ | 0.64 | $ | 1.28 | $ | 0.26 | $ | 1.54 | ||||||||||||
(1) Adjustments are for the period from January 1, 2016 through April 29, 2016.
(2) Adjustments are for the period from January 1, 2015 through December 31, 2015.
On February 3, 2015, we completed the acquisition of FSH and its two wholly owned subsidiaries. The acquisition of FSIC supports the Company's growth strategy and further strengthens the Company's overall position in the property and casualty insurance market in the states of Louisiana and Hawaii. The total purchase price paid to acquire the companies was $13,507,000 that was paid in shares of our common stock in two installments. The first payment occurred at the closing of the transaction when we issued 503,857 shares of our common stock that had a fair value of $12,994,000 on the date of closing the transaction. One year after the closing of the transaction, we issued an additional 32,943 shares of our common stock as payment of $513,000 of contingent consideration that we owed to the former shareholders of FSH pursuant to the terms of the purchase agreement.
The unaudited pro forma financial information has been prepared as if the FSH acquisition had taken place on January 1, 2015. The unaudited pro forma information is not necessarily indicative of the results that we would have achieved had the
70
UNITED INSURANCE HOLDINGS CORP. Notes to Consolidated Financial Statements December 31, 2016 |
transaction taken place on January 1, 2015, and the unaudited pro forma information does not purport to be indicative of future financial operating results.
For the Year Ended December 31, 2015 | ||||||||||||
Pro Forma | ||||||||||||
As Reported | Adjustments | Pro Forma | ||||||||||
Revenues | $ | 357,569 | $ | 1,127 | $ | 358,696 | ||||||
Net income | $ | 27,358 | $ | 77 | $ | 27,435 | ||||||
Diluted earnings per share | $ | 1.28 | $ | — | $ | 1.28 | ||||||
5) EARNINGS PER SHARE
Basic earnings per share (EPS) is based on the weighted average number of common shares outstanding for the period, excluding any dilutive common share equivalents. Diluted EPS reflects the potential dilution resulting from vesting of restricted stock awards. The following table shows the computation of basic and diluted EPS for the years ended December 31, 2016, 2015 and 2014:
Year Ended December 31, | ||||||||||||
2016 | 2015 | 2014 | ||||||||||
Numerator: | ||||||||||||
Net income attributable to common stockholders | $ | 5,698 | $ | 27,358 | $ | 41,013 | ||||||
Denominator: | ||||||||||||
Weighted-average shares outstanding | 21,417,486 | 21,218,233 | 19,933,652 | |||||||||
Effect of dilutive securities | 196,957 | 234,307 | 112,255 | |||||||||
Weighted-average diluted shares | 21,614,443 | 21,452,540 | 20,045,907 | |||||||||
Basic earnings per share | $ | 0.27 | $ | 1.29 | $ | 2.06 | ||||||
Diluted earnings per share | $ | 0.26 | $ | 1.28 | $ | 2.05 | ||||||
See Note 19 for additional information on the stock grants related to dilutive securities.
6) DEFERRED POLICY ACQUISITION COSTS
We anticipate that our deferred policy acquisition costs will be fully recoverable in the near term. The table below depicts the activity with regard to deferred policy acquisition costs:
2016 | 2015 | ||||||
Balance at January 1 | $ | 46,732 | $ | 31,925 | |||
Policy acquisition costs deferred | 134,588 | 101,221 | |||||
Amortization | (115,847 | ) | (86,414 | ) | |||
Balance at December 31 | $ | 65,473 | $ | 46,732 | |||
71
UNITED INSURANCE HOLDINGS CORP. Notes to Consolidated Financial Statements December 31, 2016 |
7) PROPERTY AND EQUIPMENT, NET
Property and equipment, net consists of the following:
Year Ended December 31, | ||||||||
2016 | 2015 | |||||||
Land | $ | 2,114 | $ | 2,114 | ||||
Building and building improvements | 5,502 | 4,298 | ||||||
Computer hardware and software | 14,699 | 13,574 | ||||||
Office furniture and equipment | 2,652 | 1,831 | ||||||
Leasehold improvements | — | 141 | ||||||
Total, at cost | 24,967 | 21,958 | ||||||
Less: accumulated depreciation and amortization | (7,107 | ) | (4,823 | ) | ||||
Property and equipment, net | $ | 17,860 | $ | 17,135 | ||||
On September 5, 2014, we entered into a purchase and sale agreement to acquire approximately 40,000 square feet of commercial office space and associated property in St. Petersburg, Florida. At acquisition, the real estate consisted of approximately 2.3 acres of land and an office building, plus an additional 1.5 acres of leased parking space. We are depreciating the building over its expected useful life of 39 years.
On September 9, 2015, we entered into a purchase and sale agreement to acquire approximately 7,800 square feet of commercial office space in St. Petersburg, Florida. We are depreciating the building over its expected useful life of 39 years.
Depreciation and amortization expense under property and equipment was $2,424,000, $1,803,000 and $731,000, respectively, for the years ended December 31, 2016, 2015 and 2014.
8) GOODWILL AND INTANGIBLE ASSETS
Goodwill
The changes in the carrying amount of goodwill for the years ended December 31, 2016 and 2015 are as follows:
December 31, | ||||||||
2016 | 2015 | |||||||
Balance at beginning of period | $ | 3,413 | $ | — | ||||
Acquisitions | 10,841 | 3,413 | ||||||
Impairment | — | — | ||||||
Balance at end of period | $ | 14,254 | $ | 3,413 | ||||
Using a qualitative assessment, we completed our most recent goodwill impairment testing during the fourth quarter of 2016 and determined that there was no impairment in the value of the asset as of December 31, 2016.
No impairment loss in the value of goodwill was recognized during the years ended December 31, 2016 and 2015. Additionally, there was no accumulated impairment related to goodwill at December 31, 2016 or 2015.
72
UNITED INSURANCE HOLDINGS CORP. Notes to Consolidated Financial Statements December 31, 2016 |
Intangible Assets
The following is a summary of intangible assets excluding goodwill and value of business acquired (VOBA) at December 31, 2016 or 2015:
Weighted-average remaining amortization period (in years) | Gross carrying amount | Accumulated amortization | Net carrying amount | |||||||||||
2016 | ||||||||||||||
Amortizing intangible assets | ||||||||||||||
Agency agreements acquired | 3.8 | $ | 10,284 | $ | (2,784 | ) | $ | 7,500 | ||||||
Trade names acquired | 2.1 | 720 | (264 | ) | 456 | |||||||||
Non-amortizing intangible assets | ||||||||||||||
Licenses acquired | 1,185 | — | 1,185 | |||||||||||
Total | $ | 12,189 | $ | (3,048 | ) | $ | 9,141 | |||||||
2015 | ||||||||||||||
Amortizing intangible assets | ||||||||||||||
Agency agreements acquired | 4.1 | $ | 5,652 | $ | (1,036 | ) | $ | 4,616 | ||||||
Trade names acquired | 2.1 | 250 | (76 | ) | 174 | |||||||||
Non-amortizing intangible assets | ||||||||||||||
Licenses acquired | 410 | — | 410 | |||||||||||
Total | $ | 6,312 | $ | (1,112 | ) | $ | 5,200 | |||||||
No impairment in the value of amortizing or non-amortizing intangible assets was recognized during the years ended December 31, 2016 and 2015.
Amortization expense was $10,910,000, $3,090,000 and $460,000 for the years ended December 31, 2016, 2015 and 2014, respectively. The large increase in amortization expense in 2016 was due to the amortization of intangible assets and VOBA acquired as part of the IIC acquisition. Estimated amortization expense to be recognized by the Company over the next five years is as follows:
Year ending December 31, | Estimated Amortization Expense | |||
2017 | $ | 3,509 | ||
2018 | 2,271 | |||
2019 | 2,159 | |||
2020 | 1,071 | |||
2021 | 358 | |||
9) REINSURANCE
Our reinsurance program is designed, utilizing our risk management methodology, to address our exposure to catastrophes. According to the Insurance Service Office (ISO), a catastrophe loss is defined as a single unpredictable incident or series of closely related incidents that result in $25,000,000 or more in U.S. industry-wide direct insured losses to property and that affect a significant number of policyholders and insurers (ISO catastrophe). In addition to ISO catastrophes, we also include as catastrophes those events (non-ISO catastrophes), which may include losses, that we believe are, or will be, material to our operations, either in amount or in number of claims made.
Our program provides reinsurance protection for catastrophes including hurricanes, tropical storms, and tornadoes. These reinsurance agreements are part of our catastrophe management strategy, which is intended to provide our shareholders an acceptable return on the risks assumed in our property business, and to reduce variability of earnings, while providing protection to our policyholders.
73
UNITED INSURANCE HOLDINGS CORP. Notes to Consolidated Financial Statements December 31, 2016 |
During the second quarter of 2016, we placed our reinsurance program for the 2016 treaty year beginning June 1, 2016 and ending on May 31, 2017. The agreements incorporate the mandatory coverage required by and placed with the Florida Hurricane Catastrophe Fund (FHCF). The FHCF is a Florida state-sponsored trust fund that provides reimbursement in Florida against storms that the National Hurricane Center designates as hurricanes. The private agreements provide coverage against severe weather events such as hurricanes, tropical storms and tornadoes.
For the treaty year beginning June 1, 2016 and ending on May 31, 2017, UPC Insurance has obtained reinsurance protection of $1,515,197,000 excess $10,000,000, providing sufficient protection for a 1-in-100 year hurricane event and a second 1-in-50 year hurricane event in the same year as calculated using a blended model result predominately based on our licensed modeling software, AIR model version 17, using long-term event rates excluding demand surge. For a single first event hurricane or tropical storm, UPC Insurance will pay, or “retain”, 100% of losses up to $30,000,000 including the $20,000,000 layer funded by UPC Re. The catastrophe excess of loss reinsurance program provides our insurance subsidiaries 100% coverage for all losses in excess of $10,000,000 up to $1,415,197,000 for a first event and $1,515,197,000 for any number of subsequent events until all limit is exhausted.
For the 2016 contract year, UPC Insurance has elected a 45% participation rate with the FHCF and purchased replacement coverage from private insurers for the remaining 45%. Of the $1,515,197,000 in excess of $10,000,000, we estimate the mandatory FHCF layer will provide approximately $354,015,000 (45% of $786,700,000) of aggregate coverage for losses in excess of $246,002,000. The private market FHCF replacement coverage provides another $346,182,000 of aggregate protection (45% of $769,293,000) in excess of $244,206,000 layer for Florida only on a fully collateralized basis that also inures to the benefit of all other private reinsurance coverage.
In addition to the FHCF and FHCF replacement coverage, we purchase $685,000,000 of aggregate catastrophe reinsurance coverage in excess of $10,000,000 from 55 unaffiliated private reinsurers and catastrophe bond investors who either carry A.M. Best financial strength ratings of A- or higher, or have fully collateralized their maximum potential obligations in dedicated trusts for the benefit of UPC Insurance. Our 2016 agreements with these private reinsurers structure coverage into 5 layers, with a cascading feature such that all layers attach at $10,000,000. If the aggregate limit of the preceding layer is exhausted, the next layer drops down (cascades) in its place. Additionally, any unused layer protection drops down for subsequent events until exhausted ensuring there are no potential gaps in coverage up to the $1,415,197,000 first event program exhaustion point. The Company also secured up to $100,000,000 of limit that can be utilized at our option for the second and subsequent events at an additional cost, but the Company is under no obligation to activate this layer.
The total cost of the 2016-17 catastrophe reinsurance program is estimated to be $191,500,000.
Effective December 1, 2016, UPC Insurance, through our wholly owned insurance subsidiary UPC entered into a quota share reinsurance agreement (the "quota share agreement") with private reinsurers. Also, effective January 1, 2017, we renewed our aggregate excess of loss reinsurance agreement (the "aggregate excess of loss agreement," and, together with the quota share agreement, the "agreements") with private reinsurers. These agreements provide coverage for in-force, new and renewal business. The quota share agreement provides coverage only for UPC, while the aggregate excess of loss agreement provides coverage for UPC, IIC, and FSIC. These new reinsurance programs are designed to work in conjunction with our catastrophe excess of loss reinsurance program to provide us broad risk transfer protection and to lessen financial volatility.
The quota share agreement includes a cession rate of 20% (15% on single year and 5% over a two-year period) for all subject business. The quota share agreement provides coverage for all catastrophe perils (e.g. hurricanes, tropical storms, tropical depressions and earthquakes), other-catastrophe perils (e.g. weather-related perils other than hurricanes, tropical storms, tropical depressions and earthquakes), and attritional losses. For other-catastrophe perils, the quota share agreement provides coverage alongside the aggregate excess of loss program described herein, after our retention has been satisfied. For catastrophe perils, the quota share agreement provides ground-up protection that effectively reduces our retention for catastrophe losses. Quota share agreement reinsurers' participation in paying attritional losses is subject to an attritional loss ratio cap.
The aggregate excess of loss agreement provides coverage only for other-catastrophe perils. Under this agreement, for other-catastrophe losses in excess of $1,000,000 but less than $15,000,000, UPC will retain, in the aggregate, 100% of those losses up to $30,000,000. The reinsurers will then be liable for all losses excess of $30,000,000 in the aggregate not to exceed
74
UNITED INSURANCE HOLDINGS CORP. Notes to Consolidated Financial Statements December 31, 2016 |
an annual aggregate limit of $30,000,000. This program was placed at 85% rather than 100% because of the quota share agreement reinsurers' participation in paying other-catastrophe losses after the $30,000,000 retention.
We amortize our prepaid reinsurance premiums over the annual agreement period, and we record that amortization in ceded premiums earned on our Consolidated Statements of Comprehensive Income. The table below summarizes the amounts of our ceded premiums written under the various types of agreements, as well as the amortization of prepaid reinsurance premiums:
Year Ended December 31, | |||||||||||
2016 | 2015 | 2014 | |||||||||
Excess-of-loss | $ | (235,236 | ) | $ | (163,106 | ) | $ | (125,638 | ) | ||
Equipment & identity theft | (8,313 | ) | (6,169 | ) | (4,370 | ) | |||||
Novation of Auto Policies (1) | (2,396 | ) | — | — | |||||||
Flood | (16,395 | ) | (14,533 | ) | (14,396 | ) | |||||
Ceded premiums written | $ | (262,340 | ) | $ | (183,808 | ) | $ | (144,404 | ) | ||
Increase in ceded unearned premiums | 52,442 | 15,551 | 8,559 | ||||||||
Ceded premiums earned | $ | (209,898 | ) | $ | (168,257 | ) | $ | (135,845 | ) | ||
(1) Reflects ceding of auto policy premiums to Maidstone Insurance Company as part of the settlement of the novation agreement entered into at the closing of the IIC transaction.
Current year catastrophe losses by the event magnitude are shown in the following table.
Number of Events | Incurred Loss and LAE (1) | Combined Ratio Impact | ||||||||
December 31, 2016 | ||||||||||
Current period catastrophe losses incurred | ||||||||||
Greater than $5 million (2) | 1 | $ | 29,987 | 6.5 | % | |||||
$1 million to $5 million (3) | 12 | 21,506 | 4.7 | % | ||||||
Less than $1 million (4) | 6 | 4,349 | 1.0 | % | ||||||
Total | 19 | $ | 55,842 | 12.2 | % | |||||
December 31, 2015 | ||||||||||
Current period catastrophe losses incurred | ||||||||||
$5 million to $10 million (5) | 2 | $ | 11,523 | 3.4 | % | |||||
$1 million to $5 million (6) | 7 | 14,699 | 4.4 | % | ||||||
Less than $1 million (7) | 5 | 2,343 | 0.7 | % | ||||||
Total | 14 | $ | 28,565 | 8.5 | % | |||||
December 31, 2014 | ||||||||||
Current period catastrophe losses incurred | ||||||||||
Less than $1 million (8) | 3 | $ | 829 | 0.3 | % | |||||
Total | 3 | $ | 829 | 0.3 | % | |||||
(1) Incurred loss and LAE is equal to losses and LAE paid plus the change in case and incurred but not reported reserves. Shown net of losses ceded to reinsurers.
(2) Reflects losses from Hurricane Matthew in 2016.
(3) Reflects losses from Hurricane Hermine, Winter Storm Olympia, Tropical Storm Colin, tornadoes, wind storms, hail storms, and flooding in 2016.
(4) Reflects losses from Tropical Storm Julia, tornadoes, wind storms, hail storms, and flooding in 2016.
(5) | Reflects losses from winter storms in 2015. |
(6) | Reflects losses from winter storms, hail storms and wind storms in 2015. |
75
UNITED INSURANCE HOLDINGS CORP. Notes to Consolidated Financial Statements December 31, 2016 |
(7) | Reflects losses from winter storms, hail storms, Texas flooding, Hurricane Anna and Tropical Storm Bill in 2015. |
(8) | Reflects losses from the Richland hailstorm, Hurricane Arthur and the Revere Tornado in 2014. |
Reinsurance recoverable at the balance sheet dates consists of the following:
December 31, | |||||||
2016 | 2015 | ||||||
Reinsurance recoverable on unpaid losses and LAE | $ | 18,724 | $ | 2,114 | |||
Reinsurance recoverable on paid losses and LAE | 5,304 | 847 | |||||
Reinsurance recoverable | $ | 24,028 | $ | 2,961 | |||
During the years ended December 31, 2016 and 2015, we realized recoveries under our reinsurance agreements totaling $18,412,000 and $10,282,000, respectively. These recoveries were primarily related to losses from Hurricane Matthew, Hurricane Hermine, Winter Storm Olympia, Tropical Storm Colin, tornadoes, thunderstorms, hail storms, and flooding in 2016.
We write flood insurance under an agreement with the National Flood Insurance Program. We cede 100% of the premiums written and the related risk of loss to the federal government. We earn commissions for the issuance of flood policies based upon a fixed percentage of net written premiums and the processing of flood claims based upon a fixed percentage of incurred losses, and we can earn additional commissions by meeting certain growth targets for the number of in-force policies. We recognized commission revenue from our flood program of $1,056,000, $959,000, and $1,078,000 for the years ended December 31, 2016, 2015, and 2014, respectively.
The following table depicts written premiums, earned premiums and losses, showing the effects that our reinsurance transactions have on these components of our Consolidated Statements of Comprehensive Income:
Year ended December 31, | |||||||||||
2016 | 2015 | 2014 | |||||||||
Premium written: | |||||||||||
Direct | $ | 708,252 | $ | 548,916 | $ | 417,769 | |||||
Assumed | (96 | ) | 20,820 | 18,984 | |||||||
Ceded | (262,340 | ) | (183,808 | ) | (144,404 | ) | |||||
Net premium written | $ | 445,816 | $ | 385,928 | $ | 292,349 | |||||
Change in unearned premiums: | |||||||||||
Direct | $ | (57,759 | ) | $ | (65,300 | ) | $ | (38,995 | ) | ||
Assumed | 16,432 | (221 | ) | 2,937 | |||||||
Ceded | 52,442 | 15,551 | 8,559 | ||||||||
Net decrease (increase) | $ | 11,115 | $ | (49,970 | ) | $ | (27,499 | ) | |||
Premiums earned: | |||||||||||
Direct | $ | 650,493 | $ | 483,616 | $ | 378,774 | |||||
Assumed | 16,336 | 20,599 | 21,921 | ||||||||
Ceded | (209,898 | ) | (168,257 | ) | (135,845 | ) | |||||
Net premiums earned | $ | 456,931 | $ | 335,958 | $ | 264,850 | |||||
Losses and LAE incurred: | |||||||||||
Direct | $ | 335,542 | $ | 188,270 | $ | 111,820 | |||||
Assumed | 3,747 | 7,861 | 8,672 | ||||||||
Ceded | (40,936 | ) | (13,023 | ) | (2,415 | ) | |||||
Net losses and LAE incurred | $ | 298,353 | $ | 183,108 | $ | 118,077 | |||||
76
UNITED INSURANCE HOLDINGS CORP. Notes to Consolidated Financial Statements December 31, 2016 |
Ceded losses incurred increased by $27,913,000 during the year ended December 31, 2016, compared to the year ended December 31, 2015, primarily because we paid more ceded losses in 2016 than in 2015. A portion of the losses we incurred in 2016 and 2015 exceeded our retained loss thresholds, therefore we received reinsurance recoveries for some of the losses that we incurred on these storms. The losses we incurred in 2014 related to storms that occurred in the same year but did not exceed our retained loss thresholds.
The following table highlights the effects that our reinsurance transactions have on unpaid losses and loss adjustment expenses and unearned premiums in our Consolidated Balance Sheets:
December 31, | |||||||||||
2016 | 2015 | 2014 | |||||||||
Unpaid losses and LAE: | |||||||||||
Direct | $ | 138,345 | $ | 72,373 | $ | 49,734 | |||||
Assumed | 2,510 | 4,419 | 4,702 | ||||||||
Gross unpaid losses and LAE | 140,855 | 76,792 | 54,436 | ||||||||
Ceded | (18,724 | ) | (2,114 | ) | (1,252 | ) | |||||
Net unpaid losses and LAE | $ | 122,131 | $ | 74,678 | $ | 53,184 | |||||
Unearned premiums: | |||||||||||
Direct | $ | 371,149 | $ | 287,148 | $ | 212,201 | |||||
Assumed | 1,074 | 17,506 | 17,285 | ||||||||
Gross unearned premiums | 372,223 | 304,654 | 229,486 | ||||||||
Ceded | (132,564 | ) | (79,400 | ) | (63,827 | ) | |||||
Net unearned premiums | $ | 239,659 | $ | 225,254 | $ | 165,659 | |||||
10) LIABILITY FOR UNPAID LOSSES AND LOSS ADJUSTMENT EXPENSE
We generally use the term loss(es) to collectively refer to both loss and loss adjusting expenses. We establish reserves for both reported and unreported unpaid losses that have occurred at or before the balance sheet date for amounts we estimate we will be required to pay in the future. Our policy is to establish these loss reserves after considering all information known to us at each reporting period. At any given point in time, our loss reserve represents our best estimate of the ultimate settlement and administration cost of our insured claims incurred and unpaid. Since the process of estimating loss reserves requires significant judgment due to a number of variables, such as fluctuations in inflation, judicial decisions, legislative changes and changes in claims handling procedures, our ultimate liability will likely differ from these estimates. We revise our reserve for unpaid losses as additional information becomes available, and reflect adjustments, if any, in our earnings in the periods in which we determine the adjustments are necessary.
General Discussion of the Loss Reserving Process
Reserves for unpaid losses fall into two categories: case reserves and reserves for claims incurred but not reported.
• | Case reserves - When a claim is exported, we establish an automatic minimum case reserve for that claim type that represents our initial estimate of the losses that will ultimately be paid on the reported claim. Our initial estimate for each claim is based upon averages of loss payments for our prior closed claims made for that claim type. Then, our claims personnel perform an evaluation of the type of claim involved, the circumstances surrounding each claim and the policy provisions relating to the loss and adjust the reserve as necessary. As claims mature, we increase or decrease the reserve estimates as deemed necessary by our claims department based upon additional information we receive regarding the loss, the results of on-site reviews and any other information we gather while reviewing the claims. |
• | Reserves for losses incurred but not reported (IBNR reserves) - Our IBNR reserves include true IBNR reserves plus “bulk” reserves. Bulk reserves represent additional amounts that cannot be allocated to particular claims, but which are necessary to estimate ultimate losses on reported and unreported claims. We estimate our IBNR reserves by projecting |
77
UNITED INSURANCE HOLDINGS CORP. Notes to Consolidated Financial Statements December 31, 2016 |
the ultimate losses using the methods discussed below and then deducting actual loss payments and case reserves from the projected ultimate losses. We review and adjust our IBNR reserves on a quarterly basis based on information available to us at the balance sheet date.
When we establish our reserves, we analyze various factors such as our historical loss experience and that of the insurance industry, claims frequency and severity, our business mix, our claims processing procedures, legislative enactments, judicial decisions and legal developments in imposition of damages, and general economic conditions, including inflation. A change in any of these factors from the assumptions implicit in our estimates will cause our ultimate loss experience to be better or worse than indicated by our reserves, and the difference could be material. Due to the interaction of the aforementioned factors, there is no precise method for evaluating the impact of any one specific factor in isolation, and an element of judgment is ultimately required. Due to the uncertain nature of any projection of the future, the ultimate amount we will pay for losses will be different from the reserves we record. However, in our judgment, we employ techniques and assumptions that are appropriate, and the resulting reserve estimates are reasonable, given the information available at the balance sheet date.
We determine our ultimate losses by using multiple actuarial methods to determine an actuarial estimate within a relevant range of indications that we calculate using generally accepted actuarial techniques. Our selection of the actuarial estimate is influenced by the analysis of our historical loss and claim experience. For each accident year, we estimate the ultimate incurred losses for both reported and unreported claims. In establishing this estimate, we review the results of various actuarial methods discussed below.
Estimation of the Reserves for Unpaid Losses and Allocated Loss Adjustment Expenses
We calculate our estimate of ultimate losses by using the following actuarial methods. We separately calculate the methods using paid loss data and incurred loss data. In the versions of these methods based on incurred loss data, the incurred losses are defined as paid losses plus case reserves. For this discussion of our loss reserving process, the word “segment” refers to a subgrouping of our claims data, such as by geographic area and/or by particular line of business; it does not refer to operating segments.
• | Incurred Development Method - The incurred development method is based upon the assumption that the relative change in a given year’s incurred loss estimates from one evaluation point to the next is similar to the relative change in prior years’ reported loss estimates at similar evaluation points. In utilizing this method, actual annual historical incurred loss data is evaluated. Successive years can be arranged to form a triangle of data. Loss development factors (LDFs) are calculated to measure the change in cumulative incurred costs from one evaluation point to the next. These historical LDFs and comparable industry benchmark factors form the basis for selecting the LDFs used in projecting the current valuation of losses to an ultimate basis. This method’s implicit assumption is that the relative adequacy of case reserves has been consistent over time, and that there have been no material changes in the rate at which claims have been reported. The paid development method is similar to the incurred development method. While the paid development methods have the disadvantage of not recognizing the information by current case reserves, it has the advantage of avoiding potential distortions in the data due to changes in case reserving methodology. The paid development method’s implicit assumption is that the rate of payment of claims has been relatively consistent over time. |
• | Expected Loss Method - In the expected loss method, ultimate loss projections are based upon some prior measure of the anticipated losses, usually relative to some measure of exposure (e.g., earned house years). An expected loss cost is applied to the measure of exposure to determine estimated ultimate losses for each year. Actual losses are not considered in this calculation. This method has the advantage of stability over time, because the ultimate loss estimates do not change unless the exposures or loss costs change. However, this advantage of stability is offset by a lack of responsiveness, since this method does not consider actual loss experience as it emerges. This method is based on the assumption that the loss cost per unit of exposure is a good indication of ultimate losses. It can be entirely dependent on pricing assumptions (e.g., historical experience adjusted for loss trend). |
• | Bornhuetter-Ferguson Method - The incurred Bornhuetter-Ferguson (B-F) method is essentially a blend of two other methods. The first method is the loss development method whereby actual incurred losses are multiplied by an expected LDF. For slow reporting coverages, the loss development method can lead to erratic and unreliable projections because a relatively small swing in early reporting can result in a large swing in ultimate projections. The second method is the expected loss method whereby the IBNR estimate equals the difference between a predetermined estimate of expected losses and actual incurred losses. The incurred B-F method combines these two methods by |
78
UNITED INSURANCE HOLDINGS CORP. Notes to Consolidated Financial Statements December 31, 2016 |
setting ultimate losses equal to actual incurred losses plus expected unreported losses. As an experience year matures and expected unreported losses become smaller, the initial expected loss assumption becomes gradually less important. Two parameters are needed to apply the B-F method: the initial expected loss cost and the expected reporting pattern (LDFs). This method is often used for long-tail lines and in situations where the incurred loss experience is relatively immature or lacks sufficient credibility for the application of other methods. The paid B-F method is analogous to the incurred B-F method using paid losses and development patterns in place of incurred losses and patterns.
• | Paid-to-Paid Development Method - In addition to the aforementioned methods, we also rely upon the paid-to-paid development method to project ultimate unallocated loss adjustment expense (ULAE). Ratios of paid ULAE to paid loss and allocated loss adjustment expense (ALAE) are compiled by calendar year and a paid-to-paid ratio selection is made. The selected ratio is applied to the estimated IBNR amounts and one half of this ratio is applied to case reserves. This method is derived from rule of thumb that half of ULAE is incurred when a claim is opened and the other half is incurred over the remaining life of the claim. |
Reliance and Selection of Methods
The various methods we use have strengths and weaknesses that depend upon the circumstances of the segment and the age of the claims experience we analyze. The nature of our book of business allows us to place substantial, but not exclusive, reliance on the loss development methods, the selected LDFs, represent the most critical aspect of our loss reserving process. We use the same set of LDFs in the methods during our loss reserving process that we also use to calculate the premium necessary to pay expected ultimate losses.
Reasonably-Likely Changes in Variables
As previously noted, we evaluate several factors when exercising our judgment in the selection of the loss development factors that ultimately drive the determination of our loss reserves. The process of establishing our reserves is complex and necessarily imprecise, as it involves using judgment that is affected by many variables. We believe a reasonably-likely change in almost any of these aforementioned factors could have an impact on our reported results, financial condition and liquidity. However, we do not believe any reasonably-likely changes in the frequency or severity of claims would have a material impact on us.
On an annual basis, our consulting actuary issues a statement of actuarial opinion that documents the actuary’s evaluation of the adequacy of our unpaid loss obligations under the terms of our policies. We review the analysis underlying the actuary’s opinion and compare the projected ultimate losses per the actuary’s analysis to our own projection of ultimate losses to ensure that our reserve for unpaid losses recorded at each annual balance sheet date is based upon our analysis of all internal and external factors related to known and unknown claims against us and to ensure our reserve is within guidelines promulgated by the National Association of Insurance Commissioners (NAIC).
We maintain an in-house claims staff that monitors and directs all aspects of our claims process. We assign the fieldwork to our wholly-owned claims subsidiary, or to third-party claims adjusting companies, none of whom have the authority to settle or pay any claims on our behalf. The third-party claims adjusting companies conduct inspection of the damaged property and prepare initial estimates. We review the inspection reports and initial estimates to determine the amounts to be paid to the policyholder in accordance with the terms and conditions of the policy in effect at the time that the policyholder incurs the loss. We maintain strategic relationships with multiple claims adjusting companies that we can engage should we need additional non-catastrophe claims servicing capacity. We believe the combination of our internal resources and relationships with external claims servicing companies provide an adequate level of claims servicing in the event catastrophes affect our policyholders.
The following is information about incurred claims development and paid claims development as of December 31, 2016, net of reinsurance, as well as cumulative claim frequency and the total of IBNR liability plus expected development on reported claims included within the net incurred claims amounts. The incurred claims development and paid claims development data reflect the acquisitions of FSIC and IIC in February 2015 and April 2016, respectively, on a retrospective basis (includes FSIC and IIC data for years prior to our acquisition of the insurance affiliates). The information about incurred claims development and paid claims development for the years ended December 31, 2007, to 2015 is presented as supplementary information.
79
UNITED INSURANCE HOLDINGS CORP. Notes to Consolidated Financial Statements December 31, 2016 |
Homeowners' Insurance
$ In thousands (except number of reported claims)
Incurred Claims and Allocated Claim Adjustment Expenses, Net of Reinsurance | As of December 31, 2016 | |||||||||||||||||||||||||||||||||
Total of IBNR Liabilities Plus Expected Development on Reported Claims | Cumulative Number of Reported Claims | |||||||||||||||||||||||||||||||||
For the Years Ended December 31, | ||||||||||||||||||||||||||||||||||
Unaudited | ||||||||||||||||||||||||||||||||||
Accident Year | 2007 | 2008 | 2009 | 2010 | 2011 | 2012 | 2013 | 2014 | 2015 | 2016 | ||||||||||||||||||||||||
2007 | $ | 28,232 | $ | 25,780 | $ | 24,828 | $ | 24,852 | $ | 24,641 | $ | 24,563 | $ | 24,665 | $ | 24,725 | $ | 24,596 | $ | 24,601 | $ | — | 2,332,000 | |||||||||||
2008 | — | 30,073 | 28,126 | 27,174 | 27,161 | 27,358 | 27,597 | 27,564 | 27,468 | 27,453 | — | 3,170,000 | ||||||||||||||||||||||
2009 | — | — | 46,952 | 46,089 | 45,515 | 45,583 | 45,316 | 45,116 | 44,959 | 44,996 | — | 4,044,000 | ||||||||||||||||||||||
2010 | — | — | — | 51,144 | 51,292 | 51,862 | 52,239 | 51,685 | 51,841 | 51,674 | 3 | 4,839,000 | ||||||||||||||||||||||
2011 | — | — | — | — | 53,878 | 56,840 | 57,670 | 58,047 | 59,517 | 60,215 | 62 | 5,913,000 | ||||||||||||||||||||||
2012 | — | — | — | — | — | 65,112 | 69,438 | 68,923 | 68,388 | 69,000 | 167 | 10,649,000 | ||||||||||||||||||||||
2013 | — | — | — | — | — | — | 98,461 | 94,755 | 93,041 | 92,702 | 677 | 7,809,000 | ||||||||||||||||||||||
2014 | — | — | — | — | — | — | — | 130,090 | 130,488 | 131,402 | 2,025 | 10,857,000 | ||||||||||||||||||||||
2015 | — | — | — | — | — | — | — | — | 181,609 | 195,902 | 6,784 | 17,918,000 | ||||||||||||||||||||||
2016 | — | — | — | — | — | — | — | — | — | 249,276 | 34,483 | 28,430,000 | ||||||||||||||||||||||
Total | $ | 947,221 | ||||||||||||||||||||||||||||||||
Accident Year | Cumulative Paid Claims and Allocated Claim Adjustment Expenses, Net of Reinsurance | |||||||||||||||||||||||||||||
For the Years Ended December 31, | ||||||||||||||||||||||||||||||
Unaudited | ||||||||||||||||||||||||||||||
2007 | 2008 | 2009 | 2010 | 2011 | 2012 | 2013 | 2014 | 2015 | 2016 | |||||||||||||||||||||
2007 | $ | 16,713 | $ | 22,017 | $ | 23,131 | $ | 24,155 | $ | 24,277 | $ | 24,382 | $ | 24,439 | $ | 24,483 | $ | 24,596 | $ | 24,601 | ||||||||||
2008 | — | 17,915 | 23,806 | 25,264 | 26,360 | 27,044 | 27,358 | 27,390 | 27,445 | 27,451 | ||||||||||||||||||||
2009 | — | — | 31,525 | 41,134 | 43,149 | 44,114 | 44,413 | 44,737 | 44,898 | 44,966 | ||||||||||||||||||||
2010 | — | — | — | 32,993 | 43,932 | 46,711 | 49,256 | 50,215 | 50,704 | 51,163 | ||||||||||||||||||||
2011 | — | — | — | — | 36,419 | 48,558 | 52,412 | 55,532 | 58,069 | 59,461 | ||||||||||||||||||||
2012 | — | — | — | — | — | 42,699 | 60,640 | 64,675 | 66,739 | 68,337 | ||||||||||||||||||||
2013 | — | — | — | — | — | — | 63,732 | 85,346 | 89,068 | 90,627 | ||||||||||||||||||||
2014 | — | — | — | — | — | — | — | 88,375 | 119,612 | 125,951 | ||||||||||||||||||||
2015 | — | — | — | — | — | — | — | — | 123,888 | 174,993 | ||||||||||||||||||||
2016 | — | — | — | — | — | — | — | — | — | 170,527 | ||||||||||||||||||||
Total | $ | 838,077 | ||||||||||||||||||||||||||||
All outstanding liabilities before 2007, net of reinsurance | 176 | |||||||||||||||||||||||||||||
Liabilities for claims and claim adjustment expenses, net of reinsurance | $ | 109,320 | ||||||||||||||||||||||||||||
The following is supplementary information about average historical claims duration as of December 31, 2016.
Average Annual Percentage Payout of Incurred Claims by Age, Net of Reinsurance | ||||||||||||||||||||
Unaudited | ||||||||||||||||||||
Years | 1 | 2 | 3 | 4 | 5 | 6 | 7 | 8 | 9 | 10 | ||||||||||
65.4 | % | 22.4 | % | 4.7 | % | 3.6 | % | 2.0 | % | 1.1 | % | 0.4 | % | 0.2 | % | 0.2 | % | — | % | |
80
UNITED INSURANCE HOLDINGS CORP. Notes to Consolidated Financial Statements December 31, 2016 |
Remaining Product Lines
$ In thousands (except number of reported claims)
Incurred Claims and Allocated Claim Adjustment Expenses, Net of Reinsurance | As of December 31, 2016 | |||||||||||||||||||||||||||||||||
Total of IBNR Liabilities Plus Expected Development on Reported Claims | Cumulative Number of Reported Claims | |||||||||||||||||||||||||||||||||
For the Years Ended December 31, | ||||||||||||||||||||||||||||||||||
Unaudited | ||||||||||||||||||||||||||||||||||
Accident Year | 2007 | 2008 | 2009 | 2010 | 2011 | 2012 | 2013 | 2014 | 2015 | 2016 | ||||||||||||||||||||||||
2007 | $ | 11,491 | $ | 9,605 | $ | 8,313 | $ | 7,825 | $ | 7,553 | $ | 7,554 | $ | 7,504 | $ | 7,464 | $ | 7,464 | $ | 7,507 | $ | — | 1,191,000 | |||||||||||
2008 | — | 13,504 | 12,871 | 12,324 | 11,833 | 11,877 | 12,661 | 12,761 | 12,885 | 12,884 | — | 1,170,000 | ||||||||||||||||||||||
2009 | — | — | 10,610 | 10,135 | 10,093 | 10,026 | 9,902 | 9,844 | 9,837 | 10,009 | — | 1,097,000 | ||||||||||||||||||||||
2010 | — | — | — | 9,911 | 11,042 | 10,733 | 11,126 | 11,020 | 11,105 | 11,072 | — | 1,160,000 | ||||||||||||||||||||||
2011 | — | — | — | — | 11,126 | 11,022 | 10,896 | 10,630 | 10,575 | 10,740 | — | 1,217,000 | ||||||||||||||||||||||
2012 | — | — | — | — | — | 10,760 | 9,651 | 9,350 | 9,412 | 9,147 | 11 | 1,061,000 | ||||||||||||||||||||||
2013 | — | — | — | — | — | — | 6,657 | 5,817 | 5,401 | 5,736 | 5 | 553,000 | ||||||||||||||||||||||
2014 | — | — | — | — | — | — | — | 9,073 | 7,927 | 8,016 | 76 | 682,000 | ||||||||||||||||||||||
2015 | — | — | — | — | — | — | — | — | 19,669 | 19,723 | 581 | 1,384,000 | ||||||||||||||||||||||
2016 | — | — | — | — | — | — | — | — | — | 17,053 | 1,952 | 46,000 | ||||||||||||||||||||||
Total | $ | 111,887 | ||||||||||||||||||||||||||||||||
Cumulative Paid Claims and Allocated Claim Adjustment Expenses, Net of Reinsurance | ||||||||||||||||||||||||||||||
For the Years Ended December 31, | ||||||||||||||||||||||||||||||
Unaudited | ||||||||||||||||||||||||||||||
Accident Year | 2007 | 2008 | 2009 | 2010 | 2011 | 2012 | 2013 | 2014 | 2015 | 2016 | ||||||||||||||||||||
2007 | $ | 3,974 | $ | 5,885 | $ | 6,627 | $ | 7,001 | $ | 7,127 | $ | 7,303 | $ | 7,442 | $ | 7,449 | $ | 7,452 | $ | 7,507 | ||||||||||
2008 | — | 6,169 | 9,309 | 10,647 | 11,104 | 11,404 | 12,360 | 12,403 | 12,557 | 12,884 | ||||||||||||||||||||
2009 | — | — | 4,807 | 7,507 | 8,470 | 9,062 | 9,471 | 9,570 | 9,688 | 10,009 | ||||||||||||||||||||
2010 | — | — | — | 4,346 | 8,128 | 9,036 | 10,182 | 10,242 | 10,327 | 11,073 | ||||||||||||||||||||
2011 | — | — | — | — | 4,587 | 8,013 | 9,444 | 9,837 | 10,128 | 10,740 | ||||||||||||||||||||
2012 | — | — | — | — | — | 5,112 | 7,631 | 8,242 | 8,626 | 9,124 | ||||||||||||||||||||
2013 | — | — | — | — | — | — | 2,925 | 4,496 | 4,811 | 5,566 | ||||||||||||||||||||
2014 | — | — | — | — | — | — | — | 4,008 | 6,237 | 7,868 | ||||||||||||||||||||
2015 | — | — | — | — | — | — | — | — | 11,104 | 18,129 | ||||||||||||||||||||
2016 | — | — | — | — | — | — | — | — | — | 12,432 | ||||||||||||||||||||
Total | $ | 105,332 | ||||||||||||||||||||||||||||
All outstanding liabilities before 2007, net of reinsurance | 42 | |||||||||||||||||||||||||||||
Liabilities for claims and claim adjustment expenses, net of reinsurance | $ | 6,597 | ||||||||||||||||||||||||||||
The following is supplementary information about average historical claims duration as of December 31, 2016.
Average Annual Percentage Payout of Incurred Claims by Age, Net of Reinsurance | ||||||||||||||||||||
Unaudited | ||||||||||||||||||||
Years | 1 | 2 | 3 | 4 | 5 | 6 | 7 | 8 | 9 | 10 | ||||||||||
48.3 | % | 25.7 | % | 7.2 | % | 6.5 | % | 2.8 | % | 3.5 | % | 2.5 | % | 1.5 | % | 1.3 | % | 0.7 | % | |
The reconciliation of the net incurred and paid claims development tables to the liability for claims and claim adjustment expenses in the consolidated statement of financial position is as follows.
81
UNITED INSURANCE HOLDINGS CORP. Notes to Consolidated Financial Statements December 31, 2016 |
December 31, 2016 | |||
Net outstanding liabilities | |||
Homeowners' Only | $ | 109,320 | |
All other lines of business | 6,597 | ||
Liabilities for unpaid claims and claim adjustment expenses, net of reinsurance | $ | 115,917 | |
Reinsurance recoverable on unpaid claims | |||
Homeowners' Only | $ | 14,223 | |
All other lines of business | 4,501 | ||
Total reinsurance recoverable on unpaid claims | $ | 18,724 | |
Unallocated claims adjustment expenses | 6,214 | ||
Total gross liability for unpaid claims and claims adjustment expense | $ | 140,855 | |
The table below shows the analysis of our reserve for unpaid losses for each of our last three fiscal years on a GAAP basis:
2016 | 2015 | 2014 | |||||||||
Balance at January 1 | $ | 76,792 | $ | 54,436 | $ | 47,451 | |||||
Acquisition of IIC reserves | 22,576 | — | — | ||||||||
Acquisition of FSIC reserves | — | 2,390 | — | ||||||||
Less: reinsurance recoverable on unpaid losses | 2,114 | 1,252 | 1,957 | ||||||||
Net balance at January 1 | $ | 97,254 | $ | 55,574 | $ | 45,494 | |||||
Incurred related to: | |||||||||||
Current year | 281,365 | 185,476 | 122,114 | ||||||||
Prior years | 16,988 | (2,368 | ) | (4,037 | ) | ||||||
Total incurred | $ | 298,353 | $ | 183,108 | $ | 118,077 | |||||
Paid related to: | |||||||||||
Current year | 210,970 | 127,306 | 83,967 | ||||||||
Prior years | 62,506 | 36,698 | 26,420 | ||||||||
Total paid | $ | 273,476 | $ | 164,004 | $ | 110,387 | |||||
Net balance at December 31 | $ | 122,131 | $ | 74,678 | $ | 53,184 | |||||
Plus: reinsurance recoverable on unpaid losses | 18,724 | 2,114 | 1,252 | ||||||||
Balance at December 31 | $ | 140,855 | $ | 76,792 | $ | 54,436 | |||||
Composition of reserve for unpaid losses and LAE: | |||||||||||
Case reserves | $ | 83,447 | $ | 45,502 | $ | 29,726 | |||||
IBNR reserves | 57,408 | 31,290 | 24,710 | ||||||||
Balance at December 31 | $ | 140,855 | $ | 76,792 | $ | 54,436 | |||||
Based upon our internal analysis and our review of the statement of actuarial opinion provided by our actuarial consultants, we believe that the reserve for unpaid losses reasonably represents the amount necessary to pay all claims and related expenses which may arise from incidents that have occurred as of the balance sheet date.
82
UNITED INSURANCE HOLDINGS CORP. Notes to Consolidated Financial Statements December 31, 2016 |
As reflected by our losses incurred related to prior years, the favorable development experienced in 2015 was primarily the result of losses related to the 2014 and 2013 accident years coming in better than expected. The favorable development experienced in 2014 was primarily the result of losses related to the 2013 and 2012 accident years coming in better than expected. During 2016, we had a reserve deficiency. Since we place substantial reliance on loss-development-based actuarial models when determining our estimate of ultimate losses, the deficiencies resulted from additional development on prior accident years which caused our ultimate losses to increase.
11) LONG-TERM DEBT
At December 31, 2016, the annual maturities of our long-term debt were as follows:
Amount | |||
2017 | $ | 9,969 | |
2018 | 1,472 | ||
2019 | 1,473 | ||
2020 | 1,473 | ||
2121 | 1,474 | ||
Thereafter | 38,314 | ||
Total debt | $ | 54,175 | |
Florida State Board of Administration Note Payable
Our long-term debt at December 31, 2016 and 2015 included a note payable to the Florida State Board of Administration (SBA Note). During the year ended December 31, 2016, we paid $1,177,000 and $219,000 of principal and interest, respectively. At December 31, 2016 and 2015, we owed $11,176,000 and $12,353,000, respectively, on the note and the interest rate was 1.56% and 2.05%, respectively.
We executed the 20-year, $20,000,000 note payable to the SBA under its Insurance Capital Build-Up Incentive Program, effective October 1, 2006. The stated rate for the SBA note is a rate equivalent to the 10-year U.S. Treasury Bond rate. We made quarterly interest-only payments for the first three years, then, as of October 1, 2009, we began making quarterly principal and interest payments.
The SBA note requires UPC to maintain surplus as regards policyholders at or above a calculated level, which was $6,007,000 at December 31, 2016. Each quarter, we monitor the surplus as regards policyholders for all of our insurance affiliates and, for various reasons, we occasionally provide additional capital to our insurance affiliates.
Our SBA note requires that UPC maintain either a 2:1 ratio of net written premium to surplus, or net writing ratio, or a 6:1 ratio of gross written premium to surplus, or gross writing ratio, to avoid additional interest penalties. The SBA note agreement defines surplus for the purpose of calculating the required ratios as the $20,000,000 of capital contributed to UPC under the agreement plus the outstanding balance of the note. Should UPC fail to exceed either a net writing ratio of 1.5:1 or a gross writing ratio of 4.5:1, UPC's interest rate will increase by 450 basis points above the 10-year Constant Maturity Treasury rate which was 2.45% at the end of December 2016. Any other writing ratio deficiencies result in an interest rate penalty of 25 basis points above the stated rate of the note, which was 1.56% at December 31, 2016. Our SBA note further provides that the SBA may, among other things, declare its loan immediately due and payable for all defaults existing under the SBA note; however, any payment is subject to approval by the insurance regulatory authority. At December 31, 2016, we were in compliance with the covenants as specified in the SBA note.
Interboro, LLC Promissory Note Payable
On April 29, 2016, we issued an $8,550,000 promissory note to Interboro, LLC, the former parent company of IIC, as part of the purchase price paid to acquire our newest insurance affiliate. The note will mature in 18 months after the closing of the transaction and bears interest at an annual rate of 6% which is paid in full at maturity. In accordance with the stock purchase
83
UNITED INSURANCE HOLDINGS CORP. Notes to Consolidated Financial Statements December 31, 2016 |
agreement, we have the right to reduce the amount of the outstanding principal by the amount of all or part of any loss relating to a claim for indemnification to which we may be entitled under the stock purchase agreement.
In the event of default, Interboro, LLC, at its option, may declare the loan immediately due and payable.
BB&T Term Note Payable
On May 26, 2016, we issued a $5,200,000, 15-year term note payable to BB&T (the BB&T note) with the intent to use the funds to purchase, renovate, furnish and equip our home office. The note bears interest at 1.65% in excess of the one month LIBOR. The interest rate resets monthly and was 2.44% at December 31, 2016. Principal and interest are payable monthly. During the year ended December 31, 2016, we paid $202,000 and $66,000 of principal and interest, respectively. At December 31, 2016, we owed $4,998,000 on the note.
The BB&T note requires that at all times while there has been no "Non-Recurring Losses", UPC will maintain a minimum Cash Flow Coverage ratio of 1.2:1. The Cash Flow Coverage ratio is defined as UPC's cash flow to borrower's debt services. Cash flow is defined as earnings before taxes, plus depreciation and amortization and interest. Debt service is defined as prior year's current maturities of long term debt plus interest expense. This ratio will be tested annually, based on UPC's audited financial statements. For the annual period only following a "Non-Recurring Loss", UPC will maintain a minimum Cash Flow Coverage ratio of 1.0:1. At December 31, 2016, UPC's Cash Flow Coverage ratio was 9.2:1, which is well above the 1.2:1 required ratio at times when there has been no "Non-Recurring Losses".
For purposes of both of the foregoing, "Non-Recurring Losses" is defined as losses from our insurance subsidiaries' operations, as determined from time to time in the bank's sole discretion. This covenant will only be effective if the Pre Non-Recurring Losses test is failed, and is only available and effective for one (1) annual test period. Thereafter, the Non-Recurring Loss Cash Flow Coverage Ratio of 1.2:1 will immediately apply.
In addition, the BB&T note requires that we establish and maintain with BB&T a noninterest bearing DDA account with a minimum balance of $500,000, and an interest bearing account with a minimum balance of $1,500,000, at all times during the term of the loan.
In the event of default, BB&T, may among other things, declare its loan immediately due and payable, require us to pledge additional collateral to the bank, and take possession of and foreclose upon our home office which has been pledged to the bank as security for the loan. At December 31, 2016, we were in compliance with the covenants as specified in the BB&T note.
Senior Notes Payable
On December 5, 2016, we issued $30,000,000 of senior notes pursuant to an Indenture (the "Indenture") dated as of December 5, 2016, by and between the Company and private investors.
The notes bear interest at a floating rate equal to the three month LIBOR plus 5.75% per annum with interest payable quarterly in arrears. The notes will mature 10 years after the issue date, have no scheduled amortization, and may be redeemed at par any time without a pre-payment penalty.
The Indenture contains customary event of default provisions. It also contains covenants that, among other things, restrict the Company's ability to incur indebtedness without first providing written notification and receiving approval from the majority of the holders of the notes, limit the Company's ability to create, incur or assume liens other than permitted liens that secure any indebtedness on any asset or property of the Company, require the Company to maintain reinsurance coverage during the life of the notes, and maintain a maximum debt to capital ratio of 20% beginning from December 31, 2017.
Debt Issuance Costs
The table below presents the rollforward of our debt issuance costs paid, in conjunction with the debts instruments described above, during the year ended December 31, 2016:
84
UNITED INSURANCE HOLDINGS CORP. Notes to Consolidated Financial Statements December 31, 2016 |
2016 | |||
Balance at January 1, | $ | — | |
Additions | 596 | ||
Amortization | (47 | ) | |
Balance at December 31, | $ | 549 | |
12) INCOME TAXES
The following table summarizes the provision for income taxes:
Year Ended December 31, | |||||||||||
2016 | 2015 | 2014 | |||||||||
Federal: | |||||||||||
Current | $ | (1,906 | ) | $ | 10,143 | $ | 21,633 | ||||
Deferred | 1,920 | 2,103 | (996 | ) | |||||||
Provision for Federal income tax expense | 14 | 12,246 | 20,637 | ||||||||
State: | |||||||||||
Current | 1,001 | 2,054 | 2,945 | ||||||||
Deferred | 290 | 202 | (185 | ) | |||||||
Provision for State income tax expense | 1,291 | 2,256 | 2,760 | ||||||||
Provision for income taxes | $ | 1,305 | $ | 14,502 | $ | 23,397 | |||||
The actual income tax expense differs from the expected income tax expense computed by applying the combined applicable effective federal and state tax rates to income before the provision for income taxes as follows:
Year Ended December 31, | |||||||||||
2016 | 2015 | 2014 | |||||||||
Expected income tax expense at federal rate | $ | 2,381 | $ | 14,671 | $ | 22,545 | |||||
State tax expense, net of federal deduction benefit | 934 | 1,023 | 1,660 | ||||||||
Dividend received deduction | (217 | ) | — | (350 | ) | ||||||
Prior period adjustment | — | 42 | — | ||||||||
Section 847 payments | — | (693 | ) | — | |||||||
Municipal tax exempt interest | (1,011 | ) | — | — | |||||||
Other, net | (782 | ) | (541 | ) | (458 | ) | |||||
Reported income tax expense | $ | 1,305 | $ | 14,502 | $ | 23,397 | |||||
Deferred income taxes, which are included in other assets or other liabilities as appropriate, reflect the net tax effects of temporary differences between the carrying amounts of assets and liabilities for financial reporting purposes and the amounts used for income tax purposes.
The table below summarizes the significant components of our net deferred tax liability:
85
UNITED INSURANCE HOLDINGS CORP. Notes to Consolidated Financial Statements December 31, 2016 |
December 31, | |||||||
2016 | 2015 | ||||||
Deferred tax assets: | |||||||
Unearned premiums | $ | 19,113 | $ | 18,182 | |||
Tax-related discount on loss reserve | 1,479 | 936 | |||||
Bad debt expense | 54 | 51 | |||||
Other-than-temporary impairment | 27 | 28 | |||||
Other | 507 | 432 | |||||
Total deferred tax assets | 21,180 | 19,629 | |||||
Deferred tax liabilities: | |||||||
Unrealized gain | (642 | ) | (1,019 | ) | |||
Deferred acquisitions costs | (19,586 | ) | (18,976 | ) | |||
Capitalized software | (1,505 | ) | (251 | ) | |||
Intangible asset | (3,371 | ) | (1,974 | ) | |||
Other | (895 | ) | (433 | ) | |||
Total deferred tax liabilities | (25,999 | ) | (22,653 | ) | |||
Net deferred tax liability | $ | (4,819 | ) | $ | (3,024 | ) | |
In assessing the net realizable value of deferred tax assets, we consider whether it is more likely than not that we will not realize some portion or all of the deferred tax assets. The ultimate realization of deferred tax assets depends upon the generation of future taxable income during the periods in which those temporary differences become deductible. We consider the scheduled reversal of deferred tax liabilities, projected future taxable income and tax planning strategies in making this assessment.
The statute of limitations related to our consolidated Federal income tax returns and our Florida income tax returns expired for all tax years up to and including 2012; therefore, only the 2013 through 2016 tax years remain subject to examination by taxing authorities. No taxing authorities are currently examining any of our federal or state income tax returns.
UPC Insurance's reinsurance affiliate, which is based in the Cayman Islands, made an irrevocable election under section 953(d) of the U.S. Internal Revenue Code of 1986, as amended, to be treated as a domestic insurance company for U.S. Federal income tax purposes. As a result of this election, our reinsurance subsidiary is subject to United States income tax on its worldwide income as if it were a U.S. corporation.
As of December 31, 2016, we have not taken any uncertain tax positions with regard to our tax returns.
13) STATUTORY ACCOUNTING AND REGULATION
The insurance industry is heavily-regulated. State laws and regulations, as well as national regulatory agency requirements, govern the operations of all insurers such as our insurance affiliates. The various laws and regulations require that insurers maintain minimum amounts of statutory surplus and risk-based capital, restrict insurers' ability to pay dividends, specify allowable investment types and investment mixes, and subject insurers to assessments. At December 31, 2016, we received an assessment for $415,000 from the North Carolina Joint Underwriting Association related to Hurricane Matthew. We did not receive any additional significant assessments from regulatory authorities in the states in which our insurance affiliates operate.
Governmental agencies or certain quasi-governmental entities can levy assessments upon us in the states in which we write policies. See Note 2(k) for a description of how we recover assessments imposed upon us.
The table below summarizes the activity related to assessments levied upon our insurance affiliates:
86
UNITED INSURANCE HOLDINGS CORP. Notes to Consolidated Financial Statements December 31, 2016 |
2016 | 2015 | 2014 | |||||||||
Expected recoveries of assessments, January 1 | $ | — | $ | — | $ | 7 | |||||
Assessments expensed | 1,472 | 226 | 72 | ||||||||
Assessments recovered | — | 1 | (2 | ) | |||||||
Assessments not recoverable | (1,472 | ) | (227 | ) | (77 | ) | |||||
Expected recoveries of assessments, December 31 | $ | — | $ | — | $ | — | |||||
We expense an assessment when the particular governmental agency or quasi-governmental entity levies it upon us; therefore, expected recoveries in the table above are not assets and we will record the amounts as income when collected from policyholders.
Governmental agencies or certain quasi-governmental entities can also levy assessments upon policyholders, and we collect the amount of the assessments from policyholders as surcharges for the benefit of the assessing agency. We currently collect assessments levied upon policyholders on behalf of Citizens in the amount of 1.0%, and on behalf of FHCF in the amount of 1.3%. We multiply the premium written on each policy, except our flood policies, by these assessment percentages to determine the additional amount that we will collect from the policyholder and remit to the assessing agencies.
Our insurance affiliates, UPC, FSIC and IIC are domiciled in Florida, Hawaii, and New York, respectively. They must maintain capital and surplus ratios or balances as determined by the regulatory authority of the states in which they are domiciled. The table below shows the minimum capital and surplus requirements, as well as the amount of surplus as regards policyholders for our regulated entities at December 31, 2016 and 2015.
Minimum Requirement | December 31, 2016 | December 31, 2015 | |||||||||
UPC (1) | $ | 5,000 | $ | 155,587 | $ | 135,288 | |||||
FSIC | $ | 3,250 | $ | 16,269 | $ | 15,572 | |||||
IIC | $ | 4,700 | $ | 40,442 | N/A(2) | ||||||
(1) UPC is required to maintain capital and surplus equal to the greater of 10% of its total liabilities or $5,000,000.
(2) There is not a reportable value for IIC at December 31, 2015 as we did not own the company until April 2016.
The amount of restricted net assets of UPC, FSIC, and IIC at December 31, 2016 was $140,606,000, $18,825,000, and $45,606,000, respectively.
Florida law limits an insurer’s investment in equity instruments and also restricts investments in medium to low quality debt instruments. We were in compliance with all investment restrictions at December 31, 2016 and 2015.
The SBA note is considered a surplus note pursuant to statutory accounting principles. As a result, UPC is subject to the authority of the Insurance Commissioner of the State of Florida with regard to its ability to repay principal and interest on the surplus note. Any payment of principal or interest requires permission from the insurance regulatory authority.
We have reported our insurance affiliates' assets, liabilities and results of operations in accordance with GAAP, which varies from statutory accounting principles prescribed or permitted by state laws and regulations, as well as by general industry practices. The following items are principal differences between statutory accounting and GAAP:
• | Statutory accounting requires that we exclude certain assets, called non-admitted assets, from the balance sheet. |
• | Statutory accounting requires us to expense policy acquisition costs when incurred, while GAAP allows us to defer to the extent realizable, and amortize policy acquisition costs over the estimated life of the policies. |
87
UNITED INSURANCE HOLDINGS CORP. Notes to Consolidated Financial Statements December 31, 2016 |
• | Statutory accounting requires that surplus notes, also known as surplus debentures, be recorded in statutory surplus, while GAAP requires us to record surplus notes as a liability. |
• | Statutory accounting allows certain investments to be carried at amortized cost or fair value based on the rating received from the Securities Valuation Office of the National Association of Insurance Commissioners, while they are recorded at fair value for GAAP because the investments are held as available for sale. |
• | Statutory accounting allows ceding commission income to be recognized when written if the cost of acquiring and renewing the associated business exceeds the ceding commissions, but under GAAP such income is deferred and recognized over the coverage period. |
• | Statutory accounting requires that unearned premiums and loss reserves are presented net of related reinsurance rather than on a gross basis under GAAP. |
• | Statutory accounting requires a provision for reinsurance liability be established for reinsurance recoverable on paid losses aged over ninety days and for unsecured amounts recoverable from unauthorized reinsurers. Under GAAP there is no charge for uncollateralized amounts ceded to a company not licensed in the insurance affiliate's domiciliary state and a reserve for uncollectable reinsurance is charged through earnings rather than surplus or equity. |
• | Statutory accounting requires an additional admissibility test and the change in deferred income tax is reported directly in capital and surplus, rather than being reported as a component of income tax expense under GAAP. |
Our insurance affiliates must file with the various insurance regulatory authorities an “Annual Statement” which reports, among other items, statutory net income (loss) and surplus as regards policyholders, which is called stockholders' equity under GAAP.
The table below reconciles our consolidated GAAP net income to the statutory net income of our insurance affiliates:
Year Ended December 31, | |||||||||||
2016 | 2015 | 2014 | |||||||||
Consolidated GAAP net income | $ | 5,698 | $ | 27,358 | $ | 41,013 | |||||
Increase (decrease) due to: | |||||||||||
Commissions | 17,486 | 339 | (12,258 | ) | |||||||
Deferred income taxes | (3,255 | ) | (2,518 | ) | 64 | ||||||
Deferred policy acquisition costs | (6,342 | ) | (4,962 | ) | (788 | ) | |||||
Allowance for doubtful accounts | (24 | ) | 97 | 5 | |||||||
Assessments | — | — | (78 | ) | |||||||
Prepaid expenses | (538 | ) | 131 | (136 | ) | ||||||
Other, net | 166 | — | — | ||||||||
Operations of non-statutory subsidiaries | (10,621 | ) | (10,077 | ) | (14,915 | ) | |||||
January net income for FSIC | — | 152 | — | ||||||||
January through April net income for IIC | 3,513 | — | — | ||||||||
Statutory net income of insurance affiliates | $ | 6,083 | $ | 10,520 | $ | 12,907 | |||||
88
UNITED INSURANCE HOLDINGS CORP. Notes to Consolidated Financial Statements December 31, 2016 |
The table below reconciles our consolidated GAAP stockholders’ equity to the surplus as regards policyholders of our insurance affiliates:
December 31, | |||||||
2016 | 2015 | ||||||
Consolidated GAAP stockholders’ equity | $ | 241,327 | $ | 239,211 | |||
Increase (decrease) due to: | |||||||
Deferred policy acquisition costs | (15,373 | ) | (9,031 | ) | |||
Deferred income taxes | (3,338 | ) | 917 | ||||
Investments | 1,386 | 185 | |||||
Non-admitted assets | (623 | ) | (1,066 | ) | |||
Surplus debentures | 11,176 | 12,353 | |||||
Provision for reinsurance | (7,648 | ) | (734 | ) | |||
Equity of non-statutory subsidiaries | (32,615 | ) | (96,825 | ) | |||
Commissions | 18,570 | 876 | |||||
Prepaid expenses | (564 | ) | (26 | ) | |||
Paid in surplus | — | 5,000 | |||||
Statutory surplus as regards policyholders of insurance affiliates | $ | 212,298 | $ | 150,860 | |||
14) COMMITMENTS AND CONTINGENCIES
We are involved in claims-related legal actions arising in the ordinary course of business. We accrue amounts resulting from claims-related legal actions in unpaid losses and loss adjustment expenses during the period that we determine an unfavorable outcome becomes probable and we can estimate the amounts. Management makes revisions to our estimates based on its analysis of subsequent information that we receive regarding various factors, including: (i) per claim information; (ii) company and industry historical loss experience; (iii) judicial decisions and legal developments in the awarding of damages, and (iv) trends in general economic conditions, including the effects of inflation.
At December 31, 2016, we were not involved in any material non claims-related legal actions.
See Note 11 for information regarding commitments related to long-term debt, and Note 13 for commitments related to regulatory actions.
15) LEASES
We lease office space and office equipment under operating leases. In February 2015, we acquired an office space lease in Hawaii held by FSH which was renewed during November 2016 and will expire in November 2019.
We have office equipment leases with various expiration dates. Lease expense amounted to $205,000, $922,000, and $783,000 for the years ended December 31, 2016, 2015, and 2014, respectively. At December 31, 2016, our minimum future lease payment s under non-cancellable operating leases are:
89
UNITED INSURANCE HOLDINGS CORP. Notes to Consolidated Financial Statements December 31, 2016 |
Amount | |||
2017 | $ | 173 | |
2018 | 112 | ||
2019 | 110 | ||
2020 | 89 | ||
2021 | 59 | ||
16) RELATED PARTY TRANSACTIONS
One of our executive officers, Ms. Salmon, is a former partner at the law firm of Groelle & Salmon, PA, where her spouse remains partner and co-owner. Groelle & Salmon, PA provides legal representation to us related to our claims litigation, and also provided representation to us for several years prior to Ms. Salmon joining UPC Insurance in 2014. During the years ended December 31, 2016 and 2015, Groelle & Salmon, PA billed us approximately $2,892,000 and $1,439,000, respectively. Ms. Salmon's spouse has a 50% interest in these billings, or approximately $1,446,000 and $719,500 for the years ended December 31, 2016 and 2015, respectively.
17) EMPLOYEE BENEFIT PLAN
We provide a 401(k) plan for substantially all of our employees. We match 100% of the first 5% of employees’ contributions to the plan. For the years ended December 31, 2016, 2015, and 2014, our contributions to the plan on behalf of the participating employees were $444,000, $365,000, and $267,000, respectively.
18) ACCUMULATED OTHER COMPREHENSIVE INCOME
We report changes in other comprehensive income items within comprehensive income on the Consolidated Statements of Comprehensive Income, and we include accumulated other comprehensive income as a component of stockholders' equity on the Consolidated Balance Sheets.
The table below details the components of accumulated other comprehensive income at year end:
Pre-Tax Amount | Tax (Expense)Benefit | Net-of-Tax Amount | |||||||||
December 31, 2013 | $ | 150 | $ | (58 | ) | $ | 92 | ||||
Changes in net unrealized gain on investments | 6,367 | (2,460 | ) | 3,907 | |||||||
Reclassification adjustment for net realized losses | 20 | (8 | ) | 12 | |||||||
December 31, 2014 | 6,537 | (2,526 | ) | 4,011 | |||||||
Changes in net unrealized loss on investments | (3,070 | ) | 1,187 | (1,883 | ) | ||||||
Reclassification adjustment for net realized losses | (827 | ) | 319 | (508 | ) | ||||||
December 31, 2015 | 2,640 | (1,020 | ) | 1,620 | |||||||
Changes in net unrealized gain on investments | (629 | ) | 167 | (462 | ) | ||||||
Reclassification adjustment for net realized gains | (547 | ) | 211 | (336 | ) | ||||||
December 31, 2016 | $ | 1,464 | $ | (642 | ) | $ | 822 | ||||
19) STOCKHOLDERS' EQUITY
Our Board declared dividends on our outstanding shares of common stock to shareholders of record as follows for the periods presented (in thousands, except per share amounts):
90
UNITED INSURANCE HOLDINGS CORP. Notes to Consolidated Financial Statements December 31, 2016 |
Year Ended December 31, | ||||||||||||||||||||||||
2016 | 2015 | 2014 | ||||||||||||||||||||||
Per Share Amount | Aggregate Amount | Per Share Amount | Aggregate Amount | Per Share Amount | Aggregate Amount | |||||||||||||||||||
First Quarter | $ | 0.05 | $ | 1,076 | $ | 0.05 | $ | 1,073 | $ | 0.04 | $ | 832 | ||||||||||||
Second Quarter | $ | 0.06 | $ | 1,300 | $ | 0.05 | $ | 1,077 | $ | 0.04 | $ | 834 | ||||||||||||
Third Quarter | $ | 0.06 | $ | 1,299 | $ | 0.05 | $ | 1,076 | $ | 0.04 | $ | 834 | ||||||||||||
Fourth Quarter | $ | 0.06 | $ | 1,299 | $ | 0.05 | $ | 1,076 | $ | 0.04 | $ | 836 | ||||||||||||
On February 3, 2015, we completed the acquisition of FSH and its subsidiaries by issuing 503,857 shares of our common stock as payment of the initial purchase price. In March 2016 we paid contingent consideration of 32,943 shares of common stock as part of the FSH acquisition. See Note 4 for additional information on this acquisition.
On March 5, 2014, we closed an underwritten public offering of 4,600,000 shares of our common stock. Our total net proceeds from the offering were approximately $54,041,000.
We are authorized to issue 875,000 shares of "blank check" preferred stock, which may be issued from time to time in one or more series upon authorization by our board of directors. Our Board, without further approval of the stockholders, is authorized to fix the designations, powers, including voting powers, preferences and the relative, participating optional or other special rights of the shares of each series and any qualifications, limitations and restrictions thereof. As of December 31, 2016, we had not issued any shares of preferred stock.
See Note 20 for information regarding the activity of our common stock and share-based compensation.
20) STOCK-BASED COMPENSATION
We account for stock-based compensation under the fair value recognition provisions of ASC Topic 718 - Compensation - Stock Compensation.
Stock-based compensation cost for restricted stock grants is measured based on the closing fair market value of our common stock on the date of grant. We recognize stock-based compensation cost over the award’s requisite service period on a straight-line basis for time-based restricted stock grants.
We granted 115,405 shares of restricted common stock awards during the twelve-month period ended December 31, 2016, which had a weighted-average grant date fair value of $16.90 per share. We granted 130,442 shares of restricted stock during the twelve-month period ended December 31, 2015, which had a weighted-average grant date fair value of $20.38 per share.
The following table presents certain information related to the activity of our non-vested common stock grants:
91
UNITED INSURANCE HOLDINGS CORP. Notes to Consolidated Financial Statements December 31, 2016 |
Number of Restricted Shares | Weighted Average Grant Date Fair Value | |||||
Outstanding as of December 31, 2013 | 80,068 | $ | 5.56 | |||
Granted | 103,156 | 13.86 | ||||
Forfeited | 8,057 | 7.69 | ||||
Vested | 21,784 | 6.40 | ||||
Outstanding as of December 31, 2014 | 153,383 | 10.91 | ||||
Granted | 130,442 | 20.38 | ||||
Forfeited | 14,365 | 13.80 | ||||
Vested | 90,277 | 12.71 | ||||
Outstanding as of December 31, 2015 | 179,183 | 16.67 | ||||
Granted | 115,405 | 16.90 | ||||
Forfeited | 26,082 | 17.44 | ||||
Vested | 98,864 | 16.39 | ||||
Outstanding as of December 31, 2016 | 169,642 | $ | 16.87 | |||
We had approximately $1,106,000 of unrecognized stock compensation expense on December 31, 2016 related to non-vested stock-based compensation granted, that we expect to recognize over the next three years. We recognized $877,000, $808,000 and $280,000 of stock-based compensation expense during the twelve months ended December 31, 2016, 2015 and 2014, respectively.
We had approximately $370,000 of unrecognized director stock-based compensation expense at December 31, 2016 related to non-vested director stock-based compensation granted, which we expect to recognize ratably until the 2017 Annual Meeting of Stockholders. We recognized $1,070,000, $1,166,000 and $371,000 of director stock-based compensation expense during the twelve months ended December 31, 2016, 2015 and 2014, respectively.
21) QUARTERLY RESULTS (UNAUDITED)
Three Months Ended | |||||||||||||||
March 31, | June 30, | September 30, | December 31, | ||||||||||||
(In thousands, except per share data) | |||||||||||||||
2016 | |||||||||||||||
Revenues | $ | 107,561 | $ | 120,921 | $ | 127,202 | $ | 131,433 | |||||||
Income before income taxes | $ | 4,330 | $ | 15,210 | $ | 5,041 | $ | (17,578 | ) | ||||||
Net income | $ | 2,951 | $ | 9,841 | $ | 3,423 | $ | (10,517 | ) | ||||||
Earnings per common share - Basic (1) | $ | 0.14 | $ | 0.46 | $ | 0.16 | $ | (0.49 | ) | ||||||
Earnings per common share - Diluted (1) | $ | 0.14 | $ | 0.45 | $ | 0.16 | $ | (0.49 | ) | ||||||
2015 | |||||||||||||||
Revenues | $ | 82,396 | $ | 85,340 | $ | 89,806 | $ | 100,027 | |||||||
Income before income taxes | $ | 338 | $ | 8,187 | $ | 12,984 | $ | 20,351 | |||||||
Net income | $ | 198 | $ | 5,275 | $ | 8,083 | $ | 13,802 | |||||||
Earnings per common share - Basic (1) | $ | 0.01 | $ | 0.25 | $ | 0.38 | $ | 0.65 | |||||||
Earnings per common share - Diluted (1) | $ | 0.01 | $ | 0.25 | $ | 0.38 | $ | 0.64 | |||||||
(1) The sum of the quarterly reported amounts may not equal the full year, as each is computed independently.
92
UNITED INSURANCE HOLDINGS CORP. Notes to Consolidated Financial Statements December 31, 2016 |
22) SUBSEQUENT EVENTS
We evaluate all subsequent events and transactions for potential recognition or disclosure in our financial statements.
On February 22, 2017, our Board of Directors declared a $0.06 per share quarterly cash dividend payable on March 15, 2017, to stockholders of record on March 8, 2017.
On February 3, 2017, a special meeting of our stockholders was held at our principal executive offices. A total of 17,042,645 shares of our common stock, out of a total of 21,646,614 shares of common stock issued and outstanding and entitled to vote as of the close of business on December 28, 2016, were present in person or represented by proxy and the special meeting. Stockholders voted upon and approved the issuance of shares of our common stock, as contemplated by the merger agreement with AmCo Holding Company. Approximately 98.8% of the shares entitled to vote were voted in favor of the issuance.
93
UNITED INSURANCE HOLDINGS CORP.
Item 9. Changes in and Disagreements with Accountants on Accounting and Financial Disclosure
None.
Item 9A. Controls and Procedures
Evaluation of Disclosure Controls and Procedures
We maintain a set of disclosure controls and procedures designed to ensure that the information we must disclose in reports we file or submit under the Securities Exchange Act of 1934, as amended (Exchange Act) is recorded, processed, summarized and reported within the time periods specified in the SEC's rules and forms. We designed our disclosure controls with the objective of ensuring we accumulate and communicate this information to our management, including our principal executive officer and principal financial officer, as appropriate, to allow timely decisions regarding required disclosure.
Under the supervision and with the participation of our management, including our principal executive officer and principal financial officer, we conducted an evaluation of the effectiveness of the design and operations of our disclosure controls and procedures, as such term is defined in Rules 13a-15(e) and 15d-15(e) under Exchange Act, as of the end of the period covered by this report. Based on our evaluation, our principal executive officer and principal financial officer concluded that our disclosure controls and procedures were effective as of the end of the period covered by this report to ensure that the information required to be disclosed by us in the reports that we file or submit under the Exchange Act is recorded, processed, summarized and reported within the time periods specified in the SEC's rules and forms.
Management’s Report on Internal Control over Financial Reporting
Our management is responsible for establishing and maintaining adequate internal control over our financial reporting. Internal control over financial reporting is a process to provide reasonable assurance regarding the reliability of our financial reporting and the preparation of financial statements for external purposes in accordance with generally accepted accounting principles in the United States. Internal control over financial reporting includes those policies and procedures that: (a) pertain to the maintenance of records that in reasonable detail accurately and fairly reflect our transactions and dispositions of our assets; (b) provide reasonable assurance that transactions are recorded as necessary to permit preparation of financial statements in accordance with generally accepted accounting principles, and that our receipts and expenditures are being made only in accordance with authorizations of our management and directors; and (c) provide reasonable assurance regarding prevention or timely detection of unauthorized acquisition, use or disposition of our assets that could have a material effect on our financial statements.
Our management assessed the effectiveness of our internal control over financial reporting as of December 31, 2016. In making this assessment, our management used the criteria set forth in the Internal Control—Integrated Framework issued by the Committee of Sponsoring Organizations of the Treadway Commission in 2013. Based on the criteria set forth in the Internal Control-Integrated Framework, our management believes that as of December 31, 2016, our internal control over our financial reporting is effective.
RSM US LLP, our independent registered public accounting firm that audited the consolidated financial statements included in this Form 10-K, has issued their attestation report on our internal control over financial reporting, which is included herein.
Changes in Internal Control over Financial Reporting
During the fiscal quarter ended December 31, 2016, we made no change in our internal control over financial reporting that has materially affected, or is reasonably likely to materially affect, our internal control over financial reporting.
Limitations on Controls
Because of the inherent limitations of internal controls, we do not expect our disclosure controls and procedures or our internal control over financial reporting will prevent or detect all errors and fraud. Any control system, no matter how well designed and operated, is based upon certain assumptions and can provide only reasonable, not absolute, assurance that our
94
UNITED INSURANCE HOLDINGS CORP.
objectives will be met. Further, no evaluation of controls can provide absolute assurance that we will prevent all misstatements due to error or fraud or that we will detect all control issues and instances of fraud, if any, within our company.
Item 9B. Other Information
None.
95
UNITED INSURANCE HOLDINGS CORP.
REPORT OF INDEPENDENT REGISTERED PUBLIC ACCOUNTING FIRM
To the Board of Directors and Stockholders
United Insurance Holdings Corp.
We have audited United Insurance Holding Corp. and subsidiaries’ (the “Company”) internal control over financial reporting as of December 31, 2016, based on criteria established in Internal Control - Integrated Framework issued by the Committee of Sponsoring Organizations of the Treadway Commission in 2013. The Company’s management is responsible for maintaining effective internal control over financial reporting and for its assessment of the effectiveness of internal control over financial reporting included in the accompanying Management’s Report on Internal Control over Financial Reporting. Our responsibility is to express an opinion on the Company’s internal control over financial reporting based on our audit.
We conducted our audit in accordance with the standards of the Public Company Accounting Oversight Board (United States). Those standards require that we plan and perform the audit to obtain reasonable assurance about whether effective internal control over financial reporting was maintained in all material respects. Our audit included obtaining an understanding of internal control over financial reporting, assessing the risk that a material weakness exists, and testing and evaluating the design and operating effectiveness of internal control based on the assessed risk. Our audit also included performing such other procedures as we considered necessary in the circumstances. We believe that our audit provides a reasonable basis for our opinion.
A company’s internal control over financial reporting is a process designed to provide reasonable assurance regarding the reliability of financial reporting and the preparation of financial statements for external purposes in accordance with generally accepted accounting principles. A company’s internal control over financial reporting includes those policies and procedures that (a) pertain to the maintenance of records that, in reasonable detail, accurately and fairly reflect the transactions and dispositions of the assets of the company; (b) provide reasonable assurance that transactions are recorded as necessary to permit preparation of financial statements in accordance with generally accepted accounting principles, and that receipts and expenditures of the company are being made only in accordance with authorizations of management and directors of the company; and (c) provide reasonable assurance regarding prevention or timely detection of unauthorized acquisition, use, or disposition of the company’s assets that could have a material effect on the financial statements.
Because of its inherent limitations, internal control over financial reporting may not prevent or detect misstatements. Also, projections of any evaluation of effectiveness to future periods are subject to the risk that controls may become inadequate because of changes in conditions, or that the degree of compliance with the policies or procedures may deteriorate.
In our opinion, United Insurance Holdings Corp. and subsidiaries maintained, in all material respects, effective internal control over financial reporting as of December 31, 2016, based on criteria established in Internal Control - Integrated Framework issued by the Committee of Sponsoring Organizations of the Treadway Commission in 2013.
We have also audited, in accordance with the standards of the Public Company Accounting Oversight Board (United States), the consolidated balance sheet of United Insurance Holdings Corp. and subsidiaries as of December 31, 2016, and the related consolidated statements of comprehensive income, stockholders’ equity, and cash flows for the year then ended, and our report dated March 15, 2017 expressed an unqualified opinion.
/s/ RSM US LLP |
Omaha, Nebraska |
March 15, 2017 |
96
UNITED INSURANCE HOLDINGS CORP.
PART III
Item 10. Directors, Executive Officers and Corporate Governance
Other than the information regarding our Code of Conduct and Ethics set forth below, all information required by this Item is incorporated herein by reference to our definitive Proxy Statement for the 2017 Annual Meeting of our Stockholders to be filed with the SEC within 120 days after the end of our fiscal year ended December 31, 2016.
CODE OF CONDUCT AND ETHICS
We have adopted a code of ethics (our Code of Conduct and Ethics) that applies to our officers, directors and employees, including our principal executive officer and our principal financial and accounting officer, in accordance with applicable federal securities laws. We have filed a copy of our Code of Conduct and Ethics with the SEC (filed as Exhibit 14 to the Form S-1, Registration No. 333-143466, filed June 4, 2007). This document may be reviewed by accessing our public filings at the SEC’s web site at www.sec.gov. In addition, a copy of our Code of Conduct and Ethics will be provided without charge upon written request submitted to us via regular mail or via electronic mail to investorrelations@upcinsurance.com. We intend to post notice of any waiver from, or amendment to, any provision in our Code of Conduct and Ethics on our website at www.upcinsurance.com.
Item 11. Executive Compensation
The information required by this Item is incorporated herein by reference to our definitive Proxy Statement for the 2017 Annual Meeting of our Stockholders to be filed with the SEC within 120 days after the end of our fiscal year ended December 31, 2016.
Item 12. Security Ownership of Certain Beneficial Owners and Management and Related Stockholder Matters
Information required by this Item is incorporated herein by reference to our definitive Proxy Statement for the 2017 Annual Meeting of our Stockholders to be filed with the SEC within 120 days after the end of our fiscal year ended December 31, 2016.
Item 13. Certain Relationships and Related Transactions, and Director Independence
The information required by this Item is incorporated herein by reference to our definitive Proxy Statement for the 2017 Annual Meeting of our Stockholders to be filed with the SEC within 120 days after the end of our fiscal year ended December 31, 2016.
Item 14. Principal Accounting Fees and Services
The information required by this Item is incorporated herein by reference to our definitive Proxy Statement for the 2017 Annual Meeting of our Stockholders to be filed with the SEC within 120 days after the end of our fiscal year ended December 31, 2016.
97
UNITED INSURANCE HOLDINGS CORP.
PART IV
Item 15. Exhibits, Financial Statement Schedules
The following documents are filed as part of this Report:
(1) Consolidated Financial Statements. In Part II, Item 8, we have included our consolidated financial statements, the notes thereto and the report of the Independent Registered Public Accounting Firm.
(2) Financial Statement Schedules. Schedule I – Summary of Investments, Schedule II - Condensed Financial Information of Registrant, Schedule IV – Reinsurance, and Schedule V – Valuation and Qualifying Accounts are filed as a part hereof along with the related report of the Independent Registered Public Accounting Firm included in Part II, Item 8. All other schedules have been omitted because the information required to be set forth therein is not applicable or is included in the consolidated financial statements or notes thereto.
(3) Exhibits. We hereby file as part of this Annual Report on Form 10-K the Exhibits listed on the attached Exhibit Index. Exhibits which are incorporated herein by reference can be inspected and copied at the public reference facilities maintained by the SEC, 100 F Street, N.E., Room 1580, Washington D.C. 20549, at prescribed rates or on the SEC website at www.sec.gov.
98
UNITED INSURANCE HOLDINGS CORP.
SCHEDULE I. SUMMARY OF INVESTMENTS
December 31, 2016 | |||||||||||
Cost or Amortized Cost | Fair Value | Amount Shown in Consolidated Balance Sheet | |||||||||
Bonds: | |||||||||||
U.S. government and agency securities | $ | 151,656 | $ | 149,952 | $ | 149,952 | |||||
Foreign governments | 2,031 | 2,061 | 2,061 | ||||||||
States, municipalities and political subdivisions | 170,636 | 169,112 | 169,112 | ||||||||
Public utilities | 7,687 | 7,730 | 7,730 | ||||||||
Corporate securities | 164,424 | 164,536 | 164,536 | ||||||||
Redeemable preferred stocks | 1,182 | 1,125 | 1,125 | ||||||||
Total fixed maturities | 497,616 | 494,516 | 494,516 | ||||||||
Common stocks: | |||||||||||
Public utilities | 1,343 | 1,507 | 1,507 | ||||||||
Other common stocks | 19,815 | 24,048 | 24,048 | ||||||||
Nonredeemable preferred stocks | 2,916 | 2,843 | 2,843 | ||||||||
Total equity securities | 24,074 | 28,398 | 28,398 | ||||||||
Other investments | 5,493 | 5,733 | 5,733 | ||||||||
Total investments | $ | 527,183 | $ | 528,647 | $ | 528,647 | |||||
99
UNITED INSURANCE HOLDINGS CORP.
SCHEDULE II. CONDENSED FINANCIAL INFORMATION OF REGISTRANT
Condensed Balance Sheets | |||||||
December 31, | |||||||
2016 | 2015 | ||||||
Assets | |||||||
Fixed maturities, available for sale, at fair value | $ | — | $ | 8,157 | |||
Equity securities, available for sale, at fair value | — | 26,343 | |||||
Cash and cash equivalents | 7,399 | 11,555 | |||||
Accrued investment income | — | 3 | |||||
Investment in subsidiaries | 263,712 | 195,940 | |||||
Goodwill | 10,841 | — | |||||
Property and equipment, net | 7,993 | 6,838 | |||||
Other assets | 11,337 | 2 | |||||
Total Assets | $ | 301,282 | $ | 248,838 | |||
Liabilities | |||||||
Intercompany payable | $ | 14,531 | $ | 8,657 | |||
Other liabilities | 2,426 | 970 | |||||
Long-term notes payable | 42,998 | — | |||||
Total Liabilities | 59,955 | 9,627 | |||||
Stockholders' Equity | |||||||
Common stock | 2 | 2 | |||||
Additional paid-in capital | 99,353 | 97,163 | |||||
Treasury stock | (431 | ) | (431 | ) | |||
Accumulated other comprehensive income | 822 | 1,620 | |||||
Retained earnings | 141,581 | 140,857 | |||||
Total Stockholders' Equity | 241,327 | 239,211 | |||||
Total Liabilities and Stockholders' Equity | $ | 301,282 | $ | 248,838 | |||
100
UNITED INSURANCE HOLDINGS CORP.
SCHEDULE II. CONDENSED FINANCIAL INFORMATION OF REGISTRANT, CONTINUED
Condensed Statements of Comprehensive Income | |||||||||||
Years Ended December 31, | |||||||||||
2016 | 2015 | 2014 | |||||||||
Revenues | |||||||||||
Net income from subsidiaries (equity method) | $ | 13,296 | $ | 27,562 | $ | 40,108 | |||||
Net realized investment gain (loss) | (14 | ) | 951 | — | |||||||
Net investment income | 88 | 239 | — | ||||||||
Total revenues | 13,370 | 28,752 | 40,108 | ||||||||
Expenses | |||||||||||
Operating and underwriting | 337 | 138 | 86 | ||||||||
General and administrative | 11,805 | 1,252 | 130 | ||||||||
Interest expense | 496 | — | — | ||||||||
Total expenses | 12,638 | 1,390 | 216 | ||||||||
Income before other income | 732 | 27,362 | 39,892 | ||||||||
Other income | 60 | 245 | 61 | ||||||||
Income before income taxes | 792 | 27,607 | 39,953 | ||||||||
Provision for income tax expense (benefit) | (4,906 | ) | 249 | (1,060 | ) | ||||||
Net income | $ | 5,698 | $ | 27,358 | $ | 41,013 | |||||
Unrealized gain (loss) on investments | (1,191) | 25 | — | ||||||||
Reclassification adjustments - losses (gains) | 14 | (951 | ) | — | |||||||
Income tax benefit (expense) related to other items of comprehensive income | 378 | (357 | ) | — | |||||||
Total Comprehensive Income | $ | 4,899 | $ | 26,075 | $ | 41,013 | |||||
101
UNITED INSURANCE HOLDINGS CORP.
SCHEDULE II. CONDENSED FINANCIAL INFORMATION OF REGISTRANT, CONTINUED
Condensed Statements of Cash Flows | |||||||||||
Year Ended December 31, | |||||||||||
2016 | 2015 | 2014 | |||||||||
OPERATING ACTIVITIES | |||||||||||
Net income | $ | 5,698 | $ | 27,358 | $ | 41,013 | |||||
Adjustments to reconcile net income to net cash provided by (used in) operating activities: | |||||||||||
Depreciation and amortization | 682 | 74 | — | ||||||||
Net realized investment gains | 14 | (951 | ) | — | |||||||
Deferred income taxes, net | 382 | 126 | (44 | ) | |||||||
Stock based compensation | 1,947 | 1,974 | 649 | ||||||||
Changes in operating assets and liabilities: | |||||||||||
Accrued investment income | 3 | (3 | ) | — | |||||||
Other assets | (22,553 | ) | 450 | (548 | ) | ||||||
Intercompany payable | 5,874 | 2,557 | (47,033 | ) | |||||||
Other liabilities | 1,969 | 918 | (352 | ) | |||||||
Net cash provided by (used in) operating activities | (5,984 | ) | 32,503 | (6,315 | ) | ||||||
INVESTING ACTIVITIES | |||||||||||
Proceeds from sales of investments available for sale | 34,551 | 19,633 | — | ||||||||
Purchases of investments available for sale | (70 | ) | (53,212 | ) | — | ||||||
Additional investment in subsidiaries | (68,563 | ) | 16,276 | (36,608 | ) | ||||||
Cost of property and equipment acquired | (1,797 | ) | (3,255 | ) | (3,583 | ) | |||||
Net cash used in investing activities | (35,879 | ) | (20,558 | ) | (40,191 | ) | |||||
FINANCING ACTIVITIES | |||||||||||
Tax withholding payment related to net settlement of equity awards | (270 | ) | (185 | ) | (110 | ) | |||||
Proceeds from borrowings | 42,951 | — | — | ||||||||
Dividends | (4,974 | ) | (4,302 | ) | (3,336 | ) | |||||
Proceeds from offering | — | — | 54,041 | ||||||||
Net cash provided by (used in) financing activities | 37,707 | (4,487 | ) | 50,595 | |||||||
Increase in cash | (4,156 | ) | 7,458 | 4,089 | |||||||
Cash and cash equivalents at beginning of period | 11,555 | 4,097 | 8 | ||||||||
Cash and cash equivalents at end of period | $ | 7,399 | $ | 11,555 | $ | 4,097 | |||||
Notes to Condensed Financial Statements - Basis of Presentation
The Company's investment in subsidiaries is stated at cost plus equity in the undistributed earnings of subsidiaries since the date of acquisition. The Company's share of net income of its subsidiaries is included in income using the equity method. These financial statements should be read in conjunction with UPC Insurance's consolidated financial statements.
102
UNITED INSURANCE HOLDINGS CORP.
SCHEDULE IV. REINSURANCE
Property and Casualty Insurance | ||||||||||||||||||
Direct Premium Written | Premiums Ceded to Other Companies | Premiums Assumed from Other Companies | Net Premiums Written | Percentage of Premiums Assumed to Net | ||||||||||||||
Years Ended December 31, | ||||||||||||||||||
2016 | $ | 708,252 | $ | 262,340 | $ | (96 | ) | $ | 445,816 | — | % | |||||||
2015 | 548,916 | 183,808 | 20,820 | 385,928 | 5.4 | % | ||||||||||||
2014 | 417,769 | 144,404 | 18,984 | 292,349 | 6.5 | % | ||||||||||||
103
UNITED INSURANCE HOLDINGS CORP.
SCHEDULE V. VALUATION AND QUALIFYING ACCOUNTS
Uncollectible Premium Liability | |||||||||||||||
Balance at Beginning of Period | Charged to Costs and Expenses | Deductions | Balance at End of Period | ||||||||||||
Years Ended December 31, | |||||||||||||||
2016 | $ | 132 | $ | 356 | $ | (344 | ) | $ | 144 | ||||||
2015 | 34 | 198 | (100 | ) | 132 | ||||||||||
2014 | 29 | 42 | (37 | ) | 34 | ||||||||||
104
UNITED INSURANCE HOLDINGS CORP.
EXHIBIT INDEX
Exhibit | Description | |
2.1 | Agreement and Plan of Merger, dated as of December 12, 2014, by and among Family Security Holdings, LLC and United Insurance Holdings Corp. (included as exhibit 2.1 to the Form 10-K filed on February 25, 2015, and incorporated herein by reference). | |
2.2 | Stock Purchase Agreement, dated as of September 26, 2015, by and between United Insurance Holdings Corp and Interboro LLC (included as exhibit 2.1 to the Form 8-K filed on September 28, 2015, and incorporated herein by reference). | |
2.3 | Agreement and Plan of Merger, dated as of August 17, 2016, by and among United Insurance Holdings Corp., Kilimanjaro Corp., Kili LLC, RDX Holding, LLC, certain equityholders of RDX Holding, LLC party thereto and AmCo Holding Company (included as Exhibit 2.1 to the Form 8-K filed on August 19, 2016, and incorporated herein by reference). | |
3.1 | Second Amended and Restated Certificate of Incorporation (as amended to include the Certificate of Designations, Powers, Preferences and Rights of Series A Junior Participating Preferred Stock of United Insurance Holdings Corp.) (filed as exhibit 3.1 to the Form 10-Q filed on August 8, 2012, and incorporated herein by reference). | |
3.2 | Bylaws (included as exhibit 3.3 to the Form S-1 (Registration No. 333-143466), filed June 4, 2007, and incorporated herein by reference). | |
4.1 | Specimen Common Stock Certificate (included as exhibit 4.2 to Amendment No. 1 to Post-Effective Amendment No. 1 on Form S-3 (Registration No. 333-150327), filed on December 23, 2008, and incorporated herein by reference). | |
4.2 | Registration Rights Agreement, dated October 4, 2007, by and among FMG Acquisition Corp. and the investors named therein (included as exhibit 10.4 to the Form 8K, filed October 12, 2007, and incorporated herein by reference). | |
4.3 | Rights Agreement, dated as of July 20, 2012, between United Insurance Holdings Corp and Continental Stock Transfer & Trust Company, which includes as Exhibit A thereto a summary of the terms of the Series A Junior Participating Preferred Stock, as Exhibit B thereto the Form of Right Certificate, and as Exhibit C thereto the Summary of Rights to Purchase Preferred Shares (included as Exhibit 4.1 to the Form 8-A filed July 23, 2012, and incorporated herein by reference.). | |
4.4 | First Amendment to Rights Agreement, dated as of August 17, 2016, by and between United Insurance Holdings Corp. and American Stock Transfer & Trust Company, amending the Rights Agreement, dated as of July 20, 2012, by and between United Insurance Holdings Corp. and American Stock Transfer & Trust Company (included as Exhibit 4.1 to the Form 8-K filed on August 19, 2016, and incorporated herein by reference). | |
10.1 | Investment Management Agreement between United Property & Casualty Insurance Company and Synovus Trust Company, dated October 8, 2003 (included as exhibit 10.18 to the Form S-4/A (Registration No. 333-150327), filed June 13, 2008, and incorporated herein by reference). | |
10.2 | Insurance Capital Build-up Incentive Program Surplus Note between United Property & Casualty Insurance Company and the State Board of Administration of Florida dated September 22, 2006 (included as exhibit 10.31 to the Form S-4/A (Registration No. 333-150327), filed June 13, 2008, and incorporated herein by reference). | |
10.3 | Master Business Process Outsourcing Services Agreement between United Insurance Management, LLC and Computer Sciences Corporation, dated March 11, 2008 (included as exhibit 10.24 to the Form S-4/A (Registration No. 333-150327), filed June 13, 2008, and incorporated herein by reference). | |
10.4 | Addendum Number One to Insurance Capital Build-Up Incentive Program Surplus Note, dated November 7, 2008 and effective July 1, 2008, between the State Board of Administration of Florida and United Property & Casualty Insurance Company (included as exhibit 10.1 to the Form 8-K, filed November 12, 2008, and incorporated herein by reference). | |
10.5 | Federal Income Tax Allocation Agreement between United Insurance Holdings Corp., United Insurance Management, L.C., Skyway Claims Services, LLC, United Property & Casualty Insurance Company, UPC Re and amended to include Family Security Holdings, LLC and its subsidiaries dated July 1, 2012 (filed as exhibit 10.11 to the Form 10-Q filed on August 8, 2012, and incorporated herein by reference). | |
105
UNITED INSURANCE HOLDINGS CORP.
Exhibit | Description | |
10.6 | Assumption Agreement between Sunshine State Insurance Company and United Property & Casualty Insurance Company, effective July 1, 2010 (included as exhibit 10.7 to the Form 10-Q, filed August 9, 2010, and incorporated herein by reference). | |
10.7 (a) | Continuing Employment and Senior Advisor Agreement between United Insurance Holdings Corp. and Don Cronin effective November 1, 2011 (included as exhibit 10.19 to the Form 10-K, filed March 13, 2012, and incorporated herein by reference). | |
10.8 (a) | Employment Agreement between United Insurance Holdings Corp. and John Forney, dated June 8, 2012 (included as Exhibit 10.1 to the Form 8-K, filed June 12, 2012, and incorporated herein by reference). | |
10.9 (a) | First Amendment to Employment Agreement between United Insurance Holdings Corp. and John Forney, dated June 12, 2012 (included as Exhibit 10.2 to the Form 8-K filed on June 12, 2012, and incorporated herein by reference). | |
10.10 (a) | Restricted Stock Award Agreement, dated September 14, 2012, by and between United Insurance Holdings Corp. and John Forney (included as Exhibit 10.1 to the Form 8-K, filed September 14, 2012, and incorporated herein by reference). | |
10.11 | Form of Indemnification Agreement between United Insurance Holdings Corp. and its Directors (included as Exhibit 10.1 to the Form 8-K, filed October 10, 2012, and incorporated herein by reference). | |
10.12 (a) | Employment Agreement, dated November 5, 2012, between United Insurance Management, L.C. and John Langowski (filed as Exhibit 10.1 to the Form 8-KA filed on November 8, 2012, and incorporated herein by reference). | |
10.13 (a) | Employment Agreement between United Insurance Holdings Corp. and B. Bradford Martz, dated October 31, 2012 and effective October 1, 2012 (filed as Exhibit 10.1 to the Form 8-KA filed on November 6, 2012, and incorporated herein by reference). | |
10.14 | Assumption Agreement between Citizens and United Property Casualty Insurance Company, effective November 20, 2012 (filed as Exhibit 10.1 to the Form 10-Q, filed May 8, 2013, and incorporated herein by reference). | |
10.15 (a) | Employment Agreement, dated July 10, 2013 between United Insurance Holdings Corp. and Deepak Menon (included as Exhibit 10.1 to the Form 8-K filed on July 11, 2013, and incorporated herein by reference). | |
10.16 (a) | Employment Agreement, dated August 26, 2013 between United Insurance Holdings Corp. and Andrew Swenson (included as Exhibit 10.1 to the Form 8-K filed on August 26, 2013, and incorporated herein by reference). | |
10.17 (a) | Form of Restricted Stock Award under the United Insurance Holdings Corp. 2013 Omnibus Incentive Plan (included as Exhibit 10.1 to the Form 8-K, filed September 30, 2013, and incorporated herein by reference). | |
10.18 (a) | Employment Agreement, dated February 5, 2014 between United Insurance Holdings Corp. and Kimberly Salmon (included as Exhibit 10.1 to the Form 8-K filed on February 6, 2014, and incorporated herein by reference). | |
10.19 (a) | Employment Agreement, dated August 10, 2016 between United Insurance Holdings Corp. and Paul DiFrancesco (included as Exhibit 10.1 to the Form 8-K filed on August 15, 2016, and incorporated herein by reference). | |
10.20 (a) | Employment Agreement, dated August 22, 2016 between United Insurance Holdings Corp. and Scott St John (included as Exhibit 10.1 to the Form 8-K filed on August 11, 2016, and incorporated herein by reference). | |
10.21 (a) | United Insurance Holdings Corp. 2013 Omnibus Incentive Plan (incorporated by reference to Appendix A to the Company's Definitive Proxy statement for its 2013 Annual Meeting, filed on April 16, 2013). | |
10.22 (a) | Restricted Stock Award Agreement, dated March 21, 2014, by and between United Insurance Holdings Corp. and Kimberly Salmon (included as exhibit 10.2 to the Form 10-Q filed on May 1, 2014, and incorporated herein by reference). | |
10.23 (a) | Form of Restricted Stock Award Agreement (for Non-Employee Members of the Board of Directors) under the United Insurance Holdings Corp. 2013 Omnibus Incentive Plan (included as exhibit 10.1 to the Form 8-K filed on September 25, 2014, and incorporated herein by reference). | |
106
UNITED INSURANCE HOLDINGS CORP.
Exhibit | Description | |
10.24 (a) | Form of Restricted Stock Award (for Employees) under the United Insurance Holdings Corp. 2013 Omnibus Incentive Plan (included as exhibit 10.2 to the Form 8-K filed on September 25, 2014, and incorporated herein by reference). | |
10.25 (a) | Form of Restricted Stock Award Agreement (for Chairman of the Board) under the United Insurance Holdings Corp. 2013 Omnibus Incentive Plan (included as exhibit 10.3 to the Form 8-K filed on September 25, 2014, and incorporated herein by reference). | |
10.26 (a) | Non-Executive Chairman Agreement, dated September 19, 2014, between United Insurance Holdings Corp. and Gregory C. Branch (included as exhibit 10.4 to the Form 8-K filed on September 25, 2014, and incorporated herein by reference). | |
10.27 | Purchase and Sale Agreement, dated September 5, 2014, between AAA Auto Club South, Inc. and United Insurance Holdings Corp. (included as exhibit 10.1 to the Form 8-K filed on September 11, 2014, and incorporated herein by reference). | |
10.28 | Property Per Risk Excess of Loss Reinsurance Agreement between United Property & Casualty Insurance Company and General Reinsurance Corporation, effective January 1, 2015 (included as exhibit 10.9 to the Form 10-K filed on February 25, 2015, and incorporated herein by reference). | |
10.29 | Property Per Risk Excess of Loss Reinsurance Agreement between United Property & Casualty Insurance Company and Swiss Reinsurance America Corporation, effective January 1, 2015 (included as exhibit 10.10 to the Form 10-K filed on February 25, 2015, and incorporated herein by reference). | |
10.30 | Stockholders Agreement, dated as of August 17, 2016, by and among United Insurance Holdings Corp., RDX Holding, LLC., R. Daniel Peed and Peed FLP1, Ltd., L.L.P (included as Exhibit 10.1 to the Form 8-K filed on August 19, 2016, and incorporated herein by reference). | |
12.1 | Computation of Ratio of Earnings to Fixed Charges | |
14.1 | Code of Conduct and Ethics (included as exhibit 14 to the Form S-1 (Registration No. 333-143466), filed June 4, 2007, and incorporated herein by reference). | |
21.1 | Subsidiaries of United Insurance Holdings Corp. | |
23.1 | Consent of RSM US LLP. | |
31.1 | Certification of Principal Executive Officer pursuant to Section 302 of the Sarbanes-Oxley Act. | |
31.2 | Certification of Principal Financial Officer pursuant to Section 302 of the Sarbanes-Oxley Act. | |
32.1 | Certification of Principal Executive Officer pursuant to Section 906 of the Sarbanes-Oxley Act. | |
32.2 | Certification of Principal Financial Officer pursuant to Section 906 of the Sarbanes-Oxley Act. | |
101.INS | XBRL Instance Document | |
101.SCH | XBRL Taxonomy Extension Schema | |
101.CAL | XBRL Taxonomy Extension Calculation Linkbase | |
101.DEF | XBRL Taxonomy Extension Definition Linkbase | |
101.LAB | XBRL Taxonomy Extension Label Linkbase | |
101.PRE | XBRL Taxonomy Extension Presentation Linkbase | |
(a) Indicates management contract or compensatory plan
107
UNITED INSURANCE HOLDINGS CORP.
Item 16. Form 10-K Summary
Not applicable.
108
UNITED INSURANCE HOLDINGS CORP.
SIGNATURES
Pursuant to the requirements of Section 13 or 15(d) of the Securities Exchange Act of 1934, the registrant has duly caused this report to be signed on its behalf by the undersigned, thereunto duly authorized.
UNITED INSURANCE HOLDINGS CORP. | |||
Date: | March 15, 2017 | By: | /s/ John L. Forney |
Name: | John L. Forney | ||
Title: | Chief Executive Officer | ||
(principal executive officer and duly authorized officer) | |||
Pursuant to the requirements of the Securities Exchange Act of 1934, this report has been signed below by the following persons on behalf of the registrant and in the capacities and on the dates indicated.
/s/ John L. Forney John L. Forney | President, Chief Executive Officer and Director (principal executive officer) | March 15, 2017 |
/s/ B. Bradford Martz B. Bradford Martz | Chief Financial Officer (principal financial and accounting officer) | March 15, 2017 |
/s/ Gregory C. Branch Gregory C. Branch | Chairman of the Board | March 15, 2017 |
/s/ Kern M. Davis, M.D. Kern M. Davis, M.D. | Director | March 15, 2017 |
/s/ William H. Hood, III William H. Hood, III | Director | March 15, 2017 |
/s/ Alec L. Poitevint, II Alec L. Poitevint, II | Director | March 15, 2017 |
/s/ Kent G. Whittemore Kent G. Whittemore | Director | March 15, 2017 |
/s/ Sherrill W. Hudson Sherrill W. Hudson | Director | March 15, 2017 |
109