Attached files
| file | filename |
|---|---|
| EX-32.1 - EXHIBIT 32.1 - WashingtonFirst Bankshares, Inc. | a201610-kexhibit321.htm |
| EX-31.2 - EXHIBIT 31.2 - WashingtonFirst Bankshares, Inc. | a201610-kexhibit312.htm |
| EX-31.1 - EXHIBIT 31.1 - WashingtonFirst Bankshares, Inc. | a201610-kexhibit311.htm |
| EX-23 - EXHIBIT 23 - WashingtonFirst Bankshares, Inc. | exhibit23201610k.htm |
| EX-21 - EXHIBIT 21 - WashingtonFirst Bankshares, Inc. | exhibit21201610k.htm |
| EX-14 - EXHIBIT 14 - WashingtonFirst Bankshares, Inc. | exhibit14201610k.htm |
| EX-12 - EXHIBIT 12 - WashingtonFirst Bankshares, Inc. | exhibit12201610k.htm |
As filed with the Securities and Exchange Commission on
March 14, 2017
UNITED STATES
SECURITIES AND EXCHANGE COMMISSION
WASHINGTON, D.C. 20549
FORM 10-K
(Mark One)
x ANNUAL REPORT PURSUANT TO SECTION 13 OR 15(d) OF THE SECURITIES EXCHANGE ACT OF 1934
For the fiscal year ended December 31, 2016
or
¨ | TRANSITION REPORT PURSUANT TO SECTION 13 OR 15(d) OF THE SECURITIES EXCHANGE ACT OF 1934 |
For the transition period from ____________ to ____________.
Commission File Number: 001-35768

WASHINGTONFIRST BANKSHARES, INC. | ||
(Exact name of registrant as specified in its charter) | ||
VIRGINIA | 26-4480276 | |
(State or other jurisdiction of incorporation or organization) | (I.R.S. Employer Identification No.) | |
11921 Freedom Drive, Suite 250, Reston, Virginia | 20190 | |
(Address of principal executive offices) | (Zip Code) | |
(703) 840-2410 | ||
(Registrant’s telephone number, including area code) | ||
Securities registered pursuant to Section 12(b) of the Act: | ||
Title of each class | Exchange on which registered | |
Common Stock, par value $0.01 per share | NASDAQ Capital Market | |
Securities registered pursuant to Section 12(g) of the Act: | ||
Title of each class | Exchange on which registered | |
None | n/a | |
Indicate by check mark if the registrant is a well-known seasoned issuer, as defined in Rule 405 of the Securities Act.
Yes ¨ No x
Indicate by check mark if the registrant is not required to file reports pursuant to Section 13 or Section 15 (d) of the Act.
Yes ¨ No x
Indicate by check mark whether the registrant (1) has filed all reports required to be filed by Section 13 or 15(d) of the Securities Exchange Act of 1934 during the preceding 12 months (or for such shorter period that the registrant was required to file such reports), and (2) has been subject to such filing requirements for the past 90 days.
Yes x No ¨
Indicate by check mark whether the registrant has submitted electronically and posted on its corporate Web site, if any, every Interactive Data File required to be submitted and posted pursuant to Rule 405 of Regulation S-T (§ 232.405 of this chapter) during the preceding 12 months (or for such shorter period that the registrant was required to submit and post such files).
Yes x No ¨
Indicate by check mark if disclosure of delinquent filers pursuant to Item 405 of Regulation S-K (17 C.F.R. §229.405) is not contained herein, and will not be contained, to the best of the registrant's knowledge, in definitive proxy or information statements incorporated by reference in Part III of this Form 10-K or any amendment to this Form 10-K. ¨
Indicate by check mark whether the registrant is a large accelerated filer, an accelerated filer, a non-accelerated filer, or a smaller reporting company. See the definitions of "large accelerated filer," "accelerated filer" and "smaller reporting company" in Rule 12b-2 of the Exchange Act. (Check one):
Large accelerated filer ¨ Accelerated filer x
Non-accelerated filer ¨ Smaller Reporting Company ¨
Indicate by check mark whether the registrant is a shell company (as defined in Rule 12b-2 of the Exchange Act).
Yes ¨ No x
The aggregate market value of the common stock held by non-affiliates of the registrant was $217.6 million as of June 30, 2016, based upon the closing price on June 30, 2016, as reported by the NASDAQ Stock Market.
As of March 9, 2017, the registrant had outstanding 12,114,985 shares of voting common stock and 816,835 shares of non-voting common stock.
DOCUMENTS INCORPORATED BY REFERENCE
Certain information called for by Part III is incorporated by reference to certain sections in the registrant’s definitive proxy statement relating to the 2017 Annual Meeting of Stockholders, which will be filed with the Securities and Exchange Commission not later than 120 days after December 31, 2016.
Table of Contents to 2016 Form 10-K
2
3
Glossary of Acronyms
ACBB | - | Atlantic Central Bankers Bank |
ACH | - | Automated Clearing House |
ALCO | - | Asset/Liability Committee |
AOCI | - | Additional Other Comprehensive Income |
ASC | - | FASB Accounting Standards Codification |
ASU | - | Accounting Standards Update |
Bank | - | WashingtonFirst Bank |
BHC Act | - | Bank Holding Company Act of 1956 |
BOLI | - | Bank Owned Life Insurance |
Bureau | - | Virginia Bureau of Financial Institutions |
CBB | - | Community Bankers Bank |
CDARS | - | Certificate of Deposit Account Registry Service |
CET1 | - | Common Equity Tier 1 |
CFPB | - | Consumer Financial Protection Bureau |
CMO | - | Collateralized Mortgage Obligations |
Company | - | WashingtonFirst Bankshares, Inc. |
CRA | - | Community Reinvestment Act of 1977 |
DIF | - | Deposit Insurance Fund |
Dodd-Frank Act | - | Dodd-Frank Wall Street Reform and Consumer Protection Act of 2010 |
ELC | - | Executive Loan Committee of the Board of Directors |
EVE | - | Economic Value of Equity |
Exchange Act | - | Securities Exchange Act of 1934, as amended |
Fannie Mae | - | Federal National Mortgage Association |
FASB | - | Financial Accounting Standards Board |
FDIA | - | Federal Deposit Insurance Act of 1950 |
FDIC | - | Federal Deposit Insurance Corporation |
FDICIA | - | Federal Deposit Insurance Corporation Improvement Act of 1991 |
Federal Reserve | - | Board of Governors of the Federal Reserve System |
FHFA | - | Federal Housing Finance Agency |
FHLB | - | Federal Home Loan Bank of Atlanta |
FRA | - | Federal Reserve Act of 1913 |
FRB | - | Federal Reserve Bank of Richmond |
Freddie Mac | - | Federal Home Loan Mortgage Corporation |
GAAP | - | Generally Accepted Accounting Principles in the U.S. |
GLB Act | - | Graham Leach Bliley Act of 1999 |
GSE | - | Government Sponsored Enterprises |
HUD | - | The Department of Housing and Urban Development |
HVCRE | - | High-volatility commercial real estate |
IRLOC | - | Interest Rate Lock Commitment |
IRS | - | Internal Revenue Service |
JOBS Act | - | Jumpstart Our Business Startups Act of 2012 |
LHFI | - | Loans Held for Investment |
LHFS | - | Loans Held for Sale |
LTV | - | Loan-to-value Ratio |
MBS | - | Mortgage Backed Securities |
Mortgage Company | - | WashingtonFirst Mortgage Corporation, a wholly owned subsidiary of WashingtonFirst Bank |
NASDAQ | - | NASDAQ Capital Market |
NII | - | Net Interest Income |
OFAC | - | U.S. Treasury Department Office of Foreign Assets Control |
OLC | - | Bank Officers' Loan Committee |
OREO | - | Other Real Estate Owned |
RESPA | - | Real Estate Settlement Procedures Act of 1974 |
SOX | - | Sarbanes-Oxley Act of 2002 |
SBLF | - | Small Business Loan Fund |
SEC | - | Securities and Exchange Commission |
Securities Act | - | Securities Act of 1933, as amended |
TDR | - | Troubled Debt Restructuring |
TILA | - | Truth-in-Lending Act of 1968 |
USA Patriot Act | - | Uniting and Strengthening America by Providing Appropriate Tools Required to Intercept and Obstruct Terrorism Act of 2001 |
VA | - | Veterans Administration |
VCDC | - | Virginia Community Development Corporation |
VSCA | - | Virginia Stock Corporation Act |
Wealth Advisors | - | 1st Portfolio, Inc., a wholly owned subsidiary of WashingtonFirst Bankshares, Inc. |
4
Cautionary Note Regarding Forward-Looking Statements
The following discussion and other sections to which the Company has referred you contains management’s comments on the Company’s business strategy and outlook, and such discussions contain forward-looking statements. These forward-looking statements reflect the expectations, beliefs, plans and objectives of management about future financial performance and assumptions underlying management’s judgment concerning the matters discussed, and accordingly, involve estimates, assumptions, judgments and uncertainties. The Company’s actual results could differ materially from those discussed in the forward-looking statements and the discussion below is not necessarily indicative of future results. Factors that could cause or contribute to any differences include, but are not limited to, those discussed in Part II, Item 1A - “Risk Factors.”
This report, as well as other periodic reports filed with the SEC, and written or oral communications made from time to time by or on behalf of the Company, may contain statements relating to future events or future results and their effects that are considered “forward-looking statements” under the Private Securities Litigation Reform Act of 1995. These forward-looking statements may be identified by the use of words such as “believe,” “expect,” “anticipate,” “plan,” “estimate,” “intend,” and “potential,” or words of similar meaning, or future or conditional verbs such as “should,” “could,” or “may” or the negative of those terms or other variations of them or comparable terminology. Forward-looking statements include statements of the Company’s goals, intentions and expectations; statements regarding its business plans, prospects, growth and operating strategies; statements regarding the quality of its loan and investment portfolios; and estimates of its risks and future costs and benefits.
Forward-looking statements included herein speak only as of the date of this report. The Company does not undertake to update forward-looking statements to reflect circumstances or events that occur after the date of this report or to reflect the occurrence of unanticipated events except as required by federal securities laws.
5
PART I
Item 1. Business
General
The Company was organized in 2009 under the laws of Virginia to operate as a bank holding company and is headquartered in Reston, Virginia. The Company is the holding company for WashingtonFirst Bank, which operates 19 full-service banking offices throughout the Washington, D.C. metropolitan area. The Bank opened for business in April 2004 and is chartered by the Commonwealth of Virginia. Through the end of 2016, the FDIC served as its primary federal regulator. In January 2017, the Bank became a member of the Federal Reserve System and, as such, is subject to regulation and supervision by the Federal Reserve Board going forward. With the acquisition of 1st Portfolio, Inc. in July 2015, the Company provides wealth management services with offices located in Fairfax, Virginia; and mortgage banking services through the Bank's wholly owned subsidiary, WashingtonFirst Mortgage which operates in two locations: Fairfax, Virginia and Rockville, Maryland. Wealth Advisors operates as a wholly owned subsidiary of the Company and WashingtonFirst Mortgage is a wholly owned subsidiary of the Bank.
WashingtonFirst’s growth strategy is to pursue organic growth as well as acquisition opportunities within its target market area of the Washington, D.C. metropolitan area. The Company has completed two branch acquisitions, two whole-bank acquisitions, an FDIC-assisted acquisition, and the acquisition of a mortgage company and a wealth management company. Additionally, the Company has a demonstrated track record of consistent organic growth in assets and profitability since its inception by hiring and developing skilled personnel, and creating and maintaining a solid infrastructure to support continued business growth on a sound basis.
WashingtonFirst’s business strategy is to provide its customers with highly qualified personal and customized service utilizing effective technology solutions and delivery channels. The Bank’s marketing efforts are directed to prospective clients who value high quality service and who are, or have the potential to become, highly profitable. WashingtonFirst’s view of the financial services market is that community banks must be effective in providing quality, tailored services to their customers rather than competing with large national institutions on a head-to-head basis for broad-based consumer business.
Revenues are primarily derived from interest and fees received in connection with loans, deposits, and investments, as well as mortgage banking and wealth advisory fees. Major expenses include compensation and employee benefits, interest expense on deposits and borrowings, and operating expenses.
Products and Services
The Bank offers a comprehensive range of commercial banking products and services to small-to-medium sized businesses, not-for-profit organizations, professional service firms and individuals in the greater Washington, D.C. metropolitan area. The Mortgage Company provides residential mortgage lending services to customers in the Washington, D.C. metropolitan and greater mid-Atlantic areas. Wealth Advisors specializes in assisting select affluent business owners, executives and families preserve and grow their wealth, providing comprehensive wealth management and business retirement plan services. More information on WashingtonFirst’s services is available on-line at www.wfbi.com.
Business and Consumer Lending
WashingtonFirst’s lending activities include commercial real estate loans, residential real estate loans, commercial and industrial loans, construction and development loans and consumer loans. Loans originated by the Bank are primarily classified as loans held for investment. Loans originated by the Mortgage Company are primarily classified as loans held for sale.
Lending activities are subject to lending limits imposed by federal and state law. While different limits apply in certain circumstances based on the type of loan, the Bank’s lending limit to any one borrower on loans that are not fully secured by readily marketable or other permissible collateral generally is equal to 15 percent of the Bank’s unimpaired capital and surplus. As of December 31, 2016, the Bank’s legal lending limit was $32.2 million. For loan amounts exceeding WashingtonFirst’s legal lending limits or internal lending policies, the Bank has established relationships with various correspondent banks to sell loan participations.
WashingtonFirst has an established credit policy that includes procedures for underwriting each type of loan and lending personnel have been assigned specific loan approval authorities based upon their experience. Loans in excess of an individual loan officer’s authority are presented to the OLC or ELC for approval. The OLC and ELC each meet weekly to facilitate a timely approval process for WashingtonFirst’s clients. Loans are approved based on the borrower’s capacity for credit, collateral and sources of repayment. Loans are actively monitored to detect any potential performance issues. WashingtonFirst manages its loans within the context of a risk grading system developed by management based upon extensive experience in administering loan portfolios in its market. Payment performance is carefully monitored for all loans. When loan repayment is dependent upon an operating business or investment real estate, periodic financial reports, site visits and select asset verification procedures are used to ensure that WashingtonFirst accurately rates the relative risk of its assets. Based upon criteria established by management and the Bank’s board
6
of directors, the degree of monitoring is escalated or relaxed for any given borrower based upon WashingtonFirst’s assessment of the future repayment risk.
Acquisition, Development & Construction Loans. These loans generally fall into one of four types: first, loans to construct owner-occupied commercial buildings; second, loans to individuals that are ultimately used to acquire property and construct an owner-occupied residence; third, loans to builders for the purpose of acquiring property and constructing homes for sale to consumers; and fourth, loans to developers for the purpose of acquiring land to be developed into finished lots for the ultimate construction of residential or commercial buildings. Loans of these types are generally secured by the subject property within limits established by WashingtonFirst’s board of directors based upon an assessment of market conditions and updated from time to time. The loans typically carry recourse to principal borrowers. In addition to the repayment risk associated with loans to individuals and businesses, loans in this category carry construction completion risk. To address this additional risk, loans of this type are subject to additional administrative procedures designed to verify and ensure progress of the project in accordance with allocated funding, project specifications and time frames.
Commercial Real Estate Loans. These loans generally fall into one of three categories: loans supporting owner-occupied commercial property; loans supporting properties used by non-profit organizations such as trade associations, churches or charter schools where repayment is dependent upon the cash flow of the non-profit organizations; and loans supporting a commercial property leased to third parties for investment. Commercial real estate loans are secured by the subject property and underwritten to policy standards. Policy standards, approved by WashingtonFirst’s board of directors from time to time, set forth, among other considerations, loan to value limits, cash flow coverage ratios, and standards governing the general creditworthiness of the obligors. Loans secured by commercial real estate originated by the Bank are primarily classified as loans held for investment.
Residential Real Estate Loans. Through the Mortgage Company, WashingtonFirst offers a variety of competitive mortgage loan products to homeowners and investors of 1-4 family properties. Mortgage loans originated are generally sold in the secondary market through purchase agreements with institutional investors with servicing released. Loans in these categories are underwritten to standards within a traditional consumer framework that is periodically reviewed and updated by management and the board of directors, and includes such considerations as repayment source and capacity, collateral value, credit history, savings pattern, and stability. The Mortgage Company’s activities rely on insurance provided by HUD and the VA. In addition, the Mortgage Company underwrites mortgage loans in accordance with guidelines for programs under Fannie Mae and Freddie Mac that make these loans marketable in the secondary market.
Commercial and Industrial Loans. These loans are to businesses or individuals for business purposes. Typically the loan proceeds are used to support working capital and the acquisition of fixed assets of an operating business or to refinance a loan payable to another financial institution that was originally made for a similar purpose. Each loan is underwritten based upon WashingtonFirst’s assessment of the obligor’s ability to generate operating cash flow in the future necessary to repay the loan. To address the risks associated with the uncertainties of future cash flow, these loans are generally secured by assets owned by the business or its principal shareholders and the principal shareholders are typically required to guarantee the loan.
Consumer Loans. Consumer loans are loans to individuals for a stated purpose such as to finance a car or boat, to refinance debt, or to fund general working capital needs. These loans are generally extended in a single disbursement and repaid over a specified period of time. Most loans are well secured with assets other than real estate, such as marketable securities or automobiles. In general, management discourages unsecured lending. Loans in this category are underwritten to standards within a traditional consumer framework that is periodically reviewed and updated by WashingtonFirst’s management and board of directors, and includes such considerations as repayment source and capacity, collateral value, credit history, savings pattern, and stability.
Deposit Services
Deposits are the primary source of funding for the Bank. The Bank offers an array of traditional banking products and services which are priced competitively. Deposit services include business and personal checking, NOW accounts, tiered savings and money market and time deposit accounts with varying maturity structures and customer options. A complete individual retirement account program is also available. The Bank also participates in the CDARS program which functions to assure full FDIC insurance for participating Bank customers.
Deposit services include cash management services such as electronic banking, sweep accounts, lockbox, account reconciliation services, merchant card depository, safe deposit boxes, remote deposit capture and ACH origination. After hour depository and ATM services are also available. In addition, the Bank offers a full range of on-line banking services for both personal and commercial accounts and has a mobile banking application for both.
7
Wealth Management
Through its wholly owned subsidiary, Wealth Advisors, the Company offers fee based investment advisory services to high net worth individuals, business owners and executives, and families to preserve and grow their wealth. In addition, the Company provides financial and retirement planning services. Custodial services are offered through third party contractual arrangements with Pershing Securities and Charles Schwab Securities. Wealth Advisors maintains offices in Fairfax, Virginia.
Employees
At December 31, 2016, WashingtonFirst had 253 employees, of which 178 were employees of the Bank, 69 were employees of the Mortgage Company, and 6 were employees of Wealth Advisors; compared to 220 employees of the Bank as of December 31, 2015. None of WashingtonFirst’s employees is subject to a collective bargaining agreement. Management considers employee relations to be good. The Company provides employees with a comprehensive employee benefit program which includes group life, health and dental insurance, paid time off, sick leave, educational opportunities, a cash incentive plan, an equity award incentive plan for key employees, and a 401(k) plan with discretionary employer match.
Market Area and Competition
WashingtonFirst serves the greater Washington, D.C. metropolitan area. With a population of more than 7 million, the region is the 5th largest market in the U.S. Our market area is economically diverse, well-educated, has one of the highest levels of household income in the nation, and has low unemployment relative to most other regions. Significant business sectors include federal and local government, professional and business services, education, health, leisure and hospitality, as well as non-profit trade associations, universities and major hospital systems. The Company experiences strong competition in all aspects of its business, competing with other banks and non-bank financial institutions (e.g., savings and loan associations, credit unions, small loan companies, finance companies, and mortgage companies) that offer similar services in its market area. Much of this competition comes from larger financial institutions headquartered outside the region, each of which has greater financial and other resources than WashingtonFirst and is able to conduct large advertising campaigns and offer incentives. To attract business in this competitive environment, WashingtonFirst offers a full array of competitively priced, traditional community bank products and services, and relies on personal contact by its officers and directors, local promotional activities, and the ability to provide personally tailored services to small businesses and professionals.
Regulation
Financial institutions and their holding companies are extensively regulated under federal and state law. Consequently, the growth and earnings performance of the Company and its subsidiaries can be affected not only by management decisions and general economic conditions, but also by the statutes administered by, and the regulations and policies of, various governmental regulatory authorities including, but not limited to, the Bureau, the Federal Reserve, the FDIC, the SEC, HUD, certain state securities commissions, U.S. Treasury, as well as federal and state taxing authorities. The effect of such statutes, regulations and policies can be significant, and cannot be predicted with a high degree of certainty.
The following description summarizes some of the laws to which the Company and its subsidiaries are subject. References herein to applicable statutes and regulations are brief summaries thereof, do not purport to be complete, and are qualified in their entirety by reference to such statutes and regulations. Any change in applicable law or regulations may have a material effect on the business of the Company and its subsidiaries.
WashingtonFirst Bankshares, Inc.
The Company is a bank holding company registered under the BHC Act and subject to supervision, regulation and examination by the Federal Reserve. The BHC Act and other federal laws subject bank holding companies to particular restrictions on the types of activities in which they may engage, and to a range of supervisory requirements and activities, including regulatory enforcement actions for violations of laws and regulations. The Company is registered in Virginia with the Bureau under the financial institution holding company laws of Virginia and is subject to regulation and supervision by the Bureau. The Company is also subject to the disclosure and regulatory requirements of the Securities Act and the Exchange Act, both as administered by the SEC. As a company with securities listed in the NASDAQ, it is subject to the rules of the NASDAQ for listed companies.
Generally, the Company is prohibited, with certain limited exceptions, from acquiring a direct or indirect interest in or control of more than 5.0 percent of the voting shares of any company which is not a bank or financial or bank holding company and from engaging directly or indirectly in activities other than those of banking, managing or controlling banks or furnishing services to its subsidiary banks, except the Company may engage in and may own shares of companies engaged in certain activities found by the Federal Reserve to be so closely related to banking or managing and controlling banks as to be a proper incident thereto. In approving acquisitions by bank holding companies of companies engaged in banking- related activities or the addition of activities, the Federal Reserve considers a number of factors and weighs the expected benefits to the public (such as greater convenience, increased
8
competition, or gains in efficiency) against the risks of possible adverse effects (such as undue concentration of resources, decreased or unfair competition, conflicts of interest or unsound banking practices).
The GLB Act allows a bank holding company or other company to certify status as a financial holding company, which allows such company to engage in activities that are financial in nature, that are incidental to such activities, or are complementary to such activities. The GLB Act enumerates certain activities that are deemed financial in nature, such as underwriting insurance or acting as an insurance principal, agent or broker, underwriting, dealing in or making markets in securities, and engaging in merchant banking under certain restrictions. It also authorizes the Federal Reserve Board to determine by regulation what other activities are financial in nature, or incidental or complementary thereto. The GLB Act allows a wider array of companies to own banks, which could result in companies with resources substantially in excess of the Company's entering into competition with the Company and the Bank. The Company has not elected financial holding company status.
Bank holding companies are not permitted to engage in unsafe and unsound banking practices. The Federal Reserve’s Regulation Y, for example, generally requires a holding company to give the Federal Reserve prior notice of any redemption or repurchase of its own equity securities, if the consideration to be paid, together with the consideration paid for any repurchases or redemptions in the preceding year, is equal to 10.0 percent or more of its consolidated net worth. The Federal Reserve may oppose the transaction if it believes that the transaction would constitute an unsafe or unsound practice or would violate any law or regulation. Depending upon the circumstances, the Federal Reserve could take the position that paying a dividend would constitute an unsafe or unsound banking practice.
The Federal Reserve has broad authority to prohibit activities of bank holding companies and their non-banking subsidiaries which represent unsafe and unsound banking practices or which constitute violations of laws or regulations, and can assess civil money penalties for violation of laws, regulations or orders, for participation in an unsafe or unsound practice or breach of fiduciary duty.
Regulatory Restrictions on Dividends; Source of Strength. The Company is regarded as a legal entity separate and distinct from the Bank. The principal source of the Company’s revenue is dividends received from the Bank. As described in more detail below, both state and federal law place limitations on the amount that banks may pay in dividends, which the Bank must adhere to when paying dividends to the Company. It is the policy of the Federal Reserve that bank holding companies should pay cash dividends on common stock only out of income earned over the past year and only if prospective earnings retention is consistent with the organization’s expected future needs and financial condition. The policy provides that bank holding companies should not pay cash dividends at levels that undermine the bank holding company’s ability to serve as a source of strength to its banking subsidiaries. Given the current financial and economic environment, the Federal Reserve has indicated that bank holding companies should carefully review their dividend policy in relation to the organization’s overall asset quality, level of current and prospective earnings, and composition, level and quality of capital. The guidance provides that the Company inform and consult with the Federal Reserve prior to declaring and paying a dividend that exceeds earnings for the period for which the dividend is being paid or that could result in an adverse change to the Company’s capital structure. See Part II, Item 5, “Market for Registrant’s Common Equity, Related Shareholder Matters and Issuer Purchases of Equity Securities-Dividend Policy.”
Virginia state law also restricts dividends to shareholders of the Company. The Company’s shareholders are entitled to receive dividends if, as and when declared by the Company’s Board of Directors in accordance with Section 13.1-653 of the Code of Virginia. Generally, dividends may be paid out of surplus or, if there is no surplus, out of net profits for the fiscal year in which the dividend is declared and/or the preceding fiscal year.
Under Federal Reserve policy, a bank holding company has historically been required to act as a source of financial strength to each of its banking subsidiaries. The Dodd-Frank Act, codifies this policy as a statutory requirement. The Company is required to commit resources to support the Bank, and this obligation may arise at times when the Company may not be in a financial position to provide such resources. Any capital loans by a bank holding company to any of its subsidiary banks are subordinate in right of payment to deposits and to certain other indebtedness of such subsidiary banks. As discussed below, a bank holding company, in certain circumstances, could be required to guarantee the capital plan of an undercapitalized banking subsidiary.
In the event of a bank holding company’s bankruptcy under Chapter 11 of the U.S. Bankruptcy Code, the trustee will be deemed to have assumed and will be required to cure immediately any deficit under any commitment by the debtor holding company to any of the federal banking agencies to maintain the capital of the insured depository institution. Any claim for breach of such obligation will generally have priority over most other unsecured claims.
Anti-Tying Restrictions. Bank holding companies and their affiliates are prohibited from tying the provision of certain services, such as extensions of credit, to other non-banking services offered by a holding company or its affiliates.
Volcker Rule. The Dodd-Frank Act bars banking organizations, such as the Company, from engaging in proprietary trading and from sponsoring and investing in hedge funds and private equity funds, except as permitted under certain circumstances, pursuant to a provision commonly referred to as the “Volcker Rule.” Under the Dodd-Frank Act, proprietary trading generally means trading by a banking entity or its affiliate for its trading account. The Volcker Rule restrictions apply to the Company and its subsidiaries.
9
Capital Adequacy Requirements. The Federal Reserve has adopted a system using risk-based capital guidelines under a two-tier capital framework to evaluate the capital adequacy of bank holding companies. Tier 1 capital generally consists of common shareholders’ equity, retained earnings, a limited amount of qualifying perpetual preferred stock, qualifying trust preferred securities and non-controlling interests in the equity accounts of consolidated subsidiaries, less goodwill and certain intangibles. Tier 2 capital generally consists of certain hybrid capital instruments and perpetual debt, mandatory convertible debt securities and a limited amount of subordinated debt, qualifying preferred stock, loan loss allowance, and unrealized holding gains on certain equity securities.
Under the guidelines, specific categories of assets are assigned different risk weights, based generally on the perceived credit risk of the asset. These risk weights are multiplied by corresponding asset balances to determine a “risk-weighted” asset base. The guidelines require a minimum total risk-based capital ratio of 8.0 percent (of which at least 4.0 percent is required to consist of Tier 1 capital elements). Total capital is the sum of Tier 1 and Tier 2 capital. In addition to the risk-based capital guidelines, the Federal Reserve uses a leverage ratio as an additional tool to evaluate the capital adequacy of bank holding companies. The leverage ratio is a company’s Tier 1 capital divided by its average total consolidated assets. Certain highly rated bank holding companies may maintain a minimum leverage ratio of 3.0 percent, but other bank holding companies are required to maintain a leverage ratio of at least 4.0 percent.
Additional information on WashingtonFirst’s capital ratios may be found in Part II, Item 7 - “Management Discussion & Analysis” under the heading “Capital Resources” and in Part II, Item 8 - “Notes to the Consolidated Financial Statements”, and is incorporated herein by reference.
See “WashingtonFirst Bank” below for more specifics on capital requirements.
Basel III Capital Adequacy Requirements. In December 2010, the Basel Committee on Banking Supervision released its final framework for strengthening international capital and liquidity regulation ("Basel III"). The regulations adopted by the U.S. federal bank regulatory agencies, when fully phased-in, will require bank holding companies and their bank subsidiaries to maintain more capital, with a greater emphasis on common equity. In July 2013, the Federal Reserve and FDIC issued a final rule implementing Basel III capital requirements as well as certain other regulatory capital and other requirements under the Dodd-Frank Act. The rules apply to all insured depository institutions and bank holding companies with consolidated assets over $500 million, such as WashingtonFirst. In broad terms, the regulations increase the required quality and quantity of the capital base, reduce the range of instruments that count as capital and increase the risk-weighted asset assessment for certain types of activities. The Company and the Bank are obligated to maintain higher capital ratios as the new regulatory standards were phased in beginning on January 1, 2015. The Company remains well capitalized under Basel III.
The Company’s $25 million 6% fixed-to-floating subordinated notes due 2025 are intended to qualify for Tier II capital treatment under Basel III.
See “WashingtonFirst Bank” below for more specifics on Basel III.
Imposition of Liability for Undercapitalized Subsidiaries. Bank regulators are required to take “prompt corrective action” to resolve problems associated with insured depository institutions whose capital declines below certain levels. In the event an institution becomes “undercapitalized,” it must submit a capital restoration plan. The capital restoration plan will not be accepted by the regulators unless each company having control of the undercapitalized institution guarantees the subsidiary’s compliance with the capital restoration plan up to a certain specified amount. Any such guarantee from a depository institution’s holding company is entitled to a priority of payment in bankruptcy.
The aggregate liability of the holding company of an undercapitalized bank is limited to the lesser of 5 percent of the institution’s assets at the time it became undercapitalized or the amount necessary to cause the institution to be adequately capitalized. The bank regulators have greater power in situations where an institution becomes significantly or critically undercapitalized or fails to submit a capital restoration plan. For example, a bank holding company controlling such an institution can be required to obtain prior Federal Reserve approval of proposed dividends, or might be required to consent to a consolidation or to divest the troubled institution or other affiliates.
Acquisitions by Bank Holding Companies. The BHC Act requires every bank holding company to obtain the prior approval of the Federal Reserve before it may acquire all or substantially all of the assets of any bank, or ownership or control of any voting shares of any bank, if after such acquisition it would own or control, directly or indirectly, more than 5 percent of the voting shares of such bank. In approving bank acquisitions by bank holding companies, the Federal Reserve is required to consider the financial and managerial resources and future prospects of the bank holding company and the banks concerned, the convenience and needs of the communities to be served, and various competitive factors. Acquisitions by Virginia bank holding companies are also subject to the provisions of Virginia law.
Control Acquisitions. The Change in Bank Control Act prohibits a person or group of persons from acquiring “control” of a bank holding company unless the Federal Reserve has been notified and has not objected to the transaction. Any entity is required to obtain
10
the approval of the Federal Reserve under the BHC Act before acquiring 25 percent (5 percent in the case of an acquirer that is a bank holding company) or more of a bank holding company’s or bank’s voting securities, or otherwise obtaining control or a controlling influence over the company or bank. Under a rebuttable presumption established by the regulations of the Federal Reserve, the acquisition of 10 percent or more of a class of voting stock of a bank holding company, would, under the circumstances set forth in the presumption, constitute acquisition of control of a bank holding company. The statute and regulations set forth standards and certain presumptions concerning acquisition of control. Acquisitions of control are also subject to regulation by Virginia law.
In most circumstances, an entity that owns 25 percent or more of the total equity of a banking organization owns enough of the capital resources to have a controlling influence over such banking organization for purposes of the BHC Act. On September 22, 2008, the Federal Reserve issued a policy statement on equity investments in banks and bank holding companies. The key statutory limit restricting a non-controlling investor to 24.9 percent of voting securities for purposes of the BHC Act remains, but the policy statement loosens some restrictions on entities within this limit. The provisions of the policy statement generally allow the Federal Reserve to be able to conclude that an entity is not “controlling” if it does not own in excess of 15 percent of the voting power and 33 percent of the total equity of the bank holding company or bank. Depending on the nature of the overall investment and the capital structure of the banking organization, based on the policy statement the Federal Reserve will permit non-controlling investments in the form of voting and nonvoting shares that represent in the aggregate (i) less than one-third of the total equity of the banking organization (and less than one-third of any class of voting securities, assuming conversion of all convertible nonvoting securities held by the entity) and (ii) less than 15 percent of any class of voting securities of the organization.
WashingtonFirst Bank
During 2016, as a Virginia state non-member bank, the Bank was principally supervised, examined and regulated by the Bureau and the FDIC. Because the Bank’s deposits are insured by the FDIC, it is also subject to regulation pursuant to the FRA and FDIA. In January 2017, the Bank became a member of the FRB and will be regulated by the FRB going forward as the Bank’s primary federal regulator. The aspects of its business which are regulated under federal law include security requirements, reserve requirements, investments, transactions with affiliates, amounts it may lend to certain borrowers, business activities in which it may engage and minimum capital requirements. It is also subject to applicable provisions of Virginia law insofar as they do not conflict with and are not preempted by federal law, including laws relating to usury, various consumer and commercial loans and the operation of branch offices. Such supervision and regulation is intended primarily for the protection of depositors, the deposit insurance funds of the FDIC and the banking system as a whole, and not for the protection of WashingtonFirst’s shareholders or creditors. The following references to applicable statutes and regulations are brief summaries which do not purport to be complete and which are qualified in their entirety by references to such statutes and regulations.
Equivalence to National Bank Powers. To the extent that the Virginia laws and regulations may have allowed state-chartered banks to engage in a broader range of activities than national banks, the FDICIA has operated to limit this authority. The FDICIA provides that no state bank or subsidiary thereof may engage as principal in any activity not permitted for national banks, unless the institution complies with applicable capital requirements and the FDIC determines that the activity poses no significant risk to the insurance fund. In general, statutory restrictions on the activities of banks are aimed at protecting the safety and soundness of depository institutions.
Branching. Virginia law provides that a Virginia-chartered bank can establish a branch anywhere in Virginia provided that the branch is approved in advance by The Bureau. The branch must also be approved by the bank’s primary federal regulator. Approval is based on a number of factors, including financial history, capital adequacy, earnings prospects, character of management, needs of the community and consistency with corporate powers. The Dodd-Frank Act permits insured state banks to engage in de novo interstate branching if the laws of the state where the new branch is to be established would permit the establishment of the branch if it were chartered by such state. Currently, the Bank operates branch offices in Virginia, Maryland and Washington, D.C.
Restrictions on Transactions with Affiliates and Insiders. Transactions between the Bank and its non-banking affiliates, including WashingtonFirst and any of its future non-banking subsidiaries, are subject to Section 23A of the Federal Reserve Act. An affiliate of a bank is any company or entity that controls, is controlled by, or is under common control with that bank. In general, Section 23A imposes limits on the amount of such transactions, and also requires certain levels of collateral for loans to affiliated parties. It also limits the amount of advances to third parties which are collateralized by the securities or obligations of WashingtonFirst or its subsidiaries. The Dodd-Frank Act significantly expanded the coverage and scope of the limitations on affiliate transactions within a banking organization.
Affiliate transactions are also subject to Section 23B of the Federal Reserve Act which generally requires certain transactions between the Bank and its affiliates be on terms substantially the same, or at least as favorable to the Bank, as those prevailing at the time for comparable transactions with or involving other non-affiliated persons. The Federal Reserve has also issued Regulation W, which codifies prior pronouncements under Sections 23A and 23B of the Federal Reserve Act and interpretive guidance with respect to affiliate transactions.
11
The restrictions on loans to directors, executive officers, principal shareholders and their related interests (collectively referred to in this section as “insiders”) contained in the FRA and Regulation O apply to all insured depository institutions and their subsidiaries. These restrictions include limits on loans to one borrower and conditions that must be met before such a loan can be made. There is also an aggregate limitation on all loans to insiders and their related interests. In the aggregate, these loans cannot exceed the institution’s total unimpaired capital and surplus, and the FDIC may determine that a lesser amount is appropriate. Insiders are subject to enforcement actions for knowingly accepting loans in violation of applicable restrictions. The Dodd-Frank Act adds new requirements to bank transactions with insiders by requiring that credit exposure to derivatives and certain other transactions be treated as loans for the insider loan and general lending limits.
Restrictions on Distribution of Subsidiary Bank Dividends and Assets. The Bank’s payment of dividends is subject to certain restrictions imposed by federal and state banking laws, regulations and authorities. Dividends paid by the Bank have provided a substantial part of the Company’s operating funds and for the foreseeable future it is anticipated that dividends paid by the Bank to the Company will continue to be the Company’s principal source of operating funds. The Bank’s ability to pay dividends is subject to the restrictions previously described for the Company. In addition, capital adequacy requirements serve to limit the amount of dividends that may be paid by the Bank. Under federal law, the Bank cannot pay a dividend if, after paying the dividend, the Bank will be “undercapitalized.” The FDIC may declare a dividend payment to be unsafe and unsound even though the Bank would continue to meet its capital requirements after the dividend.
Because the Company is a legal entity separate and distinct from its subsidiaries, its right to participate in the distribution of assets of any subsidiary upon the subsidiary’s liquidation or reorganization will be subject to the prior claims of the subsidiary’s creditors. In the event of a liquidation or other resolution of an insured depository institution, the claims of depositors and other general or subordinated creditors are entitled to a priority of payment over the claims of holders of any obligation of the institution to its shareholders, including any depository institution holding company (such as WashingtonFirst) or any shareholder or creditor thereof.
Examinations. The Bank is subject to annual examinations by its primary federal regulator. These examinations review areas such as capital adequacy, reserves, loan portfolio quality and management, consumer and other compliance issues, investments and management practices. Based upon such an evaluation, bank regulators may revalue the assets of the institution and require that it establish specific reserves to compensate for the difference between the regulator-determined value and the book value of such assets. The Bureau also conducts examinations of state banks but may accept the results of a federal examination in lieu of conducting an independent examination. In addition, federal and state regulators may elect to conduct a joint examination.
In addition to these regular exams, an insured bank is required to furnish quarterly and annual reports to its primary federal regulator. Regulators may exercise cease and desist or other supervisory powers over an insured bank if its actions represent unsafe or unsound practices or violations of law. Further, any proposed addition of any individual to the board of directors of the Bank or the employment of any individual as a senior executive officer of the Bank, or the change in responsibility of such an officer, will be subject to 90 days prior written notice to its federal regulator if the Bank is not in compliance with the applicable minimum capital requirements, is otherwise a troubled institution or the regulators determines that such prior notice is appropriate for the Bank. The regulators then has the opportunity to disapprove any such appointment.
Audit Reports. Pursuant to Part 363 of the FDIC rules and regulations, insured institutions with total assets of $500.0 million or more must submit annual audit reports prepared by independent auditors to federal and state regulators. In some instances, the audit report of the institution’s holding company can be used to satisfy this requirement. Auditors must receive examination reports, supervisory agreements and reports of enforcement actions. For institutions with total assets of $1.0 billion or more, financial statements prepared in accordance with generally accepted accounting principles, management’s certifications concerning responsibility for the financial statements, internal controls and compliance with legal requirements designated by the Bank’s primary federal regulator, and an attestation by the auditor relating to the internal controls must be submitted. For institutions with total assets of more than $3.0 billion, independent auditors may be required to review quarterly financial statements. FDICIA requires that independent audit committees be formed, consisting of outside directors only. The committees of such institutions must include members with experience in banking or financial management, must have access to outside counsel, and must not include representatives of large customers.
Change in Control. The Change in Bank Control Act and regulations promulgated by the FDIC require that, depending on the particular circumstances, notice must be furnished to the FDIC and not disapproved prior to any person or group of persons acquiring “control” of an insured bank, subject to exemptions for certain transactions. For purposes of the Change in Bank Control Act, control is conclusively presumed to exist if a person acquires the power to vote, directly or indirectly, 25 percent or more of any class of voting securities of the bank. In addition, the term includes the power to direct the management and policies of the bank. Control is rebuttably presumed to exist if a person acquires 10 percent or more but less than 25 percent of any class of voting securities and either the bank has registered securities under Section 12 of the Exchange Act, or no other person will own a greater percentage of that class of voting securities immediately after the transaction. The regulations provide a procedure for challenging the rebuttable control presumption. Acquisitions of control are also subject to the provisions of Virginia law.
12
Capital Adequacy Requirements. Similar to the Federal Reserve’s requirements for bank holding companies, the FDIC has adopted regulations establishing minimum requirements for the capital adequacy of insured banks. The FDIC’s risk-based and leverage ratios are minimum supervisory ratios generally applicable to banking organizations that meet certain specified criteria. Banking organizations not meeting these criteria are expected to operate with capital positions well above the minimum ratios. The federal bank regulatory agencies may set capital requirements for a particular banking organization that are higher than the minimum ratios when circumstances warrant. Regulatory guidelines also provide that banking organizations experiencing internal growth or making acquisitions will be expected to maintain strong capital positions substantially above the minimum supervisory levels, without significant reliance on intangible assets.
The FDIC’s regulations require insured banks to have and maintain a “Tier 1 risk-based capital” ratio of at least 4.0 percent and a “total risk-based capital” ratio of at least 8.0 percent of total risk-adjusted assets. Assets are adjusted under the risk-based guidelines to take into account different risk characteristics, with the categories ranging from zero percent (requiring no risk-based capital) for assets such as cash, to 100 percent for the bulk of assets which are typically held by a bank holding company, including certain multi-family residential and commercial real estate loans, commercial business loans and consumer loans. Residential first mortgage loans on one to four family residential real estate and certain seasoned multi-family residential real estate loans, which are not 90 days or more past due or nonperforming and which have been made in accordance with prudent underwriting standards are assigned a 50% level in the risk-weighing system, as are certain privately-issued mortgage-backed securities representing indirect ownership of such loans. Off-balance sheet items also are adjusted to take into account certain risk characteristics. Total risk-based capital represents the sum of Tier 1 capital and Tier 2 capital, as those terms are defined in the regulations.
The FDIC also requires insured banks to meet a minimum “leverage ratio” of Tier 1 capital to total assets of not less than 3.0 percent for a bank that is not anticipating or experiencing significant growth and is highly rated (i.e., has a composite rating of 1 on a scale of 1 to 5). Banks that the FDIC determines are anticipating or experiencing significant growth or that are not highly rated must meet a minimum leverage ratio of 4.0 percent.
Basel III Capital Requirements. Basel III became applicable to the Company and the Bank on January 1, 2015. The Basel III final capital framework, among other things, (i) introduced as a new capital measure "CET1", (ii) specified that Tier 1 capital consists of CET1 and "Additional Tier 1 capital" instruments meeting specified requirements, (iii) defined CET1 narrowly by requiring that most adjustments to regulatory capital measures be made to CET1 and not to the other components of capital and (iv) expanded the scope of the adjustments as compared to existing regulations.
When fully phased in by January 1, 2019, Basel III will require banks to maintain: (i) as a newly adopted international standard, a minimum ratio of CET1 to risk-weighted assets of at least 4.5%, plus a "capital conservation buffer" of 2.5%; (ii) a minimum ratio of Tier 1 capital to risk-weighted assets of at least 6.0%, plus the capital conservation buffer, or 8.5%; (iii) a minimum ratio of Total (Tier 1 plus Tier 2) capital to risk-weighted assets of at least 8.0% plus the capital conservation buffer, or 10.5%; and (iv) as a newly adopted international standard, a minimum leverage ratio of 3.0%, calculated as the ratio of Tier 1 capital to balance sheet exposures plus certain off-balance sheet exposures (computed as the average for each quarter of the month-end ratios for the quarter).
Basel III also provides for a "countercyclical capital buffer," generally to be imposed when national regulators determine that excess aggregate credit growth becomes associated with a buildup of systemic risk that would be a CET1 add-on to the capital conservation buffer in the range of 0% to 2.5% when fully implemented. The capital conservation buffer is designed to absorb losses during periods of economic stress. Banking institutions with a ratio of CET1 to risk-weighted assets above the minimum but below the conservation buffer (or below the combined capital conservation buffer and countercyclical capital buffer, when the latter is applied) may face constraints on their ability to pay dividends, effect equity repurchases and pay discretionary bonuses to executive officers, which constraints vary based on the amount of the shortfall. The capital conservation buffer requirement was phased in beginning January 1, 2016, at 0.625% of risk-weighted assets, and will increase each year until fully implemented at 2.5% on January 1, 2019.
The Basel III framework provides for a number of new deductions from and adjustments to CET1. These include, for example, the requirement that mortgage servicing rights, deferred tax assets dependent upon future taxable income and significant investments in non-consolidated financial entities be deducted from CET1 to the extent that any one such category exceeds 10% of CET1 or all such categories in the aggregate exceed 15% of CET1.
As part of the definition of CET1 capital, Basel III includes a requirement that banking institutions include the amount of AOCI (consisting primarily of unrealized gains and losses on available for sale securities, which are not required to be treated as other-than-temporary impairment, net of tax) in calculating regulatory capital, unless the institution makes a one-time opt-out election from this provision in connection with the filing of its first regulatory reports after applicability of Basel III to that institution. Basel III also proposes a 4% minimum leverage ratio. The Company and Bank elected to exclude AOCI in calculating regulatory capital.
Basel III also makes changes to the manner of calculating risk-weighted assets. New methodologies for determining risk-weighted assets in the general capital rules are included, including revisions to recognition of credit risk mitigation, and a greater recognition of financial collateral and a wider range of eligible guarantors. These also include risk-weighting of equity exposures and past due loans; and higher (greater than 100%) risk-weighting for certain commercial real estate exposures that have higher credit risk profiles,
13
including higher loan to value and equity components. In particular, loans categorized as loans HVCRE loans are required to be assigned a 150% risk-weighting, and require additional capital support. HVCRE loans are defined to include any credit facility that finances or has financed the acquisition, development or construction of real property, unless it finances 1-4 family residential properties; certain community development investments; agricultural land used or usable for, and whose value is based on, agricultural use; or commercial real estate projects in which: (i) the LTV is less than the applicable maximum supervisory LTV ratio established by the bank regulatory agencies; (ii) the borrower has contributed cash or unencumbered readily marketable assets, or has paid development expenses out of pocket, equal to at least 15% of the appraised "as completed" value; (iii) the borrower contributes its 15% before the bank advances any funds; and (iv) the capital contributed by the borrower, and any funds internally generated by the project, are contractually required to remain in the project until the facility is converted to permanent financing, sold or paid in full.
Overall, the Company believes that implementation of Basel III has not had a material adverse effect on the Company's or the Bank's capital ratios, earnings, shareholder's equity, or its ability to pay dividends, effect stock repurchases or pay discretionary bonuses to executive officers. See Part II, Item 7., “Capital Resources.”
Prompt Corrective Action. Under Section 38 of the FDIA, each federal banking agency is required to implement a system of prompt corrective action for institutions which it regulates. The federal banking agencies have promulgated substantially similar regulations to implement the system of prompt corrective action established by Section 38 of the FDIA. Basel III integrates the new capital requirements into the prompt corrective action category definitions. The following capital requirements apply to the Company for purposes of Section 38.
Capital Category | Total Risk-Based Capital Ratio | Tier 1 Risk-Based Capital Ratio | Common Equity Tier 1 Capital Ratio | Leverage Ratio | Tangible Equity to Assets | Supplemental Leverage Ratio |
Well Capitalized | 10% or greater | 8% or greater | 6.5% or greater | 5% or greater | n/a | n/a |
Adequately Capitalized | 8% or greater | 6% or greater | 4.5% or greater | 4% or greater | n/a | 3% or greater |
Undercapitalized | Less than 8% | Less than 6% | Less than 4.5% | Less than 4% | n/a | Less than 3% |
Significantly Undercapitalized | Less than 6% | Less than 4% | Less than 3% | Less than 3% | n/a | n/a |
Critically Undercapitalized | n/a | n/a | n/a | n/a | Less than 2% | n/a |
Based on the most recent notification from the FDIC, the Bank was classified as “well capitalized” for purposes of the FDIC’s prompt corrective action regulations.
An institution generally must file a written capital restoration plan which meets specified requirements with an appropriate federal banking agency within 45 days of the date the institution receives notice or is deemed to have notice that it is undercapitalized, significantly undercapitalized or critically undercapitalized. A federal banking agency must provide the institution with written notice of approval or disapproval within 60 days after receiving a capital restoration plan, subject to extensions by the applicable agency.
An institution which is required to submit a capital restoration plan must concurrently submit a performance guaranty by each company that controls the institution. Such guaranty shall be limited to the lesser of (i) an amount equal to 5.0% of the institution's total assets at the time the institution was notified or deemed to have notice that it was undercapitalized or (ii) the amount necessary at such time to restore the relevant capital measures of the institution to the levels required for the institution to be classified as adequately capitalized. Such a guaranty shall expire after the federal banking agency notifies the institution that it has remained adequately capitalized for each of four consecutive calendar quarters. An institution which fails to submit a written capital restoration plan within the requisite period, including any required performance guaranty, or fails in any material respect to implement a capital restoration plan, shall be subject to the restrictions in Section 38 of the FDIA which are applicable to significantly undercapitalized institutions.
A "critically undercapitalized institution" is to be placed in conservatorship or receivership within 90 days unless the FDIC formally determines that forbearance from such action would better protect the deposit insurance fund. Unless the FDIC or other appropriate federal banking regulatory agency makes specific further findings and certifies that the institution is viable and is not expected to fail, an institution that remains critically undercapitalized on average during the fourth calendar quarter after the date it becomes critically undercapitalized must be placed in receivership. The general rule is that the FDIC will be appointed as receiver within 90 days after a bank becomes critically undercapitalized unless extremely good cause is shown and an extension is agreed to by the federal regulators. In general, good cause is defined as capital, which has been raised and is imminently available for infusion into the Bank except for certain technical requirements, which may delay the infusion for a period of time beyond the 90 day time period.
Immediately upon becoming undercapitalized, an institution shall become subject to the provisions of Section 38 of the FDIA, which (i) restrict payment of capital distributions and management fees; (ii) require that the appropriate federal banking agency monitor the
14
condition of the institution and its efforts to restore its capital; (iii) require submission of a capital restoration plan; (iv) restrict the growth of the institution's assets; and (v) require prior approval of certain expansion proposals. The appropriate federal banking agency for an undercapitalized institution also may take any number of discretionary supervisory actions if the agency determines that any of these actions is necessary to resolve the problems of the institution at the least possible long-term cost to the deposit insurance fund, subject in certain cases to specified procedures. These discretionary supervisory actions include: requiring the institution to raise additional capital; restricting transactions with affiliates; requiring divestiture of the institution or the sale of the institution to a willing purchaser; and any other supervisory action that the agency deems appropriate. These and additional mandatory and permissive supervisory actions may be taken with respect to significantly undercapitalized and critically undercapitalized institutions.
Additionally, under Section 11(c)(5) of the FDIA, a conservator or receiver may be appointed for an institution where: (i) an institution's obligations exceed its assets; (ii) there is substantial dissipation of the institution's assets or earnings as a result of any violation of law or any unsafe or unsound practice; (iii) the institution is in an unsafe or unsound condition; (iv) there is a willful violation of a cease-and-desist order; (v) the institution is unable to pay its obligations in the ordinary course of business; (vi) losses or threatened losses deplete all or substantially all of an institution's capital, and there is no reasonable prospect of becoming "adequately capitalized" without assistance; (vii) there is any violation of law or unsafe or unsound practice or condition that is likely to cause insolvency or substantial dissipation of assets or earnings, weaken the institution's condition, or otherwise seriously prejudice the interests of depositors or the insurance fund; (viii) an institution ceases to be insured; (ix) the institution is undercapitalized and has no reasonable prospect that it will become adequately capitalized, fails to become adequately capitalized when required to do so, or fails to submit or materially implement a capital restoration plan; or (x) the institution is critically undercapitalized or otherwise has substantially insufficient capital.
Deposit Insurance Assessments. The Bank’s deposits are insured by the FDIC through the DIF, to the extent provided by law, and the Bank must pay assessments to the FDIC for such deposit insurance protection. The FDIC maintains the DIF by designating a required reserve ratio. If the reserve ratio falls below the designated level, the FDIC must adopt a restoration plan that provides that the DIF will return to an acceptable level generally within five years. The designated reserve ratio is currently set at 2.0 percent. The FDIC has the discretion to price deposit insurance according to the risk for all insured institutions regardless of the level of the reserve ratio. The DIF reserve ratio is maintained by assessing depository institutions an insurance premium based upon statutory factors. Under its current regulations, the FDIC imposes assessments for deposit insurance according to a depository institution’s ranking in one of four risk categories based upon supervisory and capital evaluations. The assessment rate for an individual institution is determined according to a formula based on a combination of weighted average CAMELS component ratings, financial ratios and, for institutions that have long-term debt ratings, the average ratings of its long-term debt. The assessment base is determined using average consolidated total assets minus average tangible equity rather than using adjusted domestic deposits. Current assessment rates, calculated on the revised assessment base, generally range from 2.5 to 9 basis points for Risk Category I institutions, 9 to 24 basis points for Risk Category II institutions, 18 to 33 basis points for Risk Category III institutions, and 30 to 45 basis points for Risk Category IV institutions. For large institutions (generally those with total assets of $10 billion or more), which does not include the Bank, the initial base assessment rate ranges from 5 to 35 basis points on an annualized basis. After the effect of potential base-rate adjustments, the total base assessment rate could range from 2.5 to 45 basis points on an annualized basis. Assessment rates for large institutions are calculated using a scorecard that combines CAMELS ratings and certain forward-looking financial measures to assess the risk a large institution poses to the DIF.
Enforcement Powers. The FDIC and the other federal banking agencies have broad enforcement powers, including the power to terminate deposit insurance, impose substantial fines and other civil and criminal penalties and appoint a conservator or receiver. Failure to comply with applicable laws, regulations and supervisory agreements could subject WashingtonFirst or the Bank, as well as officers, directors and other institution-affiliated parties of these organizations, to administrative sanctions and potentially substantial civil money penalties. In addition to the grounds discussed above under “–Corrective Measures for Capital Deficiencies,” the appropriate federal banking agency may appoint the FDIC (or the FDIC may appoint itself, under certain circumstances) as conservator or receiver for a banking institution if any one or more of a number of circumstances exist, including, without limitation, the fact that the banking institution is undercapitalized and has no reasonable prospect of becoming adequately capitalized, fails to become adequately capitalized when required to do so, fails to submit a timely and acceptable capital restoration plan or materially fails to implement an accepted capital restoration plan. The Bureau also has broad enforcement powers over the Bank, including the power to impose orders, remove officers and directors, impose fines and appoint supervisors and conservators.
Brokered Deposit Restrictions. Adequately capitalized institutions cannot accept, renew or roll over brokered deposits except with a waiver from the FDIC, and are subject to restrictions on the interest rates that can be paid on any deposits. Undercapitalized institutions may not accept, renew, or roll over brokered deposits. As previously noted, the Bank is categorized as “well capitalized.”
Concentrated Commercial Real Estate Lending Regulations. The federal banking agencies, including the FDIC, have promulgated guidance governing financial institutions with concentrations in commercial real estate lending. The guidance provides that a bank has a concentration in commercial real estate lending if (i) total reported loans for construction, land development, and other land represent 100 percent or more of total capital, or (ii) total reported loans secured by multifamily and non-owner occupied, non-farm residential properties and loans for construction, land development, and other land represent 300 percent or more of total capital and
15
the bank’s commercial real estate loan portfolio has increased 50 percent or more during the prior 36 months. If a concentration is present, management must employ heightened risk management practices that address the following key elements: board and management oversight and strategic planning, portfolio management, development of underwriting standards, risk assessment and monitoring through market analysis and stress testing, and maintenance of increased capital levels as needed to support the level of commercial real estate lending. The Bank has a high concentration of real estate loans and has implemented heightened risk management practices to monitor and control its exposure. Such risk management practices include but are not limited to: the establishment of an active credit quality process, detailed reporting and analysis, stress testing of the loan portfolio, and a robust credit workout process.
Community Reinvestment Act. The CRA and the corresponding regulations are intended to encourage banks to help meet the credit needs of their service area, including low and moderate income neighborhoods, consistent with the safe and sound operations of the banks. These regulations also provide for regulatory assessment of a bank’s record in meeting the needs of its service area when considering applications to acquire the assets and assume the liabilities of another bank. Federal banking agencies are required to make public a rating of a bank’s performance under the CRA. In the case of a bank holding company, the CRA performance record of the banks involved in the transaction are reviewed in connection with the filing of an application to acquire ownership or control of shares or assets of a bank or to merge with any other bank holding company. An unsatisfactory record can substantially delay or block the transaction. As of its most recent exam, the Bank’s compliance with CRA was rated “satisfactory.”
Consumer Laws and Regulations. In addition to the laws and regulations discussed herein, the Bank is also subject to certain consumer laws and regulations that are designed to protect consumers in transactions with banks. While the list set forth herein is not exhaustive, these laws and regulations include the Truth in Lending Act, the Truth in Savings Act, the Electronic Funds Transfer Act, the Expedited Funds Availability Act, the Equal Credit Opportunity Act and the Fair Housing Act, among others. These laws and regulations mandate certain disclosure requirements and regulate the manner in which financial institutions must deal with customers when taking deposits or making loans to such customers. The Bank must comply with the applicable provisions of these consumer protection laws and regulations as part of its ongoing customer relations.
Anti-Money Laundering and Anti-Terrorism Legislation. A major focus of governmental policy on financial institutions in recent years has been combating money laundering and terrorist financing. The USA Patriot Act substantially broadened the scope of United States anti-money laundering laws and regulations by imposing significant new compliance and due diligence obligations, creating new crimes and penalties and expanding the extra-territorial jurisdiction of the United States. These regulations impose obligations on financial institutions to maintain appropriate policies, procedures and controls to detect, prevent and report money laundering and terrorist financing. The USA Patriot Act requires financial institutions to prohibit correspondent accounts with foreign shell banks, establish an anti-money laundering program that includes employee training and an independent audit, follow minimum standards for identifying customers and maintaining records of the identification information and make regular comparisons of customers against agency lists of suspected terrorists, their organizations and money launderers. Failure of a financial institution to maintain and implement adequate programs to combat money laundering and terrorist financing, or to comply with all of the relevant laws or regulations, could have serious legal and reputational consequences for the institution.
Office of Foreign Assets Control Regulation. The United States has imposed economic sanctions that affect transactions with designated foreign countries, nationals and others. These are typically known as the “OFAC” rules based on their administration by OFAC. The OFAC-administered sanctions targeting countries take many different forms. Generally, however, they contain one or more of the following elements: (i) restrictions on trade with or investment in a sanctioned country, including prohibitions against direct or indirect imports from and exports to a sanctioned country and prohibitions on “U.S. persons” engaging in financial transactions relating to making investments in, or providing investment-related advice or assistance to, a sanctioned country; and (ii) a blocking of assets in which the government or specially designated nationals of the sanctioned country have an interest, by prohibiting transfers of property subject to U.S. jurisdiction (including property in the possession or control of U.S. persons). Blocked assets (e.g., property and bank deposits) cannot be paid out, withdrawn, set off or transferred in any manner without a license from OFAC. Failure to comply with these sanctions could have serious legal and reputational consequences.
Privacy. WashingtonFirst and its subsidiaries are subject to numerous privacy-related laws and their implementing regulations. For example, the GLB Act imposes requirements on financial institutions with respect to customer privacy. The GLB Act generally prohibits disclosure of customer information to non-affiliated third parties unless the customer has been given the opportunity to object and has not objected to such disclosure. Financial institutions are further required to disclose their privacy policies to customers annually, and are required to comply with state law if it is more protective of customer privacy than the GLB Act.
Dodd-Frank Act. In July 2010, the Dodd-Frank Act regulatory reform legislation became law. This law broadly affects the financial services industry by implementing changes to the financial regulatory landscape aimed at strengthening the sound operation of the financial services sector, including provisions that, among other things, enhance prudential standards for banks and bank holding companies inclusive of capital, leverage, liquidity, concentration and exposure measures. In addition, traditional bank regulatory principles such as restrictions on transactions with affiliates and insiders were enhanced. The Dodd-Frank Act also contains reforms of consumer mortgage lending practices and creates the CFPB which is granted broad authority over consumer financial practices of
16
banks and others. WashingtonFirst is not subject to regulation by the CFPB, as it has supervisory authority over depository institutions with total assets of $10.0 billion or greater. Nevertheless, it is unclear whether the CFPB’s focus on consumer regulation and the risks posed by financial products will ultimately impact institutions such as WashingtonFirst.
It is expected as the specific new or incremental requirements applicable to WashingtonFirst become effective that the costs and difficulties of remaining compliant with all such requirements will increase. Provisions in the legislation that affect deposit insurance assessments and payment of interest on demand deposits could increase the costs associated with deposits as well as place limitations on certain revenues those deposits may generate. A number of aspects of the Dodd-Frank Act are still subject to rule making and will take effect over several years, making it difficult to anticipate the overall financial impact on WashingtonFirst, its customers or the financial industry more generally.
Incentive Compensation. Federal bank regulators issued comprehensive guidance on incentive compensation policies intended to ensure that the incentive compensation programs of financial institutions do not undermine the safety and soundness of banking organizations by encouraging excessive risk-taking. The guidance, which covers all employees that have the ability to materially affect the risk profile of an organization, either individually or as part of a group, is based upon the key principles that a banking organization’s incentive compensation arrangements should (i) provide incentives that do not encourage risk-taking beyond the organization’s ability to effectively identify and manage risks, (ii) be compatible with effective internal controls and risk management, and (iii) be supported by strong corporate governance, including active and effective oversight by the organization’s board of directors. On April 14, 2011, federal bank regulators published a proposed interagency rule to implement certain incentive compensation requirements of the Dodd-Frank Act. Under the proposed rule, financial institutions must prohibit incentive-based compensation arrangements that encourage inappropriate risk-taking that are deemed excessive or that may lead to material losses. The agencies recently revised the proposed rule and it has not yet been finalized, however, the interagency guidance remains in place.
The Federal Reserve will review, as part of the regular, risk-focused examination process, the incentive compensation arrangements of banking organizations, such as WashingtonFirst, that are not “large, complex banking organizations.” These reviews will be tailored to each organization based on the scope and complexity of the organization’s activities and the prevalence of incentive compensation arrangements. The findings of the supervisory initiatives will be included in reports of examination. Deficiencies will be incorporated into the organization’s supervisory ratings, which can affect the organization’s ability to make acquisitions and take other actions. Enforcement actions may be taken against a banking organization if its incentive compensation arrangements, or related risk-management control or governance processes, pose a risk to the organization’s safety and soundness and the organization is not taking prompt and effective measures to correct the deficiencies.
WashingtonFirst Mortgage
Mortgage Company activities are subject to the rules and regulations of, and examination by HUD, FHA, VA and various state regulatory authorities with respect to originating, processing and selling mortgage loans. Those rules and regulations, among other things, establish standards for loan origination, prohibit discrimination, provide for inspections and appraisals of property, require credit reports on prospective borrowers and, in some cases, restrict certain loan features, and fix maximum interest rates and fees. In addition to other federal laws, mortgage origination activities are subject to the Equal Credit Opportunity Act, TILA, Home Mortgage Disclosure Act, RESPA, and Home Ownership Equity Protection Act, and the regulations promulgated under these acts, including the TILA-RESPA Integrated Disclosure rules issued by the CFPB. These laws prohibit discrimination, require the disclosure of certain basic information to mortgagors concerning credit and settlement costs, limit payment for settlement services to the reasonable value of the services rendered and require the maintenance and disclosure of information regarding the disposition of mortgage applications based on race, gender, geographical distribution and income level.
Ability-to-Repay and Qualified Mortgage Rule. Pursuant to the Dodd-Frank Act, the CFPB issued a final rule on January 10, 2013 (effective on January 10, 2014), amending Regulation Z as implemented by the TILA, requiring mortgage lenders to make a reasonable and good faith determination based on verified and documented information that a consumer applying for a mortgage loan has a reasonable ability to repay the loan according to its terms. Mortgage lenders are required to determine consumers' ability to repay in one of two ways. The first alternative requires the mortgage lender to consider the following eight underwriting factors when making the credit decision: (i) current or reasonably expected income or assets; (ii) current employment status; (iii) the monthly payment on the covered transaction; (iv) the monthly payment on any simultaneous loan; (v) the monthly payment for mortgage-related obligations; (vi) current debt obligations, alimony, and child support; (vii) the monthly debt-to-income ratio or residual income; and (viii) credit history. Alternatively, the mortgage lender can originate "qualified mortgages," which are entitled to a presumption that the creditor making the loan satisfied the ability-to-repay requirements. In general, a "qualified mortgage" is a mortgage loan without negative amortization, interest-only payments, balloon payments, or terms exceeding 30 years. In addition, to be a qualified mortgage the points and fees paid by a consumer cannot exceed 3% of the total loan amount. Qualified mortgages that are "higher-priced" (e.g. sub-prime loans) garner a rebuttable presumption of compliance with the ability-to-repay rules, while qualified mortgages that are not "higher-priced" (e.g. prime loans) are given a safe harbor of compliance.
Mortgage Loan Originator Compensation. Previously existing regulations concerning the compensation of mortgage loan originators have been amended. As a result of these amendments, mortgage loan originators may not receive compensation based on a mortgage
17
transaction’s terms or conditions other than the amount of credit extended under the mortgage loan. Further, the new standards limit the total points and fees that a bank and/or a broker may charge on conforming and jumbo loans to 3% of the total loan amount. Mortgage loan originators may receive compensation from a consumer or from a lender, but not both. These rules contain requirements designed to prohibit mortgage loan originators from “steering” consumers to loans that provide mortgage loan originators with greater compensation. In addition, the rules contain other requirements concerning recordkeeping.
Mortgage Loan Servicing. The CFPB implemented servicing rules requiring servicers meet certain benchmarks for loan servicing and customer service in general. Servicers must provide periodic billing statements and certain required notices and acknowledgments, promptly credit borrowers’ accounts for payments received and promptly investigate complaints by borrowers and are required to take additional steps before purchasing insurance to protect the lender’s interest in the property. These servicing rules also call for additional notice, review and timing requirements with respect to delinquent borrowers.
Wealth Advisors
Investment Adviser Regulation. Wealth Advisors is subject to regulation under federal and state securities laws. Wealth Advisors is registered as an investment adviser with the SEC under the Advisers Act. The Advisers Act imposes numerous obligations on registered investment advisers, including fiduciary, record keeping, operational, and disclosure obligations. Wealth Advisors is also subject to regulation under the securities laws of certain states. The foregoing laws and regulations generally grant the supervisory agencies broad administrative powers, including the power to limit or restrict Wealth Advisors, a subsidiary of the Company, from conducting its business in the event that it fails to comply with such laws and regulations. Possible sanctions that may be imposed in the event of noncompliance include the suspension of individual employees, limitations on business activities for specified periods of time, revocations as an investment adviser and/or other registrations, and other fines.
Internet Access to Corporate Documents
Information about WashingtonFirst can be found on its website at www.wfbi.com. WashingtonFirst posts its Annual Reports on Form 10-K, Quarterly Reports on Form 10-Q, Current Reports on Form 8-K, definitive proxy materials, and any amendments to those reports in the “Investor Relations” section of the website as soon as reasonably practicable after they are electronically filed with or furnished to the SEC. All such filings are available free of charge. The information available on WashingtonFirst’s website is not part of this Annual Report on Form 10-K or any other report filed by WashingtonFirst with the SEC.
Item 1A. Risk Factors
An investment in our common stock involves a high degree of risk. Before making an investment decision, you should carefully read and consider the risk factors described below as well as other information included in this report and other documents we file with the SEC, as the same may be updated from time to time. Any of these risks, if they actually occur, could materially adversely affect our business, financial condition, and results of operation. Additional risks and uncertainties not currently known to us that we currently deem to be immaterial may also materially and adversely affect us. In any such case, you could lose all or a portion of your original investment.
Risks Associated with WashingtonFirst’s Common Stock
Economic and other factors may cause volatility in the price of our common stock.
WashingtonFirst’s common stock trades on the NASDAQ Exchange. In the current economic environment, the prices of publicly traded stocks in the financial services industry have experienced volatility. A variety of factors can affect the market price of WashingtonFirst’s common stock, including its operating and financial performance, strategic actions by our competitors, speculation in the press or investment community, sales of WashingtonFirst common stock by members of the board of directors or management, changes in accounting principles, additions or departures of key management personnel, actions by WashingtonFirst shareholders, general market conditions including fluctuations in interest rates, and legal and regulatory factors unrelated to WashingtonFirst’s performance. These factors can influence both the price of the liquidity of WashingtonFirst’s stock. General market declines or volatility in the future could adversely impact the price of WashingtonFirst’s stock, and the current market price of the stock may not be indicative of future market prices.
WashingtonFirst is an emerging growth company and its reliance on the reduced disclosure requirements applicable to emerging growth companies may make its common stock less attractive to investors.
WashingtonFirst is an “emerging growth company,” as defined in the JOBS Act and it may take advantage of certain exemptions and relief from various reporting requirements that are applicable to other public companies that are not emerging growth companies. In particular, while WashingtonFirst is an emerging growth company it will not be required to comply with the auditor attestation requirements of Section 404(b) of the SOX; it will be subject to reduced disclosure obligations regarding executive compensation in its periodic reports and proxy statements; it will not be required to adopt new or revised accounting pronouncements applicable to
18
public companies until such pronouncements are made applicable to private companies; and it will not be required to hold non-binding advisory votes on executive compensation or shareholder approval of any golden parachute payments not previously approved. WashingtonFirst may remain an emerging growth company until as late as December 31, 2017, though WashingtonFirst may cease to be an emerging growth company earlier under certain circumstances, including (i) if the market value of its common stock that is held by non-affiliates exceeds $700 million as of any June 30, in which case it would cease to be an emerging growth company as of the following December 31 or (ii) if its gross revenues exceed $1 billion in any fiscal year. Investors may find WashingtonFirst’s common stock less attractive if WashingtonFirst relies on these exemptions and relief. If some investors find WashingtonFirst’s common stock less attractive as a result, there may be a less active trading market for its common stock and its stock price may decline and/or become more volatile.
Restrictions relating to the acquisition of WashingtonFirst’s common stock may discourage acquisition or merger proposals and may adversely affect the market price of WashingtonFirst’s common stock.
Some provisions of WashingtonFirst’s articles of incorporation and bylaws could make it difficult for a third party to acquire control of WashingtonFirst, even if the change in control would be beneficial to and desirable by WashingtonFirst shareholders. These provisions, among others, provide for staggered terms for directors, the ability of the board of directors to issue preferred stock without shareholder approval, limitations on affiliated transactions and control share acquisitions, the inability of shareholders to call special meetings, and the requirement that certain transactions such as a merger, share exchange, sale of all or substantially all of WashingtonFirst’s assets must be approved and recommended by at least two-thirds of the directors then in office or, if not so approved and recommended, by the affirmative vote of the holders of 80% of each voting group entitled to vote on such transaction. In addition, certain provisions of state and federal law may also have the effect of discouraging or prohibiting a future takeover attempt in which our shareholders might otherwise receive a premium for their shares over then-current market prices. To the extent that any of these provisions are perceived to discourage or limit merger or acquisition attempts, they may tend to reduce the market price for WashingtonFirst’s common stock.
Future sales of WashingtonFirst’s common stock in the public market could lower its stock price, and any additional capital raised by WashingtonFirst may dilute the ownership of existing shareholders and/or decrease earnings.
In order to meet applicable regulatory capital requirements, WashingtonFirst may, from time to time take steps in the future to increase its capital, including selling additional shares of common stock in subsequent public or private offerings or otherwise issue additional shares of common stock or securities convertible into or exchangeable for common stock in the future, or offer and sell subordinated debt. Such steps could have a dilutive effect on shareholders, limit WashingtonFirst’s ability to pay dividends or return capital to shareholders, or otherwise cause WashingtonFirst to incur higher costs and result in reduced earnings. WashingtonFirst cannot predict the size of future issuances of its common stock or the effect, if any, that future issuances and sales of shares of its common stock or subordinated debt will have on the market price of its common stock. Sales of substantial amounts of WashingtonFirst’s common stock (including shares issued in connection with an acquisition), or the perception that such sales could occur, may adversely affect prevailing market prices of WashingtonFirst’s common stock.
The concentration of WashingtonFirst’s capital stock ownership will limit your ability to influence corporate matters.
As of March 2, 2017, WashingtonFirst’s directors and executive officers as a group beneficially own approximately 20.70 percent of the Company’s outstanding common stock and options exercisable within sixty days. Consequently, WashingtonFirst’s board of directors has significant influence over all matters that require approval by WashingtonFirst’s shareholders, including the election of directors and approval of significant corporate transactions. This concentration of ownership may limit the ability of other shareholders to influence corporate matters.
WashingtonFirst’s ability to pay cash dividends is subject to regulatory restrictions, and it may be unable to pay future cash dividends.
WashingtonFirst’s ability to pay dividends is subject to regulatory, statutory and contractual restrictions and the need to maintain sufficient capital. Its only source of funds with which to pay dividends to its shareholders are dividends received from the Bank, and the Bank’s ability to pay dividends is limited by its own obligations to maintain sufficient capital and regulatory restrictions. If these regulatory requirements are not satisfied, WashingtonFirst will be unable to pay dividends on its common stock.
19
Risks Associated With WashingtonFirst’s Business
WashingtonFirst’s future success will depend on its ability to compete effectively in the highly competitive financial services industry.
WashingtonFirst faces substantial competition in all phases of its operations from a variety of different competitors. In particular, there is very strong competition for financial services in the greater Washington, D.C. metropolitan area in which it conducts its business. WashingtonFirst competes with commercial banks, credit unions, savings and loan associations, mortgage banking firms, consumer finance companies, money market funds and other mutual funds, as well as other kinds of local and community, super-regional, national and international financial institutions and enterprises that operate offices in its primary market areas and elsewhere. WashingtonFirst’s future growth and success will depend on its ability to compete effectively in this highly competitive financial services environment.
Many of WashingtonFirst’s competitors are well-established, larger financial institutions and many offer products and services that it does not. Many have substantially greater resources, name recognition and market presence that benefit them in attracting business. In addition, some operate in less stringent regulatory environments. While WashingtonFirst believes it competes effectively with these other financial institutions in its primary markets, it may face a competitive disadvantage as a result of its smaller size, smaller asset base, lack of geographic diversification and inability to spread its marketing costs across a broader market. If WashingtonFirst has to raise interest rates paid on deposits or lower interest rates charged on loans to compete effectively, its net interest margin and income could be negatively affected. Failure to compete effectively to attract new or to retain existing clients may reduce or limit WashingtonFirst’s net income and its market share and may adversely affect its results of operations, financial condition and growth.
WashingtonFirst’s profitability depends on interest rates generally, and it may be adversely affected by changes in government monetary policy.
The economy, interest rates, monetary and fiscal policies of the federal government and regulatory policies have a significant influence on WashingtonFirst and the industry as a whole. These policies influence overall growth and distribution of bank loans, investments and deposits on a national basis, and their use may affect interest rates charged on loans or paid for deposits.
Federal Reserve monetary policies and the fiscal policies of the federal government have materially affected the operating results of commercial banks in the past and are expected to continue to do so in the future. WashingtonFirst cannot predict the nature of future monetary and fiscal policies and the effect of such policies on the future business and earnings of WashingtonFirst or its subsidiaries.
WashingtonFirst’s profitability depends in substantial part on its net interest margin, which is the difference between the rates it receives on loans and investments and the rates it pays for deposits and other sources of funds. Its net interest margin depends on many factors that are partly or completely outside of its control, including competition, federal economic, monetary and fiscal policies, and economic conditions generally. If market interest rates change so that the interest it pays on deposits and borrowings increases faster than the interest it earns on loans and investments, our net income could be negatively affected. Any substantial, unexpected or prolonged change in market interest rates could have a material adverse affect on our business, financial condition, and results of operations.
In addition, a substantial portion of our consolidated net revenues (net interest income plus non-interest income) are derived from originating and selling residential mortgages. Residential mortgage lending in general has experienced substantial volatility in recent periods. An increase by the Federal Reserve in interest rates may materially and adversely affect our future loan origination volume, margins, and the value of the collateral securing our outstanding loans, may increase rates of borrower default, and may otherwise adversely affect our business. Additionally, fluctuations in housing inventory could impact the volume of mortgage loans that we originate. Further, a reduction in housing inventory could result in elevated costs, as a significant amount of loan processing and underwriting that we perform would be to qualifying borrowers for mortgage loan transactions that never materialize.
Changes in interest rates, particularly by the Federal Reserve, which implements national monetary policy in order to mitigate recessionary and inflationary pressures, also affect the value of its loans. In setting its policy, the Federal Reserve may utilize techniques such as: (i) engaging in open market transactions in United States government securities; (ii) setting the discount rate on member bank borrowings; and (iii) changing reserve requirements. These techniques may have an adverse effect on WashingtonFirst’s deposit levels, net interest margin, loan demand or its business and operations. The reduction by the Federal Reserve of its historic levels of securities purchases, or “tapering,” could cause the interest required to be paid by WashingtonFirst on deposits and borrowings to increase leading to a reduction in its net interest margin. In addition, an increase in interest rates could adversely affect borrowers’ ability to pay the principal or interest on existing variable rate loans or reduce their desire to borrow more money. This may lead to an increase in WashingtonFirst’s nonperforming assets, a decrease in loan originations, or a reduction in the value of and income from its loans, any of which could have a material adverse effect on WashingtonFirst’s results of operations. WashingtonFirst tries to minimize its exposure to interest rate risk, but it is unable to completely eliminate this risk. Fluctuations in market rates and other market disruptions are neither predictable nor controllable and may have a material adverse effect on WashingtonFirst’s business, financial condition and results of operations.
20
WashingtonFirst’s profitability depends significantly on local economic conditions, and may be adversely affected by reductions in Federal spending.
WashingtonFirst’s success is dependent to a significant extent upon general economic conditions in the greater Washington, D.C. metropolitan area which are, in turn, dependent to a large extent on the Federal government, particularly its local employment and spending levels. In addition, the banking industry in the greater Washington, D.C. metropolitan area, similar to other geographic markets, is affected by general economic conditions such as inflation, recession, unemployment and other factors beyond WashingtonFirst’s control. Prolonged continuation of adverse economic and financial conditions or other economic dislocation in the greater Washington, D.C. metropolitan area, including a substantial reduction in the level of employment or local spending by the Federal government, could cause increases in nonperforming assets, thereby causing operating losses, impairing liquidity and eroding capital. WashingtonFirst cannot assure you that future adverse changes in the economy in the greater Washington, D.C. metropolitan area would not have a material adverse effect on the WashingtonFirst’s financial condition, results of operations or cash flows.
Our concentration of loans may create a greater risk of loan defaults and losses.
A significant portion of the Bank’s loan portfolio is secured by real estate collateral. Real estate collateral in each case provides an alternate source of repayment in the event of default by the borrower. While we believe that our loan portfolio is diversified, these concentrations expose us to the risk that a decline in the real estate market or in the economic conditions in the greater Washington, D.C. metropolitan area, could increase the levels of nonperforming loans and charge-offs, decrease the value of collateral and reduce loan demand. In that event, Bank’s earnings and capital could be adversely affected.
Commercial, commercial real estate and construction loans tend to have larger balances than single family mortgage loans and other consumer loans. Because the loan portfolio contains a significant number of commercial and commercial real estate and construction loans, the deterioration of one or a few of these loans may cause a significant increase in nonperforming assets. An increase in nonperforming loans could result in: a loss of earnings from these loans, an increase in the provision for loan losses, or an increase in loan charge-offs, which could have an adverse impact on the results of operations and financial condition.
Further, under guidance adopted by the federal banking regulators, banks that have concentrations in construction, land development or commercial real estate loans (other than loans for majority owner occupied properties) would be expected to maintain higher levels of risk management and, potentially, higher levels of capital. We may be required to maintain higher levels of capital than we would otherwise be expected to maintain as a result of our levels of construction, development and commercial real estate loans, which may require us to obtain additional capital sooner than we would otherwise seek it, which may reduce shareholder returns.
WashingtonFirst’s business strategy includes the continuation of its growth plans, and its financial condition and results of operations could be negatively affected if it fails to grow or fails to manage its growth effectively.
The Company seeks to continue to grow in its existing banking markets (internally and through additional offices) and to expand into new markets as appropriate opportunities arise. WashingtonFirst’s ability to grow successfully will depend on a variety of factors, including the continued availability of desirable business opportunities, the competitive responses from other financial institutions in its market areas and its ability to manage its growth. WashingtonFirst may face risks with respect to future acquisitions, including: the time and costs associated with identifying and evaluating potential acquisitions and merger partners; the time and costs of evaluating new markets, hiring experienced management, opening new offices, and the time lags between these activities and generating of sufficient assets and deposits to support the costs of the expansion; WashingtonFirst’s ability to finance an acquisition and possible ownership or economic dilution to its current shareholders; and the diversion of WashingtonFirst’s management’s attention to the negotiation of a transaction, and the integration of the operations and personnel of the combining businesses.
WashingtonFirst may incur substantial costs to expand, and it can give no assurance such expansion will result in the levels of profits it seeks. There can be no assurance that integration efforts for any future mergers or acquisitions will be successful. Also, there is no assurance that, following any future merger or acquisition, WashingtonFirst’s integration efforts will be successful or that, after giving effect to the acquisition, it will achieve profits comparable to or better than its historical experience.
WashingtonFirst’s recent results may not be indicative of its future results.
WashingtonFirst may not be able to sustain its historical rate of growth or may not even be able to grow its business at all. In the future, WashingtonFirst may not have the benefit of several recently favorable factors, such as a generally stable interest rate environment, an improving real estate market, the ability to find suitable expansion opportunities, or the relative resistance of the greater Washington, D.C. metropolitan area to economic downturns. Various factors, including economic conditions, regulatory and legislative considerations and competition, may also impede or prohibit WashingtonFirst’s ability to expand its market presence. As our asset size and earnings increase, it may become more difficult to achieve high rates of increase in assets and earnings. Additionally, it may become more difficult to achieve continued improvement in our expense levels and efficiency ratio. We may not be able to maintain the relatively low levels of nonperforming assets that we have experienced. Declines in the rate of growth of income or assets or deposits, and increases in operating expenses or nonperforming assets may have an adverse impact on the value of
21
the common stock. If WashingtonFirst experiences a significant decrease in its historical rate of growth, its results of operations and financial condition may be adversely affected due to the fixed nature of certain operating costs.
WashingtonFirst’s allowance for loan losses could become inadequate and reduce its earnings and capital.
WashingtonFirst maintains an allowance for loan losses which management believes is adequate for absorbing the estimated future losses inherent in its loan portfolio. Management conducts a periodic review and consideration of the loan portfolio to determine the amount of the allowance for loan losses based upon general market conditions, credit quality of the loan portfolio and performance of WashingtonFirst’s clients relative to their financial obligations with it. The amount of future losses, however, is susceptible to changes in economic and other market conditions, including changes in interest rates and collateral values, which are beyond WashingtonFirst’s control, and these future losses may exceed its current estimates. There can be no assurance that additional provisions for loan losses will not be required in the future, including as a result of changes in the economic assumptions underlying management’s estimates and judgments, adverse developments in the economy on a national basis or in the Bank’s market area, or changes in the circumstances of particular borrowers. Although WashingtonFirst believes the allowance for loan losses is adequate to absorb probable losses in its loan portfolio, WashingtonFirst cannot predict the amount of such losses or guarantee that its allowance will be adequate in the future. Excessive loan losses could have a material adverse effect on WashingtonFirst financial condition and results of operations.
A failure to maintain sufficient capital to meet regulatory requirements could adversely affect our financial condition, liquidity and results of operations, as well as our ability to maintain regulatory compliance.
WashingtonFirst must meet certain regulatory capital requirements and maintain sufficient liquidity. We face significant capital and other regulatory requirements as a financial institution, which were heightened with the implementation of the Basel III rule on January 1, 2015 and the phase-in of capital conservation buffer requirement through January 1, 2019. The application of these more stringent capital requirements for WashingtonFirst could, among other things, result in lower returns on equity, require the raising of additional capital, adversely affect WashingtonFirst’s future growth opportunities, and result in regulatory actions such as a prohibition on the payment of dividends or on the repurchase of shares if it were unable to comply with such requirements.
Liquidity needs could adversely affect WashingtonFirst’s results of operations and financial condition.
WashingtonFirst’s primary source of funds is client deposits in the Bank and loan repayments. While scheduled loan repayments are a relatively stable source of funds, they are subject to the ability of borrowers to repay the loans. The ability of borrowers to repay loans can be adversely affected by a number of factors, including changes in economic conditions, adverse trends or events affecting business industry groups, reductions in real estate values or markets, business closings or lay-offs, inclement weather, natural disasters and international instability. Additionally, deposit levels may be affected by a number of factors, including rates paid by competitors, general interest rate levels, regulatory capital requirements, returns available to clients on alternative investments and general economic conditions. The deposits from the title and escrow agency customers are expected to continue to be an important component of WashingtonFirst’s deposit base. Because deposits of title and escrow agency customers are directly related to home sales and refinancing activity, any decrease in this activity would adversely impact WashingtonFirst’s deposit levels. Accordingly, WashingtonFirst may be required from time to time to rely on secondary sources of liquidity to meet withdrawal demands or otherwise fund operations. Such sources include FHLB advances, sales of securities and loans, and federal funds lines of credit from correspondent banks, as well as out-of-market time deposits. While WashingtonFirst believes that these sources are currently adequate, there can be no assurance they will be sufficient to meet future liquidity demands, particularly if WashingtonFirst continues to grow and experience increasing loan demand. Should such sources not be adequate, WashingtonFirst may be required to slow or discontinue loan growth, capital expenditures or other investments or liquidate assets.
Changes in accounting standards could impact reported earnings.
From time to time there are changes in the financial accounting and reporting standards that govern the preparation of our financial statements. These changes are difficult to predict and can materially impact how we record and report our financial condition and results of operations. In some instances, we could be required to apply a new or revised standard retroactively, resulting in the restatement of prior period financial statements. Such changes could also require us to incur additional personnel or technology costs.
Changes in federal or state enacted tax rates could impact reported earnings.
The net deferred tax asset reported on the Company’s balance sheet generally represents the tax benefit of future deductions from taxable income for items that have already been recognized for financial reporting purposes. The bulk of these deferred tax assets consists of deferred loan loss deductions, deferred compensation related deductions and net operating loss carryforwards for which the associated tax deduction is deferred until payment and other future triggering event. The net deferred tax asset is measured by applying currently-enacted income tax rates to the accounting period during which the tax benefit is expected to be realized. As of December 31, 2016, the Company’s net deferred tax asset was $8.9 million.
22
The President of the United States and some members of Congress have announced plans to introduce legislation that would lower the federal corporate income tax rate from its current level of 35%. If this tax rate reduction is enacted, it will result in an immediate impairment of the recorded net deferred tax asset because the future tax benefit of these deferrals would need to be re-measured for the impact of the lower tax rate. Any such impairment would be recorded as a charge to the Company’s earnings and would be recognized in the quarter during which the lower rate is enacted.
WashingtonFirst is subject to extensive regulation that could limit or restrict its activities and adversely affect its earnings.
WashingtonFirst and the Bank are subject to extensive federal and state regulation and supervision. Banking regulations are primarily intended to protect depositors’ funds, federal deposit insurance funds and the banking system as a whole, not WashingtonFirst’s shareholders. These regulations affect WashingtonFirst’s lending practices, capital structure, investment practices, dividend policy and growth, among other things. Congress and federal regulatory agencies continually review banking laws, regulations and policies for possible changes. Any change in applicable regulations or federal or state legislation could have a substantial impact on WashingtonFirst, the Bank and their respective operations.
The Dodd-Frank Act, enacted in July 2010, instituted major changes to the banking and financial institutions regulatory regimes in light of the recent performance of and government intervention in the financial services sector. Additional legislation and regulations or regulatory policies, including changes in interpretation or implementation of statutes, regulations or policies, could significantly affect WashingtonFirst’s powers, authority and operations, or the powers, authority and operations of the Bank in substantial and unpredictable ways. Further, regulators have significant discretion and power to prevent or remedy unsafe or unsound practices or violations of laws by banks and bank holding companies in the performance of their supervisory and enforcement duties. The exercise of this regulatory discretion and power could have a negative impact on WashingtonFirst. Failure to comply with laws, regulations or policies could result in sanctions by regulatory agencies, civil money penalties and/or reputation damage, which could have a material adverse effect on WashingtonFirst’s business, financial condition and results of operations.
WashingtonFirst depends on the services of key personnel, and a loss of any of those personnel could disrupt its operations and result in reduced revenues.
WashingtonFirst’s success depends upon the continued service of its senior management team and upon its ability to attract and retain qualified financial services personnel. Competition for qualified employees is intense. In management’s experience, it can take a significant period of time to identify and hire personnel with the combination of professional skills and personal attributes necessary for the successful implementation of WashingtonFirst’s strategy. If WashingtonFirst loses the services of one or more of its key personnel, including key client relationship personnel, or is unable to attract additional qualified personnel, its business, financial condition, results of operations and cash flows could be materially adversely affected.
WashingtonFirst depends on technology to compete effectively and may be required to make substantial investments in new technology, which could have a negative effect on WashingtonFirst’s operating results and the value of its common stock.
The market for financial services, including banking services, is increasingly affected by advances in technology, including developments in telecommunications, data processing, mobile devices, computers, automation and Internet-based banking. This is particularly true for WashingtonFirst, which relies on technology to compete in its market. WashingtonFirst depends on third party vendors for portions of its data processing services. In addition to WashingtonFirst’s ability to finance the purchase of those services and integrate them into its operations, its ability to offer new technology-based services depends on WashingtonFirst’s vendors’ abilities to provide and support those services. Future advances in technology may require WashingtonFirst to incur substantial expenses that adversely affect its operating results, and WashingtonFirst’s limited capital resources may make it impractical or impossible for it to keep pace with competitors possessing greater capital resources. WashingtonFirst’s ability to compete successfully in its banking markets may depend on the extent to which WashingtonFirst and its vendors are able to offer new technology-based services and on WashingtonFirst’s ability to integrate technological advances into its operations.
Reliance on technology exposes WashingtonFirst to cybersecurity risks.
WashingtonFirst relies on digital technologies to conduct its operations, and those technologies may be compromised by the deliberate attacks by others or unintentional cybersecurity incidents. Deliberate cybersecurity attacks may seek to gain unauthorized access to digital systems for purposes of misappropriating assets or sensitive information, corrupting data or causing operational disruption. Other events may not seek unauthorized access, but may seek to prevent authorized users to be able to access digital systems, referred to as “denial of service” attacks. A cybersecurity incident of this type, could require WashingtonFirst to incur substantial remediation and increased cybersecurity protection costs, such as implementing new technologies, hiring and training new employees and engaging third party experts and consultants. In addition, WashingtonFirst could become subject to litigation from customers whose sensitive data was obtained without their consent, and to damage to the company’s reputation, which could have an adverse effect on the company’s financial condition and results of operation. From time to time, WashingtonFirst is subject to cybersecurity attacks arising in the normal course of its business. In the opinion of management, there have been no cybersecurity attacks which would have a material adverse effect on WashingtonFirst’s financial condition, results of operation or products and services.
23
WashingtonFirst’s operations rely on certain external vendors.
WashingtonFirst’s business is dependent on the use of outside service providers that support its day-to-day operations including data processing and electronic communications. WashingtonFirst’s operations are exposed to risk that a service provider may not perform in accordance with established performance standards required in its agreements for any number of reasons including: equipment or network failure, a change in their senior management, their financial condition, their product line or mix and how they support existing customers, or simple change in their strategic focus. While WashingtonFirst has comprehensive policies and procedures in place to mitigate risk at all phases of service provider management from selection, to performance monitoring and renewals, the failure of a service provider to perform in accordance with contractual agreements could be disruptive to WashingtonFirst’s business, which could have a material adverse effect on our financial condition and results of operations.
Our business operations may not generate the cash needed to make payments of principal and interest on our outstanding subordinated debt notes may have negative consequences.
On October 5, 2015, the Company entered into a Subordinated Note Purchase Agreement (the "Purchase Agreement") with each of sixteen accredited investors (the "Purchasers") pursuant to which the Company sold $25 million in aggregate principal amount of its 6.00% Fixed-to-Floating Rate Subordinated Notes due October 2025 (the "Notes") to the Purchasers at a price equal to 100% of the aggregate principal amount of the Notes. Each Purchase Agreement contains certain customary representations, warranties and covenants made by the Company, on the one hand, and the respective Purchasers, on the other hand.
The Notes were offered and sold in reliance on the exemptions from registration provided by Section 4(a)(2) of the Securities Act of 1933, as amended, and Rule 506 of Regulation D thereunder. Accordingly, the Notes were offered and sold exclusively to persons who are "accredited investors" within the meaning of Rule 501(a) of Regulation D.
The Notes were issued under an Indenture, dated October 5, 2015 (the “Indenture”), by and between the Company and Wilmington Trust, National Association, as trustee (the “Trustee”). The Trustee will also serve as the initial paying agent and registrar with respect to the Notes.
Our ability to make payments on our indebtedness, including the notes, and to fund planned capital expenditures will depend on our ability to generate cash in the future. We cannot assure you that our business will generate sufficient cash flow from operations or that future borrowings will be available to us in an amount sufficient to enable us to pay the principal of or interest on our indebtedness, including the notes, or to fund our other liquidity needs.
WashingtonFirst’s profitability may be significantly reduced if we are not able to sell mortgages.
Currently, the Bank generally sells virtually all of the mortgage loans originated by its subsidiary, the Mortgage Company. The profitability of the Mortgage Company depends in large part upon our ability to originate a high volume of loans and to quickly sell them in the secondary market. Thus, we are dependent upon (i) the existence of an active secondary market and (ii) our ability to sell loans into that market.
The Mortgage Company’s ability to sell mortgage loans readily is dependent upon the availability of an active secondary market for single-family mortgage loans, which in turn depends in part upon the continuation of programs currently offered by Fannie Mae and Freddie Mac and other institutional and non-institutional investors. These entities account for a substantial portion of the secondary market in residential mortgage loans. Some of the largest participants in the secondary market, including Fannie Mae and Freddie Mac, are government-sponsored enterprises with substantial market influence whose activities are governed by federal law. Any future changes in laws that significantly affect the activity of these government-sponsored enterprises and other institutional and non-institutional investors or any impairment of our ability to participate in such programs could, in turn, adversely affect our operations.
Fannie Mae and Freddie Mac have reported past substantial losses and a need for substantial amounts of additional capital. Such losses were due to these entities’ business models being tied extensively to the U.S. housing market which severely contracted during the recent economic downturn. In response to the deteriorating financial condition of Fannie Mae and Freddie Mac from the U.S. housing market contraction, Congress and the U.S. Treasury undertook a series of actions to stabilize these entities. The FHFA was established in July 2008 pursuant to the Regulatory Reform Act in an effort to enhance regulatory oversight over Fannie Mae and Freddie Mac. FHFA placed Fannie Mae and Freddie Mac into federal conservatorship in September 2008. Both Fannie Mae and Freddie Mac have returned to profitability as a result of the housing market recovery, but their long-term financial viability is highly dependent on governmental support. If the governmental support is inadequate, these companies could fail to offer programs necessary to an active secondary market. In addition, future policies that change the relationship between Fannie Mae and Freddie Mac and the U.S. government, including those that result in their winding down, nationalization, privatization, or elimination may have broad adverse implications for the residential mortgage market, the mortgage-backed securities market and the Mortgage Company’s business, operations and financial condition. If this were to occur, the Mortgage Company’s ability to sell mortgage loans readily could be hampered, and the profitability of the Bank could be significantly reduced.
Changes in fee structures by third party loan purchasers and mortgage insurers may decrease our loan production volume and the margin we can recognize on conforming home loans, and may adversely impact our results of operations.
24
In the future, third party loan purchasers may revise their fee structures and increase the costs of doing business with them. Such changes may have a negative impact on our ability to originate loans to be sold because of the increased costs of such loans and may decrease our profitability with respect to loans held for sale. In addition, any significant adverse change in the level of activity in the secondary market or the underwriting criteria of these third party loan purchasers could negatively impact our results of business, operations and cash flows.
If we breach any of the representations or warranties we make to a purchaser or securitizer of our mortgage loans, we may be liable to the purchaser or securitizer for certain costs and damages.
When we sell or securitize mortgage loans in the ordinary course of business, we are required to make certain representations and warranties to the purchaser about the mortgage loans and the manner in which they were originated. Our agreements require us to repurchase mortgage loans if we have breached any of these representations or warranties, in which case we may be required to repurchase such loan and record a loss upon repurchase and/or bear any subsequent loss on the loan. We may not have any remedies available to us against a third party for such losses, or the remedies available to us may not be as broad as the remedies available to the purchaser of the mortgage loan against us. In addition, if there are remedies against a third party available to us, we face further risk that such third party may not have the financial capacity to perform remedies that otherwise may be available to us. Therefore, if a purchaser enforces remedies against us, we may not be able to recover our losses from a third party and may be required to bear the full amount of the related loss.
If repurchase and indemnity demands increase on loans that we sell from our portfolios, our liquidity, results of operations and financial condition will be adversely affected.
We may face risk of loss if we purchase loans from a seller that fails to satisfy its indemnification obligations.
We generally receive representations and warranties from the originators and sellers from whom we purchase loans such that if a loan defaults and there has been a breach of such representations and warranties, we may be able to pursue a remedy against the seller of the loan for the unpaid principal and interest on the defaulted loan. However, if the originator and/or seller breach such representations and warranties and does not have the financial capacity to pay the related damages, we may be subject to the risk of loss for such loan as the originator or seller may not be able to pay such damages or repurchase loans when called upon by us to do so.
WashingtonFirst may not be able to expand its wealth advisory services and retain current clients.
WashingtonFirst and its subsidiary Wealth Advisors, may not be able to attract new and retain current investment advisory clients due to competition from the following: commercial banks and trust companies; mutual fund companies; other investment advisory firms; law firms; brokerage firms; and other financial services companies. Their ability to successfully attract and retain clients is dependent upon their ability to compete with competitors’ investment products, level of investment performance, client services and marketing and distribution capabilities. Due to changes in economic conditions, the performance of Wealth Advisors may be negatively impacted by the financial markets in which investment clients’ assets are invested, causing clients to seek other alternative investment options. If Wealth Advisors is not successful, the Company’s results from operations and financial position may be negatively impacted.
WashingtonFirst depends on the accuracy and completeness of information about clients and counterparties.
In deciding whether to extend credit or enter into other transactions with clients and counterparties, WashingtonFirst may rely on information furnished to it by or on behalf of clients and counterparties, including financial statements and other financial information. WashingtonFirst also may rely on representations of clients and counterparties as to the accuracy and completeness of that information and, with respect to financial statements, on reports of independent auditors. For example, in deciding whether to extend credit to customers, WashingtonFirst expects that a customer’s financial statements present fairly, in all material respects, the financial condition, results of operations and cash flows of the customer. WashingtonFirst’s financial condition and results of operations could be negatively impacted to the extent it relies on customer-provided financial statements or other information which are discovered to be materially misleading.
WashingtonFirst relies upon independent appraisals to determine the value of the real estate which secures a significant portion of its loans, and the values indicated by such appraisals may not be realizable if it is forced to foreclose upon such loans.
A significant portion of WashingtonFirst’s loan portfolio consists of loans secured by real estate. WashingtonFirst relies upon independent appraisers to estimate the value of such real estate. Appraisals are only estimates of value and the independent appraisers may make mistakes of fact or judgment which adversely affect the reliability of their appraisals. In addition, events occurring after the initial appraisal may cause the value of the real estate to increase or decrease. As a result of any of these factors, the real estate securing some of WashingtonFirst’s loans may be more or less valuable than anticipated at the time the loans were made. If a default
25
occurs on a loan secured by real estate that is less valuable than originally estimated, WashingtonFirst may not be able to recover the outstanding balance of the loan and may suffer a loss.
WashingtonFirst is exposed to risk of environmental liabilities with respect to properties to which it takes title.
In the course of its business, WashingtonFirst may foreclose and take title to real estate, potentially becoming subject to environmental liabilities associated with the properties. WashingtonFirst may be held liable to a governmental entity or to third parties for property damage, personal injury, investigation and clean-up costs or it may be required to investigate or clean up hazardous or toxic substances or chemical releases at a property. Costs associated with investigation or remediation activities can be substantial. If WashingtonFirst or the Bank is the owner or former owner of a contaminated site, it may be subject to statutory and/or common law claims by third parties based on damages and costs resulting from environmental contamination emanating from the property. These costs and claims could adversely affect WashingtonFirst’s business.
Item 1B. Unresolved Staff Comments
The Company does not have any unresolved staff comments to report for the year ended December 31, 2016.
Item 2. Properties
The Company leases offices and branch locations that are used in the normal course of business. WashingtonFirst does not own any banking facilities. As of March 9, 2017, WashingtonFirst leased 22 properties of which 19 were operating branches; two were offices for mortgage and wealth business activities; and one was a corporate headquarters office. The branches consist of twelve locations in Virginia, five in Maryland, and two branches in the District of Columbia. All of the leased properties are in good operating condition and are adequate for WashingtonFirst’s present and anticipated future needs.
26
Corporate Office | ||
Corporate Headquarters 11921 Freedom Drive Reston, VA 20190 | ||
Virginia Branches | ||
Annandale | Great Falls | Reston |
7023 Little River Turnpike | 9851 Georgetown Pike | 11636 Plaza America Drive |
Annandale, VA 22003 | Great Falls, VA 22066 | Reston, VA 20190 |
Ballston | Herndon | Sterling |
4501 North Fairfax Drive | 13081 Worldgate Drive | 46901 Cedar Lake Plaza |
Arlington, VA 22203 | Herndon, VA 20170 | Sterling, VA 20164 |
Fairfax | Manassas Park | Tysons Corner |
10777 Main Street | 9113 Manassas Drive | 2095 Chain Bridge Road |
Fairfax, VA 22030 | Manassas Park, VA 20111 | Vienna, VA 22182 |
Fair Lakes | McLean | Old Town Alexandria |
12735 Shoppes Lane | 1356 Chain Bridge Road | 115 N. Washington Street |
Fairfax, VA 22033 | McLean, VA 22101 | Alexandria, VA 22314 |
Maryland Branches | ||
Bethesda | Oxon Hill | Greenbelt |
7708 Woodmont Avenue | 6089 Oxon Hill Road | 6329 Greenbelt Road |
Bethesda, MD 20814 | Oxon Hill, MD 20745 | College Park, MD 20740 |
Rockville | Potomac | |
14941 Shady Grove Road | 9812 Falls Road | |
Rockville, MD 20850 | Potomac, MD 20854 | |
District of Columbia Branches | ||
19th Street | Connecticut Avenue | |
1146 19th Street, NW | 1025 Connecticut Avenue, NW | |
Washington, DC 20036 | Washington, DC 20036 | |
WashingtonFirst Mortgage Offices | ||
Fairfax Office | Rockville Office | |
12700 Fair Lakes Circle, Suite #400 | 7811 Montrose Road, Suite #501 | |
Fairfax, VA 22033 | Rockville, MD 20854 | |
1st Portfolio Wealth Advisors Office | ||
Fairfax Office | ||
12700 Fair Lakes Circle, Suite #400 | ||
Fairfax, VA 22033 | ||
Item 3. Legal Proceedings
From time to time, the Company and its subsidiaries may become involved in various legal proceedings relating to claims arising in the normal course of its business. In the opinion of management, there are currently no pending or threatened legal proceedings which would have a material adverse effect on the Company’s financial condition or results of operations.
Item 4. Mine Safety Disclosures
Not applicable.
27
PART II
Item 5. Market for Registrant’s Common Equity, Related Shareholder Matters and Issuer Purchases of Equity Securities
Market for Common Stock. Our voting common stock is listed for trading on the NASDAQ Capital Market under the symbol “WFBI.” Our non-voting common stock is not listed on any exchange. As of March 9, 2017, there were 12,114,985 shares of common stock voting issued and outstanding and 816,835 shares of common stock non-voting issued and outstanding. As of that date, our common stock voting was held by approximately 450 shareholders of record and the closing price of our common stock voting was $27.13. As of that date, our common stock non-voting was held by two shareholders of record.
The information below represents the high and low closing price per share of the common stock voting stock for the periods indicated below, as reported on the NASDAQ:
Sales Prices (1) | Common Stock Voting and Non-Voting Cash Dividends Declared | ||||||||||
Common Stock Voting | |||||||||||
High | Low | ||||||||||
(per share) | |||||||||||
2017 | |||||||||||
First Quarter (through March 9, 2017) | $ | 29.07 | $ | 27.13 | $ | 0.07 | |||||
2016 | |||||||||||
Fourth Quarter | 29.91 | 22.42 | 0.07 | ||||||||
Third Quarter | 24.24 | 20.30 | 0.06 | ||||||||
Second Quarter | 22.14 | 18.82 | 0.06 | ||||||||
First Quarter | 21.93 | 19.41 | 0.06 | ||||||||
2015 | |||||||||||
Fourth Quarter | 21.60 | 17.14 | 0.06 | ||||||||
Third Quarter | 18.09 | 15.19 | 0.05 | ||||||||
Second Quarter | 16.67 | 15.24 | 0.05 | ||||||||
First Quarter | 16.18 | 14.29 | 0.05 | ||||||||
(1) Prices adjusted to reflect all stock dividends | |||||||||||
The Company commenced paying cash dividends in 2014. Although the Company expects to declare and pay quarterly cash dividends in the future, payment of dividends is at the discretion of the Board of Directors of the Company, and is subject to various federal and state regulatory limitations. Regulatory restrictions on the ability of the Bank to pay dividends to the Company are set forth in “Part 1, Item 1A - Risk Factors.”
The Board of Directors has declared four (4) stock dividends, on the Company’s outstanding shares of common stock voting and common stock non-voting, in the amount of five percent (5%) each: on January 23, 2012 (paid February 29, 2012), on April 5, 2013 (paid May 17, 2013), on July 21, 2014 (paid September 2, 2014), and on December 13, 2016 (paid December 28, 2016).
Stock Price Performance. The following graph and table show the cumulative total return on the common stock of the Company over the last five years, compared with the cumulative total return of a broad stock market index (the Standard and Poor’s 500 Index or “S&P 500”), and a narrower index (the SNL U.S. Bank Index). The graph assumes that $100 was invested on December 31, 2011 in each of: WashingtonFirst’s common stock voting; the S&P 500 Stock Market Index: and the SNL U.S. Bank Index. The graph also assumes that all dividends were reinvested into the same securities throughout the past five years. WashingtonFirst obtained the information contained in the performance graph and table below from SNL Financial.
28
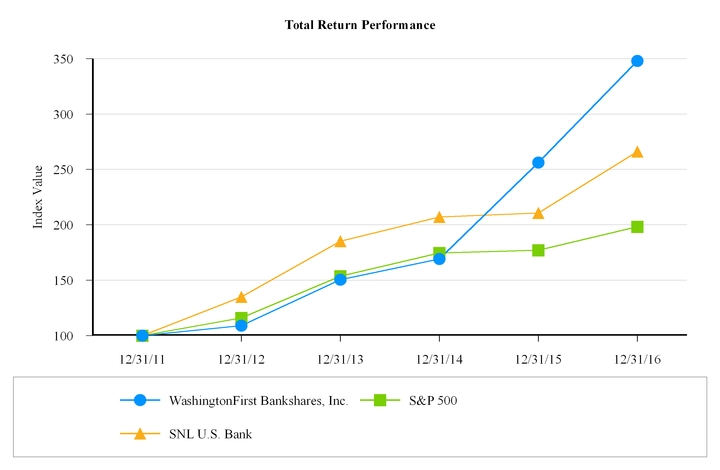
For the Year Ended December 31, | |||||||||||||||||||||||
Index | 2011 | 2012 | 2013 | 2014 | 2015 | 2016 | |||||||||||||||||
WashingtonFirst Bankshares, Inc. | $ | 100.00 | $ | 109.00 | $ | 150.58 | $ | 169.17 | $ | 256.13 | $ | 347.96 | |||||||||||
S&P 500 | 100.00 | 116.00 | 153.57 | 174.60 | 177.01 | 198.18 | |||||||||||||||||
SNL U.S. Bank | 100.00 | 134.95 | 185.28 | 207.12 | 210.65 | 266.16 | |||||||||||||||||
Issuer Repurchase of Common Stock. WashingtonFirst has not repurchased any shares of its common stock.
Item 6. Selected Financial Data
The selected consolidated financial data presented below should be reviewed in conjunction with the audited consolidated financial statements and related notes and with Item 7 - “Management’s Discussion and Analysis of Financial Condition and Results of Operations”.
Use of Non-GAAP Financial Measures. The information set forth below contains certain financial information determined by methods other than in accordance with GAAP. These non-GAAP financial measures are "tangible common equity," "tangible book value per common share," "efficiency ratio", and “adjusted allowance for loan losses”. Management uses these non-GAAP measures in its analysis of our performance because it believes these measures are material and will be used as a measure of our performance by investors. These disclosures should not be considered in isolation or as a substitute for results determined in accordance with GAAP, and are not necessarily comparable to non-GAAP performance measures which may be presented by other bank holding companies. Management compensates for these limitations by providing detailed reconciliations between GAAP information and the non-GAAP financial measures. A reconciliation table is set forth in Item 7 - “Management’s Discussion and Analysis of Financial Condition and Results of Operations”.
29
2016 | 2015 | 2014 | 2013 | 2012 | |||||||||||||||
($ in thousands, except per share data) | |||||||||||||||||||
Results of Operations: | |||||||||||||||||||
Interest income | $ | 73,847 | $ | 63,183 | $ | 55,119 | $ | 46,829 | $ | 28,219 | |||||||||
Interest expense | 12,471 | 9,211 | 7,219 | 6,130 | 4,949 | ||||||||||||||
Net interest income | 61,376 | 53,972 | 47,900 | 40,699 | 23,270 | ||||||||||||||
Provision for loan losses | 3,880 | 3,550 | 3,005 | 4,755 | 3,225 | ||||||||||||||
Net interest income after provision for loan losses | 57,496 | 50,422 | 44,895 | 35,944 | 20,045 | ||||||||||||||
Non-interest income | 27,505 | 7,891 | 1,998 | 1,139 | 3,541 | ||||||||||||||
Non-interest expenses | 56,863 | 39,589 | 33,116 | 28,117 | 20,178 | ||||||||||||||
Income before taxes | 28,138 | 18,724 | 13,777 | 8,966 | 3,408 | ||||||||||||||
Income tax expense | 10,131 | 6,469 | 4,353 | 2,627 | 1,173 | ||||||||||||||
Net income | 18,007 | 12,255 | 9,424 | 6,339 | 2,235 | ||||||||||||||
Net income available to common stockholders | 18,007 | 12,181 | 9,263 | 6,161 | 2,057 | ||||||||||||||
Per Share Data: | |||||||||||||||||||
Net income - basic per share (6) | $ | 1.40 | $ | 1.15 | $ | 1.09 | $ | 0.73 | $ | 0.54 | |||||||||
Net income - diluted per share (6) | 1.37 | 1.13 | 1.06 | 0.72 | 0.53 | ||||||||||||||
Book value per common share (6) | 14.94 | 13.95 | 12.07 | 10.65 | 10.13 | ||||||||||||||
Tangible book value per common share (6) | 13.93 | 12.91 | 11.38 | 10.18 | 9.64 | ||||||||||||||
Dividends paid | 0.24 | 0.20 | 0.16 | — | — | ||||||||||||||
Period End Balances: | |||||||||||||||||||
Assets | $ | 2,002,911 | $ | 1,674,466 | $ | 1,333,390 | $ | 1,127,559 | $ | 1,147,818 | |||||||||
Loans (1) | 1,566,652 | 1,344,577 | 1,066,126 | 838,120 | 753,355 | ||||||||||||||
Investments (2) | 291,930 | 226,241 | 171,733 | 148,897 | 138,221 | ||||||||||||||
Deposits | 1,522,741 | 1,333,242 | 1,086,063 | 948,903 | 972,660 | ||||||||||||||
Borrowings (3) | 270,587 | 149,913 | 104,311 | 63,489 | 64,923 | ||||||||||||||
Shareholders’ equity | 192,660 | 178,595 | 134,538 | 107,604 | 101,520 | ||||||||||||||
Mortgage origination volume | 772,076 | 213,449 | 23,050 | 3,648 | — | ||||||||||||||
Assets under management | 297,394 | 226,688 | — | — | — | ||||||||||||||
Average Balances: | |||||||||||||||||||
Assets | $ | 1,792,435 | $ | 1,483,500 | $ | 1,259,832 | $ | 1,060,309 | $ | 575,751 | |||||||||
Loans (1) | 1,440,519 | 1,187,273 | 949,808 | 783,683 | 443,578 | ||||||||||||||
Investments (2) | 256,716 | 196,172 | 172,367 | 124,418 | 66,675 | ||||||||||||||
Deposits | 1,443,948 | 1,194,549 | 1,059,529 | 892,167 | 487,318 | ||||||||||||||
Borrowings (3) | 146,004 | 133,783 | 81,859 | 56,693 | 29,314 | ||||||||||||||
Shareholders’ equity | 189,632 | 144,492 | 112,707 | 105,489 | 56,801 | ||||||||||||||
Performance Ratios: | |||||||||||||||||||
Return on average assets | 1.00 | % | 0.83 | % | 0.75 | % | 0.60 | % | 0.39 | % | |||||||||
Return on average shareholders' equity | 9.50 | % | 8.48 | % | 8.36 | % | 6.01 | % | 3.92 | % | |||||||||
Yield on average interest-earning assets | 4.23 | % | 4.32 | % | 4.51 | % | 4.57 | % | 5.02 | % | |||||||||
Rate on average interest-bearing liabilities | 1.02 | % | 0.90 | % | 0.83 | % | 0.84 | % | 1.24 | % | |||||||||
Net interest spread | 3.21 | % | 3.42 | % | 3.68 | % | 3.73 | % | 3.78 | % | |||||||||
Net interest margin | 3.52 | % | 3.74 | % | 3.92 | % | 3.97 | % | 4.14 | % | |||||||||
Efficiency ratio (4) | 63.42 | % | 64.00 | % | 66.59 | % | 64.92 | % | 75.26 | % | |||||||||
Dividend payout ratio | 17.14 | % | 17.39 | % | 14.68 | % | — | % | — | % | |||||||||
Capital Ratios: | |||||||||||||||||||
Total regulatory capital to risk-weighted assets | 13.99 | % | 14.86 | % | 13.20 | % | 14.05 | % | 13.77 | % | |||||||||
Tier 1 capital to risk-weighted assets | 11.61 | % | 12.22 | % | 12.14 | % | 12.80 | % | 12.71 | % | |||||||||
Tier 1 leverage | 10.14 | % | 10.67 | % | 10.23 | % | 10.53 | % | 9.97 | % | |||||||||
Tangible common equity to tangible assets (5) | 9.03 | % | 9.95 | % | 8.62 | % | 7.64 | % | 6.97 | % | |||||||||
Average equity to average assets | 10.58 | % | 9.74 | % | 8.95 | % | 9.95 | % | 9.87 | % | |||||||||
30
2016 | 2015 | 2014 | 2013 | 2012 | ||||||||||
($ in thousands, except per share data) | ||||||||||||||
Credit Quality Ratios: | ||||||||||||||
Allowance for loan losses to loans held for investment | 0.89 | % | 0.94 | % | 0.87 | % | 1.02 | % | 0.83 | % | ||||
Adjusted allowance for loan losses to total loans held for investment (7) | 1.11 | % | 1.30 | % | 1.46 | % | 1.67 | % | 2.09 | % | ||||
Non-performing loans to total loans held for investment | 0.46 | % | 1.11 | % | 1.02 | % | 2.48 | % | 2.48 | % | ||||
Non-performing assets to total assets | 0.43 | % | 0.86 | % | 0.84 | % | 1.97 | % | 1.92 | % | ||||
Net charge-offs to average loans held for investment | 0.18 | % | 0.04 | % | 0.24 | % | 0.32 | % | 0.43 | % | ||||
(1) Includes Loans held for sale at lower of cost or fair value and loans held for investment at amortized cost. | ||||||||||||||
(2) Includes the following categories from the balance sheet: available-for-sale investment securities and restricted stocks. | ||||||||||||||
(3) Includes the following categories from the balance sheet: other borrowings, FHLB advances, and long-term borrowings. | ||||||||||||||
(4) The efficiency ratio is calculated as total non-interest expense (less debt extinguishment costs) divided by the sum of net interest income and total non-interest income (less gain on sale of AFS securities). This non-GAAP financial measure is presented to facilitate an understanding of the Company's performance. | ||||||||||||||
(5) Tangible common equity to tangible assets ratio is a non-GAAP financial measure that is presented to facilitate an understanding of the Company's capital structure. Refer to the reconciliation of tangible common equity to tangible assets ratio in "Item 7. Management’s Discussion and Analysis of Financial Condition and Results of Operations". | ||||||||||||||
(6) Adjusted for stock dividends. | ||||||||||||||
(7) This is a non-GAAP financial measure. Credit purchase accounting marks are GAAP marks under purchase accounting guidance. Refer to the reconciliation of GAAP Allowance Ratio to Adjusted Allowance ratio in "Item 7. Management’s Discussion and Analysis of Financial Condition and Results of Operations". | ||||||||||||||
31
Item 7. Management’s Discussion and Analysis of Financial Condition and Results of Operations
The following discussion provides information about the results of operations, financial condition, liquidity, and capital resources of the Company and it’s operating subsidiaries. This discussion and analysis should be read in conjunction with the audited Consolidated Financial Statements and Notes thereto, appearing elsewhere in this report.
Critical Accounting Policies and Estimates
The Company’s consolidated financial statements are prepared in accordance with U.S. GAAP and follow general practices in the U.S. banking industry. Application of these principles requires management to make estimates, assumptions, and judgments that affect the amounts reported in the consolidated financial statements and accompanying notes. These estimates, assumptions, and judgments are based on information available as of the date of the financial statements; accordingly, as this information changes, the financial statements may reflect different estimates, assumptions, and judgments. Certain policies inherently rely to a greater extent on the use of estimates, assumptions, and judgments and as such may have a greater possibility of producing results that could be materially different than originally reported. Management believes the following accounting policies are the most critical to aid in fully understanding and evaluating our reported financial results:
• | allowance for loan losses; |
• | business combinations |
• | goodwill and identifiable intangible asset impairment; and, |
• | accounting for income taxes. |
Allowance for Loan Losses
The allowance for loan and lease losses is an estimate of the probable losses that are inherent in the loan and lease portfolio at the balance sheet date. The allowance is based on the basic principle that a loss be accrued when it is probable that the loss has occurred at
the date of the financial statements and the amount of the loss can be reasonably estimated.
Management believes that the allowance is adequate. However, its determination requires significant judgment, and estimates of probable losses in the lending portfolio can vary significantly from the amounts actually observed. While management uses available information to recognize probable losses, future additions or reductions to the allowance may be necessary based on changes in the loans and comprising the portfolio and changes in the financial condition of borrowers, resulting from changes in economic conditions. In addition, various regulatory agencies, as an integral part of their examination process, and independent consultants engaged by the Company periodically review the loan and lease portfolio and the allowance. Such reviews may result in additional provisions based on their judgments of information available at the time of each examination.
Impaired Loans. A loan is considered impaired when, based on current information and events, it is probable that the Company will be unable to collect the scheduled payments of principal or interest when due according to the contractual terms of the loan agreement. Factors considered by management in determining impairment include payment status, collateral value, and the probability of collecting scheduled principal and interest payments when due. Loans that experience insignificant payment delays and payment shortfalls generally are not classified as impaired. Management determines the significance of payment delays and payment shortfalls on a case-by-case basis, taking into consideration all of the circumstances surrounding the loan and the borrower, including the length of the delay, the reasons for the delay, the borrower’s prior payment record, and the amount of the shortfall in relation to the principal and interest owed. Impairment is measured on a loan-by-loan basis by either the present value of expected future cash flows discounted at the loan’s effective interest rate, the loan’s obtainable market price, or the fair value of the collateral if the loan is collateral dependent.
The Company’s allowance for loan and lease losses has three basic components: a general allowance (ASC 450 reserves) reflecting historical losses by loan category, as adjusted by several factors whose effects are not reflected in historical loss ratios; specific allowances (ASC 310 reserves) for individually identified loans; and an unallocated component. Each of these components, and the allowance methodology used to establish them, are described in detail in Note 1 of the Notes to the Consolidated Financial Statements included in this report. The amount of the allowance is reviewed monthly by management, and periodically by independent consultants.
General reserve component consists of two parts. The first part covers non-impaired loans and is quantitatively derived from an estimate of credit losses averaged during the preceding twelve quarters, adjusted for various qualitative factors applicable to loan portfolio segments. The estimate of credit losses is the product of the adjusted net charge-off historical loss experience multiplied by the balance of the loan segment. The qualitative environmental factors consist of national, local, and portfolio characteristics and are applied to the loan segments. The following are types of environmental factors management considers:
• | trends in delinquencies and other non-performing loans; |
32
• | changes in the risk profile related to large loans in the portfolio; |
• | changes in the categories of loans comprising the loan portfolio; |
• | concentrations of loans to specific industry segments; |
• | changes in economic conditions on both a local and national level; |
• | changes in the Company’s credit administration and loan portfolio management processes; and |
• | quality of the Company’s credit risk identification processes. |
Specific reserve component is established for individually impaired loans. As a practical expedient, for collateral dependent loans, the Company measures impairment based on fair value of the collateral less costs to sell the underlying collateral. For loans on which the Company has not elected to use a practical expedient to measure impairment, the Company will measure impairment based on the present value of expected future cash flows discounted at the loan’s effective interest rate. In determining the cash flows to be included in the discount calculation the Company considers the several factors when estimating the probability and severity of potential losses, including borrower’s overall financial condition, resources and payment record, demonstrated or documented support available from guarantors, and adequacy of realizable collateral value in a liquidation scenario.
Unallocated component may be used to cover uncertainties that could affect management’s estimate of probable losses. The unallocated component of the allowance reflects the margin of imprecision inherent in the underlying assumptions used in the methodologies for estimating specific and general losses in the loan portfolio.
Business Combinations
Business combinations are accounted for under ASC 805, Business Combinations, using the acquisition method of accounting. The acquisition method of accounting requires an acquirer to recognize the assets acquired and liabilities assumed at the acquisition date measured at their fair value as of that date. To determine fair value, the Company utilizes third party valuations, such as appraisals, or internal valuations based on discounted cash flow analysis or other valuation techniques. Under the acquisition method of accounting, the Company will identify the acquirer and the closing date and apply applicable recognition principals and conditions. If they are necessary, to implement its plan to exit an activity of an acquiree, the costs that the Company expects, but is not obligated, to incur in the future are not liabilities at the acquisition date, nor are costs to terminate the employment of or relocate an acquiree’s employee(s). The Company does not recognize these costs as part of applying the acquisition method. Instead, the Company recognizes these costs as expenses in its post-combination financial statements in accordance with other applicable U.S. GAAP.
Acquisition-related costs are costs the Company incurs to effect a business combination. These costs include advisory, legal, accounting, valuation and other professional services. Some other examples of acquisition-related costs to the Company include systems conversions, integration planning consultants and advertising costs. The Company will account for acquisition-related costs as expenses in periods in which the costs are incurred and the services received.
Loans acquired in a business combination are recorded at fair value on the date of acquisition. Loans acquired with deteriorating credit quality are accounted for in accordance with ASC 310-30, Receivables - Loans and Debt Securities Acquired with Deteriorating Credit Quality, and are initially measured at fair value, which includes estimated future credit losses expected to be incurred over the life of the loans. Loans acquired in business combinations with evidence of credit deterioration are not considered to be impaired unless they deteriorate further subsequent to the acquisition. Certain acquired loans, including performing loans and revolving lines of credit, are accounted for in accordance with ASC 310-20, Receivables - Nonrefundable Fees and Other Costs, where the discount is accreted through earnings based on estimated cash flows over the estimated life of the loan.
Goodwill and Identifiable Intangible Assets
The Company follows ASC 350, Goodwill and Other Intangible Assets, which prescribes the accounting for goodwill and intangible assets subsequent to initial recognition. Goodwill is generally determined as the excess of the fair value of the consideration transferred, plus the fair value of any non-controlling interests in the acquiree, over the fair value of the net assets acquired and liabilities assumed as of the acquisition date. Goodwill and intangible assets acquired in a purchase business combination and determined to have an indefinite useful life are not amortized, but tested for impairment at least annually or more frequently if events and circumstances exist that indicate that a goodwill impairment test should be performed. The Company performs its annual impairment testing in the 4th quarter, or more frequently if events or changes in circumstances indicate that the asset may be impaired. Examples of such events include, but are not limited to, a significant deterioration in future operating results, adverse action by a regulator, or a loss of key personnel. If the fair value is less than book value, an expense may be required to write-down the related goodwill to the proper carrying value. Intangible assets with definite useful lives such as core deposits and customer relationships are amortized over their estimated useful lives to their estimated residual values. These are initially measured at fair value and then are amortized over their useful lives. Determining the fair value requires the Company to use a degree of subjectivity. Intangible assets with definite useful lives are amortized over their estimated useful lives, to their estimated residual values. Goodwill is the only intangible asset with an indefinite life on the Company’s Consolidated Balance Sheets. Core deposit intangible assets arise when a
33
bank has a stable deposit base comprised of funds associated with long-term customer relationships. The intangible asset value derives from customer relationships that provide a low-cost source of funding. Client list intangible assets arise when a client list is acquired through a business combination and that client list is deemed to be an asset that will provide value over a finite period of time.
Accounting for Income Taxes
The Company accounts for income taxes by recording deferred income taxes that reflect the net tax effects of temporary differences between the carrying amounts of assets and liabilities for financial reporting purposes and the amounts used for income tax purposes. Management exercises significant judgment in the evaluation of the amount and timing of the recognition of the resulting tax assets and liabilities. The judgments and estimates required for the evaluation are updated based upon changes in business factors and the tax laws. If actual results differ from the assumptions and other considerations used in estimating the amount and timing of tax recognized, there can be no assurance that additional expenses will not be required in future periods. The Company’s accounting policy follows the prescribed authoritative guidance that a minimal probability threshold of a tax position must be met before a financial statement benefit is recognized. The Company recognizes, when applicable, interest and penalties related to unrecognized tax benefits in other non-interest expenses in its consolidated statements of income. Assessment of uncertain tax positions requires careful consideration of the technical merits of a position based on management’s analysis of tax regulations and interpretations. Significant judgment may be involved in applying the applicable reporting and accounting requirements.
Management expects that the Company’s adherence to the required accounting guidance may result in increased volatility in quarterly and annual effective income tax rates due to the requirement that any change in judgment or measurement of a tax position taken in a prior period be recognized as a discrete event in the period in which it occurs. Factors that could impact management’s judgment include changes in income, tax laws and regulations, and tax planning strategies.
Executive Overview
The following discussion provides information about the results of operations, financial condition, liquidity, and capital resources of the Company and its subsidiary. This discussion and analysis should be read in conjunction with Item 8 - “Consolidated Financial Statements and Notes”.
Consolidated net income available to common shareholders was $18.0 million (or $1.37 per diluted common share) for the year ended December 31, 2016. Net income available to common shareholders during 2016 increased $5.8 million, up 47.8% over the $12.2 million (or $1.13 per diluted common share) earned during the year ended December 31, 2015. These results reflect the following:
• | The increase in earnings is primarily attributable to the growth in earning assets of the Bank and mortgage originations. In July 2015, the Company successfully completed the 1st Portfolio Acquisition which added mortgage banking and wealth advisory services and related revenue streams. |
• | Return on average assets for the year ended December 31, 2016 was 1.00% compared to 0.83% for the same period last year, and for the prior quarter. |
• | Return on average shareholders’ equity for the year ended December 31, 2016 was 9.50% compared to 8.48% for the year ended December 31, 2015. |
• | Net interest income after provision for loan losses for the year ended December 31, 2016 increased $7.1 million or 14.0% to $57.5 million compared to $50.4 million for the year ended December 31, 2015. This increase is primarily attributable to growth in earning assets of the Bank. |
• | During the year ended December 31, 2016, the Mortgage Company generated $24.4 million in gross revenue on $772.1 million of mortgage production compared to $5.6 million in revenue on $213.4 million of mortgage production in the prior year. In 2016, mortgage production contributed net income of $3.2 million or $0.25 cents per share fully diluted. |
• | As of December 31, 2016 and December 31, 2015, total assets were $2.0 billion and $1.7 billion, respectively. Total net loans held for investment increased by $225.2 million (17.4%) from $1.3 billion as of December 31, 2015, to $1.5 billion as of December 31, 2016. This increase is attributable to organic growth from our existing lending team. During the same period, total deposits increased $189.5 million (14.2%) to $1.5 billion. This increase is attributable to core deposit growth. |
• | As of December 31, 2016, WashingtonFirst had $8.5 million in non-performing assets, 0.43% of total assets; a decrease of $6.0 million from $14.5 million at December 31, 2015. Allowance for loan losses increased to $13.6 million during the year ended December 31, 2016 increasing $1.3 million compared to December 31, 2015. The increase in the allowance was driven by provisions of $3.9 million partially offset by net charge-offs of $2.6 million. |
• | The Company paid its 13th consecutive quarterly dividend of $0.07 on January 3, 2017. |
34
The Company's primary market, the Washington, D.C. metropolitan area (which includes the District of Columbia proper, Northern Virginia and suburban Maryland), has been relatively less impacted by recessionary forces than other parts of the country. The region’s economic strength is due not only to the region’s significant federal presence, but also to strong growth in the business and professional services sector. Private sector growth was attributable in part to a diverse economy including a large health care component, substantial business services, and a highly educated work force. The unemployment rate in the region has remained consistently below the national average for the last several years. Much of this success is due to the region’s highly trained and educated workforce. According to the U.S. Census Bureau, the region is home to six of the top ten most highly educated counties in the nation and six of the top ten most affluent counties, as measured by household income. Collectively, the Company’s market area is more diverse and resilient than many other regions. During much of 2016, the Mid-Atlantic region in which the Company operates continued to show consistent economic improvement. Market interest rates and general conditions remained favorable for all business segments. The Bank experienced healthy loan growth while maintaining strong levels of liquidity, capital and credit quality. The Mortgage Company benefited from favorable interest rates spurring an increase in refinancings.
Acquisition Activities in 2015
On May 13, 2015, the Company entered into an Agreement and Plan of Reorganization (“1st Portfolio Agreement”) providing for the Company’s acquisition of 1st Portfolio Holding Corporation with and into the Company (“1st Portfolio Acquisition”). The 1st Portfolio Acquisition closed on July 31, 2015. 1st Portfolio Holding Corporation’s wholly owned subsidiary, 1st Portfolio Wealth Advisors became a wholly owned subsidiary of the Company and wholly owned subsidiary 1st Portfolio Lending Corporation (now WashingtonFirst Mortgage Corporation) became a wholly owned subsidiary of WashingtonFirst Bank.
The 1st Portfolio Acquisition was accounted for using the acquisition method. Accordingly, assets acquired, liabilities assumed and consideration paid were recorded at their estimated fair values as of the transaction date. The excess of fair value of net liabilities assumed exceeded cash received in the transaction resulting in goodwill of $5.2 million. The Company also recorded $1.4 million in customer list intangibles which will be amortized over 15 years.
Results of Operations
The following tables provide information regarding interest-earning assets and funding for the years ended 2016, 2015, and 2014. The balance of non-accruing loans is included in the average balance of loans presented, though the related income is accounted for on a cash basis. Therefore, as the balance of non-accruing loans and the income received increases or decreases, the net interest yield will fluctuate accordingly. The increase in average rate on interest-bearing deposit accounts is consistent with general trends in average short-term rates during the periods presented. The upward trend in the average rate on time deposits reflects the maturity of older time deposits and the issuance of new time deposits at higher market rates.
35
Table M1: Average Balances, Interest Income and Expense and Average Yield and Rates | ||||||||||||||||||||||||||||||||
For the Year Ended December 31, | ||||||||||||||||||||||||||||||||
2016 | 2015 | 2014 | ||||||||||||||||||||||||||||||
Average Balance | Income/ Expense | Yield/ Rate | Average Balance | Income/ Expense | Yield/ Rate | Average Balance | Income/ Expense | Yield/ Rate | ||||||||||||||||||||||||
($ in thousands) | ||||||||||||||||||||||||||||||||
Assets | ||||||||||||||||||||||||||||||||
Interest-earning assets: | ||||||||||||||||||||||||||||||||
Loans held for sale | $ | 47,598 | $ | 1,790 | 3.76 | % | $ | 10,596 | $ | 401 | 3.78 | % | $ | 961 | $ | 64 | 6.66 | % | ||||||||||||||
Loans held for investment (1) | 1,392,921 | 67,111 | 4.82 | % | 1,176,677 | 58,945 | 5.00 | % | 948,847 | 51,548 | 5.43 | % | ||||||||||||||||||||
Investment securities - taxable | 243,578 | 4,274 | 1.75 | % | 186,931 | 3,257 | 1.74 | % | 163,351 | 2,886 | 1.77 | % | ||||||||||||||||||||
Investment securities - tax-exempt (2) | 6,849 | 149 | 2.18 | % | 3,088 | 93 | 3.01 | % | 4,776 | 133 | 3.56 | % | ||||||||||||||||||||
Other equity securities | 6,289 | 284 | 4.52 | % | 6,153 | 257 | 4.18 | % | 4,240 | 166 | 3.92 | % | ||||||||||||||||||||
Interest-bearing balances | 86 | 1 | 1.57 | % | 4,239 | 27 | 0.64 | % | 14,056 | 87 | 0.62 | % | ||||||||||||||||||||
Federal funds sold | 48,110 | 264 | 0.55 | % | 55,121 | 222 | 0.40 | % | 87,388 | 235 | 0.27 | % | ||||||||||||||||||||
Total interest earning assets | 1,745,431 | 73,873 | 4.23 | % | 1,442,805 | 63,202 | 4.32 | % | 1,223,619 | 55,119 | 4.51 | % | ||||||||||||||||||||
Non-interest earning assets: | ||||||||||||||||||||||||||||||||
Cash and due from banks | 3,209 | 3,795 | 3,216 | |||||||||||||||||||||||||||||
Premises and equipment | 7,499 | 6,575 | 5,932 | |||||||||||||||||||||||||||||
Other real estate owned | 1,609 | 250 | 1,026 | |||||||||||||||||||||||||||||
Other assets (3) | 47,291 | 40,549 | 34,605 | |||||||||||||||||||||||||||||
Less: allowance for loan losses | (12,604 | ) | (10,474 | ) | (8,566 | ) | ||||||||||||||||||||||||||
Total non-interest earning assets | 47,004 | 40,695 | 36,213 | |||||||||||||||||||||||||||||
Total Assets | $ | 1,792,435 | $ | 1,483,500 | $ | 1,259,832 | ||||||||||||||||||||||||||
Liabilities and Shareholders’ Equity | ||||||||||||||||||||||||||||||||
Interest-bearing liabilities: | ||||||||||||||||||||||||||||||||
Interest-bearing demand deposits | $ | 121,823 | $ | 355 | 0.29 | % | $ | 106,202 | $ | 261 | 0.25 | % | $ | 90,759 | $ | 193 | 0.21 | % | ||||||||||||||
Money market deposit accounts | 277,552 | 1,666 | 0.60 | % | 229,819 | 1,129 | 0.49 | % | 212,373 | 1,026 | 0.48 | % | ||||||||||||||||||||
Savings accounts | 207,153 | 1,469 | 0.71 | % | 137,010 | 943 | 0.69 | % | 124,943 | 896 | 0.72 | % | ||||||||||||||||||||
Time deposits | 475,224 | 5,237 | 1.10 | % | 411,336 | 4,098 | 1.00 | % | 358,982 | 3,328 | 0.93 | % | ||||||||||||||||||||
Total interest-bearing deposits | $ | 1,081,752 | 8,727 | 0.81 | % | 884,367 | 6,431 | 0.73 | % | 787,057 | 5,443 | 0.69 | % | |||||||||||||||||||
FHLB advances | 106,882 | 1,583 | 1.48 | % | 109,967 | 1,625 | 1.48 | % | 63,108 | 1,051 | 1.67 | % | ||||||||||||||||||||
Other borrowings and long-term borrowings | 39,122 | 2,161 | 5.52 | % | 23,816 | 1,155 | 4.85 | % | 18,751 | 725 | 3.87 | % | ||||||||||||||||||||
Total interest-bearing liabilities | $ | 1,227,756 | 12,471 | 1.02 | % | 1,018,150 | 9,211 | 0.90 | % | 868,916 | 7,219 | 0.83 | % | |||||||||||||||||||
Non-interest-bearing liabilities: | ||||||||||||||||||||||||||||||||
Demand deposits | 362,196 | 310,182 | 272,472 | |||||||||||||||||||||||||||||
Other liabilities | 12,851 | 10,676 | 5,737 | |||||||||||||||||||||||||||||
Total non-interest-bearing liabilities | 375,047 | 320,858 | 278,209 | |||||||||||||||||||||||||||||
Total Liabilities | 1,602,803 | 1,339,008 | 1,147,125 | |||||||||||||||||||||||||||||
Shareholders’ Equity | 189,632 | 144,492 | 112,707 | |||||||||||||||||||||||||||||
Total Liabilities and Shareholders’ Equity | $ | 1,792,435 | $ | 1,483,500 | $ | 1,259,832 | ||||||||||||||||||||||||||
Interest Spread (4) | 3.21 | % | 3.42 | % | 3.68 | % | ||||||||||||||||||||||||||
Net Interest Margin (2)(5) | $ | 61,402 | 3.52 | % | $ | 53,991 | 3.74 | % | $ | 47,900 | 3.92 | % | ||||||||||||||||||||
(1) | Includes loans placed on non-accrual status. |
(2) | Yield and income presented on a fully taxable equivalent (FTE) basis using a federal statutory rate of 35 percent and includes $26 thousand and $19 thousand of FTE income for the year ended December 31, 2016, and December 31, 2015, respectively. |
(3) | Includes intangibles, deferred tax asset, accrued interest receivable, bank-owned life insurance and other assets. |
(4) | Interest spread is the average yield earned on earning assets, less the average rate incurred on interest bearing liabilities. |
(5) | Net interest margin is net interest income, expressed as a percentage of average earning assets. |
36
The following tables set forth information regarding the changes in the components of the Company’s net interest income for the periods indicated. For each category, information is provided for changes attributable to changes in volume (change in volume multiplied by old rate) and changes in rate (change in rate multiplied by old volume). Combined rate/volume variances, the third element of the calculation, are allocated based on their relative size. The decreases in income due to changes in rate reflect the reset of variable rate investments, variable rate deposit accounts and adjustable rate mortgages to lower rates and the acquisition of new lower yielding investments and loans, as described above. The decrease in expense reflects the decreased cost of funding due to lower interest rates available in the debt markets. The increases due to changes in volume reflect the increase in on-balance sheet assets during the year ended December 31, 2016, and 2015.
Table M2: Changes in Rate and Volume Analysis | |||||||||||||||||||||||
2016 vs. 2015 | 2015 vs. 2014 | ||||||||||||||||||||||
(Decrease)/Increase Due to | (Decrease)/Increase Due to | ||||||||||||||||||||||
Rate | Volume | Total | Rate | Volume | Total | ||||||||||||||||||
($ in thousands) | |||||||||||||||||||||||
Income from interest-earning assets: | |||||||||||||||||||||||
Loans held for sale | $ | (2 | ) | $ | 1,391 | $ | 1,389 | $ | (39 | ) | $ | 376 | $ | 337 | |||||||||
Loans held for investment | (2,310 | ) | 10,476 | 8,166 | (4,226 | ) | 11,623 | 7,397 | |||||||||||||||
Investment securities - taxable | 19 | 998 | 1,017 | (76 | ) | 447 | 371 | ||||||||||||||||
Investment securities - tax exempt | (31 | ) | 87 | 56 | (19 | ) | (40 | ) | (59 | ) | |||||||||||||
Other equity securities | 21 | 6 | 27 | 12 | 79 | 91 | |||||||||||||||||
Interest bearing balances | 16 | (42 | ) | (26 | ) | 3 | (63 | ) | (60 | ) | |||||||||||||
Federal funds sold | 73 | (31 | ) | 42 | 91 | (104 | ) | (13 | ) | ||||||||||||||
Total income from interest-earning assets | (2,214 | ) | 12,885 | 10,671 | (4,254 | ) | 12,318 | 8,064 | |||||||||||||||
Expense from interest-bearing liabilities: | |||||||||||||||||||||||
Interest-bearing deposits | 756 | 1,540 | 2,296 | 315 | 673 | 988 | |||||||||||||||||
FHLB Advances | — | (42 | ) | (42 | ) | (143 | ) | 717 | 574 | ||||||||||||||
Borrowed funds | 178 | 828 | 1,006 | 205 | 225 | 430 | |||||||||||||||||
Total expense from interest-bearing liabilities | 934 | 2,326 | 3,260 | 377 | 1,615 | 1,992 | |||||||||||||||||
Increase (Decrease) in net interest income | $ | (3,148 | ) | $ | 10,559 | $ | 7,411 | $ | (4,631 | ) | $ | 10,703 | $ | 6,072 | |||||||||
Interest Earning Assets
Average loan balances were $1.4 billion for the year ended December 31, 2016, compared to $1.2 billion and $948.8 million for 2015 and 2014, respectively. This 18.4% increase over the prior year is attributable primarily to organic growth. The related interest income from loans was $67.1 million for the year ended December 31, 2016 resulting in an average yield of 4.82%, compared to $58.9 million and $51.5 million for 2015 and 2014, resulting in average yields of 5.00% and 5.43%, respectively. The decrease in average yield on loans reflects competitive pressure on loan pricing during the period (including the repricing of adjustable rate loans). Interest rates are established for classes of loans that include variable rates based on the prime rate as reported by The Wall Street Journal or other identifiable bases while others carry fixed rates with terms as long as 30 years. Most variable rate originations include minimum initial rates and/or floors.
Taxable investment securities balances averaged $243.6 million for the year ended December 31, 2016, compared to $186.9 million and $163 million for 2015 and 2014, respectively. Interest income generated on these investment securities for the year ended December 31, 2016 totaled $4.3 million, or a 1.75% yield, compared to $3.3 million or a 1.74% yield and $2.9 million or a 1.77% yield for 2015 and 2014, respectively.
Tax-exempt investment securities balances averaged $6.8 million for the year ended December 31, 2016, compared to $3.1 million and $4.8 million for 2015 and 2014, respectively. Interest income generated on these investment securities for the year ended December 31, 2016 totaled $149.0 thousand, or a 2.18% yield, compared to $93.0 thousand or a 3.01% yield and $133.0 thousand or a yield of 3.56% for 2015 and 2014, respectively. The yield for tax-exempt securities has been presented on a fully taxable equivalent basis.
Other equity securities balances averaged $6.3 million for the year ended December 31, 2016, compared to $6.2 million and $4.2 million for 2015 and 2014, respectively. Interest income generated on these investment securities for the year ended
37
December 31, 2016 totaled $284.0 thousand, or a 4.52% yield, compared to $257.0 thousand or a 4.18% yield for 2015 and $166.0 thousand or a 3.92% yield for 2014.
Interest-bearing balances averaged $86.0 thousand for the year ended December 31, 2016, compared to $4.2 million for the year ended December 31, 2015. Interest income generated on these balances for the year ended December 31, 2016 totaled $1.0 thousand, or a 1.57% yield, compared to $27.0 thousand or a 0.64% yield for the year ended December 31, 2015.
Short-term investments in federal funds sold averaged $48.1 million for the year ended December 31, 2016, compared to $55.1 million for the year ended December 31, 2015. The decrease in average short-term investments in 2016 is attributable to loan growth out pacing deposit growth. Interest income generated on these assets for the year ended December 31, 2016 totaled $264.0 thousand, or a 0.55% yield, compared to $222.0 thousand, or a 0.40% yield, for the year ended December 31, 2015.
Interest Bearing Liabilities
Average interest-bearing deposits were $1.1 billion for the year ended December 31, 2016 compared to $884.4 million and $787.1 million for 2015 and 2014, respectively. This 22.3% increase in the average interest-bearing deposits in 2016 is the result of organic growth. The related interest expense from interest-bearing deposits was $8.7 million for the year ended December 31, 2016, compared to $6.4 million and $5.4 million for 2015 and 2014, respectively. The average rate on these deposits was 0.81% for the year ended December 31, 2016, compared to 0.73% for 2015 and 0.69% for 2014. This increase in the cost of interest-bearing deposits is attributable to increased competition in the Company’s market, and changes in the mix of interest-bearing deposits. The increase in interest expense is primarily attributable to an increase in the average balance of interest bearing liabilities as well as changes in the mix of deposit funding.
FHLB advances averaged $106.9 million for the year ended December 31, 2016, compared to $110.0 million and $63.1 million for 2015 and 2014, respectively. Interest expense incurred on these borrowings for year ended December 31, 2016, totaled $1.6 million, or a 1.48% rate, compared to $1.6 million, or a 1.48% rate, for 2015 and $1.1 million, or a 1.67% rate, for 2014. In late June 2016, the Company prepaid a long-term FHLB advance as part of management’s efforts to delever the balance sheet. This $25.0 million advance had a coupon rate of 3.99% but an effective cost of 2.04% after considering the purchase accounting mark on the instrument. In August 2016, the Company prepaid an additional $10.0 million advance.
Other borrowings and long-term liabilities averaged $39.1 million for the year ended December 31, 2016, compared to $23.8 million for 2015 and $18.8 million for 2014. Interest expense incurred on these borrowing for the year ended December 31, 2016, totaled $2.2 million, or a 5.52% rate, compared to $1.2 million, or a 4.85% rate for 2015 and $0.7 million or a 3.87% rate for 2014.
The Company’s net interest margin includes the benefit of acquisition accounting fair value adjustments (purchase marks). Net accretion related to acquisition accounting totaled $1.0 million for the year ended December 31, 2016. Borrowings accretion ceased after the FHLB advance with a purchase accounting mark was prepaid during the June 2016 deleveraging strategy mentioned earlier. Actual accretion results presented are augmented by prepayments of loans, whereas future projections of accretion are based solely on the contractual maturity of loans and do not include estimated accretion related to prepayment of loans. The actual 2016 and remaining estimated net accretion impact are reflected in the following table.
Table M3: Purchase Accounting Accretion Analysis | ||||||||
Loan Accretion | Borrowings Accretion (Amortization) | Total | ||||||
($ in thousands) | ||||||||
For the years ending: | ||||||||
2016 (1) | 1,004 | 93 | 1,097 | |||||
2017 | 309 | (139 | ) | 170 | ||||
2018 | 313 | (139 | ) | 174 | ||||
2019 | 312 | (139 | ) | 173 | ||||
2020 | 295 | (139 | ) | 156 | ||||
2021 | 269 | (139 | ) | 130 | ||||
Thereafter | 2,446 | (1,594 | ) | 852 | ||||
(1) The remaining purchase mark on an acquired FHLB advance totaling $2.3 million was accelerated upon early prepayment and moved from the margin to the debt extinguishment line item in order to net with the prepayment penalty incurred during the second quarter of 2016. | ||||||||
38
Non-Interest Income
For the year ended December 31, 2016, non-interest income was $27.5 million, compared to $7.9 million and $2.0 million for 2015 and 2014, respectively. This $19.6 million increase over the year ended December 31, 2015 is primarily attributable to the 1st Portfolio Acquisition in July 2015. Gains on the sale of available-for-sale investment securities totaled $1.3 million for the year ended December 31, 2016, compared to $10.0 thousand and $166.0 thousand for 2015 and 2014, respectively. The increase of $1.3 million over the year ended December 31, 2015 is primarily attributable to a deleveraging strategy implemented in June 2016 and, to a lesser extent, in July 2016. The aforementioned deleveraging strategy sought to prepay two long-term FHLB advances, one of which had been acquired during prior acquisitions, with the sale of securities in gain positions to substantially offset the cost of prepayment penalties incurred during the termination of the two FHLB advances. The net effect was to reduce average assets with minimal impact to earnings.
The Mortgage Company realized gains on the sale of loans of $18.3 million for the year ended December 31, 2016, compared to $4.6 million and $0.4 million for 2015 and 2014, respectively. During the year ended December 31, 2016, 61.6% of the mortgage loan volume was for purchase money mortgage loans, whereas only 54.8% and 64.4% of the mortgage volume for 2015 and 2014, respectively, was for purchase money loans. Additional fee income of $4.3 million was generated by the mortgage subsidiary for the year ended December 31, 2016. Gains realized through July 31, 2015, are related to the Bank’s legacy mortgage division which was combined with the Mortgage Company in August 2015 after the 1st Portfolio Acquisition. The mortgage subsidiary closed on a record volume of loans during the year ended December 31, 2016, compared to any prior comparable period in its history. Mortgage origination volume for the year ended December 31, 2016, was $772.1 million, compared to $213.4 million for the prior year. Mortgage operations tend to be subject to seasonality with higher levels of volume seen during the second and third quarters annually.
The Wealth Management segment generated $1.8 million in revenue for the year ended December 31, 2016. Prior to July 2015, no such income was generated. The Wealth Management segment generated $693.0 thousand in revenue for year ended December 31, 2015. Assets under management grew to $297.4 million as of December 31, 2016, at the wealth management subsidiary, compared to $226.7 million as of December 31, 2015.
Non-Interest Expense
For the year ended December 31, 2016, non-interest expense was $56.9 million, compared to $39.6 million and $33.1 million for 2015 and 2014, respectively. The increase of $17.3 million over the year ended December 31, 2015 is primarily attributable to the acquisition of 1st Portfolio in July 2015. Compensation and employee benefits were $35.2 million, $23.1 million, and $18.1 million for the year ended December 31, 2016, 2015, and 2014, respectively. This $12.1 million increase over the year ended December 31, 2015 is primarily attributable to mortgage loan officer commissions, increase in staff levels stemming from the 1st Portfolio Acquisition, and organic growth in the banking segment. Increases in premises and equipment expense is primarily due to an increase in rent expense associated with the addition of two new branches during the first quarter of 2016, as well as 1st Portfolio’s two office locations. Increases in data processing expense is primarily attributable to increased core processing costs given the Bank’s growth and enhancements to network infrastructure. During the year ended December 31, 2016, as part of the deleveraging strategy outlined earlier, the Company prepaid two long-term FHLB advances and incurred debt extinguishment costs of $1.3 million, respectively. No such costs were incurred during the year ended December 31, 2015 or prior.
Gain on sale of loans is highly correlated with salaries and employee benefits at the mortgage subsidiary due to commissions paid to loan officers. Salaries and employee benefits totaled $15.0 million for year ended December 31, 2016, compared to$3.7 million for 2015, at the mortgage segment. Of those amounts, $8.8 million and $2.0 million were related to variable commission and bonus costs for the year ended December 31, 2016, and 2015, respectively. Other expenses at the mortgage segment totaled $3.3 million and $0.8 million for the year ended December 31, 2016, and 2015, respectively. Of those amounts, $1.3 million and $0.3 million, respectively, were variable and based upon mortgage volume. These mortgage variable costs are primarily made up of appraisal, verification and credit reporting costs incurred upfront; as well as closing expenses, investor fees, and quality control costs incurred during and after loan closing.
Changes in other operating expenses are outlined in the following table.
39
Table M4: Consolidated Statement of Operations - Other Operating Expenses Detail | |||||||||||
For the Year Ended December 31, | |||||||||||
2016 | 2015 | 2014 | |||||||||
($ in thousands) | |||||||||||
Other real estate owned expenses | $ | 319 | $ | 21 | $ | 391 | |||||
Business and franchise tax | 1,358 | 1,005 | 824 | ||||||||
Advertising and promotional expenses | 1,070 | 801 | 665 | ||||||||
FDIC premiums | 1,002 | 862 | 866 | ||||||||
Postage, printing and supplies | 216 | 179 | 213 | ||||||||
Directors' fees | 415 | 362 | 289 | ||||||||
Insurance | 224 | 217 | 114 | ||||||||
Amortization of intangibles | 269 | 213 | 158 | ||||||||
Other | 1,327 | 892 | 994 | ||||||||
Other expenses | $ | 6,200 | $ | 4,552 | $ | 4,514 | |||||
Provision for Income Taxes
Provision for income taxes were $10.1 million for year ended December 31, 2016, compared to $6.5 million and $4.4 million for 2015 and 2014, respectively, resulting in effective tax rates of 36.0%, 34.5%, and 31.6%, respectively.
Financial Condition
Total assets were $2.0 billion as of December 31, 2016, compared to $1.7 billion as of December 31, 2015. This 19.6% increase is primarily attributable to the Bank’s organic growth. As of December 31, 2016, the Company had $97.4 million of cash and cash equivalents, compared to $62.8 million as of December 31, 2015. As of December 31, 2016, the Company had $280.2 million of investment securities, compared to $220.1 million as of December 31, 2015.
Total loans held for investment, net, increased $225.2 million (17.4%) from $1.3 billion as of December 31, 2015, to $1.5 billion as of December 31, 2016. This increase is attributable to organic loan growth in our core market.
Total deposits increased $189.5 million (14.2%) from $1.3 billion as of December 31, 2015 to $1.5 billion as of December 31, 2016. This increase is attributable to a $77.5 million growth in non-interest demand deposit account balances, a $27.0 million growth in transactional accounts, and a $85.0 million increase in time deposits.
Total shareholders’ equity increased $14.1 million (7.9%) from $178.6 million as of December 31, 2015 to $192.7 million as of December 31, 2016. The increase in total shareholders’ equity during that period is attributable to net income of $18.0 million, stock option exercises of $837.0 thousand, less year to date cash dividends declared of $3.1 million, offset by a $2.5 million decrease in accumulated other comprehensive income as a result of the change in fair value of the available-for-sale investment portfolio.
Investment Securities - Available-for-sale
The Company actively manages its portfolio duration and composition in response to changing market conditions and changes in balance sheet risk management needs. Additionally, the securities are pledged as collateral for certain borrowing transactions, public funds and repurchase agreements. The total fair value of the amount of the investment securities accounted for under available-for-sale accounting was $280.2 million as of December 31, 2016, compared to $220.1 million as of December 31, 2015. The increase is primarily attributable to additional purchases of investment securities. For reporting purposes, management includes Small Business Administration debentures within the mortgage backed securities subtotal due to similar cash flow characteristics.
40
Table M5: Available-for-Sale Investment Securities Summary | ||||||||||||||||||||
As of December 31, | ||||||||||||||||||||
2016 | 2015 | 2014 | ||||||||||||||||||
Amount | Percent | Amount | Percent | Amount | Percent | |||||||||||||||
($ in thousands) | ||||||||||||||||||||
U.S. Treasuries | $ | 8,078 | 2.9 | % | $ | 9,618 | 4.4 | % | $ | 3,014 | 1.8 | % | ||||||||
U.S. Government agencies | 98,476 | 35.2 | % | 96,016 | 43.6 | % | 51,864 | 31.1 | % | |||||||||||
Mortgage-backed securities | 68,951 | 24.6 | % | 58,876 | 26.7 | % | 50,792 | 30.5 | % | |||||||||||
Collateralized mortgage obligations | 78,818 | 28.1 | % | 40,398 | 18.4 | % | 44,815 | 26.9 | % | |||||||||||
Taxable state and municipal securities | 11,292 | 4.0 | % | 10,853 | 4.9 | % | 12,754 | 7.7 | % | |||||||||||
Tax-exempt state and municipal securities | 14,589 | 5.2 | % | 4,352 | 2.0 | % | 3,269 | 2.0 | % | |||||||||||
Total available-for-sale investment securities | $ | 280,204 | 100.0 | % | $ | 220,113 | 100.0 | % | $ | 166,508 | 100.0 | % | ||||||||
The amortized cost, fair value and yield of investments by remaining contractual maturity for available-for-sale investment securities are set forth below. Asset-backed and mortgage-backed securities are included based on their final maturities, although the actual maturities may differ due to prepayments of the underlying assets or mortgages.
Table M6: Available-for-Sale Investment Securities Contractual Maturity | ||||||||||
December 31, 2016 | ||||||||||
Amortized Cost | Fair Value | Weighted-Average Yield | ||||||||
($ in thousands) | ||||||||||
Due within one year | $ | 6,856 | $ | 6,876 | 1.49 | % | ||||
Due after one year through five years | 100,102 | 99,693 | 1.78 | % | ||||||
Due after five years through ten years | 45,828 | 44,419 | 1.92 | % | ||||||
Due after ten years | 131,486 | 129,216 | 1.91 | % | ||||||
Total available-for-sale investment securities | $ | 284,272 | $ | 280,204 | 1.88 | % | ||||
Loans Held for Sale
Loans in this category are originated by the Mortgage Company and comprised of residential mortgage loans extended to consumers and underwritten in accordance with standards set forth by an institutional investor to whom we expect to sell the loans. Loan proceeds are used for the purchase or refinance of the property securing the loan. Loans and servicing are sold concurrently. The LHFS are closed in the name of the Mortgage Company and carried on our books until the loan is delivered to and purchased by an investor, generally within fifteen to forty-five days. The Mortgage Company releases all servicing rights to the investors.
The Mortgage Company was acquired in July 2015. See Note 3 - Acquisition Activities for further details. As of December 31, 2016, loans held for sale totaled $32.1 million. The amount of loans held for sale outstanding at the end of any given month fluctuates with the volume of loans closed during the month and the timing of loans purchased by investors. During the year ended December 31, 2016, the mortgage subsidiary originated $772.1 million of total loan volume.
Loans Held for Investment
In its lending activities, the Company seeks to develop relationships with clients whose business and individual banking needs will grow with the Company. The Company has made significant efforts to be responsive to the lending needs in the markets served, while maintaining sound asset quality and credit practices. The Company extends credit to construction and development, residential real estate, commercial real estate, commercial and industrial and consumer borrowers in the normal course of business. The gross loans held for investment portfolio totaled $1.53 billion as of December 31, 2016, an increase of $226.4 million (17.3%) from the December 31, 2015, balance of $1.31 billion.
41
Table M7: Loans Held for Investment Portfolio | ||||||||||||||||||||||||||||||||||
As of December 31, | ||||||||||||||||||||||||||||||||||
2016 | 2015 | 2014 | 2013 | 2012 | ||||||||||||||||||||||||||||||
Amount | Percent | Amount | Percent | Amount | Percent | Amount | Percent | Amount | Percent | |||||||||||||||||||||||||
($ in thousands) | ||||||||||||||||||||||||||||||||||
Construction and development | $ | 288,193 | 18.8 | % | $ | 249,433 | 19.1 | % | $ | 156,241 | 14.7 | % | $ | 97,324 | 11.6 | % | $ | 91,586 | 12.2 | % | ||||||||||||||
Commercial real estate - owner occupied | 231,414 | 15.1 | % | 232,572 | 17.8 | % | 210,910 | 19.8 | % | 146,470 | 17.5 | % | 145,568 | 19.3 | % | |||||||||||||||||||
Commercial real estate - non-owner occupied | 557,846 | 36.4 | % | 424,538 | 32.5 | % | 439,141 | 41.2 | % | 375,290 | 44.8 | % | 262,791 | 34.9 | % | |||||||||||||||||||
Residential real estate | 287,250 | 18.6 | % | 241,395 | 18.5 | % | 122,306 | 11.5 | % | 95,428 | 11.4 | % | 126,394 | 16.8 | % | |||||||||||||||||||
Real estate loans | 1,364,703 | 88.9 | % | 1,147,938 | 87.9 | % | 928,598 | 87.2 | % | 714,512 | 85.3 | % | 626,339 | 83.2 | % | |||||||||||||||||||
Commercial and industrial | 165,172 | 10.8 | % | 153,860 | 11.8 | % | 127,084 | 11.9 | % | 120,833 | 14.4 | % | 124,670 | 16.5 | % | |||||||||||||||||||
Consumer | 4,668 | 0.3 | % | 6,285 | 0.5 | % | 9,376 | 0.9 | % | 2,775 | 0.3 | % | 2,346 | 0.3 | % | |||||||||||||||||||
Total loans held for investment | $ | 1,534,543 | 100.0 | % | $ | 1,308,083 | 100.2 | % | $ | 1,065,058 | 100.0 | % | $ | 838,120 | 100.0 | % | $ | 753,355 | 100.0 | % | ||||||||||||||
Substantially all loans are initially underwritten based on identifiable cash flows and supported by appropriate advance rates on collateral, which is independently valued. Commercial and industrial loans are generally secured by accounts receivable, equipment and business assets. Commercial real estate loans are secured by owner-occupied or non-owner occupied commercial properties of all types. Construction and development loans are supported by projects which generally require an appropriate level of pre-sales or pre-leasing. Generally, all commercial and industrial loans and commercial real estate loans have full recourse to the owners and/or sponsors. Residential real estate loans are secured by first or second liens on both owner-occupied and investor-owned residential properties.
Loans secured by various types of real estate, which include construction and development loans, commercial real estate loans, and residential real estate loans, constitute the largest portion of total loans. Of that portion, commercial real estate loans represent the largest dollar exposure. Substantially all of these loans are secured by properties in the greater Washington, D.C. metropolitan area with the heaviest concentration in Northern Virginia. Risk is managed through diversification by sub-market, property type, and loan size, and by seeking loans with multiple sources of repayment. The average outstanding loan balance in this portfolio is $0.7 million as of December 31, 2016.
Construction and development loans represented 18.8% and 19.1% of the total loan portfolio as of December 31, 2016 and December 31, 2015, respectively. New originations in this category are being underwritten in the context of current market conditions and are particularly focused in sub-markets which the Company believes to be relatively strong as compared to other markets in the region. Legacy loans, particularly in the land and speculative construction portion of this portfolio, have been largely converted to amortizing loans with regular principal and interest payments. The Company expects any future reductions in its land and speculative construction exposure to be partially offset by increases in residential construction activities as market conditions improve.
Secured residential real estate loans represented 18.7% and 18.5% of total loans as of December 31, 2016 and December 31, 2015, respectively. In general, loans in these categories represent loans underwritten to customers who had or established a deposit relationship with the respective bank at the time the loan was originated. Management believes that its underwriting criteria reflect current market conditions.
42
The contractual maturity ranges or repricing schedules, as appropriate, of the loans in the Bank’s loan portfolio and the amount of such loans with predetermined interest rates and floating rates in each maturity range as of December 31, 2016, are summarized in the following table:
Table M8: Loan Portfolio Maturity Schedule | |||||||||||||||
As of December 31, 2016 | |||||||||||||||
One Year or Less | One to Five Years | Over Five Years | Total | ||||||||||||
($ in thousands) | |||||||||||||||
Construction and development | $ | 181,696 | $ | 67,700 | $ | 38,797 | $ | 288,193 | |||||||
Commercial real estate - owner occupied | 22,751 | 43,279 | 165,384 | 231,414 | |||||||||||
Commercial real estate - non-owner occupied | 58,668 | 220,546 | 278,632 | 557,846 | |||||||||||
Residential real estate | 49,007 | 65,435 | 172,808 | 287,250 | |||||||||||
Commercial and industrial | 73,036 | 69,320 | 22,816 | 165,172 | |||||||||||
Consumer | 2,212 | 1,342 | 1,114 | 4,668 | |||||||||||
Total loans | $ | 387,370 | $ | 467,622 | $ | 679,551 | $ | 1,534,543 | |||||||
Loans with a predetermined interest rate | $ | 81,299 | $ | 294,800 | $ | 119,672 | $ | 495,771 | |||||||
Loans with a floating or adjustable interest rate | 306,071 | 172,822 | 559,879 | 1,038,772 | |||||||||||
Total loans | $ | 387,370 | $ | 467,622 | $ | 679,551 | $ | 1,534,543 | |||||||
Asset Quality
The Bank separates its loans into the following categories, based on credit quality: pass; pass watch; special mention; substandard; doubtful; and loss. The Bank reviews the characteristics of each rating at least annually, generally during the first quarter of each year. For a discussion of the characteristics of these ratings, see Note 6 - Loans Held for Investment.
As part of the Bank’s credit risk management practices, management regularly monitors the payment performance of its borrowers. A high percentage of all loans require some form of payment on a monthly basis, with a high percentage requiring regular amortization of principal. However, certain home equity lines of credit, commercial and industrial lines of credit, and construction loans generally require only monthly interest payments.
When payments are 90 days or more in arrears, or when it is no longer prudent to recognize current interest income on a loan, management classifies the loan as non-accrual. From time to time, a loan may be past due 90 days or more but is well secured and in the process of collection and thus warrants remaining on accrual status. Non-accrual loans decreased from $10.2 million as of December 31, 2015 to $5.7 million as of December 31, 2016. There were $2.0 thousand loans past due more than 90 days that were still accruing as of December 31, 2016, and $28.0 thousand in loans past due more than 90 days that were still accruing as of December 31, 2015.
Allowance for Loan Losses
The methodology used by the Company to determine the level of its allowance for loan losses is described in Item 7 - “Management’s Discussion and Analysis of Financial Condition and Results of Operations - Critical Accounting Policies and Estimates - Allowance for Loan Losses.”
The allowance for loan losses was $13.6 million as of 2016, or approximately 0.89% of outstanding loans held for investment, compared to $12.3 million or approximately 0.94% of outstanding loans held for investment as of December 31, 2015.
As of December 31, 2016, the Company has allocated $1.3 million for specific loans evaluated individually for impairment. For the year ended 2016, the Company recorded $3.9 million in provisions for loan losses, $2.8 million in charge-offs, and $169.0 thousand in recoveries, compared to $3.6 million in provision for loans losses, $0.7 million in charge-offs and $158.0 thousand in recoveries for the year ended December 31, 2015.
As part of its routine credit administration process, the Company periodically engages an outside consulting firm to review its loan portfolio and ALLL methodology. The information from these reviews is used to monitor individual loans as well as to evaluate the overall adequacy of the allowance for loan losses. In reviewing the adequacy of the allowance for loan losses at each period, management takes into consideration the historical loan losses experienced by the Company, current economic conditions affecting the borrowers’ ability to repay, the volume of loans, trends in delinquent, non-accruing, and potential problem loans, and the quality of
43
collateral securing loans. Loan losses are charged against the allowance when the Company believes that the collection of the principal is unlikely. Subsequent recoveries of losses previously charged against the allowance are credited to the allowance. After charging off all known losses incurred in the loan portfolio, management considers on a quarterly basis whether the allowance for loan losses remains adequate to cover its estimate of probable future losses, and establishes a provision for loan losses as appropriate. Because the allowance for loan losses is an estimate, the composition of the loan portfolio changes and allowance for loan losses review process continues to evolve, there may be changes to this estimate and elements used in the methodology that may have an effect on the overall level of allowance maintained.
The allowance for loan losses model is reviewed and evaluated each quarter by management to ensure its adequacy and applicability in relation to the Company’s past and future experience with the loan portfolio, from a credit quality perspective.
Table M9: Analysis of the Allowance for Loan Losses | |||||||||||||||||||
For the Year Ended December 31, | |||||||||||||||||||
2016 | 2015 | 2014 | 2013 | 2012 | |||||||||||||||
($ in thousands) | |||||||||||||||||||
Balance at beginning of period | $ | 12,289 | $ | 9,257 | $ | 8,534 | $ | 6,260 | $ | 4,932 | |||||||||
Provision for loan losses | 3,880 | 3,550 | 3,005 | 4,755 | 3,225 | ||||||||||||||
Charge-offs: | |||||||||||||||||||
Construction and development | (31 | ) | — | (100 | ) | — | (508 | ) | |||||||||||
Commercial real estate - owner occupied | (299 | ) | (128 | ) | (476 | ) | (107 | ) | — | ||||||||||
Commercial real estate - non-owner occupied | (636 | ) | (10 | ) | (462 | ) | (2 | ) | (694 | ) | |||||||||
Residential real estate | (65 | ) | (143 | ) | (715 | ) | (817 | ) | (232 | ) | |||||||||
Commercial and industrial | (1,554 | ) | (224 | ) | (618 | ) | (2,077 | ) | (647 | ) | |||||||||
Consumer loans | (171 | ) | (171 | ) | (232 | ) | (1 | ) | (5 | ) | |||||||||
Total charge-offs | (2,756 | ) | (676 | ) | (2,603 | ) | (3,004 | ) | (2,086 | ) | |||||||||
Recoveries: | |||||||||||||||||||
Construction and development | 2 | — | — | 74 | 19 | ||||||||||||||
Commercial real estate - owner occupied | 20 | 1 | 1 | — | — | ||||||||||||||
Commercial real estate - non-owner occupied | — | — | 101 | 234 | 138 | ||||||||||||||
Residential real estate | 60 | 117 | 197 | 42 | 32 | ||||||||||||||
Commercial and industrial | 83 | 35 | 18 | 164 | — | ||||||||||||||
Consumer | 4 | 5 | 4 | 9 | — | ||||||||||||||
Total recoveries | 169 | 158 | 321 | 523 | 189 | ||||||||||||||
Net recoveries/(charge-offs) | (2,587 | ) | (518 | ) | (2,282 | ) | (2,481 | ) | (1,897 | ) | |||||||||
Balance at end of period | $ | 13,582 | $ | 12,289 | $ | 9,257 | $ | 8,534 | $ | 6,260 | |||||||||
Allowance for loan losses to total loans held for investment | 0.89 | % | 0.94 | % | 0.87 | % | 1.02 | % | 0.83 | % | |||||||||
Adjusted allowance for loan losses to total loans held for investment (1) | 1.11 | % | 1.30 | % | 1.46 | % | 1.67 | % | 2.09 | % | |||||||||
Allowance for loan losses to non-accrual loans | 236.37 | % | 120.47 | % | 106.48 | % | 56.57 | % | 40.09 | % | |||||||||
Allowance for loan losses to non-performing assets | 159.10 | % | 84.76 | % | 82.61 | % | 38.33 | % | 28.39 | % | |||||||||
Non-performing assets to total assets | 0.43 | % | 0.86 | % | 0.84 | % | 1.97 | % | 1.92 | % | |||||||||
Net charge-offs to average loans held for investment | 0.18 | % | 0.04 | % | 0.24 | % | 0.32 | % | 0.43 | % | |||||||||
(1) This is a non-GAAP financial measure. Refer to the table below outlining the reconciliation of GAAP Allowance Ratio to Adjusted Allowance Ratio. | |||||||||||||||||||
Of the Bank’s $1.5 billion in gross loans outstanding as of December 31, 2016, approximately $55.5 million or 3.6% were recorded on the books at fair value in connection with the acquisition of Alliance and the Millennium Transaction and have an aggregate discount on the books of $3.9 million as of December 31, 2016. This discount is a net amount consisting of credit-related mark-downs of $3.5 million, yield-related mark-downs of $1.0 million and yield-related mark-ups of $0.6 million.
The adjustment required to reconcile allowance for loan losses with the Company’s adjusted allowance for loan losses and adjusted allowance for loan losses to total loans ratios is the addition of the credit purchase accounting marks on purchased loans in the portfolio. In acquisition accounting, there is no carryover of previously established allowance for loan losses, as acquired loans are recorded at fair value. Loans that were acquired under the purchase accounting method are carried at book value with certain
44
accounting marks set up on them at the time of purchase in order to adjust the acquired loans to fair value. These accounting marks can be pricing marks or credit marks. Pricing marks account for the difference in current interest rates and the interest rate on the loan being acquired, and may be either positive or negative. Credit marks may only be negative and are similar to an allowance for loans losses based on credit quality. Therefore, in determining the adjusted allowance for loan losses and related ratio, the credit mark component is added to the allowance for loan losses and to the total loans held for investment. Below is a reconciliation of the allowance for loan losses and related ratios to the adjusted allowance for loan losses and related ratios as of December 31, 2016, and December 31, 2015:
Table M10: Reconciliation of GAAP Allowance Ratio to Adjusted Allowance Ratio (1) | |||||||||||||||||||
For the Year Ended December 31, | |||||||||||||||||||
2016 | 2015 | 2014 | 2013 | 2012 | |||||||||||||||
($ in thousands) | |||||||||||||||||||
GAAP allowance for loan losses | $ | 13,582 | $ | 12,289 | $ | 9,257 | $ | 8,534 | $ | 6,260 | |||||||||
GAAP loans held for investment, at amortized cost | 1,534,543 | 1,308,083 | 1,065,058 | 838,120 | 753,355 | ||||||||||||||
GAAP allowance for loan losses to total loans held for investment | 0.89 | % | 0.94 | % | 0.87 | % | 1.02 | % | 0.83 | % | |||||||||
GAAP allowance for loan losses | $ | 13,582 | $ | 12,289 | $ | 9,257 | $ | 8,534 | $ | 6,260 | |||||||||
Plus: Credit purchase accounting marks | 3,537 | 4,721 | 6,336 | 6,716 | 9,700 | ||||||||||||||
Adjusted allowance for loan losses | $ | 17,119 | $ | 17,010 | $ | 15,593 | $ | 15,250 | $ | 15,960 | |||||||||
GAAP loans held for investment, at amortized cost | $ | 1,534,543 | $ | 1,308,083 | $ | 1,065,058 | $ | 838,120 | $ | 753,355 | |||||||||
Plus: Credit purchase accounting marks | 3,537 | 4,721 | 6,336 | 6,716 | 9,700 | ||||||||||||||
Adjusted loans held for investment, at amortized cost | $ | 1,538,080 | $ | 1,312,804 | $ | 1,071,394 | $ | 844,836 | $ | 763,055 | |||||||||
Adjusted allowance for loan losses to total loans held for investment | 1.11 | % | 1.30 | % | 1.46 | % | 1.81 | % | 2.09 | % | |||||||||
(1) This is a non-GAAP financial measure. Credit purchase accounting marks are GAAP marks under purchase accounting guidance. | |||||||||||||||||||
Non-performing Assets
As of December 31, 2016, the Company had $8.5 million of non-performing assets compared to $14.5 million as of December 31, 2015, a decrease of $6.0 million. The ratio of non-performing assets to total assets decreased 43 basis points to 0.43% as of December 31, 2016, from 0.86% as of December 31, 2015.
Table M11: Non-Performing Assets | |||||||||||||||||||
As of December 31, | |||||||||||||||||||
2016 | 2015 | 2014 | 2013 | 2012 | |||||||||||||||
($ in thousands) | |||||||||||||||||||
Non-accrual loans | $ | 5,746 | $ | 10,201 | $ | 8,694 | $ | 15,087 | $ | 15,615 | |||||||||
90+ days still accruing | 2 | 28 | — | — | — | ||||||||||||||
Troubled debt restructurings still accruing | 1,361 | 4,269 | 2,151 | 5,715 | 3,036 | ||||||||||||||
Asset-backed security | — | — | — | — | 106 | ||||||||||||||
Other real estate owned | 1,428 | — | 361 | 1,463 | 3,294 | ||||||||||||||
Total non-performing assets | $ | 8,537 | $ | 14,498 | $ | 11,206 | $ | 22,265 | $ | 22,051 | |||||||||
Non-performing assets to total assets | 0.43 | % | 0.86 | % | 0.84 | % | 1.97 | % | 1.92 | % | |||||||||
Non-accrual loans were $5.7 million as of December 31, 2016, compared to $10.2 million as of December 31, 2015. The $5.7 million non-accrual loan balance consists primarily of loans secured by commercial real estate. The change in non-accrual loans is primarily attributable to the foreclosure on three borrowers, with the properties moving into OREO during the year ended December 31, 2016. Specific reserves for impaired loans were $1.3 million and $2.5 million, respectively, as of December 31, 2016 and December 31, 2015.
45
As of December 31, 2016, OREO was $1.4 million compared to none as of December 31, 2015, respectively. During the year ended December 31, 2016, the Bank acquired seven OREO properties with a fair value of $2.3 million through foreclosure and sold two properties totaling $678.9 thousand.
Table M12: Changes in Other Real Estate Owned | |||||||||||
For the Year Ended December 31, | |||||||||||
2016 | 2015 | 2014 | |||||||||
($ in thousands) | |||||||||||
Balance at beginning of period | $ | — | $ | 361 | $ | 1,463 | |||||
Properties acquired at foreclosure | 2,255 | 90 | 360 | ||||||||
Sales of foreclosed properties | (668 | ) | (451 | ) | (1,130 | ) | |||||
Write downs | (159 | ) | — | (332 | ) | ||||||
Balance at end of period | $ | 1,428 | $ | — | $ | 361 | |||||
Restricted Stock
The Bank’s securities portfolio contains restricted stock investments that are required to be held as part of its banking operations. As a member of the FHLB, the Bank is required to purchase and maintain stock in the FHLB in an amount equal to 4.25% of aggregate outstanding advances in addition to the membership stock requirement of 0.09% of total assets as of December 31, 2016 (subject to a cap of $15.0 million). Unlike other types of stock, FHLB stock and the stock of correspondent banks is acquired primarily for the right to receive advances and loan participations rather than for the purpose of maximizing dividends or stock growth. No readily available market exists for the FHLB and correspondent bank stock, and they have no quoted market value. Restricted stock, such as FHLB and correspondent bank stock, is carried at cost. FHLB stock pays a quarterly dividend. For the year ended December 31, 2016, FHLB stock dividend yield was 4.79% as compared to 4.44% for the prior year.
Table M13: Composition of Restricted Stocks | |||||||||||
As of December 31, | |||||||||||
2016 | 2015 | 2014 | |||||||||
($ in thousands) | |||||||||||
FHLB stock | $ | 11,370 | $ | 5,772 | $ | 4,869 | |||||
ACBB | 100 | 100 | 100 | ||||||||
CBB | 256 | 256 | 256 | ||||||||
Total other equity securities | $ | 11,726 | $ | 6,128 | $ | 5,225 | |||||
Deposits
The Bank seeks deposits within its market area by offering high-quality customer service, using technology to deliver deposit services effectively and paying competitive interest rates.
As of December 31, 2016, the deposit portfolio totaled $1.5 billion, comprised of $381.9 million of non-interest bearing deposits and $1.1 billion of interest bearing deposits. Total deposits increased $189.5 million (14.2%) from $1.3 billion as of December 31, 2015 to $1.5 billion as of December 31, 2016. As of December 31, 2015, the deposit portfolio totaled $1.3 billion, which was composed of $304.4 million of non-interest bearing deposits and $1.0 billion of interest bearing deposits.
The average balance of interest bearing deposits was $1.1 billion for the year ended December 31, 2016, compared to $884.4 million and $787.1 million for 2015 and 2014, respectively. The increase in the average interest-bearing deposits in 2016 and 2015 is the result of organic growth. The related interest expense from interest-bearing deposits was $8.7 million for the year ended December 31, 2016, compared to $6.4 million and $5.4 million for 2015 and 2014, respectively. The average rate on these deposits was 0.81%, 0.73%, and 0.69% for 2016, 2015 and 2014 respectively. The increase in interest expense is primarily attributable to an increase in the average balance of interest bearing liabilities as well as changes in the mix of deposit funding.
Average non-interest bearing deposits were $362.2 million for the year ended December 31, 2016, compared to $310.2 million and $272.5 million for 2015 and 2014, respectively. The increase in the average non-interest-bearing deposits in 2016 and 2015 is the result of organic growth.
46
A significant component of the Bank’s deposit portfolio is related to title companies, predominantly held in non-interest bearing transaction accounts. Balances with these relationships tends to fluctuate on a seasonal cycle with lows in the 1st and 4th quarters, and highs in the 2nd and 3rd quarters. For the year ended December 31, 2016, average title company balances were $168.1 million compared to $131.6 million for the prior year.
Table M14: Certificates of Deposit by Maturity | |||||||||||||||
As of December 31, 2016 | |||||||||||||||
Under $100,000 | $100,000 through $250,000 | Over $250,000 | Total | ||||||||||||
($ in thousands) | |||||||||||||||
Three months or less | $ | 9,964 | $ | 73,655 | $ | 18,996 | $ | 102,615 | |||||||
Three through six months | 14,234 | 45,200 | 34,114 | 93,548 | |||||||||||
Six through twelve months | 19,449 | 79,979 | 55,261 | 154,689 | |||||||||||
Over twelve months | 33,632 | 109,982 | 30,695 | 174,309 | |||||||||||
Total certificates of deposit | $ | 77,279 | $ | 308,816 | $ | 139,066 | $ | 525,161 | |||||||
Other Borrowings
Other borrowings consist of customer repurchase agreements and overnight borrowings from correspondent banks. As of December 31, 2016 and 2015, the Company had no outstanding overnight borrowings from correspondent banks. Customer repurchase agreements are standard commercial bank transactions and involve a Bank customer rather than a wholesale bank or broker. This product is an accommodation to commercial customers and individuals that require safety for their funds beyond the FDIC deposit insurance limits. Management believes this product offers it a stable source of financing at a reasonable market rate of interest and is continuing the program. As of December 31, 2016, the Company had $5.9 million of customer repurchase agreements with an average rate of 0.05%, compared to $6.9 million at 0.05% as of December 31, 2015. As of December 31, 2016, the Company was in compliance with all debt agreements and/or debt covenants.
FHLB Advances
The FHLB is a significant source of funding for the Bank, which augments its funding portfolio with FHLB advances for both liquidity and interest rate management. The purchase accounting mark noted in the table below is associated with an advance acquired in the 2012 Alliance acquisition and is being amortized over the life of the advance. Advances are secured by a lien on certain loans and securities of the Bank that are pledged from time to time.
Table M15: Composition of FHLB Advances | |||||||||||
As of December 31, | |||||||||||
2016 | 2015 | 2014 | |||||||||
($ in thousands) | |||||||||||
FHLB advances | $ | 232,097 | $ | 107,579 | $ | 83,054 | |||||
FHLB purchase accounting mark | — | 2,508 | 2,993 | ||||||||
FHLB total | $ | 232,097 | $ | 110,087 | $ | 86,047 | |||||
Weighted average outstanding effective interest rate | 1.12 | % | 1.62 | % | 1.58 | % | |||||
In late June 2016, the Bank prepaid a long-term FHLB advance that was assumed during the Alliance acquisition which was completed in December of 2012. This $25.0 million advance had a coupon rate of 3.99% but an effective cost of 2.04% after considering the purchase accounting mark on the instrument. The instrument had a final maturity of February 26, 2021. The effective cost (prepayment penalty less release of the purchase accounting mark) to terminate the debt instrument was $1.04 million.
In August 2016, the Bank prepaid a long-term FHLB advance that was entered into during late 2015. This $10.0 million advance had a coupon rate of 1.67% and a final maturity of August 15, 2019 . The cost to terminate the debt instrument was $155.0 thousand.
47
Table M16: FHLB Advances Average Balances | |||||||||||
For the Year Ended December 31, | |||||||||||
2016 | 2015 | 2014 | |||||||||
($ in thousands) | |||||||||||
Average FHLB advances during the period | $ | 106,882 | $ | 109,967 | $ | 63,108 | |||||
Average effective interest rate paid during the period | 1.48 | % | 1.48 | % | 1.67 | % | |||||
Maximum month-end balance outstanding | $ | 232,097 | $ | 127,696 | $ | 101,169 | |||||
As of December 31, 2016, the Company was in compliance with all debt agreements and/or debt covenants.
Long-term Borrowings
Table M17: Long-term Borrowings Detail | |||||||||||
As of December 31, | |||||||||||
2016 | 2015 | 2014 | |||||||||
($ in thousands) | |||||||||||
Subordinated debt | $ | 25,000 | $ | 25,000 | 2,281 | ||||||
Less: debt issuance costs | (385 | ) | — | — | |||||||
Trust preferred capital notes | 10,310 | 10,310 | 7,746 | ||||||||
Trust preferred capital notes purchase accounting mark | (2,287 | ) | (2,426 | ) | — | ||||||
Long-term borrowings | $ | 32,638 | $ | 32,884 | $ | 10,027 | |||||
On October 5, 2015, the Company issued $25.0 million in subordinated debt (the “Company Subordinated Debt”). The Company Subordinated Debt has a maturity of ten (10) years with a five year no-call provision, maturing in full on October 15, 2025, and carries a 6.00% fixed rate coupon, payable quarterly, subject to reset after five years at 3-month LIBOR plus 467 basis points. As of December 31, 2016, the entire amount of Company Subordinated Debt is considered Tier 2 Capital. As of December 31, 2015, and December 31, 2014, there was $483.0 thousand and $0 of debt issuance costs carried in other assets, respectively.
On June 30, 2003, Alliance invested $310.0 thousand as common equity into a wholly-owned Delaware statutory business trust (the “Trust”). Simultaneously, the Trust privately issued $10.0 million face amount of thirty-year floating rate trust preferred capital securities (the “Trust Preferred Capital Notes”) in a pooled trust preferred capital securities offering. The Trust used the offering proceeds, plus the equity, to purchase $10.3 million principal amount of Alliances’ floating rate junior subordinated debentures due 2033 (the “Subordinated Debentures”). The Trust Preferred Capital Notes are callable at any time without penalty. The interest rate associated with the Trust Preferred Capital Notes is three month LIBOR plus 3.15% subject to quarterly interest rate adjustments. The interest rate as of December 31, 2016, and December 31, 2015, was 4.11% and 3.66%, respectively. The Trust Preferred Capital Notes are guaranteed by the Company on a subordinated basis, and were recorded on the Company’s books at the time of the Alliance acquisition at a discounted amount of $7.5 million, which was the fair value of the instruments at the time of the acquisition. The $2.5 million discount is being expensed monthly over the life of the obligation.
Under the indenture governing the Trust Preferred Capital Notes, the Company has the right to defer payments of interest for up to twenty consecutive quarterly periods. The interest deferred under the indenture compounds quarterly at the interest rate then in effect. the Company is not currently deferring the interest payments.
Under current regulatory guidelines, the Trust Preferred Capital Notes may constitute no more than 25% of total Tier 1 Capital. Any amount not eligible to be counted as Tier 1 Capital is considered to be Tier 2 Capital. As of December 31, 2016, and December 31, 2015, the entire amount of Trust Preferred Capital Notes was considered Tier 1 Capital. As of December 31, 2016, the Company was in compliance with all debt agreements and/or debt covenants.
48
Capital Resources
Capital management consists of providing equity to support the Company’s current and future operations. The Company is subject to capital adequacy requirements imposed by the FRB and the Bank is subject to capital adequacy requirements imposed by the FDIC. Both the FRB and the FDIC have adopted risk-based capital requirements for assessing bank holding company and bank capital adequacy.
As of December 31, 2016 and December 31, 2015, the Bank had $107.2 million and $100.1 million, respectively, of capital in excess of the amount needed to meet the regulatory minimum Tier 1 leverage ratio required to be considered “well capitalized.”
The Company elected to participate in the SBLF program, and on August 4, 2011, the Company issued and sold to the U.S. Treasury 17,796 shares of Series D Preferred Stock for an aggregate purchase price of $17.8 million in cash. In 2015, the Bank redeemed its remaining balance of $13.3 million.
Total shareholders’ equity increased $14.1 million (7.9%) from $178.6 million as of December 31, 2015, to $192.7 million as of December 31, 2016. The increase in total shareholders’ equity during that period is attributable to net income of $18.0 million, stock option exercises of $837.0 thousand, less year to date cash dividends declared of $3.1 million, and a $2.5 million increase in accumulated other comprehensive loss as a result of the change in fair value of it available-for-sale investment portfolio.
Table M18: Capital Categories and Ratio Components | |||||||||||
December 31, 2016 | December 31, 2015 | December 31, 2014 | |||||||||
($ in thousands) | |||||||||||
Tier 1 Capital: | |||||||||||
Common stock | $ | 128 | $ | 121 | $ | 95 | |||||
Capital surplus | 177,924 | 160,861 | 112,887 | ||||||||
Accumulated earnings | 17,187 | 17,740 | 7,775 | ||||||||
Less: disallowed assets | (13,218 | ) | (13,933 | ) | (6,894 | ) | |||||
Total Common Equity Tier 1 Capital | 182,021 | 164,789 | 113,863 | ||||||||
Add: Preferred Stock | 13,347 | ||||||||||
Add: Trust preferred | 8,023 | 7,884 | 7,746 | ||||||||
Less: Additional tier 1 capital deductions | 552 | — | — | ||||||||
Total Tier 1 Capital | 189,492 | 172,673 | 134,956 | ||||||||
Tier 2 Capital: | |||||||||||
Qualifying allowance for loan losses | 13,891 | 12,289 | 9,257 | ||||||||
Qualifying subordinated debt | 25,000 | 25,000 | 2,500 | ||||||||
Total Tier 2 Capital | 38,891 | 37,289 | 11,757 | ||||||||
Total risk-based capital | $ | 228,383 | $ | 209,962 | $ | 146,713 | |||||
Risk weighted assets | $ | 1,632,651 | $ | 1,412,771 | $ | 1,111,426 | |||||
Qualifying quarterly average assets | $ | 1,867,961 | $ | 1,618,250 | $ | 1,319,030 | |||||
Table M19: Capital Ratios and Regulatory Requirements Summary | |||||||||||||||
December 31, 2016 | December 31, 2015 | December 31, 2014 | To Be Well Capitalized Under Prompt Corrective Action Provisions | For Minimum Capital Adequacy Requirements | |||||||||||
Capital Ratios: | |||||||||||||||
Total risk-based capital ratio | 13.99 | % | 14.86 | % | 13.20 | % | 10.00 | % | 8.00 | % | |||||
Tier 1 risk-based capital ratio | 11.61 | % | 12.22 | % | 12.14 | % | 8.00 | % | 6.00 | % | |||||
CET 1 risk-based capital ratio | 11.15 | % | 11.66 | % | n/a | 6.50 | % | 4.50 | % | ||||||
Tier 1 leverage ratio | 10.14 | % | 10.67 | % | 10.23 | % | 5.00 | % | 4.00 | % | |||||
49
Both the Company and the Bank are considered “well capitalized” under the risk-based capital guidelines currently in effect for the federal banking regulatory agencies, and maintaining a “well capitalized” regulatory position is important for each organization. Both the Company and the Bank monitor their respective capital positions to ensure appropriate capital for the respective risk profile of each organization, as well as sufficient levels to promote depositor and investor confidence in the respective organizations.
Table M20: Reconciliation of Tangible Common Equity to Tangible Assets Ratio (1) | |||||||||||
December 31, 2016 | December 31, 2015 | December 31, 2014 | |||||||||
($ in thousands) | |||||||||||
Tangible Common Equity: | |||||||||||
Common Stock Voting | $ | 109 | $ | 103 | $ | 77 | |||||
Common Stock Non-Voting | 19 | 18 | 18 | ||||||||
Additional paid-in capital - common | 177,924 | 160,861 | 112,887 | ||||||||
Accumulated earnings | 17,187 | 17,740 | 7,775 | ||||||||
Accumulated other comprehensive income/(loss) | (2,579 | ) | (127 | ) | 434 | ||||||
Total Common Equity | 192,660 | 178,595 | 121,191 | ||||||||
Less Intangibles: | |||||||||||
Goodwill | 11,420 | 11,431 | 6,240 | ||||||||
Identifiable intangibles | 1,619 | 1,888 | 654 | ||||||||
Total Intangibles | 13,039 | 13,319 | 6,894 | ||||||||
Tangible Common Equity | 179,621 | 165,276 | 114,297 | ||||||||
Tangible Assets: | |||||||||||
Total Assets | 2,002,911 | 1,674,466 | 1,333,390 | ||||||||
Less Intangibles: | |||||||||||
Goodwill | 11,420 | 11,431 | 6,240 | ||||||||
Identifiable intangibles | 1,619 | 1,888 | 654 | ||||||||
Total Intangibles | 13,039 | 13,319 | 6,894 | ||||||||
Tangible Assets | $ | 1,989,872 | $ | 1,661,147 | $ | 1,326,496 | |||||
Tangible Common Equity to Tangible Assets | 9.03 | % | 9.95 | % | 8.62 | % | |||||
(1) Tangible common equity to tangible assets ratio is a non-GAAP financial measure that is presented to facilitate an understanding of the Company's capital structure. This table provides a reconciliation between certain GAAP amounts and this non-GAAP financial measure. | |||||||||||
Liquidity
Liquidity is the ability to meet the demand for funds from depositors and borrowers as well as expenses incurred in the operation of the business. The Company has a formal liquidity management policy and a contingency funding policy used to assist management in executing its liquidity strategies. Similar to other banking organizations, management monitors the need for funds to support depositor activities and funding of loans on a daily basis. Liquid assets include cash, interest-bearing balances, Federal funds sold, securities available for sale, loans held for sale and loans maturing within one year. Additional liquidity sources available to the Company include its capacity to borrow funds through correspondent bank lines of credit, a line of credit with the FHLB, the purchase of wholesale and brokered deposits and a corporate line of credit at a correspondent bank. Management considers the Company’s overall liquidity to be sufficient to satisfy its depositors requirements and to meet its customers’ credit needs.
Cash and cash equivalents and investment securities available for sale comprised 18.9% of total assets as of December 31, 2016, compared to 16.9% as of December 31, 2015. Additional sources of liquidity available to the Company include its capacity to borrow additional funds when necessary. The Bank maintains $127.0 million in unsecured lines of credit with a variety of correspondent banks. As of December 31, 2016, there were no outstanding balances on these lines of credit. The Bank also maintains a secured line
50
of credit with the FHLB up to 25% of total assets or $500.7 million as of December 31, 2016 based on available collateral. As of December 31, 2016, the Bank’s borrowing capacity was $478.0 million of which $232.1 million was outstanding. The Company maintains a $5.0 million unsecured line of credit with a correspondent bank.
Community banks may also acquire funding from brokers through a nationally recognized network of financial institutions. The Bank may utilize such funding when rates are more favorable than other comparable sources of funding. As of December 31, 2016, the Bank had no brokered funds.
As of December 31, 2016, loans held for investment, loans held for sale, and investments that mature within one year totaled $426.4 million or 21.3% of total assets.
Concentrations
Substantially all of the Company’s loans, commitments and standby letters of credit have been granted to customers located in the greater Washington, D.C. metropolitan area. The Company’s overall business includes a significant focus on commercial and residential real estate activities. As of December 31, 2016, commercial real estate loans were 51.4% of the total loan portfolio, construction and development loans were 18.8% of the total loan portfolio and residential real estate loans were 18.7% of the total loan portfolio.
The banking regulators have issued guidance for those institutions which are deemed to have concentrations in commercial real estate lending. Pursuant to the supervisory guidance for identifying institutions with a potential commercial real estate concentration risk, institutions which have (1) total reported loans for construction, land development, and other land acquisitions which represent 100% or more of an institution’s total risk-based capital; or (2) total commercial real estate loans representing 300% or more of the institution’s total risk-based capital and the institution’s commercial real estate loan portfolio has increased 50% or more during the prior 36 months are identified as having potential commercial real estate concentration risk. Institutions which are deemed to have concentrations in commercial real estate lending are expected to employ heightened levels of risk management with respect to their commercial real estate portfolios, and may be required to hold higher levels of capital. As of December 31, 2016, the Bank’s total reported loans for construction, land development, and other land acquisitions represented 134.3% of total bank risk based capital, and its total commercial real estate loans, loans for construction, land development, and other land acquisitions represented 502.3% of total bank risk based capital.
For more information regarding risks, see Part II, Item 1A. Risk Factors - “Risks Associated With WashingtonFirst’s Business”, “WashingtonFirst’s profitability depends significantly on local economic conditions” and Part II, Item 1A. Risk Factors - “Risks Associated With WashingtonFirst’s Business”, “WashingtonFirst’s loan portfolios have significant real estate concentration” both located in the Company’s Form 10-K filed with the Securities and Exchange Commission on March 15, 2016.
Off-Balance Sheet Arrangements
The Company enters into certain off-balance sheet arrangements in the normal course of business to meet the financing needs of customers. These arrangements include commitments to extend credit, standby letters of credit and financial guarantees which would impact the overall liquidity and capital resources to the extent customers accept and/or use these commitments. These instruments involve, to varying degrees, elements of credit and interest rate risk in excess of the amount recognized in the balance sheet. With the exception of these arrangements, the Company has no off-balance sheet arrangements that have or are reasonably likely to have a material current or future effect on its financial condition, changes in financial condition, revenues or expenses, results of operations, liquidity, capital expenditures or capital resources.
51
Item 7A. Quantitative and Qualitative Disclosures About Market Risk
Market risk is defined as the sensitivity of net income, fair market values and capital to changes in interest rates, foreign currency exchange rates, commodity prices and other relevant market prices and rates. The Company’s primary market risk exposure is interest rate risk inherent in our lending, deposit taking and borrowing activities, since net interest income is the largest component on net income. The board of directors has delegated interest rate risk management to the ALCO. ALCO is governed by policy approved annually by our board of directors. The overall interest rate risk position and strategies are reviewed by executive management, ALCO and the Company’s board of directors on an ongoing basis. ALCO formulates and monitors management of interest rate risk through policies and guidelines it establishes and through review of detailed reports discussed at least quarterly. In establishing guidelines, ALCO considers impact on earnings, capital, level and direction of interest rates, liquidity, local economic conditions, external threats and other factors as part of its process to identify and manage maturity and re-pricing mismatches inherent in its cash flows to provide net interest growth consistent with the Company’s earnings objectives.
The Company uses an earnings simulation model on a quarterly basis to monitor its interest rate sensitivity and risk, and to model balance sheet and income statement effects in alternative interest rate scenarios. In modeling interest rate risk, the Company measures NII sensitivity and EVE. The resulting percentage change in NII over various rate scenarios is an indication of short-term interest rate risk. The resulting change in EVE over various rate scenarios is an indication of long-term interest rate risk.
The earnings simulation model utilizes a static current balance sheet and related attributes, and adjusts for assumptions such as interest rates, loan and investment prepayment speeds, deposit early withdrawal assumptions, the sensitivity of non-maturity deposit rates, non-interest income and expense and other factors deemed significant by ALCO. Maturing and repayment dollars are assumed to roll back into like instruments for new terms at current market rates. Pricing floors on discretionary priced liability products are used which limit how low various deposit products could go under declining interest rate scenarios, reflective of our pricing philosophy in response to changing interest rates. Additional assumptions are applied to modify volumes and pricing under various rate scenarios. This information is then shock tested which assumes a simultaneous change in interest rates ranging from +400 basis points to -200 basis points. Results are then analyzed for the impact on NII, net income and EVE over the next 12 months and 24 months. In addition to simultaneous changes in interest rates, alternative interest rate changes such as changes based on interest rate ramps are also performed.
As part of its interest rate risk management, the Company typically uses its investment portfolio and wholesale funding instruments to balance its interest rate exposure.
The board of directors has established interest rate risk limits in its ALCO policy for static gap analysis and both NII and EVE. The Company engages an outside consulting firm to assist in modeling its short-term and long-term interest rate risk profile. On a periodic basis, management reports to ALCO and the board of directors on the Company’s interest rate risk profile and expectations of changes in the profiles based on certain interest rate shocks. The Company believes its strategies are prudent and is within its policy guidelines as of December 31, 2016.
The interest rate risk model results for December 31, 2016, and December 31, 2015, are shown in the table below based on an immediate shift in market interest rates and a static balance sheet. The percentage change indicates what the Company would expect NII and EVE to change over the next twelve months under various interest rate shock scenarios:
Percentage Change in NII and EVE from Base Case | ||||||||||||
Interest | December 31, 2016 | December 31, 2015 | ||||||||||
Rate Shocks | NII | EVE | NII | EVE | ||||||||
+400 bp | 2.5 | % | (5.0 | )% | 2.8 | % | 0.2 | % | ||||
+300 bp | 5.4 | % | 0.0 | % | 5.8 | % | 2.7 | % | ||||
+200 bp | 5.9 | % | 3.0 | % | 5.3 | % | 4.4 | % | ||||
+100 bp | 3.4 | % | 2.7 | % | 3.1 | % | 3.6 | % | ||||
-100 bp | 3.7 | % | (0.1 | )% | 3.7 | % | (1.9 | )% | ||||
-200 bp | 3.5 | % | (4.5 | )% | 3.2 | % | (7.0 | )% | ||||
This analysis suggests that if interest rates were to increase, the Company is positioned for an improvement in net interest income over the next 12 months.
On a periodic basis, the Company back-tests actual changes in its net interest income against expected changes as well as actual market interest rate movements and other factors impacting actual versus projected results.
52
Certain shortcomings are inherent in this method of analysis. Since the Company’s actual balance sheet movement is not static (maturing and repayment dollars are presumed to be rolled back into like instruments for new terms at current market rates), these simulated changes in net interest income are indicative only of the magnitude of interest rate risk in the balance sheet. These changes do not take into account actions we may take in response to changes in interest rates, and are not necessarily reflective of the income the Company would actually receive. There is no guarantee that the risk management techniques and balance sheet management strategies the Company employs will be effective in periods of rapid rate movements or extremely volatile periods. In addition to changes in interest rates, the level of future net interest income is also dependent on a number of other variables including growth and composition of earning assets and interest bearing liabilities, economic and competitive conditions, changes in lending, investing and deposit gathering strategies and client preferences.
53
Item 8. Consolidated Financial Statements

Report of Independent Registered Public Accounting Firm
Board of Directors and Shareholders
WashingtonFirst Bankshares, Inc.
Reston, Virginia
We have audited the accompanying consolidated balance sheets of WashingtonFirst Bankshares, Inc. as of December 31, 2016, and 2015 and the related consolidated statements of income and comprehensive income, shareholders’ equity, and cash flows for each of the three years in the period ended December 31, 2016. These consolidated financial statements are the responsibility of the Company’s management. Our responsibility is to express an opinion on these financial statements based on our audits.
We conducted our audits in accordance with the standards of the Public Company Accounting Oversight Board (United States). Those standards require that we plan and perform the audit to obtain reasonable assurance about whether the financial statements are free of material misstatement. An audit includes examining, on a test basis, evidence supporting the amounts and disclosures in the financial statements, assessing the accounting principles used and significant estimates made by management, as well as evaluating the overall presentation of the financial statements. We believe that our audits provide a reasonable basis for our opinion.
In our opinion, the consolidated financial statements referred to above present fairly, in all material respects, the financial position of WashingtonFirst Bankshares, Inc. at December 31, 2016, and 2015, and the results of their operations and their cash flows for each of the three years in the period ended December 31, 2016, in conformity with accounting principles generally accepted in the United States of America.

Philadelphia, Pennsylvania
March 14, 2017
BDO USA, LLP, a Delaware limited liability partnership, is the U.S. member of BDO International Limited, a UK company limited by guarantee, and forms part of the international BDO network of independent member firms.
BDO is the brand name for the BDO network and for each of the BDO Member Firms.
54
WashingtonFirst Bankshares, Inc.
Consolidated Balance Sheets
December 31, 2016 | December 31, 2015 | ||||||
($ in thousands) | |||||||
Assets: | |||||||
Cash and cash equivalents: | |||||||
Cash and due from bank balances | $ | 3,614 | $ | 3,739 | |||
Federal funds sold | 93,659 | 59,014 | |||||
Interest bearing deposits | 100 | — | |||||
Cash and cash equivalents | 97,373 | 62,753 | |||||
Investment securities, available-for-sale, at fair value | 280,204 | 220,113 | |||||
Restricted stock, at cost | 11,726 | 6,128 | |||||
Loans held for sale, at lower of cost or fair value | 32,109 | 36,494 | |||||
Loans held for investment: | |||||||
Loans held for investment, at amortized cost | 1,534,543 | 1,308,083 | |||||
Allowance for loan losses | (13,582 | ) | (12,289 | ) | |||
Total loans held for investment, net of allowance | 1,520,961 | 1,295,794 | |||||
Premises and equipment, net | 6,955 | 7,374 | |||||
Goodwill | 11,420 | 11,431 | |||||
Identifiable intangibles | 1,619 | 1,888 | |||||
Deferred tax asset, net | 8,944 | 8,116 | |||||
Accrued interest receivable | 5,243 | 4,502 | |||||
Other real estate owned | 1,428 | — | |||||
Bank-owned life insurance | 13,880 | 13,521 | |||||
Other assets | 11,049 | 6,352 | |||||
Total Assets | $ | 2,002,911 | $ | 1,674,466 | |||
Liabilities and Shareholders' Equity: | |||||||
Liabilities: | |||||||
Non-interest bearing deposits | $ | 381,887 | $ | 304,425 | |||
Interest bearing deposits | 1,140,854 | 1,028,817 | |||||
Total deposits | 1,522,741 | 1,333,242 | |||||
Other borrowings | 5,852 | 6,942 | |||||
FHLB advances | 232,097 | 110,087 | |||||
Long-term borrowings | 32,638 | 32,884 | |||||
Accrued interest payable | 947 | 912 | |||||
Other liabilities | 15,976 | 11,804 | |||||
Total Liabilities | 1,810,251 | 1,495,871 | |||||
Commitments and contingent liabilities | — | — | |||||
Shareholders' Equity: | |||||||
Common stock: | |||||||
Common Stock Voting, $0.01 par value, 50,000,000 shares authorized, 10,987,652 and 10,377,981 shares issued and outstanding, respectively | 109 | 103 | |||||
Common Stock Non-Voting, $0.01 par value, 10,000,000 shares authorized; 1,908,733 and 1,817,842 shares issued and outstanding, respectively | 19 | 18 | |||||
Additional paid-in capital | 177,924 | 160,861 | |||||
Accumulated earnings | 17,187 | 17,740 | |||||
Accumulated other comprehensive loss | (2,579 | ) | (127 | ) | |||
Total Shareholders' Equity | 192,660 | 178,595 | |||||
Total Liabilities and Shareholders' Equity | $ | 2,002,911 | $ | 1,674,466 | |||
See accompanying notes to audited consolidated financial statements.
55
WashingtonFirst Bankshares, Inc.
Consolidated Statements of Income
For the Year Ended December 31, | |||||||||||
2016 | 2015 | 2014 | |||||||||
Interest and dividend income: | |||||||||||
Interest and fees on loans | $ | 68,901 | $ | 59,346 | $ | 51,612 | |||||
Interest and dividends on investments: | |||||||||||
Taxable | 4,274 | 3,257 | 2,886 | ||||||||
Tax-exempt | 123 | 74 | 133 | ||||||||
Dividends on other equity securities | 284 | 257 | 166 | ||||||||
Interest on Federal funds sold and other short-term investments | 265 | 249 | 322 | ||||||||
Total interest and dividend income | 73,847 | 63,183 | 55,119 | ||||||||
Interest expense: | |||||||||||
Interest on deposits | 8,727 | 6,431 | 5,443 | ||||||||
Interest on borrowings | 3,744 | 2,780 | 1,776 | ||||||||
Total interest expense | 12,471 | 9,211 | 7,219 | ||||||||
Net interest income | 61,376 | 53,972 | 47,900 | ||||||||
Provision for loan losses | 3,880 | 3,550 | 3,005 | ||||||||
Net interest income after provision for loan losses | 57,496 | 50,422 | 44,895 | ||||||||
Non-interest income: | |||||||||||
Service charges on deposit accounts | 259 | 434 | 466 | ||||||||
Earnings on bank-owned life insurance | 359 | 374 | 364 | ||||||||
Gain on sale of other real estate owned, net | 11 | 231 | 76 | ||||||||
Gain on sale of loans, net | 18,329 | 4,645 | 364 | ||||||||
Mortgage banking activities | 4,265 | 759 | — | ||||||||
Wealth management income | 1,835 | 693 | — | ||||||||
Gain/(loss) on sale of available-for-sale investment securities, net | 1,323 | 10 | 166 | ||||||||
Other operating income | 1,124 | 745 | 562 | ||||||||
Total non-interest income | 27,505 | 7,891 | 1,998 | ||||||||
Non-interest expense: | |||||||||||
Compensation and employee benefits | 35,183 | 23,122 | 18,101 | ||||||||
Premises and equipment | 7,370 | 6,327 | 5,776 | ||||||||
Data processing | 4,169 | 3,510 | 3,129 | ||||||||
Professional fees | 1,336 | 1,285 | 1,395 | ||||||||
Merger expenses | 30 | 545 | 201 | ||||||||
Mortgage loan processing expenses | 1,240 | 248 | — | ||||||||
Debt extinguishment | 1,335 | — | — | ||||||||
Other operating expenses | 6,200 | 4,552 | 4,514 | ||||||||
Total non-interest expense | 56,863 | 39,589 | 33,116 | ||||||||
Income before provision for income taxes | 28,138 | 18,724 | 13,777 | ||||||||
Provision for income taxes | 10,131 | 6,469 | 4,353 | ||||||||
Net income | 18,007 | 12,255 | 9,424 | ||||||||
Preferred stock dividends | — | (74 | ) | (161 | ) | ||||||
Net income available to common shareholders | $ | 18,007 | $ | 12,181 | $ | 9,263 | |||||
Earnings per common share: (1) | |||||||||||
Basic earnings per common share | $ | 1.40 | $ | 1.15 | $ | 1.09 | |||||
Diluted earnings per common share | $ | 1.37 | $ | 1.13 | $ | 1.06 | |||||
(1) Prior periods adjusted for 5% stock dividend declared in 2016 | |||||||||||
56
WashingtonFirst Bankshares, Inc.
Consolidated Statements of Comprehensive Income
For the Year Ended December 31, | |||||||||||
2016 | 2015 | 2014 | |||||||||
($ in thousands) | |||||||||||
Net income | $ | 18,007 | $ | 12,255 | $ | 9,424 | |||||
Other comprehensive income/(loss): | |||||||||||
Unrealized gain/(loss) on hedge: | |||||||||||
Unrealized holding gain/(loss) | — | 66 | — | ||||||||
Reclassification adjustment for realized (gains)/losses | (66 | ) | — | — | |||||||
Tax effect | — | — | — | ||||||||
Unrealized (gain)/loss on hedge, net of tax | (66 | ) | 66 | — | |||||||
Unrealized gain/(loss) on securities available for sale: | |||||||||||
Unrealized holding gain/(loss) arising during the period | (2,446 | ) | (985 | ) | 3,060 | ||||||
Reclassification adjustment for realized (gains)/losses | (1,323 | ) | (10 | ) | (166 | ) | |||||
Tax effect | 1,383 | 368 | (951 | ) | |||||||
Unrealized gain/(loss) on securities available for sale, net of tax | (2,386 | ) | (627 | ) | 1,943 | ||||||
Total other comprehensive income/(loss) | (2,452 | ) | (561 | ) | 1,943 | ||||||
Comprehensive income | $ | 15,555 | $ | 11,694 | $ | 11,367 | |||||
See accompanying notes to audited consolidated financial statements.
57
WashingtonFirst Bankshares, Inc.
Consolidated Statements of Changes in Shareholders' Equity
For the Year Ended December 31, | ||||||||||||||||||||
2016 | 2015 | 2014 | ||||||||||||||||||
Shares | Amount | Shares | Amount | Shares | Amount | |||||||||||||||
($ in thousands, except share data) | ||||||||||||||||||||
Preferred stock: | ||||||||||||||||||||
Balance, beginning of period | — | $ | — | 13,347 | $ | 67 | 17,796 | $ | 89 | |||||||||||
Redemption of preferred stock | — | — | (13,347 | ) | (67 | ) | (4,449 | ) | (22 | ) | ||||||||||
Balance, end of period | — | $ | — | — | $ | — | 13,347 | $ | 67 | |||||||||||
Additional paid-in capital - preferred: | ||||||||||||||||||||
Balance, beginning of period | $ | — | $ | 13,280 | $ | 17,707 | ||||||||||||||
Redemption of preferred stock | — | (13,280 | ) | (4,427 | ) | |||||||||||||||
Balance, end of period | $ | — | $ | — | $ | 13,280 | ||||||||||||||
Common stock: | ||||||||||||||||||||
Balance, beginning of period | 12,195,823 | $ | 121 | 9,565,637 | $ | 95 | 7,648,495 | $ | 76 | |||||||||||
Exercise of stock options | 87,306 | 1 | 61,612 | — | 84,942 | 1 | ||||||||||||||
Forfeiture of restricted stock award | (1,586 | ) | — | (2,836 | ) | — | (3,601 | ) | — | |||||||||||
Issuance of common stock under restricted stock agreements | 1,200 | — | — | — | 72,341 | — | ||||||||||||||
Common stock dividends | 613,670 | 6 | — | — | 386,241 | 5 | ||||||||||||||
Issuance of common stock related to 1st Portfolio acquisition | (28 | ) | — | 916,410 | 9 | |||||||||||||||
Issuance of common stock | — | — | 1,655,000 | 17 | 1,377,219 | 13 | ||||||||||||||
Balance, end of period | 12,896,385 | $ | 128 | 12,195,823 | $ | 121 | 9,565,637 | $ | 95 | |||||||||||
Additional paid-in capital - common: | ||||||||||||||||||||
Balance, beginning of period | $ | 160,861 | $ | 112,887 | $ | 85,636 | ||||||||||||||
Exercise of stock options | 836 | 566 | 765 | |||||||||||||||||
Stock compensation expense | 551 | 405 | 215 | |||||||||||||||||
Tax effect of stock-based awards | 240 | 103 | 67 | |||||||||||||||||
Exercise of warrants | (47 | ) | — | — | ||||||||||||||||
Common stock dividends | 15,483 | — | 5,727 | |||||||||||||||||
Issuance of common stock, net of offering costs | — | 31,135 | 20,477 | |||||||||||||||||
Issuance of common stock related to 1st Portfolio Acquisition | — | 15,616 | — | |||||||||||||||||
Conversion of stock options related to 1st Portfolio Acquisition | — | 149 | — | |||||||||||||||||
Balance, end of period | $ | 177,924 | $ | 160,861 | $ | 112,887 | ||||||||||||||
Accumulated earnings: | ||||||||||||||||||||
Balance, beginning of period | $ | 17,740 | $ | 7,775 | $ | 5,605 | ||||||||||||||
Net income | 18,007 | 12,255 | 9,424 | |||||||||||||||||
Preferred stock dividends | — | (74 | ) | (161 | ) | |||||||||||||||
Cash dividends declared | (3,063 | ) | (2,216 | ) | (1,357 | ) | ||||||||||||||
Common stock dividends | (15,489 | ) | — | (5,731 | ) | |||||||||||||||
Common stock cash-in-lieu dividends | (8 | ) | — | (5 | ) | |||||||||||||||
Balance, end of period | $ | 17,187 | $ | 17,740 | $ | 7,775 | ||||||||||||||
Accumulated other comprehensive income/(loss): | ||||||||||||||||||||
Balance, beginning of period | $ | (127 | ) | $ | 434 | $ | (1,509 | ) | ||||||||||||
Other comprehensive income/(loss) | (2,452 | ) | (561 | ) | 1,943 | |||||||||||||||
Balance, end of period | $ | (2,579 | ) | $ | (127 | ) | $ | 434 | ||||||||||||
Total shareholders' equity | $ | 192,660 | $ | 178,595 | $ | 134,538 | ||||||||||||||
58
WashingtonFirst Bankshares, Inc.
Consolidated Statements of Cash Flows
For the Year Ended December 31, | |||||||||||
2016 | 2015 | 2014 | |||||||||
($ in thousands) | |||||||||||
Cash flows from operating activities: | |||||||||||
Net income | $ | 18,007 | $ | 12,255 | $ | 9,424 | |||||
Adjustments to reconcile net income to net cash provided by operating activities: | |||||||||||
Depreciation and amortization | 2,071 | 1,466 | 1,314 | ||||||||
Amortization of deferred loan origination fees and costs | (555 | ) | (1,179 | ) | 308 | ||||||
Net amortization of purchase accounting marks | (3,103 | ) | (1,284 | ) | (4,011 | ) | |||||
Loss on disposal of fixed assets | (40 | ) | 19 | — | |||||||
Gain on sale of other real estate owned | (11 | ) | (231 | ) | (76 | ) | |||||
Write-down of other real estate owned | 159 | — | 332 | ||||||||
Gain on sale of investment securities available-for-sale | (1,323 | ) | (10 | ) | (166 | ) | |||||
Provision for loan losses | 3,880 | 3,550 | 3,005 | ||||||||
Earnings on bank-owned life insurance | (359 | ) | (374 | ) | (364 | ) | |||||
Deferred income taxes | 555 | (538 | ) | 1,201 | |||||||
Tax effect on stock options | 240 | 102 | — | ||||||||
Net amortization on investment securities available-for-sale | 1,550 | 843 | 1,002 | ||||||||
Stock based compensation | 551 | 405 | 215 | ||||||||
Gain on sale of loans | (18,329 | ) | (4,645 | ) | (364 | ) | |||||
Originations of loans held-for-sale | (772,076 | ) | (213,449 | ) | (23,050 | ) | |||||
Proceeds from sales of loans held-for-sale | 793,566 | 215,580 | 22,346 | ||||||||
Net change in: | |||||||||||
Accrued interest receivable | (741 | ) | (650 | ) | (386 | ) | |||||
Other assets | (5,381 | ) | (2,124 | ) | 1,484 | ||||||
Accrued interest payable | 35 | 364 | 24 | ||||||||
Other liabilities | 4,053 | 1,224 | 834 | ||||||||
Net cash provided by operating activities | 22,749 | 11,324 | 13,072 | ||||||||
Cash flows from investing activities: | |||||||||||
Net cash received in acquisitions | — | 5,732 | 59,047 | ||||||||
Purchase of investment securities available-for-sale | (185,726 | ) | (97,171 | ) | (44,656 | ) | |||||
Proceeds from repayment of investment securities available-for-sale | 45,088 | 29,422 | 25,868 | ||||||||
Proceeds from sale of investment securities available-for-sale | 76,551 | 12,335 | 19,050 | ||||||||
Net increase in loans held-for-investment | (228,520 | ) | (241,232 | ) | (175,026 | ) | |||||
Proceeds from sale of real estate owned | 679 | 682 | 1,206 | ||||||||
Purchase of bank-owned life insurance | — | — | (2,500 | ) | |||||||
Net increase in restricted stock | (5,598 | ) | (903 | ) | (1,012 | ) | |||||
Purchases of premises and equipment, net | (1,365 | ) | (1,418 | ) | (2,027 | ) | |||||
Net cash used in investing activities | (298,891 | ) | (292,553 | ) | (120,050 | ) | |||||
Cash flows from financing activities: | |||||||||||
Net increase in deposits | 189,439 | 247,133 | 15,787 | ||||||||
Proceeds from FHLB advances | 231,500 | 25,500 | 30,871 | ||||||||
Repayments of FHLB advances | (106,982 | ) | (975 | ) | — | ||||||
Net increase/(decrease) in other borrowings | (1,090 | ) | (29,054 | ) | (1,920 | ) | |||||
Net (decrease)/increase in other long-term borrowings | — | 22,668 | — | ||||||||
Proceeds from issuance of common stock, net | — | 31,153 | 20,490 | ||||||||
Proceeds from exercise of stock options | 837 | 566 | 766 | ||||||||
Redemption of preferred stock | — | (13,347 | ) | (4,449 | ) | ||||||
Cash dividends paid | (2,934 | ) | (1,894 | ) | (1,259 | ) | |||||
Dividends paid - cash portion for fractional shares on 5% dividend | (8 | ) | — | (5 | ) | ||||||
Preferred stock dividends paid | — | (74 | ) | (161 | ) | ||||||
Net cash provided by financing activities | 310,762 | 281,676 | 60,120 | ||||||||
Net increase in cash and cash equivalents | 34,620 | 447 | (46,858 | ) | |||||||
Cash and cash equivalents at beginning of period | 62,753 | 62,306 | 109,164 | ||||||||
Cash and cash equivalents at end of period | $ | 97,373 | $ | 62,753 | $ | 62,306 | |||||
See accompanying notes to audited consolidated financial statements.
59
WashingtonFirst Bankshares, Inc.
Notes to the Consolidated Financial Statements
In this report, WashingtonFirst Bankshares Inc. is sometimes referred to as “WashingtonFirst,” the “Company,” “we,” “our,” or “us” and these references include the Company’s subsidiaries, WashingtonFirst Bank, 1st Portfolio, Inc. and WashingtonFirst Mortgage (a wholly-owned subsidiary of WashingtonFirst Bank), unless the context requires otherwise.
1. ORGANIZATION
The Company is organized under the laws of the Commonwealth of Virginia as a bank holding company. Headquartered in Reston, Virginia, the Company is the parent company of the Bank which operates 19 full-service banking offices throughout the Washington, D.C. metropolitan area. In addition, the Company provides wealth management services through its subsidiary, 1st Portfolio, Inc., located in Fairfax, Virginia, and mortgage banking services through the Bank’s wholly owned subsidiary, WashingtonFirst Mortgage which operates in two locations: Fairfax, Virginia, and Rockville, Maryland.
2. SIGNIFICANT ACCOUNTING POLICIES
The accounting and reporting policies of the Company conform to U.S. GAAP and follow general practices within the banking industry. All significant intercompany accounts and transactions have been eliminated in consolidation. The following are the significant accounting policies that the Company follows in preparing and presenting its consolidated financial statements:
Use of Estimates
Management makes estimates and assumptions that affect the reported amounts of assets and liabilities and disclosure of contingent assets and liabilities at the date of the financial statements and the reported amounts of revenues and expenses during the reporting period. Actual results could differ from those estimates. Material estimates that are particularly susceptible to significant change in the near term relate to the determination of the allowance for loan losses, the fair values and impairments of financial instruments, the status of contingencies and the valuation of deferred tax assets and goodwill.
Cash and Cash Equivalents and Statements of Cash Flows
For purposes of the statements of cash flows, cash and cash equivalents consists of cash and due from banks, interest bearing balances and federal funds sold.
60
Table 2: Certain Cash and Non-Cash Transactions | ||||||||||
For the Year Ended December 31, | ||||||||||
2016 | 2015 | 2014 | ||||||||
($ in thousands) | ||||||||||
Cash paid during the period for: | ||||||||||
Interest paid | $ | 12,436 | $ | 8,847 | 5,473 | |||||
Income taxes paid | 9,771 | 5,452 | 1,800 | |||||||
Non-cash activity: | ||||||||||
Loans converted into other real estate owned | 2,255 | 90 | 360 | |||||||
Reclassifications from goodwill to other liabilities | (11 | ) | — | — | ||||||
Reclassifications from LHFS to LHFI | (885 | ) | — | — | ||||||
Non-cash activity resulting from acquisitions/transactions: | ||||||||||
Common shares issued: | ||||||||||
Common shares issued | — | 15,625 | — | |||||||
Fair value of assets acquired: | ||||||||||
Investment securities | — | — | 19,240 | |||||||
Other equity securities | — | — | 683 | |||||||
Loans held for sale | — | 32,912 | — | |||||||
Loans held for investment, net of unearned income | — | — | 51,332 | |||||||
Premises and equipment | — | 1,164 | 470 | |||||||
Identifiable intangibles - core deposit | — | — | — | |||||||
Identifiable intangibles - customer list | — | 1,447 | — | |||||||
Other assets | — | 1,371 | 440 | |||||||
Fair value of liabilities assumed: | ||||||||||
Deposits | — | — | 121,592 | |||||||
FHLB advances | — | — | 12,209 | |||||||
Borrowings | — | 27,759 | — | |||||||
Other liabilities | — | 4,302 | 50 | |||||||
Investment Securities
Purchase premiums and discounts are recognized in interest income using the interest method over the terms of the securities. Declines in the fair value of available-for-sale securities below their cost that are deemed to be other than temporary are reflected in earnings as realized losses. Gains and losses on the sale of securities are recorded on the trade date and are determined using the specific identification method.
The estimated fair value of the portfolio fluctuates due to changes in market interest rates and other factors. Securities are monitored to determine whether a decline in their value is other-than-temporary. Management evaluates the investment portfolio on a quarterly basis to determine the collectibility of amounts due per the contractual terms of the investment security.
A security is generally defined to be impaired if the carrying value of such security exceeds its estimated fair value. Based on the provisions of ASC 320, a security is considered to be other-than-temporarily impaired if the present value of cash flows expected to be collected is less than the security’s amortized cost basis (the difference being defined as the credit loss) or if the fair value of the security is less than the security’s amortized cost basis and the investor intends, or more-likely-than-not will be required to sell the security before recovery of the security’s amortized cost basis. The charge to earnings is limited to the amount of credit loss if the investor does not intend, and more-likely-than-not will not be required, to sell the security before recovery of the security’s amortized cost basis. Any remaining difference between fair value and amortized cost is recognized in other comprehensive income, net of applicable taxes. In certain instances, as a result of the other-than-temporary impairment analysis, the recognition or accrual of interest will be discontinued and the security will be placed on non-accrual status.
Loans Held for Sale
The Mortgage Company regularly engages in the generation and sale of residential mortgage loans. These loans are generally loans held for sale to outside investors, are made on a pre-sold basis with servicing rights released, and carried at lower of cost or market, determined in the aggregate. Fair value considers commitment agreements with investors and prevailing market prices. Gains and losses on these loans are recognized based on the difference between the selling price and the carrying value of the related loan sold.
61
Loans Held for Investment
Loans are stated at the principal amount outstanding, net of unamortized deferred costs and fees. Interest income on loans is accrued at the contractual rate on the principal amount outstanding. The loans are expected to be repaid from cash flow or proceeds from the sale of selected assets of the borrowers. The ability of the Company’s debtors to honor their loan contracts is dependent upon the real estate and general economic conditions in the Company’s market area. Loans that management has the intent and ability to hold for the foreseeable future or until maturity or pay-off generally are reported at their outstanding unpaid principal balances less the allowance for loan losses, and any deferred fees or costs on originated loans. Interest income is accrued on the unpaid principal balance. Loan origination fees, net of certain direct origination costs, are deferred and recognized as an adjustment of the related loan yield using the interest method. The accrual of interest on mortgage and commercial loans is generally discontinued at the time the loan is 90 days delinquent unless the credit is well-secured and in process of collection. Consumer loans and other loans typically are charged off no later than 180 days past due. In all cases, loans are placed on non-accrual or charged-off at an earlier date if collection of principal or interest is considered doubtful. All interest accrued but not collected for loans that are placed on non-accrual or charged-off is reversed against interest income. The interest on these loans is accounted for on the cash-basis or cost-recovery method, until qualifying for return to accrual. Loans are returned to accrual status when all of the principal and interest amounts contractually due are brought current and future payments are reasonably assured.
Allowance for Loan Losses
The allowance for loan losses is an estimate of the losses that may be sustained in our loan portfolio. The allowance is based on two basic principles of accounting: (i) ASC 450-10, which requires that losses be accrued when they are probable of occurring and estimable; and (ii) ASC 310-10, which requires that losses be accrued based on the differences between the net realizable value of collateral, present value of future cash flows or values that are observable in the secondary market and the loan balance.
An allowance is established as losses are estimated to have occurred through a provision for loan losses charged to earnings. Loan losses are charged against the allowance when management believes the uncollectibility of a loan balance is confirmed. Subsequent recoveries, if any, are credited to the allowance. The allowance represents an amount that, in management’s judgment will be adequate to absorb any losses on existing loans that may become uncollectible. Management’s judgment in determining the adequacy of the allowance is based on evaluations of the collectibility of loans while taking into consideration such factors as changes in the nature and volume of the loan portfolio, current economic conditions which may affect a borrower’s ability to repay, overall portfolio quality, and review of specific potential losses. This evaluation is inherently subjective, as it requires estimates that are susceptible to significant revision as more information becomes available. The allowance consists of specific, general and unallocated components. The specific component relates to loans that are classified as doubtful, substandard or special mention. The general component covers non-classified loans and is based on historical loss experience adjusted for qualitative factors. An unallocated component is maintained to cover uncertainties that could affect management’s estimate of probable losses. The unallocated component of the allowance reflects the margin of imprecision inherent in the underlying assumptions used in the methodologies for estimating specific and general losses in the portfolio.
For loans that are classified as impaired, an allowance is established when the net realizable value (or collateral value, observable market price, or discounted cash flows) of the impaired loan is lower than the carrying value of that loan. A loan is considered impaired when, based on current information and events, it is probable that the Bank will be unable to collect the scheduled payments of principal or interest when due according to the contractual terms of the loan agreement. Factors considered by management in determining impairment include payment status, collateral value, and the probability of collecting scheduled principal and interest payments when due. Loans that experience insignificant payment delays and payment shortfalls generally are not classified as impaired. Management determines the significance of payment delays and payment shortfalls on a case-by-case basis, taking into consideration all of the circumstances surrounding the loan and the borrower, including the length of the delay, the reasons for the delay, the borrower’s prior payment record, and the amount of the shortfall in relation to the principal and interest owed. Impairment is measured on a loan by loan basis for commercial and construction loans by either the present value of the expected future cash flows discounted at the loan’s effective interest rate, the loan’s observable market price, or the fair value of the collateral if the loan is collateral dependent. Large groups of smaller balance homogeneous loans are collectively evaluated for impairment. Accordingly, the Bank does not separately identify individual consumer loans for impairment disclosures.
Troubled debt restructurings are also considered impaired with impairment generally measured at the present value of future cash flows using the loan’s effective rate at inception or using the fair value of collateral, less estimated costs to sell, if repayment is expected solely from the collateral.
Premises and Equipment
Premises and equipment are stated at cost less accumulated depreciation. Premises and equipment are depreciated over their estimated useful lives; leasehold improvements are amortized over the lives of the respective leases or the estimated useful life of the leasehold improvement, whichever is less. Depreciation is computed using the straight-line method over the lesser of the estimated useful life or the remaining term of the lease for leasehold improvements; and 3 to 7 years for furniture, fixtures, and equipment. Costs of
62
maintenance and repairs are expensed as incurred; improvements and betterments are capitalized. When items are retired or otherwise disposed of, the related costs and accumulated depreciation are removed from the accounts and any resulting gains or losses are included in the determination of net income.
Other Real Estate Owned
Real estate properties acquired through loan foreclosures are recorded initially at fair value, less expected sales costs, determined by management. Subsequent valuations are performed by management, and the carrying amount of a property is adjusted by a charge to expense to reflect any subsequent declines in estimated fair value. Fair value estimates are based on recent appraisals and current market conditions. Gains or losses on sales of real estate owned are recognized upon disposition.
Leases
The Bank and Mortgage Company lease certain properties under operating leases with terms greater than one year and with minimum lease payments associated with these agreements. Rent expense is recognized on a straight-line basis over the expected lease term in accordance with ASC 840. Within the provisions of certain leases, there are predetermined fixed escalations of the minimum rental payments over the base lease term. The effects of the escalations have been reflected in rent expense on a straight-line basis over the lease term, and the difference between the recognized rental expense and the amounts payable under the lease is recorded as deferred lease payments. The amortization period for leasehold improvements is the term used in calculating straight-line rent expense or their estimated economic life, whichever is shorter.
Marketing & Advertising
Marketing and advertising costs are generally expensed as incurred.
Income Taxes
The Company employs the liability method of accounting for income taxes as required by ASC Topic 740, "Income Taxes." Under the liability method, deferred-tax assets and liabilities are determined based on differences between the financial statement carrying amounts and the tax basis of existing assets and liabilities (i.e. temporary timing differences) and are measured at the enacted rates that will be in effect when these differences reverse. The Company utilizes statutory requirements for its income tax accounting, and avoids risks associated with potentially problematic tax positions that may incur challenge upon audit, where an adverse outcome is more likely than not. Therefore, no provisions are made for either uncertain tax positions nor accompanying potential tax penalties and interest for underpayments of income taxes in the Company's tax reserves.
Valuation of Long-Lived Assets
The Company accounts for the valuation of long-lived assets under ASC 205-20, which requires that long-lived assets and certain identifiable intangible assets be reviewed for impairment whenever events or changes in circumstances indicate that the carrying amount of an asset may not be recoverable. Recoverability of the long-lived asset is measured by a comparison of the carrying amount of the asset to future undiscounted net cash flows expected to be generated by the asset. If such assets are considered to be impaired, the impairment to be recognized is measured by the amount by which the carrying amount of the assets exceeds the estimated fair value of the assets. Assets to be disposed of are reportable at the lower of the carrying amount or the fair value, less costs to sell.
Transfer of Financial Assets
Transfers of financial assets are accounted for as sales when control over the assets has been surrendered. Control over transferred assets is deemed to be surrendered when: (1) the assets have been isolated from the Company; (2) the transferee obtains the right (free of conditions that constrain it from taking advantage of that right) to pledge or exchange the transferred assets; and (3) the Company does not maintain effective control over the transferred assets through an agreement to repurchase them before their maturity.
Derivative Financial Instruments
The Company enters into commitments to originate residential mortgage loans whereby the interest rate on the loan is determined prior to funding (i.e. interest rate lock commitments). Such interest rate lock commitments on mortgage loans to be sold in the secondary market are considered to be derivatives. To protect against the price risk inherent in residential mortgage loan commitments, the Company utilizes both "best efforts" and "mandatory delivery" forward loan sale commitments to mitigate the risk of potential decreases in the values of loans that would result from the exercise of the derivative loan commitments. Under a "best efforts" contract, the Company commits to deliver an individual mortgage loan of a specified principal amount and quality to an investor and the investor commits to a price that it will purchase the loan from the Company if the loan to the underlying borrower closes. The Company protects itself from changes in interest rates through the use of best efforts forward delivery commitments, whereby the investor commits to purchase a loan at a price representing a premium on the day the borrower commits to an interest rate
63
with the intent that the buyer/investor has assumed the interest rate risk on the loan. As a result, the Bank is not generally exposed to losses on loans sold utilizing best efforts, nor will it realize gains related to rate lock commitments due to changes in interest rates. The market values of interest rate lock commitments and best efforts contracts are not readily ascertainable with precision because rate lock commitments and best efforts contracts are not actively traded. Because of the high correlation between rate lock commitments and best efforts contracts, no gain or loss should occur on the interest rate lock commitments. Under a "mandatory delivery" contract, the Company commits to deliver a certain principal amount of mortgage loans to an investor at a specified price on or before a specified date. If the Company fails to deliver the amount of mortgages necessary to fulfill the commitment by the specified date, it is obligated to pay the investor a "pair-off" fee, based on then-current market prices, to compensate the investor for the shortfall. The Company manages the interest rate risk on interest rate lock commitments by entering into forward sale contracts of mortgage backed securities, whereby the Company obtains the right to deliver securities to investors in the future at a specified price. Such contracts are accounted for as derivatives and are recorded at fair value in derivative assets or liabilities, carried on the Consolidated Balance Sheet within other assets or other liabilities with changes in fair value recorded in other income within the Consolidated Statement of Income. The period of time between issuance of a loan commitment to the customer and closing and sale of the loan to an investor generally ranges from 30 to 90 days under current market conditions. The gross gains on loan sales are recognized based on new loan commitments with adjustment for price and pair-off activity. Commission expenses on loans held for sale are recognized based on loans closed.
The Company has determined these derivative financial instruments do not meet the hedging criteria required by ASC 815 and has not designated these derivative financial instruments as hedges. Accordingly, changes in fair value are recognized currently in income.
Purchased Credit Impaired Loans
Related to its acquisition activity, the Bank has acquired loans, some of which have shown evidence of credit impairment since origination. These purchased credit impaired loans are recorded at the amount paid, such that there is no carryover of the seller’s allowance for loan losses. After acquisition, losses are recognized by an increase in the allowance for loan losses. Such purchased credit impaired loans are accounted for individually. For each such loan the Bank estimates the amount and timing of expected cash flows, and the expected cash flows in excess of amount paid is recorded as interest income over the remaining life of the loan (accretable yield). The excess of the loan’s contractual principal and interest over expected cash flows is not recorded (nonaccretable difference).
Reclassifications
Certain reclassifications of prior year information were made to conform to the December 31, 2016 presentation. These reclassifications had no material impact of the Company’s consolidated financial position or results of operations.
Recent Accounting Pronouncements
In August 2016, the FASB issued ASU No. 2016-15, Statement of Cash Flow (Topic 230): Classification of Certain Cash Receipts and Cash Payments. This amends ASC 230 to add or clarify guidance on the classification of eight specific cash receipts and payments in the statement of cash flows. The amendments are effective for public companies for fiscal periods beginning after December 15, 2017, and interim periods within those fiscal years and should be be applied using a retrospective transition method to each period where practicable. The adoption of this pronouncement is not expected to have a material impact on the Company’s Consolidated Financial Statements.
In June 2016, the FASB issued ASU No. 2016-13, Current Expected Credit Losses (CECL). This provided new accounting guidance that will require the earlier recognition of credit losses on loans and other financial instruments based on an expected loss model, replacing the incurred loss model that is currently in use. Under the new guidance, an entity will measure all expected credit losses for financial instruments held at the reporting date based on historical experience, current conditions and reasonable and supportable forecasts. The expected loss model will apply to loans and leases, unfunded lending commitments, held-to-maturity (HTM) debt securities and other debt instruments measured at amortized cost. The impairment model for available-for-sale (AFS) debt securities will require the recognition of credit losses through a valuation allowance when fair value is less than amortized cost, regardless of whether the impairment is considered to be other-than-temporary. The new guidance is effective on January 1, 2020, with early adoption permitted on January 1, 2019. While early adoption is permitted, the Company does not expect to elect that option. The Company has begun its evaluation of this pronouncement including the potential impact on its Consolidated Financial Statements. As a result of the required change in approach toward determining estimated credit losses from the current “incurred loss” model to one based on estimated cash flows over a loan’s contractual life, adjusted for prepayments (a “life of loan” model), the Company expects the new guidance will result in an increase in the allowance for loan losses, particularly for longer duration portfolios. The Company also expects the new pronouncement may result in an allowance for debt securities. In both cases, the extent of the change is indeterminable at this time as it will be dependent upon portfolio composition and credit quality at the adoption date, as well as economic conditions and forecasts at that time. Further, to date, no guidance has been issued by either the Company’s or the Bank’s primary regulator with respect to how the impact of the amended standard is to be treated for regulatory capital purposes.
64
In March 2016, the FASB issued ASU No. 2016-09, Compensation - Stock Compensation (Topic 718): Improvements to Employee Shares-Based Payment Accounting. The amendments in this ASU simplify several aspects of the accounting for share-based payment award transactions including: (a) income tax consequences; (b) classification of awards as either equity or liabilities; and (c) classification on the statement of cash flows. The amendments are effective for public companies for annual periods beginning after December 15, 2016, and interim periods within those annual periods. The Company assessed the impact this pronouncement will have on its Consolidated Financial Statements and has concluded there is potential for a positive benefit to net income in future periods as a result of tax benefits flowing through tax expense arising from the change in the application of tax accounting for share-based payment award transactions. The aforementioned positive benefit to net income is dependent upon the company’s stock price gradually rising over time so that the fair value assigned to share-based payment awards is less than the future value of the awards upon vesting or exercise date for restricted stock awards and option awards, respectively.
In February 2016, the FASB issued ASU No. 2016-02, Leases. From the lessee's perspective, the new standard establishes a right-of-use (ROU) model that requires a lessee to record a ROU asset and a lease liability on the balance sheet for all leases with terms longer than 12 months. Leases will be classified as either finance or operating, with classification affecting the pattern of expense recognition in the income statement for a lessees. From the lessor's perspective, the new standard requires a lessor to classify leases as either sales-type, finance or operating. A lease will be treated as a sale if it transfers all of the risks and rewards, as well as control of the underlying asset, to the lessee. If risks and rewards are conveyed without the transfer of control, the lease is treated as a financing. If the lessor doesn’t convey risks and rewards or control, an operating lease results. The new standard is effective for fiscal years beginning after December 15, 2018, including interim periods within those fiscal years. A modified retrospective transition approach is required for lessees for capital and operating leases existing at, or entered into after, the beginning of the earliest comparative period presented in the financial statements, with certain practical expedients available. A modified retrospective transition approach is required for lessors for sales-type, direct financing, and operating leases existing at, or entered into after, the beginning of the earliest comparative period presented in the financial statements, with certain practical expedients available. The Company continues to evaluate the impact of this pronouncement, including determining whether additional contracts exist that are deemed to be in scope. Further, to date, no guidance has been issued by either the Company’s or the Bank’s primary regulator with respect to how the impact of the amended standard is to be treated for regulatory capital purposes. For more information on leases, refer to Footnote 8 “Premises and Equipment, Net”.
In January 2016, the FASB issued ASU No. 2016-01, Financial Instruments - Overall. The guidance in this ASU among other things, (1) requires equity investments with certain exceptions, to be measured at fair value with changes in fair value recognized in net income, (2) simplifies the impairment assessment of equity investments without readily determinable fair values by requiring a qualitative assessment to identify impairment, (3) eliminates the requirement for public businesses entities to disclose the methods and significant assumptions used to estimate the fair value that is required to be disclosed for financial instruments measured at amortized cost on the balance sheet, (4) requires public business entities to use the exit price notion when measuring the fair value of financial instruments for disclosure purposes, (5) requires an entity to present separately in other comprehensive income the portion of the change in fair value of a liability resulting from a change in the instrument-specific credit risk when the entity has elected to measure the liability at fair value in accordance with the fair value option for financial instruments, (6) requires separate presentation of financial assets and financial liabilities by measurement category and form of financial asset on the balance sheet or the accompanying notes to the financial statements and (7) clarifies that an entity should evaluate the need for a valuation allowance on a deferred tax asset related to available-for-sale securities. The pronouncement is effective for fiscal years beginning after December 15, 2017, including interim periods within those fiscal years. The Company does not expect the adoption of this pronouncement to have a significant impact on its Consolidated Financial Statements.
FASB issued ASU 2014-09, Revenue from Contracts with Customers (Topic 606). The amendments in this update creates a new topic in ASC Topic 606. In addition to superseding and replacing nearly all existing U.S. GAAP revenue recognition guidance, including industry-specific guidance, ASC 606 establishes a new control-based revenue recognition model, changes the basis for deciding when revenue is recognized over time or at a point in time, provides new and more detailed guidance on specific topics and expands and improves disclosures about revenue. In addition, ASU 2014-09 adds a new Subtopic to the Codification, ASC 340-40, Other Assets and Deferred Costs: Contracts with Customers, to provide guidance on costs related to obtaining a contract with a customer and costs incurred in fulfilling a contract with a customer that are not in the scope of another ASC Topic. The new guidance does not apply to certain contracts within the scope of other ASC Topics, such as lease contracts, financing arrangements, financial instruments, guarantees other than product or service warranties, and non-monetary exchanges between entities in the same line of business to facilitate sales to customers. The amendments are effective for annual periods and interim periods within those annual periods beginning after December 15, 2017. The Company does not expect the adoption of this pronouncement to have a significant impact on its Consolidated Financial Statements.
FASB issued ASU 2015-03, Simplifying the Presentation of Debt Issuance Costs. This update requires that debt issuance costs be reported in the balance sheet as a direct deduction from the face amount of the related liability, consistent with the presentation of debt discounts. Further, the update requires the amortization of debt issuance costs to be reported as interest expense. Similarly, debt issuance costs and any discount or premium are considered in the aggregate when determining the effective interest rate on the debt.
65
The new guidance is effective for fiscal years beginning after December 15, 2015, and interim periods within those fiscal years. The new guidance must be applied retrospectively. Adoption of this pronouncement by the Company resulted in an entry amounting to $385 thousand being made to reclass debt issuance costs from other assets to long-term borrowings in 2016.
FASB issued ASU No. 2014-17, Business Combinations (Topic 805)-Pushdown Accounting (a consensus of the FASB Emerging Issues Task Force), which provides guidance regarding when and how an acquiree that is a business or a non-profit activity can apply pushdown accounting in its separate financial statements. In particular, ASU No. 2014-17 provides an acquired entity with an option to apply pushdown accounting in its separate financial statements upon the occurrence of an event in which an acquirer obtains control of the acquiree. An acquired entity may elect the option to apply pushdown accounting in the reporting period in which the change-in-control event occurs. If, however, pushdown accounting is not applied during that reporting period, an acquired entity will have the option to elect to apply pushdown accounting in a subsequent reporting period to the acquired entity’s most recent change-in-control event. Such an election to apply pushdown accounting in a reporting period after the one in which the change-in-control event occurred should be considered a change in accounting principle, in accordance with ASC Topic 250, Accounting Changes and Error Corrections. Additionally, the ASU provides that an acquired entity should determine whether to elect to apply pushdown accounting for each individual change-in-control event in which an acquirer obtains control of the acquired entity. Notably, if pushdown accounting is applied to an individual change-in-control event, that election is irrevocable. The amendments in this pronouncement were effective on November 18, 2014. Following the effective date, an acquired entity can make an election to apply the guidance to future change-in-control events or to its most recent change-in-control event. The impact of prospective adoption of this pronouncement by the Company was not material to its Consolidated Financial Statements.
3. ACQUISITION ACTIVITIES
The Company completed its acquisition of 1st Portfolio Holding Corporation on July 31, 2015. 1st Portfolio Holding Corporation’s wholly owned subsidiary, 1st Portfolio Wealth Advisors became a wholly owned subsidiary of the Company and wholly owned subsidiary 1st Portfolio Lending Corporation (now WashingtonFirst Mortgage Corporation) became a wholly owned subsidiary of the Bank. Under the terms of the 1st Portfolio Agreement, accredited shareholders of 1st Portfolio Holding Corporation received 916,382 shares of WFBI common stock valued at $17.05 per share.
Table 3.1: Goodwill on 1st Portfolio Acquisition | |||
Amount | |||
($ in thousands) | |||
Consideration paid: | |||
Common shares issued (916,382 shares) | $ | 15,625 | |
Cash paid to shareholders in lieu of fractional shares | 1 | ||
Fair value of options | 149 | ||
15,775 | |||
Assets acquired: | |||
Cash and cash equivalents | 5,732 | ||
Loans held for sale | 32,912 | ||
Premises and equipment | 1,164 | ||
Customer list intangible | 1,447 | ||
Other assets | 1,371 | ||
Total assets | 42,626 | ||
Liabilities assumed: | |||
Borrowings | 27,759 | ||
Other liabilities | 4,272 | ||
Total liabilities | 32,031 | ||
Net assets acquired | 10,595 | ||
Goodwill | $ | 5,180 | |
For income tax purposes, the acquired assets and assumed liabilities are recorded at their carry-over basis with no resulting goodwill. Goodwill at the time of closing of the 1st Portfolio acquisition was allocated between the Mortgage Company and the Wealth Advisors at $3.6 million and $1.6 million respectively. The customer list intangible was attributed to the Wealth Advisors and is being amortized straight line over 15 years.
66
In many cases, the fair values of assets acquired and liabilities assumed were determined by estimating the cash flows expected to result from those assets and liabilities and discounting them at appropriate market rates. The most significant category of assets for which this procedure was used was the acquired loans. The excess of expected cash flows above the fair value of the performing portion of loans will be accreted to interest income over the remaining lives of the loans in accordance with ASC 310-20. Those loans for which specific credit-related deterioration since origination was identified were recorded at fair value, reflecting the present value of the amounts expected to be collected. Income recognition on these loans is based on reasonable expectation about the timing and amount of cash flows to be collected. Acquired loans deemed impaired and considered collateral dependent, with the timing of the sale of loan collateral indeterminate, remain on non-accrual status and have no accretable yield.
The following table presents unaudited pro forma information as if the acquisition had occurred at the beginning of 2014 and includes adjustments for interest income on loans and securities acquired, amortization of intangibles arising from the transaction, depreciations expense on property acquired, and the related income tax effects. The pro forma financial information is not necessarily indicative of results of operations that would have occurred had the transactions been effected on the assumed dates. The following table does not contain comparative information for 2016 since the 1st Portfolio companies were a part of consolidated operations for the full year ended December 31, 2016.
Table 3.2: Proforma Income Statement (Unaudited) | |||||||
For the Year Ended December 31, | |||||||
2015 | 2014 | ||||||
($ in thousands, except per share data) | |||||||
Net Interest Income | $ | 54,354 | $ | 48,367 | |||
Non-Interest income | 18,607 | 13,358 | |||||
Non-Interest Expense | 47,996 | 43,081 | |||||
Net Income - Common | 13,978 | 10,577 | |||||
EPS - basic (1) | $ | 1.32 | $ | 1.14 | |||
EPS - diluted (1) | 1.30 | 1.11 | |||||
(1) EPS has been adjusted for 5% stock dividend | |||||||
4. CASH AND CASH EQUIVALENTS
Federal Reserve regulations require banks to maintain reserve balances with the FRB based principally on the type and amount of their deposits. During 2016 and 2015, the Bank maintained balances at the FRB (in addition to vault cash) to meet the reserve requirements as well as balances to partially compensate for services provided by the FRB. The Bank has an interest bearing account with the FHLB and maintains seven non-interest bearing accounts with domestic correspondents. In addition, the Bank has short term investments in the form of certificates of deposit with FDIC insured banks, classified as interest bearing balances, as of December 31, 2016. All balances are fully insured up to the applicable limits by the FDIC.
The Company maintains deposits with other commercial banks in amounts that may exceed federal deposit insurance coverage. Management regularly evaluates the credit risk associated with these transactions and believes that the Company is not exposed to any significant credit risks on cash and cash equivalents. The Bank is required to maintain certain average reserve balances with the FRB. Those balances include usable vault cash and amounts on deposit with the FRB. The Bank had no compensating balance requirements or required cash reserves with correspondent banks as of December 31, 2016 and December 31, 2015. The Bank maintains interest bearing balances at other banks to help ensure sufficient liquidity and provide additional return compared to overnight Federal Funds.
5. INVESTMENT SECURITIES
The Bank maintains an investment securities portfolio to help ensure sufficient liquidity and provide additional return versus overnight Federal Funds and interest bearing balances. Securities that management has both the positive intent and ability to hold to maturity are classified as “held to maturity” and are recorded at amortized cost. Securities not classified as held to maturity, including equity securities with readily determinable fair values, are classified as “available-for-sale” and recorded at fair value, with unrealized gains and losses excluded from earnings and reported in other comprehensive income, net of income taxes. As of December 31, 2016, and December 31, 2015, all investments were classified as available-for-sale. As of December 31, 2016, and December 31, 2015, the only material component of the balance in accumulated other comprehensive loss on the balance sheet is related to the unrealized gains/losses on available-for-sale investment securities.
67
Table 5.1: Available-for-Sale Investment Securities Summary | |||||||||||||||
As of December 31, 2016 | |||||||||||||||
Amortized Cost | Unrealized Gains | Unrealized Losses | Estimated Fair Value | ||||||||||||
($ in thousands) | |||||||||||||||
U.S. Treasuries | $ | 8,082 | $ | 17 | $ | (21 | ) | $ | 8,078 | ||||||
U.S. Government agencies | 99,153 | 135 | (812 | ) | 98,476 | ||||||||||
Mortgage-backed securities | 69,835 | 49 | (933 | ) | 68,951 | ||||||||||
Collateralized mortgage obligations | 80,306 | 29 | (1,517 | ) | 78,818 | ||||||||||
Taxable state and municipal securities | 11,690 | 18 | (416 | ) | 11,292 | ||||||||||
Tax-exempt state and municipal securities | 15,206 | 4 | (621 | ) | 14,589 | ||||||||||
Total available-for-sale investment securities | $ | 284,272 | $ | 252 | $ | (4,320 | ) | $ | 280,204 | ||||||
As of December 31, 2015 | |||||||||||||||
Amortized Cost | Unrealized Gains | Unrealized Losses | Estimated Fair Value | ||||||||||||
($ in thousands) | |||||||||||||||
U.S. Treasuries | $ | 9,636 | $ | 15 | $ | (33 | ) | $ | 9,618 | ||||||
U.S. Government agencies | 96,177 | 229 | (390 | ) | 96,016 | ||||||||||
Mortgage-backed securities | 59,125 | 161 | (410 | ) | 58,876 | ||||||||||
Collateralized mortgage obligations | 40,787 | 85 | (474 | ) | 40,398 | ||||||||||
Taxable state and municipal securities | 10,405 | 448 | — | 10,853 | |||||||||||
Tax-exempt state and municipal securities | 4,282 | 81 | (11 | ) | 4,352 | ||||||||||
Total available-for-sale investment securities | $ | 220,412 | $ | 1,019 | $ | (1,318 | ) | $ | 220,113 | ||||||
The estimated fair value of securities pledged to secure public funds, securities sold under agreements to repurchase, and for other purposes amounted to $132.9 million and $104.5 million as of December 31, 2016, and December 31, 2015, respectively.
The Bank did not recognize in earnings any other-than-temporary impairment losses on available-for-sale investment securities during the years ended 2016, 2015 and 2014. During the year ended December 31, 2016, the Bank received proceeds of $76.6 million from the sale of securities from its available-for-sale investment portfolio resulting in gross realized gains of $1.4 million and gross realized losses of $52.0 thousand, compared to proceeds of $12.3 million resulting in gross realized gains of $163.0 thousand and gross realized losses of $153.0 thousand during the year ended December 31, 2015.
Table 5.2: Gross Unrealized Loss and Fair Value of Available-for-Sale Securities | |||||||||||||||
As of December 31, 2016 | |||||||||||||||
Unrealized loss position for less than 12 months | Unrealized loss position for more than 12 months | ||||||||||||||
Fair Value | Unrealized Loss | Fair Value | Unrealized Loss | ||||||||||||
($ in thousands) | |||||||||||||||
U.S. Treasuries | $ | 5,061 | $ | (21 | ) | $ | — | $ | — | ||||||
U.S. Government agencies | 60,279 | (812 | ) | — | — | ||||||||||
Mortgage-backed securities | 54,981 | (871 | ) | 1,356 | (62 | ) | |||||||||
Collateralized mortgage obligations | 69,497 | (1,395 | ) | 3,754 | (122 | ) | |||||||||
Taxable state and municipal securities | 7,995 | (416 | ) | — | — | ||||||||||
Tax-exempt state and municipal securities | 13,661 | (621 | ) | — | — | ||||||||||
Total | $ | 211,474 | $ | (4,136 | ) | $ | 5,110 | $ | (184 | ) | |||||
68
As of December 31, 2015 | |||||||||||||||
Unrealized loss position for less than 12 months | Unrealized loss position for more than 12 months | ||||||||||||||
Fair Value | Unrealized Loss | Fair Value | Unrealized Loss | ||||||||||||
($ in thousands) | |||||||||||||||
U.S. Treasuries | $ | 5,101 | $ | (33 | ) | $ | — | $ | — | ||||||
U.S. Government agencies | 59,175 | (382 | ) | 996 | (8 | ) | |||||||||
Mortgage-backed securities | 36,769 | (322 | ) | 2,612 | (88 | ) | |||||||||
Collateralized mortgage obligations | 19,320 | (225 | ) | 10,034 | (249 | ) | |||||||||
Tax-exempt state and municipal securities | 1,245 | (9 | ) | 519 | (2 | ) | |||||||||
Total | $ | 121,610 | $ | (971 | ) | $ | 14,161 | $ | (347 | ) | |||||
As of December 31, 2016, there were $5.1 million, or four positions, of individual securities that had been in a continuous loss position for more than 12 months with a total unrealized loss of $184.0 thousand. As of December 31, 2015, there were $14.2 million, or eleven positions, of individual securities that had been in a continuous loss position for more than 12 months with a total unrealized loss of $347.0 thousand. Management has determined these securities are temporarily impaired at December 31, 2016 for the following reasons:
U.S. Treasuries and Government Agencies. The unrealized losses in this category were caused by interest rate fluctuations. The contractual terms of the investments do not permit the issuer to settle the securities at a price less than the cost basis of each investment. Because the Company does not intend to sell any of the investments and the accounting standard of “more likely than not” has been met for the Company to be required to sell any of these investments before recovery of its amortized cost basis, which may be at maturity, the Company does not consider these investments to be other than temporarily impaired,
Mortgage backed securities and collateralized mortgage obligations. The unrealized losses in this category were primarily the result of interest rate fluctuation. Since the decline in market value is attributable to changes in interest rates and not credit quality, and because the Company does not intend to sell the investments and it is not more likely than not that the Company will be required to sell the investments before recovery of their amortized cost basis, which may be at maturity, the Company does not consider these investments to be other than temporarily impaired.
Tax-exempt state and municipal securities. The unrealized losses in the category were generally the result of changes in market interest rates and interest spread relationships since original purchases. The contractual terms of the investments do not permit the issuer to settle the securities at a price less than the cost basis of each investment. The Company does not intend to sell any of the investments and the accounting standard of “more likely than not” has not been met for the Company to be required to sell any of the investments before recovery of its amortized cost basis, which may be at maturity, therefore the Company does not consider these investments to be other than temporarily impaired.
Table 5.3: Contractual Maturity of Available-For-Sale Securities | |||||||||||||||
As of December 31, | |||||||||||||||
2016 | 2015 | ||||||||||||||
Amortized Cost | Fair Value | Amortized Cost | Fair Value | ||||||||||||
($ in thousands) | |||||||||||||||
Due within one year | $ | 6,856 | $ | 6,876 | $ | 4,606 | $ | 4,624 | |||||||
Due after one year through five years | 100,102 | 99,693 | 99,447 | 99,685 | |||||||||||
Due after five years through ten years | 45,828 | 44,419 | 38,697 | 38,611 | |||||||||||
Due after ten years | 131,486 | 129,216 | 77,662 | 77,193 | |||||||||||
Total | $ | 284,272 | $ | 280,204 | $ | 220,412 | $ | 220,113 | |||||||
In the table above, mortgage-backed securities and collateralized mortgage obligations are included based on their final maturities, although the actual maturities may differ due to prepayments of the underlying assets or mortgages.
69
6. LOANS HELD FOR INVESTMENT
The Bank and Mortgage Company make several types of loans to its customers including real estate loans (which vary in type between construction and development, commercial, and residential), commercial and industrial loans, and consumer loans. A significant portion of the Bank’s loan portfolio is secured by commercial real estate collateral in the greater Washington, D.C. metropolitan area. Real estate collateral in each case provides an alternate source of repayment in the event of default by the borrower. Under guidance adopted by the federal banking regulators, banks with concentrations in construction, land development or commercial real estate loans (other than loans for majority owner occupied properties) would be expected to maintain higher levels of risk management and, potentially, higher levels of capital.
Table 6.1: Composition of Loans Held for Investment | |||||||
As of December 31, | |||||||
2016 | 2015 | ||||||
($ in thousands) | |||||||
Construction and development | $ | 288,193 | $ | 249,433 | |||
Commercial real estate - owner occupied | 231,414 | 232,572 | |||||
Commercial real estate - non-owner occupied | 557,846 | 424,538 | |||||
Residential real estate | 287,250 | 241,395 | |||||
Real estate loans | 1,364,703 | 1,147,938 | |||||
Commercial and industrial | 165,172 | 153,860 | |||||
Consumer | 4,668 | 6,285 | |||||
Total loans held for investment | 1,534,543 | 1,308,083 | |||||
Less: allowance for loan losses | 13,582 | 12,289 | |||||
Total loans held for investment, net of allowance | $ | 1,520,961 | $ | 1,295,794 | |||
Loans that are 90+ days past due and still accruing are only loans that are well secured and in the process of collection.
Table 6.2: Loans Held for Investment Aging Analysis | |||||||||||||||||||||||||||
As of December 31, 2016 | |||||||||||||||||||||||||||
Current Loans (1) | 30-59 Days Past Due | 60-89 Days Past Due | 90+ Days Past Due (and accruing) | Non- Accrual | Total Past Due | Total Loans | |||||||||||||||||||||
($ in thousands) | |||||||||||||||||||||||||||
Construction and development | $ | 288,035 | $ | 158 | $ | — | $ | — | $ | — | $ | 158 | $ | 288,193 | |||||||||||||
Commercial real estate - owner occupied | 226,735 | 1,837 | 277 | — | 2,565 | 4,679 | 231,414 | ||||||||||||||||||||
Commercial real estate - non-owner occupied | 555,657 | 2,189 | — | — | — | 2,189 | 557,846 | ||||||||||||||||||||
Residential real estate | 285,035 | 630 | — | — | 1,585 | 2,215 | 287,250 | ||||||||||||||||||||
Commercial and industrial | 162,904 | 685 | — | — | 1,583 | 2,268 | 165,172 | ||||||||||||||||||||
Consumer | 4,653 | — | — | 2 | 13 | 15 | 4,668 | ||||||||||||||||||||
Balance at end of period | $ | 1,523,019 | $ | 5,499 | $ | 277 | $ | 2 | $ | 5,746 | $ | 11,524 | $ | 1,534,543 | |||||||||||||
70
As of December 31, 2015 | |||||||||||||||||||||||||||
Current Loans (1) | 30-59 Days Past Due | 60-89 Days Past Due | 90+ Days Past Due (and accruing) | Non- Accrual | Total Past Due | Total Loans | |||||||||||||||||||||
($ in thousands) | |||||||||||||||||||||||||||
Construction and development | $ | 249,312 | $ | — | $ | — | $ | — | $ | 121 | $ | 121 | $ | 249,433 | |||||||||||||
Commercial real estate - owner occupied | 229,021 | 121 | — | — | 3,430 | 3,551 | 232,572 | ||||||||||||||||||||
Commercial real estate - non-owner occupied | 420,164 | 2,345 | — | — | 2,029 | 4,374 | 424,538 | ||||||||||||||||||||
Residential real estate | 238,831 | 1,044 | — | — | 1,520 | 2,564 | 241,395 | ||||||||||||||||||||
Commercial and industrial | 149,703 | 411 | 617 | 28 | 3,101 | 4,157 | 153,860 | ||||||||||||||||||||
Consumer | 6,284 | 1 | — | — | — | 1 | 6,285 | ||||||||||||||||||||
Balance at end of period | $ | 1,293,315 | $ | 3,922 | $ | 617 | $ | 28 | $ | 10,201 | $ | 14,768 | $ | 1,308,083 | |||||||||||||
(1) For the purpose of this table, loans 1-29 days past due are included in the balance of current loans. | |||||||||||||||||||||||||||
As of December 31, 2016, $732.7 million of loans were pledged as collateral for FHLB advances, compared to $636.2 million as of December 31, 2015. Loans pledged include qualifying home equity lines of credit, commercial real estate loans, multifamily real estate loans, and residential real estate secured loans. As of December 31, 2016, and December 31, 2015, there were $1.5 million and $1.6 million of net unamortized deferred fees, respectively.
The Company divides its loans held for investment into the following categories based on credit quality.
The characteristics of these ratings are as follows:
• | Pass and pass watch rated loans (risk ratings 1 to 6) are to borrowers with an acceptable financial condition, specified collateral margins, specified cash flow to service the existing loans, and a specified leverage ratio. The borrower has paid all obligations as agreed and it is expected that the borrower will maintain this type of payment history. Acceptable personal guarantors routinely support these loans. |
• | Special mention loans (risk rating 7) have a specifically defined weakness in the borrower’s operations and/or the borrower’s ability to generate positive cash flow on a sustained basis. For example, the borrower’s recent payment history may be characterized by late payments. The Company’s risk exposure to special mention loans is partially mitigated by collateral supporting the loan; however, loans in this category have collateral that is considered to be degraded. |
• | Substandard loans (risk rating 8) are considered to have specific and well-defined weaknesses that jeopardize the repayment terms as originally structured in the Company’s initial credit extension. The payment history for the loan may have been inconsistent and the expected or projected primary repayment source may be inadequate to service the loan, or the estimated net liquidation value of the collateral pledged and/or ability of the personal guarantors to pay the loan may not adequately protect the Company. For loans in this category, there is a distinct possibility that the Company will sustain some loss if the deficiencies associated with the loan are not corrected in the near term. A substandard loan would not automatically meet the Company’s definition of an impaired loan unless the loan is significantly past due and the borrower’s performance and financial condition provide evidence that it is probable the Company will be unable to collect all amounts due. Substandard non-accrual loans have the same characteristics as substandard loans. However these loans have a non-accrual classification generally because the borrower’s principal or interest payments are 90 days or more past due. |
• | Doubtful rated loans (risk rating 9) have all the weakness inherent in a loan that is classified as substandard but with the added characteristic that the weakness makes collection or liquidation in full highly questionable and improbable based upon current existing facts, conditions, and values. The possibility of loss related to doubtful rated loans is extremely high. |
• | Loss (risk rating 10) rated loans are not considered collectible under normal circumstances and there is no realistic expectation for any future payment on the loan. Loss rated loans are fully charged off. |
Internal risk ratings of pass (rating numbers 1 to 5), pass watch (rating number 6), and special mention (rating number 7) are deemed to be unclassified assets. Internal risk ratings of substandard (rating number 8), doubtful (rating number 9) and loss (rating number 10) are deemed to be classified assets.
71
Table 6.3: Risk Categories of Loans Held for Investment | ||||||||||||||||||||||||
As of December 31, 2016 | ||||||||||||||||||||||||
Internal risk rating grades | Pass | Pass Watch | Special Mention | Substandard | Doubtful | Total | ||||||||||||||||||
Risk rating number | 1 to 5 | 6 | 7 | 8 | 9 | |||||||||||||||||||
($ in thousands) | ||||||||||||||||||||||||
Construction and development | $ | 286,959 | $ | 1,234 | $ | — | $ | — | $ | — | $ | 288,193 | ||||||||||||
Commercial real estate - owner occupied | 222,683 | 5,401 | — | 3,330 | — | 231,414 | ||||||||||||||||||
Commercial real estate - non-owner occupied | 551,996 | 3,331 | 2,519 | — | — | 557,846 | ||||||||||||||||||
Residential real estate | 279,953 | 4,737 | 849 | 1,660 | 51 | 287,250 | ||||||||||||||||||
Commercial and industrial | 157,076 | 5,547 | 743 | 1,640 | 166 | 165,172 | ||||||||||||||||||
Consumer | 4,653 | 2 | — | 13 | — | 4,668 | ||||||||||||||||||
Balance at end of period | $ | 1,503,320 | $ | 20,252 | $ | 4,111 | $ | 6,643 | $ | 217 | $ | 1,534,543 | ||||||||||||
As of December 31, 2015 | ||||||||||||||||||||||||
Internal risk rating grades | Pass | Pass Watch | Special Mention | Substandard | Doubtful | Total | ||||||||||||||||||
Risk rating number | 1 to 5 | 6 | 7 | 8 | 9 | |||||||||||||||||||
($ in thousands) | ||||||||||||||||||||||||
Construction and development | $ | 248,011 | $ | 1,301 | $ | — | $ | 121 | $ | — | $ | 249,433 | ||||||||||||
Commercial real estate - owner occupied | 223,884 | 4,339 | — | 4,349 | — | 232,572 | ||||||||||||||||||
Commercial real estate - non-owner occupied | 414,546 | 1,612 | 5,570 | 2,810 | — | 424,538 | ||||||||||||||||||
Residential real estate | 234,957 | 4,447 | 783 | 1,208 | — | 241,395 | ||||||||||||||||||
Commercial and industrial | 144,421 | 3,732 | 1,170 | 4,537 | — | 153,860 | ||||||||||||||||||
Consumer | 5,905 | 380 | — | — | — | 6,285 | ||||||||||||||||||
Balance at end of period | $ | 1,271,724 | $ | 15,811 | $ | 7,523 | $ | 13,025 | $ | — | $ | 1,308,083 | ||||||||||||
A loan may be placed on non-accrual status when the loan is specifically determined to be impaired or when principal or interest is delinquent 90 days or more. The Company closely monitors individual loans, and relationship officers are charged with working with customers to resolve potential credit issues in a timely manner with minimum exposure to the Company. The Company maintains a policy of adding an appropriate amount to the allowance for loan losses to ensure an adequate reserve based on the portfolio composition, specific credit extended by it, general economic conditions and other factors and external circumstances identified during the process of estimating probable losses in its loan portfolio.
Table 6.4: Non-Accrual Loans | |||||||
As of December 31, | |||||||
2016 | 2015 | ||||||
($ in thousands) | |||||||
Construction and development | $ | — | $ | 121 | |||
Commercial real estate - owner occupied | 2,565 | 3,430 | |||||
Commercial real estate - non-owner occupied | — | 2,029 | |||||
Residential real estate | 1,585 | 1,520 | |||||
Commercial and industrial | 1,583 | 3,101 | |||||
Consumer | 13 | — | |||||
Total non-accrual loans | $ | 5,746 | $ | 10,201 | |||
A modification to the contractual terms of a loan that results in granting a concession to a borrower experiencing financial difficulties is considered a TDR. When the Company has granted a concession, as a result of the restructuring, it does not expect to collect all amounts due in a timely manner, including interest accrued at the original contract rate. In making its determination of whether a borrower is experiencing financial difficulties, the Company considers several factors, including whether: (1) the borrower has
72
declared or is in the process of declaring bankruptcy; (2) there is substantial doubt as to whether the borrower will continue to be a going concern; and (3) the borrower can obtain funds from other sources at an effective interest rate at or near a current market interest rate for debt with similar risk characteristics. The Company evaluates TDRs similarly to other impaired loans for purposes of the allowance for loan losses. In some situations a borrower may be experiencing financial distress, but the Company does not provide a concession. These modifications are not considered TDRs. In other cases, the Company might provide a concession, such as a reduction in interest rate, but the borrower is not experiencing financial distress. This could be the case if the Company is matching a competitor’s interest rate. These modifications would also not be considered TDRs. Finally, any renewals at existing terms for borrowers not experiencing financial distress would not be considered TDRs.
Table 6.5: Changes in Troubled Debt Restructurings | |||||||||||||||||||||||||||
Construction and Development | Commercial real estate - owner occupied | Commercial real estate - non-owner occupied | Residential Real Estate | Commercial and Industrial | Consumer | Total | |||||||||||||||||||||
($ in thousands) | |||||||||||||||||||||||||||
Balance as of January 1, 2015 | $ | 241 | $ | 2,584 | $ | 2,035 | $ | 1,796 | $ | 354 | $ | — | $ | 7,010 | |||||||||||||
New TDRs | — | — | — | 547 | 1,675 | 353 | 2,575 | ||||||||||||||||||||
Increases to existing TDRs | — | — | — | 9 | 16 | — | 25 | ||||||||||||||||||||
Charge-offs post modification | — | (128 | ) | — | — | — | — | (128 | ) | ||||||||||||||||||
Sales, principal payments, or other decreases | (212 | ) | (2,456 | ) | (6 | ) | (385 | ) | (96 | ) | — | (3,155 | ) | ||||||||||||||
Balance as of December 31, 2015 | $ | 29 | $ | — | $ | 2,029 | $ | 1,967 | $ | 1,949 | $ | 353 | $ | 6,327 | |||||||||||||
New TDRs | — | — | 742 | 1,788 | 28 | — | 2,558 | ||||||||||||||||||||
Increases to existing TDRs | — | — | — | 8 | — | — | 8 | ||||||||||||||||||||
Charge-offs post modification | (29 | ) | — | (544 | ) | (11 | ) | (576 | ) | — | (1,160 | ) | |||||||||||||||
Sales, principal payments, or other decreases | — | — | (2,227 | ) | (2,679 | ) | (1,294 | ) | (4 | ) | (6,204 | ) | |||||||||||||||
Balance as of December 31, 2016 | $ | — | $ | — | $ | — | $ | 1,073 | $ | 107 | $ | 349 | $ | 1,529 | |||||||||||||
Table 6.6: New Troubled Debt Restructurings Details | |||||||||||||||||||||
For the Year Ended December 31, | |||||||||||||||||||||
2016 | 2015 | ||||||||||||||||||||
Number of Loans | Pre-Modification Outstanding Recorded Balance | Post-Modification Outstanding Recorded Balance | Number of Loans | Pre-Modification Outstanding Recorded Balance | Post-Modification Outstanding Recorded Balance | ||||||||||||||||
($ in thousands) | |||||||||||||||||||||
Construction and development | — | $ | — | $ | — | — | $ | — | $ | — | |||||||||||
Commercial real estate - owner occupied | — | — | — | — | — | — | |||||||||||||||
Commercial real estate - non-owner occupied | 1 | 742 | 742 | — | — | — | |||||||||||||||
Residential real estate | 1 | 1,788 | 1,788 | 5 | 547 | 547 | |||||||||||||||
Commercial and industrial | 1 | 28 | 28 | 5 | 1,839 | 1,675 | |||||||||||||||
Consumer | — | — | — | 1 | 353 | 353 | |||||||||||||||
Total loans | 3 | $ | 2,558 | $ | 2,558 | 11 | $ | 2,739 | $ | 2,575 | |||||||||||
TDRs are reported as impaired loans in the calendar year of their restructuring and are evaluated to determine whether they should be placed on non-accrual status. In subsequent years, a TDR may be returned to accrual status if the borrower satisfies a minimum six-month performance requirement; however, it will remain classified as impaired.
73
Table 6.7: Troubled Debt Restructuring in Default in Past Twelve Months | |||||||||||||||||||||
As of December 31, | |||||||||||||||||||||
2016 | 2015 | ||||||||||||||||||||
Number of Loans | Pre-Modification Outstanding Recorded Balance | Post-Modification Outstanding Recorded Balance | Number of Loans | Pre-Modification Outstanding Recorded Balance | Post-Modification Outstanding Recorded Balance | ||||||||||||||||
($ in thousands) | |||||||||||||||||||||
Construction and development | — | $ | — | $ | — | 1 | $ | 184 | $ | 29 | |||||||||||
Commercial real estate - owner occupied | — | — | — | — | — | — | |||||||||||||||
Commercial real estate - non-owner occupied | — | — | — | 2 | 2,071 | 2,029 | |||||||||||||||
Residential real estate | 1 | 168 | 144 | 1 | 181 | 181 | |||||||||||||||
Commercial and industrial | 1 | 931 | 931 | 3 | 809 | 644 | |||||||||||||||
Consumer | 1 | 350 | 166 | — | — | — | |||||||||||||||
Total loans | 3 | $ | 1,449 | $ | 1,241 | 7 | $ | 3,245 | $ | 2,883 | |||||||||||
The following is an analysis of new loans modified in a troubled debt restructuring by type of concession for the year ended December 31, 2016, and 2015. There were no modifications that involved forgiveness of debt.
Table 6.8: Troubled Debt Restructuring by Type of Concession | |||||||||||||
TDRs Entered into During the Year Ended December 31, | |||||||||||||
2016 | 2015 | ||||||||||||
Number of Loans | Post-Modification Outstanding Recorded Balance | Number of Loans | Post-Modification Outstanding Recorded Balance | ||||||||||
($ in thousands) | |||||||||||||
Extended under forbearance | 3 | $ | 2,558 | — | $ | — | |||||||
Interest rate modification | — | — | 2 | 267 | |||||||||
Maturity or payment extension | — | — | 9 | 2,308 | |||||||||
Total loans | 3 | $ | 2,558 | 11 | $ | 2,575 | |||||||
The outstanding balances in Table 6.1 include acquired impaired loans with a recorded investment of $2.7 million or 0.2% of total loans as of December 31, 2016, compared to $3.5 million or 0.3% of total loans as of December 31, 2015. The contractual principal of these acquired loans was $2.9 million as of December 31, 2016 compared to $3.8 million as of December 31, 2015. For these loans, the allowance for loan losses decreased by $224.0 thousand and $23.0 thousand during the year ended December 31, 2016 and 2015, respectively. The balances do not include future accretable net interest on the acquired impaired loans.
Table 6.9: Accretable Yield of Purchased Credit Impaired Loans | |||||||
For the Year Ended December 31, | |||||||
2016 | 2015 | ||||||
($ in thousands) | |||||||
Accretable yield at beginning of period | $ | 1,208 | $ | 1,484 | |||
Accretion (including cash recoveries) | (229 | ) | (309 | ) | |||
Net reclassifications to accretable from non-accretable | 18 | 107 | |||||
Disposals (including maturities, foreclosures, and charge-offs) | (153 | ) | (74 | ) | |||
Accretable yield at end of period | $ | 844 | $ | 1,208 | |||
74
Table 6.10: Non-Performing Assets | |||||||
As of December 31, | |||||||
2016 | 2015 | ||||||
($ in thousands) | |||||||
Non-accrual loans | $ | 5,746 | $ | 10,201 | |||
90+ days still accruing | 2 | 28 | |||||
Troubled debt restructurings still accruing | 1,361 | 4,269 | |||||
Other real estate owned | 1,428 | — | |||||
Total non-performing assets | $ | 8,537 | $ | 14,498 | |||
As of December 31, 2016, and 2015, there was one loan and one loan, respectively, past due more than 90 days that were still accruing. If interest had been earned on the non-accrual loans, interest income on these loans would have been approximately $0.5 million, $0.4 million and $0.8 million for the year ended December 31, 2016, 2015 and 2014, respectively. The Company has no remaining commitment to fund non-performing loans. As of December 31, 2016, the Company had approximately $531.0 thousand in loans in the process of foreclosure.
7. ALLOWANCE FOR LOAN LOSSES
Table 7.1: Changes in Allowance for Loan Losses | |||||||||||||||||||||||||||
Construction and Development | Commercial Real Estate - Owner Occupied | Commercial Real Estate - Non-Owner Occupied | Residential Real Estate | Commercial and Industrial | Consumer | Total | |||||||||||||||||||||
($ in thousands) | |||||||||||||||||||||||||||
Balance as of January 1, 2014 | $ | 681 | $ | 1,751 | $ | 3,276 | $ | 920 | $ | 1,801 | $ | 105 | $ | 8,534 | |||||||||||||
Provision for loan losses | 447 | 892 | 591 | 518 | 411 | 146 | 3,005 | ||||||||||||||||||||
Charge-offs | (100 | ) | (476 | ) | (462 | ) | (715 | ) | (618 | ) | (232 | ) | (2,603 | ) | |||||||||||||
Recoveries | — | 1 | 101 | 197 | 18 | 4 | 321 | ||||||||||||||||||||
Balance as of December 31, 2014 | $ | 1,028 | $ | 2,168 | $ | 3,506 | $ | 920 | $ | 1,612 | $ | 23 | $ | 9,257 | |||||||||||||
Provision for loan losses | 1,293 | 535 | 53 | 638 | 749 | 282 | 3,550 | ||||||||||||||||||||
Charge-offs | — | (128 | ) | (10 | ) | (143 | ) | (224 | ) | (171 | ) | (676 | ) | ||||||||||||||
Recoveries | — | 1 | — | 117 | 35 | 5 | 158 | ||||||||||||||||||||
Balance as of December 31, 2015 | $ | 2,321 | $ | 2,576 | $ | 3,549 | $ | 1,532 | $ | 2,172 | $ | 139 | $ | 12,289 | |||||||||||||
Provisions for loan losses | 662 | (168 | ) | 1,921 | 241 | 1,168 | 56 | 3,880 | |||||||||||||||||||
Charge-offs | (31 | ) | (299 | ) | (636 | ) | (65 | ) | (1,554 | ) | (171 | ) | (2,756 | ) | |||||||||||||
Recoveries | 2 | 20 | — | 60 | 83 | 4 | 169 | ||||||||||||||||||||
Balance as of December 31, 2016 | $ | 2,954 | $ | 2,129 | $ | 4,834 | $ | 1,768 | $ | 1,869 | $ | 28 | $ | 13,582 | |||||||||||||
75
Table 7.2: Loans Held for Investment and Related Allowance for Loan Losses by Impairment Method and Loan Class | |||||||||||||||||||||||||||
As of December 31, 2016 | |||||||||||||||||||||||||||
Construction and Development | Commercial Real Estate - Owner Occupied | Commercial Real Estate - Non-Owner Occupied | Residential Real Estate | Commercial and Industrial | Consumer | Total | |||||||||||||||||||||
($ in thousands) | |||||||||||||||||||||||||||
Ending Balance: | |||||||||||||||||||||||||||
Evaluated collectively for impairment | $ | 288,193 | $ | 228,131 | $ | 557,846 | $ | 283,013 | $ | 163,157 | $ | 4,653 | $ | 1,524,993 | |||||||||||||
Evaluated individually for impairment | — | 3,283 | — | 4,237 | 2,015 | 15 | 9,550 | ||||||||||||||||||||
$ | 288,193 | $ | 231,414 | $ | 557,846 | $ | 287,250 | $ | 165,172 | $ | 4,668 | $ | 1,534,543 | ||||||||||||||
Allowance for Losses: | |||||||||||||||||||||||||||
Evaluated collectively for impairment | $ | 2,954 | $ | 2,000 | $ | 4,834 | $ | 1,533 | $ | 952 | $ | 15 | $ | 12,288 | |||||||||||||
Evaluated individually for impairment | — | 129 | — | 235 | 917 | 13 | 1,294 | ||||||||||||||||||||
$ | 2,954 | $ | 2,129 | $ | 4,834 | $ | 1,768 | $ | 1,869 | $ | 28 | $ | 13,582 | ||||||||||||||
As of December 31, 2015 | |||||||||||||||||||||||||||
Construction and Development | Commercial Real Estate - Owner Occupied | Commercial Real Estate - Non-Owner Occupied | Residential Real Estate | Commercial and Industrial | Consumer | Total | |||||||||||||||||||||
($ in thousands) | |||||||||||||||||||||||||||
Ending Balance: | |||||||||||||||||||||||||||
Evaluated collectively for impairment | $ | 249,312 | $ | 228,224 | $ | 415,393 | $ | 235,885 | $ | 145,217 | $ | 5,932 | $ | 1,279,963 | |||||||||||||
Evaluated individually for impairment | 121 | 3,429 | 2,029 | 3,488 | 5,050 | 353 | 14,470 | ||||||||||||||||||||
Evaluated individually for impairment but not deemed to be impaired | — | 919 | 7,116 | 2,022 | 3,593 | — | 13,650 | ||||||||||||||||||||
$ | 249,433 | $ | 232,572 | $ | 424,538 | $ | 241,395 | $ | 153,860 | $ | 6,285 | $ | 1,308,083 | ||||||||||||||
Allowance for Losses: | |||||||||||||||||||||||||||
Evaluated collectively for impairment | $ | 2,291 | $ | 1,794 | $ | 3,196 | $ | 1,181 | $ | 787 | $ | 20 | $ | 9,269 | |||||||||||||
Evaluated individually for impairment | 30 | 782 | 190 | 170 | 1,209 | 119 | 2,500 | ||||||||||||||||||||
Evaluated individually for impairment but not deemed to be impaired | — | — | 163 | 181 | 176 | — | 520 | ||||||||||||||||||||
$ | 2,321 | $ | 2,576 | $ | 3,549 | $ | 1,532 | $ | 2,172 | $ | 139 | $ | 12,289 | ||||||||||||||
76
Table 7.3: Specific Allocation for Impaired Loans | |||||||||||||||||||||||
As of December 31, | |||||||||||||||||||||||
2016 | 2015 | ||||||||||||||||||||||
Unpaid Principal Balance | Recorded Investment | Related Allowance | Unpaid Principal Balance | Recorded Investment | Related Allowance | ||||||||||||||||||
($ in thousands) | |||||||||||||||||||||||
With no related allowance: | |||||||||||||||||||||||
Construction and development | $ | — | $ | — | $ | — | $ | — | $ | — | $ | — | |||||||||||
Commercial real estate - owner occupied | 3,239 | 3,154 | — | 317 | 278 | — | |||||||||||||||||
Commercial real estate - non-owner occupied | — | — | — | — | — | — | |||||||||||||||||
Residential real estate | 1,972 | 1,845 | — | 2,397 | 2,297 | — | |||||||||||||||||
Commercial and industrial | 213 | 204 | — | 407 | 313 | — | |||||||||||||||||
Consumer | — | — | — | — | — | — | |||||||||||||||||
Total with no related allowance | 5,424 | 5,203 | — | 3,121 | 2,888 | — | |||||||||||||||||
With an allowance recorded: | |||||||||||||||||||||||
Construction and development | — | — | — | 291 | 121 | 30 | |||||||||||||||||
Commercial real estate - owner occupied | 130 | 129 | 129 | 3,242 | 3,151 | 782 | |||||||||||||||||
Commercial real estate - non-owner occupied | — | — | — | 2,071 | 2,029 | 190 | |||||||||||||||||
Residential real estate | 2,409 | 2,392 | 235 | 1,205 | 1,191 | 170 | |||||||||||||||||
Commercial and industrial | 2,140 | 1,811 | 917 | 5,146 | 4,737 | 1,209 | |||||||||||||||||
Consumer | 16 | 15 | 13 | 353 | 353 | 119 | |||||||||||||||||
Total with an allowance recorded | 4,695 | 4,347 | 1,294 | 12,308 | 11,582 | 2,500 | |||||||||||||||||
Total impaired loans | $ | 10,119 | $ | 9,550 | $ | 1,294 | $ | 15,429 | $ | 14,470 | $ | 2,500 | |||||||||||
Table 7.4: Average Impaired Loan Balance | |||||||||||||||||||||||
For the Year Ended December 31, | |||||||||||||||||||||||
2016 | 2015 | 2014 | |||||||||||||||||||||
Average Recorded Investment | Interest Income Recognized | Average Recorded Investment | Interest Income Recognized | Average Recorded Investment | Interest Income Recognized | ||||||||||||||||||
($ in thousands) | |||||||||||||||||||||||
With no related allowance: | |||||||||||||||||||||||
Construction and development | $ | 122 | $ | — | $ | 31 | $ | 1 | $ | — | $ | — | |||||||||||
Commercial real estate - owner occupied | 3,407 | — | 2,578 | 197 | 4,199 | 425 | |||||||||||||||||
Commercial real estate - non-owner occupied | 3,047 | — | 3,879 | 184 | 1,812 | 143 | |||||||||||||||||
Residential real estate | 4,608 | 31 | 2,436 | 57 | 1,596 | 101 | |||||||||||||||||
Commercial and industrial | 4,435 | 18 | 590 | 16 | 3,874 | 169 | |||||||||||||||||
Consumer | — | — | 240 | 17 | 121 | 5 | |||||||||||||||||
Total with no related allowance | 15,619 | 49 | 9,754 | 472 | 11,602 | 843 | |||||||||||||||||
With an allowance recorded: | |||||||||||||||||||||||
Construction and development | — | — | 307 | — | 254 | — | |||||||||||||||||
Commercial real estate - owner occupied | — | — | 4,236 | 50 | 6,856 | 242 | |||||||||||||||||
Commercial real estate - non-owner occupied | — | — | 4,591 | 128 | 10,318 | 417 | |||||||||||||||||
Residential real estate | 1,303 | 50 | 2,961 | 133 | 2,347 | 70 | |||||||||||||||||
Commercial and industrial | 2,048 | 4 | 6,583 | 244 | 5,237 | 263 | |||||||||||||||||
Consumer | 13 | — | 81 | 7 | 7 | 2 | |||||||||||||||||
Total with an allowance recorded | 3,364 | 54 | 18,759 | 562 | 25,019 | 994 | |||||||||||||||||
Total average impaired loans | $ | 18,983 | $ | 103 | $ | 28,513 | $ | 1,034 | $ | 36,621 | $ | 1,837 | |||||||||||
77
8. PREMISES AND EQUIPMENT, NET
Table 8.1: Premises and Equipment | |||||||
As of December 31, | |||||||
2016 | 2015 | ||||||
($ in thousands) | |||||||
Furniture and equipment | $ | 5,737 | $ | 5,451 | |||
Leasehold improvements | 8,069 | 7,381 | |||||
Gross premises and equipment | 13,806 | 12,832 | |||||
Less: accumulated depreciation | (6,851 | ) | (5,458 | ) | |||
Premises and equipment, net | $ | 6,955 | $ | 7,374 | |||
Depreciation and amortization expense included in premises and equipment expenses for the years ended December 31, 2016, 2015 and 2014 was $1.6 million, $1.3 million, and $1.2 million, respectively.
The Bank leases all of its offices and branch facilities under non-cancelable operating lease arrangements. Certain leases contain options, which enable the Bank to renew the leases for additional periods. In addition to minimum rentals, the leases have escalation clauses based upon price indices and include provisions for additional payments to cover real estate taxes and common area maintenance. Rent expense associated with these operating leases for the years ended December 31, 2016, 2015 and 2014 totaled $4.6 million, $3.8 million and $3.3 million, respectively.
Table 8.2: Future Minimum Lease Payment Under Non-Cancelable Lease | |||
As of December 31, 2016 | |||
($ in thousands) | |||
2017 | $ | 4,746 | |
2018 | 4,657 | ||
2019 | 4,022 | ||
2020 | 3,860 | ||
2021 | 3,738 | ||
Thereafter | 7,340 | ||
Total | $ | 28,363 | |
9. OTHER REAL ESTATE OWNED
OREO activity for the twelve months ended December 31, 2016, 2015, and 2014 is presented in the tables below.
Table 9.1: Changes in OREO | |||||||||||
For the Year Ended December 31, | |||||||||||
2016 | 2015 | 2014 | |||||||||
($ in thousands) | |||||||||||
Balance at beginning of period | $ | — | $ | 361 | $ | 1,463 | |||||
Properties acquired at foreclosure | 2,255 | 90 | 360 | ||||||||
Sales of foreclosed properties | (668 | ) | (451 | ) | (1,130 | ) | |||||
Write-downs | (159 | ) | — | (332 | ) | ||||||
Balance at end of period | $ | 1,428 | $ | — | $ | 361 | |||||
78
Table 9.2: OREO Expense | |||||||||||
For the Year Ended December 31, | |||||||||||
2016 | 2015 | 2014 | |||||||||
($ in thousands) | |||||||||||
Write-downs | $ | 159 | $ | — | $ | 332 | |||||
Operating expenses | 160 | 21 | 59 | ||||||||
Rental income | (55 | ) | — | — | |||||||
Net OREO expense | $ | 264 | $ | 21 | $ | 391 | |||||
10. GOODWILL AND IDENTIFIABLE INTANGIBLE ASSETS
The Company recognized approximately $2.6 million of goodwill as a part of the Millennium Transaction in 2014 and approximately $5.2 million of goodwill as part of the 1st Portfolio Acquisition in 2015. The remaining $3.6 million of goodwill on the balance sheet as of December 31, 2016, arose from multiple community banking acquisition activities in years prior.
In connection with the Millennium Transaction in 2014, the Company recorded a $470 thousand core deposit intangible, which is presented in the identifiable intangibles line item on the consolidated balance sheet. These are being amortized straight-line over a five year or eight year period, depending on the nature of the deposits underlying the intangible. Core deposit intangibles arise when an acquired bank or branch has a stable deposit base comprised of funds associated with long-term customer relationships. The intangible asset value derives from customer relationships that provide a low-cost source of funding. The Bank’s core deposit intangibles arising from acquisitions are amortized over a five year period for non-interest bearing deposits and interest-bearing NOW accounts. Conversely, core deposit intangibles arising from savings accounts are being amortized over an eight year period.
As a part of the 1st Portfolio Acquisition that closed on July 31, 2015, the Company recognized $5.2 million of goodwill and a client list intangible asset of $1.4 million. The client list is being amortized over a 15 year term beginning in August 2015. See Note 3 for further details on the 1st Portfolio Acquisition.
There was no impairment of goodwill or identifiable intangible assets during the periods ended December 31, 2016, or December 31, 2015.
Table 10: Goodwill and Identifiable Intangibles | |||||||||||
For the Year Ended December 31, | |||||||||||
2016 | 2015 | 2014 | |||||||||
($ in thousands) | |||||||||||
Goodwill: | |||||||||||
Balance, beginning of period | $ | 11,431 | $ | 6,240 | $ | 3,601 | |||||
Goodwill additions/(reductions) | (11 | ) | 5,191 | 2,639 | |||||||
Balance, end of period | $ | 11,420 | $ | 11,431 | $ | 6,240 | |||||
Identifiable intangibles: | |||||||||||
Core deposit intangible balance, beginning of period | $ | 481 | $ | 654 | $ | 342 | |||||
Addition of core deposit intangibles | — | — | 470 | ||||||||
Amortization of core deposit intangibles | (172 | ) | (173 | ) | (158 | ) | |||||
Core deposit intangible balance, net, end of period | $ | 309 | $ | 481 | $ | 654 | |||||
Client list intangible balance, beginning of period | $ | 1,407 | $ | — | $ | — | |||||
Addition of client list intangibles | — | 1,447 | — | ||||||||
Amortization of client list intangibles | (97 | ) | (40 | ) | — | ||||||
Client list intangible balance, net, end of period | $ | 1,310 | $ | 1,407 | $ | — | |||||
Total intangibles, net | $ | 13,039 | $ | 13,319 | $ | 6,894 | |||||
79
11. DEPOSITS
Table 11.1: Composition of Deposits | |||||||
As of December 31, | |||||||
2016 | 2015 | ||||||
($ in thousands) | |||||||
Demand deposit accounts | $ | 381,887 | $ | 304,425 | |||
NOW accounts | 134,938 | 115,459 | |||||
Money market accounts | 270,794 | 309,940 | |||||
Savings accounts | 209,961 | 163,289 | |||||
Time deposits under $100,000 | 77,279 | 81,771 | |||||
Time deposits $100,000 through $250,000 | 308,816 | 242,683 | |||||
Time deposits over $250,000 | 139,066 | 115,675 | |||||
Total deposits | $ | 1,522,741 | $ | 1,333,242 | |||
Time deposits include CDARS balances. CDARS deposits are customer deposits that are placed in the CDARS network to maximize the FDIC insurance coverage for clients. CDARS balances were $57.8 million and $44.3 million as of December 31, 2016 and 2015, respectively. The Bank did not have any brokered deposits as of December 31, 2016 or December 31, 2015. As of December 31, 2016 and 2015, approximately $515.5 million and $644.3 million, respectively, in deposits were in excess of FDIC insurance limits.
Table 11.2: Scheduled Maturities of Time Deposits | |||||||
As of December 31, | |||||||
2016 | 2015 | ||||||
($ in thousands) | |||||||
Within 1 Year | $ | 350,854 | $ | 295,442 | |||
1 - 2 years | 111,315 | 75,869 | |||||
2 - 3 years | 36,187 | 32,651 | |||||
3 - 4 years | 19,570 | 21,446 | |||||
4 - 5 years | 6,981 | 14,472 | |||||
5+ years | 254 | 249 | |||||
Total | $ | 525,161 | $ | 440,129 | |||
12. OTHER BORROWINGS
Other borrowings consist of $5.9 million and $6.9 million of customer repurchase agreements as of December 31, 2016 and 2015, respectively. Customer repurchase agreements are overnight and continuous standard commercial banking transactions that involve a Bank customer instead of a wholesale bank or broker. The average rate of these repurchase agreements was 0.05% as of both December 31, 2016, and 2015. As of December 31, 2016, these repurchase agreements were backed by $3.7 million of collateralized mortgage obligations and $2.2 million of mortgage-backed securities, compared to $3.8 million and $3.1 million, respectively, as of 2015. In addition, the Bank maintains $127.0 million in unsecured lines of credit with a variety of correspondent banks. As of December 31, 2016, there were no outstanding balances on these lines of credit. The parent company also maintains a $5.0 million unsecured line of credit with a bank.
13. FEDERAL HOME LOAN BANK ADVANCES
As a member of the FHLB, the Bank has access to numerous borrowing programs with total credit availability established at 25% of total quarter-end assets. FHLB advances are fully collateralized by pledges of certain qualifying real estate secured loans (see Note 4 - Cash and Cash Equivalents). The Bank also maintains a secured line of credit with the FHLB up to 25% of total assets or $500.7
80
million as of December 31, 2016 based on available collateral. As of December 31, 2016, the Bank’s borrowing capacity was $478.0 million of which $232.1 million was outstanding.
Table 13.1: Composition of FHLB Advances | |||||||
As of December 31, | |||||||
2016 | 2015 | ||||||
($ in thousands) | |||||||
FHLB advances | $ | 232,097 | $ | 107,579 | |||
FHLB purchase accounting mark | — | 2,508 | |||||
FHLB total | $ | 232,097 | $ | 110,087 | |||
Weighted average outstanding effective interest rate | 1.12 | % | 1.62 | % | |||
In August 2016, the Bank prepaid a long-term FHLB advance that was entered into during late 2015. This $10.0 million advance had a coupon rate of 1.67% and a final maturity of August 15, 2019 . The cost to terminate the debt instrument was $155.0 thousand.
In late June 2016, the Bank prepaid a long-term FHLB advance that was assumed during the Alliance acquisition which was completed in December of 2012. This $25.0 million advance had a coupon rate of 3.99% but an effective cost of 2.04% after considering the purchase accounting mark on the instrument. The instrument had a final maturity of February 26, 2021. The effective cost (prepayment penalty less release of the purchase accounting mark) to terminate the debt instrument was $1.04 million.
Table 13.2: FHLB Advances Average Balances | |||||||||||
For the Year Ended December 31, | |||||||||||
2016 | 2015 | 2014 | |||||||||
($ in thousands) | |||||||||||
Average FHLB advances during the period | $ | 106,882 | $ | 109,967 | $ | 63,108 | |||||
Average effective interest rate paid during the period | 1.48 | % | 1.48 | % | 1.67 | % | |||||
Maximum month-end balance outstanding | $ | 232,097 | $ | 127,696 | $ | 101,169 | |||||
Table 13.3: Contractual Maturities of FHLB Advances | |||||||
As of December 31, | |||||||
2016 | 2015 | ||||||
($ in thousands) | |||||||
Within one year | $ | 156,000 | $ | 15,000 | |||
1 - 2 years | 7,500 | 7,500 | |||||
2 - 3 years | 9,906 | 7,500 | |||||
3 - 4 years | 15,000 | 25,869 | |||||
4 - 5 years | 6,556 | 15,000 | |||||
5+ years | 37,135 | 36,710 | |||||
Total FHLB advances | $ | 232,097 | $ | 107,579 | |||
81
14. LONG-TERM BORROWINGS
Table 14: Long-term Borrowings Detail | |||||||
As of December 31, | |||||||
2016 | 2015 | ||||||
($ in thousands) | |||||||
Subordinated debt | $ | 25,000 | $ | 25,000 | |||
Less: debt issuance costs | (385 | ) | — | ||||
Trust preferred capital notes | 10,310 | 10,310 | |||||
Trust preferred capital notes purchase accounting mark | (2,287 | ) | (2,426 | ) | |||
Long-term borrowings | $ | 32,638 | $ | 32,884 | |||
In October 2015, the Company issued $25.0 million in Subordinated Debt. As part of the use of proceeds, the Company paid off $2.5 million of existing subordinate debt at the Bank. The Subordinated Debt has a maturity of ten years, is due in full on October 15, 2025, and bears interest at 6.00% per annum, payable quarterly. As of December 31, 2015, there was $483.0 thousand of debt issuance costs carried in other assets.
Under current regulatory guidelines, the Subordinated Debt may constitute no more than 25% of total Tier 1 Capital. Any amount not eligible to be counted as Tier 1 Capital is considered to be Tier 2 Capital. As of December 31, 2016 and December 31, 2015, the entire amount of Subordinated Debt was considered Tier 2 Capital.
On June 30, 2003, Alliance invested $310.0 thousand as common equity into a wholly-owned Delaware statutory business trust (the “Trust”). Simultaneously, the Trust privately issued $10.0 million face amount of thirty-year floating rate trust preferred capital securities (the “Trust Preferred Capital Notes”) in a pooled trust preferred capital securities offering. The Trust used the offering proceeds, plus the equity, to purchase $10.3 million principal amount of Alliance’s floating rate junior subordinated debentures due 2033 (the “Subordinated Debentures”). Both the Trust Preferred Capital Notes and the Subordinated Debentures are callable at any time, without penalty. The interest rate associated with the Trust Preferred Capital Notes is three month LIBOR plus 3.15% subject to quarterly interest rate adjustments. The interest rates as of December 31, 2016 and December 31, 2015 were 4.11% and 3.66%, respectively. The Trust Preferred Capital Notes are guaranteed by the Company on a subordinated basis, and were recorded on the Company’s books at the time of the Alliance acquisition at a discounted amount of $7.5 million, which was the fair value of the instruments at the time of the acquisition. The $2.5 million discount is being expensed monthly over the life of the obligation. Under the indenture governing the Trust Preferred Capital Notes, the Company has the right to defer payments of interest for up to twenty consecutive quarterly periods. As of December 31, 2016, the Company was current on all interest payments.
Under current regulatory guidelines, the Trust Preferred Capital Notes may constitute no more than 25% of total Tier 1 Capital. Any amount not eligible to be counted as Tier 1 Capital is considered to be Tier 2 Capital.
15. SHAREHOLDERS’ EQUITY
In August 2011, the Company elected to participate in the SBLF, and issued 17,796 shares of its Series D Preferred Stock to the United States Treasury for $17.8 million. Under the terms of the SBLF transaction, during the first ten quarters (ended December 31, 2013) in which the Series D Preferred Stock was outstanding, the preferred shares earned dividends at a rate that could fluctuate on a quarterly basis. From the eleventh dividend period (ended March 31, 2014) through the year 4.5 years after the closing of the SBLF transaction, because the Company’s qualified small business lending (“QSBL”) as of December 31, 2013 had increased sufficiently as compared with the QSBL baseline, the annual dividend rate is fixed at a rate of 1%.
In February 2015, the Company redeemed $4.4 million (4,449 shares), or 25% of the initial $17.8 million of the outstanding Series D Preferred Stock issued to the U.S. Treasury under the SBLF Program. The shares were redeemed at their liquidation value of $1,000 per share plus accrued dividends, for a total redemption price of $4.5 million. In October 2015, the Company redeemed the remaining $8.9 million (8,898 shares) or 50% of the initial $17.8 million outstanding of the Series D Preferred Stock. These shares were redeemed at their liquidation value of $1,000 per share plus accrued dividends, for a total redemption price of $8.9 million. As of December 31, 2016 and 2015, there were no shares of Series D Preferred Stock outstanding.
On December 8, 2015, WashingtonFirst completed an underwritten public offering of 1,655,000 shares of its voting common stock, which included 215,000 shares sold pursuant to the underwriters’ exercise of their option to purchase additional shares, at a price of $20.00 per share to the public (“Public Offering”). WashingtonFirst received aggregate proceeds, after deducting the underwriting discount and estimated offering expenses, of approximately $31.1 million. The voting common stock was offered pursuant to a
82
prospectus supplement dated December 3, 2015 filed with the Securities and Exchange Commission as part of the Company’s shelf registration statement on Form S-3 (Registration File No. 333-202318; effective on March 11, 2015).
The Company has warrants outstanding to purchase 63,689 shares of common stock at a share price equal to $10.30. These warrants have been retroactively adjusted to reflect the effect of all stock dividends and expire if not exercised on or before June 15, 2020.
In connection with the 1st Portfolio Acquisition, on July 31, 2015, the Company issued 916,382 shares of the Company’s common stock at a value of $17.05 as merger consideration to former stockholders of 1st Portfolio Holding Corporation. In accordance with the Agreement and Plan of Reorganization (the “Merger Agreement”), 47,895 of these shares were held in escrow until July 31, 2016 as security for the indemnification obligations of the FP Indemnity Security Holders as more particularly described in the Merger Agreement, and to make any payments to the Company as provided in therein. On August 1, 2016, all 47,895 shares held in escrow for indemnification obligations were released to their respective owners as per the agreement.
The Company commenced paying cash dividends in 2014. In the fourth quarter 2016, the Company increased the quarterly cash dividend to seven cents ($0.07) per share, which was paid on January 3, 2017. Although the Company expects to declare and pay quarterly cash dividends in the future, any such dividend would be at the discretion of the Board of Directors of the Company and would be subject to various federal and state regulatory limitations.
On November 22, 2016, the Company declared a five percent (5%) stock dividend on the Company’s outstanding shares of voting and non-voting common stock. The dividend shares were issued on December 28, 2016 to stockholders of record at the close of business on December 13, 2016. The Company paid cash in lieu of fractional shares.
16. SHARE BASED COMPENSATION
The Company maintains the 2010 Equity Compensation Plan (the “2010 Equity Plan”). Pursuant to the terms of the 2010 Equity Plan, all shares of common stock of the Company remaining unissued under the prior plans were canceled, and an identical number of shares of the Company’s common stock were reserved for issuance under the 2010 Equity Plan. The 2010 Equity Plan gives the Personnel/Compensation Committee of the Company the ability to grant Incentive Stock Options, Non-Qualified Stock Options, Stock Appreciation Rights, Restricted Stock, and Stock Awards to employees and non-employee directors.
Under ASC 718, the Company recognizes compensation costs related to share-based payment transactions to be recognized in the financial statements over the period that an employee provides services in exchange for the award. Compensation cost is measured based on the fair value of the equity instrument issued at the date of grant. Option awards are granted with an exercise price equal to the market price at the date of grant. The fair value of each option award is estimated on the date of grant using a closed form option valuation (Black-Scholes) model. Expected volatilities are based on historical volatilities of the Company’s common stock. The Company uses historical data to estimate option exercise and post-vesting termination behavior. The expected term of options granted is based on historical data and represents the period of time that options granted are expected to be outstanding, which takes into account that the options are not transferable. The Company expects that all options granted will vest and become exercisable. The risk-free interest rate for the expected term of the option is based on the U.S. Treasury yield curve in effect at the time of the grant.
For the year ended December 31, 2016, the Company recognized $551.0 thousand in expense, compared to $405.0 thousand and $215.0 thousand in expenses for 2015 and 2014, respectively, related to these awards. The total unrecognized compensation cost related to non-vested share based compensation arrangements granted under the plan as of December 31, 2016 was $1.5 million, compared to $1.4 million and $0.5 million for 2015 and 2014, respectively. The cost is expected to be recognized over a weighted average period of 3.6 years.
Table 16.1: Stock Options | ||||||||||||||||||||
For the Year Ended December 31, | ||||||||||||||||||||
2016 | 2015 (1) | 2014 (1) | ||||||||||||||||||
Stock Options | Weighted-Average Exercise Price | Stock Options | Weighted-Average Exercise Price | Stock Options | Weighted-Average Exercise Price | |||||||||||||||
Outstanding, beginning of year | 663,648 | $ | 11.56 | 575,079 | $ | 10.44 | 670,768 | $ | 10.19 | |||||||||||
Options granted or exchanged | 87,450 | 20.04 | 156,643 | 14.70 | — | — | ||||||||||||||
Exercised | (91,671 | ) | 11.19 | (64,693 | ) | 8.74 | (89,189 | ) | 8.59 | |||||||||||
Canceled or forfeited | (23,217 | ) | 14.72 | (3,381 | ) | 12.41 | (6,500 | ) | 9.75 | |||||||||||
Outstanding, end of period | 636,210 | $ | 12.71 | 663,648 | $ | 11.56 | 575,079 | $ | 10.44 | |||||||||||
Exercisable at end of period | 260,010 | $ | 11.68 | 319,152 | $ | 11.30 | 320,439 | $ | 10.81 | |||||||||||
(1) Adjusted for 5% stock dividend | ||||||||||||||||||||
83
Table 16.2: Fair Value Assumptions for Stock Option Awards | |||||||
For the Year Ended December 31, | |||||||
2016 | 2015 | ||||||
Weighted-average risk-free interest rate | 1.46 | % | 2.20 | % | |||
Expected dividend yield | 1.14 | % | 1.24 | % | |||
Weighted-average expected volatility | 52.45 | % | 59.75 | % | |||
Weighted-average expected life (in years) | 7.0 years | 10.0 years | |||||
Weighted-average fair value of each option granted | $ | 9.55 | $ | 9.94 | |||
Table 16.3: Stock Options Outstanding | |||||||||||||
As of December 31, 2016 | |||||||||||||
Outstanding | Exercisable | ||||||||||||
Range of Exercise Prices | Stock Options | Weighted-Average Remaining Contractual Life | Stock Options | Weighted-Average Remaining Contractual Life | Weighted-Average Exercise Price | ||||||||
$8.00 - $9.99 | 199,939 | 5.2 | 17,618 | 2.9 | $ | 8.27 | |||||||
$10.00 - $10.99 | 99,098 | 5.4 | 66,482 | 5.0 | 10.10 | ||||||||
$11.00 - $11.99 | 97,812 | 0.9 | 97,812 | 0.9 | 11.50 | ||||||||
$13.00 - $13.99 | 56,000 | 0.7 | 51,944 | 0.5 | 13.21 | ||||||||
$14.00 - $14.99 | 6,340 | 2.1 | 4,230 | 2.1 | 14.89 | ||||||||
$15.00 - $15.99 | 78,073 | 7.5 | 19,309 | 6.5 | 15.23 | ||||||||
$18.00 - $21.99 | 98,948 | 9.2 | 2,615 | 8.9 | 19.71 | ||||||||
636,210 | 5.1 | 260,010 | 2.5 | $ | 11.68 | ||||||||
As of December 31, 2016, 2015, and 2014, the intrinsic value of stock options outstanding was $10.2 million, $6.5 million, and $2.2 million, respectively.
Table 16.4: Non-Vested Restricted Stock | ||||||||||||||||||||
For the Year Ended December 31, | ||||||||||||||||||||
2016 | 2015 | 2014 | ||||||||||||||||||
Non-vested Restricted Stock | Weighted-Average Grant Date Fair Value | Non-vested Restricted Stock | Weighted-Average Grant Date Fair Value | Non-vested Restricted Stock | Weighted-Average Grant Date Fair Value | |||||||||||||||
Outstanding, beginning of year | 44,496 | $ | 8.91 | 64,479 | $ | 9.13 | 34,599 | $ | 9.09 | |||||||||||
Granted | — | — | 1,260 | 19.71 | 42,173 | 13.63 | ||||||||||||||
Canceled | (1,199 | ) | 13.45 | (2,978 | ) | 13.49 | (3,781 | ) | 8.68 | |||||||||||
Vested and issued | (15,090 | ) | 10.44 | (18,265 | ) | 10.04 | (8,512 | ) | 9.00 | |||||||||||
Outstanding, end of period | 28,207 | $ | 7.90 | 44,496 | $ | 8.91 | 64,479 | $ | 9.13 | |||||||||||
17. COMMITMENTS AND CONTINGENCIES
Credit Extension Commitments
Various commitments to extend credit are made in the normal course of banking business. Letters of credit are also issued for the benefit of customers. These commitments are subject to loan underwriting standards and geographic boundaries consistent with the Company's loans outstanding. Commitments to extend credit are agreements to lend to a customer as long as there is no violation of
84
any condition established in the contract. Commitments generally have fixed expiration dates or other termination clauses and may require payment of a fee. Since some of the commitments are expected to expire without being drawn upon, the total commitment amounts do not necessarily represent future cash requirements.
As of December 31, 2016, the Bank has $15.7 million in fixed rate commitments and $392.2 million in variable rate commitments.
Table 17: Outstanding Commitments to Extend Credit | |||||||
As of December 31, | |||||||
2016 | 2015 | ||||||
($ in thousands) | |||||||
Unused lines of credit as of period ended: | |||||||
Loans held for sale | $ | 2,746 | $ | 3,613 | |||
Commercial | 197,750 | 109,143 | |||||
Commercial real estate | 158,972 | 145,022 | |||||
Residential real estate | 727 | 772 | |||||
Home equity | 45,782 | 42,036 | |||||
Personal lines of credit | 1,940 | 2,799 | |||||
Total outstanding commitments to extend credit | $ | 407,917 | $ | 303,385 | |||
Litigation
In the ordinary course of business, the Company has various outstanding commitments and contingent liabilities that are not reflected in the accompanying financial statements. In each pending matter, the Company contests liability or the amount of claimed damages. In view of the inherent difficulty of predicting the outcome of such matters, particularly in cases where claimants seek substantial or indeterminate damages, or where investigation or discovery have yet to be completed, the Company is unable to reasonably estimate a range of possible losses on its remaining outstanding legal proceedings; however, in the opinion of management and after consultation with legal counsel, the Company believes that the ultimate disposition of these matters is not expected to have a material adverse effect on the financial condition of the Company.
Investment in Affordable Housing Project
The Bank has committed $1.0 million to VCDC, a non-profit organization that seeks to gather capital from investors to build and operate low income housing programs. The Bank’s commitment is split evenly between two funds: the Housing Equity Fund of Virginia XVII, L.L.C (“Fund XVII”) and the Housing Equity Fund of Virginia XVIII, L.L.C. (“Fund XVIII”). The expected return on these two funds is in the form of tax credits and tax deductions from operating losses. The principal risk associated with such an investment results from potential noncompliance with the conditions in the tax law to qualify for the tax benefits, which could result in recapture of the tax benefits. As of December 31, 2016, the Bank had disbursed $491 thousand and $111 thousand to Fund XVII and Fund XVIII, respectively, as a result of investor capital calls. The Bank expects to make additional capital investments of $10 thousand by the end of 2017 for Fund XVII and additional capital investments of $390 thousand by the end of 2018 for Fund XVIII. The Bank accounts for the capital already disbursed in Other Assets on the balance sheet, and records related income using the effective interest method.
Representations and Warranties for Mortgage Loans Sold
The Mortgage Company maintains a reserve for the potential repurchase of residential mortgage loans, which amounted to $309 thousand as of December 31, 2016 and $313 thousand as of December 31, 2015. These amounts are included in other liabilities in the accompanying Consolidated Balance Sheets. Changes in the balance of the reserve are a component of other expenses in the accompanying Consolidated Statements of Operations. The reserve is available to absorb losses on the repurchase of loans sold related to document and other fraud, early payment default and early payoff. Through December 31, 2016, no reserve charges have occurred related to fraud.
Other Contractual Arrangements
The Bank is party to a contract dated October 7, 2010, with Fiserv, for core data processing and item processing services integral to the operations of the Bank. Under the terms of the agreement, the Bank may cancel the agreement subject to a substantial cancellation penalty based on the current monthly billing and remaining term of the contract. The initial term of services provided shall end seven years following the date services are first used. Services were first provided beginning May 16, 2011 and will expire on May 15, 2018. The Bank expects to pay Fiserv approximately $2.0 million over the remaining life of the contract.
85
Mortgage Banking Interest Rate Locks
During the normal course of business, the Mortgage Company enters into commitments to originate mortgage loans with end customers whereby the interest rate on the loan is determined prior to funding or closing such a loan in a transaction referred to as an IRLOC. The IRLOC are considered derivatives. The Mortgage Company protects itself from changes in interest rates through the use of best efforts forward delivery commitments. The Mortgage Company commits to sell a loan at the time the borrower commits to an interest rate with the intent that the buyer of the loan has assumed the interest rate risk on the loan. The correlation between the IRLOC and the best efforts contracts is very high due to their similarity and timing of entering into an IRLOC with the customer and the best efforts delivery commitment entered into with the buyer of the loan.
The market values of the IRLOC are not readily ascertainable with precision because the IRLOC is not an actively traded instrument in a stand-alone market. The Mortgage Company determines the fair value of the IRLOC by considering the difference between the wholesale and retail mortgage values and the expected premium for service and release fees offset by direct production costs of the underlying loans. In addition, we apply an estimated pull through rate to the valuation which recognizes the likelihood that some loans that have an IRLOC will not ultimately result in a funded mortgage loan.
The Mortgage Company also originates mortgage loans which are sold to investors on mandatory basis. These loans are hedged via forward sales contracts of MBS. The forward sales contracts of the MBS securities provide a natural hedge against changes in interest rates when mortgage loans are locked with customers. Certain additional risks arise from these forward delivery contracts in that the counterparties to the contract may fail to meet their contractual obligations. The Mortgage Company does not expect the counterparties to fail to meet their respective obligations. If the Mortgage Company fails to close loans required under mandatory delivery requirements, the Mortgage Company could incur additional costs to acquire additional loans to meet the commitment and/or MBS securities to comply with its contractual obligations. These costs could adversely impact the financial performance of the Mortgage Company. The forward sales contracts of MBS securities are recorded at fair value with the changes in fair value recorded in non-interest income.
Since the derivative instruments are not designated as hedging instruments, the fair value of the derivatives are recorded by the Mortgage Company as a freestanding asset or liability with the change in value being recognized in current net income during the period of change. As of December 31, 2016, and December 31, 2015, the Mortgage Company had open forward contracts with a notional value of $36.5 million and $35.0 million, respectively. The open forward delivery contracts are composed of forward sales of MBS. The fair value of these open forward contracts was an asset of $17.1 thousand and a liability of $27.7 thousand as of December 31, 2016 and December 31, 2015, respectively. Certain additional risks arise from these forward delivery contracts in that the counterparties to the contracts may not be able to meet the terms of the contracts. The Mortgage Company does not expect any counterparty to fail to meet its obligation. Additional risks inherent in mandatory delivery programs include the risk that if the Mortgage Company does not close the loans subject to interest rate risk lock commitments, they will be obligated to deliver MBS to the counterparty under the forward sales agreement. Should this be required, the Mortgage Company could incur significant costs in acquiring replacement loans or MBS and such costs could have an adverse effect on mortgage banking operations in future periods.
IRLCs totaled $29.6 million and $35.4 million (notional amount) as of December 31, 2016, and December 31, 2015, respectively. Fair values of these best efforts commitments were $0.2 million and $0.1 million as of December 31, 2016, and December 31, 2015, respectively.
Loans Held for Sale Loss Contingencies
The Mortgage Company makes representations and warranties that loans sold to investors meet its program’s guidelines and that the information provided by the borrowers is accurate and complete. In the event of a default on a loan sold, the investor may make a claim for losses due to document deficiencies, program compliance, early payment default, and fraud or borrower misrepresentations. The Mortgage Company maintains a reserve in other liabilities for potential losses on mortgage loans sold. Management performs a quarterly analysis to determine the adequacy of the reserve. As of December 31, 2016, and December 31, 2015, the balance in this reserve totaled $0.3 million and $0.3 million, respectively.
18. RELATED PARTY TRANSACTIONS
The aggregate amount of loans outstanding to employees, officers, directors, and to companies in which the Company’s directors were principal owners, amounted to $23.5 million, or 1.5% of total loans, and $23.7 million, or 1.8% of total loans, as of December 31, 2016 and December 31, 2015, respectively. For the year ended December 31, 2016, principal advances to related parties totaled $5.5 million and principal repayments and other reductions totaled $6.0 million.
Total deposit accounts with related parties totaled $29.9 million and $26.7 million as of December 31, 2016 and December 31, 2015, respectively.
86
19. INCOME TAXES
The Company and its subsidiaries are subject to U.S. federal income tax and state income tax in those jurisdictions where they operate. The Bank is not subject to state income tax in its primary place of business (Virginia), rather it is subject to Virgina franchise tax. The Company is no longer subject to examination by Federal or State taxing authorities for the years before December 31, 2013. As of December 31, 2016 and December 31, 2015 the Company did not have any unrecognized tax benefits. The Company does not expect the amount of any unrecognized tax benefits to significantly increase in the next twelve months. The Company recognizes interest related to income tax matters as interest expense and penalties related to income tax matters as other non-interest expense. As of December 31, 2016 and December 31, 2015, the Company does not have any amounts accrued for interest and/or penalties.
Table 19.1: Components of Income Tax Expense | |||||||||||
For the Year Ended December 31, | |||||||||||
2016 | 2015 | 2014 | |||||||||
($ in thousands) | |||||||||||
Current: | |||||||||||
Federal | $ | 8,707 | $ | 6,519 | $ | 2,903 | |||||
State | 869 | 488 | 249 | ||||||||
Total current tax expense (benefit) | $ | 9,576 | $ | 7,007 | $ | 3,152 | |||||
Deferred: | |||||||||||
Federal | $ | 881 | $ | (525 | ) | $ | 1,142 | ||||
State | (326 | ) | (13 | ) | 59 | ||||||
Total deferred tax expense (benefit) | $ | 555 | $ | (538 | ) | $ | 1,201 | ||||
Total income tax expense (benefit) | $ | 10,131 | $ | 6,469 | $ | 4,353 | |||||
Table 19.2: Components of Income Tax Expense (Benefit) | |||||||||||
For the Year Ended December 31, | |||||||||||
2016 | 2015 | 2014 | |||||||||
($ in thousands) | |||||||||||
Current tax expense (benefit) | $ | 9,576 | $ | 7,007 | $ | 3,152 | |||||
Deferred tax expense (benefit) | 555 | (538 | ) | 1,201 | |||||||
Tax expense (benefit) recorded in OCI | (1,383 | ) | (351 | ) | 1,061 | ||||||
Total income tax expense/(benefit) | $ | 8,748 | $ | 6,118 | $ | 5,414 | |||||
87
Table 19.3: Reconciliation of Income Tax Expense at Statutory Tax Rate to Actual Tax Expense | |||||||||||
For the Year Ended December 31, | |||||||||||
2016 | 2015 | 2014 | |||||||||
($ in thousands) | |||||||||||
Tax expense at statutory rate | $ | 9,848 | $ | 6,553 | $ | 4,684 | |||||
Increase (decrease) due to: | |||||||||||
State income tax, net of federal tax benefit | 353 | 305 | 97 | ||||||||
Deferred income tax expense rate change | 35 | (211 | ) | — | |||||||
Earnings on bank-owned life insurance | (126 | ) | (131 | ) | (124 | ) | |||||
Tax-exempt interest, net | (35 | ) | (26 | ) | (35 | ) | |||||
Tax credits | (90 | ) | — | — | |||||||
Nondeductible expenses | 89 | 20 | 16 | ||||||||
Stock option expense | 135 | 56 | 29 | ||||||||
Change in valuation allowance | (264 | ) | 64 | (432 | ) | ||||||
Other | 186 | (161 | ) | 118 | |||||||
Income tax expense | $ | 10,131 | $ | 6,469 | $ | 4,353 | |||||
Statutory tax rate | 35.0 | % | 35.0 | % | 34.0 | % | |||||
Effective tax rate | 36.0 | % | 34.5 | % | 31.6 | % | |||||
Table 19.4: Components of Deferred Tax Assets and Liabilities | |||||||
As of December 31, | |||||||
2016 | 2015 | ||||||
($ in thousands) | |||||||
Deferred tax assets: | |||||||
Net operating loss carry forwards | $ | 2,120 | $ | 2,987 | |||
Tax credit carry forwards | 251 | 251 | |||||
Unrealized losses on available-for-sale securities | 1,492 | 110 | |||||
Bad debts | 5,018 | 4,507 | |||||
Other real estate owned | 59 | — | |||||
Acquisition fair value adjustments | — | 435 | |||||
Nonaccrual loan interest | 321 | 651 | |||||
Compensation related | 1,614 | 971 | |||||
Deferred rent | 940 | 574 | |||||
Other | 209 | 80 | |||||
Valuation allowance | — | (264 | ) | ||||
Total deferred tax assets | 12,024 | 10,302 | |||||
Deferred tax liabilities: | |||||||
Deferred loan costs | (1,795 | ) | (1,446 | ) | |||
Acquisition fair value adjustments | (517 | ) | — | ||||
Depreciation | (653 | ) | (671 | ) | |||
Intangibles amortization | (115 | ) | (69 | ) | |||
Other | — | — | |||||
Total deferred tax liabilities | (3,080 | ) | (2,186 | ) | |||
Net deferred tax assets | $ | 8,944 | $ | 8,116 | |||
The net operating loss carry forward acquired in conjunction with the First Liberty Bancorp acquisition in 2006 is subject to annual limits under Section 382 of the Internal Revenue Code of $0.3 million and expires in 2025. In conjunction with the acquisition of Alliance in 2012, the net operating loss carry forward is subject to annual limits under Section 382 of the Internal Revenue Code of $0.8 million and begins to expire in 2029.
88
In accordance with ASC Topic 740, the Company may establish a reserve against deferred tax assets in those cases where realization is less than certain, although no such reserves exist at December 31, 2016.
20. REGULATORY MATTERS
The Company and Bank are subject to regulatory capital requirements of federal banking agencies. Failure to meet minimum capital requirements can result in mandatory—and possibly additional discretionary—actions by regulators that could have a direct material effect on the Company’s financial statements. Under capital adequacy guidelines and the regulatory framework for prompt corrective action, the Company must meet specific capital requirements that involve quantitative measures of the Company’s assets, liabilities, and certain off-balance-sheet items as calculated under regulatory accounting practices. The capital amounts and classification are also subject to qualitative judgments by the regulators about components, risk weightings, and other factors.
Quantitative measures established by regulation to ensure capital adequacy require the Company and Bank to maintain minimum amounts and ratios (set forth in the table below) of Total, Common Equity Tier 1 and Tier 1 capital to risk-weighted assets, and of Tier 1 capital to average assets, in each case as those terms are defined in the regulations. To be categorized as well capitalized, the Company must maintain minimum total risk-based, Tier 1 risk-based, and Tier 1 leverage ratios, as set forth in the table below. Additionally, under the final capital rules that became effective on January 1, 2015, there was a requirement for a common equity Tier 1 capital conservation buffer of 2.5% of risk-weighted assets which is in addition to the other minimum risk-based capital standards in the rule. Institutions that do not maintain this required capital buffer will become subject to progressively more stringent limitations on the percentage of earnings that can be paid out in dividends or used for stock repurchases and on the payment of discretionary bonuses to senior executive management. The capital buffer requirement is being phased in over three years beginning in 2016. We have included the 0.625% increase for 2016 in our minimum capital adequacy ratios in the table below. The capital buffer requirement effectively raises the minimum required common equity Tier 1 capital ratio to 7.0%, the Tier 1 capital ratio to 8.5%, and the total capital ratio to 10.5% on a fully phased-in basis on January 1, 2019.
As of December 31, 2016, management believes the Company and Bank satisfied all capital adequacy requirements to which it was subject to and that the Company and Bank were “well capitalized” under the regulatory framework for prompt corrective action. As of December 31, 2016, the Company and Bank would meet all capital adequacy requirements under the Basel III Capital Rules on a fully phased-in basis as if all such requirements were currently in effect. The capital buffer provisions as of December 31, 2016, are presented in the table below as well.
89
Table 20: Capital Amounts, Ratios and Regulatory Requirements Summary | ||||||||||||||||||||||||
Actual | To Be Well Capitalized Under Prompt Corrective Action Provisions | For Minimum Capital Adequacy Purposes | For Minimum Capital Adequacy Purposes with Capital Buffer (1) | |||||||||||||||||||||
Amount | Ratio | Amount | Ratio | Amount | Ratio | Amount | Ratio | |||||||||||||||||
($ in thousands) | ||||||||||||||||||||||||
As of December 31, 2016: | ||||||||||||||||||||||||
Total risk-based capital ratio | ||||||||||||||||||||||||
Consolidated | $ | 228,383 | 13.99 | % | n/a | n/a | $ | 130,612 | >8.0% | $ | 140,816 | >8.625% | ||||||||||||
Bank | 214,512 | 13.15 | % | $ | 163,182 | >10.0% | 130,545 | >8.0% | 140,744 | >8.625% | ||||||||||||||
Tier 1 risk-based capital ratio | ||||||||||||||||||||||||
Consolidated | 189,492 | 11.61 | % | n/a | n/a | 97,959 | >6.0% | 108,163 | >6.625% | |||||||||||||||
Bank | 200,621 | 12.29 | % | 130,545 | >8.0% | 97,909 | >6.0% | 108,108 | >6.625% | |||||||||||||||
Common Equity Tier 1 risk-based capital ratio | ||||||||||||||||||||||||
Consolidated | 182,021 | 11.15 | % | n/a | n/a | 73,469 | >4.5% | 83,673 | >5.125% | |||||||||||||||
Bank | 200,621 | 12.29 | % | 106,068 | >6.5% | 73,432 | >4.5% | 83,631 | >5.125% | |||||||||||||||
Tier 1 leverage ratio | ||||||||||||||||||||||||
Consolidated | 189,492 | 10.14 | % | n/a | n/a | 74,718 | >4.0% | n/a | n/a | |||||||||||||||
Bank | 200,621 | 10.74 | % | 93,373 | >5.0% | 74,699 | >4.0% | n/a | n/a | |||||||||||||||
As of December 31, 2015: | ||||||||||||||||||||||||
Total risk-based capital ratio | ||||||||||||||||||||||||
Consolidated | $ | 209,962 | 14.86 | % | n/a | n/a | $ | 113,022 | >8.0% | n/a | n/a | |||||||||||||
Bank | 193,214 | 13.70 | % | $ | 141,050 | >10.0% | 112,840 | >8.0% | n/a | n/a | ||||||||||||||
Tier 1 risk-based capital ratio | ||||||||||||||||||||||||
Consolidated | 172,673 | 12.22 | % | n/a | n/a | 84,766 | >6.0% | n/a | n/a | |||||||||||||||
Bank | 180,925 | 12.83 | % | 112,840 | >8.0% | 84,630 | >6.0% | n/a | n/a | |||||||||||||||
Common Equity Tier 1 risk-based capital ratio | ||||||||||||||||||||||||
Consolidated | 164,789 | 11.66 | % | n/a | n/a | 63,575 | >4.5% | n/a | n/a | |||||||||||||||
Bank | 180,925 | 12.83 | % | 91,683 | >6.5% | 63,473 | >4.5% | n/a | n/a | |||||||||||||||
Tier 1 leverage ratio | ||||||||||||||||||||||||
Consolidated | 172,673 | 10.67 | % | n/a | n/a | 64,730 | >4.0% | n/a | n/a | |||||||||||||||
Bank | 180,925 | 11.19 | % | 80,808 | >5.0% | 64,646 | >4.0% | n/a | n/a | |||||||||||||||
(1) Capital Buffer is not applicable to Tier 1 leverage ratio or any periods prior to January 1, 2016 | ||||||||||||||||||||||||
90
21. EARNINGS PER SHARE
Basic earnings per common share is computed by dividing net income applicable to common shares by the weighted average number of voting and non-voting restricted common shares outstanding during the period. Diluted earnings per common share is computed by dividing applicable net income by the weighted average number of common shares outstanding plus any dilutive potential common shares and dilutive stock options. It is assumed that all dilutive stock options were exercised at the beginning of each period and that the proceeds were used to purchase shares of the Company’s common stock at the average market price during the period.
The following shows the weighted average number of shares used in computing earnings per share and the effect on weighted average number of shares of diluted potential common stock. Potential dilutive common stock has no effect on income available to common shareholders.
Table 21: Basic and Dilutive Earnings Per Share | |||||||||||
For the Year Ended December 31, | |||||||||||
2016 | 2015 | 2014 | |||||||||
($ in thousands, except for per share amounts) | |||||||||||
Net income | $ | 18,007 | $ | 12,255 | $ | 9,424 | |||||
Less: SBLF dividends | — | (74 | ) | (161 | ) | ||||||
Net income available to common shareholders | $ | 18,007 | $ | 12,181 | $ | 9,263 | |||||
Weighted average number of shares outstanding (2) | 12,854,011 | 10,593,573 | 8,508,958 | ||||||||
Effect of dilutive shares (1) (2) | 254,236 | 187,861 | 198,320 | ||||||||
Diluted weighted average number of shares outstanding (2) | 13,108,247 | 10,781,434 | 8,707,278 | ||||||||
Basic earnings per share (2) | $ | 1.40 | $ | 1.15 | $ | 1.09 | |||||
Diluted earnings per share (2) | $ | 1.37 | $ | 1.13 | $ | 1.06 | |||||
(1) All restricted stock, stock options and warrants were dilutive for the periods presented | |||||||||||
(2) Prior periods adjusted for stock dividend | |||||||||||
22. EMPLOYEE BENEFITS
The Company has a 401(k) Plan designed to qualify under section 401 of the IRS Code of 1986 that allows employees to defer a
portion of their salary compensation as savings for retirement. All full-time employees are eligible to participate after three months of
employment. The Company reserves the right to make an annual discretionary contribution to the account of each eligible employee
based in part on the Company’s profitability for a given year, and on each participant’s yearly earnings up to IRS limitations.
Participants are vested in the Company’s discretionary matching contributions evenly over a 3 year period and are fully vested in
future Company matching contributions after three years of employment. The company incurred expenses of $0.8 million, $0.7 million and $0.5 million for the years ended December 31, 2016, 2015 and 2014, respectively, under the 401(k). The Company also provides a benefit package which includes health, dental and optical insurance, 401K plan, life and long term disability insurance. Additionally, WashingtonFirst maintains a stock-based compensation plan for employees of WashingtonFirst.
In August 2013, the Compensation Committee of the Company approved the terms of a SERP for certain of the Bank’s executive
officers. The intent of the SERP is to provide retirement benefits to selected executives upon retirement or other qualifying separation
from service. In 2014 the Bank entered into separate agreements under the SERP (the “SERP Agreements”) with six of its executive
officers. Generally, the SERP Agreements provide retirement benefits computed as a percentage of the executive’s annual
compensation at a defined retirement age or earlier separation from service, and payable in monthly installments over a specified
period of time. The SERP Agreements are unfunded arrangements maintained primarily to provide supplemental retirement benefits
and comply with Section 409A of the IRS Code. For the year ended December 31, 2016, 2015 and 2014, the Company recorded
benefit expense of $0.4 million, $0.3 million and $0.2 million respectively for this post retirement benefit.
91
23. OTHER OPERATING EXPENSES
Table 23: Consolidated Statement of Operations - Other Operating Expenses Detail | |||||||||||
For the Year Ended December 31, | |||||||||||
2016 | 2015 | 2014 | |||||||||
($ in thousands) | |||||||||||
Other real estate owned expenses | $ | 319 | $ | 21 | $ | 391 | |||||
Business and franchise tax | 1,358 | 1,005 | 824 | ||||||||
Advertising and promotional expenses | 1,070 | 801 | 665 | ||||||||
FDIC premiums | 1,002 | 862 | 866 | ||||||||
Postage, printing and supplies | 216 | 179 | 213 | ||||||||
Directors' fees | 415 | 362 | 289 | ||||||||
Insurance | 224 | 217 | 114 | ||||||||
Amortization of intangibles | 269 | 213 | 158 | ||||||||
Other | 1,327 | 892 | 994 | ||||||||
Other expenses | $ | 6,200 | $ | 4,552 | $ | 4,514 | |||||
24. FAIR VALUE DISCLOSURES
Fair values of financial instruments are estimated using relevant market information and other assumptions, as more fully disclosed separately. Fair value estimates involve uncertainties and matters of significant judgment regarding interest rates, credit risk, prepayments and other factors, especially in the absence of broad markets for particular items. Changes in assumptions or in market conditions could significantly affect the estimates. The fair value estimates of existing on-and off-balance sheet financial instruments do not include the value of anticipated future business or the values of assets and liabilities not considered financial instruments.
Fair value is defined in FASB ASC 820-10 as the exchange price that would be received for an asset or paid to transfer a liability (exit price) in the principal or most advantageous market for the asset or liability in an orderly transaction between market participants on the measurement date. FASB ASC 820-10 also establishes a fair value hierarchy which requires an entity to maximize the use of observable inputs and minimize the use of unobservable inputs when measuring fair value. Transfers between levels of the fair value hierarchy are recognized on the actual dates of the event or circumstances that caused the transfer, which generally coincides with the Corporation’s monthly and or quarterly valuation process. The standard describes three levels of inputs that may be used to measure fair values:
Level 1 | Unadjusted quoted prices in active markets that are accessible at the measurement date for identical, unrestricted assets or liabilities. | ||
Level 2 | Quoted prices in markets that are not active or financial instruments for which all significant inputs are observable, either directly or indirectly. | ||
Level 3 | Prices or valuations that require unobservable inputs that are significant to the fair value measurement. | ||
The following is a description of the fair value techniques used for instruments measured at fair value as well as the general classification of such instruments pursuant to the valuation hierarchy described above. Fair value measurements related to financial instruments that are reported at fair value in the consolidated financial statements each period are referred to as recurring fair value measurements. Fair value measurements related to financial instruments that are not reported at fair value each period but are subject to fair value adjustments in certain circumstances are referred to as non-recurring fair value measurements.
Recurring Fair Value Measurements and Classification
Investment Securities Available for Sale
The fair value of investments in U.S. Treasuries is based on unadjusted quoted prices in active markets. The Company classifies these fair value measurements as Level 1.
For a significant portion of the Company’s investment portfolio, including most asset-backed securities, corporate debt securities, senior agency debt securities, and Government/GSE guaranteed mortgage-backed securities, fair value is determined using a reputable and nationally recognized third party pricing service. The prices obtained are non-binding and generally representative of recent
92
market trades. The Company corroborates its primary valuation source by obtaining a secondary price from another independent third party pricing service. The Company classifies these fair value measurements as Level 2.
For certain investment securities that are thinly traded or not quoted, the Company estimates fair value using internally-developed models that employ a discounted cash flow approach. The Company maximizes the use of observable market data, including prices of financial instruments with similar maturities and characteristics, interest rate yield curves, measures of volatility and prepayment rates. The Company generally considers a market to be thinly traded or not quoted if the following conditions exist: (1) there are few transactions for the financial instruments; (2) the prices in the market are not current; (3) the price quotes vary significantly either over time or among independent pricing services or dealers; or (4) there is a limited availability of public market information. The Company classifies these fair value measurements as Level 3.
Net transfers in and/or out of the different levels within the fair value hierarchy are based on the fair values of the assets and liabilities as of the beginning of the reporting period. There were no transfers within the fair value hierarchy for fair value measurements of the Company's investment securities during the year ended December 31, 2016 or 2015.
Financial Derivatives
The Company relies on a third-party pricing service to value its mortgage banking derivative financial assets and liabilities, which the Company classifies as a Level 3 valuation. The external valuation model to estimate the fair value of its interest rate lock commitments to originate residential mortgage loans held for sale includes grouping the interest rate lock commitments by interest rate and terms, applying an estimated pull-through rate based on historical experience, and then multiplying by quoted investor prices determined to be reasonably applicable to the loan commitment groups based on interest rate, terms, and rate lock expiration dates of the loan commitment groups.
Nonrecurring Fair Value Measurements and Classification
Loans Held for Investment
Certain loans in the Company's loan portfolio are measured at fair value when they are determined to be impaired. Impaired loans are reported at fair value less estimated cost to sell. The fair value of the loan generally is based on the fair value of the underlying property, which is determined by third-party appraisals when available. When third-party appraisals are not available, fair value is estimated based on factors such as prices for comparable properties in similar geographical areas and/or assessment through observation of such properties. The Company classifies these fair values as Level 3 measurements.
Other Real Estate Owned
The Company initially records OREO properties at fair value less estimated costs to sell and subsequently records them at the lower of carrying value or fair value less estimated costs to sell. The fair value of OREO is determined by third-party appraisals when available. When third-party appraisals are not available, fair value is estimated based on factors such as prices for comparable properties in similar geographical areas and/or assessment through observation of such properties.
Fair Value Classification and Transfers
Fair values estimated by management in the absence of readily determinable fair values are classified as Level 3. As of December 31, 2016, the Company's Level 3 assets and liabilities recorded were $10.1 million or approximately 0.5% of total assets and 3.5% of financial instruments measured at fair value. As of December 31, 2015, level 3 assets and liabilities were at $16.6 million or approximately 1.0% of total assets and 7.0% of financial instruments measured at fair value.
The following tables present information about the Company's assets and liabilities measured at fair value on a recurring and nonrecurring basis as of December 31, 2016 and December 31, 2015, respectively, and indicate the fair value hierarchy of the valuation techniques used by the Company to determine such fair value:
93
Table 24.1: Summary of Assets and Liabilities Measured at Fair Value | |||||||||||||||
As of December 31, 2016 | |||||||||||||||
Level 1 | Level 2 | Level 3 | Total | ||||||||||||
($ in thousands) | |||||||||||||||
Recurring: | |||||||||||||||
Assets: | |||||||||||||||
U.S. Treasuries | $ | 8,078 | $ | — | $ | — | $ | 8,078 | |||||||
U.S. Government agencies | — | 98,476 | — | 98,476 | |||||||||||
Mortgage-backed securities | — | 68,951 | — | 68,951 | |||||||||||
Collateralized mortgage obligations | — | 78,818 | — | 78,818 | |||||||||||
Taxable state and municipal securities | — | 11,292 | — | 11,292 | |||||||||||
Tax-exempt state and municipal securities | — | 14,589 | — | 14,589 | |||||||||||
Financial derivatives | — | — | 318 | 318 | |||||||||||
Total recurring assets at fair value | $ | 8,078 | $ | 272,126 | $ | 318 | $ | 280,522 | |||||||
Liabilities: | |||||||||||||||
Financial derivatives | $ | — | $ | — | $ | 105 | $ | 105 | |||||||
Total recurring liabilities at fair value | $ | — | $ | — | $ | 105 | $ | 105 | |||||||
Nonrecurring: | |||||||||||||||
Assets: | |||||||||||||||
Loans held for investment (1) | $ | — | $ | — | $ | 8,256 | $ | 8,256 | |||||||
Other real estate owned | — | — | 1,428 | 1,428 | |||||||||||
Total nonrecurring assets at fair value | $ | — | $ | — | $ | 9,684 | $ | 9,684 | |||||||
As of December 31, 2015 | |||||||||||||||
Level 1 | Level 2 | Level 3 | Total | ||||||||||||
($ in thousands) | |||||||||||||||
Recurring: | |||||||||||||||
Assets: | |||||||||||||||
U.S. Treasuries | $ | 9,618 | $ | — | $ | — | $ | 9,618 | |||||||
U.S. Government agencies | — | 96,016 | — | 96,016 | |||||||||||
Mortgage-backed securities | — | 58,876 | — | 58,876 | |||||||||||
Collateralized mortgage obligations | — | 40,398 | — | 40,398 | |||||||||||
Taxable state and municipal securities | — | 10,853 | — | 10,853 | |||||||||||
Tax-exempt state and municipal securities | — | 4,352 | — | 4,352 | |||||||||||
Financial derivatives | — | — | 93 | 93 | |||||||||||
Total recurring assets at fair value | $ | 9,618 | $ | 210,495 | $ | 93 | $ | 220,206 | |||||||
Liabilities: | |||||||||||||||
Financial derivatives | — | — | 27 | 27 | |||||||||||
Total recurring liabilities at fair value | $ | — | $ | — | $ | 27 | $ | 27 | |||||||
Nonrecurring: | |||||||||||||||
Assets: | |||||||||||||||
Loans held for investment (1) | $ | — | $ | — | $ | 16,521 | $ | 16,521 | |||||||
Other real estate owned | — | — | — | — | |||||||||||
Total nonrecurring assets at fair value | $ | — | $ | — | $ | 16,521 | $ | 16,521 | |||||||
(1) Represents the impaired loans, net of allowance, that have been individually evaluated and reserved for. | |||||||||||||||
94
Table 24.2: Fair Value Inputs, Assets, Quantitative Information | |||||||||
As of December 31, 2016 | |||||||||
Fair Value | Valuation Technique | Unobservable Input | Range (Weighted Average) | ||||||
($ in thousands) | |||||||||
Loans held for investment (1) | $ | 8,256 | Appraisal | Appraisal Adjustments | 0%-43% (6%) | ||||
Cost to Sell | 0%-10% (6%) | ||||||||
Time to Liquidate (Mo.) | 0-12 mo (9 mo.) | ||||||||
Probability of Default | 5%-100% (51%) | ||||||||
Other real estate owned | 1,428 | Appraisal | Appraisal Adjustment | 0%-10% (10%) | |||||
Cost to Sell | 0-5% (5%) | ||||||||
As of December 31, 2015 | |||||||||
Fair Value | Valuation Technique | Unobservable Input | Range (Weighted Average) | ||||||
($ in thousands) | |||||||||
Loans held for investment (1) | $ | 16,521 | Appraisal | Appraisal Adjustments | 0%-43% (12%) | ||||
Cost to Sell | 0%-10% (7%) | ||||||||
Probability of Default | 1%-100% (51%) | ||||||||
Time to Liquidate (Mo.) | 0-12 mo (9 mo.) | ||||||||
(1) Represents the impaired loans, net of allowance, that have been individually evaluated and reserved for. | |||||||||
The recurring Level 3 assets and liabilities are related to the fair value of the interest rate locks recorded by the Mortgage Company (acquired in July 2015). These derivatives represent the fair value of the interest rate locks and forward sales contracts of mortgage backed securities. The fair value utilizes market pricing for the valuation with the unobservable inputs being the estimated pull-through percentages which ranges from 70% to 90%. For more information on these derivatives, see Part II, Note 15 - Commitments and Contingencies. There were no significant transfers in or out of level 3 as of December 31, 2016, and December 31, 2015, respectively.
95
Table 24.3: Estimated Fair Values and Carrying Values for Financial Assets, Liabilities and Commitments | |||||||||||||||
December 31, 2016 | December 31, 2015 | ||||||||||||||
Carrying Amount | Fair Value | Carrying Amount | Fair Value | ||||||||||||
($ in thousands) | |||||||||||||||
Assets: | |||||||||||||||
Cash and cash equivalents | $ | 97,373 | $ | 97,373 | $ | 62,753 | $ | 62,753 | |||||||
Investment securities | 280,204 | 280,204 | 220,113 | 220,113 | |||||||||||
Restricted Stock | 11,726 | 11,726 | 6,128 | 6,128 | |||||||||||
Loans held for sale | 32,109 | 32,985 | 36,494 | 37,389 | |||||||||||
Loans held for investment, net | 1,520,961 | 1,546,652 | 1,295,794 | 1,334,205 | |||||||||||
Bank-owned life insurance | 13,880 | 13,880 | 13,521 | 13,521 | |||||||||||
Derivatives | 318 | 318 | 93 | 93 | |||||||||||
Liabilities: | |||||||||||||||
Time deposits | 525,161 | 525,149 | 440,129 | 440,584 | |||||||||||
Other borrowings | 5,852 | 5,852 | 6,942 | 6,942 | |||||||||||
FHLB advances | 232,097 | 232,264 | 110,087 | 112,994 | |||||||||||
Long-term borrowings | 32,638 | 44,188 | 32,884 | 44,309 | |||||||||||
Derivatives | 105 | 105 | 27 | 27 | |||||||||||
Off-balance sheet instruments | — | — | — | — | |||||||||||
The following methods and assumptions not previously presented were used in estimating the fair value of financial assets and financial liabilities that are not measured and reported at fair value on a recurring basis or non-recurring basis:
Cash and cash equivalents. The carrying amount of cash and cash equivalents approximates fair value.
Restricted Stock. It is not practical to determine the fair value of restricted stock due to the restrictions placed on transferability therefore the carrying amount is assumed to be the fair value.
Loans Held for Sale. Loans held for sale are carried at the lower of cost or fair value. Fair value is derived from secondary market quotations for similar instruments. Gains and losses on sales of these loans are recorded as a component of non-interest income in the consolidated statements of operations. As such, the Company classifies loans subjected to fair value adjustments as Level 2 valuation.
Loans Held for Investment, net (including impaired loans). For certain homogeneous categories of loans, such as some residential mortgages, and other consumer loans, fair value is estimated using the quoted market prices for securities backed by similar loans, adjusted for differences in loan characteristics resulting in a Level 3 classification. The fair value of other types of loans is estimated by discounting the future cash flows using the current rates at which similar loans would be made to borrowers with similar credit ratings and for the same remaining maturities resulting in a Level 3 classification.
Accounting pronouncements require disclosure of the estimated fair value of financial instruments. Fair value is defined in accordance with ASC 820-10 as disclosed above. Given market conditions, a portion of our loan portfolio is not readily marketable and market prices do not exist. We have not attempted to market our loans to potential buyers, if any exist, to determine the fair value of those instruments in accordance with the definition of ASC 820-10. Since negotiated prices in illiquid markets depends upon the then present motivations of the buyer and seller, it is reasonable to assume that actual sales prices could vary widely from any estimate of fair value made without the benefit of negotiations. Additionally, changes in market interest rates can dramatically impact the value of financial instruments in a short period of time. Accordingly, the fair value measurements for loans included in the table above are unlikely to represent the instruments’ liquidation values.
Bank-owned life insurance. The fair value of bank-owned life insurance is based on the cash surrender value provide by the insurance provider, resulting in a Level 3 classification.
Deposits. The fair value of deposits with no stated maturity, such as demand, interest checking and money market, and savings accounts, is equal to the amount payable on demand at year-end, resulting in a Level 1 classification. The fair value of time deposits is based on the discounted value of contractual cash flows using the rates currently offered for deposits of similar remaining maturities thereby resulting in a Level 2 classification.
Other borrowings. The carrying value of other borrowing, which consists of customer repurchase agreements, approximates the fair value as of the reporting date, therefore resulting in a Level 2 classification.
96
FHLB advances. The fair value of FHLB advances is based on the discounted value of future cash flows using interest rates currently being offered for FHLB advances with similar terms and characteristics thereby resulting in a Level 2 classification.
Long-term borrowings. The fair value of long-term borrowing, which consists of subordinated debt and trust preferred securities are based on the discounted value of future cash flows using interest rates currently being offered for FHLB advances with similar terms and characteristics thereby resulting in a Level 2 classification.
Off-balance sheet instruments. The fair value of off-balance-sheet lending commitments is equal to the amount of commitments outstanding. This is based on the fact that the Company generally does not offer lending commitments or standby letters of credit to its customers for long periods, and therefore, the underlying rates of the commitments approximate market rates, resulting in a Level 2 classification.
25. FINANCIAL STATEMENTS (PARENT COMPANY ONLY)
Table 25.1: WashingtonFirst Bankshares, Inc. (PARENT ONLY) - Condensed Balance Sheets | |||||||
As of December 31, | |||||||
2016 | 2015 | ||||||
($ in thousands) | |||||||
Assets: | |||||||
Cash and cash equivalents | $ | 13,408 | $ | 16,398 | |||
Investment in bank subsidiary | 212,553 | 195,405 | |||||
Other assets | 2,119 | 1,767 | |||||
Total Assets | $ | 228,080 | $ | 213,570 | |||
Liabilities and Shareholders' Equity: | |||||||
Liabilities: | |||||||
Accrued interest payable | $ | 344 | $ | 384 | |||
Long-term borrowings | 32,638 | 32,884 | |||||
Deferred tax liability, net | 724 | 909 | |||||
Other liabilities | 1,714 | 798 | |||||
Total Liabilities | 35,420 | 34,975 | |||||
Shareholders' Equity: | |||||||
Total Shareholders’ Equity | 192,660 | 178,595 | |||||
Total Liabilities and Shareholders' Equity | $ | 228,080 | $ | 213,570 | |||
97
Table 25.2: WashingtonFirst Bankshares, Inc. (PARENT ONLY) - Condensed Statement of Operations and Comprehensive Income | |||||||||||
For the Year Ended December 31, | |||||||||||
2016 | 2015 | 2014 | |||||||||
($ in thousands) | |||||||||||
Interest income: | |||||||||||
Dividends from subsidiary | $ | — | $ | — | $ | — | |||||
Other interest income | 41 | 70 | 59 | ||||||||
Total interest income | 41 | 70 | 59 | ||||||||
Interest expense | 2,131 | 867 | 480 | ||||||||
Net interest income | (2,090 | ) | (797 | ) | (421 | ) | |||||
Non-interest income: | |||||||||||
Other income | 66 | — | — | ||||||||
Total non-interest income | 66 | — | — | ||||||||
Non-interest expense: | |||||||||||
Merger expenses | — | 4 | — | ||||||||
Other operating expenses | 1,638 | 2,532 | 2,254 | ||||||||
Total other expenses | 1,638 | 2,536 | 2,254 | ||||||||
(Loss)/income before provision income taxes | (3,662 | ) | (3,333 | ) | (2,675 | ) | |||||
Income tax benefit | 1,343 | 1,192 | 957 | ||||||||
Net (loss)/income before undistributed income of subsidiaries | (2,319 | ) | (2,141 | ) | (1,718 | ) | |||||
Equity in earnings of subsidiaries | 20,326 | 14,396 | 11,142 | ||||||||
Net income | 18,007 | 12,255 | 9,424 | ||||||||
Accumulated other comprehensive income in subsidiary | (2,452 | ) | (561 | ) | 1,943 | ||||||
Comprehensive Income | $ | 15,555 | $ | 11,694 | $ | 11,367 | |||||
98
Table 25.3: WashingtonFirst Bankshares, Inc. (PARENT ONLY) - Condensed Statements of Cash Flows | |||||||||||
For the Year Ended December 31, | |||||||||||
2016 | 2015 | 2014 | |||||||||
($ in thousands) | |||||||||||
Cash flows from operating activities: | |||||||||||
Net income | $ | 18,007 | $ | 12,255 | $ | 9,424 | |||||
Adjustments to reconcile net income to net cash (used in) provided by operating activities: | |||||||||||
Undistributed income of subsidiaries | (20,326 | ) | (14,396 | ) | (11,142 | ) | |||||
Amortization | 139 | 138 | 139 | ||||||||
Bank to parent dividend | 1,470 | 275 | — | ||||||||
Net change in: | |||||||||||
Other assets | 84 | 4,825 | (2,970 | ) | |||||||
Other liabilities | (259 | ) | (1,089 | ) | 744 | ||||||
Net cash (used in) / provided by operating activities | (885 | ) | 2,008 | (3,805 | ) | ||||||
Cash flows from investing activities: | |||||||||||
Investment in subsidiaries | — | (50,500 | ) | 1,128 | |||||||
Net cash (used in) / provided by investing activities | — | (50,500 | ) | 1,128 | |||||||
Cash flows from financing activities: | |||||||||||
Proceeds from stock issuance - private placement | — | — | 20,490 | ||||||||
Proceeds from issuance of common stock, net | — | 31,153 | — | ||||||||
Proceeds from exercise of stock options | 837 | 566 | 766 | ||||||||
Net increase / (decrease) in long-term borrowings | — | 25,000 | — | ||||||||
Repurchase of Preferred Stock | — | (13,347 | ) | (4,449 | ) | ||||||
Cash dividends paid | (2,934 | ) | (1,894 | ) | (1,259 | ) | |||||
Dividends paid - cash portion for fractional shares on 5% dividend | (8 | ) | — | (5 | ) | ||||||
Preferred stock dividends paid | — | (74 | ) | (161 | ) | ||||||
Net cash provided by financing activities | (2,105 | ) | 41,404 | 15,382 | |||||||
Net increase / (decrease) in cash and cash equivalents | (2,990 | ) | (7,088 | ) | 12,705 | ||||||
Cash and cash equivalents at beginning of period | 16,398 | 23,486 | 10,781 | ||||||||
Cash and cash equivalents at end of period | $ | 13,408 | $ | 16,398 | $ | 23,486 | |||||
99
26. QUARTERLY FINANCIAL INFORMATION (Unaudited)
Table 26.1: Quarterly Income Statements - 2016 | |||||||||||||||
2016 Quarter Ended | |||||||||||||||
Dec. 31 | Sept. 30 | Jun. 30 | Mar. 31 | ||||||||||||
($ in thousands, except per share amounts) | |||||||||||||||
Interest income | $ | 19,185 | $ | 18,936 | $ | 18,182 | $ | 17,544 | |||||||
Interest expense | 3,206 | 3,093 | 3,181 | 2,991 | |||||||||||
Net interest income | 15,979 | 15,843 | 15,001 | 14,553 | |||||||||||
Provision for loan losses | 1,240 | 1,035 | 980 | 625 | |||||||||||
Net interest income after provision for loan losses | 14,739 | 14,808 | 14,021 | 13,928 | |||||||||||
Non-interest (loss)/income | 5,568 | 8,666 | 8,490 | 4,781 | |||||||||||
Non-interest expense | 13,216 | 15,611 | 15,535 | 12,501 | |||||||||||
Income before income taxes | 7,091 | 7,863 | 6,976 | 6,208 | |||||||||||
Provision for income taxes | 2,347 | 2,922 | 2,578 | 2,284 | |||||||||||
Net income | $ | 4,744 | $ | 4,941 | $ | 4,398 | $ | 3,924 | |||||||
Earnings per common share: | |||||||||||||||
Basic earnings per common share | $ | 0.37 | $ | 0.38 | $ | 0.34 | $ | 0.31 | |||||||
Fully diluted earnings per common share | $ | 0.36 | $ | 0.37 | $ | 0.34 | $ | 0.30 | |||||||
Table 26.2: Quarterly Income Statements - 2015 | |||||||||||||||
2015 Quarter Ended | |||||||||||||||
Dec. 31 | Sept. 30 | Jun. 30 | Mar. 31 | ||||||||||||
($ in thousands, except per share amounts) | |||||||||||||||
Interest income | $ | 17,159 | $ | 16,462 | $ | 15,252 | $ | 14,310 | |||||||
Interest expense | 2,827 | 2,300 | 2,080 | 2,004 | |||||||||||
Net interest income | 14,332 | 14,162 | 13,172 | 12,306 | |||||||||||
Provision for loan losses | 1,075 | 925 | 850 | 700 | |||||||||||
Net interest income after provision for loan losses | 13,257 | 13,237 | 12,322 | 11,606 | |||||||||||
Non-interest (loss)/income | 3,806 | 2,922 | 606 | 557 | |||||||||||
Non-interest expense | 11,914 | 11,229 | 8,601 | 7,845 | |||||||||||
Income before income taxes | 5,149 | 4,930 | 4,327 | 4,318 | |||||||||||
Provision for income taxes | 1,607 | 1,774 | 1,560 | 1,528 | |||||||||||
Net income | $ | 3,542 | $ | 3,156 | $ | 2,767 | $ | 2,790 | |||||||
Earnings per common share: | |||||||||||||||
Basic earnings per common share | $ | 0.31 | $ | 0.29 | $ | 0.28 | $ | 0.27 | |||||||
Fully diluted earnings per common share | $ | 0.30 | $ | 0.29 | $ | 0.27 | $ | 0.27 | |||||||
27. SEGMENT REPORTING
Beginning in 2015, the Company has three reportable segments: traditional commercial banking, a mortgage banking business, and a wealth management business. The basis of segmentation is driven by the respective lines of business within the Company. Revenues from commercial banking operations consist primarily of interest earned on loans and investment securities and fees from deposit services. Mortgage banking operating revenues consist principally of interest earned on mortgage loans held for sale, gains on sales of loans in the secondary market, and loan origination fee income. Wealth management operating revenues consist of fees for portfolio asset management and transactional fees charged to clients. The commercial banking segment provides the mortgage banking segment with the short-term funds needed to originate mortgage loans through a warehouse line of credit and charges the mortgage banking segment interest based on a premium over their cost to borrow funds. These transactions are eliminated in the consolidation process. The following table presents segment information for the year ended December 31, 2016. The Company did not have mortgage banking and wealth management segments prior to the acquisition of 1st Portfolio Holding Corporation in July 2015 - see Note 3
100
Acquisition Activities for more information. The accounting policies of the reportable segments are the same as those described in the summary of significant accounting policies. Inter-segment transactions are recorded at cost and eliminated as part of the consolidation process. A management fee for operations and administrative support services is charged to amongst subsidiaries and eliminated in the consolidated totals.
Table 27.1: Segment Reporting - 2016 (YTD) | |||||||||||||||||||
For the Year Ended December 31, 2016 | |||||||||||||||||||
Commercial Bank | Mortgage Bank | Wealth Management | Other (1) | Consolidated Totals | |||||||||||||||
($ in thousands) | |||||||||||||||||||
Revenue: | |||||||||||||||||||
Interest income | $ | 73,340 | $ | 1,790 | $ | — | $ | (1,283 | ) | $ | 73,847 | ||||||||
Gain on sale of loans | — | 18,329 | — | — | 18,329 | ||||||||||||||
Other revenue | 3,008 | 4,265 | 1,837 | 66 | 9,176 | ||||||||||||||
Total revenue | $ | 76,348 | $ | 24,384 | $ | 1,837 | $ | (1,217 | ) | $ | 101,352 | ||||||||
Expenses: | |||||||||||||||||||
Interest expense | $ | 10,378 | $ | 1,283 | $ | 3 | $ | 807 | $ | 12,471 | |||||||||
Salaries and employee benefits | 18,376 | 14,961 | 974 | 872 | 35,183 | ||||||||||||||
Other expenses | 21,084 | 3,306 | 431 | 739 | 25,560 | ||||||||||||||
Total expenses | $ | 49,838 | $ | 19,550 | $ | 1,408 | $ | 2,418 | $ | 73,214 | |||||||||
Income/(loss) before provision for income taxes | $ | 26,510 | $ | 4,834 | $ | 429 | $ | (3,635 | ) | $ | 28,138 | ||||||||
Total assets | $ | 1,952,964 | $ | 46,185 | $ | 3,868 | $ | (106 | ) | $ | 2,002,911 | ||||||||
(1) Includes parent company and intercompany eliminations | |||||||||||||||||||
Table 27.2: Segment Reporting - 2015 (YTD) | |||||||||||||||||||
For the Year Ended December 31, 2015 | |||||||||||||||||||
Commercial Bank | Mortgage Bank | Wealth Management | Other (1) | Consolidated Totals | |||||||||||||||
($ in thousands) | |||||||||||||||||||
Revenue: | |||||||||||||||||||
Interest income | $ | 62,960 | $ | 401 | $ | — | $ | (178 | ) | $ | 63,183 | ||||||||
Gain on sale of loans | 174 | 4,471 | — | — | 4,645 | ||||||||||||||
Other revenue | 4,379 | 760 | 695 | (2,588 | ) | 3,246 | |||||||||||||
Total revenue | $ | 67,513 | $ | 5,632 | $ | 695 | $ | (2,766 | ) | $ | 71,074 | ||||||||
Expenses: | |||||||||||||||||||
Interest expense | $ | 8,373 | $ | 219 | $ | — | $ | 619 | $ | 9,211 | |||||||||
Salaries and employee benefits | 19,117 | 3,671 | 334 | — | 23,122 | ||||||||||||||
Other expenses | 18,498 | 818 | 181 | 520 | 20,017 | ||||||||||||||
Total expenses | $ | 45,988 | $ | 4,708 | $ | 515 | $ | 1,139 | $ | 52,350 | |||||||||
Income/(loss) before provision for income taxes | $ | 21,525 | $ | 924 | $ | 180 | $ | (3,905 | ) | $ | 18,724 | ||||||||
Total assets | $ | 1,673,612 | $ | 47,801 | $ | 3,010 | $ | (49,957 | ) | $ | 1,674,466 | ||||||||
(1) Includes parent company and intercompany eliminations | |||||||||||||||||||
During the year ended December 31, 2016, the mortgage subsidiary originated $772.1 million of total loan volume compared to $213.4 million for the year ended December 31, 2015. Wealth Advisors’ assets under management grew to $297.4 million as of December 31, 2016, from $226.7 million as of December 31, 2015.
101
28. SUBSEQUENT EVENTS
On December 19, 2016, the Bank’s application to become a member of the Federal Reserve Bank of Richmond was approved. As a member bank of the Federal Reserve, the Bank is required to subscribe to Federal Reserve Stock in the amount equivalent to six percent of its capital and surplus. In conjunction with this requirement, the Company purchased 93,310 shares of Federal Reserve Stock at a cost of $4.7 million on January 6, 2017. As a result of becoming a member of the Federal Reserve, the Company’s primary federal regulator is now the Federal Reserve.
On February 22, 2017, the Company, entered into an Exchange Agreement with Castle Creek Capital Partners IV, LP (“Castle Creek”) providing for the exchange of 591,898 shares of the Company’s Non-Voting Common Stock, Series A, par value $.01 per share (“Non-Voting Common Stock”), for 591,898 shares of the Company’s voting common stock, par value $.01 per share (“Voting Common Stock”). The Company also entered into an Exchange Agreement with Endicott Opportunity Partners III, L.P. (“Endicott”) providing for the exchange of 500,000 shares of the Company’s Non-Voting Common Stock for 500,000 shares of the Company’s Voting Common Stock. The Non-Voting Common Stock was originally issued to Castle Creek and Endicott (referred to herein together as the “Investors”) in a private placement transaction that was completed on December 21, 2012, and was issued to enable the equity ownership of Castle Creek and Endicott to comply with applicable banking laws and regulations. Pursuant to the terms of the Company’s Amended and Restated Articles of Incorporation (the “Articles of Incorporation”) the Non-Voting Common Stock was convertible into Voting Common Stock, subject to certain limitations. The number of shares that the Investors received pursuant to the Exchange Agreements is equal to the number of shares of Voting Common Stock that the Investors would have received upon conversion of the Non-Voting Common Stock. The exchange transactions were effected because the Non-Voting Common Stock could only be converted at the time of a transfer or sale of the Non-Voting Common Stock that satisfied certain conditions set forth in the Articles of Incorporation. The Voting Common Stock issued upon exchange of the Non-Voting Common Stock was offered and exchanged in reliance on exemptions from registration provided by the Securities Act of 1933, as amended (the “Securities Act”). Upon completion of the exchange transactions, Castle Creek had 591,898 shares of Voting Common Stock issued and outstanding, including unvested stock awards, and Endicott had 1,199,032 shares of Voting Common Stock issued and outstanding, including unvested stock awards. Copies of the Exchange Agreements are attached as Exhibits 10.21 and 10.22 to Form 8-K filed with the SEC on February 28, 2017. The foregoing description of the Exchange Agreements is a summary and is qualified in its entirety by reference to the complete text of the Exchange Agreements.
On February 28, 2017, the Company announced that its Board of Directors declared a cash dividend of seven cents ($0.07) per share payable on April 3, 2017, to stockholders of record as of March 13, 2017. The dividend payout will be approximately $904 thousand on 12.9 million shares of voting and non-voting common stock.
Item 9. Changes in and Disagreements with Accountants on Accounting and Financial Disclosures
None.
Item 9A. Controls and Procedures
Management's Evaluation of Disclosure Controls and Procedures. The Company maintains disclosure controls and procedures designed to ensure that information required to be disclosed in the Company’s periodic filings under the Exchange Act, including this report, is recorded, processed, summarized and reported on a timely basis. These disclosure controls and procedures include controls and procedures designed to ensure that information required to be disclosed under the Exchange Act is accumulated and communicated to the Company’s management on a timely basis to allow decisions regarding required disclosure. There are inherent limitations to the effectiveness of any system of disclosure controls and procedures, including the possibility of human error and the circumvention or overriding of the controls and procedures. Accordingly, even effective disclosure controls and procedures can only provide reasonable assurance of achieving their control objectives. Management, including the Company’s Chief Executive Officer and Chief Financial Officer, has evaluated the effectiveness of the design and operation of the Company’s disclosure controls and procedures (as defined under Rules 13a-15(e) and 15d-15(e) of the Exchange Act) as of December 31, 2016. Based on management’s assessment, the Chief Executive Officer and the Chief Financial Officer have concluded that the Company’s disclosure controls and procedures were effective as of December 31, 2016.
Changes in Internal Control Over Financial Reporting. There were no changes in the Company’s internal control over financial reporting during the year ended December 31, 2016, that have materially affected, or are reasonably likely to materially affect, the Company’s internal control over financial reporting.
Item 9B. Other Information
None.
102
PART III
Item 10. Directors, Executive Officers and Corporate Governance
The information required by this item is incorporated by reference to the Company’s definitive proxy statement relating to the 2017 Annual Meeting of Stockholders, which will be filed with the Securities and Exchange Commission not later than 120 days after December 31, 2016.
Item 11. Executive Compensation
The information required by this item is incorporated by reference to the Company’s definitive proxy statement relating to the 2017 Annual Meeting of Stockholders, which will be filed with the Securities and Exchange Commission not later than 120 days after December 31, 2016.
Item 12. Security Ownership of Certain Beneficial Owners and Management and Related Shareholders
Securities Authorized for Issuance Under Equity Compensation Plans
The following table provides information as of December 31, 2016, regarding the Company’s equity compensation plans under which its equity securities (only common stock) are authorized for issuance:
(a) | (b) | (c) | |||||||
Plan Category | Number of securities to be issued upon exercise of outstanding options, warrants and rights | Weighted-average exercise pricing of outstanding options, warrants and rights | Number of securities remaining available for future issuance under equity compensation plans(excluding securities reflected in column (a)) | ||||||
Equity compensation plan approved by security holders | 664,417 | $ | 12.51 | 200,032 | |||||
Equity compensation plan not approved by security holders | — | — | — | ||||||
Total | 664,417 | $ | 12.51 | 200,032 | |||||
Item 13. Certain Relationships and Related Transactions, and Director Independence
The information required by this item is incorporated by reference to the Company’s definitive proxy statement relating to the 2017 Annual Meeting of Stockholders, which will be filed with the Securities and Exchange Commission not later than 120 days after December 31, 2016.
Item 14. Principal Accounting Fees and Services
The information required by this item is incorporated by reference to the Company’s definitive proxy statement relating to the 2017 Annual Meeting of Stockholders, which will be filed with the Securities and Exchange Commission not later than 120 days after December 31, 2016.
103
PART IV
Item 15. Exhibits, Financial Statement Schedules
(a) The following financial statements, financial statement schedules and exhibits are filed as a part of this report:
1. | Financial Statements. WashingtonFirst’s consolidated financial statements are included in Item 1 of this report. |
2. | Financial Statement Schedules. Financial statement schedules have been omitted because they are either not required, not applicable or the information required to be presented is included in WashingtonFirst’s financial statements and related notes. |
3. | Exhibits. The following exhibits are filed herewith pursuant to the requirements of Item 601 of Regulation S-K: |
EXHIBIT LIST
Exhibit | Description | |
2.1† | Agreement and Plan of Reorganization, dated as of May 3, 2012, by and among WashingtonFirst Bankshares, Inc., Alliance Bankshares Corporation and Alliance Bank Corporation (incorporated by reference herein to Appendix A to Amendment No. 3 to the Registration Statement on Form S-4 filed with the Securities and Exchange Commission by WashingtonFirst Bankshares, Inc. on November 9, 2012 (File No. 333-183255)). | |
2.2 | Amendment No. 1, dated August 9, 2012, to the Agreement and Plan of Reorganization, dated as of May 3, 2012, by and among WashingtonFirst Bankshares, Inc., Alliance Bankshares Corporation and Alliance Bank Corporation (incorporated by reference herein to Appendix A to Amendment No. 3 to the Registration Statement on Form S-4 filed with the Securities and Exchange Commission by WashingtonFirst Bankshares, Inc. on November 9, 2012 (File No. 333-183255)). | |
2.3 | Purchase and Assumption Agreement by and among the Federal Deposit Insurance Corporation, Receiver of Millennium Bank, N.A, the Federal Deposit Insurance Corporation and WashingtonFirst Bank, dated as of February 28, 2014 (incorporated by reference herein to Exhibit 2.1 to Form 8-K filed with the Securities and Exchange Commission by WashingtonFirst Bankshares, Inc. on March 5, 2014 (File No. 001-35768)). | |
2.4 | Agreement and Plan of Reorganization by and among WashingtonFirst Bankshares, Inc., 1st Portfolio Holding Corporation, and John Oswald, solely in his capacity as the FP Representative, dated as of May 13, 2015 (incorporated by reference herein to Exhibit 2.1 to Form 8-K filed with the Securities and Exchange Commission by WashingtonFirst Bankshares, Inc. on May 19, 2015 (File No. 001-35768)). | |
3.1 | Articles of Incorporation of WashingtonFirst Bankshares, Inc. filed February 25, 2009, as amended (incorporated by reference herein to Exhibit 3.1 to Form 8-K filed with the Securities and Exchange Commission by WashingtonFirst Bankshares, Inc. on December 21, 2012 (File No. 001-35768)). | |
3.2 | Articles of Amendment to the Articles of Incorporation of WashingtonFirst Bankshares, Inc. filed January 28, 2013 (incorporated by reference herein to Exhibit 3.1 to Form 8-K filed with the Securities and Exchange Commission by WashingtonFirst on Bankshares, Inc. February 6, 2013 (File No. 001-35768)). | |
3.3 | Bylaws of WashingtonFirst Bankshares, Inc. adopted February 25, 2009 (incorporated by reference herein to Exhibit 3.7 to the Registration Statement on Form S-4 filed with the Securities and Exchange Commission by WashingtonFirst Bankshares, Inc. on August 13, 2012 (File No. 333-183255)). | |
4.1 | Form of certificate representing shares of WashingtonFirst Bankshares, Inc.’s common stock (incorporated by reference herein to Exhibit 4.1 to Amendment No. 1 to the Registration Statement on Form S-4 filed with the Securities and Exchange Commission by WashingtonFirst Bankshares, Inc. on September 21, 2012 (File No. 333-183255)). | |
4.2 | Certificate of Designations relating to WashingtonFirst Bankshares, Inc. Senior Non-Cumulative Perpetual Preferred Stock, Series D (incorporated by reference herein to part of Exhibit 3.5 to the Registration Statement on Form S-4 filed with the Securities and Exchange Commission by WashingtonFirst Bankshares, Inc. on August 13, 2012 (File No. 333-183255)). | |
4.3 | Form of certificate representing shares of WashingtonFirst Bankshares, Inc.’s non-voting common stock (incorporated by reference herein to Exhibit 4.3 to Amendment No. 2 to the Registration Statement on Form S-4 filed with the Securities and Exchange Commission by WashingtonFirst Bankshares, Inc. on November 5, 2012 (File No. 333-183255)). | |
104
4.4 | Investment Agreement dated as of December 30, 2014, by and between WashingtonFirst Bankshares, Inc. and Castle Creek Capital Partners IV, L.P. (incorporated by reference herein to Exhibit 99.1 to Current Report on Form 8-K filed with the Securities and Exchange Commission by WashingtonFirst Bankshares, Inc. on January 5, 2015 (File No. 001-35768)). | |
4.5 | Investment Agreement dated as of December 30, 2014, by and between WashingtonFirst Bankshares, Inc. and Ithan Creek investors USB, LLC (incorporated by reference herein to Exhibit 99.2 to Current Report on Form 8-K filed with the Securities and Exchange Commission by WashingtonFirst Bankshares, Inc. on January 5, 2015 (File No. 001-35768)). | |
4.6 | Investment Agreement dated as of December 30, 2014, by and between WashingtonFirst Bankshares, Inc. and Banc Fund VII L.P. (incorporated by reference herein to Exhibit 99.3 to Current Report on Form 8-K filed with the Securities and Exchange Commission by WashingtonFirst Bankshares, Inc. on January 5, 2015 (File No. 001-35768)). | |
4.7 | Investment Agreement dated as of December 30, 2014, by and between WashingtonFirst Bankshares, Inc. and Banc Fund VIII L.P. (incorporated by reference herein to Exhibit 99.4 to Current Report on Form 8-K filed with the Securities and Exchange Commission by WashingtonFirst Bankshares, Inc. on January 5, 2015 (File No. 001-35768)). | |
4.8 | Investment Agreement dated as of December 30, 2014, by and between WashingtonFirst Bankshares, Inc. and Banc Fund IX L.P. (incorporated by reference herein to Exhibit 99.5 to Current Report on Form 8-K filed with the Securities and Exchange Commission by WashingtonFirst Bankshares, Inc. on January 5, 2015 (File No. 001-35768)). | |
4.9 | Investment Agreement dated as of December 30, 2014, by and between WashingtonFirst Bankshares, Inc. and Basswood Capital Management, LLC (incorporated by reference herein to Exhibit 99.6 to Current Report on Form 8-K filed with the Securities and Exchange Commission by WashingtonFirst Bankshares, Inc. on January 5, 2015 (File No. 001-35768)). | |
4.10 | Registration Rights Agreement dated as of December 30, 2014, by and among WashingtonFirst Bankshares, Inc., Castle Creek Partners IV, L.P., Ithan Creek Investors USB, LLC, Banc Fund VII L.P., Banc Fund VIII L.P., Banc Fund IX L.P., Basswood Opportunity Partners, L.P., Basswood Opportunity Fund, Inc., Basswood Financial Fund, L.P., Basswood Financial Fund, Inc. (A), Basswood Financial Long Only Fund, L.P. and Castle Creek Capital Partners IV, L.P. (incorporated herein by reference to Exhibit 99.7 to Current Report on Form 8-K filed with the Securities and Exchange Commission by WashingtonFirst Bankshares, Inc. on January 5, 2015 (File No. 001-35768)). | |
4.11 | Form of Indenture for Senior Debt Securities (including form of Note for Senior Debt Securities) (incorporated herein by reference to Exhibit 4.6 to the Registration Statement on Form S-3 filed with the Securities and Exchange Commission by WashingtonFirst Bankshares, Inc. on February 26, 2015 (File No. 333-202318)). | |
4.12 | Form of Indenture for Subordinated Debt Securities (including form of Note for Subordinated Debt Securities (incorporated herein by reference to Exhibit 4.7 to the Registration Statement on Form S-3 filed with the Securities and Exchange Commission by WashingtonFirst Bankshares, Inc. on February 26, 2015 (File No. 333-202318)). | |
4.13** | Form of Deposit Agreement (including Form of Depositary Share Certificate) with respect to Depositary Shares. | |
4.14** | Form of Preferred Stock Certificate. | |
4.15** | Form of Statement of Designations for series of Preferred Stock. | |
4.16** | Form of Warrant Agreement (including Form of Warrant Certificate) with respect to Warrants to Purchase Debt Securities, Preferred Stock, Depositary Shares, Common Stock or Units. | |
4.17** | Form of Unit Agreement. | |
4.18 | Indenture, dated October 5, 2015, by and between WashingtonFirst Bankshares, Inc., as Issuer, and Wilmington Trust, National Association, as Trustee (incorporated by reference herein to Exhibit 4.4 to Form 8-K filed with the Securities and Exchange Commission by WashingtonFirst Bankshares, Inc. on October 6, 2015 (File No. 001-35768)). | |
4.19 | Forms of 6.00% Fixed-to-Floating Subordinated Notes due 2025 (included as Exhibit A-1 and Exhibit A-2 in Exhibit 4.20 incorporated by reference herein). | |
105
10.1 | Second Amended and Restated Executive Employment Agreement, dated September 21, 2012, by and between WashingtonFirst Bank and Shaza L. Andersen (incorporated by reference herein to Exhibit 10.1 to Amendment No. 1 to the Registration Statement on Form S-4 filed with the Securities and Exchange Commission by WashingtonFirst Bankshares, Inc. on September 21, 2012 (File No. 333-183255)). | |
10.2 | Second Amended and Restated Severance Payment Agreement, dated September 21, 2012, by and between WashingtonFirst Bank and Richard D. Horn (incorporated by reference herein to Exhibit 10.2 to Amendment No. 1 to the Registration Statement on Form S-4 filed with the Securities and Exchange Commission by WashingtonFirst Bankshares, Inc. on September 21, 2012 (File No. 333-183255)). | |
10.3 | Second Amended and Restated Severance Payment Agreement, dated September 21, 2012, by and between WashingtonFirst Bank and George W. Connors, IV (incorporated by reference herein to Exhibit 10.3 to Amendment No. 1 to the Registration Statement on Form S-4 filed with the Securities and Exchange Commission by WashingtonFirst Bankshares, Inc. on September 21, 2012 (File No. 333-183255)). | |
10.4 | Investment Agreement, dated as of May 3, 2012, by and between WashingtonFirst Bankshares, Inc. and Endicott Opportunity Partners III, L.P. (incorporated by reference herein to Exhibit 10.4 to the Registration Statement on Form S-4 filed with the Securities and Exchange Commission by WashingtonFirst Bankshares, Inc. on August 13, 2012 (File No. 333-183255)). | |
10.5 | Investment Agreement, dated as of June 20, 2012, by and between WashingtonFirst Bankshares, Inc. and Castle Creek Capital Partners IV, L.P. (incorporated by reference herein to Exhibit 10.5 to the Registration Statement on Form S-4 filed with the Securities and Exchange Commission by WashingtonFirst Bankshares, Inc. on August 13, 2012 (File No. 333-183255)). | |
10.6 | Form of Nonqualified Stock Option Agreement (incorporated by reference herein to Exhibit 10.7 to the Registration Statement on Form S-4 filed with the Securities and Exchange Commission by WashingtonFirst Bankshares, Inc. on August 13, 2012 (File No. 333-183255))). | |
10.7 | Form of Restricted Stock Agreement (incorporated by reference herein to Exhibit 10.8 to the Registration Statement on Form S-4 filed with the Securities and Exchange Commission by WashingtonFirst Bankshares, Inc. on August 13, 2012 (File No. 333-183255)). | |
10.8 | Form of Indemnification Agreement between WashingtonFirst Bankshares, Inc. and each of the directors and executive officers thereof (incorporated by reference herein to Exhibit 10.9 to Amendment No. 1 to the Registration Statement on Form S-4 filed with the Securities and Exchange Commission by WashingtonFirst Bankshares, Inc. on September 21, 2012 (File No. 333-183255)). | |
10.9 | Amendment No. 1 to Investment Agreement, dated September 21, 2012, by and between WashingtonFirst Bankshares, Inc. and Endicott Opportunity Partners III, L.P. (incorporated by reference herein to Exhibit 10.10 to Amendment No. 1 to the Registration Statement on Form S-4 filed with the Securities and Exchange Commission by WashingtonFirst Bankshares, Inc. on September 21, 2012 (File No. 333-183255)). | |
10.10 | Amendment No. 1 to Investment Agreement, dated September 21, 2012, by and between WashingtonFirst Bankshares, Inc. and Castle Creek Capital Partners IV, L.P. (incorporated by reference herein to Exhibit 10.11 to Amendment No. 1 to the Registration Statement on Form S-4 filed with the Securities and Exchange Commission by WashingtonFirst Bankshares, Inc. on September 21, 2012 (File No. 333-183255)). | |
10.11 | WashingtonFirst Bankshares, Inc. 2010 Equity Compensation Plan, as Amended (incorporated by reference herein to Exhibit 99.1 to Form 8-K filed with the Securities and Exchange Commission by WashingtonFirst Bankshares, Inc. on May 3, 2013 (File No. 001-35768)). | |
10.12 | Form of WashingtonFirst Bankshares, Inc. Incentive Stock Option Agreement (incorporated by reference herein to Exhibit 99.1 to Form 8-K filed with the Securities and Exchange Commission by WashingtonFirst Bankshares, Inc. on May 3, 2013 (File No. 001-35768)). | |
10.13 | WashingtonFirst Bank Supplemental Executive Retirement Agreement effective April 1, 2014 between WashingtonFirst Bank and Shaza L. Andersen (incorporated by reference herein to Exhibit 10.13 to Form 8-K filed with the Securities and Exchange Commission by WashingtonFirst Bankshares, Inc. on April 29, 2014 (File No. 001-35768)). | |
106
10.14 | WashingtonFirst Bank Supplemental Executive Retirement Agreement effective April 1, 2014 between WashingtonFirst Bank and George W. Connors, IV (incorporated by reference herein to Exhibit 10.14 to Form 8-K filed with the Securities and Exchange Commission by WashingtonFirst Bankshares, Inc. on April 29, 2014 (File No. 001-35768)). | |
10.15 | WashingtonFirst Bank Supplemental Executive Retirement Agreement effective April 1, 2014 between WashingtonFirst Bank and Matthew R. Johnson(incorporated by reference herein to Exhibit 10.15 to Form 8-K filed with the Securities and Exchange Commission by WashingtonFirst Bankshares, Inc. on April 29, 2014 (File No. 001-35768)). | |
10.16 | WashingtonFirst Bank Supplemental Executive Retirement Agreement effective April 1, 2014 between WashingtonFirst Bank and Richard D. Horn (incorporated by reference herein to Exhibit 10.16 to Form 8-K filed with the Securities and Exchange Commission by WashingtonFirst Bankshares, Inc. on April 29, 2014 (File No. 001-35768)). | |
10.17 | WashingtonFirst Bank Supplemental Executive Retirement Agreement effective October 1, 2014 between WashingtonFirst Bank and Joseph S. Bracewell (incorporated by reference herein to Exhibit 10.17 to Form 8-K filed with the Securities and Exchange Commission by WashingtonFirst Bankshares, Inc. on October 17, 2014 (File No. 001-35768)). | |
10.18 | 1st Portfolio Holding Corporation 2009 Stock Incentive Plan, as amended (incorporated by reference herein to Exhibit 99.1 to Form 8-K filed with the Securities and Exchange Commission by WashingtonFirst Bankshares, Inc. on September 22, 2015 (File No. 333-207071)). | |
10.19 | Form of Subordinated Note Purchase Agreement, dated October 5, 2015, by and between WashingtonFirst Bankshares, Inc. and each purchaser of subordinated notes (incorporated by reference herein to Exhibit 10.25 to Form 8-K filed with the Securities and Exchange Commission by WashingtonFirst Bankshares, Inc. on October 6, 2015 (File No. 001-35768)). | |
10.20 | Form of Registration Rights Agreement, dated October 5, 2015, by and among WashingtonFirst Bankshares, Inc. and purchasers of subordinated notes (incorporated by reference herein to Exhibit 10.26 to Form 8-K filed with the Securities and Exchange Commission by WashingtonFirst Bankshares, Inc. on October 6, 2015 (File No. 001-35768)). | |
12* | Statement of Ratio of Combined Fixed Charges and Preferred Dividends to Earnings. | |
14* | Code of Ethics of WashingtonFirst Bankshares, Inc. dated November 21, 2016. | |
21* | Subsidiaries of the registrant. | |
23* | Consent of Independent Registered Public Accounting Firm | |
31.1* | Certification by CEO pursuant to Rule 13a-14(a) or 15d-14(a) of the Securities Exchange Act of 1934, as adopted pursuant to Section 302 of the Sarbanes-Oxley Act of 2002. | |
31.2* | Certification by CFO pursuant to Rule 13a-14(a) or 15d-14(a) of the Securities Exchange Act of 1934, as adopted pursuant to Section 302 of the Sarbanes-Oxley Act of 2002. | |
32.1* | Certification by CEO and CFO pursuant to 18 U.S.C. Section 1350, as adopted pursuant to Section 906 of the Sarbanes-Oxley Act of 2002. | |
101** | Interactive data files pursuant to Rule 405 of Regulation S-T: WashingtonFirst Bankshares, Inc.’s (i) Consolidated Statements of Income for the years ended December 31, 2015, 2014 and 2013; (ii) Consolidated Statements of Comprehensive Income for the years ended December 31, 2015, 2014 and 2013; (iii) Consolidated Balance Sheets as of December 31, 2015 and 2014; (iv) Consolidated Statements of Cash Flows for the years ended December 31, 2015, 2014 and 2013; (v) Consolidated Statement of Shareholders’ Equity for the years ended December 31, 2015 and 2014; and (vi) the notes to the foregoing Consolidated Financial Statements. | |
107
Exhibit | Description | ||
* | 101.INS | XBRL Instance Document. | |
* | 101.SCH | XBRL Taxonomy Extension Schema Document. | |
* | 101.CAL | XBRL Taxonomy Calculation Linkbase Document. | |
* | 101.DEF | XBRL Taxonomy Definition Linkbase Document. | |
* | 101.LAB | XBRL Taxonomy Label Linkbase Document. | |
* | 101.PRE | XBRL Taxonomy Presentation Linkbase Document. | |
* | Filed with this Annual Report on Form 10-K. | |
** | To be subsequently filed by an amendment to the registration statement or by a Current Report on Form 8-K and incorporated herein by reference. | |
† | The schedules to this agreement have been omitted for this filing pursuant to Item 601(b)(2) of Regulation S-K. The registrant will furnish copies of such schedules to the SEC upon request. | |
Item 16. Form 10-K Summary
Not applicable.
SIGNATURES
Pursuant to the requirements of Section 13 or 15(d) of the Securities Exchange Act of 1934, the registrant has duly caused this report to be signed on its behalf by the undersigned thereunto duly authorized.
WASHINGTONFIRST BANKSHARES, INC. | ||
(Registrant) | ||
/s/ Shaza L. Andersen | March 14, 2017 | |
Shaza L. Andersen | Date | |
President & Chief Executive Officer | ||
Pursuant to the requirements of the Securities Exchange Act of 1934, this report has been signed below by the following persons on behalf of the registrant and in the capacities and on the dates indicated.
108
Name | Title | Date | ||
/s/ Shaza L. Andersen | Director, President & Chief Executive Officer | March 14, 2017 | ||
Shaza L. Andersen | (Principal Executive Officer) | |||
/s/ Matthew R. Johnson | Executive Vice President & Chief Financial Officer | March 14, 2017 | ||
Matthew R. Johnson | (Principal Financial and Accounting Officer) | |||
/s/ Joseph S. Bracewell | Chairman of the Board of Directors | March 14, 2017 | ||
Joseph S. Bracewell | ||||
/s/ Charles E. Andrews | Director | March 14, 2017 | ||
Charles E. Andrews | ||||
/s/ Josephine S. Cooper | Director | March 14, 2017 | ||
Josephine S. Cooper | ||||
/s/ Stephen M. Cumbie | Director | March 14, 2017 | ||
Stephen M. Cumbie | ||||
/s/ John H. Dalton | Director | March 14, 2017 | ||
John H. Dalton | ||||
/s/ Richard D. Horn | Director and General Counsel | March 14, 2017 | ||
Richard D. Horn | ||||
/s/ Caren D. Merrick | Director | March 14, 2017 | ||
Caren D. Merrick | ||||
/s/ Larry D. Meyers | Director | March 14, 2017 | ||
Larry D. Meyers | ||||
/s/ Madhu K. Mohan, MD | Director | March 14, 2017 | ||
Madhu K. Mohan, MD | ||||
/s/ James P. Muldoon | Director | March 14, 2017 | ||
James P. Muldoon | ||||
/s/ William C. Oldaker | Director | March 14, 2017 | ||
William C. Oldaker | ||||
/s/ Joe R. Reeder | Director | March 14, 2017 | ||
Joe R. Reeder | ||||
/s/ Johnnie E. Wilson | Director | March 14, 2017 | ||
Johnnie E. Wilson | ||||
109