Attached files
| file | filename |
|---|---|
| EX-32.2 - EXHIBIT 32.2 - OHA Investment Corp | ohai10k12312016exhibit322.htm |
| EX-32.1 - EXHIBIT 32.1 - OHA Investment Corp | ohai10k12312016exhibit321.htm |
| EX-31.2 - EXHIBIT 31.2 - OHA Investment Corp | ohai10k12312016exhibit312.htm |
| EX-31.1 - EXHIBIT 31.1 - OHA Investment Corp | ohai10k12312016exhibit311.htm |
| EX-21.1 - EXHIBIT 21.1 - OHA Investment Corp | ohai10k12312016exhibit211.htm |
| EX-14.2 - EXHIBIT 14.2 - OHA Investment Corp | ohai10k12312016exhibit142.htm |
| EX-14.1 - EXHIBIT 14.1 - OHA Investment Corp | ohai10k12312016exhibit141.htm |
UNITED STATES
SECURITIES AND EXCHANGE COMMISSION
Washington, D.C. 20549
__________________________________
FORM 10-K
__________________________________
(Mark One) | ||
ý | ANNUAL REPORT PURSUANT TO SECTION 13 OR 15(d) OF THE SECURITIES EXCHANGE ACT OF 1934 | |
For the fiscal year ended December 31, 2016
OR
o | TRANSITION REPORT PURSUANT TO SECTION 13 OR 15(d) OF THE SECURITIES EXCHANGE ACT OF 1934 | |
For the transition period from to
Commission file number 814-00672
__________________________________
OHA INVESTMENT CORPORATION
(Exact name of registrant as specified in its charter)
__________________________________
Maryland | 20-1371499 | |
(State or other jurisdiction of incorporation or organization) | (I.R.S. Employer Identification Number) | |
1114 Avenue of the Americas, 27th Floor New York, New York | 10036 | |
(Address of principal executive offices) | (Zip Code) | |
(212) 852-1900
(Registrant’s telephone number, including area code)
__________________________________
Securities registered pursuant to Section 12(b) of the Act:
Common Stock, Par Value $.001 per share | NASDAQ Global Select Market | |
(Title of each class) | (Name of each exchange on which registered) | |
Securities registered pursuant to Section 12(g) of the Act: None
__________________________________
Indicate by check mark if the registrant is a well-known seasoned issuer, as defined in Rule 405 of the Securities Act. Yes o No ý
Indicate by check mark if the registrant is not required to file reports pursuant to Section 13 or Section 15(d) of the Exchange Act. Yes o No ý
Indicate by check mark whether the registrant (1) has filed all reports required to be filed by Section 13 or 15(d) of the Securities Exchange Act of 1934 during the preceding 12 months (or for such shorter period that the registrant was required to file such reports), and (2) has been subject to such filing requirements for the past 90 days. Yes ý No o
Indicate by check mark whether the registrant has submitted electronically and posted on its corporate Website, if any, every Interactive Data File required to be submitted and posted pursuant to Rule 405 of Regulation S-T (§232.405 of this chapter) during the preceding 12 months (or for such shorter period that the registrant was required to submit and post such files). Yes o No o
Indicate by check mark if disclosure of delinquent filers pursuant to Item 405 of Regulation S-K is not contained herein, and will not be contained, to the best of registrant’s knowledge, in definitive proxy or information statements incorporated by reference in Part III of this Form 10-K or any amendment to this Form 10-K. ý
Indicate by check mark whether the registrant is a large accelerated filer, an accelerated filer, a non-accelerated filer, or a smaller reporting company. See the definitions of “large accelerated filer,” “accelerated filer” and “smaller reporting company” in Rule 12b-2 of the Exchange Act.
Large accelerated filer o | Accelerated filer o | Non-accelerated filer x | Smaller reporting company o | |||
(Do not check if a smaller reporting company)
Indicate by check mark whether the registrant is a shell company (as defined in Rule 12b-2 of the Exchange Act). Yes o No ý
As of June 30, 2016, the aggregate market value of common stock held by non-affiliates of the registrant based on the closing price on that date of $1.94 on the NASDAQ Global Select Market was approximately $37,550,623.
As of March 14, 2017, there were 20,172,392 shares of the registrant’s common stock outstanding.
DOCUMENTS INCORPORATED BY REFERENCE
Portions of the registrant’s definitive proxy statement for its 2017 Annual Meeting of Stockholders are incorporated by reference into Part III, Items 10 through 14 herein.
Certain exhibits previously filed with the Securities and Exchange Commission are incorporated by reference into Part IV of this report.
OHA INVESTMENT CORPORATION
TABLE OF CONTENTS
i
PART I
In this Annual Report on Form 10-K, except where the context suggests otherwise, the terms “we,” “us,” “our,” the “Company” and “OHAI” refer to OHA Investment Corporation; and “OHA,” “our investment advisor” and “our administrator” refer to Oak Hill Advisors, L.P. Some of the statements in this Annual Report constitute forward-looking statements, which relate to future events, future performance or financial condition. These forward-looking statements involve risks and uncertainties and actual results could differ materially from those projected in the forward-looking statement for any reason, including those factors discussed in “Item 1A. Risk Factors” and elsewhere in the report.
Item 1. Business
Introduction
OHA Investment Corporation
We are a specialty finance company with an investment objective to generate both current income and capital appreciation primarily through debt investments, some of which include equity components. We focus primarily on providing creative direct lending solutions to middle market private companies across industry sectors. Our investment activities are managed by OHA and supervised by our Board of Directors, the majority of whose members are independent of OHA and its affiliates.
We are an externally managed, closed-end, non-diversified management investment company that has elected to be regulated as a business development company, or a BDC, under the Investment Company Act of 1940, or the 1940 Act. For federal income tax purposes, we operate so as to be treated as a regulated investment company, or a RIC, under Subchapter M of the Internal Revenue Code of 1986, as amended, or the Code. As a BDC and a RIC, we are required to comply with certain investment diversification and other regulatory requirements.
On September 30, 2014, our stockholders approved the appointment of OHA as our investment advisor, replacing NGP Investment Advisor, LP, which had been our investment advisor since our inception. In connection with this change in investment advisor, we changed our name from NGP Capital Resources Company to OHA Investment Corporation, or OHAI. OHA is a registered investment adviser under the Investment Advisers Act of 1940, or the Advisers Act. OHA acts as our investment advisor and administrator pursuant to an investment advisory agreement and an administration agreement, respectively, each dated as of September 30, 2014, which we refer to as the Investment Advisory Agreement and the Administration Agreement, respectively.
The aggregate fair value of our investment portfolio at December 31, 2016 was $105.0 million, with such value comprised of 12 active portfolio investments. Under our previous investment advisor, we focused our investments primarily on small and mid-size companies engaged in the upstream sector of the energy industry, which includes businesses that find, develop and extract energy resources, including natural gas, crude oil and coal. Consequently, a significant portion of our current investment portfolio value is comprised of debt securities and other investments in upstream exploration and production companies engaged in the acquisition, development and production of oil and natural gas properties in and along the Gulf Coast and in the state and federal waters of the Gulf of Mexico.
Part of OHA’s investment strategy is to reduce our portfolio concentration in the energy industry and to diversify our portfolio with investments in debt securities of U.S. private and small public middle market companies across industry sectors. Since September 30, 2014, we have made a total of 13 new investments in portfolio companies with a principal amount of $121.3 million (total cost of $117.5 million) and realized six of these investments with a principal amount of $60.6 million. Primarily as a result of these new investments, net of realizations, and write-downs of legacy energy investments, the concentration of our investment portfolio in the energy sector decreased to 38% at December 31, 2016.
Our historical focus and current concentration in the energy sector causes our portfolio to be particularly influenced by commodity prices for oil and natural gas, which experienced significant volatility in 2016 as the sector responded to changes in supply and demand, the weather, and uncertainty regarding production volumes. Brent crude prices in 2016 averaged $45 per barrel, down by $8 per barrel from 2015. West Texas Intermediate (WTI) crude oil prices averaged $43 per barrel, down by $5 per barrel from 2015. U.S. natural gas prices averaged $2.55 per million British thermal units (BTU) at Henry Hub, the U.S. national benchmark, down from $2.63 per million BTU in 2015. Although average prices were lower in 2016, Brent crude and WTI ended the year at $54 per barrel and $57 per barrel, respectively. Natural gas prices were also higher at the end of 2016, rising to $3.72 per million BTU at December 31, 2016, however prices have dropped to around $3.00 per million BTU in the first quarter of 2017. Further decline or increased volatility in the energy markets, particularly in North America, will negatively impact the values of our energy-related investments and, in turn, our net asset value. These factors may also extend the holding period for such investments, thus impacting our ability to reduce the concentration of energy investments in our portfolio. See “Item 1A. Risk Factors — Risk Factors Related to Our Investments” for further discussion regarding the decline in oil and natural gas prices and other risks related to the energy industry.
1
Our Investment Advisor
OHA is a leading independent investment firm specializing in direct lending, high yield bonds, leveraged loans, distressed investments, mortgage strategies and corporate structured products. With approximately $29.8 billion of capital under management as of December 2016, OHA employs a fundamental value-oriented strategy focused on credit analysis, relative value analysis, risk-adjusted return generation, loss avoidance and active risk management that has been in place for more than two decades. OHA has substantial experience in direct lending, having invested approximately $4.1 billion in over 125 direct lending investments over the past 14 years. Headquartered in New York, OHA employs more than 270 people located in seven offices, and has been registered as an investment adviser under the Advisers Act since 2004.
OHA is responsible for sourcing potential investments, conducting research on prospective investments, analyzing investment opportunities, structuring our investments, and monitoring our investments on an ongoing basis. We pay OHA a base management fee as a percentage of our assets and incentive fees as a percentage of our net investment income and net capital gains. Managing our portfolio is an extension of OHA’s direct lending activities to middle market companies, which OHA defines as companies with annual revenues of $50 million to $1 billion.
We have an investment committee that evaluates and approves each of our investments, subject to the oversight of our Board of Directors. All key investment decisions made by OHA on our behalf require the approval of a majority of the members of the investment committee. OHA’s extensive team of investment professionals, including industry analysts and portfolio managers, actively source, evaluate and monitor our investments.
Our Investment Approach
OHA (and its affiliated investment advisors and predecessor firms) continues to build on its over 20-year history of investing in various asset classes and believes that its past success is a reflection of the firm’s consistent investment philosophy, strategy and process. As our investment advisor, OHA seeks to expand our portfolio’s exposure to a broader range of industries beyond energy, focusing on the middle market. OHA believes that middle market companies are generally less able to secure financing from public financial markets than larger companies and thus offer better return opportunities for firms able to originate and structure these investments, along with conducting the necessary diligence to appropriately evaluate these opportunities.
The OHA investment team employs an opportunistic, credit-driven investing approach rather than a broad origination model, leveraging the depth and breadth of its credit research team to seek value creation through long-term investment results. OHA looks for investment opportunities across the capital structure of middle market companies, using a fundamental value-oriented investment strategy. We believe that this approach will yield a highly diversified investment portfolio across asset classes, industries and capital structures. Our investment approach seeks attractive risk-adjusted returns while attempting to limit the risk of potential capital losses.
OHA expects that most of our new investments will be in senior and junior secured, unsecured and subordinated debt securities in U.S. private and small public middle market companies with maturities ranging from three to seven years. However, OHA seeks to identify attractive investments throughout the capital structure and thus may invest in equity, distressed debt, residual interests of CLOs and other assets. We may invest in newly issued securities and acquire investments in the secondary market.
The companies in which OHA intends to invest are typically highly leveraged, and, in most cases, our investments in such companies will not be rated by national rating agencies. If such companies were rated, we believe that they would typically receive a rating below investment grade (between BB and CCC under the Standard & Poor’s system) from the national rating agencies, which are often referred to as “junk.” From time to time, OHA may invest opportunistically in other types of investments, consistent with the provisions of the 1940 Act.
Our Board of Directors has the authority to modify or waive our operating policies and strategies without prior notice and without stockholder approval. However, under the 1940 Act, we may not change the nature of our business so as to cease to be, or withdraw our election as, a BDC without stockholder approval.
Investment Sourcing and Selection. OHA pursues selective direct origination from its extensive network of relationships with key financial sponsors, financial institutions, middle market companies, management teams, corporations and other sources, and it has sought to position itself as a value-added partner in club transactions by private equity firms. OHA believes its experience in the below-investment-grade credit markets positions it well to execute private deals and capture illiquidity premiums and attractive, uncorrelated returns that may be found in this market.
In originating assets, OHA employs multiple channels and leverages the extensive relationships of the broader OHA platform. OHA’s decision to select an investment for our portfolio stems directly from OHA’s long-established investment approach, which focuses on intensive credit analysis, relative value analysis, risk-adjusted return generation and loss avoidance. As part of this process, OHA continuously looks to originate new ideas, perform due diligence on these opportunities and
2
execute on those investments that meet OHA’s investment criteria. OHA has extensive direct lending experience spanning several credit cycles. Since 2002, OHA has originated and invested in approximately $4.1 billion of middle market private capital investments composed of more than 125 transactions.
BDCs generally are not permitted to co-invest on a concurrent basis with certain affiliated entities in the absence of an exemptive order from the U.S. Securities and Exchange Commission, or the SEC. However, BDCs are permitted to and may simultaneously co-invest in transactions where price is the only negotiated point. In an order dated April 25, 2016, the SEC granted exemptive relief permitting us, subject to the satisfaction of certain conditions, to co-invest in certain investment transactions with certain OHA affiliates where terms other than price are negotiated. We believe this relief will enhance our ability to further our investment objectives and strategy and may also increase favorable investment opportunities for us, in part, by allowing us to participate in larger investments, together with our co-investment affiliates, than would be available to us if such relief had not been obtained. However, there can be no assurance that such exemptive relief will permit us to fully achieve these goals.
Due Diligence. OHA believes that each investment opportunity should stand on its own merits rather than being dependent upon macro views held by the chief investment officer or a research analyst. In performing diligence on direct lending opportunities, an investigation is typically conducted by a team of research analysts and portfolio managers. The process entails, among other considerations: business analysis, capital structure analysis and valuation analysis. Business analysis involves a comprehensive fundamental evaluation of a company, including historical and projected financial modeling. Capital structure analysis evaluates the terms and structure of a company’s debt and equity securities relative to the company’s business risk. Valuation analysis considers the enterprise value of a company in both the public and private markets.
OHA’s credit process seeks to be quantitatively rigorous and qualitatively thorough, enhanced by OHA’s contacts throughout the investment community and industries it analyzes. Research analysts are encouraged to develop relationships with senior management, consultants, investment bankers, rating agencies and other experts in the industries they cover. OHA’s investment professionals also have extensive contact with senior professionals of OHA’s portfolio companies, and often perform frequent customer and supplier references. Typically, detailed written reports evaluate an investment’s merits and concerns and steer the discussions between the team of research analysts and portfolio managers. These discussions are critical to the decision to purchase or sell an investment, or to redirect the research process to areas that warrant further evaluation. The process is often iterative and can involve multiple investment discussions.
Monitoring Investments. Once we have provided a financial commitment or investment with respect to a portfolio company, OHA monitors our portfolio companies on an ongoing basis. The objective of OHA’s monitoring process is to identify current and potential value changes and be in a position to act accordingly. OHA actively monitors the financial performance of our portfolio companies through regular contact with the management teams, along with studying developments in the relevant industries and the financial markets. Constant, active monitoring allows OHA to maintain current risk assessments, address potential problems early, refine exit plans, and make prompt follow-on investment decisions.
Valuation Process
The majority of our investments are in securities for which market quotations are unavailable, or which have various degrees of restrictions on liquidity. We account for all of the assets in our portfolio at fair value, following the provisions of the Financial Accounting Standards Board Accounting Standards Codification “Fair Value Measurements and Disclosures,” or ASC 820. Our Board of Directors determines the fair value of each investment in our portfolio on a quarterly basis, as generally described below.
• | Investment Team Valuation. The investment professionals of OHA prepare fair value recommendations for each investment. |
• | Investment Team Valuation Documentation. The investment team documents and discusses its preliminary fair value recommendations with the investment committee and senior management of OHA. |
• | Third Party Valuation Activity. We may, at our discretion, retain an independent valuation firm to review any or all of the valuation analyses and fair value recommendations provided by the OHA investment team. As of December 31, 2016, our general practice is that we have an independent valuation firm review all Level 3 investments (those whose value is determined using significant unobservable inputs) with recommended fair values in excess of $10 million on a quarterly basis, and review all Level 3 investments with recommended fair values greater than zero at least annually. |
• | Presentation to Audit Committee. OHA and our senior management present the valuation analyses and fair value recommendations to the Audit Committee of our Board of Directors. |
• | Board of Directors and Audit Committee. The Board of Directors and the Audit Committee review and discuss the valuation analyses and fair value recommendations provided by OHA and the analysis of the independent valuation firm, if applicable. |
3
• | Final Valuation Determination. Our Board of Directors discusses the fair values recommended by the Audit Committee and determines the fair value of each investment in our portfolio, in good faith, based on the input of OHA, our Audit Committee and the independent valuation firm, if applicable. |
ASC 820 defines fair value as the price that a seller would receive for an asset or pay to transfer a liability in an orderly transaction between independent, knowledgeable and willing market participants at the measurement date. The fair value definition focuses on exit price in the principal, or most advantageous, market and prioritizes the use of observable market inputs over unobservable entity-specific inputs.
Competition
Historically, our primary competitors in this market have consisted of public and private investment funds, commercial and investment banks, commercial financing companies and other BDCs. Although these competitors regularly provide financing similar to most of our investments, a number of them focus on different aspects of these markets. We also face competition from other firms that are substantially larger and have considerably greater financial, technical and marketing resources than we have. Some of our competitors have a lower cost of funds and access to funding sources that are not available to us. In addition, some of our competitors have higher risk tolerances or different risk assessments, which allow them to consider a wider variety of investments and establish more portfolio relationships than we can. Furthermore, many of our competitors are not subject to the regulatory restrictions that the 1940 Act imposes on us as a BDC; nor are they subject to the requirements imposed on RICs by the Code. Nevertheless, we believe that the relationships of the senior professionals of OHA should enable us to compete effectively for attractive investment opportunities.
Employees
We do not have any direct employees, and our day-to-day investment operations are managed by OHA. Our principal officers are our chief executive officer, our chief financial officer and our chief compliance officer. In addition to the chief financial officer, we have two other OHA employees dedicated full time to our operations. All of these individuals are employees of OHA. Our allocable portion of the cost of our officers and their staffs is paid by us pursuant to the Administration Agreement. The services necessary for the origination, monitoring and administration of our investment portfolio are provided by investment professionals employed by OHA.
Regulation
Business Development Company
We have elected to be regulated as a BDC under the 1940 Act. By electing to be treated as a BDC, we are subject to various provisions of the 1940 Act. The 1940 Act contains prohibitions and restrictions relating to transactions between BDCs and their affiliates (including any investment advisers or sub-advisers), principal underwriters and affiliates of those affiliates or underwriters and requires that a majority of the directors be persons other than “interested persons,” as that term is defined in the 1940 Act. In addition, the 1940 Act provides that we may not change the nature of our business so as to cease to be, or withdraw our election to be regulated as, a BDC without first obtaining the approval of a “majority of our outstanding voting securities,” as that term is defined in the 1940 Act. Under the 1940 Act, the vote of holders of a “majority” means the vote of the holders of the lesser of: (i) 67% or more of the outstanding shares of the company’s common stock present at a meeting or represented by proxy if holders of more than 50% of the shares of the company’s common stock are present or represented by proxy or (ii) more than 50% of the company’s outstanding shares of common stock. We do not anticipate any substantial change in the nature of our business.
We are generally not permitted to issue and sell our common stock at a price below net asset value per share. We may, however, issue and sell shares of our common stock at a price below net asset value per share if (i) our Board of Directors determines that such sale is in our best interests and the best interests of our stockholders, and (ii) our stockholders have approved our policy and practice of making such sales within the preceding 12 months. In any such case, the price at which our common stock is to be issued and sold may not be less than a price which, in the determination of our Board of Directors, closely approximates the market value of such securities. We may repurchase our shares subject to the restrictions of the 1940 Act and our existing credit agreement.
As a BDC, we are required to meet a coverage ratio of the value of total assets to senior securities, which include all of our borrowings and any preferred stock we may issue in the future, of at least 200%. We are also prohibited under the 1940 Act from knowingly participating in certain transactions with our affiliates without the prior approval of our Board of Directors who are not interested persons and, in some cases, prior approval by the SEC.
We do not intend to acquire securities issued by any investment company that exceed the limits imposed by the 1940 Act. Under these limits, we generally are prohibited from (a) acquiring more than 3% of the voting stock of any investment company, (b) investing more than 5% of the value of our total assets in the securities of one investment company, or (c) investing more than 10% of the value of our total assets in the securities of investment companies in the aggregate. With regard
4
to that portion of our portfolio invested in securities issued by investment companies, it should be noted that such investments might subject our stockholders to additional expenses.
Qualifying Assets
A BDC must be organized and have its principal place of business in the United States and operate for the purpose of investing in the types of securities described in 1, 2 and 3 below. As a BDC, we may not acquire any asset other than assets of the type listed in Section 55(a) of the 1940 Act, which are referred to as qualifying assets, unless, at the time the acquisition is made, qualifying assets represent at least 70% of our total assets. The principal categories of qualifying assets relevant to our business are the following:
1.Securities purchased in transactions not involving any public offering from the issuer of such securities, which issuer (subject to certain limited exceptions):
a. | is an eligible portfolio company, or from any person who is, or has been during the preceding thirteen months, an affiliated person of an eligible portfolio company, or from any other person, subject to such rules as may be prescribed by the SEC. The 1940 Act defines an eligible portfolio company as any issuer that: |
i.is organized under the laws of, and has its principal place of business in, the United States;
ii.is not an investment company (other than a small business investment company, or SBIC, wholly owned by the BDC) or a company that would be an investment company but for certain exclusions under the 1940 Act; and
iii.does not have any class of securities listed on a national securities exchange
b. | is a company that meets the requirements of (a)(i) and (ii) above, but is not an eligible portfolio company because it has issued a class of securities on a national securities exchange, if: |
i. | at the time of the purchase, we own at least 50% of (A) the greatest number of equity securities of such issuer and securities convertible into or exchangeable for such securities; and (B) the greatest amount of debt securities of such issuer, held by us at any point in time during the period when such issuer was an eligible portfolio company; and; |
ii.we are one of the 20 largest holders of such issuer’s outstanding voting securities; or;
c. | is a company that meets the requirements of (a)(i) and (ii) above, but is not an eligible portfolio company because it has issued a class of securities on a national securities exchange, if the aggregate market value of such company’s outstanding voting and non-voting common equity is less than $250 million. |
2.Securities of any eligible portfolio company that we control.
3. | Securities purchased in a private transaction from a U.S. issuer that is not an investment company or from an affiliated person of such issuer, or from any person in transactions incident thereto, if immediately prior to the purchase of its securities such issuer is in bankruptcy and subject to reorganization, or if the issuer, immediately prior to the purchase of its securities was unable to meet its obligations as they came due without material assistance other than conventional lending or financing arrangements. |
4. | Securities of an eligible portfolio company purchased from any person in a private transaction if there is no ready market for such securities, and we already own 60% of the outstanding equity of the eligible portfolio company. |
5. | Securities received in exchange for or distributed on or with respect to securities described in (1) through (4) above, or pursuant to the exercise of options, warrants or rights relating to such securities. |
6. | Cash, cash equivalents, U.S. government securities or high-quality debt maturing in one year or less from the time of investment. |
Managerial Assistance to Portfolio Companies
As noted above, a BDC must be operated for the purpose of making investments in the types of securities described in 1, 2 and 3 under the heading entitled “Qualifying Assets” above. In addition, BDCs generally must offer to make available to the issuer of such securities significant managerial assistance, except in circumstances where either (i) the BDC controls such issuer of the securities or (ii) the BDC purchases such securities in conjunction with one or more other persons acting together and one of the other persons in the group makes available such managerial assistance. Making available managerial assistance means, among other things, any arrangement whereby the BDC, through its directors, officers, employees or agents, offers to provide, and, if accepted, does so provide, significant guidance and counsel concerning the management, operations or business objectives and policies of a portfolio company.
5
Temporary Investments
Pending investment in other types of “qualifying assets,” as described above, our investments generally consist of cash, cash equivalents, U.S. government securities or high-quality debt maturing in one year or less from the time of investment, which we refer to, collectively, as temporary investments, so that at least 70% of our assets are qualifying assets. Typically, we invest in U.S. Treasury Bills or in repurchase agreements, provided that such agreements are fully collateralized by cash or securities issued by the U.S. government or its agencies. A repurchase agreement involves the purchase by an investor, such as us, of a specified security and the simultaneous agreement by the seller to repurchase it at an agreed-upon future date and at a price that is greater than the purchase price by an amount that reflects an agreed-upon interest rate. There is no percentage restriction on the proportion of our assets that we may invest in such repurchase agreements. However, if more than 25% of our total assets constitute repurchase agreements from a single counterparty, we would not meet the asset diversification requirements in order to qualify as a RIC for federal income tax purposes. Thus, we do not intend to enter into repurchase agreements with a single counterparty in excess of this limit. OHA will monitor the creditworthiness of the counterparties with which we enter into any repurchase agreement transactions.
Senior Securities
The 1940 Act permits us, under specified conditions, to issue multiple classes of senior indebtedness and one class of stock senior to our common stock if our asset coverage, as defined in the 1940 Act, is at least equal to 200% immediately after each such issuance. In addition, while any senior securities remain outstanding, we may be required by the 1940 Act to make provisions to prohibit any distribution to our stockholders or the repurchase of such securities or shares unless we meet the applicable asset coverage ratios at the time of the distribution or repurchase. We are also permitted to borrow amounts up to 5% of the value of our total assets for temporary or emergency purposes without regard to asset coverage.
Code of Ethics
We and OHA have adopted a code of ethics pursuant to Rule 17j-1 under the 1940 Act and Rule 204A-1 under the Advisors Act, respectively, that establishes procedures for personal investments and restricts certain personal securities transactions. Personnel subject to each code may invest in securities for their personal investment accounts, including securities that may be purchased or held by us, so long as such investments are made in accordance with the code’s requirements.
Compliance Policies and Procedures
We and OHA have adopted and implemented written policies and procedures reasonably designed to prevent violation of the federal securities laws and will review these policies and procedures annually for their adequacy and the effectiveness of their implementation. We and OHA have each designated a chief compliance officer to be responsible for administering the policies and procedures.
Proxy Voting Policies and Procedures
While the majority of our investments are in debt securities, we may occasionally hold investments in publicly-traded equity securities. We have delegated our proxy voting responsibility to OHA. The proxy voting policies and procedures of OHA are set forth below. The guidelines are reviewed periodically by OHA and, accordingly, are subject to change.
As an investment advisor registered under the Advisers Act, OHA has fiduciary duties to us. As part of this duty, OHA recognizes that it must vote client securities in a timely manner free of conflicts of interest and in our best interests and the best interests of our stockholders. OHA’s proxy voting policies and procedures have been formulated to ensure decision-making consistent with these fiduciary duties. These policies and procedures for voting proxies are intended to comply with Section 206 of, and Rule 206(4)-6 under, the Advisers Act.
OHA votes proxies relating to our portfolio securities in what it perceives to be the best interest of our stockholders. OHA reviews on a case-by-case basis each proposal submitted to a stockholder vote to determine its effect on the portfolio securities held by us. Although OHA will generally vote against proposals that may have a negative effect on our portfolio securities, OHA may vote for such a proposal if there exist compelling long-term reasons to do so.
OHA’s proxy voting decisions are made by those senior investment professionals who are responsible for monitoring each of our investments. To ensure that a vote is not the product of a conflict of interest, OHA requires that (1) anyone involved in the decision-making process disclose to our chief compliance officer any potential conflict that he or she is aware of and any contact that he or she has had with any interested party regarding a proxy vote and (2) employees involved in the decision-making process or vote administration are prohibited from revealing how OHA intends to vote on a proposal in order to reduce any attempted influence from interested parties. If a vote may involve a material conflict of interest, prior to approving such vote, OHA must consult with our chief compliance officer to determine whether the potential conflict is material and if so, the appropriate method to resolve such conflict. If the conflict is determined not to be material, OHA’s employees shall vote the proxy in accordance with OHA’s proxy voting policy.
6
You may obtain information about how we voted proxies by making a written request for proxy voting information to Chief Compliance Officer, OHA Investment Corporation, 1114 Avenue of the Americas, 27th Floor, New York, New York 10036.
Other
We expect to be periodically examined by the SEC for compliance with the 1940 Act.
We are required to provide and maintain a bond issued by a reputable fidelity insurance company to protect us against larceny and embezzlement. Furthermore, as a BDC, we are prohibited from protecting any director or officer against any liability to us or our stockholders arising from willful misfeasance, bad faith, gross negligence or reckless disregard of the duties involved in the conduct of such person’s office.
Regulated Investment Company
As a BDC, we have elected to be treated as a RIC under Subchapter M of Chapter 1 of the Code. As a RIC, we are generally not subject to corporate-level U.S. federal income taxes on the portion of our investment company taxable income (which generally consists of ordinary income and realized net short-term capital gains in excess of realized net long-term capital losses, if any, reduced by deductible expenses), or realized net capital gains, that we distribute, or deem to distribute, to stockholders on a timely basis.
Taxable income available for distribution differs from consolidated net investment income under GAAP due to (i) temporary and permanent differences in income and expense recognition, (ii) capital gains and losses, (iii) activity at taxable subsidiaries, and (iv) the timing and period of recognition regarding dividends declared in December of one year and paid in January of the following year. Dividends we declare and pay in a particular year generally differ from taxable income for that year as such dividends may include the distribution of current year taxable income, the distribution of prior year taxable income carried forward into and distributed in the current year, or returns of capital.
We may also be subject to federal excise tax if we do not distribute an amount at least equal to the sum of (1) 98% of our ordinary income for the calendar year (taking into account certain deferrals and elections), (2) 98.2% of our capital gain net income, computed for the one year period ended October 31 of that calendar year, and (3) 100% of any ordinary income or capital gain net income not distributed or taxed in prior years. Dividends to stockholders are recorded on the ex-dividend date. We currently intend to make sufficient distributions each year to maintain our status as a RIC for federal income tax purposes and to avoid excise taxes. If we do not meet this requirement, the Code imposes a nondeductible excise tax generally equal to 4% of the amount by which the required distribution exceeds the distribution for the year. The taxable income on which an excise tax is paid is generally carried forward and distributed to stockholders in the next tax year. Depending on the level of taxable income earned in a tax year, we may choose to carry forward taxable income in excess of current year distributions into the next tax year and pay a 4% excise tax on such income.
In order to maintain our status as a RIC, we must, in general, (1) continue to qualify as a BDC; (2) derive at least 90% of our gross income from dividends, interest, gains from the sale of securities and other specified types of income; (3) meet asset diversification requirements as defined in the Code; and (4) timely distribute to stockholders at least 90% of our annual investment company taxable income as defined in the Code.
Investment Advisory Agreement
Management Services
OHA manages our investments and business pursuant to the Investment Advisory Agreement. The Investment Advisory Agreement was most recently approved by our Board of Directors, a majority of whose members are not “interested” persons (as defined in the 1940 Act) of us, on August 2, 2016.
In determining to reapprove the Investment Advisory Agreement, our Board of Directors requested information from OHA that enabled it to evaluate a number of factors relevant to its determination. These factors included:
• | information regarding the nature and quality of the advisory services rendered by OHA; |
• | our performance; |
• | the experience and qualifications of the personnel providing services to us; |
• | the current fee structure under the Investment Advisory Agreement, which was not proposed to be changed, and our current and anticipated expense ratio in relation to those of other BDCs with comparable investment policies and limitations, which the Board of Directors believed to be comparable to such other peer BDCs; |
• | the absence of breakpoints in the fee structure, and the fact that due to our small asset size, OHA had not experienced to date any economies of scale in connection with its management of our investments and business; |
7
• | the fees charged by OHA to its similar clients, which the Board of Directors did not believe to be a relevant consideration, as we are the sole BDC managed by OHA; |
• | the direct and indirect costs incurred by OHA in performing services for us and the basis of determining and allocating such costs; and |
• | any other possible benefits to OHA arising from its relationship with us. |
Based on the information reviewed and the considerations detailed above, our Board of Directors, including all of our directors who are not interested persons of us or OHA, concluded that the investment advisory fee rate and terms are fair and reasonable in relation to the services provided and reapproved the Investment Advisory Agreement as being in the best interests of our stockholders.
Subject to the overall supervision of our Board of Directors, OHA manages the investment and reinvestment of our assets in accordance with our investment objectives and policies. Under the terms of the Investment Advisory Agreement, OHA provides any and all management and investment advisory services necessary for the operation and conduct of our business and:
• | determines the composition of our portfolio, the nature and timing of the changes to our portfolio and the manner of implementing such changes; |
• | identifies, evaluates and negotiates the structure of our investments; |
• | monitors the performance of, and manages our investments; |
• | determines the securities and other assets that we purchase, retain or sell and the terms on which any such securities are purchased and sold; |
• | arranges for the disposition of our investments; |
• | recommends to our Board of Directors the estimated fair value of our investments that are not publicly traded debt or equity securities, based on our valuation guidelines; |
• | votes proxies in accordance with the proxy voting policy and procedures adopted by OHA; and |
• | provides us with such other investment advice, research and related services as our Board of Directors may, from time to time, reasonably require for the investment of our assets. |
OHA’s services under the Investment Advisory Agreement are not required to be exclusive, and OHA is free to furnish the same or similar services to other entities, including businesses that may directly or indirectly compete with us for particular investments, so long as its services to others do not impair its services to us. Under the Investment Advisory Agreement, OHA also provides on our behalf significant managerial assistance to those portfolio companies to which we are required to provide such assistance under the 1940 Act and who request such assistance from us.
Management and Incentive Fees
Pursuant to the Investment Advisory Agreement, we pay OHA a fee for management services consisting of two components — a base management fee and an incentive fee.
Base Management Fee: The base management fee is paid quarterly in arrears, and is calculated by multiplying the average value of our total assets (excluding cash, cash equivalents and U.S. Treasury Bills that are purchased with borrowed funds solely for the purpose of satisfying quarter-end diversification requirements related to our election to be taxed as a RIC under the Code), as of the end of the two immediately prior fiscal quarters, by a rate of 1.75% per annum.
Incentive Fee: The incentive fee consists of two parts. The first part, the investment income incentive fee, is calculated and payable quarterly in arrears based on our pre-incentive fee net investment income for the fiscal quarter for which the fee is being calculated. Pre-incentive fee net investment income means interest income, dividend income, royalty payments, net profits interest payments, and any other income (including any other fees, such as commitment, origination, syndication, structuring, diligence, monitoring and consulting fees or other fees that we receive from portfolio companies) accrued during the fiscal quarter, minus our operating expenses for the quarter (including the base management fee, expenses payable under the Administration Agreement, and any interest expense and dividends paid on any issued and outstanding preferred stock, but excluding the incentive fee). Net investment income includes, in the case of investments with a deferred interest feature (such as original issue discount, debt instruments with payment-in-kind interest and zero coupon securities), accrued income that we have not yet received in cash. Accordingly, we may pay (and in certain quarters, have paid) an incentive fee based partly on accrued investment income, the collection of which may be uncertain or deferred. Net investment income does not include any realized capital gains, realized capital losses, or unrealized capital appreciation or depreciation. Pre-incentive fee net investment
8
income, expressed as a rate of return on the value of our net assets (defined as total assets less liabilities at the end of the immediately preceding fiscal quarter) is compared to a “hurdle rate” of 1.75% per quarter (7% annualized). OHA receives no incentive fee for any fiscal quarter in which our pre-incentive fee net investment income does not exceed the hurdle rate. OHA receives an incentive fee equal to 100% of our pre-incentive fee net investment income for any fiscal quarter in which our pre-incentive fee net investment income exceeds the hurdle rate but is less than 2.1875% (8.75% annualized) of net assets (also referred to as the “catch up” provision) plus 20% of our pre-incentive fee net investment income for such fiscal quarter greater than 2.1875% (8.75% annualized) of net assets. The following is a graphical representation of the calculation of the investment income incentive fee:
Quarterly Incentive Fee Based on Net Investment Income
Pre-incentive fee net investment income (expressed as a percentage of the value of net assets)
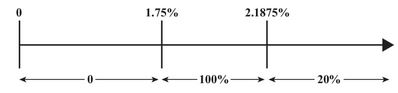
Percentage of pre-incentive fee net investment income allocated to investment income incentive fee
The second part of the incentive fee, the capital gains fee, is determined and payable in arrears as of the end of each fiscal year (or, upon termination of the Investment Advisory Agreement, as of the termination date). The capital gains fee is equal to 20% of our cumulative aggregate realized capital gains from the date of the Investment Advisory Agreement through the end of that fiscal year, computed net of our cumulative aggregate realized capital losses and cumulative aggregate unrealized depreciation on investments for the same time period. The aggregate amount of any previously paid capital gains incentive fees to OHA is subtracted from the capital gains incentive fee calculated. If such amount is negative, then there is no capital gains fee for such year. For the purposes of the capital gains fee, any gains and losses associated with our investment portfolio as of September 30, 2014 shall be excluded from the capital gains fee calculation.
The Investment Advisory Agreement may be terminated at any time, without the payment of any penalty, by a vote of our Board of Directors or the holders of a majority of our shares on 60 days’ written notice to OHA, and would automatically terminate in the event of its “assignment” (within the meaning of the 1940 Act). In addition, OHA may terminate the Investment Advisory Agreement without penalty upon not more than 60 days’ written notice to us. Pursuant to the Investment Advisory Agreement, OHA pays the compensation expense of its investment professionals, who provide management and investment advisory services to us. We bear all other costs and expenses of our operations and transactions.
Administration Agreement
Under the Administration Agreement, OHA furnishes us with certain administrative services, personnel and facilities. The Administration Agreement was most recently approved by our Board of Directors on August 2, 2016. Payments under the Administration Agreement will be equal to our allocable portion of OHA’s overhead in performing its obligations under the Administration Agreement, including all administrative services necessary for our operation and the conduct of our business. The aggregate amount of certain costs and expenses payable by us under the Investment Advisory Agreement and the Administration Agreement for the period from October 1, 2014 to September 30, 2015 shall not exceed $2.5 million (the “Cap”); provided that, generally speaking, interest expense and bank fees, management and incentive fees, legal and professional fees, insurance expenses, taxes and costs related to the change in investment advisor are not subject to the Cap. The Administration Agreement may be terminated at any time, without penalty, by a vote of our Board of Directors or by OHA upon 60 days’ written notice to the other party.
Corporate Information
We are a Maryland corporation organized in July 2004, and we completed our initial public offering in November 2004. Our principal executive office is located at 1114 Avenue of the Americas, 27th floor, New York, New York 10036, and our telephone number is (212) 852-1900. We believe our office facilities are suitable and adequate for our operations as currently conducted and contemplated. Our corporate website is www.ohainvestmentcorporation.com. We make available free of charge on our website our annual report on Form 10-K, quarterly reports on Form 10-Q, current reports on Form 8-K, and all amendments to those reports as soon as reasonably practicable after we electronically file or furnish such material to the SEC. This document includes our website address as an inactive textual reference only, and we do not incorporate the information contained on our website into this Form 10-K.
We have several direct and indirect subsidiaries that are single member limited liability companies and wholly-owned limited partnerships established to hold certain portfolio investments or provide services to us in accordance with specific rules
9
prescribed for a company operating as a RIC. We consolidate the financial results of our wholly-owned subsidiaries for financial reporting purposes, and we do not consolidate the financial results of our portfolio companies.
Item 1A. Risk Factors
An investment in our securities involves a number of significant risks. In addition to the other information contained in this annual report on Form 10-K, you should consider the following information before making an investment in our securities. The risks set forth below are not the only risks we face, and we face other risks which we have not yet identified, which we do not currently deem material or which are not yet predictable. If any of the following events occur, our business, financial condition and results of operations could be materially adversely affected. In such case, our net asset value and the trading price of our securities could decline, and you may lose all or part of your investment.
Risks Related to Our Investments
Continuation of the current decline in oil and natural gas prices and production levels for a prolonged period of time would have a material adverse effect on our investment portfolio.
A significant portion of our portfolio is invested in energy-related businesses. The energy industry has been in a period of disruption and volatility that has been characterized by a decline in oil and natural gas prices and production levels which remain at depressed levels. This disruption and volatility has adversely affected the credit quality and, in some cases, the fair value, of our energy-related investments and impaired the financial condition of the underlying businesses. A prolonged continuation of low oil and natural gas prices and production levels or further declines would likely further significantly affect the business, financial condition, results of operations and cash flows of these businesses and might impair their ability to meet financial commitments to us or to satisfy financial or operating covenants imposed by us or other lenders, which, in turn, could negatively affect our financial condition and results of operations.
In connection with certain bankruptcy proceedings, Bennu Oil & Gas, LLC, the successor in title to ATP Oil & Gas Corporation (“Bennu”) shut down production on the Titan Production Facility (“Titan”) for production with respect to the Telemark field in which we have a limited term royalty interest (“ORRI”) and shut-in all related wells (to the extent such wells were still producing). As a result, production payments on our ORRI have ceased. The Telemark leases and our ORRI are dependent on continued production from the Telemark field. As a result of Bennu's Chapter 7 bankruptcy, it is unclear whether production will continue. If production payments do not resume, we will not recover our full investment in the ORRIs. In addition, certain amounts received by us with respect to the ORRIs remain subject to disgorgement in connection with the ATP litigation, which may adversely affect both our recovery, if any, and our expected return.
In 2011 and 2012, we purchased from ATP Oil & Gas Corporation/(predecessor in title to Bennu), limited-term ORRIs in certain offshore oil and gas producing properties operated by Bennu in the Gulf of Mexico. Under this arrangement, we purchased the right to portions (ranging from 5.0% to 10.8%) of the monthly production proceeds from oil and gas properties known as the Gomez and Telemark properties. The terms of the ORRIs provide that they will terminate after we receive payments that equal our investment in the ORRIs plus a time-value factor that is calculated at a rate of 13.2% per annum.
On November 30, 2016, Bennu filed bankruptcy under Chapter 7 of the U.S. Bankruptcy Code. Bennu is the ultimate parent of Titan, the owner of the floating production platform in the Gulf of Mexico utilized by Bennu for production with respect to the Telemark field in which we have an ORRI. Titan went into involuntary Chapter 11 bankruptcy in September 2016. In November 2016, Bennu shut down production on the Titan platform and shut-in all related wells in anticipation of the Chapter 7 bankruptcy filing. The last monthly production payment we received was with respect to September 2016 production. While production continued for the month of October and a portion of November, it is likely that we will not receive payments with respect to those months. Our ORRI is dependent on continued production from the Telemark field. By law, the leases on the Telemark field will expire 180 days from the date of last production unless production is resumed or a party requests and the government grants a deferral of the requirement to produce. It is unclear whether Bennu or the Chapter 7 trustee will seek or receive such deferral. It is also unclear whether a party will emerge from the Chapter 7 bankruptcy that will continue production. If production payments do not resume, we will not recover our full investment in the ORRIs.
Please refer to “Item 3. Legal Proceedings” for further discussion of the ATP litigation. As of December 31, 2016, our unrecovered investment was $31.1 million, and we had received aggregate production payments of $37.5 million subject to a disgorgement agreement. In addition, as of December 31, 2016, we had incurred legal and consulting fees totaling $5.9 million in connection with the enforcement of our rights under the ORRIs, $5.4 million of which has been added to the unrecovered investment balance under the terms of the ORRI agreements.
Payments not made on the ORRIs for two months of pre-petition production have been delayed, thus extending the time for termination of the ORRI, and may never be made in full. It is also possible that our rights to payments for post-petition
10
production, as well as post-petition payments actually received, could be delayed subject to disgorgement in the bankruptcy proceedings or otherwise adversely affected in ATP’s bankruptcy proceedings, which would adversely affect both our recovery, if any, and our expected return.
Our investment in Castex Energy 2005, LP is subject to a number of associated risks. These include the likelihood that Castex will continue to pay us payment-in-kind, or PIK, rather than cash dividends, which will adversely affect our liquidity and the possibility that the entity through which Castex produces and develops oil and natural gas may undergo a restructuring, asset sale or other transaction that may adversely affect the fair value of our investment in Castex
Our largest investment at December 31, 2016 was a redeemable preferred LP interest in Castex Energy 2005, LP, an oil & natural gas production and development company. Due primarily to the decline in oil and natural gas prices, and pursuant to Castex’s contractual right under its investment agreement with us, this investment has paid PIK rather than cash dividends since July 2015 (and such PIK dividend amounts are added to the principal balance of the investment the month following quarter end) and we expect the company to continue to pay us in PIK in the foreseeable future. As discussed above, when we accrue the quarterly dividends, we recognize investment income for GAAP and tax purposes without receiving cash representing such income. If, as we anticipate, Castex continues to pay PIK dividends due to insufficient projected cash flows, our liquidity will be adversely affected, and we may have greater difficulty meeting our RIC tax requirement to distribute at a minimum 90% of our net ordinary taxable income and realized net short-term capital gains in excess of realized net long-term capital losses, if any. This difficulty is exacerbated by the size of our investment in Castex, whose fair value represents 20% of our total assets at December 31, 2016. Given its size in our portfolio, income from our investment in Castex represents a substantial portion of our annual expected income. We note that the fair value of our investment in Castex decreased from $43.9 million at December 31, 2015 to $32.9 million at December 31, 2016; however, we have not placed this investment on non-accrual status. In addition, the entity through which Castex produces and develops oil and natural gas may undergo a restructuring, asset sale, or other transaction that could adversely affect the fair value of our investment in Castex, and our expected return. There is no guarantee that the outcome of such a transaction would be favorable to us, or would enhance the value of our preferred LP interest. We are subject to the risk that Castex may make business decisions with which we disagree, and that the management may take risks or otherwise act in ways that are adverse to our interests.
Our investment in OCI Holdings, LLC (“OCI”) is subject to risks resulting from Medicare reimbursement rate reductions in the state of Texas that have had a negative impact on OCI’s earnings and cash flow, and the possibility that such reductions may not be rescinded.
OCI’s business as a home health provider of pediatric services to Medicaid patients in Texas has been negatively impacted by Medicaid reimbursement rate reductions implemented by the state of Texas effective December 15, 2016. Even prior to the implementation of these reductions, OCI experienced pressures on rates in certain parts of their business and reductions in visit volumes. Advocacy groups continue to challenge the Medicare reimbursement rate reductions and are asking the Texas Legislature to restore funding in its upcoming legislative session. However, there is no guarantee that the Texas Legislature will do so. Therefore, the long-term impact to OCI remains uncertain. These developments have had, and may continue to have, a negative impact on the fair value of our subordinated note and Class A units, which totaled $17.2 million, representing 16.3% of the total fair value of our portfolio investments as of December 31, 2016.
The energy industry is subject to many risks.
We have a significant concentration of investments in the energy industry. The revenues, income (or losses), cash flows and valuations of energy companies can fluctuate suddenly and dramatically due to any one or more of the following factors:
Commodity Pricing Risk. In general, commodity prices, such as the market prices of crude oil, natural gas, coal and wholesale electricity, directly affect energy companies especially those that own the underlying energy commodity. In addition, the volatility of commodity prices can affect other energy companies due to the impact of prices on the volume of commodities produced, transported, processed, stored or distributed and on the cost of fuel for power generation companies. The volatility of commodity prices can also affect energy companies’ ability to borrow money or access the capital markets in light of the expectation that their performance is directly tied to commodity prices. Historically, energy commodity prices have been cyclical and have recently exhibited significant volatility. Some of our portfolio companies may not engage in hedging transactions to minimize their exposure to commodity price risk. Those companies that engage in such hedging transactions remain subject to market risks, including market liquidity and counterparty creditworthiness.
Regulatory Risk. Changes in the regulatory environment could adversely affect the cash flows and profitability of energy companies. Federal, state and local governments heavily regulate the businesses of energy companies in diverse matters, such as the way in which energy assets are constructed, maintained and operated, environmental regulations and requirements, and the prices energy companies may charge for their products and services. Many of these laws provide for civil penalties as well as regulatory remediation, thus adding to the potential liability an energy company may face. In addition, these regulations can change over time, including in scope and intensity. Additionally, certain states in which our portfolio companies operate have
11
adopted, or are considering adopting, new or more stringent disclosure and additional well-location and well-construction requirements related to production operations.
Production Risk. The volume of crude oil, natural gas or other energy commodities available for producing, transporting, processing, storing, distributing or generating power may materially impact the cash flows and profitability of energy companies. A significant decrease in the production of crude oil, natural gas or other energy commodities, due to the decline of production from existing facilities, depressed commodity prices, political events, OPEC actions or otherwise, could reduce revenue and operating income or increase operating costs of energy companies and, therefore, their ability to service debt or pay dividends. Similarly, the excess production of crude oil, natural gas or other energy commodities may result in the decline in the prices of these commodities, which could negatively impact the results of operations and financial condition of operating companies.
Demand Risk. A sustained decline in demand for crude oil, natural gas, refined petroleum products, coal and electricity may materially affect the cash flows and profitability of energy companies. Factors that could lead to a decrease in market demand include a recession or other adverse economic conditions, increases in the market price of the underlying commodity, higher taxes or other regulatory actions that increase costs or shifts in consumer demand for such products. The long-term effect of a decline in demand is uncertain and may adversely impact a portfolio company’s ability to satisfy financial or operating covenants imposed by us or other lenders.
Depletion and Exploration Risk. A portion of an energy company’s assets may consist of natural gas, crude oil and/or coal reserves and other commodities that naturally deplete over time. Depletion could have a material adverse impact on such company’s ability to service its debt or pay dividends. Further, estimates of energy reserves may not be accurate and, even if accurate, reserves may not be produced profitably, or at all. In addition, exploration of energy resources, especially of oil and natural gas, is inherently risky and requires large amounts of capital.
Weather Risk. Unseasonable extreme weather patterns could result in significant volatility in demand for energy and power or may directly affect the operations of individual companies. In addition, natural disasters, including hurricanes, could damage offshore production platforms or coastal oil or natural gas gathering or transmission facilities, causing delays or disruption in the flows of oil and natural gas to the marketplace. These weather-related risks may create fluctuations in earnings of energy companies.
Operational Risk. Energy companies are subject to various operational risks, such as failed drilling or well development, unscheduled outages, underestimated cost projections, unanticipated operation and maintenance expenses, failure to obtain the necessary permits to operate and failure of third-party contractors (including energy producers and shippers) to perform their contractual obligations. In addition, energy companies employ a variety of means of increasing cash flow, including increasing utilization of existing facilities, expanding operations through new construction, expanding operations through acquisitions, or securing additional long-term contracts. Thus, some energy companies may be subject to construction risk, acquisition risk or other risks arising from their specific business strategies and operations.
Competition Risk. Our energy related portfolio companies face substantial competition in executing their strategies and operations, including in acquiring properties, enhancing and developing their assets, marketing their commodities, securing trained personnel and operating their properties. Many of their competitors, including major oil companies, natural gas utilities, independent power producers and other private independent energy companies, generally have financial and other resources that substantially exceed their resources. Our energy related portfolio companies may face greater competition in the production, marketing and selling of power and energy products brought about in part from the deregulation of the energy markets.
Valuation Risk. The valuations of our energy related portfolio companies are based, in significant part, on the value of their assets. The valuations of the assets of our energy related portfolio companies are subject to uncertainties inherent in estimating quantities of reserves of oil and natural gas and in projecting future rates of production and the timing of development expenditures, which are dependent upon many factors beyond our control. The estimates rely on various assumptions, including, for example, commodity prices, operating expenses, capital expenditures and the availability of funds, and are therefore inherently imprecise indications of future net cash flows. Actual future production, cash flows, taxes, operating expenses, development expenditures and quantities of recoverable reserves may vary substantially from those assumed in the estimates. Any significant variance in these assumptions could materially affect the value of our investments.
Climate Change. There is some evidence of global climate change. Climate change creates physical and financial risk and some of our portfolio companies may be adversely affected by climate change. For example, the needs of customers of energy companies vary with weather conditions, primarily temperature and humidity. To the extent climate changes affect weather conditions, energy use could increase or decrease depending on the duration and magnitude of any changes. Increased energy use due to weather changes may require additional investments by our portfolio companies in more pipelines and other infrastructure to serve increased demand. A decrease in energy use due to weather changes may affect the financial condition and cash flows of our energy related portfolio companies. Extreme weather conditions in general require more system backup,
12
adding to costs, and can contribute to increased system stresses, including service interruptions. Potential lawsuits against or taxes or other regulatory costs imposed on greenhouse gas emitters could also affect energy companies, based on links drawn between greenhouse gas emissions and climate change.
Disruption and instability in U.S. or global capital markets could materially and adversely affect our business.
The U.S. and global capital markets experienced extreme volatility and disruption during the economic downturn that began in mid-2007, and the U.S. economy was in a recession for several consecutive calendar quarters during the same period. In 2010, a financial crisis emerged in Europe, triggered by high budget deficits and rising direct and contingent sovereign debt, which created concerns about the ability of certain nations to continue to service their sovereign debt obligations. More recently, the implications of the United Kingdom’s referendum decision to the European Union (“Brexit”) and the policies of the new U.S. presidential administration remain unclear. These market and economic disruptions affected, and these and other similar market and economic disruptions may in the future affect, the U.S. capital markets, which could adversely affect our business and that of our portfolio companies, and have reduced the availability of debt and equity capital for the market as a whole and to financial firms, in particular. At various times, these disruptions resulted in, and may in the future result, increased spreads between the yields realized on riskier debt securities and those realized on securities perceived to be risk-free, a lack of liquidity in parts of the debt capital markets, significant write-offs in the financial services sector and the repricing of credit risk. These conditions may reoccur for a prolonged period of time again or materially worsen in the future, including as a result of U.S. government shutdowns or further downgrades to the U.S. government’s sovereign credit rating or the perceived credit worthiness of the United States or other large global economies. Unfavorable economic conditions, including future recessions, also could increase our funding costs, limit our access to the capital markets or result in a decision by lenders not to extend credit to us. We may in the future have difficulty accessing debt and equity capital on attractive terms, or at all, and a severe disruption and instability in the global financial markets or deteriorations in credit and financing conditions may cause us to reduce the volume of loans we originate and/or fund, adversely affect the value of our portfolio investments or otherwise have a material adverse effect on our business, financial condition and results of operations.
Our investments are risky and highly speculative.
We invest primarily in senior and junior secured, unsecured and subordinated loans and preferred stock of U.S. private and public middle market companies. However, we may also invest in equity, distressed debt and other assets.
Senior Secured Loans. When we make a senior secured debt investment in a portfolio company, we generally take a security interest in the available assets of the portfolio company, including the equity interests of its subsidiaries, which we expect to help mitigate the risk that we will not be repaid. However, there is a risk that the collateral securing our investment may decrease in value over time, may be difficult to sell in a timely manner, may be difficult to appraise and may fluctuate in value based upon the success of the business and market conditions, including as a result of the inability of the portfolio company to raise additional capital. In some circumstances, our lien could be subordinated to claims of other creditors. In addition, deterioration in a portfolio company’s financial condition and prospects, including its inability to raise additional capital, may be accompanied by deterioration in the value of the collateral for the loan. Consequently, the fact that an investment is secured does not guarantee that we will receive principal and interest payments according to the contractual terms, or at all, or that we will be able to collect on the investment should we enforce our remedies.
Junior Secured Debt. Junior secured debt investments are secured debt investments (including second lien loans) that rank after senior secured debt in priority of payment. As other creditors may rank senior to any junior secured debt held by us in the event of insolvency, junior secured debt may have an above average amount of risk and volatility or loss of principal.
Unsecured Debt. Unsecured debt investments do not benefit from a security interest in the assets of the portfolio company. As such, in the event of insolvency, any secured creditors of the portfolio company would have priority over us with respect to the proceeds from the sale of such company’s assets and the proceeds from such sale may not be sufficient to repay our debt.
Subordinated Debt. Subordinated debt investments are debt investments in which the holder has contractually agreed to be subordinated to other creditors. As such, in the event of insolvency, any creditor with a security interest or who ranks senior to the subordinated debt under the agreement governing the debt, including certain unsecured creditors, would have priority over us with respect to the proceeds from the sale of the portfolio company’s assets, and the proceeds from such sale may not be sufficient to repay our debt.
Preferred Stock and Other Equity Investments. We may invest directly in the equity securities of portfolio companies. In addition, when we invest in loans and other debt securities, we may acquire common or preferred equity securities as well. Our goal is generally to exit such equity interests and realize gains upon our disposition of interests. However, the equity interests we receive may not appreciate in value and may end up declining in value. Accordingly, we may not be able to realize gains from our equity interests, and any gains that we do realize on the disposition of any equity interests may not be sufficient to
13
offset any other losses we experience. Our largest investment at December 31, 2016 was a preferred participating interest in Castex Energy 2005, LP, in which the fair value of our investment was $32.9 million at December 31, 2016.
Distressed Debt. We may from time to time invest in distressed debt or the loans that we hold may become distressed. Distressed debt investments may not produce income, may require us to bear certain expenses to protect our investment and may subject us to uncertainty as to when, in what manner and for what value such distressed debt will eventually be satisfied.
Middle-Market Companies. Investing in middle market companies involves a number of significant risks, including:
• | such companies may have limited financial resources and may be unable to meet their obligations under their debt securities that we hold, which may be accompanied by a deterioration in the value of any collateral and a reduction in the likelihood of us realizing on any guarantees we may have obtained in connection with our investment; |
• | such companies typically have shorter operating histories, narrower product lines and smaller market shares than larger businesses, which tend to render them more vulnerable to competitors’ actions and market conditions, as well as general economic downturns; |
• | such companies are more likely to depend on the management talents and efforts of a small group of persons; therefore, the death, disability, resignation or termination of one or more of these persons could have a material adverse impact on our portfolio company and, in turn, on us; |
• | limited public information exists about many of these companies and, if OHA’s investment professionals are unable to uncover all material information necessary to evaluate the potential returns from investing in such companies, we may not make a fully informed investment decision, and we may lose money on our investments; |
• | such companies generally have less predictable operating results, may from time to time be parties to litigation, may be engaged in rapidly changing businesses with products subject to a substantial risk of obsolescence, and may require substantial additional capital to support their operations, finance expansion or maintain their competitive position; and |
• | such companies may have difficulty accessing the capital markets to meet future capital needs, which may limit their ability to grow or to repay their outstanding indebtedness, including any debt securities held by us, upon maturity. |
Our portfolio is concentrated in a limited number of portfolio companies and industries (and is currently concentrated in the energy industry), which will subject us to a risk of significant loss if any of these companies performs poorly or defaults on its obligations under any of its debt instruments or if there is a downturn in a particular industry.
We are classified as a non-diversified management investment company within the meaning of the 1940 Act, which means that we are not limited by the 1940 Act with respect to the proportion of our assets that we may invest in securities of a single issuer. Beyond the asset diversification requirements associated with our qualification as a RIC under Subchapter M of the Code, we do not have fixed guidelines for diversification. Our portfolio is currently concentrated in a limited number of portfolio companies. For example, as of December 31, 2016, a single portfolio company, Castex Energy 2005, LP, and a single industry segment, Oil & Natural Gas Production and Development, represented 31% and 38% of our portfolio investments (excludes $40.0 million of our investments in U.S. Treasury Bills) at fair value, respectively. As a result, the aggregate returns we realize may be significantly adversely affected if a small number of investments perform poorly or if we need to write down the value of any one investment. Additionally, a downturn in any particular industry, such as the energy industry, in which we are invested could also significantly impact our net asset value and the aggregate returns we realize.
Our investments in securities rated below investment grade are speculative in nature and are subject to additional risk factors such as increased possibility of default, illiquidity of the security, and changes in value based on changes in interest rates.
We typically invest in securities that are not rated by any rating agency, but we believe that if such securities were rated, they would be below investment grade (rated lower than “Baa3” by Moody’s Investors Service, lower than “BBB-” by Fitch Ratings or lower than “BBB-” by Standard & Poor’s Ratings Services). Securities rated below investment grade are often referred to as “leveraged loans,” “high yield” or “junk” securities and are regarded as having predominantly speculative characteristics with respect to the issuer’s capacity to pay interest and repay principal in accordance with the terms of the obligations. Securities rated below investment grade generally offer a higher current yield than that available from investment grade securities but typically involve greater risk. These securities are especially sensitive to adverse changes in general economic conditions, to changes in the financial condition of their issuers and to price fluctuation in response to changes in interest rates. During periods of economic downturn or rising interest rates, issuers of below investment grade instruments may experience financial stress that could adversely affect their ability to make payments of principal and interest and increase the possibility of default. In addition, the secondary market for below-investment grade securities may not be as liquid as the secondary market for more highly rated securities.
14
Many of our portfolio companies may incur debt that ranks equally with, or senior to, our investments and debt securities in such companies and such portfolio companies may not generate sufficient cash flow to service their debt obligations to us.
We have invested a portion of our capital in second lien, subordinated and unsecured debt securities issued by our portfolio companies and intend to continue to do so in the future. Such portfolio companies usually have, or may be permitted to incur, other debt that ranks equally with, or senior to, the debt securities in which we invest. Such subordinated investments are subject to greater risk of default than senior obligations as a result of adverse changes in the financial condition of the obliger or in general economic conditions. If we make a subordinated investment in a portfolio company, the portfolio company may be highly leveraged, and its relatively high debt-to-equity ratio may create increased risks that its operations might not generate sufficient cash flow to service all of its debt obligations. By their terms, senior debt instruments may provide that the holders are entitled to receive payment of interest or principal on or before the dates on which we are entitled to receive payments in respect of the debt securities in which we invest. Also, in the event of insolvency, liquidation, dissolution, reorganization or bankruptcy of a portfolio company, holders of debt instruments ranking senior to our investment in that portfolio company would typically be entitled to receive payment in full before we receive any distribution in respect of our investment. After repaying senior creditors, the portfolio company may not have any remaining assets to use for repaying its obligation to us where we are junior creditor. In the case of debt ranking equally with debt securities in which we invest, we would have to share any distributions on an equal and ratable basis with other creditors holding such debt in the event of an insolvency, liquidation, dissolution, reorganization or bankruptcy of the relevant portfolio company.
Additionally, certain loans that we make to portfolio companies may be secured on a second priority basis by the same collateral securing senior secured debt of such companies. The first priority liens on the collateral will secure the portfolio company’s obligations under any outstanding senior debt and may secure certain other future debt that may be permitted to be incurred by the portfolio company under the agreements governing the loans. The holders of obligations secured by first priority liens on the collateral will generally control the liquidation of, and be entitled to receive proceeds from any realization of, the collateral to repay their obligations in full before we would. In addition, the value of the collateral in the event of liquidation will depend on market and economic conditions, the availability of buyers and other factors. There can be no assurance that the proceeds, if any, from sales of all of the collateral would be sufficient to satisfy the loan obligations secured by the second priority liens after payment in full of all obligations secured by the first priority liens on the collateral. If such proceeds were not sufficient to repay amounts outstanding under the loan obligations secured by the second priority liens, then we, to the extent not repaid from the proceeds of the sale of the collateral, will only have an unsecured claim against the portfolio company’s remaining assets, if any.
We have made in the past, and may make in the future, unsecured loans to portfolio companies, meaning that such loans will not benefit from any interest in the collateral of such companies. Liens on a portfolio company’s collateral, if any, will secure the portfolio company’s obligations under its outstanding secured debt and may secure certain future debt that is permitted to be incurred by the portfolio company under its secured loan agreements. The holders of obligations secured by such liens will generally control the liquidation of, and be entitled to receive proceeds from any realization of, such collateral to repay their obligations in full before we would. In addition, the value of such collateral in the event of liquidation will depend on market and economic conditions, the availability of buyers and other factors. There can be no assurance that the proceeds, if any, from sales of such collateral would be sufficient to satisfy our unsecured loan obligations after payment in full of all loans secured by collateral. If such proceeds were not sufficient to repay the outstanding secured loan obligations, then our unsecured claims would rank equally with the unpaid portion of such secured creditors’ claims against the portfolio company’s remaining assets, if any.
The rights we may have with respect to the collateral securing the loans we make to our portfolio companies with senior debt outstanding may also be limited pursuant to the terms of one or more intercreditor agreements that we enter into with the holders of such senior debt. Under a typical intercreditor agreement, at any time that obligations that have the benefit of the first priority liens are outstanding, any of the following actions that may be taken in respect of the collateral will be taken at the direction of the holders of the obligations secured by the first priority liens:
• | the ability to cause the commencement of enforcement proceedings against the collateral; |
• | the ability to control the conduct of such proceedings; |
• | the approval of amendments to collateral documents; |
• | releases of liens on the collateral; and |
• | waivers of past defaults under collateral documents. |
We may not have the ability to control or direct such actions, even if our rights are adversely affected.
Price declines and illiquidity in the corporate debt markets may adversely affect the fair value of our portfolio investments, reducing our net asset value through increased unrealized depreciation.
As a BDC, we are required to carry our investments at market value or, if no market value is ascertainable, at fair value as determined in good faith by or under the direction of our Board of Directors and in accordance with generally accepted
15
accounting principles. Decreases in the market values or fair values of our investments are recorded as unrealized depreciation. Any unrealized depreciation in our loan portfolio could be an indication of a portfolio company’s inability to meet its repayment obligations to us with respect to the affected loans. This could result in realized losses in the future and ultimately in reductions of our income available for distribution in future periods and could materially adversely affect our ability to service our outstanding borrowings. Depending on market conditions, we could incur substantial losses in future periods, which could reduce our net asset value and have a material adverse impact on our business, financial condition and results of operations.
The majority of our portfolio investments are recorded at fair value as determined in good faith by our Board of Directors and, as a result, there may be uncertainty as to the value of our portfolio investments.
The majority of our portfolio investments take the form of securities that are not publicly traded. The fair value of securities and other investments that are not publicly traded may not be readily determinable, and we value these securities at fair value as determined in good faith by our Board of Directors, including to reflect significant events affecting the value of our securities. A majority of our investments are classified as Level 3 under ASC Topic 820. This means that our portfolio valuations are based on unobservable inputs and our own assumptions about how market participants would price the asset or liability in question. Inputs into the determination of fair value of our portfolio investments require significant management judgment or estimation. Even if observable market data are available, such information may be the result of consensus pricing information or broker quotes, which may include a disclaimer that the broker would not be held to such a price in an actual transaction. The non-binding nature of consensus pricing and/or quotes accompanied by disclaimers materially reduces the reliability of such information.
Because such valuations are inherently uncertain, may fluctuate over short periods of time and may be based on estimates, our determinations of fair value may differ materially from the values that would have been used if a ready market for these securities existed. Our net asset value could be adversely affected if our determinations regarding the fair value of our investments were materially higher than the values that we ultimately realize upon the disposal of such securities.
We adjust quarterly the valuation of our portfolio to reflect our Board of Directors’ determination of the fair value of each investment in our portfolio. Any changes in fair value are recorded in our consolidated statement of operations as net unrealized appreciation (depreciation) on investments.
The lack of liquidity in our investments may adversely affect our business.
A substantial portion of our investments are and will be subject to legal and other restrictions on resale or will otherwise be less liquid than more broadly traded public securities. The illiquidity of these investments may make it difficult for us to sell such investments if the need arises. In addition, if we are required to liquidate all or a portion of our portfolio quickly, we may realize significantly less than the value at which we have previously recorded our investments.
Generally we do not hold controlling equity interests in our portfolio companies, and therefore, we may not be in a position to exercise control over our portfolio companies or to prevent decisions by management of our portfolio companies that could decrease the value of our investments.
To the extent we do not hold a controlling equity position in a portfolio company, we are subject to the risk that a portfolio company in which we do not have a controlling interest may make business decisions with which we disagree, and that the management and/or stockholders of such portfolio company may take risks or otherwise act in ways that are adverse to our interests. Due to the lack of liquidity of the debt and equity investments that we typically hold in our portfolio companies, we may not be able to dispose of our investments in the event we disagree with the actions of a portfolio company and may therefore suffer a decrease in the value of our investments.
Prepayments of our debt investments by our portfolio companies could adversely impact our results of operations and reduce our return on equity.
We are subject to the risk that the investments we make in our portfolio companies may be prepaid prior to maturity. We may use the proceeds from such prepayments to reduce our outstanding borrowings or invest such proceeds in temporary investments, pending their future investment in new portfolio companies. These temporary investments, if any, will typically have substantially lower yields than the debt investment being prepaid, and we could experience significant delays in reinvesting these amounts. Any future investment in a new portfolio company may be at lower yields than the debt investment that was prepaid. As a result, our results of operations could be materially adversely affected if one or more of our portfolio companies elect to prepay amounts owed to us. Additionally, prepayments could negatively impact our return on equity, which could result in a decline in the market price of our common stock.
Our portfolio companies may be unable to repay or refinance outstanding principal on their loans at or prior to maturity, and rising interests rates may make it more difficult for portfolio companies to make periodic payments on their loans.
Our portfolio companies may be unable to repay or refinance outstanding principal on their loans at or prior to maturity. This risk and the risk of default is increased to the extent that the loan documents do not require the portfolio
16
companies to pay down the outstanding principal of such debt prior to maturity. In addition, if general interest rates rise, there is a risk that our portfolio companies will be unable to pay escalating interest amounts, which could result in a default under our investment. Rising interest rates could also cause portfolio companies to shift cash from other productive uses to the payment of interest, which may have a material adverse effect on their business and operations and could, over time, lead to increased defaults. Any failure of one or more of our portfolio companies to repay or refinance its debt at or prior to maturity or the inability of one or more portfolio companies to make ongoing payments, including as a result of an increase in contractual interest rates, could have a material adverse effect on our business, financial condition and results of operations.
We may choose to waive or defer enforcement of covenants in the debt securities held in our portfolio, which may cause us to lose all or part of our investment in these companies.
We structure the debt investments in our portfolio companies to include business and financial covenants placing affirmative and negative obligations on the operation of the company’s business and its financial condition. However, from time to time we may elect to waive breaches of these covenants, including our right to payment, or waive or defer enforcement of remedies, such as acceleration of obligations or foreclosure on collateral, depending upon the financial condition and prospects of the particular portfolio company. These actions may reduce the likelihood of our receiving the full amount of future payments of interest or principal and may be accompanied by a deterioration in the value of the underlying collateral, as many of these companies may have limited financial resources, may be unable to meet future obligations and may go bankrupt. This could negatively impact our ability to pay distributions and could adversely affect our business, financial condition, and results of operations.
Our loans could be subject to equitable subordination by a court or we could be subject to lender liability claims.
Courts may apply the doctrine of equitable subordination to subordinate the claim or lien of a lender against a borrower to claims or liens of other creditors of the borrower, when the lender or its affiliates is found to have engaged in unfair, inequitable or fraudulent conduct. The courts have also applied the doctrine of equitable subordination when a lender or its affiliates is found to have exerted inappropriate control over the borrower, including control resulting from the ownership of equity interests in a client. We have in the past made, and from time to time in the future make, direct equity investments or received warrants in connection with loans. Payments on one or more of our loans, particularly a loan to a borrower in which we also hold an equity interest, may be subject to claims of equitable subordination. If we were deemed to have the ability to control or otherwise exercise influence over the business and affairs of one or more of our portfolio companies (including through the provision of managerial assistance to that portfolio company) resulting in economic hardship to other creditors of that company, this control or influence may constitute grounds for equitable subordination and a court may treat one or more of our secured loans as if it were unsecured or common equity in the portfolio company. In that case, if the portfolio company were to liquidate, we would be entitled to repayment of our loan on a pro-rata basis with other unsecured debt or, if the effect of subordination was to place us at the level of common equity, then on an equal basis with other holders of the portfolio company’s common equity only after all of its obligations relating to its debt and preferred securities had been satisfied.
In addition, lenders in certain cases can be subject to lender liability claims for actions taken by them when they become too involved in the borrower’s business or exercise control over a borrower. It is possible that we could become subject to a lender’s liability claim, including as a result of actions taken if we render managerial assistance to the borrower.
We may hold the debt securities of leveraged companies that may enter into bankruptcy proceedings.
Leveraged companies may experience bankruptcy or similar financial distress. The bankruptcy process has a number of significant inherent risks, including difficulties estimating contingent claims. Many events in a bankruptcy proceeding are the product of contested matters and adversary proceedings and are beyond the control of the creditors, and our influence on the process may be limited. A bankruptcy filing by a portfolio company may adversely and permanently affect the portfolio company. If the proceeding is converted to a liquidation, the value of the portfolio company may not equal the liquidation value that was believed to exist at the time of the investment. The duration of a bankruptcy proceeding is also difficult to predict, and a creditor’s return on investment can be adversely affected by delays until the plan of reorganization or liquidation ultimately becomes effective. The administrative costs of a bankruptcy proceeding are frequently high and would be paid out of the debtor’s estate prior to any return to creditors.
Two of our portfolio companies, Bennu and Shoreline Energy, LLC, are currently involved in bankruptcy proceedings.
We make loans that include PIK interest or dividends or accretion of original issue discount provisions, which could increase the risk of default by our portfolio companies.
Some of the loans we make or acquire provide for the payment by portfolio companies of PIK interest or dividends or accreted original issue discount at maturity. Such loans have the effect of deferring a portfolio company’s payment obligation until the end of the term of the loan, which may make it difficult for us to identify and address developing problems with a portfolio company in terms of its ability to repay us. Particularly in a rising interest rate environment, loans containing PIK and original issue discount provisions can give rise to negative amortization on a loan, resulting in a borrower owing more at the
17
end of the term of a loan than what it owed when the loan was originated. Any such developments may increase the risk of default on our loans by borrowers. In addition, loans containing PIK may have unreliable valuations because their continuing accruals require continuing judgments about the collectability of the deferred payments and the value of any associated collateral.
In addition, to the extent that we invest in original issue discount instruments and the accretion of original issue discount constitutes a portion of our income, we will be exposed to risks associated with the requirement to include such non-cash income in taxable and accounting income prior to receipt of cash, including that, for accounting purposes, cash distributions to investors representing original issue discount income do not come from paid-in capital, although they may be paid from the offering proceeds. As a result, although a distribution of original issue discount income may come from the cash invested by investors, the 1940 Act does not require that investors be given notice of this fact.
We are subject to risks associated with our investments in CLOs.
We are currently invested, and may in the future invest, in the subordinated debt or equity of CLOs, which involves a number of significant risks. Generally, there may be less information available to us regarding the underlying debt investments held by CLOs than if we had invested directly in the debt of the underlying companies. As a result, our stockholders will not know the details of the underlying securities of the CLOs in which we invest.
CLOs are typically highly levered, which magnifies the adverse impact of any defaults by the senior secured loans underlying our investment in the CLO. While investors in CLOs indirectly bear risks of the underlying debt investments held by such CLOs, we generally have the right to receive payments only from the CLOs, and generally do not have direct rights against the underlying borrowers or the entity that sponsored the CLOs.
In addition to the general risks associated with investing in debt securities, CLOs carry additional risks, including: (i) the possibility that distributions from the underlying loans will not be adequate to make interest or other payments; (ii) the quality of the underlying loans may decline in value or default; and (iii) the complex structure of the security may not be fully understood at the time of investment and may produce disputes with the CLO or unexpected investment results. CLO securities are typically privately offered and thinly traded. Further, our investments in the subordinated debt or equity of a CLO will be subordinate to the senior debt securities of such CLO. We held one investment in a CLO, Gramercy Park CLO, Ltd., with a fair value of $1.8 million, which represents 2% of our portfolio investments, as of December 31, 2016.
We may incur risk with respect to investments we acquire through assignments or participations of interests.
We have in the past acquired, and may in the future acquire, loans through assignments or participations of interests in such loans. The purchaser of an assignment typically succeeds to all the rights and obligations of the assigning institution and becomes a lender under the credit agreement with respect to such debt obligation. However, where we acquire an assignment or participation interest, our rights may be more restricted than those of the assigning institution, and we may not be able to unilaterally enforce all rights and remedies under an assigned debt obligation and with regard to any associated collateral. A participation typically results in a contractual relationship only with the institution participating out the interest, such as a bank or broker-dealer, and not directly with the borrower, and we may not directly benefit from the collateral supporting the debt obligation in which we have purchased the participation. As a result, we will be exposed to the credit risk of both the borrower and the institution selling the participation. Further, in purchasing participations, we may not be able to conduct the same level of due diligence on a borrower or the quality of the loan with respect to which we are buying a participation as we would conduct if we were investing directly in the loan. This difference may result in us being exposed to greater credit risk with respect to such loans than we expected when initially purchasing the participation.
Economic downturns or recessions could impair our portfolio companies’ operations and ability to satisfy obligations to their respective lenders, including us, which could negatively impact our ability to pay dividends.
The conditions and overall strength of the international, national and regional economies, including interest rate fluctuations, changes in capital markets and changes in the prices of their primary commodities and products, generally affects our portfolio companies. These factors could adversely impact the results of operations of our portfolio companies.
Our portfolio companies may be susceptible to economic downturns or recessions and may be unable to satisfy financial covenants or to repay our loans during these periods. Adverse economic conditions also may decrease the value of collateral securing our loans and the value of our equity investments. Economic downturns or recessions could lead to financial losses in our portfolio and decreases in revenues, net income and assets. A portfolio company’s failure to satisfy financial or operating covenants imposed by us or other lenders could lead to defaults and, potentially, termination of its loans and foreclosure on the assets securing such loans, which could trigger cross-defaults under other agreements and jeopardize our portfolio company’s ability to meet its obligations under the debt securities that we hold and adversely impact the value of any equity securities we own. These events could temporarily or permanently reduce the fair value of certain of our investments, prevent us from making additional investments and harm our operating results or ability to pay dividends.
18
Risks Relating to Our Business and Structure
We operate in a highly competitive market for investment opportunities.
A number of entities compete with us to make the types of investments that we target. We compete with other BDCs, public and private investment funds, commercial and investment banks, commercial financing companies and, to the extent they provide an alternative form of financing, private equity and hedge funds. Some of our competitors are substantially larger and may have greater financial, technical and marketing resources than we have. For example, some competitors may have a lower cost of funds and access to funding sources that are not available to us. In addition, some of our competitors may have higher risk tolerances or different risk assessments than we do, which could allow them to consider a wider variety of investments and establish more portfolio relationships than we do. Furthermore, many of our competitors are not subject to the regulatory restrictions that the 1940 Act and the Code impose on us as a BDC and a RIC, respectively.
The competitive pressures we face may have a material adverse effect on our business, financial condition and results of operations. As a result of this competition, we may not be able to take advantage of attractive investment opportunities from time to time, and we may not be able to identify and make investments that are consistent with our investment objectives. If we are unable to source attractive investments, we may hold a greater percentage of our assets in cash or operate with less leverage than anticipated, which could impact potential returns on our portfolio.
We do not seek to compete primarily based on the interest rates we will offer, and we believe that some of our competitors may make loans with interest rates that will be comparable to or lower than the rates we offer. We may lose investment opportunities if we do not match our competitors’ pricing, terms and structure. However, if we match our competitors’ pricing, terms and structure, we may experience decreased net investment income and increased risk of credit loss.
We are dependent upon senior management personnel of OHA and on OHA’s ability to hire and retain qualified personnel.
We depend on our investment management team, which is provided by OHA, for the identification, final selection, structuring, closing and monitoring of our investments. Our investment team at OHA is integral to our asset management activities and has critical industry experience and relationships that we rely on to implement our business plan. Our future success depends on continued service to OHA of our investment team and/or additional qualified personnel. The departure of any of the members of OHA’s investment team could have a material adverse effect on our ability to achieve our investment objective. As a result, we may not be able to operate our business as we expect, and our ability to compete could be harmed, which could cause our operating results to suffer.
Our business model depends to a significant extent upon strong referral relationships with financial sponsors, and the inability of OHA to maintain or develop these relationships, or the failure of these relationships to generate investment opportunities, could adversely affect our business.
We expect that OHA will maintain and develop their relationships with financial sponsors, and we will rely to a significant extent upon these relationships to provide us with potential investment opportunities. If OHA fails to maintain its existing relationships or develop new relationships with other sponsors or sources of investment opportunities, we will not be able to grow our investment portfolio. In addition, individuals with whom OHA has relationships are not obligated to provide us with investment opportunities, and, therefore, there is no assurance that such relationships will generate investment opportunities for us. If OHA is unable to source investment opportunities, we may hold a greater percentage of our assets in cash than anticipated, which could impact potential returns on our portfolio.
OHA has limited experience managing a BDC.
OHA had not managed a BDC prior to September 30, 2014, and the investment philosophy and techniques used by OHA and its investment professionals to manage us may differ from the investment philosophy and techniques employed by our previous investment advisor and its investment professionals. In addition, the 1940 Act imposes numerous constraints on the operations of BDCs that do not apply to the other types of investment vehicles managed by OHA. For example, under the 1940 Act, BDCs are generally required to invest at least 70% of their total assets primarily in securities of qualifying U.S. private or small capitalization companies. OHA’s lack of experience in managing a portfolio of assets under these specific constraints may hinder our ability to take advantage of attractive investment opportunities and, as a result, achieve our investment objectives. As a result, an investment in shares of our common stock may entail more risk than the shares of common stock of a comparable company with an investment advisor with more experience in managing a BDC.
There are significant potential conflicts of interest which could adversely impact our investment returns.
Our executive officers and directors, and certain investment professionals of OHA, serve or may serve as officers, directors, principals or investment professionals of entities that operate in the same or a related line of business as we do or of
19
investment funds managed by our affiliates. OHA and its affiliates also manage private investment funds, and may manage other funds in the future, that have investment objectives or mandates that are similar, in whole and in part, to ours. Accordingly, such individuals and OHA may have obligations to investors in those entities, the fulfillment of which might not be in the best interests of us or our stockholders. For example, the principals of OHA may face conflicts of interest in the allocation of investment opportunities to us and such other funds.
OHA has adopted an investment allocation policy that governs the allocation of investment opportunities among the investment funds (including us) that are managed by OHA and its affiliates. To the extent an investment opportunity is appropriate for us or any other investment fund managed by OHA or its affiliates, OHA will adhere to its investment allocation policy in order to determine the allocation of such opportunity among the various investment funds. Although OHA’s investment professionals will endeavor to allocate investment opportunities in a fair and equitable manner, we and our stockholders could be adversely affected to the extent investment opportunities are allocated among us and other investment vehicles managed or sponsored by, or affiliated with, investment professionals of OHA, our executive officers and directors.
BDCs generally are not permitted to co-invest on a concurrent basis with certain affiliated entities in the absence of an exemptive order from the U.S. Securities and Exchange Commission, or the SEC. However, BDCs are permitted to and may simultaneously co-invest in transactions where price is the only negotiated point. In an order dated April 25, 2016, the SEC granted exemptive relief permitting us, subject to the satisfaction of certain conditions, to co-invest in certain investment transactions with certain OHA affiliates where terms other than price are negotiated. We believe this relief will enhance our ability to further our investment objectives and strategy and may also increase favorable investment opportunities for us, in part, by allowing us to participate in larger investments, together with our co-investment affiliates, than would be available to us if such relief had not been obtained. However, there can be no assurance that such exemptive relief will permit us to fully achieve these goals.
OHA’s investment allocation policy is also designed to manage and mitigate conflicts of interest associated with the allocation of investment opportunities if we are able to co-invest, either pursuant to SEC interpretive positions or our exemptive order, with other funds managed by OHA or its affiliates. Under the investment allocation policy, if we are permitted to co-invest pursuant to an exemptive order, co-investments would be allocated pursuant to the conditions of the exemptive order.
Generally, for any initial allocation of a purchase under the investment allocation policy, if we are able to co-invest pursuant to SEC interpretive positions, a portion of each opportunity that is appropriate for us and any affiliated fund will be offered to us and such other affiliated fund and other participating portfolios as determined by OHA based on two inputs: (i) available capital (which includes available cash, unfunded capital commitments and, at the discretion of OHA, leverage) and (ii) maximum issuer or asset class concentration sizes (which is determined at the discretion of OHA, taking into consideration account investment guidelines and other factors). Other factors may be considered, including but not limited to account size and diversification. Initial trade allocations may be adjusted by OHA in making a final allocation determination, including in cases where OHA is limited in its ability to allocate across all accounts. The outcome of any allocation determination may result in the allocation of all or none of an investment opportunity to us, and there can be no assurance that we will have an opportunity to participate in certain investments that fall within our investment objectives.
Based on the foregoing methodology, accounts with higher available capital than we have will generally have a higher initial allocation percentage to an investment. Likewise, an account with a larger maximum issuer or relevant asset class concentration size than we are permitted to have under the 1940 Act or other applicable law will generally have a higher initial allocation percentage to an investment.
OHA seeks to treat all clients fairly and equitably such that none receive preferential treatment over the others over time, in a manner consistent with its fiduciary duty to each of them; however, in some instances, especially in instances of limited liquidity, the factors may not result in allocations or may result in situations where certain funds receive allocations where others do not.
In addition, because we expect to make investments alongside other investment funds, accounts and other investment vehicles managed by OHA, consistent with existing regulatory guidance and OHA’s allocation procedures, we may subsequently be prohibited by the 1940 Act from re-negotiating the terms of such co-investments, including with respect to granting loan waivers or concessions or in connection with a restructuring, reorganization or similar transaction involving the portfolio company, to the extent that other investment funds, accounts or other investment vehicles managed by OHA continue to hold such investments at the time. As a result, we may have to sell such investments at such time in order to avoid violating the 1940 Act or otherwise not participate in the re-negotiation of the terms of such co-investments, which may result in investment losses or lost opportunities to generate additional income, or may otherwise negatively impact us.
We may need to raise additional capital to grow because we must distribute most of our income.
We must distribute at least 90% of our investment company taxable income to our stockholders to maintain our RIC status and such distributions will not be available to fund new investments. We may need additional capital to fund growth in our
20
investments. A reduction in the availability of new capital could limit our ability to grow. We expect to borrow from financial institutions and may, if warranted by market conditions and in the best interests of our stockholders, issue additional debt and equity securities. If we fail to obtain funds from such sources or from other sources to fund our investments, it could limit our ability to grow, which may have an adverse effect on the value of our securities. In addition, as a BDC, our ability to borrow or issue preferred stock may be restricted if our total assets are less than 200% of our total borrowings and preferred stock.
Our ability to secure additional financing and satisfy our financial obligations under indebtedness outstanding from time to time will depend upon our future operating performance, which is subject to the prevailing general economic and credit market conditions, including interest rate levels and the availability of credit generally, and financial, business and other factors, many of which are beyond our control. The prolonged continuation or worsening of current economic and capital market conditions could have a material adverse effect on our ability to secure financing on favorable terms, if at all.
If we are unable to obtain debt capital, then our equity investors will not benefit from the potential for increased returns on equity resulting from leverage to the extent that our investment strategy is successful, and we may be limited in our ability to make new commitments or fundings to our portfolio companies.
Failure to extend our Credit Facility could also have a material adverse effect on our results of operations and financial position and our ability to pay expenses and make distributions.
We entered into a Credit Agreement (the "Credit Facility") with Midcap Financial Trust, as administrative agent. The Credit Facility is currently scheduled to mature on March 9, 2018 and can be extended for a six month period at our option, subject to certain conditions. If the participating lenders do not renew or extend the Credit Facility, we will not be able to make further borrowings under the current Credit Facility after such date and the outstanding principal balance on that date will be due and payable. If we are unable to extend our current Credit Facility or find a new source of borrowing on acceptable terms, we will be required to pay down the amounts outstanding under the current Credit Facility through one or more of the following: (1) available cash balances, (2) principal collections on our securities pledged under the facility, (3) at our option, interest collections on our securities pledged under the facility, or (4) possible liquidation of some or all of our loans and other assets, any of which could have a material adverse effect on our results of operations and financial position and may force us to decrease or stop paying certain expenses and making distributions to stockholders until the facility is repaid. In addition, our stock price could decline significantly, we would be restricted in our ability to acquire new investments. and our independent registered public accounting firm could raise an issue as to our ability to continue as a going concern.
Any failure on our part to maintain our status as a BDC would reduce our operating flexibility.
The 1940 Act imposes numerous constraints on the operations of BDCs. For example, BDCs are required to invest at least 70% of their total assets in specified types of securities, primarily in private companies or small U.S. public companies, cash, cash equivalents, U.S. government securities and other high quality debt investments that mature in one year or less. Any failure to comply with the requirements imposed on BDCs by the 1940 Act could cause the SEC to bring an enforcement action against us and/or expose us to claims of private litigants. In addition, if we fail to maintain our qualification as a BDC, we may be subject to substantially greater regulation under the 1940 Act as a closed-end investment company. Compliance with such regulations would significantly decrease our operating flexibility, and could significantly increase our costs of doing business.
Regulations governing our operation as a BDC affect our ability to raise, and the way in which we raise additional capital. As a BDC, the necessity of raising additional capital may expose us to risks, including the typical risks associated with leverage.
Under the provisions of the 1940 Act, we are permitted, as a BDC, to issue debt securities or preferred stock and/or borrow money from banks or other financial institutions, which we refer to collectively as “senior securities,” in amounts such that our asset coverage, as defined in the 1940 Act, equals at least 200% of gross assets less all liabilities and indebtedness not represented by senior securities, after each issuance of senior securities. If the value of our assets declines, we may be unable to satisfy this test and, as a result, we will be limited in our ability to use debt capital to finance our operations. Also, any amounts that we use to service our indebtedness would not be available for distributions to our common stockholders. Furthermore, as a result of issuing senior securities, we would also be exposed to typical risks associated with leverage, including an increased risk of loss. As of December 31, 2016, we had $40.5 million outstanding and $16.0 million availability for borrowing under the Credit Facility.
If we issue preferred stock, the preferred stock would rank “senior” to common stock in our capital structure, preferred stockholders would generally vote together with common stockholders but would have separate voting rights on certain matters and might have other rights, preferences, or privileges more favorable than those of our common stockholders, and the issuance of preferred stock could have the effect of delaying, deferring or preventing a transaction or a change of control that might involve a premium price for holders of our common stock or otherwise be in your best interest.
As a BDC, we are not generally able to issue and sell our common stock at a price below net asset value per share. We may, however, sell our common stock at a price below the then-current net asset value per share of our common stock if our
21
Board of Directors determines that such sale is in the best interests of OHAI and its stockholders, and our stockholders approve such sale. In any such case, the price at which our securities are to be issued and sold may not be less than a price that, in the determination of our Board of Directors, closely approximates the market value of such securities (less any distributing commission or discount). If we raise additional funds by issuing more common stock or senior securities convertible into, or exchangeable for, our common stock, then the percentage ownership of our stockholders at that time will decrease, and you might experience dilution. This dilution would occur as a result of a proportionately greater decrease in a stockholder’s interest in our earnings and assets and voting interest in us than the increase in our assets resulting from such issuance. Because the number of future shares of common stock that may be issued below our net asset value per share and the price and timing of such issuances are not currently known, we cannot predict the actual dilutive effect of any such issuance. We cannot determine the resulting reduction in our net asset value per share of any such issuance. We also cannot predict whether shares of our common stock will trade above, at or below our net asset value in the future.
We borrow money, which magnifies the potential for loss on amounts invested and may increase the risk of investing in us.
The use of leverage magnifies the potential for loss on amounts invested and, therefore, increases the risks associated with investing in our securities. We currently borrow under our $56.5 million Credit Facility. As of December 31, 2016, we had $40.5 million outstanding under the Credit Facility. We may borrow from and issue senior debt securities to banks, insurance companies and other lenders in the future. Lenders of these senior securities, including the Credit Facility, will have fixed dollar claims on our assets that are superior to the claims of our stockholders, and we would expect such lenders to seek recovery against our assets in the event of a default. If the value of our assets decreases, leveraging would cause net asset value to decline more sharply than it otherwise would have had we not leveraged. Similarly, any decrease in our income would cause net income to decline more sharply than it would have had we not borrowed. Such a decline could also negatively affect our ability to make distribution payments on our common stock. Leverage is generally considered a speculative investment technique. Our ability to service any debt that we incur will depend largely on our financial performance and will be subject to prevailing economic conditions and competitive pressures. Moreover, as the management fee payable to OHA is payable based on our gross assets, including those assets acquired through the use of leverage, OHA has a financial incentive to incur leverage which may not be consistent with our stockholders’ interests. In addition, our stockholders bear the burden of any increase in our expenses as a result of leverage, including any increase in the management fee payable to OHA. The amount of leverage that we employ depends on OHA’s and our Board of Directors’ assessment of market and other factors at the time of any proposed borrowing. We cannot assure you that we will be able to obtain credit at all or on terms acceptable to us.
The following table illustrates the effect of leverage on returns from an investment in our common stock as of December 31, 2016, assuming various annual returns, net of expenses. The calculations in the table below are hypothetical and actual returns may be higher or lower than those appearing in the table below.
Assumed Return on Our Portfolio (Net of Expenses) | -10% | -5% | 0 | 5% | 10% | |||||
Corresponding return to common stockholder (1) | -23% | -16% | -9% | -3% | 3% | |||||
(1)Assumes $162.9 million in total assets, $40.5 million in debt outstanding and $80.5 million in net assets as of December 31, 2016 and a weighted average interest rate of 6.98% as of December 31, 2016.
Based on our outstanding indebtedness of $40.5 million as of December 31, 2016 and the weighted average interest rate of 6.98% as of that date, our investment portfolio would have been required to experience an annual return of at least 2.7% to cover annual interest payments on the outstanding debt.
Substantially all of our assets are subject to security interests under the Credit Facility, and if we default on our obligations under the Credit Facility, we may suffer adverse consequences, including foreclosure on our assets.
As of December 31, 2016, substantially all of our assets were pledged as collateral under the Credit Facility. If we default on our obligations under this facility, the lenders may have the right to foreclose upon and sell, or otherwise transfer, the collateral subject to their security interests or their superior claim. In such event, we may be forced to sell our investments to raise funds to repay our outstanding borrowings in order to avoid foreclosure and these forced sales may be at times and at prices we would not consider advantageous. Moreover, such deleveraging of our company could significantly impair our ability to effectively operate our business in the manner in which we have historically operated. As a result, we could be forced to curtail or cease new investment activities and lower or eliminate the dividends that we have historically paid to our stockholders.
It is likely that the terms of any current or future long-term credit facility we may enter into in the future could constrain our ability to grow our business.
22
Under the Credit Facility and our other borrowings, current lenders have, and any future lender or lenders may have, fixed dollar claims on our assets that are senior to the claims of our stockholders and, thus, will have a preference over our stockholders with respect to our assets in the collateral pool.
Our Credit Facility and borrowings also subject us to various financial and operating covenants. For example, the Credit Facility requires us to maintain debt to tangible net worth ratio, as defined in the credit agreement, of not more than 0:80 to 1.00 as determined on the last day of the month. If this ratio exceeds 0:80 to 1.00, we may not be able to incur additional debt, which could have a material adverse effect on our operations, and we may not be able to make distributions to our stockholders. Future credit facilities and borrowings will likely subject us to similar or additional covenants.
The Credit Facility generally contains customary default provisions such as a debt to tangible net worth ratio, debt to fair market value ratio and a restriction on changing our business. An event of default under the Credit Facility would likely result in, among other things, termination of the availability of further funds under the Credit Facility and accelerated maturity dates for all amounts outstanding under the Credit Facility, which would likely disrupt our business and, potentially, the business of the portfolio companies whose loans we finance through the Credit Facility. This could reduce our revenues and, by delaying any cash payment allowed to us under the Credit Facility until the lenders have been paid in full, reduce our liquidity and cash flow and impair our ability to grow our business and maintain our status as a RIC.
We are exposed to risks associated with changes in interest rates.
Since we borrow money to make investments, our net investment income will depend, in part, upon the difference between the rate at which we borrow funds and the rate at which we invest those funds. As a result, a significant change in market interest rates may have a material adverse effect on our net investment income. In periods of rising interest rates, our cost of funds would increase, except to the extent we issue fixed rate debt or preferred stock, which could reduce our net investment income. We may use interest rate risk management techniques in an effort to limit our exposure to interest rate fluctuations. Such techniques may include various interest rate hedging activities to the extent permitted by the 1940 Act.
In addition, a rise in the general level of interest rates can be expected to lead to higher interest rates applicable to our debt investments over time. Interest rate fluctuations may have a substantial negative impact on our investments, the value of our common stock and our rate of return on invested capital. A reduction in the interest rates on new investments relative to interest rates on current investments or a reduction in the spread between the interest rates on our investments and the interest rates payable on our borrowings could have an adverse impact on our net investment income. In addition, a rise in the general level of interest rates can be expected to lead to higher interest rates applicable to our debt investments over time. There is a risk that the portfolio companies in which we hold floating rate debt investments will be unable to pay escalating interest amounts if general interest rates rise, resulting in a default under our investment. In addition, increasing payment obligations under floating rate loans may cause our portfolio companies to refinance or otherwise repay our loans prior to maturity. An increase in interest rates would make it easier for us to meet or exceed the incentive fee hurdle rate and may result in a substantial increase of the amount of incentive fees payable to OHA with respect to our pre-incentive fee net investment income. Also, an increase in interest rates available to investors could make investment in our common stock less attractive if we are not able to increase our dividend rate, which could reduce the market value of our common stock.
Pending legislation may allow us to incur additional leverage.
As a BDC, under the 1940 Act generally we are not permitted to incur indebtedness unless immediately after such borrowing we have an asset coverage for total borrowings of at least 200% (i.e., the amount of debt may not exceed 50% of the value of our total assets). Recent legislation introduced in the U.S. House of Representatives under H.R. 3868 - Small Business Credit Availability Act, which was included as part of the revised Financial CHOICE Act, if passed, would modify this section of the 1940 Act and increase the amount of debt that BDCs may incur by modifying the percentage from 200% to 150% (subject to stockholder approval). As a result, we may be able to incur additional indebtedness in the future and therefore your risk of an investment in us may increase. In addition, since our management fee is calculated as a percentage of the value of our gross assets, which includes any borrowings for investment purposes, the management fee expenses will increase if we incur additional indebtedness.
Our fee arrangement may create incentives for OHA that are not fully aligned with the interests of our stockholders and may induce OHA to pursue speculative investments.
Pursuant to the terms of the Investment Advisory Agreement, we pay base management and incentive fees to OHA. The base management fee is based on our average adjusted gross assets and the incentive fee is computed and paid on income, both of which include leverage. As a result, investors in our common stock will invest on a “gross” basis and receive distributions on a “net” basis after expenses, resulting in a lower rate of return than one might achieve through direct investments. Because the base management fee is based on our average adjusted gross assets, OHA benefits when we incur debt or use leverage. In addition, the incentive fee payable to OHA is calculated based on a percentage of our return on invested capital. This may encourage OHA to use leverage to increase the return on our investments. Under certain circumstances, the use of leverage may
23
increase the likelihood of default, which would impair the value of our common stock and the amount of distributions we make to stockholders.
In addition, OHA receives the incentive fee based, in part, upon net capital gains realized on our investments. Unlike that portion of the incentive fee based on income, there is no hurdle rate applicable to the portion of the incentive fee based on net capital gains. As a result, OHA may have a tendency to invest more of our capital in investments that are likely to result in capital gains as compared to income producing securities. Moreover, for the purpose of calculating OHA’s capital gains incentive fee, any gains and losses associated with our investment portfolio as of September 30, 2014 are excluded. As the capital gains fee is not payable by us to OHA with respect to any legacy investments, OHA may be incented to dispose of those investments with the aim of substituting them with assets for which a capital gains fee would be payable. These incentives could result in our investing in more speculative securities than would otherwise be the case, which could result in higher investment losses, particularly during economic downturns or result in us exiting an investment sooner than that which would have otherwise been optimal for us.
The incentive fee payable by us to OHA also may induce OHA to invest on our behalf in instruments that have a deferred interest feature, even if such deferred payments would not provide cash necessary to enable us to pay current distributions to our stockholders. Under these investments, we would accrue interest over the life of the investment but would not receive the cash income from the investment until the end of the term. Our net investment income used to calculate the income portion of the incentive fee, however, includes accrued interest. Thus, a portion of this incentive fee would be based on income that we have not yet received in cash. In addition, the “catch-up” portion of the incentive fee may encourage OHA to accelerate or defer interest payable by portfolio companies from one calendar quarter to another, potentially resulting in fluctuations in timing and distribution amounts.
We may invest, to the extent permitted by law, in the securities and instruments of other investment companies, including private funds, and, to the extent we so invest, will bear our ratable share of any such investment company’s expenses, including management and performance fees. We will also remain obligated to pay management and incentive fees to OHA with respect to the assets invested in the securities and instruments of other investment companies. With respect to each of these investments, each of our stockholders will bear his or her share of the management and incentive fee of OHA as well as indirectly bearing the management and performance fees and other expenses of any investment companies in which we invest.
We may be obligated to pay OHA an incentive fee based on income even if we incur a loss.
OHA is entitled to an incentive fee based on income for each fiscal quarter in an amount equal to a percentage of the excess of our pre-incentive fee net investment income for that quarter (before deducting incentive compensation) above a performance threshold for that quarter. Since the performance threshold is based on a percentage of our net asset value, decreases in our net asset value reduce the performance threshold required for OHA to earn an incentive fee based on income. Our pre-incentive fee net investment income for purposes of calculating the incentive fee excludes realized and unrealized capital losses or depreciation that we may incur in the fiscal quarter, even if such capital losses or depreciation result in a net loss on our statement of operations for that quarter. Thus, we may be required to pay OHA an incentive fee for a fiscal quarter even if there is a decline in the value of our portfolio or we incur a net loss for that quarter.
Under the terms of the Investment Advisory Agreement, we may have to pay capital gain incentive fees to OHA in periods in which we have incurred a net realized loss on the sale of our investments.
Pursuant to the terms of the Investment Advisory Agreement, any gains and losses associated with our investment portfolio as of September 30, 2014, or the legacy portfolio, are excluded from the capital gains fee calculation. As a result, we may have to pay OHA a capital gains incentive fee in periods in which we have incurred a net realized loss on the sale of our investments to the extent that some or all of the realized losses relate to the legacy portfolio.
We will become subject to corporate-level income tax if we are unable to maintain our qualification as a RIC under Subchapter M of the Code.
Although we have elected to be treated as a RIC under Subchapter M of the Code, no assurance can be given that we will be able to maintain our RIC status. To maintain RIC tax treatment under the Code, we must meet the following annual distribution, income source and asset diversification requirements.
• | The annual distribution requirement for a RIC will be satisfied if we distribute to our stockholders on an annual basis at least 90% of our net ordinary income and realized net short-term capital gains in excess of realized net long-term capital losses, if any. Because we use debt financing, we are subject to certain asset coverage ratio requirements under the 1940 Act and financial covenants under credit agreements, that could, under certain circumstances, restrict us from making distributions necessary to satisfy the distribution requirement. If we are unable to obtain cash from other sources, we could fail to qualify for RIC tax treatment and thus become subject to corporate-level income tax. |
24
• | The income source requirement will be satisfied if we obtain at least 90% of our income for each year from distributions, interest, gains from the sale of stock or securities or similar sources. |
• | The asset diversification requirement will be satisfied if we meet certain asset diversification requirements at the end of each quarter of our taxable year. Failure to meet those requirements may result in our having to dispose of certain investments quickly in order to prevent the loss of RIC status. Because most of our investments will be in private companies, and therefore will be relatively illiquid, any such dispositions could be made at disadvantageous prices and could result in substantial losses. |
If we fail to qualify for RIC tax treatment for any reason and become subject to corporate income tax, the resulting corporate taxes could substantially reduce our net assets, the amount of income available for distribution and the amount of our distributions. Such a failure would have a material adverse effect on us, the net asset value of our common stock and the total return, if any, obtainable from an investment in our common stock.
We may have difficulty satisfying the annual distribution requirement in order to qualify and maintain RIC status if we recognize income before or without receiving cash representing such income.
In accordance with generally accepted accounting principles, or GAAP, and tax requirements, we include in income certain amounts that we have not yet received in cash, such contractual PIK interest, which represents contractual interest added to a loan balance and due at the end of such loan’s term. The increases in loan balances as a result of contractual PIK arrangements are included in income for the period in which such PIK interest was accrued, which is typically in advance of receiving cash payment, and are separately identified on our statements of cash flows. In addition, certain loans may also include any of the following: end-of-term payments, “make whole” interest or dividend provisions, exit fees, balloon payment fees or prepayment fees, which may require us to include certain amounts in income prior to receiving the related cash.
Since in certain cases we may recognize income before or without receiving cash representing such income, we may have difficulty meeting the RIC tax requirement to distribute at least 90% of our net ordinary income and realized net short-term capital gains in excess of realized net long-term capital losses, if any. Under such circumstances, we may have to sell some of our investments at times we would not consider advantageous, raise additional debt or equity capital or reduce new investment originations to meet these distribution requirements. If we are unable to obtain cash from other sources and are otherwise unable to satisfy such distribution requirements, we may fail to qualify for the federal income tax benefits allowable to RICs and, thus, become subject to a corporate-level income tax on all our income.
The failure in cyber-security systems, as well as the occurrence of events unanticipated in our disaster recovery systems and management continuity planning could impair our ability to conduct business effectively.
The occurrence of a disaster such as a cyber attack, a natural catastrophe, an industrial accident, a terrorist attack or war, events unanticipated in our disaster recovery systems, or a support failure from external providers, could have an adverse effect on our ability to conduct business and on our results of operations and financial condition, particularly if those events affect our computer-based data processing, transmission, storage, and retrieval systems or destroy data. If a significant number of our OHA personnel were unavailable in the event of a disaster, our ability to effectively conduct our business could be severely compromised.
We depend heavily upon computer systems to perform necessary business functions. Despite our implementation of a variety of security measures, our computer systems could be subject to cyber attacks and unauthorized access, such as physical and electronic break-ins or unauthorized tampering. Like other companies, we may experience threats to our data and systems, including malware and computer virus attacks, unauthorized access, system failures and disruptions. If one or more of these events occurs, it could potentially jeopardize the confidential, proprietary and other information processed and stored in, and transmitted through, our computer systems and networks, or otherwise cause interruptions or malfunctions in our operations, which could result in damage to our reputation, financial losses, litigation, increased costs, regulatory penalties and/or customer dissatisfaction or loss.
We are highly dependent on information systems and systems failures could significantly disrupt our business, which may, in turn, negatively affect the market price of our common stock and our ability to pay distributions.
Our business is highly dependent on third parties’ communications and information systems. Any failure or interruption of those systems, including as a result of the termination of an agreement with any third-party service providers, could cause delays or other problems in our activities. OHA's financial, accounting, data processing, backup or other operating systems and facilities may fail to operate properly or become disabled or damaged as a result of a number of factors including events that are wholly or partially beyond our control and adversely affect our business. There could be:
• | sudden electrical or telecommunications outages; |
• | natural disasters such as earthquakes, tornadoes and hurricanes; |
25
• | disease pandemics; |
• | events arising from local or larger scale political or social matters, including terrorist acts; and |
• | cyber attacks. |
These events, in turn, could have a material adverse effect on our operating results and negatively affect the market price of our common stock and our ability to pay distributions to our stockholders.
Our Board of Directors may change our investment objectives, operating policies and strategies without prior notice or stockholder approval.
Our Board of Directors has the authority to modify or waive our investment objectives, operating policies and strategies without prior notice and without stockholder approval. However, absent stockholder approval, we may not change the nature of our business so as to cease to be, or withdraw our election as, a BDC. We cannot predict the effect any changes to our current investment objectives, operating policies and strategies would have on our business, operating results and value of our stock. Nevertheless, the effects may adversely affect our business and impact our ability to make distributions.
Changes in laws or regulations governing our operations or the operations of our portfolio companies may adversely affect our business.
Changes in or uncertainty regarding laws or regulations, or the interpretations of the laws and regulations, which govern BDCs, RICs or non-depository commercial lenders could significantly affect our operations and our cost of doing business. We are subject to federal, state and local laws and regulations and are subject to judicial and administrative decisions that affect our operations, including our loan originations, maximum interest rates, fees and other charges, disclosures to portfolio companies, the terms of secured transactions, collection and foreclosure procedures, and other trade practices. If these laws, regulations or decisions change, or if we expand our business into jurisdictions that have adopted more stringent requirements than those in which we currently conduct business, then we may have to incur significant expenses in order to comply or we may have to restrict our operations. In addition, if we do not comply with applicable laws, regulations and decisions, then we may lose licenses needed for the conduct of our business and be subject to civil fines and criminal penalties, any of which could have a material adverse effect upon our business results of operations or financial condition. Similarly changes in or uncertainty regarding laws and regulations (or the interpretation of such laws and regulations) which govern our portfolio companies could adversely affect their operations and cost of doing business which in turn could adversely affect their ability to make payments to us and adversely affect our financial condition and results of operations.
OHA can resign upon 60 days’ notice, and we may not be able to find a suitable replacement within that time, resulting in a disruption in our operations that could adversely affect our financial condition, business and results of operations.
OHA has the right, under both the Investment Advisory Agreement and the Administration Agreement, to resign at any time upon 60 days’ written notice, whether we have found a replacement or not. If OHA resigns, we may not be able to find a new investment advisor or new administrator, as applicable, or hire internal management with similar expertise and ability to provide the same or equivalent services on acceptable terms within 60 days, or at all. If we are unable to do so quickly, our operations are likely to experience a disruption, our financial condition, business and results of operations as well as our ability to pay distributions are likely to be adversely affected, and the market price of our shares may decline. In addition, the coordination of our internal management and investment or administration activities, as applicable, is likely to suffer if we are unable to identify and reach an agreement with a single institution or group of executives having the expertise possessed by OHA and its affiliates. Even if we are able to retain comparable management, whether internal or external, the integration of such management and their lack of familiarity with our investment objective may result in additional costs and time delays that may adversely affect our financial condition, business and results of operations.
Risks Relating to an Investment in Our Securities
Our shares currently trade at a substantial discount from net asset value and may continue to do so over the long term.
Shares of closed-end investment companies, including BDCs, frequently trade at a market price that is less than the net asset value that is attributable to those shares. The possibility that shares of our common stock will trade at a substantial discount from net asset value over the long term is separate and distinct from the risk that our net asset value will decrease. Although we cannot predict whether shares of our common stock will trade above, at or below our net asset value, our common stock has consistently traded below our net asset value since the fourth quarter of 2008. When our common stock trades below its net asset value, we are generally not able to issue additional shares of our common stock at its market price without first obtaining the approval for such issuance from our stockholders and our independent directors. Any offering of our common stock that requires stockholder approval must occur, if at all, within one year after receiving such stockholder approval. If
26
additional funds are not available to us, we could be forced to curtail or cease our new lending and investment activities, and our net asset value could decrease and our level of distributions could be impacted.
Our common stock price may be volatile and may decrease substantially.
The trading price of our common stock may fluctuate substantially. The price of our common stock that will prevail in the market may be higher or lower than the price you pay, depending on many factors, some of which are beyond our control and may not be directly related to our operating performance. These factors include the following:
• | price and volume fluctuations in the overall stock market or in securities of BDCs from time to time; |
• | investor demand for our shares; |
• | exclusion of our common stock from certain market indices which could reduce the ability of certain investment funds to own our common stock; |
• | changes in regulatory policies or tax guidelines with respect to RICs and BDCs; |
• | the loss of RIC status; |
• | actual or anticipated changes in our earnings or fluctuations in our operating results; |
• | any shortfall in revenue or net investment income or any increase in losses from levels expected by stockholders or securities analysts; |
• | changes in accounting guidelines governing valuation of our investments; |
• | changes, or perceived changes, in the value of our portfolio investments; |
• | departures of OHA’s key personnel; |
• | operating performance of companies comparable to us; and |
• | general economic conditions and trends and other external factors. |
In the past, following periods of volatility in the market price of a company’s securities or for other reasons, securities class action litigation has been brought against that company. Due to the potential volatility of our stock price or for other reasons, we may become the target of securities litigation in the future. Securities litigation could result in substantial costs and divert management’s attention and resources from our business.
Our stockholders may not receive distributions, our distributions may not grow over time or a portion of our distributions may be a return of capital.
We intend to make distributions on a quarterly basis to our stockholders out of assets legally available for distribution. We cannot assure you that we will achieve investment results that will allow us to make a specified level of cash distributions or year-to-year increases in cash distributions. Our ability to pay distributions may be adversely affected by the impact of one or more of the risk factors described in this report. In addition, due to the asset coverage test applicable to us as a BDC, we may be prohibited in our ability to make distributions in certain limited circumstances. We cannot assure you that you will receive distributions at a particular level or at all.
If our distributions exceed our taxable income and capital gains realized during a taxable year, all or a portion of the distributions made in the same taxable year may be characterized as a return of capital to our stockholders. To the extent there is a return of capital, stockholders will be required to reduce their basis in our stock for U.S. federal income tax purposes, resulting in a higher reported capital gain or lower reported capital loss when those shares of our common stock are sold or otherwise disposed of.
Provisions of the Maryland General Corporation Law and of our charter and bylaws could (if not otherwise exempted) deter takeover attempts and have an adverse impact on the price of our common stock.
The Maryland General Corporation Law, our charter and our bylaws contain provisions that may discourage, delay or make more difficult a change in control of us or the removal of our directors. These anti-takeover provisions may inhibit a change of control in circumstances that could give our stockholders the opportunity to realize a premium over the market price for our common stock.
We are subject to the Maryland Business Combination Act, the application of which is subject to any applicable requirements of the 1940 Act. While our Board of Directors has adopted a resolution exempting from the Business Combination Act any business combination between us and any other person (subject to prior approval of such business combination by our Board of Directors, including approval by a majority of our directors who are not interested persons of the acquiring person), if the resolution exempting business combinations is repealed or our Board of Directors does not approve a
27
business combination, the Business Combination Act may discourage third parties from trying to acquire control of us and increase the difficulty of consummating such an offer.
Our bylaws exempt from the Maryland Control Share Acquisition Act acquisitions of our stock by any person. If we were to amend our bylaws to repeal the exemption from such act, it would make it more difficult for a third party to obtain control of us and increase the difficulty of consummating such a control attempt.
Our charter provides for classifying our Board of Directors in three classes serving staggered three-year terms, and provisions of our charter authorize our Board of Directors to classify or reclassify shares of our stock in one or more classes or series, to cause the issuance of additional shares of our stock, and to amend our charter, without stockholder approval, to increase or decrease the number of shares of stock that we have authority to issue.
Item 1B. Unresolved Staff Comments
Not applicable.
Item 2. Properties
We do not own any real estate or other physical properties materially important to our operation. Our headquarters are located in New York, New York, where we share office space with OHA pursuant to our Administration Agreement. We also occupy office space in Fort Worth, Texas. We believe that our office facilities are suitable and adequate for our business as presently conducted.
Item 3. Legal Proceedings
We are involved in various legal proceedings arising in the normal course of business. While we cannot predict the outcome of these proceedings with certainty, we do not believe that an adverse result in any pending legal proceeding, other than those described below, individually or in the aggregate, would be material to our business, financial condition or cash flows.
ATP Litigation. On August 17, 2012, ATP Oil & Gas Corporation, or ATP, filed a petition for relief under Chapter 11 of the U.S. Bankruptcy Code in the U.S. Bankruptcy Court for the Southern District of Texas. Prior to the bankruptcy filing, we purchased limited term overriding royalty interests, or ORRIs, in certain offshore oil and gas producing properties operated by ATP (generally, the Gomez and Telemark properties). On August 23, 2012, on a motion filed by ATP, the bankruptcy judge presiding over ATP’s case signed an order (Bankr. Dkt. No. 191) requiring ATP to pay amounts received after August 17, 2012 to those parties it believes are entitled to receive them, including the ORRI holders, provided that the ORRI holders execute a disgorgement agreement providing for the repayment of any amounts that the bankruptcy court later finds to have been inappropriately paid. We executed the disgorgement agreement and began receiving monthly distributions in September 2012 from ATP of our share of production proceeds received by ATP after August 17, 2012.
Phase 1. On October 17, 2012, we filed a lawsuit against ATP styled: OHA Investment Corporation v. ATP Oil & Gas Corporation, Adv. Proc. No. 12-03443, in the U.S. Bankruptcy Court for the Southern District of Texas, seeking a declaration that the ORRIs are our property and not property of ATP and that the conveyance and purchase and sale documents are not executory contracts that may be rejected in order to remove or recharacterize our interests in the properties (the “Adversary Proceeding”). Also, certain service companies claiming statutory liens or privileges intervened for the purpose of establishing that their alleged statutory liens and privileges are superior to our rights in the ORRIs and asserting related claims for disgorgement of royalties paid to us by ATP. The issues in the Adversary Proceeding were bifurcated such that the issues of (i) whether the conveyances and transactions between us and ATP constituted outright transfers of ownership and (ii) whether the conveyances are executory contracts or leases that ATP may reject, would be tried first as “Phase 1” of the proceeding. And, any additional claims, including the service company statutory lien claims and related issues, would be decided later in “Phase 2.” Phase 1 of the litigation proceeded into the discovery stage and dispositive motion practice.
On October 17, 2013, the bankruptcy court entered its Final Sale Order approving the sale of the Telemark properties (Bankr. Dkt. No. 2706) to Bennu Oil & Gas, LLC, or Bennu, a newly formed company owned by the DIP Lenders. (The Gomez properties were abandoned by ATP.)
After the bankruptcy case was converted to a case under Chapter 7 of the Bankruptcy Code, we settled Phase 1 of the litigation with the Trustee, Bennu and Credit Suisse AG, as agent to the DIP Lenders (Adv. Dkt. No. 270, 271). On February 4, 2016, an Agreed Final Judgment [Adv. Dkt. No. 276] was entered determining that, among other things, the ORRIs are a real
28
property interest and a “production payment” within the meaning of Sections 101(42A) and 541(b) of the United States Bankruptcy Code. Likewise, our claims against ATP were dismissed without prejudice. The Agreed Judgment resolved Phase 1 of the Adversary Proceeding. It did not address any disputes between us and Bennu with respect to the proper calculation of the investment balance under the terms of the ORRIs, including our legal fees, default interest, or the claims asserted by the statutory lien claimants. Additional detail on Phase 1 and the ATP bankruptcy is set forth in our Form 10Q for the quarter ending March 31, 2016.
Phase 2. On February 3, 2016, we filed our Amended Motion to Dismiss the Complaints in Intervention Filed by the Statutory Lien Claimants, which was subsequently amended [Adv. Dkt. No. 284]. The Amended Motion to Dismiss asserted, among other things, that under the terms of the applicable Louisiana Oil Well Lien Statute, the alleged statutory liens of the lien claimants either cannot attach to overriding royalties, or alternatively, that OHA purchased the ORRIs free and clear of the statutory liens because the lien claimants did not provide notice of the liens as required under the statute. We also filed a Motion to Withdraw the Reference of the Phase II Claims from the Bankruptcy Court to the District Court. On May 13, 2016, the Court entered its order granting in part and denying in part OHA’s Motion to Dismiss and Motion to Withdraw Reference [Adv. Dkt. No. 294] and its Report and Recommendation and Memorandum Opinion [Adv. Dkt. No. 293]. Pursuant to the Memorandum Opinion and the Order, the Court determined that under the Louisiana statute, if we purchased our ORRIs without notice of the lien claimants’ liens, in a bona fide transaction, we would take the ORRIs free and clear of the lien claimants’ rights. The Court granted the lien claimants leave to file amended complaints to specifically plead whether we had notice of their alleged privileges at the time we paid the purchase price. To that end, the Court stated that the Amended Motion to Dismiss was denied as to all issues other than the issue of whether we had notice of the lien claimants’ liens and that the Court would review the amended complaints (to determine whether they sufficiently pleaded a claim) [Adv. Dkt. No. 294]. The Bankruptcy Court recommended that the District Court grant the Motion to Withdraw the Reference, but that the Adversary Proceeding remain in the Bankruptcy Court until the time of trial. The District Court entered an order consistent with the Bankruptcy Court’s recommendation on the Motion to Withdraw the Reference.
On May 27, 2016, the Intervenors filed their amended complaints, which made new allegations with respect to the issue of notice. Accordingly, on June 9, 2016, we filed our Motion to Dismiss the amended complaints [Adv. Dkt. No. 310] asserting that the allegations regarding notice are insufficient to state a claim under the statute.
On August 19, 2016, the Bankruptcy Court entered its order [Adv. Dkt. No. 325] and its related Report and Recommendation [Adv. Dkt. No. 326] dismissing, with prejudice, the Intervenors’ amended complaints. The Bankruptcy Court’s order and the related Report and Recommendation recommends, to the District Court, that Phase II of the lawsuit be fully resolved in our favor. The Report and Recommendation was docketed in the United States District Court for the Southern District of Texas, Case No. 4:16-CV-02556. On September 2, 2016, certain of the Intervenors filed their Objection to Judge Isgur’s Report and Recommendation [Dist. Dkt. No. 3] arguing that the Bankruptcy Court’s conclusions were erroneous, and that the Intervenors were not required to give notice to OHA in order for their alleged liens to attach. We filed a limited objection to the Report and Recommendation arguing that the Report and Recommendation should be affirmed, but even if notice were not required under the statute, the Intervenors’ alleged liens could not have attached to the ORRIs in the first instance. On March 9, 2017 the District Court entered a Memorandum Opinion and Order [Dist. Dkt. No. 17] (the “District Court’s Order”) adopting the Bankruptcy Court’s Report and Recommendation and dismissing the Intervenors’ claims with prejudice. The Intervenors may elect to appeal the District Court’s Order to the United States Court of Appeals for the Fifth Circuit or seek other judicial relief.
As of December 31, 2016, our unrecovered investment was $31.1 million, and we had received aggregate royalty payments of $37.5 million since the date of ATP’s bankruptcy filing. As of December 31, 2016, we had incurred legal and consulting fees totaling $5.9 million in connection with the enforcement of our rights under the ORRIs. On various occasions, we have provided notice that such legal expenses will be added to our unrecovered investment balance to the extent they are not reimbursed. To date, we have not received any payments on account of legal expenses aside from our receipt of regular monthly production payments. As a result, we add our legal expenses to the unrecovered investment balance in accordance with our transaction documents. As of December 31, 2016, $5.4 million of the $5.9 million in legal and consulting fees have been added to, and are thus included in the unrecovered investment balance under the terms of our transaction documents. The remaining amounts of legal and consulting fees have been expensed to professional fees, thus, not included in the unrecovered investment balance at December 31, 2016.
Through December 31, 2016, we received post-petition royalty payments from the Gomez properties and the Telemark properties in the amount of $8.3 million and $29.2 million, respectively. It is estimated that the statutory lien claims asserted by the intervenors in the Adversary Proceeding against our ORRIs are in the principal amount of approximately $35.2 million. At this time, we estimate that there are potential statutory lien claims (including the claims of the intervenors in the Adversary Proceeding, without regard to the validity of such claims) in the principal amount of approximately $54.2 million. To the extent the Intervenors elect to appeal the District Court’s Order and it is reversed on appeal, we will assert that we have viable
29
defenses with respect to all of the claims of the statutory lien claimants or any other claim which seeks to avoid or disgorge any pre-petition or post-petition royalty payment which we received in respect of the Telemark or Gomez properties. In the event we do not prevail on our defenses to the statutory lien claims or any other claim seeking to avoid or disgorge pre-petition or post-petition royalty payments, we contend that, pursuant to the terms of our transaction documents, we are entitled to include any amounts disgorged on account of any such claims into the unrecovered investment balance of our ORRIs. Moreover, to the extent we do not prevail on our defenses to any action brought by the holder of a statutory lien claim, we contend that we would be permitted to seek contribution from other ORRI and net profits interest holders with respect to any disgorged amounts.
However, in the event the District Court’s Order is reversed on appeal and our defenses to the claims of the statutory lien claimants are unsuccessful or we otherwise become liable for disgorgement of any pre-petition or post-petition royalty payments which we have received from either the Gomez or Telemark properties, the remaining oil and gas reserves associated with the Telemark properties may be insufficient to provide for a full recovery on our investment. In the event that it is determined that we are not entitled to include amounts disgorged on account of statutory lien claims or other claims, if any, into the unrecovered investment balance of our ORRIs, any disgorged amounts will result in a failure to achieve our anticipated return and/or a loss on our investment.
While we intend to vigorously defend our legal positions in the Adversary Proceeding, there can be no assurance that we will ultimately prevail in any or all of these matters.
Bennu Titan Bankruptcy. On August 11, 2016, an involuntary Chapter 11 bankruptcy petition was filed by Beal Bank USA against Bennu Titan LLC (formerly known as ATP Titan LLC), an indirect subsidiary of Bennu Oil & Gas, LLC, and the owner of the floating production platform in the Gulf of Mexico that processes and transports hydrocarbons produced from the Telemark properties, in which OHA owns the ORRI. An order for relief was entered on September 9, 2016, in the case styled In re Bennu Titan LLC (f/k/a ATP Titan LLC), Case No. 16-11870, in the United States Bankruptcy Court for the District of Delaware. We are not a creditor in this bankruptcy case.
Bennu Oil & Gas Bankruptcy. On November 30, 2016, Bennu Oil & Gas, LLC filed a Chapter 7 bankruptcy in the Bankruptcy Court for the Southern District of Texas, Case No. 16-35930. Two of its affiliates, Bennu Blocker, Inc., Case No. 16-35931, and Bennu Holdings, LLC, Case No. 16-35932, likewise filed on that date.
On November 30, 2016, Bennu Oil & Gas, LLC moved to reject the Platform Use Agreement with Bennu Titan, LLC for the drilling and production platform commonly known as the Titan Platform. On January 4, 2017, the Bankruptcy Court entered an order approving the rejection of the Platform Use Agreement effective November 30, 2016.
On January 26, 2017, the Delaware Bankruptcy Court entered an order transferring the Bennu Titan case to the Bankruptcy Court for the Southern District of Texas so that the affiliated cases will be in the same court.
The “meeting of creditors” in the Bennu Oil & Gas bankruptcy case was held on January 26, 2017. The Chapter 7 Trustee reported that she is in the process of working with the Bennu Oil & Gas lenders on a plan to market the leases including the Telemark properties.
Status of Telemark Leases. The Telemark properties are comprised of three leases: Mississippi Canyon Block 942 known as OCS-G 24130 (“MC 942”); Mississippi Canyon Block 941 known as OCS-G 16661 (“MC 941”); and Atwater Valley Block 63 known as OCS-G 13198 (“AT 63”). At the meeting of creditors, Bennu officers testified that the well on the AT 63 lease stopped producing in May, 2016. Prior to filing bankruptcy, Bennu Oil & Gas shut in all of the wells on the other two Telemark leases on November 30, 2016. Accordingly, the leases will expire in 180 days from the date of last production unless production is resumed or the BOEM grants a deferral of the requirement to produce (known as a Suspense of Operations (“SOO”)0 or Suspense of Production (“SOP”). Based on the testimony at the meeting of creditors, we understand that Bennu Oil & Gas applied for an SOP for the AT 63 lease and the government has not ruled on the request. The Trustee’s counsel reported that the Trustee filed an amended request for an SOP for the AT 63 lease. There is no assurance that the government will grant the request for an SOP or any future request for an SOP on the Telemark leases. If the requests are not granted, the Telemark leases will expire 180 days from the date of last production.
Item 4. Mine Safety Disclosures
Not applicable.
PART II
Item 5. Market for Registrant’s Common Equity and Related Stockholder Matters
Effective October 1, 2014, our common stock began to trade on the NASDAQ Global Select Market under the symbol “OHAI.” Prior to that date, our common stock traded on the NASDAQ Global Select Market under the symbol “NGPC.” The following table sets forth the range of high and low sales prices of our common stock, as reported on the NASDAQ Global Select Market, and our distributions declared for the periods indicated.
30
NAV(1) | Price Range | Cash Distribution per Share(2) | ||||||||||||||
High | Low | |||||||||||||||
Fiscal 2016 | ||||||||||||||||
Fourth quarter | $ | 3.99 | $ | 3.33 | $ | 1.65 | $ | 0.06 | ||||||||
Third quarter | 4.61 | 3.29 | 1.94 | 0.06 | ||||||||||||
Second quarter | 4.80 | 3.36 | 1.85 | 0.06 | ||||||||||||
First quarter | 4.85 | 4.25 | 2.51 | 0.06 | ||||||||||||
Fiscal 2015 | ||||||||||||||||
Fourth quarter | $ | 5.49 | $ | 4.87 | $ | 3.53 | $ | 0.12 | ||||||||
Third quarter | 6.71 | 5.74 | 4.00 | 0.12 | ||||||||||||
Second quarter | 7.16 | 5.98 | 5.10 | 0.12 | ||||||||||||
First quarter | 7.27 | 5.31 | 4.56 | 0.12 | ||||||||||||
_______________
(1) | We calculate net asset value per share as of the last day in the relevant quarter and therefore may not reflect the net asset value per share on the date of the high and low closing sales prices. We calculate net asset value per share based on outstanding shares at the end of each period. |
(2) | Represents the distribution declared in the specified quarter. |
The last reported price for our common stock on March 13, 2017 was $1.78 per share. On March 8, 2017, there were approximately 49 record holders. On February 16, 2017, the most recent record date available, there were 5,072 beneficial holders (held in street name) of our common stock, according to our transfer agent.
Distributions
Since the first full quarter following our initial public offering, we have distributed, and currently intend to continue to distribute in the form of dividends, a minimum of 90% of our investment company taxable income to our stockholders. We may retain long-term capital gains and treat them as deemed distributions for tax purposes. We determine the tax characteristics of our dividend distributions as of the end of the fiscal year, based on the taxable income for the full year and distributions paid during the year. Taxable income available for distribution differs from consolidated net investment income under GAAP due to (i) temporary and permanent differences in income and expense recognition, (ii) capital gains and losses, (iii) activity at taxable subsidiaries, and (iv) the timing and period of recognition regarding dividends declared in December of one year and paid in January of the following year. As a result, net investment income and net realized gain (loss) on investments for a reporting period may differ significantly from distributions during such period. We report the estimated tax characteristics of each distribution when declared, and we (or the applicable withholding agent) report the actual tax characteristics of dividends annually to each stockholder on Form 1099-DIV. There is no assurance that we will achieve investment results or maintain a tax status that will permit any specified level of cash distributions or year-to-year increases in cash distributions.
The tax characteristics of distributions paid in 2016 represented $5.8 million from ordinary income, none from return of capital and none from capital gains. For tax purposes, 10% of the $1.2 million dividend paid on January 9, 2017 was applied to 2016 taxable income and 90% will be applied to 2017 taxable income.
Our stock transfer agent, registrar and dividend reinvestment plan administrator is American Stock Transfer & Trust Company. You should direct information requests for American Stock Transfer & Trust Company to Operations Center, 6201 15th Avenue, Brooklyn, NY 11219. Our transfer agent’s telephone number for stockholder or dividend reinvestment services is 1-800-937-5449.
We have established an “opt out” dividend reinvestment plan, or DRIP plan, for our stockholders. As a result, if we declare a cash dividend, our plan agent automatically reinvests a stockholder’s cash dividend in additional shares of our common stock unless the stockholder, or his or her broker, specifically “opts out” of the dividend reinvestment plan and elects to receive cash dividends. It is customary practice for many brokers to opt out of dividend reinvestment plans on behalf of their clients unless specifically instructed otherwise. The purpose of the DRIP plan is to provide stockholders with a method of investing cash dividends and distributions in additional shares at the current market price without charges for record-keeping, custodial and reporting services.
We intend, when permitted by the DRIP plan, to primarily use newly issued shares for reinvested dividends under the DRIP plan. However, we reserve the right to purchase shares in the open market in connection with the DRIP plan. The number of newly issued shares to be issued to a stockholder is determined by dividing the total dollar amount of the dividend payable to
31
such stockholder by the average market price per share of our common stock at the close of regular trading on the exchange or market on which our shares of common stock are listed for the five trading days preceding the valuation date for such dividend.
We may not use newly issued shares to satisfy our obligations under the DRIP plan if the market price of our shares is less than our net asset value per share. In such event, the cash dividends are paid to the plan administrator who purchases shares in the open market for credit to the accounts of plan participants unless the average of the closing sales prices for the shares for the five days immediately preceding the payment date exceeds 110% of the most recently reported net asset value per share. The allocation of shares to the participants’ plan accounts is based on the average cost of the shares so purchased, including brokerage commissions.
Stock Performance Graph
The following line graph compares the cumulative total return on an investment in our common stock against the cumulative total return of the NASDAQ Financial 100 Index, the NASDAQ Index and an index of peer companies (selected by us) for the five years ended December 31, 2016. The graph assumes that $100 was invested in our common stock and each index on December 31, 2011, and that dividends were reinvested. We selected the peer group in good faith and it consists of the following six business development companies: Gladstone Capital Corporation, Gladstone Investment Corporation, KCAP Financial, Inc., CM Finance LLC, THL Credit, Inc. and Stellus Capital Investment Corporation. Our peer group includes BDCs that generally invest in similar types of securities as we do, with market capitalizations between $100 million and $600 million and initial public offering dates in 2010 or earlier. The index of our peer companies index uses beginning of period market capitalization weighting. This historic stock price Performance Graph and the related textual information are not necessarily indicative of future performance.
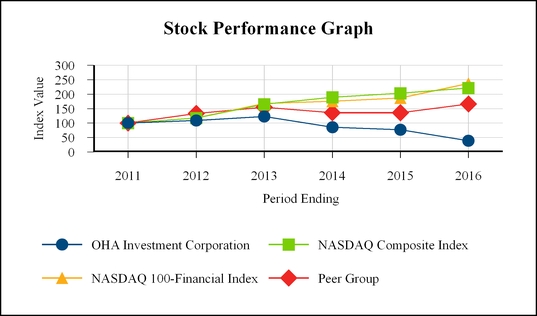
Item 6. Selected Financial Data
The following table contains our selected financial data, as of and for the dates and periods indicated. We derived the selected financial data from our audited financial statements, and you should read it in conjunction with our financial statements and notes thereto and “Management’s Discussion and Analysis of Financial Condition and Results of Operations” included in this Annual Report on Form 10-K.
32
Year ended December 31, | |||||||||||||||||||
2016 | 2015 | 2014 | 2013 | 2012 | |||||||||||||||
(In Thousands, Except Per Share Data and Other Data) | |||||||||||||||||||
Income Statement Data | |||||||||||||||||||
Total investment income | $ | 17,888 | $ | 22,049 | $ | 22,119 | $ | 27,912 | $ | 23,369 | |||||||||
Total operating expenses(1) | 11,378 | 12,008 | 18,812 | 15,245 | 11,560 | ||||||||||||||
Net investment income(1) | 6,503 | 9,969 | 3,198 | 12,576 | 11,763 | ||||||||||||||
Net realized capital loss on investments | (27,011 | ) | (218 | ) | (12,430 | ) | (2,261 | ) | (17,827 | ) | |||||||||
Net unrealized appreciation (depreciation) on investments | (4,938 | ) | (40,973 | ) | (12,999 | ) | (6,445 | ) | 23,415 | ||||||||||
Net increase (decrease) in net assets resulting from operations(1) | $ | (25,446 | ) | $ | (31,222 | ) | $ | (22,231 | ) | $ | 3,870 | $ | 17,351 | ||||||
Per Share Data | |||||||||||||||||||
Net investment income(1) | $ | 0.32 | $ | 0.49 | $ | 0.16 | $ | 0.61 | $ | 0.55 | |||||||||
Net realized and unrealized gain (loss) on investments | (1.58 | ) | (2.03 | ) | (1.24 | ) | (0.42 | ) | 0.26 | ||||||||||
Net increase (decrease) in net assets resulting from operations(1) | $ | (1.26 | ) | $ | (1.54 | ) | $ | (1.08 | ) | $ | 0.19 | $ | 0.81 | ||||||
Dividends declared | $ | 0.24 | $ | 0.48 | $ | 0.64 | $ | 0.64 | $ | 0.57 | |||||||||
Net asset value per share | $ | 3.99 | $ | 5.49 | $ | 7.48 | $ | 9.20 | $ | 9.57 | |||||||||
Balance Sheet Data | |||||||||||||||||||
Total investments | $ | 145,002 | $ | 209,707 | $ | 206,763 | $ | 257,371 | $ | 259,610 | |||||||||
Portfolio investments at fair value | 105,005 | 174,710 | 176,163 | 211,371 | 213,614 | ||||||||||||||
Cash and cash equivalents | 16,533 | 15,554 | 31,455 | 29,298 | 47,655 | ||||||||||||||
Total assets | 162,898 | 228,477 | 242,175 | 292,623 | 312,322 | ||||||||||||||
Total debt(2) | 40,500 | 72,000 | 52,000 | 53,000 | 59,500 | ||||||||||||||
Total net assets | 80,493 | 110,780 | 154,164 | 188,552 | 201,266 | ||||||||||||||
Other Data | |||||||||||||||||||
Weighted average yield on portfolio investments(3) | 8.1 | % | 9.6 | % | 9.2 | % | 10.2 | % | 10.0 | % | |||||||||
Number of portfolio companies | 14 | 17 | 15 | 16 | 14 | ||||||||||||||
Expense ratios (as a percentage of average net assets): | |||||||||||||||||||
Interest expense and bank fees | 3.9 | % | 2.4 | % | 1.2 | % | 1.7 | % | 1.0 | % | |||||||||
Management fees | 2.9 | % | 2.1 | % | 2.6 | % | 2.9 | % | 2.3 | % | |||||||||
Incentive fees | 0.3 | % | 0.7 | % | — | % | 0.2 | % | — | % | |||||||||
Costs related to strategic alternatives review | — | % | — | % | 3.4 | % | 0.3 | % | — | % | |||||||||
Other operating expenses including provision for income taxes | 4.4 | % | 3.2 | % | 3.5 | % | 2.8 | % | 2.4 | % | |||||||||
Total operating expenses including provision for income taxes | 11.5 | % | 8.4 | % | 10.7 | % | 7.9 | % | 5.7 | % | |||||||||
_______________
(1) | Includes $6.0 million and $0.6 million, or $0.29 and $0.03 per share, in 2014 and 2013, respectively, of costs related to our review of strategic alternatives. See Note 1 of Notes to Consolidated Financial Statements included elsewhere herein for further discussion. |
(2) | Excludes amounts borrowed on a temporary basis to purchase U.S. Treasury Bills and debt issuance costs. |
(3) | Calculated as of the end of the period, based on cost. |
33
Item 7. Management’s Discussion and Analysis of Financial Condition and Results of Operations
You should read the following analysis of our financial condition and results of operations in conjunction with our financial statements and the notes thereto contained elsewhere in this Annual Report on Form 10-K.
Forward-Looking Statements
Certain statements in this Annual Report on Form 10-K that relate to estimates or expectations of our future performance or financial condition may constitute “forward-looking statements.” These forward-looking statements are subject to various risks and uncertainties, which could cause actual results and conditions to differ materially from those projected, including, but not limited to:
• | uncertainties associated with the timing and likelihood of investment transaction closings; |
• | changes in interest rates; |
• | the future operating results of our portfolio companies and their ability to achieve their objectives; |
• | changes in regional, national or international economic conditions and their impact on the industries in which we invest; |
• | disruptions in the credit and capital markets; |
• | changes in the conditions of the industries in which we invest; |
• | the adequacy of our cash resources and working capital; |
• | the timing of cash flows, if any, from the operations of our portfolio companies; |
• | the ability of OHA to locate suitable investments for us and to monitor and administer our investments; |
• | other factors enumerated in our filings with the SEC; |
• | further decrease in oil and gas prices for an extended period causing further losses in E&P holdings; and |
• | effects of current and pending legislation. |
We may use words such as “anticipates,” “believes,” “intends,” “plans,” “expects,” “projects,” “estimates,” “will,” “should,” “may” and similar expressions to identify forward-looking statements. These forward-looking statements are subject to various risks and uncertainties. Certain factors could cause actual results and conditions to differ materially from those projected and our historical experience. You should not place undue reliance on such forward-looking statements, which speak only as of the date they are made. We undertake no obligation to update our forward-looking statements made herein, unless required by law.
Overview
We are a specialty finance company with an investment objective to generate both current income and capital appreciation primarily through debt investments, some of which include equity components. We focus primarily on providing creative direct lending solutions to middle market private companies across industry sectors. Our investment activities are managed by OHA and supervised by our Board of Directors, the majority of whose members are independent of OHA and its affiliates.
We are an externally managed, closed-end, non-diversified management investment company that has elected to be regulated as a BDC, under the 1940 Act. For federal income tax purposes, we operate so as to be treated as a RIC, under Subchapter M of the Code. As a BDC and a RIC, we are required to comply with certain investment diversification and other regulatory requirements.
On September 30, 2014, our stockholders approved the appointment of OHA as our investment advisor, replacing NGP Investment Advisor, LP, which had been our investment advisor since our inception. In connection with this change in investment advisor, we changed our name from NGP Capital Resources Company to OHA Investment Corporation. OHA is a registered investment adviser under the Advisers Act. OHA acts as our investment advisor and administrator pursuant to the Investment Advisory Agreement and the Administration Agreement.
The aggregate fair value of our investment portfolio at December 31, 2016 was $105.0 million, with such value comprised of 12 active portfolio investments. Under our previous investment advisor, we focused our investments primarily on small and mid-size companies engaged in the upstream sector of the energy industry, which includes businesses that find, develop and extract energy resources, including natural gas, crude oil and coal. Consequently, a significant portion of our current investment portfolio value is comprised of debt securities and other investments in upstream exploration and production companies engaged in the acquisition, development and production of oil and natural gas properties in and along the Gulf Coast and in the state and federal waters of the Gulf of Mexico.
34
Part of OHA’s investment strategy is to reduce our portfolio concentration in the energy industry and to diversify our portfolio with investments in debt securities of U.S. private and small public middle market companies across industry sectors. Since September 30, 2014, we have made a total of 13 new investments with a principal amount of $121.3 million (total cost of $117.5 million) and realized six of these investments with a principal amount of $60.6 million. Primarily as a result of these new investments, net of realizations, and write-downs of legacy energy investments, the concentration of our investment portfolio in the energy sector decreased to 38% at December 31, 2016.
Our historical focus and current concentration in the energy sector causes our portfolio to be particularly influenced by commodity prices for oil and natural gas, which experienced significant volatility in 2016 as the sector responded to changes in supply and demand, the weather, and uncertainty regarding production volumes. Brent crude prices in 2016 averaged $45 per barrel, down by $8 per barrel from 2015. West Texas Intermediate (WTI) crude oil prices averaged $43 per barrel, down by $5 per barrel from 2015. U.S. natural gas prices averaged $2.55 per million British thermal units (BTU) at Henry Hub, the U.S. national benchmark, down from $2.63 per million BTU in 2015. Although average prices were lower in 2016, the year ended on a more positive note; Brent crude and WTI ended the year at $57 per barrel and $54 per barrel, respectively. Natural gas prices were also higher at the end of 2016, rising to an average of $3.58 per million BTU in December 2016. Further decline or increased volatility in the energy markets, particularly in North America, will negatively impact the values of our energy-related investments and, in turn, our net asset value. These factors may also extend the holding period for such investments, thus impacting our ability to reduce the concentration of energy investments in our portfolio. See “Item 1A. Risk Factors — Risk Factors Related to Our Investments” for further discussion regarding the decline in oil and natural gas prices and other risks related to the energy industry.
Our level of investment activity can and does vary substantially from period to period depending on many factors. Some of these factors are the amount of debt and equity capital available to middle market companies, the level of acquisition and divestiture activity for such companies, the general economic environment and the competitive environment for the types of investments we make, and our own ability to raise capital to fund our investments, both through the issuance of debt and equity securities. If a substantial portion of our investment portfolio were to be realized in the near term, OHA may not be able to source sufficient appropriate investments for us to timely replace the investment income from the realized investments.
Portfolio and 2016 Investment Activity
In January 2016, we purchased a $1.7 million second lien term loan to Berlin Packaging, LLC, or Berlin, adding to our $5.5 million position that was previously acquired in December 2015. The $1.7 million Berlin loan was purchased at a 5.0% discount, earns interest payable in cash at a rate of 7.75% per annum (LIBOR+6.75% with a 1.0% floor) and matures in October 2022.
In March 2016, we sold $0.5 million of the second lien term loan of Stardust Financial Holdings, Inc., an affiliate of Hanson Building Products, or Hanson, at a price of 97.0% of par, resulting in a realized capital gain of $24,000 or $0.00 per share. In April and May 2016, we sold an additional $5.4 million of the Hanson second lien term loan at an average price of 98.5% of par, resulting in realized capital gains of $0.2 million or $0.01 per share. In October 2016, Hanson repaid its second lien term loan in the amount of $1.7 million which included a 3%, or $0.1 million, call premium. This investment generated a gross internal rate of return of 16.3% and a return on investment of 1.17x.
In April 2016, KOVA International, Inc., or KOVA, repaid its senior subordinated notes in the amount of $9.0 million. We recorded previously unamortized original issue discount of $0.1 million as additional interest income as a result of this repayment. This investment was initiated in February 2013 and generated a gross internal rate of return of 14.8% and a return on investment of 1.45x.
In June 2016, we sold our 800 Membership Units representing 80% of the common equity of Contour Highwall Holdings, LLC, or Contour, for $1.4 million, net of transaction costs of $0.1 million. In connection with this transaction, the senior secured term loan and the unsecured promissory note of Contour were extinguished. The initial investment was made in October 2010 and this transaction resulted in a realized loss of $10.1 million.
In July 2016, WP Mustang (Electronic Funds Services, LLC) repaid its second lien term loan in the amount of $10.0 million. This prepayment included a 1%, or $0.1 million, call premium and we recorded previously unamortized discount of $0.1 million as additional interest income as a result of this repayment. This investment was initiated in December 2014 and generated a gross internal rate of return of 11.0% and a return on investment of 1.17x.
In August 2016, Appriss Holdings, Inc. repaid part of its second lien term loan in the amount of $3.8 million. We recorded previously unamortized discount of $0.05 million as additional interest income as a result of this repayment.
In October 2016, Synarc-BioCore Holdings, LLC repaid its first lien senior secured notes in the amount of $2.4 million. This prepayment included a 7%, or $0.2 million, call premium and we recorded previously unamortized discount of $0.1
35
million as additional interest income as a result of this repayment. This investment was initiated in September 2015 and generated a gross internal rate of return of 17.0% and a return on investment of 1.11x.
In November 2016, Kronos, Inc repaid its second lien term loan in the amount of $12.0 million. This prepayment included a 1%, or $0.1 million, call premium which was partially offset by previously unamortized premium of $0.1 million to interest income as a result of the prepayment. This investment was initiated in October 2015 and generated a gross internal rate of return of 9.9% and return on investment of 1.10x.
In November 2016, we purchased a $5.5 million second lien term loan to PAE Holding Corporation, or PAE, a leading government contractor that provides operations & maintenance, logistics, training, construction, vehicle/aircraft maintenance for US embassies, government infrastructure and military facilities. In addition, PAE provides background checks, biometric data collection, security clearances and human relationship support to the US Office of Personnel Management. The second lien term loan issued by PAE was purchased at a 3.0% discount, earns interest payable in cash at a rate of 10.50% per annum (LIBOR+9.50% with a 1.0% floor) and matures on October 2023.
In December 2016, our position in Gramercy Park CLO Ltd., or Gramercy, was called and we received partial payment of $3.9 million on our investment of which $3.7 million was applied to our basis. We expect to receive future payments related to our investment in Gramercy from the underlying assets that have not yet been sold or settled.
As of December 31, 2016, our unrecovered investment in limited-term overriding ORRIs purchased from Bennu, was $31.1 million, and we had received aggregate production payments of $37.5 million subject to a disgorgement agreement. In addition, as of December 31, 2016, we had incurred legal and consulting fees totaling $5.9 million in connection with the enforcement of our rights under the ORRIs. On various occasions, we have provided notice to Bennu that such legal expenses will be added to our unrecovered investment balance to the extent they are not reimbursed. To date, we have not received any payments on account of legal expenses aside from our receipt of regular monthly production payments which ceased after the September 2016 production payment. We add our legal expenses to the unrecovered investment balance in accordance with our transaction documents. As of December 31, 2016, $5.4 million of the $5.9 million in legal and consulting fees have been added to, and are thus included in, the unrecovered investment balance under the terms of our transaction documents. The remaining amounts of legal and consulting fees, have been expensed, thus, not included in the unrecovered investment balance as of December 31, 2016. We note that the fair value of our investment in ATP ORRI decreased from $11.8 million as of December 31, 2015 to $0 as of December 31, 2016 $0 as of the result of the cessation of monthly production payments. For more information, please refer to the discussion of the ATP Litigation under the heading “Legal Proceedings” in Note 6 to our interim consolidated financial statements.
The table below shows our portfolio investments by type for the periods indicated. We compute yields on investments using interest rates as of the balance sheet date and include amortization of original issue discount and market premium or discount, royalty income and other similar investment income, weighted by their respective costs when averaged. Such weighted average yields are not necessarily indicative of expected total returns on a portfolio.
December 31, 2016 | December 31, 2015 | |||||||||||||||||
Weighted Average Yields(1) | Weighted Average Yields(1) | |||||||||||||||||
Percentage of Portfolio | Percentage of Portfolio | |||||||||||||||||
Cost | Fair Value | Cost | Fair Value | |||||||||||||||
First lien secured debt | — | % | — | % | — | % | 8.3 | % | 9.3 | % | 1.9 | % | ||||||
Second lien debt | 9.5 | % | 27.5 | % | 34.2 | % | 10.0 | % | 30.8 | % | 39.8 | % | ||||||
Subordinated debt | 15.2 | % | 22.3 | % | 32.1 | % | 13.3 | % | 19.9 | % | 21.7 | % | ||||||
Limited term royalties | 5.3 | % | 16.0 | % | — | % | 11.8 | % | 11.6 | % | 6.8 | % | ||||||
Redeemable preferred units | 5.8 | % | 31.9 | % | 31.3 | % | 10.0 | % | 21.4 | % | 25.1 | % | ||||||
CLO residual interests (2) | 13.5 | % | 0.9 | % | 1.7 | % | 13.3 | % | 2.6 | % | 3.2 | % | ||||||
Equity securities | ||||||||||||||||||
Membership and partnership units | — | % | 1.4 | % | 0.7 | % | — | % | 4.4 | % | 1.5 | % | ||||||
Total equity securities | — | % | 1.4 | % | 0.7 | % | — | % | 4.4 | % | 1.5 | % | ||||||
Total portfolio investments | 9.7 | % | 100.0 | % | 100.0 | % | 11.0 | % | 100.0 | % | 100.0 | % | ||||||
(1) Weighted average yield based on cost and excludes non-yielding assets.Yields are based on the most recent quarter's activity.
36
(2) Yields from investments in CLO residual interests represent the implied internal rate of return calculation expected from cash flows.
As of December 31, 2016 and December 31, 2015, the total fair value of our portfolio investments was $105.0 million and $174.7 million, respectively. Of those fair value totals, approximately $60.9 million, or 58.0%, as of December 31, 2016, and $107.3 million, or 61.4%, as of December 31, 2015, are determined using significant unobservable (i.e., Level 3) inputs.
Results of Operations
The following sections analyze our results of operations for the year ended December 31, 2016 compared to 2015 and for the year ended December 31, 2015 compared to 2014.
Investment Income
Total investment income includes interest on our investments, dividend income, royalty income and other income. Dividend income is income we from certain of our equity investments. Royalty income is net of amortization that we receive in connection with certain of our investments. Other income includes prepayment fees and modification fees we receive in connection with certain of our investments. These fees are recognized as earned. The table below summarizes the components of our investment income.
Investment Income | For the year ended December 31, | |||||||||||
(in thousands) | 2016 | 2015 | 2014 | |||||||||
Interest income | $ | 13,382 | $ | 16,724 | $ | 17,452 | ||||||
Dividend income | 4,008 | 4,279 | 4,002 | |||||||||
Royalty income, net of amortization | — | 30 | 155 | |||||||||
Other income | 498 | 1,016 | 510 | |||||||||
Total investment income | $ | 17,888 | $ | 22,049 | $ | 22,119 | ||||||
For the year ended December 31, 2016 total investment income was $17.9 million, a 19% decrease from $22.0 million for the year ended December 31, 2015. The decrease of $4.2 million was primarily due to lower average portfolio loan balances from December 31, 2015 to December 31, 2016 and a decrease in non-recurring fee income of $0.5 million.
For the year ended December 31, 2015 total investment income was $22.0 million, a $0.1 million decrease from the year ended December 31, 2014 as a result of a decline in the weighted average investment income yield in 2015, partially offset by an increase in the average portfolio investment balance plus $1.0 million in prepayment premiums and amendment fees earned in 2015.
Operating Expenses
Operating expenses include our allocable portion of operating expenses incurred on our behalf by our investment advisor and our administrator. Other general and administrative expenses include our allocated share of employee, facilities, and stockholder services incurred by our administrator. The table below summarizes the components of our operating expenses.
Operating Expenses | For the year ended December 31, | |||||||||||
(in thousands) | 2016 | 2015 | 2014 | |||||||||
Interest expense and bank fees | $ | 3,819 | $ | 3,480 | $ | 2,119 | ||||||
Management fees | 2,939 | 3,034 | 4,602 | |||||||||
Incentive fees | 281 | 969 | — | |||||||||
Costs related to strategic alternatives review | — | — | 6,040 | |||||||||
Professional fees | 2,442 | 2,126 | 1,437 | |||||||||
Other general and administrative expenses | 1,652 | 2,154 | 4,369 | |||||||||
Directors fees | $ | 245 | $ | 245 | $ | 245 | ||||||
Total operating expenses | $ | 11,378 | $ | 12,008 | $ | 18,812 | ||||||
37
For the year ended December 31, 2016, total operating expenses decreased by 5.2% to $11.4 million from $12.0 million for the year ended December 31, 2015 primarily due to lower general and administrative expenses, base management and incentive fees partially offset by higher interest expense and bank fees.
Interest expense and bank fees increased by 9.7% to $3.8 million for the year ended December 31, 2016 from $3.5 million compared to prior year largely due to higher rates on the Credit Facility compared to the Investment Facility and an increase in the weighted average debt amount outstanding of $3.8 million. Management and incentive fees decreased by 19.6% to $3.2 million from $4.0 million due to lower incentives fees incurred in 2016 and lower average asset base subject to the base management fee during 2016. Other general and administrative expenses decreased by 23.3% to $1.7 million from $2.2 million primarily due to a decrease in employee related expenses in 2016 and settlement costs related to our ATP legal proceedings in 2015 which was offset by a credit applied to our 2015 expenses in excess of the Cap under the Investment and Advisory Agreement.
For the year ended December 31, 2015, total operating expenses decreased by 36.2% to $12.0 million from $18.8 million for the year ended December 31, 2014. Total operating expenses decreased primarily due to costs related to strategic alternative review in 2014 and lower management fees and general and administrative expenses. Management fees decreased by 34.1% to $3.0 million from $4.6 million primarily as a result of the lower base management fee structure in the Investment Advisory Agreement with OHA as compared to the base management fee structure under our former investment advisory agreement. During 2014, we also incurred $6.0 million of non-recurring costs related to our strategic alternatives review process, which ultimately resulted in the appointment of OHA as our new investment advisor as of September 30, 2014. Professional fees increased during 2015 compared to 2014, primarily due to legal fees and recruitment fees. Other general and administrative expenses decreased during 2015 compared to 2014, as a result of costs incurred in connection with our shelf registration statement that expired in the second quarter of 2014, lower personnel costs, lower insurance expense and a credit applied to our expenses of $0.5 million from OHA related to expenses in excess of the Cap under the Investment Advisory Agreement and the Administration Agreement, partially offset by settlement expenses related to our ATP legal proceedings. Increase in interest and bank fees increased by 64.2% to $3.5 million in 2015 from $2.1 million due to greater utilization of our Investment Facility in 2015.
In connection with the transactions surrounding the appointment of OHA as our investment advisor, and the related process of evaluating strategic alternatives, we incurred costs totaling $6.0 million, or $0.29 per share, during 2014, including $3.4 million of retention payments to employees of our former administrator pursuant to retention agreements entered into in September 2013 and allocated to us under the terms of the administration agreement with NGP Administration, LLC, $1.1 million for a “tail” insurance policy covering our former directors and officers, and $1.5 million of legal and investment banking advisory fees. We also incurred an additional $0.6 million, or $0.03 per share, of legal and consulting costs related to the strategic alternatives review during the fourth quarter of 2013. Thus, the total cost incurred related to the strategic review process was $6.7 million, or $0.32 per share.
According to the terms of our previous investment advisory agreement with NGP Investment Advisor, LP, prior to September 30, 2014, we calculated the base management fee quarterly as 0.45% of the average of our total assets (inclusive of all cash and cash equivalents without any exclusions) as of the end of the two most recent fiscal quarters. According to the terms of our new Investment Advisory Agreement with OHA, effective September 30, 2014, we calculate the base management as 0.4375% (reduced to 0.375% in the first year) of the average of our total assets (excluding cash, cash equivalents and U.S. Treasury Bills that are purchased with borrowed funds solely for the purpose of satisfying quarter-end diversification requirements related to our election to be taxed as a RIC under the Code). Consequently, our base management fee, relative to our total asset balances, is lower under the Investment Advisory Agreement than it was under our previous investment advisory agreement.
Under the Investment Advisory Agreement, the investment income incentive fee is calculated quarterly at a rate of 20% of quarterly net investment income above a “hurdle rate” of 1.75% per quarter (7% annualized) with a “catch up” provision. Under our previous investment advisory agreement, the investment income incentive fee was calculated at 20% of net investment income above a “hurdle rate” of 2.0% per quarter (8% annualized) with no “catch up” provision.
Net Investment Income
Net Investment Income | For the year ended December 31, | |||||||||||
(in thousands, except per share data) | 2016 | 2015 | 2014 | |||||||||
Net investment income | $ | 6,503 | $ | 9,969 | $ | 3,198 | ||||||
Net investment income per common share | 0.32 | 0.49 | 0.16 | |||||||||
38
As the result of the $4.2 million decrease in total investment income and the $0.6 million decrease in total operating expenses, net investment income for the year ended December 31, 2016 was $6.5 million compared to net investment income of $10.0 million during the year ended December 31, 2015.
For the year ended December 31, 2015, the increase in net investment income compared to the year ended December 31, 2014 was driven primarily by the $6.0 million of costs related to the strategic alternatives review process in 2014.
Net Realized Gains and Losses
Net realized gains and losses is the difference between the net proceeds received from dispositions of portfolio investments and their stated costs. Realized losses may also be recorded in connection with our determination that certain investments are considered worthless securities and/or meet the conditions for loss recognition per the applicable tax rules.
Net Realized Capital Gains and Losses | For the year ended December 31, | |||||||||||
(in thousands, except per share data) | 2016 | 2015 | 2014 | |||||||||
Net realized capital gains and losses | $ | (27,011 | ) | $ | (218 | ) | $ | (12,430 | ) | |||
Net realized capital gains and losses per common share | (1.34 | ) | (0.01 | ) | (0.61 | ) | ||||||
For the year ended December 31, 2016, we recognized net realized capital losses totaling $27.0 million, which consisted of of $27.1 million in realized capital losses related two control portfolio companies; (i) $10.1 million related to the sale of our equity interest in Contour and the extinguishment of the associated senior secured term loans and (ii) $17.0 million realized capital loss on our remaining interests in Spirit Resources, LLC, or Spirit, which consisted of senior secured loans tranche A & B and 80,000 preferred units. Realized capital losses in 2016 were partially offset by a $0.2 million realized capital gain related to the sale of the $5.8 million Hanson second lien term loan.
For the year ended December 31, 2015, we realized net capital losses of $0.2 million primarily related to the redemption of our Myriant shares and expiration of our Myriant warrants. These realized losses were partially offset by a realized gain related to the reconveyance of a component of our Spirit investments and Huff warrants.
For the year ended December 31, 2014, we recognized net realized losses of $12.4 million primarily as the result of losses of $9.4 million on the disposition of our GMX 2018 Notes and $4.3 million on the write-off of our investment in Chroma preferred stock, both of which losses were recorded as unrealized depreciation on investments in previous years. These realized losses were partially offset by realized gains of $0.9 million on the realization of our investments in Crossroads and $0.7 million on the sale of our Midstates Notes, and net losses on remaining realizations of $0.3 million.
Unrealized Appreciation or Depreciation on Investments
Net unrealized appreciation or depreciation is the net change in the fair value of our investments during the reporting period, including the reversal of previously recorded unrealized appreciation or depreciation when gains or losses are realized.
Net Unrealized Appreciation (Depreciation) on Investments | For the year ended December 31, | |||||||||||
(in thousands, except per share data) | 2016 | 2015 | 2014 | |||||||||
Control investments | $ | 27,608 | $ | (5,222 | ) | $ | (19,144 | ) | ||||
Affiliate investments | (2,820 | ) | 802 | (90 | ) | |||||||
Non-affiliate investments | (29,726 | ) | (36,553 | ) | 6,235 | |||||||
Benefit (provision) for taxes on unrealized appreciation (depreciation) on investments | — | — | — | |||||||||
Net unrealized appreciation (depreciation) on investments | $ | (4,938 | ) | $ | (40,973 | ) | $ | (12,999 | ) | |||
Net unrealized appreciation (depreciation) on investments per common share | (0.24 | ) | (2.02 | ) | (0.63 | ) | ||||||
Control Investments
For the year ended December 31, 2016, the increase in net unrealized gains on our control investments was attributable to the reversal of unrealized depreciation, due to realizations, on our investments in Contour and Spirit of $10.6 million and $17.0 million, respectively. In 2015, the increase in net unrealized depreciation on our control investments was primarily due to a
decrease in the fair value of our Contour and Spirit investments of $4.3 million and $0.9 million, respectively. During 2014, the increase in net unrealized depreciation on our control investments was primarily due to a decrease in fair value of our Contour and Spirit investments of $7.1 million and $12.1 million, respectively.
Affiliate Investments
For the year ended December 31, 2016, the increase in net unrealized depreciation on our affiliate investments was attributable to a decrease in the fair value of our investment in OCI of $2.8 million. In 2015, the increase in net unrealized appreciation on our affiliate investments was attributable to an increase in the fair value of our investment in OCI of $0.8 million. During 2014, the increase in net unrealized depreciation on our affiliate investments was attributable to a decrease in fair value of our investment in OCI of $0.1 million.
Non-Affiliate Investments
For the year ended December 31, 2016, the increase in net unrealized depreciation on our non-affiliate investments was primarily due to a decrease in the fair value of our investments in Castex of $15.5 million, Bennu of $12.0 million, Shoreline Energy, LLC of $9.1 million, and other investments of $0.3 million. These decreases were partially offset by increase in the fair value of our investments in Talos of $2.0 million, TIBCO Software, Inc. of $1.6 million, other portfolio companies totaling $2.4 million, and the reversal of net unrealized losses due to realization of $1.1 million.
For the year ended December 31, 2015, the increase in net unrealized depreciation on our non-affiliate investments was primarily due to a decrease in the fair value of our investments in ATP of $12.8 million, Castex of $12.2 million, Talos of $5.8 million, Shoreline Energy, LLC of $2.5 million, TIBCO Software, Inc. of $1.3 million, KOVA of $1.1 million, and other investments of $1.8 million. These decreases were partially offset by increase in the fair value of some of our investments in portfolio companies and the reversal of net unrealized losses due to realization of $0.9 million.
For the year ended December 31, 2014 the increase net unrealized appreciation on our non-affiliate investments primarily due to an increase in the estimated fair value of our investment in Castex of $2.2 million and the reversal of unrealized losses related to the realization of our investments in the GMX 2018 Notes of $9.4 million and Chroma preferred stock of $4.3 million. This was partially offset by decreases in fair value of our investments in ATP of $3.3 million, Shoreline of $1.5 million, Talos of $1.4 million, other investments of $1.2 million, and the reversal of unrealized gains related to the realization of our investments in Crossroads Energy of $1.5 million and Midstates of $0.8 million.
Net Increase or Decrease in Net Assets Resulting from Operations
The table below summarizes the components of our net increase or decrease in net assets resulting from operations.
Net Increase (Decrease) in Net Assets Resulting from Operations | For the year ended December 31, | |||||||||||
(in thousands, except per share data) | 2016 | 2015 | 2014 | |||||||||
Net increase (decrease) in net assets resulting from operations | $ | (25,446 | ) | $ | (31,222 | ) | $ | (22,231 | ) | |||
Net increase (decrease) in net assets resulting from operations per common share | (1.26 | ) | (1.54 | ) | (1.08 | ) | ||||||
For the year ended December 31, 2016, the net increase in net assets resulting from operations compared to the year ended December 31, 2015 is primarily attributable to the $36.0 million increase in unrealized gains on our investments attributable to reversal of unrealized depreciation, due to realizations, partially offset by an increase in realized losses of $26.8 million and the $3.5 million decrease in net investment income, all of which are described above.
For the year ended December 31, 2015, the net decrease in net assets resulting from operations compared to the year ended December 31, 2014 is primarily attributable to the $28.0 million increase in unrealized losses on our investments, partially offset by a decrease in realized loss of $12.2 million and the $6.8 million increase in net investment income, all of which are described above.
39
Financial Condition, Liquidity and Capital Resources
We expect to fund our investments and our operations in 2017 from available cash, proceeds from realizations of existing investments and from borrowings under the Credit Facility. In the future, we may also fund a portion of our investments with issuances of equity or senior debt securities. We expect our primary use of funds to be investments in portfolio companies, cash distributions to holders of our common stock and payment of fees, debt service, and other operating expenses.
Cash Flows
At December 31, 2016 and December 31, 2015, we had cash and cash equivalents totaling $16.5 million and $15.6 million, respectively.
For the year ended December 31, 2016, we experienced a net increase in cash and cash equivalents in the amount of $1.0 million. During that period, our operating activities attributed $35.4 million in cash, consisting primarily of proceeds from redemption of investments in portfolio securities of $50.8 million, partially offset by purchases of new investments in portfolio securities of $7.1 million. In addition, financing activities used cash of $34.4 million primarily related to $80.5 million of repayments on our Investment Facility and cash distributions paid to our stockholders in the amount of $6.1 million, partially offset by initial cash proceeds of $40.5 million from our new Credit Facility.
For the year ended December 31, 2015, we experienced a net decrease in cash and cash equivalents in the amount of $15.9 million. During that period, our operating activities used $27.2 million in cash, consisting primarily of purchases of new investments in portfolio securities of $74.4 million, partially offset by proceeds from redemption of investments in portfolio securities of $38.0 million. In addition, financing activities provided cash of $11.3 million, consisting of our net borrowings under our repurchase agreement of $34.3 million in correction with the purchases of our investments in U.S. Treasury Bills, partially offset by our net borrowings under our Investment Facility of $10.0 million and cash distributions paid to our stockholders in the amount of $10.6 million.
For the year ended December 31, 2014, we experienced a net increase in cash and cash equivalents in the amount of $2.2 million. During that period, our operating activities attributed $30.3 million in cash, consisting primarily of proceeds from redemption of investments in portfolio securities of $51.8 million, partially offset by purchases of new investments in portfolio securities of $39.7 million. In addition, financing activities used cash of $28.1 million primarily related to $16.0 million of repayments on our Investment Facility and cash distributions paid to our stockholders in the amount of $13.1 million.
Distributions to Stockholders
For the year ended December 31, 2016, we paid cash distributions totaling $6.1 million, or $0.30 per share, to our common stockholders compared to $10.6 million, or $0.52 per share, during 2015 and $13.1 million, or $0.64 per share, during 2014. In December 2016, we declared a fourth quarter dividend totaling $1.2 million, or $0.06 per share, which was paid in January 2017. We currently intend to continue to distribute, out of assets legally available for distribution and as determined by our Board of Directors, in the form of quarterly distributions, a minimum of 90% of our annual investment company taxable income to our stockholders.
In March 2015, our Board of Directors authorized us to repurchase up to the remaining $2.4 million available to be repurchased under a previously approved plan, which was completed in the third quarter of 2015. See Note 8 to our consolidated financial statements.
Commodity Derivative Instruments
We use commodity derivative instruments from time to time to manage our exposure to commodity price fluctuations. We do not designate these instruments as hedging instruments for financial accounting purposes, and, as a result, we recognize the change in the instruments’ fair value currently on the Consolidated Statement of Operations as net increase (decrease) in unrealized appreciation (depreciation) on investments. See Note 11 of Notes to Consolidated Financial Statements included elsewhere herein for further description of our put options.
Credit Facilities and Borrowings
We are party to the Credit Agreement which replaced our prior Third Amended and Restated Revolving Credit Agreement (the "Investment Facility"), as amended with SunTrust Bank, as administrative agent. As of December 31, 2016, the size of the Credit Facility was $56.5 million with a maturity date of March 9, 2018, which can be extended for a six-month period at our option, subject to certain conditions. The initial proceeds of $40.5 million from the Credit Facility were used to pay off the $38.5 million outstanding balance on the Investment Facility, pay transaction expenses and provide balance sheet cash. The remaining $16.0 million consists of a delayed draw term loan, which is committed for one year, and is available to us to grow our investment portfolio and operate our business.
40
As of December 31, 2016, the total amount outstanding under the Credit Facility was $40.5 million with $16.0 million available to draw. The total amount outstanding on the Credit Facility is shown net of unamortized debt issuance costs of $1.4 million on our Consolidated Balance Sheet as of December 31, 2016. Substantially all of our assets, except our investments in U.S. Treasury Bills, are pledged as collateral for the obligations under the Credit Facility. The Credit Facility bears an interest rate of Adjusted LIBOR plus 5.35% for Eurodollar Loans, subject to a 1% LIBOR floor, and Base Rate plus 4.35% for Base Rate Loans. As of December 31, 2016 the interest rate on our outstanding balance of $40.5 million was 6.35%.
The Credit Facility contains affirmative and reporting covenants and certain financial ratio and restrictive covenants. We have complied with these covenants from the date of the new Credit Agreement through December 31, 2016, and had no existing defaults or events of default under the Credit Facility. The financial covenants, with terms as defined in the Credit Agreement, are:
• | maintain a Debt to Tangible Net Worth Ratio of not more than 0.80:1.00, as determined on the last day of the calendar month, |
• | maintain at all times a minimum liquidity in the form of Cash or Cash Equivalents of at least $1.0 million, |
• | maintain a Debt to Fair Market Value Ratio of not more than 0.50:1.00 at any time, and |
• | maintain the Fair Market Value of Liquid Portfolio Investments as a percentage of outstanding aggregate principal balance to not be less than 80% through March 9, 2017, 90% through September 9, 2017 and 100% through March 9, 2018. |
The Investment Facility initially was a $72.0 million facility and subsequently went through a series of amendments to extend its maturity date prior to its pay-down and extinguishment on September 9, 2016. On May 9, 2016, we amended the Investment Facility to extend the maturity date from May 23, 2016 to July 29, 2016 (the "Extension"), and reduce the size of the Investment Facility from $72.0 million to $54.0 million. Under the Extension, we were required to use cash proceeds from any returns of capital on our portfolio investments to prepay our debt obligations under the Investment Facility. We were also permitted to accrue but were prohibited from paying management or incentive fees (excluding reimbursements to OHA for costs and expenses, or indemnification payments owed to OHA) to OHA under our Investment Advisory Agreement or Administration Agreement.
On July 28, 2016, we amended the Investment Facility to extend its maturity date from July 29, 2016 to September 15, 2016 (the “July Extension”). The July Extension contained substantially identical terms and conditions to the prior extension granted on May 9, 2016, but with the addition of the following: (i) a reduction of the size of the Investment Facility from $54.0 million to approximately $42.3 million, reflecting the outstanding principal balance on July 26, 2016 and (ii) an increase in the margin rate applicable to Eurodollar Loans and Base Rate Loans to 5.25%.
As of December 31, 2015, the total amount outstanding under the Investment Facility was $72.0 million. Substantially all of our assets, except our investments in U.S. Treasury Bills, were pledged as collateral for the obligations under the Investment Facility. The Investment Facility bore interest, at our option, at either (i) LIBOR plus 3.25% to 4.75%, or (ii) the base rate plus 2.25% to 3.75%, both based on our amounts outstanding.
We were party to a $30.0 million Treasury Secured Revolving Credit Agreement, or the Treasury Facility, dated March 31, 2011, as amended, with SunTrust Bank as administrative agent, that could only be used to purchase U.S. Treasury Bills. Proceeds from the Treasury Facility facilitated the growth of our investment portfolio and provided flexibility in the sizing of our portfolio investments. On September 24, 2014, we entered into a fifth amendment to the Treasury Facility, reduced the size of the Treasury Facility to $30.0 million and permitted the appointment of OHA as our investment advisor. Borrowings under the Treasury Facility bore interest, at our option, at either (i) LIBOR plus 150 basis points or (ii) the base rate plus 50 basis points. The Treasury Facility matured on September 24, 2015 and was not renewed.
The Investment Facility and the Treasury Facility contained affirmative and reporting covenants and certain financial ratio and restrictive covenants. We complied with these covenants throughout 2015 and the period ended September 9, 2016, and had no existing defaults or events of default under either facility. The most restrictive covenants, with terms as defined in the credit agreements, were (these restrictive covenants apply to both the Investment Facility and the Treasury Facility, unless otherwise noted):
• | maintaining a ratio of net asset value to consolidated total indebtedness (excluding net hedging liabilities) of not less than 2.25:1.0, |
• | maintaining a ratio of net asset value to consolidated total indebtedness (including net hedging liabilities) of not less than 2.0:1.0, |
• | maintaining a ratio of EBITDA (excluding revenue from cash collateral) to interest expense (excluding interest on loans under the Treasury Facility) of not less than 3.0:1.0, and |
41
• | maintaining a ratio of collateral to the aggregate principal amount of loans under the Treasury Facility of not less than 1.02:1.0. |
At the end of each quarter, we may take proactive steps to preserve investment flexibility for the next quarter by investing in cash equivalents, which includes purchasing U.S. Treasury Bills, by utilizing repurchase agreements on a temporary basis. On December 27, 2016, we purchased $40.0 million of U.S. Treasury Bills and contemporaneously entered into a repurchase arrangement with a global financial institution to finance such purchase. Under the repurchase arrangement, we transferred $40.0 million of U.S. Treasury Bills and $0.8 million of cash as collateral under the repurchase agreement. We repaid the $39.2 million amount borrowed under the repurchase agreement, and was returned the $0.8 million cash collateral, net of a $10 thousand financing fee, upon maturity of the U.S. Treasury Bills on January 5, 2017. We account for the transfer of the U.S. Treasury Bills under the repurchase agreement as a secured borrowing. As a result, the U.S. Treasury Bills are recorded on our books as investments in U.S. Treasury Bills, and the amount borrowed under the repurchase agreement is recorded as short-term debt at December 31, 2016.
On December 22, 2015, we purchased $35.0 million of U.S. Treasury Bills and contemporaneously entered into a repurchase arrangement with a global financial institution to finance such purchase. Under the repurchase arrangement, we transferred $35.0 million of U.S. Treasury Bills and $0.7 million of cash as collateral under the repurchase agreement. We repaid the amount borrowed under the repurchase agreement, and was returned the $0.7 million cash collateral, net of a $21 thousand financing fee, upon maturity of the U.S. Treasury Bills on January 21, 2016. We account for the transfer of the U.S. Treasury Bills under the repurchase agreement as a secured borrowing. As a result, the U.S. Treasury Bills are recorded on our books as investments in U.S. Treasury Bills, and the amount borrowed under the repurchase agreement is recorded as short-term debt at December 31, 2015.
Distributions
We have elected to operate our business to be taxed as a RIC for federal income tax purposes. As a RIC, we generally are not required to pay corporate-level U.S. federal income taxes on any ordinary income or capital gains that we distribute to our stockholders as distributions. To maintain our RIC status, we must meet specific source-of-income and asset diversification requirements and distribute annually an amount equal to at least 90% of our “investment company taxable income” (which generally consists of ordinary income and realized net short-term capital gains in excess of realized net long-term capital losses, if any, reduced by deductible expenses) and net tax-exempt interest. In order to avoid certain excise taxes imposed on RICs, we generally must distribute during each calendar year an amount at least equal to the sum of (1) 98% of our ordinary income for the calendar year (taking into account certain deferrals and elections), (2) 98.2% of our capital gain net income (i.e., realized capital gains in excess of realized capital losses) for the one-year period ended on October 31 of that calendar year, and (3) 100% of any ordinary income or capital gain net income not distributed in prior years and on which we did not pay corporate-level federal income taxes. We currently intend to make sufficient distributions to satisfy the annual distribution requirement and to avoid the excise taxes.
Although we currently intend to distribute realized net capital gains (i.e., net long-term capital gains in excess of short-term capital losses), if any, at least annually, we may in the future decide to retain such capital gains for investment and designate such retained amount as a deemed distribution.
We determine the tax characteristics of our distributions to stockholders as of the end of the fiscal year, based on the taxable income for the full year and distributions paid during the year. Taxable income available for distribution differs from consolidated net investment income under GAAP due to (i) temporary and permanent differences in income and expense recognition, (ii) capital gains and losses, (iii) activity at taxable subsidiaries, and (iv) the timing and period of recognition regarding distributions declared in December of one year and paid in January of the following year. We (or the applicable withholding agent) report the tax characteristics of distributions paid annually to each stockholder on Form 1099-DIV after the end of the year.
The tax characteristics of deemed distributions in 2016 represented $5.8 million from ordinary income, none from return of capital and none from capital gains. For tax purposes, 10% of the $1.2 million dividend declared in December 2016 and paid on January 9, 2017 was deemed to be distributed in 2016 and 90% was deemed to be distributed in 2017.
We may not achieve operating results that will allow us to make distributions at a specific level or to increase the amount of these distributions from time to time. In addition, we may be limited in our ability to make distributions due to the asset coverage test for borrowings applicable to us as a BDC under the 1940 Act and due to provisions in our Credit Facility. If we do not distribute a certain percentage of our income annually, we will suffer adverse tax consequences, including possible loss
42
of our status as a RIC. We cannot assure stockholders that they will receive any distributions or distributions at any specific level.
We have established an “opt out” DRIP plan for our stockholders. As a result, if we declare a cash dividend, our plan agent automatically reinvests a stockholder’s cash dividend in additional shares of our common stock unless the stockholder, or his or her broker, specifically “opts out” of the dividend reinvestment plan and elects to receive cash dividends.
No action is required on the part of a registered stockholder to have the stockholder’s dividend reinvested in shares of our common stock. The plan administrator will set up an account for shares acquired through the DRIP plan for each stockholder who has not elected to receive dividends in cash, a participant, and hold such shares in non-certificated form. A registered stockholder may terminate participation in the DRIP plan at any time and elect to receive dividends in cash by notifying the plan administrator in writing so that such notice is received by the plan administrator no later than 10 days prior to the record date for dividends to stockholders. Participants may terminate participation in the plan by notifying the plan administrator via its website at www.amstock.com, by filling out the transaction request form located at the bottom of their statement and sending it to the plan administrator at American Stock Transfer & Trust Company, Operations Center, 6201 15th Avenue, Brooklyn, NY 11219 or by calling the plan administrator at 1-800-937-5449.
Within 20 days following receipt of a termination notice by the plan administrator and according to a participant’s instructions, the plan administrator will either: (a) maintain all shares held by such participant in a plan account designated to receive all future dividends and distributions in cash; (b) issue certificates for the whole shares credited to such participant’s plan account and issue a check representing the value of any fractional shares to such participant; or (c) sell the shares held in the plan account and remit the proceeds of the sale, less any brokerage commissions that may be incurred and a $15.00 transaction fee, to such participant at his or her address of record at the time of such liquidation. A stockholder who has elected to receive dividends in cash may re-enroll in the DRIP at any time by providing notice to the plan administrator.
Those stockholders whose shares are held by a broker or other financial intermediary may receive dividends in cash by notifying their broker or other financial intermediary of their election. It is customary practice for many brokers to opt out of dividend reinvestment plans on behalf of their clients unless specifically instructed otherwise.
We intend, when permitted by the DRIP plan, to primarily use newly issued shares for reinvested dividends under the DRIP plan. However, we reserve the right to purchase shares in the open market in connection with the DRIP plan. The number of newly issued shares to be issued to a stockholder is determined by dividing the total dollar amount of the dividend payable to such stockholder by the average market price per share of our common stock at the close of regular trading on the exchange or market on which our shares of common stock are listed for the five trading days preceding the valuation date for such dividend. We can not calculate the number of shares of our common stock to be outstanding after giving effect to payment of the dividend until the value per share at which additional shares will be issued has been determined and elections of our stockholders have been tabulated.
We may not use newly issued shares to satisfy our obligations under the DRIP plan if the market price of our shares is less than our net asset value per share. In such event, the cash dividends are paid to the plan administrator who purchases shares in the open market for credit to the accounts of plan participants unless the average of the closing sales prices for the shares for the five days immediately preceding the payment date exceeds 110% of the most recently reported net asset value per share. The allocation of shares to the participants’ plan accounts is based on the average cost of the shares so purchased, including brokerage commissions. The plan administrator will reinvest all dividends and distributions as soon as practicable, but no later than the next ex-dividend date, except to the extent necessary to comply with applicable provisions of the federal securities laws. The plan will not pay interest on any uninvested cash payment.
As of January 9, 2017, the date of our most recent dividend payment, holders of approximately 57,000 shares, or approximately 0.3% of the 20,172,392 outstanding shares, were participants in the DRIP plan. During 2016, we declared dividends totaling $0.24 per common share. During 2015, we declared dividends totaling $0.48 per common share.
There are no brokerage charges on newly issued shares or other charges to stockholders who participate in the DRIP plan. We pay the plan administrator’s fees.
We may terminate the DRIP plan upon notice in writing mailed to each participant at least 30 days prior to any record date for the payment of any dividend. When a participant withdraws from the DRIP plan or when the DRIP plan is terminated, the participant will receive a cash payment for any fractional shares of our common stock based on the market price on the date of withdrawal or termination. Participants and interested stockholders should direct all correspondence concerning the DRIP plan to the plan administrator by mail at American Stock Transfer & Trust Company, Operations Center, 6201 15th Avenue, Brooklyn, NY 11219.
The automatic reinvestment of dividends and distributions will not relieve a participant of any income tax liability associated with such dividend or distribution. A U.S. stockholder participating in the DRIP plan will be treated for U.S. federal income tax purposes as having received a dividend or distribution in an equal amount to the cash that the participant could have
43
received instead of shares. The tax basis of such shares will equal the amount of such cash. In the case of newly issued shares under the dividend reinvestment plan, the dividend and tax basis will generally be the value of the issued shares. A participant will not realize any taxable income upon receipt of a certificate for whole shares credited to the participant’s account whether upon the participant’s request for a specified number of shares or upon termination of enrollment in the DRIP plan. Each participant will receive each year from us (or the applicable withholding agent) a Form 1099-DIV with respect to the U.S. federal income tax status of all dividends and distributions during the previous year.
A copy of our dividend reinvestment plan is available on our corporate website, www.ohainvestmentcorporation.com, in the investor relations section.
Portfolio Credit Quality
At December 31, 2016, most of our portfolio investments were in negotiated, and often illiquid, securities of middle market businesses, with a concentration in the energy industry. As of December 31, 2016, we had certain investments related to two portfolio companies on non-accrual status with an aggregate cost and fair value of $40.5 million and $0.0 million, respectively. Our investment in Shoreline was placed on non-accural during the first quarter of 2016. Effective July 1, 2015, Bennu was placed on non-accrual status based on estimated future production payments and income is recognized to the extent cash received. Our investments in Contour and Spirit were placed on non-accrual status during the fourth quarter of 2014. Our portfolio investments at fair value were approximately 60.2% and 73.0% of the related cost basis as of December 31, 2016 and December 31, 2015, respectively.
Non-accruing and non-income producing investments | December 31, 2016 | December 31, 2015 | ||||||||||||||
(in thousands) | Cost | Fair Value | Cost | Fair Value | ||||||||||||
Non-accruing investments | ||||||||||||||||
ATP Oil & Gas Corporation/Bennu Oil & Gas, LLC (non-accrual cash basis July 2015) | $ | 27,845 | $ | — | $ | 27,709 | $ | 11,845 | ||||||||
Shoreline Energy, LLC (non-accrual January 2016) | 12,659 | — | 12,640 | 9,040 | ||||||||||||
Contour Highwall Holdings, LLC (non-accrual October 2014) | — | — | 11,578 | 1,000 | ||||||||||||
Spirit Resources, LLC - Tranche A (non-accrual November 2014) | — | — | 4,621 | — | ||||||||||||
Spirit Resources, LLC - Tranche B (non-accrual March 2014) | — | — | 4,409 | — | ||||||||||||
Total non-accruing investments | $ | 40,504 | $ | — | $ | 60,957 | $ | 21,885 | ||||||||
Non-income producing investments | ||||||||||||||||
OHA/OCI Investments, LLC Class A Units | $ | 2,500 | $ | 686 | $ | 2,500 | $ | 2,583 | ||||||||
Spirit Resources, LLC preferred units | — | — | 8,000 | — | ||||||||||||
Total non-income producing investments | 2,500 | 686 | 10,500 | 2,583 | ||||||||||||
Total non-accruing and non-income producing investments | $ | 43,004 | $ | 686 | $ | 71,457 | $ | 24,468 | ||||||||
Critical Accounting Policies
Valuation of Investments
The 1940 Act requires the separate identification of investments according to the percentage ownership in a portfolio company’s outstanding voting securities. The percentages and categories are as follows:
• | Control investments — we own more than 25% of a portfolio company’s outstanding voting securities |
• | Affiliate investments — we own 5% or more but not more than 25% of a portfolio company’s outstanding voting securities |
• | Non-affiliate investments — we own less than 5% of a portfolio company’s outstanding voting securities |
We account for all of the assets in our investment portfolio at fair value, following the provisions of the Financial Accounting Standards Board Accounting Standards Codification Fair Value Measurements and Disclosures, or ASC 820. ASC
44
820 defines fair value, establishes a framework for measuring fair value, establishes a fair value hierarchy based on the quality of inputs used to measure fair value and enhances disclosure requirements for fair value measurements.
On a quarterly basis, the investment team of our investment advisor prepares fair value recommendations for all of the assets in our portfolio in accordance with ASC 820 and presents them to the Audit Committee of our Board of Directors. The Audit Committee recommends fair values of each asset to our Board of Directors, which in good faith determines the final fair value for each investment.
• | Investment Team Valuation. The investment professionals of our investment advisor prepare fair value recommendations for each investment. |
• | Investment Team Valuation Documentation. The investment team documents and discusses its preliminary fair value recommendations with the investment committee and senior management of our investment advisor. |
• | Third Party Valuation Activity. We may, at our discretion, retain an independent valuation firm to review any or all of the valuation analyses and fair value recommendations provided by the investment team of our investment advisor. Since December 31, 2014, our general practice is that we have an independent valuation firm review all Level 3 investments (those whose value is determined using significant unobservable inputs) with recommended fair values in excess of $10 million on a quarterly basis, and review all Level 3 investments with recommended fair values greater than zero at least annually to provide positive assurance on our valuations. With respect to our valuations as of December 31, 2016 and 2015, an independent valuation firm reviewed and assisted in valuations representing 56% and 61%, respectively, of the total fair value of our portfolio investments. |
• | Presentation to Audit Committee. Our investment advisor and senior management present the valuation analyses and fair value recommendations to the Audit Committee of our Board of Directors. |
• | Board of Directors and Audit Committee. The Board of Directors and the Audit Committee review and discuss the valuation analyses and fair value recommendations provided by the investment team of our investment advisor and the independent valuation firm, if applicable. |
• | Final Valuation Determination. Our Board of Directors discusses the fair values recommended by the Audit Committee and determines the fair value of each investment in our portfolio, in good faith, based on the input of the investment team of our investment advisor, our Audit Committee and the independent valuation firm, if applicable. |
We record investments in securities for which market quotations are readily available at such market quotations in our financial statements as of the valuation date. For investments in securities for which market quotations are unavailable, or which have various degrees of trading restrictions, the investment team of our investment advisor prepares valuation analyses and fair value estimates, using the most recently available financial statements, forecasts and, when applicable, comparable transaction data. These valuation analyses rely on estimates of the asset values and enterprise values of portfolio companies issuing securities.
The methodologies for determining asset valuations include estimates based on: the liquidation or sale value of a portfolio company’s assets, the discounted value of expected future net cash flows from the assets and third party valuations of a portfolio company’s assets, such as asset appraisal reports, futures prices and engineering reserve reports of oil and natural gas properties. The investment team of our investment advisor considers some or all of the above valuation methods to determine the estimated asset value of a portfolio company.
The methodologies for determining enterprise valuations include estimates based on: valuations of comparable companies, recent sales of comparable companies, the value of recent investments in the equity securities of a portfolio company and on the methodologies used for asset valuations. The investment team of our investment advisor considers some or all of the above valuation methods to determine the estimated enterprise value of a portfolio company.
The methodologies for determining estimated current market values of comparable securities include estimates based on: recent initial offerings of comparable securities of public and private companies; recent secondary market sales of comparable securities of public and private companies; current market implied interest rates for comparable securities in general; and current market implied interest rates for non-comparable securities in general, with adjustments for such elements as size of issue, terms, and liquidity. The investment team of our investment advisor considers some or all of the above valuation methods to determine the estimated current market value of a comparable security.
For some of our securities, quoted prices in active markets for identical assets (Level 1 valuation inputs) or other significant observable inputs, including quoted prices of similar securities, interest rates, prepayments, credit risk, etc. (Level 2
45
valuation inputs) are readily available from independent sources and are used to value such securities. For other securities, there will be no readily available Level 1 or Level 2 pricing information, and therefore significant unobservable inputs (Level 3 valuation inputs), including the assumptions of OHA, must be relied upon in determining fair value for these securities.
If prices or quotes for securities are either not readily available, or a price or quote is deemed not reflective of the security’s fair market value, we employ a fair valuation technique for that security. In determining the fair value of a security, we may take into consideration (either individually or in combination) the financial condition and operating results of the underlying portfolio company, nature of the investment, restrictions on marketability, liquidity, market conditions, earnings multiple analyses using comparable companies, discounted cash flow analyses, appraisals, and other factors we deem appropriate.
We have a contingent earn-out investment which resulted from the sale of our investment in Alden Resources, LLC to Globe BG, LLC in July 2011. The amount of the payment, up to $6.8 million, is based on a formula involving the number of clean tons of coal produced multiplied by the difference between the company’s cost of production in 2010 and the cost of production during the optimal consecutive twelve-month period during the three-year period ended July 2014. The reporting and review mechanism to determine the ultimate value of the earn-out has not yet been completed. Globe has informally advised us that the company’s relative cost of production has not improved since July 2011, so we have recorded the value of the earn-out at zero.
We record all derivative instruments at fair value. Quoted market prices are the best evidence of fair value. We determine the fair value of the crude oil and natural gas options using a market-based valuation methodology based upon forward commodity price and volatility curves. Independent pricing services provide the curves, which reflect broker market quotes. We consider these investments as Level 2 on the valuation hierarchy, as the values represent quoted prices for similar instruments in active markets. We have not held any commodity derivative instruments since September 30, 2013.
Securities Transactions, Interest and Dividend Income Recognition
We account for all securities transactions on a trade-date basis, and we accrete premiums and discounts into interest or dividend income using the effective interest method. In conjunction with the acquisition of debt securities, we may receive detachable warrants, other equity securities or property interests such as overriding royalty interests. We record these interests separately from the debt securities at their initial fair value, with a corresponding amount recorded as a discount to the associated debt security. These original issue discounts, as well as market discounts or premiums, are capitalized and amortized into interest income over the life of the respective security using the effective interest method. The amortized cost of investments represents the original cost adjusted for the amortization of discounts and premiums and upfront loan origination fees.
We record interest income, adjusted for amortization of premiums or discounts, on an accrual basis to the extent that we expect to collect such amounts. We recognize dividend income on the ex-dividend date. When collectability of interest or dividends is no longer probable, we place the investment on non-accrual status and evaluate any existing interest or dividend receivable balances to determine if a reserve or write-off is necessary. We assess the collectability of the interest and dividends on many factors, including the portfolio company’s ability to service its debt based on current and projected cash flows as well as the current valuation of the portfolio company’s assets.
We defer the recognition of upfront loan origination fees, and amortize them into interest income over the life of the security using the effective interest method. Upon the prepayment of a loan or debt security, we record any unamortized loan origination fees as interest income and we record any unamortized market premium or discount as a realized gain or loss on the investment. We record prepayment premiums on loans and securities as other income when we receive such amounts.
We record interest income from investments in CLO residual interests based upon an estimate of an effective yield to expected maturity using anticipated cash flows with any remaining amount recorded to the cost basis of the investment. We monitor the anticipated cash flows from our CLO residual interest investments and adjust our effective yield periodically as needed on a prospective basis.
We recognize income from overriding royalty interests as received, and we amortize the cost of the recorded assets using the units of production method.
Payment-in-Kind Interest and Dividends
We have investments in our portfolio that contain payment-in-kind, or PIK, interest or dividend provisions. We compute PIK interest income or PIK dividend income at the contractual rate specified in each investment agreement, and we add that amount to the principal balance of the investment. For investments with PIK interest or PIK dividends, we calculate our income accruals on the principal balance plus any PIK amounts. If the portfolio company’s projected cash flows, further supported by estimated total enterprise value, are not sufficient to cover the contractual principal and interest or dividend amounts, as applicable, we do not accrue PIK interest income or PIK dividend income on the investment. To maintain our RIC status, we must pay out this non-cash income to stockholders in the form of distributions, even though we have not yet collected the cash.
46
We recorded net PIK interest income of $1.0 million, $1.4 million, and $1.2 million in 2016, 2015 and 2014, respectively. We recorded PIK dividend income of $4.4 million, and $1.3 million in 2016 and 2015, respectively from our investment in Castex Energy 2005, LP, and did not record any PIK dividend income and 2014.
Net Realized Gains or Losses and Net Change in Unrealized Appreciation or Depreciation
We measure realized gains on a security as the excess of the net amount realized from the sale or other disposition of such security over the amortized cost for the security. We measure realized losses on a security as the amount by which the net amount realized from the sale or other disposition of such security is less than the amortized cost of such security. We consider unamortized upfront fees and investments charged off during the year, net of recoveries, and we do not include previously recognized unrealized appreciation or depreciation.
We measure unrealized appreciation or depreciation on a security as the amount by which the fair value of such security exceeds or is less than the amortized cost of such security, as applicable. Net unrealized appreciation or depreciation for the period reflects the change in portfolio investment values during the reporting period, including the reversal of previously recorded unrealized appreciation or depreciation when we realize the settled gains or losses upon redemption.
We do not account for our commodity derivative instruments, if any, as hedging instruments for financial accounting purposes. Net unrealized appreciation or depreciation reflects the change in fair values during the reporting period including the reversal of previously recorded unrealized appreciation or depreciation when we realize the settled gains or losses.
Contractual Obligations and Off-Balance Sheet Arrangements
The following table summarizes our contractual payment obligations at December 31, 2016 (in thousands):
Credit facilities(1) | Total | Less than 1 Year | 1-3 Years | 3-5 Years | More than 5 Years | |||||||||||||||
Credit Facility | $ | 40,500 | $ | — | $ | 40,500 | $ | — | $ | — | ||||||||||
Repurchase Agreement (2) | 39,200 | 39,200 | — | — | — | |||||||||||||||
Total | $ | 79,700 | $ | 39,200 | $ | 40,500 | $ | — | $ | — | ||||||||||
(1) Excludes accrued interest amounts.
(2) Amount borrowed under the Repurchase Agreement was repaid on January 5, 2017.
From time to time we could have unused commitments to extend credit to our portfolio companies. Generally, these commitments have fixed expiration dates, and we do not expect to fund the entire amounts before they expire. Therefore, these commitment amounts do not necessarily represent future cash requirements, and we do not report the unused portions of these commitments on our Consolidated Balance Sheets. We have $16.0 million unused credit commitments as of December 31, 2016. We did not have any unused credit commitments as of December 31, 2015.
Item 7A. Quantitative and Qualitative Disclosures About Market Risk
Our business activities contain elements of risk. We consider the principal market risks to be: credit risk, risks related to the energy industry, illiquidity of individual investments in our investment portfolio, leverage risk, risks related to fluctuations in interest rates and commodity price risk.
Credit risk is the principal market risk associated with our business. Credit risk originates from the fact that some of our portfolio companies may become unable or unwilling to fulfill their contractual payment obligations to us and may eventually default on those obligations. These contractual payment obligations arise under the debt securities and other investments that we hold. They include payment of interest, principal, dividends, royalties, fees and payments under guarantees and similar instruments. Our investment advisor endeavors to mitigate and manage credit risk through the analysis, structure and requirements of our investments. Prior to making an investment, our investment advisor evaluates it under a variety of scenarios to understand its sensitivity to changes in critical variables and assumptions and to assess its potential credit risk. Our investment advisor attempts to structure our investments to mitigate credit risk, and generally requires routine reporting, periodic appraisal of asset values, and financial covenants designed to minimize and detect developing credit issues.
Historically, we have concentrated our investments in the securities of companies that operate in the energy industry. This industry is replete with risks that may affect individual companies or may systemically affect virtually our entire energy-related investment portfolio. The revenues, income or losses, cash flow available for debt service or distribution, and valuations of energy companies can be significantly impacted by any one or more of the following factors: commodity pricing risk, regulatory risk, production risk, demand risk, depletion and exploration risk, weather risk, operational risk, competition risk, valuation risk, financing risk and climate change. Elaboration of these risks is provided in “Item 1A. Risk Factors — The energy industry is subject to many risks.” Through our credit risk management process, we endeavor to mitigate and manage these risks as they relate to individual portfolio companies and, by extension, to our entire portfolio of investments. However,
47
we cannot be assured that our investment advisor’s efforts to mitigate and manage credit risk and the risks associated with the energy industry will successfully insulate us from any and all losses, either at the level of individual portfolio companies or, more broadly, for our entire energy-related investment portfolio.
We primarily invest in illiquid debt and other securities of small and mid-sized private companies. In some cases these investments include additional equity components. Our investments generally have no established trading market or are generally subject to restrictions on resale. The illiquidity of our investments may adversely affect our ability to dispose of debt and equity securities at times when it may be otherwise advantageous for us to liquidate such investments (for example, for management of the various diversification requirements we are subject to as a BDC and as a RIC, or for management of liquidity or credit risk). The proceeds realized from such liquidation would likely be significantly less than the long-term value of the liquidated investments.
We use a combination of long-term and short-term borrowings to supplement our equity capital to finance our investing activities. These borrowings rank senior in our capital structure to interests of our stockholders and, thus, have a senior claim on earnings and cash flows generated by our investment portfolio. To the extent that we are able to invest borrowed money at rates in excess of the cost of borrowing, we will generate greater returns on our equity capital than would have been the case without leverage. However, if we have losses in our investment portfolio, we must first service or repay the borrowings. This would potentially subject our stockholders to the risk of greater loss than would have been the case without leverage. Elaboration of the risks associated with the issue of senior securities is provided in “Item 1A. Risk Factors.”
Another facet of utilizing borrowed money to make investments is that our net investment income is dependent upon the difference, or spread, between the rate at which we borrow funds and the interest rate or effective yield at which we invest those funds. Our Credit Facility bears a variable interest rate with a 1% one-month LIBOR interest rate floor, so any increase in interest rates above 1% will increase the cost of our borrowed funds. As of December 31, 2016 and 2015, excluding investments in U.S. Treasury Bills, approximately 50% and 49%, respectively, of our portfolio investments at fair value in our portfolio were at fixed rates, while approximately 50% and 51%, respectively, were at variable rates, generally with an interest rate floor. Thus, interest income from our portfolio investments will increase at a slower rate than the cost of our borrowed funds with an increase in interest rates until the interest rate floor are met, if at all. We may use interest rate risk management techniques in an effort to limit our exposure to interest rate fluctuations. Such techniques may include various interest rate hedging activities to the extent permitted by the 1940 Act.
Assuming that our consolidated balance sheet as of December 31, 2016 were to remain constant and that no actions were taken to alter our current interest rate sensitivity, the following table shows the annualized impact of hypothetical base rate changes in interest rates.
Change in interest rates | Increase/(decrease) in interest income | Increase/(decrease) in interest expense | Net increase/(decrease) in net investment income | |||||||||
Down 25 basis points | $ | — | $ | — | $ | — | ||||||
Up 50 basis points | 145 | 110 | 35 | |||||||||
Up 100 basis points | 412 | 313 | 99 | |||||||||
Up 150 basis points | 679 | 515 | 164 | |||||||||
Up 200 basis points | 945 | 718 | 227 | |||||||||
Although we believe that this analysis is indicative of our existing sensitivity to interest rate changes, it does not adjust for changes in credit markets, the composition of our investment portfolio or other business developments (including borrowings under the Credit Facility), that affect net interest income.
48
Item 8. Financial Statements and Supplementary Data.
INDEX TO FINANCIAL STATEMENTS
49
Report of Independent Registered Public Accounting Firm
The Board of Directors and Shareholders of OHA Investment Corporation
We have audited the accompanying consolidated balance sheets of OHA Investment Corporation, including the consolidated schedules of investments, as of December 31, 2016 and 2015, the related consolidated statements of operations, changes in net assets and cash flows for each of the three years in the period ended December 31, 2016, and the financial highlights for each of the five years in the period ended December 31, 2016. Our audits also included the financial statement schedule listed in the Index at Item 15(a), Schedule 12 - 14 Schedule of Investments In and Advances to Affiliates. These financial statements, financial highlights, and schedules are the responsibility of the Company’s management. Our responsibility is to express an opinion on these financial statements, financial highlights, and schedules based on our audits.
We conducted our audits in accordance with the standards of the Public Company Accounting Oversight Board (United States). Those standards require that we plan and perform the audit to obtain reasonable assurance about whether the financial statements and financial highlights are free of material misstatement. An audit includes examining, on a test basis, evidence supporting the amounts and disclosures in the financial statements and financial highlights. An audit also includes assessing the accounting principles used and significant estimates made by management, as well as evaluating the overall financial statement presentation. Our procedures included confirmation of securities owned as of December 31, 2016 and 2015 by correspondence with the custodian and brokers or by other appropriate auditing procedures where replies from brokers were not received. We believe that our audits provide a reasonable basis for our opinion.
In our opinion, the financial statements and financial highlights referred to above present fairly, in all material respects, the consolidated financial position of OHA Investment Corporation at December 31, 2016 and 2015, and the consolidated results of its operations, changes in net assets, cash flows for each of the three years in the period ended and the financial highlights for each of the five years in the period ended December 31, 2016, in conformity with U.S. generally accepted accounting principles. Also, in our opinion, the related financial statement schedules, when considered in relation to the basic financial statements taken as a whole, present fairly in all material respects the information set forth therein.
We have also audited, in accordance with the standards of the Public Company Accounting Oversight Board (United States), OHA Investment Corporation’s internal control over financial reporting as of December 31, 2016, based on criteria established in Internal Control-Integrated (2013 Framework) issued by the Committee of Sponsoring Organizations of the Treadway Commission and our report dated March 14, 2017 expressed an unqualified opinion thereon.
/s/ Ernst & Young LLP
Dallas, Texas
March 14, 2017
50
Report of Independent Registered Public Accounting Firm
The Board of Directors and Shareholders of OHA Investment Corporation
We have audited OHA Investment Corporation’s internal control over financial reporting as of December 31, 2016, based on criteria established in Internal Control-Integrated Framework issued by the Committee of Sponsoring Organizations of the Treadway Commission 2013 framework (the COSO criteria). OHA Investment Corporation’s management is responsible for maintaining effective internal control over financial reporting, and for its assessment of the effectiveness of internal control over financial reporting included in the accompanying Management’s Annual Report on Internal Control over Financial Reporting. Our responsibility is to express an opinion on the company’s internal control over financial reporting based on our audit.
We conducted our audit in accordance with the standards of the Public Company Accounting Oversight Board (United States). Those standards require that we plan and perform the audit to obtain reasonable assurance about whether effective internal control over financial reporting was maintained in all material respects. Our audit included obtaining an understanding of internal control over financial reporting, assessing the risk that a material weakness exists, testing and evaluating the design and operating effectiveness of internal control based on the assessed risk, and performing such other procedures as we considered necessary in the circumstances. We believe that our audit provides a reasonable basis for our opinion.
A company’s internal control over financial reporting is a process designed to provide reasonable assurance regarding the reliability of financial reporting and the preparation of financial statements for external purposes in accordance with generally accepted accounting principles. A company’s internal control over financial reporting includes those policies and procedures that (1) pertain to the maintenance of records that, in reasonable detail, accurately and fairly reflect the transactions and dispositions of the assets of the company; (2) provide reasonable assurance that transactions are recorded as necessary to permit preparation of financial statements in accordance with generally accepted accounting principles, and that receipts and expenditures of the company are being made only in accordance with authorizations of management and directors of the company; and (3) provide reasonable assurance regarding prevention or timely detection of unauthorized acquisition, use, or disposition of the company’s assets that could have a material effect on the financial statements.
Because of its inherent limitations, internal control over financial reporting may not prevent or detect misstatements. Also, projections of any evaluation of effectiveness to future periods are subject to the risk that controls may become inadequate because of changes in conditions, or that the degree of compliance with the policies or procedures may deteriorate.
In our opinion, OHA Investment Corporation maintained, in all material respects, effective internal control over financial reporting as of December 31, 2016, based on the COSO criteria.
We also have audited, in accordance with the standards of the Public Company Accounting Oversight Board (United States), the consolidated balance sheets of OHA Investment Corporation, including the consolidated schedules of investments, as of December 31, 2016 and 2015, the related consolidated statements of operations, changes in net assets and cash flows for each of the three years in the period ended December 31, 2016, and the financial highlights for each of the five years in the period ended December 31, 2016, and our report dated March 14, 2017 expressed an unqualified opinion thereon.
/s/ Ernst & Young LLP
Dallas, Texas
March 14, 2017
51
OHA INVESTMENT CORPORATION
CONSOLIDATED BALANCE SHEETS
(in thousands, except share and per share amounts)
December 31, 2016 | December 31, 2015 | |||||||
Assets | ||||||||
Investments in portfolio securities at fair value | ||||||||
Control investments (cost: $0 and $28,608, respectively) | $ | — | $ | 1,000 | ||||
Affiliate investments (cost: $19,724 and $18,647, respectively) | 17,150 | 18,893 | ||||||
Non-affiliate investments (cost: $154,772 and $192,012, respectively) | 87,855 | 154,817 | ||||||
Total portfolio investments (cost: $174,496 and $239,267, respectively) | 105,005 | 174,710 | ||||||
Investments in U.S. Treasury Bills at fair value (cost: $39,997 and $34,997, respectively) | 39,997 | 34,997 | ||||||
Total investments | 145,002 | 209,707 | ||||||
Cash and cash equivalents | 16,533 | 15,554 | ||||||
Accounts receivable and other current assets | 33 | 517 | ||||||
Interest receivable | 1,313 | 2,248 | ||||||
Other prepaid assets | 17 | 451 | ||||||
Total current assets | 17,896 | 18,770 | ||||||
Total assets | $ | 162,898 | $ | 228,477 | ||||
Liabilities | ||||||||
Current liabilities | ||||||||
Due to broker | $ | — | $ | 5,226 | ||||
Distributions payable | 1,210 | 2,421 | ||||||
Accounts payable and accrued expenses | 1,999 | 1,741 | ||||||
Due to affiliate (Note 5) | 220 | 221 | ||||||
Management and incentive fees payable (Note 5) | 635 | 1,713 | ||||||
Income taxes payable | 28 | 75 | ||||||
Repurchase agreement | 39,200 | 34,300 | ||||||
Short-term debt | — | 72,000 | ||||||
Total current liabilities | 43,292 | 117,697 | ||||||
Long-term debt, net of debt issuance costs of $1,387 and $0, respectively | 39,113 | — | ||||||
Total liabilities | 82,405 | 117,697 | ||||||
Commitments and contingencies (Note 7) | ||||||||
Net assets | ||||||||
Common stock, $.001 par value, 250,000,000 shares authorized; 20,172,392 and 20,172,392 shares issued and outstanding, respectively | 20 | 20 | ||||||
Paid-in capital in excess of par | 235,703 | 241,985 | ||||||
Undistributed net investment loss | (2,873 | ) | (5,947 | ) | ||||
Undistributed net realized capital loss | (85,979 | ) | (63,838 | ) | ||||
Net unrealized depreciation on investments | (66,378 | ) | (61,440 | ) | ||||
Total net assets | 80,493 | 110,780 | ||||||
Total liabilities and net assets | $ | 162,898 | $ | 228,477 | ||||
Net asset value per share | $ | 3.99 | $ | 5.49 | ||||
(See accompanying notes to consolidated financial statements)
52
OHA INVESTMENT CORPORATION
CONSOLIDATED STATEMENTS OF OPERATIONS
(in thousands, except per share data)
(See accompanying notes to consolidated financial statements)
For the year ended December 31, | ||||||||||||
2016 | 2015 | 2014 | ||||||||||
Investment income: | ||||||||||||
Interest income: | ||||||||||||
Control investments | $ | — | $ | — | $ | 1,404 | ||||||
Affiliate investments | 2,923 | 2,597 | 2,311 | |||||||||
Non-affiliate investments | 10,459 | 14,127 | 13,737 | |||||||||
Dividend income: | ||||||||||||
Non-affiliate investments | 4,008 | 4,279 | 4,002 | |||||||||
Royalty income, net of amortization: | ||||||||||||
Control investments | — | 30 | 90 | |||||||||
Non-affiliate investments | — | — | 65 | |||||||||
Other income | 498 | 1,016 | 510 | |||||||||
Total investment income | 17,888 | 22,049 | 22,119 | |||||||||
Operating expenses: | ||||||||||||
Interest expense and bank fees | 3,819 | 3,480 | 2,119 | |||||||||
Management and incentive fees (Note 5) | 3,220 | 4,003 | 4,602 | |||||||||
Costs related to strategic alternatives review | — | — | 6,040 | |||||||||
Professional fees, net of legal fees of $0, $454 and $1,591, respectively, related to ATP bankruptcy (Note 7) | 2,442 | 2,126 | 1,437 | |||||||||
Other general and administrative expenses | 1,652 | 2,154 | 4,369 | |||||||||
Directors fees | 245 | 245 | 245 | |||||||||
Total operating expenses | 11,378 | 12,008 | 18,812 | |||||||||
Income tax provision, net | 7 | 72 | 109 | |||||||||
Net investment income | 6,503 | 9,969 | 3,198 | |||||||||
Realized and unrealized gain (loss) on investments: | ||||||||||||
Net realized capital gain (loss) on investments | ||||||||||||
Control investments | (27,172 | ) | 232 | (325 | ) | |||||||
Affiliate investments | — | — | 95 | |||||||||
Non-affiliate investments | 223 | (450 | ) | (12,198 | ) | |||||||
Provision for taxes on realized loss | (62 | ) | — | (2 | ) | |||||||
Total net realized capital loss on investments | (27,011 | ) | (218 | ) | (12,430 | ) | ||||||
Net unrealized appreciation (depreciation) on investments | ||||||||||||
Control investments | 27,608 | (5,222 | ) | (19,144 | ) | |||||||
Affiliate investments | (2,820 | ) | 802 | (90 | ) | |||||||
Non-affiliate investments | (29,726 | ) | (36,553 | ) | 6,235 | |||||||
Total net unrealized depreciation on investments | (4,938 | ) | (40,973 | ) | (12,999 | ) | ||||||
Net decrease in net assets resulting from operations | $ | (25,446 | ) | $ | (31,222 | ) | $ | (22,231 | ) | |||
Net decrease in net assets resulting from operations per common share | $ | (1.26 | ) | $ | (1.54 | ) | $ | (1.08 | ) | |||
Distributions declared per common share | $ | 0.24 | $ | 0.48 | $ | 0.64 | ||||||
Weighted average shares outstanding - basic and diluted | 20,172 | 20,322 | 20,529 | |||||||||
53
OHA INVESTMENT CORPORATION
CONSOLIDATED STATEMENTS OF CHANGES IN NET ASSETS
(in thousands, except per share data)
For the year ended December 31, | ||||||||||||
2016 | 2015 | 2014 | ||||||||||
Increase (decrease) in net assets from operations | ||||||||||||
Net investment income | $ | 6,503 | $ | 9,969 | $ | 3,198 | ||||||
Net realized capital loss on investments | (27,011 | ) | (218 | ) | (12,430 | ) | ||||||
Net unrealized depreciation on investments | (4,938 | ) | (40,973 | ) | (12,999 | ) | ||||||
Net decrease in net assets resulting from operations | (25,446 | ) | (31,222 | ) | (22,231 | ) | ||||||
Distributions to common stockholders | ||||||||||||
Distributions from net investment income | (4,841 | ) | (9,736 | ) | (9,692 | ) | ||||||
Return of capital | — | — | (3,465 | ) | ||||||||
Net decrease in net assets from distributions | (4,841 | ) | (9,736 | ) | (13,157 | ) | ||||||
Capital transactions | ||||||||||||
Acquisition of common stock under repurchase plan | — | (2,426 | ) | — | ||||||||
Issuance of common stock to affiliate | — | — | 1,000 | |||||||||
Net increase (decrease) in net assets from capital transactions | — | (2,426 | ) | 1,000 | ||||||||
Net decrease in net assets | (30,287 | ) | (43,384 | ) | (34,388 | ) | ||||||
Net assets, beginning of period | 110,780 | 154,164 | 188,552 | |||||||||
Net assets, end of period | $ | 80,493 | $ | 110,780 | $ | 154,164 | ||||||
Net asset value per common share at end of period | $ | 3.99 | $ | 5.49 | $ | 7.48 | ||||||
Common shares outstanding at end of period | 20,172 | 20,172 | 20,616 | |||||||||
(See accompanying notes to consolidated financial statements)
54
OHA INVESTMENT CORPORATION
CONSOLIDATED STATEMENTS OF CASH FLOWS
(in thousands)
For the year ended December 31, | ||||||||||||
2016 | 2015 | 2014 | ||||||||||
Cash flows from operating activities: | ||||||||||||
Net decrease in net assets resulting from operations | $ | (25,446 | ) | $ | (31,222 | ) | $ | (22,231 | ) | |||
Adjustments to reconcile net decrease in net assets resulting from operations to net cash provided by (used in) operating activities: | ||||||||||||
Payment-in-kind interest and dividend | (5,432 | ) | (2,669 | ) | (1,158 | ) | ||||||
Net amortization of premiums, discounts and fees | (472 | ) | (636 | ) | (1,203 | ) | ||||||
Net realized capital loss on investments | 26,949 | 218 | 12,428 | |||||||||
Net unrealized depreciation on investments | 4,938 | 40,973 | 12,999 | |||||||||
Purchase of investments in portfolio securities | (7,091 | ) | (74,423 | ) | (39,681 | ) | ||||||
Proceeds from redemption of investments in portfolio securities | 50,813 | 37,990 | 51,823 | |||||||||
Purchase of investments in U.S. Treasury Bills | (130,000 | ) | (142,801 | ) | (171,571 | ) | ||||||
Proceeds from redemption of investments in U.S. Treasury Bills | 125,000 | 138,404 | 186,971 | |||||||||
Amortization of debt issuance costs on Credit Facility | 362 | — | — | |||||||||
Effects of changes in operating assets and liabilities: | ||||||||||||
Accounts receivable and other current assets | 484 | (201 | ) | 148 | ||||||||
Interest receivable | 935 | (158 | ) | 307 | ||||||||
Other prepaid assets | 434 | 1,100 | 1,542 | |||||||||
Payables and accrued expenses | (867 | ) | 1,046 | (308 | ) | |||||||
Due to broker | (5,226 | ) | 5,226 | — | ||||||||
Due to affiliate | (1 | ) | (8 | ) | 229 | |||||||
Net cash provided by (used in) operating activities | 35,380 | (27,161 | ) | 30,295 | ||||||||
Cash flows from financing activities: | ||||||||||||
Borrowings under revolving credit facilities | 49,000 | 160,500 | 340,000 | |||||||||
Borrowings under repurchase agreement | 127,400 | 84,300 | — | |||||||||
Debt issuance costs paid | (1,749 | ) | — | — | ||||||||
Repayments on revolving credit facilities | (80,500 | ) | (170,500 | ) | (356,000 | ) | ||||||
Repayments on repurchase agreement | (122,500 | ) | (50,000 | ) | — | |||||||
Acquisition of common stock under repurchase plan | — | (2,426 | ) | — | ||||||||
Proceeds from issuance of common stock to affiliate | — | — | 1,000 | |||||||||
Distributions to stockholders | (6,052 | ) | (10,614 | ) | (13,138 | ) | ||||||
Net cash provided by (used in) financing activities | (34,401 | ) | 11,260 | (28,138 | ) | |||||||
Net increase (decrease) in cash and cash equivalents | 979 | (15,901 | ) | 2,157 | ||||||||
Cash and cash equivalents, beginning of period | 15,554 | 31,455 | 29,298 | |||||||||
Cash and cash equivalents, end of period | $ | 16,533 | $ | 15,554 | $ | 31,455 | ||||||
Supplemental Disclosures: | ||||||||||||
Cash paid for interest | $ | 2,854 | $ | 2,123 | $ | 607 | ||||||
Cash paid for taxes, net of refunds | $ | 150 | $ | 110 | $ | 98 | ||||||
(See accompanying notes to consolidated financial statements)
55
OHA INVESTMENT CORPORATION
NOTES TO CONSOLIDATED FINANCIAL STATEMENTS - (Continued)
December 31, 2016
OHA INVESTMENT CORPORATION
CONSOLIDATED SCHEDULE OF INVESTMENTS
December 31, 2016
(in thousands, except share amounts and percentages)
Portfolio Company | Industry Segment | Investment(1) | Principal | Cost | Fair Value(2) | |||||||||||
Affiliate Investments - (5% to 25% owned) | ||||||||||||||||
OCI Holdings, LLC | Home Health Services | Subordinated Note (LIBOR+ 12.0% cash with a 1% floor plus 3% PIK, due 8/15/2018)(7) | $ | 17,330 | $ | 17,224 | $ | 16,464 | ||||||||
OCI Holdings, LLC | Home Health Services | 100% of OHA/OCI Investments, LLC Class A Units representing 20.8% diluted ownership of OCI Holdings, LLC(15) | 2,500 | 686 | ||||||||||||
Subtotal Affiliate Investments - (5% to 25% owned) | $ | 19,724 | $ | 17,150 | ||||||||||||
Non-affiliate Investments - (Less than 5% owned) | ||||||||||||||||
Castex Energy 2005, LP | Oil & Natural Gas Production and Development | Redeemable Preferred LP Units (current pay 8.0% cash or 10.0% PIK)(8) | $ | 56,625 | $ | 55,662 | $ | 32,876 | ||||||||
TIBCO Software, Inc. | Software | Senior Unsecured Notes (11.38% due 12/1/2021)(3) | 10,100 | 9,754 | 10,100 | |||||||||||
Royal Holdings, Inc. | Chemicals | Second Lien Term Loan (LIBOR+7.5% with a 1.0% floor, due 6/19/2023)(3) | 10,000 | 9,929 | 9,938 | |||||||||||
Appriss Holdings, Inc. | Information Services | Second Lien Term Loan (LIBOR+9.25% with a 1.0% floor, due 5/21/2021)(14) | 9,323 | 9,217 | 9,137 | |||||||||||
Berlin Packaging, LLC | Packaging | Second Lien Term Loan (LIBOR+6.75% with a 1% floor, due 10/1/2022)(3) | 7,205 | 6,886 | 7,295 | |||||||||||
Talos Production. LLC | Oil & Natural Gas Production and Development | Senior Unsecured Notes (9.75%, due 2/15/2018)(3) | 12,000 | 11,980 | 7,140 | |||||||||||
PAE Holding Corporation | Aerospace and Defense | Second Lien Term Loan (LIBOR+9.50% with a 1% floor, due 10/20/2023)(3) | 5,500 | 5,337 | 5,596 | |||||||||||
WASH Multifamily Acquisition, Inc. | Industrials - Laundry Equipment | Second Lien Term Loan (LIBOR+7.0% with a 1.0% floor, due 5/14/2023)(3) | 3,404 | 3,382 | 3,404 | |||||||||||
Gramercy Park CLO Ltd.(5) | Financial Services | Subordinated Notes, Residual Interest (11.95%, based on cost, due 7/17/2023) | 9,000 | 1,529 | 1,773 | |||||||||||
Coinamatic Canada, Inc.(5) | Industrials - Laundry Equipment | Second Lien Term Loan (LIBOR+7.0% with a 1.0% floor, due 5/14/2023)(3) | 596 | 592 | 596 | |||||||||||
56
OHA INVESTMENT CORPORATION
NOTES TO CONSOLIDATED FINANCIAL STATEMENTS - (Continued)
December 31, 2016
OHA INVESTMENT CORPORATION
CONSOLIDATED SCHEDULE OF INVESTMENTS - Continued
December 31, 2016
(in thousands, except share amounts and percentages)
Portfolio Company | Industry Segment | Investment(1) | Principal | Cost | Fair Value(2) | |||||||||||
Non-affiliate Investments - (Less than 5% owned) - Continued | ||||||||||||||||
ATP Oil & Gas Corporation/Bennu Oil & Gas, LLC | Oil & Natural Gas Production and Development | Limited Term Royalty Interest (notional rate of 13.2%)(9)(10) | $ | 27,845 | $ | — | ||||||||||
Shoreline Energy, LLC | Oil & Natural Gas Production and Development | Second Lien Term Loan (greater of LIBOR+9.25% with a 1.25% floor plus 1.75% PIK, or prime+8.25%, due 3/30/2019)(6)(11)(12) | 13,182 | 12,659 | — | |||||||||||
Globe BG, LLC | Coal Production | Contingent earn-out related to July 2011 sale of royalty interests in Alden Resources, LLC(13) | — | — | ||||||||||||
Subtotal Non-affiliate Investments - (Less than 5% owned) | $ | 154,772 | $ | 87,855 | ||||||||||||
Subtotal Portfolio Investments (81.4% of total investments) | $ | 174,496 | $ | 105,005 | ||||||||||||
GOVERNMENT SECURITIES | ||||||||||||||||
U.S. Treasury Bills(4) | $ | 40,000 | $ | 39,997 | $ | 39,997 | ||||||||||
Subtotal Government Securities (18.6% of total investments) | $ | 39,997 | $ | 39,997 | ||||||||||||
TOTAL INVESTMENTS | $ | 214,493 | $ | 145,002 | ||||||||||||
NOTES TO CONSOLIDATED SCHEDULE OF INVESTMENTS
(1) | We pledged all of our portfolio investments, except our investments in U.S. Treasury Bills, as collateral for obligations under our Credit Facility. See Note 3 of Notes to Consolidated Financial Statements. Percentages represent interest rates in effect as of December 31, 2016, and due dates represent the contractual maturity dates. Common stock, units and earn-outs are non-income producing securities, unless otherwise stated. |
(2) | The Audit Committee recommends fair values of each asset to our Board of Directors, which in good faith determines the final fair value for each investment. Fair value is determined using unobservable inputs (Level 3 hierarchy), unless otherwise stated. See Note 10 of Notes to Consolidated Financial Statements. |
(3) | Fair value is determined using prices with observable market inputs (Level 2 hierarchy). See Note 10 of Notes to Consolidated Financial Statements. |
(4) | Fair value is determined using prices for identical securities in active markets (Level 1 hierarchy). See Note 10 of Notes to Consolidated Financial Statements. |
(5) | We have determined that this investment is not a “qualifying asset” under Section 55(a) of the Investment Company Act of 1940, or the 1940 Act. Under the 1940 Act, we may not acquire any non-qualifying asset unless, at the time such acquisition is made, qualifying assets represent at least 70% of our total assets. The status of these assets under the 1940 Act is subject to change. We monitor the status of these assets on an ongoing basis. |
(6) | Investment on non-accrual status. |
(7) | During the fourth quarter of 2016, we executed a series of amendments to our note purchase and security agreement with OCI Holdings, LLC, or OCI, to allow the company to PIK its LIBOR+12% cash interest for November and December 2016. Also, default interest of $0.1 million and current unpaid interest of $0.4 million was added to the principal balance in the fourth quarter 2016. Effective January 31, 2017, we executed a seventh amendment to our note purchase and security agreement with OCI to allow the company to PIK its LIBOR+12% cash interest through March 31, 2017. OCI remains in financial covenant default and while in default, we are earning an additional 2% cash interest and 2% PIK interest. |
57
OHA INVESTMENT CORPORATION
NOTES TO CONSOLIDATED FINANCIAL STATEMENTS - (Continued)
December 31, 2016
OHA INVESTMENT CORPORATION
CONSOLIDATED SCHEDULE OF INVESTMENTS - Continued
December 31, 2016
NOTES TO CONSOLIDATED SCHEDULE OF INVESTMENTS - Continued
(8) | By the terms of our original investment, upon redemption, we were due the outstanding face amount of $50 million, any unpaid and accrued dividends, plus an option to elect to receive either: a) a cash payment resulting in a total 12% return or make-whole (inclusive of the 8% cash distributions even if not paid), or b) our pro rata share of 2% of the outstanding regular limited partner interests in Castex Energy 2005, LP, or Castex, (0.67% net to us). Castex elected to pay us in PIK for more than two consecutive quarters, causing the return on the initial make-whole calculation to first increase from 12% to 13.5%. Preferred unit holders had a put right starting on July 1, 2016, which we exercised on that date with respect to all of our preferred units. Castex had 90 days from the receipt of the put notice to redeem. Castex did not redeem the preferred units within 90 days of the receipt of the put notice. As a result, the make-whole of 13.5% further increased by 4.5%, to 18%, we are entitled to board observation rights as a preferred unit holder, and other covenants apply. If the preferred units are not redeemed within one year from the originally scheduled put closing date (which would be September 29, 2017), Castex and the limited partners must use commonly reasonable efforts to enter into, within 90 days, a 12% dollar denominated production payment transaction with the preferred unit holders exercising the put right, with a 3 year term for such production payment. If such production payment transaction is not consummated within 90 days, Castex must use all available resources to repay preferred units and the preferred return steps up to 25% from that point forward. Amounts shown for principal and cost include PIK dividends that have been added to the principal balance. |
(9) | Effective July 1, 2015, ATP was placed on non-accrual status based on estimated future production payments and income is recognized to the extent cash received. |
(10) | For more information on ATP, refer to the discussion of the ATP litigation in Note 7 to the Consolidated Financial Statements. |
(11) | Effective June 24, 2015, we executed a third amendment to our credit agreement with Shoreline Energy, LLC, or Shoreline, to amend certain covenant limits in exchange for increases in Shoreline's interest to the greater of LIBOR+9.25% with a 1.25% floor or prime+8.25% with a 1.25% floor, effective after March 31, 2015. The third amendment also included the addition of 0.50% payment-in-kind, or PIK, interest effective after June 30, 2015. Effective September 23, 2015, we executed a fourth amendment to our credit agreement with Shoreline to increase PIK interest to 1.75%. |
(12) | On November 2, 2016, Shoreline and seven affiliated debtors (collectively, the "Debtors") each filed a voluntary petition for relief under Chapter 11 of the United States Bankruptcy Code in the United States Bankruptcy Court for the Southern District of Texas. The Debtors have requested that their cases be jointly administered under Case No. 16-35571. |
(13) | Contingent payment of up to $6.8 million is dependent upon Alden Resources, LLC’s achievement of certain sales volume and operating efficiency levels during the three-year period ended July 2014. The reporting and review mechanism to conclude the ultimate value of the earn-out has not yet been completed. Globe BG, LLC has informally advised us that the company’s relative cost of production has not improved since July 2011. |
(14) | On August 10, 2016, the margin was amended to be increased from LIBOR+8.25% with a 1% floor to LIBOR+9.25% with a 1% floor. |
(15) | Non-income producing equity security. |
(See accompanying notes to consolidated financial statements)
58
OHA INVESTMENT CORPORATION
NOTES TO CONSOLIDATED FINANCIAL STATEMENTS - (Continued)
December 31, 2016
OHA INVESTMENT CORPORATION
CONSOLIDATED SCHEDULE OF INVESTMENTS
December 31, 2015
(in thousands, except share amounts and percentages)
Portfolio Company | Industry Segment | Investment(1) | Principal | Cost | Fair Value(2) | |||||||||||
Control Investments - (More than 25% owned) | ||||||||||||||||
Contour Highwall Holdings, LLC | Coal Mining | Senior Secured Term Loan (12%, due 10/14/2015)(6) | $ | 10,757 | $ | 10,778 | $ | 1,000 | ||||||||
Contour Highwall Holdings, LLC | Coal Mining | Unsecured Promissory Note (6%, due 4/11/2016)(6) | 800 | 800 | — | |||||||||||
Contour Highwall Holdings, LLC | Coal Mining | 800 Membership Units representing 80% of the common equity(7)(15) | — | — | ||||||||||||
Spirit Resources, LLC | Oil & Natural Gas Production and Development | Tranche A - Senior Secured Term Loan (greater of 8% or LIBOR+4.0%, due 4/28/2015)(6) | 4,657 | 4,621 | — | |||||||||||
Spirit Resources, LLC | Oil & Natural Gas Production and Development | Tranche B - Senior Secured Term Loan (greater of 15% PIK or LIBOR+11.0%, due 10/28/2015)(6) | 4,409 | 4,409 | — | |||||||||||
Spirit Resources, LLC | Oil & Natural Gas Production and Development | 80,000 Preferred Units representing 100% of the outstanding equity(15) | 8,000 | — | ||||||||||||
Subtotal Control Investments - (More than 25% owned) | $ | 28,608 | $ | 1,000 | ||||||||||||
Affiliate Investments - (5% to 25% owned) | ||||||||||||||||
OCI Holdings, LLC | Home Health Services | Subordinated Note (LIBOR+ 12.0% cash with a 1% floor plus 3% PIK, due 8/15/2018)(8)(9) | $ | 16,310 | $ | 16,147 | $ | 16,310 | ||||||||
OCI Holdings, LLC | Home Health Services | 100% of OHA/OCI Investments, LLC Class A Units representing 20.8% diluted ownership of OCI Holdings, LLC(15) | 2,500 | 2,583 | ||||||||||||
Subtotal Affiliate Investments - (5% to 25% owned) | $ | 18,647 | $ | 18,893 | ||||||||||||
Non-affiliate Investments - (Less than 5% owned) | ||||||||||||||||
Castex Energy 2005, LP | Oil & Natural Gas Production and Development | Redeemable Preferred LP Units (current pay 8% cash, due 7/1/2016)(10) | $ | 51,265 | $ | 51,273 | $ | 43,939 | ||||||||
Appriss Holdings, Inc. | Information Services | Second Lien Term Loan (LIBOR+8.25% with a 1% floor, due 5/21/2021) | 13,100 | 12,925 | 12,314 | |||||||||||
Kronos Incorporated | Software | Second Lien Term Loan (LIBOR+8.50% with a 1.25% floor, due 4/30/2020)(3) | 12,000 | 12,145 | 11,985 | |||||||||||
ATP Oil & Gas Corporation/Bennu Oil & Gas, LLC | Oil & Natural Gas Production and Development | Limited Term Royalty Interest (notional rate of 13.2%)(11)(12) | 27,709 | 11,845 | ||||||||||||
59
OHA INVESTMENT CORPORATION
NOTES TO CONSOLIDATED FINANCIAL STATEMENTS - (Continued)
December 31, 2016
OHA INVESTMENT CORPORATION
CONSOLIDATED SCHEDULE OF INVESTMENTS - Continued
December 31, 2015
(in thousands, except share amounts and percentages)
Portfolio Company | Industry Segment | Investment(1) | Principal | Cost | Fair Value(2) | |||||||||||
Non-affiliate Investments - (Less than 5% owned) - Continued | ||||||||||||||||
WP Mustang (Electronic Funds Services, LLC) | Financial Services | Second Lien Term Loan (LIBOR+7.5% with a 1% floor, due 5/29/2022)(3) | $ | 10,000 | $ | 9,843 | $ | 10,038 | ||||||||
Royal Holdings, Inc. | Chemicals | Second Lien Term Loan (LIBOR+7.5% with a 1% floor, due June 19, 2023)(3) | 10,000 | 9,926 | 9,850 | |||||||||||
Shoreline Energy, LLC | Oil & Natural Gas Production and Development | Second Lien Term Loan (greater of LIBOR+9.25% with a 1.25% floor plus 2.0% PIK, or prime+8.25%, due 3/30/2019)(13) | 12,918 | 12,640 | 9,040 | |||||||||||
TIBCO Software, Inc. | Software | Senior Unsecured Notes (11.38% due 12/1/2021)(3) | 10,100 | 9,707 | 8,446 | |||||||||||
KOVA International, Inc. | Medical Supplies Manufacturing and Distribution | Senior Subordinated Notes (12.75%, due 8/15/2018) | 9,000 | 8,898 | 7,920 | |||||||||||
Stardust Financial Holdings (Hanson) | Building Materials | Second Lien Term Loan (LIBOR+9.5% with a 1% floor, due 3/13/2023)(3) | 7,500 | 7,114 | 7,238 | |||||||||||
Gramercy Park CLO Ltd.(5) | Financial Services | Subordinated Notes, Residual Interest (11.95%, based on cost, due 7/17/2023)(3) | 9,000 | 6,327 | 5,659 | |||||||||||
Berlin Packaging, LLC | Packaging | Second Lien Term Loan (LIBOR+6.75% with a 1% floor, due 10/1/2022)(3) | 5,500 | 5,226 | 5,253 | |||||||||||
Talos Production, LLC | Oil & Natural Gas Production and Development | Senior Unsecured Notes (9.75%, due 2/15/2018)(3) | 12,000 | 11,965 | 5,160 | |||||||||||
WASH Multifamily Acquisition, Inc. | Industrials - Laundry Equipment | Second Lien Term Loan (LIBOR+7.0% with a 1% floor, due May 14, 2023)(3) | 3,404 | 3,380 | 3,225 | |||||||||||
Synarc-BioCore Holdings, LLC | Healthcare | First Lien Senior Secured Notes (7.75% due 3/10/2021) | 2,400 | 2,342 | 2,340 | |||||||||||
Coinamatic Canada, Inc.(5) | Industrials - Laundry Equipment | Second Lien Term Loan (LIBOR+7.0% with a 1% floor, due May 14, 2023)(3) | 596 | 592 | 565 | |||||||||||
Globe BG, LLC | Coal Production | Contingent earn-out related to July 2011 sale of royalty interests in Alden Resources, LLC(14) | — | — | ||||||||||||
Subtotal Non-affiliate Investments - (Less than 5% owned) | $ | 192,012 | $ | 154,817 | ||||||||||||
Subtotal Portfolio Investments (83.3% of total investments) | $ | 239,267 | $ | 174,710 | ||||||||||||
GOVERNMENT SECURITIES | ||||||||||||||||
U.S. Treasury Bills(4) | $ | 35,000 | $ | 34,997 | $ | 34,997 | ||||||||||
Subtotal Government Securities (16.7% of total investments) | $ | 34,997 | $ | 34,997 | ||||||||||||
TOTAL INVESTMENTS | $ | 274,264 | $ | 209,707 | ||||||||||||
60
OHA INVESTMENT CORPORATION
NOTES TO CONSOLIDATED FINANCIAL STATEMENTS - (Continued)
December 31, 2016
OHA INVESTMENT CORPORATION
CONSOLIDATED SCHEDULE OF INVESTMENTS - Continued
December 31, 2015
NOTES TO CONSOLIDATED SCHEDULE OF INVESTMENTS
(1) | We pledged all of our portfolio investments, except our investments in U.S. Treasury Bills, as collateral for obligations under our Investment Facility. See Note 3 of Notes to Consolidated Financial Statements. Percentages represent interest rates in effect as of December 31, 2015, and due dates represent the contractual maturity dates. Warrants, common stock, units and earn-outs are non-income producing securities, unless otherwise stated. |
(2) | The Audit Committee recommends fair values of each asset to our Board of Directors, which in good faith determines the final fair value for each investment. Fair value is determined using unobservable inputs (Level 3 hierarchy), unless otherwise stated. See Note 10 of Notes to Consolidated Financial Statements. |
(3) | Fair value is determined using prices with observable market inputs (Level 2 hierarchy). See Note 10 of Notes to Consolidated Financial Statements. |
(4) | Fair value is determined using prices for identical securities in active markets (Level 1 hierarchy). See Note 10 of Notes to Consolidated Financial Statements. |
(5) | We have determined that this investment is not a “qualifying asset” under Section 55(a) of the Investment Company Act of 1940, or 1940 Act. Under the 1940 Act, we may not acquire any non-qualifying asset unless, at the time such acquisition is made, qualifying assets represent at least 70% of our total assets. The status of these assets under the 1940 Act is subject to change. We monitor the status of these assets on an ongoing basis. |
(6) | Investment on non-accrual status. |
(7) | The fair value of our Contour Highwall Holdings, LLC, or Contour, membership units also includes any value attributable to our ownership of 8,000 shares of common stock of Bundy Auger Mining, Inc., an affiliate of Contour. |
(8) | Effective July 9, 2014, we executed a third amendment to our note purchase and security agreement with OCI Holdings, LLC, or OCI, to amend certain covenant limits in exchange for increases in OCI’s interest to LIBOR+11% cash with a 1% floor, plus 3% payment-in-kind, or PIK. |
(9) | Effective December 31, 2015, we executed a fourth amendment to our note purchase and security agreement with OCI Holdings, LLC, or OCI, to waive several defaults and amend covenant limits in exchange for increases in OCI's interest to LIBOR+12% cash with a 1% floor, plus 3% PIK. Also, default interest of $0.1 million was added to the principal balance. |
(10) | By the terms of our original investment, upon redemption, we were due the outstanding face amount of $50 million, any unpaid and accrued dividends, plus an option to elect to receive either: a) a cash payment resulting in a total 12% return or make-whole (inclusive of the 8% cash distributions even if not paid), or b) our pro rata share of 2% of the outstanding regular limited partner interests in Castex Energy 2005, LP, or Castex, (0.67% net to us). Castex elected to pay us in PIK for more than two consecutive quarters, causing the return on the initial make-whole calculation to first increase from 12% to 13.5%. Preferred unit holders had a put right starting on July 1, 2016, which we exercised on that date with respect to all of our preferred units. Castex had 90 days from the receipt of the put notice to redeem. Castex did not redeem the preferred units within 90 days of the receipt of the put notice. As a result, the make-whole of 13.5% further increased by 4.5%, to 18%, we are entitled to board observation rights as a preferred unit holder, and other covenants apply. If the preferred units are not redeemed within one year from the originally scheduled put closing date (which would be September 29, 2017), Castex and the limited partners must use commonly reasonable efforts to enter into, within 90 days, a 12% dollar denominated production payment transaction with the preferred unit holders exercising the put right, with a 3 year term for such production payment. If such production payment transaction is not consummated within 90 days, Castex must use all available resources to repay preferred units and the preferred return steps up to 25% from that point forward. Amounts shown for principal and cost include PIK dividends that have been added to the principal balance. |
(11) | Effective July 1, 2015, ATP was placed on non-accrual status based on estimated future production payments and income is recognized to the extent cash received. |
(12) | For more information on ATP, refer to the discussion of the ATP litigation in Note 7 to the Consolidated Financial Statements. |
61
OHA INVESTMENT CORPORATION
NOTES TO CONSOLIDATED FINANCIAL STATEMENTS - (Continued)
December 31, 2016
OHA INVESTMENT CORPORATION
CONSOLIDATED SCHEDULE OF INVESTMENTS - Continued
December 31, 2015
NOTES TO CONSOLIDATED SCHEDULE OF INVESTMENTS - Continued
(13) | Effective June 24, 2015, we executed a third amendment to our credit agreement with Shoreline Energy, LLC, or Shoreline, to amend certain covenant limits in exchange for increases in Shoreline's interest to the greater of LIBOR+9.25% with a 1.25% floor or prime+8.25% with a 1.25% floor, effective after March 31, 2015. The third amendment also included the addition of 0.50% payment-in-kind, or PIK, interest effective after June 30, 2015. Effective September 23, 2015, we executed a fourth amendment to our credit agreement with Shoreline to increase PIK interest to 1.75%. |
(14) | Contingent payment of up to $6.8 million is dependent upon Alden Resources, LLC’s achievement of certain sales volume and operating efficiency levels during the three-year period ended July 2014. The reporting and review mechanism to conclude the ultimate value of the earn-out has not yet been completed. Globe BG, LLC has informally advised us that the company’s relative cost of production has not improved since July 2011. |
(15) | Non-income producing equity security. |
(See accompanying notes to consolidated financial statements)
62
OHA INVESTMENT CORPORATION
NOTES TO CONSOLIDATED FINANCIAL STATEMENTS
December 31, 2016
Note 1: Organization
These consolidated financial statements present the financial position, results of operations and cash flows of OHA Investment Corporation and its consolidated subsidiaries (collectively “we,” “us,” “our” and “OHAI”). We are a specialty finance company that was organized in July 2004 as a Maryland corporation. Our investment objective is to generate both current income and capital appreciation primarily through debt investments, some of which include equity components. We are an externally managed, closed-end, non-diversified management investment company that has elected to be regulated as a business development company, or a BDC, under the Investment Company Act of 1940, or the 1940 Act. For federal income tax purposes we operate so as to be treated as a regulated investment company, or RIC, under Subchapter M of the Internal Revenue Code of 1986, as amended, or the Code. We have several direct and indirect subsidiaries that are single-member limited liability companies and wholly-owned limited partnerships established to hold certain portfolio investments or provide services to us in accordance with specific rules prescribed for a company operating as a RIC. We consolidate the financial results of our wholly-owned subsidiaries for financial reporting purposes, and we do not consolidate the financial results of our portfolio companies.
On September 30, 2014, our stockholders approved the appointment of Oak Hill Advisors, L.P., or OHA, as our investment advisor, replacing NGP Investment Advisor, LP, which had been our investment advisor since our inception. In connection with this change in investment advisor, we changed our name from NGP Capital Resources Company to OHA Investment Corporation. OHA is a registered investment adviser under the 1940 Act. OHA acts as our investment advisor and administrator pursuant to an investment advisory agreement and an administration agreement, respectively, each dated as of September 30, 2014, which we refer to as the Investment Advisory Agreement and the Administration Agreement, respectively. See Note 5.
In connection with the transactions surrounding the appointment of OHA as our investment advisor, and the related process of evaluating strategic alternatives, we incurred costs totaling $6.0 million, or $0.29 per share, during 2014, including $3.4 million of retention payments to employees of our former administrator pursuant to retention agreements entered into in September 2013 allocated to us under the terms of the administration agreement with NGP Administration, LLC, $1.1 million for a “tail” insurance policy covering our former directors and officers, and $1.5 million of legal and investment banking advisory fees. We also incurred an additional $0.6 million, or $0.03 per share, of legal and consulting costs related to the strategic alternatives review during the fourth quarter of 2013. Thus, the total cost incurred related to the strategic review process was $6.7 million, or $0.32 per share.
Note 2: Accounting Policies
Basis of Presentation
These consolidated financial statements include the accounts of OHAI and its wholly-owned subsidiaries. The effects of all intercompany transactions between OHAI and its subsidiaries have been eliminated in consolidation. We prepare our consolidated financial statements in accordance with accounting principles generally accepted in United States of America ("GAAP") and pursuant to the rules and regulations of the Securities and Exchange Commission ("SEC"). The Company is an investment company following the accounting and reporting guidance in Financial Accounting Standards Board ("FASB") Accounting Standards Codification ("ASC") Topic 946, Financial Services - Investment Companies ("ASC 946"). Under the investment company rules and regulations pursuant to Article 6 of Regulation S-X and ASC 946, the Company is precluded from consolidating portfolio company investments, including those in which it has a controlling interest, unless the portfolio company is another investment company. An exception to this general principle occurs if the Company holds a controlling interest in an operating company that provides all or substantially all of its services directly to the Company or to its portfolio companies. None of the portfolio investments made by the Company qualify for this exception. Therefore, the Company's investment portfolio is carried on the Consolidated Balance Sheet at fair value.
Use of Estimates
Preparing consolidated financial statements in accordance with GAAP requires us to make estimates and assumptions that affect the amounts reported in the consolidated financial statements and the accompanying notes to the consolidated financial statements. Although we believe our estimates and assumptions are reasonable, actual results could differ materially from these estimates.
Reclassifications
Certain prior-period amounts have been reclassified to conform to the current-period presentation.
63
OHA INVESTMENT CORPORATION
NOTES TO CONSOLIDATED FINANCIAL STATEMENTS - (Continued)
December 31, 2016
Cash and Cash Equivalents
Cash and cash equivalents include short-term, liquid investments with an original maturity of three months or less in accounts such as demand deposit accounts, money market accounts, certain overnight investment sweep accounts and money market fund accounts. We record cash and cash equivalents at cost, which approximates fair value.
Deferred Loan Costs and Other Prepaid Assets
Deferred loan costs include up-front bank fees and related legal fees associated with the establishment of our credit facilities (see Note 3). Deferred loan costs are amortized to interest expense on a straight-line basis over the term of the related credit facility. Prepaid assets consist of premiums paid for directors’ and officers’ liability insurance with policy terms of one year and broker fees and commissions associated with the establishment of such policies. We amortize such premiums and fees on a straight-line basis over the term of the policy.
Concentration of Credit Risk
We place our cash and cash equivalents with financial institutions and, at times, cash held in checking or money market accounts may exceed the Federal Deposit Insurance Corporation insured limit.
The significant portion of our investments and interest receivable are with companies involved in the energy industry or in energy-related businesses.
Valuation of Investments
The 1940 Act requires the separate identification of investments according to the percentage ownership in a portfolio company’s outstanding voting securities. The percentages and categories are as follows:
• | Control investments — we own more than 25% of a portfolio company’s outstanding voting securities |
• | Affiliate investments — we own 5% or more but not more than 25% of a portfolio company’s outstanding voting securities |
• | Non-affiliate investments — we own less than 5% of a portfolio company’s outstanding voting securities |
We account for all of the assets in our investment portfolio at fair value, following the provisions of the FASB ASC 820, Fair Value Measurements and Disclosures. ASC 820 defines fair value, establishes a framework for measuring fair value, establishes a fair value hierarchy based on the quality of inputs used to measure fair value and enhances disclosure requirements for fair value measurements.
On a quarterly basis, the investment team of our investment advisor prepares fair value recommendations for all of the assets in our portfolio in accordance with ASC 820 and presents them to the Audit Committee of our Board of Directors. The Audit Committee recommends a fair value of each portfolio investment to our Board of Directors, which in good faith determines the final fair value for each portfolio investment.
• | Investment Team Valuation. The investment professionals of our investment advisor prepare fair value recommendations for each investment. |
• | Investment Team Valuation Documentation. The investment team documents and discusses its preliminary fair value recommendations with the investment committee and senior management of our investment advisor. |
• | Third Party Valuation Activity. We may, at our discretion, retain an independent valuation firm to review any or all of the valuation analyses and fair value recommendations provided by the investment team of our investment advisor. Since December 31, 2014, our general practice is that we have an independent valuation firm review all Level 3 investments (those whose value is determined using significant unobservable inputs) with recommended fair values in excess of $10 million on a quarterly basis, and review all Level 3 investments with recommended fair values greater than zero at least annually to provide positive assurance on our valuations. With respect to our valuations as of December 31, 2016 and 2015, an independent valuation firm reviewed and assisted in valuations representing 56% and 61%, respectively, of the total fair value of our portfolio investments. |
• | Presentation to Audit Committee. Our investment advisor and senior management present the valuation analyses and fair value recommendations to the Audit Committee of our Board of Directors. |
64
OHA INVESTMENT CORPORATION
NOTES TO CONSOLIDATED FINANCIAL STATEMENTS - (Continued)
December 31, 2016
• | Board of Directors and Audit Committee. The Board of Directors and the Audit Committee review and discuss the valuation analyses and fair value recommendations provided by the investment team of our investment advisor and the independent valuation firm, if applicable. |
• | Final Valuation Determination. Our Board of Directors discusses the fair values recommended by the Audit Committee and determines the fair value of each investment in our portfolio, in good faith, based on the input of the investment team of our investment advisor, our Audit Committee and the independent valuation firm, if applicable. |
We record investments in securities for which market quotations are readily available at such market quotations in our financial statements as of the valuation date. For investments in securities for which market quotations are unavailable, or which have various degrees of trading restrictions, the investment team of our investment advisor prepares valuation analyses and fair value estimates, using the most recently available financial statements, forecasts and, when applicable, comparable transaction data. These valuation analyses rely on estimates of the asset values and enterprise values of portfolio companies issuing securities.
The methodologies for determining asset valuations include estimates based on: the liquidation or sale value of a portfolio company’s assets, the discounted value of expected future net cash flows from the assets and third party valuations of a portfolio company’s assets, such as asset appraisal reports, futures prices and engineering reserve reports of oil and natural gas properties. The investment team of our investment advisor considers some or all of the above valuation methods to determine the estimated asset value of a portfolio company.
The methodologies for determining enterprise valuations include estimates based on: valuations of comparable companies, recent sales of comparable companies, the value of recent investments in the equity securities of a portfolio company and on the methodologies used for asset valuations. The investment team of our investment advisor considers some or all of the above valuation methods to determine the estimated enterprise value of a portfolio company.
The methodologies for determining estimated current market values of comparable securities include estimates based on: recent initial offerings of comparable securities of public and private companies; recent secondary market sales of comparable securities of public and private companies; current market implied interest rates for comparable securities in general; and current market implied interest rates for non-comparable securities in general, with adjustments for such elements as size of issue, terms, and liquidity. The investment team of our investment advisor considers some or all of the above valuation methods to determine the estimated current market value of a comparable security.
For some of our securities, quoted prices (unadjusted) in active markets for identical assets (Level 1 valuation inputs) or other significant observable inputs, including quoted prices of similar securities, interest rates, prepayments, credit risk, etc. (Level 2 valuation inputs) are readily available from independent sources and are used to value such securities. For other securities, there will be no readily available Level 1 or Level 2 pricing information, and therefore significant unobservable inputs (Level 3 valuation inputs), including the assumptions of OHA, must be relied upon in determining fair value for these securities.
If prices or quotes for securities are either not readily available, or a price or quote is deemed not reflective of the security’s fair market value, we employ a fair valuation technique for that security. In determining the fair value of a security, we may take into consideration (either individually or in combination) the financial condition and operating results of the underlying portfolio company, nature of the investment, restrictions on marketability, liquidity, market conditions, earnings multiple analyses using comparable companies, discounted cash flow analyses, appraisals, and other factors we deem appropriate.
We have a contingent earn-out investment which resulted from the sale of our investment in Alden Resources, LLC to Globe BG, LLC in July 2011. The amount of the payment, up to $6.8 million, is based on a formula involving the number of clean tons of coal produced multiplied by the difference between the company’s cost of production in 2010 and the cost of production during the optimal consecutive twelve-month period during the three-year period ended July 2014. The reporting and review mechanism to determine the ultimate value of the earn-out has not yet been completed. Globe has informally advised us that the company’s relative cost of production has not improved since July 2011, so we have recorded the value of the earn-out at zero.
Securities Transactions, Interest and Dividend Income Recognition
We account for all securities transactions on a trade-date basis, and we accrete premiums and discounts into interest or dividend income using the effective interest method. In conjunction with the acquisition of debt securities, we may receive detachable warrants, other equity securities or property interests such as overriding royalty interests. We record these interests separately from the debt securities at their initial fair value, with a corresponding amount recorded as a discount to the
65
OHA INVESTMENT CORPORATION
NOTES TO CONSOLIDATED FINANCIAL STATEMENTS - (Continued)
December 31, 2016
associated debt security. These original issue discounts, as well as market discounts or premiums, are capitalized and amortized into interest income over the life of the respective security using the effective interest method. The amortized cost of investments represents the original cost adjusted for the amortization of discounts and premiums and upfront loan origination fees.
We record interest income, adjusted for amortization of premiums or discounts, on an accrual basis to the extent that we expect to collect such amounts. We recognize dividend income on the ex-dividend date. When collectability of interest or dividends is no longer probable, we place the investment on non-accrual status and evaluate any existing interest or dividend receivable balances to determine if a reserve or write-off is necessary. We assess the collectability of the interest and dividends on many factors, including the portfolio company’s ability to service its debt based on current and projected cash flows as well as the current valuation of the portfolio company’s assets.
We defer the recognition of upfront loan origination fees, and amortize them into interest income over the life of the security using the effective interest method. Upon the prepayment of a loan or debt security, we record any unamortized loan origination fees as interest income and we record any unamortized market premium or discount as a realized gain or loss on the investment. We record prepayment premiums on loans and securities as other income when we receive such amounts.
We record interest income from investments in CLO residual interests based upon an estimate of an effective yield to expected maturity using anticipated cash flows with any remaining amount recorded to the cost basis of the investment. We monitor the anticipated cash flows from our CLO residual interest investments and adjust our effective yield periodically as needed on a prospective basis.
We recognize income from overriding royalty interests as received, and we amortize the cost of the recorded assets using the units of production method.
Payment-in-Kind Interest and Dividends
We have investments in our portfolio that contain payment-in-kind, or PIK, interest or dividend provisions. We compute PIK interest income or PIK dividend income at the contractual rate specified in each investment agreement, and we add that amount to the principal balance of the investment. For investments with PIK interest or PIK dividends, we calculate our income accruals on the principal balance plus any PIK amounts. If the portfolio company’s projected cash flows, further supported by estimated total enterprise value, are not sufficient to cover the contractual principal and interest or dividend amounts, as applicable, we do not accrue PIK interest income or PIK dividend income on the investment. To maintain our RIC status, we must pay out this non-cash income to stockholders in the form of distributions, even though we have not yet collected the cash. We recorded net PIK interest income of $1.0 million, $1.4 million and $1.2 million in 2016, 2015 and 2014, respectively. We recorded PIK dividend income of $4.4 million and $1.3 million in 2016 and 2015, respectively from our investment in Castex Energy 2005, LP, and did not record any PIK dividend income in 2014.
Net Realized Gains or Losses and Net Change in Unrealized Appreciation or Depreciation
We measure realized gains on a security as the excess of the net amount realized from the sale or other disposition of such security over the amortized cost for the security. We measure realized losses on a security as the amount by which the net amount realized from the sale or other disposition of such security is less than the amortized cost of such security. We consider unamortized upfront fees and investments charged off during the year, net of recoveries, and we do not include previously recognized unrealized appreciation or depreciation.
We measure unrealized appreciation or depreciation on a security as the amount by which the fair value of such security exceeds or is less than the amortized cost of such security, as applicable. Net unrealized appreciation or depreciation for the period reflects the change in portfolio investment values during the reporting period, including the reversal of previously recorded unrealized appreciation or depreciation when we realize the settled gains or losses upon redemption.
Fee Income Recognition
Fees primarily include financial advisory, transaction structuring, loan administration, commitment, amendment and prepayment fees. Financial advisory fees represent amounts received for providing advice and analysis to companies, and we recognize these fees as earned when we perform such services, provided collection is probable. Transaction structuring fees represent amounts received for structuring, financing and executing transactions and are generally payable only if the transaction closes. We defer such fees and accrete them into interest income over the life of the loan using the effective interest method. Commitment fees represent amounts received for committed funding and are generally payable whether the transaction closes or not. We defer commitment fees on transactions that close within the commitment period and accrete these fees into
66
OHA INVESTMENT CORPORATION
NOTES TO CONSOLIDATED FINANCIAL STATEMENTS - (Continued)
December 31, 2016
interest income over the life of the loan using the effective interest method. We record commitment fees on transactions that do not close in the month the commitment period expires. We recognize prepayment and loan administration fees when we receive them. During the years ended December 31, 2016, 2015, and 2014 we recorded the following amounts of fee income (in thousands):
2016 | 2015 | 2014 | |||||||||
Prepayment, amendment and loan administration fees | $ | 498 | $ | 1,016 | $ | 510 | |||||
Commitment fees and discounts accreted and premiums amortized into interest income | 472 | 634 | 1,218 | ||||||||
Total fee income | $ | 970 | $ | 1,650 | $ | 1,728 | |||||
Distributions
We record distributions to stockholders on the ex-dividend date. We currently intend that our distributions each year will be sufficient to maintain our status as a RIC for federal income tax purposes and to eliminate federal excise tax liability. We currently intend to make distributions to stockholders on a quarterly basis so that substantially all of our net taxable income is distributed on an annual basis. We also intend to make distributions of net realized capital gains, if any, at least annually. However, we may in the future decide to retain such capital gains for investment and designate such retained amounts as deemed distributions. Each quarter, we estimate our annual taxable earnings. The Board of Directors considers this estimate and determines the distribution amount, if any. We generally declare our distributions each quarter and pay them shortly thereafter. The following table summarizes our recent distribution history:
Declaration Date | Per Share Amount | Record Date | Payment Date | |||||
March 3, 2015 | $ | 0.12 | March 31, 2015 | April 8, 2015 | ||||
June 10, 2015 | 0.12 | June 30, 2015 | July 9, 2015 | |||||
September 17, 2015 | 0.12 | September 30, 2015 | October 7, 2015 | |||||
December 11, 2015 | 0.12 | December 31, 2015 | January 8, 2016 | |||||
March 15, 2016 | 0.06 | March 31, 2016 | April 8, 2016 | |||||
June 7, 2016 | 0.06 | June 30, 2016 | July 8, 2016 | |||||
September 15, 2016 | 0.06 | September 30, 2016 | October 7, 2016 | |||||
December 8, 2016 | 0.06 | December 31, 2016 | January 9, 2017 | |||||
We determine the tax characteristics of our dividend distributions as of the end of the fiscal year, based on the taxable income for the full year and distributions paid during the year. Taxable income available for distribution differs from consolidated net investment income under GAAP due to (i) temporary and permanent differences in income and expense recognition, (ii) capital gains and losses, (iii) activity at taxable subsidiaries, and (iv) the timing and period of recognition regarding dividends declared in December of one year and paid in January of the following year. The tax characteristics of distributions paid in 2016 represented $5.8 million from ordinary income, none from return of capital and none from capital gains. For tax purposes, 10% of the $1.2 million dividend paid on January 9, 2017 was applied to 2016 taxable income and 90% will be applied to 2017 taxable income. For tax purposes, 15% of the $2.4 million dividend declared in December 2015 and paid on January 8, 2016 was deemed to be distributed in 2015 and 85% was deemed to be distributed in 2016.
We have established an “opt out” dividend reinvestment plan for our common stockholders. As a result, if we declare a cash dividend, our plan agent automatically reinvests a stockholder’s cash dividend in additional shares of our common stock unless the stockholder, or his or her broker, specifically “opts out” of the dividend reinvestment plan and elects to receive cash dividends. It is customary practice for many brokers to “opt out” of dividend reinvestment plans on behalf of their clients unless specifically instructed otherwise.
The purpose of the plan is to provide stockholders with a method of investing cash dividends and distributions in additional shares at the current market price without charges for record-keeping, custodial and reporting services. Any stockholder of
67
OHA INVESTMENT CORPORATION
NOTES TO CONSOLIDATED FINANCIAL STATEMENTS - (Continued)
December 31, 2016
record may elect to partially participate in the plan, or begin or resume participation at any time, by providing the plan agent with written notice.
The plan agent of our dividend reinvestment plan purchases shares in the open market for credit to the accounts of plan participants unless the average of the closing sales prices for the shares for the five days immediately preceding the payment date exceeds 110% of the most recently reported net asset value per share.
The table below summarizes recent participation in our dividend reinvestment plan (in thousands, except percentages, shares and price per share):
Dividend | Participating Shares | Percentage of Outstanding Shares | Total Distribution | Cash Dividends | Common Stock Dividends | |||||||||||||||||
Purchased in Open Market | Price per Share | |||||||||||||||||||||
March 2015 | 71,000 | 0.3 | % | $ | 2,465 | $ | 2,457 | $ | 8 | $ | 5.39 | |||||||||||
June 2015 | 59,000 | 0.3 | 2,609 | 2,602 | 7 | 5.73 | ||||||||||||||||
September 2015 | 61,000 | 0.3 | 2,609 | 2,602 | 7 | 4.74 | ||||||||||||||||
December 2015 | 68,000 | 0.3 | 2,609 | 2,601 | 8 | 4.21 | ||||||||||||||||
March 2016 | 104,000 | 0.5 | 1,305 | 1,299 | 6 | 3.15 | ||||||||||||||||
June 2016 | 103,000 | 0.5 | 1,305 | 1,299 | 6 | 2.34 | ||||||||||||||||
September 2016 | 116,000 | 0.6 | 1,305 | 1,298 | 7 | 3.30 | ||||||||||||||||
December 2016 | 57,000 | 0.3 | 1,305 | 1,302 | 3 | 1.78 | ||||||||||||||||
Income Taxes
For federal income tax purposes, we operate so as to qualify as a RIC under Subchapter M of Chapter 1 of the Code. As a RIC, we are generally not subject to corporate-level U.S. federal income taxes on the portion of our investment company taxable income and net capital gain (i.e., realized net long-term capital gains in excess of realized net short-term capital losses) that we distribute to our stockholders. We have distributed and intend to distribute sufficient dividends to eliminate taxable income. We may also be subject to federal excise tax if we do not distribute an amount at least equal to the sum of (1) 98% of our ordinary income for the calendar year (taking into account certain deferrals and elections), (2) 98.2% of our capital gain net income, computed for the one year period ended October 31 of that calendar year, and (3) 100% of any ordinary income or capital gain net income not distributed or taxed in prior years. Dividends to stockholders are recorded on the ex-dividend date. We currently intend to make sufficient distributions each year to maintain our status as a RIC for federal income tax purposes and to avoid excise taxes.
Certain of our wholly owned subsidiaries, or Taxable Subsidiaries, have elected to be taxed as corporations for federal income tax purposes. The Taxable Subsidiaries hold certain of our portfolio investments and are consolidated for financial reporting purposes, but not for income tax reporting purposes. These Taxable Subsidiaries permit us to hold equity investments in portfolio companies that are “pass through” entities for tax purposes, in order to comply with the “source-of-income” requirements that must be satisfied to maintain our qualification as a RIC. The Taxable Subsidiaries may generate net income tax expense or benefit, which is reflected on our Consolidated Statements of Operations.
We record any tax interest and penalties in other general and administrative expenses on our Consolidated Statement of Operations. Tax interest and penalties were immaterial for all periods presented.
Recent Accounting Pronouncements
In April 2015, the FASB issued ASU 2015-03 Interest - Imputation of Interest (“ASU 2015-03”). This guidance requires that debt issuance costs related to a recognized debt liability be presented in the balance sheet as a direct deduction from the carrying amount of that debt liability (i.e., versus being capitalized as an asset and amortized as required under previous guidance), consistent with the presentation of debt discounts. The recognition and measurement guidance for debt issuance costs are not affected by this guidance (i.e., debt issuance costs will continue to be amortized as an increase to interest expense). In addition, in August 2015, the FASB issued ASU 2015-15, Interest-Imputation of Interest (Subtopic 835-30) (“ASU 2015-15”). This guidance reiterates that the SEC would not object to an entity deferring and presenting debt issuance costs
68
OHA INVESTMENT CORPORATION
NOTES TO CONSOLIDATED FINANCIAL STATEMENTS - (Continued)
December 31, 2016
related to a line of credit arrangement as an asset and subsequently amortizing the deferred debt issuance costs ratably over the term of the line of credit arrangement, regardless of whether there are any outstanding borrowings. ASU 2015-03 and ASU 2015-15 are effective for interim and annual reporting periods in fiscal years beginning after December 15, 2015. As of January 1, 2016, the Company adopted ASU 2015-03 and ASU 2015-15 to simplify the presentation of debt issuance costs for all outstanding debt, except that incurred under our Investment Facility (as defined in Note 3), which the Company continued to present as an asset on our Consolidated Balance Sheets as of December 31, 2015. The debt issuance cost of $1.4 million related to our Credit Facility is now presented as a reduction from the carrying value of the Credit Facility as of December 31, 2016. The adoption of ASU 2015-03 and 2015-15 had no material impact on the Company’s net asset value, results of operations or cash flows.
Note 3: Credit Facilities and Borrowings
We are party to a Credit Agreement (the "Credit Facility"), dated September 9, 2016, with MidCap Financial Trust, as administrative agent, which replaced our prior Third Amended and Restated Revolving Credit Agreement (the "Investment Facility"), as amended, with SunTrust Bank, as administrative agent. As of December 31, 2016, the size of Credit Facility was $56.5 million with a maturity date of March 9, 2018, which can be extended for a six-month period at our option, subject to certain conditions. The initial proceeds of $40.5 million from the Credit Facility were used to pay off the $38.5 million outstanding balance on the Investment Facility, pay transaction expenses and provide balance sheet cash. The remaining $16.0 million consists of a delayed draw term loan, which is committed for one year, and is available to us to grow our investment portfolio and operate our business.
As of December 31, 2016, the total amount outstanding under the Credit Facility was $40.5 million with $16.0 million available to draw. The total amount outstanding on the Credit Facility is shown net of unamortized debt issuance costs of $1.4 million on our Consolidated Balance Sheet as of December 31, 2016. Substantially all of our assets, except our investments in U.S. Treasury Bills, are pledged as collateral for the obligations under the Credit Facility. The Credit Facility bears an interest rate of Adjusted LIBOR plus 5.35% for Eurodollar Loans, subject to a 1% LIBOR floor, and Base Rate plus 4.35% for Base Rate Loans. As of December 31, 2016 the interest rate on our outstanding balance of $40.5 million was 6.35%.
The Credit Facility contains affirmative and reporting covenants and certain financial ratio and restrictive covenants. We have complied with these covenants from the date of the Credit Agreement through December 31, 2016, and had no existing defaults or events of default under the Credit Facility. The financial covenants, with terms as defined in the Credit Agreement, are:
• | maintain a Debt to Tangible Net Worth Ratio of not more than 0.80:1.00 as determined on the last day of each calendar month, |
• | maintain at all times a minimum liquidity in the form of Cash or Cash Equivalents of at least $1.0 million, |
• | maintain a Debt to Fair Market Value Ratio of not more than 0.50:1.00 at any time, and |
• | maintain the Fair Market Value of Liquid Portfolio Investments as a percentage of outstanding aggregate principal balance to not be less than 80% through March 9, 2017, 90% through September 9, 2017 and 100% through March 9, 2018. |
The Investment Facility initially was a $72.0 million facility and subsequently went through a series of amendments to extend its maturity date and prior to its pay-down and extinguishment on September 9, 2016. On May 9, 2016, we amended the Investment Facility to extend the maturity date from May 23, 2016 to July 29, 2016 (the "Extension"), and reduce the size of the Investment Facility from $72.0 million to $54.0 million. Under the Extension, we were required to use cash proceeds from any returns of capital on our portfolio investments to prepay our debt obligations under the Investment Facility. We were also permitted to accrue but were prohibited from paying management or incentive fees (excluding reimbursements to OHA for costs and expenses, or indemnification payments owed to OHA) to OHA under our Investment Advisory Agreement or Administration Agreement.
On July 28, 2016, we amended the Investment Facility to extend its maturity date from July 29, 2016 to September 15, 2016 (the “July Extension”). The July Extension contained substantially identical terms and conditions to the prior extension granted on May 9, 2016, but with the addition of the following: (i) a reduction of the size of the Investment Facility from $54.0 million to approximately $42.3 million, reflecting the outstanding principal balance on July 26, 2016 and (ii) an increase in the margin rate applicable to Eurodollar Loans and Base Rate Loans to 5.25%.
69
OHA INVESTMENT CORPORATION
NOTES TO CONSOLIDATED FINANCIAL STATEMENTS - (Continued)
December 31, 2016
As of December 31, 2015, the total amount outstanding under the Investment Facility was $72.0 million. Substantially all of our assets, except our investments in U.S. Treasury Bills, were pledged as collateral for the obligations under the Investment Facility. Prior to the July extension, the Investment Facility bore interest, at our option, at either (i) LIBOR plus 3.25% to 4.75%, or (ii) the base rate plus 2.25% to 3.75%, both based on our amounts outstanding.
We were party to a $30.0 million Treasury Secured Revolving Credit Agreement, or the Treasury Facility, dated March 31, 2011, as amended, with SunTrust Bank as administrative agent, that could only be used to purchase U.S. Treasury Bills. Proceeds from the Treasury Facility facilitated the growth of our investment portfolio and provided flexibility in the sizing of our portfolio investments. On September 24, 2014, we entered into a fifth amendment to the Treasury Facility, reduced the size of the Treasury Facility to $30.0 million and permitted the appointment of OHA as our investment advisor. Borrowings under the Treasury Facility bore interest, at our option, at either (i) LIBOR plus 150 basis points or (ii) the base rate plus 50 basis points. The Treasury Facility matured on September 24, 2015 and was not renewed.
The Investment Facility and the Treasury Facility contained affirmative and reporting covenants and certain financial ratio and restrictive covenants. We complied with these covenants throughout 2015 and the period ended September 9, 2016, and had no existing defaults or events of default under either facility. The most restrictive covenants, with terms as defined in the credit agreements, were (these restrictive covenants apply to both the Investment Facility and the Treasury Facility, unless otherwise noted):
• | maintaining a ratio of net asset value to consolidated total indebtedness (excluding net hedging liabilities) of not less than 2.25:1.0, |
• | maintaining a ratio of net asset value to consolidated total indebtedness (including net hedging liabilities) of not less than 2.0:1.0, |
• | maintaining a ratio of EBITDA (excluding revenue from cash collateral) to interest expense (excluding interest on loans under the Treasury Facility) of not less than 3.0:1.0, and |
• | maintaining a ratio of collateral to the aggregate principal amount of loans under the Treasury Facility of not less than 1.02:1.0. |
At the end of each quarter, we may take proactive steps to preserve investment flexibility for the next quarter by investing in cash equivalents, which includes purchasing U.S. Treasury Bills, by utilizing repurchase agreements on a temporary basis. On December 27, 2016, we purchased $40.0 million of U.S. Treasury Bills and contemporaneously entered into a $39.2 million repurchase arrangement with a global financial institution to finance such purchase. Under the repurchase arrangement, we transferred $40.0 million of U.S. Treasury Bills and $0.8 million of cash as collateral under the repurchase agreement. We repaid the $39.2 million borrowed under the repurchase agreement, and was returned the $0.8 million cash collateral, net of a $10 thousand financing fee, upon maturity of the U.S. Treasury Bills on January 5, 2017. We account for the transfer of the U.S. Treasury Bills under the repurchase agreement as a secured borrowing. As a result, the U.S. Treasury Bills are recorded on our books as investments in U.S. Treasury Bills, and the amount borrowed under the repurchase agreement is recorded as short-term debt at December 31, 2016.
On December 22, 2015, we purchased $35.0 million of U.S. Treasury Bills and contemporaneously entered into a $34.3 million repurchase arrangement with a global financial institution to finance such purchase. Under the repurchase arrangement, we transferred $35.0 million of U.S. Treasury Bills and $0.7 million of cash as collateral under the repurchase agreement. We repaid the amount borrowed under the repurchase agreement, and was returned the $0.7 million cash collateral, net of a $21 thousand financing fee, upon maturity of the U.S. Treasury Bills on January 21, 2016. We account for the transfer of the U.S. Treasury Bills under the repurchase agreement as a secured borrowing. As a result, the U.S. Treasury Bills are recorded on our books as investments in U.S. Treasury Bills, and the amount borrowed under the repurchase agreement is recorded as short-term debt at December 31, 2015.
Our average amount of debt outstanding during 2016 was $51.2 million and the average interest rate was 5.5%. During the years ended December 31, 2016, 2015 and 2014, interest expense and bank fees included the following (in thousands):
70
OHA INVESTMENT CORPORATION
NOTES TO CONSOLIDATED FINANCIAL STATEMENTS - (Continued)
December 31, 2016
2016 | 2015 | 2014 | ||||||||||
Interest expense on borrowed amounts | $ | 2,816 | $ | 2,115 | $ | 643 | ||||||
Commitment fees on unborrowed amounts | 39 | 179 | 386 | |||||||||
Amortization of deferred loan and debt issuance costs | 928 | 1,145 | 1,053 | |||||||||
Bank service charges | 36 | 41 | 37 | |||||||||
Interest expense and bank fees | $ | 3,819 | $ | 3,480 | $ | 2,119 | ||||||
Note 4: Common Stock
On October 31, 2011, our Board of Directors approved a stock repurchase plan, pursuant to which we were authorized to repurchase, from time to time, up to $10.0 million of our common stock in the open market at prices not to exceed the net asset value of our shares. During 2012 and 2013, we repurchased an aggregate of 1,129,014 shares of our common stock in the open market at an average price of $6.71 per share, totaling $7.6 million, in accordance with the stock repurchase plan. These repurchases were made at approximate discounts to our most recently published net asset value of 30%, 26% and 28% in May and November 2012 and May 2013, respectively.
On September 30, 2014, in connection with the appointment of OHA as our investment advisor, we completed the private sale of $1.0 million in aggregate purchase price of our common stock at an offering price of $8.53 per share, for a total of 117,234 shares, to an affiliate of OHA, pursuant to the stock purchase and transaction agreement dated July 21, 2014, by and among us, OHA and the affiliate. The price per share paid by the affiliate was the net asset value per share established by our previous board of directors as of a date within 48 hours prior to the purchase, excluding the impact of certain transaction and closing expenses, and represented a 38% premium to the market price per share on such date. The OHA affiliate also executed a stock purchase plan in accordance with Rule 10b-5-1 of the Securities Exchange Act of 1934, pursuant to which it committed to purchase, from time to time during the 12-month period ending September 30, 2015, through open market purchases, additional shares of our common stock having an aggregate purchase price of $4 million. During the fourth quarter of 2014, the OHA affiliate fulfilled its obligations under this plan, purchasing an aggregate of 696,198 shares of our common stock in the open market at an average price of $5.75 per share, totaling $4.0 million.
In March 2015, our Board of Directors authorized the Company to repurchase up to the remaining $2.4 million available to be repurchased under this plan. As of July 14, 2015, we completed the stock repurchases under the stock repurchase plan. During 2015, we repurchased a total of 444,030 shares for $2.4 million at a weighted average price of $5.46 per share, a 27% discount to net asset value at December 31, 2014. Repurchases initiated after March 31, 2015 were made pursuant to a plan executed in accordance with Rule 10b5-1 under the Securities Exchange Act of 1934. Under our current Credit Facility, the Company is prohibited from repurchasing shares of our common stock. There were no share repurchases during the year ended December 31, 2016.
Note 5: Investment Management
Investment Advisory Agreement
On September 30, 2014, we entered into the Investment Advisory Agreement with OHA, an investment adviser registered under the Investment Advisers Act of 1940, or Advisers Act, pursuant to which OHA replaced NGP Investment Advisor, LP as our investment advisor. The Investment Advisory Agreement was most recently approved by our Board of Directors, a majority of whom are not “interested” persons (as defined in the 1940 Act) of us, on August 2, 2016. Pursuant to the Investment Advisory Agreement, OHA implements our business strategy on a day-to-day basis and performs certain services for us on August 2, 2016, subject to the supervision of our Board of Directors. Under the Investment Advisory Agreement, we pay OHA a fee consisting of two components — a base management fee and an incentive fee.
Base Management Fee: The base management fee is paid quarterly in arrears, and is calculated by multiplying the average value of our total assets (excluding cash, cash equivalents and U.S. Treasury Bills that are purchased with borrowed funds solely for the purpose of satisfying quarter-end diversification requirements related to our election to be taxed as a RIC under the Code), as of the end of the two immediately prior fiscal quarters, by a rate of 1.75% per annum, with a 0.25% reduction in this 1.75% annual rate for the first year following September 30, 2014. For the years ended December 31, 2016 and December 31, 2015, we incurred $2.9 million and $3.0 million in base management fees, respectively.
Incentive Fee: The incentive fee consists of two parts. The first part, the investment income incentive fee, is calculated and payable quarterly in arrears based on our pre-incentive fee net investment income for the fiscal quarter for which the fee is being calculated. Pre-incentive fee net investment income means interest income, dividend income, royalty payments, net profits interest payments, and any other income (including any other fees, such as commitment, origination, syndication, structuring, diligence, monitoring and consulting fees or other fees that we receive from portfolio companies) accrued during the fiscal quarter, minus our operating expenses for the quarter (including the base management fee, expenses payable under the Administration Agreement, and any interest expense and distributions paid on any issued and outstanding preferred stock, but excluding the incentive fee). Pre-incentive fee net investment income includes, in the case of investments with a deferred interest feature (such as original issue discount, debt instruments with payment-in-kind interest and zero coupon securities), accrued income that we have not yet received in cash. Accordingly, we may pay an incentive fee based partly on accrued investment income, the collection of which is uncertain or deferred. Pre-incentive fee net investment income does not include any realized capital gains, realized capital losses, or unrealized capital appreciation or depreciation. Pre-incentive fee net investment income, expressed as a rate of return on the value of our net assets (defined as total assets less liabilities at the end of the immediately preceding fiscal quarter) is compared to a “hurdle rate” of 1.75% per quarter (7% annualized). OHA receives no incentive fee for any fiscal quarter in which our pre-incentive fee net investment income does not exceed the hurdle rate. OHA receives an incentive fee equal to 100% of our pre-incentive fee net investment income for any fiscal quarter in which our pre-incentive fee net investment income exceeds the hurdle rate but is less than 2.1875% (8.75% annualized) of net assets (also referred to as the “catch up” provision) plus 20% of our pre-incentive fee net investment income for such fiscal quarter greater than 2.1875% (8.75% annualized) of net assets. For the years ended December 31, 2016 and December 31, 2015, we incurred $0.3 million and $1.0 million in investment income incentive fees, respectively. We did not incur any investment income incentive fee in the fourth quarter of 2014.
The second part of the incentive fee, the capital gains fee, is determined and payable in arrears as of the end of each fiscal year (or, upon termination of the Investment Advisory Agreement, as of the termination date). The capital gains fee is equal to 20% of our cumulative aggregate realized capital gains from September 30, 2014 through the end of that fiscal year, computed net of our cumulative aggregate realized capital losses and cumulative aggregate unrealized depreciation on investments for the same time period. The aggregate amount of any previously paid capital gains incentive fees to OHA is subtracted from the capital gains incentive fee calculated. If such amount is negative, then there is no capital gains fee for such year. For the purposes of the capital gains fee, any gains and losses associated with our investment portfolio as of September 30, 2014 shall be excluded from the capital gains fee calculation. We have not incurred any capital gains fees since the Investment Advisory Agreement went into effect on September 30, 2014.
The Investment Advisory Agreement may be terminated at any time, without the payment of any penalty, by a vote of our Board of Directors or a vote of the holders of at least a majority of our outstanding voting securities (within the meaning of the 1940 Act) on 60 days’ written notice to OHA, and would automatically terminate in the event of its “assignment” (within the meaning of the 1940 Act). OHA may terminate the Investment Advisory Agreement without penalty by providing us at least than 60 days’ written notice. Pursuant to the Investment Advisory Agreement, OHA pays the compensation expense of its investment professionals, who provide management and investment advisory services to us. We bear all other costs and expenses of our operations and transactions.
Previous Investment Advisory Agreement
Prior to the September 30, 2014 appointment of OHA as our investment advisor, we had a similar investment advisory agreement with our previous investment advisor, NGP Investment Advisor, LP. The fee structure under our previous investment advisory agreement consisted of two components — a base management fee and an incentive fee.
Base Management Fee: Under the previous investment advisory agreement, we calculated the quarterly base management fee as 0.45% (1.8% annualized) of the average of our total assets (inclusive of all cash and cash equivalents without any exclusions) as of the end of the two most recent fiscal quarters, payable quarterly in arrears.
Incentive Fee: The incentive fee under the previous investment advisory agreement consisted of two parts. We calculated the first part of the incentive fee, the investment income incentive fee, as 20% of the excess, if any, of our net investment income for the quarter that exceeded a quarterly hurdle rate equal to 2% (8% annualized) of our net assets, with no “catch up” provision. We calculated and paid this investment income incentive fee quarterly in arrears. For the purpose of this fee calculation, net investment income was defined similarly to that under the Investment Advisory Agreement. We did not incur any investment income incentive fees in 2014 under the previous investment advisory agreement.
71
OHA INVESTMENT CORPORATION
NOTES TO CONSOLIDATED FINANCIAL STATEMENTS - (Continued)
December 31, 2016
We calculated the second part of the incentive fee, the capital gains fee, as (1) 20% of (a) our net realized capital gains (realized capital gains less realized capital losses) on a cumulative basis from the closing date of our initial public offering to the end of the applicable fiscal year, less (b) any unrealized capital depreciation at the end of such fiscal year, less (2) the aggregate amount of all capital gains fees paid to NGP Investment Advisor, LP in prior fiscal years. We determined and paid the capital gains fee in arrears as of the end of each fiscal year. We did not incur any capital gains fees under the previous investment advisory agreement since 2007.
Administration Agreement
Under the Administration Agreement, OHA furnishes us with certain administrative services, personnel and facilities. The Administration Agreement was most recently approved by our Board of Directors on August 2, 2016. Payments under the Administration Agreement are equal to our allocable portion of OHA’s overhead in performing its obligations under the Administration Agreement, including all administrative services necessary for our operation and the conduct of our business. The aggregate amount of certain costs and expenses payable by us under the Investment Advisory Agreement and the Administration Agreement for the period from October 1, 2014 to September 30, 2015 shall not exceed $2.5 million, or the Cap; provided that interest expense and bank fees, management and incentive fees, legal and professional fees, insurance expenses, taxes and costs related to the change in investment advisor are not subject to the Cap. Following the expiration of the Cap period, we completed the reconciliation of the related costs and expenses which resulted in approximately $0.5 million credit from OHA and is reflected in general and administrative expenses as of December 31, 2015. The Administration Agreement may be terminated at any time, without penalty, by a vote of our Board of Directors or by OHA upon 60 days’ written notice to the other party.
Prior to the September 30, 2014 appointment of OHA as our administrator, we had a similar administration agreement with our previous administrator, NGP Administration, LLC, with similar provisions as the Administration Agreement, except that under the previous administration agreement, (i) there was no Cap on expenses payable by us, and (ii) a portion of compensation costs of investment professionals and certain other costs were allocated to us that are not allocable to us under the Administration Agreement.
We owed $0.2 million and $0.2 million to OHA under the Administration Agreement as of December 31, 2016 and December 31, 2015, respectively, for expenses incurred on our behalf for the final month of the respective quarterly period. We include these amounts in accounts payable and accrued expenses on our Consolidated Balance Sheets.
Note 6: Federal Income Taxes
We operate so as to qualify, for tax purposes, as a RIC under Subchapter M of Chapter 1 of the Code. As a RIC, we are generally not subject to corporate-level U.S. federal income taxes on the portion of our investment company taxable income and net capital gain (i.e., realized net long-term capital gains in excess of realized net short-term capital losses) that we distribute to our stockholders. To qualify as a RIC, we are required, among other things, to distribute to our stockholders each year at least 90% of investment company taxable income, as defined by the Code, and to meet certain asset-diversification requirements.
Certain of our wholly-owned subsidiaries, or Taxable Subsidiaries, have elected to be taxed as corporations for federal income tax purposes. The Taxable Subsidiaries hold certain of our portfolio investments and are consolidated for financial reporting purposes, but not for income tax reporting purposes. These Taxable Subsidiaries permit us to hold equity investments in portfolio companies that are “pass through” entities for tax purposes, in order to comply with the “source-of-income” requirements that must be satisfied to maintain our qualification as a RIC. The Taxable Subsidiaries may generate net income tax expense or benefit, which is reflected on our Consolidated Statements of Operations.
Tax years 2012 through 2015 with respect to the Company and our Taxable Subsidiaries are open to future IRS examination. Our Taxable Subsidiaries have federal net operating loss carryforwards of $27.9 million that expire in various years through 2036.
Deferred income tax expense (benefit) results from temporary differences in the recognition of income and expenses for financial reporting purposes and for income tax purposes. The significant components of the income tax effects of these temporary differences, representing deferred income tax assets and liabilities are as follows (in thousands):
72
OHA INVESTMENT CORPORATION
NOTES TO CONSOLIDATED FINANCIAL STATEMENTS - (Continued)
December 31, 2016
December 31, | |||||||
2016 | 2015 | ||||||
Deferred tax assets | |||||||
Net operating loss carryforwards | $ | 10,169 | $ | 15,276 | |||
Unrealized losses, net | 8,402 | 5,529 | |||||
AMT credit carryforward | 695 | 632 | |||||
Capital loss carryforward | 292 | — | |||||
Total gross deferred tax assets | 19,558 | 21,437 | |||||
Less valuation allowance | (19,057 | ) | (14,621 | ) | |||
Net deferred tax assets | 501 | 6,816 | |||||
Deferred tax liabilities | |||||||
Investment in partnerships-Federal | (501 | ) | (6,816 | ) | |||
Total gross deferred tax liabilities | (501 | ) | (6,816 | ) | |||
Net deferred tax assets (liabilities) | $ | — | $ | — | |||
Federal and state income tax provisions (benefits) on net investment income, capital gains (losses) and unrealized appreciation (depreciation) on investments are as follows (in thousands):
Year Ended December 31, | |||||||||||
2016 | 2015 | 2014 | |||||||||
Current: | |||||||||||
U.S. federal – capital (AMT) | $ | 62 | $ | — | $ | 2 | |||||
State – net investment income | 7 | 72 | 109 | ||||||||
$ | 69 | $ | 72 | $ | 111 | ||||||
Deferred: | |||||||||||
U.S. federal – unrealized | $ | — | $ | — | $ | — | |||||
Total | $ | 69 | $ | 72 | $ | 111 | |||||
Actual income tax expense differs from income tax expense computed by applying the U.S. federal statutory corporate rate of 34% to net investment income before provision for income taxes. These differences and the differences between the statutory federal tax rate and the effective income tax rate were as follows (in thousands, except percentages):
Year Ended December 31, | ||||||||||||||||||||
2016 | 2015 | 2014 | ||||||||||||||||||
Net income (loss) before taxes | $ | (25,376 | ) | $ | (31,425 | ) | $ | (22,120 | ) | |||||||||||
Provision (benefit) at the statutory rate | (8,628 | ) | 34 | % | (10,685 | ) | 34 | % | (7,521 | ) | 34 | % | ||||||||
Increase (decrease) in provision resulting from: | ||||||||||||||||||||
RIC loss (income) not subject to income taxes | 3,335 | (13 | )% | 6,995 | (22 | )% | 6,546 | (30 | )% | |||||||||||
State income taxes | 7 | — | % | 63 | — | % | 94 | — | % | |||||||||||
Valuation allowance | 5,361 | (21 | )% | 3,702 | (12 | )% | 994 | (5 | )% | |||||||||||
Other | (6 | ) | — | % | (3 | ) | — | % | (2 | ) | — | % | ||||||||
Total income tax provision (benefit), net | $ | 69 | — | % | $ | 72 | — | % | $ | 111 | (1 | )% | ||||||||
Effective tax rate | — | % | — | % | (1 | )% | ||||||||||||||
Note 7: Commitments and Contingencies
73
OHA INVESTMENT CORPORATION
NOTES TO CONSOLIDATED FINANCIAL STATEMENTS - (Continued)
December 31, 2016
As of December 31, 2016, we had investments in 12 portfolio companies totaling $174.5 million. Of these 12 portfolio companies, the Company had already funded investments in the amount of $174.5 million and there were no remaining outstanding unfunded commitments. As of December 31, 2015, we had investments in or commitments to fund investments in 19 portfolio companies totaling $239.3 million. Of these 19 portfolio companies, the Company had already funded investments in the amount of $239.3 million and there were no remaining outstanding unfunded commitments.
We have continuing obligations under the Investment Advisory Agreement and the Administration Agreement with OHA. See Note 5. The agreements provide that, absent willful misfeasance, bad faith or gross negligence in the performance of its duties or the reckless disregard of its duties and obligations, OHA and its officers, managers, agents, employees, controlling persons, members and any other person or entity affiliated with OHA will be entitled to indemnification from us for any damages, liabilities, costs and expenses (including reasonable attorneys’ fees and amounts reasonably paid in settlement) arising from the rendering of services under the agreements or otherwise as our investment advisor or administrator. The agreements also provide that OHA and its affiliates will not be liable to us or any stockholder for any error of judgment, mistake of law, any loss or damage with respect to any of our investments or any action taken or omitted to be taken by OHA in connection with the performance of any of its duties or obligations under the agreements or otherwise as investment advisor or administrator to us, except to the extent specified in Section 36(b) of the 1940 Act concerning loss resulting from a breach of fiduciary duty with respect to the receipt of compensation for services. In the normal course of business, we enter into a variety of undertakings containing a variety of representations that may expose us to some risk of loss. We do not expect significant losses, if any, from such undertakings.
Legal Proceedings
From time to time, we are involved in various legal proceedings arising in the normal course of business. While we cannot predict the outcome of these proceedings with certainty, we do not believe that an adverse result in any pending legal proceeding, other than those described below, individually or in the aggregate, would be material to our business, financial condition or cash flows.
ATP Litigation. On August 17, 2012, ATP Oil & Gas Corporation, or ATP, filed a petition for relief under Chapter 11 of the U.S. Bankruptcy Code in the U.S. Bankruptcy Court for the Southern District of Texas. Prior to the bankruptcy filing, we purchased limited term overriding royalty interests, or ORRIs, in certain offshore oil and gas producing properties operated by ATP (generally, the Gomez and Telemark properties). On August 23, 2012, on a motion filed by ATP, the bankruptcy judge presiding over ATP’s case signed an order (Bankr. Dkt. No. 191) requiring ATP to pay amounts received after August 17, 2012 to those parties it believes are entitled to receive them, including the ORRI holders, provided that the ORRI holders execute a disgorgement agreement providing for the repayment of any amounts that the bankruptcy court later finds to have been inappropriately paid. We executed the disgorgement agreement and began receiving monthly distributions in September 2012 from ATP of our share of production proceeds received by ATP after August 17, 2012.
Phase 1. On October 17, 2012, we filed a lawsuit against ATP styled: OHA Investment Corporation v. ATP Oil & Gas Corporation, Adv. Proc. No. 12-03443, in the U.S. Bankruptcy Court for the Southern District of Texas, seeking a declaration that the ORRIs are our property and not property of ATP and that the conveyance and purchase and sale documents are not executory contracts that may be rejected in order to remove or recharacterize our interests in the properties (the “Adversary Proceeding”). Also, certain service companies claiming statutory liens or privileges intervened for the purpose of establishing that their alleged statutory liens and privileges are superior to our rights in the ORRIs and asserting related claims for disgorgement of royalties paid to us by ATP. The issues in the Adversary Proceeding were bifurcated such that the issues of (i) whether the conveyances and transactions between us and ATP constituted outright transfers of ownership and (ii) whether the conveyances are executory contracts or leases that ATP may reject, would be tried first as “Phase 1” of the proceeding. And, any additional claims, including the service company statutory lien claims and related issues, would be decided later in “Phase 2.” Phase 1 of the litigation proceeded into the discovery stage and dispositive motion practice.
On October 17, 2013, the bankruptcy court entered its Final Sale Order approving the sale of the Telemark properties (Bankr. Dkt. No. 2706) to Bennu Oil & Gas, LLC, or Bennu, a newly formed company owned by the DIP Lenders. (The Gomez properties were abandoned by ATP.)
After the bankruptcy case was converted to a case under Chapter 7 of the Bankruptcy Code, we settled Phase 1 of the litigation with the Trustee, Bennu and Credit Suisse AG, as agent to the DIP Lenders (Adv. Dkt. No. 270, 271). On February 4, 2016, an Agreed Final Judgment [Adv. Dkt. No. 276] was entered determining that, among other things, the ORRIs are a real property interest and a “production payment” within the meaning of Sections 101(42A) and 541(b) of the United States Bankruptcy Code. Likewise, our claims against ATP were dismissed without prejudice. The Agreed Judgment resolved Phase 1
74
OHA INVESTMENT CORPORATION
NOTES TO CONSOLIDATED FINANCIAL STATEMENTS - (Continued)
December 31, 2016
of the Adversary Proceeding. It did not address any disputes between us and Bennu with respect to the proper calculation of the investment balance under the terms of the ORRIs, including our legal fees, default interest, or the claims asserted by the statutory lien claimants. Additional detail on Phase 1 and the ATP bankruptcy is set forth in our Form 10Q for the quarter ending March 31, 2016.
Phase 2. On February 3, 2016, we filed our Amended Motion to Dismiss the Complaints in Intervention Filed by the Statutory Lien Claimants, which was subsequently amended [Adv. Dkt. No. 284]. The Amended Motion to Dismiss asserted, among other things, that under the terms of the applicable Louisiana Oil Well Lien Statute, the alleged statutory liens of the lien claimants either cannot attach to overriding royalties, or alternatively, that OHA purchased the ORRIs free and clear of the statutory liens because the lien claimants did not provide notice of the liens as required under the statute. We also filed a Motion to Withdraw the Reference of the Phase II Claims from the Bankruptcy Court to the District Court. On May 13, 2016, the Court entered its order granting in part and denying in part OHA’s Motion to Dismiss and Motion to Withdraw Reference [Adv. Dkt. No. 294] and its Report and Recommendation and Memorandum Opinion [Adv. Dkt. No. 293]. Pursuant to the Memorandum Opinion and the Order, the Court determined that under the Louisiana statute, if we purchased our ORRIs without notice of the lien claimants’ liens, in a bona fide transaction, we would take the ORRIs free and clear of the lien claimants’ rights. The Court granted the lien claimants leave to file amended complaints to specifically plead whether we had notice of their alleged privileges at the time we paid the purchase price. To that end, the Court stated that the Amended Motion to Dismiss was denied as to all issues other than the issue of whether we had notice of the lien claimants’ liens and that the Court would review the amended complaints (to determine whether they sufficiently pleaded a claim) [Adv. Dkt. No. 294]. The Bankruptcy Court recommended that the District Court grant the Motion to Withdraw the Reference, but that the Adversary Proceeding remain in the Bankruptcy Court until the time of trial. The District Court entered an order consistent with the Bankruptcy Court’s recommendation on the Motion to Withdraw the Reference.
On May 27, 2016, the Intervenors filed their amended complaints, which made new allegations with respect to the issue of notice. Accordingly, on June 9, 2016, we filed our Motion to Dismiss the amended complaints [Adv. Dkt. No. 310] asserting that the allegations regarding notice are insufficient to state a claim under the statute.
On August 19, 2016, the Bankruptcy Court entered its order [Adv. Dkt. No. 325] and its related Report and Recommendation [Adv. Dkt. No. 326] dismissing, with prejudice, the Intervenors’ amended complaints. The Bankruptcy Court’s order and the related Report and Recommendation recommends, to the District Court, that Phase II of the lawsuit be fully resolved in our favor. The Report and Recommendation was docketed in the United States District Court for the Southern District of Texas, Case No. 4:16-CV-02556. On September 2, 2016, certain of the Intervenors filed their Objection to Judge Isgur’s Report and Recommendation [Dist. Dkt. No. 3] arguing that the Bankruptcy Court’s conclusions were erroneous, and that the Intervenors were not required to give notice to OHA in order for their alleged liens to attach. We filed a limited objection to the Report and Recommendation arguing that the Report and Recommendation should be affirmed, but even if notice were not required under the statute, the Intervenors’ alleged liens could not have attached to the ORRIs in the first instance. On March 9, 2017 the District Court entered a Memorandum Opinion and Order [Dist. Dkt. No. 17] (the “District Court’s Order”) adopting the Bankruptcy Court’s Report and Recommendation and dismissing the Intervenors’ claims with prejudice. The Intervenors may elect to appeal the District Court’s Order to the United States Court of Appeals for the Fifth Circuit or seek other judicial relief.
As of December 31, 2016, our unrecovered investment was $31.1 million, and we had received aggregate royalty payments of $37.5 million since the date of ATP’s bankruptcy filing. As of December 31, 2016, we had incurred legal and consulting fees totaling $5.9 million in connection with the enforcement of our rights under the ORRIs. On various occasions, we have provided notice that such legal expenses will be added to our unrecovered investment balance to the extent they are not reimbursed. To date, we have not received any payments on account of legal expenses aside from our receipt of regular monthly production payments. As a result, we add our legal expenses to the unrecovered investment balance in accordance with our transaction documents. As of December 31, 2016, $5.4 million of the $5.9 million in legal and consulting fees have been added to, and are thus included in the unrecovered investment balance under the terms of our transaction documents. The remaining amounts of legal and consulting fees have been expensed to professional fees, thus, not included in the unrecovered investment balance at December 31, 2016. We note that the fair value of our investment in ATP ORRI decreased from $11.8 million as of December 31, 2015 to $0 as of December 31, 2016 as of the result of the cessation of monthly production payments.
Through December 31, 2016, we received post-petition royalty payments from the Gomez properties and the Telemark properties in the amount of $8.3 million and $29.2 million, respectively. It is estimated that the statutory lien claims asserted by the intervenors in the Adversary Proceeding against our ORRIs are in the principal amount of approximately $35.2 million. At
75
OHA INVESTMENT CORPORATION
NOTES TO CONSOLIDATED FINANCIAL STATEMENTS - (Continued)
December 31, 2016
this time, we estimate that there are potential statutory lien claims (including the claims of the intervenors in the Adversary Proceeding, without regard to the validity of such claims) in the principal amount of approximately $54.2 million. To the extent the Intervenors elect to appeal the District Court’s Order and it is reversed on appeal, we have or will assert that we have viable defenses with respect to all of the claims of the statutory lien claimants or any other claim which seeks to avoid or disgorge any pre-petition or post-petition royalty payment which we received in respect of the Telemark or Gomez properties. In the event that the District Court’s Order is reversed on appeal, and to the extent we do not prevail on our defenses to the statutory lien claims or any other claim seeking to avoid or disgorge pre-petition or post-petition royalty payments, we contend that, pursuant to the terms of our transaction documents, we are entitled to include any amounts disgorged on account of any such claims into the unrecovered investment balance of our ORRIs. Moreover, to the extent we do not prevail on our defenses to any action brought by the holder of a statutory lien claim, we contend that we would be permitted to seek contribution from other ORRI and net profits interest holders with respect to any disgorged amounts.
However, in the event the District Court’s Order is reversed on appeal and our defenses to the claims of the statutory lien claimants are unsuccessful or we otherwise become liable for disgorgement of any pre-petition or post-petition royalty payments which we have received from either the Gomez or Telemark properties, the remaining oil and gas reserves associated with the Telemark properties may be insufficient to provide for a full recovery on our investment. In the event that it is determined that we are not entitled to include amounts disgorged on account of statutory lien claims or other claims, if any, into the unrecovered investment balance of our ORRIs, any disgorged amounts will result in a failure to achieve our anticipated return and/or a loss on our investment.
While we intend to vigorously defend our legal positions in the Adversary Proceeding, there can be no assurance that we will ultimately prevail in any or all of these matters.
Bennu Titan Bankruptcy. On August 11, 2016, an involuntary Chapter 11 bankruptcy petition was filed by Beal Bank USA against Bennu Titan LLC (formerly known as ATP Titan LLC), an indirect subsidiary of Bennu Oil & Gas, LLC, and the owner of the floating production platform in the Gulf of Mexico that processes and transports hydrocarbons produced from the Telemark properties, in which OHA owns the ORRI. An order for relief was entered on September 9, 2016, in the case styled In re Bennu Titan LLC (f/k/a ATP Titan LLC), Case No. 16-11870, in the United States Bankruptcy Court for the District of Delaware. We are not a creditor in this bankruptcy case.
Bennu Oil & Gas Bankruptcy. On November 30, 2016, Bennu Oil & Gas, LLC filed a Chapter 7 bankruptcy in the Bankruptcy Court for the Southern District of Texas, Case No. 16-35930. Two of its affiliates, Bennu Blocker, Inc., Case No. 16-35931, and Bennu Holdings, LLC, Case No. 16-35932, likewise filed on that date.
On November 30, 2016, Bennu Oil & Gas, LLC moved to reject the Platform Use Agreement with Bennu Titan, LLC for the drilling and production platform commonly known as the Titan Platform. On January 4, 2017, the Bankruptcy Court entered an order approving the rejection of the Platform Use Agreement effective November 30, 2016.
On January 26, 2017, the Delaware Bankruptcy Court entered an order transferring the Bennu Titan case to the Bankruptcy Court for the Southern District of Texas so that the affiliated cases will be in the same court.
The “meeting of creditors” in the Bennu Oil & Gas bankruptcy case was held on January 26, 2017. The Chapter 7 Trustee reported that she is in the process of working with the Bennu Oil & Gas lenders on a plan to market the leases including the Telemark properties.
Status of Telemark Leases. The Telemark properties are comprised of three leases: Mississippi Canyon Block 942 known as OCS-G 24130 (“MC 942”); Mississippi Canyon Block 941 known as OCS-G 16661 (“MC 941”); and Atwater Valley Block 63 known as OCS-G 13198 (“AT 63”). At the meeting of creditors, Bennu officers testified that the well on the AT 63 lease stopped producing in May, 2016. Prior to filing bankruptcy, Bennu Oil & Gas shut in all of the wells on the other two Telemark leases on November 30, 2016. Accordingly, the leases will expire in 180 days from the date of last production unless production is resumed or the BOEM grants a deferral of the requirement to produce (known as a Suspense of Operations (“SOO”) or Suspense of Production (“SOP”). Based on the testimony at the meeting of creditors, we understand that Bennu Oil & Gas applied for an SOP for the AT 63 lease and the government has not ruled on the request. The Trustee’s counsel reported that the Trustee filed an amended request for an SOP for the AT 63 lease. There is no assurance that the government will grant the request for an SOP or any future request for an SOP on the Telemark leases. If the requests are not granted, the Telemark leases will expire 180 days from the date of last production.
Note 8: Dividends and Distributions
76
OHA INVESTMENT CORPORATION
NOTES TO CONSOLIDATED FINANCIAL STATEMENTS - (Continued)
December 31, 2016
We declared dividends for the years ended December 31, 2016 and December 31, 2015 totaling $4.8 million, or $0.24 per share, and $9.7 million, or $0.48 per share, respectively. The tax characteristics of deemed distributions in 2016 represented $5.8 million from ordinary income, none from return of capital and none from capital gains. The tax characteristics of deemed distributions in 2015 represented $11.0 million from ordinary income, none from return of capital and none from capital gains. For tax purposes, 10% of the $1.2 million dividend declared in December 2016 and paid on January 9, 2017 was deemed to be distributed in 2016 and 90% was deemed to be distributed in 2017. Also, the $2.4 million dividend declared in December 2015 and paid on January 8, 2016, 15% was deemed to be distributed in 2015 and 85% was deemed to be distributed in 2016 for tax purposes.
The following table summarizes the differences between financial statement net increase in net assets resulting from operations and taxable income available for distribution to stockholders for the years ended December 31, 2016, 2015 and 2014 (in thousands):
Year Ended December 31, | |||||||||||
2016 | 2015 | 2014 | |||||||||
Net increase (decrease) in net assets resulting from operations | $ | (25,446 | ) | $ | (31,222 | ) | $ | (22,231 | ) | ||
Adjustments: | |||||||||||
Net change in unrealized (appreciation) depreciation, net of income tax (benefit) provision | 4,938 | 40,973 | 12,999 | ||||||||
Net amortization of insurance premiums | — | — | 727 | ||||||||
Net revenue, income and expenses from Taxable Subsidiaries | (328 | ) | (472 | ) | (92 | ) | |||||
Realized (gain) loss of Taxable Subsidiaries | 6,626 | 441 | 252 | ||||||||
Realized (gain) loss offset by capital loss carryforwards | 20,385 | (222 | ) | 12,175 | |||||||
Defaulted loan interest | 196 | 2,209 | 1,055 | ||||||||
Costs related to strategic alternatives review | (542 | ) | (615 | ) | 1,947 | ||||||
Income from investment in Passive Foreign Investment Company | — | (96 | ) | 96 | |||||||
Reclassification of capital loss on closed options | — | — | — | ||||||||
Allowance for uncollectible interest and dividends | — | — | 115 | ||||||||
State taxes, tax penalty, interest and fees | (19 | ) | (26 | ) | 49 | ||||||
Income tax (benefit) provision | 3 | 6 | 2 | ||||||||
Other | 1 | (3 | ) | — | |||||||
Taxable income available for distribution to stockholders | 5,814 | 10,973 | 7,094 | ||||||||
Less: | |||||||||||
Dividends declared | 4,841 | 9,736 | 13,157 | ||||||||
Dividends payable at prior year end | 2,421 | 3,299 | 3,280 | ||||||||
Dividends payable at current year end | (1,210 | ) | (2,421 | ) | (3,299 | ) | |||||
Current year IRC Section 852(b)(7) dividend payable | 121 | 359 | — | ||||||||
Prior year IRC Section 852(b)(7) dividend payable | (359 | ) | — | (2,579 | ) | ||||||
Current year deemed distributions | 5,814 | 10,973 | 10,559 | ||||||||
Over distribution | $ | — | $ | — | $ | (3,465 | ) | ||||
As of December 31, 2016, the components of net assets (excluding paid in capital) on a tax basis consisted of net unrealized depreciation on portfolio investments of $73.3 million and other temporary differences of $2.9 million. As of December 31, 2016, we had long-term and short-term capital loss carryforwards of $59.3 million and $0.6 million, respectively, which do not expire. In addition, we have a $22.4 million remaining capital loss carryforward balance generated in the year ended December 31, 2010, that expires in 2018, for a total remaining capital loss carryforward of $82.3 million at December 31, 2016. At December 31, 2016, the aggregate cost of total portfolio investments for federal income tax purposes was $218.3 million, resulting in gross unrealized appreciation of $1.3 million and gross unrealized depreciation of $74.6 million. The
77
OHA INVESTMENT CORPORATION
NOTES TO CONSOLIDATED FINANCIAL STATEMENTS - (Continued)
December 31, 2016
difference between cost of investments for book and tax amounts for federal income tax purposes was due primarily to timing differences in recognizing certain gains and losses on investment transactions.
Note 9: Reclassifications
GAAP requires adjustments to certain components of net assets to reflect permanent differences between financial and tax reporting. These reclassifications have no effect on total net assets or net asset value per share. These reclassifications are primarily due to reclassification of the distribution of dividends paid, non-deductible meal expenses, income and expenses from wholly owned subsidiaries, amortization of insurance premiums, costs related to strategic alternatives review and tax basis adjustments for investments sold. The table below summarizes the reclassifications from undistributed net investment income (loss), undistributed net realized capital gain (loss), and paid-in capital in excess of par for the years ended December 31, 2016, 2015, and 2014 (in thousands):
78
OHA INVESTMENT CORPORATION
NOTES TO CONSOLIDATED FINANCIAL STATEMENTS - (Continued)
December 31, 2016
Year | Undistributed Net Investment Income (Loss) | Undistributed Net Realized Capital Gain (Loss) | Paid-in Capital in Excess of Par | |||||||||
2016 | $ | 1,413 | $ | 4,869 | $ | (6,282 | ) | |||||
2015 | (1,615 | ) | 1,678 | (63 | ) | |||||||
2014 | 5,978 | (1,693 | ) | (4,285 | ) | |||||||
Note 10: Fair Value
Our investments consisted of the following as of December 31, 2016 and 2015:
December 31, 2016 | December 31, 2015 | |||||||||||||||||||||||||||
(Dollar amounts in thousands) | Cost | % of total | Fair Value | % of total | Cost | % of total | Fair Value | % of total | ||||||||||||||||||||
Portfolio investments | ||||||||||||||||||||||||||||
First lien secured debt | $ | — | — | % | $ | — | — | % | $ | 22,150 | 8.1 | % | $ | 3,340 | 1.7 | % | ||||||||||||
Second lien debt | 48,002 | 22.3 | % | 35,966 | 24.8 | % | 73,791 | 26.9 | % | 69,508 | 33.1 | % | ||||||||||||||||
Subordinated debt | 38,958 | 18.2 | % | 33,704 | 23.2 | % | 47,517 | 17.3 | % | 37,836 | 18.0 | % | ||||||||||||||||
Limited term royalties | 27,845 | 13.0 | % | — | — | % | 27,709 | 10.1 | % | 11,845 | 5.6 | % | ||||||||||||||||
Redeemable preferred units | 55,662 | 26.0 | % | 32,876 | 22.7 | % | 51,273 | 18.7 | % | 43,939 | 21.0 | % | ||||||||||||||||
CLO residual interests | 1,529 | 0.7 | % | 1,773 | 1.2 | % | 6,327 | 2.3 | % | 5,659 | 2.7 | % | ||||||||||||||||
Membership and partnership units | 2,500 | 1.2 | % | 686 | 0.5 | % | 10,500 | 3.8 | % | 2,583 | 1.2 | % | ||||||||||||||||
Total portfolio investments | 174,496 | 81.4 | % | 105,005 | 72.4 | % | 239,267 | 87.2 | % | 174,710 | 83.3 | % | ||||||||||||||||
Government securities | ||||||||||||||||||||||||||||
U.S. Treasury Bills | 39,997 | 18.6 | % | 39,997 | 27.6 | % | 34,997 | 12.8 | % | 34,997 | 16.7 | % | ||||||||||||||||
Total investments | $ | 214,493 | 100.0 | % | $ | 145,002 | 100.0 | % | $ | 274,264 | 100.0 | % | $ | 209,707 | 100.0 | % | ||||||||||||
ASC 820 defines fair value as the price that a seller would receive for an asset or pay to transfer a liability in an orderly transaction between independent, knowledgeable and willing market participants at the measurement date. The fair value definition focuses on exit price in the principal, or most advantageous, market and prioritizes the use of observable market inputs over unobservable entity-specific inputs. In accordance with ASC 820, we categorize our investments based on the inputs to our valuation methodologies as follows:
• | Level 1 — Quoted unadjusted prices for identical instruments in active markets to which we have access at the date of measurement. |
• | Level 2 — Quoted prices for similar instruments in active markets; quoted prices for identical or similar instruments in markets that are not active; and model-derived valuations in which all significant inputs and significant value drivers are observable in active markets. Level 2 inputs are those in markets for which there are few transactions, the prices are not current, little public information exists or instances where prices vary substantially over time or among brokered market makers. |
• | Level 3 — Model-derived valuations in which one or more significant inputs or significant value drivers are unobservable. Unobservable inputs are those inputs that reflect our own assumptions regarding what market participants would use to price the asset or liability based on the best available information. |
Fair value accounting classifies financial assets and liabilities in their entirety based on the lowest level of input that is significant to the estimated fair value measurement. Our assessment of the significance of a particular input to the fair value measurement requires judgment that may affect the valuation of assets and liabilities and their placement within the fair value hierarchy levels. Any transfers between levels are disclosed, effective at the end of the period.
79
OHA INVESTMENT CORPORATION
NOTES TO CONSOLIDATED FINANCIAL STATEMENTS - (Continued)
December 31, 2016
We did not have any liabilities carried at fair value at December 31, 2016 or December 31, 2015. Amounts under our Credit Facility and Investment Facility are carried at amortized cost in the Consolidated Balance Sheets. As of December 31, 2016, the fair value of our Credit Facility approximated its carry value of $39.1 million. As of December 31, 2015, the carry value of our Investment Facility was $72.0 million and the estimated fair value was $69.3 million. The estimated fair value of the Credit Facility is determined by discounting projected remaining payments using market interest rates for borrowings of the Company.
During fourth quarter of 2016, our investment in Gramercy Park CLO Ltd., a CLO residual interest, transferred from Level 2 to Level 3 category as a result of the lack of quoted prices for similar instruments in active markets. There were no other transfers between levels as of December 31, 2016. During 2015, there were no transfers between Levels 3, 2 or 1 categories. During 2016 and 2015, none of our investments in portfolio companies changed between the categories of Control Investments, Affiliate Investments and Non-Affiliate Investments.
The following tables set forth our financial assets by level within the fair value hierarchy that we accounted for at fair value as of December 31, 2016 and 2015 (in thousands):
December 31, 2016 | Total | Level 1 | Level 2 | Level 3 | ||||||||||||
Portfolio investments | ||||||||||||||||
Affiliate investments | ||||||||||||||||
Subordinated debt | 16,464 | — | — | 16,464 | ||||||||||||
Equity securities | 686 | — | — | 686 | ||||||||||||
Total affiliate investments | 17,150 | — | — | 17,150 | ||||||||||||
Non-affiliate investments | ||||||||||||||||
Second lien debt | 35,966 | — | 26,829 | 9,137 | ||||||||||||
Subordinated debt | 17,240 | — | 17,240 | — | ||||||||||||
Redeemable preferred units | 32,876 | — | — | 32,876 | ||||||||||||
CLO residual interests | 1,773 | — | — | 1,773 | ||||||||||||
Total non-affiliate investments | 87,855 | — | 44,069 | 43,786 | ||||||||||||
Total portfolio investments | 105,005 | — | 44,069 | 60,936 | ||||||||||||
Government securities | ||||||||||||||||
U.S. Treasury Bills | 39,997 | 39,997 | — | — | ||||||||||||
Total investments | $ | 145,002 | $ | 39,997 | $ | 44,069 | $ | 60,936 | ||||||||
80
OHA INVESTMENT CORPORATION
NOTES TO CONSOLIDATED FINANCIAL STATEMENTS - (Continued)
December 31, 2016
December 31, 2015 | Total | Level 1 | Level 2 | Level 3 | ||||||||||||
Portfolio investments | ||||||||||||||||
Control investments | ||||||||||||||||
First lien secured debt | $ | 1,000 | $ | — | $ | — | $ | 1,000 | ||||||||
Total control investments | 1,000 | — | — | 1,000 | ||||||||||||
Affiliate investments | ||||||||||||||||
Subordinated debt | 16,310 | — | — | 16,310 | ||||||||||||
Equity securities | 2,583 | — | — | 2,583 | ||||||||||||
Total affiliate investments | 18,893 | — | — | 18,893 | ||||||||||||
Non-affiliate investments | ||||||||||||||||
First lien secured debt | 2,340 | — | — | 2,340 | ||||||||||||
Second lien debt | 69,508 | — | 48,154 | 21,354 | ||||||||||||
Subordinated debt | 21,526 | — | 13,606 | 7,920 | ||||||||||||
Limited term royalties | 11,845 | — | — | 11,845 | ||||||||||||
Redeemable preferred units | 43,939 | — | — | 43,939 | ||||||||||||
CLO residual interests | 5,659 | — | 5,659 | — | ||||||||||||
Total non-affiliate investments | 154,817 | — | 67,419 | 87,398 | ||||||||||||
Total portfolio investments | 174,710 | — | 67,419 | 107,291 | ||||||||||||
Government securities | ||||||||||||||||
U.S. Treasury Bills | 34,997 | 34,997 | — | — | ||||||||||||
Total investments | $ | 209,707 | $ | 34,997 | $ | 67,419 | $ | 107,291 | ||||||||
81
OHA INVESTMENT CORPORATION
NOTES TO CONSOLIDATED FINANCIAL STATEMENTS - (Continued)
December 31, 2016
The following table presents a roll-forward of the changes in fair value during the years ended December 31, 2016 and 2015 for all investments for which we determine fair value using unobservable (Level 3) factors (in thousands):
First Lien Secured Debt and Limited Term Royalties | Second Lien Debt | Subordinated Debt and Redeemable Preferred Units | Royalty Interests, Contingent Earn-out and Equity Securities | CLO Residual Interest | Total Investments | ||||||||||||||||||
Fair value at December 31, 2014 | $ | 34,970 | $ | 21,835 | $ | 79,606 | $ | 2,147 | — | $ | 138,558 | ||||||||||||
Total gains, (losses) and amortization: | |||||||||||||||||||||||
Net realized gains (losses) | — | — | — | 199 | — | 199 | |||||||||||||||||
Net unrealized gains (losses) | (16,949 | ) | (3,123 | ) | (14,180 | ) | 998 | — | (33,254 | ) | |||||||||||||
Net amortization of premiums, discounts and fees | 134 | 275 | 68 | — | — | 477 | |||||||||||||||||
New investments, repayments and settlements, net: | |||||||||||||||||||||||
New investments | 4,683 | 21,566 | 800 | — | — | 27,049 | |||||||||||||||||
Payment-in-kind | 710 | 84 | 1,875 | — | — | 2,669 | |||||||||||||||||
Repayments and settlements | (8,363 | ) | (19,283 | ) | — | (761 | ) | — | (28,407 | ) | |||||||||||||
Fair value at December 31, 2015 | 15,185 | 21,354 | 68,169 | 2,583 | — | 107,291 | |||||||||||||||||
Total gains, (losses) and amortization: | |||||||||||||||||||||||
Net realized gains (losses) | (19,807 | ) | — | (800 | ) | (6,565 | ) | — | (27,172 | ) | |||||||||||||
Net unrealized gains (losses) | 6,829 | (8,528 | ) | (14,597 | ) | 6,103 | — | (10,193 | ) | ||||||||||||||
Net amortization of premiums, discounts and fees | 57 | 73 | 151 | — | — | 281 | |||||||||||||||||
New investments, repayments and settlements, net: | |||||||||||||||||||||||
New investments | — | — | — | — | — | — | |||||||||||||||||
Payment-in-kind | 136 | 15 | 5,417 | — | — | 5,568 | |||||||||||||||||
Repayments and settlements | (2,400 | ) | (3,777 | ) | (9,000 | ) | (1,435 | ) | — | (16,612 | ) | ||||||||||||
Transfers into Level 3 | — | — | — | — | 1,773 | 1,773 | |||||||||||||||||
Fair value at December 31, 2016 | $ | — | $ | 9,137 | $ | 49,340 | $ | 686 | $ | 1,773 | $ | 60,936 | |||||||||||
Net change in unrealized gains (losses) from investments still held as of reporting date: | |||||||||||||||||||||||
December 31, 2016 | $ | 6,829 | $ | (8,528 | ) | $ | (14,597 | ) | $ | 6,103 | $ | — | $ | (10,193 | ) | ||||||||
December 31, 2015 | $ | (6,973 | ) | $ | (1,623 | ) | $ | (1,945 | ) | $ | 1,295 | $ | — | $ | (9,246 | ) | |||||||
We present net unrealized gains (losses) on our Consolidated Statements of Operations as “Net unrealized appreciation (depreciation) on investments.”
82
OHA INVESTMENT CORPORATION
NOTES TO CONSOLIDATED FINANCIAL STATEMENTS - (Continued)
December 31, 2016
The following table summarizes the significant unobservable inputs in the fair value measurements of our Level 3 investments by category of investment and valuation technique as of December 31, 2016 (fair value in thousands):
Type of Investment | Fair Value | Valuation Technique | Significant Unobservable Inputs | Range of Inputs | Weighted Average | |||||||
Non-Energy Investments: | ||||||||||||
Second lien debt | $ | 9,137 | Market comparables | EBITDA multiples | 11.0x - 16.0x | 12.9x | ||||||
Subordinated debt | 16,464 | Market comparables | EBITDA multiples | 5.0x - 6.0x | 5.5x | |||||||
CLO residual interest | 1,773 | Net asset value with discount rate | Discount rate | 15% | 15% | |||||||
Equity securities | 686 | Market comparables | EBITDA multiples | 5.0x - 6.0x | 5.5x | |||||||
$ | 28,060 | |||||||||||
Energy Investments: | ||||||||||||
Redeemable preferred units | $ | 32,876 | Discounted cash flow | Discount rate | 10% | 10% | ||||||
Market comparables | EBITDA | 3.0x - 5.0x | 4.0x | |||||||||
Reserve multiple(1) | $1.50 - $1.70 | $1.60 | ||||||||||
Production multiple(2) | $4,500 - $6,100 | $5,300 | ||||||||||
Total Level 3 investments | $ | 60,936 | ||||||||||
(1) Based on price per thousand cubic fee of natural gas.
(2) Based on price per million cubic feet equivalent of natural gas per day.
As noted above, the income and market approaches were used in the determination of fair value of certain Level 3 assets as of December 31, 2016. The significant unobservable inputs used in the income approach are the discount rate or market yield used to discount the estimated future cash flows expected to be received from the underlying investment, which include future principal and interest payments. An increase in the discount rate or market yield would result in a decrease in the fair value. The significant unobservable inputs used in the market approach are based on market comparable transactions and market multiples of publicly traded comparable companies. Increases or decreases in market multiples would result in an increase or decrease, respectively in the fair value.
83
OHA INVESTMENT CORPORATION
NOTES TO CONSOLIDATED FINANCIAL STATEMENTS - (Continued)
December 31, 2016
Note 11: Financial Highlights
Year Ended December 31, | |||||||||||||||||||
Per Share Data(1) | 2016 | 2015 | 2014 | 2013 | 2012 | ||||||||||||||
Net asset value, beginning of period | $ | 5.49 | $ | 7.48 | $ | 9.20 | $ | 9.57 | $ | 9.26 | |||||||||
Net investment income | 0.32 | 0.49 | 0.16 | 0.61 | 0.55 | ||||||||||||||
Net realized and unrealized gain (loss) on investments(2) | (1.58 | ) | (2.03 | ) | (1.24 | ) | (0.42 | ) | 0.26 | ||||||||||
Net increase (decrease) in net assets resulting from operations | (1.26 | ) | (1.54 | ) | (1.08 | ) | 0.19 | 0.81 | |||||||||||
Distributions to common stockholders | |||||||||||||||||||
Distributions from net investment income | (0.24 | ) | (0.48 | ) | (0.47 | ) | (0.64 | ) | (0.57 | ) | |||||||||
Return of capital | — | — | (0.17 | ) | — | — | |||||||||||||
Net decrease in net assets from distributions | (0.24 | ) | (0.48 | ) | (0.64 | ) | (0.64 | ) | (0.57 | ) | |||||||||
Effect of shares repurchased, gross | — | 0.03 | — | 0.08 | 0.07 | ||||||||||||||
Net asset value, end of period | $ | 3.99 | $ | 5.49 | $ | 7.48 | $ | 9.20 | $ | 9.57 | |||||||||
Market value, beginning of period | $ | 3.80 | $ | 4.69 | $ | 7.47 | $ | 7.22 | $ | 7.19 | |||||||||
Market value, end of period | $ | 1.72 | $ | 3.80 | $ | 4.69 | $ | 7.47 | $ | 7.22 | |||||||||
Market value return(3) | (50.2 | )% | (10.7 | )% | (30.2 | )% | 12.9 | % | 8.4 | % | |||||||||
Net asset value return(4) | (20.0 | )% | (19.1 | )% | (9.7 | )% | 4.9 | % | 11.5 | % | |||||||||
Ratios and Supplemental Data | |||||||||||||||||||
($ and shares in thousands) | |||||||||||||||||||
Net assets, end of period | $ | 80,493 | $ | 110,780 | $ | 154,164 | $ | 188,552 | $ | 201,266 | |||||||||
Average net assets | $ | 99,220 | $ | 143,394 | $ | 176,556 | $ | 192,392 | $ | 202,519 | |||||||||
Common shares outstanding, end of period | 20,172 | 20,172 | 20,616 | 20,499 | 21,020 | ||||||||||||||
Total operating expenses/average net assets(5) | 11.5 | % | 8.3 | % | 10.7 | % | 7.9 | % | 5.7 | % | |||||||||
Net investment income/average net assets(5)(7) | 6.6 | % | 7.0 | % | 1.8 | % | 6.5 | % | 5.8 | % | |||||||||
Portfolio turnover rate | 4.8 | % | 26.7 | % | 34.2 | % | 43.6 | % | 47.3 | % | |||||||||
Expense Ratios (as a percentage of average net assets)(4) | |||||||||||||||||||
Interest expense and bank fees | 3.9 | % | 2.4 | % | 1.2 | % | 1.7 | % | 1.0 | % | |||||||||
Management and incentive fees(6) | 3.2 | % | 2.8 | % | 2.6 | % | 3.1 | % | 2.3 | % | |||||||||
Costs related to strategic alternatives review | — | % | — | % | 3.4 | % | 0.3 | % | — | % | |||||||||
Other operating expenses including provision for income taxes(5)(7) | 4.4 | % | 3.2 | % | 3.5 | % | 2.8 | % | 2.4 | % | |||||||||
Total operating expenses including provision for income taxes(5)(7) | 11.5 | % | 8.4 | % | 10.7 | % | 7.9 | % | 5.7 | % | |||||||||
_______________
(1) | Per Share Data is based on weighted average number of common shares outstanding for the period. |
84
OHA INVESTMENT CORPORATION
NOTES TO CONSOLIDATED FINANCIAL STATEMENTS - (Continued)
December 31, 2016
(2) | May include a balancing amount necessary to reconcile the change in net asset value per share with other per share information presented. This amount may not agree with the aggregate gains and losses for the period because the difference in the net asset value at the beginning and end of the period may not equal the per share changes of the line items disclosed. |
(3) | Total return based on market value is calculated as the change in market value per share during the respective periods, assuming dividends and distributions, if any, are reinvested in accordance with the Company's dividend reinvestment plan. |
(4) | Total return based on net asset value is calculated as the change in net asset value per share during the respective periods, assuming dividends and distributions, if any, are reinvested in accordance with the Company's dividend reinvestment plan. |
(5) | Net of legal fee reimbursements of $0.5 million, $1.6 million and $3.2 million in 2015, 2014 and 2013, respectively. Excluding these legal fee reimbursements, other operating expense ratio and total operating expense ratios would have been 3.7% and 8.9%, respectively, for the year ended December 31, 2015, 4.4% and 11.6%, respectively, for the year ended December 31, 2014 and 4.8% and 9.6%, respectively, for the year ended December 31, 2013. |
(6) | On September 30, 2014, Oak Hill Advisors, L.P. replaced NGP Investment Advisor, LP as our investment advisor. |
(7) | For the year ended December 31, 2015, we applied a credit to our expenses of $0.5 million from OHA related to expenses in excess of the Cap under the Investment Advisory Agreement and the Administration Agreement. Excluding this credit, the net investment ratio would have been 6.6%, the net decrease in net assets resulting from operations ratio would have been (22.1)%, the other operating expenses ratio would have been 3.5% and the total operating expenses ratio would have been 8.7%. |
Note 12: Selected Quarterly Financial Data (unaudited)
Investment Income | Net Investment Income (Loss) | Net Realized and Unrealized Gain (Loss) on Investments | Net Increase (Decrease) in Net Assets Resulting from Operations | |||||||||||||||||||||||||||||
Quarter Ended | Total | Per Share | Total | Per Share | Total | Per Share | Total | Per Share | ||||||||||||||||||||||||
(In thousands, except per share amounts) | ||||||||||||||||||||||||||||||||
March 31, 2015 | $ | 4,816 | $ | 0.23 | $ | 2,169 | $ | 0.11 | $ | (4,054 | ) | $ | (0.20 | ) | $ | (1,885 | ) | $ | (0.09 | ) | ||||||||||||
June 30, 3015 | 5,914 | 0.29 | 2,498 | 0.12 | (2,982 | ) | (0.15 | ) | (484 | ) | (0.02 | ) | ||||||||||||||||||||
September 30, 2015 | 5,088 | 0.25 | 2,081 | 0.10 | (8,728 | ) | (0.43 | ) | (6,647 | ) | (0.33 | ) | ||||||||||||||||||||
December 31, 2015 | 6,231 | 0.31 | 3,221 | 0.16 | (25,427 | ) | (1.26 | ) | (22,206 | ) | (1.10 | ) | ||||||||||||||||||||
March 31, 2016 | 5,157 | 0.26 | 1,835 | 0.09 | (13,499 | ) | (0.67 | ) | (11,664 | ) | (0.58 | ) | ||||||||||||||||||||
June 30, 3016 | 4,373 | 0.22 | 1,354 | 0.07 | (1,239 | ) | (0.06 | ) | 115 | 0.01 | ||||||||||||||||||||||
September 30, 2016 | 4,321 | 0.21 | 1,700 | 0.08 | (4,312 | ) | (0.21 | ) | (2,612 | ) | (0.13 | ) | ||||||||||||||||||||
December 31, 2016 | 4,037 | 0.20 | 1,614 | 0.08 | (12,899 | ) | (0.64 | ) | (11,285 | ) | (0.56 | ) | ||||||||||||||||||||
Item 9. Changes in and Disagreements with Accountants on Accounting and Financial Disclosure
None.
Item 9A. Controls and Procedures
Disclosure Controls and Procedures
We maintain controls and procedures (as defined in Rules 13a-15(e) and 15d-15(e) of the Securities Exchange Act of 1934, as amended, or the Exchange Act), designed to ensure that information required to be disclosed in our reports that we file under the Exchange Act is recorded, processed, summarized and reported within the time periods specified in the rules and forms of the SEC and accumulated and communicated to management, including our Chief Executive Officer and our Chief Financial Officer, to allow timely decisions regarding required disclosures.
85
In connection with the preparation of this Annual Report on Form 10-K, as of the end of the fiscal period covered by this Annual Report on Form 10-K (December 31, 2016), we performed an evaluation, under the supervision and with the participation of management, including our Chief Executive Officer and our Chief Financial Officer, of the effectiveness of the design and operation of our disclosure controls and procedures pursuant to Rules 13a-15(b) and 15d-15(b) of the Exchange Act. Based on this evaluation, our Chief Executive Officer and our Chief Financial Officer concluded that, as of December 31, 2016, our disclosure controls and procedures were effective in providing reasonable assurance (i) that information required to be disclosed in the reports we file or submit under the Exchange Act is recorded, processed, summarized and reported within the time periods specified in the rules and forms of the SEC and (ii) that such information is accumulated and communicated to management in a manner that allows timely decisions regarding required disclosure.
Management’s Annual Report on Internal Control over Financial Reporting
Management is responsible for establishing and maintaining adequate internal control over financial reporting, as defined in Rules 13a-15(f) and 15d-15(f) of the Exchange Act.
Our internal control over financial reporting is a process designed to provide reasonable assurance regarding the reliability of financial reporting and the preparation of financial statements for external purposes in accordance with generally accepted accounting principles. Our internal control over financial reporting includes those policies and procedures that (1) pertain to the maintenance of records that, in reasonable detail, accurately and fairly reflect the transactions and dispositions of our assets; (2) provide reasonable assurance that we record transactions as necessary to permit preparation of financial statements in accordance with generally accepted accounting principles, and that our receipts and expenditures are in accordance with authorizations of management and our Board of Directors; and (3) provide reasonable assurance regarding prevention or timely detection of unauthorized acquisition, use or disposition of our assets that could have a material effect on our financial statements.
Because of its inherent limitations, internal control over financial reporting may not prevent misstatements or detect misstatements on a timely basis. Also, projections of any evaluation of effectiveness to future periods are subject to the risk that controls may become inadequate because of changes in conditions, or that the degree of compliance with the policies and procedures may deteriorate.
Management has evaluated the effectiveness of its internal control over financial reporting as of December 31, 2016. In making its assessment of internal control over financial reporting, management used the criteria established by the Committee of Sponsoring Organizations of the Treadway Commissions (COSO) in Internal Control — Integrated Framework. Based on the results of this evaluation, management has determined that, as of December 31, 2016, our internal control over financial reporting is effective based on the criteria in Internal Control — Integrated Framework issued by COSO.
Our independent registered public accounting firm that has audited our financial statements has also audited the effectiveness of our internal control over financial reporting as of December 31, 2016, as stated in their report included herein.
Changes in Internal Control Over Financial Reporting
No changes to our internal control over financial reporting occurred during the quarter ended December 31, 2016 that have materially affected, or are reasonably likely to materially affect, our internal control over financial reporting (as defined in Rules 13a-15(f) and 15d-15(f) of the Exchange Act).
Item 9B. Other Information
None.
PART III
Item 10. Directors, Executive Officers and Corporate Governance
We hereby incorporate by reference the information required by Item 10 of Form 10-K from the information appearing in our definitive Proxy Statement relating to our 2017 annual meeting of stockholders, which will be filed pursuant to Regulation 14A within 120 days after our fiscal year ended December 31, 2016.
Code of Ethics
We have adopted a code of business conduct and ethics applicable to our directors, officers (including our principal executive officer, principal compliance officer and principal financial officer) and employees of OHA performing regular functions or duties for us. In addition, we have adopted a code of ethics pursuant to Rule 17j-1 under the 1940 Act that establishes procedures for personal investments and restricts certain personal securities transactions. Personnel subject to such code may invest in securities for their personal investment accounts, including securities that may be purchased or held by us, so long as such investments are made in accordance with the code’s requirements. Copies of our code of business conduct and
86
ethics and our code of ethics will be provided to any person, without charge, upon request. Contact our Chief Compliance Officer at 212-852-1900 to request a copy or send the request to OHA Investment Corporation, Attn: Chief Compliance Officer, 1114 Avenue of the Americas, 27th Floor, New York, New York, 10036. Additionally, our code of business conduct and ethics is available on our corporate website, www.ohainvestmentcorporation.com, on the Corporate Governance page in the Investor Relations section. If any substantive amendments are made to our code of business conduct and ethics or if we grant any waiver, including any implicit waiver, from a provision of the code to any of our executive officers and directors, we will disclose the nature of such amendment or waiver in a report on Form 8-K.
Item 11. Executive Compensation
We hereby incorporate by reference the information required by Item 11 of Form 10-K from the information appearing in our definitive Proxy Statement relating to our 2017 annual meeting of stockholders, which will be filed pursuant to Regulation 14A within 120 days after our fiscal year ended December 31, 2016.
Item 12. Security Ownership of Certain Beneficial Owners and Management and Related Stockholder Matters
We hereby incorporate by reference the information required by Item 12 of Form 10-K from the information appearing in our definitive Proxy Statement relating to our 2017 annual meeting of stockholders, which will be filed pursuant to Regulation 14A within 120 days after our fiscal year ended December 31, 2016.
Item 13. Certain Relationships and Related Transactions
We hereby incorporate by reference the information required by Item 13 of Form 10-K from the information appearing in our definitive Proxy Statement relating to our 2017 annual meeting of stockholders, which will be filed pursuant to Regulation 14A within 120 days after our fiscal year ended December 31, 2016.
Item 14. Principal Accountant Fees and Services
We hereby incorporate by reference the information required by Item 14 of Form 10-K from the information appearing in our definitive Proxy Statement relating to our 2017 annual meeting of stockholders, which will be filed pursuant to Regulation 14A within 120 days after our fiscal year ended December 31, 2016.
PART IV
Item 15. Exhibits, Financial Statement Schedules
(a) | We are filing the following documents as a part of this Annual Report on Form 10-K: |
(a) | Financial Statements |
(2) Financial Statement Schedules | ||
(b) | Exhibits required to be filed by Item 601 of Regulation S-K |
See “Index to Exhibits” following the signature page for a description of the exhibits filed as part of this Annual Report on Form 10-K.
87
Schedule 12 – 14
OHA INVESTMENT CORPORATION
SCHEDULE OF INVESTMENTS IN AND ADVANCES TO AFFILIATES(1)
December 31, 2016
(In Thousands)
Portfolio Company | Investment(2) | Year Ended December 31, 2016 Amount of Interest or Royalties Credited to Income(3) | December 31, 2015 Fair Value | Gross Additions(4) | Gross Reductions(5) | December 31, 2016 Fair Value | ||||||||||||||||
Control Investments | ||||||||||||||||||||||
Contour Highwall Holdings, LLC | Term Loan | $ | — | $ | 1,000 | $ | — | $ | (1,000 | ) | $ | — | ||||||||||
Promissory Note | — | — | — | — | $ | — | ||||||||||||||||
Membership Units | — | — | — | — | — | |||||||||||||||||
Spirit Resources, LLC | Tranche A Term Loan | — | — | — | — | — | ||||||||||||||||
Tranche B Term Loan | — | — | — | — | — | |||||||||||||||||
Preferred Units | — | — | — | — | — | |||||||||||||||||
Overriding Royalty Interests | — | — | — | — | — | |||||||||||||||||
Subtotal Control Investments | $ | — | $ | 1,000 | $ | — | $ | (1,000 | ) | $ | — | |||||||||||
Affiliate Investments | ||||||||||||||||||||||
OCI Holdings, LLC | Subordinated Note | $ | 2,923 | $ | 16,310 | $ | 1,077 | $ | (923 | ) | $ | 16,464 | ||||||||||
OHA/OCI Investments, LLC Units | — | 2,583 | — | (1,897 | ) | 686 | ||||||||||||||||
Subtotal Affiliate Investments | $ | 2,923 | $ | 18,893 | $ | 1,077 | $ | (2,820 | ) | $ | 17,150 | |||||||||||
Total Control Investments and Affiliate Investments | $ | 2,923 | $ | 19,893 | $ | 1,077 | $ | (3,820 | ) | $ | 17,150 | |||||||||||
_______________
(1) | This schedule should be read in conjunction with our Consolidated Financial Statements for the year ended December 31, 2016. |
(2) | Units and common stock are generally non-income producing and restricted. The principal amount for debt, number of shares of common stock or number, or percentage of, units is shown in the Consolidated Schedule of Investments as of December 31, 2016. |
(3) | Represents the total amount of interest, dividends or royalties, net of amortization, credited to income for the portion of the year an investment was included in our Control Investments or Affiliate Investments categories, as applicable. |
(4) | Gross additions include increases in investments resulting from new portfolio company investments, payment-in-kind interest and the amortization of discounts or fees. Gross additions also include net increases in unrealized appreciation or net decreases in unrealized depreciation. |
(5) | Gross reductions include decreases in the cost basis resulting from principal collections related to investment repayments, sales or write-offs. Gross reductions also include increases in net unrealized depreciation or net decreases in unrealized appreciation. |
88
SIGNATURES
Pursuant to the requirements of Section 13 or 15(d) of the Securities Exchange Act of 1934, the Registrant has duly caused this report to be signed on its behalf by the undersigned, thereunto duly authorized.
OHA INVESTMENT CORPORATION | ||
/s/ STEVEN T. WAYNE | ||
By: | Steven T. Wayne President and Chief Executive Officer | |
Date: March 14, 2017
Pursuant to the requirements of the Securities Exchange Act of 1934, this report has been signed below by the following persons on behalf of the Registrant and in the capacities and on the dates indicated. This document may be executed by the signatories hereto on any number of counterparts, all of which constitute one and the same instrument.
Signature | Title | Date | ||
/s/ STEVEN T. WAYNE | President and Chief Executive Officer | March 14, 2017 | ||
Steven T. Wayne | (Principal Executive Officer) | |||
/s/ CORY E. GILBERT | Chief Financial Officer and Treasurer (Principal Financial and Accounting Officer) | March 14, 2017 | ||
Cory E. Gilbert | ||||
/s/ GLENN R. AUGUST | Director and Chairman of the Board | March 14, 2017 | ||
Glenn R. August | ||||
/s/ ALAN M. SCHRAGER | Director | March 14, 2017 | ||
Alan M. Schrager | ||||
/s/ STUART I. ORAN | Director | March 14, 2017 | ||
Stuart I. Oran | ||||
/s/ JAMES A. STERN | Director | March 14, 2017 | ||
James A. Stern | ||||
/s/ FRANK V. TANNURA | Director | March 14, 2017 | ||
Frank V. Tannura | ||||
89
INDEX TO EXHIBITS
Exhibit No. | Exhibit | |
3.1 | Articles of Incorporation (filed as Exhibit (a)(1) to our Registration Statement on Form N-2 filed on August 16, 2004 (Registration No. 333-118279) and incorporated herein by reference) | |
3.2 | Articles of Amendment and Restatement (filed as Exhibit 3.2 to our Annual Report on Form 10-K filed on April 12, 2005 and incorporated herein by reference) | |
3.3 | Second Amended and Restated Bylaws (filed as Exhibit 3.3 to our Annual Report on Form 10-K filed on March 15, 2016 and incorporated herein by reference) | |
4.1 | Form of Stock Certificate (filed as Exhibit 4.1 to our Annual Report on Form 10-K filed on March 12, 2015 and incorporated herein by reference) | |
4.2 | Dividend Reinvestment Plan (filed as Exhibit 4.2 to our Annual Report on Form 10-K filed on March 12, 2015 and incorporated herein by reference) | |
10.1 | Stock Purchase and Transaction Agreement dated as of July 21, 2014 by and among Registrant, OHA BDC Investor, LLC and Oak Hill Advisors, L.P. (filed as Exhibit 10.1 to our Current Report on Form 8-K filed on July 21, 2014, and incorporated herein by reference) | |
10.2 | Investment Advisory Agreement, dated September 30, 2014, between OHA Investment Corporation and Oak Hill Advisors, L.P. (filed as Exhibit 10.1 to our Current Report on Form 8-K filed on October 2, 2014, and incorporated herein by reference) | |
10.3 | Administration Agreement dated September 30, 2014, between OHA Investment Corporation and Oak Hill Advisors, L.P. (filed as Exhibit 10.2 to our Current Report on Form 8-K filed on October 2, 2014, and incorporated herein by reference) | |
10.4 | Form of Indemnity Agreement between the Registrant and the directors and officers of the Registrant (filed as Exhibit 10.3 to our Quarterly Report on Form 10-Q filed on November 7, 2014 and incorporated herein by reference) | |
10.5 | Security Procedure Agreement, dated January 23, 2015, by and between OHA Investment Corporation and Wells Fargo Bank, National Association (filed as Exhibit 10.18 to our Quarterly Report on Form 10-Q filed on August 6, 2015 and incorporated herein by reference) | |
10.6 | Amendment to Security Procedure Agreement, dated June 18, 2015, by and between OHA Investment Corporation and Wells Fargo Bank, National Association (filed as Exhibit 10.19 to our Quarterly Report on From 10-Q filed on August 6, 2015 and incorporated herein by reference) | |
10.7 | Credit Agreement dated September 9, 2016, by and among OHA Investment Corporation, the lenders from time to time thereto and MidCap Financial Trust as administrative agent (filed as Exhibit 10.20 to our Current Report on Form 8-K filed on September 12, 2016 and incorporated herein by reference) | |
10.8 | Security Agreement, dated September 9, 2016, by and among OHA Investment Corporation, the subsidiary guarantors party thereto and MidCap Financial Trust, as administrative agent (filed as Exhibit 10.21 to our Current Report on Form 8-K filed on September 12, 2016 and incorporated herein by reference) | |
10.9 | Guaranty Agreement, dated September 9, 2016, by and among the subsidiary guarantors and MidCap Financial Trust, as administrative agent (filed as Exhibit 10.22 to our Current Report on Form 8-K filed on September 12, 2016 and incorporated herein by reference) | |
10.10 | Custodial Agreement dated September 26, 2016, between OHA Investment Corporation and Wells Fargo Bank, National Association (filed as Exhibit 10.22 to our Quarterly Report on Form 10-Q filed on November 14, 2016 and incorporated herein by reference) | |
14.1* | Code of Business Conduct and Ethics | |
14.2* | Code of Ethics adopted October 15, 2016 | |
21.1* | Subsidiaries | |
31.1* | Certification required by Rule 13a-14(a)/15d-14(a) by the Chief Executive Officer | |
31.2* | Certification required by Rule 13a-14(a)/15d-14(a) by the Chief Financial Officer | |
32.1* | Section 1350 Certification by the Chief Executive Officer | |
32.2* | Section 1350 Certification by the Chief Financial Officer | |
* | Filed herewith. | |
90