Attached files
| file | filename |
|---|---|
| EX-31.1 - CERTIFICATION OF CHIEF EXECUTIVE OFFICER PURSUANT TO SECTION 302 - KBS Real Estate Investment Trust III, Inc. | kbsriiiq42016exhibit311.htm |
| EX-99.2 - CONSENT OF DUFF & PHELPS, LLC - KBS Real Estate Investment Trust III, Inc. | kbsriiiq42016exhibit992.htm |
| EX-32.2 - CERTIFICATION OF CHIEF FINANCIAL OFFICER PURSUANT TO SECTION 906 - KBS Real Estate Investment Trust III, Inc. | kbsriiiq42016exhibit322.htm |
| EX-32.1 - CERTIFICATION OF CHIEF EXECUTIVE OFFICER PURSUANT TO SECTION 906 - KBS Real Estate Investment Trust III, Inc. | kbsriiiq42016exhibit321.htm |
| EX-31.2 - CERTIFICATION OF CHIEF FINANCIAL OFFICER PURSUANT TO SECTION 302 - KBS Real Estate Investment Trust III, Inc. | kbsriiiq42016exhibit312.htm |
| EX-23.1 - CONSENT OF ERNST & YOUNG LLP - KBS Real Estate Investment Trust III, Inc. | kbsriiiq42016exhibit231.htm |
| EX-21.1 - SUBSIDIARIES OF THE COMPANY - KBS Real Estate Investment Trust III, Inc. | kbsriiiq42016exhibit211.htm |
UNITED STATES
SECURITIES AND EXCHANGE COMMISSION
Washington, D.C. 20549
___________________________________________________________________________
FORM 10-K
______________________________________________________
(Mark One)
x | ANNUAL REPORT PURSUANT TO SECTION 13 OR 15(d) OF THE SECURITIES EXCHANGE ACT OF 1934 |
For the fiscal year ended December 31, 2016
OR
¨ | TRANSITION REPORT PURSUANT TO SECTION 13 OR 15(d) OF THE SECURITIES EXCHANGE ACT OF 1934 |
For the transition period from to
Commission file number 000-54687
______________________________________________________
KBS REAL ESTATE INVESTMENT TRUST III, INC.
(Exact Name of Registrant as Specified in Its Charter)
______________________________________________________
Maryland | 27-1627696 | |
(State or Other Jurisdiction of Incorporation or Organization) | (I.R.S. Employer Identification No.) | |
800 Newport Center Drive, Suite 700 Newport Beach, California | 92660 | |
(Address of Principal Executive Offices) | (Zip Code) | |
(949) 417-6500
(Registrant’s Telephone Number, Including Area Code)
______________________________________________________________________
Securities registered pursuant to Section 12(b) of the Act:
Title of Each Class | Name of Each Exchange on Which Registered | |
None | None | |
Securities registered pursuant to Section 12(g) of the Act:
Common Stock, $0.01 par value per share
______________________________________________________________________
Indicate by check mark if the registrant is a well-known seasoned issuer, as defined in Rule 405 of the Securities Act. Yes ¨ No x
Indicate by check mark if the registrant is not required to file reports pursuant to Section 13 or Section 15(d) of the Act. Yes ¨ No x
Indicate by check mark whether the registrant (1) has filed all reports required to be filed by Section 13 or 15(d) of the Securities Exchange Act of 1934 during the preceding 12 months (or for such shorter period that the registrant was required to file such reports) and (2) has been subject to such filing requirements for the past 90 days. Yes x No ¨
Indicate by check mark whether the registrant has submitted electronically and posted on its corporate website, if any, every Interactive Data File required to be submitted and posted pursuant to Rule 405 of Regulation S-T (§232.405 of this chapter) during the preceding 12 months (or for such shorter period that the registrant was required to submit and post such files). Yes x No ¨
Indicate by check mark if disclosure of delinquent filers pursuant to Item 405 of Regulation S-K is not contained herein, and will not be contained, to the best of Registrant’s knowledge, in definitive proxy or information statements incorporated by reference in Part III of the Form 10-K or any amendment of this Form 10-K. x
Indicate by check mark whether the registrant is a large accelerated filer, an accelerated filer, a non-accelerated filer or a smaller reporting company. See definitions of “large accelerated filer”, “accelerated filer” and “smaller reporting company” in Rule 12b-2 of the Exchange Act. (Check one):
Large Accelerated Filer | ¨ | Accelerated Filer | ¨ | |||
Non-Accelerated Filer | x (Do not check if a smaller reporting company) | Smaller reporting company | ¨ | |||
Indicate by check mark whether the registrant is a shell company (as defined in Rule 12b-2 of the Securities Exchange Act). Yes ¨ No x
There is no established market for the Registrant’s shares of common stock. On December 8, 2015, the board of directors of the Registrant approved an estimated value per share of the Registrant’s common stock of $10.04 based on the estimated value of the Registrant’s assets less the estimated value of the Registrant’s liabilities, or net asset value, divided by the number of shares outstanding, all as of September 30, 2015, with the exception of a reduction to the Registrant’s net asset value for acquisition fees and closing costs related to a real estate acquisition that closed subsequent to September 30, 2015 and deferred financing costs related to a mortgage loan that closed subsequent to September 30, 2015. For a full description of the methodologies used to value the Registrant’s assets and liabilities in connection with the calculation of the estimated value per share as of December 8, 2015, see Part II, Item 5, “Market for Registrant’s Common Equity, Related Stockholder Matters and Issuer Purchases of Equity Securities - Market Information” of the Registrant’s Annual Report on Form 10-K for the year ended December 31, 2015. On December 9, 2016, the board of directors of the Registrant approved an estimated value per share of the Registrant’s common stock of $10.63 based on the estimated value of the Registrant’s assets less the estimated value of the Registrant’s liabilities, or net asset value, divided by the number of shares outstanding, all as of September 30, 2016. For a full description of the methodologies used to value the Registrant’s assets and liabilities in connection with the calculation of the estimated value per share as of December 9, 2016, see Part II, Item 5, “Market for Registrant’s Common Equity, Related Stockholder Matters and Issuer Purchases of Equity Securities - Market Information” in this Annual Report on Form 10-K.
There were approximately 179,899,389 shares of common stock held by non-affiliates as of June 30, 2016, the last business day of the Registrant’s most recently completed second fiscal quarter.
As of March 8, 2017, there were 181,616,100 outstanding shares of common stock of the Registrant.
Documents Incorporated by Reference: Registrant incorporates by reference in Part III (Items 10, 11, 12, 13 and 14) of this Form 10-K portions of its Definitive Proxy Statement for its 2017 Annual Meeting of Stockholders.
TABLE OF CONTENTS
ITEM 1. | |||
ITEM 1A. | |||
ITEM 1B. | |||
ITEM 2. | |||
ITEM 3. | |||
ITEM 4. | |||
ITEM 5. | |||
ITEM 6. | |||
ITEM 7. | |||
ITEM 7A. | |||
ITEM 8. | |||
ITEM 9. | |||
ITEM 9A. | |||
ITEM 9B. | |||
ITEM 10. | |||
ITEM 11. | |||
ITEM 12. | |||
ITEM 13. | |||
ITEM14. | |||
ITEM 15. | |||
1
FORWARD-LOOKING STATEMENTS
Certain statements included in this Annual Report on Form 10-K are forward-looking statements. Those statements include statements regarding the intent, belief or current expectations of KBS Real Estate Investment Trust III, Inc. and members of our management team, as well as the assumptions on which such statements are based, and generally are identified by the use of words such as “may,” “will,” “seeks,” “anticipates,” “believes,” “estimates,” “expects,” “plans,” “intends,” “should” or similar expressions. Actual results may differ materially from those contemplated by such forward-looking statements. Further, forward-looking statements speak only as of the date they are made, and we undertake no obligation to update or revise forward-looking statements to reflect changed assumptions, the occurrence of unanticipated events or changes to future operating results over time, unless required by law.
The following are some of the risks and uncertainties, although not all of the risks and uncertainties, that could cause our actual results to differ materially from those presented in our forward-looking statements:
• | We are dependent on KBS Capital Advisors LLC (“KBS Capital Advisors”), our advisor, to identify suitable investments, to manage our investments and for the disposition of our investments. |
• | All of our executive officers, our affiliated directors and other key real estate and debt finance professionals are also officers, affiliated directors, managers, key professionals and/or holders of a direct or indirect controlling interest in our advisor, our dealer manager and/or other KBS-affiliated entities. As a result, our executive officers, our affiliated directors, some of our key real estate and debt finance professionals, our advisor and its affiliates face conflicts of interest, including significant conflicts created by our advisor’s and its affiliates’ compensation arrangements with us and other KBS-sponsored programs and KBS-advised investors and conflicts in allocating time among us and these other programs and investors. Furthermore, these individuals may become employees of another KBS-sponsored program in an internalization transaction or, if we internalize our advisor, may not become our employees as a result of their relationship with other KBS-sponsored programs. These conflicts could result in action or inaction that is not in the best interests of our stockholders. |
• | Because investment opportunities that are suitable for us may also be suitable for other KBS-sponsored programs or KBS-advised investors, our advisor and its affiliates face conflicts of interest relating to the purchase of properties and other investments and such conflicts may not be resolved in our favor, meaning that we could invest in less attractive assets, which could reduce the investment return to our stockholders. |
• | Our advisor and its affiliates receive fees in connection with transactions involving the purchase or origination and management of our investments. These fees are based on the cost of the investment, and not based on the quality of the investment or the quality of the services rendered to us. This may influence our advisor to recommend riskier transactions to us and increases our stockholders’ risk of loss. In addition, we have paid substantial fees to and expenses of our advisor, its affiliates and participating broker-dealers in connection with our now-terminated primary initial public offering, which payments increase the risk that our stockholders will not earn a profit on their investment. We may also pay significant fees during our listing/liquidation stage. Although most of the fees payable during our listing/liquidation stage are contingent on our stockholders first enjoying agreed-upon investment returns, the investment return thresholds may be reduced subject to approval by our conflicts committee and to other limitations in our charter. |
• | Our charter permits us to pay distributions from any source, including offering proceeds or borrowings (which may constitute a return of capital), and our charter does not limit the amount of funds we may use from any source to pay such distributions. As of December 31, 2016, we had used a combination of cash flow from operations, proceeds from debt financing and proceeds from an advance from our advisor to fund distributions. From time to time during our operational stage, we expect to use proceeds from third party financings to fund at least a portion of distributions in anticipation of cash flow to be received in later periods. We may also fund such distributions from the sale of assets or from the maturity, payoff or settlement of debt investments. If we pay distributions from sources other than our cash flow from operations, we will have less funds available for investment in properties and other assets and the overall return to our stockholders may be reduced. |
• | We may incur debt until our total liabilities would exceed 75% of the cost of our tangible assets (before deducting depreciation and other non-cash reserves), and we may exceed this limit with the approval of the conflicts committee of our board of directors. To the extent financing in excess of this limit is available on attractive terms, our conflicts committee may approve debt such that our total liabilities would exceed this limit. High debt levels could limit the amount of cash we have available to distribute and could result in a decline in the value of an investment in us. |
2
• | We depend on tenants for the revenue generated by our real estate investments and, accordingly, the revenue generated by our real estate investments is dependent upon the success and economic viability of our tenants. Revenues from our properties could decrease due to a reduction in occupancy (caused by factors including, but not limited to, tenant defaults, tenant insolvency, early termination of tenant leases and non-renewal of existing tenant leases) and/or lower rental rates, making it more difficult for us to meet our debt service obligations and limiting our ability to pay distributions to our stockholders. |
• | In addition, our real estate investments may be affected by unfavorable real estate market and general economic conditions, which could decrease the value of those assets and reduce the investment return to our stockholders. |
• | We cannot predict with any certainty how much, if any, of our dividend reinvestment plan proceeds will be available for general corporate purposes including, but not limited to: the repurchase of shares under our share redemption program; capital expenditures, tenant improvement costs and leasing costs related to our real estate properties; reserves required by any financings of our real estate investments; the acquisition or origination of real estate investments, which include payment of acquisition or origination fees to our advisor; and the repayment of debt. If such funds are not available from our dividend reinvestment plan offering, then we may have to use a greater proportion of our cash flow from operations to meet these cash requirements, which would reduce cash available for distributions and could limit our ability to redeem shares under our share redemption program. |
• | Disruptions in the financial markets and uncertain economic conditions could adversely affect our ability to implement our business strategy and generate returns to stockholders. |
• | Our charter does not require us to liquidate our assets and dissolve by a specified date, nor does our charter require our directors to list our shares for trading by a specified date. No public market currently exists for our shares of common stock, and we have no plans at this time to list our shares on a national securities exchange. Until our shares are listed, if ever, our stockholders may not sell their shares unless the buyer meets the applicable suitability and minimum purchase standards. Any sale must comply with applicable state and federal securities laws. In addition, our charter prohibits the ownership of more than 9.8% of our stock, unless exempted by our board of directors, which may inhibit large investors from purchasing our shares. Our shares cannot be readily sold and, if our stockholders are able to sell their shares, they would likely have to sell them at a substantial discount from the price our stockholders paid to acquire the shares and from our estimated value per share. |
All forward-looking statements should be read in light of the risks identified in Part I, Item 1A of this Annual Report on Form 10-K.
3
PART I
ITEM 1. | BUSINESS |
Overview
KBS Real Estate Investment Trust III, Inc. (the “Company”) was formed on December 22, 2009 as a Maryland corporation that elected to be taxed as a real estate investment trust (“REIT”) beginning with the taxable year ended December 31, 2011 and it intends to continue to operate in such a manner. As used herein, the terms “we,” “our” and “us” refer to the Company and as required by context, KBS Limited Partnership III, a Delaware limited partnership, which we refer to as our “Operating Partnership,” and to their subsidiaries. We conduct our business primarily through our Operating Partnership, of which we are the sole general partner.
We own a diverse portfolio of real estate investments. As of December 31, 2016, we owned 28 office properties and one mixed-use office/retail property and had entered into a joint venture (the “Hardware Village Joint Venture”) with a developer to develop and subsequently operate one apartment complex, which is currently under construction.
On February 4, 2010, we filed a registration statement on Form S-11 with the Securities and Exchange Commission (the “SEC”) to offer a minimum of 250,000 shares and a maximum of up to 280,000,000 shares, or up to $2,760,000,000 of shares, of common stock for sale to the public, of which up to 200,000,000 shares, or up to $2,000,000,000 of shares, were registered in our primary offering and up to 80,000,000 shares, or up to $760,000,000 of shares, were registered under our dividend reinvestment plan. The SEC declared our registration statement effective on October 26, 2010 and we retained KBS Capital Markets Group LLC (“KBS Capital Markets Group”), an affiliate of our advisor, to serve as the dealer manager of our initial public offering pursuant to a dealer manager agreement. The dealer manager was responsible for marketing our shares in our initial public offering. We ceased offering shares of common stock in our primary offering on May 29, 2015 and terminated the primary offering on July 28, 2015.
We sold 169,006,162 shares of common stock in our now-terminated primary initial public offering for gross offering proceeds of $1.7 billion. As of December 31, 2016, we had also sold 16,973,229 shares of common stock under our dividend reinvestment plan for gross offering proceeds of $165.0 million. Also as of December 31, 2016, we had redeemed 5,367,281 shares sold in our initial public offering for $52.5 million.
Additionally, on October 3, 2014, we issued 258,462 shares of common stock, for $2.4 million, in private transactions exempt from the registration requirements pursuant to Section 4(a)(2) of the Securities Act of 1933.
We continue to offer shares under our dividend reinvestment plan. In some states, we will need to renew the registration statement annually or file a new registration statement to continue the dividend reinvestment plan offering. We may terminate our dividend reinvestment plan offering at any time.
As our advisor, KBS Capital Advisors manages our day-to-day operations and our portfolio of real estate investments. KBS Capital Advisors makes recommendations on all investments to our board of directors. All proposed investments must be approved by at least a majority of our board of directors, including a majority of the conflicts committee. Unless otherwise provided by our charter, the conflicts committee may approve a proposed investment without action by the full board of directors if the approving members of the conflicts committee constitute at least a majority of the board of directors. KBS Capital Advisors also provides asset-management, disposition, marketing, investor-relations and other administrative services on our behalf. Our advisor owns 20,000 shares of our common stock. We have no paid employees.
Objectives and Strategies
Our primary investment objectives are to preserve and return our stockholders’ capital contributions and to provide our stockholders with attractive and stable cash distributions. We will also seek to realize growth in the value of our investments by timing asset sales to maximize asset value.
4
2016 Investment Highlights
During 2016:
• | we acquired one office property containing 488,243 rentable square feet located in Charlotte, North Carolina for $146.1 million plus closing costs; |
• | at maturity, the borrower under our investment in the Aberdeen First Mortgage Origination paid off the entire $22.4 million principal balance outstanding and due to us. The Aberdeen First Mortgage Origination matured on July 1, 2016 and bore interest at a fixed rate of 7.5%; and |
• | we entered into the Hardware Village Joint Venture to participate in the development and subsequent operation of a two-building apartment complex located on the developable land at Gateway Tech Center (“Hardware Village”). The total projected cost of Hardware Village is approximately $116.9 million. We own a 99.24% equity interest in the Hardware Village Joint Venture. Hardware Village is currently under construction. |
Real Estate Portfolio
Other than our investment in the development of Hardware Village, we have made investments in core real estate properties, which are generally lower risk, existing properties with at least 80% occupancy and minimal near-term lease rollover. Our primary investment focus is core office properties located throughout the United States, though we may also invest in other types of properties. Our core property focus in the U.S. office sector has reflected a more value-creating core strategy. In many cases, these properties have slightly higher (10% to 15%) vacancy rates and/or higher near-term lease rollover at acquisition than more conservative value-maintaining core properties. These characteristics may provide us with opportunities to lease space at higher rates, especially in markets with increasing absorption, or to re-lease space at higher rates, bringing below-market rates of in-place expiring leases up to market rates. Many of these properties required or will require a moderate level of additional investment for capital expenditures and tenant improvement costs in order to improve or rebrand the properties and increase rental rates. Thus, we believe these properties will provide an opportunity for us to achieve more significant capital appreciation by increasing occupancy, negotiating new leases with higher rental rates and/or executing enhancement projects.
The core office properties in which we have invested include low-rise, mid-rise and high-rise office buildings and office parks in urban and suburban locations in or near central business districts with access to transportation.
We generally hold fee title to the real estate properties in our portfolio. We may also enter into other joint ventures, partnerships and other co-ownership arrangements (including preferred equity investments) or participations for the purpose of obtaining interests in real estate properties and other real estate investments.
We generally intend to hold our core properties for three to seven years, which we believe is a reasonable period to enable us to capitalize on the potential for increased income and capital appreciation of properties. However, economic and market conditions may influence us to hold our real estate properties for different periods of time.
We have invested all of the proceeds from our now-terminated initial public offering in a diverse portfolio of real estate investments. From time to time, and based upon asset sales, availability under our debt facilities or market conditions, we may seek to make additional real estate investments.
We also may make investments in real estate-related loans, including first and second mortgage loans, mezzanine loans, B-Notes, bridge loans, convertible mortgages, wraparound mortgage loans, construction mortgage loans and participations in such loans. We may structure, underwrite and originate some of the debt products in which we invest. Our underwriting process will involve comprehensive financial, structural, operational and legal due diligence to assess the risks of investments so that we can optimize pricing and structuring. By originating loans directly, we will be able to efficiently structure a diverse range of products.
We may make adjustments to our target portfolio based on real estate market conditions and investment opportunities. We will not forego a good investment because it does not precisely fit our expected portfolio composition. We believe that we are most likely to meet our investment objectives through the careful selection and underwriting of assets. When making an acquisition, we will emphasize the performance and risk characteristics of that investment, how that investment will fit with our portfolio-level performance objectives, the other assets in our portfolio and how the returns and risks of that investment compare to the returns and risks of available investment alternatives. Thus, to the extent that our advisor presents us with what we believe to be good investment opportunities that allow us to meet the REIT requirements under the Internal Revenue Code of 1986, as amended (the “Internal Revenue Code”), our portfolio composition may vary from what we initially expect. In fact, we may invest in whatever types of real estate or real estate-related assets we believe are in our best interests. However, we will attempt to construct a portfolio that produces stable and attractive returns by spreading risk across different real estate investments.
5
We acquired our first real estate property on September 29, 2011. As of December 31, 2016, our real estate portfolio was composed of 28 office properties and one mixed-use office/retail property encompassing an aggregate of 11.0 million rentable square feet and was collectively 94% occupied. In addition, we have entered into the Hardware Village Joint Venture to develop and subsequently operate Hardware Village, which is currently under construction.
For more information on our real estate investments, including tenant information, see Item 1, Part 2, “Properties.”
The following charts illustrate the geographic diversification of our real estate properties, excluding Hardware Village, based on total leased square feet and total annualized base rent as of December 31, 2016:
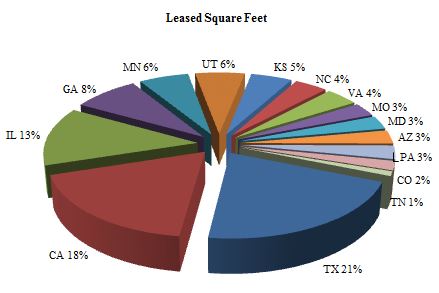
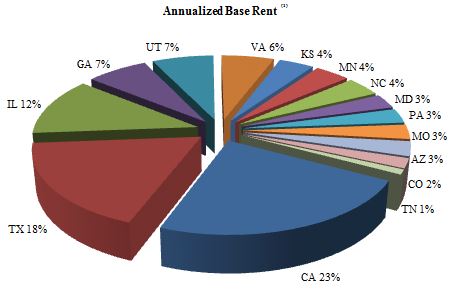
_____________________
(1) Annualized base rent represents annualized contractual base rental income as of December 31, 2016, adjusted to straight-line any contractual tenant concessions (including free rent), rent increases and rent decreases from the lease’s inception through the balance of the lease term.
6
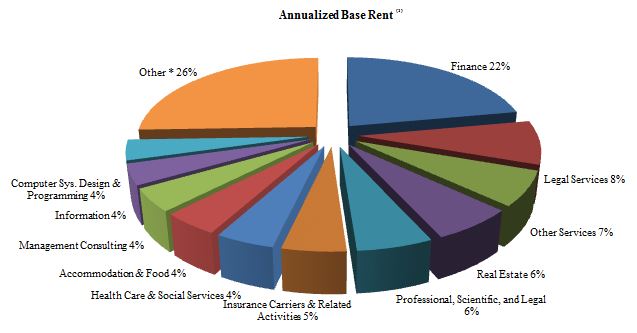
We have a stable tenant base and we have tried to diversify our tenant base in order to limit exposure to any one tenant or industry. Our top ten tenants leasing space in our real estate portfolio represented approximately 18.3% of our total annualized base rent as of December 31, 2016. The chart below illustrates the diversity of tenant industries in our real estate portfolio, excluding Hardware Village, based on total annualized base rent as of December 31, 2016:
_____________________
(1) Annualized base rent represents annualized contractual base rental income as of December 31, 2016, adjusted to straight-line any contractual tenant concessions (including free rent), rent increases and rent decreases from the lease’s inception through the balance of the lease term.
* “Other” includes any industry less than 4% of total.
Financing Objectives
We financed our real estate acquisitions to date with a combination of the proceeds received from our now-terminated initial public offering and debt. We may use proceeds from borrowings to finance acquisitions of new properties or assets or for originations of new loans; to pay for capital improvements, repairs or tenant build-outs to properties; to refinance existing indebtedness; to pay distributions; or to provide working capital. Careful use of debt will help us to achieve our diversification goals because we will have more funds available for investment. Our investment strategy is to utilize primarily secured and possibly unsecured debt to finance our investment portfolio. We may elect to secure financing subsequent to the acquisition date of future real estate properties and initially acquire investments without debt financing. To the extent that we do not finance our properties and other investments, our ability to acquire additional real estate investments will be restricted.
We expect to borrow funds at fixed and variable rates. As of December 31, 2016, we had debt obligations in the aggregate principal amount of $1.8 billion, with a weighted-average remaining term of 2.2 years. We have a total of $194.3 million of fixed rate notes payable and $1.6 billion of variable rate notes payable. The interest rates on $919.5 million of our variable rate notes payable are effectively fixed through interest rate swap agreements. The interest rate and weighted-average interest rate of our fixed rate debt and variable rate debt as of December 31, 2016 was 4.1% and 2.8%, respectively. The weighted-average interest rate represents the actual interest rate in effect as of December 31, 2016 (consisting of the contractual interest rate and the effect of interest rate swaps), using interest rate indices as of December 31, 2016, where applicable. In addition, we entered into eight interest rate swaps with an aggregate notional amount of $363.8 million, which will become effective at various times during 2017 through 2018. We also had an interest rate cap for a notional amount of $147.3 million that terminated on January 1, 2017. See Part II, Item 7, “Management’s Discussion and Analysis of Financial Condition and Results of Operations – Subsequent Events – Financing Subsequent to December 31, 2016.”
7
We have tried to spread the maturity dates of our debt to minimize maturity and refinance risk in our portfolio. In addition, a majority of our debt allows us to extend the maturity dates, subject to certain conditions contained in the applicable loan documents. Although we believe we will satisfy the conditions to extend the maturity of our debt obligations, we can give no assurance in this regard. The following table shows the current maturities, including principal amortization payments, of our debt obligations as of December 31, 2016 (in thousands):
2017 | $ | 298,405 | ||
2018 | 690,210 | |||
2019 | 257,210 | |||
2020 | 273,035 | |||
2021 | 93,956 | |||
Thereafter | 180,589 | |||
$ | 1,793,405 | |||
We expect that our debt financing and other liabilities will be between 35% and 65% of the cost of our tangible assets (before deducting depreciation and other non-cash reserves). We expect our debt financing related to the acquisition of core real estate properties to be between 45% and 65% of the aggregate cost of all such assets. We expect our debt financing related to the acquisition or origination of real estate-related investments to be between 0% and 65% of the aggregate cost of all such assets, depending upon the availability of such financings in the marketplace. There is no limitation on the amount we may borrow for the purchase of any single asset. We limit our total liabilities to 75% of the cost of our tangible assets (before deducting depreciation and other non-cash reserves) meaning that our borrowings and other liabilities may exceed our maximum target leverage of 65% of the cost of our tangible assets without violating these borrowing restrictions. We may exceed the 75% limit only if a majority of the conflicts committee approves each borrowing in excess of this limitation and we disclose such borrowings to our stockholders in our next quarterly report with an explanation from the conflicts committee of the justification for the excess borrowing. To the extent financing in excess of this limit is available on attractive terms, the conflicts committee may approve debt in excess of this limit. From time to time, our total liabilities could also be below 35% of the cost of our tangible assets due to the lack of availability of debt financing. As of December 31, 2016, our borrowings and other liabilities were approximately 55% of both the cost (before deducting depreciation and other noncash reserves) and book value (before deducting depreciation) of our tangible assets, respectively.
Market Outlook - Real Estate and Real Estate Finance Markets
The following discussion is based on management’s beliefs, observations and expectations with respect to the real estate and real estate finance markets.
Conditions in the global capital markets remain volatile as of the first quarter of 2017. Current economic data and financial market developments suggest that the global economy is improving, although at a slow and uneven pace. European economic growth has recently picked up, whereas the U.K. and China remain areas of concern. Against this backdrop, the central banks of the world’s major industrialized economies are beginning to back away from their strong monetary accommodation. Quantitative easing in Japan and Europe is slowing, but the liquidity generated from these programs continues to impact the global capital markets.
At a duration of 91 months (as of year-end 2016), the current business cycle, which commenced in June 2009, is the fourth longest in U.S. history, including the post-World War II cycle, which lasted 58 months. In December 2016 the U.S. Federal Reserve (the “FED”) increased interest rates for the second time since the 2008 - 2009 financial crisis. Expectations are for the rate increases to continue in the wake of ongoing economic growth and some acceleration in inflationary pressures, with the goal of the FED to normalize the level of interest rates. Little in the U.S. macroeconomic data suggests that the economy is growing too rapidly, the primary symptom of trouble ahead for a business cycle. Real gross domestic product (“GDP”) growth has averaged approximately 2% per year over the past two years, and job growth has averaged about 1.7%. Personal income growth has started to pick up and unemployment statistics indicate that labor force conditions are finally showing real improvements.
The U.S. commercial real estate market continues to benefit from inflows of foreign capital, particularly from China. With a backdrop of global political conflict, and stabilizing international economic conditions, the U.S. dollar has remained a safe haven currency. The volume of available capital that is seeking “core” properties has helped to push the pricing of some assets past prior peaks, making some markets look expensive. Reduced leverage ratios have shifted more risk toward the equity investor. Traditional sources of capital are favoring a “risk-off” approach, where investors’ appetite for risk falls, when valuing investments. Investors acquiring properties are extremely selective, with cap rate compression having spread into secondary markets over the last two years. Commercial real estate returns are increasingly being driven by property income (yield), as opposed to price appreciation through cap rate compression.
8
Lenders with long memories remain disciplined in their underwriting of investments. For balance sheet lenders, such as banks and insurance companies, underwriting standards for commercial real estate have been tightened. This has resulted in lower loan-to-value and higher debt coverage ratios. CMBS originations also have been limited as lenders are attempting to adjust to new securitization rules which require issuers to maintain an ongoing equity stake in pooled transactions. These trends have led to increased uncertainty in the level and cost of debt for commercial properties, and in turn has injected some volatility into commercial real estate markets.
A major factor contributing to the strength of the real estate cycle is the difficulty of securing construction financing. Lack of construction financing is effectively keeping an oversupply of commercial real estate, which is typical late in a real estate cycle, from emerging. Bank regulators and new risk-based capital guidelines have enforced discipline in lending, which has helped reduce new construction.
Impact on Our Real Estate Properties
The volatility in the global financial markets continues to cause a level of uncertainty in our outlook for the performance of the U.S. commercial real estate markets. Both the investing and leasing environments are highly competitive. While foreign capital continues to flow into U.S. real estate markets, the uncertainty regarding the political, regulatory and economic environments has introduced uncertainty into the markets. Possible future declines in rental rates, slower or potentially negative net absorption of leased space and expectations of future rental concessions, including free rent to renew tenants early, to retain tenants who are up for renewal or to attract new tenants, may result in decreases in cash flows. Historically low interest rates could help offset some of the impact of these potential decreases in operating cash flow for properties financed with variable rate mortgages; however, interest rates in the United States have started to increase. The FED increased interest rates in the fourth quarter of 2015 and again in December 2016. The real estate and finance markets anticipate further rate increases as long as the economy remains strong. If this trend continues, management will review our debt financing strategies to optimize the cost of our debt exposure.
Impact on Our Financing Activities
In light of the risks associated with potentially volatile operating cash flows from some of our real estate properties, and the possible increase in the cost of financing due to higher interest rates, we may have difficulty refinancing some of our debt obligations prior to or at maturity or we may not be able to refinance these obligations at terms as favorable as the terms of our existing indebtedness. Short-term interest rates in the United States have increased. Market conditions can change quickly, potentially negatively impacting the value of our investments.
As of December 31, 2016, we had debt obligations in the aggregate principal amount of $1.8 billion, with a weighted-average remaining term of 2.2 years. Our debt obligations consisted of $194.3 million of fixed rate notes payable and $1.6 billion of variable rate notes payable. As of December 31, 2016, the interest rates on $919.5 million of our variable rate notes payable are effectively fixed through interest rate swap agreements. In addition, we entered into eight interest rate swaps with an aggregate notional amount of $363.8 million, which will become effective at various times during 2017 through 2018. We also had an interest rate cap for a notional amount of $147.3 million that terminated on January 1, 2017. See Part II, Item 7, “Management’s Discussion and Analysis of Financial Condition and Results of Operations – Subsequent Events – Financing Subsequent to December 31, 2016.”
Economic Dependency
We are dependent on our advisor for certain services that are essential to us, including the identification, evaluation, negotiation, acquisition or origination and disposition of investments; management of the daily operations and leasing of our portfolio; and other general and administrative responsibilities. In the event that our advisor is unable to provide these services, we will be required to obtain such services from other sources.
Competitive Market Factors
The U.S. commercial real estate investment and leasing markets remain competitive. We face competition from various entities for investment opportunities, for prospective tenants and to retain our current tenants, including other REITs, pension funds, insurance companies, investment funds and companies, partnerships and developers. Many of these entities have substantially greater financial resources than we do and may be able to accept more risk than we can prudently manage, including risks with respect to the creditworthiness of a tenant or the geographic location of their investments. Competition from these entities may reduce the number of suitable investment opportunities offered to us or increase the bargaining power of property owners seeking to sell. Further, as a result of their greater resources, those entities may have more flexibility than we do in their ability to offer rental concessions to attract and retain tenants. This could put pressure on our ability to maintain or raise rents and could adversely affect our ability to attract or retain tenants. As a result, our financial condition, results of operations, cash flow, ability to satisfy our debt service obligations and ability to pay distributions to our stockholders may be adversely affected.
9
To the extent we acquire or originate additional real estate-related investments, the success of our portfolio of real estate-related investments will depend, in part, on our ability to acquire and originate investments with spreads over our borrowing cost. In acquiring and originating these investments, we will compete with other REITs that acquire or originate real estate loans, specialty finance companies, savings and loan associations, banks, mortgage bankers, insurance companies, mutual funds, institutional investors, investment banking firms, other lenders, governmental bodies and other entities, many of which have greater financial resources and lower costs of capital available to them than we do. In addition, there are numerous REITs with asset acquisition objectives similar to ours, and others may be organized in the future, which may increase competition for investments suitable for us. Competitive variables include market presence and visibility, size of loans offered and underwriting standards. To the extent that a competitor is willing to risk larger amounts of capital in a particular transaction or to employ more liberal underwriting standards when evaluating potential loans than we are, our acquisition and origination volume and profit margins for our real estate-related investment portfolio could be impacted. Our competitors may also be willing to accept lower returns on their investments and may succeed in buying the assets that we have targeted for acquisition. To the extent we are selling assets, we may also face competition from other entities that are selling assets. Competition from these entities may increase the supply of real estate investment opportunities or increase the bargaining power of real estate investors seeking to buy.
Although we believe that we are well-positioned to compete effectively in each facet of our business, there is enormous competition in our market sector and there can be no assurance that we will compete effectively or that we will not encounter increased competition in the future that could limit our ability to conduct our business effectively.
Compliance with Federal, State and Local Environmental Law
Under various federal, state and local environmental laws, ordinances and regulations, a current or previous real property owner or operator may be liable for the cost of removing or remediating hazardous or toxic substances on, under or in such property. These costs could be substantial. Such laws often impose liability whether or not the owner or operator knew of, or was responsible for, the presence of such hazardous or toxic substances. Environmental laws also may impose liens on property or restrictions on the manner in which property may be used or businesses may be operated, and these restrictions may require substantial expenditures or prevent us from entering into leases with prospective tenants that may be impacted by such laws. Environmental laws provide for sanctions for noncompliance and may be enforced by governmental agencies or, in certain circumstances, by private parties. Certain environmental laws and common law principles could be used to impose liability for the release of and exposure to hazardous substances, including asbestos-containing materials and lead-based paint. Third parties may seek recovery from real property owners or operators for personal injury or property damage associated with exposure to released hazardous substances and governments may seek recovery for natural resource damage. The costs of defending against claims of environmental liability, of complying with environmental regulatory requirements, of remediating any contaminated property, or of paying personal injury, property damage or natural resource damage claims could reduce our cash available for distribution to our stockholders. All of our real estate acquisitions are subject to Phase I environmental assessments prior to the time they are acquired.
Industry Segments
As of December 31, 2016, we aggregated our real estate investments into one reportable business segment. Prior to the reporting period commencing on January 1, 2014, we had identified two reportable business segments based on our investment types: real estate and real estate-related.
Employees
We have no paid employees. The employees of our advisor or its affiliates provide management, acquisition, disposition, advisory and certain administrative services for us.
Principal Executive Office
Our principal executive offices are located at 800 Newport Center Drive, Suite 700, Newport Beach, California 92660. Our telephone number, general facsimile number and website address are (949) 417-6500, (949) 417-6501 and www.kbsreitiii.com, respectively.
Available Information
Access to copies of our annual reports on Form 10-K, quarterly reports on Form 10-Q, current reports on Form 8-K, proxy statements and other filings with the SEC, including amendments to such filings, may be obtained free of charge from the following website, www.kbsreitiii.com, or through the SEC’s website, www.sec.gov. These filings are available promptly after we file them with, or furnish them to, the SEC.
10
ITEM 1A. | RISK FACTORS |
The following are some of the risks and uncertainties that could cause our actual results to differ materially from those presented in our forward-looking statements. The risks and uncertainties described below are not the only ones we face but do represent those risks and uncertainties that we believe are material to us. Additional risks and uncertainties not presently known to us or that we currently deem immaterial may also harm our business.
Risks Related to an Investment in Our Common Stock
Because no public trading market for our shares currently exists, it will be difficult for our stockholders to sell their shares and, if they are able to sell their shares, they will likely sell them at a substantial discount to the public offering price and the estimated value per share.
Our charter does not require our directors to seek stockholder approval to liquidate our assets and dissolve by a specified date, nor does our charter require our directors to list our shares for trading on a national securities exchange by a specified date. There is no public market for our shares and we have no plans at this time to list our shares on a national securities exchange. Until our shares are listed, if ever, our stockholders may not sell their shares unless the buyer meets the applicable suitability and minimum purchase standards. Any sale must comply with applicable state and federal securities laws. Our charter prohibits the ownership of more than 9.8% of our stock by any person, unless exempted by our board of directors, which may inhibit large investors from desiring to purchase our stockholders’ shares. Moreover, our share redemption program includes numerous restrictions that limit our stockholders’ ability to sell their shares to us, and our board of directors could amend, suspend or terminate our share redemption program upon 30 days’ notice to our stockholders, provided that we may increase or decrease funding available for the redemption of shares pursuant to our share redemption program upon ten business days’ notice to our stockholders. We describe the restrictions of our share redemption program in detail under Part II, Item 5, “Share Redemption Program.” Therefore, it will be difficult for our stockholders to sell their shares promptly or at all. If our stockholders are able to sell their shares, they will likely have to sell them at a substantial discount to their public offering price or the estimated value per share. It is also likely that our stockholders’ shares will not be accepted as the primary collateral for a loan. Investors should purchase shares in our dividend reinvestment plan only as a long-term investment and be prepared to hold them for an indefinite period of time because of the illiquid nature of our shares.
We face significant competition for tenants and, to the extent we acquire additional assets, real estate investment opportunities, which may limit our ability to achieve our investment objectives or pay distributions.
We depend upon the performance of our property managers in the selection of tenants and negotiation of leasing arrangements. The highly competitive U.S. commercial real estate industry has created increased pressure on real estate investors and their property managers to find new tenants and keep existing tenants. In order to do so, we have offered and may have to offer inducements, such as free rent and tenant improvements, to compete for attractive tenants. Our investors must rely entirely on the management abilities of our advisor, the property managers our advisor selects and the oversight of our board of directors. In the event we are unable to find new tenants and keep existing tenants, or if we are forced to offer significant inducements to such tenants, we may be unable or limited in our ability to pay distributions and we may not be able to meet our investment objectives.
In addition, to the extent we acquire additional assets, we face competition from various entities for real estate investment opportunities, including other REITs, pension funds, banks and insurance companies, investment funds and companies, partnerships and developers. Many of these entities have substantially greater financial resources than we do and may be able to accept more risk than we can prudently manage, including risks with respect to the creditworthiness of a tenant or the geographic location of their investments. Competition from these entities may reduce the number of suitable investment opportunities offered to us or increase the bargaining power of property owners seeking to sell. Additionally, disruptions and dislocations in the credit markets could impact the cost and availability of debt to finance real estate investments, which is a key component of our acquisition strategy. A downturn in the credit market and a potential lack of available debt could result in a further reduction of suitable investment opportunities and create a competitive advantage for other entities that have greater financial resources than we do. In addition, the number of entities and the amount of funds competing for suitable investments may increase. We can give no assurance that our advisor will be successful in obtaining additional suitable investments on financially attractive terms or that, if our advisor makes investments on our behalf, our objectives will be achieved. If we acquire investments at higher prices and/or by using less-than-ideal capital structures, our returns will be lower and the value of our assets may not appreciate or may decrease significantly below the amount we paid for such assets. If such events occur, our stockholders may experience a lower return on their investment.
11
Disruptions in the financial markets and uncertain economic conditions could adversely affect market rental rates and commercial real estate values and our ability to refinance or secure debt financing, service future debt obligations, or pay distributions to our stockholders.
We have relied on debt financing to finance our real estate properties and we may have difficulty refinancing some of our debt obligations prior to or at maturity or we may not be able to refinance these obligations at terms as favorable as the terms of our existing indebtedness. We also may be unable to obtain additional debt financing on attractive terms or at all. If we are not able to refinance our existing indebtedness on attractive terms at the various maturity dates, we may be forced to dispose of some of our assets. Market conditions can change quickly, which could negatively impact the value of our assets and may interfere with the implementation of our business strategy and/or force us to modify it.
Disruptions in the financial markets and uncertain economic conditions could adversely affect the values of our investments. Any disruption to the debt and capital markets could result in fewer buyers seeking to acquire commercial properties and possible increases in capitalization rates and lower property values. Furthermore, any decline in economic conditions could negatively impact commercial real estate fundamentals and result in lower occupancy, lower rental rates and declining values in our real estate portfolio, which could have the following negative effects on us:
• | the values of our real estate properties could decrease below the amounts paid for such properties; and/or |
• | revenues from our properties could decrease due to fewer tenants and/or lower rental rates, making it more difficult for us to pay distributions or meet our debt service obligations on debt financing. |
All of these factors could reduce our stockholders’ return and decrease the value of an investment in us.
Because of the concentration of a significant portion of our assets in three geographic areas and in core office properties, any adverse economic, real estate or business conditions in these geographic areas or in the office market could affect our operating results and our ability to pay distributions to our stockholders
As of March 8, 2017, a significant portion of our real estate properties was located in California, Texas and Illinois. As such, the geographic concentration of our portfolio makes us particularly susceptible to adverse economic developments in the California, Texas and Illinois real estate markets. In addition, the majority of our real estate properties consists of core office properties. Any adverse economic or real estate developments in these geographic markets, such as business layoffs or downsizing, industry slowdowns, relocations of businesses, changing demographics and other factors, or any decrease in demand for office space could adversely affect our operating results and our ability to pay distributions to our stockholders.
A significant percentage of our assets is invested in 500 West Madison and the value of our stockholders’ investment in us will fluctuate with the performance of this investment.
As of December 31, 2016, 500 West Madison represented approximately 12% of our total assets and represented approximately 12% of our total annualized base rent. Further, as a result of this acquisition, the geographic concentration of our portfolio makes us particularly susceptible to adverse economic developments in the Chicago real estate market. Any adverse economic or real estate developments in this market, such as business layoffs or downsizing, industry slowdowns, relocations of businesses, changing demographics and other factors, or any decrease in demand for office space resulting from the local business climate, could adversely affect our operating results and our ability to pay distributions to our stockholders.
We may not be able to operate our business successfully or generate sufficient revenue to make or sustain distributions to our stockholders.
As of March 8, 2017, we owned 29 real estate properties, had entered into the Hardware Village Joint Venture to develop and subsequently operate Hardware Village, which is currently under construction, and had entered into the Village Center Station II Joint Venture (defined below) to develop and subsequently operate Village Center Station II (defined below), which is currently under construction. We cannot assure our stockholders that we will be able to operate our business successfully or implement our operating policies and strategies. We can provide no assurance that our performance will replicate the past performance of other KBS-sponsored programs. Our investment returns could be substantially lower than the returns achieved by other KBS-sponsored programs. The results of our operations depend on several factors, including the availability of opportunities for the acquisition of additional assets, the level and volatility of interest rates, the availability of short and long-term financing, and conditions in the financial markets and economic conditions.
12
Because we depend upon our advisor and its affiliates to select and acquire our real estate investments and to conduct our operations, any adverse changes in the financial health of our advisor or its affiliates or our relationship with them could cause our operations to suffer.
We depend on our advisor to select and acquire our real estate investments and to manage our operations and our portfolio of assets. Our advisor depends upon the fees and other compensation that it receives from us, KBS Real Estate Investment Trust, Inc. (“KBS REIT I”), KBS Real Estate Investment Trust II, Inc. (“KBS REIT II”), KBS Strategic Opportunity REIT, Inc. (“KBS Strategic Opportunity REIT”), KBS Legacy Partners Apartment REIT, Inc. (“KBS Legacy Partners Apartment REIT”), KBS Strategic Opportunity REIT II, Inc. (“KBS Strategic Opportunity REIT II”), KBS Growth & Income REIT, Inc. (“KBS Growth & Income REIT”), and any future KBS-sponsored programs that it advises in connection with the purchase, management and sale of assets to conduct its operations. Any adverse changes to our relationship with, or the financial condition of, our advisor and its affiliates, could hinder their ability to successfully manage our operations and our portfolio of investments.
We have paid distributions in part from financings and expect that in the future we may not pay distributions solely from our cash flow from operating activities. To the extent that we pay distributions from sources other than our cash flow from operating activities, we will have less funds available for investment in properties and other assets and the overall return to our stockholders may be reduced.
Our organizational documents permit us to pay distributions from any source, including offering proceeds or borrowings (which may constitute a return of capital), and our charter does not limit the amount of funds we may use from any source to pay such distributions. We have paid distributions in part from financings (including with an advance from our advisor that we have repaid with debt financing), and from time to time during our operational stage, we expect that we may not pay distributions solely from our cash flow from operating activities, in which case distributions may be paid in whole or in part from debt financing. We may also fund such distributions with proceeds from the sale of assets or from the maturity, payoff or settlement of debt investments. If we fund distributions from borrowings, our interest expense and other financing costs, as well as the repayment of such borrowings, will reduce our earnings and cash flow from operating activities available for distribution in future periods. If we fund distributions from the sale of assets or the maturity, payoff or settlement of debt investments, this will affect our ability to generate cash flow from operating activities in future periods. To the extent that we pay distributions from sources other than our cash flow from operating activities, we will have fewer funds available with which to make real estate investments and the overall return to our stockholders may be reduced. In addition, to the extent distributions exceed cash flow from operating activities, a stockholder’s basis in our stock will be reduced and, to the extent distributions exceed a stockholder’s basis, the stockholder may recognize capital gain. There is no limit on the amount of distributions we may fund from sources other than from cash flow from operating activities.
For the year ended December 31, 2016, we paid aggregate distributions of $116.9 million, including $55.0 million of distributions paid in cash and $61.9 million of distributions reinvested through our dividend reinvestment plan. We funded our total distributions paid, which includes net cash distributions and dividends reinvested by stockholders, with $95.1 million (81%) of cash flow from operating activities, $3.2 million (3%) of cash flow from operating activities in excess of distributions paid during 2015 and $18.6 million (16%) of debt financing. For the year ended December 31, 2016, our cash flow from operating activities to distributions paid coverage ratio was 98% and our funds from operations to distributions paid coverage ratio was 139%. For more information, see Part II, Item 7, “Management’s Discussion and Analysis of Financial Condition and Results of Operations - Funds from Operations” and “Management’s Discussion and Analysis of Financial Condition and Results of Operations - Distributions” in this Annual Report.
13
The loss of or the inability to retain or obtain key real estate and debt finance professionals at our advisor could delay or hinder implementation of our investment strategies, which could limit our ability to pay distributions and decrease the value of an investment in our shares.
Our success depends to a significant degree upon the contributions of Peter M. Bren, Keith D. Hall, Peter McMillan III and Charles J. Schreiber, Jr., each of whom would be difficult to replace. Neither we nor our advisor or its affiliates have employment agreements with these individuals and they may not remain associated with us, our advisor or its affiliates. If any of these persons were to cease their association with us, our advisor or its affiliates, we may be unable to find suitable replacements and our operating results could suffer as a result. We do not intend to maintain key person life insurance on any person. We believe that our future success depends, in large part, upon our advisor’s and its affiliates’ ability to attract and retain highly skilled managerial, operational and marketing professionals. Competition for such professionals is intense, and our advisor and its affiliates may be unsuccessful in attracting and retaining such skilled professionals. Further, we have established strategic relationships with firms that have special expertise in certain services or detailed knowledge regarding real properties in certain geographic regions. Maintaining such relationships will be important for us to effectively compete with other investors for properties and tenants in such regions. We may be unsuccessful in maintaining such relationships. If we lose or are unable to obtain the services of highly skilled professionals or do not establish or maintain appropriate strategic relationships, our ability to implement our investment strategies could be delayed or hindered and the value of our stockholders’ investment in us could decline.
Our rights and the rights of our stockholders to recover claims against our independent directors are limited, which could reduce our stockholders’ and our recovery against our independent directors if they negligently cause us to incur losses.
Maryland law provides that a director has no liability in that capacity if he or she performs his or her duties in good faith, in a manner he or she reasonably believes to be in our best interests and with the care that an ordinarily prudent person in a like position would use under similar circumstances. Our charter provides that none of our independent directors shall be liable to us or our stockholders for monetary damages and that we will generally indemnify them for losses unless they are grossly negligent or engage in willful misconduct. As a result, our stockholders and we may have more limited rights against our independent directors than might otherwise exist under common law, which could reduce our stockholders’ and our recovery from these persons if they act in a negligent manner. In addition, we may be obligated to fund the defense costs incurred by our independent directors (as well as by our other directors, officers, employees (if we ever have employees) and agents) in some cases, which would decrease the cash otherwise available for distribution to our stockholders.
Because the current offering price in our dividend reinvestment plan offering exceeds our net tangible book value per share, investors in our dividend reinvestment plan offering will experience immediate dilution in the net tangible book value of their shares.
We are currently offering shares in our dividend reinvestment plan offering at $10.10 per share. This offering price is equal to 95% of the most recent estimated value per share of our common stock. On December 9, 2016, our board of directors approved an estimated value per share of our common stock of $10.63 based on the estimated value of our assets less the estimated value of our liabilities divided by the number of shares outstanding, all as of September 30, 2016. The valuation methodologies used to establish the estimated value per share were based upon a number of estimates and assumptions that may not be accurate or complete. Moreover, the current offering price under our dividend reinvestment plan is likely to differ from the price at which a stockholder could resell his or her shares because of the reasons discussed below under “ - Risks Related to Our Corporate Structure - The estimated value per share of our common stock may not reflect the value that stockholders will receive for their investment and does not take into account how developments subsequent to the valuation date related to individual assets, the financial or real estate markets or other events may have increased or decreased the value of our portfolio.” For a full description of the methodologies and assumptions used to value our assets and liabilities in connection with the calculation of the estimated value per share as of December 9, 2016, see Part II, Item 5, “Market for Registrant’s Common Equity, Related Stockholder Matters and Issuer Purchases of Equity Securities - Market Information.”
Because we are conducting an ongoing offering under our dividend reinvestment plan, we are providing information about our net tangible book value per share. Our net tangible book value per share is a rough approximation of value calculated as total book value of assets minus total book value of liabilities, divided by the total number of shares of common stock outstanding. Net tangible book value is used generally as a conservative measure of net worth that we do not believe reflects our estimated value per share. It is not intended to reflect the value of our assets upon an orderly liquidation of the company in accordance with our investment objectives. However, net tangible book value does reflect certain dilution in value of our common stock from the issue price as a result of (i) the substantial fees paid in connection with our now-terminated primary initial public offering, including selling commissions and marketing fees re-allowed by our dealer manager to participating broker-dealers, (ii) the fees and expenses paid to our advisor and its affiliates in connection with the selection, acquisition, management and sale of our investments, (iii) general and administrative expenses and (iv) accumulated depreciation and amortization of real estate investments. As of December 31, 2016, our net tangible book value per share was $6.94.
14
We face risks associated with security breaches through cyber-attacks, cyber intrusions or otherwise, as well as other significant disruptions of our information technology (IT) networks and related systems.
We face risks associated with security breaches, whether through cyber-attacks or cyber intrusions over the Internet, malware, computer viruses, attachments to e-mails, persons inside our organization or persons with access to systems inside our organization, and other significant disruptions of our IT networks and related systems. The risk of a security breach or disruption, particularly through cyber-attack or cyber intrusion, including by computer hackers, foreign governments and cyber terrorists, has generally increased as the number, intensity and sophistication of attempted attacks and intrusions from around the world have increased. Our IT networks and related systems are essential to the operation of our business and our ability to perform day-to-day operations. Although we make efforts to maintain the security and integrity of these types of IT networks and related systems, and we have implemented various measures to manage the risk of a security breach or disruption, there can be no assurance that our security efforts and measures will be effective or that attempted security breaches or disruptions would not be successful or damaging. Even the most well protected information, networks, systems and facilities remain potentially vulnerable because the techniques used in such attempted security breaches evolve and generally are not recognized until launched against a target, and in some cases are designed not to be detected and, in fact, may not be detected. Accordingly, we may be unable to anticipate these techniques or to implement adequate security barriers or other preventative measures, and thus it is impossible for us to entirely mitigate this risk.
A security breach or other significant disruption involving our IT networks and related systems could:
• | disrupt the proper functioning of our networks and systems and therefore our operations; |
• | result in misstated financial reports, violations of loan covenants and/or missed reporting deadlines; |
• | result in our inability to properly monitor our compliance with the rules and regulations regarding our qualification as a REIT; |
• | result in the unauthorized access to, and destruction, loss, theft, misappropriation or release of, proprietary, confidential, sensitive or otherwise valuable information of ours or others, which others could use to compete against us or which could expose us to damage claims by third-parties for disruptive, destructive or otherwise harmful purposes and outcomes; |
• | require significant management attention and resources to remedy any damages that result; |
• | subject us to claims for breach of contract, damages, credits, penalties or termination of leases or other agreements; or |
• | damage our reputation among our stockholders. |
Any or all of the foregoing could have a material adverse effect on our results of operations, financial condition and cash flows.
Risks Related to Conflicts of Interest
Our advisor and its affiliates, including all of our executive officers and our affiliated directors and other key real estate and debt finance professionals, face conflicts of interest caused by their compensation arrangements with us and with other KBS-sponsored programs, which could result in actions that are not in the long-term best interests of our stockholders.
All of our executive officers and our affiliated directors and other key real estate and debt finance professionals are also officers, directors, managers, key professionals and/or holders of a direct or indirect controlling interest in our advisor, our dealer manager and/or other KBS-affiliated entities. Our advisor and its affiliates receive substantial fees from us. These fees could influence our advisor’s advice to us as well as the judgment of its affiliates. Among other matters, these compensation arrangements could affect their judgment with respect to:
• | the continuation, renewal or enforcement of our agreements with our advisor and its affiliates, including the advisory agreement; |
• | public offerings of equity by us, which would entitle our dealer manager to dealer manager fees and would likely entitle our advisor to additional acquisition and origination fees and asset management fees; |
• | sales of real estate investments, which entitle our advisor to disposition fees and possible subordinated incentive fees; |
• | acquisitions of real estate investments, which entitle our advisor to acquisition or origination fees based on the cost of the investment and asset management fees based on the cost of the investment, and not based on the quality of the investment or the quality of the services rendered to us, which may influence our advisor to recommend riskier transactions to us and/or transactions that are not in our best interest and, in the case of acquisitions of investments from other KBS-sponsored programs, which might entitle affiliates of our advisor to disposition fees and possible subordinated incentive fees in connection with its services for the seller; |
• | borrowings to acquire real estate investments, which borrowings will increase the acquisition and origination fees and asset-management fees payable to our advisor; |
15
• | whether and when we seek to list our shares of common stock on a national securities exchange, which listing (i) may make it more likely for us to become self-managed or internalize our management or (ii) could entitle our advisor to a subordinated incentive listing fee, and which could also adversely affect the sales efforts for other KBS-sponsored programs, depending on the price at which our shares trade; and |
• | whether and when we seek to sell the company or its assets, which sale could entitle our advisor to a subordinated incentive fee and terminate the asset management fee. |
Our advisor and its affiliates face conflicts of interest relating to the acquisition and origination of assets and leasing of properties due to their relationship with other KBS-sponsored programs and KBS-advised investors, which could result in decisions that are not in our best interest or the best interests of our stockholders.
We rely on our sponsors and other key real estate and debt finance professionals at our advisor, including Messrs. Bren, Hall, McMillan and Schreiber, to identify suitable investment opportunities for us. KBS REIT I, KBS REIT II, KBS Legacy Partners Apartment REIT, KBS Strategic Opportunity REIT, KBS Strategic Opportunity REIT II and KBS Growth & Income REIT are also advised by KBS Capital Advisors and rely on our sponsors and many of the same real estate and debt finance professionals as will future KBS-sponsored programs advised by our advisor. Messrs. Bren and Schreiber and several of the other key real estate professionals at KBS Capital Advisors are also the key real estate professionals at KBS Realty Advisors and its affiliates, the advisors to the private KBS-sponsored programs and the investment advisors to KBS-advised investors. As such, KBS-sponsored programs that have funds available for investment and KBS-advised investors that have funds available for investment rely on many of the same real estate and debt finance professionals, as will future KBS-sponsored programs and KBS-advised investors. Many investment opportunities that are suitable for us may also be suitable for other KBS-sponsored programs and KBS-advised investors. When these real estate and debt finance professionals direct an investment opportunity to any KBS-sponsored program or KBS-advised investor, they, in their sole discretion, will offer the opportunity to the program or investor for which the investment opportunity is most suitable based on the investment objectives, portfolio and criteria of each program or investor. For so long as we are externally advised, our charter provides that it shall not be a proper purpose of the company for us to make any significant investment unless our advisor has recommended the investment to us. Thus, the real estate and debt finance professionals of our advisor could direct attractive investment opportunities to other KBS-sponsored programs or KBS-advised investors. Such events could result in us investing in properties that provide less attractive returns, which would reduce the level of distributions we may be able to pay our stockholders.
We and other KBS-sponsored programs and KBS-advised investors also rely on these real estate professionals to supervise the property management and leasing of properties. If the KBS team of real estate professionals directs creditworthy prospective tenants to properties owned by another KBS-sponsored program or KBS-advised investor when it could direct such tenants to our properties, our tenant base may have more inherent risk and our properties’ occupancy may be lower than might otherwise be the case.
Further, existing and future KBS-sponsored programs and KBS-advised investors and Messrs. Bren, Hall, McMillan and Schreiber generally are not and will not be prohibited from engaging, directly or indirectly, in any business or from possessing interests in any other business venture or ventures, including businesses and ventures involved in the acquisition, origination, development, ownership, leasing or sale of real estate-related investments.
16
Our sponsors, our officers, our advisor and the real estate, debt finance, management and accounting professionals assembled by our advisor face competing demands on their time and this may cause our operations and our stockholders’ investment in us to suffer.
We rely on our sponsors, our officers, our advisor and the real estate, debt finance, management and accounting professionals that our advisor retains, including Messrs. Bren, Hall, McMillan and Schreiber and Jeffrey K. Waldvogel and Stacie K. Yamane, to provide services to us for the day-to-day operation of our business. KBS REIT I, KBS REIT II, KBS Strategic Opportunity REIT, KBS Legacy Partners Apartment REIT, KBS Strategic Opportunity REIT II and KBS Growth & Income REIT are also advised by KBS Capital Advisors and rely on our sponsors and many of the same real estate, debt finance, management and accounting professionals, as will future KBS-sponsored programs and KBS-advised investors. Further, our officers and affiliated directors are also officers and/or affiliated directors of some or all of the other public KBS-sponsored programs. Messrs. Bren, Hall, Schreiber and Waldvogel and Ms. Yamane are also executive officers of KBS REIT I, KBS REIT II and KBS Growth & Income REIT and Mr. McMillan is an executive officer of KBS REIT I and KBS REIT II. Messrs. Hall, McMillan and Waldvogel and Ms. Yamane are executive officers of KBS Strategic Opportunity REIT and KBS Strategic Opportunity REIT II, and Messrs. Bren, McMillan and Waldvogel and Ms. Yamane are executive officers of KBS Legacy Partners Apartment REIT. Messrs. Bren and Schreiber and Ms. Yamane are executive officers of KBS Realty Advisors and its affiliates, the advisors of the private KBS-sponsored programs and the KBS-advised investors. In addition, KBS Real Estate Investment Trust II, KBS Legacy Partners Apartment REIT and KBS Strategic Opportunity REIT have announced that they are exploring strategic alternatives, and KBS REIT I has announced the passage by its stockholders of a plan of complete liquidation and dissolution of KBS REIT I, the pursuit of each of which would create further demands on the time of our advisor’s real estate, debt finance, management and accounting professionals.
As a result of their interests in other KBS-sponsored programs, their obligations to KBS-advised investors and the fact that they engage in and will continue to engage in other business activities on behalf of themselves and others, Messrs. Bren, Hall, McMillan, Schreiber and Waldvogel and Ms. Yamane face conflicts of interest in allocating their time among us, KBS REIT I, KBS REIT II, KBS Strategic Opportunity REIT, KBS Legacy Partners Apartment REIT, KBS Strategic Opportunity REIT II, KBS Growth & Income REIT, KBS Capital Advisors, other KBS-sponsored programs and other KBS-advised investors, as well as other business activities in which they are involved. In addition, KBS Capital Advisors and KBS Realty Advisors and their affiliates share many of the same key real estate, management and accounting professionals. During times of intense activity in other programs and ventures, these individuals may devote less time and fewer resources to our business than are necessary or appropriate to manage our business. Furthermore, some or all of these individuals may become employees of another KBS-sponsored program in an internalization transaction or, if we internalize our advisor, may not become our employees as a result of their relationship with other KBS-sponsored programs. If these events occur, the returns on our investments, and the value of our stockholders’ investment in us, may decline.
All of our executive officers, our affiliated directors and the key real estate and debt finance professionals assembled by our advisor face conflicts of interest related to their positions and/or interests in our advisor and its affiliates, including our dealer manager, which could hinder our ability to implement our business strategy and to generate returns to our stockholders.
All of our executive officers, our affiliated directors and the key real estate and debt finance professionals assembled by our advisor are also executive officers, directors, managers, key professionals and/or holders of a direct or indirect controlling interest in our advisor, our dealer manager and/or other KBS-affiliated entities. Through KBS-affiliated entities, some of these persons also serve as the investment advisors to KBS-advised investors and, through KBS Capital Advisors and KBS Realty Advisors, these persons serve as the advisor to KBS REIT I, KBS REIT II, KBS Strategic Opportunity REIT, KBS Legacy Partners Apartment REIT, KBS Strategic Opportunity REIT II, KBS Growth & Income REIT and other KBS-sponsored programs. As a result, they owe fiduciary duties to each of these entities, their stockholders, members and limited partners and these investors, which fiduciary duties may from time to time conflict with the fiduciary duties that they owe to us and our stockholders. Their loyalties to these other entities and investors could result in action or inaction that is detrimental to our business, which could harm the implementation of our business strategy and our investment and leasing opportunities. Further, Messrs. Bren, Hall, McMillan and Schreiber and existing and future KBS-sponsored programs and KBS-advised investors generally are not and will not be prohibited from engaging, directly or indirectly, in any business or from possessing interests in any other business venture or ventures, including businesses and ventures involved in the acquisition, development, ownership, leasing or sale of real estate investments. If we do not successfully implement our business strategy, we may be unable to generate the cash needed to pay distributions to our stockholders and to maintain or increase the value of our assets.
17
Our board of directors’ loyalties to KBS REIT I, KBS REIT II, KBS Strategic Opportunity REIT, KBS Strategic Opportunity REIT II, KBS Growth & Income REIT and possibly to future KBS-sponsored programs could influence its judgment, resulting in actions that may not be in our stockholders’ best interest or that result in a disproportionate benefit to another KBS-sponsored program at our expense.
All of our directors are also directors of KBS REIT I and KBS REIT II. One of our affiliated directors is also an affiliated director of KBS Growth & Income REIT and one of our affiliated directors is also an affiliated director of KBS Strategic Opportunity REIT and KBS Strategic Opportunity REIT II. The loyalties of our directors serving on the boards of directors of KBS REIT I, KBS REIT II, KBS Strategic Opportunity REIT, KBS Strategic Opportunity REIT II and KBS Growth & Income REIT, or possibly on the boards of directors of future KBS-sponsored programs, may influence the judgment of our board of directors when considering issues for us that also may affect other KBS-sponsored programs, such as the following:
• | The conflicts committee of our board of directors must evaluate the performance of our advisor with respect to whether our advisor is presenting to us our fair share of investment opportunities. If our advisor is not presenting a sufficient number of investment opportunities to us because it is presenting many opportunities to other KBS-sponsored programs or if our advisor is giving preferential treatment to other KBS-sponsored programs in this regard, our conflicts committee may not be well-suited to enforce our rights under the terms of the advisory agreement or to seek a new advisor. |
• | We could enter into transactions with other KBS-sponsored programs, such as property sales, acquisitions or financing arrangements. Such transactions might entitle our advisor or its affiliates to fees and other compensation from both parties to the transaction. For example, acquisitions from other KBS-sponsored programs might entitle our advisor or its affiliates to disposition fees and possible subordinated incentive fees in connection with its services for the seller in addition to acquisition or origination fees and other fees that we might pay to our advisor in connection with such transaction. Similarly, property sales to other KBS-sponsored programs might entitle our advisor or its affiliates to acquisition or origination fees in connection with its services to the purchaser in addition to disposition and other fees that we might pay to our advisor in connection with such transaction. Decisions of our board or the conflicts committee regarding the terms of those transactions may be influenced by our board’s or the conflicts committee’s loyalties to such other KBS-sponsored programs. |
• | A decision of our board or the conflicts committee regarding the timing of a debt or equity offering could be influenced by concerns that the offering would compete with offerings of other KBS-sponsored programs. |
• | A decision of our board or the conflicts committee regarding the timing of property sales could be influenced by concerns that the sales would compete with those of other KBS-sponsored programs. |
• | A decision of our board or the conflicts committee regarding whether and when we seek to list our common stock on a national securities exchange could be influenced by concerns that such listing could adversely affect the sales efforts of other KBS-sponsored programs, depending on the price at which our shares trade. |
Because our independent directors are also independent directors of KBS REIT I and KBS REIT II, they receive compensation for service on the boards of KBS REIT I and KBS REIT II. Like us, KBS REIT I and KBS REIT II each pays each independent director an annual retainer of $40,000 as well as compensation for attending meetings as follows: (i) $2,500 for each board meeting attended, (ii) $2,500 for each audit or conflicts committee meeting attended (except that the committee chairman is paid $3,000 for each audit or conflicts committee meeting attended), (iii) $2,000 for each teleconference board meeting attended, and (iv) $2,000 for each teleconference audit or conflicts committee meeting attended (except that the committee chairman is paid $3,000 for each teleconference audit or conflicts committee meeting attended). In addition, KBS REIT I and KBS REIT II also pays each independent director compensation for attending special committee meetings as follows: (i) $2,000 for each special committee meeting attended (except that the committee chairman is paid $3,000 for each special committee meeting attended), and (ii) $2,000 for each special teleconference committee meeting attended (except that the committee chairman is paid $3,000 for each special teleconference committee meeting attended). In addition, like us, KBS REIT I and KBS REIT II each reimburses directors for reasonable out-of-pocket expenses incurred in connection with attendance at meetings of their boards of directors or committee meetings.
18
Risks Related to Our Corporate Structure
Our charter limits the number of shares a person may own and permits our board of directors to issue stock with terms that may subordinate the rights of our common stockholders or discourage a third party from acquiring us in a manner that could result in a premium price to our stockholders.
Our charter, with certain exceptions, authorizes our directors to take such actions as are necessary and desirable to preserve our qualification as a REIT. To help us comply with the REIT ownership requirements of the Internal Revenue Code, our charter prohibits a person from directly or constructively owning more than 9.8% of our outstanding shares, unless exempted by our board of directors. In addition, our board of directors may classify or reclassify any unissued common stock or preferred stock and establish the preferences, conversion or other rights, voting powers, restrictions, limitations as to dividends and other distributions, qualifications and terms or conditions of redemption of any such stock. Thus, our board of directors could authorize the issuance of preferred stock with priority as to distributions and amounts payable upon liquidation over the rights of the holders of our common stock. These charter provisions may have the effect of delaying, deferring or preventing a change in control of us, including an extraordinary transaction (such as a merger, tender offer or sale of all or substantially all of our assets) that might provide a premium price to holders of our common stock.
Our stockholders’ investment return may be reduced if we are required to register as an investment company under the Investment Company Act; if we or our subsidiaries become an unregistered investment company, we could not continue our business.
Neither we nor any of our subsidiaries intend to register as an investment company under the Investment Company Act. If we or our subsidiaries were obligated to register as investment companies, we would have to comply with a variety of substantive requirements under the Investment Company Act that impose, among other things:
• | limitations on capital structure; |
• | restrictions on specified investments; |
• | prohibitions on transactions with affiliates; and |
• | compliance with reporting, record keeping, voting, proxy disclosure and other rules and regulations that would significantly increase our operating expenses. |
Under the relevant provisions of Section 3(a)(1) of the Investment Company Act, an investment company is any issuer that:
• | pursuant to Section 3(a)(1)(A), is or holds itself out as being engaged primarily, or proposes to engage primarily, in the business of investing, reinvesting or trading in securities (the “primarily engaged test”); or |
• | pursuant to Section 3(a)(1)(C), is engaged or proposes to engage in the business of investing, reinvesting, owning, holding or trading in securities and owns or proposes to acquire “investment securities” having a value exceeding 40% of the value of such issuer’s total assets (exclusive of U.S. government securities and cash items) on an unconsolidated basis (the “40% test”). “Investment securities” excludes U.S. government securities and securities of majority-owned subsidiaries that are not themselves investment companies and are not relying on the exception from the definition of investment company under Section 3(c)(1) or Section 3(c)(7) (relating to private investment companies). |
We believe that neither we nor our Operating Partnership are required to register as an investment company based on the following analyses. With respect to the 40% test, most of the entities through which we and our Operating Partnership own our assets are majority-owned subsidiaries that will not themselves be investment companies and will not be relying on the exceptions from the definition of investment company under Section 3(c)(1) or Section 3(c)(7).
With respect to the primarily engaged test, we and our Operating Partnership are holding companies and do not intend to invest or trade in securities ourselves. Rather, through the majority-owned subsidiaries of our Operating Partnership, we and our Operating Partnership are primarily engaged in the non-investment company businesses of these subsidiaries, namely the business of purchasing or otherwise acquiring real estate and real estate-related assets.
19
If any of the subsidiaries of our Operating Partnership fail to meet the 40% test, we believe they will usually, if not always, be able to rely on Section 3(c)(5)(C) of the Investment Company Act for an exception from the definition of an investment company. (Otherwise, they should be able to rely on the exceptions for private investment companies pursuant to Section 3(c)(1) and Section 3(c)(7) of the Investment Company Act.) As reflected in no-action letters, the SEC staff’s position on Section 3(c)(5)(C) generally requires that an issuer maintain at least 55% of its assets in “mortgages and other liens on and interests in real estate,” or qualifying assets; at least 80% of its assets in qualifying assets plus real estate-related assets; and no more than 20% of the value of its assets in other than qualifying assets and real estate-related assets, which we refer to as miscellaneous assets. To constitute a qualifying asset under this 55% requirement, a real estate interest must meet various criteria based on no-action letters. We expect that any of the subsidiaries of our Operating Partnership relying on Section 3(c)(5)(C) will invest at least 55% of its assets in qualifying assets, and approximately an additional 25% of its assets in other types of real estate-related assets. If any subsidiary relies on Section 3(c)(5)(C), we expect to rely on guidance published by the SEC staff or on our analyses of guidance published with respect to types of assets to determine which assets are qualifying real estate assets and real estate-related assets.
To maintain compliance with the Investment Company Act, our subsidiaries may be unable to sell assets we would otherwise want them to sell and may need to sell assets we would otherwise wish them to retain. In addition, our subsidiaries may have to acquire additional assets that they might not otherwise have acquired or may have to forego opportunities to make investments that we would otherwise want them to make and would be important to our investment strategy. Moreover, the SEC or its staff may issue interpretations with respect to various types of assets that are contrary to our views and current SEC staff interpretations are subject to change, which increases the risk of non-compliance and the risk that we may be forced to make adverse changes to our portfolio. If we were required to register as an investment company but failed to do so, we would be prohibited from engaging in our business and criminal and civil actions could be brought against us. In addition, our contracts would be unenforceable unless a court required enforcement and a court could appoint a receiver to take control of us and liquidate our business assets.
Our stockholders will have limited control over changes in our policies and operations, which increases the uncertainty and risks our stockholders face.
Our board of directors determines our major policies, including our policies regarding targeted investment allocation, financing, growth, debt capitalization, REIT qualification and distributions. Our board of directors may amend or revise these and other policies without a vote of the stockholders. Under Maryland General Corporation Law and our charter, our stockholders have a right to vote only on limited matters. Our board’s broad discretion in setting policies and our stockholders’ inability to exert control over those policies increases the uncertainty and risks our stockholders face.
Our stockholders may not be able to sell their shares under our share redemption program and, if our stockholders are able to sell their shares under the program, they may not be able to recover the amount of their investment in our shares or an amount equal to the estimated value per share of our common stock.
Our share redemption program includes numerous restrictions that severely limit our stockholders’ ability to sell their shares should they require liquidity and will limit our stockholders’ ability to recover the value they invested in our common stock or an amount equal to the estimated value per share of our common stock. Our stockholders must hold their shares for at least one year in order to participate in our share redemption program, except in connection with a stockholder’s death, “qualifying disability” or “determination of incompetence” (each as defined in the share redemption program, and together with redemptions sought in connection with a stockholder’s death, “Special Redemptions”). We limit the number of shares redeemed pursuant to our share redemption program as follows: (i) during any calendar year, we may redeem no more than 5% of the weighted‑average number of shares outstanding during the prior calendar year and (ii) during each calendar year, redemptions will be limited to the amount of net proceeds from the sale of shares under our dividend reinvestment plan during the prior calendar year; however, we may increase or decrease the funding available for the redemption of shares upon ten business days’ notice to our stockholders. Further, we have no obligation to redeem shares if the redemption would violate the restrictions on distributions under Maryland law, which prohibits distributions that would cause a corporation to fail to meet statutory tests of solvency. These limits may prevent us from accommodating all redemption requests made in any year.
20
Pursuant to our share redemption program, unless our shares are being redeemed in connection with a Special Redemption, the redemption price for shares eligible for redemption will be calculated based upon the updated estimated value per share. On December 9, 2016, our board of directors approved an estimated value per share of our common stock of $10.63 based on the estimated value of our assets less the estimated value of our liabilities divided by the number of shares outstanding, all as of September 30, 2016. In accordance with our share redemption program, redemptions made in connection with Special Redemptions are made at a price per share equal to the most recent estimated value per share of our common stock as of the applicable redemption date. The price at which we will redeem all other shares eligible for redemption is as follows:
• | For those shares held by the redeeming stockholder for at least one year, 92.5% of our most recent estimated value per share as of the applicable redemption date; |
• | For those shares held by the redeeming stockholder for at least two years, 95.0% of our most recent estimated value per share as of the applicable redemption date; |
• | For those shares held by the redeeming stockholder for at least three years, 97.5% of our most recent estimated value per share as of the applicable redemption date; and |
• | For those shares held by the redeeming stockholder for at least four years, 100% of our most recent estimated value per share as of the applicable redemption date. |
We currently expect to announce an updated estimated value per share in December 2017.
In March 2009, in order to preserve capital and value for all stockholders during the 2008-2009 recession, KBS REIT I amended its share redemption program to limit redemptions (other than Special Redemptions) during any calendar year to the amount of the net proceeds from the sale of shares under its dividend reinvestment plan from the prior calendar year less amounts KBS REIT I deemed necessary from such proceeds to fund its current and future funding obligations and needs. Pursuant to this limitation, KBS REIT I suspended ordinary redemptions for the remainder of 2009 and from 2010 through March 2012. KBS REIT I provided notice of this amendment in its Annual Report on Form 10-K filed on March 27, 2009, and the amendment was effective upon 30 days’ notice. The amendment became effective before the April 30, 2009 redemption date. As a result, investors did not have a final opportunity to submit redemptions. In March 2012, KBS REIT I amended and restated its share redemption program to provide only for Special Redemptions. Special Redemptions are limited to an annual amount determined by KBS REIT I’s board of directors which may be reviewed and adjusted from time to time during the year.
On January 24, 2014, in consideration of the cash requirements necessary to effectively manage KBS Legacy Partners Apartment REIT’s assets, KBS Legacy Partners Apartment REIT amended and restated its share redemption program to limit redemptions to $2.0 million of shares in the aggregate during any calendar year. Additionally, during any calendar year, once KBS Legacy Partners Apartment REIT has redeemed $1.5 million of shares under its share redemption program, including special redemptions, the remaining $0.5 million of the $2.0 million annual limit shall be reserved exclusively for special redemptions. KBS Legacy Partners Apartment REIT provided notice of this amendment and restatement of its share redemption program in its Current Report on Form 8-K filed on January 28, 2014 and its amended and restated share redemption program became effective for redemptions under the program on or after February 27, 2014. Because of these limitations on the dollar value of shares that may be redeemed under its share redemption program, KBS Legacy Partners Apartment REIT exhausted funds available for all redemptions for 2014 in August 2014. The $2.0 million annual limitation was reset beginning January 1, 2015 and the outstanding unfulfilled redemption requests as of December 31, 2014 were fulfilled in January 2015. Because of limitation on the dollar value of shares that may be redeemed under its share redemption program described above, KBS Legacy Partners Apartment REIT exhausted funds available for all redemptions for the remainder of 2015 in March 2015. The $2.0 million annual limitation was reset beginning January 1, 2016 and $1.0 million of the outstanding unfulfilled redemption requests as of December 31, 2015, representing 103,808 shares, were fulfilled in January 2016. In January 2016, KBS Legacy Partners Apartment REIT exhausted the $1.5 million of funds available for all redemptions for 2016 and in August 2016, KBS Legacy Partners Apartment REIT exhausted the $0.5 million of funds available for special redemptions for the remainder of 2016. As of December 31, 2016, KBS Legacy Partners Apartment REIT had $1.4 million of outstanding and unfulfilled ordinary redemption requests and $0.3 million of outstanding and unfulfilled special redemption requests. The annual limitation was reset on January 1, 2017, and KBS Legacy Partners Apartment REIT had an aggregate of $2.0 million of funds available for all redemptions, subject to the limitations in the share redemption program, including the requirement that the first $1.5 million of funds is available for all redemptions and the last $0.5 million is available solely for special redemptions. KBS Legacy Partners Apartment REIT exhausted $1.5 million of funds available for all redemptions for 2017 in January 2017 and an aggregate of $0.3 million of funds available for special redemptions for 2017 in January and February 2017. As such, KBS Legacy Partners Apartment REIT will only be able to process $0.2 million of redemption requests related to special redemptions for the remainder of 2017.
21
On May 15, 2014, KBS REIT II amended and restated its share redemption program to provide only for special redemptions. Special redemptions are limited to an annual amount determined by KBS REIT II’s board of directors which may be reviewed and adjusted from time to time during the year. KBS REIT II provided notice of this amendment and restatement of its share redemption program in its Current Report on Form 8-K filed on May 19, 2014 and its amended and restated share redemption program became effective for redemptions under the program on June 18, 2014.
During the year ended December 31, 2016, KBS Strategic Opportunity REIT’s redemptions were limited to $3.0 million of shares in a given quarter (excluding shares redeemed in connection with a stockholder’s death, “qualifying disability” or “determination of incompetence”). To the extent that KBS Strategic Opportunity REIT redeemed less than $3.0 million of shares (excluding shares redeemed in connection with a stockholder’s death, “qualifying disability” or “determination of incompetence”) in a given fiscal quarter, any remaining excess capacity to redeem shares in such fiscal quarter was added to the capacity to otherwise redeem shares (excluding shares redeemed in connection with a stockholder’s death, “qualifying disability” or “determination of incompetence”) during succeeding fiscal quarters. In December 2016, the amount of redemption requests in connection with a stockholder’s death, “qualifying disability or “determination of incompetence” was less than the amount of the $1.0 million reserved for such redemptions under the share redemption program, therefore the excess funds were used to redeem shares not requested in connection with a stockholder’s death, “qualifying disability or “determination of incompetence” during such month. In 2017, KBS Strategic Opportunity REIT may not redeem more than $3.0 million of shares in a given quarter (excluding shares redeemed in connection with a stockholder’s death, “qualifying disability” or “determination of incompetence”). To the extent that KBS Strategic Opportunity REIT redeems less than $3.0 million of shares (excluding shares redeemed in connection with a stockholder’s death, “qualifying disability” or “determination of incompetence”) in a given fiscal quarter, any remaining excess capacity to redeem shares in such fiscal quarter will be added to our capacity to otherwise redeem shares (excluding shares redeemed in connection with a stockholder’s death, “qualifying disability” or “determination of incompetence”) during succeeding fiscal quarters. The last $1.0 million of net proceeds from the dividend reinvestment plan during 2016 is reserved exclusively for shares redeemed in connection with a stockholder’s death, “qualifying disability,” or “determination of incompetence” with any excess funds being available to redeem shares not requested in connection with a stockholder’s death, “qualifying disability or “determination of incompetence” on the December 2017 redemption date. Based on the amount of net proceeds raised from the sale of shares under the dividend reinvestment plan during 2016, KBS Strategic Opportunity REIT has $12.6 million available for redemptions during 2017, subject to the limitations described above. KBS Strategic Opportunity REIT had $14.3 million of outstanding unfulfilled redemption requests as of December 31, 2016.
Our board may amend, suspend or terminate our share redemption program upon 30 days’ notice to stockholders, provided that we may increase or decrease the funding available for the redemption of shares pursuant to our share redemption program upon ten business days’ notice to our stockholder. See Part II, Item 5, “Share Redemption Program” for more information about the program.
The estimated value per share of our common stock may not reflect the value that stockholders will receive for their investment and does not take into account how developments subsequent to the valuation date related to individual assets, the financial or real estate markets or other events may have increased or decreased the value of our portfolio.
On December 9, 2016, our board of directors approved an estimated value per share of our common stock of $10.63 based on the estimated value of our assets less the estimated value of our liabilities, or net asset value, divided by the number of shares outstanding, all as of September 30, 2016. We did not make any other adjustments to the estimated value per share subsequent to September 30, 2016, including any adjustments relating to the following, among others: (i) the issuance of common stock and the payment of related offering costs related to our dividend reinvestment plan offering; (ii) net operating income earned and distributions declared; and (iii) the redemption of shares. We provided this estimated value per share to assist broker-dealers that participated in our now-terminated initial public offering in meeting their customer account statement reporting obligations under National Association of Securities Dealers Conduct Rule 2340 as required by the Financial Industry Regulatory Authority (“FINRA”). This valuation was performed in accordance with the provisions of and also to comply with Practice Guideline 2013—01, Valuations of Publicly Registered, Non-Listed REITs, issued by the Investment Program Association (“IPA”) in April 2013 (the “IPA Valuation Guidelines”).
We engaged Duff & Phelps, LLC (“Duff & Phelps”), an independent third party real estate valuation firm, to provide appraisals for each of our 29 real estate properties owned as of September 30, 2016 (the “Appraised Properties”) and to provide a calculation of the range in estimated value per share of our common stock as of December 9, 2016. Duff & Phelps based this range in estimated value per share upon (i) its appraisals of the Appraised Properties, and (ii) valuations performed by KBS Capital Advisors of our cash, other assets, mortgage debt and other liabilities and our investment in the Hardware Village Joint Venture.
22
As with any valuation methodology, the methodologies used are based upon a number of estimates and assumptions that may not be accurate or complete. Different parties using different assumptions and estimates could derive a different estimated value per share of our common stock, and this difference could be significant. The estimated value per share is not audited and does not represent the fair value of our assets less the fair value of our liabilities according to U.S. generally accepted accounting principles (“GAAP”), nor does it represent a liquidation value of our assets and liabilities or the price at which our shares of common stock would trade on a national securities exchange. The estimated value per share does not reflect a discount for the fact that we are externally managed, nor does it reflect a real estate portfolio premium/discount versus the sum of the individual property values. The estimated value per share also does not take into account estimated disposition costs and fees for real estate properties, debt prepayment penalties that could apply upon the prepayment of certain of our debt obligations, the impact of restrictions on the assumption of debt or swap breakage fees that may be incurred upon the termination of certain of our swaps prior to expiration. The estimated value per share does not take into consideration acquisition related costs and financing costs related to any future acquisitions we make. Accordingly, with respect to the estimated value per share, we can give no assurance that:
• | a stockholder would be able to resell his or her shares at our estimated value per share; |
• | a stockholder would ultimately realize distributions per share equal to our estimated value per share upon liquidation of our assets and settlement of our liabilities or a sale of our company; |
• | our shares of common stock would trade at the estimated value per share on a national securities exchange; |
• | another independent third-party appraiser or third-party valuation firm would agree with our estimated value per share; or |
• | the methodology used to determine our estimated value per share would be acceptable to FINRA or for compliance with ERISA reporting requirements. |
The value of our shares will fluctuate over time in response to developments related to future investments, the performance of individual assets in our portfolio and the management of those assets, the real estate and finance markets and due to other factors. As such, the estimated value per share does not take into account developments in our portfolio since December 9, 2016. For a full description of the methodologies and assumptions used to value our assets and liabilities in connection with the calculation of the estimated value per share, see Part II, Item 5, “Market for Registrant’s Common Equity, Related Stockholder Matters and Issuer Purchases of Equity Securities — Market Information.”
We currently expect to utilize an independent valuation firm to update the estimated value per share in December 2017.
The actual value of shares that we repurchase under our share redemption program may be less than what we pay.
Under our share redemption program, shares currently may be repurchased at varying prices depending on (i) the number of years the shares have been held, and (ii) whether the redemptions are in connection with a Special Redemptions. The current maximum price that may be paid under the program is $10.63 per share, which is the current estimated value per share. Although this is our current estimated value per share, this reported value is likely to differ from the price at which a stockholder could resell his or her shares for the reasons discussed in the risk factor above. Thus, when we repurchase shares of our common stock at $10.63 per share, the actual value of the shares that we repurchase is likely to be less, and the repurchase is likely to be dilutive to our remaining stockholders. Even at lower repurchase prices, the actual value of the shares may be less than what we pay and the repurchase may be dilutive to our remaining stockholders.
If funds are not available from our dividend reinvestment plan offering for general corporate purposes, then we may have to use a greater proportion of our cash flow from operations to meet our general cash requirements, which would reduce cash available for distributions and could limit our ability to redeem shares under our share redemption program.
We depend on the proceeds from our dividend reinvestment plan offering for general corporate purposes including, but not limited to: the repurchase of shares under our share redemption program; capital expenditures, tenant improvement costs and leasing costs related to our real estate properties; reserves required by any financings of our real estate investments; funding obligations under any of our real estate loans receivable; the acquisition or origination of real estate investments, which would include payment of acquisition or origination fees to our advisor; and the repayment of debt. We cannot predict with any certainty how much, if any, dividend reinvestment plan proceeds will be available for general corporate purposes. If such funds are not available from our dividend reinvestment plan offering, then we may have to use a greater proportion of our cash flow from operations to meet our general cash requirements, which would reduce cash available for distributions and could limit our ability to redeem shares under our share redemption program.
23
Our stockholders’ interest in us will be diluted if we issue additional shares, which could reduce the overall value of their investment.
Our common stockholders do not have preemptive rights to any shares we issue in the future. Our charter authorizes us to issue 1,010,000,000 shares of capital stock, of which 1,000,000,000 shares are designated as common stock and 10,000,000 shares are designated as preferred stock. Our board of directors may increase the number of authorized shares of capital stock without stockholder approval. Our board may elect to (i) sell additional shares in our dividend reinvestment plan or in future primary offerings; (ii) issue equity interests in private offerings; (iii) issue shares to our advisor, or its successors or assigns, in payment of an outstanding fee obligation; (iv) issue shares of our common stock to sellers of properties or assets we acquire in connection with an exchange of limited partnership interests of the Operating Partnership; or (v) otherwise issue additional shares of our capital stock. To the extent we issue additional equity interests, whether in future primary offerings, pursuant to our dividend reinvestment plan or otherwise, our stockholders’ percentage ownership interest in us would be diluted. In addition, depending upon the terms and pricing of any additional issuance of shares, the use of the proceeds and the value of our real estate investments, our stockholders may also experience dilution in the book value and fair value of their shares and in the earnings and distributions per share.
Payment of fees to our advisor and its affiliates reduces cash available for investment and distribution to our stockholders and increases the risk that our stockholders will not be able to recover the amount of their investment in our shares.
Our advisor and its affiliates perform services for us in connection with the selection and acquisition or origination of our real estate investments, the management and leasing of our real estate properties and the disposition of our investments. We pay them substantial fees for these services, which results in immediate dilution of the value of our stockholders’ investment in us and reduces the amount of cash available for investments or distribution to stockholders. Compensation to be paid to our advisor may be increased with the approval of our conflicts committee and subject to the limitations in our charter, which would further dilute our stockholders’ investment in us and reduce the amount of cash available for investment or distribution to stockholders.
We may also pay significant fees during our listing/liquidation stage. Although most of the fees expected to be paid during our listing/liquidation stage are contingent on our stockholders first receiving agreed-upon investment returns, the investment-return thresholds may be reduced with the approval of our conflicts committee and subject to the limitations in our charter.
Therefore, these fees increase the risk that the amount of cash available for distribution to our stockholders upon a liquidation of our portfolio would be less than the amount stockholders paid to acquire our shares. These substantial fees and other payments also increase the risk that our stockholders will not be able to resell their shares at a profit, even if our shares are listed on a national securities exchange.
If we are unable to obtain funding for future capital needs, cash distributions to our stockholders and the value of an investment in us could decline.
When tenants do not renew their leases or otherwise vacate their space, we will often need to expend substantial funds for improvements to the vacated space in order to attract replacement tenants. Even when tenants do renew their leases we may agree to make improvements to their space as part of our negotiations. If we need additional capital in the future to improve or maintain our properties or for any other reason, we may have to obtain funding from sources other than our cash flow from operations or proceeds from our dividend reinvestment plan, such as borrowings or future equity offerings. These sources of funding may not be available on attractive terms or at all. If we cannot procure additional funding for capital improvements, our investments may generate lower cash flows or decline in value, or both, which would limit our ability to pay distributions to our stockholders and could reduce the value of our stockholders’ investment.
Our stockholders may be more likely to sustain a loss on their investment because our sponsors do not have as strong an economic incentive to avoid losses as do sponsors who have made significant equity investments in their companies.
Our sponsors have invested only $200,000 in us through the purchase of 20,000 shares of our common stock at $10.00 per share. With this limited exposure, our stockholders may be at a greater risk of loss because our sponsors do not have as much to lose from a decrease in the value of our shares as do those sponsors who make more significant equity investments in their companies.
24
Although we will not currently be afforded the protection of the Maryland General Corporation Law relating to deterring or defending hostile takeovers, our board of directors could opt into these provisions of Maryland law in the future, which may discourage others from trying to acquire control of us and may prevent our stockholders from receiving a premium price for their stock in connection with a business combination.
Under Maryland law, “business combinations” between a Maryland corporation and certain interested stockholders or affiliates of interested stockholders are prohibited for five years after the most recent date on which the interested stockholder becomes an interested stockholder. These business combinations include a merger, consolidation, share exchange or, in circumstances specified in the statute, an asset transfer or issuance or reclassification of equity securities. Also under Maryland law, control shares of a Maryland corporation acquired in a control share acquisition have no voting rights except to the extent approved by a vote of two-thirds of the votes entitled to be cast on the matter. Shares owned by the acquirer, an officer of the corporation or an employee of the corporation who is also a director of the corporation are excluded from the vote on whether to accord voting rights to the control shares. Should our board of directors opt into these provisions of Maryland law, it may discourage others from trying to acquire control of us and increase the difficulty of consummating any offer. Similarly, provisions of Title 3, Subtitle 8 of the Maryland General Corporation Law could provide similar anti-takeover protection.
Our charter includes an anti-takeover provision that may discourage a stockholder from launching a tender offer for our shares.
Our charter provides that any tender offer made by a stockholder, including any “mini-tender” offer, must comply with most provisions of Regulation 14D of the Securities Exchange Act of 1934, as amended. The offering stockholder must provide our company notice of such tender offer at least 10 business days before initiating the tender offer. If the offering stockholder does not comply with these requirements, our company will have the right to redeem that stockholder’s shares and any shares acquired in such tender offer. In addition, the noncomplying stockholder shall be responsible for all of our company’s expenses in connection with that stockholder’s noncompliance. This provision of our charter may discourage a stockholder from initiating a tender offer for our shares and prevent our stockholders from receiving a premium price for their shares in such a transaction.
General Risks Related to Investments in Real Estate
Economic, market and regulatory changes that impact the real estate market generally may decrease the value of our investments and weaken our operating results.
Our operating results and the performance of our real estate properties are subject to the risks typically associated with real estate, any of which could decrease the value of our investments and could weaken our operating results, including:
• | downturns in national, regional and local economic conditions; |
• | competition from other office and industrial buildings; |
• | adverse local conditions, such as oversupply or reduction in demand for office and industrial buildings and changes in real estate zoning laws that may reduce the desirability of real estate in an area; |
• | vacancies, changes in market rental rates and the need to periodically repair, renovate and re-let space; |
• | changes in interest rates and the availability of permanent mortgage financing, which may render the sale of a property or loan difficult or unattractive; |
• | changes in tax (including real and personal property tax), real estate, environmental and zoning laws; |
• | natural disasters such as hurricanes, earthquakes and floods; |
• | acts of war or terrorism, including the consequences of terrorist attacks, such as those that occurred on September 11, 2001; |
• | the potential for uninsured or underinsured property losses; and |
• | periods of high interest rates and tight money supply. |
Any of the above factors, or a combination thereof, could result in a decrease in our cash flow from operations and a decrease in the value of our investments, which would have an adverse effect on our operations, on our ability to pay distributions to our stockholders and on the value of our stockholders’ investment.
If our acquisitions fail to perform as expected, cash distributions to our stockholders may decline.
As of March 8, 2017, we had acquired 30 real estate properties (one of which was sold on February 19, 2014), originated one real estate loan receivable (which was fully repaid on July 1, 2016) and entered into the Hardware Village Joint Venture to develop and subsequently operate Hardware Village, which is currently under construction, based on an underwriting analysis with respect to each asset and how the asset fits into our portfolio. If these assets do not perform as expected we may have less cash flow from operating activities available to fund distributions and stockholder returns may be reduced.
25
Properties that have significant vacancies could be difficult to sell, which could diminish the return on these properties and adversely affect our cash flow and ability to pay distributions to our stockholders.
A property may incur vacancies either by the expiration and non-renewal of tenant leases or the continued default of tenants under their leases. If vacancies continue for a long period of time, we may suffer reduced revenues resulting in less cash available for distribution to our stockholders. In addition, the resale value of the property could be diminished because the market value of a particular property depends principally upon the value of the cash flow generated by the leases associated with that property. Such a reduction in the resale value of a property could also reduce the value of our stockholders’ investment.
To the extent that we buy core real estate properties with occupancy of less than 95% or that have significant rollover during the expected hold period, we may incur significant costs for capital expenditures and tenant improvement costs to lease-up the properties, which increases the risk of loss associated with these properties compared to other properties.
We have invested in, and may make additional investments in, core properties that have an occupancy rate of less than 95%, significant rollover during the expected hold period, or other characteristics that could provide an opportunity for us to achieve appreciation by increasing occupancy, negotiating new leases with higher rental rates and/or executing enhancement projects. We likely will need to fund reserves or maintain capacity under our credit facilities to fund capital expenditures, tenant improvements and other improvements in order to attract new tenants to these properties. To the extent we do not maintain adequate reserves to fund these costs, we may use our cash flow from operating activities, which will reduce the amount of cash flow available for distribution to our stockholders. If we are unable to execute our business plan for these investments, the overall return on these investments will decrease.
We may enter into long-term leases with tenants in certain properties, which may not result in fair market rental rates over time.
We may enter into long-term leases with tenants of certain of our properties, or include renewal options that specify a maximum rate increase. These leases would provide for rent to increase over time; however, if we do not accurately judge the potential for increases in market rental rates, we may set the terms of these long-term leases at levels such that, even after contractual rent increases, the rent under our long-term leases is less than then-current market rates. Further, we may have no ability to terminate those leases or to adjust the rent to then-prevailing market rates. As a result, our cash available for distribution could be lower than if we did not enter into long-term leases.
Certain property types, such as industrial properties, or portfolios of such properties, that we may acquire may not have efficient alternative uses and, if we acquire such properties, we may have difficulty leasing them to new tenants and/or have to make significant capital expenditures to them to do so.
Certain property types, particularly industrial properties, can be difficult to lease to new tenants, should the current tenant terminate or choose not to renew its lease. These properties generally will have received significant tenant-specific improvements and only very specific tenants may be able to use such improvements, making the properties very difficult to re-lease in their current condition. Additionally, an interested tenant may demand that, as a condition of executing a lease for the property, we finance and construct significant improvements so that the tenant could use the property. This expense may decrease cash available for distribution, as we likely would have to (i) pay for the improvements up-front or (ii) finance the improvements at potentially unattractive terms.
To the extent we acquire retail properties with anchor tenants, our revenue will be significantly impacted by the success and economic viability of our retail anchor tenants. Our reliance on a single tenant or significant tenants in certain properties may decrease our ability to lease vacated space and adversely affect the returns on our stockholders’ investment in us.
In the retail sector, a tenant occupying all or a large portion of the gross leasable area of a retail center, commonly referred to as an anchor tenant, may become insolvent, may suffer a downturn in business and default on or terminate its lease, or may decide not to renew its lease. Any of these events would result in a reduction or cessation in rental payments to us from that tenant and would adversely affect our financial condition. A lease termination by an anchor tenant could result in lease terminations or reductions in rent by other tenants whose leases may permit cancellation or rent reduction if an anchor tenant’s lease is terminated. In such event, we may be unable to re-lease the vacated space. Similarly, the leases of some anchor tenants may permit those anchor tenants to transfer their leases to other retailers. The transfer to a new anchor tenant could cause customer traffic in the retail center to decrease and thereby reduce the income generated by that retail center. A lease transfer to a new anchor tenant could also allow other tenants, under the terms of their respective leases, to make reduced rental payments or to terminate their leases. In the event that we are unable to re-lease the vacated space to a new anchor tenant, we may incur additional expenses in order to renovate and subdivide the space to be able to re-lease the space to more than one tenant.
26
Our retail tenants will face competition from numerous retail channels and may be disproportionately affected by economic conditions. These events could reduce the profitability of our retail properties and affect our ability to pay distributions.
Retailers will face continued competition from discount or value retailers, factory outlet centers, wholesale clubs, mail order catalogues and operators, television shopping networks and shopping via the Internet. Such conditions could adversely affect our retail tenants and, consequently, our funds available for distribution related to such tenants.
We depend on tenants for our revenue generated by our real estate investments and, accordingly, our revenue generated by our real estate investments and our ability to pay distributions to our stockholders are partially dependent upon the success and economic viability of our tenants and our ability to retain and attract tenants. Non-renewals, terminations or lease defaults could reduce our net income and limit our ability to pay distributions to our stockholders.
The success of our real estate investments materially depends upon the financial stability of the tenants leasing the properties we own. The inability of a single major tenant or a significant number of smaller tenants to meet their rental obligations would significantly lower our net income. A non-renewal after the expiration of a lease term, termination or default by a tenant on its lease payments to us would cause us to lose the revenue associated with such lease and require us to find an alternative source of revenue to meet mortgage payments and prevent a foreclosure if the property is subject to a mortgage. In the event of a tenant default or bankruptcy, we may experience delays in enforcing our rights as landlord of a property and may incur substantial costs in protecting our investment and re-leasing the property. Tenants may have the right to terminate their leases upon the occurrence of certain customary events of default and, in other circumstances, may not renew their leases or, because of market conditions, may only be able to renew their leases on terms that are less favorable to us than the terms of their initial leases.
Further, some of our assets may be outfitted to suit the particular needs of the tenants. We may have difficulty replacing the tenants of these properties if the outfitted space limits the types of businesses that could lease that space without major renovation. If a tenant does not renew a lease or, terminates or defaults on a lease, we may be unable to lease the property for the rent previously received or sell the property without incurring a loss. Because the market value of a particular property depends principally upon the value of the cash flow generated by the leases associated with such property, we may incur a loss upon the sale of a property with significant vacant space. These events could cause us to reduce distributions to stockholders.
The bankruptcy or insolvency of our tenants or delays by our tenants in making rental payments could seriously harm our operating results and financial condition.
Any bankruptcy filings by or relating to any of our tenants could bar us from collecting pre-bankruptcy debts from that tenant, unless we receive an order permitting us to do so from the bankruptcy court. A tenant bankruptcy could delay our efforts to collect past due balances under the relevant leases, and could ultimately preclude full collection of these sums. If a lease is rejected by a tenant in bankruptcy, we would have only a general unsecured claim for damages. Any unsecured claim we hold against a bankrupt entity may be paid only to the extent that funds are available and only in the same percentage as is paid to all other holders of unsecured claims. We may recover substantially less than the full value of any unsecured claims, which would harm our financial condition.
Our inability to sell a property at the time and on the terms we want could limit our ability to pay distributions to our stockholders and could reduce the value of our stockholders’ investment in us.
Many factors that are beyond our control affect the real estate market and could affect our ability to sell properties for the price, on the terms or within the time frame that we desire. These factors include general economic conditions, the availability of financing, interest rates and other factors, including supply and demand. Because real estate investments are relatively illiquid, we have a limited ability to vary our portfolio in response to changes in economic or other conditions. Further, before we can sell a property on the terms we want, it may be necessary to expend funds to correct defects or to make improvements. However, we can give no assurance that we will have the funds available to correct such defects or to make such improvements. We may be unable to sell our properties at a profit. Our inability to sell properties at the time and on the terms we want could reduce our cash flow, limit our ability to pay distributions to our stockholders and reduce the value of our stockholders’ investment in us.
If we sell a property by providing financing to the purchaser, we will bear the risk of default by the purchaser, which could delay or reduce cash available for distribution to our stockholders.
If we decide to sell any of our properties, we intend to use our best efforts to sell them for cash; however, in some instances, we may sell our properties by providing financing to purchasers. When we provide financing to a purchaser, we will bear the risk that the purchaser may default, which could reduce our cash distributions to stockholders. Even in the absence of a purchaser default, the distribution of the proceeds of the sale to our stockholders, or the reinvestment of the proceeds in other assets, will be delayed until the promissory note or other property we may accept upon a sale is actually paid, sold, refinanced or otherwise disposed.
27
Potential development and construction delays and resultant increased costs and risks may hinder our operating results and decrease our net income.
From time to time we may acquire unimproved real property or properties that are under development or construction. Investments in such properties will be subject to the uncertainties associated with the development and construction of real property, such as our investment in Hardware Village, including those related to re-zoning land for development, environmental concerns of governmental entities and/or community groups and our builders’ ability to build in conformity with plans, specifications, budgeted costs and timetables. If a builder fails to perform, we may resort to legal action to rescind the purchase or the construction contract or to compel performance. A builder’s performance may also be affected or delayed by conditions beyond the builder’s control. Delays in completing construction could also give tenants the right to terminate preconstruction leases. We may incur additional risks when we make periodic progress payments or other advances to builders before they complete construction. These and other factors can result in increased costs of a project or loss of our investment. In addition, we will be subject to normal lease-up risks relating to newly-constructed projects. We also must rely on rental income and expense projections and estimates of the fair market value of property upon completion of construction when agreeing upon a purchase price at the time we acquire the property. If our projections are inaccurate, we may pay too much for a property, and the return on our investment could suffer.
Actions of our joint venture partners could reduce the returns on joint venture investments and decrease our stockholders’ overall return.
We have entered into the Hardware Village Joint Venture and the Village Center Station II Joint Venture, and may enter into additional joint ventures with third parties to acquire properties and other assets. We may also purchase and develop additional properties in joint ventures or in partnerships, co-tenancies or other co-ownership arrangements. Such investments may involve risks not otherwise present with other methods of investment, including, for example, the following risks:
• | that our co-venturer, co-tenant or partner in an investment could become insolvent or bankrupt; |
• | that such co-venturer, co-tenant or partner may at any time have economic or business interests or goals that are or that become inconsistent with our business interests or goals; |
• | that such co-venturer, co-tenant or partner may be in a position to take action contrary to our instructions or requests or contrary to our policies or objectives; or |
• | that disputes between us and our co-venturer, co-tenant or partner may result in litigation or arbitration that would increase our expenses and prevent our officers and directors from focusing their time and effort on our operations. |
Any of the above might subject a property to liabilities in excess of those contemplated and thus reduce our returns on that investment and the value of our stockholders’ investment in us.
Costs imposed pursuant to laws and governmental regulations may reduce our net income and our cash available for distribution to our stockholders.
Real property and the operations conducted on real property are subject to federal, state and local laws and regulations relating to protection of the environment and human health. We could be subject to liability in the form of fines, penalties or damages for noncompliance with these laws and regulations. These laws and regulations generally govern wastewater discharges, air emissions, the operation and removal of underground and above-ground storage tanks, the use, storage, treatment, transportation and disposal of solid and hazardous materials, the remediation of contamination associated with the release or disposal of solid and hazardous materials, the presence of toxic building materials and other health and safety-related concerns.
Some of these laws and regulations may impose joint and several liability on the tenants, owners or operators of real property for the costs to investigate or remediate contaminated properties, regardless of fault, whether the contamination occurred prior to purchase, or whether the acts causing the contamination were legal. Our tenants’ operations, the condition of properties at the time we buy them, operations in the vicinity of our properties, such as the presence of underground storage tanks, or activities of unrelated third parties may affect our properties.
The presence of hazardous substances, or the failure to properly manage or remediate these substances, may hinder our ability to sell, rent or pledge such property as collateral for future borrowings. Any material expenditures, fines, penalties or damages we must pay will reduce our ability to pay distributions to our stockholders and may reduce the value of our stockholders’ investment in us.
28
The costs of defending against claims of environmental liability, of complying with environmental regulatory requirements, of remediating any contaminated property or of paying personal injury or other damage claims could reduce our cash available for distribution to our stockholders.
Under various federal, state and local environmental laws, ordinances and regulations, a current or previous real property owner or operator may be liable for the cost of removing or remediating hazardous or toxic substances on, under or in such property. These costs could be substantial. Such laws often impose liability whether or not the owner or operator knew of, or was responsible for, the presence of such hazardous or toxic substances. Environmental laws also may impose liens on property or restrictions on the manner in which property may be used or businesses may be operated, and these restrictions may require substantial expenditures or prevent us from entering into leases with prospective tenants that may be impacted by such laws. Environmental laws provide for sanctions for noncompliance and may be enforced by governmental agencies or, in certain circumstances, by private parties. Certain environmental laws and common law principles could be used to impose liability for the release of and exposure to hazardous substances, including asbestos-containing materials and lead-based paint. Third parties may seek recovery from real property owners or operators for personal injury or property damage associated with exposure to released hazardous substances and governments may seek recovery for natural resource damage. The costs of defending against claims of environmental liability, of complying with environmental regulatory requirements, of remediating any contaminated property, or of paying personal injury, property damage or natural resource damage claims could reduce our cash available for distribution to our stockholders.
All of our real estate properties are subject to Phase I environmental assessments prior to the time they are acquired; however, such assessments may not provide complete environmental histories due, for example, to limited available information about prior operations at the properties or other gaps in information at the time we acquire the property. A Phase I environmental assessment is an initial environmental investigation to identify potential environmental liabilities associated with the current and past uses of a given property. If any of our properties were found to contain hazardous or toxic substances after our acquisition, the value of our investment could decrease below the amount paid for such investment. In addition, real estate-related investments in which we invest may be secured by properties with recognized environmental conditions. Where we are secured creditors, we will attempt to acquire contractual agreements, including environmental indemnities, that protect us from losses arising out of environmental problems in the event the property is transferred by foreclosure or bankruptcy; however, no assurances can be given that such indemnities would fully protect us from responsibility for costs associated with addressing any environmental problems related to such properties.
Costs associated with complying with the Americans with Disabilities Act may decrease our cash available for distribution.
Our properties may be subject to the Americans with Disabilities Act of 1990, as amended, or the Disabilities Act. Under the Disabilities Act, all places of public accommodation are required to comply with federal requirements related to access and use by disabled persons. The Disabilities Act has separate compliance requirements for “public accommodations” and “commercial facilities” that generally require that buildings and services be made accessible and available to people with disabilities. The Disabilities Act’s requirements could require removal of access barriers and could result in the imposition of injunctive relief, monetary penalties or, in some cases, an award of damages. Any funds used for Disabilities Act compliance will reduce our net income and the amount of cash available for distribution to our stockholders.
Uninsured losses relating to real property or excessively expensive premiums for insurance coverage could reduce our cash flow from operations and the return on our stockholders’ investment in us.
There are types of losses, generally catastrophic in nature, such as losses due to wars, acts of terrorism, earthquakes, floods, hurricanes, pollution or environmental matters, that are uninsurable or not economically insurable, or may be insured subject to limitations, such as large deductibles or co-payments. Insurance risks associated with potential acts of terrorism could sharply increase the premiums we pay for coverage against property and casualty claims. Additionally, mortgage lenders in some cases have begun to insist that commercial property owners purchase coverage against terrorism as a condition to providing mortgage loans. Such insurance policies may not be available at reasonable costs, if at all, which could inhibit our ability to finance or refinance our properties. In such instances, we may be required to provide other financial support, either through financial assurances or self-insurance, to cover potential losses. We may not have adequate coverage for such losses. If any of our properties incurs a casualty loss that is not fully insured, the value of our assets will be reduced by any such uninsured loss, which will reduce the value of our stockholders’ investment in us. In addition other than any working capital reserve or other reserves we may establish, we have limited sources of funding to repair or reconstruct any uninsured property. Also, to the extent we must pay unexpectedly large amounts for insurance, we could suffer reduced earnings that would result in lower distributions to our stockholders.
29
Terrorist attacks and other acts of violence or war may affect the markets in which we plan to operate, which could delay or hinder our ability to meet our investment objectives and reduce our stockholders’ overall return.
Terrorist attacks or armed conflicts may directly impact the value of our properties through damage, destruction, loss or increased security costs. We may not be able to obtain insurance against the risk of terrorism because it may not be available or may not be available on terms that are economically feasible. The terrorism insurance that we obtain may not be sufficient to cover loss for damages to our properties as a result of terrorist attacks. The inability to obtain sufficient terrorism insurance or any terrorism insurance at all could limit our financing and refinancing options as some mortgage lenders have begun to insist that specific coverage against terrorism be purchased by commercial owners as a condition for providing loans.
Competition from other apartment communities for tenants could reduce our profitability and the return on our stockholders’ investment.
The apartment community industry is highly competitive. This competition could reduce occupancy levels and revenues at our apartment communities, which would adversely affect our operations. We are currently developing, through the Hardware Village Joint Venture, the Hardware Village apartment community, which we will subsequently operate through the joint venture. We expect to face competition from many sources. We will face competition from other apartment communities both in the immediate vicinity and in the larger geographic market where our apartment communities are located. Overbuilding of apartment communities may occur. If so, this will increase the number of apartment units available and may decrease occupancy and apartment rental rates. In addition, increases in operating costs due to inflation may not be offset by increased apartment rental rates.
Risks Related to Real Estate-Related Investments
Any future real estate-related investments we make will be subject to the risks typically associated with real estate.
Any future investments we make in real estate loans generally will be directly or indirectly secured by a lien on real property (or the equity interests in an entity that owns real property) that, upon the occurrence of a default on the loan, could result in our taking ownership of the property. The values of these properties may change after the dates of acquisition or origination of the loans. If the values of the underlying properties drop, our risk will increase because of the lower value of the security associated with such loans. In this manner, real estate values could impact the values of our loan investments. Any investments we make in residential and commercial mortgage-backed securities and other real estate-related investments may be similarly affected by real estate property values. Therefore, any real estate-related investments we make will be subject to the risks typically associated with real estate, which are described above under the heading “- General Risks Related to Investments in Real Estate.”
Any future investments we make in real estate loans will be subject to interest rate fluctuations that will affect our returns as compared to market interest rates; accordingly, the value of our stockholders’ investment in us will be subject to fluctuations in interest rates.
With respect to fixed rate, long-term loans receivable, if interest rates rise, the loans could yield a return that is lower than then-current market rates. If interest rates decrease, we will be adversely affected to the extent that loans are prepaid because we may not be able to reinvest the proceeds at as high of an interest rate. If we invest in variable-rate loans receivable and interest rates decrease, our revenues will also decrease. For these reasons, investments in real estate loans, returns on those loans and the value of our stockholders’ investment in us would be subject to fluctuations in interest rates.
The mortgage loans we may invest in and the mortgage loans underlying any mortgage securities we may invest in are subject to delinquency, foreclosure and loss, which could result in losses to us.
Commercial real estate loans generally are secured by commercial real estate properties and are subject to risks of delinquency and foreclosure. The ability of a borrower to repay a loan secured by an income-producing property typically is dependent primarily upon the successful operation of such property rather than upon the existence of independent income or assets of the borrower. If the net operating income of the property is reduced, the borrower’s ability to repay the loan may be impaired. Net operating income of an income-producing property can be affected by, among other things: tenant mix, success of tenant businesses, occupancy rates, property management decisions, property location and condition, competition from comparable types of properties, changes in laws that increase operating expenses or limit rents that may be charged, any need to address environmental contamination at the property, the occurrence of any uninsured casualty at the property, changes in national, regional or local economic conditions and/or specific industry segments, declines in regional or local real estate values, declines in regional or local rental or occupancy rates, increases in interest rates, real estate tax rates and other operating expenses, changes in governmental rules, fiscal policies and regulations (including environmental legislation), natural disasters, terrorism, social unrest and civil disturbances.
30
In the event of any default under a mortgage loan we may acquire, we will bear a risk of loss of principal and accrued interest to the extent of any deficiency between the value of the collateral and the principal and accrued interest of the mortgage loan, which could have a material adverse effect on our cash flow from operations. Foreclosure on a property securing a mortgage loan can be an expensive and lengthy process that could have a substantial negative effect on our anticipated return on the investment. In the event of the bankruptcy of a mortgage loan borrower, the mortgage loan to such borrower will be deemed to be secured only to the extent of the value of the underlying collateral at the time of bankruptcy (as determined by the bankruptcy court), and the lien securing the mortgage loan will be subject to the avoidance powers of the bankruptcy trustee or debtor-in-possession to the extent the lien is unenforceable under state law.
Hedging against interest rate exposure may adversely affect our earnings, limit our gains or result in losses, which could adversely affect cash available for distribution to our stockholders.
We have entered into and in the future may enter into interest rate swap agreements or pursue other interest rate hedging strategies. Our hedging activity will vary in scope based on the level of interest rates, the type of investments we hold, and other changing market conditions. Interest rate hedging may fail to protect or could adversely affect us because, among other things:
• | interest rate hedging can be expensive, particularly during periods of rising and volatile interest rates; |
• | available interest rate hedging products may not correspond directly with the interest rate risk for which protection is sought; |
• | the duration of the hedge may not match the duration of the related liability or asset; |
• | the amount of income that a REIT may earn from hedging transactions to offset losses due to fluctuations in interest rates is limited by federal tax provisions governing REITs; |
• | the credit quality of the party owing money on the hedge may be downgraded to such an extent that it impairs our ability to sell or assign our side of the hedging transaction; |
• | the party owing money in the hedging transaction may default on its obligation to pay; and |
• | we may purchase a hedge that turns out not to be necessary, i.e., a hedge that is out of the money. |
Any hedging activity we engage in may adversely affect our earnings, which could adversely affect cash available for distribution to our stockholders. Therefore, while we may enter into such transactions to seek to reduce interest rate risks, unanticipated changes in interest rates may result in poorer overall investment performance than if we had not engaged in any such hedging transactions. In addition, the degree of correlation between price movements of the instruments used in a hedging strategy and price movements in the investments being hedged or liabilities being hedged may vary materially. Moreover, for a variety of reasons, we may not seek to establish a perfect correlation between such hedging instruments and the interest rate risk sought to be hedged. Any such imperfect correlation may prevent us from achieving the intended accounting treatment and may expose us to risk of loss.
We assume the credit risk of our counterparties with respect to derivative transactions.
We enter into derivative contracts for risk management purposes to hedge our exposure to cash flow variability caused by changing interest rates on our future variable rate real estate loans receivable and variable rate notes payable. These derivative contracts generally are entered into with bank counterparties and are not traded on an organized exchange or guaranteed by a central clearing organization. We would therefore assume the credit risk that our counterparties will fail to make periodic payments when due under these contracts or become insolvent. If a counterparty fails to make a required payment, becomes the subject of a bankruptcy case, or otherwise defaults under the applicable contract, we would have the right to terminate all outstanding derivative transactions with that counterparty and settle them based on their net market value or replacement cost. In such an event, we may be required to make a termination payment to the counterparty, or we may have the right to collect a termination payment from such counterparty. We assume the credit risk that the counterparty will not be able to make any termination payment owing to us. We may not receive any collateral from a counterparty, or we may receive collateral that is insufficient to satisfy the counterparty’s obligation to make a termination payment. If a counterparty is the subject of a bankruptcy case, we will be an unsecured creditor in such case unless the counterparty has pledged sufficient collateral to us to satisfy the counterparty’s obligations to us.
We assume the risk that our derivative counterparty may terminate transactions early.
If we fail to make a required payment or otherwise default under the terms of a derivative contract, the counterparty would have the right to terminate all outstanding derivative transactions between us and that counterparty and settle them based on their net market value or replacement cost. In certain circumstances, the counterparty may have the right to terminate derivative transactions early even if we are not defaulting. If our derivative transactions are terminated early, it may not be possible for us to replace those transactions with another counterparty, on as favorable terms or at all.
31
We may be required to collateralize our derivative transactions.
We may be required to secure our obligations to our counterparties under our derivative contracts by pledging collateral to our counterparties. That collateral may be in the form of cash, securities or other assets. If we default under a derivative contract with a counterparty, or if a counterparty otherwise terminates one or more derivative contracts early, that counterparty may apply such collateral toward our obligation to make a termination payment to the counterparty. If we have pledged securities or other assets, the counterparty may liquidate those assets in order to satisfy our obligations. If we are required to post cash or securities as collateral, such cash or securities will not be available for use in our business. Cash or securities pledged to counterparties may be repledged by counterparties and may not be held in segregated accounts. Therefore, in the event of a counterparty insolvency, we may not be entitled to recover some or all collateral pledged to that counterparty, which could result in losses and have an adverse effect on our operations.
There can be no assurance that the direct or indirect effects of the Dodd-Frank Act and other applicable non-U.S. regulations will not have an adverse effect on our interest rate hedging activities.
Title VII of the Dodd-Frank Wall Street Reform and Consumer Protection Act of 2010 (the “Dodd-Frank Act”) imposed additional regulations on derivatives markets and transactions. Such regulations and, to the extent we trade with counterparties organized in non-US jurisdictions, any applicable regulations in those jurisdictions, are still being implemented, and will affect our interest rate hedging activities. While the full impact of regulation on our interest rate hedging activities cannot be fully assessed until all final rules and regulations are implemented, such regulation may affect our ability to enter into hedging or other risk management transactions, may increase our costs in entering into such transactions, and/or may result in us entering into such transactions on less favorable terms than prior to implementation of such regulation. For example, but not by way of limitation, the Dodd-Frank Act and the rulemaking thereunder provides for significantly increased regulation of the derivative transactions used to affect our interest rate hedging activities, including: (i) regulatory reporting, (ii) subject to an exemption for end-users of swaps upon which we and our subsidiaries generally rely, mandated clearing of certain derivatives transactions through central counterparties and execution on regulated exchanges or execution facilities, and (iii) to the extent we are required to clear any such transactions, margin and collateral requirements. The imposition, or the failure to comply with, any of the foregoing requirements may have an adverse effect on our business and our stockholders’ return.
Our investments in derivatives are carried at estimated fair value as determined by us and, as a result, there may be uncertainty as to the value of these instruments.
Our investments in derivatives are recorded at fair value but have limited liquidity and are not publicly traded. The fair value of our derivatives may not be readily determinable. We will estimate the fair value of any such investments on a quarterly basis. Because such valuations are inherently uncertain, may fluctuate over short periods of time and may be based on numerous estimates, our determinations of fair value may differ materially from the values that would have been used if a ready market for these investments existed. The value of our common stock could be adversely affected if our determinations regarding the fair value of these investments are materially higher than the values that we ultimately realize upon their disposal or maturity.
Risks Associated with Debt Financing
We obtain lines of credit, mortgage indebtedness and other borrowings, which increases our risk of loss due to potential foreclosure.
We obtain lines of credit and long-term financing secured by our properties and other assets. We have acquired many of our real estate properties by financing a portion of the price of the properties and mortgaging or pledging some or all of the properties purchased as security for that debt. We may also incur mortgage debt on properties that we already own in order to obtain funds to acquire additional properties, to fund property improvements and other capital expenditures, to pay distributions and for other purposes. In addition, we may borrow as necessary or advisable to ensure that we maintain our qualification as a REIT for federal income tax purposes, including borrowings to satisfy the REIT requirement that we distribute at least 90% of our annual REIT taxable income to our stockholders (computed without regard to the dividends-paid deduction and excluding net capital gain). However, we can give our stockholders no assurance that we will be able to obtain such borrowings on satisfactory terms or at all.
32
If we do mortgage a property and there is a shortfall between the cash flow generated by that property and the cash flow needed to service mortgage debt on that property, then the amount of cash available for distribution to our stockholders may be reduced. In addition, incurring mortgage debt increases the risk of loss of a property since defaults on indebtedness secured by a property may result in lenders initiating foreclosure actions. In that case, we could lose the property securing the loan that is in default, reducing the value of our stockholders’ investment in us. For tax purposes, a foreclosure of any of our properties would be treated as a sale of the property for a purchase price equal to the outstanding balance of the debt secured by the mortgage. If the outstanding balance of the debt secured by the mortgage exceeds our tax basis in the property, we would recognize taxable income on foreclosure even though we would not necessarily receive any cash proceeds. We have given and may give full or partial guarantees to lenders of mortgage or other debt on behalf of the entities that own our properties. When we give a guaranty on behalf of an entity that owns one of our properties, we will be responsible to the lender for satisfaction of all or a part of the debt or other amounts related to the debt if it is not paid by such entity. If any mortgages contain cross-collateralization or cross-default provisions, a default on a mortgage secured by a single property could affect mortgages secured by other properties.
We may utilize repurchase agreements as a component of our financing strategy. Repurchase agreements economically resemble short-term, variable-rate financing and usually require the maintenance of specific loan-to-collateral value ratios. If the market value of the assets subject to a repurchase agreement declines, we may be required to provide additional collateral or make cash payments to maintain the required loan-to-collateral value ratios. If we are unable to provide such collateral or cash repayments, we may lose our economic interest in the underlying assets.
We may also obtain recourse debt to finance our acquisitions and meet our REIT distribution requirements. If we have insufficient income to service our recourse debt obligations, our lenders could institute proceedings against us to foreclose upon our assets. If a lender successfully forecloses upon any of our assets, our ability to pay cash distributions to our stockholders will be limited and our stockholders could lose all or part of their investment in us.
High mortgage rates or changes in underwriting standards may make it difficult for us to finance or refinance properties, which could reduce the number of properties we can acquire, our cash flow from operations and the amount of cash available for distribution to our stockholders.
If mortgage debt is unavailable at reasonable rate, we may not be able to finance the purchase of properties. If we place mortgage debt on a property, we run the risk of being unable to refinance part or all of the debt when it becomes due or of being unable to refinance on favorable terms. If interest rates are higher when we refinance properties subject to mortgage debt, our income could be reduced. We may be unable to refinance or may only be able to partly refinance properties if underwriting standards, including loan to value ratios and yield requirements, among other requirements, are more strict than when we originally financed the properties. If any of these events occurs, our cash flow could be reduced and/or we might have to pay down existing mortgages. This, in turn, would reduce cash available for distribution to our stockholders, could cause us to require additional capital and may hinder our ability to raise capital by issuing more stock or by borrowing more money.
We may not be able to access financing sources on attractive terms, which could adversely affect our ability to execute our business plan.
We may finance our assets over the long-term through a variety of means, including repurchase agreements, credit facilities, issuances of commercial mortgage-backed securities and other structured financings. Our ability to execute this strategy will depend on various conditions in the markets for financing in this manner that are beyond our control, including lack of liquidity and greater credit spreads. We cannot be certain that these markets will remain an efficient source of long-term financing for our assets. If our strategy is not viable, we will have to find alternative forms of long-term financing for our assets, as secured revolving credit facilities and repurchase agreements may not accommodate long-term financing. This could subject us to more recourse indebtedness and the risk that debt service on less efficient forms of financing would require a larger portion of our cash flow, thereby reducing cash available for distribution to our stockholders and funds available for operations as well as for future business opportunities.
Lenders may require us to enter into restrictive covenants relating to our operations, which could limit our ability to pay distributions to our stockholders.
When providing financing, a lender may impose restrictions on us that affect our distribution and operating policies and our ability to incur additional debt. Loan agreements into which we enter may contain covenants that limit our ability to further mortgage a property or that prohibit us from discontinuing insurance coverage or replacing our advisor. These or other limitations would decrease our operating flexibility and our ability to achieve our operating objectives and limit our ability to pay distributions to our stockholders.
33
Increases in interest rates would increase the amount of our debt payments and limit our ability to pay distributions to our stockholders.
We have incurred variable rate debt and we expect that we will incur additional debt in the future. Increases in interest rates will increase the cost of that debt, which could reduce our cash flow from operations and the cash we have available for distribution to our stockholders. In addition, if we need to repay existing debt during periods of rising interest rates, we could be required to liquidate one or more of our investments at times that may not permit realization of the maximum return on such investments.
We have broad authority to incur debt and high debt levels could limit the amount of cash we have available to distribute to our stockholders and decrease the value of our stockholders’ investment in us.
We may incur debt until our total liabilities would exceed 75% of the cost of our tangible assets (before deducting depreciation and other noncash reserves) and we may exceed this limit with the approval of the conflicts committee of our board of directors. As of December 31, 2016, our borrowings and other liabilities were approximately 55% of both the cost (before deducting depreciation and other noncash reserves) and book value (before deducting depreciation) of our tangible assets, respectively. High debt levels would cause us to incur higher interest charges and higher debt service payments and may also be accompanied by restrictive covenants. These factors could limit the amount of cash we have available to distribute to our stockholders and could result in a decline in the value of our stockholders’ investment in us.
Federal Income Tax Risks
Failure to qualify as a REIT would reduce our net earnings available for investment or distribution.
Our qualification as a REIT will depend upon our ability to meet requirements regarding our organization and ownership, distributions of our income, the nature and diversification of our income and assets and other tests imposed by the Internal Revenue Code. If we fail to qualify as a REIT for any taxable year after electing REIT status, we will be subject to federal income tax on our taxable income at corporate rates. In addition, we would generally be disqualified from treatment as a REIT for the four taxable years following the year in which we lost our REIT status. Losing our REIT status would reduce our net earnings available for investment or distribution to stockholders because of the additional tax liability. In addition, distributions to stockholders would no longer qualify for the dividends-paid deduction and we would no longer be required to pay distributions. If this occurs, we might be required to borrow funds or liquidate some investments in order to pay the applicable tax.
Failure to qualify as a REIT would subject us to federal income tax, which would reduce the cash available for distribution to our stockholders.
We believe that we have operated and will continue to operate in a manner that will allow us to continue to qualify as a REIT for federal income tax purposes, commencing with the taxable year ended December 31, 2011. However, the federal income tax laws governing REITs are extremely complex, and interpretations of the federal income tax laws governing qualification as a REIT are limited. Qualifying as a REIT requires us to meet various tests regarding the nature of our assets and our income, the ownership of our outstanding stock, and the amount of our distributions on an ongoing basis. Accordingly, we cannot be certain that we will be successful in operating so we can remain qualified as a REIT. While we intend to continue to operate so that we will qualify as a REIT, given the highly complex nature of the rules governing REITs, the ongoing importance of factual determinations, including the tax treatment of certain investments we may make, and the possibility of future changes in our circumstances, no assurance can be given that we will so qualify for any particular year. If we fail to qualify as a REIT in any calendar year and we do not qualify for certain statutory relief provisions, we would be required to pay federal income tax on our taxable income. We might need to borrow money or sell assets to pay that tax. Our payment of income tax would decrease the amount of our income available for distribution to our stockholders. Furthermore, if we fail to maintain our qualification as a REIT and we do not qualify for certain statutory relief provisions, we no longer would be required to distribute substantially all of our REIT taxable income to our stockholders. Unless our failure to qualify as a REIT were excused under federal tax laws, we would be disqualified from taxation as a REIT for the four taxable years following the year during which qualification was lost.
Our stockholders may have current tax liability on distributions they elect to reinvest in our common stock.
If our stockholders participate in our dividend reinvestment plan, they will be deemed to have received, and for income tax purposes will be taxed on, the amount reinvested in shares of our common stock to the extent the amount reinvested was not a tax-free return of capital. In addition, our stockholders will be treated for tax purposes as having received an additional distribution to the extent the shares are purchased at a discount to fair market value, if any. As a result, unless our stockholders are tax-exempt entities, they may have to use funds from other sources to pay their tax liability on the value of the shares of common stock received.
34
Even if we qualify as a REIT for federal income tax purposes, we may be subject to federal, state, local or other tax liabilities that reduce our cash flow and our ability to pay distributions to our stockholders.
Even if we qualify as a REIT for federal income tax purposes, we may be subject to some federal, state and local taxes on our income or property. For example:
• | In order to qualify as a REIT, we must distribute annually at least 90% of our REIT taxable income to our stockholders (which is determined without regard to the dividends-paid deduction or net capital gain). To the extent that we satisfy the distribution requirement but distribute less than 100% of our REIT taxable income, we will be subject to federal corporate income tax on the undistributed income. |
• | We will be subject to a 4% nondeductible excise tax on the amount, if any, by which distributions we pay in any calendar year are less than the sum of 85% of our ordinary income, 95% of our capital gain net income and 100% of our undistributed income from prior years. |
• | If we elect to treat property that we acquire in connection with a foreclosure of a mortgage loan or certain leasehold terminations as “foreclosure property,” we may avoid the 100% tax on the gain from a resale of that property, but the income from the sale or operation of that property may be subject to corporate income tax at the highest applicable rate. |
• | If we sell an asset, other than foreclosure property, that we hold primarily for sale to customers in the ordinary course of business, our gain would be subject to the 100% “prohibited transaction” tax unless such sale were made by one of our taxable REIT subsidiaries. |
REIT distribution requirements could adversely affect our ability to execute our business plan.
We generally must distribute annually at least 90% of our REIT taxable income, subject to certain adjustments and excluding any net capital gain, in order for federal corporate income tax not to apply to earnings that we distribute. To the extent that we satisfy this distribution requirement, but distribute less than 100% of our REIT taxable income, we will be subject to federal corporate income tax on our undistributed REIT taxable income. In addition, we will be subject to a 4% nondeductible excise tax if the actual amount that we pay out to our stockholders in a calendar year is less than a minimum amount specified under federal tax laws. We also may decide to retain net capital gain we earn from the sale or other disposition of our property and pay U.S. federal income tax directly on such income. In that event, our stockholders would be treated as if they earned that income and paid the tax on it directly. However, stockholders that are tax-exempt, such as charities or qualified pension plans, would have no benefit from their deemed payment of such tax liability unless they file U.S. federal income tax returns and thereon seek a refund of such tax. We also will be subject to corporate tax on any undistributed taxable income. We intend to make distributions to our stockholders to comply with the REIT requirements of the Internal Revenue Code.
From time to time, we may generate taxable income greater than our income for financial reporting purposes, or our taxable income may be greater than our cash flow available for distribution to stockholders (for example, where a borrower defers the payment of interest in cash pursuant to a contractual right or otherwise). If we do not have other funds available in these situations we could be required to borrow funds, sell investments at disadvantageous prices or find another alternative source of funds to pay distributions sufficient to enable us to pay out enough of our taxable income to satisfy the REIT distribution requirements and to avoid corporate income tax and the 4% excise tax in a particular year. These alternatives could increase our costs or reduce our equity. Thus, compliance with the REIT requirements may hinder our ability to operate solely on the basis of maximizing profits.
To maintain our REIT status, we may be forced to forego otherwise attractive business or investment opportunities, which may delay or hinder our ability to meet our investment objectives and reduce our stockholders’ overall return.
To qualify as a REIT, we must satisfy certain tests on an ongoing basis concerning, among other things, the sources of our income, nature of our assets and the amounts we distribute to our stockholders. We may be required to pay distributions to stockholders at times when it would be more advantageous to reinvest cash in our business or when we do not have funds readily available for distribution. Compliance with the REIT requirements may hinder our ability to operate solely on the basis of maximizing profits and reduce the value of our stockholders’ investment.
35
If our operating partnership fails to maintain its status as a partnership for federal income tax purposes, its income would be subject to taxation and our REIT status would be terminated.
We intend to maintain the status of our operating partnership as a partnership for federal income tax purposes. However, if the Internal Revenue Service were to successfully challenge the status of our operating partnership as a partnership, it would be taxable as a corporation. In such event, this would reduce the amount of distributions that our operating partnership could make to us. This would also result in our losing REIT status and becoming subject to a corporate level tax on our own income. This would substantially reduce our cash available to pay distributions and the return on your investment. In addition, if any of the entities through which our operating partnership owns its properties, in whole or in part, loses its characterization as a partnership for federal income tax purposes, the underlying entity would become subject to taxation as a corporation, thereby reducing distributions to our operating partnership and jeopardizing our ability to maintain REIT status.
Potential characterization of distributions or gain on sale may be treated as unrelated business taxable income to tax-exempt investors.
If (i) all or a portion of our assets are subject to the rules relating to taxable mortgage pools, (ii) we are a “pension-held REIT,” (iii) a tax-exempt stockholder has incurred debt to purchase or hold our common stock, or (iv) the residual Real Estate Mortgage Investment Conduit interests, or REMICs, we buy (if any) generate “excess inclusion income,” then a portion of the distributions to and, in the case of a stockholder described in clause (iii), gains realized on the sale of common stock by such tax-exempt stockholder may be subject to federal income tax as unrelated business taxable income under the Internal Revenue Code.
The failure of a mezzanine loan to qualify as a real estate asset could adversely affect our ability to qualify as a REIT.
The Internal Revenue Service has issued Revenue Procedure 2003-65, which provides a safe harbor pursuant to which a mezzanine loan that is secured by interests in a pass-through entity will be treated by the Internal Revenue Service as a real estate asset for purposes of the REIT tests, and interest derived from such loan will be treated as qualifying mortgage interest for purposes of the REIT 75% income test. Although the Revenue Procedure provides a safe harbor on which taxpayers may rely, it does not prescribe rules of substantive tax law. We intend to make investments in loans secured by interests in pass-through entities in a manner that complies with the various requirements applicable to our qualification as a REIT. To the extent, however, that any such loans do not satisfy all of the requirements for reliance on the safe harbor set forth in the Revenue Procedure, there can be no assurance that the Internal Revenue Service will not challenge the tax treatment of such loans, which could jeopardize our ability to qualify as a REIT.
The tax on prohibited transactions will limit our ability to engage in transactions, including certain methods of securitizing mortgage loans, that would be treated as sales for federal income tax purposes.
A REIT’s net income from prohibited transactions is subject to a 100% tax. In general, prohibited transactions are sales or other dispositions of assets, other than foreclosure property, deemed held primarily for sale to customers in the ordinary course of business. We might be subject to this tax if we were to dispose of or securitize loans in a manner that was treated as a sale of the loans for federal income tax purposes. Therefore, in order to avoid the prohibited transactions tax, we may choose not to engage in certain sales of loans at the REIT level, and may limit the structures we utilize for our securitization transactions, even though the sales or structures might otherwise be beneficial to us.
It may be possible to reduce the impact of the prohibited transaction tax by conducting certain activities through taxable REIT subsidiaries. However, to the extent that we engage in such activities through taxable REIT subsidiaries, the income associated with such activities may be subject to full corporate income tax.
Complying with REIT requirements may force us to liquidate otherwise attractive investments.
To qualify as a REIT, we must ensure that at the end of each calendar quarter, at least 75% of the value of our assets consists of cash, cash items, government securities and qualified REIT real estate assets, including certain mortgage loans and residential and commercial mortgage-backed securities. The remainder of our investment in securities (other than government securities and qualified real estate assets) generally cannot include more than 10% of the outstanding voting securities of any one issuer or more than 10% of the total value of the outstanding securities of any one issuer. In addition, in general, no more than 5% of the value of our assets (other than government securities and qualified real estate assets) can consist of the securities of any one issuer, and no more than 25% (20% for taxable years after 2017) of the value of our total assets can be represented by securities of one or more taxable REIT subsidiaries. If we fail to comply with these requirements at the end of any calendar quarter, we must correct the failure within 30 days after the end of the calendar quarter or qualify for certain statutory relief provisions to avoid losing our REIT qualification and suffering adverse tax consequences. As a result, we may be required to liquidate from our portfolio otherwise attractive investments. These actions could have the effect of reducing our income and amounts available for distribution to our stockholders.
36
Liquidation of assets may jeopardize our REIT qualification.
To qualify as a REIT, we must comply with requirements regarding our assets and our sources of income. If we are compelled to liquidate our investments to repay obligations to our lenders, we may be unable to comply with these requirements, ultimately jeopardizing our qualification as a REIT, or we may be subject to a 100% tax on any resultant gain if we sell assets that are treated as dealer property or inventory.
Characterization of any repurchase agreements we enter into to finance our investments as sales for tax purposes rather than as secured lending transactions would adversely affect our ability to qualify as a REIT.
We may enter into repurchase agreements with a variety of counterparties to achieve our desired amount of leverage for the assets in which we invest. When we enter into a repurchase agreement, we generally sell assets to our counterparty to the agreement and receive cash from the counterparty. The counterparty is obligated to resell the assets back to us at the end of the term of the transaction. We believe that for federal income tax purposes we will be treated as the owner of the assets that are the subject of repurchase agreements and that the repurchase agreements will be treated as secured lending transactions notwithstanding that such agreement may transfer record ownership of the assets to the counterparty during the term of the agreement. It is possible, however, that the Internal Revenue Service could successfully assert that we did not own these assets during the term of the repurchase agreements, in which case we could fail to qualify as a REIT if tax ownership of these assets was necessary for us to meet the income and/or asset tests.
Complying with REIT requirements may limit our ability to hedge effectively.
The REIT provisions of the Internal Revenue Code may limit our ability to hedge our assets and operations. Under these provisions, any income that we generate from transactions intended to hedge our interest rate, inflation and/or currency risks will be excluded from gross income for purposes of the REIT 75% and 95% gross income tests if the purpose of the instrument is to (i) hedge interest rate risk on liabilities incurred to carry or acquire real estate, (ii) hedge risk of currency fluctuations with respect to any item of income or gain that would be qualifying income under the REIT 75% or 95% gross income tests, or (iii) manage risk with respect to the termination of certain prior hedging transactions described in (i) and/or (ii) above and, in each case, such instrument is properly identified under applicable Treasury Regulations. Income from hedging transactions that do not meet these requirements will generally constitute nonqualifying income for purposes of both the REIT 75% and 95% gross income tests. As a result of these rules, we may have to limit our use of hedging techniques that might otherwise be advantageous, which could result in greater risks associated with interest rate or other changes than we would otherwise incur.
Our ownership of and relationship with our taxable REIT subsidiaries will be limited and a failure to comply with the limits would jeopardize our REIT status and may result in the application of a 100% excise tax.
A REIT may own up to 100% of the stock of one or more taxable REIT subsidiaries. A taxable REIT subsidiary may earn income that would not be qualifying income if earned directly by the parent REIT. Both the subsidiary and the REIT must jointly elect to treat the subsidiary as a taxable REIT subsidiary. A corporation of which a taxable REIT subsidiary directly or indirectly owns more than 35% of the voting power or value of the stock will automatically be treated as a taxable REIT subsidiary. Overall, no more than 25% (20% for taxable years after 2017) of the value of a REIT’s assets may consist of stock or securities of one or more taxable REIT subsidiaries. A domestic taxable REIT subsidiary will pay federal, state and local income tax at regular corporate rates on any income that it earns. In addition, the taxable REIT subsidiary rules limit the deductibility of interest paid or accrued by a taxable REIT subsidiary to its parent REIT to assure that the taxable REIT subsidiary is subject to an appropriate level of corporate taxation. The rules also impose a 100% excise tax on certain transactions between a taxable REIT subsidiary and its parent REIT that are not conducted on an arm’s-length basis. We cannot assure our stockholders that we will be able to comply with the 25% (or 20% as applicable) value limitation on ownership of taxable REIT subsidiary stock and securities on an ongoing basis so as to maintain REIT status or to avoid application of the 100% excise tax imposed on certain non-arm’s length transactions.
The ability of our board of directors to revoke our REIT qualification without stockholder approval may subject us to U.S. federal income tax and reduce distributions to our stockholders.
Our charter provides that our board of directors may revoke or otherwise terminate our REIT election, without the approval of our stockholders, if it determines that it is no longer in our best interest to continue to qualify as a REIT. While we intend to elect and qualify to be taxed as a REIT, we may not elect to be treated as a REIT or may terminate our REIT election if we determine that qualifying as a REIT is no longer in our best interests. If we cease to be a REIT, we would become subject to U.S. federal income tax on our taxable income and would no longer be required to distribute most of our taxable income to our stockholders, which may have adverse consequences on our total return to our stockholders and on the market price of our common stock.
37
We may be subject to adverse legislative or regulatory tax changes.
At any time, the federal income tax laws or regulations governing REITs or the administrative interpretations of those laws or regulations may be amended. We cannot predict when or if any new federal income tax law, regulation or administrative interpretation, or any amendment to any existing federal income tax law, regulation or administrative interpretation, will be adopted, promulgated or become effective and any such law, regulation or interpretation may take effect retroactively. We and our stockholders could be adversely affected by any such change in, or any new, federal income tax law, regulation or administrative interpretation. You are urged to consult with your tax advisor with respect to the impact of recent legislation on your investment in our shares and the status of legislative, regulatory or administrative developments and proposals and their potential effect on an investment in our shares.
Although REITs generally receive better tax treatment than entities taxed as regular corporations, it is possible that future legislation would result in a REIT having fewer tax advantages, and it could become more advantageous for a company that invests in real estate to elect to be treated for U.S. federal income tax purposes as a corporation. As a result, our charter provides our board of directors with the power, under certain circumstances, to revoke or otherwise terminate our REIT election and cause us to be taxed as a regular corporation, without the vote of our stockholders. Our board of directors has fiduciary duties to us and our stockholders and could only cause such changes in our tax treatment if it determines in good faith that such changes are in the best interest of our stockholders.
Dividends payable by REITs do not qualify for the reduced tax rates.
In general, the maximum tax rate for dividends payable to domestic stockholders that are individuals, trusts and estates is 20%. Dividends payable by REITs, however, are generally not eligible for this reduced rate. While this tax treatment does not adversely affect the taxation of REITs or dividends paid by REITs, the more favorable rates applicable to regular corporate dividends could cause investors who are individuals, trusts or estates to perceive investments in REITs to be relatively less attractive than investments in stock of non‑REIT corporations that pay dividends, which could adversely affect the value of the stock of REITs, including our common stock.
Qualifying as a REIT involves highly technical and complex provisions of the Internal Revenue Code.
Qualification as a REIT involves the application of highly technical and complex Internal Revenue Code provisions for which only limited judicial and administrative authorities exist. Even a technical or inadvertent violation could jeopardize our REIT qualification. Our continued qualification as a REIT will depend on our satisfaction of certain asset, income, organizational, distribution, stockholder ownership and other requirements on a continuing basis. In addition, our ability to satisfy the requirements to qualify as a REIT depends in part on the actions of third parties over which we have no control or only limited influence, including in cases where we own an equity interest in an entity that is classified as a partnership for U.S. federal income tax purposes.
The taxation of distributions to our stockholders can be complex; however, distributions that we make to our stockholders generally will be taxable as ordinary income, which may reduce your anticipated return from an investment in us.
Distributions that we make to our taxable stockholders to the extent of our current and accumulated earnings and profits (and not designated as capital gain dividends or qualified dividend income) generally will be taxable as ordinary income. However, a portion of our distributions may (i) be designated by us as capital gain dividends generally taxable as long-term capital gain to the extent that they are attributable to net capital gain recognized by us, (ii) be designated by us as qualified dividend income generally to the extent they are attributable to dividends we receive from non-REIT corporations, such as our taxable REIT subsidiaries, or (iii) constitute a return of capital generally to the extent that they exceed our current and accumulated earnings and profits as determined for U.S. federal income tax purposes. A return of capital distribution is not taxable, but has the effect of reducing the basis of a stockholder’s investment in our common stock.
We may be required to pay some taxes due to actions of a taxable REIT subsidiary which would reduce our cash available for distribution to you.
Any net taxable income earned directly by a taxable REIT subsidiary, or through entities that are disregarded for federal income tax purposes as entities separate from our taxable REIT subsidiaries, will be subject to federal and possibly state corporate income tax. In this regard, several provisions of the laws applicable to REITs and their subsidiaries ensure that a taxable REIT subsidiary will be subject to an appropriate level of federal income taxation. For example, a taxable REIT subsidiary is limited in its ability to deduct certain interest payments made to an affiliated REIT. In addition, the REIT has to pay a 100% penalty tax on some payments that it receives or on some deductions taken by a taxable REIT subsidiary if the economic arrangements between the REIT, the REIT's customers, and the taxable REIT subsidiary are not comparable to similar arrangements between unrelated parties. Finally, some state and local jurisdictions may tax some of our income even though as a REIT we are not subject to federal income tax on that income because not all states and localities follow the federal income tax treatment of REITs. To the extent that we and our affiliates are required to pay federal, state and local taxes, we will have less cash available for distributions to you.
38
Investments in other REITs and real estate partnerships could subject us to the tax risks associated with the tax status of such entities.
We may invest in the securities of other REITs and real estate partnerships. Such investments are subject to the risk that any such REIT or partnership may fail to satisfy the requirements to qualify as a REIT or a partnership, as the case may be, in any given taxable year. In the case of a REIT, such failure would subject such entity to taxation as a corporation, may require such REIT to incur indebtedness to pay its tax liabilities, may reduce its ability to make distributions to us, and may render it ineligible to elect REIT status prior to the fifth taxable year following the year in which it fails to so qualify. In the case of a partnership, such failure could subject such partnership to an entity level tax and reduce the entity’s ability to make distributions to us. In addition, such failures could, depending on the circumstances, jeopardize our ability to qualify as a REIT.
Retirement Plan Risks
If the fiduciary of an employee benefit plan subject to ERISA (such as a profit sharing, Section 401(k) or pension plan) or an owner of a retirement arrangement subject to Section 4975 of the Internal Revenue Code (such as an individual retirement account (“IRA”)) fails to meet the fiduciary and other standards under ERISA or the Internal Revenue Code as a result of an investment in our stock, the fiduciary could be subject to penalties and other sanctions.
There are special considerations that apply to employee benefit plans subject to ERISA (such as profit sharing, Section 401(k) or pension plans) and other retirement plans or accounts subject to Section 4975 of the Internal Revenue Code (such as an IRA) that are investing in our shares. Fiduciaries and IRA owners investing the assets of such a plan or account in our common stock should satisfy themselves that:
• | the investment is consistent with their fiduciary and other obligations under ERISA and the Internal Revenue Code; |
• | the investment is made in accordance with the documents and instruments governing the plan or IRA, including the plan’s or account’s investment policy; |
• | the investment satisfies the prudence and diversification requirements of Sections 404(a)(1)(B) and 404(a)(1)(C) of ERISA and other applicable provisions of ERISA and the Internal Revenue Code; |
• | the investment in our shares, for which no public market currently exists, is consistent with the liquidity needs of the plan or IRA; |
• | the investment will not produce an unacceptable amount of “unrelated business taxable income” for the plan or IRA; |
• | our stockholders will be able to comply with the requirements under ERISA and the Internal Revenue Code to value the assets of the plan or IRA annually; and |
• | the investment will not constitute a prohibited transaction under Section 406 of ERISA or Section 4975 of the Internal Revenue Code. |
With respect to the annual valuation requirements described above, we will provide an estimated value for our common stock annually. We can make no claim whether such estimated value per share will or will not satisfy the applicable annual valuation requirements under ERISA and the Internal Revenue Code. The Department of Labor or the Internal Revenue Service may determine that a plan fiduciary or an IRA custodian is required to take further steps to determine the value of our common stock. In the absence of an appropriate determination of value, a plan fiduciary or an IRA custodian may be subject to damages, penalties or other sanctions. For information regarding our estimated value per share, see Part II, Item 5, “Market for Registrant’s Common Equity, Related Stockholder Matters, and Issuer Purchases of Equity Securities - Market Information” of this Annual Report on Form 10-K.
Failure to satisfy the fiduciary standards of conduct and other applicable requirements of ERISA and the Internal Revenue Code may result in the imposition of civil and criminal penalties and could subject the fiduciary to claims for damages or for equitable remedies, including liability for investment losses. In addition, if an investment in our shares constitutes a prohibited transaction under ERISA or the Internal Revenue Code, the fiduciary or IRA owner who authorized or directed the investment may be subject to the imposition of excise taxes with respect to the amount invested. In addition, the investment transaction must be undone. In the case of a prohibited transaction involving an IRA owner, the IRA may be disqualified as a tax-exempt account and all of the assets of the IRA may be deemed distributed and subjected to tax. ERISA plan fiduciaries and IRA owners should consult with counsel before making an investment in our common stock.
39
If our assets are deemed to be plan assets, our advisor and we may be exposed to liabilities under Title I of ERISA and the Internal Revenue Code.
In some circumstances where an ERISA plan holds an interest in an entity, the assets of the entity are deemed to be ERISA plan assets unless an exception applies. This is known as the “look-through rule.” Under those circumstances, the obligations and other responsibilities of plan sponsors, plan fiduciaries and plan administrators, and of parties in interest and disqualified persons, under Title I of ERISA or Section 4975 of the Internal Revenue Code, may be applicable, and there may be liability under these and other provisions of ERISA and the Internal Revenue Code. We believe that our assets should not be treated as plan assets because the shares should qualify as “publicly-offered securities” that are exempt from the look-through rules under applicable Treasury Regulations. We note, however, that because certain limitations are imposed upon the transferability of shares so that we may qualify as a REIT, and perhaps for other reasons, it is possible that this exemption may not apply. If that is the case, and if we or our advisor are exposed to liability under ERISA or the Internal Revenue Code, our performance and results of operations could be adversely affected. Stockholders should consult with their legal and other advisors concerning the impact of ERISA and the Internal Revenue Code on their investment and our performance.
The Department of Labor has issued a final regulation revising the definition of “fiduciary” under ERISA and the Internal Revenue Code, which may affect the marketing of investments in our shares.
On April 8, 2016, the Department of Labor issued a final regulation relating to the definition of a fiduciary under ERISA and Section 4975 of the Internal Revenue Code. The final regulation broadens the definition of fiduciary and is accompanied by new and revised prohibited transaction exemptions relating to investments by IRAs and benefit plans. The final regulation and the related exemptions will become applicable for investment transactions on and after April 10, 2017 (subject to delay in the application of the regulation), but generally should not apply to purchases of our shares before that date. The final regulation and the accompanying exemptions are complex, and benefit plan fiduciaries and the beneficial owners of IRAs are urged to consult with their own advisors regarding this development.
ITEM 1B. | UNRESOLVED STAFF COMMENTS |
We have no unresolved staff comments.
40
ITEM 2. | PROPERTIES |
As of December 31, 2016, we owned 28 office properties and one mixed-use office/retail property encompassing 11.0 million rentable square feet in the aggregate that were collectively 94% occupied with a weighted-average remaining lease term of 4.7 years. In addition, we had entered into the Hardware Village Joint Venture to develop and subsequently operate Hardware Village, which is currently under construction. The following table provides summary information regarding the properties owned by us as of December 31, 2016:
Property Location of Property | Date Acquired | Property Type | Rentable Square Feet | Total Real Estate at Cost (1) (in thousands) | Annualized Base Rent (2) (in thousands) | Average Annualized Base Rent per Square Foot (3) | Average Remaining Lease Term in Years | % of Total Assets | Occupancy | |||||||||||||||||||
Domain Gateway Austin, TX | 09/29/2011 | Office | 173,962 | $ | 47,373 | $ | 3,716 | $ | 21.36 | 2.7 | 1.1 | % | 100.0 | % | ||||||||||||||
Town Center Plano, TX | 03/27/2012 | Office | 522,043 | 117,254 | 12,685 | 24.37 | 3.4 | 3.0 | % | 99.7 | % | |||||||||||||||||
McEwen Building Franklin, TN | 04/30/2012 | Office | 175,262 | 38,534 | 4,081 | 27.59 | 3.0 | 1.0 | % | 84.4 | % | |||||||||||||||||
Gateway Tech Center Salt Lake City, UT | 05/09/2012 | Office | 199,361 | 24,935 | 4,764 | 23.96 | 3.0 | 0.6 | % | 99.8 | % | |||||||||||||||||
Tower on Lake Carolyn Irving, TX | 12/21/2012 | Office | 364,336 | 52,222 | 7,623 | 23.54 | 4.0 | 1.3 | % | 88.9 | % | |||||||||||||||||
RBC Plaza Minneapolis, MN | 01/31/2013 | Office | 709,690 | 150,579 | 11,376 | 17.32 | 6.3 | 3.9 | % | 92.5 | % | |||||||||||||||||
One Washingtonian Center Gaithersburg, MD | 06/19/2013 | Office | 314,175 | 90,211 | 9,646 | 31.30 | 7.0 | 2.5 | % | 98.1 | % | |||||||||||||||||
Preston Commons Dallas, TX | 06/19/2013 | Office | 427,799 | 115,767 | 11,205 | 27.45 | 3.0 | 3.1 | % | 95.4 | % | |||||||||||||||||
Sterling Plaza Dallas, TX | 06/19/2013 | Office | 313,609 | 79,333 | 7,333 | 27.36 | 3.1 | 2.2 | % | 85.5 | % | |||||||||||||||||
201 Spear Street San Francisco, CA | 12/03/2013 | Office | 252,591 | 135,751 | 13,856 | 56.49 | 3.1 | 3.9 | % | 97.1 | % | |||||||||||||||||
500 West Madison Chicago, IL | 12/16/2013 | Office | 1,457,724 | 440,172 | 35,373 | 25.29 | 4.4 | 12.1 | % | 95.9 | % | |||||||||||||||||
222 Main Salt Lake City, UT | 02/27/2014 | Office | 426,657 | 165,583 | 15,095 | 36.05 | 6.9 | 4.6 | % | 98.1 | % | |||||||||||||||||
Anchor Centre Phoenix, AZ | 05/22/2014 | Office | 333,014 | 92,721 | 7,991 | 26.43 | 4.7 | 2.6 | % | 90.8 | % | |||||||||||||||||
171 17th Street Atlanta, GA | 08/25/2014 | Office | 510,255 | 131,223 | 11,169 | 24.26 | 5.4 | 3.7 | % | 90.2 | % | |||||||||||||||||
Rocklin Corporate Center Rocklin, CA | 11/06/2014 | Office | 220,020 | 33,252 | 4,523 | 21.41 | 4.2 | 0.9 | % | 96.0 | % | |||||||||||||||||
Reston Square Reston, VA | 12/03/2014 | Office | 139,071 | 46,627 | 5,135 | 39.45 | 5.8 | 1.3 | % | 93.6 | % | |||||||||||||||||
Ten Almaden San Jose, CA | 12/05/2014 | Office | 309,255 | 121,716 | 11,204 | 36.23 | 2.8 | 3.5 | % | 100.0 | % | |||||||||||||||||
Towers at Emeryville Emeryville, CA | 12/23/2014 | Office | 815,018 | 261,054 | 26,312 | 35.81 | 2.7 | 7.5 | % | 90.1 | % | |||||||||||||||||
101 South Hanley St. Louis, MO | 12/24/2014 | Office | 360,505 | 67,526 | 8,486 | 24.80 | 5.4 | 1.9 | % | 94.9 | % | |||||||||||||||||
3003 Washington Boulevard Arlington, VA | 12/30/2014 | Office | 210,804 | 151,334 | 12,355 | 59.50 | 11.1 | 4.4 | % | 98.5 | % | |||||||||||||||||
Village Center Station Greenwood Village, CO | 05/20/2015 | Office | 234,915 | 78,039 | 5,891 | 25.08 | 3.6 | 2.3 | % | 100.0 | % | |||||||||||||||||
Park Place Village Leawood, KS | 06/18/2015 | Office/Retail | 483,054 | 129,509 | 13,904 | 29.80 | 6.7 | 3.8 | % | 96.6 | % | |||||||||||||||||
201 17th Street Atlanta, GA | 06/23/2015 | Office | 355,870 | 103,416 | 9,818 | 28.34 | 6.5 | 3.0 | % | 97.3 | % | |||||||||||||||||
Promenade I & II at Eilan San Antonio, TX | 07/14/2015 | Office | 205,773 | 62,471 | 4,142 | 21.83 | 5.0 | 1.8 | % | 92.2 | % | |||||||||||||||||
CrossPoint at Valley Forge Wayne, PA | 08/18/2015 | Office | 272,360 | 90,041 | 8,684 | 32.30 | 7.3 | 2.7 | % | 98.7 | % | |||||||||||||||||
515 Congress Austin, TX | 08/31/2015 | Office | 263,058 | 116,357 | 6,564 | 26.01 | 2.8 | 3.4 | % | 95.9 | % | |||||||||||||||||
The Almaden San Jose, CA | 09/23/2015 | Office | 416,126 | 162,745 | 12,101 | 31.91 | 4.1 | 4.9 | % | 91.1 | % | |||||||||||||||||
3001 Washington Boulevard Arlington, VA | 11/06/2015 | Office | 94,837 | 54,674 | 1,900 | 56.99 | 9.8 | 1.7 | % | 35.2 | % | |||||||||||||||||
Carillon Charlotte, NC | 01/15/2016 | Office | 488,243 | 151,377 | 11,237 | 25.20 | 4.6 | 4.6 | % | 91.4 | % | |||||||||||||||||
Hardware Village Salt Lake City, UT (4) | 08/26/2016 | Development/Apartment | N/A | 21,853 | N/A | N/A | N/A | 0.7 | % | N/A | ||||||||||||||||||
11,049,387 | $ | 3,333,649 | $ | 298,169 | $ | 28.71 | 4.7 | 94.0 | % | |||||||||||||||||||
_____________________
41
(1) Total real estate at cost represents the total cost of real estate net of write-offs of fully depreciated/amortized assets.
(2) Annualized base rent represents annualized contractual base rental income as of December 31, 2016, adjusted to straight-line any contractual tenant concessions (including free rent), rent increases and rent decreases from the lease’s inception through the balance of the lease term.
(3) Average annualized base rent per square foot is calculated as the annualized base rent divided by the leased square feet.
(4) On August 26, 2016, we entered into the Hardware Village Joint Venture to participate in the development and subsequent operation of Hardware Village. We own a 99.24% equity interest in the joint venture.
Portfolio Lease Expirations
The following table sets forth a schedule of expiring leases for our real estate portfolio by square footage and by annualized base rent as of December 31, 2016:
Year of Expiration | Number of Leases Expiring | Annualized Base Rent Expiring (1) (in thousands) | % of Portfolio Annualized Base Rent Expiring | Leased Square Feet Expiring | % of Portfolio Leased Square Feet Expiring | |||||||||||
Month to Month | 44 | $ | 4,046 | 1.4 | % | 296,289 | 2.7 | % | ||||||||
2017 | 155 | 28,657 | 9.6 | % | 992,973 | 9.6 | % | |||||||||
2018 | 143 | 25,587 | 8.6 | % | 883,500 | 8.5 | % | |||||||||
2019 | 150 | 44,545 | 14.9 | % | 1,576,457 | 15.2 | % | |||||||||
2020 | 111 | 30,610 | 10.3 | % | 1,163,228 | 11.2 | % | |||||||||
2021 | 106 | 28,866 | 9.7 | % | 1,108,617 | 10.7 | % | |||||||||
2022 | 77 | 33,273 | 11.2 | % | 1,069,369 | 10.3 | % | |||||||||
2023 | 41 | 26,546 | 8.9 | % | 940,310 | 9.1 | % | |||||||||
2024 | 37 | 18,920 | 6.3 | % | 649,106 | 6.3 | % | |||||||||
2025 | 26 | 23,170 | 7.8 | % | 690,809 | 6.7 | % | |||||||||
2026 | 26 | 13,159 | 4.4 | % | 435,465 | 4.2 | % | |||||||||
Thereafter | 19 | 20,790 | 6.9 | % | 577,741 | 5.5 | % | |||||||||
Total | 935 | $ | 298,169 | 100.0 | % | 10,383,864 | 100.0 | % | ||||||||
_____________________
(1) Annualized base rent represents annualized contractual base rental income as of December 31, 2016, adjusted to straight-line any contractual tenant concessions (including free rent), rent increases and rent decreases from the lease’s inception through the balance of the lease term.
As of December 31, 2016, our portfolio’s highest tenant industry concentration (greater than 10% of annualized base rent) was as follows:
Industry | Number of Tenants | Annualized Base Rent(1) (in thousands) | Percentage of Annualized Base Rent | ||||||
Finance | 170 | $ | 67,084 | 22.5 | % | ||||
(1) Annualized base rent represents annualized contractual base rental income as of December 31, 2016, adjusted to straight-line any contractual tenant concessions (including free rent), rent increases and rent decreases from the lease’s inception through the balance of the lease term.
As of December 31, 2016, no other tenant industries accounted for more than 10% of annualized base rent and no tenant accounted for more than 10% of the annualized base rent.
For more information about our real estate portfolio, see Part I, Item 1, “Business.”
ITEM 3. | LEGAL PROCEEDINGS |
From time to time, we are party to legal proceedings that arise in the ordinary course of our business. Management is not aware of any legal proceedings of which the outcome is reasonably likely to have a material adverse effect on our results of operations or financial condition, nor are we aware of any such legal proceedings contemplated by government authorities.
ITEM 4. | MINE SAFETY DISCLOSURES |
Not applicable.
42
PART II
ITEM 5. | MARKET FOR REGISTRANT’S COMMON EQUITY, RELATED STOCKHOLDER MATTERS AND ISSUER PURCHASES OF EQUITY SECURITIES |
Stockholder Information
As of March 8, 2017, we had 181.6 million shares of common stock outstanding held by a total of approximately 40,200 stockholders. The number of stockholders is based on the records of DST Systems, Inc., which serves as our transfer agent.
Market Information
No public market currently exists for our shares of common stock, and we currently have no plans to list our shares on a national securities exchange. Until our shares are listed, if ever, our stockholders may not sell their shares unless the buyer meets the applicable suitability and minimum purchase requirements. Any sale must comply with applicable state and federal securities laws. In addition, our charter prohibits the ownership of more than 9.8% of our stock by a single person, unless exempted by our board of directors. Consequently, there is the risk that our stockholders may not be able to sell their shares at a time or price acceptable to them.
We provide an estimated value per share to assist broker-dealers that participated in our initial public offering in meeting their customer account statement reporting obligations under NASD Conduct Rule 2340, as required by FINRA. This valuation was performed in accordance with the provisions of and also to comply with the IPA Valuation Guidelines. For this purpose, we estimated the value of the shares of our common stock as $10.63 per share as of December 31, 2016. This estimated value per share is based on our board of directors’ approval on December 9, 2016 of an estimated value per share of our common stock of $10.63 based on the estimated value of our assets less the estimated value of our liabilities, or net asset value, divided by the number of shares outstanding, all as of September 30, 2016. There were no other material changes between September 30, 2016 and December 9, 2016 that impacted the overall estimated value per share.
The conflicts committee, composed solely of all of our independent directors, is responsible for the oversight of the valuation process used to determine the estimated value per share of our common stock, including the review and approval of the valuation and appraisal processes and methodologies used to determine our estimated value per share, the consistency of the valuation and appraisal methodologies with real estate industry standards and practices and the reasonableness of the assumptions used in the valuations and appraisals. With the approval of the conflicts committee, we engaged Duff & Phelps, LLC (“Duff & Phelps”), an independent third party real estate valuation firm, to provide appraisals for each of our 29 real estate properties owned as of September 30, 2016 (the “Appraised Properties”) and to provide a calculation of the range in estimated value per share of our common stock as of December 9, 2016. Duff & Phelps based this range in estimated value per share upon (i) its appraisals of the Appraised Properties and (ii) valuations performed by our advisor of our cash, other assets, mortgage debt and other liabilities and the Hardware Village Joint Venture, which are disclosed in our Quarterly Report on Form 10-Q for the period ended September 30, 2016. The appraisal reports Duff & Phelps prepared summarized the key inputs and assumptions involved in the appraisal of each of the Appraised Properties. The methodologies and assumptions used to determine the estimated value of our assets and the estimated value of our liabilities are described further below.
The conflicts committee reviewed Duff & Phelps’ valuation report, which included an appraised value for each of the Appraised Properties and a summary of the estimated value of each of our other assets and our liabilities as determined by our advisor and reviewed by Duff & Phelps. In light of the valuation report and other factors considered by the conflicts committee and the conflicts committee’s own extensive knowledge of our assets and liabilities, the conflicts committee: (i) concluded that the range in estimated value per share of $9.77 to $11.50, with a mid-range value of $10.63 per share, as indicated in Duff & Phelps’ valuation report and recommended by our advisor, which mid-range value was based on Duff & Phelps’ appraisals of the Appraised Properties and valuations performed by our advisor of our cash, other assets, mortgage debt and other liabilities and the Hardware Village Joint Venture, was reasonable and (ii) recommended to our board of directors that it adopt $10.63 as the estimated value per share of our common stock, which represents the mid-range value determined by Duff & Phelps and recommended by our advisor and which was based on Duff & Phelps’ appraisals of the Appraised Properties and valuations performed by our advisor of our cash, other assets, mortgage debt and other liabilities and the Hardware Village Joint Venture. Our board of directors unanimously agreed to accept the recommendation of the conflicts committee and approved $10.63 as the estimated value per share of our common stock, which determination is ultimately and solely the responsibility of the board of directors.
43
The table below sets forth the calculation of our estimated value per share as of December 9, 2016 as well as the calculation of our prior estimated value per share as of December 8, 2015. Duff & Phelps was not responsible for the determination of the estimated value per share as of December 9, 2016 or December 8, 2015, respectively.
December 9, 2016 Estimated Value per Share | December 8, 2015 Estimated Value per Share (1) | Change in Estimated Value per Share | ||||||||||
Real estate properties (2) | $ | 20.51 | $ | 18.74 | $ | 1.77 | ||||||
Real estate-related investment | — | 0.12 | (0.12 | ) | ||||||||
Hardware Village Joint Venture | 0.08 | — | 0.08 | |||||||||
Cash (3) | 0.28 | 0.55 | (0.27 | ) | ||||||||
Other assets | 0.08 | 0.08 | — | |||||||||
Mortgage debt (4) | (9.72 | ) | (8.93 | ) | (0.79 | ) | ||||||
Other liabilities | (0.60 | ) | (0.51 | ) | (0.09 | ) | ||||||
Acquisition and deferred financing costs subsequent to September 30, 2015 | — | (0.01 | ) | 0.01 | ||||||||
Estimated value per share | $ | 10.63 | $ | 10.04 | $ | 0.59 | ||||||
Estimated enterprise value premium | None assumed | None assumed | None assumed | |||||||||
Total estimated value per share | $ | 10.63 | $ | 10.04 | $ | 0.59 | ||||||
(1) The December 8, 2015 estimated value per share was based upon a calculation of the range in estimated value per share of our common stock as of September 30, 2015 by Duff & Phelps and the recommendation of our advisor. Duff & Phelps based this range in estimated value per share upon its appraisals of our real estate properties held as of September 30, 2016 and valuations performed by our advisor with respect to our cash, real estate loan receivable, other assets, mortgage debt and other liabilities. For more information relating to the December 8, 2015 estimated value per share and the assumptions and methodologies used by Duff & Phelps and our advisor, see Part II, Item 5 of our Annual Report on Form 10-K for the year ended December 31, 2015 as filed with the SEC.
(2) The increase in the estimated value of real estate properties per share was primarily due to the acquisitions of real estate properties subsequent to September 30, 2015 and an increase in the appraised value of real estate properties acquired prior to September 30, 2016.
(3) The decrease in cash is primarily due to cash used for real estate acquisitions subsequent to September 30, 2015.
(4) The increase in the estimated value of mortgage debt per share was primarily due to the increase in mortgage debt outstanding related to real estate acquisitions through September 30, 2016.
The increase in our estimated value per share from the previous estimate was primarily due to the items noted in the table below, which reflect the significant contributors to the increase in the estimated value per share from $10.04 to $10.63. The changes are not equal to the change in values of each asset and liability group presented in the table above due to changes in the amount of shares outstanding, new investments and related financings and other factors, which caused the value of certain asset or liability groups to change with no impact to our fair value of equity or the overall estimated value per share.
Change in Estimated Value per Share | ||||
December 8, 2015 estimated value per share | $ | 10.04 | ||
Changes to estimated value per share | ||||
Real estate | ||||
Real estate | 1.03 | |||
Capital expenditures on real estate | (0.47 | ) | ||
Total change related to real estate | 0.56 | |||
Operating cash flows in excess of monthly distributions declared (1) | 0.05 | |||
Acquisition related costs and financing costs | (0.02 | ) | ||
Notes payable | 0.06 | |||
Interest rate swap liability | (0.05 | ) | ||
Other changes, net | (0.01 | ) | ||
Total change in estimated value per share | $ | 0.59 | ||
December 9, 2016 estimated value per share | $ | 10.63 | ||
_____________________
(1) Operating cash flow reflects modified funds from operations (“MFFO”) adjusted to add back the amortization of deferred financing costs. We compute MFFO in accordance with the definition included in the practice guideline issued by the IPA in November 2010.
44
As with any valuation methodology, the methodologies used are based upon a number of estimates and assumptions that may not be accurate or complete. Different parties using different assumptions and estimates could derive a different estimated value per share of our common stock, and this difference could be significant. The estimated value per share is not audited and does not represent the fair value of our assets less the fair value of our liabilities according to U.S. generally accepted accounting principles (“GAAP”), nor does it represent a liquidation value of our assets and liabilities or the price at which our shares of common stock would trade on a national securities exchange. The estimated value per share does not reflect a discount for the fact that we are externally managed, nor does it reflect a real estate portfolio premium/discount versus the sum of the individual property values. The estimated value per share also does not take into account estimated disposition costs and fees for real estate properties, debt prepayment penalties that could apply upon the prepayment of certain of our debt obligations, the impact of restrictions on the assumption of debt or swap breakage fees that may be incurred upon the termination of certain of our swaps prior to expiration. The estimated value per share does not take into consideration acquisition-related costs and financing costs related to future acquisitions. As of December 9, 2016, we had no potentially dilutive securities outstanding that would impact the estimated value per share of our common stock.
Our estimated value per share takes into consideration any potential liability related to a subordinated participation in cash flows our advisor is entitled to upon meeting certain stockholder return thresholds in accordance with the advisory agreement. For purposes of determining the estimated value per share, our advisor calculated the potential liability related to this incentive fee based on a hypothetical liquidation of the assets and liabilities at their estimated fair values, after considering the impact of any potential closing costs and fees related to the disposition of real estate properties, and determined that there would be no liability related to the subordinated participation in cash flows.
Methodology
Our goal for the valuation was to arrive at a reasonable and supportable estimated value per share, using a process that was designed to be in compliance with the IPA Valuation Guidelines and using what we and our advisor deemed to be appropriate valuation methodologies and assumptions. The following is a summary of the valuation and appraisal methodologies, assumptions and estimates used to value our assets and liabilities:
Real Estate
Independent Valuation Firm
Duff & Phelps(1) was engaged by our advisor and approved by our conflicts committee and board of directors to appraise each of the Appraised Properties and to provide a calculation of the range in estimated value per share of our common stock as of December 9, 2016. Duff & Phelps is engaged in the business of appraising commercial real estate properties and is not affiliated with us or our advisor. The compensation we paid to Duff & Phelps was based on the scope of work and not on the appraised values of the Appraised Properties. The appraisals were performed in accordance with the Code of Ethics and the Uniform Standards of Professional Appraisal Practice, or USPAP, the real estate appraisal industry standards created by The Appraisal Foundation, as well as the requirements of the state where each real property is located. Each appraisal was reviewed, approved and signed by an individual with the professional designation of MAI (Member of the Appraisal Institute). The use of the reports is subject to the requirements of the Appraisal Institute relating to review by its duly authorized representatives.
Duff & Phelps collected all reasonably available material information that it deemed relevant in appraising the Appraised Properties. Duff & Phelps obtained property-level information from our advisor, including (i) property historical and projected operating revenues and expenses; (ii) property lease agreements; and (iii) information regarding recent or planned capital expenditures. Duff & Phelps reviewed and relied in part on the property-level information provided by our advisor and considered this information in light of its knowledge of each property’s specific market conditions.
_____________________
(1) Duff & Phelps is actively engaged in the business of appraising commercial real estate properties similar to those owned by us in connection with public securities offerings, private placements, business combinations and similar transactions. We engaged Duff & Phelps to prepare appraisal reports for each of the Appraised Properties and to provide a calculation of the range in estimated value per share of our common stock and Duff & Phelps received fees upon the delivery of such reports and the calculation of the range in estimated value per share of our common stock. In addition, we have agreed to indemnify Duff & Phelps against certain liabilities arising out of this engagement. In the two years prior to the date of this filing, Duff & Phelps and its affiliates have provided a number of commercial real estate, appraisal, valuation and financial advisory services for our affiliates and have received fees in connection with such services. Duff & Phelps and its affiliates may from time to time in the future perform other commercial real estate, appraisal, valuation and financial advisory services for us and our affiliates in transactions related to the properties that are the subjects of the appraisals, so long as such other services do not adversely affect the independence of the applicable Duff & Phelps appraiser as certified in the applicable appraisal report.
45
In conducting its investigation and analyses, Duff & Phelps took into account customary and accepted financial and commercial procedures and considerations as it deemed relevant. Although Duff & Phelps reviewed information supplied or otherwise made available by us or our advisor for reasonableness, it assumed and relied upon the accuracy and completeness of all such information and of all information supplied or otherwise made available to it by any other party and did not independently verify any such information. With respect to operating or financial forecasts and other information and data provided to or otherwise reviewed by or discussed with Duff & Phelps, Duff & Phelps assumed that such forecasts and other information and data were reasonably prepared in good faith on bases reflecting the best currently available estimates and judgments of our management and/or our advisor. Duff & Phelps relied on us to advise it promptly if any information previously provided became inaccurate or was required to be updated during the period of its review.
In performing its analyses, Duff & Phelps made numerous other assumptions as of various points in time with respect to industry performance, general business, economic and regulatory conditions and other matters, many of which are beyond its and our control, as well as certain factual matters. For example, unless specifically informed to the contrary, Duff & Phelps assumed that we had clear and marketable title to each of the Appraised Properties, that no title defects existed, that any improvements were made in accordance with law, that no hazardous materials were present or had been present previously, that no deed restrictions existed, and that no changes to zoning ordinances or regulations governing use, density or shape were pending or being considered. Furthermore, Duff & Phelps’ analyses, opinions and conclusions were necessarily based upon market, economic, financial and other circumstances and conditions existing as of or prior to the date of the appraisals, and any material change in such circumstances and conditions may affect Duff & Phelps’ analyses and conclusions. Duff & Phelps’ appraisal reports contain other assumptions, qualifications and limitations that qualify the analyses, opinions and conclusions set forth therein. Furthermore, the prices at which the Appraised Properties may actually be sold could differ from their appraised values.
Although Duff & Phelps considered any comments to its appraisal reports received from us or our advisor, the appraised values of the Appraised Properties were determined by Duff & Phelps. The appraisal reports for the Appraised Properties are addressed solely to us to assist in the calculation of the range in estimated value per share of our common stock. The appraisal reports are not addressed to the public and may not be relied upon by any other person to establish an estimated value per share of our common stock and do not constitute a recommendation to any person to purchase or sell any shares of our common stock. In preparing its appraisal reports, Duff & Phelps did not solicit third-party indications of interest for the Appraised Properties. In preparing its appraisal reports and in calculating the range in estimated value per share of our common stock, Duff & Phelps did not, and was not requested to, solicit third-party indications of interest for our common stock in connection with possible purchases thereof or the acquisition of all or any part of us.
The foregoing is a summary of the standard assumptions, qualifications and limitations that generally apply to Duff & Phelps’ appraisal reports. All of the Duff & Phelps appraisal reports, including the analyses, opinions and conclusions set forth in such reports, are qualified by the assumptions, qualifications and limitations set forth in the respective appraisal reports.
Real Estate Valuation
Duff & Phelps appraised each of the Appraised Properties using various methodologies including the direct capitalization approach, discounted cash flow analyses and sales comparison approach and relied primarily on 10-year discounted cash flow analyses for the final appraisal of each of the Appraised Properties. Duff & Phelps calculated the discounted cash flow value of each of the Appraised Properties using property-level cash flow estimates, terminal capitalization rates and discount rates that fall within ranges it believes would be used by similar investors to value the Appraised Properties, based on recent comparable market transactions adjusted for unique properties and market-specific factors.
The Appraised Properties consist of 28 office properties and one mixed use office/retail property, which were acquired for a total purchase price of $3.2 billion, including $45.9 million of acquisition fees and acquisition expenses, and as of September 30, 2016, we had invested $214.1 million in capital and tenant improvements in the Appraised Properties. As of September 30, 2016, the total appraised value of the Appraised Properties as provided by Duff & Phelps using the appraisal methods described above was $3.7 billion. The total appraised value of the Appraised Properties, compared to the total acquisition cost of the Appraised Properties plus subsequent capital improvements through September 30, 2016, results in an overall increase in the value of the Appraised Properties of approximately 8.2%.
46
The following table summarizes the key assumptions that Duff & Phelps used in the discounted cash flow analyses to arrive at the appraised value of the Appraised Properties:
Range in Values | Weighted-Average Basis | |||
Terminal capitalization rate | 6.00% to 7.75% | 6.59% | ||
Discount rate | 6.50% to 8.75% | 7.53% | ||
Net operating income compounded annual growth rate (1) | (1.91)% to 23.58% | 4.11% | ||
_____________________
(1) The net operating income compounded annual growth rates (the “CAGRs”) reflect both the contractual and market rents and reimbursements (in cases where the contractual lease period is less than the hold period of the property) net of expenses over the hold period for each of the properties. The range of CAGRs shown is the constant annual rate at which the net operating income is projected to grow to reach the net operating income in the final year of the hold period for each of the properties.
While we believe that Duff & Phelps’ assumptions and inputs are reasonable, a change in these assumptions and inputs would significantly impact the appraised value of the Appraised Properties and thus, our estimated value per share. The table below illustrates the impact on our estimated value per share if the terminal capitalization rates or discount rates Duff & Phelps used to appraise the Appraised Properties were adjusted by 25 basis points, assuming all other factors remain unchanged. Additionally, the table below illustrates the impact on our estimated value per share if these terminal capitalization rates or discount rates were adjusted by 5% in accordance with the IPA Valuation Guidelines, assuming all other factors remain unchanged:
Increase (Decrease) on the Estimated Value per Share due to | ||||||||||||||||
Decrease of 25 basis points | Increase of 25 basis points | Decrease of 5% | Increase of 5% | |||||||||||||
Terminal capitalization rate | $ | 0.52 | $ | (0.48 | ) | $ | 0.62 | $ | (0.59 | ) | ||||||
Discount Rate | 0.41 | (0.39 | ) | 0.56 | (0.54 | ) | ||||||||||
Finally, a 1% increase in the appraised value of the Appraised Properties would result in an $0.21 increase in our estimated value per share and a 1% decrease in the appraised value of the Appraised Properties would result in a decrease of $0.21 to our estimated value per share, assuming all other factors remain unchanged.
Construction-in-Progress - Hardware Village
As of September 30, 2016, we had one real estate construction-in-progress project held through the Hardware Village Joint Venture in which we own a 99.24% equity interest and exercise control. The estimated value of our real estate construction in progress is equal to the GAAP carrying value as disclosed in our Quarterly Report on Form 10-Q for the period ended September 30, 2016. Under GAAP, all costs incurred related to real estate under construction that is necessary to bring the investment to its intended use are capitalized. The fair value and carrying value of our real estate construction in progress project was $14.9 million as of September 30, 2016.
Notes Payable
The estimated values of our notes payable are equal to the GAAP fair values disclosed in our Quarterly Report on Form 10-Q for the period ended September 30, 2016, but do not equal the book value of the loans in accordance with GAAP. Our advisor estimated the values of our notes payable using a discounted cash flow analysis. The discounted cash flow analysis was based on projected cash flow over the remaining loan terms, including extensions we expect to exercise, and on management’s estimates of current market interest rates for instruments with similar characteristics, including remaining loan term, loan-to-value ratio, type of collateral and other credit enhancements.
As of September 30, 2016, the GAAP fair value and the carrying value of our notes payable were $1.8 billion and $1.8 billion, respectively. The weighted-average discount rate applied to the future estimated debt payments was approximately 2.8%. Our notes payable have a weighted-average remaining term of 2.2 years.
The table below illustrates the impact on our estimated value per share if the discount rates our advisor used to value our notes payable were adjusted by 25 basis points, assuming all other factors remain unchanged. Additionally, the table below illustrates the impact on our estimated value per share if these discount rates were adjusted by 5% in accordance with the IPA Valuation Guidelines, assuming all other factors remain unchanged:
Increase (Decrease) on the Estimated Value per Share due to | ||||||||||||||||
Decrease of 25 basis points | Increase of 25 basis points | Decrease of 5% | Increase of 5% | |||||||||||||
Discount rate | $ | (0.05 | ) | $ | 0.05 | $ | (0.03 | ) | $ | 0.03 | ||||||
47
Other Assets and Liabilities
The carrying values of a majority of our other assets and liabilities are considered to equal their fair value due to their short maturities or liquid nature. The estimated value per share includes deductions for minority interests related to the Hardware Village Joint Venture. Certain balances, such as straight-line rent receivables, lease intangible assets and liabilities, accrued capital expenditures, deferred financing costs, unamortized lease commissions and unamortized lease incentives, have been eliminated for the purpose of the valuation due to the fact that the value of those balances was already considered in the valuation of the related asset or liability. Our advisor has also excluded redeemable common stock, as temporary equity does not represent a true liability to us and the shares that this amount represents are included in our total outstanding shares of common stock for purposes of calculating the estimated value per share of our common stock.
Limitations of the Estimated Value per Share
As mentioned above, we provided this estimated value per share to assist broker dealers that participated in our now-terminated initial public offering in meeting their customer account statement reporting obligations. The estimated value per share set forth above first appeared on the December 31, 2016 customer account statements mailed in January 2017. This valuation was performed in accordance with the provisions of and also to comply with the IPA Valuation Guidelines. As with any valuation methodology, the methodologies used are based upon a number of estimates and assumptions that may not be accurate or complete. Different parties with different assumptions and estimates could derive a different estimated value per share of our common stock, and this difference could be significant. The estimated value per share is not audited and does not represent the fair value of our assets less the fair value of our liabilities according to GAAP.
Accordingly, with respect to the estimated value per share, we can give no assurance that:
• | a stockholder would be able to resell his or her shares at our estimated value per share; |
• | a stockholder would ultimately realize distributions per share equal to our estimated value per share upon liquidation of our assets and settlement of our liabilities or a sale of our company; |
• | our shares of common stock would trade at the estimated value per share on a national securities exchange; |
• | another independent third-party appraiser or third-party valuation firm would agree with our estimated value per share; or |
• | the methodology used to determine our estimated value per share would be acceptable to FINRA or for compliance with ERISA reporting requirements. |
Further, the estimated value per share is based on the estimated value of our assets less the estimated value of our liabilities, divided by the number of shares outstanding, all as of September 30, 2016. We did not make any other adjustments to the estimated value per share subsequent to September 30, 2016, including any adjustments relating to the following, among others: (i) the issuance of common stock and the payment of related offering costs related to our dividend reinvestment plan offering; (ii) net operating income earned and distributions declared; and (iii) the redemption of shares. The value of our shares will fluctuate over time in response to developments related to future investments, the performance of individual assets in our portfolio and the management of those assets, the real estate and finance markets and due to other factors. Our estimated value per share does not reflect a discount for the fact that we are externally managed, nor does it reflect a real estate portfolio premium/discount versus the sum of the individual property values. Our estimated value per share does not take into account estimated disposition costs and fees for real estate properties, debt prepayment penalties that could apply upon the prepayment of certain of our debt obligations, the impact of restrictions on the assumption of debt or swap breakage fees that may be incurred upon the termination of certain of our swaps prior to expiration. The estimated value per share does not take into consideration acquisition-related costs and financing costs related to future acquisitions. We currently expect to utilize an independent valuation firm to update our estimated value per share in December 2017.
Historical Estimated Values per Share
The historical reported estimated values per share of our common stock approved by the board of directors are set forth below:
Estimated Value per Share | Effective Date of Valuation | Filing with the Securities and Exchange Commission | |||||
$10.04 | December 8, 2015 | Part II, Item 5 of our Annual Report on Form 10-K for the Year Ended December 31, 2015, filed March 14, 2016 | |||||
$9.42 | (1) | December 9, 2014 | Part II, Item 5 of our Annual Report on Form 10-K for the Year Ended December 31, 2014, filed March 9, 2015 | ||||
$9.29 | (1) | May 5, 2014 | Supplement no. 3 to our prospectus dated April 25, 2014 (Registration No. 333-164703), filed May 6, 2014 | ||||
_____________________
(1) Determined solely to be used as a component in calculating the offering prices in our now-terminated primary initial public offering.
48
Distribution Information
We have authorized and declared, and expect to continue to authorize and declare, distributions based on daily record dates, and we have paid, and expect to continue to pay, such distributions on a monthly basis. The rate is determined by our board of directors based on our financial condition and other factors our board of directors deems relevant. Our board of directors has not pre-established a percentage range of return for distributions to stockholders. We have not established a minimum distribution level, and our charter does not require that we pay distributions to our stockholders.
Generally, our policy is to pay distributions from cash flow from operations. From time to time during our operational stage, we may not pay distributions solely from our cash flow from operations. Further, because we may receive income from interest or rents at various times during our fiscal year and because we may need cash flow from operations during a particular period to fund capital expenditures and other expenses, we expect that, from time to time, we will declare distributions in anticipation of cash flow that we expect to receive during a later period and we will pay these distributions in advance of our actual receipt of these funds. In these instances, we have funded our distributions in part with an advance from our advisor and debt financing and we expect to utilize debt financing in the future, if necessary, to fund at least a portion of our distributions. We may also fund such distributions with proceeds from the sale of assets or from the maturity, payoff or settlement of debt investments. Our organizational documents permit us to pay distributions from any source, including offering proceeds or borrowings (which may constitute a return of capital), and our charter does not limit the amount of funds we may use from any source to pay such distributions. Our distribution policy is not to use the proceeds from an offering to pay distributions. If we pay distributions from sources other than our cash flow from operations, we will have less funds available for investment in properties and other assets and the overall return to our stockholders may be reduced.
Over the long-term, we expect that a greater percentage of our distributions will be paid from cash flow from operating activities and FFO from current or prior periods (except with respect to distributions related to sales of our assets and distributions related to the repayment of principal under real estate-related investments). However, our operating performance cannot be accurately predicted and may deteriorate in the future due to numerous factors, including those discussed under “Forward-Looking Statements”, Part I, Item 1, “Market Outlook - Real Estate and Real Estate Finance Markets”, Part I, Item 1A, “Risk Factors” and Part II, Item 7, “Management’s Discussion and Analysis of Financial Condition and Results of Operations - Results of Operations.” Those factors include: the future operating performance of our current and future real estate investments in the existing real estate and financial environment; the success and economic viability of our tenants; our ability to refinance existing indebtedness at comparable terms; changes in interest rates on any variable rate debt obligations we incur; and the level of participation in our dividend reinvestment plan. In the event our FFO and/or cash flow from operating activities decrease in the future, the level of our distributions may also decrease. In addition, future distributions declared and paid may exceed FFO and/or cash flow from operating activities.
We elected to be taxed as a REIT under the Internal Revenue Code and have operated as such beginning with our taxable year ended December 31, 2011. To maintain our qualification as a REIT, we must meet certain organizational and operational requirements, including a requirement to distribute at least 90% of our REIT taxable income (computed without regard to the dividends-paid deduction or net capital gain and which does not necessarily equal net income as calculated in accordance with GAAP). Our board of directors may authorize distributions in excess of those required for us to maintain REIT status depending on our financial condition and such other factors as our board of directors deems relevant.
During 2015 and 2016, we declared distributions based on daily record dates for each day during the periods commencing January 1, 2015 through February 28, 2016 and March 1, 2016 through December 31, 2016. We paid distributions for all record dates of a given month on or about the first business day of the following month. Distributions declared during 2016 and 2015, aggregated by quarter, are as follows (dollars in thousands, except per share amounts):
2016 | |||||||||||||||||||
1st Quarter | 2nd Quarter | 3rd Quarter | 4th Quarter | Total | |||||||||||||||
Total Distributions Declared | $ | 28,667 | $ | 29,160 | $ | 29,563 | $ | 29,635 | $ | 117,025 | |||||||||
Total Per Share Distribution (1) | $ | 0.160 | $ | 0.162 | $ | 0.164 | $ | 0.164 | $ | 0.650 | |||||||||
2015 | |||||||||||||||||||
1st Quarter | 2nd Quarter | 3rd Quarter | 4th Quarter | Total | |||||||||||||||
Total Distributions Declared | $ | 21,581 | $ | 26,609 | $ | 28,884 | $ | 29,115 | $ | 106,189 | |||||||||
Total Per Share Distribution (1) | $ | 0.160 | $ | 0.162 | $ | 0.164 | $ | 0.164 | $ | 0.650 | |||||||||
_____________________
(1) During the years ended December 31, 2015 and 2016, we declared distributions based on daily record dates for each day during the periods commencing January 1, 2015 through February 28, 2016 and March 1, 2016 through December 31, 2016. Distributions for these periods were calculated based on stockholders of record each day during the periods at a rate of $0.00178082 per share per day and equal a daily amount that, if paid each day for a 365-day period, would equal a 6.11% annualized rate based on the current estimated value per share of $10.63.
49
The tax composition of our distributions declared for the years ended December 31, 2016 and 2015 was as follows:
2016 | 2015 | ||||
Ordinary Income | 43 | % | 49 | % | |
Capital Gain | — | % | — | % | |
Return of Capital | 57 | % | 51 | % | |
Total | 100 | % | 100 | % | |
For more information with respect to our distributions paid, see Part II, Item 7, “Management’s Discussion and Analysis of Financial Condition and Results of Operations - Distributions.”
On November 7, 2016, our board of directors declared distributions based on daily record dates for the period from January 1, 2017 through January 31, 2017, which we paid on February 1, 2017. On January 27, 2017, our board of directors declared distributions based on daily record dates for the period from February 1, 2017 through February 28, 2017, which we paid on March 1, 2017, and distributions based on daily record dates for the period from March 1, 2017 through March 31, 2017, which we expect to pay in April 2017. On March 10, 2017, our board of directors declared distributions based on daily record dates for the period from April 1, 2017 through April 30, 2017, which we expect to pay in May 2017, and distributions based on daily record dates for the period from May 1, 2017 to May 31, 2017, which we expect to pay in June 2017. Stockholders may choose to receive cash distributions or purchase additional shares through our dividend reinvestment plan.
Distributions for these periods are calculated based on stockholders of record each day during these periods at a rate of $0.00178082 per share per day and equal a daily amount that, if paid each day for a 365-day period, would equal a 6.11% annualized rate based on the current estimated value per share of $10.63.
Use of Proceeds from Sales of Registered Securities and Unregistered Sales of Equity Securities
During the year ended December 31, 2016, we did not sell any equity securities that were not registered under the Securities Act of 1933.
Share Redemption Program
We have a share redemption program that may enable stockholders to sell their shares to us in limited circumstances. The restrictions of our share redemption program will severely limit our stockholders’ ability to sell their shares should they require liquidity and will limit our stockholders’ ability to recover the value they invested in our common stock or recover an amount equal to or greater than our estimated value per share.
There are several limitations on our ability to redeem shares under our share redemption program:
• | Unless the shares are being redeemed in connection with a Special Redemption, we may not redeem shares unless the stockholder has held the shares for one year. |
• | During any calendar year, we may redeem only the number of shares that we could purchase with the amount of net proceeds from the sale of shares under our dividend reinvestment plan during the prior calendar year. Notwithstanding anything contained in our share redemption program to the contrary, we may increase or decrease the funding available for the redemption of shares pursuant to the program upon ten business days’ notice to our stockholders. We may provide notice by including such information (a) in a Current Report on Form 8-K or in our annual or quarterly reports, all publicly filed with the SEC or (b) in a separate mailing to our stockholders. |
• | During any calendar year, we may redeem no more than 5% of the weighted-average number of shares outstanding during the prior calendar year. |
• | We have no obligation to redeem shares if the redemption would violate the restrictions on distributions under Maryland law, which prohibits distributions that would cause a corporation to fail to meet statutory tests of solvency. |
50
For a stockholder’s shares to be eligible for redemption in a given month, the administrator must receive a written redemption request from the stockholder or from an authorized representative of the stockholder setting forth the number of shares requested to be redeemed at least five business days before the redemption date. If we cannot redeem all shares presented for redemption in any month because of the limitations on redemptions set forth in our share redemption program, then we will honor redemption requests on a pro rata basis, except that if a pro rata redemption would result in a stockholder owning less than the minimum purchase requirement described in our currently effective, or the most recently effective, registration statement, as such registration statement has been amended or supplemented, then we would redeem all of such stockholder’s shares.
If we do not completely satisfy a redemption request on a redemption date because the program administrator did not receive the request in time, because of the limitations on redemptions set forth in our share redemption program or because of a suspension of our share redemption program, then we will treat the unsatisfied portion of the redemption request as a request for redemption at the next redemption date funds are available for redemption, unless the redemption request is withdrawn. Any stockholder can withdraw a redemption request by sending written notice to the program administrator, provided such notice is received at least five business days before the redemption date.
Upon a transfer of shares, any pending redemption requests with respect to such transferred shares will be canceled as of the date we accept the transfer. Stockholders wishing us to continue to consider a redemption request related to any transferred shares must resubmit their redemption request.
Pursuant to our share redemption program, redemptions made in connection with Special Redemptions are made at a price per share equal to the most recent estimated value per share of our common stock as of the applicable redemption date. The price at which we will redeem all other shares eligible for redemption is as follows:
• | For those shares held by the redeeming stockholder for at least one year, 92.5% of our most recent estimated value per share as of the applicable redemption date; |
• | For those shares held by the redeeming stockholder for at least two years, 95.0% of our most recent estimated value per share as of the applicable redemption date; |
• | For those shares held by the redeeming stockholder for at least three years, 97.5% of our most recent estimated value per share as of the applicable redemption date; and |
• | For those shares held by the redeeming stockholder for at least four years, 100% of our most recent estimated value per share as of the applicable redemption date. |
On December 8, 2015, our board of directors approved an estimated value per share of our common stock of $10.04 based on the estimated value of our assets less the estimated value of our liabilities divided by the number of shares outstanding, all as of September 30, 2015, with the exception of a reduction to our net asset value for acquisition fees and closing costs related to a real estate acquisition that closed subsequent to September 30, 2015 and deferred financing costs related to a mortgage loan that closed subsequent to September 30, 2015. This estimated value per share became effective for the December 2015 redemption date, which was December 31, 2015.
On December 9, 2016, our board of directors approved an estimated value per share of our common stock of $10.63 based on the estimated value of our assets less the estimated value of our liabilities divided by the number of shares outstanding, all as of September 30, 2016. This estimated value per share became effective for the December 2016 redemption date, which was December 30, 2016.
For purposes of determining the time period a redeeming stockholder has held each share, the time period begins as of the date the stockholder acquired the share; provided, that shares purchased by the redeeming stockholder pursuant to our dividend reinvestment plan will be deemed to have been acquired on the same date as the initial share to which the dividend reinvestment plan shares relate. The date of the share’s original issuance by us is not determinative. In addition, as described above, the shares owned by a stockholder may be redeemed at different prices depending on how long the stockholder has held each share submitted for redemption.
We currently expect to utilize an independent valuation firm to update our estimated value per share in December 2017. We will report the estimated value per share of our common stock in a Current Report on Form 8-K or in our annual or quarterly reports, all publicly filed with the SEC. We will also provide information about our estimated value per share on our website (such information may be provided by means of a link to our public filings on the SEC’s website, www.sec.gov).
Our board may amend, suspend or terminate our share redemption program upon 30 days’ notice to stockholders, provided that we may increase or decrease the funding available for the redemption of shares pursuant to our share redemption program upon 10 business days’ notice. The complete share redemption program document is filed as an exhibit to our Annual Report on Form 10-K for the year ended December 31, 2013 and is available at the SEC’s website at www.sec.gov.
51
During the year ended December 31, 2016, we fulfilled all redemption requests eligible for redemption under our share redemption program and received in good order. We funded redemptions under our share redemption program with the net proceeds from our dividend reinvestment plan. We redeemed shares pursuant to our share redemption program as follows:
Month | Total Number of Shares Redeemed (1) | Average Price Paid Per Share (2) | Approximate Dollar Value of Shares Available That May Yet Be Redeemed Under the Program | ||||||
January 2016 | 151,856 | $ | 9.67 | (3) | |||||
February 2016 | 124,749 | $ | 9.71 | (3) | |||||
March 2016 | 194,195 | $ | 9.74 | (3) | |||||
April 2016 | 176,038 | $ | 9.63 | (3) | |||||
May 2016 | 249,568 | $ | 9.78 | (3) | |||||
June 2016 | 373,657 | $ | 9.69 | (3) | |||||
July 2016 | 512,961 | $ | 9.76 | (3) | |||||
August 2016 | 586,058 | $ | 9.85 | (3) | |||||
September 2016 | 308,830 | $ | 9.81 | (3) | |||||
October 2016 | 322,764 | $ | 9.88 | (3) | |||||
November 2016 | 251,370 | $ | 9.82 | (3) | |||||
December 2016 | 286,003 | $ | 10.36 | (3) | |||||
Total | 3,538,049 | ||||||||
(1) We announced the adoption and commencement of the program on October 14, 2010. We announced amendments to the program on March 8, 2013 (which amendment became effective on April 7, 2013) and on March 7, 2014 (which amendment became effective on April 6, 2014).
(2) The prices at which we redeem shares under the program are as set forth above.
(3) We limit the dollar value of shares that may be redeemed under the program as described above. One of these limitations is that during each calendar year, our share redemption program limits the number of shares we may redeem to those that we could purchase with the amount of net proceeds from the sale of shares under our dividend reinvestment plan during the prior calendar year. However, we may increase or decrease the funding available for the redemption of shares upon ten business days’ notice to our stockholders. In 2015, our net proceeds from the dividend reinvestment plan were $55.4 million. During the year ended December 31, 2016, we redeemed $34.8 million of shares of common stock. Based on the amount of net proceeds raised from the sale of shares under our dividend reinvestment plan during 2016, we have $61.9 million available for redemptions of shares eligible for redemption in 2017.
52
ITEM 6. | SELECTED FINANCIAL DATA |
The following selected financial data as of and for the years ended December 31, 2016, 2015, 2014, 2013 and 2012 should be read in conjunction with the accompanying consolidated financial statements and related notes thereto and Part II, Item 7, “Management’s Discussion and Analysis of Financial Condition and Results of Operations” (in thousands, except share and per share amounts):
December 31, | ||||||||||||||||||||
2016 | 2015 | 2014 | 2013 | 2012 | ||||||||||||||||
Balance sheet data | ||||||||||||||||||||
Total real estate and real estate-related investments, net | $ | 2,988,855 | $ | 2,933,721 | $ | 2,217,090 | $ | 1,247,319 | $ | 318,661 | ||||||||||
Total assets | 3,182,676 | 3,133,874 | 2,375,288 | 1,305,447 | 348,481 | |||||||||||||||
Notes payable, net | 1,783,468 | 1,640,654 | 1,311,751 | 724,743 | 118,896 | |||||||||||||||
Total liabilities | 1,927,429 | 1,791,675 | 1,412,863 | 790,216 | 136,456 | |||||||||||||||
Redeemable common stock | 61,871 | 55,367 | 29,329 | 12,414 | 4,804 | |||||||||||||||
Total equity | 1,193,376 | 1,286,832 | 933,096 | 502,817 | 207,221 | |||||||||||||||
For the Years Ended December 31, | ||||||||||||||||||||
2016 | 2015 | 2014 | 2013 | 2012 | ||||||||||||||||
Operating data | ||||||||||||||||||||
Total revenues | $ | 400,407 | $ | 315,709 | $ | 188,896 | $ | 80,423 | $ | 27,283 | ||||||||||
Net income (loss) attributable to common stockholders | 763 | (29,015 | ) | (12,352 | ) | (21,637 | ) | (7,682 | ) | |||||||||||
Net income (loss) per common share attributable to common stockholders - basic and diluted | — | (0.18 | ) | (0.14 | ) | (0.50 | ) | (0.40 | ) | |||||||||||
Other data | ||||||||||||||||||||
Cash flows provided by operating activities | 114,157 | 97,521 | 53,954 | 20,164 | 7,657 | |||||||||||||||
Cash flows used in investing activities | (198,884 | ) | (831,986 | ) | (1,035,952 | ) | (938,610 | ) | (233,423 | ) | ||||||||||
Cash flows provided by financing activities | 48,553 | 739,964 | 1,051,552 | 928,117 | 212,105 | |||||||||||||||
Distributions declared | 117,025 | 106,189 | 59,481 | 28,309 | 12,525 | |||||||||||||||
Distributions declared per common share (1) | 0.650 | 0.650 | 0.650 | 0.650 | 0.650 | |||||||||||||||
Weighted-average number of common shares outstanding, basic and diluted | 180,043,027 | 163,358,289 | 91,374,493 | 43,547,227 | 19,253,338 | |||||||||||||||
Reconciliation of funds from operations (2) | ||||||||||||||||||||
Net income (loss) | $ | 763 | $ | (29,015 | ) | $ | (12,352 | ) | $ | (21,637 | ) | $ | (7,682 | ) | ||||||
Depreciation of real estate assets | 77,676 | 56,957 | 30,088 | 11,445 | 4,150 | |||||||||||||||
Amortization of lease-related costs | 83,688 | 79,978 | 49,475 | 23,935 | 9,715 | |||||||||||||||
Gain on sale of real estate, net | — | — | (10,894 | ) | — | — | ||||||||||||||
FFO | $ | 162,127 | $ | 107,920 | $ | 56,317 | $ | 13,743 | $ | 6,183 | ||||||||||
_____________________
(1) Distributions declared per common share assumes each share was issued and outstanding each day for the periods presented. Distributions for the periods from January 1, 2012 through February 28, 2012, March 1, 2012 through February 28, 2016 and March 1, 2016 through December 31, 2016 were based on daily record dates and calculated at a rate of $0.00178082 per share per day.
(2) We believe that funds from operations (“FFO”) is a beneficial indicator of the performance of an equity REIT. We compute FFO in accordance with the current National Association of Real Estate Investment Trusts (“NAREIT”) definition. FFO represents net income, excluding gains and losses from sales of operating real estate assets (which can vary among owners of identical assets in similar conditions based on historical cost accounting and useful-life estimates), impairment losses on real estate assets, depreciation and amortization of real estate assets, and adjustments for unconsolidated partnerships and joint ventures. We believe FFO facilitates comparisons of operating performance between periods and among other REITs. However, our computation of FFO may not be comparable to other REITs that do not define FFO in accordance with the NAREIT definition or that interpret the current NAREIT definition differently than we do. Our management believes that historical cost accounting for real estate assets in accordance with GAAP implicitly assumes that the value of real estate assets diminishes predictably over time. Since real estate values have historically risen or fallen with market conditions, many industry investors and analysts have considered the presentation of operating results for real estate companies that use historical cost accounting to be insufficient by themselves. As a result, we believe that the use of FFO, together with the required GAAP presentations, provides a more complete understanding of our performance relative to our competitors and provides a more informed and appropriate basis on which to make decisions involving operating, financing, and investing activities.
FFO is a non-GAAP financial measure and does not represent net income as defined by GAAP. Net income as defined by GAAP is the most relevant measure in determining our operating performance because FFO includes adjustments that investors may deem subjective, such as adding back expenses such as depreciation and amortization. Investors should exercise caution when using non-GAAP performance measures, such as FFO, to make investment decisions. Accordingly, FFO should not be considered as an alternative to net income as an indicator of our operating performance.
53
ITEM 7. | MANAGEMENT’S DISCUSSION AND ANALYSIS OF FINANCIAL CONDITION AND RESULTS OF OPERATIONS |
The following discussion and analysis should be read in conjunction with the “Selected Financial Data” above and our accompanying consolidated financial statements and the notes thereto. Also see “Forward-Looking Statements” preceding Part I and Part I, Item 1A, “Risk Factors.”
Overview
We were formed on December 22, 2009 as a Maryland corporation that elected to be taxed as a REIT beginning with the taxable year ended December 31, 2011 and we intend to continue to operate in such a manner. We conduct our business primarily through our Operating Partnership, of which we are the sole general partner. Subject to certain restrictions and limitations, our business is managed by our advisor pursuant to an advisory agreement and our advisor conducts our operations and manages our portfolio of real estate investments. Our advisor owns 20,000 shares of our common stock. We have no paid employees.
We have invested in a diverse portfolio of real estate investments. As of December 31, 2016, we owned 28 office properties and one mixed-use office/retail property and had entered into the Hardware Village Joint Venture with a developer to develop and subsequently operate Hardware Village, which is currently under construction.
On February 4, 2010, we filed a registration statement on Form S-11 with the SEC to offer a minimum of 250,000 shares and a maximum of up to 280,000,000 shares, or up to $2,760,000,000 of shares, of common stock for sale to the public, of which up to 200,000,000 shares, or up to $2,000,000,000 of shares, were registered in our primary offering and up to 80,000,000 shares, or up to $760,000,000 of shares, were registered under our dividend reinvestment plan. We ceased offering shares of common stock in our primary offering on May 29, 2015 and terminated the primary offering on July 28, 2015 upon the completion of review of subscriptions submitted in accordance with our processing procedures. We sold 169,006,162 shares of common stock in our now-terminated primary initial public offering for gross offering proceeds of $1.7 billion. As of December 31, 2016, we had also sold 16,973,229 shares of common stock under our dividend reinvestment plan for gross offering proceeds of $165.0 million. Also as of December 31, 2016, we had redeemed 5,367,281 shares sold in our initial public offering for $52.5 million.
Additionally, on October 3, 2014, we issued 258,462 shares of common stock, for $2.4 million, in private transactions exempt from the registration requirements pursuant to Section 4(a)(2) of the Securities Act of 1933.
We continue to offer shares under our dividend reinvestment plan. In some states, we will need to renew the registration statement annually or file a new registration statement to continue the dividend reinvestment plan offering. We may terminate our dividend reinvestment plan offering at any time.
Market Outlook – Real Estate and Real Estate Finance Markets
The following discussion is based on management’s beliefs, observations and expectations with respect to the real estate and real estate finance markets.
Conditions in the global capital markets remain volatile as of the first quarter of 2017. Current economic data and financial market developments suggest that the global economy is improving, although at a slow and uneven pace. European economic growth has recently picked up, whereas the U.K. and China remain areas of concern. Against this backdrop, the central banks of the world’s major industrialized economies are beginning to back away from their strong monetary accommodation. Quantitative easing in Japan and Europe is slowing, but the liquidity generated from these programs continues to impact the global capital markets.
For further discussion of current market conditions, see Part I, Item 1, “Business ─ Market Outlook ─ Real Estate and Real Estate Finance Markets.”
Impact on Our Real Estate Properties
The volatility in the global financial markets continues to cause a level of uncertainty in our outlook for the performance of the U.S. commercial real estate markets. Both the investing and leasing environments are highly competitive. While foreign capital continues to flow into U.S. real estate markets, the uncertainty regarding the political, regulatory and economic environments has introduced uncertainty into the markets. Possible future declines in rental rates, slower or potentially negative net absorption of leased space and expectations of future rental concessions, including free rent to renew tenants early, to retain tenants who are up for renewal or to attract new tenants, may result in decreases in cash flows. Historically low interest rates could help offset some of the impact of these potential decreases in operating cash flow for properties financed with variable rate mortgages; however, interest rates in the United States have started to increase. The FED increased interest rates in the fourth quarter of 2015 and again in December 2016. The real estate and finance markets anticipate further rate increases as long as the economy remains strong. If this trend continues, management will review our debt financing strategies to optimize the cost of our debt exposure.
54
Impact on Our Financing Activities
In light of the risks associated with potentially volatile operating cash flows from some of our real estate properties, and the possible increase in the cost of financing due to higher interest rates, we may have difficulty refinancing some of our debt obligations prior to or at maturity or we may not be able to refinance these obligations at terms as favorable as the terms of our existing indebtedness. Short-term interest rates in the United States have increased. Market conditions can change quickly, potentially negatively impacting the value of our investments.
As of December 31, 2016, we had debt obligations in the aggregate principal amount of $1.8 billion, with a weighted-average remaining term of 2.2 years. Our debt obligations consisted of $194.3 million of fixed rate notes payable and $1.6 billion of variable rate notes payable. As of December 31, 2016, the interest rates on $919.5 million of our variable rate notes payable are effectively fixed through interest rate swap agreements. In addition, we entered into eight interest rate swaps with an aggregate notional amount of $363.8 million, which will become effective at various times during 2017 through 2018. We also had an interest rate cap for a notional amount of $147.3 million that terminated on January 1, 2017.
Liquidity and Capital Resources
We sold 169,006,162 shares of common stock in our now-terminated primary initial public offering for gross offering proceeds of $1.7 billion. As of December 31, 2016, we had also sold 16,973,229 shares of common stock under our dividend reinvestment plan for gross offering proceeds of $165.0 million. Also as of December 31, 2016, we had redeemed 5,367,281 shares sold in our initial public offering for $52.5 million. We ceased offering shares of common stock in our primary offering on May 29, 2015 and terminated our primary offering on July 28, 2015.
We continue to offer shares under our dividend reinvestment plan. In some states, we will need to renew the registration statement annually or file a new registration statement to continue the dividend reinvestment plan offering. We may terminate our dividend reinvestment plan offering at any time.
We have invested all of the proceeds from our now-terminated primary initial public offering, net of selling commissions and dealer manager fees and other organization and offering costs, and proceeds from debt financing, in a diverse portfolio of real estate investments. To date, proceeds from our dividend reinvestment plan have been used primarily to fund redemptions of shares under our share redemption program and for capital expenditures on our real estate investments.
Our principal demands for funds during the short and long-term are and will be for the acquisition of additional real estate investments; operating expenses, capital expenditures and general and administrative expenses; payments under debt obligations; redemptions of common stock; capital commitments and development expenses under our joint venture agreement; and payments of distributions to stockholders. Our primary sources of capital for meeting our cash requirements are as follows:
• | Cash flow generated by our real estate investments; |
• | Debt financings (including amounts currently available under existing loan facilities); and |
• | Proceeds from common stock issued under our dividend reinvestment plan. |
Our real estate properties generate cash flow in the form of rental revenues and tenant reimbursements, which are reduced by operating expenditures, capital expenditures, debt service payments, the payment of asset management fees and corporate general and administrative expenses. Cash flow from operations from our real estate properties is primarily dependent upon the occupancy level of our portfolio, the net effective rental rates on our leases, the collectability of rent and operating recoveries from our tenants and how well we manage our expenditures. As of December 31, 2016, we owned 28 office properties and one mixed-use office/retail property that were collectively 94% occupied. In addition, we had entered into the Hardware VIllage Joint Venture to develop and subsequently operate Hardware Village, which is currently under construction.
As of December 31, 2016, we had mortgage debt obligations in the aggregate principal amount of $1.8 billion, with a weighted-average remaining term of 2.2 years. The maturity dates of certain loans may be extended beyond their current maturity date, subject to certain terms and conditions contained in the loan documents. Assuming our notes payable are fully extended under the terms of the respective loan agreements and other loan documents, we have $1.9 million of debt obligations maturing during the 12 months ending December 31, 2017. As of December 31, 2016, we had $126.5 million of revolving debt available for immediate future disbursement under a portfolio loan, subject to certain conditions set forth in the loan agreement.
We paid distributions to our stockholders during the year ended December 31, 2016 using cash flow from operations from current and prior periods and debt financing. We believe that our cash flow from operations, cash on hand, proceeds from our dividend reinvestment plan, proceeds from the sale of real estate and current and anticipated financing activities are sufficient to meet our liquidity needs for the foreseeable future.
55
Under our charter, we are required to limit our total operating expenses to the greater of 2% of our average invested assets or 25% of our net income for the four most recently completed fiscal quarters, as these terms are defined in our charter, unless the conflicts committee has determined that such excess expenses were justified based on unusual and non-recurring factors. Operating expenses for the four fiscal quarters ended December 31, 2016 did not exceed the charter-imposed limitation.
Cash Flows from Operating Activities
We commenced operations in connection with our first investment on June 24, 2011. As of December 31, 2016, we owned 28 office properties and one mixed-use office/retail property and had entered into the Hardware Village Joint Venture to develop and subsequently operate Hardware Village, which is currently under construction. During the year ended December 31, 2016, net cash provided by operating activities was $114.2 million, compared to net cash provided by operating activities of $97.5 million during the year ended December 31, 2015. Net cash provided by operating activities increased in 2016 primarily as a result of the growth in our real estate portfolio.
Cash Flows from Investing Activities
Net cash used in investing activities was $198.9 million for the year ended December 31, 2016 and primarily consisted of the following:
• | $141.8 million for the acquisition of one real estate property; |
• | $67.3 million of improvements to real estate; |
• | $22.5 million of cash received from the repayment of our real estate loan receivable, partially offset by advances on loan receivable of $0.5 million; and |
• | $11.8 million of payments for construction-in-progress. |
Cash Flows from Financing Activities
Our cash flows from financing activities consist primarily of debt financings and distributions paid to our stockholders. During the year ended December 31, 2016, net cash provided by financing activities was $48.6 million and primarily consisted of the following:
• | $137.8 million of net cash provided by debt financing as a result of proceeds from notes payable of $248.5 million, partially offset by principal payments on notes payable of $108.5 million and payments of deferred financing costs of $2.2 million; |
• | $55.0 million of net cash distributions, after giving effect to distributions reinvested by stockholders of $61.9 million; |
• | $34.8 million of cash used for redemptions of common stock; and |
• | $0.3 million of cash provided by noncontrolling interest contributions. |
We expect that our debt financing and other liabilities will be between 35% and 65% of the cost of our tangible assets (before deducting depreciation and other non-cash reserves). We expect our debt financing related to the acquisition of core real estate properties to be between 45% and 65% of the aggregate cost of all such assets. We expect our debt financing related to the acquisition or origination of real estate-related investments to be between 0% and 65% of the aggregate cost of all such assets, depending upon the availability of such financings in the marketplace. There is no limitation on the amount we may borrow for the purchase of any single asset. We limit our total liabilities to 75% of the cost of our tangible assets (before deducting depreciation and other non-cash reserves), meaning that our borrowings and other liabilities may exceed our maximum target leverage of 65% of the cost of our tangible assets without violating these borrowing restrictions. We may exceed the 75% limit only if a majority of the conflicts committee approves each borrowing in excess of this limitation and we disclose such borrowings to our stockholders in our next quarterly report with an explanation from the conflicts committee of the justification for the excess borrowing. To the extent financing in excess of this limit is available on attractive terms, our conflicts committee may approve debt in excess of this limit. From time to time, our total liabilities could also be below 35% of the cost of our tangible assets due to the lack of availability of debt financing. As of December 31, 2016, our borrowings and other liabilities were approximately 55% of both the cost (before deducting depreciation and other noncash reserves) and book value (before deducting depreciation) of our tangible assets, respectively.
In addition to making investments in accordance with our investment objectives, we expect to use our capital resources to make certain payments to our advisor and we have made certain payments to our dealer manager. During our acquisition and development stage, we expect to make payments to our advisor in connection with the selection and acquisition or origination of investments, the management of our investments and costs incurred by our advisor in providing services to us. We also pay fees to our advisor in connection with the disposition of investments.
56
Among the fees payable to our advisor is an asset management fee. With respect to investments in real property, the asset management fee is a monthly fee equal to one-twelfth of 0.75% of the amount paid or allocated to acquire the investment, plus the cost of any subsequent development, construction or improvements to the property. This amount includes any portion of the investment that was debt financed and is inclusive of acquisition expenses related thereto (but excludes acquisition fees paid or payable to our advisor). In the case of investments made through joint ventures, the asset management fee will be determined based on our proportionate share of the underlying investment (but excluding acquisition fees paid to our advisor). With respect to investments in loans and any investments other than real property, the asset management fee is a monthly fee calculated, each month, as one-twelfth of 0.75% of the lesser of (i) the amount actually paid or allocated to acquire or fund the loan or other investment (which amount includes any portion of the investment that was debt financed and is inclusive of acquisition or origination expenses related thereto but is exclusive of acquisition or origination fees paid or payable to our advisor) and (ii) the outstanding principal amount of such loan or other investment, plus the acquisition or origination expenses related to the acquisition or funding of such investment (excluding acquisition or origination fees paid or payable to our advisor), as of the time of calculation.
Pursuant to the advisory agreement, with respect to asset management fees accruing from March 1, 2014, our advisor agreed to defer, without interest, our obligation to pay asset management fees for any month in which our MFFO for such month, as such term is defined in the practice guideline issued by the IPA in November 2010 and interpreted by us, excluding asset management fees, does not exceed the amount of distributions declared by us for record dates of that month. We remain obligated to pay our advisor an asset management fee in any month in which our MFFO, excluding asset management fees, for such month exceeds the amount of distributions declared for the record dates of that month (such excess amount, an “MFFO Surplus”); however, any amount of such asset management fee in excess of the MFFO Surplus will also be deferred under the advisory agreement. If the MFFO Surplus for any month exceeds the amount of the asset management fee payable for such month, any remaining MFFO Surplus will be applied to pay any asset management fee amounts previously deferred in accordance with the advisory agreement.
As of December 31, 2016, we had reimbursed our advisor for all accrued and deferred asset management fees in accordance with the terms noted above. The amount of asset management fees deferred, if any, will vary on a month-to-month basis and the total amount of asset management fees deferred as well as the timing of the deferrals and repayments are difficult to predict as they will depend on the amount of and terms of the debt we use to acquire assets, the level of operating cash flow generated by our real estate investments and other factors. In addition, deferrals and repayments may occur in the same period, and it is possible that there could be additional deferrals in the future. As of December 31, 2016, we had $2.1 million of asset management fees payable related to asset management fees incurred for the month of December 2016, which were subsequently paid in January 2017.
However, notwithstanding the foregoing, any and all deferred asset management fees that are unpaid will become immediately due and payable at such time as our stockholders have received, together as a collective group, aggregate distributions (including distributions that may constitute a return of capital for federal income tax purposes) sufficient to provide (i) an 8% per year cumulative, noncompounded return on net invested capital (the “Stockholders’ 8% Return”) and (ii) a return of their net invested capital, or the amount calculated by multiplying the total number of shares purchased by stockholders by the issue price, reduced by any amounts to repurchase shares pursuant to our share redemption program. The Stockholders’ 8% Return is not based on the return provided to any individual stockholder. Accordingly, it is not necessary for each of our stockholders to have received any minimum return in order for our advisor to receive deferred asset management fees.
On September 27, 2016, we and our advisor renewed the advisory agreement. The advisory agreement has a one-year term but may be renewed for an unlimited number of successive one-year periods upon the mutual consent of our advisor and our conflicts committee.
57
Contractual Commitments and Contingencies
The following is a summary of our contractual obligations as of December 31, 2016 (in thousands):
Payments Due During the Years Ended December 31, | ||||||||||||||||||||
Contractual Obligations | Total | 2017 | 2018-2019 | 2020-2021 | Thereafter | |||||||||||||||
Outstanding debt obligations (1) | $ | 1,793,405 | $ | 298,405 | $ | 947,419 | $ | 366,992 | $ | 180,589 | ||||||||||
Interest payments on outstanding debt obligations (2) | 120,704 | 47,722 | 50,955 | 19,881 | 2,146 | |||||||||||||||
Development obligations | 86,000 | (3) | (3) | — | — | |||||||||||||||
_____________________
(1) Amounts include principal payments only.
(2) Projected interest payments are based on the outstanding principal amounts, maturity dates and interest rates in effect as of December 31, 2016 (consisting of the contractual interest rate and the effect of interest rate swaps, if applicable). We incurred interest expense of $48.3 million, excluding amortization of deferred financing costs totaling $5.1 million and unrealized gain on derivatives of $1.6 million and including interest capitalized of $0.2 million during the year ended December 31, 2016.
(3) We have entered into the Hardware Village Joint Venture to develop and subsequently operate Hardware Village and expect to incur approximately $86.0 million in development obligations through 2018.
Results of Operations
Overview
As of December 31, 2015, we owned 27 office properties, one mixed-use office/retail property and one real estate loan receivable. As of December 31, 2016, we owned 28 office properties, one mixed-use office/retail property and had entered into the Hardware Village Joint Venture to develop and subsequently operate Hardware Village, which is currently under construction. During the year ended December 31, 2016, the Aberdeen First Mortgage Origination was paid off. In general, we expect that our income and expenses related to our portfolio will increase in future periods as a result of owning the real estate investments acquired in 2016 for an entire period, the development and subsequent operation of Hardware Village and Village Center Station II and possible future real estate investments. As a result, the results of operations presented for the years ended December 31, 2016 and 2015 are not directly comparable due to our acquisition and development activity.
Comparison of the year ended December 31, 2016 versus the year ended December 31, 2015
The following table provides summary information about our results of operations for the years ended December 31, 2016 and 2015 (dollar amounts in thousands):
For the Years Ended December 31, | Increase (Decrease) | Percentage Change | $ Change Due to Acquisitions and Payoffs (1) | $ Change Due to Properties Held Throughout Both Periods (2) | |||||||||||||||||||
2016 | 2015 | ||||||||||||||||||||||
Rental income | $ | 307,568 | $ | 245,772 | $ | 61,796 | 25 | % | $ | 50,716 | $ | 11,080 | |||||||||||
Tenant reimbursements | 70,856 | 53,960 | 16,896 | 31 | % | 11,492 | 5,404 | ||||||||||||||||
Interest income from real estate loan receivable | 831 | 1,603 | (772 | ) | (48 | )% | (772 | ) | — | ||||||||||||||
Other operating income | 21,152 | 14,374 | 6,778 | 47 | % | 6,051 | 727 | ||||||||||||||||
Operating, maintenance and management costs | 93,580 | 75,319 | 18,261 | 24 | % | 17,213 | 1,048 | ||||||||||||||||
Real estate taxes and insurance | 61,090 | 50,320 | 10,770 | 21 | % | 8,541 | 2,229 | ||||||||||||||||
Asset management fees to affiliate | 24,940 | 20,051 | 4,889 | 24 | % | 4,443 | 446 | ||||||||||||||||
Real estate acquisition fees to affiliate | 1,473 | 7,697 | (6,224 | ) | (81 | )% | (6,224 | ) | n/a | ||||||||||||||
Real estate acquisition fees and expenses | 306 | 4,292 | (3,986 | ) | (93 | )% | (3,986 | ) | n/a | ||||||||||||||
General and administrative expenses | 5,398 | 4,912 | 486 | 10 | % | n/a | n/a | ||||||||||||||||
Depreciation and amortization | 161,364 | 136,935 | 24,429 | 18 | % | 27,211 | (2,782 | ) | |||||||||||||||
Interest expense | 51,554 | 45,370 | 6,184 | 14 | % | n/a | n/a | ||||||||||||||||
_____________________
(1) Represents the dollar amount increase (decrease) for the year ended December 31, 2016 compared to the year ended December 31, 2015 related to real estate investments acquired or repaid on or after January 1, 2015.
(2) Represents the dollar amount increase (decrease) for the year ended December 31, 2016 compared to the year ended December 31, 2015 related to real estate investments owned by us throughout both periods presented.
58
Rental income and tenant reimbursements from our real estate properties increased from $299.7 million for the year ended December 31, 2015 to $378.4 million for the year ended December 31, 2016, primarily as a result of the growth in our real estate portfolio. The increase in rental income and tenant reimbursements for properties held throughout both periods was primarily due to an increase in occupancy from 92% as of December 31, 2015 to 94% as of December 31, 2016, an increase in rental rates and an increase in expense recoveries. We expect rental income and tenant reimbursements to vary in future periods as a result of owning the real estate property acquired in 2016 for an entire period, occupancy rates and rental rates of our real estate investments, the development and subsequent operation of Hardware Village and Village Center Station II and acquisition activity.
Interest income from our real estate loan receivable, recognized using the interest method, decreased from $1.6 million for the year ended December 31, 2015 to $0.8 million for the year ended December 31, 2016 as a result of the Aberdeen First Mortgage Origination being paid off on July 1, 2016.
Other operating income increased from $14.4 million during the year ended December 31, 2015 to $21.2 million for the year ended December 31, 2016, primarily as a result of the growth in our real estate portfolio. Other operating income primarily consisted of parking revenues. We expect other operating income to vary in future periods as a result of owning the real estate property acquired in 2016 for an entire period, the development and subsequent operation of Hardware Village and Village Center Station II, occupancy rates and parking rates at our real estate properties and acquisition activity.
Operating, maintenance and management costs increased from $75.3 million for the year ended December 31, 2015 to $93.6 million for the year ended December 31, 2016, primarily as a result of the growth in our real estate portfolio. The increase in operating, maintenance and management costs for properties held throughout both periods was primarily due to an increase in repairs and maintenance, association fees and management fees. We expect operating, maintenance and management costs to vary in future periods as a result of owning the real estate property acquired in 2016 for an entire period, the development and subsequent operation of Hardware Village and Village Center Station II, inflation and acquisition activity.
Real estate taxes and insurance increased from $50.3 million for the year ended December 31, 2015 to $61.1 million for the year ended December 31, 2016, primarily as a result of the growth in our real estate portfolio. The increase of real estate taxes and insurance for properties held throughout both periods was primarily due to higher taxes as the assessed values have increased on several of our properties. We expect real estate taxes and insurance to increase in future periods as a result of owning the real estate property acquired in 2016 for an entire period, the development and subsequent operation of Hardware Village and Village Center Station II, inflation, future reassessments and acquisition activity.
Asset management fees with respect to our real estate investments increased from $20.1 million for the year ended December 31, 2015 to $24.9 million for the year ended December 31, 2016, primarily as a result of the growth in our real estate portfolio. We expect asset management fees to vary in future periods as a result of owning the real estate property acquired in 2016 for an entire period, the development of Hardware Village and Village Center Station II, acquisitions, improvements or dispositions. As of December 31, 2016, $2.1 million of asset management fees were payable, which were subsequently paid in January 2017. For a discussion of accrued and deferred asset management fees, see “Liquidity and Capital Resources - Cash Flows from Financing Activities” herein.
Real estate acquisition fees and expenses to affiliate and non-affiliates decreased from $12.0 million for the year ended December 31, 2015 to $1.8 million for the year ended December 31, 2016 due to a decrease in acquisition activity. We acquired one real estate property for $146.1 million during the year ended December 31, 2016. During the year ended December 31, 2015, we acquired eight real estate properties for $754.8 million. Additionally, during the year ended December 31, 2016, we capitalized $0.1 million in acquisition fees and expenses related to the development of Hardware Village. We expect real estate acquisition fees and expenses to vary in future periods based upon acquisition and development activity.
Depreciation and amortization increased from $136.9 million for the year ended December 31, 2015 to $161.4 million for the year ended December 31, 2016, primarily as a result of the growth in our real estate portfolio. We expect depreciation and amortization to vary in future periods as a result of owning the real estate property acquired in 2016 for an entire period, a decrease in amortization related to fully amortized tenant origination costs, acquisition activity and the development and subsequent operation of Hardware Village and Village Center Station II.
59
Interest expense increased from $45.4 million for the year ended December 31, 2015 to $51.6 million for the year ended December 31, 2016. Included in interest expense is the amortization of deferred financing costs of $5.1 million and $3.6 million for the years ended December 31, 2016 and 2015, respectively. Additionally, during the year ended December 31, 2016, we capitalized $0.2 million of interest to construction-in-progress. Interest expense incurred as a result of our derivative instruments for the years ended December 31, 2016 and 2015 was $6.4 million and $13.4 million, respectively, which includes $1.6 million of unrealized gains and $6.1 million of unrealized losses on derivative instruments for the years ended December 31, 2016 and 2015, respectively. The increase in interest expense is primarily due to increased borrowings as a result of our use of additional debt in acquiring real estate properties in 2015 and 2016 and changes in value on interest rate swaps. We expect interest expense to vary in future periods as a result of borrowings in 2016 being outstanding for an entire period and acquisition and development activity. In addition, our interest expense in future periods will vary based on fair value changes with respect to our interest rate swaps that are not accounted for as cash flow hedges.
Comparison of the year ended December 31, 2015 versus the year ended December 31, 2014
The following table provides summary information about our results of operations for the years ended December 31, 2015 and 2014 (dollar amounts in thousands):
For the Years Ended December 31, | Increase (Decrease) | Percentage Change | $ Change Due to Acquisitions and Dispositions (1) | $ Change Due to Properties or Loans Held Throughout Both Periods (2) | |||||||||||||||||||
2015 | 2014 | ||||||||||||||||||||||
Rental income | $ | 245,772 | $ | 141,535 | $ | 104,237 | 74 | % | $ | 101,868 | $ | 2,369 | |||||||||||
Tenant reimbursements | 53,960 | 40,636 | 13,324 | 33 | % | 12,559 | 765 | ||||||||||||||||
Interest income from real estate loan receivable | 1,603 | 1,352 | 251 | 19 | % | — | 251 | ||||||||||||||||
Other operating income | 14,374 | 5,373 | 9,001 | 168 | % | 8,425 | 576 | ||||||||||||||||
Operating, maintenance and management costs | 75,319 | 46,223 | 29,096 | 63 | % | 29,869 | (773 | ) | |||||||||||||||
Real estate taxes and insurance | 50,320 | 31,623 | 18,697 | 59 | % | 17,678 | 1,019 | ||||||||||||||||
Asset management fees to affiliate | 20,051 | 11,476 | 8,575 | 75 | % | 8,168 | 407 | ||||||||||||||||
Real estate acquisition fees to affiliate | 7,697 | 10,441 | (2,744 | ) | (26 | )% | (2,744 | ) | n/a | ||||||||||||||
Real estate acquisition fees and expenses | 4,292 | 2,497 | 1,795 | 72 | % | 1,795 | n/a | ||||||||||||||||
General and administrative expenses | 4,912 | 3,403 | 1,509 | 44 | % | n/a | n/a | ||||||||||||||||
Depreciation and amortization | 136,935 | 79,563 | 57,372 | 72 | % | 57,122 | 250 | ||||||||||||||||
Interest expense | 45,370 | 27,003 | 18,367 | 68 | % | n/a | n/a | ||||||||||||||||
Gain on sale of real estate, net | — | 10,894 | (10,894 | ) | (100 | )% | (10,894 | ) | n/a | ||||||||||||||
_____________________
(1) Represents the dollar amount increase (decrease) for the year ended December 31, 2015 compared to the year ended December 31, 2014 related to real estate investments acquired or disposed of on or after January 1, 2014.
(2) Represents the dollar amount increase (decrease) for the year ended December 31, 2015 compared to the year ended December 31, 2014 related to real estate investments owned by us throughout both periods presented.
Rental income and tenant reimbursements from our real estate properties increased from $182.2 million for the year ended December 31, 2014 to $299.7 million for the year ended December 31, 2015, primarily as a result of the growth in our real estate portfolio, partially offset by the sale of one of our properties on February 19, 2014.
Interest income from our real estate loan receivable, recognized using the interest method, increased from $1.4 million for the year ended December 31, 2014 to $1.6 million for the year ended December 31, 2015. The increase in interest income is a result of an increase in the overall loan balance as a result of advances made under the real estate loan receivable.
Other operating income increased from $5.4 million during the year ended December 31, 2014 to $14.4 million for the year ended December 31, 2015, primarily as a result of the growth in our real estate portfolio. Other operating income primarily consisted of parking revenues.
Operating, maintenance and management costs increased from $46.2 million for the year ended December 31, 2014 to $75.3 million for the year ended December 31, 2015, primarily as a result of the growth in our real estate portfolio, partially offset by the sale of one of our properties on February 19, 2014.
Real estate taxes and insurance increased from $31.6 million for the year ended December 31, 2014 to $50.3 million for the year ended December 31, 2015, primarily as a result of the growth in our real estate portfolio, partially offset by the sale of one of our properties on February 19, 2014.
60
Asset management fees with respect to our real estate investments increased from $11.5 million for the year ended December 31, 2014 to $20.1 million for the year ended December 31, 2015, primarily as a result of the growth in our real estate portfolio, partially offset by the sale of one of our properties on February 19, 2014. As of December 31, 2015, there were $10.1 million of accrued and deferred asset management fees. For a discussion of accrued and deferred asset management fees, see “Liquidity and Capital Resources - Cash Flows from Financing Activities” herein.
Real estate acquisition fees and expenses to affiliate and non-affiliates decreased from $12.9 million for the year ended December 31, 2014 to $12.0 million for the year ended December 31, 2015 due to a decrease in acquisition activity. We acquired eight real estate properties for $754.8 million during the year ended December 31, 2015. During the year ended December 31, 2014, we acquired nine real estate properties for $1.0 billion.
Depreciation and amortization increased from $79.6 million for the year ended December 31, 2014 to $136.9 million for the year ended December 31, 2015, primarily as a result of the growth in our real estate portfolio, partially offset by the sale of one of our properties on February 19, 2014.
Interest expense increased from $27.0 million for the year ended December 31, 2014 to $45.4 million for the year ended December 31, 2015. Included in interest expense is the amortization of deferred financing costs of $3.6 million and $1.9 million for the years ended December 31, 2015 and 2014, respectively. Interest expense incurred as a result of our derivative instruments for the years ended December 31, 2015 and 2014 was $13.4 million and $7.2 million, respectively, which includes $6.1 million and $1.5 million of unrealized losses on derivative instruments for the years ended December 31, 2015 and 2014. The increase in interest expense is primarily due to increased borrowings as a result of our use of additional debt in acquiring real estate properties in 2015.
A gain on sale of real estate of $10.9 million was recognized for the year ended December 31, 2014 due to the disposition of Las Cimas IV in February 2014. There were no dispositions for the year ended December 31, 2015.
Funds from Operations and Modified Funds from Operations
We believe that FFO is a beneficial indicator of the performance of an equity REIT. We compute FFO in accordance with the current NAREIT definition. FFO represents net income, excluding gains and losses from sales of operating real estate assets (which can vary among owners of identical assets in similar conditions based on historical cost accounting and useful-life estimates), impairment losses on real estate assets, depreciation and amortization of real estate assets, and adjustments for unconsolidated partnerships and joint ventures. We believe FFO facilitates comparisons of operating performance between periods and among other REITs. However, our computation of FFO may not be comparable to other REITs that do not define FFO in accordance with the NAREIT definition or that interpret the current NAREIT definition differently than we do. Our management believes that historical cost accounting for real estate assets in accordance with GAAP implicitly assumes that the value of real estate assets diminishes predictably over time. Since real estate values have historically risen or fallen with market conditions, many industry investors and analysts have considered the presentation of operating results for real estate companies that use historical cost accounting to be insufficient by themselves. As a result, we believe that the use of FFO, together with the required GAAP presentations, provides a more complete understanding of our performance relative to our competitors and provides a more informed and appropriate basis on which to make decisions involving operating, financing, and investing activities.
Changes in accounting rules have resulted in a substantial increase in the number of non-operating and non-cash items included in the calculation of FFO. Items such as acquisition fees and expenses, which had previously been capitalized prior to 2009, are currently expensed and accounted for as operating expenses. As a result, our management also uses MFFO as an indicator of our ongoing performance as well as our dividend sustainability. MFFO excludes from FFO: acquisition fees and expenses; adjustments related to contingent purchase price obligations; amounts relating to straight-line rents and amortization of above and below market intangible lease assets and liabilities; accretion of discounts and amortization of premiums on debt investments; amortization of closing costs relating to debt investments; impairments of real estate-related investments; mark-to-market adjustments included in net income; and gains or losses included in net income for the extinguishment or sale of debt or hedges. We compute MFFO in accordance with the definition of MFFO included in the practice guideline issued by the IPA in November 2010 as interpreted by management. Our computation of MFFO may not be comparable to other REITs that do not compute MFFO in accordance with the current IPA definition or that interpret the current IPA definition differently than we do.
61
We believe that MFFO is helpful as a measure of ongoing operating performance because it excludes costs that management considers more reflective of investing activities and other non-operating items included in FFO. Management believes that excluding acquisition costs from MFFO provides investors with supplemental performance information that is consistent with management’s analysis of the operating performance of the portfolio over time, including periods after our acquisition stage. MFFO also excludes non-cash items such as straight-line rental revenue. Additionally, we believe that MFFO provides investors with supplemental performance information that is consistent with the performance indicators and analysis used by management, in addition to net income and cash flows from operating activities as defined by GAAP, to evaluate the sustainability of our operating performance. MFFO provides comparability in evaluating the operating performance of our portfolio with other non-traded REITs which typically have limited lives with short and defined acquisition periods and targeted exit strategies. MFFO, or an equivalent measure, is routinely reported by non-traded REITs, and we believe often used by analysts and investors for comparison purposes.
FFO and MFFO are non-GAAP financial measures and do not represent net income as defined by GAAP. Net income as defined by GAAP is the most relevant measure in determining our operating performance because FFO and MFFO include adjustments that investors may deem subjective, such as adding back expenses such as depreciation and amortization and the other items described above. Accordingly, FFO and MFFO should not be considered as alternatives to net income as an indicator of our current and historical operating performance. In addition, FFO and MFFO do not represent cash flows from operating activities determined in accordance with GAAP and should not be considered an indication of our liquidity. We believe FFO and MFFO, in addition to net income and cash flows from operating activities as defined by GAAP, are meaningful supplemental performance measures.
Although MFFO includes other adjustments, the exclusion of adjustments for straight-line rent, the amortization of above- and below-market leases, unrealized (gains) losses on derivative instruments and acquisition fees and expenses are the most significant adjustments for the periods presented. We have excluded these items based on the following economic considerations:
• | Adjustments for straight-line rent. These are adjustments to rental revenue as required by GAAP to recognize contractual lease payments on a straight-line basis over the life of the respective lease. We have excluded these adjustments in our calculation of MFFO to more appropriately reflect the current economic impact of our in-place leases, while also providing investors with a useful supplemental metric that addresses core operating performance by removing rent we expect to receive in a future period or rent that was received in a prior period; |
• | Amortization of above- and below-market leases. Similar to depreciation and amortization of real estate assets and lease related costs that are excluded from FFO, GAAP implicitly assumes that the value of intangible lease assets and liabilities diminishes predictably over time and requires that these charges be recognized currently in revenue. Since market lease rates in the aggregate have historically risen or fallen with local market conditions, management believes that by excluding these charges, MFFO provides useful supplemental information on the realized economics of the real estate; |
• | Unrealized (gains) losses on derivative instruments. These adjustments include unrealized (gains) losses from mark-to-market adjustments on interest rate swaps. The change in fair value of interest rate swaps not designated as a hedge are non-cash adjustments recognized directly in earnings and are included in interest expense. We have excluded these adjustments in our calculation of MFFO to more appropriately reflect the economic impact of our interest rate swap agreements; and |
• | Acquisition fees and expenses. Acquisition fees and expenses related to the acquisition of real estate are generally expensed. Although these amounts reduce net income, we exclude them from MFFO to more appropriately present the ongoing operating performance of our real estate investments on a comparative basis. Additionally, acquisition fees and expenses have been funded from the proceeds from our now-terminated initial public offering and debt financings and not from our operations. We believe this exclusion is useful to investors as it allows investors to more accurately evaluate the sustainability of our operating performance. |
62
Our calculation of FFO, which we believe is consistent with the calculation of FFO as defined by NAREIT, is presented in the following table, along with our calculation of MFFO, for the years ended December 31, 2016, 2015 and 2014, respectively (in thousands). No conclusions or comparisons should be made from the presentation of these periods.
For the Years Ended December 31, | |||||||||||
2016 | 2015 | 2014 | |||||||||
Net income (loss) attributable to common stockholders | $ | 763 | $ | (29,015 | ) | $ | (12,352 | ) | |||
Depreciation of real estate assets | 77,676 | 56,957 | 30,088 | ||||||||
Amortization of lease-related costs | 83,688 | 79,978 | 49,475 | ||||||||
Gain on sale of real estate, net | — | — | (10,894 | ) | |||||||
FFO attributable to common stockholders | $ | 162,127 | $ | 107,920 | $ | 56,317 | |||||
Straight-line rent and amortization of above- and below-market leases | (26,136 | ) | (24,874 | ) | (13,766 | ) | |||||
Amortization of discounts and closing costs | 15 | 27 | 26 | ||||||||
Unrealized (gains) losses on derivative instruments | (1,597 | ) | 6,078 | 1,494 | |||||||
Real estate acquisition fees to affiliate | 1,473 | 7,697 | 10,441 | ||||||||
Real estate acquisition fees and expenses | 306 | 4,292 | 2,497 | ||||||||
MFFO attributable to common stockholders | $ | 136,188 | $ | 101,140 | $ | 57,009 | |||||
FFO and MFFO may also be used to fund all or a portion of certain capitalizable items that are excluded from FFO and MFFO, such as tenant improvements, building improvements and deferred leasing costs.
Distributions
From time to time during our operational stage, we may not pay distributions solely from our cash flow from operating activities or FFO, in which case distributions may be paid in whole or in part from debt financing. Distributions declared, distributions paid and cash flow from operating activities were as follows during 2016 (in thousands, except per share amounts):
Distributions Declared (1) | Distributions Declared Per Share (1) (2) | Distributions Paid (3) | Cash Flow from Operating Activities | |||||||||||||||||||||
Period | Cash | Reinvested | Total | |||||||||||||||||||||
First Quarter 2016 | $ | 28,667 | $ | 0.160 | $ | 13,281 | $ | 15,322 | $ | 28,603 | $ | 6,838 | ||||||||||||
Second Quarter 2016 | 29,160 | 0.162 | 13,778 | 15,647 | 29,425 | 38,724 | ||||||||||||||||||
Third Quarter 2016 | 29,563 | 0.164 | 13,980 | 15,574 | 29,554 | 36,520 | ||||||||||||||||||
Fourth Quarter 2016 | 29,635 | 0.164 | 13,947 | 15,328 | 29,275 | 32,075 | ||||||||||||||||||
$ | 117,025 | $ | 0.650 | $ | 54,986 | $ | 61,871 | $ | 116,857 | $ | 114,157 | |||||||||||||
_____________________
(1) Distributions for the periods from January 1, 2016 through February 28, 2016 and March 1, 2016 through December 31, 2016 were based on daily record dates and were calculated at a rate of $0.00178082 per share per day.
(2) Assumes share was issued and outstanding each day during the periods presented.
(3)Distributions are paid on a monthly basis. Distributions for all record dates of a given month are paid on or about the first business day of the following month.
For the year ended December 31, 2016, we paid aggregate distributions of $116.9 million, including $55.0 million of distributions paid in cash and $61.9 million of distributions reinvested through our dividend reinvestment plan. Our net income for the year ended December 31, 2016 was $0.8 million. FFO for the year ended December 31, 2016 was $162.1 million and cash flow from operating activities was $114.2 million. See the reconciliation of FFO to net income above. We funded our total distributions paid, which includes net cash distributions and dividends reinvested by stockholders, with $95.1 million of cash flow from operating activities, $3.2 million of cash flow from operating activities in excess of distributions paid during 2015 and $18.6 million of debt financing. For purposes of determining the source of our distributions paid, we assume first that we use cash flow from operating activities from the relevant or prior periods to fund distribution payments.
63
Over the long-term, we expect that a greater percentage of our distributions will be paid from cash flow from operating activities and FFO from current or prior periods (except with respect to distributions related to sales of our assets and distributions related to the repayment of principal under any real estate-related investments we make). From time to time during our operational stage, we may not pay distributions solely from our cash flow from operating activities. To the extent that we pay distributions from sources other than our cash flow from operating activities, we will have less funds available for the acquisition of real estate investments and the overall return to our stockholders may be reduced. Further, our operating performance cannot be accurately predicted and may deteriorate in the future due to numerous factors, including those discussed under “Forward-Looking Statements,” Part I, Item 1, “Business ─ Market Outlook ─ Real Estate and Real Estate Finance Markets,” Part I, Item 1A, “Risk Factors” and Part II, Item 7, “Management’s Discussion and Analysis of Financial Condition and Results of Operations ─ Results of Operations.” Those factors include: the future operating performance of our current and future real estate investments in the existing real estate and financial environment; the success and economic viability of our tenants; our ability to refinance existing indebtedness at comparable terms; changes in interest rates on any variable rate debt obligations we incur; and the level of participation in our dividend reinvestment plan. In the event our FFO and/or cash flow from operating activities decrease in the future, the level of our distributions may also decrease. In addition, future distributions declared and paid may exceed FFO and/or cash flow from operating activities.
Critical Accounting Policies
Our consolidated financial statements have been prepared in accordance with GAAP and in conjunction with the rules and regulations of the SEC. The preparation of our financial statements requires significant management judgments, assumptions and estimates about matters that are inherently uncertain. These judgments affect the reported amounts of assets and liabilities and our disclosure of contingent assets and liabilities as of the dates of the financial statements and the reported amounts of revenue and expenses during the reporting periods. With different estimates or assumptions, materially different amounts could be reported in our financial statements. Additionally, other companies may utilize different estimates that may impact the comparability of our results of operations to those of companies in similar businesses. There have been no significant changes to our policies during 2016.
Revenue Recognition
Real Estate
We recognize minimum rent, including rental abatements, lease incentives and contractual fixed increases attributable to operating leases, on a straight-line basis over the term of the related leases when collectability is reasonably assured and record amounts expected to be received in later years as deferred rent receivable. If the lease provides for tenant improvements, we determine whether the tenant improvements, for accounting purposes, are owned by the tenant or by us. When we are the owner of the tenant improvements, the tenant is not considered to have taken physical possession or have control of the physical use of the leased asset until the tenant improvements are substantially completed. When the tenant is the owner of the tenant improvements, any tenant improvement allowance (including amounts that the tenant can take in the form of cash or a credit against its rent) that is funded is treated as a lease incentive and amortized as a reduction of revenue over the lease term. Tenant improvement ownership is determined based on various factors including, but not limited to:
• | whether the lease stipulates how a tenant improvement allowance may be spent; |
• | whether the amount of a tenant improvement allowance is in excess of market rates; |
• | whether the tenant or landlord retains legal title to the improvements at the end of the lease term; |
• | whether the tenant improvements are unique to the tenant or general-purpose in nature; and |
• | whether the tenant improvements are expected to have any residual value at the end of the lease. |
We record property operating expense reimbursements due from tenants for common area maintenance, real estate taxes, and other recoverable costs in the period the related expenses are incurred.
We make estimates of the collectability of our tenant receivables related to base rents, including deferred rent receivable, expense reimbursements and other revenue or income. We specifically analyze accounts receivable, deferred rent receivable, historical bad debts, customer creditworthiness, current economic trends and changes in customer payment terms when evaluating the adequacy of the allowance for doubtful accounts. In addition, with respect to tenants in bankruptcy, we make estimates of the expected recovery of pre-petition and post-petition claims in assessing the estimated collectability of the related receivable. In some cases, the ultimate resolution of these claims can exceed one year. When a tenant is in bankruptcy, we will record a bad debt reserve for the tenant’s receivable balance and generally will not recognize subsequent rental revenue until cash is received or until the tenant is no longer in bankruptcy and has the ability to make rental payments.
64
Real Estate Loan Receivable
Interest income on our real estate loan receivable is recognized on an accrual basis over the life of the investment using the interest method. Direct loan origination fees and origination or acquisition costs, as well as acquisition premiums or discounts, are amortized over the term of the loan as an adjustment to interest income. We will place loans on non-accrual status when any portion of principal or interest is 90 days past due, or earlier when concern exists as to the ultimate collection of principal or interest. When a loan is placed on non-accrual status, we will reserve for any unpaid accrued interest and generally do not recognize subsequent interest income until the cash is received, or the loan returns to accrual status. We will resume the accrual of interest if we determine the collection of interest according to the contractual terms of the loan is probable.
Real Estate
Depreciation and Amortization
Real estate costs related to the acquisition and improvement of properties are capitalized and amortized over the expected useful life of the asset on a straight-line basis. Repair and maintenance costs are charged to expense as incurred and significant replacements and betterments are capitalized. Repair and maintenance costs include all costs that do not extend the useful life of the real estate asset. We consider the period of future benefit of an asset to determine its appropriate useful life. Expenditures for tenant improvements are capitalized and amortized over the shorter of the tenant’s lease term or expected useful life. We anticipate the estimated useful lives of our assets by class to be generally as follows:
Buildings | 25-40 years |
Building improvements | 10-25 years |
Tenant improvements | Shorter of lease term or expected useful life |
Tenant origination and absorption costs | Remaining term of related leases, including below-market renewal periods |
Real Estate Acquisition Valuation
We record the acquisition of income-producing real estate or real estate that will be used for the production of income as a business combination. All assets acquired and liabilities assumed in a business combination are measured at their acquisition-date fair values. Acquisition costs are expensed as incurred and restructuring costs that do not meet the definition of a liability at the acquisition date are expensed in periods subsequent to the acquisition date.
We assess the acquisition date fair values of all tangible assets, identifiable intangibles and assumed liabilities using methods similar to those used by independent appraisers, generally utilizing a discounted cash flow analysis that applies appropriate discount and/or capitalization rates and available market information. Estimates of future cash flows are based on a number of factors, including historical operating results, known and anticipated trends, and market and economic conditions. The fair value of tangible assets of an acquired property considers the value of the property as if it were vacant.
We record above-market and below-market in-place lease values for acquired properties based on the present value (using a discount rate that reflects the risks associated with the leases acquired) of the difference between (i) the contractual amounts to be paid pursuant to the in-place leases and (ii) management’s estimate of fair market lease rates for the corresponding in-place leases, measured over a period equal to the remaining non-cancelable term of above-market in-place leases and for the initial term plus any extended term for any leases with below-market renewal options. We amortize any recorded above-market or below-market lease values as a reduction or increase, respectively, to rental income over the remaining non-cancelable terms of the respective lease, including any below-market renewal periods.
We estimate the value of tenant origination and absorption costs by considering the estimated carrying costs during hypothetical expected lease up periods, considering current market conditions. In estimating carrying costs, we include real estate taxes, insurance and other operating expenses and estimates of lost rentals at market rates during the expected lease up periods.
We amortize the value of tenant origination and absorption costs to depreciation and amortization expense over the remaining non-cancelable term of the leases.
Estimates of the fair values of the tangible assets, identifiable intangibles and assumed liabilities require us to make significant assumptions to estimate market lease rates, property-operating expenses, carrying costs during lease-up periods, discount rates, market absorption periods, and the number of years the property will be held for investment. The use of inappropriate assumptions would result in an incorrect valuation of our acquired tangible assets, identifiable intangibles and assumed liabilities, which would impact the amount of our net income.
Subsequent to the acquisition of a property, we may incur and capitalize costs necessary to get the property ready for its intended use. During that time, certain costs such as legal fees, real estate taxes and insurance and financing costs are also capitalized.
65
Impairment of Real Estate and Related Intangible Assets and Liabilities
We continually monitor events and changes in circumstances that could indicate that the carrying amounts of our real estate and related intangible assets and liabilities may not be recoverable or realized. When indicators of potential impairment suggest that the carrying value of real estate and related intangible assets and liabilities may not be recoverable, we assess the recoverability by estimating whether we will recover the carrying value of the real estate and related intangible assets and liabilities through its undiscounted future cash flows and its eventual disposition. If, based on this analysis, we do not believe that we will be able to recover the carrying value of the real estate and related intangible assets and liabilities, we would record an impairment loss to the extent that the carrying value exceeds the estimated fair value of the real estate and related intangible assets and liabilities.
Projecting future cash flows involves estimating expected future operating income and expenses related to the real estate and its related intangible assets and liabilities as well as market and other trends. Using inappropriate assumptions to estimate cash flows could result in incorrect fair values of the real estate and its related intangible assets and liabilities and could result in the overstatement of the carrying values of our real estate and related intangible assets and liabilities and an overstatement of our net income.
Real Estate Held for Sale and Discontinued Operations
We generally consider real estate to be “held for sale” when the following criteria are met: (i) management commits to a plan to sell the property, (ii) the property is available for sale immediately, (iii) the property is actively being marketed for sale at a price that is reasonable in relation to its current fair value, (iv) the sale of the property within one year is considered probable and (v) significant changes to the plan to sell are not expected. Real estate that is held for sale and its related assets are classified as “real estate held for sale” and “assets related to real estate held for sale,” respectively, for all periods presented in the accompanying consolidated financial statements. Notes payable and other liabilities related to real estate held for sale are classified as “notes payable related to real estate held for sale” and “liabilities related to real estate held for sale,” respectively, for all periods presented in the accompanying consolidated financial statements. Real estate classified as held for sale is no longer depreciated and is reported at the lower of its carrying value or its estimated fair value less estimated costs to sell. Operating results of properties and related gains on sale that were disposed of or classified as held for sale in the ordinary course of business during the years ended December 31, 2016, 2015 and 2014 that had not been classified as held for sale in financial statements prior to January 1, 2014 are included in continuing operations on our consolidated statements of operations.
Real Estate Loan Receivable
We record real estate loans receivable at amortized cost, net of loan loss reserves (if any), and evaluate real estate loans receivable for impairments at each balance sheet date. The amortized cost of a real estate loan receivable is the outstanding unpaid principal balance, net of unamortized acquisition premiums or discounts and unamortized costs and fees directly associated with the origination or acquisition of the loan.
The reserve for loan losses is a valuation allowance that reflects our estimate of loan losses inherent in the loan portfolio as of the balance sheet date. The reserve is adjusted through “Provision for loan losses” in our consolidated statements of operations and is decreased by charge-offs to specific loans when losses are confirmed. The reserve for loan losses may include a portfolio-based component and an asset-specific component.
An asset-specific reserve relates to reserves for losses on loans considered impaired. We consider a loan to be impaired when, based upon current information and events, we believe that it is probable that we will be unable to collect all amounts due under the contractual terms of the loan agreement. We also consider a loan to be impaired if we grant the borrower a concession through a modification of the loan terms or if we expect to receive assets (including equity interests in the borrower) with fair values that are less than the carrying value of our loan in satisfaction of the loan. A reserve is established when the present value of payments expected to be received, observable market prices, the estimated fair value of the collateral (for loans that are dependent on the collateral for repayment) or amounts expected to be received in satisfaction of a loan are lower than the carrying value of that loan.
Failure to recognize impairments would result in the overstatement of earnings and the carrying value of real estate loans held for investment. Actual losses, if any, could differ significantly from estimated amounts.
66
Derivative Instruments
We enter into derivative instruments for risk management purposes to hedge our exposure to cash flow variability caused by changing interest rates on our variable rate notes payable. We record these derivative instruments at fair value on the accompanying consolidated balance sheets. Derivative instruments designated and qualifying as a hedge of the exposure to variability in expected future cash flows or other types of forecasted transactions are considered cash flow hedges. The change in fair value of the effective portion of a derivative instrument that is designated as a cash flow hedge is recorded as other comprehensive income (loss) on the accompanying consolidated statements of comprehensive income (loss) and consolidated statements of equity. The changes in fair value for derivative instruments that are not designated as a hedge or that do not meet the hedge accounting criteria are recorded as gain or loss on derivative instruments and included as interest expense as presented in the accompanying consolidated statements of operations.
We formally document all relationships between hedging instruments and hedged items, as well as our risk-management objectives and strategy for undertaking various hedge transactions. This process includes designating all derivative instruments that are part of a hedging relationship to specific forecasted transactions or recognized obligations on the consolidated balance sheets. We also assess and document, both at the hedging instrument’s inception and on a quarterly basis thereafter, whether the derivative instruments that are used in hedging transactions are highly effective in offsetting changes in cash flows associated with the respective hedged items. When we determine that a derivative instrument ceases to be highly effective as a hedge, or that it is probable the underlying forecasted transaction will not occur, we discontinue hedge accounting prospectively and reclassify amounts recorded to accumulated other comprehensive income (loss) to earnings.
Fair Value Measurements
Under GAAP, we are required to measure certain financial instruments at fair value on a recurring basis. In addition, we are required to measure other non-financial and financial assets at fair value on a non-recurring basis (e.g., carrying value of impaired real estate loans receivable and long-lived assets). Fair value is defined as the price that would be received upon the sale of an asset or paid to transfer a liability in an orderly transaction between market participants at the measurement date. The GAAP fair value framework uses a three-tiered approach. Fair value measurements are classified and disclosed in one of the following three categories:
• | Level 1: unadjusted quoted prices in active markets that are accessible at the measurement date for identical assets or liabilities; |
• | Level 2: quoted prices for similar instruments in active markets, quoted prices for identical or similar instruments in markets that are not active, and model-derived valuations in which significant inputs and significant value drivers are observable in active markets; and |
• | Level 3: prices or valuation techniques where little or no market data is available that requires inputs that are both significant to the fair value measurement and unobservable. |
When available, we utilize quoted market prices from independent third-party sources to determine fair value and classify such items in Level 1 or Level 2. In instances where the market for a financial instrument is not active, regardless of the availability of a nonbinding quoted market price, observable inputs might not be relevant and could require us to make a significant adjustment to derive a fair value measurement. Additionally, in an inactive market, a market price quoted from an independent third party may rely more on models with inputs based on information available only to that independent third party. When we determine the market for a financial instrument owned by us to be illiquid or when market transactions for similar instruments do not appear orderly, we use several valuation sources (including internal valuations, discounted cash flow analysis and quoted market prices) and establish a fair value by assigning weights to the various valuation sources. Additionally, when determining the fair value of liabilities in circumstances in which a quoted price in an active market for an identical liability is not available, we measure fair value using (i) a valuation technique that uses the quoted price of the identical liability when traded as an asset or quoted prices for similar liabilities when traded as assets or (ii) another valuation technique that is consistent with the principles of fair value measurement, such as the income approach or the market approach.
Changes in assumptions or estimation methodologies can have a material effect on these estimated fair values. In this regard, the derived fair value estimates cannot be substantiated by comparison to independent markets and, in many cases, may not be realized in an immediate settlement of the instrument.
67
We consider the following factors to be indicators of an inactive market: (i) there are few recent transactions, (ii) price quotations are not based on current information, (iii) price quotations vary substantially either over time or among market makers (for example, some brokered markets), (iv) indexes that previously were highly correlated with the fair values of the asset or liability are demonstrably uncorrelated with recent indications of fair value for that asset or liability, (v) there is a significant increase in implied liquidity risk premiums, yields, or performance indicators (such as delinquency rates or loss severities) for observed transactions or quoted prices when compared with our estimate of expected cash flows, considering all available market data about credit and other nonperformance risk for the asset or liability, (vi) there is a wide bid-ask spread or significant increase in the bid-ask spread, (vii) there is a significant decline or absence of a market for new issuances (that is, a primary market) for the asset or liability or similar assets or liabilities, and (viii) little information is released publicly (for example, a principal-to-principal market).
We consider the following factors to be indicators of non-orderly transactions: (i) there was not adequate exposure to the market for a period before the measurement date to allow for marketing activities that are usual and customary for transactions involving such assets or liabilities under current market conditions, (ii) there was a usual and customary marketing period, but the seller marketed the asset or liability to a single market participant, (iii) the seller is in or near bankruptcy or receivership (that is, distressed), or the seller was required to sell to meet regulatory or legal requirements (that is, forced), and (iv) the transaction price is an outlier when compared with other recent transactions for the same or similar assets or liabilities.
Income Taxes
We have elected to be taxed as a REIT under the Internal Revenue Code. To continue to qualify as a REIT, we must continue to meet certain organizational and operational requirements, including a requirement to distribute at least 90% of our annual REIT taxable income to stockholders (which is computed without regard to the dividends-paid deduction or net capital gain and which does not necessarily equal net income as calculated in accordance with GAAP). As a REIT, we generally will not be subject to federal income tax on income that we distribute as dividends to our stockholders. If we fail to qualify as a REIT in any taxable year, we will be subject to federal income tax on our taxable income at regular corporate income tax rates and generally will not be permitted to qualify for treatment as a REIT for federal income tax purposes for the four taxable years following the year during which qualification is lost, unless the Internal Revenue Service grants us relief under certain statutory provisions. Such an event could materially and adversely affect our net income and net cash available for distribution to stockholders. However, we believe that we are organized and operate in such a manner as to qualify for treatment as a REIT.
Subsequent Events
We evaluate subsequent events up until the date the consolidated financial statements are issued.
Distributions Paid
On January 3, 2017, we paid distributions of $10.0 million, which related to distributions declared for daily record dates for each day in the period from December 1, 2016 through December 31, 2016. On February 1, 2017, we paid distributions of $10.0 million, which related to distributions declared for daily record dates for each day in the period from January 1, 2017 through January 31, 2017. On March 1, 2017, we paid distributions of $9.0 million, which related to distributions declared for daily record dates for each day in the period from February 1, 2017 through February 28, 2017.
Distributions Declared
On January 27, 2017, our board of directors declared distributions based on daily record dates for the period from March 1, 2017 through March 31, 2017, which we expect to pay in April 2017. On March 10, 2017, our board of directors declared distributions based on daily record dates for the period from April 1, 2017 through April 30, 2017, which we expect to pay in May 2017, and distributions based on daily record dates for the period from May 1, 2017 through May 31, 2017, which we expect to pay in June 2017. Investors may choose to receive cash distributions or purchase additional shares through our dividend reinvestment plan.
Distributions for these periods will be calculated based on stockholders of record each day during these periods at a rate of $0.00178082 per share per day and equal a daily amount that, if paid each day for a 365-day period, would equal a 6.11% annualized rate based on our December 9, 2016 estimated value per share of $10.63.
68
Financing Subsequent to December 31, 2016
Hardware Village Loan Facility
On February 23, 2017, we, through the Hardware Village Joint Venture, entered into a construction loan facility with an unaffiliated lender for borrowings of up to $74.0 million secured by Hardware Village (the “Hardware Village Loan Facility”). The Hardware Village Loan Facility matures on February 23, 2020 with two one-year extension options, subject to certain terms described in the loan documents, and bears interest at a floating rate of 325 basis points over either one, two, three, or six-month LIBOR at the election of the Hardware Village Joint Venture. Monthly payments are interest-only during the initial term and first extension of the loan. During the second extension term, we would be required to make principal payments in an amount equal to an amount that would amortize the outstanding principal balance of the loan in 30 years at a rate of interest equal to the greater of (i) a fixed rate of 6% per annum or (ii) the rate of interest on a ten-year United States Treasury Note in the amount of the loan plus 2.25%. The Hardware Village Joint Venture has the right to repay the loan in part and in whole subject to certain fees, expenses and conditions, all as described in the loan documents.
KBS REIT Properties III (“REIT Properties III”) is providing a guaranty of 35% of the principal loan balance with respect to certain obligations and liabilities, and related costs, damages and expenses, owed by the Hardware Village Joint Venture to the lender under the Hardware Village Loan Facility resulting from: certain intentional actions committed by the Hardware Village Joint Venture, REIT Properties III and/or any of their affiliates in violation of the loan documents and certain other occurrences described in the loan documents. REIT Properties III is also providing a partial guaranty of the principal balance and any interest or other sums outstanding under the loan and a full guaranty of the principal balance and any interest or other sums outstanding under the loan facility in the event of certain (i) bankruptcy or insolvency proceedings involving the Hardware Village Joint Venture or REIT Properties III or (ii) transfers of Hardware Village in violation of the loan documents. REIT Properties III is also providing a guaranty of the completion of construction of Hardware Village and of the payment of all amounts related thereto.
Joint Venture and Financing Subsequent to December 31, 2016
Village Center Station II Joint Venture and Acquisition and Development
On March 3, 2017, we, through an indirect wholly owned subsidiary, entered into an amended and restated limited liability company agreement with an unaffiliated developer (the “Developer”) (the “Agreement”) relating to an existing limited liability company owned by the Developer (the “Existing LLC”). Pursuant to the Agreement, we acquired a 75% equity interest in the Existing LLC and created a joint venture with the Developer (the “Village Center Station II Joint Venture”). The Village Center Station II Joint Venture was formed to develop and subsequently operate a 12-story office building containing approximately 306,053 rentable square feet and an adjacent two-story office/retail building containing approximately 17,753 rentable square feet, located in the Denver sub-market of Greenwood Village, Colorado (together “Village Center Station II”). Village Center Station II is adjacent to our existing Village Center Station I Investment. The total projected cost of the development is approximately $113.1 million. Upon completion of Village Center Station II, Charter Communications Holding Company, LLC (“Charter Communications”) will occupy 100% of the property under a ten-year lease, with three five-year or two six-year extension options.
The Village Center Station II Joint Venture intends to fund Village Center Station II with capital contributions from its members and with proceeds from the Village Center Station II Construction Loan (discussed below). Our initial capital contribution to the Village Center Station II Joint Venture was $32.3 million. Under the Agreement, we may be required to contribute up to 75% of additional requested contributions to the Village Center Station II Joint Venture. The Developer will fund all cost overruns (excluding certain overruns described in the Charter Communications lease) once the Village Center Station II Joint Venture has used all available funds in the development of Village Center Station II. Income, losses, distributions of cash flow from operations and sale or refinancing are allocated among the members of the Village Center Station II Joint Venture pursuant to the Agreement. Upon completion of Village Center Station II, we will purchase the Developer's 25% equity interest.
On March 1, 2017 the Existing LLC’s existing construction loan with unaffiliated lenders was modified. The loan now provides for borrowings of up to $78.5 million secured by Village Center Station II (the “Village Center Station II Construction Loan”). The Village Center Station II Construction Loan matures on the earlier of March 31, 2019 or the date that the loan converts to a traditional mortgage loan, subject to certain terms and conditions contained in the loan documents. Upon the conversion of the Village Center Station II Construction Loan to a traditional mortgage loan and upon the satisfaction of certain terms and conditions contained in the loan documents, the Village Center Station II Joint Venture may extend the initial maturity date to March 1, 2022. The Village Center Station II Construction Loan bears interest at a floating rate of 220 basis points over one-month LIBOR that reduces to a floating rate of 170 basis points over one-month LIBOR upon conversion to a traditional mortgage loan. The Village Center Station II Joint Venture has the right to repay the loan in part or in whole at any time subject, in certain circumstances, to certain fees, expenses and conditions, all as described in the loan documents.
69
Upon the conversion of the Village Center Station II Construction Loan to a traditional mortgage loan, REIT Properties III will provide a guaranty: (i) with respect to certain liabilities, obligations, losses, damages, costs and expenses of the lenders under the Village Center Station II Construction Loan as a result of: certain intentional actions committed by the Village Center Station II Joint Venture and/or REIT Properties III in violation of the loan documents and certain other occurrences described in the loan documents and in the Charter Communications lease, and (ii) of 25% of the outstanding principal balance of, and certain other sums and costs related to, the Village Center Station II Construction Loan, which guaranty amount may increase to 35% or 50% upon the occurrence of certain tenant-related events described in the loan documents.
ITEM 7A. | QUANTITATIVE AND QUALITATIVE DISCLOSURES ABOUT MARKET RISK |
We are exposed to the effects of interest rate changes as a result of borrowings used to maintain liquidity and to fund the acquisition, expansion and refinancing of our real estate investment portfolio and operations. We may also be exposed to the effects of changes in interest rates as a result of the acquisition and origination of mortgage and other loans. Our profitability and the value of our real estate investment portfolio may be adversely affected during any period as a result of interest rate changes. Our interest rate risk management objectives are to limit the impact of interest rate changes on earnings, prepayment penalties and cash flows and to lower overall borrowing costs. We may manage interest rate risk by maintaining a ratio of fixed rate, long-term debt such that variable rate exposure is kept at an acceptable level or we may utilize a variety of financial instruments, including interest rate caps, floors, and swap agreements, in order to limit the effects of changes in interest rates on our operations. When we use these types of derivatives to hedge the risk of interest-earning assets or interest-bearing liabilities, we may be subject to certain risks, including the risk that losses on a hedge position will reduce the funds available for the payment of distributions to our stockholders and that the losses may exceed the amount we invested in the instruments.
The table below summarizes the outstanding principal balance, weighted-average interest rates and fair value for our notes payable for each category; and the notional amounts, average pay and receive rates and the strike rate, if applicable, of our derivative instruments, based on maturity dates as of December 31, 2016 (dollars in thousands):
Maturity Date | Total Value or Notional Amount | |||||||||||||||||||||||||||||||
2017 | 2018 | 2019 | 2020 | 2021 | Thereafter | Fair Value | ||||||||||||||||||||||||||
Assets | ||||||||||||||||||||||||||||||||
Derivative Instruments | ||||||||||||||||||||||||||||||||
Interest rate swaps, notional amount | $ | — | $ | 18,400 | $ | — | $ | 24,000 | $ | — | $ | 164,740 | $ | 207,140 | $ | 1,630 | ||||||||||||||||
Average pay rate (1) | — | 0.9 | % | — | 1.4 | % | — | 1.7 | % | 1.6 | % | |||||||||||||||||||||
Average receive rate (2) | — | 0.8 | % | — | 0.8 | % | — | 0.8 | % | 0.8 | % | |||||||||||||||||||||
Interest rate cap, notional amount (3) | $ | 147,340 | $ | — | $ | — | $ | — | $ | — | $ | — | $ | 147,340 | $ | — | ||||||||||||||||
Strike rate (4) | 2.5 | % | — | — | — | — | — | 2.5 | % | |||||||||||||||||||||||
Liabilities | ||||||||||||||||||||||||||||||||
Notes payable, principal outstanding | ||||||||||||||||||||||||||||||||
Fixed Rate | $ | — | $ | — | $ | — | $ | — | $ | 101,343 | $ | 93,000 | $ | 194,343 | $ | 193,859 | ||||||||||||||||
Weighted-average interest rate (5) | — | — | — | — | 4.0 | % | 4.2 | % | 4.1 | % | ||||||||||||||||||||||
Variable Rate | $ | 296,532 | $ | 687,781 | $ | 254,629 | $ | 271,820 | $ | — | $ | 88,300 | $ | 1,599,062 | $ | 1,582,094 | ||||||||||||||||
Weighted-average interest rate (5) | 2.8 | % | 3.1 | % | 2.4 | % | 2.2 | % | — | 3.4 | % | 2.8 | % | |||||||||||||||||||
Derivative Instruments | ||||||||||||||||||||||||||||||||
Interest rate swaps, notional amount | $ | 68,730 | $ | 601,540 | $ | — | $ | 405,903 | $ | — | $ | — | $ | 1,076,173 | $ | 9,728 | ||||||||||||||||
Average pay rate (1) | 0.8 | % | 1.5 | % | — | 2.2 | % | — | — | 2.0 | % | |||||||||||||||||||||
Average receive rate (2) | 0.8 | % | 0.8 | % | — | 0.8 | % | — | — | 0.8 | % | |||||||||||||||||||||
_____________________
(1) The average pay rate is based on the interest rate swap fixed rate.
(2) The average receive rate is based on the 30‑day LIBOR rate as of December 31, 2016.
(3) The interest rate cap was terminated on January 1, 2017.
(4) The strike rate caps one-month LIBOR on the applicable notional amount.
(5) The weighted-average interest rate represents the actual interest rate in effect as of December 31, 2016 (consisting of the contractual interest rate and the effect of interest rate swaps), if applicable, using interest rate indices as of December 31, 2016, where applicable.
70
We borrow funds and make investments at a combination of fixed and variable rates. Interest rate fluctuations will generally not affect our future earnings or cash flows on our fixed rate debt or fixed rate real estate loans receivable, if any, unless such instruments mature or are otherwise terminated. However, interest rate changes will affect the fair value of our fixed rate instruments. As of December 31, 2016, the fair value of our fixed rate debt was $193.9 million and the outstanding principal balance of our fixed rate debt was $194.3 million. The fair value estimate of our fixed rate debt is calculated using a discounted cash flow analysis utilizing rates we would expect to pay for debt of a similar type and remaining maturity if the loan was originated as of December 31, 2016. As we expect to hold our fixed rate instruments to maturity and the amounts due under such instruments would be limited to the outstanding principal balance and any accrued and unpaid interest, we do not expect that fluctuations in interest rates, and the resulting change in fair value of our fixed rate instruments, would have a significant impact on our operations. As of December 31, 2016, we did not own any fixed rate loans receivable.
Conversely, movements in interest rates on our variable rate debt and any loans receivable we may own would change our future earnings and cash flows, but not significantly affect the fair value of those instruments. However, changes in required risk premiums would result in changes in the fair value of variable rate instruments. As of December 31, 2016, we were exposed to market risks related to fluctuations in interest rates on $679.6 million of variable rate debt outstanding after giving consideration to the impact of interest rate swap agreements on approximately $919.5 million of our variable rate debt. This amount does not take into account the impact of $363.8 million of forward interest rate swap agreements that were not yet effective as of December 31, 2016. We also had an interest rate cap for a notional amount of $147.3 million that terminated on January 1, 2017. Based on interest rates as of December 31, 2016, if interest rates were 100 basis points higher during the 12 months ending December 31, 2017, interest expense on our variable rate debt would increase by $6.8 million. As of December 31, 2016, one-month LIBOR was 0.77167% and if this index was reduced to 0% during the 12 months ending December 31, 2017, interest expense on our variable rate debt would decrease by $5.2 million. As of December 31, 2016, we did not own any variable rate loans receivable.
The weighted-average interest rates of our fixed rate debt and variable rate debt as of December 31, 2016 were 4.1% and 2.8%, respectively. The weighted-average interest rates represent the actual interest rate in effect as of December 31, 2016 (consisting of the contractual interest rate and the effect of interest rate swaps, if applicable), using interest rate indices as of December 31, 2016 where applicable.
For a discussion of the interest rate risks related to the current capital and credit markets, see Part I, Item 1, “Business ─ Market Outlook” and Part I, Item 1A, “Risk Factors.”
ITEM 8. | FINANCIAL STATEMENTS AND SUPPLEMENTARY DATA |
See the Index to Financial Statements at page F-1 of this report.
ITEM 9. | CHANGES IN AND DISAGREEMENTS WITH ACCOUNTANTS ON ACCOUNTING AND FINANCIAL DISCLOSURE |
None.
ITEM 9A. | CONTROLS AND PROCEDURES |
Disclosure Controls and Procedures
As of the end of the period covered by this report, management, including our principal executive officer and principal financial officer, evaluated the effectiveness of the design and operation of our disclosure controls and procedures. Based upon, and as of the date of, the evaluation, our principal executive officer and principal financial officer concluded that the disclosure controls and procedures were effective as of the end of the period covered by this report to ensure that information required to be disclosed in the reports we file and submit under the Exchange Act is recorded, processed, summarized and reported as and when required. Disclosure controls and procedures include, without limitation, controls and procedures designed to ensure that information required to be disclosed by us in the reports we file and submit under the Exchange Act is accumulated and communicated to our management, including our principal executive officer and our principal financial officer, as appropriate to allow timely decisions regarding required disclosure.
Management’s Report on Internal Control Over Financial Reporting
Our management is responsible for establishing and maintaining adequate internal control over financial reporting, as such term is defined in Rule 13a-15(f) or 15d-15(f) promulgated under the Securities Exchange Act of 1934, as amended.
In connection with the preparation of our Form 10-K, our management assessed the effectiveness of our internal control over financial reporting as of December 31, 2016. In making that assessment, management used the criteria set forth by the Committee of Sponsoring Organizations of the Treadway Commission (COSO) in Internal Control-Integrated Framework (2013).
71
Based on its assessment, our management believes that, as of December 31, 2016, our internal control over financial reporting was effective based on those criteria. There have been no changes in our internal control over financial reporting that occurred during the quarter ended December 31, 2016 that have materially affected, or are reasonably likely to materially affect, our internal control over financial reporting.
ITEM 9B. | OTHER INFORMATION |
None.
72
PART III
We will file a definitive Proxy Statement for our 2017 Annual Meeting of Stockholders (the “2017 Proxy Statement”) with the SEC, pursuant to Regulation 14A, not later than 120 days after the end of our fiscal year. Accordingly, certain information required by Part III has been omitted under General Instruction G(3) to Form 10-K. Only those sections of the 2017 Proxy Statement that specifically address the items required to be set forth herein are incorporated by reference.
ITEM 10. | DIRECTORS, EXECUTIVE OFFICERS AND CORPORATE GOVERNANCE |
We have adopted a Code of Conduct and Ethics that applies to all of our executive officers and directors, including but not limited to, our principal executive officer, principal financial officer and principal accounting officer. Our Code of Conduct and Ethics can be found at www.kbsreitiii.com.
The other information required by this Item is incorporated by reference from our 2017 Proxy Statement.
ITEM 11. | EXECUTIVE COMPENSATION |
The information required by this Item is incorporated by reference from our 2017 Proxy Statement.
ITEM 12. | SECURITY OWNERSHIP OF CERTAIN BENEFICIAL OWNERS AND MANAGEMENT AND RELATED STOCKHOLDER MATTERS |
The information required by this Item is incorporated by reference from our 2017 Proxy Statement.
ITEM 13. | CERTAIN RELATIONSHIPS AND RELATED TRANSACTIONS AND DIRECTOR INDEPENDENCE |
The information required by this Item is incorporated by reference from our 2017 Proxy Statement.
ITEM 14. | PRINCIPAL ACCOUNTING FEES AND SERVICES |
The information required by this Item is incorporated by reference from our 2017 Proxy Statement.
73
PART IV
ITEM 15. | EXHIBITS, FINANCIAL STATEMENT SCHEDULES |
(a) Financial Statement Schedules
See the Index to Financial Statements at page F-1 of this report.
The following financial statement schedule is included herein at pages F-41 through F-43 of this report:
Schedule III - Real Estate Assets and Accumulated Depreciation and Amortization
(b) Exhibits
Ex. | Description | |
3.1 | Second Articles of Amendment and Restatement, incorporated by reference to Exhibit 3.1 to the Company’s Current Report on Form 8-K, filed January 25, 2011 | |
3.2 | Amended and Restated Bylaws, incorporated by reference to Exhibit 3.2 to Pre-Effective Amendment No. 3 to the Company’s Registration Statement on Form S-11, Commission File No. 333-164703, filed September 30, 2010 | |
3.3 | Second Amended and Restated Bylaws, incorporated by reference to Exhibit 3.1 to the Company’s Current Report on Form 8-K, filed September 22, 2016 | |
4.1 | Statement regarding restrictions on transferability of shares of common stock (to appear on stock certificate or to be sent upon request and without charge to stockholders issued shares without certificates), incorporated by reference to Exhibit 4.2 to Pre-Effective Amendment No. 2 to the Company’s Registration Statement on Form S-11, Commission File No. 333-164703, filed August 20, 2010 | |
4.2 | Fourth Amended and Restated Dividend Reinvestment Plan, incorporated by reference to Exhibit 4.2 to the Company’s Quarterly Report on Form 10-Q for the period ended June 30, 2015, filed August 13, 2015 | |
10.1 | Advisory Agreement, by and between the Company and KBS Capital Advisors LLC, dated as of September 27, 2016, incorporated by reference to Exhibit 10.1 to the Company’s Quarterly Report on Form 10-Q for the period ended September 30, 2016, filed November 8, 2016 | |
21.1 | Subsidiaries of the Company | |
23.1 | Consent of Ernst & Young LLP | |
31.1 | Certification of Chief Executive Officer pursuant to Section 302 of the Sarbanes-Oxley Act of 2002 | |
31.2 | Certification of Chief Financial Officer pursuant to Section 302 of the Sarbanes-Oxley Act of 2002 | |
32.1 | Certification of Chief Executive Officer pursuant to 18 U.S.C. 1350, as created by Section 906 of the Sarbanes-Oxley Act of 2002 | |
32.2 | Certification of Chief Financial Officer pursuant to 18 U.S.C. 1350, as created by Section 906 of the Sarbanes-Oxley Act of 2002 | |
99.1 | Third Amended and Restated Share Redemption Program, incorporated by reference to Exhibit 99.3 to the Company’s Annual Report on Form 10-K for the year ended December 31, 2013, filed March 7, 2014 | |
99.2 | Consent of Duff & Phelps, LLC | |
101.INS | XBRL Instance Document | |
101.SCH | XBRL Taxonomy Extension Schema | |
101.CAL | XBRL Taxonomy Extension Calculation Linkbase | |
101.DEF | XBRL Taxonomy Extension Definition Linkbase | |
101.LAB | XBRL Taxonomy Extension Label Linkbase | |
101.PRE | XBRL Taxonomy Extension Presentation Linkbase | |
74
INDEX TO CONSOLIDATED FINANCIAL STATEMENTS
Consolidated Financial Statements | |
Financial Statement Schedule | |
All other schedules are omitted because they are not applicable or the required information is shown in the financial statements or notes thereto.
F-1
REPORT OF INDEPENDENT REGISTERED PUBLIC ACCOUNTING FIRM
The Board of Directors and Stockholders of
KBS Real Estate Investment Trust III, Inc.
We have audited the accompanying consolidated balance sheets of KBS Real Estate Investment Trust III, Inc. (the “Company”) as of December 31, 2016 and 2015, and the related consolidated statements of operations, comprehensive income (loss), equity, and cash flows for each of the three years in the period ended December 31, 2016. Our audits also included the financial statement schedule in Item 15(a), Schedule III-Real Estate Assets and Accumulated Depreciation and Amortization. These financial statements and schedule are the responsibility of the Company’s management. Our responsibility is to express an opinion on these financial statements and schedule based on our audits.
We conducted our audits in accordance with the standards of the Public Company Accounting Oversight Board (United States). Those standards require that we plan and perform the audit to obtain reasonable assurance about whether the financial statements are free of material misstatement. We were not engaged to perform an audit of the Company’s internal control over financial reporting. Our audits included consideration of internal control over financial reporting as a basis for designing audit procedures that are appropriate in the circumstances, but not for the purpose of expressing an opinion on the effectiveness of the Company’s internal control over financial reporting. Accordingly, we express no such opinion. An audit also includes examining, on a test basis, evidence supporting the amounts and disclosures in the financial statements, assessing the accounting principles used and significant estimates made by management, and evaluating the overall financial statement presentation. We believe that our audits provide a reasonable basis for our opinion.
In our opinion, the financial statements referred to above present fairly, in all material respects, the consolidated financial position of KBS Real Estate Investment Trust III, Inc. at December 31, 2016 and 2015, and the consolidated results of its operations and its cash flows for each of the three years in the period ended December 31, 2016, in conformity with U.S. generally accepted accounting principles. Also, in our opinion, the financial statement schedule referred to above, when considered in relation to the basic financial statements taken as a whole, presents fairly, in all material respects, the information set forth therein.
As discussed in Note 2 to the consolidated financial statements, the Company changed its presentation of restricted cash activities within the statement of cash flows as a result of the adoption of the amendments to the FASB Accounting Standards Codification resulting from Accounting Standards Update No. 2016-18, “Statement of Cash Flows (Topic 230): Restricted Cash,” effective December 31, 2016.
/s/ Ernst & Young LLP
Irvine, California
March 13, 2017
F-2
KBS REAL ESTATE INVESTMENT TRUST III, INC.
CONSOLIDATED BALANCE SHEETS
(in thousands, except share and per share amounts)
December 31, 2016 | December 31, 2015 | |||||||
Assets | ||||||||
Real estate: | ||||||||
Land | $ | 395,133 | $ | 380,216 | ||||
Buildings and improvements | 2,651,690 | 2,479,191 | ||||||
Construction in progress | 21,853 | 990 | ||||||
Tenant origination and absorption costs | 264,973 | 273,758 | ||||||
Total real estate, cost | 3,333,649 | 3,134,155 | ||||||
Less accumulated depreciation and amortization | (344,794 | ) | (222,431 | ) | ||||
Total real estate, net | 2,988,855 | 2,911,724 | ||||||
Real estate loan receivable, net | — | 21,997 | ||||||
Cash and cash equivalents | 72,068 | 108,242 | ||||||
Rents and other receivables, net | 64,654 | 43,035 | ||||||
Above-market leases, net | 8,191 | 10,977 | ||||||
Prepaid expenses and other assets | 48,908 | 37,899 | ||||||
Total assets | $ | 3,182,676 | $ | 3,133,874 | ||||
Liabilities and equity | ||||||||
Notes payable, net | $ | 1,783,468 | $ | 1,640,654 | ||||
Accounts payable and accrued liabilities | 56,210 | 48,335 | ||||||
Due to affiliates | 2,397 | 10,219 | ||||||
Distributions payable | 10,000 | 9,832 | ||||||
Below-market leases, net | 33,655 | 41,700 | ||||||
Other liabilities | 41,699 | 40,935 | ||||||
Total liabilities | 1,927,429 | 1,791,675 | ||||||
Commitments and contingencies (Note 11) | ||||||||
Redeemable common stock | 61,871 | 55,367 | ||||||
Equity: | ||||||||
KBS Real Estate Investment Trust III, Inc. stockholders’ equity | ||||||||
Preferred stock, $.01 par value; 10,000,000 shares authorized, no shares issued and outstanding | — | — | ||||||
Common stock, $.01 par value; 1,000,000,000 shares authorized, 180,890,572 and 177,943,238 shares issued and outstanding as of December 31, 2016 and December 31, 2015, respectively | 1,809 | 1,779 | ||||||
Additional paid-in capital | 1,591,652 | 1,571,107 | ||||||
Cumulative distributions and net losses | (398,087 | ) | (281,825 | ) | ||||
Accumulated other comprehensive loss | (2,298 | ) | (4,229 | ) | ||||
Total KBS Real Estate Investment Trust III, Inc. stockholders’ equity | 1,193,076 | 1,286,832 | ||||||
Noncontrolling interest | 300 | — | ||||||
Total equity | 1,193,376 | 1,286,832 | ||||||
Total liabilities and equity | $ | 3,182,676 | $ | 3,133,874 | ||||
See accompanying notes to consolidated financial statements.
F-3
KBS REAL ESTATE INVESTMENT TRUST III, INC.
CONSOLIDATED STATEMENTS OF OPERATIONS
(in thousands, except share and per share amounts)
Years Ended December 31, | ||||||||||||
2016 | 2015 | 2014 | ||||||||||
Revenues: | ||||||||||||
Rental income | $ | 307,568 | $ | 245,772 | $ | 141,535 | ||||||
Tenant reimbursements | 70,856 | 53,960 | 40,636 | |||||||||
Interest income from real estate loan receivable | 831 | 1,603 | 1,352 | |||||||||
Other operating income | 21,152 | 14,374 | 5,373 | |||||||||
Total revenues | 400,407 | 315,709 | 188,896 | |||||||||
Expenses: | ||||||||||||
Operating, maintenance, and management | 93,580 | 75,319 | 46,223 | |||||||||
Real estate taxes and insurance | 61,090 | 50,320 | 31,623 | |||||||||
Asset management fees to affiliate | 24,940 | 20,051 | 11,476 | |||||||||
Real estate acquisition fees to affiliate | 1,473 | 7,697 | 10,441 | |||||||||
Real estate acquisition fees and expenses | 306 | 4,292 | 2,497 | |||||||||
General and administrative expenses | 5,398 | 4,912 | 3,403 | |||||||||
Depreciation and amortization | 161,364 | 136,935 | 79,563 | |||||||||
Interest expense | 51,554 | 45,370 | 27,003 | |||||||||
Total expenses | 399,705 | 344,896 | 212,229 | |||||||||
Other income: | ||||||||||||
Other interest income | 61 | 172 | 87 | |||||||||
Gain on sale of real estate, net | — | — | 10,894 | |||||||||
Total other income | 61 | 172 | 10,981 | |||||||||
Net income (loss) | 763 | (29,015 | ) | (12,352 | ) | |||||||
Net income (loss) attributable to noncontrolling interest | — | — | — | |||||||||
Net income (loss) attributable to common stockholders | $ | 763 | $ | (29,015 | ) | $ | (12,352 | ) | ||||
Net income (loss) per common share attributable to common stockholders, basic and diluted | $ | — | $ | (0.18 | ) | $ | (0.14 | ) | ||||
Weighted-average number of common shares outstanding, basic and diluted | 180,043,027 | 163,358,289 | 91,374,493 | |||||||||
See accompanying notes to consolidated financial statements.
F-4
KBS REAL ESTATE INVESTMENT TRUST III, INC.
CONSOLIDATED STATEMENTS OF COMPREHENSIVE INCOME (LOSS)
(in thousands)
Years Ended December 31, | ||||||||||||
2016 | 2015 | 2014 | ||||||||||
Net income (loss) | $ | 763 | $ | (29,015 | ) | $ | (12,352 | ) | ||||
Other comprehensive income (loss): | ||||||||||||
Unrealized losses on derivative instruments designated as cash flow hedges | (3,582 | ) | (9,073 | ) | (10,085 | ) | ||||||
Reclassification adjustment realized in net income (effective portion) | 5,513 | 7,034 | 5,716 | |||||||||
Total other comprehensive income (loss) | 1,931 | (2,039 | ) | (4,369 | ) | |||||||
Total comprehensive income (loss) | $ | 2,694 | $ | (31,054 | ) | $ | (16,721 | ) | ||||
Total comprehensive income (loss) attributable to noncontrolling interest | $ | — | $ | — | $ | — | ||||||
Total comprehensive income (loss) attributable to common stockholders | $ | 2,694 | $ | (31,054 | ) | $ | (16,721 | ) | ||||
See accompanying notes to consolidated financial statements.
F-5
KBS REAL ESTATE INVESTMENT TRUST III, INC.
CONSOLIDATED STATEMENTS OF EQUITY
(dollars in thousands)
Additional Paid-in Capital | Cumulative Distributions and Net Losses | Accumulated Other Comprehensive Income (Loss) | Total Stockholders’ Equity | Noncontrolling Interest | Total Equity | ||||||||||||||||||||||||||
Common Stock | |||||||||||||||||||||||||||||||
Shares | Amounts | ||||||||||||||||||||||||||||||
Balance, December 31, 2013 | 66,430,888 | $ | 664 | $ | 574,762 | $ | (74,788 | ) | $ | 2,179 | $ | 502,817 | $ | — | $ | 502,817 | |||||||||||||||
Net loss | — | — | — | (12,352 | ) | — | (12,352 | ) | (12,352 | ) | |||||||||||||||||||||
Other comprehensive loss | — | — | — | — | (4,369 | ) | (4,369 | ) | — | (4,369 | ) | ||||||||||||||||||||
Issuance of common stock | 57,372,731 | 574 | 583,284 | — | — | 583,858 | — | 583,858 | |||||||||||||||||||||||
Transfers to redeemable common stock | — | — | (16,915 | ) | — | — | (16,915 | ) | — | (16,915 | ) | ||||||||||||||||||||
Redemptions of common stock | (377,073 | ) | (4 | ) | (3,633 | ) | — | — | (3,637 | ) | — | (3,637 | ) | ||||||||||||||||||
Distributions declared | — | — | — | (59,481 | ) | — | (59,481 | ) | — | (59,481 | ) | ||||||||||||||||||||
Commissions on stock sales and related dealer manager fees to affiliate | — | — | (50,808 | ) | — | — | (50,808 | ) | — | (50,808 | ) | ||||||||||||||||||||
Other offering costs | — | — | (6,017 | ) | — | — | (6,017 | ) | — | (6,017 | ) | ||||||||||||||||||||
Balance, December 31, 2014 | 123,426,546 | $ | 1,234 | $ | 1,080,673 | $ | (146,621 | ) | $ | (2,190 | ) | $ | 933,096 | $ | — | $ | 933,096 | ||||||||||||||
Net loss | — | — | — | (29,015 | ) | — | (29,015 | ) | — | (29,015 | ) | ||||||||||||||||||||
Other comprehensive loss | — | — | — | — | (2,039 | ) | (2,039 | ) | — | (2,039 | ) | ||||||||||||||||||||
Issuance of common stock | 55,602,428 | 556 | 579,653 | — | — | 580,209 | — | 580,209 | |||||||||||||||||||||||
Transfers to redeemable common stock | — | — | (26,038 | ) | — | — | (26,038 | ) | — | (26,038 | ) | ||||||||||||||||||||
Redemptions of common stock | (1,085,736 | ) | (11 | ) | (10,579 | ) | — | — | (10,590 | ) | — | (10,590 | ) | ||||||||||||||||||
Distributions declared | — | — | — | (106,189 | ) | — | (106,189 | ) | — | (106,189 | ) | ||||||||||||||||||||
Commissions on stock sales and related dealer manager fees to affiliate | — | — | (48,947 | ) | — | — | (48,947 | ) | — | (48,947 | ) | ||||||||||||||||||||
Other offering costs | — | — | (3,655 | ) | — | — | (3,655 | ) | — | (3,655 | ) | ||||||||||||||||||||
Balance, December 31, 2015 | 177,943,238 | $ | 1,779 | $ | 1,571,107 | $ | (281,825 | ) | $ | (4,229 | ) | $ | 1,286,832 | $ | — | $ | 1,286,832 | ||||||||||||||
Net income | — | — | — | 763 | — | 763 | — | 763 | |||||||||||||||||||||||
Other comprehensive income | — | — | — | — | 1,931 | 1,931 | — | 1,931 | |||||||||||||||||||||||
Issuance of common stock | 6,485,383 | 65 | 61,806 | — | — | 61,871 | — | 61,871 | |||||||||||||||||||||||
Transfers to redeemable common stock | — | — | (6,504 | ) | — | — | (6,504 | ) | — | (6,504 | ) | ||||||||||||||||||||
Redemptions of common stock | (3,538,049 | ) | (35 | ) | (34,732 | ) | — | — | (34,767 | ) | — | (34,767 | ) | ||||||||||||||||||
Distributions declared | — | — | — | (117,025 | ) | — | (117,025 | ) | — | (117,025 | ) | ||||||||||||||||||||
Other offering costs | — | — | (25 | ) | — | — | (25 | ) | — | (25 | ) | ||||||||||||||||||||
Noncontrolling interest contribution | — | — | — | — | — | — | 300 | 300 | |||||||||||||||||||||||
Balance, December 31, 2016 | 180,890,572 | $ | 1,809 | $ | 1,591,652 | $ | (398,087 | ) | $ | (2,298 | ) | $ | 1,193,076 | $ | 300 | $ | 1,193,376 | ||||||||||||||
See accompanying notes to consolidated financial statements.
F-6
KBS REAL ESTATE INVESTMENT TRUST III, INC.
CONSOLIDATED STATEMENTS OF CASH FLOWS
(in thousands)
Years Ended December 31, | ||||||||||||
2016 | 2015 | 2014 | ||||||||||
Cash Flows from Operating Activities: | ||||||||||||
Net income (loss) | $ | 763 | $ | (29,015 | ) | $ | (12,352 | ) | ||||
Adjustments to reconcile net income (loss) to net cash provided by operating activities: | ||||||||||||
Depreciation and amortization | 161,364 | 136,935 | 79,563 | |||||||||
Noncash interest income on real estate-related investment | 15 | 27 | 26 | |||||||||
Deferred rents | (17,212 | ) | (17,887 | ) | (9,655 | ) | ||||||
Loss due to property damage | — | 62 | — | |||||||||
Allowance for doubtful accounts | 1,279 | 701 | 883 | |||||||||
Amortization of above- and below-market leases, net | (8,924 | ) | (6,987 | ) | (4,111 | ) | ||||||
Amortization of deferred financing costs | 5,064 | 3,615 | 1,941 | |||||||||
Unrealized (gains) losses on derivative instruments | (1,597 | ) | 6,078 | 1,494 | ||||||||
Gain on sale of real estate | — | — | (10,894 | ) | ||||||||
Changes in operating assets and liabilities: | ||||||||||||
Rents and other receivables | (5,019 | ) | (4,163 | ) | (2,683 | ) | ||||||
Prepaid expenses and other assets | (17,034 | ) | (16,340 | ) | (9,965 | ) | ||||||
Accounts payable and accrued liabilities | 672 | 9,039 | 6,283 | |||||||||
Other liabilities | 2,740 | 8,738 | 9,923 | |||||||||
Due to affiliates | (7,954 | ) | 6,718 | 3,501 | ||||||||
Net cash provided by operating activities | 114,157 | 97,521 | 53,954 | |||||||||
Cash Flows from Investing Activities: | ||||||||||||
Acquisitions of real estate | (141,760 | ) | (755,548 | ) | (1,044,040 | ) | ||||||
Improvements to real estate | (67,275 | ) | (69,116 | ) | (31,805 | ) | ||||||
Payments for construction in progress | (11,831 | ) | (783 | ) | — | |||||||
Proceeds from sale of real estate, net | — | — | 42,739 | |||||||||
Advances on real estate loan receivable | (544 | ) | (2,176 | ) | (2,992 | ) | ||||||
Purchase of interest rate cap | — | (175 | ) | — | ||||||||
Principal repayments on real estate loan receivable | 22,526 | 162 | 146 | |||||||||
Escrow deposits for future real estate purchase | — | (4,350 | ) | — | ||||||||
Net cash used in investing activities | (198,884 | ) | (831,986 | ) | (1,035,952 | ) | ||||||
Cash Flows from Financing Activities: | ||||||||||||
Proceeds from notes payable | 248,470 | 576,454 | 632,208 | |||||||||
Principal payments on notes payable | (108,457 | ) | (245,960 | ) | (40,000 | ) | ||||||
Payments of deferred financing costs | (2,201 | ) | (5,259 | ) | (7,448 | ) | ||||||
Proceeds from issuance of common stock | — | 524,842 | 554,529 | |||||||||
Payments to redeem common stock | (34,767 | ) | (10,590 | ) | (3,637 | ) | ||||||
Payments of commissions on stock sales and related dealer manager fees | — | (48,947 | ) | (50,808 | ) | |||||||
Payments of other offering costs | (34 | ) | (3,918 | ) | (6,166 | ) | ||||||
Noncontrolling interest contribution | 300 | — | — | |||||||||
Reimbursement of other offering costs from affiliate | — | 1,173 | — | |||||||||
Return of contingent consideration related to acquisition of real estate | 228 | (228 | ) | — | ||||||||
Distributions paid to common stockholders | (54,986 | ) | (47,603 | ) | (27,126 | ) | ||||||
Net cash provided by financing activities | 48,553 | 739,964 | 1,051,552 | |||||||||
Net (decrease) increase in cash, cash equivalents and restricted cash | (36,174 | ) | 5,499 | 69,554 | ||||||||
Cash, cash equivalents and restricted cash, beginning of period | 108,242 | 102,743 | 33,189 | |||||||||
Cash, cash equivalents and restricted cash, end of period | $ | 72,068 | $ | 108,242 | $ | 102,743 | ||||||
Supplemental Disclosure of Cash Flow Information: | ||||||||||||
Interest paid, net of capitalized interest of $163, $0 and $0 for the years ended December 31, 2016, 2015, and 2014, respectively | $ | 47,238 | $ | 34,684 | $ | 22,925 | ||||||
Supplemental Disclosure of Noncash Investing and Financing Activities: | ||||||||||||
Distributions paid to common stockholders through common stock issuances pursuant to the dividend reinvestment plan | $ | 61,871 | $ | 55,367 | $ | 29,329 | ||||||
Increase in distributions payable | $ | 168 | $ | 3,219 | $ | 3,026 | ||||||
Increase in accrued improvements to real estate | $ | 53 | $ | 4,134 | $ | 6,970 | ||||||
Liabilities assumed in connection with real estate acquisitions | $ | 10 | $ | 40 | $ | 845 | ||||||
Application of escrow deposits to acquisition of real estate | $ | 4,350 | $ | — | $ | — | ||||||
Increase in construction in progress payable | $ | 4,717 | $ | 207 | $ | — | ||||||
Increase in construction in progress due to affiliate | $ | 132 | $ | — | $ | — | ||||||
Transfer of land to construction in progress | $ | 4,183 | $ | — | $ | — | ||||||
See accompanying notes to consolidated financial statements.
F-7
KBS REAL ESTATE INVESTMENT TRUST III, INC.
NOTES TO CONSOLIDATED FINANCIAL STATEMENTS
December 31, 2016
1. | ORGANIZATION |
KBS Real Estate Investment Trust III, Inc. (the “Company”) was formed on December 22, 2009 as a Maryland corporation that elected to be taxed as a real estate investment trust (“REIT”) beginning with the taxable year ended December 31, 2011 and it intends to continue to operate in such manner. Substantially all of the Company’s business is conducted through KBS Limited Partnership III (the “Operating Partnership”), a Delaware limited partnership. The Company is the sole general partner of and owns a 0.1% partnership interest in the Operating Partnership. KBS REIT Holdings III LLC (“REIT Holdings III”), the limited partner of the Operating Partnership, owns the remaining 99.9% interest in the Operating Partnership and is its sole limited partner. The Company is the sole member and manager of REIT Holdings III.
Subject to certain restrictions and limitations, the business of the Company is externally managed by KBS Capital Advisors LLC (the “Advisor”), an affiliate of the Company, pursuant to an advisory agreement the Company entered into with the Advisor (the “Advisory Agreement”). On January 26, 2010, the Company issued 20,000 shares of its common stock to the Advisor at a purchase price of $10.00 per share. As of December 31, 2016, the Advisor owned 20,000 shares of the Company’s common stock.
The Company owns a diverse portfolio of real estate investments. As of December 31, 2016, the Company owned 28 office properties and one mixed-use office/retail property and has entered into a joint venture (the “Hardware Village Joint Venture”) with a developer to develop and subsequently operate one multi-family apartment project (“Hardware Village”), which is currently under construction.
The Company commenced its initial public offering (the “Offering”) on October 26, 2010. Upon commencing the Offering, the Company retained KBS Capital Markets Group LLC (the “Dealer Manager”), an affiliate of the Company, to serve as the dealer manager of the Offering pursuant to a dealer manager agreement, as amended and restated (the “Dealer Manager Agreement”). The Company ceased offering shares of common stock in the primary Offering on May 29, 2015 and terminated the primary Offering on July 28, 2015.
The Company sold 169,006,162 shares of common stock in the primary Offering for gross proceeds of $1.7 billion. As of December 31, 2016, the Company had also sold 16,973,229 shares of common stock under its dividend reinvestment plan for gross offering proceeds of $165.0 million. Also as of December 31, 2016, the Company had redeemed 5,367,281 shares sold in the Offering for $52.5 million.
Additionally, on October 3, 2014, the Company issued 258,462 shares of common stock for $2.4 million in private transactions exempt from the registration requirements pursuant to Section 4(a)(2) of the Securities Act of 1933.
The Company continues to offer shares of common stock under its dividend reinvestment plan. In some states, the Company will need to renew the registration statement annually or file a new registration statement to continue its dividend reinvestment plan offering. The Company may terminate its dividend reinvestment plan offering at any time.
F-8
KBS REAL ESTATE INVESTMENT TRUST III, INC.
NOTES TO CONSOLIDATED FINANCIAL STATEMENTS (CONTINUED)
December 31, 2016
2. | SUMMARY OF SIGNIFICANT ACCOUNTING POLICIES |
Principles of Consolidation and Basis of Presentation
The consolidated financial statements have been prepared in accordance with U.S. generally accepted accounting principles (“GAAP”) as contained within the Financial Accounting Standards Board (“FASB”) Accounting Standards Codification (“ASC”) and the rules and regulations of the Securities and Exchange Commission (the “SEC”).
The consolidated financial statements include the accounts of the Company, REIT Holdings III, the Operating Partnership, their direct and indirect wholly owned subsidiaries and a joint venture in which the Company has a controlling interest. All significant intercompany balances and transactions are eliminated in consolidation.
Use of Estimates
The preparation of the consolidated financial statements and accompanying notes thereto in conformity with GAAP requires management to make estimates and assumptions that affect the amounts reported in the consolidated financial statements and accompanying notes. Actual results could materially differ from those estimates.
Reclassifications
Certain amounts in the Company’s prior period consolidated financial statements have been reclassified to conform to the current period presentation. These reclassifications have not changed the results of operations of the prior period. During the year ended December 31, 2016, the Company elected to early adopt ASU No. 2016-18 (as defined below). As a result, the Company no longer presents the changes within restricted cash in the consolidated statements of cash flows. Instead, restricted cash is included with cash and cash equivalents when reconciling the beginning of period and end of period total amounts shown on the consolidated statements of cash flows.
Revenue Recognition
Real Estate
The Company recognizes minimum rent, including rental abatements, lease incentives and contractual fixed increases attributable to operating leases, on a straight-line basis over the term of the related leases when collectability is reasonably assured and records amounts expected to be received in later years as deferred rent receivable. If the lease provides for tenant improvements, the Company determines whether the tenant improvements, for accounting purposes, are owned by the tenant or the Company. When the Company is the owner of the tenant improvements, the tenant is not considered to have taken physical possession or have control of the physical use of the leased asset until the tenant improvements are substantially completed. When the tenant is the owner of the tenant improvements, any tenant improvement allowance (including amounts that the tenant can take in the form of cash or a credit against its rent) that is funded is treated as a lease incentive and amortized as a reduction of revenue over the lease term. Tenant improvement ownership is determined based on various factors including, but not limited to:
•whether the lease stipulates how a tenant improvement allowance may be spent;
•whether the amount of a tenant improvement allowance is in excess of market rates;
•whether the tenant or landlord retains legal title to the improvements at the end of the lease term;
•whether the tenant improvements are unique to the tenant or general-purpose in nature; and
•whether the tenant improvements are expected to have any residual value at the end of the lease.
The Company records property operating expense reimbursements due from tenants for common area maintenance, real estate taxes, and other recoverable costs in the period the related expenses are incurred.
F-9
KBS REAL ESTATE INVESTMENT TRUST III, INC.
NOTES TO CONSOLIDATED FINANCIAL STATEMENTS (CONTINUED)
December 31, 2016
The Company makes estimates of the collectability of its tenant receivables related to base rents, including deferred rent receivable, expense reimbursements and other revenue or income. Management specifically analyzes accounts receivable, deferred rent receivable, historical bad debts, customer creditworthiness, current economic trends and changes in customer payment terms when evaluating the adequacy of the allowance for doubtful accounts. In addition, with respect to tenants in bankruptcy, management makes estimates of the expected recovery of pre-petition and post-petition claims in assessing the estimated collectability of the related receivable. In some cases, the ultimate resolution of these claims can exceed one year. When a tenant is in bankruptcy, the Company will record a bad debt reserve for the tenant’s receivable balance and generally will not recognize subsequent rental revenue until cash is received or until the tenant is no longer in bankruptcy and has the ability to make rental payments.
Real Estate Loan Receivable
Interest income on the Company’s real estate loan receivable is recognized on an accrual basis over the life of the investment using the interest method. Direct loan origination fees and origination or acquisition costs, as well as acquisition premiums or discounts, are amortized over the term of the loan as an adjustment to interest income. The Company places loans on non-accrual status when any portion of principal or interest is 90 days past due, or earlier when concern exists as to the ultimate collection of principal or interest. When a loan is placed on non-accrual status, the Company reserves for any unpaid accrued interest and generally does not recognize subsequent interest income until the cash is received, or the loan returns to accrual status. The Company will resume the accrual of interest if it determines the collection of interest, according to the contractual terms of the loan, is probable.
The Company generally recognizes income on impaired loans on either a cash basis, where interest income is only recorded when received in cash, or on a cost-recovery basis, where all cash receipts are applied against the carrying value of the loan. The Company considers the collectability of the loan’s principal balance in determining whether to recognize income on impaired loans on a cash basis or a cost-recovery basis.
Cash and Cash Equivalents
The Company recognizes interest income on its cash and cash equivalents as it is earned and classifies such amounts as other interest income.
Real Estate
Depreciation and Amortization
Real estate costs related to the acquisition and improvement of properties are capitalized and amortized over the expected useful life of the asset on a straight-line basis. Repair and maintenance costs are charged to expense as incurred and significant replacements and betterments are capitalized. Repair and maintenance costs include all costs that do not extend the useful life of the real estate asset. The Company considers the period of future benefit of an asset to determine its appropriate useful life. Expenditures for tenant improvements are capitalized and amortized over the shorter of the tenant’s lease term or expected useful life. The Company anticipates the estimated useful lives of its assets by class to be generally as follows:
Buildings | 25-40 years |
Building improvements | 10-25 years |
Tenant improvements | Shorter of lease term or expected useful life |
Tenant origination and absorption costs | Remaining term of related leases, including below-market renewal periods |
Real Estate Acquisition Valuation
The Company records the acquisition of income-producing real estate or real estate that will be used for the production of income as a business combination. All assets acquired and liabilities assumed in a business combination are measured at their acquisition-date fair values. Acquisition costs are expensed as incurred and restructuring costs that do not meet the definition of a liability at the acquisition date are expensed in periods subsequent to the acquisition date.
F-10
KBS REAL ESTATE INVESTMENT TRUST III, INC.
NOTES TO CONSOLIDATED FINANCIAL STATEMENTS (CONTINUED)
December 31, 2016
The Company assesses the acquisition date fair values of all tangible assets, identifiable intangibles and assumed liabilities using methods similar to those used by independent appraisers, generally utilizing a discounted cash flow analysis that applies appropriate discount and/or capitalization rates and available market information. Estimates of future cash flows are based on a number of factors, including historical operating results, known and anticipated trends, and market and economic conditions. The fair value of tangible assets of an acquired property considers the value of the property as if it were vacant.
The Company records above-market and below-market in-place lease values for acquired properties based on the present value (using a discount rate that reflects the risks associated with the leases acquired) of the difference between (i) the contractual amounts to be paid pursuant to the in-place leases and (ii) management’s estimate of fair market lease rates for the corresponding in-place leases, measured over a period equal to the remaining non-cancelable term of above-market in-place leases and for the initial term plus any extended term for any leases with below-market renewal options. The Company amortizes any recorded above-market or below-market lease values as a reduction or increase, respectively, to rental income over the remaining non-cancelable terms of the respective lease, including any below-market renewal periods.
The Company estimates the value of tenant origination and absorption costs by considering the estimated carrying costs during hypothetical expected lease-up periods, considering current market conditions. In estimating carrying costs, the Company includes real estate taxes, insurance and other operating expenses and estimates of lost rentals at market rates during the expected lease-up periods.
The Company amortizes the value of tenant origination and absorption costs to depreciation and amortization expense over the remaining non-cancelable term of the leases.
Estimates of the fair values of the tangible assets, identifiable intangibles and assumed liabilities require the Company to make significant assumptions to estimate market lease rates, property-operating expenses, carrying costs during lease-up periods, discount rates, market absorption periods, and the number of years the property will be held for investment. The use of inappropriate assumptions would result in an incorrect valuation of the Company’s acquired tangible assets, identifiable intangibles and assumed liabilities, which would impact the amount of the Company’s net income.
Subsequent to the acquisition of a property, the Company may incur and capitalize costs necessary to get the property ready for its intended use. During that time, certain costs such as legal fees, real estate taxes and insurance and financing costs are also capitalized.
Impairment of Real Estate and Related Intangible Assets and Liabilities
The Company continually monitors events and changes in circumstances that could indicate that the carrying amounts of its real estate and related intangible assets and liabilities may not be recoverable or realized. When indicators of potential impairment suggest that the carrying value of real estate and related intangible assets and liabilities may not be recoverable, the Company assesses the recoverability by estimating whether the Company will recover the carrying value of the real estate and related intangible assets and liabilities through its undiscounted future cash flows and its eventual disposition. If, based on this analysis, the Company does not believe that it will be able to recover the carrying value of the real estate and related intangible assets and liabilities, the Company would record an impairment loss to the extent that the carrying value exceeds the estimated fair value of the real estate and related intangible assets and liabilities. The Company did not record any impairment loss on its real estate and related intangible assets during the years ended December 31, 2016, 2015 and 2014.
Projecting future cash flows involves estimating expected future operating income and expenses related to the real estate and its related intangible assets and liabilities as well as market and other trends. Using inappropriate assumptions to estimate cash flows could result in incorrect fair values of the real estate and its related intangible assets and liabilities and could result in the overstatement of the carrying values of our real estate and related intangible assets and liabilities and an overstatement of our net income.
F-11
KBS REAL ESTATE INVESTMENT TRUST III, INC.
NOTES TO CONSOLIDATED FINANCIAL STATEMENTS (CONTINUED)
December 31, 2016
Real Estate Held for Sale and Discontinued Operations
The Company generally considers real estate to be “held for sale” when the following criteria are met: (i) management commits to a plan to sell the property, (ii) the property is available for sale immediately, (iii) the property is actively being marketed for sale at a price that is reasonable in relation to its current fair value, (iv) the sale of the property within one year is considered probable and (v) significant changes to the plan to sell are not expected. Real estate that is held for sale and its related assets are classified as “real estate held for sale” and “assets related to real estate held for sale,” respectively, for all periods presented in the accompanying consolidated financial statements. Notes payable and other liabilities related to real estate held for sale are classified as “notes payable related to real estate held for sale” and “liabilities related to real estate held for sale,” respectively, for all periods presented in the accompanying consolidated financial statements. Real estate classified as held for sale is no longer depreciated and is reported at the lower of its carrying value or its estimated fair value less estimated costs to sell. Operating results of properties and related gains on sale that were disposed of or classified as held for sale in the ordinary course of business during the years ended December 31, 2016, 2015 and 2014 that had not been classified as held for sale in financial statements prior to January 1, 2014 are included in continuing operations on the Company’s consolidated statements of operations.
Construction in Progress
Direct investments in undeveloped land or properties without leases in place at the time of acquisition are accounted for as an asset acquisition and not as a business combination. Acquisition fees and expenses are capitalized into the cost basis of an asset acquisition. Additionally, during the time in which the Company is incurring costs necessary to bring these investments to their intended use, certain costs such as legal fees, real estate taxes and insurance and financing costs are also capitalized. Once construction in progress is substantially completed, the amounts capitalized to construction in progress are transferred to land and buildings and improvements and are depreciated over their respective useful lives.
Real Estate Loans Receivable
The Company records real estate loans receivable at amortized cost, net of loan loss reserves (if any), and evaluates its real estate loans receivable for impairment at each balance sheet date. The amortized cost of a real estate loan receivable is the outstanding unpaid principal balance, net of unamortized acquisition premiums or discounts and unamortized costs and fees directly associated with the origination or acquisition of the loan.
The reserve for loan losses is a valuation allowance that reflects management’s estimate of loan losses inherent in the loan portfolio as of the balance sheet date. The reserve is adjusted through “Provision for loan losses” on the Company’s consolidated statements of operations and is decreased by charge-offs to specific loans when losses are confirmed. The reserve for loan losses may include a portfolio-based component and an asset-specific component.
An asset-specific reserve relates to reserves for losses on loans considered impaired. The Company considers a loan to be impaired when, based upon current information and events, it believes that it is probable that the Company will be unable to collect all amounts due under the contractual terms of the loan agreement. The Company also considers a loan to be impaired if it grants the borrower a concession through a modification of the loan terms or if it expects to receive assets (including equity interests in the borrower) with fair values that are less than the carrying value of the loan in satisfaction of the loan. A reserve is established when the present value of payments expected to be received, observable market prices, the estimated fair value of the collateral (for loans that are dependent on the collateral for repayment) or amounts expected to be received in satisfaction of a loan are lower than the carrying value of that loan.
Failure to recognize impairments would result in the overstatement of earnings and the carrying value of real estate loans held for investment. Actual losses, if any, could differ significantly from estimated amounts.
Cash and Cash Equivalents
The Company considers all highly liquid investments purchased with an original maturity of three months or less to be cash equivalents. Cash equivalents may include cash and short term investments. Cash and cash equivalents are stated at cost, which approximates fair value. There are no restrictions on the use of the Company’s cash and cash equivalents as of December 31, 2016.
F-12
KBS REAL ESTATE INVESTMENT TRUST III, INC.
NOTES TO CONSOLIDATED FINANCIAL STATEMENTS (CONTINUED)
December 31, 2016
The Company’s cash and cash equivalents balance exceeds federally insurable limits as of December 31, 2016. The Company monitors the cash balances in its operating accounts and adjusts the cash balances as appropriate; however, these cash balances could be impacted if the underlying financial institutions fail or are subject to other adverse conditions in the financial markets. To date, the Company has experienced no loss or lack of access to cash in its operating accounts.
Rents and Other Receivables
The Company periodically evaluates the collectability of amounts due from tenants and maintains an allowance for doubtful accounts for estimated losses resulting from the inability of tenants to make required payments under lease agreements. In addition, the Company maintains an allowance for deferred rent receivable that arises from the straight-lining of rents. The Company exercises judgment in establishing these allowances and considers payment history and current credit status of its tenants in developing these estimates.
Derivative Instruments
The Company enters into derivative instruments for risk management purposes to hedge its exposure to cash flow variability caused by changing interest rates on its variable rate notes payable. The Company records these derivative instruments at fair value on the accompanying consolidated balance sheets. Derivative instruments designated and qualifying as a hedge of the exposure to variability in expected future cash flows or other types of forecasted transactions are considered cash flow hedges. The change in fair value of the effective portion of a derivative instrument that is designated as a cash flow hedge is recorded as other comprehensive income (loss) on the accompanying consolidated statements of comprehensive income (loss) and consolidated statements of equity. The changes in fair value for derivative instruments that are not designated as a hedge or that do not meet the hedge accounting criteria are recorded as gain or loss on derivative instruments and included in interest expense as presented in the accompanying consolidated statements of operations.
The Company formally documents all relationships between hedging instruments and hedged items, as well as its risk-management objectives and strategy for undertaking various hedge transactions. This process includes designating all derivative instruments that are part of a hedging relationship to specific forecasted transactions or recognized obligations on the consolidated balance sheets. The Company also assesses and documents, both at the hedging instrument’s inception and on a quarterly basis thereafter, whether the derivative instruments that are used in hedging transactions are highly effective in offsetting changes in cash flows associated with the respective hedged items. When the Company determines that a derivative instrument ceases to be highly effective as a hedge, or that it is probable the underlying forecasted transaction will not occur, the Company discontinues hedge accounting prospectively and reclassifies amounts recorded to accumulated other comprehensive income (loss) to earnings.
Deferred Financing Costs
Deferred financing costs represent commitment fees, loan fees, legal fees and other third-party costs associated with obtaining financing and are presented on the balance sheet as a direct deduction from the carrying value of the associated debt liability. These costs are amortized over the terms of the respective financing agreements using the interest method. Unamortized deferred financing costs are generally expensed when the associated debt is refinanced or repaid before maturity unless specific rules are met that would allow for the carryover of such costs to the refinanced debt. Deferred financing costs incurred before an associated debt liability is recognized are included in prepaid and other assets on the balance sheet. Costs incurred in seeking financing transactions that do not close are expensed in the period in which it is determined that the financing will not close.
F-13
KBS REAL ESTATE INVESTMENT TRUST III, INC.
NOTES TO CONSOLIDATED FINANCIAL STATEMENTS (CONTINUED)
December 31, 2016
Fair Value Measurements
Under GAAP, the Company is required to measure certain financial instruments at fair value on a recurring basis. In addition, the Company is required to measure other non-financial and financial assets at fair value on a non-recurring basis (e.g., carrying value of impaired real estate loans receivable and long-lived assets). Fair value is defined as the price that would be received upon the sale of an asset or paid to transfer a liability in an orderly transaction between market participants at the measurement date. The GAAP fair value framework uses a three-tiered approach. Fair value measurements are classified and disclosed in one of the following three categories:
• | Level 1: unadjusted quoted prices in active markets that are accessible at the measurement date for identical assets or liabilities; |
• | Level 2: quoted prices for similar instruments in active markets, quoted prices for identical or similar instruments in markets that are not active, and model-derived valuations in which significant inputs and significant value drivers are observable in active markets; and |
• | Level 3: prices or valuation techniques where little or no market data is available that requires inputs that are both significant to the fair value measurement and unobservable. |
When available, the Company utilizes quoted market prices from independent third-party sources to determine fair value and classifies such items in Level 1 or Level 2. In instances where the market for a financial instrument is not active, regardless of the availability of a nonbinding quoted market price, observable inputs might not be relevant and could require the Company to make a significant adjustment to derive a fair value measurement. Additionally, in an inactive market, a market price quoted from an independent third party may rely more on models with inputs based on information available only to that independent third party. When the Company determines the market for a financial instrument owned by the Company to be illiquid or when market transactions for similar instruments do not appear orderly, the Company uses several valuation sources (including internal valuations, discounted cash flow analysis and quoted market prices) and establishes a fair value by assigning weights to the various valuation sources. Additionally, when determining the fair value of liabilities in circumstances in which a quoted price in an active market for an identical liability is not available, the Company measures fair value using (i) a valuation technique that uses the quoted price of the identical liability when traded as an asset or quoted prices for similar liabilities when traded as assets or (ii) another valuation technique that is consistent with the principles of fair value measurement, such as the income approach or the market approach.
Changes in assumptions or estimation methodologies can have a material effect on these estimated fair values. In this regard, the derived fair value estimates cannot be substantiated by comparison to independent markets and, in many cases, may not be realized in an immediate settlement of the instrument.
The Company considers the following factors to be indicators of an inactive market: (i) there are few recent transactions, (ii) price quotations are not based on current information, (iii) price quotations vary substantially either over time or among market makers (for example, some brokered markets), (iv) indexes that previously were highly correlated with the fair values of the asset or liability are demonstrably uncorrelated with recent indications of fair value for that asset or liability, (v) there is a significant increase in implied liquidity risk premiums, yields, or performance indicators (such as delinquency rates or loss severities) for observed transactions or quoted prices when compared with the Company’s estimate of expected cash flows, considering all available market data about credit and other nonperformance risk for the asset or liability, (vi) there is a wide bid-ask spread or significant increase in the bid-ask spread, (vii) there is a significant decline or absence of a market for new issuances (that is, a primary market) for the asset or liability or similar assets or liabilities, and (viii) little information is released publicly (for example, a principal-to-principal market).
The Company considers the following factors to be indicators of non-orderly transactions: (i) there was not adequate exposure to the market for a period before the measurement date to allow for marketing activities that are usual and customary for transactions involving such assets or liabilities under current market conditions, (ii) there was a usual and customary marketing period, but the seller marketed the asset or liability to a single market participant, (iii) the seller is in or near bankruptcy or receivership (that is, distressed), or the seller was required to sell to meet regulatory or legal requirements (that is, forced), and (iv) the transaction price is an outlier when compared with other recent transactions for the same or similar assets or liabilities.
F-14
KBS REAL ESTATE INVESTMENT TRUST III, INC.
NOTES TO CONSOLIDATED FINANCIAL STATEMENTS (CONTINUED)
December 31, 2016
Dividend Reinvestment Plan
The Company has adopted a dividend reinvestment plan pursuant to which common stockholders may elect to have all or a portion of their dividends and other distributions, exclusive of dividends and other distributions that a Company’s board of directors designates as ineligible for reinvestment through the dividend reinvestment plan, reinvested in additional shares of the Company’s common stock in lieu of receiving cash distributions.
During the Company’s primary Offering and until the Company established an estimated value per share of its common stock for a purpose other than to set the price to acquire a share of common stock in the Company’s primary public Offering, participants in the dividend reinvestment plan acquired the Company’s common stock at a price per share equal to 95% of the most recent price to acquire a share of the Company’s common stock in the primary public Offering (ignoring any discounts that may be available to certain categories of investors). Once the Company established an estimated value per share of its common stock for a purpose other than to set the price to acquire a share of common stock in the Company’s primary public Offering, participants in the dividend reinvestment plan acquire shares of the Company’s common stock at a price equal to 95% of the estimated value per share of the Company’s common stock, as determined by the Advisor or another firm chosen by the Company’s board of directors for that purpose. The initial purchase price per share under the dividend reinvestment plan was $9.50.
On May 5, 2014, the Company’s board of directors approved an updated offering price for shares of common stock to be sold in the primary Offering of $10.39 (unaudited), which was effective May 7, 2014. The updated offering price of shares of common stock to be sold in the primary Offering was determined by adding certain offering costs to the estimated value of the Company’s assets less the estimated value of the Company’s liabilities, or net asset value, divided by the number of shares outstanding, all as of March 31, 2014. Commencing with the June 2, 2014 purchase date and until the offering price was updated, the purchase price per share under the dividend reinvestment plan was $9.88.
On December 9, 2014, the Company’s board of directors approved an updated offering price for shares of common stock to be sold in the primary Offering of $10.51 (unaudited), which was effective December 12, 2014. The updated offering price of shares of common stock to be sold in the primary Offering was determined by adding certain offering costs to the estimated value of the Company’s assets less the estimated value of the Company’s liabilities, or net asset value, divided by the number of shares outstanding, all as of September 30, 2014, with the exception of an adjustment for actual or estimated acquisition fees and closing costs related to six properties that were either acquired subsequent to September 30, 2014 or under contract to purchase and were reasonably probable to close, but had not yet closed as of December 9, 2014, which were included as a reduction to the net asset value. As of December 30, 2014, the Company had closed on each of the six properties. Commencing with the January 2, 2015 purchase date and until the estimated value per share was updated, the purchase price per share under the dividend reinvestment plan was $9.99.
On December 8, 2015, the Company’s board of directors approved an estimated value per share of the Company’s common stock of $10.04 (unaudited) based on the estimated value of the Company’s assets less the estimated value of the Company’s liabilities, or net asset value, divided by the number of shares outstanding, all as of September 30, 2015, with the exception of a reduction to the Company’s net asset value for acquisition fees and closing costs related to a real estate acquisition that closed subsequent to September 30, 2015 and deferred financing costs related to a mortgage loan that closed subsequent to September 30, 2015. The change in the dividend reinvestment plan purchase price was effective for the January 4, 2016 dividend reinvestment plan purchase date and was effective until the estimated value per share was updated. Commencing with the January 4, 2016 purchase date and until the estimated value per share was updated, the purchase price per share under the dividend reinvestment plan was $9.54.
On December 9, 2016, the Company’s board of directors approved an estimated value per share of the Company’s common stock of $10.63 (unaudited) based on the estimated value of the Company’s assets less the estimated value of the Company’s liabilities, or net asset value, divided by the number of shares outstanding, all as of September 30, 2016. The change in the dividend reinvestment plan purchase price was effective for the January 3, 2017 dividend reinvestment plan purchase date and is effective until the estimated value per share is updated. Thus, commencing with the January 3, 2017 purchase date and until the estimated value per share is updated, the purchase price per share under the dividend reinvestment plan is $10.10.
No selling commissions or dealer manager fees will be paid on shares sold under the dividend reinvestment plan. The board of directors of the Company may amend or terminate the dividend reinvestment plan for any reason upon 10 days’ notice to participants.
F-15
KBS REAL ESTATE INVESTMENT TRUST III, INC.
NOTES TO CONSOLIDATED FINANCIAL STATEMENTS (CONTINUED)
December 31, 2016
Redeemable Common Stock
The Company’s board of directors has adopted a share redemption program that may enable stockholders to sell their shares to the Company in limited circumstances.
There are several limitations on the Company’s ability to redeem shares under the share redemption program:
• | Unless the shares are being redeemed in connection with a stockholder’s death, “qualifying disability” or “determination of incompetence” (each as defined in the share redemption program, and together with redemptions sought in connection with a stockholder’s death, “Special Redemptions”), the Company may not redeem shares unless the stockholder has held the shares for one year. |
• | During any calendar year, the share redemption program limits the number of shares the Company may redeem to those that the Company could purchase with the amount of net proceeds from the sale of shares under the dividend reinvestment plan during the prior calendar year. Notwithstanding anything contained in the share redemption program to the contrary, the Company may increase or decrease the funding available for the redemption of shares pursuant to the program upon ten business days’ notice to its stockholders. The Company may provide notice by including such information (a) in a Current Report on Form 8-K or in its annual or quarterly reports, all publicly filed with the SEC or (b) in a separate mailing to its stockholders. |
• | During any calendar year, the Company may redeem no more than 5% of the weighted-average number of shares outstanding during the prior calendar year. |
• | The Company has no obligation to redeem shares if the redemption would violate the restrictions on distributions under Maryland law, which prohibits distributions that would cause a corporation to fail to meet statutory tests of solvency. |
Pursuant to the share redemption program, redemptions made in connection with Special Redemptions are made at a price per share equal to the most recent estimated value per share of the Company’s common stock as of the applicable redemption date. The price at which the Company will redeem all other shares eligible for redemption is as follows:
• | For those shares held by the redeeming stockholder for at least one year, 92.5% of the Company’s most recent estimated value per share as of the applicable redemption date; |
• | For those shares held by the redeeming stockholder for at least two years, 95.0% of the Company’s most recent estimated value per share as of the applicable redemption date; |
• | For those shares held by the redeeming stockholder for at least three years, 97.5% of the Company’s most recent estimated value per share as of the applicable redemption date; and |
• | For those shares held by the redeeming stockholder for at least four years, 100% of the Company’s most recent estimated value per share as of the applicable redemption date. |
On December 9, 2016, the Company’s board of directors approved an estimated value per share of its common stock of $10.63 (unaudited) based on the estimated value of the Company’s assets less the estimated value of the Company’s liabilities, or net asset value, divided by the number of shares outstanding, all as of September 30, 2016. This estimated value per share became effective for the December 2016 redemption date, which was December 30, 2016. The Company currently expects to utilize an independent valuation firm to update its estimated value per share in December 2017.
For purposes of determining the time period a redeeming stockholder has held each share, the time period begins as of the date the stockholder acquired the share; provided, that shares purchased by the redeeming stockholder pursuant to the dividend reinvestment plan will be deemed to have been acquired on the same date as the initial share to which the dividend reinvestment plan shares relate. The date of the share’s original issuance by the Company is not determinative. In addition, as described above, the shares owned by a stockholder may be redeemed at different prices depending on how long the stockholder has held each share submitted for redemption.
F-16
KBS REAL ESTATE INVESTMENT TRUST III, INC.
NOTES TO CONSOLIDATED FINANCIAL STATEMENTS (CONTINUED)
December 31, 2016
The Company’s board of directors may amend, suspend or terminate the share redemption program with 30 days’ notice to the Company’s stockholders, provided that the Company may increase or decrease the funding available for the redemption of shares pursuant to the share redemption program upon 10 business days’ notice. The Company may provide this notice by including such information in a Current Report on Form 8-K or in the Company’s annual or quarterly reports, all publicly filed with the SEC, or by a separate mailing to its stockholders.
The Company records amounts that are redeemable under the share redemption program as redeemable common stock in the accompanying consolidated balance sheets because the shares are mandatorily redeemable at the option of the holder and therefore their redemption is outside the control of the Company. The maximum amount redeemable under the Company’s share redemption program is limited to the number of shares the Company could purchase with the amount of the net proceeds from the sale of shares under the dividend reinvestment plan during the prior calendar year. However, because the amounts that can be redeemed in future periods are determinable and only contingent on an event that is likely to occur (e.g., the passage of time), the Company presents the net proceeds from the current year dividend reinvestment plan as redeemable common stock in the accompanying consolidated balance sheets.
The Company classifies financial instruments that represent a mandatory obligation of the Company to redeem shares as liabilities. The Company’s redeemable common shares are contingently redeemable at the option of the holder. When the Company determines it has a mandatory obligation to redeem shares under the share redemption program, it will reclassify such obligations from temporary equity to a liability based upon their respective settlement values.
The Company limits the dollar value of shares that may be redeemed under the program as described above. During the year ended December 31, 2016, the Company fulfilled all redemption requests eligible for redemption under the share redemption program and received in good order, redeeming $34.8 million of shares of common stock. Effective January 1, 2017, this limitation was reset, and based on the amount of net proceeds raised from the sale of shares under the dividend reinvestment plan during 2016, the Company has $61.9 million available for redemptions of shares eligible for redemption in 2017.
Related Party Transactions
The Company has entered into the Advisory Agreement with the Advisor and the Dealer Manager Agreement with the Dealer Manager. These agreements entitled the Advisor and/or the Dealer Manager to specified fees upon the provision of certain services with regard to the Offering and reimbursement of organization and offering costs incurred by the Advisor and the Dealer Manager on behalf of the Company and entitle the Advisor to specified fees upon the provision of certain services with regard to the investment of funds in real estate investments, the management of those investments, among other services, and the disposition of investments, as well as entitle the Advisor and/or Dealer Manager to reimbursement of organization and offering costs incurred by the Advisor and the Dealer Manager on behalf of the Company, such as expenses related to the dividend reinvestment plan, and certain costs incurred by the Advisor in providing services to the Company. In addition, the Advisor is entitled to certain other fees, including an incentive fee upon achieving certain performance goals, as detailed in the Advisory Agreement. The Company has also entered into a fee reimbursement agreement (the “AIP Reimbursement Agreement”) with the Dealer Manager pursuant to which the Company agreed to reimburse the Dealer Manager for certain fees and expenses it incurs for administering the Company’s participation in the DTCC Alternative Investment Product Platform with respect to certain accounts of the Company’s investors serviced through the platform. The Advisor and Dealer Manager also serve as the advisor and dealer manager, respectively, for KBS Real Estate Investment Trust, Inc., KBS Real Estate Investment Trust II, Inc., KBS Strategic Opportunity REIT, Inc., KBS Legacy Partners Apartment REIT, Inc., KBS Strategic Opportunity REIT II, Inc. and KBS Growth & Income REIT, Inc.
The Company records all related party fees as incurred, subject to any limitations described in the Advisory Agreement, the Dealer Manager Agreement or the AIP Reimbursement Agreement. See Note 9, “Related Party Transactions.”
F-17
KBS REAL ESTATE INVESTMENT TRUST III, INC.
NOTES TO CONSOLIDATED FINANCIAL STATEMENTS (CONTINUED)
December 31, 2016
Selling Commissions and Dealer Manager Fees
The Company paid the Dealer Manager up to 6.5% and 3.0% of the gross offering proceeds from the primary Offering as selling commissions and dealer manager fees, respectively. A reduced sales commission and dealer manager fee was paid with respect to certain volume discount sales. No sales commission or dealer manager fee is paid with respect to shares issued through the dividend reinvestment plan. The Dealer Manager reallowed 100% of sales commissions earned to participating broker-dealers. The Dealer Manager also reallowed certain participating broker-dealers up to 1% of the gross offering proceeds attributable to that participating broker-dealer as a marketing fee and, in special cases, the Dealer Manager increased the reallowance.
Organization and Offering Costs
Organization and offering costs (other than selling commissions and dealer manager fees) related to the Company’s now-terminated primary Offering were sometimes paid and, with respect to the dividend reinvestment plan, may be paid by the Advisor, the Dealer Manager or their affiliates on the Company’s behalf, or the Company may pay these costs directly. Offering costs include all costs incurred in connection with the Company’s now-terminated primary Offering or the Company’s now withdrawn follow-on offering (the “Follow-on Offering”) or incurred or to be incurred with respect to the dividend reinvestment plan. Organization costs include all costs incurred by the Company in connection with its formation, including but not limited to legal fees and other costs to incorporate. Organization costs are expensed as incurred and offering costs in the Offering, which include selling commissions and dealer manager fees, are charged as incurred as a reduction to stockholders’ equity.
Pursuant to the Advisory Agreement and the Dealer Manager Agreement, the Company was obligated to reimburse the Advisor, the Dealer Manager and their affiliates for organization and offering costs they incurred on the Company’s behalf. However, at the termination of the Company’s now-terminated primary Offering and at the termination of the offering pursuant to the dividend reinvestment plan, the Advisor agreed to reimburse the Company to the extent that selling commissions, dealer manager fees and other organization and offering expenses incurred by the Company exceed 15% of the gross offering proceeds. In addition, at the end of the Company’s now-terminated primary Offering and again at the end of the offering pursuant to the dividend reinvestment plan, the Advisor agreed to reimburse the Company to the extent that organization and offering expenses, excluding underwriting compensation (which includes selling commissions, dealer manager fees and any other items viewed as underwriting compensation by the Financial Industry Regulatory Authority), exceed 2% of gross offering proceeds. The Company directly paid or reimbursed the Dealer Manager for underwriting compensation as discussed in the prospectus for the primary Offering, provided that within 30 days after the end of the month in which the Company’s now-terminated primary Offering terminated, the Dealer Manager was required to reimburse the Company to the extent that the Company’s reimbursements caused total underwriting compensation for the Company’s now-terminated primary Offering to exceed 10% of the gross offering proceeds from such offering. The Company also directly paid or reimbursed the Dealer Manager for bona fide invoiced due diligence expenses of broker-dealers. However, no reimbursements made by the Company to the Advisor or the Dealer Manager could cause total organization and offering expenses incurred by the Company (including selling commissions, dealer manager fees and all other items of organization and offering expenses) to exceed 15% of the aggregate gross proceeds from the Company’s now-terminated primary Offering and the dividend reinvestment plan as of the date of reimbursement. As of December 31, 2016, the Company’s selling commissions, dealer manager fees, and organization and other offering costs did not exceed 15% of the gross offering proceeds from the Offering. Through December 31, 2016, including shares issued through the dividend reinvestment plan, the Company had sold 185,979,390 shares in the Offering for gross offering proceeds of $1.9 billion and incurred selling commissions and dealer manager fees of $158.8 million and organization and other offering costs of $23.8 million in the Offering.
In addition, from inception through August 2015, the Company recorded $1.2 million of offering costs related to the now withdrawn Follow-on Offering. Pursuant to the Advisory Agreement, the Advisor was obligated to reimburse the Company to the extent offering costs incurred by the Company in the Follow-on Offering exceeded 15% of the gross offering proceeds of the offering. On August 24, 2015, the Company withdrew the registration statement for the Follow-on Offering. As such, the Advisor reimbursed the Company for $1.2 million of offering costs related to the Follow-on Offering.
F-18
KBS REAL ESTATE INVESTMENT TRUST III, INC.
NOTES TO CONSOLIDATED FINANCIAL STATEMENTS (CONTINUED)
December 31, 2016
Acquisition and Origination Fees
The Company pays the Advisor an acquisition fee equal to 1.0% of the cost of investments acquired, including acquisition expenses and any debt attributable to such investments. With respect to investments in and originations of loans, the Company pays an origination fee equal to 1.0% of the amount to be funded by the Company to acquire or originate mortgage, mezzanine, bridge or other loans, including any expenses related to such investments and any debt the Company uses to fund the acquisition or origination of these loans. The Company does not pay an acquisition fee with respect to investments in loans.
Operating Expenses
Under the Advisory Agreement, the Advisor has the right to seek reimbursement from the Company for all costs and expenses it incurs in connection with the provision of services to the Company, including the Company’s allocable share of the Advisor’s overhead, such as rent, employee costs, utilities, accounting software and cybersecurity costs. Commencing January 1, 2011, the Company has reimbursed the Advisor for the Company’s allocable portion of the salaries, benefits and overhead of internal audit department personnel providing services to the Company. In the future, the Advisor may seek reimbursement for additional employee costs. The Company will not reimburse the Advisor for employee costs in connection with services for which the Advisor earns acquisition, origination or disposition fees (other than reimbursement of travel and communication expenses) or for the salaries and benefits the Advisor or its affiliates may pay to the Company’s executive officers.
Asset Management Fee
With respect to investments in real estate, the Company pays the Advisor a monthly asset management fee equal to one-twelfth of 0.75% of the amount paid or allocated to acquire the investment, plus the cost of any subsequent development, construction or improvements to the property. This amount includes any portion of the investment that was debt financed and is inclusive of acquisition expenses related thereto (but excludes acquisition fees paid or payable to the Advisor). In the case of investments made through joint ventures, the asset management fee will be determined based on the Company’s proportionate share of the underlying investment.
With respect to investments in loans and any investments other than real estate, the Company pays the Advisor a monthly fee calculated, each month, as one-twelfth of 0.75% of the lesser of (i) the amount paid or allocated to acquire or fund the loan or other investment (which amount includes any portion of the investment that was debt financed and is inclusive of acquisition or origination expenses related thereto but is exclusive of acquisition or origination fees paid or payable to the Advisor) and (ii) the outstanding principal amount of such loan or other investment, plus the acquisition or origination expenses related to the acquisition or funding of such investment (but excluding acquisition or origination fees paid or payable to the Advisor), as of the time of calculation.
Pursuant to the Advisory Agreement, with respect to asset management fees accruing from March 1, 2014, the Advisor has agreed to defer, without interest, the Company’s obligation to pay asset management fees for any month in which the Company’s modified funds from operations (“MFFO”) for such month, as such term is defined in the practice guideline issued by the Investment Program Association (“IPA”) in November 2010 and interpreted by the Company, excluding asset management fees, does not exceed the amount of distributions declared by the Company for record dates of that month. The Company remains obligated to pay the Advisor an asset management fee in any month in which the Company’s MFFO, excluding asset management fees, for such month exceeds the amount of distributions declared for the record dates of that month (such excess amount, an “MFFO Surplus”); however, any amount of such asset management fee in excess of the MFFO Surplus will also be deferred under the Advisory Agreement. If the MFFO Surplus for any month exceeds the amount of the asset management fee payable for such month, any remaining MFFO Surplus will be applied to pay any asset management fee amounts previously deferred in accordance with the Advisory Agreement.
However, notwithstanding the foregoing, any and all deferred asset management fees that are unpaid will become immediately due and payable at such time as the Company’s stockholders have received, together as a collective group, aggregate distributions (including distributions that may constitute a return of capital for federal income tax purposes) sufficient to provide (i) an 8.0% per year cumulative, noncompounded return on such net invested capital (the “Stockholders’ 8% Return”) and (ii) a return of their net invested capital, or the amount calculated by multiplying the total number of shares purchased by stockholders by the issue price, reduced by any amounts to repurchase shares pursuant to the Company’s share redemption program. The Stockholders’ 8% Return is not based on the return provided to any individual stockholder. Accordingly, it is not necessary for each of the Company’s stockholders to have received any minimum return in order for the Advisor to receive deferred asset management fees.
F-19
KBS REAL ESTATE INVESTMENT TRUST III, INC.
NOTES TO CONSOLIDATED FINANCIAL STATEMENTS (CONTINUED)
December 31, 2016
Disposition Fee
For substantial assistance in connection with the sale of properties or other investments, the Company pays the Advisor or one of its affiliates 1.0% of the contract sales price of each property or other investment sold; provided, however, that if, in connection with such disposition, commissions are paid to third parties unaffiliated with the Advisor or one of its affiliates, the fee paid to the Advisor or one of its affiliates may not exceed the commissions paid to such unaffiliated third parties, and provided further that the disposition fees paid to the Advisor or one of its affiliates and unaffiliated third parties may not exceed 6.0% of the contract sales price. The Company will not pay a disposition fee upon the maturity, prepayment or workout of a loan or other debt-related investment, provided that if the Company takes ownership of a property as a result of a workout or foreclosure of a loan, the Company will pay a disposition fee upon the sale of such property.
Income Taxes
The Company has elected to be taxed as a REIT under the Internal Revenue Code of 1986, as amended. To continue to qualify as a REIT, the Company must continue to meet certain organizational and operational requirements, including a requirement to distribute at least 90% of the Company’s annual REIT taxable income to stockholders (which is computed without regard to the dividends-paid deduction or net capital gain and which does not necessarily equal net income as calculated in accordance with GAAP). As a REIT, the Company generally will not be subject to federal income tax on income that it distributes as dividends to its stockholders. If the Company fails to qualify as a REIT in any taxable year, it will be subject to federal income tax on its taxable income at regular corporate income tax rates and generally will not be permitted to qualify for treatment as a REIT for federal income tax purposes for the four taxable years following the year during which qualification is lost, unless the Internal Revenue Service grants the Company relief under certain statutory provisions. Such an event could materially and adversely affect the Company’s net income and net cash available for distribution to stockholders. However, the Company believes that it is organized and operates in such a manner as to qualify for treatment as a REIT.
The Company has concluded that there are no significant uncertain tax positions requiring recognition in its financial statements. Neither the Company nor its subsidiaries has been assessed interest or penalties by any major tax jurisdictions. The Company’s evaluations were performed for all open tax years through December 31, 2016. As of December 31, 2016, the returns for calendar years 2012 through 2015 remain subject to examination by major tax jurisdictions.
Per Share Data
Basic net income (loss) per share of common stock is calculated by dividing net income (loss) attributable to common stockholders by the weighted-average number of shares of common stock issued and outstanding during such period. Diluted net income (loss) per share of common stock equals basic net income (loss) per share of common stock as there were no potentially dilutive securities outstanding during the years ended December 31, 2016, 2015 and 2014, respectively.
Distributions declared per common share were $0.650 during the years ended December 31, 2016, 2015 and 2014, respectively. Distributions declared per common share assumes each share was issued and outstanding each day from January 1, 2014 through December 31, 2016. For each day that was a record date for distributions during the period from January 1, 2014 through December 31, 2016, distributions were calculated at a rate of $0.00178082 per share per day. Each day during the periods from January 1, 2014 through February 28, 2016 and March 1, 2016 through December 31, 2016 was a record date for distributions.
Segments
The Company has invested in core real estate properties and real estate-related investments with the goal of acquiring a portfolio of income-producing investments. The Company’s real estate properties exhibit similar long-term financial performance and have similar economic characteristics to each other. As of December 31, 2016, the Company aggregated its investments in real estate properties into one reportable business segment.
Square Footage, Occupancy and Other Measures
Square footage, number of acres, occupancy and other measures, including annualized base rent and annualized base rent per square foot, used to describe real estate investments included in these notes to consolidated financial statements are presented on an unaudited basis.
F-20
KBS REAL ESTATE INVESTMENT TRUST III, INC.
NOTES TO CONSOLIDATED FINANCIAL STATEMENTS (CONTINUED)
December 31, 2016
Recently Issued Accounting Standards Update
In May 2014, the FASB issued ASU No. 2014-09, Revenue from Contracts with Customers (Topic 606) (“ASU No. 2014-09”). ASU No. 2014-09 requires an entity to recognize the revenue to depict the transfer of promised goods or services to customers in an amount that reflects the consideration to which the entity expects to be entitled in exchange for those goods and services. ASU No. 2014-09 supersedes the revenue requirements in Revenue Recognition (Topic 605) and most industry-specific guidance throughout the Industry Topics of the Codification. ASU No. 2014-09 does not apply to lease contracts within the scope of Leases (Topic 840). ASU No. 2014-09 was to be effective for fiscal years, and interim periods within those years, beginning after December 15, 2016, and is to be applied retrospectively, with early application not permitted. In August 2015, the FASB issued ASU No. 2015-14, Revenue from Contracts with Customers (Topic 606): Deferral of the Effective Date (“ASU No. 2015-14”), which defers the effective date of ASU No. 2014-09 by one year. Early adoption is permitted but not before the original effective date. As the primary source of revenue for the Company is generated through leasing arrangements, which are scoped out of this standard, the Company does not expect the adoption of ASU No. 2014-09 to have a significant impact on its financial statements.
In August 2014, the FASB issued ASU No. 2014-15, Presentation of Financial Statements (Subtopic 205-40), Disclosure of Uncertainties about an Entity’s Ability to Continue as a Going Concern (“ASU No. 2014-15”). The amendments in ASU No. 2014-15 require management to evaluate, for each annual and interim reporting period, whether there are conditions or events, considered in the aggregate, that raise substantial doubt about an entity’s ability to continue as a going concern within one year after the date that the financial statements are issued (or are available to be issued when applicable) and, if so, provide related disclosures. ASU No. 2014-15 is effective for annual periods ending after December 15, 2016, and interim periods within annual periods beginning after December 15, 2016. The adoption of ASU No. 2014-15 did not have a significant impact on the Company's financial statements, although it could require additional disclosures in future periods if conditions or events exist that raises substantial doubt about the Company’s ability to continue as a going concern.
In January 2016, the FASB issued ASU No. 2016-01, Financial Instruments - Overall (Subtopic 825-10): Recognition and Measurement of Financial Assets and Financial Liabilities (“ASU No. 2016-01”). The amendments in ASU No. 2016-01 address certain aspects of recognition, measurement, presentation and disclosure of financial instruments. ASU No. 2016-01 primarily affects accounting for equity investments and financial liabilities where the fair value option has been elected. ASU No. 2016-01 also requires entities to present financial assets and financial liabilities separately, grouped by measurement category and form of financial asset in the balance sheet or in the accompanying notes to the financial statements. ASU No. 2016-01 is effective for annual periods beginning after December 15, 2017, including interim periods within those fiscal years. Early application is permitted for financial statements that have not been previously issued. The Company does not expect the adoption of ASU No. 2016-01 to have a significant impact on its financial statements.
In February 2016, the FASB issued ASU No. 2016-02, Leases (Topic 842) (“ASU No. 2016-02”). The amendments in ASU No. 2016-02 change the existing accounting standards for lease accounting, including requiring lessees to recognize most leases on their balance sheets and making targeted changes to lessor accounting. ASU No. 2016-02 is effective for annual periods beginning after December 15, 2018, including interim periods within those fiscal years. Early adoption of ASU No. 2016-02 as of its issuance is permitted. The new leases standard requires a modified retrospective transition approach for all leases existing at, or entered into after, the date of initial application, with an option to use certain transition relief. The Company is currently evaluating the impact of adopting the new leases standard on its consolidated financial statements.
F-21
KBS REAL ESTATE INVESTMENT TRUST III, INC.
NOTES TO CONSOLIDATED FINANCIAL STATEMENTS (CONTINUED)
December 31, 2016
In June 2016, the FASB issued ASU No. 2016-13, Financial Instruments - Credit Losses (Topic 326): Measurement of Credit Losses of Financial Instruments (“ASU No. 2016-13”). ASU No. 2016-13 affects entities holding financial assets and net investments in leases that are not accounted for at fair value through net income. The amendments in ASU No. 2016-13 require a financial asset (or a group of financial assets) measured at amortized cost basis to be presented at the net amount expected to be collected. The allowance for credit losses is a valuation account that is deducted from the amortized cost basis of the financial asset(s) to present the net carrying value at the amount expected to be collected on the financial asset. ASU No. 2016-13 also amends the impairment model for available-for-sale securities. An entity will recognize an allowance for credit losses on available-for-sale debt securities as a contra-account to the amortized cost basis rather than as a direct reduction of the amortized cost basis of the investment, as is currently required. ASU No. 2016-13 also requires new disclosures. For financial assets measured at amortized cost, an entity will be required to disclose information about how it developed its allowance for credit losses, including changes in the factors that influenced management’s estimate of expected credit losses and the reasons for those changes. For financing receivables and net investments in leases measured at amortized cost, an entity will be required to further disaggregate the information it currently discloses about the credit quality of these assets by year of the asset’s origination for as many as five annual periods. For available for sale securities, an entity will be required to provide a roll-forward of the allowance for credit losses and an aging analysis for securities that are past due. ASU No. 2016-13 is effective for annual periods beginning after December 15, 2019, including interim periods within those fiscal years. Early adoption is permitted for fiscal years beginning after December 15, 2018, including interim periods within those fiscal years. The Company is still evaluating the impact of adopting ASU No. 2016-13 on its financial statements, but does not expect the adoption of ASU No. 2016-13 to have a material impact on its financial statements.
In August 2016, the FASB issued ASU No. 2016-15, Statement of Cash Flows (Topic 230): Classification of Certain Cash Receipts and Cash Payments (“ASU No. 2016-15”). ASU No. 2016-15 is intended to reduce diversity in practice in how certain transactions are classified in the statement of cash flows. The amendments in ASU No. 2016-15 provide guidance on eight specific cash flow issues, including the following that are or may be relevant to the Company: (a) Cash payments for debt prepayment or debt extinguishment costs should be classified as cash outflows for financing activities; (b) Cash payments relating to contingent consideration made soon after an acquisition’s consummation date (i.e., approximately three months or less) should be classified as cash outflows for investing activities. Payments made thereafter should be classified as cash outflows for financing activities up to the amount of the original contingent consideration liability. Payments made in excess of the amount of the original contingent consideration liability should be classified as cash outflows for operating activities; (c) Cash payments received from the settlement of insurance claims should be classified on the basis of the nature of the loss (or each component loss, if an entity receives a lump-sum settlement); (d) Relating to distributions received from equity method investments, ASU No. 2016-15 provides an accounting policy election for classifying distributions received from equity method investments. Such amounts can be classified using a (1) cumulative earnings approach, or (2) nature of distribution approach. Under the cumulative earnings approach, an investor would compare the distributions received to its cumulative equity method earnings since inception. Any distributions received up to the amount of cumulative equity earnings would be considered a return on investment and classified in operating activities. Any excess distributions would be considered a return of investment and classified in investing activities. Alternatively, an investor can choose to classify the distributions based on the nature of activities of the investee that generated the distribution. If the necessary information is subsequently not available for an investee to determine the nature of the activities, the entity should use the cumulative earnings approach for that investee and report a change in accounting principle on a retrospective basis; (e) In the absence of specific guidance, an entity should classify each separately identifiable cash source and use on the basis of the nature of the underlying cash flows. For cash flows with aspects of more than one class that cannot be separated, the classification should be based on the activity that is likely to be the predominant source or use of cash flow. ASU No. 2016-15 is effective for fiscal years beginning after December 15, 2017, and interim periods within those fiscal years. Early adoption is permitted, including adoption in an interim period. The Company is still evaluating the impact of adopting ASU No. 2016-15 on its financial statements, but does not expect the adoption of ASU No. 2016-15 to have a material impact on its financial statements.
F-22
KBS REAL ESTATE INVESTMENT TRUST III, INC.
NOTES TO CONSOLIDATED FINANCIAL STATEMENTS (CONTINUED)
December 31, 2016
In November 2016, the FASB issued ASU No. 2016-18, Statement of Cash Flows (Topic 230): Restricted Cash (“ASU No. 2016-18”). ASU No. 2016-18 requires that a statement of cash flows explain the change during the period in the total of cash, cash equivalents, restricted cash and restricted cash equivalents. Therefore, amounts generally described as restricted cash should be included with cash and cash equivalents when reconciling the beginning of period and end of period total amounts shown on the statement of cash flows. ASU No. 2016-18 is effective for annual periods beginning after December 15, 2017, including interim periods within those fiscal years. The Company elected to early adopt ASU No. 2016-18 for the reporting period ended December 31, 2016 and applied it retrospectively. As a result of adoption of the ASU No. 2016-18, the Company no longer presents the changes within restricted cash in the consolidated statements of cash flows.
In January 2017, the FASB issued ASU No. 2017-01, Business Combinations (Topic 805): Clarifying the Definition of a Business (“ASU No. 2017-01”) to add guidance to assist entities with evaluating whether transactions should be accounted for as acquisitions (or disposals) of assets or businesses. ASU No. 2017-01 provides a screen to determine when an integrated set of assets and activities (collectively referred to as a “set”) is not a business. The screen requires that when substantially all of the fair value of the gross assets acquired (or disposed of) is concentrated in a single identifiable asset or a group of similar identifiable assets, the set is not a business. If the screen is not met, ASU No. 2017-01 (1) requires that to be considered a business, a set must include, at a minimum, an input and a substantive process that together significantly contribute to the ability to create output and (2) removes the evaluation of whether a market participant could replace missing elements. ASU No. 2017-01 provides a framework to assist entities in evaluating whether both an input and a substantive process are present. The framework includes two sets of criteria to consider that depend on whether a set has outputs. Although outputs are not required for a set to be a business, outputs generally are a key element of a business; therefore, the FASB has developed more stringent criteria for sets without outputs. ASU No. 2017-01 is effective for annual periods beginning after December 15, 2017, including interim periods within those fiscal years. Early adoption is permitted. The amendments can be applied to transactions occurring before the guidance was issued (January 5, 2017) as long as the applicable financial statements have not been issued. The Company elected to early adopt ASU No. 2017-01 for the reporting period beginning January 1, 2017. As a result of the adoption of ASU No. 2017-01, the Company’s acquisitions of investment properties beginning January 1, 2017 could qualify as an asset acquisition (as opposed to a business combination). Therefore, transaction costs associated with asset acquisitions will be capitalized, while these costs associated with business combinations will continue to be expensed as incurred.
F-23
KBS REAL ESTATE INVESTMENT TRUST III, INC.
NOTES TO CONSOLIDATED FINANCIAL STATEMENTS (CONTINUED)
December 31, 2016
3. | REAL ESTATE |
As of December 31, 2016, the Company’s real estate portfolio was composed of 28 office properties and one mixed-use office/retail property encompassing in the aggregate approximately 11.0 million rentable square feet. In addition, the Company had entered into the Hardware Village Joint Venture to develop and subsequently operate Hardware Village, which is currently under construction. As of December 31, 2016, the Company’s real estate portfolio was collectively 94% occupied. The following table summarizes the Company’s investments in real estate as of December 31, 2016 (in thousands):
Property | Date Acquired | City | State | Property Type | Total Real Estate, at Cost | Accumulated Depreciation and Amortization | Total Real Estate, Net | |||||||||||||
Domain Gateway | 09/29/2011 | Austin | TX | Office | $ | 47,373 | $ | (11,385 | ) | $ | 35,988 | |||||||||
Town Center | 03/27/2012 | Plano | TX | Office | 117,254 | (22,308 | ) | 94,946 | ||||||||||||
McEwen Building | 04/30/2012 | Franklin | TN | Office | 38,534 | (7,641 | ) | 30,893 | ||||||||||||
Gateway Tech Center | 05/09/2012 | Salt Lake City | UT | Office | 24,935 | (5,304 | ) | 19,631 | ||||||||||||
Tower on Lake Carolyn | 12/21/2012 | Irving | TX | Office | 52,222 | (11,111 | ) | 41,111 | ||||||||||||
RBC Plaza | 01/31/2013 | Minneapolis | MN | Office | 150,579 | (24,994 | ) | 125,585 | ||||||||||||
One Washingtonian Center | 06/19/2013 | Gaithersburg | MD | Office | 90,211 | (11,883 | ) | 78,328 | ||||||||||||
Preston Commons | 06/19/2013 | Dallas | TX | Office | 115,767 | (16,497 | ) | 99,270 | ||||||||||||
Sterling Plaza | 06/19/2013 | Dallas | TX | Office | 79,333 | (10,247 | ) | 69,086 | ||||||||||||
201 Spear Street | 12/03/2013 | San Francisco | CA | Office | 135,751 | (12,734 | ) | 123,017 | ||||||||||||
500 West Madison | 12/16/2013 | Chicago | IL | Office | 440,172 | (56,624 | ) | 383,548 | ||||||||||||
222 Main | 02/27/2014 | Salt Lake City | UT | Office | 165,583 | (18,627 | ) | 146,956 | ||||||||||||
Anchor Centre | 05/22/2014 | Phoenix | AZ | Office | 92,721 | (9,735 | ) | 82,986 | ||||||||||||
171 17th Street | 08/25/2014 | Atlanta | GA | Office | 131,223 | (14,781 | ) | 116,442 | ||||||||||||
Rocklin Corporate Center | 11/06/2014 | Rocklin | CA | Office | 33,252 | (3,867 | ) | 29,385 | ||||||||||||
Reston Square | 12/03/2014 | Reston | VA | Office | 46,627 | (4,879 | ) | 41,748 | ||||||||||||
Ten Almaden | 12/05/2014 | San Jose | CA | Office | 121,716 | (10,641 | ) | 111,075 | ||||||||||||
Towers at Emeryville | 12/23/2014 | Emeryville | CA | Office | 261,054 | (22,931 | ) | 238,123 | ||||||||||||
101 South Hanley | 12/24/2014 | St. Louis | MO | Office | 67,526 | (6,015 | ) | 61,511 | ||||||||||||
3003 Washington Boulevard | 12/30/2014 | Arlington | VA | Office | 151,334 | (10,005 | ) | 141,329 | ||||||||||||
Village Center Station | 05/20/2015 | Greenwood Village | CO | Office | 78,039 | (5,882 | ) | 72,157 | ||||||||||||
Park Place Village | 06/18/2015 | Leawood | KS | Office/Retail | 129,509 | (8,660 | ) | 120,849 | ||||||||||||
201 17th Street | 06/23/2015 | Atlanta | GA | Office | 103,416 | (6,466 | ) | 96,950 | ||||||||||||
Promenade I & II at Eilan | 07/14/2015 | San Antonio | TX | Office | 62,471 | (4,281 | ) | 58,190 | ||||||||||||
CrossPoint at Valley Forge | 08/18/2015 | Wayne | PA | Office | 90,041 | (4,809 | ) | 85,232 | ||||||||||||
515 Congress | 08/31/2015 | Austin | TX | Office | 116,357 | (6,946 | ) | 109,411 | ||||||||||||
The Almaden | 09/23/2015 | San Jose | CA | Office | 162,745 | (7,702 | ) | 155,043 | ||||||||||||
3001 Washington Boulevard | 11/06/2015 | Arlington | VA | Office | 54,674 | (1,497 | ) | 53,177 | ||||||||||||
Carillon | 01/15/2016 | Charlotte | NC | Office | 151,377 | (6,342 | ) | 145,035 | ||||||||||||
Hardware Village (1) | 08/26/2016 | Salt Lake City | UT | Development/Apartment | 21,853 | — | 21,853 | |||||||||||||
$ | 3,333,649 | $ | (344,794 | ) | $ | 2,988,855 | ||||||||||||||
(1) On August 26, 2016, the Company, through an indirect wholly-owned subsidiary, entered into the Hardware Village Joint Venture to develop and subsequently operate Hardware Village, located on the developable land at Gateway Tech Center. The Company owns a 99.24% equity interest in the joint venture. See “Construction in Progress” below.
F-24
KBS REAL ESTATE INVESTMENT TRUST III, INC.
NOTES TO CONSOLIDATED FINANCIAL STATEMENTS (CONTINUED)
December 31, 2016
As of December 31, 2016, the following property represented more than 10% of the Company’s total assets:
Property | Location | Rentable Square Feet | Total Real Estate, Net (in thousands) | Percentage of Total Assets | Annualized Base Rent (in thousands) (1) | Average Annualized Base Rent per sq. ft. | Occupancy | ||||||||||||||||
500 West Madison | Chicago, IL | 1,457,724 | $ | 383,548 | 12.1 | % | $ | 35,373 | $ | 25.29 | 95.9 | % | |||||||||||
(1) Annualized base rent represents annualized contractual base rental income as of December 31, 2016, adjusted to straight-line any contractual tenant concessions (including free rent), rent increases and rent decreases from the lease’s inception through the balance of the lease term.
Operating Leases
The Company’s real estate properties are leased to tenants under operating leases for which the terms and expirations vary. As of December 31, 2016, the leases had remaining terms, excluding options to extend, of up to 14.9 years with a weighted-average remaining term of 4.7 years. Some of the leases have provisions to extend the term of the leases, options for early termination for all or a part of the leased premises after paying a specified penalty, rights of first refusal to purchase the property at competitive market rates, and other terms and conditions as negotiated. The Company retains substantially all of the risks and benefits of ownership of the real estate assets leased to tenants. Generally, upon the execution of a lease, the Company requires a security deposit from the tenant in the form of a cash deposit and/or a letter of credit. The amount required as a security deposit varies depending upon the terms of the respective lease and the creditworthiness of the tenant, but generally is not a significant amount. Therefore, exposure to credit risk exists to the extent that a receivable from a tenant exceeds the amount of its security deposit. Security deposits received in cash related to tenant leases are included in other liabilities in the accompanying consolidated balance sheets and totaled $12.7 million and $12.2 million as of December 31, 2016 and 2015, respectively.
During the years ended December 31, 2016, 2015 and 2014, the Company recognized deferred rent from tenants of $17.2 million, $17.9 million and $9.7 million, respectively. As of December 31, 2016 and 2015, the cumulative deferred rent balance was $58.6 million and $38.7 million, respectively, and is included in rents and other receivables on the accompanying balance sheets. The cumulative deferred rent balance included $5.2 million and $3.3 million of unamortized lease incentives as of December 31, 2016 and 2015, respectively.
As of December 31, 2016, the future minimum rental income from the Company’s properties under its non-cancelable operating leases was as follows (in thousands):
2017 | $ | 282,416 | |
2018 | 272,124 | ||
2019 | 243,838 | ||
2020 | 207,806 | ||
2021 | 179,959 | ||
Thereafter | 491,263 | ||
$ | 1,677,406 | ||
As of December 31, 2016, the Company’s real estate properties were leased to approximately 900 tenants over a diverse range of industries and geographic areas. The Company’s highest tenant industry concentration (greater than 10% of annualized base rent) was as follows:
Industry | Number of Tenants | Annualized Base Rent(1) (in thousands) | Percentage of Annualized Base Rent | ||||||
Finance | 170 | $ | 67,084 | 22.5 | % | ||||
(1) Annualized base rent represents annualized contractual base rental income as of December 31, 2016, adjusted to straight-line any contractual tenant concessions (including free rent), rent increases and rent decreases from the lease’s inception through the balance of the lease term.
As of December 31, 2016, no other tenant industries accounted for more than 10% of annualized base rent and no tenant accounted for more than 10% of annualized base rent. No material tenant credit issues have been identified at this time.
F-25
KBS REAL ESTATE INVESTMENT TRUST III, INC.
NOTES TO CONSOLIDATED FINANCIAL STATEMENTS (CONTINUED)
December 31, 2016
Geographic Concentration Risk
As of December 31, 2016, the Company’s net investments in real estate in California, Texas and Illinois represented 21%, 16% and 12% of the Company’s total assets, respectively. As a result, the geographic concentration of the Company’s portfolio makes it particularly susceptible to adverse economic developments in the California, Texas and Illinois real estate markets. Any adverse economic or real estate developments in these markets, such as business layoffs or downsizing, industry slowdowns, relocations of businesses, changing demographics and other factors, or any decrease in demand for office space resulting from the local business climate, could adversely affect the Company’s operating results and its ability to pay distributions to stockholders.
Recent Acquisition
Carillon
On January 15, 2016, the Company, through an indirect wholly owned subsidiary (the “Carillon Buyer”), acquired an office property containing 488,243 rentable square feet located on approximately 1.8 acres of land in Charlotte, North Carolina (“Carillon”). The purchase price (net of closing credits) of Carillon was $146.1 million plus closing costs. The seller was not affiliated with the Company or the Advisor. The Company allocated the purchase price of this property to the fair value of the assets acquired and liabilities assumed. The Company allocated $19.1 million to land, $120.7 million to building and improvements, $10.0 million to tenant origination and absorption costs and $3.7 million to below-market lease liabilities during the year ended December 31, 2016. The intangible assets and liabilities acquired in connection with this acquisition have weighted-average amortization periods as of the date of acquisition of 6.3 years for tenant origination and absorption costs and 7.6 years for below-market lease liabilities.
The Company recorded the acquisition as a business combination and expensed $1.8 million of acquisition costs related to this property for the year ended December 31, 2016. During the year ended December 31, 2016, the Company recognized $14.4 million of total revenues and $6.5 million of operating expenses from this property.
Construction in Progress
Hardware Village Joint Venture Agreement
On May 9, 2012, the Company, through an indirect wholly owned subsidiary, acquired an office building containing 198,565 rentable square feet located on approximately 9.0 acres of land in Salt Lake City, Utah (“Gateway Tech Center”). At acquisition, a portion of the land at Gateway Tech Center was designated as multi-use with the potential for development (the “Excess Land”).
On August 26, 2016, the Company, through an indirect wholly owned subsidiary (the “Managing Member”), and an unaffiliated developer (the “Developer Member”), entered into an agreement (the “Hardware Village Agreement”) to form a joint venture (the “Hardware Village Joint Venture”). The Hardware Village Joint Venture was formed to participate in the development and subsequent operation of a two building multi-family apartment complex consisting of approximately 453 units, or 441,883 rentable square feet, located on the developable land at Gateway Tech Center. The total projected cost of the development is approximately $116.9 million. The Hardware Village Joint Venture intends to fund the project with capital contributions from its members and with proceeds from the Hardware Village Loan Facility. For more information regarding the Hardware Village Loan Facility, please see Note 12 - “Subsequent Events - Financing Subsequent to December 31, 2016 - Hardware Village Loan Facility.”
F-26
KBS REAL ESTATE INVESTMENT TRUST III, INC.
NOTES TO CONSOLIDATED FINANCIAL STATEMENTS (CONTINUED)
December 31, 2016
The Company owns a 99.24% equity interest in the Hardware Village Joint Venture and exercises control. Therefore the Company consolidates the Hardware Village Joint Venture in its financial statements. The Managing Member shall direct, manage and control the day to day business of the Hardware Village Joint Venture but may not enter into any major decisions involving the business of the Hardware Village Joint Venture without the Developer Member’s consent. Income and losses are generally allocated among the members such that each member’s capital account is proportionately equal to the distributions that would be made to each member if the Hardware Village Joint Venture were dissolved pursuant to the provisions of the Hardware Village Agreement. The Company records the portion of the Hardware Village Joint Venture not owned by the Company as noncontrolling interest. The Company funded its initial capital contribution to the Hardware Village Joint Venture by contributing the Excess Land valued, pursuant to the Hardware Village Agreement, at $13.5 million with a historical cost basis of $4.2 million and by contributing pre-closing development expenses in the amount of $4.6 million. Under the Hardware Village Agreement, the Company may be required to contribute up to an additional $20.7 million of cash to the Hardware Village Joint Venture.
The term of the Hardware Village Agreement will continue until December 31, 2066 or until dissolution of the Hardware Village Joint Venture pursuant to the provisions of the Hardware Village Agreement.
4. | TENANT ORIGINATION AND ABSORPTION COSTS, ABOVE-MARKET LEASE ASSETS AND BELOW-MARKET LEASE LIABILITIES |
As of December 31, 2016 and 2015, the Company’s tenant origination and absorption costs, above-market lease assets and below-market lease liabilities (excluding fully amortized assets and liabilities and accumulated amortization) were as follows (in thousands):
Tenant Origination and Absorption Costs | Above-Market Lease Assets | Below-Market Lease Liabilities | ||||||||||||||||||||||
December 31, 2016 | December 31, 2015 | December 31, 2016 | December 31, 2015 | December 31, 2016 | December 31, 2015 | |||||||||||||||||||
Cost | $ | 264,973 | $ | 273,758 | $ | 14,383 | $ | 15,573 | $ | (55,438 | ) | $ | (56,996 | ) | ||||||||||
Accumulated Amortization | (99,757 | ) | (71,836 | ) | (6,192 | ) | (4,596 | ) | 21,783 | 15,296 | ||||||||||||||
Net Amount | $ | 165,216 | $ | 201,922 | $ | 8,191 | $ | 10,977 | $ | (33,655 | ) | $ | (41,700 | ) | ||||||||||
Increases (decreases) in net income as a result of amortization of the Company’s tenant origination and absorption costs, above-market lease assets and below-market lease liabilities for the years ended December 31, 2016, 2015 and 2014 were as follows (in thousands):
Tenant Origination and Absorption Costs | Above-Market Lease Assets | Below-Market Lease Liabilities | ||||||||||||||||||||||||||||||||||
For the Years Ended December 31, | For the Years Ended December 31, | For the Years Ended December 31, | ||||||||||||||||||||||||||||||||||
2016 | 2015 | 2014 | 2016 | 2015 | 2014 | 2016 | 2015 | 2014 | ||||||||||||||||||||||||||||
Amortization | $ | (46,647 | ) | $ | (45,022 | ) | $ | (28,038 | ) | $ | (2,794 | ) | $ | (3,696 | ) | $ | (2,632 | ) | $ | 11,718 | $ | 10,683 | $ | 6,743 | ||||||||||||
F-27
KBS REAL ESTATE INVESTMENT TRUST III, INC.
NOTES TO CONSOLIDATED FINANCIAL STATEMENTS (CONTINUED)
December 31, 2016
The remaining unamortized balance for these outstanding intangible assets and liabilities as of December 31, 2016 is estimated to be amortized for the years ending December 31 as follows (in thousands):
Tenant Origination and Absorption Costs | Above-Market Lease Assets | Below-Market Lease Liabilities | ||||||||||
2017 | $ | (37,490 | ) | $ | (2,285 | ) | $ | 7,820 | ||||
2018 | (30,895 | ) | (1,730 | ) | 6,531 | |||||||
2019 | (25,316 | ) | (1,361 | ) | 5,159 | |||||||
2020 | (19,350 | ) | (834 | ) | 4,209 | |||||||
2021 | (16,007 | ) | (648 | ) | 3,782 | |||||||
Thereafter | (36,158 | ) | (1,333 | ) | 6,154 | |||||||
$ | (165,216 | ) | $ | (8,191 | ) | $ | 33,655 | |||||
Weighted-Average Remaining Amortization Period | 6.3 years | 5.3 years | 5.8 years | |||||||||
5. | REAL ESTATE LOAN RECEIVABLE |
As of December 31, 2016 and 2015, the Company, through an indirect wholly owned subsidiary, had originated one real estate loan receivable, which was repaid during the year ended December 31, 2016. The information for that real estate loan receivable as of December 31, 2016 and 2015 is set forth below (dollars in thousands):
Loan Name Location of Related Property or Collateral | Date Originated | Property Type | Loan Type | Outstanding Principal Balance as of December 31, 2016 | Book Value as of December 31, 2016 (1) | Book Value as of December 31, 2015 (1) | Contractual Interest Rate | Annualized Effective Interest Rate | Maturity Date | |||||||||||
Aberdeen First Mortgage Origination | ||||||||||||||||||||
Dallas, Texas | 06/24/2011 | Office | Mortgage | (2) | (2) | $ | 21,997 | (2) | (2) | (2) | ||||||||||
_____________________
(1) Book value represents outstanding principal balance, adjusted for unamortized origination fees and direct origination and acquisition costs.
(2) At maturity, the borrower under the Aberdeen First Mortgage Origination paid off the entire principal balance outstanding due to the Company. The Aberdeen First Mortgage Origination matured on July 1, 2016 and bore interest at a fixed rate of 7.5%.
The following summarizes the activity related to the real estate loan receivable for the year ended December 31, 2016 (in thousands):
Real estate loan receivable - December 31, 2015 | $ | 21,997 | |
Advances on real estate loan receivable | 544 | ||
Principal repayments received on real estate loan receivable | (22,526 | ) | |
Amortization of closing costs and origination fees on originated real estate loan receivable | (15 | ) | |
Real estate loan receivable - December 31, 2016 | $ | — | |
For the years ended December 31, 2016, 2015 and 2014, interest income from the real estate loan receivable consisted of the following (in thousands):
For the Years Ended December 31, | |||||||||||
2016 | 2015 | 2014 | |||||||||
Contractual interest income | $ | 846 | $ | 1,630 | $ | 1,378 | |||||
Amortization of closing costs and origination fees | (15 | ) | (27 | ) | (26 | ) | |||||
Interest income from real estate loan receivable | $ | 831 | $ | 1,603 | $ | 1,352 | |||||
F-28
KBS REAL ESTATE INVESTMENT TRUST III, INC.
NOTES TO CONSOLIDATED FINANCIAL STATEMENTS (CONTINUED)
December 31, 2016
6. | NOTES PAYABLE |
As of December 31, 2016 and 2015, the Company’s notes payable consisted of the following (dollars in thousands):
Book Value as of December 31, 2016 | Book Value as of December 31, 2015 | Contractual Interest Rate as of December 31, 2016(1) | Effective Interest Rate as of December 31, 2016(1) | Payment Type | Maturity Date(2) | |||||||||||
Town Center Mortgage Loan | $ | 75,000 | $ | 75,000 | One-month LIBOR + 1.85% | 2.87% | Interest Only | 03/27/2018 | ||||||||
Portfolio Loan (4) | 127,500 | 127,500 | One-month LIBOR + 1.90% | 2.52% | Interest Only | 06/01/2019 | ||||||||||
RBC Plaza Mortgage Loan | 75,930 | 75,930 | One-month LIBOR + 1.80% | 2.57% | Interest Only | 02/01/2017 (5) | ||||||||||
National Office Portfolio Mortgage Loan (6) | 170,602 | 169,191 | One-month LIBOR + 1.50% | 2.80% | Interest Only | 07/01/2017 | ||||||||||
500 West Madison Mortgage Loan (7) | 215,000 | 215,000 | One-month LIBOR + 1.65% | 3.16% | Interest Only | 12/16/2018 | ||||||||||
222 Main Mortgage Loan | 101,343 | 102,700 | 3.97% | 3.97% | Principal & Interest (3) | 03/01/2021 | ||||||||||
Anchor Centre Mortgage Loan | 50,000 | 50,000 | One-month LIBOR + 1.50% | 3.18% | Interest Only | 06/01/2017 | ||||||||||
171 17th Street Mortgage Loan | 83,778 | 80,992 | One-month LIBOR + 1.45% | 2.72% | Interest Only (3) | 09/01/2018 | ||||||||||
Reston Square Mortgage Loan | 23,840 | 23,840 | One-month LIBOR + 1.50% | 2.12% | Interest Only | 02/01/2018 | ||||||||||
Ten Almaden Mortgage Loan | 65,853 | 63,540 | One-month LIBOR + 1.65% | 3.41% | Interest Only | 01/01/2018 | ||||||||||
Towers at Emeryville Mortgage Loan (8) | 145,379 | 143,944 | One-month LIBOR + 1.75% | 4.01% | Interest Only | 01/15/2018 | ||||||||||
101 South Hanley Mortgage Loan | 37,502 | 35,025 | One-month LIBOR + 1.55% | 2.17% | Interest Only (3) | 01/01/2020 | ||||||||||
3003 Washington Boulevard Mortgage Loan | 90,378 | 90,378 | One-month LIBOR + 1.55% | 2.16% | Interest Only | 02/01/2020 | ||||||||||
Rocklin Corporate Center Mortgage Loan | 20,868 | 19,889 | One-month LIBOR + 1.50% | 2.11% | Interest Only | 06/05/2018 | ||||||||||
201 17th Street Mortgage Loan | 58,063 | 48,563 | One-month LIBOR + 1.40% | 2.02% | Interest Only | 08/01/2018 | ||||||||||
CrossPoint at Valley Forge Mortgage Loan | 51,000 | 51,000 | One-month LIBOR + 1.50% | 3.33% | Interest Only (3) | 09/01/2022 | ||||||||||
The Almaden Mortgage Loan (9) | 93,000 | 76,100 | 4.20% | 4.20% | Interest Only | 01/01/2022 | ||||||||||
Promenade I & II at Eilan Mortgage Loan | 37,300 | 37,300 | One-month LIBOR + 1.75% | 3.57% | Interest Only | 10/01/2022 | ||||||||||
515 Congress Mortgage Loan | 67,500 | 67,500 | One-month LIBOR + 1.70% | 2.32% | Interest Only | 11/01/2020 | ||||||||||
201 Spear Street Mortgage Loan | 100,000 | 100,000 | One-month LIBOR + 1.66% | 2.28% | Interest Only | 01/01/2019 | ||||||||||
Carillon Mortgage Loan | 76,440 | — | One-month LIBOR + 1.65% | 2.27% | Interest Only | 02/01/2020 | ||||||||||
3001 Washington Boulevard Mortgage Loan | 27,129 | — | One-month LIBOR + 1.60% | 2.22% | Interest Only | 02/01/2019 | ||||||||||
Total notes payable principal outstanding | 1,793,405 | 1,653,392 | ||||||||||||||
Deferred financing costs, net | (9,937 | ) | (12,738 | ) | ||||||||||||
Total Notes Payable, net | $ | 1,783,468 | $ | 1,640,654 | ||||||||||||
(1) Contractual interest rate represents the interest rate in effect under the loan as of December 31, 2016. Effective interest rate is calculated as the actual interest rate in effect as of December 31, 2016 (consisting of the contractual interest rate and the effect of interest rate swaps and caps, if applicable), using interest rate indices as of December 31, 2016, where applicable. For further information regarding the Company’s derivative instruments, see Note 7, “Derivative Instruments.”
(2) Represents the maturity date as of December 31, 2016; subject to certain conditions, the maturity dates of certain loans may be extended beyond the dates shown.
(3) Represents the payment type required under the loan as of December 31, 2016. Certain future monthly payments due under these loans also include amortizing principal payments. For more information of the Company’s contractual obligations under its notes payable, see five-year maturity table below.
F-29
KBS REAL ESTATE INVESTMENT TRUST III, INC.
NOTES TO CONSOLIDATED FINANCIAL STATEMENTS (CONTINUED)
December 31, 2016
(4)As of December 31, 2016, the Portfolio Loan was secured by Domain Gateway, the McEwen Building, Gateway Tech Center, the Tower on Lake Carolyn, Park Place Village and Village Center Station. The face amount of the Portfolio Loan is $255.0 million, of which $127.5 million is term debt and $127.5 million is revolving debt. As of December 31, 2016, the outstanding balance under the loan was $127.5 million of term debt. As of December 31, 2016, an additional $126.5 million of revolving debt remained available for immediate future disbursements, subject to certain conditions set forth in the loan agreement. The remaining $1.0 million of revolving debt is available for future disbursements upon the Company meeting certain financial coverage ratios and subject to certain conditions set forth in the loan agreement. During the remaining term of the Portfolio Loan, the Company has an option, which may be exercised up to two times, to increase the loan amount to a maximum of $350.0 million, of which 50% would be term debt and 50% would be revolving debt, with the addition of one or more properties to secure the Portfolio Loan, subject to certain conditions contained in the loan documents.
(5) Subsequent to December 31, 2016, the maturity date of the RBC Plaza Mortgage Loan was extended to February 1, 2018.
(6) The National Office Portfolio Mortgage Loan is secured by One Washingtonian Center, Preston Commons and Sterling Plaza.
(7) As of December 31, 2016, $215.0 million of term debt was outstanding and $40.0 million remained available for future disbursements, subject to certain terms and conditions contained in the loan documents.
(8) As of December 31, 2016, $145.4 million had been disbursed to the Company and $29.6 million remained available for future disbursements, subject to certain conditions set forth in the loan documents.
(9) On December 29, 2016, the Company refinanced The Almaden Mortgage Loan with an unaffiliated lender for borrowings of $93.0 million.
As of December 31, 2016, the Company’s deferred financing costs were $10.0 million, net of amortization, of which $9.9 million was included in notes payable, net, and $0.1 million was included in prepaid expenses and other assets on the accompanying consolidated balance sheets. As of December 31, 2015, the Company’s deferred financing costs were $12.8 million, net of amortization, of which $12.7 million was included in notes payable, net, and $0.1 million was included in prepaid expenses and other assets on the accompanying consolidated balance sheets.
During the years ended December 31, 2016, 2015 and 2014, the Company incurred $51.6 million, $45.4 million and $27.0 million of interest expense, respectively. As of December 31, 2016 and 2015, $4.3 million and $3.4 million of interest expense were payable, respectively. Included in interest expense for the years ended December 31, 2016, 2015 and 2014, were $5.1 million, $3.6 million and $1.9 million of amortization of deferred financing costs, respectively. Additionally, during the year ended December 31, 2016, the Company capitalized $0.2 million of interest to construction in progress. Interest expense incurred as a result of the Company’s derivative instruments for the years ended December 31, 2016, 2015 and 2014 were $6.4 million, $13.4 million and $7.2 million, respectively.
The following is a schedule of maturities, including principal amortization payments, for all notes payable outstanding as of December 31, 2016 (in thousands):
2017 | $ | 298,405 | ||
2018 | 690,210 | |||
2019 | 257,210 | |||
2020 | 273,035 | |||
2021 | 93,956 | |||
Thereafter | 180,589 | |||
$ | 1,793,405 | |||
The Company’s notes payable contain financial debt covenants. As of December 31, 2016, the Company was in compliance with these debt covenants.
7. | DERIVATIVE INSTRUMENTS |
The Company enters into derivative instruments for risk management purposes to hedge its exposure to cash flow variability caused by changing interest rates. The primary goal of the Company’s risk management practices related to interest rate risk is to prevent changes in interest rates from adversely impacting the Company’s ability to achieve its investment return objectives. The Company does not enter into derivatives for speculative purposes.
F-30
KBS REAL ESTATE INVESTMENT TRUST III, INC.
NOTES TO CONSOLIDATED FINANCIAL STATEMENTS (CONTINUED)
December 31, 2016
The Company enters into interest rate swaps as a fixed rate payer to mitigate its exposure to rising interest rates on its variable rate notes payable. The value of interest rate swaps is primarily impacted by interest rates, market expectations about interest rates, and the remaining life of the instrument. In general, increases in interest rates, or anticipated increases in interest rates, will increase the value of the fixed rate payer position and decrease the value of the variable rate payer position. As the remaining life of the interest rate swap decreases, the value of both positions will generally move towards zero.
The Company enters into interest rate caps to mitigate its exposure to rising interest rates on its variable rate notes payable. The values of interest rate caps are primarily impacted by interest rates, market expectations about interest rates, and the remaining life of the instrument. In general, increases in interest rates, or anticipated increases in interest rates, will increase the value of interest rate caps. As the remaining life of an interest rate cap decreases, the value of the instrument will generally decrease towards zero.
The following table summarizes the notional amount and other information related to the Company’s interest rate swaps and cap as of December 31, 2016 and 2015. The notional amount is an indication of the extent of the Company’s involvement in each instrument at that time, but does not represent exposure to credit, interest rate or market risks (dollars in thousands):
December 31, 2016 | December 31, 2015 | Weighted-Average Fix Pay Rate | Weighted-Average Remaining Term in Years | |||||||||||||||
Derivative Instruments | Number of Instruments | Notional Amount | Number of Instruments | Notional Amount | Reference Rate as of December 31, 2016 | |||||||||||||
Derivative instruments designated as hedging instruments | ||||||||||||||||||
Interest Rate Swaps | 7 | $ | 625,130 | 7 | $ | 625,130 | One-month LIBOR/ Fixed at 0.79% - 1.68% | 1.35% | 1.5 | |||||||||
Derivative instruments not designated as hedging instruments | ||||||||||||||||||
Interest Rate Swaps (1) | 12 | $ | 658,183 | 10 | $ | 557,743 | One-month LIBOR/ Fixed at 1.39% - 2.37% | 1.99% | 3.5 | |||||||||
Interest Rate Cap | 1 | $ | 147,340 | 1 | $ | 353,380 | One-month LIBOR at 2.46% | 2.46% | — | |||||||||
_____________________
(1) Included in these amounts are eight forward interest rate swaps with an aggregate notional amount of $363.8 million that were not yet in effect as of December 31, 2016. These eight interest rate swaps will become effective at various times during 2017 through 2018.
The following table sets forth the fair value of the Company’s derivative instruments as well as their classification on the consolidated balance sheets as of December 31, 2016 and 2015 (dollars in thousands):
December 31, 2016 | December 31, 2015 | |||||||||||||
Derivative Instruments | Balance Sheet Location | Number of Instruments | Fair Value | Number of Instruments | Fair Value | |||||||||
Derivative instruments designated as hedging instruments | ||||||||||||||
Interest Rate Swaps | Prepaid expenses and other assets, at fair value | 1 | $ | 42 | 1 | $ | 75 | |||||||
Interest Rate Swaps | Other liabilities, at fair value | 6 | $ | (2,340 | ) | 6 | $ | (4,304 | ) | |||||
Derivative instruments not designated as hedging instruments | ||||||||||||||
Interest Rate Swaps | Prepaid expenses and other assets, at fair value | 4 | $ | 1,588 | — | $ | — | |||||||
Interest Rate Swaps | Other liabilities, at fair value | 8 | $ | (7,388 | ) | 10 | $ | (7,400 | ) | |||||
Interest Rate Cap | Prepaid expenses and other assets, at fair value | 1 | $ | — | 1 | $ | 3 | |||||||
F-31
KBS REAL ESTATE INVESTMENT TRUST III, INC.
NOTES TO CONSOLIDATED FINANCIAL STATEMENTS (CONTINUED)
December 31, 2016
The change in fair value of the effective portion of a derivative instrument that is designated as a cash flow hedge is recorded as other comprehensive income (loss) on the accompanying consolidated statements of comprehensive income (loss) and as other comprehensive income on the accompanying consolidated statements of equity. Amounts in other comprehensive income (loss) will be reclassified into earnings in the periods in which earnings are affected by the hedged cash flows. The change in fair value of the ineffective portion is recognized directly in earnings. With respect to swap agreements that are terminated for which it remains probable that the original hedged forecasted transactions (i.e., LIBOR-based debt service payments) will occur, the loss related to the termination of these swap agreements is included in accumulated other comprehensive income (loss) and is reclassified into earnings over the period of the original forecasted hedged transaction. The change in fair value of a derivative instrument that is not designated as a cash flow hedge is recorded as interest expense in the accompanying consolidated statements of operations. The following table summarizes the effects of derivative instruments on the Company’s consolidated statements of operations (in thousands):
For the Years Ended December 31, | ||||||||||||
2016 | 2015 | 2014 | ||||||||||
Income statement related | ||||||||||||
Derivatives designated as hedging instruments | ||||||||||||
Amount of expense recognized on interest rate swaps (effective portion) | $ | 5,513 | $ | 7,034 | $ | 5,716 | ||||||
5,513 | 7,034 | 5,716 | ||||||||||
Derivatives not designated as hedging instruments | ||||||||||||
Realized loss recognized on interest rate swaps | 2,513 | 280 | — | |||||||||
Unrealized (gain) loss on interest rate swaps | (1,600 | ) | 5,906 | 1,494 | ||||||||
Unrealized loss on interest rate cap | 3 | 172 | — | |||||||||
916 | 6,358 | 1,494 | ||||||||||
Increase in interest expense as a result of derivatives | $ | 6,429 | $ | 13,392 | $ | 7,210 | ||||||
Other comprehensive income related | ||||||||||||
Unrealized losses on derivative instruments | $ | (3,582 | ) | $ | (9,073 | ) | $ | (10,085 | ) | |||
During the years ended December 31, 2016, 2015 and 2014, there was no ineffective portion related to the change in fair value of the derivative instruments designated as cash flow hedges. During the next 12 months, the Company expects to recognize additional interest expense related to derivative instruments designated as cash flow hedges. The present value of the additional interest expense expected to be recognized over the next 12 months related to derivative instruments designated as cash flow hedges totaled $2.4 million as of December 31, 2016 and was included in accumulated other comprehensive income (loss).
F-32
KBS REAL ESTATE INVESTMENT TRUST III, INC.
NOTES TO CONSOLIDATED FINANCIAL STATEMENTS (CONTINUED)
December 31, 2016
8. | FAIR VALUE DISCLOSURES |
Under GAAP, the Company is required to measure certain financial instruments at fair value on a recurring basis. In addition, the Company is required to measure other non-financial and financial assets at fair value on a non-recurring basis (e.g., carrying value of impaired real estate loans receivable and long-lived assets). Fair value is defined as the price that would be received upon the sale of an asset or paid to transfer a liability in an orderly transaction between market participants at the measurement date. The GAAP fair value framework uses a three-tiered approach. Fair value measurements are classified and disclosed in one of the following three categories:
• | Level 1: unadjusted quoted prices in active markets that are accessible at the measurement date for identical assets or liabilities; |
• | Level 2: quoted prices for similar instruments in active markets, quoted prices for identical or similar instruments in markets that are not active, and model-derived valuations in which significant inputs and significant value drivers are observable in active markets; and |
• | Level 3: prices or valuation techniques where little or no market data is available that requires inputs that are both significant to the fair value measurement and unobservable. |
The fair value for certain financial instruments is derived using a combination of market quotes, pricing models and other valuation techniques that involve significant management judgment. The price transparency of financial instruments is a key determinant of the degree of judgment involved in determining the fair value of the Company’s financial instruments. Financial instruments for which actively quoted prices or pricing parameters are available and for which markets contain orderly transactions will generally have a higher degree of price transparency than financial instruments for which markets are inactive or consist of non-orderly trades. The Company evaluates several factors when determining if a market is inactive or when market transactions are not orderly. The following is a summary of the methods and assumptions used by management in estimating the fair value of each class of assets and liabilities for which it is practicable to estimate the fair value:
Cash and cash equivalents, rent and other receivables, and accounts payable and accrued liabilities: These balances approximate their fair values due to the short maturities of these items.
Real estate loan receivable: The Company’s real estate loan receivable is presented in the accompanying consolidated balance sheets at its amortized cost net of recorded loan loss reserves and not at fair value. The fair value of the real estate loan receivable was estimated using an internal valuation model that considered the expected cash flows for the loan, underlying collateral value and estimated yield requirements of institutional investors for loans with similar characteristics, including remaining loan term, loan-to-value, type of collateral and other credit enhancements. The Company classifies these inputs as Level 3 inputs.
Derivative instruments: The Company’s derivative instruments are presented at fair value on the accompanying consolidated balance sheets. The valuation of these instruments is determined using a proprietary model that utilizes observable inputs. As such, the Company classifies these inputs as Level 2 inputs. The proprietary model uses the contractual terms of the derivatives, including the period to maturity, as well as observable market-based inputs, including interest rate curves and volatility. The fair values of interest rate swaps are estimated using the market standard methodology of netting the discounted fixed cash payments and the discounted expected variable cash receipts. The variable cash receipts are based on an expectation of interest rates (forward curves) derived from observable market interest rate curves. In addition, credit valuation adjustments, which consider the impact of any credit risks to the contracts, are incorporated in the fair values to account for potential nonperformance risk. The fair value of interest rate caps (floors) are determined using the market standard methodology of discounting the future expected cash payments (receipts) which would occur if variable interest rates rise above (below) the strike rate of the caps (floors). The variable interest rates used in the calculation of projected payments (receipts) on the cap (floors) are based on an expectation of future interest rates derived from observed market interest rate curves and volatilities.
F-33
KBS REAL ESTATE INVESTMENT TRUST III, INC.
NOTES TO CONSOLIDATED FINANCIAL STATEMENTS (CONTINUED)
December 31, 2016
Notes payable: The fair values of the Company’s notes payable are estimated using a discounted cash flow analysis based on management’s estimates of current market interest rates for instruments with similar characteristics, including remaining loan term, loan-to-value ratio, type of collateral and other credit enhancements. Additionally, when determining the fair value of a liability in circumstances in which a quoted price in an active market for an identical liability is not available, the Company measures fair value using (i) a valuation technique that uses the quoted price of the identical liability when traded as an asset or quoted prices for similar liabilities when traded as assets or (ii) another valuation technique that is consistent with the principles of fair value measurement, such as the income approach or the market approach. The Company classifies these inputs as Level 3 inputs.
The following were the face values, carrying amounts and fair values of the Company’s real estate loan receivable and notes payable as of December 31, 2016 and 2015, which carrying amounts generally do not approximate the fair values (in thousands):
December 31, 2016 | December 31, 2015 | |||||||||||||||||||||||
Face Value | Carrying Amount | Fair Value | Face Value | Carrying Amount | Fair Value | |||||||||||||||||||
Financial assets: | ||||||||||||||||||||||||
Real estate loan receivable (1) | $ | — | $ | — | $ | — | $ | 21,982 | $ | 21,997 | $ | 21,884 | ||||||||||||
Financial liabilities: | ||||||||||||||||||||||||
Notes payable | $ | 1,793,405 | $ | 1,783,468 | $ | 1,775,953 | $ | 1,653,392 | $ | 1,640,654 | $ | 1,654,788 | ||||||||||||
(1) At maturity, the borrower under the Aberdeen First Mortgage Origination paid off the entire principal balance outstanding due to the Company. For further information regarding the Company's loan receivable, see Note 5, “Real Estate Loan Receivable.”
Disclosure of the fair values of financial instruments is based on pertinent information available to the Company as of the period end and requires a significant amount of judgment. Low levels of transaction volume for certain financial instruments have made the estimation of fair values difficult and, therefore, both the actual results and the Company’s estimate of value at a future date could be materially different.
As of December 31, 2016, the Company measured the following assets and liabilities at fair value (in thousands):
Fair Value Measurements Using | ||||||||||||||||
Total | Quoted Prices in Active Markets for Identical Assets (Level 1) | Significant Other Observable Inputs (Level 2) | Significant Unobservable Inputs (Level 3) | |||||||||||||
Recurring Basis: | ||||||||||||||||
Asset derivatives - interest rate swap | $ | 1,630 | $ | — | $ | 1,630 | $ | — | ||||||||
Liability derivatives - interest rate swaps | (9,728 | ) | — | (9,728 | ) | — | ||||||||||
F-34
KBS REAL ESTATE INVESTMENT TRUST III, INC.
NOTES TO CONSOLIDATED FINANCIAL STATEMENTS (CONTINUED)
December 31, 2016
9. | RELATED PARTY TRANSACTIONS |
The Company has entered into the Advisory Agreement with the Advisor and the Dealer Manager Agreement with the Dealer Manager. These agreements entitled the Advisor and/or the Dealer Manager to specified fees upon the provision of certain services with regard to the Offering and reimbursement of organization and offering costs incurred by the Advisor and the Dealer Manager on behalf of the Company and entitle the Advisor to specified fees upon the provision of certain services with regard to the investment of funds in real estate investments, the management of those investments, among other services, and the disposition of investments, as well as entitle the Advisor and/or the Dealer Manager to reimbursement of organization and offering costs incurred by the Advisor and the Dealer Manager on behalf of the Company, such as expenses related to the dividend reinvestment plan, and certain costs incurred by the Advisor in providing services to the Company. In addition, the Advisor is entitled to certain other fees, including an incentive fee upon achieving certain performance goals, as detailed in the Advisory Agreement. The Company has also entered into the AIP Reimbursement Agreement with the Dealer Manager pursuant to which the Company agreed to reimburse the Dealer Manager for certain fees and expenses it incurs for administering the Company’s participation in the DTCC Alternative Investment Product Platform with respect to certain accounts of the Company’s investors serviced through the platform. The Advisor and Dealer Manager also serve as the advisor and dealer manager, respectively, for KBS Real Estate Investment Trust, Inc., KBS Real Estate Investment Trust II, Inc., KBS Strategic Opportunity REIT, Inc., KBS Legacy Partners Apartment REIT, Inc., KBS Strategic Opportunity REIT II, Inc. and KBS Growth & Income REIT, Inc.
On January 6, 2014, the Company, together with KBS Real Estate Investment Trust, Inc., KBS Real Estate Investment Trust II, Inc., KBS Strategic Opportunity REIT, Inc., KBS Legacy Partners Apartment REIT, Inc., KBS Strategic Opportunity REIT II, Inc., the Dealer Manager, the Advisor and other KBS-affiliated entities, entered into an errors and omissions and directors and officers liability insurance program where the lower tiers of such insurance coverage are shared. The cost of these lower tiers is allocated by the Advisor and its insurance broker among each of the various entities covered by the program, and is billed directly to each entity. The allocation of these shared coverage costs is proportionate to the pricing by the insurance marketplace for the first tiers of directors and officers liability coverage purchased individually by each REIT. The Advisor’s and the Dealer Manager’s portion of the shared lower tiers’ cost is proportionate to the respective entities’ prior cost for the errors and omissions insurance. In June 2015, KBS Growth & Income REIT, Inc. was added to the insurance program at terms similar to those described above. The Company has renewed its participation in the program, and the program is effective through June 30, 2017.
During the years ended December 31, 2016, 2015 and 2014, no other business transactions occurred between the Company and KBS Real Estate Investment Trust, Inc., KBS Real Estate Investment Trust II, Inc., KBS Strategic Opportunity REIT, Inc., KBS Legacy Partners Apartment REIT, Inc., KBS Strategic Opportunity REIT II, Inc. and KBS Growth & Income REIT, Inc.
F-35
KBS REAL ESTATE INVESTMENT TRUST III, INC.
NOTES TO CONSOLIDATED FINANCIAL STATEMENTS (CONTINUED)
December 31, 2016
Pursuant to the terms of these agreements, summarized below are the related-party costs incurred by the Company for the years ended December 31, 2016, 2015 and 2014, respectively, and any related amounts payable as of December 31, 2016 and 2015 (in thousands):
Incurred Years Ended December 31, | Payable as of December 31, | |||||||||||||||||||
2016 | 2015 | 2014 | 2016 | 2015 | ||||||||||||||||
Expensed | ||||||||||||||||||||
Asset management fees (1) | $ | 24,940 | $ | 20,051 | $ | 11,476 | $ | 2,126 | $ | 10,075 | ||||||||||
Reimbursement of operating expenses (2) | 423 | 204 | 196 | 139 | 144 | |||||||||||||||
Real estate acquisition fees | 1,473 | 7,697 | 10,441 | — | — | |||||||||||||||
Additional Paid-in Capital | ||||||||||||||||||||
Selling commissions | — | 33,200 | 34,264 | — | — | |||||||||||||||
Dealer manager fees | — | 15,747 | 16,544 | — | — | |||||||||||||||
Reimbursable other offering costs (3) | — | 2,471 | 3,594 | — | — | |||||||||||||||
Capitalized | ||||||||||||||||||||
Acquisition fee on development project | 121 | — | — | 121 | — | |||||||||||||||
Asset management fees on development project | 38 | — | — | 11 | — | |||||||||||||||
$ | 26,995 | $ | 79,370 | $ | 76,515 | $ | 2,397 | $ | 10,219 | |||||||||||
_____________________
(1) See “Deferral of Asset Management Fees” below.
(2) Reimbursable operating expenses primarily consists of internal audit personnel costs, accounting software and cybersecurity related expenses incurred by the Advisor under the Advisory Agreement. The Company has reimbursed the Advisor for the Company’s allocable portion of the salaries, benefits and overhead of internal audit department personnel providing services to the Company. These amounts totaled $217,000, $167,000 and $137,000 for the years ended December 31, 2016, 2015 and 2014, respectively, and were the only type of employee costs reimbursed under the Advisory Agreement for the years ended December 31, 2016, 2015 and 2014. The Company will not reimburse for employee costs in connection with services for which the Advisor earns acquisition or origination fees or disposition fees (other than reimbursement of travel and communication expenses) or for the salaries or benefits the Advisor or its affiliates may pay to the Company’s executive officers. In addition to the amounts above, the Company reimburses the Advisor for certain of the Company's direct costs incurred from third parties that were initially paid by the Advisor on behalf of the Company.
(3) Also see “Other Offering Costs” below.
For the year ended December 31, 2016, the Advisor reimbursed the Company $0.2 million for a property insurance rebate and the Advisor and/or the Dealer Manager reimbursed the Company $0.1 million for legal and professional fees and travel expenses.
In connection with the Offering, the Company’s sponsors agreed to provide additional indemnification to one of the participating broker-dealers. The Company agreed to add supplemental coverage to its directors’ and officers’ insurance coverage to insure the sponsors’ obligations under this indemnification agreement in exchange for reimbursement by the sponsors to the Company for all costs, expenses and premiums related to this supplemental coverage. During the years ended December 31, 2016, 2015 and 2014, the Advisor incurred $0.1 million, $0.1 million and $0.1 million for the costs of the supplemental coverage obtained by the Company, respectively.
Other Offering Costs
Pursuant to the Advisory Agreement, the Advisor was obligated to reimburse the Company to the extent organization and offering costs incurred by the Company in each of the Offering and the Follow-on Offering exceeded 15% of the gross offering proceeds of the respective offering. The Company ceased offering shares of common stock in the primary Offering on May 29, 2015 and terminated the primary Offering on July 28, 2015. As of December 31, 2016, organization and offering costs in the Offering did not exceed 15% of the gross offering proceeds. From inception through August 2015, the Company had recorded $1.2 million of offering costs related to the Follow-on Offering.
F-36
KBS REAL ESTATE INVESTMENT TRUST III, INC.
NOTES TO CONSOLIDATED FINANCIAL STATEMENTS (CONTINUED)
December 31, 2016
On August 24, 2015, the Company withdrew the registration statement for the Follow-on Offering. As such, during the year ended December 31, 2015, the Advisor reimbursed the Company for the $1.2 million of offering costs related to the Follow-on Offering previously incurred by the Company. Such costs were previously included in prepaid expenses and other assets as of December 31, 2014. During the three months ended March 31, 2015, such costs were reclassified to due from affiliate for all periods presented due to management’s expectations that significant proceeds would not be raised in the Follow-on Offering and that such costs would be reimbursed from the Advisor.
Deferral of Asset Management Fees
Pursuant to the Advisory Agreement, with respect to asset management fees accruing from March 1, 2014, the Advisor has agreed to defer, without interest, the Company’s obligation to pay asset management fees for any month in which the Company’s modified funds from operations (“MFFO”) for such month, as such term is defined in the practice guideline issued by the Investment Program Association (“IPA”) in November 2010 and interpreted by the Company, excluding asset management fees, does not exceed the amount of distributions declared by the Company for record dates of that month. The Company remains obligated to pay the Advisor an asset management fee in any month in which the Company’s MFFO, excluding asset management fees, for such month exceeds the amount of distributions declared for the record dates of that month (such excess amount, an “MFFO Surplus”); however, any amount of such asset management fee in excess of the MFFO Surplus will also be deferred under the Advisory Agreement. If the MFFO Surplus for any month exceeds the amount of the asset management fee payable for such month, any remaining MFFO Surplus will be applied to pay any asset management fee amounts previously deferred in accordance with the Advisory Agreement.
However, notwithstanding the foregoing, any and all deferred asset management fees that are unpaid will become immediately due and payable at such time as the Company’s stockholders have received, together as a collective group, aggregate distributions (including distributions that may constitute a return of capital for federal income tax purposes) sufficient to provide (i) an 8.0% per year cumulative, noncompounded return on such net invested capital (the “Stockholders’ 8% Return”) and (ii) a return of their net invested capital, or the amount calculated by multiplying the total number of shares purchased by stockholders by the issue price, reduced by any amounts to repurchase shares pursuant to the Company’s share redemption program. The Stockholders’ 8% Return is not based on the return provided to any individual stockholder. Accordingly, it is not necessary for each of the Company’s stockholders to have received any minimum return in order for the Advisor to receive deferred asset management fees.
As of December 31, 2015, the Company had accrued and deferred payment of $10.1 million of asset management fees under the Advisory Agreement, as the Company believed the payment of this amount to the Advisor was probable. As of December 31, 2016, the Company had reimbursed the Advisor for all accrued and deferred asset management fees in accordance with the terms noted above. As of December 31, 2016, the Company had $2.1 million of asset management fees payable related to asset management fees incurred for the month of December 2016, which were subsequently paid in January 2017.
Lease to Affiliate
On May 29, 2015, the indirect wholly owned subsidiary of the Company that owns 3003 Washington Boulevard entered into a lease with an affiliate of the Advisor for 5,046 rentable square feet, or approximately 2.3% of the total rentable square feet, at 3003 Washington Boulevard. The lease commenced on October 1, 2015 and terminates on August 31, 2019. The annualized base rent, which represents annualized contractual base rental income as of December 31, 2016, adjusted to straight-line any contractual tenant concessions (including free rent) and rent increases from the lease’s inception through the balance of the lease term, for this lease is approximately $234,000, and the average annual rental rate (net of rental abatements) over the lease term is $46.38 per square foot. During the years ended December 31, 2016 and 2015, the Company recognized $0.2 million and $0.1 million of rental income related to this lease, respectively.
Prior to their approval of the lease, the Company’s conflicts committee and board of directors determined the lease to be fair and reasonable to the Company.
F-37
KBS REAL ESTATE INVESTMENT TRUST III, INC.
NOTES TO CONSOLIDATED FINANCIAL STATEMENTS (CONTINUED)
December 31, 2016
10. | SELECTED QUARTERLY FINANCIAL DATA (UNAUDITED) |
Presented below is a summary of the unaudited quarterly financial information for the years ended December 31, 2016 and 2015 (in thousands, except per share amounts):
2016 | ||||||||||||||||
First Quarter | Second Quarter | Third Quarter | Fourth Quarter | |||||||||||||
Revenues | $ | 97,903 | $ | 100,255 | $ | 101,810 | $ | 100,439 | ||||||||
Net (loss) income attributable to common stockholders | $ | (13,580 | ) | $ | (5,151 | ) | $ | 3,859 | $ | 15,635 | ||||||
Net (loss) income per common share attributable to common stockholders, basic and diluted | $ | (0.08 | ) | $ | (0.03 | ) | $ | 0.02 | $ | 0.09 | ||||||
Distributions declared per common share (1) | $ | 0.160 | $ | 0.162 | $ | 0.164 | $ | 0.164 | ||||||||
2015 | ||||||||||||||||
First Quarter | Second Quarter | Third Quarter | Fourth Quarter | |||||||||||||
Revenues | $ | 68,250 | $ | 72,167 | $ | 83,829 | $ | 91,463 | ||||||||
Net loss attributable to common stockholders | $ | (5,574 | ) | $ | (5,943 | ) | $ | (16,838 | ) | $ | (660 | ) | ||||
Net loss per common share attributable to common stockholders, basic and diluted | $ | (0.04 | ) | $ | (0.04 | ) | $ | (0.10 | ) | $ | — | |||||
Distributions declared per common share (1) | $ | 0.160 | $ | 0.162 | $ | 0.164 | $ | 0.164 | ||||||||
__________________
(1) Distributions declared per common share assumes each share was issued and outstanding each day during the respective periods from January 1, 2015 through December 31, 2016. Each day during the periods from January 1, 2015 through February 28, 2016 and March 1, 2016 through December 31, 2016 was a record date for distributions. Distributions were calculated at the rate of $0.00178082 per share per day.
11. | COMMITMENTS AND CONTINGENCIES |
Economic Dependency
The Company is dependent on the Advisor for certain services that are essential to the Company, including the identification, evaluation, negotiation, origination, acquisition and disposition of investments; management of the daily operations of the Company’s investment portfolio; and other general and administrative responsibilities. In the event that the Advisor is unable to provide the respective services, the Company will be required to obtain such services from other sources.
Legal Matters
From time to time, the Company may be party to legal proceedings that arise in the ordinary course of its business. Management is not aware of any legal proceedings of which the outcome is probable or reasonably possible to have a material adverse effect on the Company’s results of operations or financial condition, which would require accrual or disclosure of the contingency and possible range of loss. Additionally, the Company has not recorded any loss contingencies related to legal proceedings in which the potential loss is deemed to be remote.
Environmental
As an owner of real estate, the Company is subject to various environmental laws of federal, state and local governments. Compliance with existing environmental laws is not expected to have a material adverse effect on the Company’s financial condition and results of operations as of December 31, 2016.
F-38
KBS REAL ESTATE INVESTMENT TRUST III, INC.
NOTES TO CONSOLIDATED FINANCIAL STATEMENTS (CONTINUED)
December 31, 2016
12. | SUBSEQUENT EVENTS |
The Company evaluates subsequent events up until the date the consolidated financial statements are issued.
Distributions Paid
On January 3, 2017, the Company paid distributions of $10.0 million, which related to distributions declared for daily record dates for each day in the period from December 1, 2016 through December 31, 2016. On February 1, 2017, the Company paid distributions of $10.0 million, which related to distributions declared for daily record dates for each day in the period from January 1, 2017 through January 31, 2017. On March 1, 2017, the Company paid distributions of $9.0 million, which related to distributions declared for daily record dates for each day in the period from February 1, 2017 through February 28, 2017.
Distributions Declared
On January 27, 2017, the Company’s board of directors declared distributions based on daily record dates for the period from March 1, 2017 through March 31, 2017, which the Company expects to pay in April 2017. On March 10, 2017, the Company’s board of directors declared distributions based on daily record dates for the period from April 1, 2017 through April 30, 2017, which the Company expects to pay in May 2017, and distributions based on daily record dates for the period from May 1, 2017 through May 31, 2017, which the Company expects to pay in June 2017. Investors may choose to receive cash distributions or purchase additional shares through the Company’s dividend reinvestment plan.
Distributions for these periods will be calculated based on stockholders of record each day during these periods at a rate of $0.00178082 per share per day and equal a daily amount that, if paid each day for a 365-day period, would equal a 6.11% annualized rate based on the Company’s December 9, 2016 estimated value per share of $10.63.
Financing Subsequent to December 31, 2016
Hardware Village Loan Facility
On February 23, 2017, the Company, through the Hardware Village Joint Venture, entered into a construction loan facility with an unaffiliated lender for borrowings of up to $74.0 million secured by Hardware Village (the “Hardware Village Loan Facility”). The Hardware Village Loan Facility matures on February 23, 2020 with two one-year extension options subject to certain terms described in the loan documents, and bears interest at a floating rate of 325 basis points over either one, two, three or six-month LIBOR at the election of the Hardware Village Joint Venture. Monthly payments are interest-only during the initial term and first extension of the loan. During the second extension term, the Company would be required to make principal payments in an amount equal to an amount that would amortize the outstanding principal balance of the loan in 30 years at a rate of interest equal to the greater of (i) a fixed rate of 6% per annum or (ii) the rate of interest on a ten-year United States Treasury Note in the amount of the loan plus 2.25%. The Hardware Village Joint Venture has the right to repay the loan in part and in whole subject to certain fees, expenses and conditions, all as described in the loan documents.
KBS REIT Properties III (“REIT Properties III”) is providing a guaranty of 35% of the principal loan balance with respect to certain obligations and liabilities, and related costs, damages and expenses, owed by the Hardware Village Joint Venture to the lender under the Hardware Village Loan Facility resulting from: certain intentional actions committed by the Hardware Village Joint Venture, REIT Properties III and/or any of their affiliates in violation of the loan documents and certain other occurrences described in the loan documents. REIT Properties III is also providing a partial guaranty of the principal balance and any interest or other sums outstanding under the loan and a full guaranty of the principal balance and any interest or other sums outstanding under the loan facility in the event of certain (i) bankruptcy or insolvency proceedings involving the Hardware Village Joint Venture or REIT Properties III or (ii) transfers of Hardware Village in violation of the loan documents. REIT Properties III is also providing a guaranty of the completion of construction of Hardware Village and of the payment of all amounts related thereto.
F-39
KBS REAL ESTATE INVESTMENT TRUST III, INC.
NOTES TO CONSOLIDATED FINANCIAL STATEMENTS (CONTINUED)
December 31, 2016
Joint Venture and Financing Subsequent to December 31, 2016
Village Center Station II Joint Venture and Acquisition and Development
On March 3, 2017, KBS Real Estate Investment Trust III, Inc. (the “Company”), through an indirect wholly owned subsidiary, entered into an amended and restated limited liability company agreement with an unaffiliated developer (the “Developer”) (the “Agreement”) relating to an existing limited liability company owned by the Developer (the “Existing LLC”). Pursuant to the Agreement, the Company acquired a 75% equity interest in the Existing LLC and created a joint venture with the Developer (the “Village Center Station II Joint Venture”). The Village Center Station II Joint Venture was formed to develop and subsequently operate a 12-story office building containing approximately 306,053 rentable square feet and an adjacent two-story office/retail building containing approximately 17,753 rentable square feet, located in the Denver sub-market of Greenwood Village, Colorado (together “Village Center Station II”). Village Center Station II is adjacent to the Company’s existing Village Center Station I Investment. The total projected cost of the development is approximately $113.1 million. Upon completion of Village Center Station II, Charter Communications Holding Company, LLC (“Charter Communications”) will occupy 100% of the property under a ten-year lease, with three five-year or two six-year extension options.
The Village Center Station II Joint Venture intends to fund Village Center Station II with capital contributions from its members and with proceeds from the Village Center Station II Construction Loan (discussed below). The Company’s initial capital contribution to the Village Center Station II Joint Venture was $32.3 million. Under the Agreement, the Company may be required to contribute up to 75% of additional requested contributions to the Village Center Station II Joint Venture. The Developer will fund all cost overruns (excluding certain overruns described in the Charter Communications lease) once the Village Center Station II Joint Venture has used all available funds in the development of Village Center Station II. Income, losses, distributions of cash flow from operations and sale or refinancing are allocated among the members of the Village Center Station II Joint Venture pursuant to the Agreement. Upon completion of Village Center Station II, the Company will purchase the Developer's 25% equity interest.
On March 1, 2017 the Existing LLC’s existing construction loan with unaffiliated lenders was modified. The loan now provides for borrowings of up to $78.5 million secured by Village Center Station II (the “Village Center Station II Construction Loan”). The Village Center Station II Construction Loan matures on the earlier of March 31, 2019 or the date that the loan converts to a traditional mortgage loan, subject to certain terms and conditions contained in the loan documents. Upon the conversion of the Village Center Station II Construction Loan to a traditional mortgage loan and upon the satisfaction of certain terms and conditions contained in the loan documents, the Village Center Station II Joint Venture may extend the initial maturity date to March 1, 2022. The Village Center Station II Construction Loan bears interest at a floating rate of 220 basis points over one-month LIBOR that reduces to a floating rate of 170 basis points over one-month LIBOR upon conversion to a traditional mortgage loan. The Village Center Station II Joint Venture has the right to repay the loan in part or in whole at any time subject, in certain circumstances, to certain fees, expenses and conditions, all as described in the loan documents.
Upon the conversion of the Village Center Station II Construction Loan to a traditional mortgage loan, REIT Properties III will provide a guaranty: (i) with respect to certain liabilities, obligations, losses, damages, costs and expenses of the lenders under the Village Center Station II Construction Loan as a result of: certain intentional actions committed by the Village Center Station II Joint Venture and/or REIT Properties III in violation of the loan documents and certain other occurrences described in the loan documents and in the Charter Communications lease, and (ii) of 25% of the outstanding principal balance of, and certain other sums and costs related to, the Village Center Station II Construction Loan, which guaranty amount may increase to 35% or 50% upon the occurrence of certain tenant-related events described in the loan documents.
F-40
KBS REAL ESTATE INVESTMENT TRUST III, INC.
SCHEDULE III
REAL ESTATE ASSETS AND ACCUMULATED DEPRECIATION AND AMORTIZATION
December 31, 2016
(dollar amounts in thousands)
Initial Cost to Company | Gross Amount at which Carried at Close of Period | |||||||||||||||||||||||||||||||||||||||||||
Description | Location | Ownership Percent | Encumbrances | Land | Building and Improvements(1) | Total | Cost Capitalized Subsequent to Acquisition(2) | Land | Building and Improvements(1) | Total (3) | Accumulated Depreciation and Amortization | Original Date of Construction | Date Acquired | |||||||||||||||||||||||||||||||
Domain Gateway | Austin, TX | 100% | $ | (4) | $ | 2,850 | $ | 44,523 | $ | 47,373 | $ | — | $ | 2,850 | $ | 44,523 | $ | 47,373 | $ | (11,385 | ) | 2009 | 09/29/2011 | |||||||||||||||||||||
Town Center | Plano, TX | 100% | 75,000 | 7,428 | 108,547 | 115,975 | 1,278 | 7,428 | 109,825 | 117,253 | (22,308 | ) | 2001/2002/2006 | 03/27/2012 | ||||||||||||||||||||||||||||||
McEwen Building | Franklin, TN | 100% | (4) | 5,600 | 34,704 | 40,304 | (1,770 | ) | 5,600 | 32,934 | 38,534 | (7,641 | ) | 2009 | 04/30/2012 | |||||||||||||||||||||||||||||
Gateway Tech Center | Salt Lake City, UT | 100% | (4) | 5,617 | 20,051 | 25,668 | (733 | ) | 5,617 | 19,318 | 24,935 | (5,304 | ) | 1909 | 05/09/2012 | |||||||||||||||||||||||||||||
Tower on Lake Carolyn | Irving, TX | 100% | (4) | 2,056 | 44,579 | 46,635 | 5,587 | 2,056 | 50,166 | 52,222 | (11,111 | ) | 1988 | 12/21/2012 | ||||||||||||||||||||||||||||||
RBC Plaza | Minneapolis, MN | 100% | 75,930 | 16,951 | 109,191 | 126,142 | 24,437 | 16,951 | 133,628 | 150,579 | (24,994 | ) | 1991 | 01/31/2013 | ||||||||||||||||||||||||||||||
One Washingtonian Center | Gaithersburg, MD | 100% | (5) | 14,400 | 74,335 | 88,735 | 1,476 | 14,400 | 75,811 | 90,211 | (11,883 | ) | 1990 | 06/19/2013 | ||||||||||||||||||||||||||||||
Preston Commons | Dallas, TX | 100% | (5) | 17,188 | 96,330 | 113,518 | 2,250 | 17,188 | 98,580 | 115,768 | (16,497 | ) | 1958/1986 | 06/19/2013 | ||||||||||||||||||||||||||||||
Sterling Plaza | Dallas, TX | 100% | (5) | 6,800 | 68,292 | 75,092 | 4,241 | 6,800 | 72,533 | 79,333 | (10,247 | ) | 1984 | 06/19/2013 | ||||||||||||||||||||||||||||||
201 Spear Street | San Francisco, CA | 100% | 100,000 | 40,279 | 85,941 | 126,220 | 9,532 | 40,279 | 95,473 | 135,752 | (12,734 | ) | 1984 | 12/03/2013 | ||||||||||||||||||||||||||||||
500 West Madison | Chicago, IL | 100% | 215,000 | 49,306 | 370,662 | 419,968 | 20,203 | 49,306 | 390,865 | 440,171 | (56,624 | ) | 1987 | 12/16/2013 | ||||||||||||||||||||||||||||||
222 Main | Salt Lake City, UT | 100% | 101,343 | 5,700 | 156,842 | 162,542 | 3,041 | 5,700 | 159,883 | 165,583 | (18,627 | ) | 2009 | 02/27/2014 | ||||||||||||||||||||||||||||||
Anchor Centre | Phoenix, AZ | 100% | 50,000 | 13,900 | 73,480 | 87,380 | 5,341 | 13,900 | 78,821 | 92,721 | (9,735 | ) | 1984 | 05/22/2014 | ||||||||||||||||||||||||||||||
171 17th Street | Atlanta, GA | 100% | 83,778 | 7,639 | 122,593 | 130,232 | 992 | 7,639 | 123,585 | 131,224 | (14,781 | ) | 2004 | 08/25/2014 | ||||||||||||||||||||||||||||||
Rocklin Corporate Center | Rocklin, CA | 100% | 20,868 | 4,448 | 28,276 | 32,724 | 528 | 4,448 | 28,804 | 33,252 | (3,867 | ) | 2007 | 11/06/2014 | ||||||||||||||||||||||||||||||
Reston Square | Reston, VA | 100% | 23,840 | 6,800 | 38,838 | 45,638 | 989 | 6,800 | 39,827 | 46,627 | (4,879 | ) | 2007 | 12/03/2014 | ||||||||||||||||||||||||||||||
Ten Almaden | San Jose, CA | 100% | 65,853 | 7,000 | 110,292 | 117,292 | 4,424 | 7,000 | 114,716 | 121,716 | (10,641 | ) | 1988 | 12/05/2014 | ||||||||||||||||||||||||||||||
Towers at Emeryville | Emeryville, CA | 100% | 145,379 | 49,183 | 200,823 | 250,006 | 11,047 | 49,183 | 211,870 | 261,053 | (22,931 | ) | 1972/1975/1985 | 12/23/2014 | ||||||||||||||||||||||||||||||
101 South Hanley | St. Louis, MO | 100% | 37,502 | 6,100 | 57,363 | 63,463 | 4,063 | 6,100 | 61,426 | 67,526 | (6,015 | ) | 1986 | 12/24/2014 | ||||||||||||||||||||||||||||||
3003 Washington Boulevard | Arlington, VA | 100% | 90,378 | 18,800 | 129,820 | 148,620 | 2,714 | 18,800 | 132,534 | 151,334 | (10,005 | ) | 2014 | 12/30/2014 | ||||||||||||||||||||||||||||||
Village Center Station | Greenwood Village, CO | 100% | (4) | 4,250 | 73,631 | 77,881 | 158 | 4,250 | 73,789 | 78,039 | (5,882 | ) | 2009 | 05/20/2015 | ||||||||||||||||||||||||||||||
Park Place Village | Leawood, KS | 100% | (4) | 11,009 | 117,070 | 128,079 | 1,431 | 11,009 | 118,501 | 129,510 | (8,660 | ) | 2007 | 06/18/2015 | ||||||||||||||||||||||||||||||
201 17th Street | Atlanta, GA | 100% | 58,063 | 5,277 | 86,859 | 92,136 | 11,280 | 5,277 | 98,139 | 103,416 | (6,466 | ) | 2007 | 06/23/2015 | ||||||||||||||||||||||||||||||
Promenade I & II at Eilan | San Antonio, TX | 100% | 37,300 | 3,250 | 59,314 | 62,564 | (93 | ) | 3,250 | 59,221 | 62,471 | (4,281 | ) | 2011 | 07/14/2015 | |||||||||||||||||||||||||||||
CrossPoint at Valley Forge | Wayne, PA | 100% | 51,000 | 17,302 | 72,280 | 89,582 | 458 | 17,302 | 72,738 | 90,040 | (4,809 | ) | 1974 | 08/18/2015 | ||||||||||||||||||||||||||||||
515 Congress | Austin, TX | 100% | 67,500 | 8,000 | 106,261 | 114,261 | 2,096 | 8,000 | 108,357 | 116,357 | (6,946 | ) | 1975 | 08/31/2015 | ||||||||||||||||||||||||||||||
The Almaden | San Jose, CA | 100% | 93,000 | 29,000 | 130,145 | 159,145 | 3,600 | 29,000 | 133,745 | 162,745 | (7,702 | ) | 1980/1981 | 09/23/2015 | ||||||||||||||||||||||||||||||
3001 Washington Boulevard | Arlington, VA | 100% | 27,129 | 9,900 | 41,551 | 51,451 | 3,223 | 9,900 | 44,774 | 54,674 | (1,497 | ) | 2015 | 11/06/2015 | ||||||||||||||||||||||||||||||
Carillon | Charlotte, NC | 100% | 76,440 | 19,100 | 126,979 | 146,079 | 5,298 | 19,100 | 132,277 | 151,377 | (6,342 | ) | 1991 | 01/15/2016 | ||||||||||||||||||||||||||||||
Hardware Village (6) | Salt Lake City, UT | 99.24% | — | 4,183 | 4,183 | 17,670 | — | 21,853 | 21,853 | — | N/A | 08/26/2016 | ||||||||||||||||||||||||||||||||
TOTAL | $ | 395,133 | $ | 2,793,755 | $ | 3,188,888 | $ | 144,761 | $ | 395,133 | $ | 2,938,516 | $ | 3,333,649 | $ | (344,794 | ) | |||||||||||||||||||||||||||
____________________
(1) Building and improvements includes tenant origination and absorption costs and construction in progress.
(2) Costs capitalized subsequent to acquisition is net of write-offs of fully depreciated/amortized assets.
(3) The aggregate cost of real estate for federal income tax purposes was $3.4 billion (unaudited) as of December 31, 2016.
F-41
KBS REAL ESTATE INVESTMENT TRUST III, INC.
SCHEDULE III
REAL ESTATE ASSETS AND ACCUMULATED DEPRECIATION AND AMORTIZATION
December 31, 2016
(dollar amounts in thousands)
(4) As of December 31, 2016, these properties served as the security for the Portfolio Loan, which had an outstanding principal balance of $127.5 million as of December 31, 2016.
(5) As of December 31, 2016, these properties served as the security for the National Office Portfolio Mortgage Loan, which had an outstanding principal balance of $170.6 million as of December 31, 2016.
(6) On August 26, 2016, the Company, through an indirect wholly-owned subsidiary, entered into the Hardware Village Joint Venture to develop and subsequently operate Hardware Village, located on the developable land at Gateway Tech Center. The Company owns a 99.24% equity interest in the joint venture. For further information regarding the Company’s construction in progress, see Note 3 “Real Estate” — Construction in Progress.
F-42
KBS REAL ESTATE INVESTMENT TRUST III, INC.
SCHEDULE III
REAL ESTATE ASSETS AND ACCUMULATED DEPRECIATION AND AMORTIZATION (CONTINUED)
December 31, 2016
(dollar amounts in thousands)
2016 | 2015 | 2014 | ||||||||||
Real Estate: | ||||||||||||
Balance at the beginning of the year | $ | 3,134,155 | $ | 2,307,861 | $ | 1,276,737 | ||||||
Acquisitions | 149,745 | 775,099 | 1,037,897 | |||||||||
Improvements | 67,328 | 73,043 | 38,775 | |||||||||
Construction in progress | 16,680 | 990 | — | |||||||||
Write off of fully depreciated and fully amortized assets | (34,259 | ) | (22,776 | ) | (9,642 | ) | ||||||
Loss due to property damage | — | (62 | ) | — | ||||||||
Sale | — | — | (35,906 | ) | ||||||||
Balance at the end of the year | $ | 3,333,649 | $ | 3,134,155 | $ | 2,307,861 | ||||||
Accumulated depreciation and amortization: | ||||||||||||
Balance at the beginning of the year | (222,431 | ) | $ | (110,781 | ) | $ | (46,608 | ) | ||||
Depreciation and amortization expense | (156,622 | ) | (134,426 | ) | (78,378 | ) | ||||||
Write off of fully depreciated and fully amortized assets | 34,259 | 22,776 | 9,642 | |||||||||
Sale | — | — | 4,563 | |||||||||
Balance at the end of the year | $ | (344,794 | ) | $ | (222,431 | ) | $ | (110,781 | ) | |||
F-43
SIGNATURES
Pursuant to the requirements of Section 13 or 15(d) of the Securities Exchange Act of 1934, the registrant has duly caused this report to be signed on its behalf by the undersigned, thereunto duly authorized, in the City of Newport Beach, State of California, on March 13, 2017.
KBS REAL ESTATE INVESTMENT TRUST III, INC. | ||
By: | /s/ Charles J. Schreiber, Jr. | |
Charles J. Schreiber, Jr. | ||
Chairman of the Board, Chief Executive Officer and Director | ||
(principal executive officer) | ||
Pursuant to the requirements of the Securities Exchange Act of 1934, this report has been signed below by the following persons on behalf of the registrant and in the capacities and on the dates indicated:
Name | Title | Date | ||
/s/ CHARLES J. SCHREIBER, JR. | Chairman of the Board, Chief Executive Officer and Director (principal executive officer) | March 13, 2017 | ||
Charles J. Schreiber, Jr. | ||||
/s/ JEFFREY K. WALDVOGEL | Chief Financial Officer (principal financial officer) | March 13, 2017 | ||
Jeffrey K. Waldvogel | ||||
/s/ PETER MCMILLAN III | Executive Vice President, Treasurer, Secretary and Director | March 13, 2017 | ||
Peter McMillan III | ||||
/s/ STACIE K. YAMANE | Chief Accounting Officer (principal accounting officer) | March 13, 2017 | ||
Stacie K. Yamane | ||||
/s/ HANK ADLER | Director | March 13, 2017 | ||
Hank Adler | ||||
/s/ BARBARA R. CAMBON | Director | March 13, 2017 | ||
Barbara R. Cambon | ||||
/s/ STUART A. GABRIEL, PH.D. | Director | March 13, 2017 | ||
Stuart A. Gabriel, Ph.D. | ||||