Attached files
| file | filename |
|---|---|
| EX-32 - EXHIBIT 32.2 - Renewable Energy Group, Inc. | regi-20161231xex322.htm |
| EX-32 - EXHIBIT 32.1 - Renewable Energy Group, Inc. | regi-20161231xex321.htm |
| EX-31 - EXHIBIT 31.2 - Renewable Energy Group, Inc. | regi-20161231xex312.htm |
| EX-31 - EXHIBIT 31.1 - Renewable Energy Group, Inc. | regi-20161231xex311.htm |
| EX-23 - EXHIBIT 23.1 - Renewable Energy Group, Inc. | regi-20161231xex231xdeloit.htm |
| EX-21 - EXHIBIT 21.1 - Renewable Energy Group, Inc. | regi-20161231xex211xlistof.htm |
| EX-12 - EXHIBIT 12.1 - Renewable Energy Group, Inc. | regi-20161231xex121stateme.htm |
UNITED STATES
SECURITIES AND EXCHANGE COMMISSION
Washington, D.C. 20549
______________________________________
FORM 10-K
(Mark One)
x | ANNUAL REPORT PURSUANT TO SECTION 13 OR 15(d) OF THE SECURITIES EXCHANGE ACT OF 1934 |
For the fiscal year ended December 31, 2016
or
¨ | TRANSITION REPORT PURSUANT TO SECTION 13 OR 15(d) OF THE SECURITIES EXCHANGE ACT OF 1934 |
For the transition period from to
Commission File Number: 001-35397
______________________________________
RENEWABLE ENERGY GROUP, INC.
(Exact name of registrant as specified in its charter)
Delaware | 26-4785427 |
(State or other jurisdiction of incorporation or organization) | (I.R.S. Employer Identification No.) |
416 South Bell Avenue, Ames, Iowa | 50010 |
(Address of principal executive offices) | (Zip Code) |
Registrant’s telephone number, including area code: (515) 239-8000
Securities registered pursuant to Section 12(b) of the Act:
Title of each class: | Name of each exchange on which registered: |
Common Stock, par value $.0001 per share | NASDAQ Global Market |
Securities registered pursuant to Section 12(g) of the Act:
None
(Title of class)
______________________________________
Indicate by check mark if the registrant is a well-known seasoned issuer, as defined in Rule 405 of the Securities Act. Yes ¨ No x
Indicate by check mark if the registrant is not required to file reports pursuant to Section 13 or Section 15(d) of the Act. Yes ¨ No x
Indicate by check mark whether the registrant (1) has filed all reports required to be filed by Section 13 or 15(d) of the Securities Exchange Act of 1934 during the preceding 12 months (or for such shorter period that the registrant was required to file such reports), and (2) has been subject to such filing requirements for the past 90 days. Yes x No ¨
Indicate by check mark whether the registrant has submitted electronically and posted on its corporate Web site, if any, every Interactive Data File required to be submitted and posted pursuant to Rule 405 of Regulation S-T (section 232.405 of this chapter) during the preceding 12 months (or for such shorter period that the registrant was required to submit and post such files). Yes x No ¨
Indicate by check mark if disclosure of delinquent filers pursuant to Item 405 of Regulation S-K is not contained herein, and will not be contained, to the best of registrant’s knowledge, in definitive proxy or information statements incorporated by reference in Part III of this Form 10-K or any amendment to this Form 10-K. x
Indicate by check mark whether the registrant is a large accelerated filer, an accelerated filer, a non-accelerated filer, or a smaller reporting company. See the definitions of “large accelerated filer,” “accelerated filer” and “smaller reporting company” in Rule 12b-2 of the Exchange Act.
Large accelerated filer | ¨ | Accelerated filer | x |
Non-accelerated filer | ¨ (Do not check if a smaller reporting company) | Smaller reporting company | ¨ |
Indicate by check mark whether the registrant is a shell company (as defined in Rule 12b-2 of the Act). Yes ¨ No x
As of June 30, 2016, the aggregate market value of Common Stock held by non-affiliates was $337,816,047.
As of February 28, 2017, 38,565,260 shares of Common Stock of the registrant were issued and outstanding.
______________________________________
Documents Incorporated By Reference
All or a portion of Items 10 through 14 in Part III of this Form 10-K are incorporated by reference to the Registrant’s definitive proxy statement on Schedule 14A, which will be filed within 120 days after the close of the fiscal year covered by this report on Form 10-K, or if the Registrant’s Schedule 14A is not filed within such period, will be included in an amendment to this Report on Form 10-K which will be filed within such 120 day period.
TABLE OF CONTENTS
Page | ||
PART I | ||
ITEM 1. | ||
ITEM 1A. | ||
ITEM 1B. | ||
ITEM 2. | ||
ITEM 3. | ||
ITEM 4. | ||
PART II | ||
ITEM 5. | ||
ITEM 6. | ||
ITEM 7. | ||
ITEM 7A. | ||
ITEM 8. | ||
ITEM 9. | ||
ITEM 9A. | ||
ITEM 9B. | ||
PART III | ||
ITEM 10. | ||
ITEM 11. | ||
ITEM 12. | ||
ITEM 13. | ||
ITEM 14. | ||
PART IV | ||
ITEM 15. | ||
ITEM 16. | ||
PART I
Cautionary Statement Regarding Forward-Looking Information
This annual report on Form 10-K contains, in addition to historical information, certain forward-looking statements within the meaning of the Private Securities Litigation Reform Act of 1995. All statements other than statements of historical facts contained in this report, including statements regarding our future results of operations and financial position, strategy and plans, and our expectations for future operations, are forward-looking statements. The words “believe,” “may,” “will,” “would,” “might,” “could,” “estimate,” “continue,” “anticipate,” “design,” “intend,” “plan,” “seek,” “potential,” “expect” and similar expressions are intended to identify forward-looking statements. We have based these forward-looking statements largely on our current expectations and projections about future events and trends that we believe may affect our financial condition, results of operations, strategy, short-term and long-term business operations and objectives, and financial needs. Forward-looking statements include, but are not limited to, statements about:
• | our financial performance, including revenues, cost of revenues and operating expenses; |
• | government programs, policymaking and mandates relating to renewable fuels; |
• | the availability, future price and volatility of feedstocks; |
• | the future price and volatility of petroleum; |
• | our liquidity and working capital requirements; |
• | anticipated trends and challenges in our business and competition in the markets in which we operate; |
• | our ability to successfully implement our acquisition strategy and integration strategy; |
• | progressing facilities currently under development to the construction and operational stages, including planned capital expenditures and our ability to obtain financing for such construction; |
• | our ability to protect proprietary technology and trade secrets; |
• | the development of competing alternative fuels, energy services and renewable chemicals; |
• | our risk management activities; |
• | product performance, in cold weather or otherwise; |
• | seasonal fluctuations in our business; |
• | our current products as well as products we are developing; |
• | critical accounting policies and estimates, the impact or anticipated impact of recent accounting pronouncements, guidance or changes in accounting principles and future recognition of impairments for the fair value of assets, including goodwill, financial instruments, intangible assets and other assets acquired; and |
• | assumptions underlying or relating to any of the foregoing. |
These statements reflect current views with respect to future events and are based on assumptions and subject to risks and uncertainties. We note that a variety of factors could cause actual results and experience to differ materially from the anticipated results or expectations expressed in our forward-looking statements. Given these uncertainties, you should not place undue reliance on these forward-looking statements. Forward-looking statements are also subject to risks and uncertainties that could cause actual results to differ materially from those expected. These risks and uncertainties include, but are not limited to, those risks discussed in Item 1A of this report.
Forward-looking statements contained in this report present management’s views only as of the date of this report. We undertake no obligation to publicly update forward-looking statements, whether as a result of new information, future events or otherwise. You are advised, however, to consult any further disclosures we make on related subjects in our 10-Q and 8-K reports filed with the Securities and Exchange Commission.
ITEM 1. | Business |
General
We focus on providing cleaner, lower carbon intensity products and services. We are North America's largest producer of advanced biofuels. We utilize a nationwide production, distribution and logistics system as part of an integrated value chain model designed to convert natural fats, oils and greases into advanced biofuels. During 2016, we sold 567 million gallons and
1
had revenues of $2.0 billion. We are also engaged in research and development efforts focused on the conversion of diverse feedstocks into renewable chemicals.
We own and operate a network of 14 biorefineries. Twelve biorefineries are located in the United States and two in Germany, and 13 of which produce biodiesel or renewable hydrocarbon diesel and have an aggregate nameplate production capacity of 502 million gallons per year, or mmgy. We also operate one microbial fermentation facility in connection with our development of renewable chemicals and one feedstock processing facility. We believe our fully integrated approach, which includes acquiring feedstock, managing biorefinery facility construction and upgrades, operating biorefineries, and distributing through a network of terminals, positions us to serve the market for biomass-based diesel and other advanced biofuels along with other products and services.
We are a lower-cost biomass-based diesel producer. We primarily produce our biomass-based diesel from a wide variety of lower cost feedstocks, including inedible corn oil, used cooking oil and inedible animal fat. We also produce biomass-based diesel from virgin vegetable oils, which are more widely available and tend to be higher in price. We believe our ability to process a wide variety of feedstocks provides us with a cost advantage over many biomass-based diesel producers, particularly those that rely primarily on higher cost virgin vegetable oils, such as soybean oil or canola oil.
We are in the process of developing renewable chemicals through our development-stage industrial biotechnology business, REG Life Sciences, which uses proprietary microbial fermentation processes to produce renewable chemicals, fuels and other products. Fatty acids are one of three product areas REG Life Sciences has focused on, along with esters and alcohols.
We sell petroleum-based heating oil and diesel fuel, which enables us to offer additional biofuel blends, while expanding our customer base. We sell heating oil and ultra-low sulfur diesel, or ULSD, at terminals throughout the northeastern U.S. as well as BioHeat® blended fuel at one of our existing Northeastern terminal locations. We expanded our sales of additional biofuel blends to Midwest terminal locations and look to potentially expand to other areas across North America.
We acquired a 75 mmgy nameplate capacity renewable hydrocarbon diesel biorefinery located in Geismar, Louisiana in June 2014. We began production at the Geismar facility in October 2014 after our completion of certain upgrades. The facility was idle from April 2015 to March 2016 while repairs were made related to the two separate fires that occurred at the facility in April and September 2015. Our Geismar facility has been running at high run rates since early October 2016.
We also expanded our business internationally by acquiring a majority interest in Petrotec AG ("Petrotec"), in December 2014. During 2015 and 2016, we acquired additional shares in Petrotec through cash tender offers and purchases on the open market. At December 31, 2016, we owned approximately 91% of Petrotec's outstanding shares. In January 2017, we completed the acquisition of the remaining minority interest in Petrotec and now own 100% of its outstanding shares. Petrotec is a fully-integrated company utilizing used cooking oil and other waste feedstocks to produce biomass-based diesel at its two biorefineries in Emden and Oeding, Germany. Our production capacity in Europe is approximately 50 mmgy.
In August 2015, we acquired our Grays Harbor facility, a 100 mmgy nameplate biodiesel plant and terminal at the Port of Grays Harbor, Washington. This acquisition expanded our production fleet to the west coast of the United States. The Grays Harbor location includes 18 million gallons of storage capacity and a terminal that can accommodate feedstock intake and fuel delivery on deep-water PANAMAX class vessels as well as possessing significant rail and truck transport capabilities. To date, the production facility's primary feedstock has been canola oil sourced nearby in the Pacific Northwest.
In March 2016, we acquired our 20 mmgy nameplate biodiesel refinery located in DeForest, Wisconsin, REG Madison, LLC, which produces biodiesel from yellow grease, rendered animal fats, and inedible corn oil, in addition to refined vegetable oils using our patented technology currently in use at our Seneca, Illinois plant. The facility has both truck and rail capabilities.
Plant Network
2
Our production network in North America consists of the following owned facilities:
Property | Nameplate1 Production Capacity (mmgy) | Estimated Production Capacity for Current Feedstock Mix as of December 31, 2016 (mmgy) | REG Operations Commenced | Feedstock Capability | ||||
Ralston, Iowa | 12 | 12 | 2002 | Refined Oils and Fats | ||||
Albert Lea, Minnesota | 30 | 30 | 2005 | Crude, High FFA and Refined Oils and Fats | ||||
Newton, Iowa | 30 | 30 | 2007 | Crude, High FFA and Refined Oils and Fats | ||||
Seabrook, Texas | 35 | 35 | 2008 | Refined Oils and Fats | ||||
Danville, Illinois | 45 | 45 | 2009 | Crude, High FFA and Refined Oils and Fats | ||||
Seneca, Illinois | 60 | 60 | 2010 | Crude, High FFA and Refined Oils and Fats | ||||
New Boston, Texas | 15 | 14 | 2013 | Crude, High FFA and Refined Oils and Fats | ||||
Ellenwood, Georgia 2 | 15 | n/a | n/a | N/A | ||||
Mason City, Iowa | 30 | 30 | 2013 | Crude, High FFA and Refined Oils and Fats | ||||
Geismar, Louisiana 3 | 75 | 75 | 2014 | Crude, High FFA and Refined Oils and Fats | ||||
Okeechobee, Florida 4 | n/a | n/a | 2014 | n/a | ||||
Grays Harbor, Washington | 100 | 92 | 2015 | Refined Oils and Fats | ||||
Madison, Wisconsin 5 | 20 | 20 | 2016 | Crude, High FFA and Refined Oils and Fats | ||||
Partially Constructed Facilities | % Complete | |||||||
St. Rose, Louisiana | 60 | n/a | ~45% | Crude, High FFA and Refined Oils and Fats | ||||
Emporia, Kansas | 60 | n/a | ~20% | Crude, High FFA and Refined Oils and Fats | ||||
Clovis, New Mexico | 15 | n/a | ~50% | Crude, High FFA and Refined Oils and Fats | ||||
1 | The nameplate capacity listed above is based on original plant design. |
2 | Idled by prior owner at time of our purchase and remains idled pending repairs or upgrades. We have not yet set a production date. |
3 | Plant commenced operations in March 2016 after being shut down since April 2015 due to two separate fires that occurred in April and September 2015. |
4 | Okeechobee is a demo-scale microbial fermentation facility for the development and production of renewable chemicals, fuels and other products. |
5 | Acquired in March 2016 from Sanimax Energy. |
Our production network in Europe consists of the following facilities:
3
Property | Nameplate Production Capacity1 (million gallons) | Estimated Production Capacity for Current Feedstock Mix as of December 31, 2016 (million gallons) | Operations Commenced | Feedstock Capability | ||||
Emden, Germany | 27 | 27 | 2008 | Crude, High FFA and Refined Oils and Fats | ||||
Oeding, Germany | 23 | 23 | 2001 | Crude, High FFA and Refined Oils and Fats | ||||
1 | The nameplate capacity listed above is based on the output of the original plant design. In Germany, nameplate capacity can be based on input, which is 30 mmgy for Emden and 26 mmgy for Oeding or 185,000 metric tons for these two locations. |
In addition to the production facilities and fermentation facility listed above, we maintain a testing laboratory at our corporate headquarters in Ames, Iowa, which allows us to test various feedstocks for conversion into biomass-based diesel, as well as various manufacturing processes available in the production of biomass-based diesel. We also have a regional office in Tulsa, Oklahoma, focused on maintaining and developing advanced biofuel technologies and renewable chemicals. Our industrial biotechnology research and development activities, conducted in South San Francisco, are dedicated to the development of renewable chemicals, advanced biofuels and other products using our proprietary microbial fermentation technology.
Our Feedstocks and Other Inputs
Our ability to use a wide range of feedstocks gives us the flexibility to respond to changes in feedstock pricing to maintain our feedstock cost advantage. We have the ability to change our processing techniques to accommodate different feedstocks and feedstock mixes. In 2016, approximately 72% of our total feedstock usage was lower cost inedible corn oil, used cooking oil or rendered animal fat feedstock and the remaining 28% was from refined vegetable oils, such as soybean oil or canola oil.
We procure our feedstocks from numerous vendors in quantities ranging from truckload to railcar to water vessel to pipeline. There is no established futures market for lower cost feedstocks. Inedible corn oil is typically purchased in nearby forward positions of one to three months, and occasionally longer, on fixed priced contracts. We generally purchase used cooking oil and rendered animal fats on one to four week forward positions using fixed pricing or an indexed price compared to a published index such as USDA reports or recognized industry price reports such as The Jacobsen or Informa. Soybean and canola oils can be purchased on a spot or forward contract basis from a number of suppliers and pricing for these vegetable oils is compared to the broadly traded Soybean Oil Index of the Chicago Mercantile Exchange (CME).
From time to time, we work with developers of next generation feedstocks, such as algae and camelina, to assist them in bringing these new feedstocks to market. We have converted several of these feedstocks, as well as other second generation feedstocks, into high quality biomass-based diesel in our laboratory and production facilities. We believe we are well positioned to incorporate many new feedstocks into our production process as they become commercially available.
We procure methanol, chemical catalysts used in our production process such as sodium methylate and hydrochloric acid, under fixed-price contracts and formula-indexed contracts based upon competitive bidding. These procurement contracts typically last from three months to one year. The price of methanol is indexed to the monthly reported published price such as the JJ&A Methanol report or Southern Chemical (SSC) report.
Distribution
We have established a national distribution system to supply biomass-based diesel throughout the United States. Each of our biomass-based diesel facilities is equipped with an on-site rail loading system, a truck loading system, or both. Our Seneca biorefinery near the Illinois River has direct barge access supplying customers using the inland waterways system. Our Houston biorefinery has barge and deep-water ship loading capability. Our Grays Harbor biorefinery has deep-water capability for PANAMAX class vessels. We also manage some customers’ biomass-based diesel storage tanks and replenishment process. We lease 484 railcars for transportation and lease biomass-based diesel storage tanks in 49 terminals as of December 31, 2016. In general, the terminals where we lease our biomass-based diesel storage tanks are petroleum fuel terminals so that fuel distributors and other biomass-based diesel customers can create a biomass-based diesel blend at the terminal before further distribution. Terminal leases typically have one- to three-year terms and are generally renewable subject to certain terms and conditions. During 2016, we have sold our various products in 47 states, four provinces in Canada, Peru, as well as Europe.
4
Risk Management
The prices for feedstocks and biomass-based diesel can be volatile and are not always closely correlated. Lower cost feedstocks are particularly difficult to risk manage given that such feedstocks are not traded in any public futures market. To manage feedstock and biomass-based diesel price risks, we utilize forward contracting, hedging and other risk management strategies, including the use of futures, swaps, options and over-the-counter products.
In establishing our risk management strategies, we draw from our own in-house risk management expertise and we consult with industry experts. We utilize research conducted by outside firms to provide additional market information and risk management strategies. We believe combining these sources of knowledge, experience and expertise gives us a more sophisticated and global view of the fluctuating commodity markets for raw materials and energy, which we then can incorporate into our risk management strategies.
Seasonality
Biodiesel producers have experienced seasonal fluctuations in demand for biodiesel. Biodiesel demand has tended to be lower during winter in most states due to blending concentrations being reduced. To mitigate some of these seasonable fluctuations in demand, we have upgraded our Newton and Danville biorefineries to produce distilled biodiesel from lower cost feedstocks, thus allowing that product to have improved cold-weather performance.
Renewable Identification Number, or RIN, prices may also be subject to seasonal fluctuations. The RIN is dated for the calendar year in which it is generated. Since 20% of an Obligated Party's annual Renewable Volume Obligation, or RVO, can be satisfied by prior year RINs, most RINs must come from biofuel produced or imported during the RVO year. As a result, RIN prices can be expected to increase as the calendar year progresses if the RIN market is undersupplied compared to that year's RVO and decrease if it is oversupplied. For further discussion and background on RINs, see "Government Programs Favoring Biomass-based Diesel Production and Use" below.
Competition
We face competition from producers and suppliers of petroleum-based diesel fuel, from other biomass-based diesel producers, marketers, traders and distributors. The size of the biomass-based diesel industry is small compared to the size of the petroleum-based diesel fuel industry and large petroleum companies have greater resources than we do. Our principal competitive differentiators are product quality, both biomass-based diesel and RIN quality, supply reliability and price. We also face competition in the biomass-based diesel RIN compliance market from producers of renewable hydrocarbon diesel and in the advanced biofuel RIN compliance market from producers of other advanced biofuels. In the United States and Canadian biomass-based diesel markets, we compete with large, multi-product companies that have greater resources than we do. Archer Daniels Midland Company, Cargill Incorporated, Louis Dreyfus Commodities Group and Ag Processing Inc. are major international agribusiness corporations and biodiesel producers with the financial sourcing and marketing resources to be formidable competitors in the biodiesel industry. These agribusiness competitors tend to make biodiesel from higher cost virgin vegetable oils such as soybean or canola oil, which they produce as part of their integrated agribusinesses. We are also in competition with producers of renewable hydrocarbon diesel, such as Neste Oil, which has approximately 882 million gallons of renewable hydrocarbon diesel production capacity in Asia and Europe and Diamond Green Diesel, LLC, the joint venture between Valero Energy Corp. and Darling International with approximately 160 million gallons of production capacity and plans to grow its capacity to 275 million gallons by end of 2017. Renewable hydrocarbon diesel can also satisfy the RFS2 biomass-based diesel requirement if the renewable hydrocarbon diesel meets the greenhouse gas reduction requirements and may satisfy Canadian renewable fuel requirements. Neste Oil has greater financial resources than we do.
In the RFS2 advanced biofuel market, we also compete with other producers and importers of advanced biofuels, such as Brazilian sugarcane ethanol producers and producers of biogas used in transportation. We face increasing competition from imported biomass-based diesel and expect this to continue. In January 2015, the EPA announced the approval of a plan submitted by CARBIO, a consortium of Argentinean renewable fuel producers, which allows for Argentinian biodiesel made from soybean oil to generate RINs. Imported biomass-based diesel that does not qualify under RFS2, also competes in jurisdictions where there are biomass-based diesel blending requirements.
We also face competition from independent biodiesel producers. Most of these competitors own only one biodiesel plant and thus, do not enjoy the benefits of scale that we do. Many of these competitors own biodiesel plants that can process only higher cost virgin vegetable oils. Furthermore, in our marketing and distribution, we face competition from biomass-based diesel traders such as US Oil, NGL, Noble, Shell, Tenaska, Vitol and others. These trading companies may have greater financial resources than we do and are able to take significant biomass-based diesel positions in the marketplace. These competitors are often customers and/or suppliers of ours as well.
Segment and Geographic Information
5
We re-assess our reportable segments on an annual basis. Prior to 2015, our business was organized into two reportable segments - the Biomass-based Diesel segment and the Services segment. As a result of the increased activities surrounding our renewable chemicals business, in 2015 we began reporting a new segment, Renewable Chemicals, which was previously included in the Biomass-based Diesel segment. Financial and geographic information regarding our segments can be found in Note 18 to our consolidated financial statements included under Part II, Item 8 of this report.
Government Programs Favoring Biomass-Based Diesel Production and Use
The biomass-based diesel industry benefits from numerous federal and state government programs, the most important of which is RFS2.
Renewable Fuel Standard
On July 1, 2010, RFS2’s biomass-based diesel requirement became effective, requiring for the first time that a certain percentage of the diesel fuel consumed in the United States be made from renewable sources. The biomass-based diesel requirement can be satisfied by two primary fuels, biodiesel and renewable hydrocarbon diesel. RFS2 required the use of one billion gallons of biomass-based diesel in 2012, required 1.28 billion gallons in 2013 and at least one billion gallons each year thereafter, with such higher amounts to be determined by the United States Environmental Protection Agency, or EPA, subject to the Office of Management and Budget, or OMB, approval. On November 30, 2015, the EPA issued the final 2014 through 2016 RVO rules whereby the biomass-based diesel volumes were set at 1.63 billion, 1.73 billion, 1.90 billion gallons for 2014, 2015 and 2016, respectively. In November 2016, the EPA issued the final 2017 biomass-based diesel volume at 2 billion gallons and additionally set the 2018 target at 2.1 billion gallons.
The biomass-based diesel requirement is one of four separate renewable fuel requirements under RFS2. The RFS2 requirements are based on two primary categories and two subcategories. The two primary categories are conventional renewable fuel, which is primarily satisfied by corn ethanol, and advanced biofuel, which is defined as a biofuel that reduces lifecycle greenhouse gas emissions by at least 50% compared to the petroleum-based fuel the biofuel is replacing. The advanced biofuel category has two subcategories, cellulosic biofuel, to be satisfied by newly developed cellulosic biofuels, such as ethanol made from woody biomass, and biomass-based diesel, which is satisfied by biodiesel and renewable hydrocarbon diesel, or RHD. RFS2’s total advanced biofuel requirement is larger than the combined cellulosic fuel and biomass-based diesel requirements, thus requiring the use of additional volumes of advanced biofuels.
The RFS2 requirement for advanced biofuels can be satisfied by any advanced biofuel, including biodiesel, renewable hydrocarbon diesel, biogas used in transportation, biobutanol, cellulosic ethanol or sugarcane-based ethanol, so long as it meets the 50% greenhouse gas reduction requirement. The advanced biofuel requirement was 2.88 billion gallons in 2015, 3.61 billion gallons in 2016, and 4.28 billion gallons in 2017.
The advanced biofuel RVO is expressed in terms of ethanol equivalent volumes, or EEV, which is based on the fuel’s renewable energy content compared to ethanol. Biodiesel has an EEV of 1.5 and RHD has an EEV of 1.5-1.7, compared to 1.0 for sugarcane-based ethanol. Accordingly, it requires less biomass-based diesel than sugarcane-based ethanol to meet the required volumes as each gallon of biomass-based diesel counts as more gallons for purposes of fulfilling the advanced biofuel RVO, providing an incentive for Obligated Parties to purchase biomass-based diesel to meet their advanced biofuel RVO.
The RFS2 volume requirements apply to petroleum refiners and petroleum fuel importers in the 48 contiguous states and Hawaii, who are defined as “Obligated Parties” in the RFS2 regulations, and requires these Obligated Parties to incorporate into their petroleum-based fuel a certain percentage of renewable fuel or purchase credits in the form of RINs from those who do. An Obligated Party’s RVO is based on the volume of petroleum-based fuel they produce or import. The largest United States petroleum refining companies, such as Valero, Phillips 66, ExxonMobil, British Petroleum, Chevron and Shell, represent the majority of the total RVO, with the remainder made up of smaller refiners and importers.
Renewable Identification Numbers
The EPA created the renewable identification number, or RIN, system to track renewable fuel production and compliance with the renewable fuel standard. EPA registered producers of renewable fuel may generate RINs for each gallon of renewable fuel they produce. In the case of biomass-based diesel, generally 1.5 to 1.7 biomass-based diesel RINs may be generated for each gallon of biomass-based diesel produced, based upon the fuel's renewable energy content. Renewable fuel, including biomass-based diesel, can then be sold with associated RINs attached. RINs may also be separated from the gallons of renewable fuel they represent and once separated they may be sold as a separate commodity. RINs are ultimately used by Obligated Parties to demonstrate compliance with the RFS2. Obligated Parties must obtain and retire the required number of RINs to satisfy their RVO during a particular compliance period. An Obligated Party can obtain RINs by buying renewable fuels with RINs attached, buying RINs that have been separated, or producing renewable fuels themselves. All RIN activity under RFS2 must be entered
6
into the EPA’s moderated transaction system, which tracks RIN generation, transfer and retirement. RINs are retired when used for compliance with the RFS2 requirements.
The value of RINs is significant to the price of biomass-based diesel. In 2015, RIN prices as a percentage contribution to the average B100 spot price, as reported by OPIS fluctuated significantly throughout the year and range from a low of $0.58 per gallon, or 23%, in September to a high of $1.55 per gallon, or 53%, in January. In 2016, RIN prices as a percentage contribution to the average B100 spot price, as reported by OPIS fluctuated significantly throughout the year and range from a low of $1.05 per gallon, or 37%, in September to a high of $1.89 per gallon, or 54%, in January.
Biodiesel Tax Credit
The federal biodiesel mixture excise tax credit, or BTC, when in effect, provides a $1.00 per gallon excise tax credit to the first blender of biomass-based diesel with at least 0.1% petroleum-based diesel fuel. The BTC can then be credited against such biodiesel federal excise tax liability or the blender can obtain a cash refund from the United States Treasury for the value of the credit. The BTC became effective January 1, 2005 and then lapsed January 1, 2010 before being reinstated retroactively on December 17, 2010. The BTC again lapsed as of December 31, 2011 and on January 2, 2013, it was again reinstated, retroactively for 2012 and through December 31, 2013. The BTC lapsed again on December 31, 2013 and was retroactively reinstated for 2014 on December 19, 2014. On December 18, 2015, the BTC was reinstated for 2015 and was in effect until December 31, 2016. The BTC is best thought of as an incentive shared across the entire value chain through routine, daily trading and negotiation. The BTC lapsed again on January 1, 2017, but is generally expected to return even though timing and form of the incentive, if reinstated, are uncertain.
California Low Carbon Fuel Standard Credits
The California Low Carbon Fuel Standard, or LCFS, regulation is a rule designed to reduce greenhouse gas emissions associated with transportation fuels used in California. The regulation quantifies lifecycle greenhouse gas emissions by assigning a “carbon intensity” (CI) score to each transportation fuel based on that fuel’s lifecycle assessment. Each fuel provider (generally the fuel’s producer or importer, or “regulated party”) is required to ensure that the overall CI score for its fuel pool meets the annual carbon intensity target for a given year. A regulated party’s fuel pool can include gasoline, diesel, and their blendstocks and substitutes. In other words, excess CI reductions from one type of fuel (e.g. diesel) can be used to offset insufficient reductions in another fuel (e.g. gasoline).
We get CI credits when we sell qualified biomass-based diesel into California. CI credits ranged from $56 per metric ton to $129 per metric ton in 2016.
Other State Programs
According to the U.S. Department of Energy, more than 40 states have implemented various programs that encourage the use of biomass-based diesel through blending requirements as well as various tax incentives. For example, Illinois offers an exemption from the generally applicable 6.25% sales tax on fuel for biomass-based diesel blends that incentivizes blending at 11% biomass-based diesel, or B11, through December 31, 2018. Illinois’ program has made that state one of the largest biomass-based diesel markets in the country. Since 2006, Iowa has had in place a retailer’s incentive for blended fuel which has been modified over time. For 2013 through 2017, retailers earn $0.045 per gallon of B5. Iowa also has a biomass-based diesel production incentive that provides $0.02 per gallon of production capped after the first 25 million gallons per production plant. Iowa recently enacted an increase in its excise tax on fuel, which is three cents per gallon less for B11 or higher blends than the diesel fuel tax. In Texas, the biomass-based diesel portion of biomass-based diesel blends are exempt from state excise tax, which results in a $0.20 per gallon incentive for B100.
Currently, Minnesota law requires a B5 biodiesel blend throughout the entire year. In 2014, the law required the state to increase blends to a B10 blend in the summer months. Oregon has implemented a B5 biodiesel blend requirement. New Mexico, Pennsylvania and Washington have all adopted legislation requiring biomass-based diesel blends beginning at B2 (and B5 in New Mexico) with incremental increases, provided certain feedstock or production minimums are met. Several northeast states, including Connecticut and Vermont, have adopted legislation requiring biomass-based diesel blends in home heating oil. In October 2016, the City of New York has adopted legislation requiring biomass-based diesel blends at a 5% rate for heating oil starting on October 1, 2017 and the blend level then moves to 10% in 2025, 15% in 2030 and 20% in 2034. In addition, Oregon and Washington State have been in the process of developing and implementing their own low carbon fuel programs. Oregon is currently engaged in the rulemaking process.
Although we believe that state requirements for the use of biofuels increase demand for our biomass-based diesel within such states, they may not increase overall demand in excess of RFS2 requirements. Rather, existing demand for our biofuel from
7
Obligated Parties in connection with federal requirements may shift to states that have use requirements or tax incentive programs.
Environmental Matters
Our manufacturing facilities, like other fuel and chemical production facilities, are subject to various federal, state and local environmental laws and regulations, including those relating to the discharge of materials into the air, water and ground; the generation, storage, handling, use, transportation and disposal of hazardous materials; ecological and natural resources; and the health and safety of our employees, contractors and the public. These laws and regulations require us to obtain and comply with numerous environmental permits to construct and operate each facility. They can require expensive pollution control equipment or operational changes to limit actual or potential impacts to human health and the environment. A violation of these laws, regulations or permit conditions could result in substantial fines, natural resource damage, criminal sanctions, permit revocations and or facility shutdowns. We do not currently have any environmental proceedings either pending or threatened against our facilities that would materially affect our business or financial condition. Furthermore, we do not anticipate a material adverse effect on our business or financial condition as a result of our efforts to comply with these requirements as presently in effect.
History
Our predecessor, REG Biofuels, LLC, formerly named REG Biofuels Inc., which was formerly named Renewable Energy Group, Inc., was formed under the laws of the State of Delaware in August 2006 upon acquiring the assets and operations of the biodiesel division of West Central Cooperative, or West Central, and two of West Central’s affiliated companies, InterWest, L.C. and REG, LLC. Set forth below is a summary of the significant events of our company since June 2008.
8
Date | Events | Description | ||
June 2008 | Houston facility | We acquired our Houston facility from U.S. Biodiesel Group, Inc., or USBG, through a transaction which included an equity investment in us by USBG. | ||
February through April 2010 | Danville, Newton and Seneca facilities | We acquired our Danville facility by merger from Blackhawk Biofuels, LLC. We acquired our Newton Facility, through the purchase of substantially all of the assets and liabilities of Central Iowa Energy, LLC. We closed a transaction in which we agreed to lease and operate the Seneca facility and certain related assets. | ||
July 2010 | Tellurian Biodiesel, Inc. and American BDF, LLC | We acquired certain assets of Tellurian Biodiesel, Inc., or Tellurian, and American BDF, LLC, or ABDF. Tellurian was a California-based biodiesel company and marketer. ABDF was a joint venture owned by Golden State Service Industries, Restaurant Technologies, Inc., or RTI, and Tellurian. The purchase connects RTI’s national used cooking oil collection system with our national network of biodiesel manufacturing facilities. | ||
September 2010 | Clovis facility | We acquired for stock the partially constructed Clovis facility. | ||
July 2011 | Albert Lea facility | We acquired for stock all the assets and certain liabilities of SoyMor cooperative and SoyMor Biodiesel, LLC. | ||
January 2012 | REG IPO | We completed our initial public offering in which we sold 6.8 million shares of our Common Stock at a price to the public of $10.00 per share. | ||
January 2012 | Seneca facility | We exercised an option to purchase our Seneca facility, which we previously operated under lease. | ||
October 2012 | New Boston facility | We acquired substantially all the assets of North Texas Bio Energy, LLC, or NTBE, including a 15 mmgy nameplate capacity biorefinery in New Boston, Texas. | ||
November 2012 | Atlanta facility | We acquired substantially all the assets of BullDog Biodiesel, LLC, or BullDog. | ||
July 2013 | Mason City facility | We acquired substantially all of the assets of Soy Energy, LLC's, or the Soy Energy Assets. The Soy Energy Assets consisted of a 30 mmgy nameplate capacity biodiesel facility and related assets located in Mason City, Iowa. We began producing biodiesel at this facility on October 1, 2013. | ||
January 2014 | LS9 | We acquired substantially all of the assets and liabilities of LS9, a development stage company focused on the use of proprietary technologies to make renewable chemicals and other products. | ||
June 2014 | Synthetic Fuels and Geismar facility | We acquired substantially all the assets of Syntroleum, which consisted of a 50% limited liability company membership interest in Dynamic Fuels, a 75 mmgy renewable hydrocarbon diesel production facility in Geismar, LA. Subsequently on June 6, 2014, we acquired the remaining 50% ownership interest in Dynamic Fuels from Tyson Foods. At closing, we renamed Dynamic Fuels, REG Geismar, LLC or REG Geismar. | ||
December 2014 | Petrotec AG | We acquired 69% equity ownership in Petrotec AG from its majority shareholder. As of December 31, 2016, we owned approximately 91% of Petrotec's shares. On January 2, 2017, we completed the acquisition of the remaining minority interest in Petrotec and own 100% of the equity in Petrotec. | ||
August 2015 | Grays Harbor facility | We acquired substantially all of the assets of Imperium Renewables, Inc., or Imperium, including a 100 mmgy nameplate biorefinery and terminal at the Port of Grays Harbor, Washington. | ||
March 2016 | Madison facility | We acquired fixed assets and inventory from Sanimax Energy, including the 20 mmgy nameplate capacity biomass-based diesel refinery in DeForest, Wisconsin. | ||
Employees
As of December 31, 2016, we had 703 full-time employees. None of our employees are represented by a labor organization or under any collective bargaining agreements. We consider our relationship with our employees to be good.
Intellectual Property
We own a significant number of U.S. and international patents and expect to file additional patent applications as we continue to pursue technological innovations. We have also developed trade secrets, and have licensed intellectual property related to our biomass-based diesel and industrial biotechnology businesses. We have developed a patented technology that uses microbes to convert sugars to biodiesel in an one-step fermentation process similar to ethanol manufacturing. Some of the patents issued to us do not expire until 2034 and additional patent applications in prosecution if issued will extend beyond 2034.
Customer concentration
Our sales to one customer, Pilot Travel Centers LLC, or Pilot, were $144.8 million, $114.0 million and $231.8 million, representing approximately 8%, 8% and 18% of our total revenues for 2016, 2015, and 2014, respectively. Our revenues from
9
Pilot generally do not directly include the RINs associated with the gallons of biomass-based diesel sold. The value of those RINs represented approximately an additional 9% and 13% of our total sales in 2016 and 2015, respectively based on the OPIS average RIN price for the year.
Research and development
We devote considerable resources to our research and development programs. Our biomass-based diesel research and development programs have been primarily targeted towards improving the quality and efficiency of the biomass-based diesel production process and developing applications for co-products. Our development stage industrial biotechnology business conducts research and development involving the production of renewable chemicals, additional advanced biofuels and other products from our proprietary microbial fermentation process. In January 2016, ExxonMobil Research and Engineering Company and REG Life Sciences commenced a joint development collaboration to develop technology to produce biodiesel by fermenting renewable cellulosic sugars from sources such as agricultural waste. In October 2016, the Company delivered its first commercial product, a specialty fatty acid. REG developed, produced and delivered approximately one metric ton of the renewable, multi-functional chemical to Aroma Chemical Services International, a leading specialty manufacturer and supplier of flavor and fragrance ingredients. Fatty acids are one of three product areas REG Life Sciences has focused on, along with esters and alcohols.
We expect our research and development expense to decrease in future periods as the business unit generates collaboration revenue. In November 2016, we commenced a strategic review of the life sciences business. We incurred research and development expense of $18.2 million, $16.9 million, and $12.4 million for the years ended December 31, 2016, 2015 and 2014, respectively.
Executive Officers of the Registrant
Daniel J. Oh, age 52, has served as our Chief Executive Officer and as a Director since September 2011 and President since April 2009. Mr. Oh served as our Chief Operating Officer from June 2007 to September 2011, our Chief Financial Officer and Executive Vice President from June 2006 to June 2007 and as Secretary from August 2006 until March 2009. From May 2004 to May 2006, Mr. Oh served at Agri Business Group, Inc., or ABG, an agribusiness management consulting firm, including as Associate Director, Director and Vice President. Prior to joining ABG, Mr. Oh served in several different positions, including Senior Financial Analyst, Financial Team Leader and Manager, in the Corporate Finance and Investment Banking area of the Corporate Strategy and Business Development Group at Eli Lilly and Company, a global pharmaceutical company, from August 2001 to May 2004. From 2000 to August 2001, Mr. Oh served as a consultant with McKinsey & Company, a leading consulting firm, where he focused on the pharmaceutical industry. From 1987 to 1998, Mr. Oh served as an officer in the United States Army, earning the rank of Major. Mr. Oh holds an M.B.A. from the University of Chicago with concentrations in finance, accounting and strategic management as well as a B.S. with a concentration in economics from the United States Military Academy. Mr. Oh serves as a director of Waste Resource Management, Inc. Mr. Oh’s employment agreement with us provides that he will serve as a director.
Chad Stone, age 47, has served as our Chief Financial Officer since August 2009. Prior to joining us from October 2007 to May 2009, he was a Director at Protiviti Inc., a global business consulting and internal audit firm. From August 1997 to September 2007, Mr. Stone served as Director with PricewaterhouseCoopers and worked at Arthur Andersen from July 1992 to August 1997, departing as a manager. Mr. Stone has served on executive Board of the Iowa Biodiesel Board since 2011 and was named chair in September 2014. In October 2015, Mr. Stone began serving on the University of Iowa School of Management's Advisory Committee. In November 2015, Mr. Stone was elected to the Governing Board of the National Biodiesel Board. Mr. Stone has over 20 years of experience in leading financial reporting, strategy, policy and compliance. Mr. Stone holds an M.B.A. with concentrations in finance, economics and accounting from the University of Chicago, Graduate School of Business and a B.B.A in Accounting from the University of Iowa. He is also a Certified Public Accountant.
Brad Albin, age 54, has served as our Vice President, Manufacturing since February 2008. Mr. Albin also served as Vice President of Construction Services from April 2007 through February 2008. From September 2006 through April 2007, Mr. Albin served as Director, Construction. Prior to joining us, Mr. Albin served as General Manager for West Central, one of our predecessors from July 2006 through September 2006. From November 2002 to January 2006, Mr. Albin served as Executive Director of Operations for Material Sciences Corporation, where he directed multi-plant operations that served the automotive and global appliance industries. From 1996 to 2002, Mr. Albin was the Vice President of Operations for Griffin Industries. Mr. Albin has over 25 years of experience in executive operations positions in multi-feedstock biomass-based diesel, chemical, food and automotive supplier companies, such as The Monsanto Company, The NutraSweet Company and Griffin Industries. Mr. Albin was a charter member of the National Biodiesel Accreditation Committee. Mr. Albin serves on the board of the Iowa Renewable Fuels Association and was the President in 2012, as well as, Vice President in 2011. In November 2014, Mr. Albin completed the Advanced Management Program from the University of Chicago Booth School of Business and he holds a B.S. in Chemistry from Eastern Illinois University.
10
Gary Haer, age 63, has served as our Vice President, Sales and Marketing since we commenced operations in August 2006. From October 1998 to August 2006, Mr. Haer served as the National Sales and Marketing Manager for biodiesel for West Central and was responsible for developing the marketing and distribution infrastructure for biomass-based diesel sales in the United States. Mr. Haer has over 15 years of experience in the biomass-based diesel industry. Mr. Haer has been elected to various officer positions of the National Biodiesel Board during his tenure from 1998 to 2015. Mr. Haer holds a M.B.A. from Baker University and a B.S. in accounting from Northwest Missouri State University.
Available Information
Our internet address is http://www.regi.com. Through that address, our annual report on Form 10-K, quarterly reports on Form 10-Q, current reports on Form 8-K, and amendments to those reports are available free of charge as soon as reasonably practicable after they are filed with the United States Securities and Exchange Commission. The information contained on our website is not included in, or incorporated by reference into, this annual report on Form 10-K.
ITEM 1A. | Risk Factors |
Our business, financial condition, results of operations and liquidity are subject to various risks and uncertainties, including those described below. As a result, the trading price of our common stock could decline.
RISKS RELATED TO FEDERAL AND STATE INCENTIVES
RFS2: The elimination or abatement of federal governmental requirements for the use of biofuels could have a material adverse effect on our revenues and operating margins.
The biomass-based diesel industry relies substantially on federal programs requiring the consumption of biofuels. Biomass-based diesel has historically been more expensive to produce than petroleum-based diesel fuel, and governmental programs support a market for biomass-based diesel that might not otherwise exist.
We believe the Renewable Fuel Standard Program is the most important of these government programs in the United States. Under this program, the EPA promulgated a regulation commonly known as RFS2, which became effective on July 1, 2010 and applies through 2022. RFS2 requires consumption of biomass-based diesel fuel, including biodiesel and renewable hydrocarbon diesel, at specified volumes, known as renewable volume obligations, or RVO.
Under RFS2, the EPA is required to set the RVO annually based on a variety of considerations. Over the past several years, the EPA has set the minimum annual consumption volume at increasing levels from 1.28 billion gallons in 2013 to 1.90 billion gallons in 2016. For 2017, the EPA set the minimum annual consumption volume at 2.00 billion gallons and has set 2.10 billion gallons as the minimum annual consumption volume target for 2018.
We believe that much of the increase in demand for our biomass-based diesel since July 2010 is attributable to, and accelerated by, the existence and implementation of RFS2. In addition, we believe that biomass-based diesel prices have received significant support from RFS2 since July 2010.
State requirements and incentives for the use of biofuels increase demand for our biomass-based diesel within such states, but such state requirements and incentives do not increase overall demand for biofuels in excess of RFS2 requirements. Rather, we believe state requirements and tax incentives influence where petroleum refiners and petroleum fuel importers choose to consume the volume requirements established by the EPA under RFS2.
The United States Congress could repeal, curtail or otherwise change RFS2 in a manner adverse to us. Similarly, the EPA could curtail or otherwise change RFS2 in a manner adverse to us, including reducing the RVO to the statutory minimum level of 1 billion gallons. The petroleum industry has generally been opposed to RFS2 and is expected to continue to press for changes that eliminate or reduce its impact. We cannot predict what changes will be instituted by the new administration or the impact, if any, of these changes to our business. It is possible, however, that future government proposals to reduce or eliminate budgetary deficits may include reduced allocations to the EPA and other agencies, or abolish such agencies and any programs thereunder entirely and may adversely affect our business and other businesses within our industry. New legislation, or a significant change in rules, regulations, directives or standards could reduce demand for our products and services, and/or increase expenses, which could have a material adverse effect on our business, financial condition and results of operations.
Any repeal or reduction in the RFS2 requirements or reinterpretation of RFS2 resulting in our biomass-based diesel failing to qualify as a required fuel would materially decrease the demand for and price of our biomass-based diesel, which would materially and adversely affect our revenues and cash flows.
11
Loss of or reductions in tax incentives for biomass-based diesel production or consumption may have a material adverse effect on industry revenues and operating margins.
Federal and state tax incentives have historically aided the biomass-based diesel industry. Prior to the 2010 implementation of RFS2, the biomass-based diesel industry relied principally on tax incentives to make the price of biomass-based diesel more cost competitive with the price of petroleum-based diesel fuel to the end user.
Federal
Biodiesel Tax Credit
The most significant tax incentive program has been the federal biodiesel mixture excise tax credit, referred to as the Biodiesel Tax Credit or BTC. Under the BTC, the entity to first blend pure biomass-based fuel, or B100, with petroleum-based diesel fuel receives a $1.00-per-gallon refundable tax credit.
The BTC was established on January 1, 2005 and has lapsed and been reinstated retroactively and prospectively several times. Most recently, the BTC was reinstated on December 18, 2015, covering 2015 retroactively and 2016 prospectively. But it lapsed again on December 31, 2016, and we are currently operating without the benefit of the BTC. In the past when the BTC has lapsed, we and others in the industry have operated without any assurance that a reinstatement would cover the lapsed period retroactively. There is no assurance that the BTC will be reinstated or, if reinstated, that its application will be retroactive, prospective or both.
Unlike RFS2, the BTC has a direct effect on federal government spending and could be changed or eliminated as a result of changes in the federal budget policy. We cannot predict what action, if any, Congress or the new administration may take with respect to the BTC or whether such action would apply retroactively or prospectively. If the BTC is not reinstated, demand for our biomass-based diesel and the price we are able to charge for our product may decline significantly, harming revenues and profitability.
In addition, uncertainty regarding the extension or reinstatement of the BTC has caused, and may in the future cause, fluctuations in our operating results. Historically, sales have increased shortly before the BTC lapses and then decreased shortly thereafter. For example, when the BTC was scheduled to expire on December 31, 2011, production and sales industry-wide accelerated in the fourth quarter of 2011, but declined in the first quarter of 2012, after the BTC lapsed. We believe reduced demand in the first quarters of 2014 and 2015 also resulted from the lapsing of the BTC at the end of 2013 and 2014, respectively. Similarly, we believe that the lapsing of the BTC on December 31, 2016 caused an acceleration of revenues in the fourth quarter of 2016, which is likely to result in a decline in demand during the first quarter of 2017.
State
Several states have enacted tax incentives for the use of biodiesel and/or biomass-based diesel. For example, we derive a significant portion of our revenues from operations in the State of Illinois. Illinois has a generally applicable 6.25% sales tax, but offers an exemption from this tax for a blend of fuel that consists of 11% biodiesel, or B11, which is set to expire December 31, 2018.
State budget or other considerations could cause the modification or elimination of the tax incentive programs of Illinois and other states. The abatement or elimination of such incentives could materially and adversely affect our revenues and profitability.
Increased industry-wide production of biomass-based diesel, including as a result of existing excess production capacity, could harm our financial results.
If the volume of excess biomass-based diesel RINs exceeds the volume mandated for use under RFS2, the demand for and price of our biomass-based diesel, and biomass-based diesel RINs may be reduced, which could adversely affect our revenues and cash flows.
According to the National Biodiesel Board, or NBB, as of May 6, 2016, 3.0 billion gallons per year of biodiesel production capacity in the United States was registered under the RFS2 program by NBB members. In addition to this amount, several hundred million more gallons of U.S. based biomass-based diesel production capacity was registered by non-NBB members and another 4.5 billion gallons of biomass-based diesel production was registered by foreign producers. The annual production capacity of existing plants and plants under construction far exceeds both historic consumption of biomass-based diesel in the United States and required consumption under RFS2. If this excess production capacity was fully utilized for the U.S. market, it would increase competition for our feedstocks, increase the volume of biomass-based diesel on the market and may reduce biomass-based diesel gross margins, harming our revenues and profitability.
Increased biomass-based diesel production may result in the generation of RINs in excess of the volume of RINs mandated for consumption under RFS2. RIN prices can be expected to decrease as the calendar year progresses if the RIN
12
market is oversupplied compared to that year’s RVO. For example, in 2012, which had a RVO for biomass-based diesel of one billion gallons, biomass-based diesel RIN prices, as reported by OPIS, began to decrease in September when biomass-based diesel RIN generation neared the equivalent of 900 million gallons, as reported by EMTS. Similarly, in September of 2013 when biomass-based diesel RIN generation reached approximately 960 million gallons compared to a 2013 biomass-based diesel RVO of 1.28 billion gallons, biomass-based diesel RIN prices, as reported by OPIS, began to decline.
RISKS RELATED TO OUR BUSINESS OPERATIONS AND THE MARKETS IN WHICH WE OPERATE
Our gross margins are dependent on the spread between biomass-based diesel prices and feedstock costs, each of which are volatile and can cause our results of operations to fluctuate substantially.
Biomass-based diesel has traditionally been marketed primarily as an additive or alternative to petroleum-based diesel fuel, and, as a result, biomass-based diesel prices have been influenced by the price of petroleum-based diesel fuel, adjusted for government incentives supporting renewable fuels, rather than biomass-based diesel production costs. If there is a lack of close correlation between production costs and biomass-based diesel prices, we may be unable to pass increased production costs on to our customers in the form of higher prices. If there is a decrease in the spread between biomass-based diesel prices and feedstock costs, whether as a result of an increase in feedstock prices or a result of a reduction in biomass-based diesel and RIN prices, our gross margins, cash flow and results of operations would be adversely affected.
Energy prices, particularly the market price for crude oil, are volatile. The average price at which we sold our biomass-based diesel increased from $2.97 per gallon in 2015 to $3.17 per gallon in 2016. Petroleum prices are volatile due to global factors, such as the impact of wars, political uprisings, new extraction technologies and techniques, OPEC production quotas, worldwide economic conditions, changes in refining capacity and natural disasters.
In addition, an element of the price of biomass-based diesel that we produce is the value of the associated RINs. RIN prices as reported by OPIS trended higher throughout 2016, starting the year at $0.75 per RIN, climbing to a high of $1.26 in December. RIN prices ended 2016 at $1.05 per RIN. In other years there was more significant volatility in RIN prices. In 2013, RIN prices decreased sharply from $1.09 per RIN on July 1, 2013 to $0.35 per RIN on December 31, 2013. Reductions in RIN values, such as those experienced in prior years, may have a material adverse effect on our revenues and profits as they directly reduce the price we are able to charge for our biomass-based diesel.
A decrease in the availability or an increase in the price, of feedstocks may have a material adverse effect on our financial condition and operating results. The price and availability of feedstocks and other raw materials may be influenced by general economic, market and regulatory factors. These factors include weather conditions, farming decisions, government policies and subsidies with respect to agriculture and international trade and global supply and demand. During periods when the BTC has lapsed, biomass-based diesel producers may elect to continue purchasing feedstock and producing biomass-based diesel at negative margins under the assumption the BTC will be retroactively reinstated, and consequently, the price of feedstocks may not decrease to a level proportionate to current operating margins. The development of alternative fuels and renewable chemicals also puts pressure on feedstock supply and availability to the biomass-based diesel industry. The biomass-based diesel industry may have difficulty in procuring feedstocks at economical prices if these emerging technologies compete with biomass-based diesel for feedstocks, are more profitable or have greater governmental support than biomass-based diesel.
At elevated feedstock price levels, certain feedstocks may be uneconomical to use, as we may be unable to pass feedstock cost increases on to our customers. In addition, we generally are unable to enter into forward contracts at fixed prices for some of our feedstocks, such as animal fat, because markets for these feedstocks are less developed.
Historically, the spread between biomass-based diesel prices and feedstock costs has varied significantly. Although actual yields vary depending on the feedstock quality, the average monthly spread between the price per gallon of 100% pure biodiesel, or B100, as reported by The Jacobsen Publishing Company, and the price per gallon for the amount of choice white grease, a common inedible animal fat used by us to make biomass-based diesel, was $0.92 in 2014, $1.09 in 2015 and $1.28 in 2016, assuming eight pounds of choice white grease yields one gallon of biomass-based diesel. The average monthly spread for the amount of crude soybean oil required to produce one gallon of biomass-based, based on the nearby futures contract as reported on the Chicago Board of Trade, was $0.65 in 2014, $0.58 in 2015 and $0.73 in 2016, assuming 7.5 pounds of soybean oil yields one gallon of biomass-based. For the periods from 2014 to 2016, approximately 85%, 85% and 72%, respectively, of our annual total feedstock usage was inedible corn oil, used cooking oil or inedible animal fat, and approximately 15%, 15% and 28%, respectively, was virgin vegetable oils.
Risk management transactions could significantly increase our operating costs and may not be effective.
In an attempt to partially offset the effects of volatile feedstock costs and biomass-based diesel fuel prices, we enter into contracts that establish market positions in feedstocks, such as inedible corn oil, used cooking oil, inedible animal fats and soybean oil, along with related commodities, such as heating oil and ultra-low sulfur diesel, or ULSD. The financial impact of
13
such market positions depends on commodity prices at the time that we are required to perform our obligations under these contracts as well as the cumulative sum of the obligations we assume under these contracts.
Risk management activities can themselves result in losses when a position is purchased in a declining market or a position is sold in a rising market. Risk management arrangements expose us to the risk of financial loss in situations where the counterparty defaults on its contract or, in the case of exchange-traded or over-the-counter futures or options contracts, where there is a change in the expected differential between the underlying price in the contract and the actual prices paid or received by us. Changes in the value of these futures instruments are recognized in current income and may result in margin calls. We may also vary the amount of risk management strategies we undertake, or we may choose not to engage in risk management transactions at all. Our results of operation may be negatively impacted if we are not able to manage our risk management strategy effectively.
One customer accounted for a meaningful percentage of revenues and a loss of this customer could have an adverse impact on our total revenues.
One customer, Pilot Travel Centers LLC, or Pilot, accounted for 8%, 8% and 18% of our revenues in 2016, 2015 and 2014, respectively. Our revenues from Pilot generally do not include the RINs associated with the gallons of biomass-based diesel sold to Pilot. The value of those RINs represented approximately an additional 9% and 13% of our total sales in 2016 and 2015, respectively, based on the OPIS average RIN price for the year. In the event we lose Pilot as a customer or Pilot significantly reduces the volume of biomass-based diesel bought from us, it could be difficult to replace the lost revenues from biomass-based diesel and RINs, and our profitability and cash flow could be materially harmed. We do not have a long term contract with Pilot that ensures a continuing level of business from Pilot.
Our facilities and our customers' facilities are subject to risks associated with fire, explosions, leaks, and other natural disasters which may disrupt our business and increase costs and liabilities.
Because biomass-based diesel and some of its inputs and outputs are combustible and/or flammable, a leak, fire or explosion may occur at a plant or customer’s facility which could result in damage to the plant and nearby properties, injury to employees and others, and interruption of operations. For example, in April 2015 and again in September 2015, we experienced fires at our Geismar facility. In the April fire, two employees were injured. In the September fire, one employee and three contractors were injured. Multiple parties and our subsidiary have been named as a defendant in lawsuits filed by contractors injured in the September fire and these suits allege that injuries resulted from, among other things, our negligence. We may be subject to additional litigation in connection with these incidents. In addition, the Occupational Safety and Health Administration, or OSHA, has issued seven "serious" citations to the Geismar facility, which has implemented abatement actions in accordance with those citations. If OSHA becomes dissatisfied with the abatement implementation, there is a possibility that it could impose additional citations or fines.
As a result of the fires, our Geismar facility was shut down from April 2015 through early March 2016 while repairs and upgrades were completed. While we expect a significant portion of the costs associated with the Geismar fires will be covered by insurance, our insurance company may dispute coverage and we may be subject to costs and penalties that are not covered by insurance. Accordingly, as a result of these two incidents at the Geismar facility, we may incur significant additional costs, including potential liability for damages or injuries, legal expenses and loss of profit, which could seriously harm our results of operations and financial condition.
A majority of our facilities are also located in the Midwest, which is subject to tornado activity. REG Life Sciences' research and development center is in South San Francisco, California, which is subject to earthquakes. In addition, our Houston and Geismar facilities, due to their Gulf Coast locations, are vulnerable to hurricanes and flooding, which may cause plant damage, injury to employees and others and interruption of operations. For example, in August 2016 we experienced reduced operating days at our Geismar facility as a result of local area flooding. Each of our plants could incur damage from other natural disasters as well. If any of the foregoing events occur, we may incur significant additional costs including, among other things, loss of profits due to unplanned temporary or permanent shutdowns of our facilities, cleanup costs, liability for damages or injuries, legal expenses and reconstruction expenses, which would harm our results of operations and financial condition.
Our insurance may not protect us against our business and operating risks.
We maintain insurance for some, but not all, of the potential risks and liabilities associated with our business. For some risks, we may not obtain insurance if we believe the cost of available insurance is excessive relative to the risks presented. As a result of market conditions, premiums and deductibles for certain insurance policies can increase substantially and, in some instances, certain insurance policies may become unavailable or available only for reduced amounts of coverage. As a result,
14
we may not be able to renew our existing insurance policies or procure other desirable insurance on commercially reasonable terms, if at all. Although we intend to maintain insurance at levels we believe are appropriate for our business and consistent with industry practice, we will not be fully insured against all risks. In addition, pollution, environmental risks and the risk of natural disasters generally are not fully insurable. Losses and liabilities from uninsured and underinsured events and delay in the payment of insurance proceeds could have a material adverse effect on our financial condition and results of operations.
Our business is primarily dependent upon two similar products. As a consequence, we may not be able to adapt to changing market conditions or endure any decline in the biomass-based diesel industry.
Our revenues are currently generated almost entirely from the production and sale of biodiesel and renewable hydrocarbon diesel, collectively referred to as biomass-based diesel. Our reliance on biomass-based diesel means that we may not be able to adapt to changing market conditions or to withstand any significant decline in the size or profitability of the biomass-based diesel industry. Historically we were required to periodically idle our plants, particularly during the first quarter of the year due to insufficient demand at profitable price points. If we are required to idle our biomass-based diesel plants in the future or are unable to adapt to changing market conditions, our revenues and results of operations may be materially harmed.
We face competition from imported biodiesel and renewable hydrocarbon diesel, which may reduce demand for biomass-based diesel produced by us and cause our revenues and profits to decline.
Biodiesel and renewable hydrocarbon diesel imports into the United States have increased significantly and compete with biodiesel and renewable hydrocarbon diesel produced in the United States. The imported fuels may benefit from production incentives or other financial incentives in foreign countries that offset some of their production costs and enable importers to profitably sell biodiesel or renewable hydrocarbon diesel in the United States at lower prices than United States-based biodiesel and renewable hydrocarbon diesel producers. Under RFS2, imported biodiesel and renewable hydrocarbon diesel is eligible and, therefore, competes to meet the volumetric requirements for biomass-based diesel and advanced biofuels. If imports continue to increase, this could make it more challenging for us to market or sell biomass-based diesel in the United States, which would have a material adverse effect on our revenues. In January 2015, the EPA announced the approval for Argentinian biodiesel made from soybean oil to generate RINs. Imported biomass-based diesel that does not qualify under RFS2, also competes in jurisdictions where there are biomass-based diesel blending requirements.
Technological advances and changes in production methods in the biomass-based diesel industry and renewable chemical industry could render our plants obsolete and adversely affect our ability to compete.
It is expected that technological advances in biomass-based diesel production methods will continue to occur and new technologies for biomass-based diesel production may develop. Advances in the process of converting oils and fats into biodiesel and renewable hydrocarbon diesel could allow our competitors to produce biomass-based diesel faster and more efficiently and at a substantially lower cost. In addition, we currently produce biomass-based diesel to conform to or exceed standards established by the American Society for Testing and Materials ("ASTM"). ASTM standards for biomass-based diesel and biomass-based diesel blends may be modified in response to new technologies from the industries involved with diesel fuel.
New standards or production technologies may require us to make additional capital investments in, or modify, plant operations to meet these standards. If we are unable to adapt or incorporate technological advances into our operations, our production facilities could become less competitive or obsolete. Further, it may be necessary for us to make significant expenditures to acquire any new technology and retrofit our plants in order to incorporate new technologies and remain competitive. In order to execute our strategy to expand into the production of renewable chemicals, additional advanced biofuels, next generation feedstocks and related renewable products, we may need to acquire licenses or other rights to technology from third parties. We can provide no assurance that we will be able to obtain such licenses or rights on favorable terms. If we are unable to obtain, implement or finance new technologies, our production facilities could be less efficient than our competitors, and our ability to sell biomass-based diesel may be harmed, negatively impacting our revenues and profitability.
Our intellectual property is integral to our business. If we are unable to protect our intellectual property, or others assert that our operations violate their intellectual property, our business could be adversely affected.
Our success depends in part upon our ability to protect and prevent others from using our intellectual property. Failure to obtain or maintain adequate intellectual property protection could adversely affect our competitive business position. We rely on a combination of intellectual property rights, including patents, copyrights, trademarks and trade secrets in the United States and in select foreign countries. Effective patent, copyright, trademark and trade secret protection may be unavailable, limited or not applied for in some countries.
15
We rely in part on trade secret protection to protect our confidential and proprietary information and processes. However, trade secrets are difficult to protect. We have taken measures to protect our trade secrets and proprietary information, but these measures may not be effective. For example, we require new employees and consultants to execute confidentiality agreements upon the commencement of their employment or consulting arrangement with us. These agreements generally require that all confidential information developed by the individual or made known to the individual by us during the course of the individual’s relationship with us be kept confidential and not disclosed to third parties. These agreements also generally provide that knowhow and inventions conceived by the individual in the course of rendering services to us are our exclusive property. Nevertheless, these agreements may be breached, or may not be enforceable, and our proprietary information may be disclosed. Despite the existence of these agreements, third parties may independently develop substantially equivalent proprietary information and techniques.
It may be difficult for us to protect and enforce our intellectual property. Costly and time-consuming litigation could be necessary to enforce and determine the scope of our proprietary rights. If we pursue litigation to assert our intellectual property rights, an adverse judicial decision in any legal action could limit our ability to assert our intellectual property rights, limit our ability to develop new products, limit the value of our technology or otherwise negatively impact our business, financial condition and results of operations.
A competitor could seek to enforce intellectual property claims against us. Defending intellectual property rights claims asserted against us, regardless of merit, could be time-consuming, expensive to litigate or settle, divert management resources and attention and force us to acquire intellectual property rights and licenses, which may involve substantial royalty payments. Further, a party making such a claim, if successful, could secure a judgment that requires us to pay substantial damages.
Increases in our transportation costs or disruptions in our transportation services could have a material adverse effect on our business.
Our business depends on transportation services to deliver raw materials to us and finished products to our customers. The costs of these transportation services are affected by the volatility in fuel prices or other factors. For example, from January 2015 to mid-2016 we saw huge drops in diesel prices in the US. However, the last half of 2016 diesel started to trend upward. These movements can be drastic and unpredictable. US oil production in the Bakkens drives the tank car business. If the production from this area increases, the demand for railcars increase and will significantly increase rail car prices. We have not been able in the past, and may not be able in the future, to pass along part or all of any of these price increases to customers. If we continue to be unable to increase our prices as a result of increased fuel costs charged to us by transportation providers, our gross margins may be materially adversely affected.
If any transportation providers fail to deliver raw materials to us in a timely manner, we may be unable to manufacture products on a timely basis. Shipments of products and raw materials may be delayed due to weather conditions, strikes or other events. Any failure of a third-party transportation provider to deliver raw materials or products in a timely manner could harm our reputation, negatively affect our customer relationships and have a material adverse effect on our business, financial condition and results of operations.
We are dependent upon our key management personnel and other personnel whereby the loss of any of these persons could adversely affect our results of operations.
Our success depends on the abilities, expertise, judgment, discretion, integrity and good faith of our management and employees to manage the business and respond to economic, market and other conditions. We are highly dependent upon key members of our relatively small management team and employee base that possess unique technical skills for the execution of our business plan. There can be no assurance that any individual will continue in his or her capacity for any particular period of time or that replacement personnel with comparable skills could be found. The inability to retain our management team and employee base or attract suitably qualified replacements and additional staff could adversely affect our business. The loss of employees could delay or prevent the achievement of our business objectives and have a material adverse effect upon our results of operations and financial position.
We have not generated significant revenues from sales of renewable chemicals to date and we expect to incur additional costs and face significant challenges to develop this business.
In January 2014, we entered the market for renewable chemicals through the acquisition of a development stage company. To date, we have incurred significant costs and have not generated significant revenues from this business. In order to generate revenue from our renewable chemicals, there must be a willing market for the products and we must be able to produce sufficient quantities of our products, which we have not done to date and would not be able to do on our own without incurring significant capital expenditure to build a commercial scale production facility. There are multiple options for how we could
16
pursue generating revenue from our renewable chemicals business. Some options would require additional capital expenditures prior to generating revenue.
In this market, we would still be selling renewable chemicals as an alternative to chemicals currently in use, and in some cases the chemicals that we seek to replace have been used for many years. The potential customers for our renewable chemical products generally have well developed manufacturing processes and arrangements with suppliers of the chemical components of their products and may resist changing these processes and components. These potential customers frequently impose lengthy and complex product qualification procedures on their suppliers. Factors that these potential customers consider during the product qualification process include consumer preference, manufacturing considerations such as process changes and capital, other costs associated with transitioning to alternative components, supplier operating history, regulatory issues, product liability and other factors, many of which are unknown to, or not well understood by, us. Some of our products may also require regulatory registrations and approvals from governmental authorities. The requirements for obtaining regulatory registrations and approvals may change or may take longer than we anticipate. Satisfying these processes may take many months or years.
If we are unable to convince these potential customers that our products are comparable to the chemicals that they currently use, or that the use of our products produce benefits to them, we will not be successful in these markets and our business will be adversely affected. In addition, in contrast to the tax incentives relating to biofuels, tax credits and subsidies are not currently available in the United States for consumer products or chemical companies who use renewable chemical products. We do not expect meaningful revenue from our sale of renewable chemicals in the near term.
The evaluation of strategic alternatives for our life sciences unit may adversely affect our business and may not result in any specific action or transaction.
In November 2016, we announced that our board of directors had authorized a review of strategic alternatives for our life sciences business to enhance value for stockholders. There can be no assurance that this ongoing strategic review will result in any specific action or transaction or that any action taken or transaction we may enter into will prove to be beneficial to stockholders. In addition, the pendency of this strategic review exposes us to risks and uncertainties, including potential difficulties in retaining and attracting key life sciences employees during the review process, distraction of our management from other important business activities, and potential difficulties in establishing or maintaining relationships between this business unit and third parties, all of which could harm our business.
We may encounter difficulties in effectively integrating the businesses we acquire, including our international businesses where we have limited operating history.
We may face significant challenges in effectively integrating entities and businesses that we acquire, and we may not realize the benefits anticipated from such acquisitions. Achieving the anticipated benefits of our acquired businesses will depend in part upon whether we can integrate our businesses in an efficient and effective manner. Our integration of acquired businesses involves a number of risks, including:
• | difficulty in integrating the operations and personnel of the acquired company; |
• | difficulty in effectively integrating the acquired technologies, products or services with our current technologies, products or services; |
• | demands on management related to the increase in our size after the acquisition; |
• | the diversion of management’s attention from daily operations to the integration of acquired businesses and personnel; |
• | failure to achieve expected synergies and costs savings; |
• | difficulties in the assimilation and retention of employees; |
• | difficulties in the assimilation of different cultures and practices, as well as in the assimilation of broad and geographically dispersed personnel and operations; |
• | difficulties in the integration of departments, systems, including accounting systems, technologies, books and records and procedures, as well as in maintaining uniform standards and controls, including internal control over financial reporting, and related procedures and policies; |
• | incurring acquisition-related costs or amortization costs for acquired intangible assets that could impact our operating results; |
• | the need to fund significant working capital requirements of any acquired production facilities; |
• | potential failure of the due diligence processes to identify significant problems, liabilities or other shortcomings or challenges of an acquired company or technology, including but not limited to, issues with the acquired company’s intellectual property, product quality, environmental liabilities, data back-up and security, revenue recognition or other accounting practices, employee, customer or partner issues or legal and financial contingencies; |
17
• | exposure to litigation or other claims in connection with, or inheritance of claims or litigation risk as a result of, an acquisition, including but not limited to, claims from terminated employees, customers, former stockholders or other third parties; and |
• | incurring significant exit charges if products or services acquired in business combinations are unsuccessful. |
Our ability to recognize the benefit of our acquisition of Petrotec, a German biodiesel producer of which we acquired majority ownership during 2014 and full ownership in January 2017, or any other international operations we may invest in the future, will require the attention of management and is subject to a number of risks. We have no experience operating a biorefinery outside of the United States. The biodiesel market in Europe benefits from regulations that encourage the use of biodiesel. These regulations are subject to political and public opinion and may be changed. In addition, expanding our operations internationally subjects us to the following risks:
• | recruiting and retaining talented and capable management and employees in foreign countries; |
• | challenges caused by distance, language and cultural differences; |
• | protecting and enforcing our intellectual property rights; |
• | difficulties in the assimilation and retention of employees; |
• | the inability to extend proprietary rights in our technology into new jurisdictions; |
• | currency exchange rate fluctuations; |
• | general economic and political conditions in foreign jurisdictions; |
• | foreign tax consequences; |
• | foreign exchange controls or U.S. tax restrictions that might restrict or prevent us from repatriating income earned in countries outside the United States; |
• | political, economic and social instability; |
• | higher costs associated with doing business internationally; and |
• | export or import regulations as well as trade and tariff restrictions. |
Our failure to successfully manage and integrate our acquisitions could have an adverse effect on our operating results, ability to recognize international revenue, and our overall financial condition.
We incur significant expenses to maintain and upgrade our operating equipment and plants, and any interruption in the operation of our facilities may harm our operating performance.
We regularly incur significant expenses to maintain and upgrade our equipment and facilities. The machines and equipment that we use to produce our products are complex, have many parts and some are run on a continuous basis. We must perform routine maintenance on our equipment and will have to periodically replace a variety of parts such as motors, pumps, pipes and electrical parts. In addition, our facilities require periodic shutdowns to perform major maintenance and upgrades. These scheduled shutdowns of facilities result in decreased sales and increased costs in the periods in which a shutdown occurs and could result in unexpected operational issues in future periods as a result of changes to equipment and operational and mechanical processes made during the shutdown period.
Growth in the sale and distribution of biomass-based diesel is dependent on the expansion of related infrastructure which may not occur on a timely basis, if at all, and our operations could be adversely affected by infrastructure limitations or disruptions.
Growth in the biomass-based diesel industry depends on substantial development of infrastructure for the distribution of biodiesel. Substantial investment required for these infrastructure changes and expansions may not be made on a timely basis or at all. The scope and timing of any infrastructure expansion are generally beyond our control. Also, we compete with other biofuel companies for access to some of the key infrastructure components such as pipeline and terminal capacity. As a result, increased production of biomass-based diesel will increase the demand and competition for necessary infrastructure. Any delay or failure in expanding distribution infrastructure could hurt the demand for or prices of biomass-based diesel, impede delivery of our biomass-based diesel, and impose additional costs, each of which would have a material adverse effect on our results of operations and financial condition. Our business will be dependent on the continuing availability of infrastructure for the distribution of increasing volumes of biomass-based diesel and any infrastructure disruptions could materially harm our business.
Risks related to the potential permanent idling of our facilities.
We perform strategic reviews of our business, which may include evaluating each of our facilities to assess their viability and strategic benefits. As part of these reviews, we may idle--whether temporarily or permanently--development or operations of certain of our facilities in order to reduce participation in markets where we determine that our returns are not acceptable.
18
We have three partially constructed plants, one near New Orleans, Louisiana, one in Emporia, Kansas and one in Clovis, New Mexico. We also own one non-operational plant near Atlanta, Georgia. If we decide to permanently idle or abandon development of these facilities or any other facilities or assets, we are likely to incur significant cash expenses, as well as substantial non-cash charges for impairment of those assets. In the fourth quarter of 2016, we recorded an impairment charge of $15.6 million, reflecting the difference between the carrying amount associated with the partially constructed Emporia facility and the estimated salvage value due to competition from foreign, imported product and the probability of that project being completed in the near term is unlikely.
We operate in a highly competitive industry and competition in our industry would increase if new participants enter the biomass-based diesel business.
We operate in a very competitive environment. The biomass-based diesel industry is primarily comprised of smaller entities that engage exclusively in biodiesel production, large integrated agribusiness companies that produce biodiesel along with their soybean crush businesses and increasingly, integrated petroleum companies. We face competition for capital, labor, feedstocks and other resources from these companies. In the United States, we compete with soybean processors and refiners, including Archer-Daniels-Midland Company, Cargill, and Louis Dreyfus Commodities. In addition, petroleum refiners are increasingly entering into biomass-based diesel production. Such petroleum refiners include Neste Oil with approximately 882 million gallons of global renewable hydrocarbon diesel production capacity in Asia and Europe and Valero Energy Corporation with its Diamond Green joint venture that operates an approximate 160 million-gallon renewable hydrocarbon diesel plant. These and other competitors that are divisions of larger enterprises may have greater financial resources than we do.
Petroleum companies and diesel retailers form the primary distribution networks for marketing biomass-based diesel through blended petroleum-based diesel. If these companies increase their direct or indirect biomass-based diesel production, there will be less need to purchase biomass-based diesel from independent biomass-based diesel producers like us. Such a shift in the market would materially harm our operations, cash flows and financial position.
A volatile regulatory environment, lack of debt or equity investments and volatile biofuel prices and feedstock costs have likely contributed to the necessity of bankruptcy filings by biofuel producers. We may encounter new competition from buyers of distressed biodiesel properties that enter the industry at a lower cost than original plant investors or from competitors consolidating or otherwise growing. Our business has been, and in the future may be, negatively impacted by the industry conditions that influenced the bankruptcy proceedings of other biofuel producers. Our business and prospects may be significantly and adversely affected if we are unable to similarly increase our scale.
Our business is subject to seasonal fluctuations, which are likely to cause our revenues and operating results to fluctuate.
Our operating results are influenced by seasonal fluctuations in the price of and demand for biodiesel. Seasonal fluctuations may be based on both the weather and the status of both the BTC and RVO obligations. Demand may be higher in the quarters leading up to the expiration of the BTC as customers seek to purchase biodiesel when they can benefit from the agreed upon value sharing of the BTC with producers of biodiesel. Seasonal fluctuation also occurs in the colder months when historically there has been reduced demand for biodiesel in northern and eastern United States markets, which are the primary markets in which we currently operate.
Biodiesel typically has a higher cloud point than petroleum-based diesel. The cloud point is the temperature below which a fuel exhibits a noticeable cloudiness and eventually gels, leading to fuel handling and performance problems for customers and suppliers. Reduced demand in the winter for our higher cloud point biodiesel may result in excess supply of such higher cloud point biodiesel and lower prices for such higher cloud point biodiesel. Most of our production facilities are located in colder Midwestern states and our costs of shipping biodiesel to warmer climates generally increase in cold weather months.
The tendency of biodiesel to gel in colder weather may also result in long-term storage problems. In cold climates, fuel may need to be stored in a heated building or heated storage tanks, which result in higher storage costs. Higher cloud point biodiesel may have other performance problems, including the possibility of particulate formation above the cloud point which may result in increased expenses as we try to remedy these performance problems, including the costs of extra cold weather treatment additives. Remedying these performance problems may result in decreased yields, lower process throughput or both, as well as substantial capital costs. Any reduction in the demand for our biodiesel product, or the production capacity of our facilities will reduce our revenues and have an adverse effect on our cash flows and results of operations.
Failure to comply with governmental regulations, including EPA requirements relating to RFS2 and FDA requirements relating to the Food Safety Modernization Act, could result in the imposition of penalties, fines, or restrictions on our operations and remedial liabilities.
19
The biomass-based diesel industry is subject to extensive federal, state and local laws and regulations. Under certain environmental laws and regulations, we could be held strictly liable for the removal or remediation of previously released materials or property contamination regardless of whether we were responsible for the release or contamination, and regardless of whether current or prior operations were conducted consistent with accepted standards of practice. Many of our assets and plants were acquired from third parties and we may incur costs to remediate property contamination caused by previous owners. Compliance with these laws, regulations and obligations could require substantial capital expenditures. Failure to comply could result in the imposition of penalties, fines or restrictions on operations and remedial liabilities.
Changes in environmental laws and regulations occur frequently, and any changes that result in more stringent or costly waste handling, storage, transport, disposal or cleanup requirements could require us to make significant expenditures to attain and maintain compliance and may otherwise have a material adverse effect on our business in general and on our results of operations, competitive position or financial condition. We are unable to predict the effect of additional environmental laws and regulations which may be adopted in the future, including whether any such laws or regulations would significantly increase our cost of doing business or affect our operations in any area.
We are subject to various laws and regulations related to RFS2, most significantly regulations related to the generation and dissemination of RINs. These regulations are highly complex and continuously evolving, requiring us to periodically update our compliance systems. Recently, the EPA implemented a quality assurance program and regulations related to the generation and sale of biomass-based diesel RINs. Compliance with these or any new regulations or Obligated Party verification procedures could require significant expenditures to attain and maintain compliance. Any violation of these regulations by us, could result in significant fines and harm our customers’ confidence in the RINs we issue, either of which could have a material adverse effect on our business.
The development of alternative fuels and energy sources may reduce the demand for biodiesel, resulting in a reduction in our revenues and profitability.
The development of alternative fuels, including a variety of energy alternatives to biodiesel has attracted significant attention and investment. Neste Oil operates four renewable hydrocarbon diesel plants: a 300 million gallon per year plant in Singapore, a 300 million gallon per year plant in Rotterdam, Netherlands, and two 60 million gallon per year plants in Porvoo, Finland. In the United States, Diamond Green Diesel, LLC operates a 160 million gallon per year renewable hydrocarbon diesel plant in Norco, Louisiana. Under RFS2, renewable hydrocarbon diesel made from biomass meets the definition of biomass-based diesel and thus is eligible, along with biodiesel, to satisfy the RFS2 biomass-based diesel requirements. Furthermore, under RFS2, renewable hydrocarbon diesel may receive up to 1.7 RINs per gallon, whereas biodiesel currently receives 1.5 RINs per gallon. As the value of RINs increases, this 0.2 RIN advantage may make renewable hydrocarbon diesel more cost-effective, both as a petroleum-based diesel substitute and for meeting RFS2 requirements. If renewable hydrocarbon diesel proves to be more cost-effective than biodiesel, revenues from our biodiesel plants and our results of operations would be adversely impacted.
In addition, the EPA may allow other fuels to satisfy the RFS2 requirements and allow RINs to be generated upon the production of these fuels. The EPA recently adopted regulations to amend the definition of “Home Heating Oil” under RFS2, which expands the scope of fuels eligible to generate RINs.
The biomass-based diesel industry will also face increased competition resulting from the advancement of technology by automotive, industrial and power generation manufacturers which are developing more efficient engines, hybrid engines and alternative clean power systems. Improved engines and alternative clean power systems offer a technological solution to address increasing worldwide energy costs, the long-term availability of petroleum reserves and environmental concerns. If and when these clean power systems are able to offer significant efficiency and environmental benefits and become widely available, the biomass-based diesel industry may not be able to compete effectively with these technologies and government requirements for the use of biofuels may be discontinued.
If automobile manufacturers and other industry groups express reservations regarding the use of biodiesel, our ability to sell biodiesel will be negatively impacted.
Because it is a relatively new product compared with petroleum diesel, research on biodiesel use in automobiles is ongoing. While most heavy duty automobile manufacturers have approved blends of up to 20% biodiesel, some industry groups have recommended that blends of no more than 5% biodiesel be used for automobile fuel due to concerns about fuel quality, engine performance problems and possible detrimental effects of biodiesel on rubber components and other engine parts. Although some manufacturers have encouraged use of biodiesel fuel in their vehicles, cautionary pronouncements by other manufacturers or industry groups may impact our ability to market our biodiesel.
20
Perception about “food vs. fuel” could impact public policy which could impair our ability to operate at a profit and substantially harm our revenues and operating margins.
Some people believe that biomass-based diesel may increase the cost of food, as some feedstocks such as soybean oil used to make biomass-based diesel can also be used for food products. This debate is often referred to as “food vs. fuel.” This is a concern to the biomass-based diesel industry because biomass-based diesel demand is heavily influenced by government policy and if public opinion were to erode, it is possible that these policies would lose political support. These views could also negatively impact public perception of biomass-based diesel. Such claims have led some, including members of Congress, to urge the modification of current government policies which affect the production and sale of biofuels in the United States.
Concerns regarding the environmental impact of biomass-based diesel production could affect public policy which could impair our ability to operate at a profit and substantially harm our revenues and operating margins.
Under the Energy Independence and Security Act of 2007, or the EISA, the EPA is required to produce a study every three years of the environmental impacts associated with current and future biofuel production and use, including effects on air and water quality, soil quality and conservation, water availability, energy recovery from secondary materials, ecosystem health and biodiversity, invasive species and international impacts. The first such triennial report was released in February 2012. The 2012 report concludes that (1) the extent of negative impacts to date are limited in magnitude and are primarily associated with the intensification of corn production; (2) whether future impacts are positive or negative will be determined by the choice of feedstock, land use change, cultivation and conservation practices; and (3) realizing potential benefits will require implementation and monitoring of conservation and best management practices, improvements in production efficiency, and implementation of innovative technologies at commercial scales. Should future EPA triennial studies, or other analyses find that biofuel production and use has resulted in, or could in the future result in, adverse environmental impacts, such findings could also negatively impact public perception and acceptance of biofuel as an alternative fuel, which also could result in the loss of political support. To the extent that state or federal laws are modified or public perception turns against biomass-based diesel, use requirements such as RFS2 and state tax incentives may not continue, which could materially harm our ability to operate profitably.
Nitrogen oxide emissions from biodiesel may harm its appeal as a renewable fuel and increase costs.
In some instances, biodiesel may increase emissions of nitrogen oxide as compared to petroleum-based diesel fuel, which could harm air quality. Nitrogen oxide is a contributor to ozone and smog. New technology diesel engines eliminate any such increase. Emissions from older vehicles while the fleet turns over may decrease the appeal of biodiesel to environmental groups and agencies who have been historic supporters of the biodiesel industry, potentially harming our ability to market our biodiesel.
In addition, several states may act to regulate potential nitrogen oxide emissions from biodiesel. California recently adopted regulations that limits the volume of biodiesel that can be used or requires an additive to reduce potential emissions. In states where such an additive is required to sell biodiesel, the additional cost of the additive may make biodiesel less profitable or make biodiesel less cost competitive against petroleum-based diesel or renewable hydrocarbon diesel, which would negatively impact our ability to sell our products in such states and therefore have an adverse effect on our revenues and profitability.
RISKS RELATED TO OUR INDEBTEDNESS
We and certain subsidiaries have indebtedness, which subjects us to potential defaults, that could adversely affect our ability to raise additional capital to fund our operations and limits our ability to react to changes in the economy or the biomass-based diesel industry.
At December 31, 2016, our total term debt before debt issuance costs was $217.9 million. This includes $113.4 million aggregate carrying value on our $152.0 million face amount, 4.00% convertible senior notes due in June 2036, which we refer to as the 2036 Convertible Notes, and $67.3 million aggregate carrying value on our $73.8 million face value, 2.75% convertible senior notes due in June 2019, which we refer to as the 2019 Convertible Notes. We also have short-term debt obligations under revolving credit agreements provided by certain banks. At December 31, 2016, there were $52.8 million of borrowings made under our revolving lines of credit. See "Note 10 - Debt" to our Consolidated Financial Statements for a description of our indebtedness.
Our indebtedness could:
• | require us to dedicate a substantial portion of our cash flow from operations to payments of principal, interest on, and other fees related to such indebtedness, thereby reducing the availability of our cash flow to fund working capital and capital expenditures, and for other general corporate purposes; |
21
• | increase our vulnerability to general adverse economic and biomass-based diesel industry conditions, including interest rate fluctuations, because a portion of our revolving credit facilities are and will continue to be at variable rates of interest; |
• | limit our flexibility in planning for, or reacting to, changes in our business and the biomass-based diesel industry, which may place us at a competitive disadvantage compared to our competitors that have less debt; and |
• | limit among other things, our ability to borrow additional funds. |
Our ability to make scheduled payments of the principal of, to pay interest on or to refinance our indebtedness, including the 2036 Convertible Notes and 2019 Convertible Notes, depends on our future financial performance, which is subject to several factors including economic, financial, competitive and other factors beyond our control. Our business may not generate cash flow from operations in the future sufficient to satisfy our obligations under our indebtedness or any future indebtedness we may incur as well as our ability to make necessary capital expenditures. If we are unable to generate such cash flow, we may be required to adopt one or more alternatives, such as reducing or delaying investments or capital expenditures, selling assets, refinancing or obtaining additional capital on terms that may be onerous or highly dilutive. Our ability to refinance the 2036 Convertible Notes, the 2019 Convertible Notes or our other existing indebtedness or future indebtedness will depend on the conditions in the capital markets and our financial condition prior to maturity of the indebtedness.
Despite our current indebtedness levels, we may still incur significant additional indebtedness. Incurring more indebtedness could increase the risks associated with our substantial indebtedness.
We and our subsidiaries may be able to incur substantial additional indebtedness, including additional secured indebtedness, in the future. As of December 3, 2016, we had $95.2 million of undrawn availability under our line of credit with Wells Fargo and Fifth Third "M&L and Services Revolver", subject to borrowing base limitations. After giving effect to the borrowing base limitation, we had availability of approximately $80.2 million under the M&L and Services Revolver as of December 31, 2016. In addition, the indentures governing our convertible notes do not prevent us from incurring additional indebtedness or other liabilities that constitute indebtedness. If new debt or other liabilities are added to our current debt levels, the related risks that we and our subsidiaries now face could intensify.
We are subject to counterparty risk with respect to the capped call transactions that we entered into in connection with the issuance of our 2019 Convertible Notes.
In connection with the issuance of our 2019 Convertible Notes, we entered into privately-negotiated capped call transactions with various counterparties. The counterparties to the capped call transactions are financial institutions, and we will be subject to the risk that they might default under the capped call transactions. Our exposure to the credit risk of the option counterparties will not be secured by any collateral. Recent global economic conditions have resulted in the actual or perceived failure or financial difficulties of many financial institutions. If any option counterparty becomes subject to insolvency proceedings, we will become an unsecured creditor in those proceedings, with a claim equal to our exposure at that time under our transactions with such option counterparty. Our exposure will depend on many factors, but generally, an increase in our exposure will be correlated to an increase in the market price and volatility of shares of our common stock. In addition, upon a default by any option counterparty, we may suffer more dilution than we currently anticipate with respect to our common stock. We can provide no assurances as to the financial stability or viability of the option counterparties.
We may not have the ability to raise the funds necessary to settle conversions of our convertible notes in cash or to repurchase the convertible notes for cash upon a fundamental change or on a repurchase date, and our future debt may contain limitations on our ability to repurchase the convertible notes.
Holders of the 2019 or 2036 Convertible Notes will have the right to require us to repurchase their 2019 or 2036 Convertible Notes upon the occurrence of a fundamental change at a repurchase price generally equal to 100% of their principal amount, plus accrued and unpaid interest, if any.
Holders of the 2036 Notes will also have the right to require us to repurchase their notes on each of June 15, 2021, June 15, 2026 and June 15, 2031 at a repurchase price generally equal to 100% of their principal amount, plus accrued and unpaid interest, if any.
In addition, upon conversion of the 2019 or 2036 Convertible Notes, unless we elect to deliver solely shares of our common stock to settle such conversion (other than paying cash in lieu of delivering any fractional share), we will be required to make cash payments in respect of the 2019 or 2036 Convertible Notes being converted. However, we may not have enough available cash or be able to obtain financing at the time we are required to make repurchases of the 2019 or 2036 Convertible Notes upon a fundamental change or to settle conversion of the 2019 or 2036 Convertible Notes in cash.
22
In addition, our ability to repurchase the 2019 or 2036 Convertible Notes may be limited by law, by regulatory authority or by agreements governing our future indebtedness. Our failure to repurchase 2019 or 2036 Convertible Notes at a time when the repurchase is required by the indenture would constitute a default under the indenture governing the 2019 or 2036 Convertible Notes. A default under the indenture or the fundamental change itself could also lead to a default under agreements governing our other indebtedness. If the repayment of the related indebtedness were to be accelerated after any applicable notice or grace periods, we may not have sufficient funds to repay the indebtedness and repurchase the convertible notes.
Certain provisions in the indenture governing the 2019 or 2036 Convertible Notes could delay or prevent an otherwise beneficial takeover or takeover attempt of us.
Certain provisions in the 2019 or 2036 Convertible Notes and the indenture could make it more difficult or more expensive for a third party to acquire us. For example, if a takeover would constitute a fundamental change, holders of the 2019 or 2036 Convertible Notes will have the right to require us to repurchase their 2019 or 2036 Convertible Notes in cash. In addition, if a takeover constitutes a make-whole fundamental change, we may be required to increase the conversion rate for holders who convert their 2019 or 2036 Convertible Notes in connection with such takeover. In either case, and in other cases, our obligations under the 2019 or 2036 Convertible Notes and the indenture could increase the cost of acquiring us or otherwise discourage a third party from acquiring us or removing incumbent management.
The accounting method for convertible debt securities that may be settled in cash could have a material effect on our reported financial results.
Because we are required to elect to settle note conversions solely in cash (or, subject to certain limitations, with a combination of cash and shares of our common stock) before we obtain the stockholder approval described in Note 2 and 10 of the Consolidated Financial Statements, we have to separately account for the conversion option associated with the 2036 Convertible Notes as an embedded derivative under Accounting Standards Codification, or ASC, Topic 815, Derivatives and Hedging. Under this treatment, the note conversion option will be measured at its fair value and accounted for separately as a liability that is marked-to-market at the end of each reporting period. The initial value allocated to the conversion option will be treated as a debt discount that will be amortized into interest expense over the term of the 2036 Convertible Notes. For each financial statement period after the issuance of the 2036 Convertible Notes until we obtain the stockholder approval, a gain (or loss) will be reported in our statement of operations to the extent the valuation of the conversion option changes from the previous period.
As a result, we may experience related non-cash volatility to our net income (loss). In addition, as a result of the amortization of the debt discount, the interest expense associated with the 2036 Convertible Notes will be greater than the coupon rate on the 2036 Convertible Notes, which will result in lower reported net income. If we obtain the stockholder approval referred to above, then we expect that the conversion option will qualify for equity treatment and will no longer be marked to market at the end of each reporting period. However, we may never obtain this stockholder approval.
We are a holding company and there are limitations on our ability to receive dividends and distributions from our subsidiaries.
All of our principal assets, including our biomass-based diesel production facilities, are owned by subsidiaries and some of these subsidiaries are subject to loan covenants that generally restrict them from paying dividends, making distributions or making loans to us or to any other subsidiary. These limitations will restrict our ability to repay indebtedness, finance capital projects or pay dividends to stockholders from our subsidiaries’ cash flows from operations.
Our debt agreements impose significant operating and financial restrictions on our subsidiaries, which may prevent us from capitalizing on business opportunities.
Certain of our revolving and term credit agreements, including our M&L and Services Revolver, impose significant operating and financial restrictions on certain of our subsidiaries. These restrictions limit our certain of our subsidiaries’ ability, among other things, to:
•incur additional indebtedness or issue certain disqualified stock and preferred stock;
•place restrictions on the ability of certain of our subsidiaries to pay dividends or make other payments to us;
•engage in transactions with affiliates;
•sell certain assets or merge with or into other companies;
•guarantee indebtedness; and
•create liens.
23
When (and for as long as) the availability under the M&L and Services Revolver is less than a specified amount for a certain period of time, funds deposited into deposit accounts used for collections will be transferred on a daily basis into a blocked account with the administrative agent and applied to prepay loans under the M&L and Services Revolver.
As a result of these covenants and restrictions, we may be limited in how we conduct our business and we may be unable to raise additional debt or equity financing to compete effectively or to take advantage of new business opportunities. The terms of any future indebtedness we may incur could include more restrictive covenants. There is no assurance that we will be able to maintain compliance with these covenants in the future and, if we fail to do so, that we will be able to obtain waivers from the lenders and/or amend the covenants.
There are limitations on our ability to incur the full $150.0 million of commitments under the M&L and Services Revolver. Borrowings under our M&L and Services Revolver are limited by a specified borrowing base consisting of a percentage of eligible accounts receivable and inventory, less customary reserves. In addition, under the M&L and Services Revolver, a monthly fixed charge coverage ratio would become applicable if excess availability under the M&L and Services Revolver is less than 10% of the total $150 million of current revolving loan commitments, or $15 million. As of December 31, 2016, availability under the M&L and Services Revolver was approximately $95.2 million. However, it is possible that excess availability under the Revolving Credit could fall below the 10% threshold in a future period. If the covenant trigger were to occur, our subsidiaries who are the borrowers under M&L and Services Revolver would be required to satisfy and maintain on the last day of each month a fixed charge coverage ratio of at least 1.0x for the preceding twelve month period.
As of December 31, 2016, our consolidated fixed charge coverage ratio was approximately 3.1x. Our ability to meet the required fixed charge coverage ratio can be affected by events beyond our control, and we cannot assure you that we will meet this ratio. A breach of any of these covenants could result in a default under the M&L and Services Revolver.
RISKS RELATED TO OUR COMMON STOCK
The market price for our common stock may be volatile.
The market price for our common stock is likely to be highly volatile and subject to wide fluctuations in response to factors including the following:
• | actual or anticipated fluctuations in our financial condition and operating results; |
• | changes in the performance or market valuations of other companies engaged in our industry; |
• | issuance of new or updated research reports by securities or industry analysts; |
• | changes in financial estimates by us or of securities or industry analysts; |
• | investors’ general perception of us and the industry in which we operate; |
• | changes in the political climate in the industry in which we operate, existing laws, regulations and policies applicable to our business and products, including RFS2, and the continuation or adoption or failure to continue or adopt renewable energy requirements and incentives, including the BTC; |
• | other regulatory developments in our industry affecting us, our customers or our competitors; |
• | announcements of technological innovations by us or our competitors; |
• | announcement or expectation of additional financing efforts, including sales or expected sales of additional common stock; |
• | additions or departures of key management or other personnel; |
• | litigation; |
• | inadequate trading volume; |
• | general market conditions in our industry; and |
• | general economic and market conditions, including continued dislocations and downward pressure in the capital markets. |
In addition, stock markets experience significant price and volume fluctuations from time to time that are not related to the operating performance of particular companies. These market fluctuations may have material adverse effect on the market price of our common stock.
We may issue additional common stock as consideration for future investments or acquisitions.
We have issued in the past, and may issue in the future, our securities in connection with investments and acquisitions. Our stockholders could suffer significant dilution, from our issuances of equity or convertible debt securities. Any new equity securities we issue could have rights, preferences and privileges superior to those of holders of our common stock. The amount of our common stock or securities convertible into or exchangeable for our common stock issued in connection with an investment or acquisition could constitute a material portion of our then outstanding common stock.
24
If we fail to maintain effective internal control over financial reporting, we might not be able to report our financial results accurately or prevent fraud. In that case, our stockholders could lose confidence in our financial reporting, which would harm our business and could negatively impact the value of our stock.
Effective internal controls are necessary for us to provide reliable financial reports and prevent fraud. The process of maintaining our internal controls may be expensive and time consuming and may require significant attention from management. Although we have concluded as of December 31, 2016 that our internal control over financial reporting provides reasonable assurance regarding the reliability of financial reporting and the preparation of financial statements for external purposes in accordance with generally accepted accounting principles, because of its inherent limitations, internal control over financial reporting may not prevent or detect fraud or misstatements. For example, in connection with the preparation of our quarterly report for the third quarter of 2016, we identified a material weakness in internal control over financial reporting relating to our biomass-based diesel sales contract review process, which has been subsequently remediated.
Failure to implement required new or improved controls, or difficulties encountered in their implementation, could harm our results of operations or cause us to fail to meet our reporting obligations. If we or our independent registered public accounting firm discover a material weakness, the disclosure of that fact could harm the value of our stock and our business.
We have never paid dividends on our common stock and we do not anticipate paying any cash dividends in the foreseeable future.
We have paid no cash dividends on our common stock to date, have contractual restrictions against paying cash dividends and currently intend to retain our future earnings to fund the development and growth of our business. As a result, stockholders must look solely to appreciation of our common stock to realize a gain on their investment. This appreciation may not occur. Investors seeking cash dividends should not invest in our common stock.
Delaware law and our amended and restated certificate of incorporation and bylaws contain anti-takeover provisions that could delay or discourage takeover attempts that stockholders may consider favorable.
Provisions in our amended and restated certificate of incorporation and bylaws may have the effect of delaying or preventing a change of control or changes in our management. These provisions include the following:
• | the right of the board of directors to elect a director to fill a vacancy created by the expansion of the board of directors; |
• | the requirement for advance notice for nominations for election to the board of directors or for proposing matters that can be acted upon at a stockholders’ meeting; |
• | the ability of the board of directors to alter our bylaws without obtaining stockholder approval; |
• | the ability of the board of directors to issue, without stockholder approval, up to 10,000,000 shares of preferred stock with rights set by the board of directors, which rights could be senior to those of common stock; |
• | a classified board; |
• | the required approval of holders of at least two-thirds of the shares entitled to vote at an election of directors to adopt, amend or repeal our bylaws or amend or repeal the provisions of our amended and restated certificate of incorporation regarding the classified board, the election and removal of directors and the ability of stockholders to take action by written consent; and |
• | the elimination of the right of stockholders to call a special meeting of stockholders and to take action by written consent. |
In addition, because we are incorporated in Delaware, we are governed by the provisions of Section 203 of the Delaware General Corporation Law, or DGCL. These provisions may prohibit or restrict large stockholders, in particular those owning 15% or more of our outstanding voting stock, from merging or combining with us. These provisions in our amended and restated certificate of incorporation and bylaws and under Delaware law could discourage potential takeover attempts and could reduce the price that investors might be willing to pay for shares of our common stock in the future and result in our market price being lower than it would without these provisions.
ITEM 1B. | Unresolved Staff Comments |
None.
ITEM 2. | Properties |
The following table lists each of our owned production facilities and their location, use, and nameplate production capacity. Each facility listed below is used by our Biomass-based diesel Segment, except for Okeechobee, which is used by our Renewable Chemicals segment.
25
PRODUCTION FACILITIES - NORTH AMERICA
Location | Use | Nameplate Production Capacity (mmgy) | ||
Ralston, Iowa | Biomass-based diesel production | 12 | ||
Seabrook, Texas | Biomass-based diesel production | 35 | ||
Danville, Illinois | Biomass-based diesel production | 45 | ||
Newton, Iowa | Biomass-based diesel production | 30 | ||
Seneca, Illinois | Biomass-based diesel production | 60 | ||
Albert Lea, Minnesota | Biomass-based diesel production | 30 | ||
New Boston, Texas | Biomass-based diesel production | 15 | ||
Ellenwood, Georgia | Biomass-based diesel production | 15 | ||
Mason City, Iowa | Biomass-based diesel production | 30 | ||
Geismar, Louisiana* | Biomass-based diesel production | 75 | ||
Grays Harbor, Washington | Biomass-based diesel production | 100 | ||
DeForest, Wisconsin | Biomass-based diesel production | 20 | ||
Okeechobee, Florida | Fermentation facility | N/A | ||
* This facility produces renewable hydrocarbon diesel, naphtha, and liquid petroleum gas.
Our Ellenwood facility was idled by the previous owners prior to our acquisition and will remain so until repairs or upgrades are made where the facility meets our standards. We have not yet set a production date for our Ellenwood facility.
PETROTEC'S PRODUCTION FACILITIES - EUROPE
Location | Use | Nameplate Production Capacity (mmgy) | ||
Emden, Germany | Biomass-based diesel production | 27 | ||
Oeding, Germany | Biomass-based diesel production | 23 | ||
The following table lists our partially constructed or idled biomass-based diesel production facilities, the planned nameplate capacity and the approximate level of completion.
PARTIALLY CONSTRUCTED FACILITIES
Location | Use | Nameplate Production Capacity (mmgy) | Approximate Completion Level | |||
St. Rose, Louisiana | Biomass-based diesel production | 60 | 45% | |||
Emporia, Kansas | Biomass-based diesel production | 60 | 20% | |||
Clovis, New Mexico | Biomass-based diesel production | 15 | 50% | |||
We own our corporate headquarters located at 416 South Bell Avenue, Ames, Iowa 50010, comprised of 60,480 square feet of office and laboratory space; as well as another building located at 215 Alexander Avenue, Ames, Iowa 50010 which is comprised of 12,000 square feet of office space. We have committed to buying a property located at 300 South Bell Avenue, Ames, Iowa 50010, for which certain closing terms are pending.
ITEM 3. | Legal Proceedings |
We are not a party to any material pending legal proceeding, nor is any of our property the subject of any material pending legal proceeding, except ordinary routine litigation arising in the ordinary course of our business and incidental to our
26
business, none of which is expected to have a material adverse impact upon our business, financial position or results of operations.
ITEM 4. | Mine Safety Disclosures |
None.
27
PART II
ITEM 5. | Market for Registrant’s Common Equity, Related Stockholder Matters and Issuer Purchases of Equity Securities |
Market For Our Common Equity
Our common stock began trading on the NASDAQ Global market on January 19, 2012. Prior to that time, there was no public market for our stock. The table below sets forth the high and low sales price of our common stock.
2016 | High | Low | |||||
Fourth Quarter | $ | 10.60 | $ | 8.10 | |||
Third Quarter | $ | 9.90 | $ | 7.90 | |||
Second Quarter | $ | 10.43 | $ | 8.31 | |||
First Quarter | $ | 9.59 | $ | 6.53 | |||
2015 | High | Low | |||||
Fourth Quarter | $ | 9.76 | $ | 7.06 | |||
Third Quarter | $ | 11.96 | $ | 7.25 | |||
Second Quarter | $ | 12.80 | $ | 8.10 | |||
First Quarter | $ | 9.93 | $ | 8.30 | |||
Holders
As of February 28, 2017, there were approximately 2,374 holders of record of our common stock.
Dividends
We have never paid, and do not intend to pay in the future, a cash dividend on our common stock. In addition, we have entered into agreements that contractually restrict certain of our subsidiaries from paying dividends, making distributions or making loans to our parent company or to any other subsidiaries.
Securities Authorized for Issuance Under Equity Compensation Plans
The following table provides certain information as of December 31, 2016, with respect to our equity compensation plans:
PLAN CATEGORY | NUMBER OF SECURITIES TO BE ISSUED UPON EXERCISE OF OUTSTANDING OPTIONS, WARRANTS AND RIGHTS | WEIGHTED AVERAGE EXERCISE PRICE OF OUTSTANDING OPTIONS, WARRANTS AND RIGHTS | NUMBER OF SECURITIES REMAINING AVAILABLE FOR FUTURE ISSUANCE UNDER EQUITY COMPENSATION PLANS | ||||||||
Equity compensation plans approved by stockholders | 3,602,106 | 1 | $ | 10.22 | 2 | 897,900 | |||||
Equity compensation plans not approved by stockholders | — | — | — | ||||||||
Total | 3,602,106 | $ | 10.22 | 897,900 | |||||||
1 | Includes 859,251 shares underlying outstanding restricted stock units, 234,840 shares underlying outstanding performance restricted stock units, and 2,508,015 shares underlying outstanding stock appreciation rights. |
2 | Restricted stock units and performance restricted stock units do not have an exercise price and therefore have not been included in the calculation of weighted average exercise price. |
Performance Graph
The following performance graph is not “soliciting material,” is not deemed filed with the SEC, and is not to be incorporated by reference into any of our filings under the Securities Act of 1933 or the Securities Exchange Act of 1934, as amended, respectively.
28
The following graph shows a comparison of the cumulative total returns from January 19, 2012 to December 31, 2016, for us, the Elements MLCX Biofuels ETN Index and the Russell 3000 Index. The graph assumes that $100 was invested on January 19, 2012 in our common stock, the Elements MLCX Biofuels ETN Index and the Russell 3000 Index, and that all dividends were reinvested.
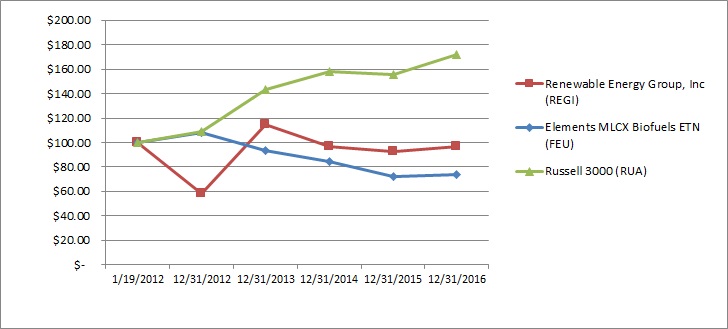
01/19/2012 | 12/31/2012 | 12/31/2013 | 12/31/2014 | 12/31/2015 | 12/31/2016 | ||||||||||||||||||
REGI | $ | 100.00 | $ | 58.60 | $ | 114.60 | $ | 97.10 | $ | 92.50 | $ | 97.00 | |||||||||||
Elements MLCX Biofuels ETN | 100.00 | 108.00 | 93.44 | 84.57 | 72.32 | 73.77 | |||||||||||||||||
Russell 3000 | 100.00 | 109.17 | 142.96 | 157.50 | 155.58 | 171.77 | |||||||||||||||||
Sales of Unregistered Securities
On March 15, 2016, we issued 33,973 shares of our common stock with respect to the intangible supply agreement in connection with the purchase of substantially all of the assets of Tellurian Biodiesel, Inc. and American BDF, LLC assets.
Issuer Purchases of Equity Securities
On February 19, 2015, the Board of Directors approved a stock repurchase program authorizing up to $30.0 million in repurchases. The program was in effect through October 31, 2016. During 2016, we used up the remaining $6.7 million to repurchase 90,654 shares of our Common Stock under this program.
In March 2016, the Company's board of directors approved a repurchase program of up to $50.0 million of the Company's shares of common stock and/or convertible notes, in effect through March 5, 2018. Under the program, which was in addition to the $30.0 million common stock repurchase program announced in February 2015, the Company may repurchase shares or bonds from time to time in open market transactions, privately negotiated transactions or by other means. During 2016, we used up all the authorized amount to repurchase 5,070,375 shares under of our Common Stock under this program, in addition to the partial repurchases of our 2019 Convertible Notes.
29
Period | Total Number of Shares Purchased | Average Price per Share | Total Number of Shares Purchased as Part of Publicly Announced Plan | Approximate Dollar Value of Shares that May Yet Be Purchased | ||||||
February 2015 Share Repurchase Program: | ||||||||||
March 2016 (from March 1, 2016 to March 31, 2016) | 647,794 | $ | 8.98 | 3,126,907 | $ | 870,000 | ||||
April 2016 (from April 1, 2016 to April 30, 2016) | 90,654 | $ | 9.58 | 3,217,561 | $ | — | ||||
March 2016 Share and Convertible Debt Repurchase Program: | ||||||||||
June 2016 (June 1, 2016 to June 30, 2016) | 4,442,823 | $ | 8.65 | 4,442,823 | $ | 11,600,000 | ||||
July 2016 (July 1, 2016 to July 31, 2016) | 500,000 | $ | 8.88 | 4,942,823 | $ | 7,100,000 | ||||
August 2016 (August 1, 2016 to August 31, 2016) | 57,561 | $ | 9.50 | 5,000,384 | $ | 6,600,000 | ||||
September 2016 (September 1, 2016 to September 30, 2016) | 69,991 | $ | 8.40 | 5,070,375 | $ | — | ||||
30
ITEM 6. | Selected Financial Data |
The following selected consolidated financial data should be read together with “Management’s Discussion and Analysis of Financial Condition and Results of Operations” and our financial statements and related notes included elsewhere in this annual report.
The selected consolidated balance sheet data as of December 31, 2016 and 2015, and the selected consolidated statements of operations data for each year ended December 31, 2016, 2015 and 2014, have been derived from our audited consolidated financial statements which are included elsewhere in this annual report. The selected consolidated balance sheet data as of December 31, 2014, 2013 and 2012, and the selected consolidated statements of operations data for the years ended December 31, 2013 and 2012 have been derived from our audited consolidated financial statements not included in this annual report.
Year Ended December 31, | |||||||||||||||||||
2016(1) | 2015 (2) | 2014 (3) | 2013 (4) | 2012(5) | |||||||||||||||
(In thousands, except per share amounts) | |||||||||||||||||||
Consolidated Statement of Operations Data: | |||||||||||||||||||
Total revenues | $ | 2,041,232 | $ | 1,387,344 | $ | 1,273,831 | $ | 1,498,138 | $ | 1,015,034 | |||||||||
Net income (loss) attributable to the company's common stockholders | 43,453 | (151,392 | ) | 81,620 | 165,254 | 43,482 | |||||||||||||
Net income (loss) per share attributable to common stockholders | |||||||||||||||||||
Basic | 1.06 | (3.44 | ) | 2.00 | 5.00 | 1.53 | |||||||||||||
Diluted | 1.06 | (3.44 | ) | 1.99 | 5.00 | 0.27 | |||||||||||||
Consolidated Balance Sheet Data: | |||||||||||||||||||
Total assets | $ | 1,136,603 | $ | 1,223,620 | $ | 1,367,736 | $ | 740,855 | $ | 495,784 | |||||||||
Long-term debt | 196,203 | 247,251 | 242,031 | 27,151 | 31,806 | ||||||||||||||
Redeemable preferred stock | — | — | — | 3,963 | 83,043 | ||||||||||||||
(1) | Reflects the acquisition of Sanimax Energy on March 15, 2016 as further described in Note 4 of Item 8 - Financial Statements and Supplementary Data. In addition, the results reflect the issuance of the convertible senior notes on June 2, 2016 as further described in Note 10 of Item 8 - Financial Statements and Supplementary Data. |
(2) | Reflects the acquisition of our Grays Harbor facility on August 19, 2015 as further described in Note 4 and the impact of goodwill impairment as further described in Note 2 of Item 8 - Financial Statements and Supplementary Data. |
(3) | Reflects the acquisitions of REG Life Sciences as of January 22, 2014, REG Synthetic Fuels and Geismar facility on June 3, 2014 and June 6, 2014, respectively, and the majority interest in Petrotec as of December 24, 2014 as further described in Note 4 of Item 8 - Financial Statements and Supplementary Data. In addition, the results reflect the issuance of the convertible senior notes on June 3, 2014 as further described in Note 10 of Item 8 - Financial Statements and Supplementary Data. |
(4) | Reflects the acquisition of our Mason City facility as of July 30, 2013. |
(5) | Reflects the acquisition of our New Boston facility as of October 26, 2012 and our Atlanta facility on November 16, 2012. |
31
ITEM 7. | Management’s Discussion and Analysis of Financial Condition and Results of Operations |
The following discussion and analysis should be read in conjunction with our consolidated financial statements and notes thereto that appear elsewhere in this report. This discussion contains forward-looking statements reflecting our current expectations that involve risks and uncertainties. Actual results may differ materially from those discussed in these forward-looking statements due to a number of factors, including those set forth in the section entitled “Risk Factors” and elsewhere in this report.
Overview
Our Company focuses on providing cleaner, lower carbon intensity products and services. We utilize a nationwide production, distribution and logistics system as part of an integrated value chain model to focus on converting natural fats, oils and greases into advanced biofuels. We own and operate 14 biorefineries (upon acquiring the remaining interest in Petrotec AG in January 2017) with 12 locations in North America and 2 locations in Germany, which consist of 13 biomass-based diesel or biodiesel and renewable hydrocarbon diesel plants, with aggregate nameplate production capacity of 502 gallons per year, or mmgy and one demonstration scale fermentation facility. We also have one feedstock processing facility in Germany. We are also engaged in research and development efforts focused on the conversion of diverse feedstocks into renewable chemicals and ester-based products.
We are a lower-cost biomass-based diesel producer. We primarily produce our biomass-based diesel from a wide variety of lower cost feedstocks, including inedible corn oil, used cooking oil and inedible animal fat. We also produce biomass-based diesel from virgin vegetable oils, which are more widely available and tend to be higher in price. We believe our ability to process a wide variety of feedstocks provides us with a cost advantage over many biomass-based diesel producers, particularly those that rely primarily on higher cost virgin vegetable oils, such as soybean oil or canola oil.
We expanded our business internationally by acquiring a majority interest in Petrotec AG, or Petrotec, in December 2014. We continued to acquire additional shares in Petrotec throughout 2015 and 2016, and in January 2017, we acquired full equity ownership of Petrotec, now called REG Germany. As of December 31, 2016, we owned approximately 91% of Petrotec's shares. Our Germany operations are a fully-integrated company and utilize used cooking oil and other waste feedstocks to produce biomass-based diesel at our two biorefineries in Germany. The combined nameplate production capacity is approximately 50 mmgy.
We sell petroleum-based heating oil and diesel fuel, which enables us to offer additional biofuel blends, while expanding our customer base. We sell heating oil and ultra-low sulfur diesel, or ULSD, at terminals throughout the northeastern U.S. as well as BioHeat® blended heating fuel at one of our existing Northeast terminal locations. In 2015, we expanded our sales of additional biofuel blends to Midwest terminal locations and look to potentially expand in other areas across North America.
In January 2014, we acquired a development-stage industrial biotechnology business focusing on microbial fermentation to develop and produce renewable chemicals, fuels and other products.
We acquired a 75 mmgy nameplate capacity renewable hydrocarbon diesel biorefinery located in Geismar, Louisiana in June 2014. Our Geismar facility had been idled by its previous owner, began operating again by us in October 2014 and was shutdown between April 2015 and early March 2016 due to two separate fires that occurred in April and September 2015. Our Geismar facility has been running at high utilization since early October 2016.
In August 2015, we acquired our Grays Harbor facility, a 100 mmgy nameplate biodiesel plant and terminal at the Port of Grays Harbor, Washington. This acquisition expanded our production fleet to the west coast of the United States. The Grays Harbor location includes 18 million gallons of storage capacity and a terminal that can accommodate feedstock intake and fuel delivery on deep-water PANAMAX class vessels as well as possessing significant rail and truck transport capabilities. To date, the production facility's primary feedstock has been canola oil.
In March 2016, we acquired our 20 mmgy nameplate biodiesel refinery located in DeForest, Wisconsin, or REG Madison, plant that produces biodiesel from yellow grease, rendered animal fats, and inedible corn oil, in addition to refined vegetable oils using our patented technology currently in use at our Seneca, Illinois plant. The facility has both truck and rail capabilities.
During 2016, we sold 567 million total gallons, including 77 million biomass-based gallons we purchased from third parties and resold, 45 million biomass-based diesel gallons by our majority-owned Petrotec and 54 million petroleum-based diesel gallons. During 2015, we sold 375 million total gallons, including 40 million gallons we purchased from third parties and resold, 40 million biomass-based diesel gallons by our majority-owned Petrotec and 30 million petroleum-based diesel gallons.
Our businesses are organized into three reportable segments - the Biomass-based Diesel segment, the Services segment and the Renewable Chemicals segment. As the activities surrounding our renewable chemicals business increase, we began reporting in 2015 a new segment - Renewable Chemicals, which was previously included in the Biomass-based Diesel segment.
32
Biomass-based Diesel Segment
Our Biomass-based Diesel segment, as reported herein, includes:
• | the operations of the following biomass-based diesel production facilities: |
• | a 12 mmgy nameplate biomass-based diesel production facility located in Ralston, Iowa; |
• | a 35 mmgy nameplate biomass-based diesel production facility located near Houston, Texas; |
• | a 45 mmgy nameplate biomass-based diesel production facility located in Danville, Illinois; |
• | a 30 mmgy nameplate biomass-based diesel production facility located in Newton, Iowa; |
• | a 60 mmgy nameplate biomass-based diesel production facility located in Seneca, Illinois; |
• | a 30 mmgy nameplate biomass-based diesel production facility located near Albert Lea, Minnesota; |
• | a 15 mmgy nameplate biomass-based diesel production facility located in New Boston, Texas; |
• | a 30 mmgy nameplate biomass-based diesel production facility located in Mason City, Iowa; |
• | a 75 mmgy nameplate renewable hydrocarbon diesel production facility located in Geismar, Louisiana; |
• | a 27 mmgy nameplate biomass-based diesel production facility located in Emden, Germany; |
• | a 23 mmgy nameplate biomass-based diesel production facility located in Oeding, Germany; |
• | a 100 mmgy nameplate biomass-based diesel production facility located in Grays Harbor, Washington; and |
• | a 20 mmgy nameplate biodiesel production facility located in DeForest, Wisconsin, since its acquisition in March 2016. |
• | purchases and resale of biomass-based diesel, petroleum-based diesel, Renewable Identification Numbers, or RINs, California Low Carbon Fuel Standard Credits, or LCFS credits, and raw material feedstocks acquired from third parties; |
• | sales of biomass-based diesel produced under toll manufacturing arrangements with third party facilities using our feedstocks; and |
• | incentives received from federal and state programs for renewable fuels. |
We derive a small portion of our revenues from the sale of glycerin, free fatty acids, naphtha and other co-products of the biomass-based diesel production process. In 2016 and 2015, our revenues from the sale of co-products were less than five percent of our total Biomass-based diesel segment revenues. During 2016 and 2015, revenues from the sale of petroleum-based heating oil and diesel fuel acquired from third parties, along with the sale of these items further blended with biodiesel produced at wholly owned facilities or purchased from third parties, were slightly over 5% of our total revenues.
In accordance with EPA regulations, we generate 1.5 to 1.7 RINS, for each gallon of biomass-based diesel we produce. RINs are used to track compliance with RFS2 using the EPA moderated transaction system, or EMTS. RFS2 allows us to attach between zero and 2.5 RINs to any gallon of biomass-based diesel we sell. We generally attach 1.5 to 1.7 RINs when we sell a gallon of biomass-based diesel. As a result, a portion of our selling price for a gallon of biomass-based diesel is generally attributable to RFS2 compliance, but no cost is allocated to the RINs generated by our biomass-based diesel production because RINs are a form of government incentive and not a result of the physical attributes of the biomass-based diesel production. In addition, RINs, once obtained with gallons of biomass-based diesel, may be separated by the acquirer and sold separately. Regularly, we obtain RINs from third parties for resale. The value of these RINs obtained from third parties is reflected in “Prepaid expenses and other assets” on our consolidated balance sheet. At each balance sheet date, this RIN inventory is valued at the lower of cost or net realizable value and resulting adjustments are reflected in our cost of goods sold for the period. The cost of RINs obtained from third parties is determined using the average cost method. Because we do not allocate costs to RINs generated by our biomass-based diesel production, fluctuations in the value of our RIN inventory represent fluctuations in the value of RINs we have obtained from third parties.
Services Segment
Our Services segment includes:
• | biomass-based diesel facility management and operational services, whereby we provide day-to-day management and operational services to biomass-based diesel production facilities as well as other clean-tech companies; and |
• | construction management services, whereby we act as the construction management and general contractor for the construction of biomass-based diesel production facilities. |
We have utilized our construction management expertise internally to upgrade our facilities, such as our facilities located in Albert Lea, New Boston, Mason City and Newton. In October 2016, we completed a $34.5 million upgrade to our Danville facility. In November 2016, we started a $24 million expansion project at our Ralston facility. During 2015 and the first
33
quarter of 2016, we spent over $42 million, the majority of which was covered by our property and casualty insurance proceeds due to damages from fires in April and September 2015, related to restoration repairs and upgrade projects at our Geismar facility. The Geismar facility came back on line in early March 2016. Demand for our construction management and facility management and operational services depend on capital spending by potential customers and existing customers, which is directly affected by trends in the biomass-based diesel industry. We have not received any orders or provided services to outside parties for new facility construction services since 2009.
Renewable Chemicals Segment
Our Renewable Chemicals segment includes:
• | research and development activities focusing on microbial fermentation to develop and produce renewable chemicals, additional advanced biofuels and other products; |
• | collaborative research and development and other service activities to continue to build out the technology platform; and |
• | the operations of a demonstration scale fermentation facility located in Okeechobee, Florida since its acquisition in January 2014. |
In January 2016, ExxonMobil Research and Engineering Company entered into an agreement with our subsidiary, REG Life Sciences, LLC, or REG Life Sciences, to develop technology for the production of biodiesel by fermenting renewable cellulosic sugars from sources such as agricultural waste. In October 2016, REG Life Sciences sold and delivered its first commercial product, a specialty fatty acid. REG developed, produced sold, and delivered approximately one metric ton of the renewable, multi-functional chemical to Aroma Chemical Services International. Fatty acids are one of three product areas REG Life Sciences has focused on, along with esters and alcohols.
During late November 2016, the Company's Board of Directors authorized a review of strategic alternatives for REG Life Sciences. There can be no assurance that this ongoing strategic review will result in any specific action or transaction or that any action taken or transaction we may enter into will prove to be beneficial to stockholders.
Factors Influencing Our Results of Operations
The principal factors affecting our results of operations and financial conditions are the market prices for biomass-based diesel and the feedstocks used to produce biomass-based diesel, as well as governmental programs designed to create incentives for the production and use of biomass-based diesel.
Governmental programs favoring biomass-based diesel production and use
Biomass-based diesel has historically been more expensive to produce than petroleum-based diesel. The biomass-based diesel industry’s growth has largely been the result of federal and state programs that require or incentivize the production and use of biomass-based diesel, which allows biomass-based diesel to be price-competitive with petroleum-based diesel.
On July 1, 2010, RFS2 was implemented, stipulating volume requirements for the amount of biomass-based diesel and other advanced biofuels that must be utilized in the United States each year. Under RFS2, Obligated Parties, including petroleum refiners and fuel importers, must show compliance with these standards. Currently, biodiesel and renewable hydrocarbon diesel production meets three categories of an Obligated Party’s annual renewable fuel required volume obligation, or RVO—biomass-based diesel, undifferentiated advanced biofuel and renewable fuel. At December 31, 2016, the final RVO targets for the biomass-based diesel volumes for the years 2014 to 2018 as set by the EPA are as follows:
2014 | 2015 | 2016 | 2017 | 2018 | |
Biomass-based diesel | 1.63 billion gallons | 1.73 billion gallons | 1.90 billion gallons | 2.00 billion gallons | 2.1 billion gallons |
Actual production or imports continue to grow as illustrated by the EMTS data noted below:
2014 | 2015 | 2016 | |
Biomass-based diesel produced or imported volume | 1.75 billion gallons | 1.81 billion gallons | 2.6 billion gallons |
The federal biodiesel mixture excise tax credit, or the BTC, has generally provided a $1.00 refundable tax credit per gallon to the first blender of biomass-based diesel with petroleum-based diesel fuel. The BTC became effective January 1,
34
2005, but since January 1, 2010 it has been allowed to lapse and then be reinstated a number of times. For example, the BTC lapsed on January 1, 2014 and was retroactively reinstated for 2014 on December 19, 2014 and lapsed on January 1, 2015. On December 18, 2015, the Protecting Americans from Tax Hikes Act of 2015 was signed into law, which reinstated and extended a set of tax provisions, including the retroactive reinstatement for 2015 and extension for 2016 of the BTC. The BTC again lapsed on January 1, 2017 and has not been reinstated as of the date of this report. It is uncertain whether the BTC will be reinstated and if reinstated, whether it would be reinstated retroactively. The lapsing or modification of the BTC could adversely affect our future financial results.
Biomass-based diesel and feedstock price fluctuations
Our operating results generally reflect the relationship between the price of biomass-based diesel, including credits and incentives and the price of feedstocks used to produce biomass-based diesel.
Biomass-based diesel is a low carbon, renewable alternative to petroleum-based diesel fuel and is primarily sold to the end user after it has been blended with petroleum-based diesel fuel. Biomass-based diesel prices have historically been heavily influenced by petroleum-based diesel fuel prices. Accordingly, biomass-based diesel prices have generally been impacted by the same factors that affect petroleum prices, such as crude oil supply and demand balance, worldwide economic conditions, wars and other political events, OPEC production quotas, changes in refining capacity and natural disasters.
Regulatory and legislative factors also influence the price of biomass-based diesel. Biomass-based diesel RIN pricing, a value component that was introduced via RFS2 in July 2010, has had a significant impact on our biomass-based diesel pricing. The following table shows for 2014, 2015 and 2016 the high and low average monthly contributory value of RINs, as reported by OPIS to the average B100 spot price of a gallon of biodiesel, as reported by The Jacobsen in terms of dollars per gallon and as a percentage of the average spot price.
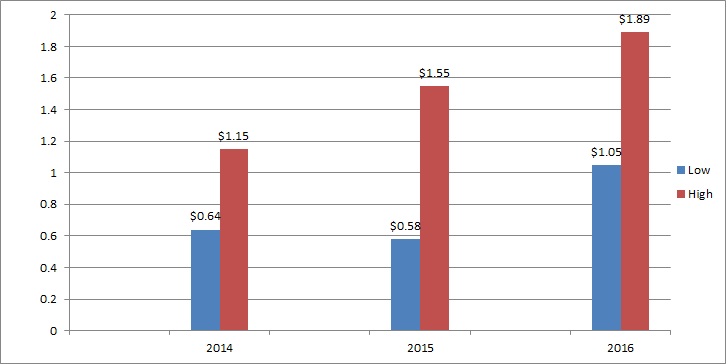
The fluctuations in the value of RINs during 2016 and 2015 resulted in write-downs of $19.4 million and $9.0 million, respectively, on RIN inventory acquired from third parties. See “Note 8 – Other Assets” to our consolidated financial statements. We enter into forward contracts to sell RINs and we use risk management position limits to manage RIN exposure.
During 2016, feedstock expense accounted for 78% of our production cost, while methanol and chemical catalysts expense accounted for 5% and 3% of our costs of goods sold, respectively.
Feedstocks for biomass-based diesel production, such as inedible corn oil, used cooking oil, inedible animal fat and soybean oil are commodities and market prices for them will be affected by a wide range of factors unrelated to the price of biomass-based diesel and petroleum-based diesel fuels. The following table outlines some of the factors influencing supply and price for each feedstock:
35
Feedstock | ||||||
Factors Influencing Supply and Price | Inedible Corn Oil | Used Cooking Oil | Inedible Animal Fat | Canola Oil | Soybean Oil | |
Demand for inedible corn oil from renewable fuel and other markets | þ | |||||
Ethanol production | þ | |||||
Export demand | þ | þ | þ | þ | þ | |
Extraction system yield | þ | |||||
Implementation of inedible corn oil separation systems into existing and new ethanol facilities | þ | |||||
Implementation of co-located biodiesel/renewable diesel plants with ethanol facilities | þ | |||||
Feed demand | þ | þ | þ | |||
New or expected biodiesel capacity | þ | |||||
Weather conditions | þ | þ | þ | |||
Biomass-based diesel demand | þ | þ | þ | |||
Population | þ | |||||
Number of restaurants in the vicinity of collection facilities and terminals which is dependent on population density | þ | |||||
Cooking methods and eating habits, which can be impacted by the economy | þ | |||||
Number of slaughter kills in the United States | þ | |||||
Demand for inedible animal fat from other markets | þ | |||||
Demand for canola oil for food use | þ | |||||
Canola crush margin | þ | |||||
Canola meal demand | þ | |||||
Crop disease | þ | þ | ||||
Palm oil supply | þ | |||||
Soybean meal demand | þ | |||||
South American crop production | þ | |||||
Farmer planting decisions | þ | |||||
Government policies and subsidies | þ | |||||
During 2016 and 2015, 72% and 85% of our feedstocks, respectively, were comprised of inedible corn oil, used cooking oil and inedible animal fats with the remainder coming from virgin vegetable oil.
The graph below illustrates the spread between the cost of producing one gallon of biodiesel made from soybean oil to the cost of producing one gallon of biodiesel made from a lower cost feedstock for the period December 2011 through December 2016. The results were derived using assumed conversion factors for the yield of each feedstock and subtracting the cost of producing one gallon of biodiesel made from each respective lower cost feedstock from the cost of producing one gallon of biodiesel made from soybean oil.
36
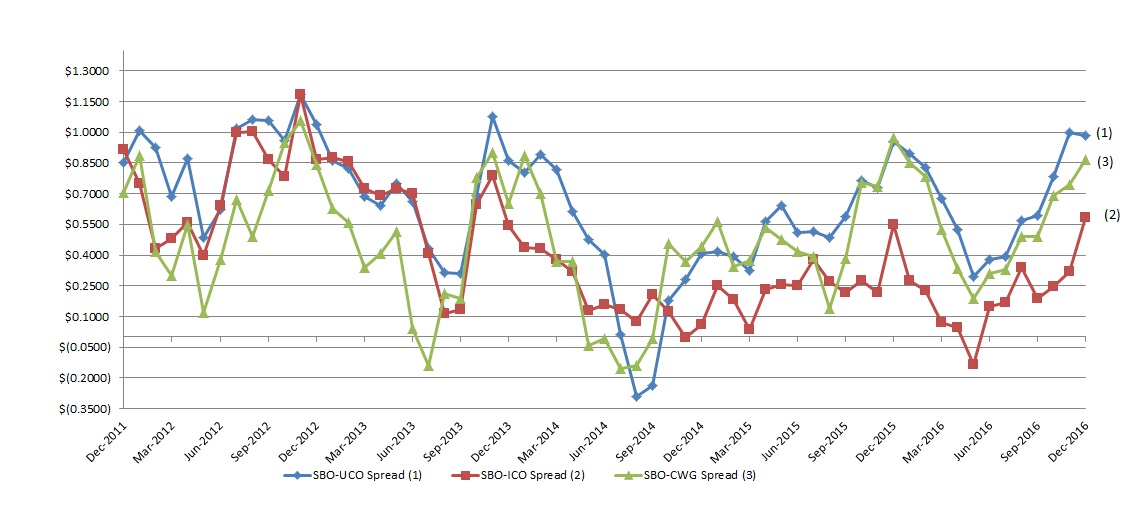
(1) | Used cooking oil prices are based on the monthly average of the daily low sales price of Missouri River yellow grease as reported by The Jacobsen (based on 8.5 pounds per gallon). |
(2) | Inedible corn oil prices are reported as the monthly average of the daily distillers’ corn oil market values delivered to Illinois as reported by The Jacobsen (based on 8.2 pounds per gallon). |
(3) | Choice white grease prices are based on the monthly average of the daily low prices of Missouri River choice white grease as reported by The Jacobsen (based on 8.0 pounds per gallon). |
(4) | Soybean oil (crude) prices are based on the monthly average of the daily closing sale price of the nearby soybean oil contract as reported by CBOT (based on 7.5 pounds per gallons). |
Our results of operations generally will benefit when the spread between biomass-based diesel prices and feedstock prices widens and will be harmed when this spread narrows. The following graph shows feedstock cost data of choice white grease and soybean oil on a per gallon basis compared to the sale price data for biodiesel, and the spread between the two, from December 2011 to December 2016.
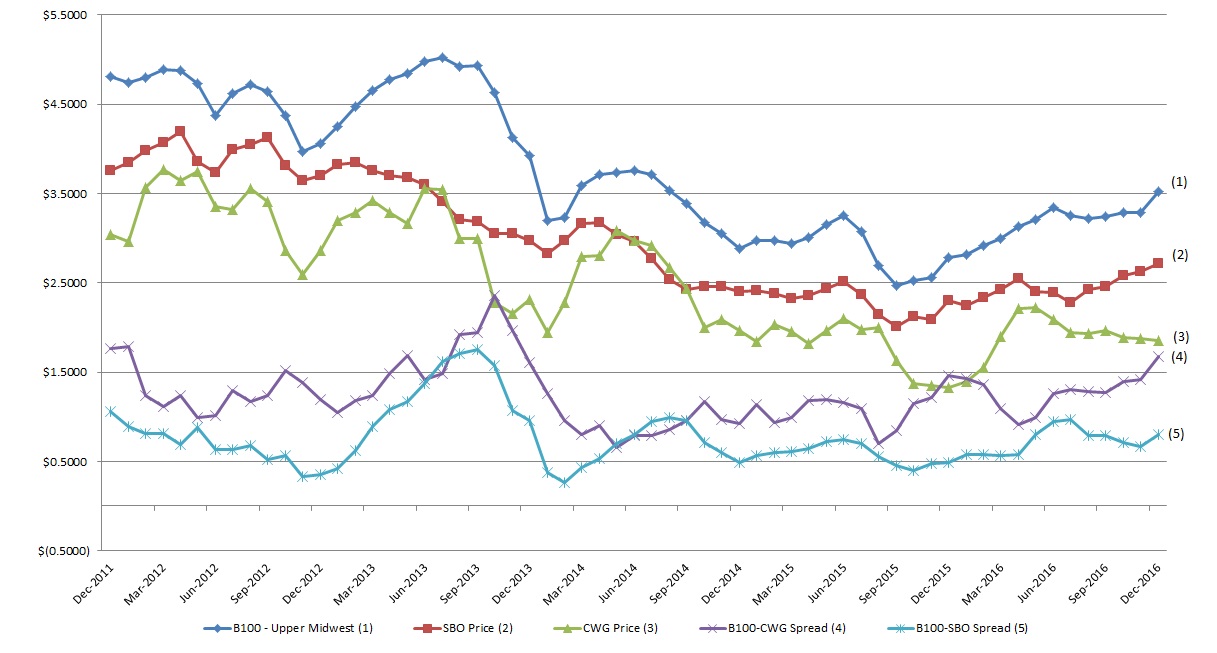
(1) | Biodiesel prices are based on the monthly average of the midpoint of the high and low prices of B100 (Upper Midwest) as reported by The Jacobsen. |
37
(2) | Soybean oil (crude) prices are based on the monthly average of the daily closing sale price of the nearby soybean oil contract as reported by CBOT (based on 7.5 pounds per gallon). |
(3) | Choice white grease prices are based on the monthly average of the daily low price of Missouri River choice white grease as reported by The Jacobsen (based on 8.0 pounds per gallon). |
(4) | Spread between biodiesel price and choice white grease price. |
(5) | Spread between biodiesel price and soybean oil (crude) price. |
During 2016, NY Harbor ULSD prices ranged from $0.87 per gallon in January to $1.70 per gallon in December with the average price for the year of $1.37 per gallon. The US crude oil production increased while crude inventories decreased due to US refineries operating at a high utilization rate during the first half of the year. In late September 2016, OPEC made statements that the group is willing to cut production to help balance world crude supply and demand helped support energy prices in late September and into October. Feedstock prices trended higher in 2016, led by the tightness in the palm oil market and strong demand from biodiesel producers for fats and inedible corn oil. The soybean crop yield was at record high in the fall of 2016. US cattle slaughter numbers in 2016 are higher than the prior year, as the cattle industry was in an expansion phase. Hog slaughter remained consistent with the prior year numbers, staying at a historically high level.
Risk Management
The profitability of producing biomass-based diesel largely depends on the spread between prices for feedstocks and biomass-based diesel, including incentives, each of which is subject to fluctuations due to market factors and each of which is not significantly correlated. Adverse price movements for these commodities directly affect our operating results. We attempt to protect cash margins for our own production and our third-party trading activity by entering into risk management contracts that mitigate the impact on our margins from price volatility in feedstocks and biomass-based diesel. We create offsetting positions by using a combination of forward fixed-price physical purchases and sales contracts on feedstock and biomass-based diesel, including risk management futures contracts, swaps and options primarily on the New York Mercantile Exchange NY Harbor ULSD and CBOT Soybean Oil; however, the extent to which we engage in risk management activities varies substantially from time to time, and from feedstock to feedstock, depending on market conditions and other factors. In making risk management decisions, we utilize research conducted by outside firms to provide additional market information in addition to our internal research and analysis.
Inedible corn oil, used cooking oil, inedible animal fat, canola oil and soybean oil are the primary feedstocks we used to produce biomass-based diesel in 2014, 2015 and 2016. We utilize several varieties of inedible animal fat, such as beef tallow, choice white grease and poultry fat derived from livestock. There is no established futures market for these lower cost feedstocks. The purchase prices for lower cost feedstocks are generally set on a negotiated flat price basis or spread to a prevailing market price reported by the USDA price sheet or The Jacobsen. Our efforts to risk manage against changing prices for inedible corn oil, used cooking oil and inedible animal fat have involved entering into futures contracts, swaps or options on other commodity products, such as CBOT soybean oil and NY Harbor ULSD. However, these products do not always experience the same price movements as lower cost feedstocks, making risk management for these feedstocks challenging. We manage feedstock supply risks related to biomass-based diesel production in a number of ways, including, where available, through long-term supply contracts. The purchase price for soybean oil under these contracts may be indexed to prevailing CBOT soybean oil market prices with a negotiated market basis. We utilize futures contracts, swaps and options to risk manage, or lock in, the cost of portions of our future feedstock requirements generally for varying periods up to one year.
Our ability to mitigate our risk of falling biomass-based diesel prices is limited. We have entered into forward contracts to supply biomass-based diesel. However, pricing under these forward sales contracts generally has been indexed to prevailing market prices, as fixed price contracts for long periods on acceptable terms have generally not been available. There is no established futures market for biomass-based diesel in the United States. Our efforts to hedge against falling biomass-based diesel prices generally involve entering into futures contracts, swaps and options on other commodity products, such as diesel fuel and NY Harbor ULSD. However, price movements on these products are not highly correlated to price movements of biomass-based diesel.
We generate 1.5 to 1.7 biomass-based diesel RINs for each gallon of biomass-based diesel we produce and sell. We also obtain RINs from third party transactions which we hold for resale. There is no effective established futures market for biomass-based diesel RINs, which severely limits the ability to risk manage the price of RINs. We enter into forward contracts to sell RINs and we use risk management position limits and value at risk to manage RIN exposure.
As a result of our strategy, we frequently have gains or losses on derivative financial instruments that are conversely offset by losses or gains on forward fixed-price physical contracts on feedstocks and biomass-based diesel or inventories. Gains and losses on derivative financial instruments are recognized each period in operating results while corresponding gains and losses on physical contracts are generally not recognized until quantities are delivered or title transfers which may be in the
38
same or later periods. Our results of operations are impacted when there is a period mismatch of recognized gains or losses associated with the change in fair value of derivative instruments used for risk management purposes at the end of the reporting period when the purchase or sale of feedstocks or biomass-based diesel has not yet occurred and thus the offsetting gain or loss will be recognized in a later accounting period.
We had risk management losses of $35.4 million from our derivative financial instrument trading activity for the year ended December 31, 2016, compared to risk management gains of $36.0 million for the year ended December 31, 2015. Changes in the value of these futures or swap instruments are reflected in current income or loss, generally within our cost of goods sold. In 2016, risk management losses resulted mostly from the significant volatility in the commodities market and accounted for a loss of 0.06 per gallon sold. Over the three years prior to 2016, risk management gains have represented an average income of $0.10 per gallon sold. The current three-year average, which incorporates 2016 risk management losses, reflects an average income of $0.05 per gallon sold. In general, over the course of a twelve-month period or more, we expect to incur a slight risk management loss when commodities are stable to compensate for the value of risk management protection from market volatility.
Seasonality
Our operating results are influenced by seasonal fluctuations in the demand for biodiesel. Biodiesel demand tends to decrease during the winter season in the Northern and Midwestern states due to reduced blending concentrations because colder temperatures can cause the higher cloud point biodiesel we make from inedible animal fats to become cloudy and eventually gel at a higher temperature than petroleum-based diesel or biodiesel made from soybean oil, canola oil or inedible corn oil. Such gelling can lead to plugged fuel filters and other fuel handling and performance problems for customers and suppliers. Reduced demand in the winter for our higher cloud point biodiesel can result in excess supply of such higher cloud point biodiesel and lower prices for such higher cloud point biodiesel. In addition, most of our production facilities are located in colder Midwestern states and our costs of shipping increases as more biodiesel is transported to warmer climate states during winter. The seasonable demand factor is somewhat offset by higher blended heating oil demand in the Northeastern United States.
RIN prices may also be subject to seasonal fluctuations. The RIN is dated for the calendar year in which it is generated, commonly referred to as the RIN vintage. Since 20% of an Obligated Party's annual RVO can be satisfied by prior year RINs, most RINs must come from biofuel produced or imported during the RVO year. As a result, RIN prices can be expected to decrease as the calendar year progresses if the RIN market is oversupplied compared to that year's RVO and prices may increase if the market is undersupplied. For example, during 2013, biomass-based diesel RIN generation was 1.78 billion gallons when the RVO for biomass-based diesel was 1.28 billion gallons, resulting in declining RIN prices during the third and fourth quarters as production rates exceeded the RVO. For 2014, biomass-based diesel RIN generation was 1.75 billion gallons while the RVO was finalized at 1.63 billion for 2014. In 2015, biomass-based diesel RIN generation was 1.81 billion gallons versus a finalized RVO volume set at 1.73 billion. In 2016, biomass-based diesel RIN generation was 2.6 billion gallons versus a finalized RVO volume set at 1.9 billion gallons.
Industry capacity and production
Our operating results are influenced by our industry’s capacity and production, including in relation to RFS2 production requirements. According to EMTS data, approximately 1.1 billion gallons of biomass-based diesel was produced in the United States in 2011, primarily reflecting the recommencement of, or increase in, operations at underutilized facilities in response to RFS2 requirements. Such production was in excess of the 800 million gallon RFS2 requirement for 2011. During 2012, according to EMTS data, approximately 1.1 billion gallons of biomass-based diesel was produced, which also was above RFS2 required volumes of 1 billion gallons of biomass-based diesel for 2012. Production in 2011, 2012 and 2013 was in excess of continued expanding RFS2 volume requirements. As reported by EMTS, the biomass-based diesel RIN generation was 1.78 billion gallons in 2013 when the RVO for biomass-based diesel was 1.28 billion. Biomass-based diesel production, as reported by EMTS was 1.81 billion gallons for 2015, 600 million gallons higher than 2014. In 2016, according to EMTS data, 2.6 billion gallons of biomass-based diesel was produced and/or imported into the U.S., compared to the equivalent 1.81 billion gallons in 2015.
During 2016 and 2015, the amount of imported biodiesel gallons qualifying under RFS2 has increased from 334.2 million gallons in 2015 to approximately 692.9 million gallons in 2016, based on the information from the Energy Information Administration. Imported gallons will likely make up a growing percentage of the RVO, as the EPA has approved a plan to allow Argentinian biodiesel made from soybean oil to qualify for RINs generation. Under RFS2, Obligated Parties are entitled to satisfy up to 20% of their annual requirement with prior year RINs.
Components of Revenues and Expenses
39
We derive revenues in our Biomass-based diesel segment from the following sources:
• | sales of biodiesel and renewable hydrocarbon diesel produced at our facilities, including RINs and LCFS credits, transportation, storage and insurance costs to the extent paid for by our customers; |
• | revenues from our sale of biomass-based diesel and RINs produced by third parties through toll manufacturing arrangements with us; |
• | resale of finished biomass-based diesel, RINs and LCFS credits acquired from third parties, and raw material feedstocks acquired from others; |
• | revenues from our sale of petroleum-based heating oil and ultra-low sulfur diesel, or ULSD, acquired from third parties, along with the sale of these petroleum-based products further blended with biodiesel produced at our wholly owned facilities; |
• | sales of glycerin, other co-products of the biomass-based diesel production process; and |
• | incentive payments from federal and state governments, including the BTC, and from the USDA Advanced Biofuel Program. |
We derive revenues in our Services segment from the following sources:
• | fees received from operations management services that we provide for biomass-based diesel production facilities, typically based on production rates and profitability of the managed facility; and |
• | amounts received for services performed by us in our role as general contractor and construction manager for upgrades and repairs to our biomass-based diesel production facilities. |
We derive revenues in our Renewable Chemicals segment from the following sources:
• | collaborative research and development and other service revenue for research and development activities to continue to build out the technology platform; and |
• | sales of renewable chemical products. |
Cost of goods sold for our Biomass-based diesel segment includes:
• | with respect to our production facilities, expenses incurred for feedstocks, catalysts and other chemicals used in the production process, leases, utilities, depreciation, salaries and other indirect expenses related to the production process, and, when required by our customers, transportation, storage and insurance; |
• | with respect to biomass-based diesel acquired from third parties produced under toll manufacturing arrangements, expenses incurred for feedstocks, transportation, catalysts and other chemicals used in the production process and toll processing fees paid to the facility producing the biomass-based diesel; |
• | with respect to finished goods and RINs acquired from third parties, the purchase price of biomass-based diesel and RINs on the spot market or under contract, and related expenses for transportation, storage, insurance, labor and other indirect expenses; |
• | adjustments made to reflect the lower of cost or market values of our finished goods inventory, including RINs acquired from third parties; |
• | expenses from the purchase of petroleum-based heating oil and ULSD acquired from third parties; and |
• | changes during the applicable accounting period in the market value of derivative and hedging instruments, such as exchange traded contracts, related to feedstocks and commodity fuel products. |
Cost of goods sold for our Services segment includes:
• | with respect to our facility management and operations activities, primarily salary expenses for the services of management employees for each facility and others who provide procurement, marketing and various administrative functions; and |
• | with respect to our construction management services activities, primarily our payments to subcontractors constructing the production facility and providing the biomass-based diesel processing equipment, and, to a much lesser extent, salaries and related expenses for our employees involved in the construction process. |
Cost of goods sold for our Renewable Chemicals segment includes:
• | research and development activities specifically related to the collaborative research and development projects; and |
• | with regards to our production of renewable chemical expenses incurred for feedstocks, catalysts and other chemicals used in the production process, leases, utilities, depreciation, salaries and other indirect expenses related to the production process, and, when required by our customers, transportation, storage and insurance. |
40
Selling, general and administrative expense consists of expenses generally involving corporate overhead functions and operations at our Ames, Iowa, international operations and regional offices.
Research and development expenses are mainly related to activities of our Renewable Chemicals segment, which is seeking to bring industrial biotechnology products to market and drive growth.
Impairment of property, plant and equipment represents non cash impairment charges of certain property, plant and equipment items.
Other income (expense), net is primarily comprised of the change in fair value of contingent considerations, gain on debt extinguishment related to the repurchase of partial principal amounts of our 2019 Convertible Notes, changes in fair value of convertible debt conversion liability, interest expense including the accretion of convertible debt and amortization of deferred financing costs, and interest income and gain on involuntary conversion, which represents the amount of insurance proceeds in excess of the net book value of the property damage recorded by us related to the April 2015 fire at our Geismar facility.
Critical Accounting Policies
Our discussion and analysis of our financial condition and results of operations is based upon our financial statements, which have been prepared in accordance with accounting principles generally accepted in the United States. The preparation of these financial statements requires us to make estimates and judgments that affect the reported amount of assets, liabilities, equities, revenues and expenses and related disclosure of contingent assets and liabilities. We evaluate our estimates on an ongoing basis. We base our estimates on historical experience and on various other assumptions that we believe to be reasonable under the circumstances, the results of which provide the basis for judgments we make about the carrying values of assets and liabilities that are not readily apparent from other sources. Because these estimates can vary depending on the situation, actual results may differ from the estimates.
We believe the following critical accounting policies affect our more significant judgments used in the preparation of our consolidated financial statements:
Revenue recognition.
We recognize revenues from the following sources:
• | the sale of biomass-based diesel, including RINs, LCFS credits, biomass-based diesel co-products and raw material feedstocks purchased by us or produced by us at owned manufacturing facilities, leased manufacturing facilities and manufacturing facilities with which we have tolling arrangements; |
• | resale of finished biomass-based diesel, including RINs, LCFS credits and raw material feedstocks acquired from others; |
• | revenues from our sale of petroleum-based heating oil and ultra-low sulfur diesel, or ULSD, acquired from third parties, along with the sale of these items further blended with biodiesel produced at our facilities or purchased from third parties; |
• | fees received under toll manufacturing agreements with third parties; |
• | fees received from federal and state incentive programs for renewable fuels; |
• | fees received for the marketing and sales of biomass-based diesel produced by third parties; and |
• | revenue from collaborative research and development and other service activities. |
Biomass-based diesel sales as well as RINs, LCFS credits and raw material feedstock revenues are recognized when there is persuasive evidence of an arrangement, delivery has occurred, the price has been fixed or is determinable and collectability can be reasonably assured.
Revenues associated with governmental incentive programs are recognized when the amount to be received is determinable, collectability is reasonably assured and the sale of product giving rise to the incentive has been recognized. Our revenue from governmental incentive programs is generally comprised of amounts received from the USDA Advanced Biofuel Program, or the USDA Program, and the biodiesel tax credit. For a discussion of the biodiesel tax credit, see the section entitled “Risk factors-Loss of or reductions in tax incentives for biomass-based diesel production or consumption may have a material adverse effect on industry revenues and operating margins” and “Factors Influencing Our Results of Operations-Governmental programs favoring biomass-based diesel production and use.” In connection with the biodiesel tax credit, we file a claim with the Internal Revenue Service, or IRS, for a refund of excise taxes each week for gallons we have blended to B99.9 and sold during the prior week. The biodiesel tax credit provided a $1.00 refundable tax credit per gallon. On December 18, 2015, the Protecting Americans from Tax Hikes Act of 2015 was signed into law, which reinstated and extended a set of tax provisions,
41
including the retroactive reinstatement for 2015 and extension for 2016 of the federal biodiesel mixture excise tax credit, which lapsed after December 31, 2016.
Fees for managing ongoing operations of third party plants, marketing biomass-based diesel produced by third party plants and from other services are recognized as services are provided. We also have performance-based incentive agreements that are included as management service revenues. These performance incentives are recognized as revenues when the amount to be received is determinable and collectability is reasonably assured.
Impairment of Long-Lived Assets and Certain Identifiable Intangibles.
We have three partially constructed production facilities and one non-operational production facility. In 2007, the Company commenced construction of two 60 mmgy production facilities, one near New Orleans, Louisiana and the other in Emporia, Kansas. In 2008, the Company halted construction of these facilities as a result of conditions in the biomass-based diesel industry and the credit markets. Construction of the New Orleans facility is approximately 45% complete and construction of the Emporia facility was approximately 20% complete. In September 2010, the Company acquired a 15 mmgy production facility in Clovis, New Mexico which is approximately 50% complete. Currently, the Clovis facility is being operated as a terminal. In November 2012, the Company completed our acquisition of Bulldog Biodiesel, LLC, a 15 mmgy production facility near Atlanta, Georgia, that was non-operational at the time the Company purchased it and will remain idled until certain repairs or upgrades are made.
We review long-lived assets, including property, plant and equipment and definite-lived intangible assets for impairment when circumstances dictate. Such evaluations generally are focused on our plants - regardless of whether they are operating, are under construction or are currently on a “construction hold.” The latter assets are those that receive the most attention as their future cash flows are subject to the most uncertainty. Asset are impaired if the undiscounted net cash flows estimated to be generated by those assets are less than their carrying amounts. If estimated future undiscounted cash flows are not sufficient to recover the carrying value of the assets, an impairment charge is recorded for the amount by which the carrying amount of the assets exceeds its fair value. Fair value is determined by management estimates using discounted cash flow calculations. The estimate of cash flows arising from the future use of the asset that are used in the impairment analysis requires judgment regarding what we would expect to recover from the future use of the asset.
Other Considerations - Means of financing of facilities under construction or construction on hold: In 2008, we halted construction on our New Orleans, Louisiana and Emporia, Kansas facilities as a result of conditions in the biomass-based diesel industry and the credit markets. Other than with respect to the Emporia facility discussed further below, we continue to pursue financing and intend to complete the facilities when industry conditions improve and financing becomes available on terms satisfactory to us. Since construction halted at these facilities in 2008, we have continued to monitor the construction sites and perform routine maintenance on the partially constructed assets. We also have pursued programs under which we could obtain a government guarantee to enhance our ability to obtain financing for these facilities. We will continue to pursue such government programs in the future to the extent they arise. If available, we would also consider using funds from operations to fund a portion of the construction at these facilities. As currently configured, the assets can be completed as biomass-based diesel production facilities, or with alternative or additional capabilities for the manufacture of specialty chemicals or other renewable products such as advanced biofuels and renewable chemicals. Some of the existing components could be transported for use at our other production facility locations, or they could be sold to third parties for various uses.
Our undiscounted cash flows analysis at the end of the third quarter of 2016 indicated that the estimated cash flows would be sufficient to cover the carrying values of our New Orleans, Atlanta, Clovis and Emporia facilities, which amounted to $46.4 million, $2.6 million, $2.6 million and $17.1 million respectively at September 30, 2016. There were no changes in the carrying amounts of our New Orleans, Atlanta and Clovis facilities between September 30, 2016 and December 31, 2016. Late during the last quarter of 2016, we recorded impairment charges of $15.6 million, which reflected the difference between the carrying amount and the estimated salvage value of our Emporia facility as a result of competition from foreign, imported product and the probability of that project being completed in the near term is unlikely. We believe this site continues to be a good opportunity for future biorefinery operations. We used external consultants to assist with the impairment calculation in establishing salvage value of certain assets. In 2015, we recorded property, plant and equipment impairments of approximately $12.4 million due to the April and September 2015 fire at our Geismar facility, which was offset in full by our property insurance proceeds.
There were no other asset impairment charges for the years ended December 31, 2016, 2015 or 2014. Refer to “Note 2 – Summary of Significant Accounting Policies” to our consolidated financial statements.
42
Results of Operations
Fiscal years ended December 31, 2016 and December 31, 2015
Set forth below is a summary of certain financial information (dollars in thousands and gallons in millions except per gallon data) for the periods indicated:
Twelve Months Ended December 31, | |||||||
2016 | 2015 | ||||||
Gallons sold | 567.1 | 374.7 | |||||
Average B100 price per gallon | $ | 3.17 | $ | 2.97 | |||
Revenues | $ | 2,041,232 | $ | 1,387,344 | |||
Costs of goods sold | 1,869,716 | 1,276,801 | |||||
Gross profit | 171,516 | 110,543 | |||||
Selling, general and administrative expenses | 88,285 | 73,397 | |||||
Research and development expense | 18,163 | 16,851 | |||||
Impairment of property, plant and equipment | 17,893 | — | |||||
Impairment of goodwill | — | 175,028 | |||||
Income (loss) from operations | 47,175 | (154,733 | ) | ||||
Other income (expense), net | 1,806 | (5,678 | ) | ||||
Income tax benefit (expense) | (4,268 | ) | 8,701 | ||||
Net income (loss) | 44,713 | (151,710 | ) | ||||
Less—Net income (loss) attributable to noncontrolling interests | 386 | (318 | ) | ||||
Net income (loss) attributable to the Company | 44,327 | (151,392 | ) | ||||
Effects of participating share-based awards | (874 | ) | — | ||||
Net income (loss) attributable to the Company’s common stockholders | $ | 43,453 | $ | (151,392 | ) | ||
Revenues. Our total revenues increased $653.9 million, or 47%, to $2,041.2 million for the year ended December 31, 2016, from $1,387.3 million for the year ended December 31, 2015. This increase was primarily due to a 51% increase in gallons sold and increased government incentives revenues, as well as improving average selling prices throughout the year as a result of a more stable energy market. The majority of the increase in the gallons sold was a result from the Grays Harbor, and Geismar operating throughout 2016 and the Madison facility from March 2016.
Biomass-based diesel revenues including government incentives increased $651.9 million, or 47%, to $2,039.1 million during the year ended December 31, 2016, from $1,387.1 million for the year ended December 31, 2015. The BTC contributed $100.8 million to the increase in biomass-based diesel revenue for the year ended December 31, 2016. Our average B100 sales price per gallon increased $0.20, or 7%, to $3.17 during the year ended December 31, 2016, compared to $2.97 during the year ended December 31, 2015. The increase in average sales price from 2015 to 2016 contributed to a $74.9 million revenue increase when applied to the number of gallons sold during 2015. Gallons sold increased 192.4 million, or 51%, to 567.1 million during the year ended December 31, 2016, compared to 374.7 million during the year ended December 31, 2015. The increase in gallons sold for the year ended December 31, 2016 accounted for a revenue increase of $609.9 million using 2016 average sales pricing. During 2016, we recorded $15.1 million in an initial and partial settlement of our business interruption insurance claim related to the September 2015 fire at our Geismar facility as an increase to our biomass-based diesel revenues. Sales of separated RIN inventory were $274.8 million and $186.5 million for the years ending December 31, 2016 and 2015, respectively.
Costs of goods sold. Our costs of goods sold increased $592.9 million, or 46%, to $1,869.7 million for the year ended December 31, 2016, from $1,276.8 million for the year ended December 31, 2015. Costs of goods sold as a percentage of revenues were 92% for the years ended December 31, 2016 and 2015.
Biomass-based diesel costs of goods sold increased in 2016 due to a 51% increase in gallons sold. Average lower cost feedstocks prices for the year ended December 31, 2016 were $0.28 per pound, compared to $0.27 per pound for the year ended December 31, 2015. Average soybean oil costs for the year ended December 31, 2016 were $0.33 per pound in comparison to $0.32 per pound for the year ended December 31, 2015. We recorded risk management losses of $35.4 million from our derivative financial instrument activity in 2016, compared to risk management gains of $36.0 million for 2015. This fluctuation in risk management gains and losses was mainly due to the volatility in the commodities market. The current three-year
43
average, which incorporates 2016 risk management losses, represents an average income of $0.05 per gallon sold. In addition, the movements in the value of RINs during 2016 resulted in a $19.4 million write-down to lower of cost or net realizable value, which was mainly based on the future contracted RIN prices, on RIN inventory held throughout the year compared to a write-down of $9.0 million during 2015. Costs of goods sold for separated RIN inventory sales excluding lower of cost write-downs were $231.4 million and $173.7 million for the years ending December 31, 2016 and 2015, respectively.
Selling, general and administrative expenses. Our selling, general and administrative, or SG&A, expenses were $88.3 million for the year ended December 31, 2016, compared to $73.4 million for the year ended December 31, 2015. SG&A expenses increased $14.9 million, or 20%, for the year ended December 31, 2016 as compared to the year ended December 31, 2015. As a percentage of revenues, our SG&A expenses were 4.3% and 5.3% for the year ended December 31, 2016 and 2015, respectively. The increase year over year was primarily due to a $11.6 million increases in employee related expenses as headcount increased from prior year acquisitions supporting growth and a $3.3 million increase in professional services expenses, largely associated with international expansion, the Geismar fire and to support our growth.
Research and development expense. Our research and development expenses were $18.2 million for the year ended December 31, 2016, compared to $16.9 million for the year ended December 31, 2015. The majority of the research and development expenses involved our Life Sciences business.
Impairment of property, plant and equipment. Late during the year ended December 31, 2016, we recorded impairment charges of $15.6 million against property, plant and equipment assets at our partially completed facility in Emporia, Kansas. The impairment charge resulted from competition from foreign, imported product and the probability of that project being completed in the near term is unlikely. In addition, we recorded impairment charges of $2.3 million against certain plant property, plant and equipment at our other facilities as the carrying amounts of these amounts were deemed not recoverable given the assets deteriorating physical conditions identified in the last quarter of 2016. The amount of property, plant and equipment impairment recorded in 2015 was approximately $12.4 million due to the April and September 2015 fires at our Geismar facility, which was offset in full by our property insurance proceeds.
Impairment of goodwill. We recorded a non-cash impairment charge of $175.0 million of goodwill for the year ended December 31, 2015. There were no impairments of goodwill recorded during 2016.
Other income (expense), net. Other income was $1.8 million for the year ended December 31, 2016 compared to other expense of $5.7 million for the year ended December 31, 2015. Other income (expense) is primarily comprised of change in fair value of contingent consideration, interest expense, interest income and other non-operating items. The increase in the overall other income of $7.5 million was mainly due to a gain on debt extinguishment of $2.3 million related to the repurchase of $69.9 million principal amount of the 2019 Convertible Notes, changes in fair value of convertible debt conversion liability of $13.0 million related to the newly issued 2036 Convertible Notes and gain on involuntary conversion of $9.9 million, which represented the amount of insurance proceeds in excess of the net book value of the property damage recorded by us related to the April 2015 and September 2015 fires at our Geismar facility. Our insurance policies cover replacement costs incurred to replace the property damaged by the fires. The overall increase in other income in 2016 was partially offset with the change in fair value of contingent consideration related to previous acquisitions in the amount of $7.9 million and a $4.1 million increase in interest expense as a result of the issuance of the 2036 Convertible Notes.
Income tax expense. There was an income tax expense recorded during the year ended December 31, 2016 of $4.3 million, compared to an income tax benefit of $8.7 million for the year ended December 31, 2015. At December 31, 2016 and 2015, we had net deferred income tax assets of approximately $344.8 million and $231.0 million, respectively, with a valuation allowance of $365.0 million and $250.2 million, respectively. As a result, our effective tax rate was 8.7% and 5.4% for the years ended December 31, 2016 and 2015, respectively. We have an income tax receivable of $4.5 million and $1.8 million as of December 31, 2016 and 2015, respectively.
Effects of participating share-based awards. Effects of participating restricted stock units was $0.9 million and $0.0 million for the years ended December 31, 2016 and 2015, respectively.
Fiscal years ended December 31, 2015 and December 31, 2014
Set forth below is a summary of certain financial information (dollars in thousands and gallons in millions except per gallon data) for the periods indicated:
44
Twelve Months Ended December 31, | |||||||
2015 | 2014 | ||||||
Gallons sold | 374.7 | 287.3 | |||||
Average B100 price per gallon | $ | 2.97 | $ | 3.62 | |||
Revenues | $ | 1,387,344 | $ | 1,273,831 | |||
Costs of goods sold | 1,276,801 | 1,113,219 | |||||
Gross profit | 110,543 | 160,612 | |||||
Selling, general and administrative expenses | 73,397 | 62,681 | |||||
Research and development expense | 16,851 | 12,424 | |||||
Impairment of goodwill | 175,028 | — | |||||
Income (loss) from operations | (154,733 | ) | 85,507 | ||||
Other income (expense), net | (5,678 | ) | 603 | ||||
Income tax expense | 8,701 | (3,572 | ) | ||||
Net income (loss) | (151,710 | ) | 82,538 | ||||
Less---Net loss attributable to noncontrolling interest | (318 | ) | (73 | ) | |||
Net income (loss) attributable to the Company | (151,392 | ) | 82,611 | ||||
Change in undistributed dividends allocated to preferred stockholders | — | 378 | |||||
Distributed dividends to preferred stockholders | — | (40 | ) | ||||
Effects of participating preferred stock | — | (91 | ) | ||||
Effects of participating share-based awards | — | (1,238 | ) | ||||
Net income (loss) attributable to the Company’s common stockholders | $ | (151,392 | ) | $ | 81,620 | ||
Revenues. Our total revenues increased $113.5 million, or 9%, to $1,387.3 million for the year ended December 31, 2015, from $1,273.8 million for the year ended December 31, 2014. This increase was primarily attributable to the volume increases in 2015 as compared to 2014 as a result of our international expansion and increased domestic sales. The increase was offset by the decline of biomass-based diesel pricing as a result of the drop in energy prices, such as crude oil and heating oil, in conjunction with lost revenues due to our Geismar facility being shut down for repairs from the April and September fires.
Biomass-based diesel revenues including government incentives increased $113.7 million, or 9%, to $1,387.1 million during the year ended December 31, 2015, from $1,273.4 million for the year ended December 31, 2014. The 2015 revenues reflected a net benefit of $95.0 million in government incentive revenue as a result of the December 18, 2015 retroactive reinstatement of the federal biodiesel mixture excise tax credit for 2015 and the net effect of an increase in gallons sold, but coupled with a decrease in biomass-based diesel prices. The increase in gallons sold reflects a full-year inclusion of our majority-owned international sales activity in addition to increased throughput across our production facilities. Due to lower RIN and energy prices in 2015, our average B100 sales price per gallon decreased $0.65, or 18%, to $2.97 during the year ended December 31, 2015, compared to $3.62 during the year ended December 31, 2014. The decrease in average sales price from 2014 to 2015 contributed to a $186.7 million revenue decrease when applied to the number of gallons sold during 2014. Gallons sold increased 87.4 million, or 30%, to 374.7 million during the year ended December 31, 2015, compared to 287.3 million during the year ended December 31, 2014. The increase in gallons for the year ended December 31, 2015 accounted for a revenue increase of $259.6 million using 2015 average sales pricing. The increase in biomass-based diesel government incentives was mainly due to the increase in gallons sold and that market participants were acting as if the biodiesel tax credit would be reinstated throughout the year. Sales of separated RIN inventory were $186.5 million and $130.2 million for the years ending December 31, 2015 and 2014, respectively.
Costs of goods sold. Our costs of goods sold increased $163.6 million, or 15%, to $1,276.8 million for the year ended December 31, 2015, from $1,113.2 million for the year ended December 31, 2014. Costs of goods sold as a percentage of revenues were 92% and 87% for the years ended December 31, 2015 and 2014, respectively. The increase in costs of goods sold as a percentage of revenues in 2015 was primarily due to the net effect of lower revenues per gallon, which was a direct impact of the drop in crude oil prices on biomass-based diesel prices and slightly offset by lower feed stock costs in 2015 as compared to 2014. Average lower cost feedstocks prices for the year ended December 31, 2015 was $0.27 per pound, compared to $0.33 per pound for the year ended December 31, 2014. Average soybean oil costs for the year ended December 31, 2015 was $0.32 per pound in comparison to $0.38 per pound for the year ended December 31, 2014. Due to the significant decline in energy market prices such as crude oil and heating oil throughout 2015, we had gains of $36.0 million from risk management trading
45
activity for the year ended December 31, 2015, compared to gains of $61.6 million from risk management trading for the year ended December 31, 2014, respectively. Over the last three years prior to 2015, risk management gains have represented an average income of $0.07 per gallon sold. The current three-year average, which incorporates 2015 risk management gains, represents an average income of $0.10 per gallon sold. In addition, the decrease in the value of RINs during 2015 resulted in a $9.0 million write-down to lower of cost or market on RIN inventory held throughout the year compared to a write-down of $4.3 million during 2014. Costs of goods sold for separated RIN inventory sales were $182.7 million and $119.8 million for the years ending December 31, 2015 and 2014, respectively.
Selling, general and administrative expenses. Our selling, general and administrative, or SG&A, expenses were $73.4 million for the year ended December 31, 2015, compared to $62.7 million for the year ended December 31, 2014. SG&A expenses increased $10.7 million, or 17%, for the year ended December 31, 2015 as compared to the year ended December 31, 2014. As a percentage of revenues, our SG&A expenses were 5.3% and 4.9% for the year ended December 31, 2015 and 2014, respectively. This increase was driven mainly from a $7.5 million increase due to international expansion as we included twelve month operating results of Petrotec, a $1.5 million increase in legal and professional fees incurred to support our growth and international expansion, a $0.8 million increase in depreciation expense, $1.8 million increase in information technology and insurance expenses. These increases were offset by a decrease in bad debt expense of approximately $2.9 million.
Research and development expense. Our research and development expenses were $16.9 million for the year ended December 31, 2015, compared to $12.4 million for the year ended December 31, 2014. The increase in research and development expenses was primarily due to the increased research and development activities to bring products to market and drive growth, mainly in regards to our REG Life Sciences business focusing on microbial fermentation to develop and produce renewable chemicals, fuels and other products.
Impairment of goodwill. We recorded a non-cash impairment charge of $175.0 million of goodwill for the year ended December 31, 2015. There were no impairments recorded during 2014. This impairment charge represents a complete write-off of goodwill in the Biomass-based Diesel and Renewable Chemicals reporting units. The impairment charge was as a result of our second goodwill impairment test, as we determined that triggering events had occurred subsequent to our annual goodwill impairment testing at July 31, 2015 due to the continued decline in our results of operations and the decrease in our common stock price and market capitalization.
Other income (expense), net. Other expense was $5.7 million for the year ended December 31, 2015 compared to other income of $0.6 million for the year ended December 31, 2014. Other income (expense) is primarily comprised of change in fair value of contingent consideration, interest expense, interest income, bargain purchase gain and other non-operating items. The decrease in the overall other income (expense) of $6.3 million was mainly due to the bargain purchase gain of $5.4 million, which was offset by an increase in interest expense of $5.2 million as a full-year interest expense was recorded in 2015 on our Convertible Notes and losses due to change in fair value of contingent consideration of $0.4 million compared to a gain of $6.6 million in 2014.
Income tax expense. There was an income tax benefit recorded during the year ended December 31, 2015 of $8.7 million, compared to an income tax expense of $3.6 million for the year ended December 31, 2014. At December 31, 2015 and 2014, we had net deferred income tax assets of approximately $231.0 million and $114.7 million, respectively, with a valuation allowance of $250.2 million and $136.5 million, respectively. As a result, our effective tax rate was 5.4% and 4.1% for the years ended December 31, 2015 and 2014, respectively. We have an income tax receivable of $1.8 million and $2.8 million as of December 31, 2015 and 2014, respectively.
Gain on redemption of preferred stock. We recognized a gain of $0.4 million which represents the difference between the carrying amount and the amount we paid to redeem all of the then outstanding Series B Preferred Stock shares in March 2014. There was no redemption gain (loss) on preferred stock in 2015.
Effects of participating preferred stock. There was no effect from participating preferred stock in 2015. The effect was $0.1 million for the year ended December 31, 2014.
Effects of participating share-based awards. Effects of participating restricted stock units was $0.0 million and $1.2 million for the years ended December 31, 2015 and 2014, respectively.
Adjusted EBITDA
We use earnings before interest, taxes, depreciation and amortization, adjusted for certain additional items, identified in the table below, or Adjusted EBITDA, as a supplemental performance measure. We present Adjusted EBITDA because we believe it assists investors in analyzing our performance across reporting periods on a consistent basis by excluding items that we do not believe are indicative of our core operating performance. In addition, we use Adjusted EBITDA to evaluate, assess
46
and benchmark our financial performance on a consistent and a comparable basis and as a factor in determining incentive compensation for our executives.
The following table provides our Adjusted EBITDA for the periods presented, as well as a reconciliation to net income:
Year ended December 31, | Year ended December 31, | ||||||||||||||||||||||||||||||||||||||
(In thousands) | 1Q-2016 | 2Q-2016 | 3Q-2016 | 4Q-2016 | 2016 | 1Q-2015 | 2Q-2015 | 3Q-2015 | 4Q-2015 | 2015 | |||||||||||||||||||||||||||||
Net income (loss) | $ | (6,888 | ) | $ | 7,714 | $ | 23,505 | $ | 20,382 | $ | 44,713 | $ | (38,304 | ) | $ | (2,163 | ) | $ | (15,671 | ) | $ | (95,572 | ) | $ | (151,710 | ) | |||||||||||||
Adjustments: | |||||||||||||||||||||||||||||||||||||||
Income tax (benefit) expense | 728 | 1,296 | (1,203 | ) | 3,447 | 4,268 | (897 | ) | (707 | ) | (1,050 | ) | (6,047 | ) | (8,701 | ) | |||||||||||||||||||||||
Interest expense | 3,311 | 3,738 | 4,487 | 4,451 | 15,987 | 2,743 | 2,928 | 2,921 | 3,275 | 11,867 | |||||||||||||||||||||||||||||
Other income (expense), net | 88 | (15,738 | ) | (2,699 | ) | 2,546 | (15,803 | ) | (565 | ) | (1,779 | ) | 462 | 1,410 | (472 | ) | |||||||||||||||||||||||
Change in fair value of contingent consideration | (15 | ) | 3,571 | 1,124 | 3,224 | 7,904 | 293 | (2,121 | ) | 1,106 | 363 | (359 | ) | ||||||||||||||||||||||||||
Gain on involuntary conversion | (3,543 | ) | (997 | ) | (3,470 | ) | (1,884 | ) | (9,894 | ) | — | — | — | — | — | ||||||||||||||||||||||||
Gain on bargain purchase | — | — | — | — | — | — | — | (5,358 | ) | — | (5,358 | ) | |||||||||||||||||||||||||||
Impairment of goodwill | — | — | — | — | — | — | — | — | 175,028 | 175,028 | |||||||||||||||||||||||||||||
Impairment of assets (2) | — | — | — | 17,893 | 17,893 | — | — | — | — | — | |||||||||||||||||||||||||||||
Straight-line lease expense | (94 | ) | (80 | ) | (73 | ) | (38 | ) | (285 | ) | (158 | ) | (145 | ) | (19 | ) | (94 | ) | (416 | ) | |||||||||||||||||||
Depreciation | 7,674 | 7,824 | 7,949 | 8,378 | 31,825 | 5,613 | 6,134 | 6,261 | 6,989 | 24,997 | |||||||||||||||||||||||||||||
Amortization | (140 | ) | (134 | ) | (129 | ) | 46 | (357 | ) | (219 | ) | (206 | ) | (199 | ) | (91 | ) | (715 | ) | ||||||||||||||||||||
Other | — | — | — | — | — | 197 | 162 | (4 | ) | 486 | 841 | ||||||||||||||||||||||||||||
Biodiesel tax credit (1) | — | — | — | — | — | 15,745 | 22,883 | 27,264 | (65,892 | ) | — | ||||||||||||||||||||||||||||
Non-cash stock compensation | 1,076 | 858 | 2,133 | 1,829 | 5,896 | 1,080 | 1,156 | 1,191 | 1,734 | 5,161 | |||||||||||||||||||||||||||||
Adjusted EBITDA | $ | 2,197 | $ | 8,052 | $ | 31,624 | $ | 60,274 | $ | 102,147 | $ | (14,472 | ) | $ | 26,142 | $ | 16,904 | $ | 21,589 | $ | 50,163 | ||||||||||||||||||
(1) | On December 18, 2015, the Protecting Americans from Tax Hikes Act of 2015 was signed into law, which reinstated and extended a set of tax provisions, including the retroactive reinstatement for 2015 and extension for 2016 of the federal biodiesel mixture excise tax credit. The retroactive credit for 2015 resulted in a net benefit to us that was recognized in the fourth quarter of 2015, however because this credit relates to the full year operating performance and results, we allocated the first three quarters of 2015, respectively, based upon gallons sold and excluded those amounts from the fourth quarter 2015 Adjusted EBITDA. |
(2) | Represents the impairment charge to write down the carrying value of certain assets, mostly attributed to the Company's Emporia facility, to remaining salvage value. |
Adjusted EBITDA is a supplemental performance measure that is not required by, or presented in accordance with, generally accepted accounting principles, or GAAP. Adjusted EBITDA should not be considered as an alternative to net income or any other performance measure derived in accordance with GAAP, or as alternatives to cash flows from operating activities or a measure of our liquidity or profitability. Adjusted EBITDA has limitations as an analytical tool, and should not be considered in isolation, or as a substitute for any of our results as reported under GAAP. Some of these limitations are:
• | Adjusted EBITDA does not reflect our cash expenditures for capital assets or the impact of certain cash clauses that we consider not to be an indication of our ongoing operations; |
• | Adjusted EBITDA does not reflect changes in, or cash requirements for, our working capital requirements; |
• | Adjusted EBITDA does not reflect the interest expense, or the cash requirements necessary to service interest or principal payments, on our indebtedness; |
• | although depreciation and amortization are non-cash charges, the assets being depreciated and amortized will often have to be replaced in the future, and Adjusted EBITDA does not reflect cash requirements for such replacements; |
47
• | stock-based compensation expense is an important element of our long term incentive compensation program, although we have excluded it as an expense when evaluating our operating performance; and |
• | other companies, including other companies in our industry, may calculate these measures differently than we do, limiting their usefulness as a comparative measure. |
Liquidity and Capital Resources
Sources of liquidity. At December 31, 2016 and 2015, the total of our cash and cash equivalents was $116.2 million and $47.1 million, respectively. At December 31, 2016, we had term debt before debt issuance costs of $217.9 million, compared to term debt before debt issuance costs of $256.6 million at December 31, 2015. This term debt is due in various tranches and the maturities are reflected in the contractual obligations table below. We set aside a total of $4.0 million of restricted cash in the form of certificates of deposits as collateral for certain letters of credit. The debt is subject to various financial covenants. We were in compliance with the restrictive financial covenants associated with the borrowings as of December 31, 2016.
Our term debt before debt issuance costs (in millions) is as follows (total balance may not foot due to rounding):
December 31, | |||||||
2016 | 2015 | ||||||
4.00% Convertible Senior Notes, $152,000 face amount, due in June 2036 | $ | 113.4 | $ | — | |||
2.75% Convertible debt, $73,838 face amount, due in June 2019 | 67.3 | 126.1 | |||||
REG Geismar GOZone bonds, secured, variable interest rate, due in October 2033 | — | 100.0 | |||||
REG Danville term loan | 8.2 | — | |||||
REG Newton term loan | 13.1 | 16.8 | |||||
REG Mason City term loan | 2.7 | 3.7 | |||||
REG Ames term loans | 3.6 | 3.9 | |||||
REG Grays Harbor term loan | 9.3 | 5.2 | |||||
Other | 0.3 | 0.9 | |||||
Total term debt before debt issuance costs | $ | 217.9 | $ | 256.6 | |||
In addition, we had revolving debt (in millions) as follows:
December 31, | |||||||
2016 | 2015 | ||||||
Total revolving loans (current) | $ | 52.8 | $ | 23.1 | |||
Maximum remaining available to be borrowed under the Wells Fargo/Fifth Third and Bankers Trust revolving lines of credit | $ | 100.2 | $ | 23.1 | |||
2019 Convertible Notes
In June 2014, the Company issued $143.8 million in convertible senior notes (the “2019 Convertible Notes”) with a maturity date of June 15, 2019, unless earlier converted or repurchased. The 2019 Convertible Notes bear interest at a rate of 2.75% per annum, payable semi-annually in arrears, beginning December 15, 2014.
The initial conversion rate is 75.3963 shares of Common Stock per $1 principal amount of 2019 Convertible Notes, which represents an initial conversion price of approximately $13.26 per share. The conversion rate will be subject to adjustment in some events but will not be adjusted for any accrued and unpaid interest. Certain corporate events that occur prior to the stated maturity date can cause the Company to increase the conversion rate for a holder.
Prior to December 15, 2018, holders may convert all or any portion of their 2019 Convertible Notes only under certain limited circumstances where the sale price of Common Stock for a period of time is (i) greater than or equal to 130% of the conversion price of the 2019 Convertible Notes on each applicable trading day; (ii) less than 98% of the product of the last reported sale price of the Common Stock and the conversion rate of the 2019 Convertible Notes on each applicable trading day; or (iii) upon the occurrence of specified corporate events. On or after December 15, 2018 until the close of business on the second scheduled trading day immediately preceding the maturity date of the 2019 Convertible Notes, holders may convert their 2019 Convertible Notes at any time, regardless of the foregoing circumstances. Upon conversion, the Company will pay or deliver, as the case may be, cash, shares of Common Stock or a combination of cash and shares of Common Stock, at the
48
Company’s election. The Company's current intent is to settle the principal amount of the 2019 Convertible Notes in cash upon conversion. If the conversion value exceeds the principal amount, the Company would deliver shares of its common stock in respect to the remainder of its conversion obligation in excess of the aggregate principal amount (conversion spread).
The 2019 Convertible Notes are not redeemable at the Company’s option prior to maturity.
We may, from time to time, depending on market conditions and other factors, repurchase our outstanding indebtedness, including our 2019 Convertible Notes, whether or not such indebtedness trades above or below its face amount, for cash and/or in exchange for other securities or other consideration, in each case in open market purchases and/or privately negotiated transactions.
During 2016, we bought back $69.9 million principal amount of the 2019 Convertible Notes in privately negotiated transactions using proceeds from the issuance of the 2036 Convertible Notes discussed below.
2036 Convertible Notes
In June 2016, we issued $152.0 million aggregate principal amount of 4.00% Convertible Senior Notes due 2036 (the “2036 Convertible Notes”) in a private offering to qualified institutional buyers. The 2036 Convertible Notes bear interest at a rate of 4.00% per year payable semi-annually in arrears on June 15 and December 15 of each year, beginning December 15, 2016. The notes will mature on June 15, 2036, unless repurchased, redeemed or converted in accordance with their terms prior to such date.
Prior to December 15, 2035, the 2036 Convertible Notes will be convertible only upon satisfaction of certain conditions and during certain periods as stipulated in the indenture. On or after December 15, 2035 until the close of business on the second scheduled trading day immediately preceding the maturity date, holders of the 2036 Convertible Notes may convert their notes at any time. Unless and until we obtain stockholder approval under applicable NASDAQ Stock Market rules, the 2036 Convertible Notes will be convertible, subject to certain conditions, into cash. If we obtain such stockholder approval, the 2036 Convertible Notes may be settled in cash, our common shares or a combination of cash and our common shares, at our election. We may not redeem the 2036 Convertible Notes prior to June 15, 2021. Holders of the 2036 Convertible Notes will have the right to require us to repurchase for cash all or some of their notes at 100% of their principal, plus any accrued and unpaid interest on each of June 15, 2021, June 15, 2026 and June 15, 2031. Holders of the 2036 Convertible Notes will have the right to require the Company to repurchase for cash all or some of their notes at 100% of their principal, plus any accrued and unpaid interest upon the occurrence of certain fundamental changes. The initial conversion rate is 92.8074 common shares per $1,000 principal amount of 2036 Convertible Notes (equivalent to an initial conversion price of approximately $10.78 per common share).
The net proceeds from the offering of the 2036 Convertible Notes were approximately $147.1 million, after deducting fees and offering expenses of $4.9 million, which was capitalized as debt issuance costs and is being amortized through June 2036. We evaluated the terms of the conversion features under the applicable accounting literature, including Derivatives and Hedging, ASC 815, and determined that the features required separate accounting as a derivative. This derivative was capitalized as a long-term liability, "Convertible Debt Conversion Liability" on the Consolidated Balance Sheets and will be adjusted to reflect fair value each reporting date. The fair value of the convertible debt conversion liability at issuance was $40.1 million.
GOZone bonds
Our subsidiary, REG Geismar, LLC, or REG Geismar, was the obligor with respect to $100.0 million aggregate principal amount of Gulf Opportunity Zone tax-exempt bonds, or GOZone Bonds, originally due in October 2033, through a loan agreement with the Louisiana Public Facilities Authority. REG Geismar’s payment obligations on the GOZone Bonds were supported by a letter of credit issued by a financial institution. REG Geismar was party to an agreement to reimburse the financial institution for any draws on the letter of credit and that obligation was secured by a $101.3 million certificate of deposit by us and pledged in favor of the financial institution. On September 6, 2016, REG Geismar caused the Louisiana Public Facilities Authority to call for redemption all of the outstanding GOZone Bonds as of September 6, 2016. The redemption was funded by application of the funds generated by release of the certificate of deposit.
REG Danville, LLC
On December 19, 2014, one of our subsidiaries, REG Danville, LLC, or REG Danville, entered into a Second Amended and Restated Loan Agreement with Fifth Third Bank which provides for a $12.0 million construction and term loan facility (the
49
“Fifth Third Construction/Term Loan”) that matures on December 19, 2017. Principal of the Fifth Third Construction/Term Loan is currently amortizing in monthly installments of $0.2 million and bears interest based upon LIBOR plus a margin of 4% per annum. In addition, the Fifth Third Construction/Term Loan requires REG Danville to prepay principal based on 50% of its annual excess cash flows. The Fifth Third Construction/Term Loan is secured by the real property and certain personal property of REG Danville and is guaranteed by us. The Fifth Third Construction/Term Loan contains financial covenants which require REG Danville to achieve a minimum fixed charge coverage ratio of at least 1.25 to 1.00, a minimum tangible net worth, and which limits its annual capital expenditures. The Fifth Third Construction/Term Loan contains various loan covenants, including prohibiting it in certain circumstances from making payments to us, and also includes events of default, which in addition to certain customary terms and changes of control of REG Danville, are triggered if REG Danville fails to achieve a specified minimum annual volume of biodiesel production. As of December 31, 2016, there was $8.2 million outstanding under the Fifth Third Construction/Term Loan.
Bankers Trust Line of Credit
On March 16, 2016, REG Energy Services, LLC ("REG Energy Services") entered into a revolving line of credit agreement (the "Energy Services Revolver") with Bankers Trust Company (“Bankers Trust”), which expires March 2017. Pursuant to the Agreement, Bankers Trust agreed to provide a revolving line of credit (the "Line of Credit") to REG Energy Services in the amount of $30.0 million, subject to certain borrowing base limitations based upon REG Energy Services eligible inventory and accounts receivable. Amounts outstanding under the Energy Services Revolver bear variable interest as stipulated in the Agreement. As of December 31, 2016, there was $3.2 million outstanding under the Energy Services Revolver. The Energy Services Revolver contains customary covenants and events of default, which include a limitation on REG Energy Services ability to make distributions to us if an event of default has occurred under the Energy Services Revolver and financial covenants that require REG Energy Services to maintain certain covenants based upon its tangible net worth. REG Energy Services’ obligations under the Energy Services Revolver are secured by certain of its accounts receivable and inventory and are guaranteed by us. The Company is currently working with Bankers Trust to extend or renew the Agreement.
Wells Fargo and Fifth Third Revolver
On September 30, 2016, REG Services Group, LLC and REG Marketing & Logistics, LLC, our wholly-owned subsidiaries entered into a Joinder and Amendment No. 11 to Credit Agreement (the “Amendment”) to that certain Credit Agreement originally dated as of December 23, 2011, by and among Borrowers, the lenders party thereto (“Lenders”) and Wells Fargo Capital Finance, LLC, as the agent, and Fifth Third Bank, as a new lender (as amended, the “M&L and Services Revolver”). Pursuant to the Amendment, the maximum commitment of the Lenders under the M&L and Services Revolver to make revolving loans was increased from $60.0 million to $150.0 million and an accordion feature was added to the M&L and Services Revolver which allows our subsidiaries that are the borrowers under the M&L and Services Revolver to request commitments for additional revolving loans in aggregate amount not to exceed $50.0 million subject to customary conditions, including the consent of Lenders providing such additional commitments. The Amendment extended the maturity date of the M&L and Services Revolver to September 30, 2021. Loans advanced under the M&L and Services Revolver bear interest based on a one-month LIBOR rate (which shall not be less than zero), plus a margin based on Quarterly Average Excess Availability (as defined in the Revolving Credit Agreement), which may range from 1.75% per annum to 2.25% per annum.
The M&L and Services Revolver contains various loan covenants that restrict each subsidiary borrower’s ability to take certain actions, including restrictions on incurrence of indebtedness, creation of liens, mergers or consolidations, dispositions of assets, repurchase or redemption of capital stock, making certain investments, making distributions to us unless certain conditions are satisfied, entering into certain transactions with affiliates or changing the nature of the subsidiary’s business. In addition, the subsidiary borrowers are required to maintain a fixed charge coverage ratio of at least 1.0 to 1.0 if excess availability under the M&L and Services Revolver Revolver is less than 10% of the total $150 million of current revolving loan commitments, or $15 million currently. The M&L and Services Revolver is secured by our subsidiary borrowers’ membership interests and substantially all of their assets. In addition, the M&L and Services Revolver is secured by the accounts receivable and inventory of REG Albert Lea, LLC, REG Houston, LLC, REG New Boston, LLC, and REG Geismar, LLC (collectively, the “Plant Loan Parties”) subject to a $40.0 million limitation with respect to each of the Plant Loan Parties. We guarantee the obligations of the borrowers under the M&L and Services Revolver.
Cash flow. The following table presents information regarding our cash flows and cash and cash equivalents for the years ended December 31, 2016, 2015 and 2014:
50
Year Ended December 31, | |||||||||||
2016 | 2015 | 2014 | |||||||||
(in thousands) | |||||||||||
Net cash flows provided from operating activities | $ | 75,303 | $ | 80,160 | $ | 32,528 | |||||
Net cash flows used in investing activities | (63,765 | ) | (67,922 | ) | (217,033 | ) | |||||
Net cash flows provided from (used in) financing activities | 58,174 | (27,274 | ) | 94,794 | |||||||
Net change in cash and cash equivalents | 69,712 | (15,036 | ) | (89,711 | ) | ||||||
Cash and cash equivalents, end of period | $ | 116,210 | $ | 47,081 | $ | 63,516 | |||||
The historical cash flows shown above illustrate that we have consistently generated positive cash flows from operations. In 2016, we generated $75.3 million of cash from operating activities. We received approximately $243.7 million related to the 2015 reinstatement of the BTC, of which $148.7 million was paid to our vendors and customers. In addition, approximately $58.6 million of operating cash was used to build up our inventories. Our net cash flows used in investing activity was impacted by the release of our restricted cash related to the early redemption of the GOZone Bonds, which was offset by the use of cash to acquire certain assets of Sanimax Energy, along with expenditures made for continued biorefinery capital improvements. The cash receipts from property insurance coverage of $10.9 million helped offset the cash amounts used in other aforementioned investing activities. Our investing activity has historically focused on acquisitions and plant upgrade projects. Only one acquisition was made in each of 2016 and 2015, while there were three acquisitions in 2014. Financing activities have moved hand in hand with our investing activities. Financing activities were impacted by the issuance of the 2036 Convertible Notes and the early redemption of the GOZone Bonds. Total proceeds from the issuance of the 2036 Convertible Notes after issuance costs were approximately $147.4 million, $60.9 million of which was used to extinguish a portion of the 2019 Convertible Notes and $35.1 million of which was used to fund additional share repurchases, in addition to payments made under our share repurchase programs and the additional $6 million repurchase of the 2019 convertible notes in September 2016. Financing activities in 2014 included the 2019 Convertible Notes we issued to finance the Dynamic Fuels and Syntroleum acquisitions. In 2015, there was no significant debt obtained while we spent approximately $23.3 million on our share repurchase program.
Capital expenditures: We have three partially constructed plants, one near New Orleans, Louisiana, one in Clovis, New Mexico and one in Emporia, Kansas along with a non-operational plant near Atlanta, Georgia. We expect additional investments of approximately $165 million to $270 million in the aggregate, excluding working capital requirements, would be required before these plants would be able to commence production. These facilities would add an expected 150 mmgy to our nameplate production capacity. Our Clovis plant is currently being operated as a terminal facility. We plan to make significant capital expenditures when debt or equity financing becomes available to complete construction of these four facilities.
During 2016, our capital expenditures were $60.7 million, including $13.9 million towards the planned $34.5 million upgrade to our Danville facility and $9.1 million in repairs and upgrades to bring our Geismar facility back on-line in March 2016. We began a planned $7.0 million upgrade project at our newly acquired Madison facility in the second quarter of 2016. Our budgeted capital expenditures for 2017 are approximately $60 million to $75 million, including upgrades to the Ralston, Madison, Geismar and Grays Harbor facilities, among others.
We continue to be in discussions with lenders in an effort to enter into equity and debt financing arrangements to meet our projected financial needs for facilities under construction and capital improvement projects for our operating facilities. Since these discussions are ongoing, we are uncertain when or if financing will be available. The financing may consist of common or preferred stock, debt, project financing or a combination of these financing techniques. Additional debt would increase our leverage and interest costs and would likely be secured by certain of our assets. Additional equity or equity-linked financings would likely have a dilutive effect on our existing and future stockholders. It is likely that the terms of any project financing would include customary financial and other covenants on our project subsidiaries, including restrictions on the ability to make distributions, to guarantee indebtedness and to incur liens on the plants of such subsidiaries.
Contractual Obligations:
The following table describes our commitments to settle contractual obligations in cash as of December 31, 2016:
51
Payments Due by Period | |||||||||||||||||||
Total | Less Than 1 Year | Years 1-3 | Years 4-5 | More Than 5 Years | |||||||||||||||
(In thousands) | |||||||||||||||||||
Long Term Debt (1) | $ | 265,616 | $ | 21,948 | $ | 99,963 | $ | 3,931 | $ | 139,774 | |||||||||
Contingent Consideration (2) | 46,568 | 17,637 | 28,931 | — | — | ||||||||||||||
Operating Lease Obligations (3) | 112,028 | 18,731 | 42,502 | 13,839 | 36,956 | ||||||||||||||
Purchase Obligations (4) | 27,232 | 3,857 | 10,829 | 5,952 | 6,594 | ||||||||||||||
Other Obligations (5) | 7,645 | — | — | — | — | ||||||||||||||
$ | 459,089 | $ | 62,173 | $ | 182,225 | $ | 23,722 | $ | 183,324 | ||||||||||
(1) | See Note 10 of Item 8 for additional detail. Includes fixed interest associated with these obligations. |
(2) | Represents contingent consideration relating to our acquisitions of LS9, Syntroleum/Dynamic Fuels and Imperium. See Note 4 of Item 8 for additional detail. |
(3) | Operating lease obligations consist of leases of distribution terminals, biomass-based diesel storage facilities, railcars and vehicles. |
(4) | Purchase obligations for our production facilities. |
(5) | Includes commitments, other facility obligations and a $1.9 million of liability for unrecognized tax benefits as the timing and amounts of cash payments are uncertain (the amounts have not been classified by period). |
Off-Balance Sheet Arrangements
We have no off-balance sheet arrangements that have or are reasonably likely to have a current or future effect on our financial condition, changes in financial condition, revenues or expenses, results of operations, liquidity, capital expenditures or capital resources that is material to investors.
Recent Accounting Pronouncements
For a discussion of new accounting pronouncements affecting us, refer to “Note 2 – Summary of Significant Accounting Policies” to our consolidated financial statements.
ITEM 7A. | Quantitative and Qualitative Disclosures about Market Risk |
The primary objectives of our investment activity are to preserve principal, provide liquidity and maximize income without significantly increasing risk. Some of the securities we invest in are subject to market risk. This means that a change in prevailing interest rates may cause the principal amount of the investment to fluctuate. To minimize this risk, we maintain a portfolio of cash equivalents in short-term investments in money market funds.
Commodity Price Risk
Over the period from January 2010 through December 2016, average diesel prices based on Platts reported pricing for Group 3 (Midwest) have ranged from a high of approximately $3.64 per gallon reported in October 2012 to a low of approximately $0.85 per gallon in January 2016, with prices averaging $2.43 per gallon during this period. Over the period January 2010 to December 2016, soybean oil prices (based on daily closing nearby futures prices on the CBOT for crude soybean oil) have ranged from a high of $0.5977 per pound, or $4.48 per gallon of biodiesel in April 2011 to a low of $0.2605 per pound, or $1.95 per gallon in September 2015 assuming 7.5 pounds of soybean oil yields one gallon of biodiesel with closing sales prices averaging $0.4224 per pound or $3.17 per gallon. Over the period from January 2010 through December 2016, animal fat prices (based on prices from The Jacobsen Missouri River, for choice white grease) have ranged from a high of $0.5450 per pound in June 2011 to a low of $0.1600 per pound in December 2015, with sales prices averaging $0.3454 per pound during this period. Over the period from July 2010 through December 2016, RIN prices (based on prices from OPIS) have ranged from a high of $1.99 in September 2011 to a low of $0.24 in November 2013, with sales prices averaging $0.87 during this period.
Adverse fluctuations in feedstock prices as compared to biomass-based diesel prices result in lower profit margins and, therefore, represent unfavorable market conditions. The availability and price of feedstocks are subject to wide fluctuations due to unpredictable factors such as weather conditions during the growing season, rendering volumes, carry-over from the previous crop year and current crop year yields, governmental policies with respect to agriculture and supply and demand, among others.
52
We have prepared a sensitivity analysis to estimate our exposure to market risk with respect to our sales contracts, lower cost feedstock requirements, soybean oil requirements and the related exchange-traded contracts for 2016. Market risk is estimated as the potential loss in fair value, resulting from a hypothetical 10% adverse change in the fair value of our lower cost feedstock and soybean oil requirements and biomass-based diesel sales. The results of this analysis, which may differ from actual results, are as follows:
2016 Volume (in millions) | Units | Hypothetical Adverse Change in Price | Impact on Annual Gross Profit (in millions) | Percentage Change in Gross Profit | ||||||||||
Total Biomass-based Diesel | 567.1 | gallons | 10 | % | $ | (179.8 | ) | (104.5 | )% | |||||
Total Lower Cost Feedstocks | 2,210.7 | pounds | 10 | % | $ | (59.7 | ) | (34.7 | )% | |||||
Total Canola Oil | 572.4 | pounds | 10 | % | $ | (18.9 | ) | (11.0 | )% | |||||
Total Soy Oil | 307.6 | pounds | 10 | % | $ | (10.2 | ) | (5.9 | )% | |||||
We attempt to protect operating margins by entering into risk management contracts that mitigate price volatility of our feedstocks, such as inedible animal fat and inedible corn oil and energy prices. We create offsetting positions by using a combination of forward physical purchases and sales contracts on feedstock and biomass-based diesel, including risk management futures contracts, swaps and options primarily on heating oil and soybean oil; however, the extent to which we engage in risk management activities varies substantially from time to time, and from feedstock to feedstock, depending on market conditions and other factors. A 10% adverse change in the price of NYMEX NY Harbor ULSD would have a negative effect on the fair value of these instruments of $7.8 million. A 10% adverse change in the price of CBOT Soybean Oil would have a negative effect on the fair value of these instruments of $1.4 million.
Interest Rate Risk
REG Newton is subject to interest rate risk relating to its $13.1 million term debt financing from AgStar. Interest will accrue on the outstanding balance of the term loan at 30-day LIBOR plus 400 basis points (effective rate at December 31, 2016 of 4.54%).
We are subject to interest rate risk under our M&L and Services Revolver under which we had $50 million borrowed and outstanding at December 31, 2016. Amounts borrowed under the M&L and Services Revolver bear interestat a per annum rate equal to the one month LIBOR rate plus a margin, which may range from 1.75% per annum to 2.25% per annum, based on the Quarterly Average Excess Availability (as defined in the M&L and Services Revolver). As of December 31, 2016, the effective interest rate under the M&L and Services Revolver was 2.77%.
We are subject to interest rate risk under our Energy Services Revolver, whereby by our wholly owned subsidiary, REG Energy Services can borrow up to $30.0 million, subject to certain borrowing base limitations based upon eligible inventory and accounts receivable. Amounts borrowed under the Energy Services Revolver bear interest at a per annum rate based upon one-month LIBOR rate plus 2.50% per annum.
Following the acquisition of Imperium, we are subject to interest rate risk under a credit agreement with Umpqua Bank, or Umpqua Credit Agreement, whereby our wholly owned subsidiary, REG Grays Harbor, can borrow up to $10.0 million for working capital. Amounts borrowed under the Umpqua Credit Agreement bear interest at a per annum rate at of minimum of 3.50% or Prime Rate plus 0.25%. The nominal rate at December 31, 2016 was 4.30%.
Our weighted average interest rate on variable rate debt balances during 2016 was 3.43% and a hypothetical increase in interest rate of 10% would not have a material effect on our annual interest expenses and consolidated financial statements.
Inflation
To date, inflation has not significantly affected our operating results, though costs for petroleum-based diesel fuel, feedstocks, construction, labor, taxes, repairs, maintenance and insurance are all subject to inflationary pressures. Inflationary pressure in the future could affect our ability to sell the biomass-based diesel we produce, maintain our production facilities adequately, build new biomass-based diesel production facilities and expand our existing facilities as well as the demand for our facility construction management and operations management services.
53
ITEM 8. | Financial Statements and Supplementary Data |
REPORT OF INDEPENDENT REGISTERED PUBLIC ACCOUNTING FIRM
To the Board of Directors and Stockholders of
Renewable Energy Group, Inc.
We have audited the accompanying consolidated balance sheets of Renewable Energy Group, Inc. and subsidiaries (the “Company”) as of December 31, 2016 and 2015, and the related consolidated statements of operations, comprehensive income (loss), redeemable preferred stock and equity, and cash flows for each of the three years in the period ended December 31, 2016. We also have audited the Company's internal control over financial reporting as of December 31, 2016, based on criteria established in Internal Control - Integrated Framework (2013) issued by the Committee of Sponsoring Organizations of the Treadway Commission. The Company's management is responsible for these financial statements, for maintaining effective internal control over financial reporting, and for its assessment of the effectiveness of internal control over financial reporting, included in the accompanying Management’s Report on Internal Control over Financial Reporting. Our responsibility is to express an opinion on these financial statements and an opinion on the Company's internal control over financial reporting based on our audits.
We conducted our audits in accordance with the standards of the Public Company Accounting Oversight Board (United States). Those standards require that we plan and perform the audit to obtain reasonable assurance about whether the financial statements are free of material misstatement and whether effective internal control over financial reporting was maintained in all material respects. Our audits of the financial statements included examining, on a test basis, evidence supporting the amounts and disclosures in the financial statements, assessing the accounting principles used and significant estimates made by management, and evaluating the overall financial statement presentation. Our audit of internal control over financial reporting included obtaining an understanding of internal control over financial reporting, assessing the risk that a material weakness exists, testing and evaluating the design and operating effectiveness of internal control based on the assessed risk. Our audits also included performing such other procedures as we considered necessary in the circumstances. We believe that our audits provide a reasonable basis for our opinions.
A company's internal control over financial reporting is a process designed by, or under the supervision of, the company's principal executive and principal financial officers, or persons performing similar functions, and effected by the company's board of directors, management, and other personnel to provide reasonable assurance regarding the reliability of financial reporting and the preparation of financial statements for external purposes in accordance with generally accepted accounting principles. A company's internal control over financial reporting includes those policies and procedures that (1) pertain to the maintenance of records that, in reasonable detail, accurately and fairly reflect the transactions and dispositions of the assets of the company; (2) provide reasonable assurance that transactions are recorded as necessary to permit preparation of financial statements in accordance with generally accepted accounting principles and that receipts and expenditures of the company are being made only in accordance with authorizations of management and directors of the company; and (3) provide reasonable assurance regarding prevention or timely detection of unauthorized acquisition, use, or disposition of the company's assets that could have a material effect on the financial statements.
Because of the inherent limitations of internal control over financial reporting, including the possibility of collusion or improper management override of controls, material misstatements due to error or fraud may not be prevented or detected on a timely basis. Also, projections of any evaluation of the effectiveness of the internal control over financial reporting to future periods are subject to the risk that the controls may become inadequate because of changes in conditions, or that the degree of compliance with the policies or procedures may deteriorate.
In our opinion, the consolidated financial statements referred to above present fairly, in all material respects, the financial position of Renewable Energy Group, Inc. and subsidiaries as of December 31, 2016 and 2015, and the results of their operations and their cash flows for each of the three years in the period ended December 31, 2016, in conformity with accounting principles generally accepted in the United States of America. Also, in our opinion, the Company maintained, in all material respects, effective internal control over financial reporting as of December 31, 2016, based on the criteria established in Internal Control - Integrated Framework (2013) issued by the Committee of Sponsoring Organizations of the Treadway Commission.
/s/ Deloitte & Touche LLP
Des Moines, Iowa
March 10, 2017
54
RENEWABLE ENERGY GROUP, INC. AND SUBSIDIARIES
CONSOLIDATED BALANCE SHEETS
AS OF DECEMBER 31, 2016 AND 2015
(IN THOUSANDS, EXCEPT SHARE AND PER SHARE AMOUNTS)
2016 | 2015 | ||||||
ASSETS | |||||||
CURRENT ASSETS: | |||||||
Cash and cash equivalents | $ | 116,210 | $ | 47,081 | |||
Accounts receivable, net | 164,949 | 310,731 | |||||
Inventories | 145,408 | 85,890 | |||||
Prepaid expenses and other assets | 36,272 | 31,882 | |||||
Total current assets | 462,839 | 475,584 | |||||
Property, plant and equipment, net | 599,474 | 574,584 | |||||
Goodwill | 16,080 | 16,080 | |||||
Intangible assets, net | 29,470 | 30,941 | |||||
Investments | 12,110 | 8,797 | |||||
Other assets | 12,630 | 11,819 | |||||
Restricted cash | 4,000 | 105,815 | |||||
TOTAL ASSETS | $ | 1,136,603 | $ | 1,223,620 | |||
LIABILITIES AND EQUITY | |||||||
CURRENT LIABILITIES: | |||||||
Revolving lines of credit | $ | 52,844 | $ | 23,149 | |||
Current maturities of long-term debt | 15,402 | 5,206 | |||||
Accounts payable | 99,137 | 236,817 | |||||
Accrued expenses and other liabilities | 38,916 | 28,466 | |||||
Deferred revenue | 27,246 | 333 | |||||
Total current liabilities | 233,545 | 293,971 | |||||
Unfavorable lease obligation | 15,515 | 17,343 | |||||
Deferred income taxes | 20,279 | 19,186 | |||||
Long-term contingent consideration for acquisitions | 28,931 | 26,949 | |||||
Convertible debt conversion liability | 27,100 | — | |||||
Long-term debt (net of debt issuance costs of $6,286 and $4,105, respectively) | 196,203 | 247,251 | |||||
Other liabilities | 4,856 | 4,910 | |||||
Total liabilities | 526,429 | 609,610 | |||||
COMMITMENTS AND CONTINGENCIES (NOTE 21) | |||||||
EQUITY: | |||||||
Common stock ($.0001 par value; 300,000,000 shares authorized; 38,553,413 and 43,837,714 shares outstanding, respectively) | 5 | 4 | |||||
Common stock—additional paid-in-capital | 480,906 | 474,367 | |||||
Retained earnings | 214,007 | 169,680 | |||||
Accumulated other comprehensive loss | (5,751 | ) | (4,009 | ) | |||
Treasury stock (9,246,002 and 3,178,372 shares, respectively) | (81,824 | ) | (28,762 | ) | |||
Total equity attributable to the Company's shareholders | 607,343 | 611,280 | |||||
Noncontrolling interest | 2,831 | 2,730 | |||||
Total equity | 610,174 | 614,010 | |||||
TOTAL LIABILITIES AND EQUITY | $ | 1,136,603 | $ | 1,223,620 | |||
See notes to consolidated financial statements.
55
RENEWABLE ENERGY GROUP, INC. AND SUBSIDIARIES
CONSOLIDATED STATEMENTS OF OPERATIONS
FOR THE YEARS ENDED DECEMBER 31, 2016, 2015 AND 2014
(IN THOUSANDS, EXCEPT SHARE AND PER SHARE AMOUNTS)
2016 | 2015 | 2014 | |||||||||
REVENUES: | |||||||||||
Biomass-based diesel sales | $ | 1,417,595 | $ | 954,742 | $ | 922,602 | |||||
Separated RIN sales | 274,800 | 186,539 | 130,170 | ||||||||
Biomass-based diesel government incentives | 346,672 | 245,868 | 220,634 | ||||||||
2,039,067 | 1,387,149 | 1,273,406 | |||||||||
Other revenues | 2,165 | 195 | 425 | ||||||||
2,041,232 | 1,387,344 | 1,273,831 | |||||||||
COSTS OF GOODS SOLD: | |||||||||||
Biomass-based diesel | 1,616,991 | 1,089,437 | 950,642 | ||||||||
Biomass-based diesel—related parties | — | 4,542 | 42,622 | ||||||||
Separated RINs | 250,809 | 182,688 | 119,788 | ||||||||
Other costs of goods sold | 1,916 | 134 | 167 | ||||||||
1,869,716 | 1,276,801 | 1,113,219 | |||||||||
GROSS PROFIT | 171,516 | 110,543 | 160,612 | ||||||||
SELLING, GENERAL, AND ADMINISTRATIVE EXPENSES (includes related party amounts of $0, $0, and $45, respectively) | 88,285 | 73,397 | 62,681 | ||||||||
RESEARCH AND DEVELOPMENT EXPENSE | 18,163 | 16,851 | 12,424 | ||||||||
IMPAIRMENT OF PROPERTY, PLANT, AND EQUIPMENT | 17,893 | — | — | ||||||||
IMPAIRMENT OF GOODWILL | — | 175,028 | — | ||||||||
INCOME (LOSS) FROM OPERATIONS | 47,175 | (154,733 | ) | 85,507 | |||||||
OTHER INCOME (EXPENSE), NET: | |||||||||||
Change in fair value of contingent consideration | (7,904 | ) | 359 | 6,631 | |||||||
Change in fair value of convertible debt conversion liability | 13,045 | — | — | ||||||||
Gain on debt extinguishment | 2,331 | — | — | ||||||||
Gain on involuntary conversion | 9,894 | — | — | ||||||||
Other income | 427 | 5,830 | 662 | ||||||||
Interest expense (includes related party amounts of $0, $0, and $7, respectively) | (15,987 | ) | (11,867 | ) | (6,690 | ) | |||||
1,806 | (5,678 | ) | 603 | ||||||||
INCOME (LOSS) BEFORE INCOME TAXES | 48,981 | (160,411 | ) | 86,110 | |||||||
INCOME TAX BENEFIT (EXPENSE) | (4,268 | ) | 8,701 | (3,572 | ) | ||||||
NET INCOME (LOSS) | 44,713 | (151,710 | ) | 82,538 | |||||||
LESS—NET INCOME (LOSS) ATTRIBUTABLE TO NONCONTROLLING INTEREST | 386 | (318 | ) | (73 | ) | ||||||
NET INCOME (LOSS) ATTRIBUTABLE TO THE COMPANY | 44,327 | (151,392 | ) | 82,611 | |||||||
PLUS—GAIN ON REDEMPTION OF PREFERRED STOCK | — | — | 378 | ||||||||
LESS—EFFECT OF CHANGES TO PREFERRED STOCK | — | — | (40 | ) | |||||||
LESS—EFFECT OF PARTICIPATING PREFERRED STOCK | — | — | (91 | ) | |||||||
LESS—EFFECT OF PARTICIPATING SHARE-BASED AWARDS | (874 | ) | — | (1,238 | ) | ||||||
NET INCOME (LOSS) ATTRIBUTABLE TO THE COMPANY’S COMMON STOCKHOLDERS | $ | 43,453 | $ | (151,392 | ) | $ | 81,620 | ||||
Net income (loss) per share attributable to common stockholders: | |||||||||||
Basic | $ | 1.06 | $ | (3.44 | ) | $ | 2.00 | ||||
Diluted | $ | 1.06 | $ | (3.44 | ) | $ | 1.99 | ||||
Weighted-average shares used to compute net income (loss) per share attributable to common stockholders: | |||||||||||
Basic | 40,897,549 | 43,958,803 | 40,740,411 | ||||||||
Diluted | 40,902,860 | 43,958,803 | 40,749,913 | ||||||||
See notes to consolidated financial statements.
56
RENEWABLE ENERGY GROUP, INC. AND SUBSIDIARIES
CONSOLIDATED STATEMENTS OF COMPREHENSIVE INCOME (LOSS)
FOR THE YEARS ENDED DECEMBER 31, 2016, 2015 AND 2014
(IN THOUSANDS)
2016 | 2015 | 2014 | |||||||||
Net income (loss) | $ | 44,713 | $ | (151,710 | ) | $ | 82,538 | ||||
Unrealized losses on marketable securities, net of taxes of $0, $0 and $0, respectively | — | — | (11 | ) | |||||||
Foreign currency translation adjustments | (1,848 | ) | (5,022 | ) | — | ||||||
Other comprehensive loss | (1,848 | ) | (5,022 | ) | (11 | ) | |||||
Comprehensive income (loss) | 42,865 | (156,732 | ) | 82,527 | |||||||
Less—Comprehensive loss attributable to noncontrolling interest | (106 | ) | (1,013 | ) | — | ||||||
Comprehensive income (loss) attributable to the Company | $ | 42,971 | $ | (155,719 | ) | $ | 82,527 | ||||
See notes to consolidated financial statements.
57
RENEWABLE ENERGY GROUP, INC. AND SUBSIDIARIES
CONSOLIDATED STATEMENTS OF REDEEMABLE PREFERRED STOCK AND EQUITY
FOR THE YEARS ENDED DECEMBER 31, 2016, 2015 AND 2014 (IN THOUSANDS EXCEPT SHARE AND PER SHARE AMOUNTS)
Redeemable Preferred Stock Shares | Redeemable Preferred Stock | Company Stockholders’ Equity | ||||||||||||||||||||||||||||||||||
Common Stock Shares | Common Stock | Common Stock- Additional Paid-in Capital | Retained Earnings | Accumulated Other Comprehensive Loss | Treasury Stock | Noncontrolling Interest | Total | |||||||||||||||||||||||||||||
BALANCE, January 1, 2014 | 143,313 | 3,963 | 36,506,221 | $ | 4 | $ | 359,818 | $ | 238,134 | $ | — | $ | (3,886 | ) | $ | — | $ | 594,070 | ||||||||||||||||||
Issuance of common stock | — | — | 49,662 | — | 582 | — | — | — | — | 582 | ||||||||||||||||||||||||||
Conversion of Series B Preferred Stock to common stock | (816 | ) | (23 | ) | 1,634 | — | 23 | — | — | — | — | 23 | ||||||||||||||||||||||||
Preferred stock redemption | (142,497 | ) | (3,940 | ) | — | — | — | 378 | — | — | — | 378 | ||||||||||||||||||||||||
Issuance of common stock in acquisitions (net of issuance costs of $942) | — | — | 7,794,710 | — | 80,163 | — | — | — | — | 80,163 | ||||||||||||||||||||||||||
Conversion of restricted stock units to common stock (net of 54,252 shares of treasury stock purchased) | — | — | 70,654 | — | — | — | — | (526 | ) | — | (526 | ) | ||||||||||||||||||||||||
Convertible notes conversion feature (net of taxes of $5,082 and net of issuance cost of $886) | — | — | — | — | 19,068 | — | — | — | — | 19,068 | ||||||||||||||||||||||||||
Purchase of capped call transactions | — | — | — | — | (11,904 | ) | — | — | — | — | (11,904 | ) | ||||||||||||||||||||||||
Purchase of remaining interest in VIE (net of taxes of $300) | — | — | — | — | (524 | ) | — | — | — | — | (524 | ) | ||||||||||||||||||||||||
Acquisition of noncontrolling interest | — | — | — | — | — | — | — | 8,962 | 8,962 | |||||||||||||||||||||||||||
Stock compensation expense | — | — | — | — | 5,883 | — | — | — | — | 5,883 | ||||||||||||||||||||||||||
Comprehensive income items | — | — | — | — | — | — | (11 | ) | — | — | (11 | ) | ||||||||||||||||||||||||
Series B Preferred Stock dividends paid | — | — | — | — | — | (40 | ) | — | — | — | (40 | ) | ||||||||||||||||||||||||
Net income (loss) | — | — | — | — | — | 82,611 | — | — | (73 | ) | 82,538 | |||||||||||||||||||||||||
BALANCE, December 31, 2015 | — | — | 44,422,881 | 4 | 453,109 | 321,083 | (11 | ) | (4,412 | ) | 8,889 | 778,662 | ||||||||||||||||||||||||
Issuance of common stock | — | — | 37,966 | — | 412 | — | — | — | — | 412 | ||||||||||||||||||||||||||
Issuance of common stock in acquisitions | — | — | 1,675,000 | — | 15,310 | — | — | — | — | 15,310 | ||||||||||||||||||||||||||
Conversion of restricted stock units to common stock (net of 92,608 shares of treasury stock purchased) | — | — | 295,089 | — | — | — | — | (854 | ) | — | (854 | ) | ||||||||||||||||||||||||
Treasury stock activity | — | — | (2,593,222 | ) | — | — | — | — | (23,473 | ) | — | (23,473 | ) | |||||||||||||||||||||||
Acquisition of noncontrolling interest | — | — | — | — | — | — | — | — | (4,828 | ) | (4,828 | ) | ||||||||||||||||||||||||
Stock compensation expense | — | — | — | — | 5,161 | — | — | — | — | 5,161 | ||||||||||||||||||||||||||
Comprehensive income items | — | — | — | — | — | — | (3,998 | ) | — | (1,013 | ) | (5,011 | ) | |||||||||||||||||||||||
Net loss | — | — | — | — | — | (151,392 | ) | — | — | (318 | ) | (151,710 | ) | |||||||||||||||||||||||
Other | — | — | — | — | 375 | (11 | ) | — | (23 | ) | — | 341 | ||||||||||||||||||||||||
BALANCE, December 31, 2015 | — | — | 43,837,714 | 4 | 474,367 | 169,680 | (4,009 | ) | (28,762 | ) | 2,730 | 614,010 | ||||||||||||||||||||||||
Issuance of common stock | — | — | 33,973 | — | 316 | — | — | — | — | 316 | ||||||||||||||||||||||||||
Issuance of common stock in acquisition | — | — | 500,000 | 1 | 4,050 | — | — | — | — | 4,051 | ||||||||||||||||||||||||||
Conversion of restricted stock units to common stock (net of 69,307 shares of treasury stock purchased) | — | — | 180,049 | — | — | — | — | (767 | ) | — | (767 | ) | ||||||||||||||||||||||||
Partial termination of capped call options (inclusive of tax impact of $116) | — | — | — | — | 1,863 | — | — | — | — | 1,863 | ||||||||||||||||||||||||||
Convertible debt extinguishment impact (net of tax impact of $2,144) | — | — | — | — | (5,560 | ) | — | — | — | — | (5,560 | ) | ||||||||||||||||||||||||
Treasury stock purchases | — | — | (5,998,323 | ) | — | — | — | — | (52,295 | ) | — | (52,295 | ) | |||||||||||||||||||||||
Acquisition of noncontrolling interest | — | — | — | — | — | — | — | — | (179 | ) | (179 | ) | ||||||||||||||||||||||||
Stock compensation expense | — | — | — | — | 5,896 | — | — | — | — | 5,896 | ||||||||||||||||||||||||||
Other comprehensive income (loss) | — | — | — | — | (26 | ) | — | (1,742 | ) | — | (106 | ) | (1,874 | ) | ||||||||||||||||||||||
Net income | — | — | — | — | — | 44,327 | — | — | 386 | 44,713 | ||||||||||||||||||||||||||
BALANCE, December 31, 2016 | — | — | 38,553,413 | $ | 5 | $ | 480,906 | $ | 214,007 | $ | (5,751 | ) | $ | (81,824 | ) | $ | 2,831 | $ | 610,174 | |||||||||||||||||
See notes to consolidated financial statements.
58
RENEWABLE ENERGY GROUP, INC. AND SUBSIDIARIES
CONSOLIDATED STATEMENTS OF CASH FLOWS
FOR THE YEARS ENDED DECEMBER 31, 2016, 2015 AND 2014
(IN THOUSANDS)
2016 | 2015 | 2014 | |||||||||
CASH FLOWS FROM OPERATING ACTIVITIES: | |||||||||||
Net income (loss) | $ | 44,713 | $ | (151,710 | ) | $ | 82,538 | ||||
Adjustments to reconcile net income (loss) to net cash flows from operating activities: | |||||||||||
Depreciation expense | 31,825 | 24,997 | 15,255 | ||||||||
Amortization expense of assets and liabilities, net | 1,052 | 570 | 541 | ||||||||
Accretion of asset retirement obligations | 78 | 72 | 67 | ||||||||
Accretion of convertible note discount | 5,147 | 4,699 | 2,635 | ||||||||
Accretion of marketable securities | — | 189 | 553 | ||||||||
Impairment of property, plant and equipment, net | 17,893 | — | — | ||||||||
Provision for doubtful accounts | 630 | (803 | ) | 1,453 | |||||||
Stock compensation expense | 5,896 | 5,161 | 5,883 | ||||||||
Impairment of goodwill | — | 175,028 | — | ||||||||
Impairment of investment | — | 1,915 | — | ||||||||
Deferred tax expense (benefits) | 3,009 | (8,953 | ) | 3,641 | |||||||
Change in fair value of contingent consideration | 7,904 | (359 | ) | (6,631 | ) | ||||||
Gain on involuntary conversion | (9,894 | ) | — | — | |||||||
Bargain purchase gain | — | (5,358 | ) | — | |||||||
Change in fair value of convertible debt conversion liability | (13,045 | ) | — | — | |||||||
Gain on debt extinguishment | (2,331 | ) | — | — | |||||||
Other | (70 | ) | (231 | ) | 249 | ||||||
Changes in asset and liabilities, net of effects from mergers and acquisitions: | |||||||||||
Accounts receivable | 145,068 | (20,309 | ) | (207,877 | ) | ||||||
Inventories | (58,551 | ) | 29,631 | (277 | ) | ||||||
Prepaid expenses and other assets | (5,566 | ) | 16,315 | (12,146 | ) | ||||||
Accounts payable | (133,139 | ) | 32,422 | 143,131 | |||||||
Accrued expenses and other liabilities | 7,771 | (6,769 | ) | 2,336 | |||||||
Deferred revenue | 26,913 | (16,347 | ) | 1,177 | |||||||
Net cash flows provided from operating activities | 75,303 | 80,160 | 32,528 | ||||||||
CASH FLOWS FROM INVESTING ACTIVITIES: | |||||||||||
Cash paid for marketable securities | — | (52,435 | ) | (80,974 | ) | ||||||
Cash receipts from marketable securities | — | 68,979 | 63,840 | ||||||||
Cash paid for purchase of property, plant and equipment | (60,705 | ) | (64,477 | ) | (60,163 | ) | |||||
Insurance proceeds for asset impairments | 10,949 | 11,027 | — | ||||||||
Cash receipts from disposal of fixed assets | — | — | 45 | ||||||||
Transfer into restricted cash | — | (4,000 | ) | (117,660 | ) | ||||||
Transfer out of restricted cash | 1,960 | 15,845 | — | ||||||||
Cash paid for investments | (3,249 | ) | (1,452 | ) | (2,779 | ) | |||||
Cash paid for acquisitions and additional interests, net of cash acquired | (12,720 | ) | (41,409 | ) | (19,369 | ) | |||||
Other investing activities | — | — | 27 | ||||||||
Net cash flows used in investing activities | (63,765 | ) | (67,922 | ) | (217,033 | ) | |||||
CASH FLOWS FROM FINANCING ACTIVITIES: | |||||||||||
Net borrowings on line of credit | 26,445 | 6,470 | 5,693 | ||||||||
Borrowing on other lines of credit | 10,185 | — | — | ||||||||
Repayments on other lines of credits | (2,437 | ) | — | — | |||||||
Cash received for issuance of debt | 11,775 | 104 | 5,490 | ||||||||
Cash paid for capped call transactions | — | — | (11,904 | ) | |||||||
Cash received on convertible debt | 152,000 | — | 143,750 | ||||||||
Cash paid on debt | (74,562 | ) | (6,708 | ) | (37,798 | ) | |||||
Cash paid for debt issuance costs | (6,369 | ) | (542 | ) | (4,719 | ) | |||||
Cash received on partial termination of capped call options | 159 | — | — | ||||||||
Cash paid for issuance of common stock and preferred stock | — | — | (1,587 | ) | |||||||
Cash paid for redemption of preferred stock | — | — | (3,562 | ) | |||||||
Cash paid for treasury stock | (51,474 | ) | (24,350 | ) | (529 | ) | |||||
Cash paid for contingent consideration | (7,548 | ) | (2,248 | ) | — | ||||||
Cash paid for preferred stock dividends | — | — | (40 | ) | |||||||
Net cash flows provided from (used in) financing activities | 58,174 | (27,274 | ) | 94,794 | |||||||
NET CHANGE IN CASH AND CASH EQUIVALENTS | 69,712 | (15,036 | ) | (89,711 | ) | ||||||
CASH AND CASH EQUIVALENTS, Beginning of period | 47,081 | 63,516 | 153,227 | ||||||||
Effect of exchange rate changes on cash | (583 | ) | (1,399 | ) | $ | — | |||||
CASH AND CASH EQUIVALENTS, End of period | $ | 116,210 | $ | 47,081 | $ | 63,516 | |||||
(continued)
59
RENEWABLE ENERGY GROUP, INC. AND SUBSIDIARIES
CONSOLIDATED STATEMENTS OF CASH FLOWS
FOR THE YEARS ENDED DECEMBER 31, 2016, 2015 AND 2014
(IN THOUSANDS)
2016 | 2015 | 2014 | |||||||||
SUPPLEMENTAL DISCLOSURES OF CASH FLOWS INFORMATION: | |||||||||||
Cash paid (received) for income taxes | $ | 410 | $ | (189 | ) | $ | (1,847 | ) | |||
Cash paid for interest | $ | 9,920 | $ | 6,947 | $ | 4,065 | |||||
SUPPLEMENTAL DISCLOSURE OF NON-CASH INVESTING AND FINANCING ACTIVITIES: | |||||||||||
Common stock repurchased included in accrued expenses and other liabilities | $ | — | $ | 464 | $ | 526 | |||||
Amounts included in period-end accounts payable for: | |||||||||||
Purchases of property, plant and equipment | $ | 3,833 | $ | 7,734 | $ | 4,220 | |||||
Issuance costs | $ | 250 | $ | 84 | $ | 311 | |||||
Incentive common stock liability for supply agreement | $ | — | $ | 316 | $ | 412 | |||||
Issuance of common stock for acquisitions | $ | 4,050 | $ | 15,310 | $ | 80,163 | |||||
Contingent consideration for acquisitions | $ | 4,500 | $ | 5,000 | $ | 45,950 | |||||
Debt assumed in acquisition | $ | — | $ | 5,225 | $ | 129,745 | |||||
Release of restricted cash to pay off the GOZone Bonds | $ | 101,315 | $ | — | $ | — | |||||
Repayment of GOZone Bonds | $ | 100,000 | $ | — | $ | — | |||||
Non-cash transfer of line of credit to long-term debt | $ | 4,498 | $ | — | $ | — | |||||
Non-cash allocation of proceeds from the 2036 Convertible Notes issuance to convertible debt conversion liability | $ | 40,145 | $ | — | $ | — | |||||
Non-cash allocation of purchase price between debt and equity related to the repurchase of the 2019 Convertible Notes | $ | 7,387 | $ | — | $ | — | |||||
Non-cash share repurchases from partial capped call termination | $ | 1,588 | $ | — | $ | — | |||||
Gain on redemption of preferred stock | $ | — | $ | — | $ | 378 | |||||
Accruals of insurance proceeds related to impairment of property, plant and equipment | $ | 313 | $ | 1,414 | $ | — | |||||
See "Note 4 - Acquisitions" for noncash items related to the acquisition transactions. | |||||||||||
See notes to consolidated financial statements.
(concluded)
60
RENEWABLE ENERGY GROUP, INC. AND SUBSIDIARIES
NOTES TO THE CONSOLIDATED FINANCIAL STATEMENTS
For The Three Years Ended December 31, 2016, 2015 and 2014
(In Thousands, Except Share and Per Share Amounts)
NOTE 1—ORGANIZATION, PRESENTATION, AND NATURE OF THE BUSINESS
Renewable Energy Group, Inc. (the "Company" or "REG") is a company focused on providing cleaner, lower carbon intensity products and services. Today, we principally generate revenue as a leading North American biofuels producer with a nationwide distribution and logistics system. The Company participates in each aspect of biomass-based diesel production, from acquiring feedstock, managing construction and operating biomass-based diesel production facilities, to marketing, selling and distributing biomass-based diesel and its co-products. To do this, REG utilizes this nationwide production, distribution and logistics system as part of an integrated value chain model to focus on converting natural fats, oils and greases into advanced biofuels and converting diverse feedstocks into renewable chemicals.
Upon completion of acquiring the remaining interest in Petrotec AG as further discussed in Note 4 - Acquisitions, the Company owns and operates fourteen biorefineries, with twelve locations in North America and two locations in Europe, which includes thirteen operating biomass-based diesel production facilities with aggregate nameplate production capacity of 502 million gallons per year, or mmgy, and one fermentation facility. REG has one feedstock processing facility. The Company's network includes the addition of a 20-million gallon nameplate capacity biomass-based diesel refinery located in DeForest, Wisconsin, acquired in March 2016. Nine of these plants are “multi-feedstock capable” which allows them to use a broad range of lower cost feedstocks, such as inedible corn oil, used cooking oil and inedible animal fats in addition to vegetable oils, such as soybean oil and canola oil.
The Company also has three partially constructed production facilities and one non-operational production facility. The Company will need to raise additional capital to complete construction of these plants and fund working capital requirements. It is uncertain when financing will be available. During fourth quarter 2016, the Company wrote down the carrying value at its Emporia facility to its estimated salvage value due to competition from foreign, imported product and the probability of that project being completed in the near term is unlikely.
The biomass-based diesel industry and the Company’s business have benefited from the continuation of certain federal and state incentives. The federal biodiesel mixture excise tax credit (the "BTC") was reinstated for 2015, in effect throughout 2016 and lapsed on January 1, 2017. It is uncertain whether the BTC will be reinstated thereafter. The expiration along with other amendments of any one or more of those laws, could adversely affect the financial results of the Company.
NOTE 2—SUMMARY OF SIGNIFICANT ACCOUNTING POLICIES
Basis of Consolidation
The consolidated financial statements include the accounts of the Company, its wholly-owned subsidiaries, and entities which it controls. All intercompany balances and transactions have been eliminated for consolidated reporting purposes.
Cash and Cash Equivalents
Cash and cash equivalents consists of money market funds and demand deposits with financial institutions. The Company considers all highly liquid debt instruments purchased with an original maturity of three months or less to be cash equivalents.
Accounts Receivable
Accounts receivable are carried at invoiced amount less allowance for doubtful accounts. Management estimates the allowance for doubtful accounts based on existing economic conditions, the financial conditions of customers, and the amount and age of past due accounts. Receivables are considered past due if full payment is not received by the contractual due date. Past due accounts are generally written off against the allowance for doubtful accounts only after reasonable collection attempts have been exhausted. Activity regarding the allowance for doubtful accounts was as follows:
61
Balance, January 1, 2014 | $ | 2,124 | |
Amount charged to selling, general and administrative expenses | 1,453 | ||
Charge-offs, net of recoveries | (1,304 | ) | |
Balance, December 31, 2014 | 2,273 | ||
Amount charged to selling, general and administrative expenses | (803 | ) | |
Charge-offs, net of recoveries | (119 | ) | |
Balance, December 31, 2015 | 1,351 | ||
Amount charged to selling, general and administrative expenses | 630 | ||
Charge-offs, net of recoveries | (106 | ) | |
Balance, December 31, 2016 | $ | 1,875 | |
Inventories
Inventories are valued at the lower of cost or net realizable value. Cost is determined based on the first-in, first-out method. There were no lower of cost or market adjustments made to the inventory values reported as of December 31, 2016 and 2015.
Renewable Identification Numbers (RINs)
When the Company produces and sells a gallon of biomass-based diesel, 1.5 to 1.7 RINs per gallon are generated. RINs are used to track compliance with Renewable Fuel Standards (RFS2). RFS2 allows the Company to attach between zero and 2.5 RINs to any gallon of biomass-based diesel. As a result, a portion of the selling price for a gallon of biomass-based diesel is generally attributable to RFS2 compliance. However, RINs that the Company generates are a form of government incentive and not a result of the physical attributes of the biomass-based diesel production. Therefore, no cost is allocated to the RIN when it is generated, regardless of whether the RIN is transferred with the biomass-based diesel produced or held by the Company pending attachment to other biomass-based diesel production sales.
In addition, the Company also obtains RINs from third parties who have separated the RINs from gallons of biomass-based diesel. From time to time, the Company holds varying amounts of these separated RINs for resale. RINs obtained from third parties are initially recorded at their cost and are subsequently revalued at the lower of cost or market as of the last day of each accounting period and the resulting adjustments are reflected in costs of goods sold for the period. The value of these RINs is reflected in “Prepaid expenses and other assets” on the consolidated balance sheet. The cost of goods sold related to the sale of these RINs is determined using the average cost method, while market prices are determined by RIN values, as reported by the Oil Price Information Service (OPIS).
California’s Low Carbon Fuel Standard
The Company generates Low Carbon fuel Standard (LCFS) credits for its low carbon fuels or blendstocks when its qualified low carbon fuels are imported by REG to California though approved physical pathways. LCFS credits are used to track compliance with California’s LCFS, which enables the Company to generate LCFS credits based upon the carbon intensity of qualified fuels that are imported by REG into California. Other companies can take title outside of California and generate LCFS credits instead of REG upon import into the state. One LCFS credit equates to one metric ton reduction of carbon dioxide compared to the petroleum fuel baseline so the amount gallons of low carbon fuel consumption to generate one credit will vary. As a result, a portion of the selling price for a gallon of biomass-based diesel sold into California is also attributable to LCFS compliance. However, LCFS credits that the Company generates are a form of government incentive and not a result of the physical attributes of the biomass-based diesel production. Therefore, no cost is allocated to the LCFS credit when it is generated, regardless of whether the LCFS credit is transferred with the biomass-based diesel produced or held by the Company on other biomass-based diesel sales that do not transfer credits.
In addition, the Company also obtains LCFS credits from third party trading activities. From time to time, the Company holds varying amounts of these 3rd party LCFS credits for resale. LCFS credits obtained from third parties is initially recorded at their cost and are subsequently revalued at the lower of cost or net realizable value as of the last day of each accounting period and the resulting adjustments are reflected in costs of goods sold for the period. The value of LCFS obtained from third parties is reflected in “Prepaid expenses and other assets” on the consolidated balance sheet. The cost of goods sold related to the sale of these LCFS credits is determined using the average cost method, while market prices are determined by LCFS
62
values, as reported by the Oil Price Information Service (OPIS). At year end, the Company held no LCFS credits purchased from third parties.
The Company records assets acquired and liabilities assumed through the exchange of non-monetary assets based on the fair value of the assets and liabilities acquired or the fair value of the consideration exchanged, whichever is more readily determinable.
Derivative Instruments
Derivatives are recorded on the balance sheet at fair value with changes in fair value recognized in current period earnings. The Company did not elect to use hedge accounting for all periods presented.
Property, Plant and Equipment
Property, plant and equipment is recorded at cost less accumulated depreciation. Maintenance and repairs are expensed as incurred. Depreciation expense is computed on a straight-line method based upon estimated useful lives of the assets. Estimated useful lives are as follows:
Automobiles and trucks | 5 years |
Computers and office equipment | 5 years |
Office furniture and fixtures | 7 years |
Machinery and equipment | 5-30 years |
Leasehold improvements | the lesser of the lease term or 30 years |
Buildings and improvements | 30-40 years |
In April 2015, the Company experienced a fire at its Geismar facility, resulting in the shutdown of the facility. The Company estimated fixed assets of approximately $11,027 were impaired as a result of the fire. At December 31, 2016, the Company had received property proceeds of $19,037 from insurance for the property damage. The excess of the property insurance proceeds over the net book value of the impaired assets, $8,010, was recorded as gain on involuntary conversion on the Consolidated Statements of Operations. These proceeds for property damage were final and have been approved and paid by the insurance carriers.
In September 2015, another fire occurred at the Geismar facility. The Company estimated fixed assets of approximately $1,414 were impaired by the September fire. At December 31, 2016, the Company recorded proceeds of $2,939 from insurance for the property damage. The excess of the property insurance proceeds over the net book value of the impaired assets of $1,525, was recorded as gain on involuntary conversion on the Consolidated Statements of Operations. In addition, as of December 31, 2016, the Company recognized the undisputed portion of $15,060 from its business interruption insurance claim related to the September 2015 fire, which was recorded as an increase in biomass-based diesel sales in the Company's consolidated Statements of Operations. The Company continues to work with the insurance carriers on the in-dispute portion of the business interruption claim. None of this in-dispute business interruption insurance amount has been recognized in earnings at December 31, 2016.
As of December 31, 2016, 2015 and 2014, the Company capitalized interest incurred on debt during the construction of assets of $537, $897 and $1,345, respectively.
Goodwill
Goodwill is tested for impairment annually on July 31 or when impairment indicators exist. Goodwill is allocated and tested for impairment by reporting units. At December 31, 2016 and December 31, 2015, the Company had goodwill in the Services reporting unit. The analysis is based on a comparison of the carrying value of the reporting unit to its fair value, determined utilizing both a discounted cash flow methodology and a market comparable methodology. The determination of whether or not the asset has become impaired involves a significant level of judgment in the assumptions underlying the approach used to determine the fair value of the Company’s reporting units. The inputs used to estimate the fair value of the Company’s Services reporting unit are considered Level 3 inputs of the fair value hierarchy and included the following: (1) The Company’s financial projections for its reporting unit were based on its analysis of various factors which include, among other things, demands, margins, whether the BTC is reinstated, capital expenditures and economic conditions. Such estimates are consistent with those used in the Company’s budgeting and capital investment reviews, incorporating current market information, historical factors and the regulatory environment; (2) The long-term growth rates assumed for the Company’s reporting unit was based on a comparison to similar publicly traded companies, supported by market information obtained from
63
external sources; and (3) The discount rate used to measure the present value of the projected future cash flows was determined by separately estimating borrowing cost of capital, equity cost of capital, and entity structure. Changes in estimates of future cash flows caused by items such as unforeseen events or sustained unfavorable changes in market conditions could negatively affect the fair value of the reporting unit’s goodwill asset and result in an impairment charge. The 2016 annual impairment test determined that the fair value of the Services reporting unit exceeded its carrying value by approximately 16%. During 2015, the Company had a full write-off of goodwill in the Biomass-based Diesel and Renewable Chemicals reporting units.
Impairment of Long-lived Assets
The Company tests its long-lived assets for recoverability when events or circumstances indicate that its carrying amount may not be recoverable. Significant assumptions used in the undiscounted cash flow analysis, when it is required, include the projected demand for biomass-based diesel based on annual renewable fuel volume obligations under the Renewable Fuel Standards (RFS2), the Company's capacity to meet that demand, the market price of biomass-based diesel and the cost of feedstock used in the manufacturing process. For facilities under construction, estimates also include the capital expenditures necessary to complete construction of the plant and the projected costs of financing. Late during the year ended December 31, 2016, the Company recorded impairment charges of $15,593 related to its Emporia facility's property, plant and equipment assets resulting from competition from foreign, imported product and the probability of that project being completed in the near term is unlikely. In addition, the Company recorded impairment charges of $2,300 against certain property, plant and equipment as the carrying amounts of these assets were deemed not recoverable given the assets' deteriorating physical conditions identified during the fourth quarter of 2016. In 2015, other than those related to the 2015 Geismar fires of $12,441, which were fully offset by insurance receipts and/or accounts receivable for insurance coverage, there was no other impairments recorded for the years ended December 31, 2015 and 2014.
Convertible Debt
In June 2016, the Company issued $152,000 aggregate principal amount of 4% convertible senior notes due 2036 (the "2036 Convertible Notes"). The Company may not elect to issue shares of common stock upon conversion of the 2036 Convertible Notes to the extent such election would result in the issuance of more than 19.99% of the common stock outstanding immediately before the issuance of the 2036 Convertible Notes until the Company receives stockholder approval for such issuance. As a result, the embedded conversion option is accounted for as an embedded derivative liability. This liability is recorded at fair value, and $13,045 fair value adjustments were recorded for the year ended December 31, 2016. The Company expects to continue marking the embedded conversion option to market unless and until shareholders authorize additional common shares during its Annual Shareholder Meeting. See "Note 10 - Debt" for a further description of the transaction.
Capped Call Transaction
In connection with the issuance of the 2014 convertible senior notes, the Company entered into capped call transactions. The purchased capped call transactions were recorded as a reduction to common stock-additional paid-in-capital. Because this was considered to be an equity transaction and qualifies for the derivative scope exception, no future changes in the fair value of the capped call will be recorded by the Company. During 2016, in connection with the issuance of the 2036 Convertible Notes, certain call options covered by the original capped call transaction were rebalanced and reset to cover 100% of the total number of shares of the Company's Common Stock underlying the remaining principal of the 2019 Convertible Notes. The impact of these transactions, net of tax, was reflected as an addition/reduction to common stock-additional paid-in capital as presented in the Consolidated Statements of Redeemable Preferred Stock and Equity.
Share Repurchase Programs
In February 2015, the Company's board of directors approved a share repurchase program of up to $30,000 of the Company's shares of common stock. Shares may be repurchased from time to time in open market transactions, privately negotiated transactions or by other means. The Company accounts for share repurchases using the cost method. Under this method, the cost of the share repurchase is recorded entirely in treasury stock, a contra equity account. The Company used the remaining available funds of approximately $6,687 authorized under this program to repurchase 738,448 shares of Common Stock during the first 6 months of 2016.
In March 2016, the Company's board of directors approved a repurchase program of up to $50,000 of the Company's shares of common stock and/or convertible notes, in effect through March 5, 2018. Under the program, which is in addition to the $30,000 common stock repurchase program announced in February 2015, the Company may repurchase shares or convertible notes from time to time in open market transactions, privately negotiated transactions or by other means. The timing and amount of repurchase transactions were determined by the Company's management based on its evaluation of
64
market conditions, share price, bond price, legal requirements and other factors. During 2016, the Company repurchased 5,070,375 shares of Common Stock for $44,019 under this program. In addition, the Company used approximately $5,584 under this program to repurchase $6,000 principal amount of the Company's 2019 Convertible Notes, finishing up the program in 2016.
Foreign Currency Transactions and Translation
The Company’s reporting and functional currency is U.S. dollars. Monetary assets and liabilities denominated in currencies other than U.S. dollars are remeasured into their respective functional currencies at exchange rates in effect at the balance sheet date. The resulting exchange gain or loss is included in the Company’s Consolidated Statements of Operations as foreign exchange gain (loss) unless the remeasurement gain or loss relates to an intercompany transaction that is of a long-term investment nature and for which settlement is not planned or anticipated in the foreseeable future. Gains or losses arising from translation of such transactions are reported as a component of accumulated other comprehensive income (loss) in the Company’s Consolidated Balance Sheets.
The Company translates the assets and liabilities of its foreign subsidiaries from their respective functional currencies to U.S. dollars at the appropriate spot rates as of the balance sheet date. Generally, our foreign subsidiaries use the local currency as their functional currency. Changes in the carrying value of these assets and liabilities attributable to fluctuations in spot rates are recognized in foreign currency translation adjustment, a component of accumulated other comprehensive income (loss) in the Company’s Consolidated Balance Sheets.
The other comprehensive loss amounts presented in the Company's Consolidated Statements of Comprehensive Income (Loss) and Consolidated Statements of Redeemable Preferred Stock and Equity mainly include the foreign currency translation adjustment resulting from translating the financial statements of Petrotec AG from Euros to US Dollars, the Company's functional currency.
Revenue Recognition
The Company recognizes revenues from the following sources:
• | the sale of biomass-based diesel and its co-products, as well as Renewable Identification Numbers (RINs), California Low Carbon Fuel Standard credits (LCFS credits) and raw material feedstocks, purchased or produced by the Company at owned manufacturing facilities and manufacturing facilities with which the Company has tolling arrangements; |
• | the resale of biomass-based diesel, RINs, LCFS credits and raw material feedstocks acquired from third parties; |
• | the sale of petroleum-based heating oil and diesel fuel acquired from third parties, along with the sale of these items further blended with biodiesel produced at wholly owned facilities; |
• | incentives received from federal and state programs for renewable fuels; and |
• | fees received for the marketing and sales of biomass-based diesel produced by third parties and from managing operations of third party facilities. |
Biomass-based diesel, including RINs and LCFS credits, and raw material feedstock revenues are recognized where there is persuasive evidence of an arrangement, delivery has occurred, the price has been fixed or is determinable and collectability can be reasonably assured.
Fees received under toll manufacturing agreements with third parties are generally established as an agreed upon amount per gallon of biomass-based diesel produced. The fees are recognized where there is persuasive evidence of an arrangement, delivery has occurred, the price has been fixed or is determinable and collectability can be reasonably assured.
Revenues associated with the governmental incentive programs are recognized when the amount to be received is determinable, collectability is reasonably assured and the sale of product giving rise to the incentive has been recognized. The Company received funds from the United States Department of Agriculture (USDA) in the amount of $434, $624 and $600 for the years ended December 31, 2016, 2015 and 2014, respectively. The Company records amounts when it has received notification of a payment from the USDA or is in receipt of the funds and records the awards under the Program in "Biodiesel government incentives" as they are closely associated with the Company's biomass-based diesel production activities.
Freight
Amounts billed to customers for freight are included in biomass-based diesel sales. Costs incurred for freight are included in costs of goods sold.
65
Advertising Costs
Advertising costs are charged to expense as they are incurred. Advertising and promotional expenses were $1,746, $1,288 and $755 for the years ended December 31, 2016, 2015 and 2014, respectively.
Research and Development
Research and development (R&D) costs are charged to expense as incurred. In process research and development (IPR&D) assets acquired in connection with acquisitions are recorded on the Consolidated Balance Sheets as intangible assets. During October 2016, the Company entered into the first commercial sale agreement to sell certain products made from the IPR&D platform. This triggered the review of the impairment and useful life of the IPR&D assets. The Company performed a final discounted cash flow analysis at October 31, 2016 prior to assigning a useful life to the IPR&D assets. No impairment was identified related to the Company's IPR&D balance at October 1, 2016, December 31, 2016 and 2015. The Company then determined the useful life of the IPR&D assets to be 15 years and utilizes a straight line method to amortize these assets over the useful life.
Employee Benefits Plan
The Company sponsors an employee savings plan under Section 401(k) of the Internal Revenue Code. The Company makes matching contributions equal to 50% of the participant’s pre-tax contribution up to a maximum of 6% of the participant’s eligible earnings. Total expense related to the Company’s defined contribution plan was $1,168, $1,071 and $855 for the years ended December 31, 2016, 2015 and 2014, respectively.
Stock-Based Compensation
Stock-based compensation expense is measured at the grant-date fair value of the award and recognized as compensation expense over the vesting period.
Income Taxes
The Company uses the asset and liability method to account for income taxes. Accordingly, deferred income taxes are recognized for differences between the financial statement and tax bases of assets and liabilities at enacted statutory tax rates in effect for the years in which differences are expected to reverse. Changes in tax rates are recognized directly to the income statement as they arise. Consideration is given to positive and negative evidence related to the realization of the deferred tax assets and valuation allowances are established to reduce deferred tax assets to the amounts expected to be realized. Significant judgment is required in making this assessment.
For uncertain tax positions, the Company recognizes tax benefits that are more likely than not to be sustained upon examination by tax authorities. The amount recognized is measured as the largest amount of benefit that is greater than 50 percent likely to be realized.
With regard to non-US subsidiaries, the Company will indefinitely reinvest any future earnings outside of the U.S. and
currently does not have any undistributed earnings.
Concentrations
One customer represented slightly less than 10% of the total consolidated revenues of the Company for the years ended December 31, 2016 and 2015. This customer accounted for more than 10% of the total consolidated revenues of the Company for the year ended December 31, 2014. All customer amounts disclosed in the table are related to biomass-based diesel sales:
2016 | 2015 | 2014 | |||||||||
Customer A | $ | 144,849 | $ | 114,030 | $ | 231,780 | |||||
The Company maintains cash balances at financial institutions, which may at times exceed the $250 coverage by the U.S. Federal Deposit Insurance Company.
Use of Estimates
The preparation of financial statements in conformity with accounting principles generally accepted in the United States of America (GAAP) requires management to make estimates and assumptions that affect the reported amounts of assets and liabilities, disclosure of contingent assets and liabilities at the dates of the financial statements and reported amounts of revenues and expenses during the reporting periods. These estimates are based on information that is currently available to
66
management and on various assumptions that the Company believes to be reasonable under the circumstances. Actual results could differ from those estimates.
New Accounting Pronouncements
On February 25, 2016, the FASB issued ASU 2016-02, which introduces a lessee model that brings most leases on the balance sheet. The new standard also aligns many of the underlying principles of the new lessor model with those in ASC 606, the FASB’s new revenue recognition standard (e.g., those related to evaluating when profit can be recognized). Furthermore, the ASU addresses other concerns related to the current leases model. The ASU is effective for annual periods beginning after December 15, 2018 and interim periods therein. The Company anticipates this standard will have a material impact on our consolidated financial statements. While the Company is continuing to assess all potential impacts of the standard, the Company currently believes the most significant impact relates to its accounting for office, railcar and terminal operating leases. The Company plans to apply a modified retrospective transition approach to each applicable lease that exists at January 1, 2017 as well as leases entered after this date.
In March 2016, the FASB issued ASU 2016-09, “Improvements to Employee Share-Based Payment Accounting”. The amendments in this updated guidance include changes to simplify the codification for several aspects of the accounting for share-based payment transactions, including the income tax consequences, classification of awards as either equity or liabilities, and classification on the statement of cash flows. For public entities, this guidance is effective for fiscal years beginning after December 15, 2016, including interim periods within that reporting period. Early adoption is permitted. The Company elected early adoption for the quarter ended December 31, 2016. As part of the adoption the Company has elected to continue to account for forfeitures of share-based payments by estimating the number of award expected to be forfeited and adjusting the estimate when it is no longer probable that the employee will fulfill the service condition. This change had no cumulative effect on retained earnings or other components of equity and did not change the net assets as of the beginning of the period of adoption (January 1, 2016). In addition, the Company assessed that the other adjustments provided in the new guidance did not have any material impact on its consolidated financial statements.
In May 2014, the Financial Accounting Standards Board (FASB) issued Accounting Standards Update 2014-09, Revenue from Contracts with Customers (Topic 606), (ASU 2014-09) which will require entities to recognize revenue in an amount that reflects the transfer of promised goods or services to a customer in an amount based on the consideration the entity expects to be entitled to in exchange for those goods or services. ASU 2014-09 also requires disclosures regarding the nature, amount, timing and uncertainty of revenues and cash flows from contracts with customers. The amendments may be applied retrospectively to each prior period presented, or retrospectively with the cumulative effect recognized as of the date of initial application. ASU 2014-09 is effective for interim and annual reporting periods beginning after December 15, 2017. The Company is still evaluating its contracts with customers in relation to the requirements of ASU 2014-09, and has not concluded on the financial statement impact of implementing ASU 2014-09. The Company expects to complete its assessment by the quarter ending September 30, 2017.
In March 2016, the FASB issued ASU 2016-08, "Revenue from Contracts with Customers (Topic 606): Principal versus Agent Consideration (Reporting Revenue Gross versus Net)" that clarifies how an entity should identify the unit of accounting for the principal versus agent evaluation and how it should apply the control principle to certain types of arrangements, such as service transactions. The guidance also re-frames the indicators to focus on evidence that an entity is acting as a principal rather than an agent. The guidance is effective for public business entities for fiscal years beginning after December 15, 2017, and interim periods within those fiscal years. In May 2016, the FASB issued ASU 2016-12, which amends certain aspects of the new revenue standard, ASU 2014-09. The amendments address issues such as collectability; presentation of sales tax and other similar taxes collected from customers; noncash consideration; contract modifications and completed contracts at transition; and transition technical correction. The guidance is effective for public business entities for fiscal years beginning after December 15, 2017 and interim periods within those fiscal years. In December 2016, the FASB issued ASU 2016-20 providing technical corrections and improvements to Topic 606, Revenue from Contracts with Customers. While the Company is continuing to assess all potential impacts of the new revenue standard, the Company anticipates that the standard will not have a material impact on its consolidated financial statements.
NOTE 3—STOCKHOLDERS’ EQUITY OF THE COMPANY
Common Stock
The Company has authorized capital stock consisting of 450,000,000 shares, all with a par value of $.0001 per share, which includes 300,000,000 shares of Common Stock, 140,000,000 shares of Common Stock A and 10,000,000 shares of Preferred Stock including 3,000,000 shares of Series B Preferred Stock.
67
Each holder of Common Stock is entitled to one vote for each share of Common Stock held on all matters submitted to a vote of stockholders. Subject to preferences that may apply to shares of previously outstanding Series A Preferred Stock and currently outstanding Series B Preferred Stock as outlined below, the holders of outstanding shares of Common Stock are entitled to receive dividends. After the payment of all preferential amounts required to the holders of Series B Preferred Stock, all of the remaining assets of the Company available for distribution shall be distributed ratably among the holders of Common Stock.
NOTE 4—ACQUISITIONS
2016 Acquisition
Sanimax Energy, LLC
On March 15, 2016, the Company acquired fixed assets and inventory from Sanimax Energy, including the 20 mmgy nameplate capacity biomass-based diesel refinery in DeForest, Wisconsin. The Company completed its initial accounting of this business combination as the valuation of the real and personal property was finalized as of September 30, 2016.
The following table summarizes the consideration paid for the acquisition from Sanimax Energy:
March 15, 2016 | |||
Consideration at fair value for acquisition from Sanimax: | |||
Cash | $ | 12,541 | |
Common stock | 4,050 | ||
Contingent consideration | 4,500 | ||
Total | $ | 21,091 | |
The fair value of the 500,000 shares of Common Stock issued was determined using the closing market price of the Company's common shares at the date of acquisition.
The Company may pay contingent consideration of up to $5,000 (Earnout Payments) over a 7-year period after the acquisition, subject to achievement of certain milestones related to the biomass-based diesel gallons produced and sold by REG Madison. The Earnout Payments are payable in cash and cannot exceed $1,700 in any one year period beginning March 15, 2016 through 2023 and up to $5,000 in aggregate. As of December 31, 2016, the Company has recorded a contingent liability of $3,835, approximately $1,790 of which has been classified as current on the Consolidated Balance Sheets.
The following table summarizes the fair values of the assets acquired at the acquisition date.
March 15, 2016 | |||
Assets (liabilities) acquired from Sanimax Energy: | |||
Inventory | $ | 1,591 | |
Property, plant and equipment | 19,500 | ||
Total identifiable assets acquired | 21,091 | ||
Accrued expenses and liabilities | — | ||
Net identifiable assets acquired | $ | 21,091 | |
The following unaudited pro forma condensed combined results of operations assume that the Sanimax Energy acquisition was completed as of January 1, 2014 and as if the stock had been issued on the same date.
68
Year ended December 31, 2016 | Year ended December 31, 2015 | Year ended December 31, 2014 | |||||||||
Revenues | $ | 2,049,658 | $ | 1,406,580 | $ | 1,282,361 | |||||
Net income (loss) attributable to the Company's common stockholders | 43,453 | (157,524 | ) | 83,612 | |||||||
Basic net income (loss) per share attributable to common stockholders | $1.06 | $(3.54) | $2.03 | ||||||||
2015 acquisitions
Imperium Renewables, Inc.
On August 19, 2015, the Company acquired substantially all the assets of Imperium Renewables, Inc. (Imperium), including the 100-mmgy nameplate biomass-based diesel refinery and deepwater port terminal at the Port of Grays Harbor, Washington. The results of Imperium's operations have been included in the consolidated financial statements since that date. The Company has finalized its accounting of this business combination during the fourth quarter of 2015.
The following table summarizes the consideration paid for Imperium:
August 19, 2015 | |||
Consideration at fair value for Imperium: | |||
Cash | $ | 36,748 | |
Common stock | 15,310 | ||
Contingent consideration | 5,000 | ||
Total | $ | 57,058 | |
The fair value of the 1,675,000 shares of Common Stock issued to Imperium was determined using the closing market price of the Company's common shares at the date of acquisition.
Subject to achievement of certain milestones related to the biomass-based diesel gallons produced and sold by REG Grays Harbor and whether the BTC is reinstated, Imperium may receive certain contingent consideration (Earnout Payments) over a two-year period after the acquisition. The Earnout Payments will be payable in cash. As of December 31, 2016, the Company has recorded a contingent liability of $2,093, all of which has been classified as current on the Consolidated Balance Sheets.
The following table summarizes the estimated fair values of the assets acquired and liabilities assumed at the acquisition date.
69
August 19, 2015 | |||
Assets (liabilities) acquired of Imperium: | |||
Cash | $ | 168 | |
Accounts receivable | 8,274 | ||
Inventory | 18,989 | ||
Other current assets | 87 | ||
Property, plant and equipment | 46,476 | ||
Intangible assets | 2,900 | ||
Total identifiable assets acquired | 76,894 | ||
Accounts payable | (4,828 | ) | |
Accrued expenses and other liabilities | (942 | ) | |
Debt | (5,225 | ) | |
Deferred tax liabilities | (3,483 | ) | |
Total liabilities assumed | (14,478 | ) | |
Net identifiable assets acquired | 62,416 | ||
Less: Bargain purchase gain | 5,358 | ||
Net assets acquired | $ | 57,058 | |
Imperium was acquired at a price less than fair value of the net identifiable assets, and the Company recorded a net of tax bargain purchase gain of $5,358. All future adjustments will be reported in the Consolidated Statements of Operations. The bargain purchase gain is reported in the "Other Income, Net" on the Consolidated Statements of Operations. Prior to recognizing a bargain purchase gain, the Company reassessed whether all assets acquired and liabilities assumed had been correctly identified as well as the key valuation assumptions and business combination accounting procedures for this acquisition. After careful consideration and review, the Company concluded that the recognition of a bargain purchase gain was appropriate for this acquisition. Factors that contributed to the bargain purchase price were:
•The assets were not fully utilized by the seller and that the transaction was completed with a motivated seller that appeared to have recapitalized its investments and desired to exit the facilities that no longer fit its strategy given the uncertainties in the industry.
• The Company was able to complete the acquisition in an expedient manner, with a cash payment, stock issuance and without a financial contingency, which was a key attribute for the seller. The relatively small size of the transaction for the Company, the lack of required third-party financing and the Company's expertise in completing similar transactions in the past gave the seller confidence that the Company could complete the transaction quickly and without difficultly.
• Due to the unique nature of the products and limited number of potential buyers for this business, the seller found it advantageous to accept the Company's purchase price based upon our demonstrated ability to operate similar businesses, and financial strength that may enable the Company to make improvement and run the business at increased production rates in the long run.
2014 acquisitions
Petrotec AG
On December 24, 2014, the Company acquired 69.08% of the outstanding common shares and voting interest of Petrotec. The results of Petrotec’s operations have been included in the consolidated financial statements since that date. During the last quarter of 2015, the Company completed its purchase accounting for this business combination. The finalization of the purchase price allocation did not result in material adjustments.
The following table summarizes the consideration paid for Petrotec:
70
December 24, 2014 | |||
Consideration at fair value for Petrotec: | |||
Common stock | $ | 20,022 | |
The fair value of the 2,070,538 common shares issued to Petrotec was determined on the basis of the closing market price of the Company's common shares at the date of acquisition.
The following table summarizes the fair values of the assets acquired and liabilities assumed at the acquisition date as the purchase price allocation was finalized:
December 24, 2014 | |||
Assets (liabilities) acquired of Petrotec: | |||
Cash | $ | 13,523 | |
Accounts receivable | 4,989 | ||
Inventory | 9,470 | ||
Other current assets | 3,583 | ||
Property, plant and equipment | 25,026 | ||
Other noncurrent assets | 369 | ||
Total identifiable assets acquired | 56,960 | ||
Accounts payable | (8,171 | ) | |
Accrued expenses and other liabilities | (2,151 | ) | |
Debt | (16,192 | ) | |
Non-current liabilities | (1,462 | ) | |
Total liabilities assumed | (27,976 | ) | |
Net identifiable assets acquired | 28,984 | ||
Non-controlling interest | (8,962 | ) | |
Net assets acquired | $ | 20,022 | |
The fair value of the 30.92% noncontrolling interest in Petrotec is estimated to be $8,962 at the date of the acquisition. The fair value of the noncontrolling interest was estimated using a combination of the income approach and a market approach.
The Company recognized $1,289 of acquisition related costs that were expensed in the period the acquisition occurred.
In April 2015, Petrotec's application to de-list its shares of common stock from the Frankfurt Stock Exchange was approved. From the end of the October 8, 2015 trading day, Petrotec's shares of common stock are no longer traded on a regulated market of any stock exchange.
During 2016 and 2015, the Company acquired additional common shares of Petrotec as part of the cash tender offers and open market purchases for $149 and $4,828, respectively. At December 31, 2016 and 2015, the Company owned 90.58% and 87.49% of the outstanding common shares and voting interest of Petrotec.
In January 2017, the Company completed its acquisition of the remaining minority interest in Petrotec and now owns 100% of Petrotec's outstanding shares.
Syntroleum Corporation/Dynamic Fuels, LLC
71
On June 3, 2014, REG Synthetic Fuels, a wholly-owned subsidiary of the Company included in the Biomass-based diesel segment, acquired substantially all the assets of Syntroleum, which consisted of a 50% limited liability company membership interest in Dynamic Fuels, as well as intellectual property and other assets. Dynamic Fuels owns a 75 mmgy nameplate capacity renewable hydrocarbon diesel biorefinery located in Geismar, Louisiana. The following table summarizes the consideration paid for Syntroleum.
June 3, 2014 | |||
Consideration at fair value for Syntroleum: | |||
Common stock | $ | 34,831 | |
The fair value of the 3,493,613 shares of Common Stock issued to Syntroleum was determined on the basis of the closing market price of the Company's common shares at the date of acquisition.
The fair value of the Syntroleum renewable hydrocarbon diesel technology was determined using the relief from royalty method, or RFR, which reflects the savings realized by owning the intangible assets. The value under RFR method is dependent upon the following factors for an asset: royalty rate, discount rate, expected life and projected revenue.
On June 6, 2014, REG Synthetic Fuels acquired the remaining 50% ownership interest in Dynamic Fuels, from Tyson Foods. The Company renamed Dynamic Fuels to REG Geismar, LLC, which is included in the Biomass-based diesel segment. The finalization of the purchase price allocation resulted in an increase in goodwill of $3,202 relating to higher than initially estimated net operating losses prior to the acquisition of Syntroleum and Dynamic Fuels.
The following table summarizes the consideration paid to Tyson Foods for Dynamic Fuels:
June 6, 2014 | |||
Consideration at fair value for Dynamic Fuels: | |||
Cash | $ | 16,447 | |
Contingent consideration | 28,900 | ||
Total | $ | 45,347 | |
The following table summarizes the amount of assets acquired and liabilities assumed at the acquisition date for the combined acquisition of Syntroleum and Dynamic Fuels:
June 6, 2014 | |||
Assets (liabilities) acquired of Syntroleum and Dynamic Fuels: | |||
Cash | $ | 253 | |
Other current assets | 4,666 | ||
Property, plant and equipment | 121,567 | ||
Goodwill | 71,398 | ||
Intangible assets | 8,900 | ||
Other noncurrent assets | 10,281 | ||
Other current liabilities | (1,024 | ) | |
Deferred tax liabilities | (8,310 | ) | |
Debt | (113,553 | ) | |
Other noncurrent liabilities | (14,000 | ) | |
Total | $ | 80,178 | |
Subsequent to the closing of the Tyson Foods transaction, REG Geismar paid off the debt owed to Tyson Foods in the amount of $13,553.
Subject to achievements related to the sale of renewable hydrocarbon diesel at the REG Geismar production facility, Tyson Foods may receive contingent consideration of up to $35,000. The Company will pay contingent consideration, if and when, the Company achieves certain sales volumes. The agreement calls for periodic payments based on pre-determined payments per gallon of product sold. The probability weighted contingent payments were discounted using a risk adjusted discount rate of 5.8%. The contingent payments will be payable in cash. As of December 31, 2016, the Company has recorded a contingent
72
liability of $27,065, of which $9,589 has been classified in accrued expenses and other liabilities on the Consolidated Balance Sheets.
LS9, Inc.
On January 22, 2014, REG Life Sciences, a wholly-owned subsidiary of the Company, acquired substantially all of the assets and certain liabilities of LS9. This acquisition's finalized purchase price allocation did not result in material adjustments. The following table summarizes the consideration paid and the amounts of assets acquired and liabilities assumed at the acquisition date:
January 22, 2014 | |||
Consideration at fair value: | |||
Cash | $ | 15,275 | |
Common stock | 26,254 | ||
Contingent consideration | 17,050 | ||
Total | $ | 58,579 | |
January 22, 2014 | |||
Assets (liabilities) acquired: | |||
Property, plant and equipment | $ | 8,215 | |
In-process research & development intangible assets | 15,956 | ||
Goodwill | 34,846 | ||
Other noncurrent liabilities | (438 | ) | |
Total | $ | 58,579 | |
The fair value of the 2,230,559 shares of Common Stock issued as part of the consideration paid for LS9 was determined on the basis of the closing market price of the Company's common shares at the date of acquisition.
Subject to achievement of certain milestones related to the development and commercialization of products from LS9’s technology, LS9 may receive contingent consideration of up to $21,500 (Earnout Payments) over a five-year period after the acquisition. The Earnout Payments will be payable in cash, the Company's stock or a combination of cash and stock at the Company's election. As of December 31, 2016 and 2015, the Company has recorded a contingent liability of $13,575 and $7,590, respectively, $4,165 and $3,958, respective of which has been classified as current on the Consolidated Balance Sheets.
416 S. Bell, LLC
Prior to July 25, 2014, the Company had a 50% ownership in 416 S Bell, LLC (Bell, LLC), a variable interest entity (VIE) joint venture that owned and leased to the Company its corporate office building in Ames, Iowa. Commencing January 1, 2011, the Company had the right to execute a call option with the joint venture member, Dayton Park, LLC (Dayton Park), to purchase Bell, LLC and commencing on January 1, 2013, Dayton Park had the right to execute a put option with the Company to sell Bell, LLC. The Company determined it was the primary beneficiary of Bell, LLC and had consolidated Bell, LLC into the Company’s financial statements since January 1, 2011.
On July 25, 2014, the Company completed the acquisition of the remaining 50% interest in Bell, LLC in exchange for $1,423 cash. The Company determined that this transaction did not result in a change of control and as such has accounted for it as an equity transaction. Neither goodwill nor a gain/loss was recognized in conjunction with the acquisition.
NOTE 5—INVENTORIES
Inventories consist of the following at December 31:
73
2016 | 2015 | ||||||
Raw materials | $ | 34,560 | $ | 28,989 | |||
Work in process | 3,775 | 3,014 | |||||
Finished goods | 107,073 | 53,887 | |||||
Total | $ | 145,408 | $ | 85,890 | |||
NOTE 6—PROPERTY, PLANT AND EQUIPMENT
Company's owned property, plant and equipment consists of the following at December 31:
2016 | 2015 | ||||||
Land | $ | 5,412 | $ | 4,221 | |||
Building and improvements | 134,398 | 103,199 | |||||
Leasehold improvements | 10,520 | 8,149 | |||||
Machinery and equipment | 511,461 | 397,632 | |||||
661,791 | 513,201 | ||||||
Accumulated depreciation | (138,372 | ) | (75,119 | ) | |||
523,419 | 438,082 | ||||||
Construction in process | 76,055 | 136,502 | |||||
Total | $ | 599,474 | $ | 574,584 | |||
During 2016, the Company recorded impairment charges of $15,593 related to its Emporia facility's property, plant and equipment assets. Refer to Note 2 for further details.
NOTE 7—INTANGIBLE ASSETS
Amortizing intangible assets consist of the following at December 31:
December 31, 2016 | |||||||||||||
Cost | Accumulated Amortization | Net | Weighted Average Remaining Life | ||||||||||
Raw material supply agreement | $ | 6,230 | $ | (1,987 | ) | $ | 4,243 | 9.0 years | |||||
Renewable hydrocarbon diesel technology | 8,300 | (1,429 | ) | 6,871 | 12.5 years | ||||||||
Acquired customer relationships | 2,900 | (396 | ) | 2,504 | 8.6 years | ||||||||
Ground lease | 200 | (127 | ) | 73 | 4.9 years | ||||||||
In-process research and development | 15,956 | (177 | ) | 15,779 | 14.8 years | ||||||||
Total intangible assets | $ | 33,586 | $ | (4,116 | ) | $ | 29,470 | ||||||
December 31, 2015 | |||||||||||||
Cost | Accumulated Amortization | Net | Weighted Average Remaining Life | ||||||||||
Raw material supply agreement | $ | 6,230 | $ | (1,551 | ) | $ | 4,679 | 10.0 years | |||||
Renewable hydrocarbon diesel technology | 8,300 | (876 | ) | 7,424 | 13.5 years | ||||||||
Acquired customer relationships | 2,900 | (106 | ) | 2,794 | 9.6 years | ||||||||
Ground lease | 200 | (112 | ) | 88 | 5.9 years | ||||||||
Total amortizing intangibles | 17,630 | (2,645 | ) | 14,985 | |||||||||
In-process research and development, indefinite lives | 15,956 | — | 15,956 | ||||||||||
Total intangible assets | $ | 33,586 | $ | (2,645 | ) | $ | 30,941 | ||||||
The raw material supply agreement acquired is amortized over its 15 year term based on actual usage under the agreement and expires in 2025. The Company determined the estimated amount of raw materials to be purchased over the life of the
74
agreement to calculate a per pound rate of consumption. The rate is then multiplied by the actual usage each period for expense reporting purposes.
Amortization expense of $1,471, $1,112 and $1,298 for intangible assets was recorded for the years ended December 31, 2016, 2015 and 2014, respectively.
Estimated amortization expense for fiscal years ended December 31 is as follows:
2017 | $ | 2,366 | |
2018 | 2,372 | ||
2019 | 2,379 | ||
2020 | 2,386 | ||
2021 | 2,392 | ||
Thereafter | 17,575 | ||
Total | $ | 29,470 | |
NOTE 8—OTHER ASSETS
Prepaid expenses and other current assets consist of the following at December 31:
2016 | 2015 | ||||||
Commodity derivatives and related collateral, net | $ | 7,127 | $ | 10,097 | |||
Prepaid expenses | 10,665 | 8,504 | |||||
Deposits | 2,897 | 3,824 | |||||
RIN inventory | 9,398 | 5,656 | |||||
Taxes receivable | 4,539 | 1,814 | |||||
Other | 1,646 | 1,987 | |||||
Total | $ | 36,272 | $ | 31,882 | |||
RIN inventory is valued at the lower of cost or net realizable value and consists of (i) RINs the Company generates in connection with its production of biomass-based diesel and (ii) RINs acquired from third parties. RINs generated by the Company are recorded at no cost, as these RINs are government incentives and not a tangible output from its biomass-based diesel production. The cost of RINs acquired from third parties is determined using the average cost method. RIN market value is based upon pricing as reported by the Oil Price Information Service (OPIS). Since RINs generated by the Company have zero cost associated to them, the lower of cost or market adjustment in RIN inventory reflects only the value of RINs obtained from third parties. RIN inventory values were adjusted in the amount of $612 and $3,027 at December 31, 2016 and 2015, respectively, to reflect the lower of cost or market.
Other noncurrent assets consist of the following at December 31:
2016 | 2015 | ||||||
Spare parts inventory | $ | 3,532 | $ | 2,922 | |||
Catalysts | 4,479 | 5,742 | |||||
Deposits | 2,392 | 2,370 | |||||
Other | 2,227 | 785 | |||||
Total | $ | 12,630 | $ | 11,819 | |||
NOTE 9—ACCRUED EXPENSES AND OTHER LIABILITIES
Accrued expenses and other liabilities consist of the following at December 31:
75
2016 | 2015 | ||||||
Accrued property taxes | $ | 1,518 | $ | 1,056 | |||
Accrued employee compensation | 15,005 | 8,776 | |||||
Accrued interest | 537 | 578 | |||||
Contingent consideration, current portion | 17,637 | 14,762 | |||||
Unfavorable lease obligation, current portion | 1,828 | 1,828 | |||||
Excise tax payable | 1,603 | — | |||||
Other | 788 | 1,466 | |||||
Total | $ | 38,916 | $ | 28,466 | |||
Other noncurrent liabilities consist of the following at December 31:
2016 | 2015 | ||||||
Straight-line lease liability | $ | 2,421 | $ | 2,751 | |||
Asset retirement obligations | 1,140 | 1,062 | |||||
Other | 1,295 | 1,097 | |||||
Total | $ | 4,856 | $ | 4,910 | |||
NOTE 10—DEBT
The Company’s term debt at December 31 is as follows:
2016 | 2015 | ||||||
4.00% Convertible Senior Notes, $152,000 face amount, due in June 2036 | $ | 113,446 | $ | — | |||
2.75% Convertible debt, $73,838 face amount, due in June 2019 | 67,254 | 126,053 | |||||
REG Geismar GOZone bonds, secured, variable interest rate, due in October 2033 | — | 100,000 | |||||
REG Danville term loan, secured, variable interest rate of LIBOR plus 4%, due in December 2017 | 8,163 | — | |||||
REG Newton term loan, secured, variable interest rate of LIBOR plus 4%, due in December 2018 | 13,063 | 16,800 | |||||
REG Mason City term loan, fixed interest rate of 5%, due in July 2019 | 2,659 | 3,675 | |||||
REG Ames term loans, secured, fixed interest rates of 3.5% and 4.25%, due in January 2018 and December 2019, respectively | 3,565 | 3,901 | |||||
REG Grays Harbor term loan, variable interest of minimum 3.5% or Prime Rate plus 0.25%, due in May 2022 | 9,273 | 5,225 | |||||
Other | 468 | 908 | |||||
Total debt before debt issuance costs | 217,891 | 256,562 | |||||
Less: Current portion of long-term debt | 15,402 | 5,206 | |||||
Less: Debt issuance costs (net of accumulated amortization of $ 3,705 and $2,296, respectively) | 6,286 | 4,105 | |||||
Total long-term debt | $ | 196,203 | $ | 247,251 | |||
REG Danville
On October 31, 2015, REG Danville, LLC entered into a Second Amended and Restated Loan Agreement with Fifth Third Bank regarding the construction/term loan (the "Fifth Third Construction/Term Loan"). The renewed Fifth Third Construction/Term Loan increased the principal amount of the Construction/Term Loan to $12,000 and had a three-year term with the maturity of the loan being extended to December 19, 2017. The loan requires monthly principal payments of $212 and interest to be charged using LIBOR plus 4% per annum. The loan agreement contains various loan covenants.
Convertible Senior Notes
76
On June 2, 2016, the Company issued $152,000 aggregate principal amount of the 2036 Convertible Notes in a private offering to qualified institutional buyers. The 2036 Convertible Notes bear interest at a rate of 4.00% per year payable semi-annually in arrears on June 15 and December 15 of each year, beginning December 15, 2016. The notes will mature on June 15, 2036, unless repurchased, redeemed or converted in accordance with their terms prior to such date.
Prior to December 15, 2035, the 2036 Convertible Notes will be convertible only upon satisfaction of certain conditions and during certain periods as stipulated in the indenture. On or after December 15, 2035 until the close of business on the second scheduled trading day immediately preceding the maturity date, holders of the 2036 Convertible Notes may convert their notes at any time. Unless and until the Company obtains stockholder approval under applicable NASDAQ Stock Market rules, the 2036 Convertible Notes will be convertible, subject to certain conditions, into cash. If the Company obtains such stockholder approval, the 2036 Convertible Notes may be settled in cash, the Company’s common shares or a combination of cash and the Company’s common shares, at the Company’s election. The Company may not redeem the 2036 Convertible Notes prior to June 15, 2021. Holders of the 2036 Convertible Notes will have the right to require the Company to repurchase for cash all or some of their notes at 100% of their principal, plus any accrued and unpaid interest on each of June 15, 2021, June 15, 2026 and June 15, 2031. Holders of the 2036 Convertible Notes will have the right to require the Company to repurchase for cash all or some of their notes at 100% of their principal, plus any accrued and unpaid interest upon the occurrence of certain fundamental changes. The initial conversion rate is 92.8074 common shares per $1,000 (one thousand) principal amount of 2036 Convertible Notes (equivalent to an initial conversion price of approximately $10.78 per common share).
The net proceeds from the offering of the 2036 Convertible Notes were approximately $147,118, after deducting fees and offering expenses of $4,882, which was capitalized as debt issuance costs and is being amortized through June 2036.
The Company evaluated the terms of the conversion features under the applicable accounting literature, including Derivatives and Hedging, ASC 815, and determined that a certain feature required separate accounting as a derivative. This derivative was recorded as a long-term liability, "Convertible Debt Conversion Liability" on the Consolidated Balance Sheets and will be adjusted to reflect fair value each reporting date. The fair value of the convertible debt conversion liability at issuance was $40,145. The fair value of the convertible debt conversion liability at December 31, 2016 was $27,100. The Company recognized gains of $13,045 for the year ended December 31, 2016, which are reflected in the "Change in Fair Value of Convertible Debt Conversion Liability" on the Consolidated Statements of Operations. The debt liability component of 2036 Convertible Notes was determined to be $111,855 at issuance, reflecting a debt discount of $40,145. The debt discount is to be amortized through June 2036. The effective interest rate on the debt liability component was 2.45%.
In June 2016, approximately $35,101 of the net proceeds from the offering of the 2036 Convertible Notes were used to repurchase 4,060,323 shares of the Company's Common Stock in privately negotiated transactions. In addition, approximately $61,954 of the net proceeds from the offering were used to repurchase $63,912 principal amount of the Company's 2019 Convertible Notes in privately negotiated transactions. In September 2016, the Company used approximately $5,584 under the March 2016 share repurchase program to repurchase an additional $6,000 principal amount of the 2019 Convertible Notes. The repurchases resulted in a gain on debt extinguishment of $2,331, which is reflected on the Consolidated Statements of Operations.
REG Grays Harbor, LLC
In July 2015, REG Grays Harbor entered into a credit agreement with Umpqua Bank, or Umpqua Credit Agreement, whereby it can borrow up to $10.0 million for capital expenditure projects. Amounts borrowed under the Umpqua Credit Agreement bear interest at a per annum rate at of minimum of 3.50% or Prime Rate plus 0.25%. In addition, in July 2015 REG Grays Harbor entered into a line of credit note or Umpqua Line of Credit Note in conjunction with the Umpqua Credit Agreement for a maximum borrowing amount of $5,000. In September 2016, REG Grays Harbor entered into the first loan modification agreement with Umpqua Bank, or the First Modification, to extend the maturity date of the Umpqua Line of Credit to July 31, 2018. The terms of the Umpqua Credit Agreement provide that any principal outstanding under the Umpqua Line of Credit Note on July 31, 2016 shall be converted into term debt. At December 31, 2016, the total outstanding borrowing under the Umpqua Credit Agreement was all term debt and amounted to $9,273, bearing an interest rate of 4.30% per annum.
REG Geismar
REG Geismar was the obligor with respect to $100,000 aggregate principal amount of Gulf Opportunity Zone tax-exempt bonds, or GOZone Bonds, originally due in October 2033, through a loan agreement with the Louisiana Public Facilities Authority. REG Geismar’s payment obligations on the GOZone Bonds were supported by a letter of credit issued by a financial institution. REG Geismar was party to an agreement to reimburse the financial institution for any draws on the letter
77
of credit and that obligation was secured by a $101,315 certificate of deposit by the Company and pledged in favor of the financial institution. On September 6, 2016, REG Geismar caused the Louisiana Public Facilities Authority to call for redemption all of the outstanding GOZone Bonds as of September 6, 2016. The redemption was funded by application of the funds generated by release of the certificate of deposit.
Lines of Credit
The Company’s revolving debt at December 31 are as follows:
2016 | 2015 | ||||||
Total revolving loans (current) | $ | 52,844 | $ | 23,149 | |||
Maximum remaining available to be borrowed under revolving lines of credit | $ | 100,237 | $ | 23,067 | |||
On March 16, 2016, REG Energy Services, LLC ("REG Energy Services") entered into an operating and revolving line of credit agreement (the "Agreement") with Bankers Trust Company (“Bankers Trust”). Pursuant to the Agreement, Bankers Trust agreed to provide an operating and revolving line of credit (the "Line of Credit") to REG Energy Services in the amount of$30,000. Amounts outstanding under the Agreement bear variable interest as stipulated in the Agreement. The Agreement contains various loan covenants that restrict REG Energy Services’ ability to take certain actions, including prohibiting it in certain circumstances from making payments to the Company. In addition, the Line of Credit is secured by substantially all of REG Energy Services’ accounts receivable and inventory.
On September 30, 2016, REG Services Group, LLC and REG Marketing & Logistics Group, LLC, the Company's wholly owned subsidiaries entered into a Joinder and Amendment No. 11 to Credit Agreement (the “Amendment”) to that certain Credit Agreement originally dated as of December 23, 2011, by and among Borrowers, the lenders party thereto (“Lenders”) and Wells Fargo Capital Finance, LLC, as the agent, and Fifth Third Bank, as a new lender (as amended, the “Well Fargo Revolver”). Pursuant to the Amendment, the maximum commitment of the Lenders under the M&L and Services Revolver to make revolving loans was increased from $60,000 to $150,000, and an accordion feature was added to the M&L and Services Revolver, which allows the Company's subsidiaries that are borrowers to request commitments for additional revolving loans in aggregate amount not to exceed to $50,000, subject to customary conditions, including the consent of Lenders providing such additional commitments.
The Amendment extended the maturity date of the M&L and Services Revolver to September 30, 2021. Loans advanced under the M&L and Services Revolver bear interest based on a one-month LIBOR rate (which shall not be less than zero), plus a margin based on Quarterly Average Excess Availability (as defined in the Revolving Credit Agreement), which may range from 1.75% per annum to 2.25% per annum.
The M&L and Services Revolver contains various loan covenants that restrict each subsidiary borrower’s ability to take certain actions, including restrictions on incurrence of indebtedness, creation of liens, mergers or consolidations, dispositions of assets, repurchase or redemption of capital stock, making certain investments, making distributions to us unless certain conditions are satisfied, entering into certain transactions with affiliates or changing the nature of the subsidiary’s business. In addition, the subsidiary borrowers are required to maintain a fixed charge coverage ratio of at least 1.0 to 1.5 if excess availability under the M&L and Services Revolver is less than 10% of the total $150,000 of current revolving loan commitments, or $15,000 currently. The M&L and Services Revolver is secured by the subsidiary borrowers’ membership interests and substantially all of their assets. In addition, the M&L and Services Revolver is secured by the accounts receivable and inventory of REG Albert Lea, LLC, REG Houston, LLC, REG New Boston, LLC, and REG Geismar, LLC (collectively, the "Plant Loan Parties") subject to a $40,000 limitation with respect to each of the Plant Loan Parties.
Maturities of the term debt, including the convertible debt, are as follows for the years ending December 31:
2017 | $ | 15,402 | |
2018 | 14,757 | ||
2019 | 69,497 | ||
2020 | 1,576 | ||
2021 | 1,638 | ||
Thereafter | 115,021 | ||
Total | 217,891 | ||
Less: current portion | 15,402 | ||
$ | 202,489 | ||
78
NOTE 11—INCOME TAXES
Income tax benefit (expense) for the years ended December 31 is as follows:
2016 | 2015 | 2014 | |||||||||
Current income tax benefit (expense) | |||||||||||
Federal | $ | — | $ | — | $ | — | |||||
State | 94 | — | — | ||||||||
Foreign | (1,036 | ) | (225 | ) | — | ||||||
(942 | ) | (225 | ) | — | |||||||
Deferred income tax benefit (expense) | |||||||||||
Federal | 2,113 | 24,151 | (14,112 | ) | |||||||
State | 6,936 | 9,736 | 1,420 | ||||||||
Foreign | (2,560 | ) | 1,035 | 9 | |||||||
Net operating loss carryforwards created | 105,165 | 88,110 | 61,640 | ||||||||
111,654 | 123,032 | 48,957 | |||||||||
Income tax benefit (expense) before valuation allowances | 110,712 | 122,807 | 48,957 | ||||||||
Deferred tax valuation allowances | (114,980 | ) | (114,106 | ) | (52,529 | ) | |||||
Income tax benefit (expense) | $ | (4,268 | ) | $ | 8,701 | $ | (3,572 | ) | |||
A reconciliation of the reported amount of income tax expense to the amount computed by applying the statutory federal income tax rate to earnings from continuing operations before income taxes is as follows:
2016 | 2015 | 2014 | |||||||||
U.S. Federal income tax expense at a statutory rate of 35 percent | $ | (17,143 | ) | $ | 56,144 | $ | (30,139 | ) | |||
State taxes, net of federal income tax benefit | 11,442 | 12,777 | 5,119 | ||||||||
Tax position on government incentives | 117,630 | 85,423 | 76,662 | ||||||||
Goodwill impairment tax impact | 2,876 | (35,062 | ) | — | |||||||
Bargain purchase gain | — | 1,875 | — | ||||||||
Foreign net operating loss expiration | (2,383 | ) | — | — | |||||||
Other | (1,710 | ) | 1,650 | (2,685 | ) | ||||||
Total (expense) benefits for income taxes before valuation allowances | 110,712 | 122,807 | 48,957 | ||||||||
Valuation allowances | (114,980 | ) | (114,106 | ) | (52,529 | ) | |||||
Total benefit (expense) for income taxes | $ | (4,268 | ) | $ | 8,701 | $ | (3,572 | ) | |||
The Company receives government incentive payments and excludes this revenue from federal and state taxable income. This tax position of excluding government incentives from taxable income has been accepted by the Internal Revenue Service under audit for 2010 and 2011 and has been approved by the Joint Committee on Taxation. As a result of excluding these government incentive payments, the Company currently has cumulative losses in recent years and initially established a valuation allowance in 2013 to reduce its total deferred tax assets to the amount more-likely-than-not to be realized.
In 2015, the Company had a non-cash impairment charge for goodwill of $175,028, of which $91,961 was not deductible for tax purposes. A $32,186 tax impact related to the non-deductible portion of the goodwill impairment charge is reflected in the tax reconciliation above for 2015 in the amount of $35,062, offset with $2,876 in 2016.
The tax effects of temporary differences that give rise to the Company’s deferred tax assets and liabilities at December 31 are as follows:
79
2016 | 2015 | ||||||
Deferred Tax Assets: | |||||||
Goodwill | $ | 42,082 | $ | 39,172 | |||
Net operating loss carryforwards | 346,768 | 243,865 | |||||
Tax credit carryforwards | 1,597 | 1,597 | |||||
Start-up costs | 857 | 988 | |||||
Stock-based compensation | 5,853 | 4,703 | |||||
Terminal leases | 2,603 | 3,859 | |||||
Capitalized research and development | 11,394 | 8,096 | |||||
Accrued compensation | 4,419 | 2,546 | |||||
Inventory capitalization | 3,227 | 2,046 | |||||
Allowance for doubtful accounts | 800 | 567 | |||||
Other | 2,363 | 1,569 | |||||
Deferred tax assets | 421,963 | 309,008 | |||||
Deferred Tax Liabilities: | |||||||
Prepaid expenses | (1,724 | ) | (1,338 | ) | |||
Property, plant and equipment | (61,431 | ) | (65,398 | ) | |||
Intangibles | (3,591 | ) | (3,909 | ) | |||
Deferred revenue | (3,454 | ) | — | ||||
Convertible debt | (5,797 | ) | (3,626 | ) | |||
Unrealized gain (loss) on available for sale investments | 874 | (1,752 | ) | ||||
Other | (2,084 | ) | (2,007 | ) | |||
Deferred tax liabilities | (77,207 | ) | (78,030 | ) | |||
Net deferred tax assets (liabilities) | 344,756 | 230,978 | |||||
Valuation allowance | (365,035 | ) | (250,164 | ) | |||
Net deferred taxes | $ | (20,279 | ) | $ | (19,186 | ) | |
At December 31, 2016, the Company has recorded a deferred tax asset of $346,768 reflecting the benefit of federal, state and foreign net operating loss carry-forwards. Federal net operating loss carry-forward totals $887,228 and will begin to expire in 2028, while the amount and expiration dates of state net operating losses vary by jurisdiction. Changes in ownership of the Company, as defined by Section 382 of the Internal Revenue Code of 1986, as amended, may limit the utilization of federal and state net operating losses and credit carry-forwards in any one year. The Company has performed an ownership change analysis in 2016 to determine the impact of changes in ownership on utilization of carry-forward attributes, the results of which have been incorporated into our financial statements.
In evaluating available evidence around the recoverability of net deferred tax assets, the Company considers, among other factors, historical financial performance, expectation of future earnings, length of statutory carry-forward periods and ability to carry back losses to prior periods, experience with operating loss and tax credit carry-forwards expiring unused, tax planning strategies and timing for the of reversals of temporary differences. In evaluating losses, management considers the nature, frequency and severity of losses in light of the conditions giving rise to those losses. As a result of the above described tax position of excluding government incentive payments from taxable income, the Company currently has cumulative losses in recent years and has established a valuation allowance to reduce its total deferred tax assets to the amount more-likely-than-not to be realized. Activity regarding the valuation allowance for deferred tax assets was as follows:
2016 | 2015 | 2014 | |||||||||
Beginning of year balance | $ | 250,164 | $ | 136,547 | $ | 76,916 | |||||
Changes in valuation allowance charged to income | 114,980 | 114,106 | 52,529 | ||||||||
Foreign currency translation | (109 | ) | (773 | ) | — | ||||||
Acquisition | — | 284 | 7,102 | ||||||||
End of year balance | $ | 365,035 | $ | 250,164 | $ | 136,547 | |||||
80
The Company analyzes filing positions in all of the federal and state jurisdictions where it is required to file income tax returns, and all open tax years in these jurisdictions to determine if it has any uncertain tax positions on any of its income tax returns. An uncertain tax position represents the Company’s expected treatment of a tax position taken in a filed tax return, or planned to be taken in a tax return not yet filed, that has not been reflected in measuring income tax expense for financial reporting purposes. The Company does not recognize income tax benefits associated with uncertain tax positions where it is determined that it is not more-likely-than-not, based on the technical merits, that the position will be sustained upon examination.
A reconciliation of the total amounts of unrecognized tax benefits at December 31 is as follows:
2016 | 2015 | 2014 | |||||||||
Beginning and end of year balance | $ | 1,900 | $ | 1,900 | $ | 1,900 | |||||
The amount of unrecognized tax benefits that would affect the effective tax rate if the tax benefits were recognized was $0 at December 31, 2016, 2015 and 2014. The remaining liability for unrecognized tax benefits is related to tax positions for which there is a related deferred tax asset. The Company does not believe it is reasonably possible that the amounts of unrecognized tax benefits existing as of December 31, 2016 will significantly increase or decrease over the next twelve months. Interest and penalties related to unrecognized tax benefits are recognized as a component of income tax expense. The Company has not recorded any such amounts in the periods presented.
The Company is subject to tax in the U.S. and various state and foreign jurisdictions. The U.S. Internal Revenue Service has examined the Company's federal income tax returns through 2008, as well as 2010 and 2011. All other years are subject to examination, while various state and foreign income tax returns also remain subject to examination by state taxing authorities.
The Company considers its foreign earnings of non U.S. subsidiaries to be permanently reinvested. Any amount would become taxable upon a repatriation of assets from the subsidiary or a sale or liquidation of the subsidiary. The Company has not made a provision for U.S. or additional foreign withholding taxes. The Company has $0 deferred tax liability related to investments in its foreign subsidiaries. If the Company had a deferred tax liability related to its foreign subsidiaries it would be unrecorded as the Company considers its foreign earnings indefinitely reinvested.
NOTE 12—STOCK-BASED COMPENSATION
On October 26, 2011, the stockholders approved the 2009 Stock Incentive Plan (the 2009 Plan) which authorizes up to 4,160,000 shares of Company Common Stock to be issued for the award of restricted stock, restricted stock units (RSUs), performance restricted stock units (PRSUs) and stock appreciation rights (SARs) at the discretion of the Company Board as compensation to employees, consultants of the Company and to non-employee directors. Under the 2009 Plan, an additional 1,800,000 shares, or 5,960,000 shares in total, are reserved for issuance as approved by shareholders on May 15, 2014. The expense is measured at the grant-date fair value of the award and recognized as compensation expense on a straight-line basis over the service period, which is the vesting period. There was no cash flow impact resulting from the grants of these awards. The 2009 Plan is generally protected from anti-dilution via adjustments for any stock dividends, stock split, combination or other recapitalization.
The Company recorded stock-based compensation expense of $5,896, $5,161 and $5,883 for the years ended December 31, 2016, 2015 and 2014, respectively. The stock-based compensation costs were included as a component of selling, general and administrative expenses. At December 31, 2016, there was $8,103 of unrecognized compensation expense related to unvested awards, which is expected to be recognized over a period of approximately 2.9 years.
Restricted Stock Units
The following table summarizes information about the Company’s Common Stock RSU’s granted, vested, exercised and forfeited:
81
Number of Awards | Weighted Average Issue Price | |||||
Awards outstanding - January 1, 2014 | 500,928 | $15.81 | ||||
Issued | 257,030 | $10.97 | ||||
Vested and restriction lapsed | (124,906 | ) | $10.42 | |||
Forfeited | (16,658 | ) | $10.95 | |||
Awards outstanding - December 31, 2014 | 616,394 | $15.00 | ||||
Issued | 339,280 | $9.34 | ||||
Vested and restriction lapsed | (295,089 | ) | $9.36 | |||
Forfeited | (22,687 | ) | $10.56 | |||
Awards outstanding - December 31, 2015 | 637,898 | $12.87 | ||||
Issued | 504,647 | $9.07 | ||||
Vested and restriction lapsed | (249,356 | ) | $9.77 | |||
Forfeited | (33,938 | ) | $8.15 | |||
Awards outstanding - December 31, 2016 | 859,251 | $11.73 | ||||
The RSUs convert into one share of common stock upon vesting. RSU’s cliff vest at the earlier of expressly provided service or performance conditions. The service period for these RSU awards, excluding those issued to the Company’s Board of Directors (one year) and certain executive management (four year), is a three year period from the grant date. The performance conditions provide for accelerated vesting upon various conditions including a change in control or other common stock liquidity events.
Performance Restricted Stock Units
The following table summarizes information about the Company’s Common Stock RSU’s granted, vested, exercised and forfeited:
Number of Awards | Weighted Average Issue Price | |||||
Awards outstanding -January 1, 2015 | — | $ | — | |||
Issued | 59,623 | $ | 9.40 | |||
Vested and restriction lapsed | — | $ | — | |||
Forfeited | — | $ | — | |||
Awards outstanding - December 31, 2015 | 59,623 | $ | 9.40 | |||
Issued | 175,217 | $ | 9.06 | |||
Vested and restriction lapsed | — | $ | — | |||
Forfeited | — | $ | — | |||
Awards outstanding - December 31, 2016 | 234,840 | $ | 9.15 | |||
The PRSUs convert into one share of common stock upon vesting. PRSUs vest in different tranches upon meeting certain performance conditions, which are generally based on the Company's stock price performance and expressly provided service. These PRSUs are fair valued at grant date based on Monte Carlo simulations. The derived service period for these PRSU awards as a result of the Monte Carlo simulation, is a approximately two year period from the grant date. The performance conditions provide for accelerated vesting upon various conditions including a change in control or other common stock liquidity events.
Stock Appreciation Rights
The following table summarizes information about SARs granted, forfeited, vested and exercisable:
82
Number of SAR’s | Weighted Average Exercise Price | Weighted Average Contractual Term | ||||||
SAR's outstanding - January 1, 2014 | 1,373,069 | $10.28 | ||||||
Granted | 449,225 | $11.73 | ||||||
Exercised | (435 | ) | $7.37 | |||||
Forfeited | (12,557 | ) | $11.57 | |||||
SAR's outstanding - December 31, 2014 | 1,809,302 | $10.63 | 8.1 years | |||||
Granted | 655,855 | $9.47 | ||||||
Exercised | (14,470 | ) | $9.21 | |||||
Forfeited | (54,561 | ) | $10.30 | |||||
SAR's outstanding - December 31, 2015 | 2,396,126 | $10.33 | 7.6 years | |||||
Granted | 176,824 | $8.80 | ||||||
Exercised | (8,003 | ) | $8.57 | |||||
Forfeited | (56,932 | ) | $10.75 | |||||
SAR's outstanding - December 31, 2016 | 2,508,015 | $10.22 | 6.7 years | |||||
SAR's exercisable - December 31, 2016 | 1,015,440 | $15.92 | 6.7 years | |||||
SAR's expected to vest - December 31, 2016 | 1,096,639 | $10.19 | 6.7 years | |||||
The SARs vest 25% annually on each of the four anniversary dates following the grant date and expire after ten years. The fair value of each SAR grant is estimated using the Black-Scholes option-pricing model as set forth in the table below:
2016 | 2015 | 2014 | |||
The weighted average fair value of stock appreciation rights issued (per unit) | $2.79 - $3.74 | $3.33 - $3.90 | $4.18 - $4.93 | ||
Dividend yield | —% | —% | —% | ||
Weighted average risk-free interest rate | 1.1% - 1.4% | 1.4% - 1.6% | 1.5% - 1.8% | ||
Weighted average expected volatility | 40% | 40% | 40% | ||
Expected life in years | 6.25 | 6.25 | 6.25 | ||
Stock Options
The following table summarizes information about Common Stock options granted, exercised, forfeited, vested and exercisable:
83
Number of Options | Weighted Average Exercise Price | Weighted Average Contractual Term | ||||||
Options outstanding - January 1, 2014 | 87,026 | $23.75 | 2.6 years | |||||
Granted | — | $— | ||||||
Exercised | — | $— | ||||||
Forfeited | — | $— | ||||||
Options outstanding - December 31, 2014 | 87,026 | $23.75 | 1.6 years | |||||
Granted | — | $— | ||||||
Exercised | — | $— | ||||||
Forfeited | — | $— | ||||||
Options outstanding - December 31, 2015 | 87,026 | $23.75 | 0.6 years | |||||
Granted | — | $— | ||||||
Exercised | — | $— | ||||||
Forfeited/Expired | (87,026 | ) | $— | |||||
Options outstanding - December 31, 2016 | — | $— | 0.0 years | |||||
Options exercisable - December 31, 2016 | — | $— | 0.0 years | |||||
There were no outstanding stock options at December31, 2016. There was no intrinsic value of options granted, exercised or outstanding during the periods presented.
NOTE 13—RELATED PARTY TRANSACTIONS
The Company reassesses its related parties at reporting dates and has determined that West Central Cooperative, now
known as Landus Cooperative ("Landus"), is no longer a related party because it does not hold ten percent or more of the
Company’s outstanding Common Stock, and no longer has the right to a seat on the Company's board throughout 2016 and for the last nine months of 2015. Transactions with Landus, prior to the Company's determination that Landus was no longer a related party, amounted to $4,542 and $42,622 for 2015 and 2014, respectively, primarily related to raw material purchases at market prices. This amount was included in the "Costs of goods sold - Biomass-based diesel" on the Consolidated Statements of Operations.
NOTE 14—OPERATING LEASES
The Company leases certain land and equipment under operating leases. Total rent expense under operating leases was $22,487, $19,814 and $17,498 for the years ended December 31, 2016, 2015 and 2014, respectively. For each of the next five calendar years and thereafter, future minimum lease payments under operating leases that have initial or remaining noncancelable lease terms in excess of one year are as follows:
Total Payments | |||
2017 | $ | 18,731 | |
2018 | 16,575 | ||
2019 | 15,300 | ||
2020 | 10,626 | ||
2021 | 10,242 | ||
Thereafter | 40,553 | ||
Total minimum payments | $ | 112,027 | |
The Company's leases consist primarily of access to distribution terminals, biomass-based diesel storage facilities, railcars and vehicles. At the end of the lease term the Company, generally, has the option to (a) return the leased equipment to the lessor, (b) purchase the property at its then fair value or (c) renew its lease at the then fair rental value on a year-to-year basis or for an agreed upon term. Certain leases allow for adjustment to minimum rentals in future periods as determined by the Consumer Price Index.
84
NOTE 15 — DERIVATIVE INSTRUMENTS
The Company has entered into heating oil and soybean oil futures, swaps and options (commodity derivative contracts) to reduce the risk of price volatility related to anticipated purchases of feedstock raw materials and to protect gross profit margins from potentially adverse effects of price volatility on biomass-based diesel sales where prices are set at a future date. All of the Company’s derivatives are recorded at fair value on the Consolidated Balance Sheets. Unrealized gains and losses on commodity futures, swaps and options contracts used to risk-manage feedstock purchases or biomass-based diesel inventory are recognized as a component of biomass-based diesel costs of goods sold reflected in current results of operations.
At December 31, 2016, the net notional volumes of heating oil and soybean oil covered under the open commodity derivative contracts were 45.4 million gallons and 41.0 million pounds, respectively.
The Company offsets the fair value amounts recognized for its commodity derivative contracts with cash collateral with the same counterparty under a master netting agreement. The net position is presented within Prepaid expenses and other assets in the Consolidated Balance Sheets, see "Note 10 – Other Assets". As of December 31, 2016, the Company posted $9,366 of collateral associated with its commodity-based derivatives with a net liability position of $2,239.
The following tables provide details regarding the Company’s derivative financial instruments:
December 31, 2016 | December 31, 2015 | ||||||||||||||
Assets | Liabilities | Assets | Liabilities | ||||||||||||
Gross amounts of commodity derivative contracts recognized at fair value | $ | 1,272 | $ | 3,511 | $ | 4,644 | $ | 185 | |||||||
Cash collateral | 9,366 | — | 5,638 | — | |||||||||||
Total gross amount recognized | 10,638 | 3,511 | 10,282 | 185 | |||||||||||
Gross amounts offset | (3,511 | ) | (3,511 | ) | (185 | ) | (185 | ) | |||||||
Net amount reported in the Consolidated Balance Sheets | $ | 7,127 | $ | — | $ | 10,097 | $ | — | |||||||
The following table sets forth the pre-tax gains (losses) included in the Consolidated Statements of Operations:
Location of Gain (Loss) Recognized in income | 2016 | 2015 | 2014 | ||||||||||
Commodity derivatives | Cost of goods sold – Biomass-based diesel | $ | (35,386 | ) | $ | 35,983 | $ | 61,631 | |||||
NOTE 16—FAIR VALUE MEASUREMENT
The fair value hierarchy prioritizes the inputs used in measuring fair value as follows:
• | Level 1—Quoted prices for identical instruments in active markets. |
• | Level 2—Quoted prices for similar instruments in active markets, quoted prices for identical or similar instruments in markets that are not active and model-derived valuations, in which all significant inputs are observable in active markets. |
• | Level 3—Unobservable inputs in which there is little or no market data, which require the reporting entity to develop its own assumptions. |
A summary of assets (liabilities) measured at fair value is as follows:
As of December 31, 2016 | |||||||||||||||
Total | Level 1 | Level 2 | Level 3 | ||||||||||||
Commodity contract derivatives | $ | (2,239 | ) | $ | (1,297 | ) | $ | (942 | ) | $ | — | ||||
Convertible debt conversion liability | $ | (27,100 | ) | — | (27,100 | ) | — | ||||||||
Contingent consideration for acquisitions | $ | (46,568 | ) | — | — | (46,568 | ) | ||||||||
$ | (75,907 | ) | $ | (1,297 | ) | $ | (28,042 | ) | $ | (46,568 | ) | ||||
85
As of December 31, 2015 | |||||||||||||||
Total | Level 1 | Level 2 | Level 3 | ||||||||||||
Commodity contract derivatives | $ | 4,459 | 2,196 | 2,263 | — | ||||||||||
Contingent consideration for acquisitions | $ | (41,712 | ) | — | — | (41,712 | ) | ||||||||
$ | (37,253 | ) | $ | 2,196 | $ | 2,263 | $ | (41,712 | ) | ||||||
The following is a reconciliation of the beginning and ending balances for liabilities measured at fair value on a recurring basis using significant unobservable inputs (Level 3) during the years ended as follows:
Contingent Consideration for Acquisitions | |||||||
2016 | 2015 | ||||||
Balance at beginning of period, January 1 | $ | 41,712 | $ | 39,319 | |||
Fair value of contingent consideration at measurement date | 4,500 | 5,000 | |||||
Change in estimates included in earnings | 7,904 | (359 | ) | ||||
Settlements | (7,548 | ) | (2,248 | ) | |||
Balance at end of period, December 31 | $ | 46,568 | $ | 41,712 | |||
The Company used the following methods and assumptions to estimate fair value of its financial instruments:
Commodity contract derivatives: The instruments held by the Company consist primarily of futures contracts, swap agreements, purchased put options and written call options. The fair value of contracts based on quoted prices of identical assets in an active exchange-traded market is reflected in Level 1. Contract fair value is determined based on quoted prices of similar contracts in over-the-counter markets and are reflected in Level 2.
Contingent consideration for acquisitions: The fair value of the contingent consideration regarding REG Life Sciences, LLC ("REG Life Sciences") is determined using an expected present value technique. Expected cash flows are determined using the probability weighted-average of possible outcomes that would occur should achievement of certain milestones related to the development and commercialization of products from REG Life Sciences' technology occur. There is no observable market data available to use in valuing the contingent consideration; therefore, the Company developed its own assumptions related to the expected future delivery of product enhancements to estimate the fair value of these liabilities. An 8.0% discount rate is used to estimate the fair value of the expected payments.
The fair value of all other contingent consideration is determined using an expected present value technique. Expected cash flows are determined using the probability weighted-average of possible outcomes that would occur should the achievement of certain milestones related to the production and/or sale of biomass-based diesel at the specific production facility. A discount rate ranging from 5.8% to 10.0% is used to estimate the fair value of the expected payments.
Convertible debt conversion liability: The fair value of the convertible debt conversion liability is estimated using the Black-Scholes model incorporating the terms and conditions of the 2036 Convertible Notes and considering changes in the prices of the Company's common stock, Company stock price volatility, risk-free rates and changes in market rates. The valuations are, among other things, subject to changes in the Company's credit worthiness as well as change in general market conditions. As the majority of the assumptions used in the calculations are based on market sources, the fair value of the convertible conversion liability is reflected in Level 2.
Debt and lines of credit: The fair value of long-term debt and lines of credit was established using discounted cash flow calculations and current market rates reflecting Level 2 inputs.
The estimated fair values of the Company’s financial instruments, which are not recorded at fair value are as follows as of December 31:
86
2016 | 2015 | ||||||||||||||
Asset (Liability) Carrying Amount | Estimated Fair Value | Asset (Liability) Carrying Amount | Estimated Fair Value | ||||||||||||
Financial Liabilities: | |||||||||||||||
Debt and lines of credit | $ | (270,735 | ) | $ | (264,267 | ) | $ | (279,711 | ) | $ | (275,123 | ) | |||
NOTE 17—NET INCOME (LOSS) PER SHARE
Basic net income per common share is presented in conformity with the two-class method required for participating securities. Participating securities include, or have included, Series A Preferred Stock, Series B Preferred Stock and RSU's.
Under the two-class method, net income is reduced for distributed and undistributed dividends earned in the current period. The remaining earnings are then allocated to Common Stock and the participating securities. The Company calculates the effects of participating securities on diluted earnings per share (EPS) using both the “if-converted or treasury stock” and "two-class" methods and discloses the method which results in a more dilutive effect. The effects of Common Stock options, warrants, stock appreciation rights and convertible notes on diluted EPS are calculated using the treasury stock method unless the effects are anti-dilutive to EPS.
The following potentially dilutive average number of securities were excluded from the calculation of diluted net income per share attributable to common stockholders during the periods presented as the effect was anti-dilutive:
Year Ended December 31, | ||||||||
2016 | 2015 | 2014 | ||||||
Options to purchase common stock | 43,513 | 87,026 | 87,026 | |||||
Stock appreciation rights | 2,422,716 | 2,072,130 | 1,400,824 | |||||
Warrants to purchase common stock | — | — | 17,916 | |||||
2019 Convertible notes | 7,895,675 | 10,838,218 | 6,295,075 | |||||
2036 Convertible notes | 8,209,651 | — | — | |||||
Total | 18,571,555 | 12,997,374 | 7,800,841 | |||||
The following table presents the calculation of diluted net income per share for the years ended December 31, 2016, 2015 and 2014 (in thousands, except share and per share data):
2016 | 2015 | 2014 | |||||||||
Net income (loss) attributable to the Company's common stockholders - Basic | $ | 43,453 | $ | (151,392 | ) | $ | 81,620 | ||||
Plus: distributed dividends to Preferred Stockholders | — | — | 40 | ||||||||
Plus (less): effect of participating securities | 874 | — | (418 | ) | |||||||
Net income (loss) attributable to common stockholders | 44,327 | (151,392 | ) | 81,242 | |||||||
Less: effect of participating securities | (874 | ) | — | — | |||||||
Net income (loss) attributable to the Company's common stockholders - Diluted | $ | 43,453 | $ | (151,392 | ) | $ | 81,242 | ||||
Shares: | |||||||||||
Weighted-average shares outstanding - Basic | 40,897,549 | 43,958,803 | 40,740,411 | ||||||||
Adjustment to reflect stock appreciation right conversions | 5,311 | — | 9,502 | ||||||||
Weighted-average shares outstanding - Diluted | 40,902,860 | 43,958,803 | 40,749,913 | ||||||||
Net income (loss) per share attributable to common stockholders - Diluted | $ | 1.06 | $ | (3.44 | ) | $ | 1.99 | ||||
NOTE 18—REPORTABLE SEGMENTS AND GEOGRAPHIC INFORMATION
The Company reports its reportable segments based on products and services provided to customers. The Company re-assesses its reportable segment on an annual basis. During the fourth quarter of 2015, the Company determined that as
87
activities surrounding its renewable chemicals business increase, it changed the composition of its operating segments from two reportable segments to three reportable segments by presenting Renewable Chemicals separate from Biomass-based diesel. The new reportable segments generally align the Company's external financial reporting segments with its new internal operating segments, which are based on its internal organizational structure, operating decisions, and performance assessment. There are no changes to the Company's assessments in 2016. As such, our reportable segments at December 31, 2016 include Biomass-based diesel, Services, Renewable Chemicals and Corporate and other activities. The accounting policies of the segments are the same as those described in the summary of significant accounting policies. All prior period disclosures below have been recast to present results on a comparable basis.
The Biomass-based diesel segment processes waste vegetable oils, animal fats, virgin vegetable oils and other feedstocks and methanol into biomass-based diesel. The Biomass-based diesel segment also includes the Company’s purchases and resale of biomass-based diesel produced by third parties. Revenue is derived from the purchases and sales of biomass-based diesel, RINs and raw material feedstocks acquired from third parties, sales of biomass-based diesel produced under toll manufacturing arrangements with third party facilities, sales of processed biomass-based diesel from Company facilities, related by-products and renewable energy government incentive payments, in the U.S. and internationally.
The Services segment offers services for managing the construction of biomass-based diesel production facilities and managing ongoing operations of third party plants and collects fees related to the services provided. The Company does not allocate items that are of a non-operating nature or corporate expenses to the business segments. Revenues are recorded by the Services segment at cost.
The Renewable Chemicals segment consists of research and development activities involving the production of renewable chemicals, additional advanced biofuels and other products from the Company's proprietary microbial fermentation process and the operations of a demonstration scale facility located in Okeechobee, Florida. The Renewable Chemicals segment started to have research and development collaborative and initial product revenues in 2016.
The Corporate and Other segment includes trading activities related to petroleum-based heating oil and diesel fuel as well as corporate activities, which consist of corporate office expenses such as compensation, benefits, occupancy and other administrative costs, including management service expenses. Corporate and other also includes income/(expense) not associated with the reportable segments, such as corporate general and administrative expenses, shared service expenses, interest expense and interest income, all reflected on an accrual basis of accounting. In addition, corporate and other includes cash and other assets not associated with the reportable segments, including investments. Intersegment revenues are reported by the Services and Corporate and Other segments.
The following table represents the significant items by reportable segment for the results of operations for the years ended December 31, 2016, 2015 and 2014:
88
2016 | 2015 | 2014 | |||||||||
Net sales: | |||||||||||
Biomass-based Diesel (includes Petrotec's net sales of $171,358, $145,039, and $3,563, respectively) | $ | 1,952,361 | $ | 1,326,452 | $ | 1,264,850 | |||||
Services | 87,014 | 102,731 | 85,149 | ||||||||
Renewable Chemicals | 2,065 | — | — | ||||||||
Corporate and other | 106,572 | 68,984 | 11,940 | ||||||||
Intersegment revenues | (106,780 | ) | (110,823 | ) | (88,108 | ) | |||||
$ | 2,041,232 | $ | 1,387,344 | $ | 1,273,831 | ||||||
Income (loss) before income taxes | |||||||||||
Biomass-based diesel (includes Petrotec's income (loss) of $5,007, $(1,643), and $(337), respectively) | $ | 64,814 | $ | (100,152 | ) | $ | 104,136 | ||||
Services | 2,970 | 6,323 | 6,980 | ||||||||
Renewable Chemicals | (19,787 | ) | (52,728 | ) | (12,252 | ) | |||||
Corporate and other | 984 | (13,854 | ) | (12,754 | ) | ||||||
$ | 48,981 | $ | (160,411 | ) | $ | 86,110 | |||||
Depreciation and amortization expense, net: | |||||||||||
Biomass-based diesel (includes Petrotec's amounts of $2,849, $3,259, and $0, respectively) | $ | 29,018 | $ | 22,799 | $ | 13,497 | |||||
Services | 613 | 302 | 204 | ||||||||
Renewable Chemicals | 1,550 | 1,413 | 1,293 | ||||||||
Corporate and other | 1,696 | 1,362 | 802 | ||||||||
$ | 32,877 | $ | 25,876 | $ | 15,796 | ||||||
Cash paid for purchases of property, plant and equipment: | |||||||||||
Biomass-based diesel (includes Petrotec's amounts of $1,353, $1,816, and $0, respectively) | $ | 52,952 | $ | 59,859 | $ | 52,846 | |||||
Services | 4,731 | 1,510 | 643 | ||||||||
Renewable Chemicals | 473 | 672 | 532 | ||||||||
Corporate and other | 2,549 | 2,436 | 6,142 | ||||||||
$ | 60,705 | $ | 64,477 | $ | 60,163 | ||||||
2016 | 2015 | ||||||
Goodwill: | |||||||
Biomass-based diesel | $ | — | $ | — | |||
Services | 16,080 | 16,080 | |||||
Renewable Chemicals | — | — | |||||
$ | 16,080 | $ | 16,080 | ||||
Assets: | |||||||
Biomass-based diesel (including Petrotec's assets of $51,822 and $45,471) | $ | 1,026,349 | $ | 1,048,923 | |||
Services | 53,823 | 60,308 | |||||
Renewable Chemicals | 22,883 | 23,872 | |||||
Corporate and other | 299,825 | 308,782 | |||||
Intersegment eliminations | (266,277 | ) | (218,265 | ) | |||
$ | 1,136,603 | $ | 1,223,620 | ||||
Geographic Information:
89
The following geographic data include net sales attributed to the countries based on the location of the subsidiary making the sale and long-lived assets based on physical location. Long-lived assets represent the net book value of property, plant and equipment. Sales and long-lived assets of the Company's investment in Petrotec comprise substantially all of the amounts categorized as Foreign in the table below.
2016 | 2015 | 2014 | |||||||||||
Net sales: | |||||||||||||
United States | $ | 1,869,874 | $ | 1,242,305 | $ | 1,270,268 | |||||||
Foreign | 171,358 | 145,039 | 3,563 | ||||||||||
$ | 2,041,232 | $ | 1,387,344 | $ | 1,273,831 | ||||||||
2016 | 2015 | ||||||||||||
Long-lived assets: | |||||||||||||
United States | $ | 580,868 | $ | 553,987 | |||||||||
Foreign | 18,606 | 20,597 | |||||||||||
$ | 599,474 | $ | 574,584 | ||||||||||
NOTE 19—COMMITMENTS AND CONTINGENCIES
The Company is involved in legal proceedings in the normal course of business. The Company currently believes that any ultimate liability arising out of such proceedings will not have a material adverse effect on the Company’s financial position, results of operations or cash flows.
The Company has entered into contracts for supplies of hydrogen, nitrogen and utilities for the REG Geismar production facility and natural gas for REG Albert Lea. The following table outlines the minimum take or pay requirement related to the purchase of hydrogen, nitrogen, utilities and natural gas.
2017 | $ | 3,857 | |
2018 | 3,784 | ||
2019 | 3,748 | ||
2020 | 3,297 | ||
2021 | 2,976 | ||
Thereafter | 9,570 | ||
Total | $ | 27,232 | |
As of December 31, 2016, REG Geismar relies on one supplier to provide hydrogen necessary to execute the production process. Any disruptions to the hydrogen supply during production from this supplier will result in the shutdown of the REG Geismar plant operations. The Company is currently seeking additional hydrogen suppliers for the REG Geismar facility.
NOTE 20—SUPPLEMENTAL QUARTERLY INFORMATION (UNAUDITED)
During the third quarter 2016 close process, the Company identified errors in its previously reported interim financial statements for the quarter ended March 31, 2016 pertaining to certain biomass-based diesel sales completed in that quarter that contained BTC sharing terms resulting in an overstatement of biomass-based diesel sales and a corresponding understatement of accounts payable, deferred income taxes and income tax expense for the three months ended March 31, 2016 and the six months ended June 30, 2016. The correction of the errors is reflected in the quarterly information below.
Based on an evaluation of all relevant facts, the Company assessed the materiality of these errors on the first and second quarter interim financial statements and concluded under ASC 250 that the correction was immaterial to the Company’s results for the three months ended March 31, 2016 and six months ended June 30, 2016 and an amendment of previously filed reports was not required. In accordance with ASC 250, the Company elected to correct these errors by revising the consolidated financial statements and other financial information contained within this Annual Report on Form 10-K for the periods impacted to correct the effect of these errors.
90
The following table represents the significant items for the results of operations on a quarterly basis for the years ended December 31, 2016 and 2015:
Three Months Ended March 31, 2016 | Three Months Ended June 30, 2016 | Three Months Ended September 30, 2016 | Three Months Ended December 31, 2016 | ||||||||||||
Revenues | $ | 297,870 | $ | 558,301 | $ | 624,640 | $ | 560,421 | |||||||
Gross profit (loss) | 17,384 | 24,862 | 47,350 | 81,920 | |||||||||||
Selling, general, and administrative expenses including research and development expense | 23,703 | 25,277 | 25,604 | 31,864 | |||||||||||
Impairment of property, plant and equipment | — | — | — | 17,893 | |||||||||||
Net income (loss) from operations | (6,319 | ) | (415 | ) | 21,746 | 32,163 | |||||||||
Other income (expense), net | 159 | 7,432 | 558 | (6,343 | ) | ||||||||||
Net income (loss) attributable to the Company | (6,918 | ) | 7,606 | 23,442 | 20,197 | ||||||||||
Net income (loss) per share attributable to common stockholders - basic | (0.16 | ) | 0.18 | 0.59 | 0.51 | ||||||||||
Net income (loss) per share attributable to common stockholders - diluted | (0.14 | ) | 0.18 | 0.59 | 0.51 | ||||||||||
Three Months Ended March 31, 2015 | Three Months Ended June 30, 2015 | Three Months Ended September 30, 2015 | Three Months Ended December 31, 2015 | ||||||||||||
Revenues | $ | 230,918 | $ | 373,762 | $ | 394,856 | $ | 387,808 | |||||||
Gross profit | (16,195 | ) | 15,907 | 4,405 | 106,426 | ||||||||||
Selling, general, and administrative expenses including research and development expense | 20,535 | 19,749 | 21,995 | 27,969 | |||||||||||
Impairment of goodwill | — | — | — | 175,028 | |||||||||||
Loss from operations | (36,730 | ) | (3,842 | ) | (17,590 | ) | (96,571 | ) | |||||||
Other income (expense), net | (2,471 | ) | 972 | 869 | (5,048 | ) | |||||||||
Net loss attributable to the Company | (38,107 | ) | (2,001 | ) | (15,675 | ) | (95,609 | ) | |||||||
Net loss per share attributable to common stockholders - basic | (0.86 | ) | (0.05 | ) | (0.36 | ) | (2.18 | ) | |||||||
Net loss per share attributable to common stockholders - diluted | (0.86 | ) | (0.05 | ) | (0.36 | ) | (2.18 | ) | |||||||
The results of operations for the three months ended December 31, 2015 reflect a goodwill impairment of $175,028 (before tax) and net benefit from the reinstatement of the BTC of $95,008.
ITEM 9. | Changes in and Disagreements with Accountants on Accounting and Financial Disclosure |
None.
ITEM 9A. | Controls and Procedures |
Evaluation of Disclosure Controls and Procedures
Disclosure controls and procedures are designed to ensure that information required to be disclosed in the Company’s reports we file or submit under the Securities Exchange Act is recorded, processed, summarized and reported within the time periods specified in the Securities Exchange Commission’s rules and forms, and that such information is accumulated and communicated to management, including our Chief Executive Officer ("CEO") and the Chief Financial Officer ("CFO"), as appropriate, to allow timely decisions regarding required disclosure. In designing and evaluating the disclosure controls and procedures, management recognized that any controls and procedures, no matter how well designed and operated, can provide only reasonable assurance of achieving the desired control objectives.
Our management, under the supervision of and with the participation of the CEO and CFO performed an evaluation of the effectiveness of our disclosure controls and procedures (as defined in Rules 13a-15(e) and 15-d-15(e) under the Securities
91
Exchange Act of 1934 as of the end of the period covered by this report, December 31, 2016. In connection with our evaluation of disclosure controls and procedures, we have concluded that our disclosure controls and procedures are effective as of December 31, 2016.
Management’s Report on Internal Control over Financial Reporting
Our management is responsible for establishing and maintaining adequate internal control over financial reporting (as defined in Rules 13a-15(f) and 15d-15(f) under the Exchange Act).
Management conducted an evaluation of the effectiveness of our internal control over financial reporting based on the framework in Internal Control-Integrated Framework (2013) issued by the Committee of Sponsoring Organizations of the Treadway Commission. Based on this evaluation, management concluded that our internal control over financial reporting was effective as of December 31, 2016.
Because of its inherent limitations, internal control over financial reporting may not prevent or detect misstatements. Projections of any evaluation of effectiveness to future periods are subject to the risks that controls may become inadequate because of changes in conditions, or that the degree of compliance with the policies or procedures may deteriorate.
Deloitte & Touche LLP has audited our internal control over financial reporting as of December 31, 2016 and has issued an attestation report regarding its assessment included herein.
Changes in Internal Control over Financial Reporting
Other than with respect to the remediation procedures detailed below for the previously identified material weaknesses, there have been no changes during our quarter ended December 31, 2016 in our internal control over financial reporting (as defined in Rules 13a-15(f) under the Exchange Act) that have materially affected, or are reasonably likely to materially affect, our internal control over financial reporting.
As previously disclosed in Item 9A of our Form 10-Q for the nine months ended September 30, 2016, management concluded that there was a material weakness in internal control over financial reporting related to the Company's sales contract review control over the recognition of biomass-based diesel sales not operating effectively. In response to the material weakness identified, management developed and implemented a remediation plan to address the underlying causes of the material weakness, which was subject to senior management review and Audit Committee oversight.
The remediation plan included:
•Increasing the frequency of the sales contract review control from a quarterly meeting to a monthly;
•Developing, documenting and implementing policies and procedures to identify non-standard sales contracts;
•Increasing the scope of the control to include any sharing agreements regardless of having the biodiesel mixture excise tax credit in place or not;
•Expanding control owners for the sales contract review control to include treasury, tax and sales personnel in addition to accounting personnel; and
•Personnel changes were made to strengthen the operating effectiveness of the control, in addition to increasing education, support and oversight of the employees tasked with the identification and evaluation of sales contract with nonstandard terms to ensure the application of the proper accounting treatment in accordance with United States generally accepted accounting principles.
Implementation of the remediation plan described above and the resulting improvements in controls have strengthened our internal control over financial reporting and have addressed the related material weakness that was identified during the third quarter of 2016. As part of our assessment of internal control over financial reporting during the fourth quarter of 2016, management tested and evaluated all internal controls to assess whether they are designed and operating effectively as of December 31, 2016. Management determined that its internal controls over financial reporting were designed and operating effectively to prevent and detect a material misstatement due to error or fraud and therefore concluded that the material weakness was remediated.
ITEM 9B. | Other Information |
None.
92
PART III
ITEM 10. | Directors, Executive Officers and Corporate Governance |
This Item is incorporated by reference to our definitive proxy statement on Schedule 14A, which will be filed within 120 days after the close of the fiscal year covered by this report on Form 10-K, or if our proxy statement is not filed by that date, will be included in an amendment to this Report on Form 10-K.
ITEM 11. | Executive Compensation |
This Item is incorporated by reference to our definitive proxy statement on Schedule 14A, which will be filed within 120 days after the close of the fiscal year covered by this report on Form 10-K, or if our proxy statement is not filed by that date, will be included in an amendment to this Report on Form 10-K.
ITEM 12. | Security Ownership of Certain Beneficial Owners and Management and Related Stockholder Matters |
This Item is incorporated by reference to our definitive proxy statement on Schedule 14A, which will be filed within 120 days after the close of the fiscal year covered by this report on Form 10-K, or if our proxy statement is not filed by that date, will be included in an amendment to this Report on Form 10-K.
ITEM 13. | Certain Relationships and Related Transactions, and Director Independence |
This Item is incorporated by reference to our definitive proxy statement on Schedule 14A, which will be filed within 120 days after the close of the fiscal year covered by this report on Form 10-K, or if our proxy statement is not filed by that date, will be included in an amendment to this Report on Form 10-K.
ITEM 14. | Principal Accounting Fees and Services |
This Item is incorporated by reference to our definitive proxy statement on Schedule 14A, which will be filed within 120 days after the close of the fiscal year covered by this report on Form 10-K, or if our proxy statement is not filed by that date, will be included in an amendment to this Report on Form 10-K.
93
PART IV
ITEM 15. | Exhibits, Financial Statement Schedules |
(a) | Financial Statements |
(i) | Consolidated Balance Sheets as of December 31, 2016 and 2015 |
(ii) | Consolidated Statements of Operations for the years ended December 31, 2016, 2015 and 2014 |
(iii) | Consolidated Statements of Comprehensive Income (Loss) for the years ended December 31, 2016, 2015, 2014 |
(iv) | Consolidated Statements of Redeemable Preferred Stock and Equity for the years ended December 31, 2016, 2015 and 2014 |
(v) | Consolidated Statements of Cash Flows for the years ended December 31, 2016, 2015 and 2014 |
(vi) | Notes to the Consolidated Financial Statements for the years ended December 31, 2016, 2015 and 2014 |
(b) Exhibits
The Exhibits filed as part of this Annual Report on Form 10-K, or incorporated by reference, are listed on the Exhibit Index immediately preceding such Exhibits, which Exhibit Index is incorporated herein by reference.
94
(c) | Financial Statement Schedules |
ITEM 16. Form 10-K Summary
Not applicable.
SIGNATURES
Pursuant to the requirements of Section 13 or 15(d) of the Securities Exchange Act of 1934, the registrant has duly caused this report to be signed on its behalf by the undersigned, thereunto duly authorized.
RENEWABLE ENERGY GROUP, INC. | |
By: | /s/ Daniel J. Oh |
Daniel J. Oh | |
President and Chief Executive Officer | |
Date: March 10, 2017
POWER OF ATTORNEY
KNOW ALL PERSONS BY THESE PRESENTS, that each person whose signature appears below constitutes and appoints Chad Stone and Chad A. Baker, and each of them, his true and lawful attorneys-in-fact, each with full power of substitution, for him in any and all capacities, to sign any amendments to this report on Form 10-K and to file the same, with exhibits thereto and other documents in connection therewith, with the Securities and Exchange Commission, hereby ratifying and confirming all that each of said attorneys-in-fact or their substitute or substitutes may do or cause to be done by virtue hereof.
Pursuant to the requirements of the Securities Exchange Act of 1934, this report has been signed below by the following persons on behalf of the registrant and in the capacities and on the dates indicated.
Date | ||
/s/ Daniel J. Oh | President, Chief Executive Officer and Director (Principal Executive Officer) | March 10, 2017 |
Daniel J. Oh | ||
/s/ Chad Stone | Chief Financial Officer (Principal Financial Officer) | March 10, 2017 |
Chad Stone | ||
/s/ Chad A. Baker | Controller and Chief Accounting Officer (Principal Accounting Officer) | March 10, 2017 |
Chad A. Baker | ||
/s/ Jeffrey Stroburg | Director (Chairman) | March 10, 2017 |
Jeffrey Stroburg | ||
/s/ Delbert Christensen | Director | March 10, 2017 |
Delbert Christensen | ||
/s/ Peter J.M.Harding | Director | March 10, 2017 |
Peter J. M. Harding | ||
/s/ Randolph L. Howard | Director | March 10, 2017 |
Randolph L. Howard | ||
/s/ Michael A. Jackson | Director | March 10, 2017 |
Michael A. Jackson | ||
/s/ Michael Scharf | Director | March 10, 2017 |
Michael Scharf | ||
/s/ Christopher Sorrells | Director | March 10, 2017 |
Christopher Sorrells | ||
95
EXHIBIT INDEX
Exhibit Number | Description | |
3.1 | Third Amended and Restated Certificate of Incorporation of Renewable Energy Group, Inc. (the “Company”), effective as of January 24, 2012 (incorporated by reference to Exhibit 3.1 (c) to the Company’s Registration Statement on Form S-1/A filed September 8, 2011). | |
3.2 | Amended and Restated Bylaws of the Company (incorporated by reference to Exhibit 3.2 (b) to the Company’s Registration Statement on Form S-1/A filed November 18, 2011). | |
4.1 | Form of Common Stock Certificate of the Company (incorporated by reference to Exhibit 4.1 to the Company’s Registration Statement on Form S-1/A filed November 18, 2011). | |
4.2 | Indenture, dated as of June 3, 2014, between the Company and Wilmington Trust, National Association, as trustee (incorporated by reference to Exhibit 4.1 to the Company’s Current Report on Form 8-K filed June 3, 2014). | |
4.3 | First Supplemental Indenture, dated as of June 3, 2014, between the Company and Wilmington Trust, National Association, as trustee (incorporated by reference to Exhibit 4.2 to the Company’s Current Report on Form 8-K dated May 29, 2014). | |
4.4 | Form of Note (included in Exhibit 4.2). | |
4.5 | Indenture dated as of June 2, 2016, between the Company and Wilmington Trust, National Association, as trustee (including form of Note) (incorporated by reference to Exhibit 4.1 to to the Company's Current Report on Form 8-K dated June 2, 2016). | |
10.1 | 2009 Stock Incentive Plan (incorporated by reference to Exhibit 10.1 to the Company’s Quarterly Report on Form 10-Q for the three months ended June 30, 2010 filed August 16, 2010). | |
10.2 | Renewable Energy Group Annual Incentive Plan for Executive Officers (incorporated by reference to Appendix A to the Company’s Proxy Statement for the Annual Meeting of Stockholders of April 4, 2013, filed on April 4, 2013).* | |
10.3 | Form of Restricted Stock Unit Award Agreement (incorporated by reference to Exhibit 10.4 to the Company's Annual Report on Form 10-K filed March 14, 2016).* | |
10.4 | Form of Stock Appreciation Right Award Agreement (incorporated by reference to Exhibit 10.1 to the Company's Annual Report on Form 10-K filed March 14, 2016).* | |
10.5 | Form of Performance Restricted Stock Unit Award Agreement (incorporated by reference to Exhibit 10.1 to the Company's Quarterly Report on Form 10-Q filed November 7, 2016).* | |
10.6 | Amended and Restated Loan Agreement dated November 3, 2011 by and between REG Danville, LLC and Fifth Third Bank (incorporated by reference to Exhibit 10.1 to the Company’s Current Report on Form 8-K filed November 9, 2011). | |
10.7 | Credit Agreement dated as of December 23, 2011 by and among the lenders identified on the signature pages thereto, Wells Fargo Capital Finance, LLC, REG Services Group, LLC and REG Marketing & Logistics Group, LLC (incorporated by reference to Exhibit 10.1 to the Company’s Current Report on Form 8-K filed December 29, 2011). | |
10.8 | Amendment No. 1 to Credit Agreement, dated as of January 31, 2012, by and among the lenders identified on the signature pages thereto, Wells Fargo Capital Finance, LLC, REG Services Group, LLC and REG Marketing & Logistics Group, LLC (incorporated by reference to Exhibit 10.9 to the Company’s Annual Report on Form 10-K filed March 14, 2016). | |
10.9 | Amendment No. 2 to Credit Agreement, dated as of February 29, 2012, by and among the lenders identified on the signature pages thereto, Wells Fargo Capital Finance, LLC, REG Services Group, LLC and REG Marketing & Logistics Group, LLC (incorporated by reference to Exhibit 10.10 to the Company’s Annual Report on Form 10-K filed March 14, 2016). | |
10.10 | Amendment No. 3 to Credit Agreement, dated as of May 1, 2012, by and among the lenders identified on the signature pages thereto, Wells Fargo Capital Finance, LLC, REG Services Group, LLC and REG Marketing & Logistics Group, LLC (incorporated by reference to Exhibit 10.11 to the Company’s Annual Report on Form 10-K filed March 14, 2016). | |
96
Exhibit Number | Description | |
10.11 | Amendment No. 4 to Credit Agreement, dated as of January 9, 2013, by and among the lenders identified on the signature pages thereto, Wells Fargo Capital Finance, LLC, REG Services Group, LLC and REG Marketing & Logistics Group, LLC (incorporated by reference to Exhibit 10.12 to the Company’s Annual Report on Form 10-K filed March 14, 2016). | |
10.12 | Amendment No. 5 to Credit Agreement, dated as of August 9, 2013, by and among the lenders identified on the signature pages thereto, Wells Fargo Capital Finance, LLC, REG Services Group, LLC and REG Marketing & Logistics Group, LLC (incorporated by reference to Exhibit 10.13 to the Company’s Annual Report on Form 10-K filed March 14, 2016). | |
10.13 | Consent and Amendment No. 6 to Credit Agreement, dated as of December 23, 2013, by and among the lenders identified on the signature pages thereto, Wells Fargo Capital Finance, LLC, REG Services Group, LLC and REG Marketing & Logistics Group, LLC (incorporated by reference to Exhibit 10.14 to the Company’s Annual Report on Form 10-K filed March 14, 2016). | |
1,014 | Amendment No. 7 to Credit Agreement, dated as of May 19, 2014, by and among the lenders identified on the signature pages thereto, Wells Fargo Capital Finance, LLC, REG Services Group, LLC and REG Marketing & Logistics Group, LLC (incorporated by reference to Exhibit 10.15 to the Company’s Annual Report on Form 10-K filed March 14, 2016). | |
10.15 | Amendment No. 8 to Credit Agreement, dated as of February 20, 2015, by and among the lenders identified on the signature pages thereto, Wells Fargo Capital Finance, LLC, REG Services Group, LLC and REG Marketing & Logistics Group, LLC (incorporated by reference to Exhibit 10.16 to the Company’s Annual Report on Form 10-K filed March 14, 2016). | |
10.16 | Amendment No. 9 to Credit Agreement, dated as of July 16, 2015, by and among the lenders identified on the signature pages thereto, Wells Fargo Capital Finance, LLC, REG Services Group, LLC and REG Marketing & Logistics Group, LLC (incorporated by reference to Exhibit 10.1 to the Company’s Current Report on Form 8-K filed July 22, 2015). | |
10.17 | General Continuing Guaranty dated as of December 23, 2011 in favor of Wells Fargo Capital Finance, LLC, as agent (incorporated by reference to Exhibit 10.2 to the Company’s Current Report on Form 8-K filed December 29, 2011). | |
10.18 | Membership Interest Purchase Agreement, dated as of May 20, 2014, by and among Renewable Energy Group, Inc., REG Synthetic Fuels, LLC and Tyson Foods, Inc. (incorporated by reference to Exhibit 2.1 to the Company’s Form 8-K filed May 27, 2014).+ | |
10.19 | Capped Call Confirmation, dated May 29, 2014, between of Bank of America, N.A. and the Company (incorporated by reference to Exhibit 10.1 to the Company’s Current Report on Form 8-K filed June 3, 2014). | |
10.20 | Capped Call Confirmation, dated May 29, 2014, between of Wells Fargo Bank, National Association, and the Company (incorporated by reference to Exhibit 10.2 to the Company’s Current Report on Form 8-K filed June 3, 2014). | |
10.21 | Additional Capped Call Confirmation, dated May 30, 2014, between of Bank of America, N.A. and the Company (incorporated by reference to Exhibit 10.3 to the Company’s Current Report on Form 8-K filed June 3, 2014). | |
1,022 | Additional Capped Call Confirmation, dated May 30, 2014, between of Wells Fargo Bank, National Association, and the Company (incorporated by reference to Exhibit 10.4 to the Company’s Current Report on Form 8-K filed June 3, 2014). | |
10.23 | Employment Agreement, effective January 1, 2015, between Renewable Energy Group, Inc. and Daniel J. Oh (incorporated by reference to Exhibit 10.24 to the Company’s Current Report on Form 8-K filed December 24, 2014). | |
10.24 | Joinder and Amendment No. 11 to Credit Agreement, dated as of September 30, 2016, by and among the lenders identified on the signature pages thereto, Wells Fargo Capital Finance, LLC, Fifth Third Bank, REG Services Group, LLC and REG Marketing & Logistics Group, LLC (incorporated by reference to Exhibit 10.1 to the Company’s Current Report on Form 8-K filed on October 4, 2016). | |
12.1 | Statement regarding computation of ratios | |
21.1 | List of Subsidiaries | |
23.1 | Consent of Deloitte & Touche LLP, Independent Registered Public Accounting Firm | |
97
Exhibit Number | Description | |
24.1 | Power of Attorney (included in the signature page to this report) | |
31.1 | Certification of Daniel J. Oh pursuant to Section 302 of the Sarbanes-Oxley Act of 2002 | |
31.2 | Certification of Chad Stone pursuant to Section 302 of the Sarbanes-Oxley Act of 2002 | |
32.1 | Certification pursuant to 18 U.S.C. Section 1350, as adopted pursuant to Section 906 of the Sarbanes-Oxley Act of 2002 – Chief Executive Officer. | |
32.2 | Certification pursuant to 18 U.S.C. Section 1350, as adopted pursuant to Section 906 of the Sarbanes-Oxley Act of 2002 – Financial Officer. | |
+ Confidential treatment requested | ||
* Management contract or compensatory plan, contract or arrangement | ||
101.1 | The following financial information of the Company and its subsidiaries for the fiscal year ended December 31, 2016, is formatted in XBRL interactive data files: (i) Consolidated Balance Sheets, (ii) Consolidated Statements of Operations; (iii) Consolidated Statements of Redeemable Preferred Stock and Equity; (iii) Consolidated Statements of Cash Flows; and (v) Notes to Consolidated Financial Statements. As provided in Rule 406T of Regulation S-T, this information is furnished and not filed for purposes of Section 18 of the Securities Exchange Act of 1934 and is not otherwise subject to liability under those sections. | |
98