Attached files
| file | filename |
|---|---|
| EX-32 - EX-32 - CEVA INC | d332181dex32.htm |
| EX-31.2 - EX-31.2 - CEVA INC | d332181dex312.htm |
| EX-31.1 - EX-31.1 - CEVA INC | d332181dex311.htm |
| EX-23.1 - EX-23.1 - CEVA INC | d332181dex231.htm |
| EX-21.1 - EX-21.1 - CEVA INC | d332181dex211.htm |
Table of Contents
UNITED STATES
SECURITIES AND EXCHANGE COMMISSION
WASHINGTON, D.C. 20549
FORM 10-K
| ☒ | ANNUAL REPORT PURSUANT TO SECTION 13 OR 15(d) OF THE SECURITIES EXCHANGE ACT OF 1934 |
For the fiscal year ended December 31, 2016
OR
| ☐ | TRANSITION REPORT PURSUANT TO SECTION 13 OR 15(d) OF THE SECURITIES EXCHANGE ACT OF 1934 |
For the transition period from to
Commission file number: 000-49842
CEVA, INC.
(Exact name of registrant as specified in its charter)
| Delaware | 77-0556376 | |
| (State or other jurisdiction of | (I.R.S. Employer | |
| incorporation or organization) | Identification No.) | |
| 1174 Castro Street, Suite 210, Mountain View, California | 94040 | |
| (Address of principal executive offices) | (Zip Code) | |
(650) 417-7900
(Registrant’s telephone number, including area code)
Securities registered pursuant to Section 12(b) of the Act:
| Title of each class |
Name of each exchange on which registered | |
| Common Stock, $0.001 par value per share | NASDAQ GLOBAL MARKET |
Securities registered pursuant to Section 12(g) of the Act: None
Indicate by check mark if the registrant is a well-known seasoned issuer, as defined in Rule 405 of the Securities Act.
Yes ☐ No ☒
Indicate by check mark if the registrant is not required to file reports pursuant to Section 13 or Section 15(d) of the Exchange Act.
Yes ☐ No ☒
Indicate by check mark whether the registrant (1) has filed all reports required to be filed by Section 13 or 15(d) of the Securities Exchange Act of 1934 during the preceding 12 months (or for such shorter period that the registrant was required to file such reports), and (2) has been subject to such filing requirements for the past 90 days.
Yes ☒ No ☐
Indicate by check mark whether the registrant has submitted electronically and posted on its corporate Web site, if any, every Interactive Data File required to be submitted and posted pursuant to Rule 405 of Regulation S-T (§232.405 of this chapter) during the preceding 12 months (or for such shorter period that the registrant was required to submit and post such files).
Yes ☒ No ☐
Indicate by check mark if disclosure of delinquent filers pursuant to Item 405 of Regulation S-K is not contained herein, and will not be contained, to the best of registrant’s knowledge, in definitive proxy or information statements incorporated by reference in Part III of this Form 10-K or any amendment to this Form 10-K. ☐
Indicate by check mark whether the registrant is a large accelerated filer, an accelerated filer, a non-accelerated filer, or a smaller reporting company. See definitions of “large accelerated filer,” “accelerated filer,” and “smaller reporting company” in Rule 12b-2 of the Exchange Act.
| Large accelerated filer | ☐ | Accelerated filer | ☒ | |||
| Non-accelerated filer | ☐ (Do not check if a smaller reporting company) | Smaller reporting company | ☐ | |||
Indicate by check mark whether the registrant is a shell company (as defined in Rule 12b-2 of the Exchange Act).
Yes ☐ No ☒
As of June 30, 2016, the aggregate market value of the registrant’s common stock held by non-affiliates of the registrant was $369,784,000 based on the closing sale price as reported on the National Association of Securities Dealers Automated Quotation System National Market System on June 30, 2016. Shares of common stock held by each officer, director, and holder of 5% or more of the outstanding common stock of the Registrant have been excluded from this calculation in that such persons may be deemed to be affiliates. This determination of affiliate status is not necessarily a conclusive determination for other purposes.
Indicate the number of shares outstanding of each of the issuer’s classes of common stock, as of the latest practicable date.
| Class |
Outstanding at March 2, 2017 | |
| Common Stock, $0.001 par value per share | 21,480,976 shares |
DOCUMENTS INCORPORATED BY REFERENCE
Portions of the registrant’s definitive Proxy Statement for its Annual Meeting of Stockholders to be held on May 15, 2017 (the “2017 Proxy Statement”) are incorporated by reference into Item 5 of Part II and Items 10, 11, 12, 13, and 14 of Part III.
Table of Contents
| PART I |
||||||
| Page | ||||||
| Item 1. |
4 | |||||
| Item 1A. |
12 | |||||
| Item 1B. |
24 | |||||
| Item 2. |
24 | |||||
| Item 3. |
25 | |||||
| Item 4. |
25 | |||||
| PART II |
||||||
| Item 5. |
27 | |||||
| Item 6. |
29 | |||||
| Item 7. |
Management’s Discussion and Analysis of Financial Condition and Results of Operations |
31 | ||||
| Item 7A. |
50 | |||||
| Item 8. |
51 | |||||
| Item 9. |
Changes in and Disagreements with Accountants on Accounting and Financial Disclosure |
51 | ||||
| Item 9A. |
51 | |||||
| Item 9B. |
52 | |||||
| PART III |
||||||
| Item 10. |
53 | |||||
| Item 11. |
53 | |||||
| Item 12. |
Security Ownership of Certain Beneficial Owners and Management and Related Stock Holder Matters |
53 | ||||
| Item 13. |
Certain Relationships and Related Transactions, and Director Independence |
53 | ||||
| Item 14. |
53 | |||||
| PART IV |
||||||
| Item 15. |
54 | |||||
| F-1 | ||||||
1
Table of Contents
FORWARD-LOOKING STATEMENTS AND INDUSTRY DATA
This Annual Report contains forward-looking statements that involve risks and uncertainties, as well as assumptions that if they materialize or prove incorrect, could cause the results of CEVA to differ materially from those expressed or implied by such forward-looking statements and assumptions. All statements other than statements of historical fact are statements that could be deemed forward-looking statements. Forward-looking statements are generally written in the future tense and/or are preceded by words such as “will,” “may,” “should,” “could,” “expect,” “suggest,” “believe,” “anticipate,” “intend,” “plan,” or other similar words. Forward-looking statements include the following:
| • | Our belief that the adoption of our signal processing IP cores and software for smart, connected devices continues to progress; |
| • | Our belief that we will benefit from the handset market transitioning from feature phones to smartphones, in particular in emerging economies; |
| • | Our belief that RivieraWaves Bluetooth and Wi-Fi IPs allow us to expand further into IoT applications and increase our overall addressable market which is expected to be 35 billion devices by 2020, as per ABI Research; |
| • | Our belief that our intelligent audio processing IP is required for IoT applications, as voice is becoming a primary user interface for such applications; |
| • | Our belief that our specialization and competitive edge in digital signal processor technologies and the inherent low cost and power performance balance of our technologies put us in a strong position to capitalize on market adoption of next generation LTE, 5G and Wi-Fi technologies for multiple market and product sectors; |
| • | Our belief that our vision processing IP offers an additional growth segment for the company, and that specifically ABI Research predicts that cameras equipped with vision processing are expected to exceed 2.7 billion units by 2018; |
| • | Our belief that we have successfully transformed CEVA into a vertically integrated, one-stop IP house for wireless broadband and IoT-related technologies; |
| • | Our belief that the revolution in using machine learning and deep networks for camera-related use cases is an opportunity for us to expand our vision technology footprint to any camera-enabled device such as smartphones, tablets, automotive safety (ADAS), drones, robotics, security and surveillance, augmented reality (AR) and virtual reality (VR), drones, and signage; |
| • | Our belief that unit shipments for non-handset baseband applications will reach 700 to 900 million units annually by 2018; |
| • | Our anticipation that our cash and cash equivalents, short-term bank deposits and marketable securities, along with cash from operations, will provide sufficient capital to fund our operations for at least the next 12 months; and |
| • | Our belief that changes in interest rates within our investment portfolio will not have a material effect on our financial position on an annual or quarterly basis. |
Forward-looking statements are not guarantees of future performance and involve risks and uncertainties. The forward-looking statements contained in this report are based on information that is currently available to us and expectations and assumptions that we deem reasonable at the time the statements were made. We do not undertake any obligation to update any forward-looking statements in this report or in any of our other communications, except as required by law. All such forward-looking statements should be read as of the time the statements were made and with the recognition that these forward-looking statements may not be complete or accurate at a later date.
2
Table of Contents
Many factors may cause actual results to differ materially from those expressed or implied by the forward-looking statements contained in this report. These factors include, but are not limited to, those risks set forth in Item 1A: Risk Factors.
This report contains market data prepared by third party research firms. Actual market results may differ from their projections. This report includes trademarks and registered trademarks of CEVA. Products or service names of other companies mentioned in this Annual Report on Form 10-K may be trademarks or registered trademarks of their respective owners.
3
Table of Contents
PART I
| ITEM 1. | BUSINESS |
Company Overview
Headquartered in Mountain View, California, CEVA is the leading licensor of signal processing IP for a smarter, connected world. We partner with semiconductor companies and OEMs worldwide to create power-efficient, intelligent and connected devices for a range of end markets, including mobile, consumer, automotive, industrial and IoT. Our ultra-low-power IPs for vision, sound, long and short range wireless, include comprehensive DSP-based platforms for LTE/LTE-A/5G baseband processing in handsets, infrastructure and IoT devices, advanced imaging, computer vision and deep learning for any camera-enabled devices, as well as sound /voice/audio applications for a broad range IoT applications . For short-range wireless, we offer the industry’s most widely adopted IPs for Bluetooth (low energy and dual mode), Wi-Fi (802.11 b/g/n/ac up to 4x4). We also offer wired interface for storage (SATA and SAS).
Our technologies are licensed to leading semiconductor and OEM companies throughout the world. These companies incorporate our IP into application-specific integrated circuits (“ASICs”) and application-specific standard products (“ASSPs”) that they manufacture, market and sell into wireless, consumer, automotive and IoT companies. Our state-of-the-art technology has shipped in more than 8 billion chips to date for a wide range of diverse end markets. One in three handsets sold worldwide is powered by CEVA.
Our revenue mix comprises primarily of IP licensing fees and related revenues, and royalties generated from the shipments of products deploying our IP. Related revenues include revenues from post contract support, training and sale of development systems.
We have built a strong network of licensing customers who rely on our technologies to deploy their silicon solutions. Our comprehensive customer base includes many of the world’s leading semiconductors and OEMs. Actions, Altek, Beken, Broadcom, Celeno, Dialog Semiconductor, DSP Group, FujiFilm, HMicro, Intel, Leadcore, LG Electronics, Mediatek,, MicroChip, Novatek, NXP, ON Semiconductor, Panasonic, Renesas, Rockchip, Rohm, Samsung. Silver Spring Networks, Socionext, Sony, Spreadtrum, Toshiba, Yamaha and ZTE all leverage CEVA’s industry-leading signal processing IP.
CEVA was created through the combination of the DSP IP licensing division of DSP Group, Inc. and Parthus Technologies plc (“Parthus”) in November 2002. On July 4, 2014, we acquired 100% of RivieraWaves SAS, a privately-held, French company and a provider of wireless connectivity intellectual property for Wi-Fi and Bluetooth technologies.
We have over 270 employees worldwide, with research and development facilities in Israel, France, Ireland and the United Kingdom, and sales and support offices throughout Asia Pacific (APAC), Japan, Sweden, France, Israel and the United States.
CEVA is traded on the NASDAQ Global Market under the symbol “CEVA”.
Industry Background
DSP Cores
Digital signal processing is a key technology that is powering many of today’s fastest growing electronics markets. Digital signal processors (DSPs) are specialized high-speed processors that are optimized for performing repetitive arithmetic calculations on an array of data. DSPs provide the foundation supporting a vast majority of today’s electronic products that are smart and connected and offer multimedia and wireless communications capabilities (e.g. video, audio, imaging, vision, artificial intelligence and cellular).
4
Table of Contents
Short Range Wireless IPs
Wi-Fi and Bluetooth have become key connectivity technologies to form the basis for the Internet of Things (“IoT”), providing the connection between the billions of devices and the networks that they communicate with.
Design Gap
The demand for smarter, better connected mobile, consumer, automotive, industrial and IoT devices continues to grow. These devices require more connectivity, greater feature sets and a richer user experience. Semiconductor manufacturers face ever growing pressures to make smaller, feature-rich integrated circuits that are more reliable, less expensive and have greater performance. These two trends are occurring concurrently in the face of decreasing product lifecycles and constrained battery power. The advent of wireless and connectivity technologies like 5G, Wi-Fi 802.11ac and Bluetooth 5 and multimedia technologies such as advanced image enhancement, computer vision, deep learning and voice and audio pre- and post-processing have further increased these pressures. While semiconductor manufacturing processes have advanced significantly to allow a substantial increase in the number of circuits placed on a single chip, resources for design capabilities have not kept pace with the advances in manufacturing processes, resulting in a growing “design gap” between the increasing manufacturing potential and the constrained design capabilities.
CEVA Business
CEVA addresses the requirements of the mobile, consumer, automotive, industrial and IoT markets by designing and licensing a broad range of robust, application-specific signal processing platforms which enable the rapid design of solutions for developing a wide variety of applications, including communications & connectivity, audio & voice, imaging & vision and storage.
Given the “design gap,” as well as the increasing complexity and the unique skill set required to develop a system-on-chip, many semiconductor design and manufacturing companies increasingly choose to license proven intellectual property, such as processor cores (e.g. DSP, CPU and GPU), connectivity products, memory and application-specific platforms, from silicon intellectual property (SIP) companies like CEVA rather than develop those technologies in-house. In addition, with more complex designs and shorter time to market, it is no longer cost efficient and becoming progressively more difficult for most semiconductor companies to develop the signal processing platform, incorporating the DSP, subsystem and software, for their target application. For connectivity, with ever-evolving standards and a huge variety of uses, most semiconductor companies cannot develop and maintain this technology in-house. As a result, companies increasingly seek to license these IPs from CEVA or a third-party community of developers, such as CEVAnet, CEVA’s third-party network.
Our IP Business Model
Our objective is for our CEVA signal processing IPs to become the de facto technologies across the mobile, consumer, automotive, industrial and IoT markets. To enable this goal, we license our technologies on a worldwide basis to semiconductor and OEM companies that design and manufacture products that combine CEVA-based solutions with their own differentiating technology. We believe our business model offers us some key advantages. By not focusing on manufacturing or selling silicon products, we are free to widely license our technology and free to focus most of our resources on research and development. By choosing to license our IP, manufacturers can achieve the advantage of creating their own differentiated solutions and develop their own unique product roadmaps. Through our licensing efforts, we have established a worldwide community developing CEVA-based solutions, and therefore we can leverage their strengths, customer relationships, proprietary technology advantages, and existing sales and marketing infrastructure. As an example, our CEVA-XCnet partner program focuses on various technology and solution providers with complimentary offerings for our CEVA-XC communication processor addressing wireless, infrastructure, smart grid and connectivity markets. In addition, as our intellectual property is widely licensed and deployed, system OEM companies can obtain CEVA-based chipsets from a wide range of suppliers, thus reducing dependence on any one supplier and fostering price competition, both of which help to contain the cost of CEVA-based products.
5
Table of Contents
We operate a licensing and royalty business model. We typically charge a license fee for access to our technology and a royalty fee for each unit of silicon which incorporates our technology. License fees are invoiced in accordance with agreed-upon contractual terms. Royalties are reported and invoiced one quarter in arrears and generally are based on a fixed unit rate or a percentage of the sale price for the CEVA-based silicon product.
Strategy
We believe there is a growing demand for high performance and low power signal processing IPs incorporating all the necessary hardware and software for target applications. Our IP portfolio is strategically aligned to allow us to exploit the most lucrative “design gaps” in the growing demand for smarter, connected devices. As CEVA offers expertise developing complete solutions in a number of key growth markets, including cellular baseband, wireless infrastructure, advanced imaging, computer vision, automotive safety, audio and voice applications, Wi-Fi, Bluetooth and storage, we believe we are well positioned to take full advantage of this growing demand. To capitalize on this industry shift, we intend to:
| • | continue to develop and enhance our range of DSP cores with additional features, performance and capabilities; |
| • | continue to develop and invest in our short range wireless IPs, providing the newest standards and the most complete offerings to address our customers’ needs; |
| • | continue to develop and enhance our range of complete and highly integrated platform solutions to deliver to our licensing partners a complete and verified system solution; |
| • | continue to develop an ecosystem of third party partners developing software and solutions based on our technologies; |
| • | continue to invest in strategic technologies that enable us to strengthen our presence in existing market or enter new addressable markets; |
| • | capitalize on our relationships and leadership within our worldwide community of semiconductor and OEM licensees who are developing CEVA-based solutions; |
| • | capitalize on our technology leadership in the development of advanced DSP technologies and connectivity IPs to create and develop new, strategic relationships with OEMs and semiconductor companies to replace their internal DSPs or incumbent DSP suppliers with CEVA-based solutions; and |
| • | capitalize on our IP licensing and royalty business model which we believe is the best vehicle for a pervasive adoption of our technology and allows us to focus our resources on research and development of new licensable technologies and applications. |
Products
We are the leading licensor of signal processing IP for semiconductors and OEMs serving the mobile, consumer, automotive, industrial and IoT markets. Our ultra-low-power IPs for vision, audio, communications and connectivity include comprehensive DSP-based platforms for LTE/LTE-A/5G baseband processing in handsets, infrastructure and machine-to-machine devices, advanced imaging, computer vision and deep learning for any camera-enabled device, audio/voice/speech and ultra-low power always-on/sensing applications for multiple IoT markets. For connectivity, we offer the industry’s most widely adopted IPs for Bluetooth (low energy and dual mode), Wi-Fi (802.11 b/g/n/ac up to 4x4) and serial storage (SATA and SAS).
CEVA DSP Cores and Platforms
We market a family of synthesizable, programmable DSP cores, each delivering a different balance of performance, power dissipation and cost, thereby allowing customers to select a DSP core ideally suited for their target application. The ability to match processing power to the application is a crucial consideration when
6
Table of Contents
designers select a DSP supplier. Our DSP cores are families of architectures, each largely software compatible, meaning that software from one core within the same architecture can be applied to another core, which significantly reduces investment in code development, tools and design engineer training.
We deliver our DSP cores in the form of a hardware description language definition (known as a soft core or a synthesizable core). All CEVA DSP cores can be manufactured on any process using any physical library, and all are accompanied by a complete set of tools and an integrated development environment. An extensive third-party network supports CEVA DSP cores with a wide range of complementing software and platforms. In addition, we provide development platforms, software development kits and software debug tools, which facilitate system design, debug and software development.
In order to reduce the cost, complexity, and risk in bringing products to market, CEVA has developed a suite of system platforms and solutions. These platforms and solutions combine the hardware and software elements that are essential for designers deploying CEVA’s state-of-the-art DSP and IP cores. Platforms typically integrate a CEVA DSP core, hardware subsystem and application-specific (e.g. LTE, computer vision or audio) software. Our family of DSP-based platforms are targeted for baseband processing within cellular handsets, Machine to Machine (M2M) type devices and base stations, wired communications, advanced imaging, computer vision and deep learning, and audio, voice & sensing and Internet-of-Things related applications.
CEVA Short Range Wireless IPs
Wi-Fi and Bluetooth low energy and dual mode are key technologies for any company looking to address the Internet-of-Things. Moreover, many companies wish to integrate these connectivity technologies into SoC designs rather than provide connectivity through an additional chip in the system. Through our connectivity business unit, we are able to expand further into the Wi-Fi and Bluetooth smart connectivity markets. The advent of the Internet-of-Things has resulted in significant demand for connectivity IPs that solves a crucial void in many companies’ strategies to address this burgeoning market. Wi-Fi and Bluetooth standards are constantly evolving, and the many different end applications where these technologies are being deployed require further customization. By licensing rather than developing these technologies in house, companies can now get access to the latest standards and profiles from CEVA, without undertaking the expensive research and development costs required to develop these technologies internally. We also offer platform solutions for serial storage technology, addressing both consumer and enterprise uses (SATA and SAS).
Customers
We have licensed our DSP cores, platforms and connectivity IPs platforms to leading semiconductor and OEM companies throughout the world. These companies incorporate our IP into application-specific chipsets or custom-designed chipsets that they manufacture, market and sell to consumer electronics companies. We also license our technologies to OEMs directly. Included among our licensees are the following customers: Actions, Altek, Beken, Broadcom, Celeno, Dialog Semiconductor, DSP Group, FujiFilm, HMicro, Intel, Leadcore, LG Electronics, Mediatek, MicroChip, Novatek, NXP, ON Semiconductor, Panasonic, Renesas, Rockchip, Rohm, Samsung, Silver Spring Networks, Socionext, Spreadtrum, Toshiba, Yamaha and ZTE.
We derive a significant amount of revenues from a limited number of customers. Sales to Spreadtrum represented 27%, 31% and 25% of our total revenues for 2016, 2015 and 2014, respectively. With respect to our royalty revenues, two royalty paying customers each represented 10% or more of our total royalty revenues for 2016, and collectively represented 80% of our total royalty revenues for 2016; two royalty paying customers each represented 10% or more of our total royalty revenues for 2015, and collectively represented 72% of our total royalty revenues for 2015; and three royalty paying customers each represented 10% or more of our total royalty revenues for 2014, and collectively represented 79% of our total royalty revenues for 2014. In 2016, we concluded a record forty nine new licensing deals, of which seventeen were with first time new customers and forty fife were for non-handset baseband applications.
7
Table of Contents
International Sales and Operations
Customers based in EME (Europe and Middle East) and APAC (Asia Pacific) accounted for 87% of our total revenues for 2016, 84% for 2015 and 77% for 2014. Customers in each of China and South Korea accounted for greater than 10% of our total revenues for both 2016 and 2015. Customers in China accounted for greater than 10% of our total revenues for 2014. Information on the geographic breakdown of our revenues and location of our long-lived assets is contained in Note 11 to our consolidated financial statements, which appear elsewhere in this annual report.
Moreover, the majority of our expenses, mainly employee salaries, are paid in currencies other than the U.S. dollar, principally the Israeli currency, New Israeli Shekel (NIS), and the EURO, which subjects us to the risks of foreign currency fluctuations and economic pressures in those regions. As a result, an increase in the value of the currencies other than the U.S. dollar in comparison to the U.S. dollar could increase the cost of our operating expenses. To protect against the increase in value of forecasted foreign currency cash flows resulting from salaries paid in currencies other than the U.S. dollar, during the year, we follow a foreign currency cash flow hedging program. We hedge portions of the anticipated payroll for our non-US employees denominated in currencies other than the U.S. dollar for a period of one to twelve months with forward and options contracts.
Sales and Marketing
We license our technology through a direct sales force. As of December 31, 2016, we had 35 employees in sales and marketing. We have sales offices and representation in Asia Pacific (APAC) region, Sweden, Israel, France and the United States.
Maintaining close relationships with our customers and strengthening these relationships are central to our strategy. From time to time we develop a new DSP core and platform or connectivity product with close alignment with a number of tier-one industry players which signifies to the market that we are focused on viable applications that meet broad industry needs or try to get similar inputs and insight for our new developments from our marketing team. Generally, these industry leaders become licensees for these products allows us to create a roadmap for the future development of existing cores and application platforms and connectivity products, and helps us to anticipate the next potential applications for the market. We seek to use our customer relationships to deliver new products in a faster time to market.
We use a variety of marketing initiatives to stimulate demand and brand awareness in our target markets. These marketing efforts include contacts with industry analysts, presenting at key industry trade shows and conferences, and a comprehensive digital marketing program aimed at developing and nurturing relationships with potential customers. Our marketing group runs competitive benchmark analyses to help us maintain our competitive position.
Technical Support
We offer technical support services through our offices in Israel, Ireland, Asia Pacific (APAC) region, Sweden, France and the United States. As of December 31, 2016, we had 21 employees in technical support. Our technical support services include:
| • | assistance with implementation, responding to customer-specific inquiries, training and, when and if they become available, distributing updates and upgrades of our products; |
| • | application support, consisting of providing general hardware and software design examples, ready-to-use software modules and guidelines to our licensees to assist them in using our technology; and |
| • | design services, consisting of creating customer-specific implementations of our signal processing IPs and application platforms. |
8
Table of Contents
We believe that our technical support services are a means to assist our licensees to embed our cores and platforms in their designs and products. Our technology is highly complex, combining sophisticated signal processing IP core architectures, integrated circuit designs and development tools. Effective customer support in helping our customers to implement our solutions enables them to shorten the time to market for their applications. Our support organization is made up of experienced engineers and professional support personnel. We conduct technical training for our licensees and their customers, and meet with them from time to time to track the implementation of our technology.
Research and Development
Our research and development team is focused on improving and enhancing our existing products, as well as developing new products to broaden our offerings and market opportunities. These efforts are largely driven by current and anticipated customer and market needs.
Our research and development team, consisting of 199 engineers as of December 31, 2016, work in six development centers located in Israel, France, Ireland and the United Kingdom. This team consists of engineers who possess significant experience in developing DSP cores, application platforms, connectivity products (Wi-Fi and Bluetooth) and serial storage technology (SATA and SAS). In addition, we engage third party contractors with specialized skills as required to support our research and development efforts. Our research and development expenses, net of related research grants, included the RivieraWaves-related expenses from July 2014, were approximately $26 million, $28 million and $31 million for 2014, 2015 and 2016, respectively.
We encourage our research and development personnel to maintain active roles in various international organizations that develop and maintain standards in the electronics and related industries. This involvement allows us to influence the development of new standards; keeps us informed as to important new developments regarding standards; and allows us to demonstrate our expertise to existing and potential customers who also participate in these standards-setting bodies.
Competition
The markets in which we operate are intensely competitive. They are subject to rapid change and are significantly affected by new product introductions. We compete with other suppliers of licensed signal processing IPs. We believe that the principal competitive elements in our field are signal processing IP performance, overall chip cost, power consumption, flexibility, reliability, communication and multimedia software and algorithms availability, design cycle time, tool chain, customer support, financial strength, name recognition and reputation. We believe that we compete effectively in each of these areas, but can offer no assurance that we will have the financial resources, technical expertise, and marketing or support capabilities to compete successfully in the future.
The markets in which we compete are dominated by large, highly competent semiconductor companies that have significant brand recognition, a large installed base and a large network of support and field application engineers. We face direct and indirect competition from:
| • | IP vendors that offer programmable or configurable DSP cores; |
| • | IP vendors that offer vision processing units for computer vision applications; |
| • | IP vendors that offers Bluetooth and Wi-Fi connectivity IPs; |
| • | IP vendors that offer hardware-based DSP implementation as opposed to software-based DSP, which is our specialization; and |
| • | internal design groups of large chip companies or OEMs that develop proprietary signal processing IP cores or engines for their own application-specific chipsets. |
9
Table of Contents
We face direct competition in the DSP and configurable core space mainly from Verisilicon, Cadence and Synopsys, which licenses DSP cores in addition to their respective semiconductor and EDA businesses. In the short range wireless space, we face direct competition from ARM Holdings, Imagination Technologies, Mindtree and STMicroelectronics (previously ST Ericsson).
In recent years, we also have faced competition from companies that offer Central Processor Unit (CPU) intellectual property. These companies’ products are used for host functions in various applications, such as in mobile and home entertainment products. These applications typically also incorporate a programmable DSP accelerator that is responsible for communication and video/audio/voice-related tasks or in some cases connectivity capabilities. CPU companies, such as ARM Holdings, Cadence, Imagination Technologies and Synopsys have added DSP acceleration and /or connectivity solutions and make use of it to provide platform solutions in the areas of baseband, video, imaging, vision, audio and connectivity.
With respect to certain large potential customers, we also compete with internal engineering teams, which may design programmable signal processing IP core products in-house. Companies such as Mediatek, Qualcomm, Samsung, Huawei and STMicroelectronics license our designs for some applications and use their own proprietary cores for other applications. These companies also may choose to license their proprietary signal processing IP cores to third parties and, as a result, become direct competitors.
Aside from the in-house research and development groups, we do not compete with any individual company across the range of our market offerings. Within particular market segments, however, we do face competition to a greater or lesser extent from other industry participants. For example, in the following specific areas we compete with the companies indicated:
| • | in the digital embedded imaging and vision market – ARM Holdings, Synopsys, Cadence and Videantis, as well as GPU IP providers such as ARM Holdings, Imagination Technologies and Verisilicon; |
| • | in the serial storage technology market – Rambus’ Snowbush IP Group, Silicon Image and Synopsys; and |
| • | in audio and voice applications market – ARM Holdings, Cadence, Synopsys and Verisilicon. |
Proprietary Rights
Our success and ability to compete are dependent on our ability to develop and maintain the proprietary aspects of our intellectual property and to operate without infringing the proprietary rights of others. We rely on a combination of patent, trademark, trade secret and copyright laws and contractual restrictions to protect the proprietary aspects of our technology. These legal protections afford only limited protection of our technology. We also seek to limit disclosure of our intellectual property and trade secrets by requiring employees and consultants with access to our proprietary information to execute confidentiality agreements with us and by restricting access to our source code and other intellectual property. Due to rapid technological change, we believe that factors such as the technological and creative skills of our personnel, new product developments and enhancements to existing products are more important than specific legal protections of our technology in establishing and maintaining a technology leadership position.
We have an active program to protect our proprietary technology through the filing of patents. Our patents relate to our signal processing IP cores and application-specific platform technologies. As of December 31, 2016, we hold 53 patents in the United States, four patents in Canada, 29 patents in the EME (Europe and Middle East) region and seven patents in Asia Pacific (APAC) region, totaling 93 patents, with expiration dates between 2017 and 2035. In addition, as of December 31, 2016, we have nine patent applications pending in the United States, five pending patent applications in Canada, 16 pending patent applications in the EME region and seven pending patent applications in the APAC region, totaling 37 pending patent applications.
10
Table of Contents
We actively pursue foreign patent protection in countries where we feel it is prudent to do so. Our policy is to apply for patents or for other appropriate statutory protection when we develop valuable new or improved technology. The status of patents involves complex legal and factual questions, and the breadth of claims allowed is uncertain. Accordingly, there are no assurances that any patent application filed by us will result in a patent being issued, or that our issued patents, and any patents that may be issued in the future, will afford us adequate protection against competitors with similar technology; nor can we be assured that patents issued to us will not be infringed or that others will not design around our technology. In addition, the laws of certain countries in which our products are or may be developed, manufactured or sold may not protect our products and intellectual property rights to the same extent as the laws of the United States. We can provide no assurance that our pending patent applications or any future applications will be approved or will not be challenged by third parties, that any issued patents will effectively protect our technology, or that patents held by third parties will not have an adverse effect on our ability to do business.
The semiconductor industry is characterized by frequent litigation regarding patent and other intellectual property rights. Questions of infringement in the semiconductor field involve highly technical and subjective analyses. In addition, patent infringement claims are increasingly being asserted by patent holding companies (so-called patent “trolls”), which do not use technology and whose sole business is to enforce patents against companies, such as us, for monetary gain. Because such patent holding companies do not provide services or use technology, the assertion of our own patents by way of counter-claim may be ineffective. Litigation may in the future be necessary to enforce our patents and other intellectual property rights, to protect our trade secrets, to determine the validity and scope of the proprietary rights of others, or to defend against claims of infringement or invalidity. We cannot assure you that we would be able to prevail in any such litigation, or be able to devote the financial resources required to bring such litigation to a successful conclusion.
In any potential dispute involving our patents or other intellectual property, our licensees also could become the targets of litigation. We are generally bound to indemnify licensees under the terms of our license agreements. Although our indemnification obligations are generally subject to a maximum amount, these obligations could nevertheless result in substantial expenses. In addition to the time and expense required for us to indemnify our licensees, a licensee’s development, marketing and sale of products embodying our solutions could be severely disrupted or shut down as a result of litigation.
We also rely on trademark, copyright and trade secret laws to protect our intellectual property. We have registered trademark in the United States for our name CEVA and the related CEVA logo, and currently market our DSP cores and other technology offerings under this trademark.
11
Table of Contents
Employees
The table below presents the number of employees of CEVA as of December 31, 2016 by function and geographic location.
| Number | ||||
| Total employees |
278 | |||
| Function |
||||
| Research and development |
199 | |||
| Sales and marketing |
35 | |||
| Administration |
23 | |||
| Technical support |
21 | |||
| Location |
||||
| Israel |
171 | |||
| France |
43 | |||
| Ireland |
14 | |||
| China |
13 | |||
| United States |
12 | |||
| United Kingdom |
11 | |||
| Elsewhere |
14 | |||
Our employees are not represented by any collective bargaining agreements, and we have never experienced a work stoppage. We believe our employee relations are good.
A number of our employees are located in Israel. Certain provisions of Israeli law and the collective bargaining agreements between the Histadrut (General Federation of Labor in Israel) and the Coordination Bureau of Economic Organizations (the Israeli federation of employers’ organizations) apply to our Israeli employees.
In 2004, we finalized and adopted a new Code of Business Conduct and Ethics regarding the standards of conduct of our directors, officers and employees. The code is reviewed and updated periodically by our Board or Directors and is available on our website at www.ceva-dsp.com.
Corporate History
Our company was incorporated in Delaware on November 22, 1999 under the name DSP Cores, Inc. We changed our name to ParthusCeva, Inc. in November 2002 and to CEVA, Inc. in December 2003.
Available Information
Our annual reports on Form 10-K, quarterly reports on Form 10-Q, current reports on Form 8-K and amendments to reports pursuant to Section 13(a) or 15(d) of the Securities Exchange Act of 1934, as amended, are available, free of charge, on our website at www.ceva-dsp.com, as soon as reasonably practicable after such reports are electronically filed with the Securities and Exchange Commission and are also available on the SEC’s website at www.sec.gov.
Our website and the information contained therein or connected thereto are not intended to be incorporated into this Annual Report on Form 10-K.
| ITEM 1A. | RISK FACTORS |
We caution you that the following important factors, among others, could cause our actual future results to differ materially from those expressed in forward-looking statements made by or on behalf of us in filings with
12
Table of Contents
the Securities and Exchange Commission, press releases, communications with investors and oral statements. Any or all of our forward-looking statements in this annual report, and in any other public statements we make, may turn out to be wrong. They can be affected by inaccurate assumptions we might make or by known or unknown risks and uncertainties. Many factors mentioned in the discussion below will be important in determining future results. We undertake no obligation to publicly update any forward-looking statements, whether as a result of new information, future events or otherwise. You are advised, however, to consult any further disclosures we make in our reports filed with the Securities and Exchange Commission.
The markets in which we operate are highly competitive, and as a result we could experience a loss of sales, lower prices and lower revenues.
The markets for the products in which our technology is incorporated are highly competitive. Aggressive competition could result in substantial declines in the prices that we are able to charge for our intellectual property or lose design wins to competitors. Many of our competitors are striving to increase their share of the growing signal processing IP markets and are reducing their licensing and royalty fees to attract customers. The following industry players and factors may have a significant impact on our competitiveness:
| • | we compete directly in the DSP cores space with Verisilicon, Cadence and Synopsys; |
| • | we compete with CPU IP or configurable CPU IP (offering DSP configured CPU and/or DSP acceleration and/or connectivity capabilities to their IP) providers, such as ARM Holdings (acquired by SoftbBank), Imagination Technologies, Synopsys and Cadence; |
| • | we compete with internal engineering teams at companies such as Mediatek, Qualcomm, Samsung, Huawei and NXP that may design programmable DSP core products in-house and therefore not license our technologies; |
| • | we compete in the SATA and SAS IP markets with several vendors, such as Semtech’s Snowbush IP Group and Synopsys, that offer similar products, thereby leading to pricing pressures for both licensing and royalty revenues; |
| • | we compete in the short range wireless markets with ARM Holdings, Mindtree, Imagination Technologies and STMicroelectronics; |
| • | we compete in embedded imaging and vision market with Cadence, Synopsys, Videantis, ARM Holdings (NEON technology) and GPU IP providers such as ARM Holdings, Imagination Technologies and Vivante (part of Verisilicon) ; and |
| • | we compete in the audio and voice applications market with ARM Holdings, Synopsys, Cadence and Verisilicon. |
In addition, we may face increased competition from smaller, niche semiconductor design companies in the future. Some of our customers also may decide to satisfy their needs through in-house design. We compete on the basis of signal processing IP performance, overall chip cost, power consumption, flexibility, reliability, communication and multimedia software availability, design cycle time, tool chain, customer support, name recognition, reputation and financial strength. Our inability to compete effectively on these bases could have a material adverse effect on our business, results of operations and financial condition.
Our quarterly operating results fluctuate from quarter to quarter due to a variety of factors, including our lengthy sales cycle, and may not be a meaningful indicator of future performance.
In some quarters our operating results could be below the expectations of securities analysts and investors, which could cause our stock price to fall. Factors that may affect our quarterly results of operations in the future include, among other things:
| • | the gain or loss of significant licensees, partly due to our dependence on a limited number of customers generating a significant amount of quarterly revenues; |
13
Table of Contents
| • | any delay in execution of any anticipated licensing arrangement during a particular quarter; |
| • | delays in revenue recognition for some license agreements based on percentage of completion of customized work or other accounting reasons; |
| • | the timing and volume of orders and production by our customers, as well as fluctuations in royalty revenues resulting from fluctuations in unit shipments by our licensees; |
| • | royalty pricing pressures and reduction in royalty rates due to an increase in volume shipments by customers, end-product price erosion and competitive pressures; |
| • | earnings or other financial announcements by our major customers that include shipment data or other information that implicates expectations for our future royalty revenues; |
| • | the mix of revenues among licensing and related revenues, and royalty revenues; |
| • | the timing of the introduction of new or enhanced technologies by us and our competitors, as well as the market acceptance of such technologies; |
| • | the discontinuation, or public announcement thereof, of product lines or market sectors that incorporate our technology by our significant customers; |
| • | our lengthy sales cycle and specifically in the third quarter of any fiscal year during which summer vacations slow down decision-making processes of our customers in executing contracts; |
| • | delays in the commercialization of end products that incorporate our technology; |
| • | currency fluctuations, mainly the EURO and the NIS versus the U.S. dollar; |
| • | fluctuations in operating expenses and gross margins associated with the introduction of new or enhanced technologies and adjustments to operating expenses resulting from restructurings; |
| • | the timing of Israeli R&D government grants from the Israeli Innovation Authority of the Ministry of Economy and Industry in Israel (previously known as Office of the Chief Scientist of Israel) (the “IIA”), EU grants and French research tax credits; |
| • | the timing of our payment of royalties to the IIA, which is impacted by the timing and magnitude of license agreements and royalty revenues derived from technologies that were funded by grant programs of the IIA; |
| • | statutory changes associated with research tax benefits applicable to French technology companies; |
| • | our ability to scale our operations in response to changes in demand for our technologies; |
| • | entry into new end markets that utilize our signal processing IPs, software and platforms; |
| • | changes in our pricing policies and those of our competitors; |
| • | restructuring, asset and goodwill impairment and related charges, as well as other accounting changes or adjustments; and |
| • | general economic conditions, including the current economic conditions, and its effect on the semiconductor industry and sales of consumer products into which our technologies are incorporated. |
Each of the above factors is difficult to forecast and could harm our business, financial condition and results of operations. Also, we license our technology to OEMs and semiconductor companies for incorporation into their end products for consumer markets, including handsets and consumer electronics products. The royalties we generate are reported by our customers and invoiced by us one quarter in arrears. As a result, our royalty revenues are affected by seasonal buying patterns of consumer products sold by our OEM customers that incorporate our technology and the market acceptance of such end products supplied by our OEM customers. The second quarter in any given year is usually a sequentially down quarter for us in relation to royalty revenues as
14
Table of Contents
this period represents lower post-Christmas first quarter consumer product shipments and little to no new introduction of handsets during the first quarter of the year. However, the magnitude of this second quarter decrease varies annually and has been impacted by global economic conditions, market share changes, exiting or refocusing of market sectors by our customers and the timing of introduction of new and existing handset devices powered by CEVA technology sold in any given quarter compared to the prior quarter.
Moreover, the semiconductor and consumer electronics industries remain volatile, which makes it extremely difficult for our customers and us to accurately forecast financial results and plan for future business activities. As a result, our past operating results should not be relied upon as an indication of future performance.
We rely significantly on revenues derived from a limited number of customers who contribute to our royalty and license revenues.
We derive a significant amount of revenues from a limited number of customers. One customer, Spreadtrum, accounted for 27%, 31% and 25% of our total revenues for 2016, 2015 and 2014, respectively. With respect to our royalty revenues, two royalty paying customers each represented 10% or more of our total royalty revenues for 2016, and collectively represented 80% of our total royalty revenues for 2016; two royalty paying customers each represented 10% or more of our total royalty revenues for 2015, and collectively represented 72% of our total royalty revenues for 2015; and three royalty paying customers each represented 10% or more of our total royalty revenues for 2014, and collectively represented 79% of our total royalty revenues for 2014. We expect that a significant portion of our future revenues will continue to be generated by a limited number of customers. The loss of any significant royalty paying customer could adversely affect our near-term future operating results. Furthermore, consolidation among our customers may negatively affect our revenue source, increase our existing customers’ negotiation leverage and make us further dependent on a limited number of customers. Moreover, the discontinuation of product lines or market sectors that incorporate our technology by our significant customers or a change in direction of their business and our inability to adapt our technology to their new business needs could have material negative implications for our future royalty revenues.
Our business is dependent on licensing revenues which may vary period to period.
License agreements for our signal processing IP cores and platforms have not historically provided for substantial ongoing license payments so past licensing revenues may not be indicative of the amount of such revenues in any future period. We believe that there is a similar risk with RivieraWaves’ operations associated with Bluetooth and Wi-Fi connectivity technologies. Significant portions of our anticipated future revenues, therefore, will likely depend upon our success in attracting new customers or expanding our relationships with existing customers. However, revenues recognized from licensing arrangements vary significantly from period to period, depending on the number and size of deals closed during a quarter, and is difficult to predict. In addition, as we expand our business into the non-handset baseband markets, our licensing deals may be smaller but greater in volume which may further fluctuate our licensing revenues quarter to quarter. Our ability to succeed in our licensing efforts will depend on a variety of factors, including the performance, quality, breadth and depth of our current and future products, as well as our sales and marketing skills. In addition, some of our licensees may in the future decide to satisfy their needs through in-house design and production. Our failure to obtain future licensing customers would impede our future revenue growth and could materially harm our business.
Royalty rates could decrease for existing and future license agreements, which could materially adversely affect our operating results.
Royalty payments to us under existing and future license agreements could be lower than currently anticipated for a variety of reasons. Average selling prices for semiconductor products generally decrease over time during the lifespan of a product. In addition, there is increasing downward pricing pressures in the semiconductor industry on end products incorporating our technology, especially end products for the handsets and consumer electronics markets. As a result, notwithstanding the existence of a license agreement, our
15
Table of Contents
customers may demand that royalty rates for our products be lower than our historic royalty rates. We have in the past and may be pressured in the future to renegotiate existing license agreements with our customers. In addition, certain of our license agreements provide that royalty rates may decrease in connection with the sale of larger quantities of products incorporating our technology. Furthermore, our competitors may lower the royalty rates for their comparable products to win market share which may force us to lower our royalty rates as well. As a consequence of the above referenced factors, as well as unforeseen factors in the future, the royalty rates we receive for use of our technology could decrease, thereby decreasing future anticipated revenues and cash flow. Royalty revenues were approximately 56%, 46% and 44% of our total revenues for 2016, 2015 and 2014, respectively. Therefore, a significant decrease in our royalty revenues could materially adversely affect our operating results.
Moreover, royalty rates may be negatively affected by macroeconomic trends or changes in products mix. For example, the shift away from feature phones by Intel and the handset baseband market by Broadcom and STMicroelectronics in 2014 negatively impacted our royalty revenues in 2014. Furthermore, consolidation among our customers may increase the leverage of our existing customers to extract concessions from us in royalty rates. Moreover, changes in products mix such as an increase in lower royalty bearing products shipped in high volume like low-cost feature phones and Bluetooth-based products in lieu of higher royalty bearing products like LTE phones could lower our royalty revenues.
We generate a significant amount of our total revenues from the handset baseband market (for mobile handsets and for other modem connected devices) and our business and operating results may be materially adversely affected if we do not continue to succeed in these highly competitive markets.
Our total revenues derived solely from the handset baseband market (for mobile handset and for other modem connected devices) represented 69%, 68% and 72% of our total revenues for 2016, 2015 and 2014, respectively. Any adverse change in our ability to compete and maintain our competitive position in the handset baseband market, including through the introduction by competitors of enhanced technologies that attract OEM customers that target those markets, would harm our business, financial condition and results of operations. Moreover, the handset baseband market is extremely competitive and are facing intense pricing pressures, and we expect that competition and pricing pressures will only increase. Furthermore, it can be very volatile with regards to volume shipments of different phones, standards and connected devices due to inventory build out or consumer demand changes or geographical macroeconomics, pricing changes, product discontinuations due to technical issues and timing of introduction of new phones and products. Our existing OEM customers also may fail to introduce new handset devices that attract consumers, or encounter significant delays in developing, manufacturing or shipping new or enhanced products in those markets. The inability of our OEM customers to compete would result in lower shipments of products powered by our technologies which in turn would have a material adverse effect on our business, financial condition and results of operations. Since a significant portion of our revenues are derived from the handset baseband market, adverse conditions in this market would have a material adverse effect on our business, financial condition and results of operations.
Because our IP solutions are components of end products, if semiconductor companies and electronic equipment manufacturers do not incorporate our solutions into their end products or if the end products of our customers do not achieve market acceptance, we may not be able to generate adequate sales of our products.
We do not sell our IP solutions directly to end-users; we license our technology primarily to semiconductor companies and electronic equipment manufacturers, who then incorporate our technology into the products they sell. As a result, we rely on our customers to incorporate our technology into their end products at the design stage. Once a company incorporates a competitor’s technology into its end product, it becomes significantly more difficult for us to sell our technology to that company because changing suppliers involves significant cost, time, effort and risk for the company. As a result, we may incur significant expenditures on the development of a new technology without any assurance that our existing or potential customers will select our technology for
16
Table of Contents
incorporation into their own product and without this “design win,” it becomes significantly difficult to sell our IP solutions. Moreover, even after a customer agrees to incorporate our technology into its end products, the design cycle is long and may be delayed due to factors beyond our control, which may result in the end product incorporating our technology not reaching the market until long after the initial “design win” with such customer. From initial product design-in to volume production, many factors could impact the timing and/or amount of sales actually realized from the design-in. These factors include, but are not limited to, changes in the competitive position of our technology, our customers’ financial stability, and our customers’ ability to ship products according to our customers’ schedule. Moreover, current economic conditions may further prolong a customer’s decision-making process and design cycle.
Further, because we do not control the business practices of our customers, we do not influence the degree to which they promote our technology or set the prices at which they sell products incorporating our technology. We cannot assure you that our customers will devote satisfactory efforts to promote their end products which incorporate our IP solutions.
In addition, our royalties from licenses and therefore the growth of our business, are dependent upon the success of our customers in introducing products incorporating our technology and the success of those products in the marketplace. The primary customers for our products are semiconductor design and manufacturing companies, system OEMs and electronic equipment manufacturers, particularly in the telecommunications field. These industries are highly competitive, cyclical and have been subject to significant economic downturns at various times. These downturns are characterized by production overcapacity and reduced revenues, which at times may encourage semiconductor companies or electronic product manufacturers to reduce their expenditure on our technology. If we do not retain our current customers and continue to attract new customers, our business may be harmed.
We depend on market acceptance of third-party semiconductor intellectual property.
The semiconductor intellectual property (SIP) industry is a relatively small and emerging industry. Our future growth will depend on the level of market acceptance of our third-party licensable intellectual property model, the variety of intellectual property offerings available on the market, and a shift in customer preference away from in-house development of proprietary signal processing IP towards licensing open signal processing IP cores and platforms. Furthermore, the third-party licensable intellectual property model is highly dependent on the market adoption of new services and products, such as low cost smartphones in emerging markets, LTE-based smartphones, mobile broadband, small cell base stations and the increased use of advanced audio, voice, computational photography and embedded vision in mobile, automotive and consumer products, as well as in IoT and connectivity applications. Such market adoption is important because the increased cost associated with ownership and maintenance of the more complex architectures needed for the advanced services and products may motivate companies to license third-party intellectual property rather than design them in-house.
The trends that would enable our growth are largely beyond our control. Semiconductor customers also may choose to adopt a multi-chip, off-the-shelf chip solution versus licensing or using highly-integrated chipsets that embed our technologies. If the above referenced market shifts do not materialize or third-party SIP does not achieve market acceptance, our business, results of operations and financial condition could be materially harmed.
Because we have significant international operations, we may be subject to political, economic and other conditions relating to our international operations that could increase our operating expenses and disrupt our revenues and business.
Approximately 87% of our total revenues for 2016, 84% for 2015 and 77% for 2014 were derived from customers located outside of the United States. We expect that international customers will continue to account for a significant portion of our revenues for the foreseeable future. As a result, the occurrence of any negative
17
Table of Contents
international political, economic or geographic events could result in significant revenue shortfalls. These shortfalls could cause our business, financial condition and results of operations to be harmed. Some of the risks of doing business internationally include:
| • | unexpected changes in regulatory requirements; |
| • | fluctuations in the exchange rate for the U.S. dollar; |
| • | imposition of tariffs and other barriers and restrictions; |
| • | burdens of complying with a variety of foreign laws, treaties and technical standards; |
| • | uncertainty of laws and enforcement in certain countries relating to the protection of intellectual property; |
| • | multiple and possibly overlapping tax structures and potentially adverse tax consequences; |
| • | political and economic instability, including terrorist attacks and protectionist polices; and |
| • | changes in diplomatic and trade relationships. |
We depend on a limited number of key personnel who would be difficult to replace.
Our success depends to a significant extent upon certain of our key employees and senior management, the loss of which could materially harm our business. Competition for skilled employees in our field is intense. We cannot assure you that in the future we will be successful in attracting and retaining the required personnel.
The sales cycle for our IP solutions is lengthy, which makes forecasting of our customer orders and revenues difficult.
The sales cycle for our IP solutions is lengthy, often lasting three to nine months. Our customers generally conduct significant technical evaluations, including customer trials, of our technology as well as competing technologies prior to making a purchasing decision. In addition, purchasing decisions also may be delayed because of a customer’s internal budget approval process. Furthermore, given the current market conditions, we have less ability to predict the timing of our customers’ purchasing cycle and potential unexpected delays in such a cycle. Because of the lengthy sales cycle and potential delays, our dependence on a limited number of customers to generate a significant amount of revenues for a particular period and the size of customer orders, if orders forecasted for a specific customer for a particular period do not occur in that period, our revenues and operating results for that particular quarter could suffer. Moreover, a portion of our expenses related to an anticipated order is fixed and difficult to reduce or change, which may further impact our operating results for a particular period.
Because our IP solutions are complex, the detection of errors in our products may be delayed, and if we deliver products with defects, our credibility will be harmed, the sales and market acceptance of our products may decrease and product liability claims may be made against us.
Our IP solutions are complex and may contain errors, defects and bugs when introduced. If we deliver products with errors, defects or bugs, our credibility and the market acceptance and sales of our products could be significantly harmed. Furthermore, the nature of our products may also delay the detection of any such error or defect. If our products contain errors, defects and bugs, then we may be required to expend significant capital and resources to alleviate these problems. This could result in the diversion of technical and other resources from our other development efforts. Any actual or perceived problems or delays may also adversely affect our ability to attract or retain customers. Furthermore, the existence of any defects, errors or failure in our products could lead to product liability claims or lawsuits against us or against our customers. A successful product liability claim could result in substantial cost and divert management’s attention and resources, which would have a negative impact on our financial condition and results of operations.
18
Table of Contents
Our success will depend on our ability to successfully manage our geographically dispersed operations.
Most of our employees are located in Israel. We also added French employees after the RivieraWaves acquisition in 2014. Accordingly, our ability to compete successfully will depend in part on the ability of a limited number of key executives located in geographically dispersed offices to integrate management, address the needs of our customers and respond to changes in our markets. If we are unable to effectively manage and integrate our remote operations, our business may be materially harmed.
Our operations in Israel may be adversely affected by instability in the Middle East region.
One of our principal research and development facilities is located in Israel, and our executive officers and some of our directors are residents of Israel. Although substantially all of our sales currently are being made to customers outside Israel, we are nonetheless directly influenced by the political, economic and military conditions affecting Israel. Any major hostilities involving Israel could significantly harm our business, operating results and financial condition.
In addition, certain of our employees are currently obligated to perform annual reserve duty in the Israel Defense Forces and are subject to being called to active military duty at any time. Although we have operated effectively under these requirements since our inception, we cannot predict the effect of these obligations on the company in the future. Our operations could be disrupted by the absence, for a significant period, of one or more of our key employees due to military service.
Terrorist attacks, acts of war or military actions and/or other civil unrest may adversely affect the territories in which we operate, and our business, financial condition and operating results.
Terrorist attacks such as those that have occurred in France, where we have our wireless connectivity operations as a result of our acquisition of RivieraWaves, and attempted terrorist attacks, military responses to terrorist attacks, other military actions, or governmental action in response to or in anticipation of a terrorist attack, or civil unrest, may adversely affect prevailing economic conditions, resulting in work stoppages, reduced consumer spending or reduced demand for end products that incorporate our technologies. These developments subject our worldwide operations to increased risks and, depending on their magnitude, could reduce net sales and therefore could have a material adverse effect on our business, financial condition and operating results.
Our research and development expenses may increase if the grants we currently receive from the Israeli government and European Union are reduced or withheld.
We currently receive research grants from programs of the Israeli Innovation Authority of the Ministry of Economy and Industry in Israel (previously known as Office of the Chief Scientist of Israel of the Israeli Ministry of Industry and Trade) and the Seventh Framework Program of the European Union. We recorded an aggregate of $6,410,000, $4,997,000 and $4,586,000 in 2016, 2015 and 2014, respectively. To be eligible for these grants, we must meet certain development conditions and comply with periodic reporting obligations. Although we have met such conditions in the past, should we fail to meet such conditions in the future our research grants may be repayable, reduced or withheld. The repayment or reduction of such research grants may increase our research and development expenses which in turn may reduce our operating income. Also, the timing of such payments from the IIA and European Union may vary from year to year and quarter to quarter, and we have no control on the timing of such payment.
The Israeli tax benefits that we currently receive and the government programs in which we participate require us to meet certain conditions and may be terminated or reduced in the future, which could increase our tax expenses.
We enjoy certain tax benefits in Israel, particularly as a result of the “Approved Enterprise” and the “Benefited Enterprise” status of our facilities and programs. To maintain our eligibility for these tax benefits, we
19
Table of Contents
must continue to meet certain conditions, relating principally to adherence to the investment program filed with the Investment Center of the Israeli Ministry of Industry and Trade and to periodic reporting obligations. Should we fail to meet such conditions in the future, these benefits would be cancelled and we would be subject to corporate tax in Israel at the standard corporate rate (25% in 2016) and could be required to refund tax benefits already received. In addition, we cannot assure you that these tax benefits will be continued in the future at their current levels or otherwise. The tax benefits under our active investment programs are scheduled to gradually expire starting in 2017. The termination or reduction of certain programs and tax benefits (particularly benefits available to us as a result of the “Approved Enterprise” and the “Benefited Enterprise” status of our facilities and programs) or a requirement to refund tax benefits already received may seriously harm our business, operating results and financial condition.
Our failure to maintain certain research tax benefits applicable to French technology companies may adversely affect the results of operations of our RivieraWaves operations.
Pursuant to our acquisition of the RivieraWaves operations, we will benefit from certain research tax credits applicable to French technology companies, including, for example, the Crédit Impôt Recherche (“CIR”). The CIR is a French tax credit aimed at stimulating research activities. The CIR can be offset against French corporate income tax due and the portion in excess (if any) may be refunded every three years. The French Parliament can decide to eliminate, or reduce the scope or the rate of, the CIR benefit, at any time or challenge our eligibility or calculations for such tax credits, all of which may have an adverse impact on our results of operations and future cash flows.
We are exposed to fluctuations in currency exchange rates.
A significant portion of our business is conducted outside the United States. Although most of our revenues are transacted in U.S. dollars, we may be exposed to currency exchange fluctuations in the future as business practices evolve and we are forced to transact business in local currencies. Moreover, the majority of our expenses are denominated in foreign currencies, mainly New Israeli Shekel (NIS) and the EURO, which subjects us to the risks of foreign currency fluctuations. Our primary expenses paid in currencies other than the U.S. dollar are employee salaries. Increases in the volatility of the exchange rates of currencies other than the U.S. dollar versus the U.S. dollar could have an adverse effect on the expenses and liabilities that we incur in currencies other than the U.S. dollar when remeasured into U.S. dollars for financial reporting purposes. We have instituted a foreign cash flow hedging program to minimize the effects of currency fluctuations. However, hedging transactions may not successfully mitigate losses caused by currency fluctuations, and our hedging positions may be partial or may not exist at all in the future. We also review our monthly expected non-U.S. dollar denominated expenditure and look to hold equivalent non-U.S. dollar cash balances to mitigate currency fluctuations. However, in some cases, we expect to continue to experience the effect of exchange rate currency fluctuations on an annual and quarterly basis. For example, our EURO cash balances increase significantly on a quarterly basis beyond our EURO liabilities from the CIR, which is generally refunded every three years.
We are exposed to the credit risk of our customers, which could result in material losses.
As we diversify and expand our addressable market, we will enter into licensing arrangements with first time customers with whom we don’t have full visible of their creditworthiness. Furthermore, we have increased business activities in the Asia Pacific region. As a result, our future credit risk exposure may increase. Although we monitor and attempt to mitigate credit risks, there can be no assurance that our efforts will be effective. Although any losses to date relating to credit exposure of our customers have not been material, future losses, if incurred, could harm our business and have a material adverse effect on our operating results and financial condition.
20
Table of Contents
Our product development efforts are time-consuming and expensive and may not generate an acceptable return, if any.
Our product development efforts require us to incur substantial research and development expense. Our research and development expenses were approximately $30.8 million, $28.1 million and $25.8 million for 2016, 2015 and 2014, respectively. We may not be able to achieve an acceptable return, if any, on our research and development efforts.
The development of our products is highly complex. We occasionally have experienced delays in completing the development and introduction of new products and product enhancements, and we could experience delays in the future. Unanticipated problems in developing products could also divert substantial engineering resources, which may impair our ability to develop new products and enhancements and could substantially increase our costs. Furthermore, we may expend significant amounts on research and development programs that may not ultimately result in commercially successful products. Our research and development expense levels increased since the third quarter of 2014 after the acquisition of RivieraWaves. As a result of these and other factors, we may be unable to develop and introduce new products successfully and in a cost-effective and timely manner, and any new products we develop and offer may never achieve market acceptance. Any failure to successfully develop future products would have a material adverse effect on our business, financial condition and results of operations.
If we are unable to meet the changing needs of our end-users or address evolving market demands, our business may be harmed.
The markets for signal processing IPs are characterized by rapidly changing technology, emerging markets and new and developing end-user needs, and requiring significant expenditure for research and development. We cannot assure you that we will be able to introduce systems and solutions that reflect prevailing industry standards, on a timely basis, meet the specific technical requirements of our end-users or avoid significant losses due to rapid decreases in market prices of our products, and our failure to do so may seriously harm our business.
We may seek to expand our business in ways that could result in diversion of resources and extra expenses.
We may in the future pursue acquisitions of businesses, products and technologies, establish joint venture arrangements, make minority equity investments or enhance our existing CEVAnet partner eco-system to expand our business. We are unable to predict whether or when any prospective acquisition, equity investment or joint venture will be completed. The process of negotiating potential acquisitions, joint ventures or equity investments, as well as the integration of acquired or jointly developed businesses, technologies or products may be prolonged due to unforeseen difficulties and may require a disproportionate amount of our resources and management’s attention. We cannot assure you that we will be able to successfully identify suitable acquisition or investment candidates, complete acquisitions or investments, or integrate acquired businesses or joint ventures with our operations. If we were to make any acquisition or investment or enter into a joint venture, we may not receive the intended benefits of the acquisition, investment or joint venture or such an acquisition, investment or joint venture may not achieve comparable levels of revenues, profitability or productivity as our existing business or otherwise perform as expected. The expansion of our CEVAnet partner eco-system also may not achieve the anticipated benefits. The occurrence of any of these events could harm our business, financial condition or results of operations. Future acquisitions, investments or joint ventures may require substantial capital resources, which may require us to seek additional debt or equity financing.
Future acquisitions, joint ventures or minority equity investments by us could result in the following, any of which could seriously harm our results of operations or the price of our stock:
| • | issuance of equity securities that would dilute our current stockholders’ percentages of ownership; |
| • | large one-time write-offs or equity investment impairment write-offs; |
21
Table of Contents
| • | incurrence of debt and contingent liabilities; |
| • | difficulties in the assimilation and integration of operations, personnel, technologies, products and information systems of the acquired companies; |
| • | inability to realize cost efficiencies or synergies, thereby incurring higher operating expenditures as a result of the acquisition; |
| • | diversion of management’s attention from other business concerns; |
| • | contractual disputes; |
| • | risks of entering geographic and business markets in which we have no or only limited prior experience; and |
| • | potential loss of key employees of acquired organizations. |
We may not be able to adequately protect our intellectual property.
Our success and ability to compete depend in large part upon the protection of our proprietary technologies. We rely on a combination of patent, copyright, trademark, trade secret, mask work and other intellectual property rights, confidentiality procedures and licensing arrangements to establish and protect our proprietary rights. These agreements and measures may not be sufficient to protect our technology from third-party infringement or protect us from the claims of others. As a result, we face risks associated with our patent position, including the potential need to engage in significant legal proceedings to enforce our patents, the possibility that the validity or enforceability of our patents may be denied, the possibility that third parties will be able to compete against us without infringing our patents and the possibility that our products may infringe patent rights of third parties.
Our trade names or trademarks may be registered or utilized by third parties in countries other than those in which we have registered them, impairing our ability to enter and compete in those markets. If we were forced to change any of our brand names, we could lose a significant amount of our brand identity.
Our business will suffer if we are sued for infringement of the intellectual property rights of third parties or if we cannot obtain licenses to these rights on commercially acceptable terms.
We are subject to the risk of adverse claims and litigation alleging infringement of the intellectual property rights of others. There are a large number of patents held by others, including our competitors, pertaining to the broad areas in which we are active. We have not, and cannot reasonably, investigate all such patents. From time to time, we have become aware of patents in our technology areas and have sought legal counsel regarding the validity of such patents and their impact on how we operate our business, and we will continue to seek such counsel when appropriate in the future. In addition, patent infringement claims are increasingly being asserted by patent holding companies (so-called patent “trolls”), which do not use technology and whose sole business is to enforce patents against companies, such as us, for monetary gain. Because such patent holding companies do not provide services or use technology, the assertion of our own patents by way of counter-claim may be ineffective. Infringement claims may require us to enter into license arrangements or result in protracted and costly litigation, regardless of the merits of these claims. Any necessary licenses may not be available or, if available, may not be obtainable on commercially reasonable terms. If we cannot obtain necessary licenses on commercially reasonable terms, we may be forced to stop licensing our technology, and our business would be seriously harmed.
The future growth of our business depends in part on our ability to license to system OEMs and small-to-medium-sized semiconductor companies directly and to expand our sales geographically.
Historically, a substantial portion of our licensing revenues has been derived in any given period from a relatively small number of licensees. Because of the substantial license fees we charge, our customers tend to be large semiconductor companies or vertically integrated system OEMs. Part of our current growth strategy is to
22
Table of Contents
broaden the adoption of our products by small and mid-size companies by offering different versions of our products targeted at these companies. If we are unable to develop and market effectively our intellectual property through these models, our revenues will continue to be dependent on a smaller number of licensees and a less geographically dispersed pattern of licensees, which could materially harm our business and results of operations.
Our operating results are affected by the highly cyclical nature of the semiconductor industry.
We operate within the semiconductor industry which experiences significant fluctuations in sales and profitability. Downturns in the semiconductor industry are characterized by diminished product demand, excess customer inventories, accelerated erosion of prices and excess production capacity. These factors could cause substantial fluctuations in our revenues and in our results of operations.
We may dispose of or discontinue existing product lines and technology developments, which may adversely impact our future results.
On an ongoing basis, we evaluate our various product offerings and technology developments in order to determine whether any should be discontinued or, to the extent possible, divested. We cannot guarantee that we have correctly forecasted, or will correctly forecast in the future, the right product lines and technology developments to dispose or discontinue or that our decision to dispose of or discontinue various investments, products lines and technology developments is prudent if market conditions change. In addition, there are no assurances that the discontinuance of various product lines will reduce our operating expenses or will not cause us to incur material charges associated with such decision. Furthermore, the discontinuance of existing product lines entails various risks, including the risk that we will not be able to find a purchaser for a product line or the purchase price obtained will not be equal to at least the book value of the net assets for the product line. Other risks include managing the expectations of, and maintaining good relations with, our customers who previously purchased products from our disposed or discontinued product lines, which could prevent us from selling other products to them in the future. We may also incur other significant liabilities and costs associated with our disposal or discontinuance of product lines, including employee severance costs and excess facilities costs.
Cybersecurity threats or other security breaches could compromise sensitive information belonging to us or our customers and could harm our business and our reputation.
We store sensitive data, including intellectual property, proprietary business information and our customer and employee information. Despite our security measures, our information technology and infrastructure may be vulnerable to attacks by hackers or breached due to employee error, malfeasance or other disruptions that could result in unauthorized disclosure or loss of sensitive data. Because the techniques used to obtain unauthorized access to networks, or to sabotage systems, change frequently and generally are not recognized until launched against a target, we may be unable to anticipate these techniques or to implement adequate preventative measures. Furthermore, in the operation of our business we also use third-party vendors that store certain sensitive data. Any security breach of our own or a third-party vendor’s systems could cause us to be non-compliant with applicable laws or regulations, subject us to legal claims or proceedings, disrupt our operations, damage our reputation, and cause a loss of confidence in our products and services, any of which could adversely affect our business.
Our corporate tax rate may increase, which could adversely impact our cash flow, financial condition and results of operations.
We have significant operations in Israel, as well operations in the Republic of Ireland and France. A substantial portion of our taxable income historically has been generated in Israel. Currently, our Israeli and Irish subsidiaries are taxed at rates substantially lower than the U.S. tax rates. If our Israeli and Irish subsidiaries were no longer to qualify for these lower tax rates or if the applicable tax laws were rescinded or changed, our operating results could be materially adversely affected. In addition, because our Israeli, Irish and French
23
Table of Contents
operations are owned by subsidiaries of our U.S. parent corporation, distributions to the U.S. parent corporation, and in certain circumstances undistributed income of the subsidiaries, may be subject to U.S. taxes. Moreover, if U.S. or other authorities were to change applicable tax laws or successfully challenge the manner in which our subsidiaries’ profits are currently recognized, our overall tax expenses could increase, and our business, cash flow, financial condition and results of operations could be materially adversely affected. Also our taxes on the Irish interest income may be double taxed both in Ireland and in the U.S. due to U.S. tax regulations and Irish tax restrictions on NOLs to off-set interest income. In addition, starting in 2012, our Israeli interest income also may be taxed both in Israel and the U.S due to different Controlled Foreign Corporation rules.
Our stock price may be volatile so you may not be able to resell your shares of our common stock at or above the price you paid for them.
Announcements of developments related to our business, announcements by competitors, quarterly fluctuations in our financial results, changes in the general conditions of the highly dynamic industry in which we compete or the national economies in which we do business, and other factors could cause the price of our common stock to fluctuate, perhaps substantially. In addition, in recent years, the stock market has experienced extreme price fluctuations, which have often been unrelated to the operating performance of affected companies. These factors and fluctuations could have a material adverse effect on the market price of our common stock.
| ITEM 1B. | UNRESOLVED STAFF COMMENTS |
None.
| ITEM 2. | PROPERTIES |
Our headquarters are located in Mountain View, California and we have principal offices in Herzeliya, Israel, Sophia Antipolis, France and Dublin, Ireland.
We lease buildings for our executive offices, and engineering, sales, marketing, administrative and support operations and design centers. The following table summarizes information with respect to the principal facilities leased by us as of December 31, 2016:
| Location |
Term | Expiration | Area (Sq. Feet) |
Principal Activities | ||||||
| Mountain View, CA, U.S. (1) | 8 years | 2023 | 3,769 | Headquarters; sales and marketing; administration | ||||||
| Herzeliya, Israel (2) | 6 years | 2020 | 35,801 | Research and development; administration; sales and marketing | ||||||
| Dublin, Ireland (3) | 10 years | 2026 | 1,755 | Research and development; administration | ||||||
| Cork, Ireland (4) | 5 years | 2021 | 2,870 | Research and development | ||||||
| Belfast, UK (5) | 15 years | 2019 | 2,600 | Research and development | ||||||
| Sophia Antipolis, France (6) | 9 years | 2021 | 7,535 | Research and development; administration; sales and marketing | ||||||
| Shanghai, China | 3 years | 2018 | 3,438 | sales and marketing | ||||||
| Tokyo, Japan | 3 years | 2019 | 1,713 | sales and marketing | ||||||
| (1) | Break clause in the lease exercisable in 2020. |
| (2) | Break clause in the lease exercisable in 2018. |
| (3) | Break clause in the lease exercisable in 2021. |
24
Table of Contents
| (4) | Break clause in the lease exercisable in 2018. |
| (5) | Break clause in the lease exercisable on payment of one year rent. |
| (6) | Break clause exercisable in 2018. |
| ITEM 3. | LEGAL PROCEEDINGS |
From time to time, we are involved in litigation relating to claims arising out of our operations in the normal course of business. We are not a party to any legal proceedings, the adverse outcome of which, in management’s opinion, would have a material adverse effect on our results of operations or financial position
| ITEM 4. | MINE SAFETY DISCLOSURES |
Not applicable.
25
Table of Contents
EXECUTIVE OFFICERS OF THE REGISTRANT
Below are the names, ages and principal recent business experience of our current executive officers. All such persons have been appointed by our board of directors to serve until their successors are elected and qualified or until their earlier resignation or removal.
Gideon Wertheizer, age 60, has served as our Chief Executive Officer since May 2005. He joined our board of directors in January 2010. Mr. Wertheizer has 33 years of experience in the semiconductor and Silicon Intellectual Property (SIP) industries. He previously served as the Executive Vice President and General Manager of the DSP business unit at CEVA. Prior to joining CEVA in November 2002, Mr. Wertheizer held various executive positions at DSP Group, Inc., including such roles as Executive VP—Strategic Business Development, Vice President for Marketing and Vice President of VLSI design. Mr. Wertheizer holds a BsC for electrical engineering from Ben Gurion University in Israel and executive MBA from Bradford University in the United Kingdom.
Yaniv Arieli, age 48, has served as our Chief Financial Officer since May 2005. Prior to his current position, Mr. Arieli served as President of U.S. Operations and Director of Investor Relations of DSP Group beginning in August 2002 and Vice President of Finance, Chief Financial Officer and Secretary of DSP Group’s DSP Cores Licensing Division prior to that time. Before joining DSP Group in 1997, Mr. Arieli served as an account manager and certified public accountant at Kesselman & Kesselman, a member of PricewaterhouseCoopers, a leading accounting firm. Mr. Arieli is a CPA and holds a B.A. in Accounting and Economics from Haifa University in Israel and an M.B.A. from Newport University and is also a member of the National Investor Relation Institute.
Issachar Ohana, age 51, has served as our Vice President, Worldwide Sales, since November 2002 and our Executive Vice President, Worldwide Sales, since July 2006. Prior to joining CEVA in November 2002, Mr. Ohana was with DSP Group beginning in August 1994 as a VLSI design engineer. He was appointed Project Manager of DSP Group’s research and development in July 1995, Director of Core Licensing in August 1998, and Vice President—Sales of the Core Licensing Division in May 2000. Mr. Ohana holds a B.Sc. in Electrical and Computer Engineering from Ben Gurion University in Israel and an MBA from Bradford University in the United Kingdom.
26
Table of Contents
PART II
| ITEM 5. | MARKET FOR REGISTRANT’S COMMON EQUITY, RELATED STOCKHOLDER MATTERS AND ISSUER PURCHASES OF EQUITY SECURITIES |
Our common stock began trading on The NASDAQ Global Market on November 1, 2002. Our common stock currently trades under the ticker symbol “CEVA” on NASDAQ. As of February 24, 2017, there were approximately 1,876 holders of record, which we believe represents approximately 9,286 beneficial holders. The closing price of our common stock on The NASDAQ Global Market on March 3, 2017 was $33.45 per share. The following table sets forth, for the periods indicated, the range of high and low closing prices per share of our common stock, as reported on The NASDAQ Global Market.
| Price Range of Common Stock |
||||||||
| High | Low | |||||||
| 2016 |
||||||||
| First Quarter |
$ | 23.15 | $ | 17.41 | ||||
| Second Quarter |
$ | 27.90 | $ | 21.77 | ||||
| Third Quarter |
$ | 36.29 | $ | 26.13 | ||||
| Fourth Quarter |
$ | 35.55 | $ | 28.50 | ||||
| 2015 |
||||||||
| First Quarter |
$ | 23.16 | $ | 17.33 | ||||
| Second Quarter |
$ | 22.45 | $ | 18.45 | ||||
| Third Quarter |
$ | 19.52 | $ | 16.98 | ||||
| Fourth Quarter |
$ | 27.14 | $ | 17.77 | ||||
We have never paid any cash dividends. We intend to retain future earnings, if any, to fund the development and growth of our business and currently do not anticipate paying cash dividends in the foreseeable future.
Equity Compensation Plan Information
Information as of December 31, 2016 regarding options, SARs and RSUs granted under our stock plans and remaining available for issuance under those plans will be contained in the definitive 2017 Proxy Statement for the 2017 annual meeting of stockholders to be held on May 15, 2017 and incorporated herein by reference.
Issuer Purchases of Equity Securities
There were no repurchases of our common stock during the three months ended December 31, 2016.
2016 Annual Meeting of Stockholders
We anticipate that the 2017 annual meeting of our stockholders will be held on May 15, 2017 in New York City, NY.
Stock Performance Graph
Notwithstanding anything to the contrary set forth in any of the Company’s previous or future filings under the Securities Act of 1933, as amended, or the Securities Exchange Act of 1934, as amended, that might incorporate this proxy statement or future filings made by the Company under those statutes, the below Stock Performance Graph shall not be deemed filed with the United States Securities and Exchange Commission and shall not be deemed incorporated by reference into any of those prior filings or into any future filings made by the Company under those statutes.
27
Table of Contents
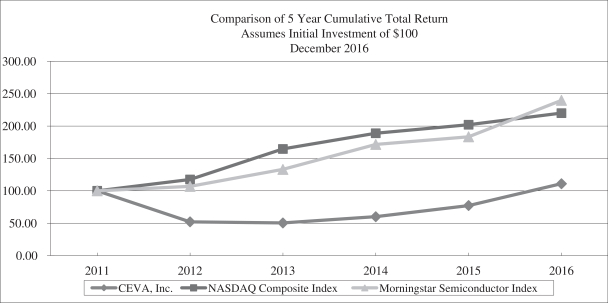
| 12/31/11 | 12/31/12 | 12/31/13 | 12/31/14 | 12/31/15 | 12/31/16 | |||||||
| CEVA, Inc. |
100.00 | 52.05 | 50.30 | 59.95 | 77.20 | 110.87 | ||||||
| NASDAQ Composite |
100.00 | 117.45 | 164.57 | 188.84 | 201.98 | 219.89 | ||||||
| Morningstar Semiconductor |
100.00 | 106.73 | 132.99 | 171.56 | 183.39 | 239.66 | ||||||
The stock performance graph above compares the percentage change in cumulative stockholder return on the common stock of our company for the period from December 31, 2011, through December 31, 2016, with the cumulative total return on The NASDAQ Global Market (U.S.) Composite Index and the Morningstar Semiconductor Group Index.
This graph assumes the investment of $100 in our common stock (at the closing price of our common stock on December 31, 2011), the NASDAQ Global Market (U.S.) Composite Index and the Morningstar Semiconductor Group Index on December 31, 2011, and assumes dividends, if any, are reinvested.
Comparisons in the graph above are based upon historical data and are not indicative of, nor intended to forecast, future performance of our common stock.
28
Table of Contents
| ITEM 6. | SELECTED FINANCIAL DATA |
The following selected financial data should be read in conjunction with, and are qualified by reference to, our consolidated financial statements and the related notes, as well as our “Management’s Discussion and Analysis of Financial Condition and Results of Operations for the fiscal year ended December 31, 2016,” both appearing elsewhere in this annual report.
| Year Ended December 31, | ||||||||||||||||||||
| 2012 | 2013 | 2014 | 2015 | 2016 | ||||||||||||||||
| (in thousands) | ||||||||||||||||||||
| Consolidated Statements of Income Data: |
||||||||||||||||||||
| Revenues: |
||||||||||||||||||||
| Licensing and related revenue |
$ | 21,727 | $ | 22,372 | $ | 28,348 | $ | 32,135 | $ | 31,874 | ||||||||||
| Royalties |
31,950 | 26,528 | 22,460 | 27,364 | 40,779 | |||||||||||||||
|
|
|
|
|
|
|
|
|
|
|
|||||||||||
| Total revenues |
53,677 | 48,900 | 50,808 | 59,499 | 72,653 | |||||||||||||||
| Cost of revenues |
3,952 | 5,163 | 5,000 | 5,424 | 6,086 | |||||||||||||||
|
|
|
|
|
|
|
|
|
|
|
|||||||||||
| Gross profit |
49,725 | 43,737 | 45,808 | 54,075 | 66,567 | |||||||||||||||
| Operating expenses: |
||||||||||||||||||||
| Research and development, net |
20,243 | 21,216 | 25,828 | 28,113 | 30,838 | |||||||||||||||
| Sales and marketing |
9,231 | 10,092 | 9,815 | 10,168 | 11,540 | |||||||||||||||
| General and administrative |
7,884 | 7,670 | 8,054 | 8,184 | 8,567 | |||||||||||||||
| Amortization of intangible assets |
— | — | 649 | 1,298 | 1,236 | |||||||||||||||
|
|
|
|
|
|
|
|
|
|
|
|||||||||||
| Total operating expenses |
37,358 | 38,978 | 44,346 | 47,763 | 52,181 | |||||||||||||||
|
|
|
|
|
|
|
|
|
|
|
|||||||||||
| Operating income |
12,367 | 4,759 | 1,462 | 6,312 | 14,386 | |||||||||||||||
| Financial income, net |
3,380 | 2,714 | 975 | 1,069 | 2,039 | |||||||||||||||
| Other loss |
— | — | (404 | ) | — | — | ||||||||||||||
|
|
|
|
|
|
|
|
|
|
|
|||||||||||
| Income before taxes on income |
15,747 | 7,473 | 2,033 | 7,381 | 16,425 | |||||||||||||||
| Income taxes |
2,062 | 788 | 2,852 | 1,114 | 3,325 | |||||||||||||||
|
|
|
|
|
|
|
|
|
|
|
|||||||||||
| Net income (loss) |
$ | 13,685 | $ | 6,685 | $ | (819 | ) | $ | 6,267 | $ | 13,100 | |||||||||
|
|
|
|
|
|
|
|
|
|
|
|||||||||||
| Basic net income (loss) per share |
$ | 0.60 | $ | 0.30 | $ | (0.04 | ) | $ | 0.31 | $ | 0.63 | |||||||||
| Diluted net income (loss) per share |
$ | 0.59 | $ | 0.30 | $ | (0.04 | ) | $ | 0.30 | $ | 0.61 | |||||||||
| December 31, | ||||||||||||||||||||
| 2012 | 2013 | 2014 | 2015 | 2016 | ||||||||||||||||
| (in thousands) | ||||||||||||||||||||
| Consolidated Balance Sheet Data: |
||||||||||||||||||||
| Working capital |
$ | 131,545 | $ | 131,433 | $ | 93,777 | $ | 87,044 | $ | 122,117 | ||||||||||
|
|
|
|
|
|
|
|
|
|
|
|||||||||||
| Total assets |
216,333 | 212,327 | 207,005 | 212,649 | 242,495 | |||||||||||||||
|
|
|
|
|
|
|
|
|
|
|
|||||||||||
| Total long-term liabilities |
6,158 | 7,255 | 7,961 | 7,571 | 8,349 | |||||||||||||||
|
|
|
|
|
|
|
|
|
|
|
|||||||||||
| Total stockholders’ equity |
$ | 196,068 | $ | 190,895 | $ | 179,049 | $ | 186,095 | $ | 211,551 | ||||||||||
|
|
|
|
|
|
|
|
|
|
|
|||||||||||
29
Table of Contents
QUARTERLY FINANCIAL INFORMATION
| Three months ended | ||||||||||||||||||||||||||||||||
| March 31, | June 30, | September 30, | December 31, | March 31, | June 30, | September 30, | December 31, | |||||||||||||||||||||||||
| 2015 | 2016 | |||||||||||||||||||||||||||||||
| Revenues: |
||||||||||||||||||||||||||||||||
| Licensing and related revenue |
$ | 7,839 | $ | 7,669 | $ | 8,600 | $ | 8,027 | $ | 8,650 | $ | 7,470 | $ | 7,456 | $ | 8,298 | ||||||||||||||||
| Royalties |
5,995 | 5,690 | 7,635 | 8,044 | 7,858 | 9,633 | 10,390 | 12,898 | ||||||||||||||||||||||||
|
|
|
|
|
|
|
|
|
|
|
|
|
|
|
|
|
|||||||||||||||||
| Total revenues |
13,834 | 13,359 | 16,235 | 16,071 | 16,508 | 17,103 | 17,846 | 21,196 | ||||||||||||||||||||||||
|
|
|
|
|
|
|
|
|
|
|
|
|
|
|
|
|
|||||||||||||||||
| Cost of revenues |
1,185 | 1,550 | 1,281 | 1,408 | 1,628 | 1,403 | 1,422 | 1,633 | ||||||||||||||||||||||||
|
|
|
|
|
|
|
|
|
|
|
|
|
|
|
|
|
|||||||||||||||||
| Gross profit |
12,649 | 11,809 | 14,954 | 14,663 | 14,880 | 15,700 | 16,424 | 19,563 | ||||||||||||||||||||||||
|
|
|
|
|
|
|
|
|
|
|
|
|
|
|
|
|
|||||||||||||||||
| Operating expenses: |
||||||||||||||||||||||||||||||||
| Research and development, net |
7,363 | 7,241 | 6,571 | 6,938 | 7,914 | 7,811 | 7,346 | 7,767 | ||||||||||||||||||||||||
| Sales and marketing |
2,426 | 2,548 | 2,384 | 2,810 | 2,845 | 2,855 | 2,763 | 3,077 | ||||||||||||||||||||||||
| General and administrative |
1,972 | 1,666 | 2,183 | 2,363 | 1,990 | 2,078 | 2,218 | 2,281 | ||||||||||||||||||||||||
| Amortization of intangible assets |
325 | 324 | 325 | 324 | 309 | 309 | 309 | 309 | ||||||||||||||||||||||||
|
|
|
|
|
|
|
|
|
|
|
|
|
|
|
|
|
|||||||||||||||||
| Total operating expenses |
12,086 | 11,779 | 11,463 | 12,435 | 13,058 | 13,053 | 12,636 | 13,434 | ||||||||||||||||||||||||
| Operating income |
563 | 30 | 3,491 | 2,228 | 1,822 | 2,647 | 3,788 | 6,129 | ||||||||||||||||||||||||
| Financial income (loss), net |
(27 | ) | 269 | 401 | 426 | 441 | 561 | 615 | 422 | |||||||||||||||||||||||
|
|
|
|
|
|
|
|
|
|
|
|
|
|
|
|
|
|||||||||||||||||
| Income before taxes on income |
536 | 299 | 3,892 | 2,654 | 2,263 | 3,208 | 4,403 | 6,551 | ||||||||||||||||||||||||
| Income taxes |
50 | 131 | 583 | 350 | 463 | 497 | 1,015 | 1,350 | ||||||||||||||||||||||||
|
|
|
|
|
|
|
|
|
|
|
|
|
|
|
|
|
|||||||||||||||||
| Net income |
$ | 486 | $ | 168 | $ | 3,309 | $ | 2,304 | $ | 1,800 | $ | 2,711 | $ | 3,388 | $ | 5,201 | ||||||||||||||||
| Basic net income per share |
$ | 0.02 | $ | 0.01 | $ | 0.16 | $ | 0.11 | $ | 0.09 | $ | 0.13 | $ | 0.16 | $ | 0.24 | ||||||||||||||||
| Diluted net income per share |
$ | 0.02 | $ | 0.01 | $ | 0.16 | $ | 0.11 | $ | 0.09 | $ | 0.13 | $ | 0.15 | $ | 0.24 | ||||||||||||||||
| Weighted average shares used to compute net income per share (in thousands): |
||||||||||||||||||||||||||||||||
| Basic |
20,418 | 20,564 | 20,448 | 20,491 | 20,520 | 20,604 | 21,025 | 21,239 | ||||||||||||||||||||||||
| Diluted |
20,958 | 20,984 | 20,811 | 21,203 | 20,926 | 21,371 | 21,883 | 22,068 | ||||||||||||||||||||||||
30
Table of Contents
| ITEM 7. | MANAGEMENT’S DISCUSSION AND ANALYSIS OF FINANCIAL CONDITION AND RESULTS OF OPERATIONS |
You should read the following discussion together with the consolidated financial statements and related notes appearing elsewhere in this annual report. This discussion contains forward-looking statements that involve risks and uncertainties. Actual results may differ materially from those included in such forward-looking statements. Factors that could cause actual results to differ materially include those set forth under “Risk Factors,” as well as those otherwise discussed in this section and elsewhere in this annual report. See “Forward-Looking Statements and Industry Data.”
BUSINESS OVERVIEW
The following discussion and analysis is intended to provide an investor with a narrative of our financial results and an evaluation of our financial condition and results of operations. The discussion should be read in conjunction with our consolidated financial statements and notes thereto for the year ended December 31, 2016, both appearing elsewhere in this annual report.
Headquartered in Mountain View, California, CEVA is a leading licensor of signal processing IP for a smarter, connected world. We partner with semiconductor companies and OEMs worldwide to create power-efficient, intelligent and connected devices for a range of end markets, including mobile, consumer, automotive, industrial and IoT. Our ultra-low-power IPs for vision, sound, long and short range wireless, include comprehensive DSP-based platforms for LTE/LTE-A/5G baseband processing in handsets, infrastructure and IoT devices, advanced imaging, computer vision and deep learning for any camera-enabled device, as well as sound/voice/audio applications for multiple Internet of Things (IoT) markets. For short range wireless, we offer the industry’s most widely adopted IPs for Bluetooth (low energy and dual mode), Wi-Fi (802.11 b/g/n/ac up to 4x4). We also offer wired interface for storage (SATA and SAS).
Our technologies are licensed to leading semiconductor and original equipment manufacturer (OEM) companies throughout the world. These companies incorporate our IP into application-specific integrated circuits (“ASICs”) and application-specific standard products (“ASSPs”) that they manufacture, market and sell to wireless, consumer, automotive and IoT companies. Our state-of-the-art technology has shipped in more than 8 billion chips to date for a wide range of diverse end markets. One in three handsets sold worldwide is powered by CEVA.
Our DSPs power many leading handset OEMs in the world today, including a tier-one U.S. brand, Coolpad, HTC, Huawei, Intex, Karbonn, Lava, Lenovo, LG, Meizu, Micromax, OPPO, Samsung, Vivo, Xiaomi, ZTE and hundreds of local handset manufacturers in China and India. Based on internal data and Strategy Analytics’ provisional worldwide shipment data, CEVA’s worldwide market share of handset baseband chips that incorporate our technologies was approximately 42% of the worldwide shipment volume in the third quarter of 2016.
In July 2014, we acquired RivieraWaves SAS (“RivieraWaves”), a privately-held, French company and a leading provider of wireless connectivity intellectual property for Wi-Fi and Bluetooth technologies.
We believe the adoption of our signal processing IP cores and software for smart, connected devices continues to progress. Devices for such markets include smartphones, tablets, smart home appliances, wearables, surveillance, connected car, drones, robots and industrial and medical equipment. As a testament to this growing trend, during the fourth quarter of 2016, we concluded fifteen licensing deals, eight of which were for our imaging and vision technologies. These customers will incorporate our technology into smartphones, automotive ADAS, DSLR cameras and surveillance systems.
31
Table of Contents
We believe the following key elements represent significant growth drivers for the company:
| • | CEVA is firmly established in the largest space in the semiconductor industry – baseband for mobile handsets. In particular, our presence in the 3G & LTE smartphone markets continue to grow as our customers targeting those markets are gaining market share at the expense of the incumbents. During the fourth quarter of 2016, we reported the shipment of 83 million LTE chipsets, which equates to 21% market share of the smartphone LTE devices sold worldwide for the third quarter of 2016. Moreover, the total number of LTE smartphones powered by our DSPs in 2016 reached 226 million units, up from 70 million in 2015. The royalty we derive from smartphones is higher on average than that of feature phones, so we are set to benefit as handset markets around the world continue to transition and shift away from feature phones to smartphones, in particular in emerging economies. |
| • | Our specialization and competitive edge in digital signal processor technologies for next generation LTE, 5G and Wi-Fi technologies in base stations, and the inherent low cost and power performance balance of our technologies, put us in a strong position to simultaneously capitalize on mass market adoption of such technologies and address multiple market and product sectors, including small cells, macrocells, routers and machine-to-machine. |
| • | Together with our presence in the handset baseband market, RivieraWaves’ Bluetooth and Wi-Fi IPs allow us to expand further into IoT applications and substantially increase our overall addressable market. Our addressable market size is expected to be 35 billion devices by 2020, per recent data from ABI Research. Already, shipments of products incorporating our Bluetooth IP are sizeable, with more than 47 million CEVA-powered Bluetooth chips reported by our customers for the fourth quarter of 2016, and reaching 138 million units for the full year 2016. |
| • | The market potential for intelligent audio processing required, as voice is becoming the primary user interface for IoT applications, including mobile, automotive and consumer devices, offers an additional growth segment for the company. Our proven track record in audio/voice, with more than 6 billion audio chips shipped to date, puts us in a strong position to power audio roadmaps across this new range of addressable end markets. |
| • | The market potential for machine learning and deep networks for camera-related use cases in automotive, mobile, consumer and IoT applications offers another growth segment for the company. Our CEVA-XM4 intelligent vision processor and our new CEVA-XM6 vision processor and platform for deep learning provide highly compelling offerings for any camera-enabled device such as smartphones, tablets, automotive safety (ADAS), drones, robotics, security and surveillance, augmented reality (AR) and virtual reality (VR), drones, and signage. Per ABI Research, camera shipments are expected to exceed 2.7 billion units by 2018. We have already signed more than 30 licensing agreements for our imaging and vision DSPs across those markets, where our customers can add camera-related enhancements such as smarter autofocus, better picture using super resolution algorithms, and better image capture in low-light environments. Other customers can add video analytics support to enable new services like augmented reality, gesture recognition and advanced safety capabilities in cars. This revolution in vision processing is an opportunity for us to expand our footprint in smartphones and further into tablets, drones, surveillance and automotive applications. |
As a result of our diversification strategy beyond baseband for handsets and our progress in addressing these new markets under the IoT umbrella, we expect significant growth in our unit shipments for non-handset baseband applications over the next few years, up from approximately 210 million royalty-bearing units annually in 2016 to 700 to 900 million units annually by 2018.
Notwithstanding the various growth opportunities we have outlined above, our business operates in a highly competitive and cyclical environment. The maintenance of our competitive position and our future growth are dependent on our ability to adapt to ever-changing technologies, short product life cycles, evolving industry standards, changing customer needs and the trend towards Internet-of-Things, handset baseband, connectivity,
32
Table of Contents
and voice, audio and video convergence in the markets that we operate. Also, our business relies significantly on revenues derived from a limited number of customers. The discontinuation of product lines or market sectors that incorporate our technology by our significant customers or a change in direction of their business and our inability to adapt our technology to their new business needs could have material negative implications for our future royalty revenues. Moreover, competition has historically increased pricing pressures for our products and decreased our average selling prices. Royalty payments under our existing license agreements also could be lower than currently anticipated for a variety of reasons, including decreased royalty rates triggered by larger volume shipments, lower royalty rates negotiated with customers due to competitive pressure or consolidation among our customers. Some of our competitors have reduced their licensing and royalty fees to attract customers and expand their market share. In order to penetrate new markets and maintain our market share with our existing products, we may need to offer our products in the future at lower prices which may result in lower profits. In addition, our future growth is dependent not only on the continued success of our existing products but also the successful introduction of new products, which requires the dedication of resources into research and development which in turn may increase our operating expenses. Furthermore, since our products are incorporated into end products of our OEM and semiconductor customers, our business is very dependent on their ability to achieve market acceptance of their end products in the handset and consumer electronic markets, which are similarly very competitive. In addition, macroeconomic trends may significantly affect our operating results. For example, consolidation among our customers may negatively affect our revenue source, increase our existing customers’ negotiation leverage and make us more dependent on a limited number of customers. Also, since we derive a significant portion of our revenues from the handset baseband market, any negative trends in that market would adversely affect our financial results.
Moreover, the semiconductor and consumer electronics industries remain volatile, which makes it extremely difficult for our customers and us to accurately forecast financial results and plan for future business activities. Our license arrangements have not historically provided for substantial ongoing license payments so revenue recognized from licensing arrangements vary significantly from period to period, depending on the number and size of deals closed during a quarter, and is difficult to predict. Moreover, our royalty revenues are based on the sales of products incorporating the semiconductors or other products of our customers, and as a result we do not have direct access to information that will help us anticipate the timing and amount of future royalties. We have very little visibility into the timetable of product shipments incorporating our technology by our customers. As a result, our past operating results should not be relied upon as an indication of future results.
CRITICAL ACCOUNTING POLICIES, ESTIMATES AND ASSUMPTIONS
Our consolidated financial statements are prepared in accordance with generally accepted accounting principles in the United States (U.S. GAAP). These accounting principles require us to make certain estimates, judgments and assumptions. We believe that the estimates, judgments and assumptions upon which we rely are reasonable based upon information available to us at the time that these estimates, judgments and assumptions are made. These estimates, judgments and assumptions can affect the reported amounts of assets and liabilities as of the date of the financial statements, as well as the reported amounts of revenues and expenses during the periods presented. To the extent there are material differences between these estimates, judgments or assumptions and actual results, our financial statements will be affected. The significant accounting policies that we believe are the most critical to aid in fully understanding and evaluating our reported financial results include the following:
| • | revenue recognition; |
| • | Business combinations and valuation of goodwill and other acquired intangible assets; |
| • | income taxes; |
| • | equity-based compensation; and |
| • | impairment of marketable securities; |
33
Table of Contents
In many cases, the accounting treatment of a particular transaction is specifically dictated by U.S. GAAP and does not require management’s judgment in its application. There are also areas in which management’s judgment in selecting among available alternatives would not produce a materially different result.
Revenue Recognition
Significant management judgments and estimates must be made and used in connection with the recognition of revenue in any accounting period. Material differences in the amount of revenue in any given period may result if these judgments or estimates prove to be incorrect or if management’s estimates change on the basis of development of business or market conditions. Management’s judgments and estimates have been applied consistently and have been reliable historically.
We generate our revenues from (1) licensing intellectual property, which in certain circumstances is modified for customer-specific requirements, (2) royalty revenues and (3) other revenues, which include revenues from support, training and sale of development systems. We license our IP to semiconductor companies throughout the world. These semiconductor companies then manufacture, market and sell custom-designed chipsets to OEMs of a variety of consumer electronics products. We also license our technology directly to OEMs, which are considered end users.
We account for our IP license revenues and related services in accordance with Financial Accounting Standards Board (“FASB”) Accounting Standards Codification (“ASC”) No. 985-605, “Software Revenue Recognition.” Revenues are recognized when persuasive evidence of an arrangement exists and no further obligation exists, delivery has occurred, the license fee is fixed or determinable, and collection is reasonably assured. A license may be perpetual or time limited in its application. Revenue earned on licensing arrangements involving multiple elements are allocated to each element based on the “residual method” when vendor specific objective evidence (“VSOE”) of fair value exists for all undelivered elements and VSOE does not exist for one of the delivered elements. VSOE of fair value of the undelivered elements is determined based on the substantive renewal rate as stated in the agreement.
Extended payment terms in a licensing arrangement may indicate that the license fees are not deemed to be fixed or determinable. If the fee is not fixed or determinable, revenue is recognized as payments become due from the customer unless collection is not considered reasonably assured, then revenue is recognized as payments are collected from the customer, provided all other revenue recognition criteria have been met.
Revenues from license fees that involve significant customization of our IP to customer-specific specifications are recognized in accordance with the principles set out in FASB ASC No. 605-35-25, “Construction-Type and Production-Type Contracts Recognition,” using contract accounting on a percentage of completion method. The amount of revenue recognized is based on the total license fees under the agreement and the percentage of completion achieved. The percentage of completion is measured by the actual time incurred to date on the project compared to the total estimated project requirements, which correspond to the costs related to earned revenues. Provisions for estimated losses on uncompleted contracts are made during the period in which such losses are first determined, in the amount of the estimated loss on the entire contract.
Revenues that are derived from the sale of a licensee’s products that incorporate our IP are classified as royalty revenues. Royalty revenues are recognized during the quarter in which we receive a report from the licensee detailing the shipment of products that incorporate our IP, which receipt is in the quarter following the licensee’s sale of such products to its customers. Royalties are calculated either as a percentage of the revenues received by our licensees on sales of products incorporating our IP or on a per unit basis, as specified in the agreements with the licensees. Non-refundable payments on account of future royalties (prepaid royalties) are included within our licensing and related revenue line on the consolidated statements of operations. We may engage a third party to perform royalty audits of our licensees, and if these audits indicate any over- or under-reported royalties, we account for the results when the audits are resolved.
34
Table of Contents
In addition to license fees, contracts with customers generally contain an agreement to provide for post contract support and training, which consists of telephone or e-mail support, correction of errors (bug fixing) and unspecified updates and upgrades. Fees for post contract support, which takes place after delivery to the customer, are specified in the contract and are generally mandatory for the first year. After the mandatory period, the customer may extend the support agreement on similar terms on an annual basis. We recognize revenue for post contract support on a straight-line basis over the period for which technical support is contractually agreed to be provided to the licensee, typically 12 months. Revenues from training are recognized as the training is performed.
Revenues from the sale of development systems are recognized when title to the product passes to the customer and all other revenue recognition criteria have been met.
We usually do not provide rights of return. When rights of return are included in the license agreements, revenue is deferred until rights of return expire.
Business Combinations and Valuation of Goodwill and Other Acquired Intangible Assets
We allocate the fair value of purchase price consideration to the tangible assets acquired, liabilities assumed and intangible assets acquired based on their estimated fair values. The excess of the fair value of purchase price consideration over the fair values of these identifiable assets and liabilities is recorded as goodwill. Such valuations require management to make significant estimates and assumptions, especially with respect to intangible assets. Significant estimates in valuing certain intangible assets include, but are not limited to, future expected cash flows from acquired customers, acquired technology, and trade names from a market participant perspective, useful lives, and discount rates. Management’s estimates of fair value are based upon assumptions believed to be reasonable, but which are inherently uncertain and unpredictable and, as a result, actual results may differ from estimates.
We review goodwill for impairment at least annually or more frequently if events or changes in circumstances indicate that the carrying value of goodwill may not be recoverable in accordance with ASC 350 “Intangibles—Goodwill and other”. ASC 350 allows an entity to first assess qualitative factors to determine whether it is necessary to perform the two-step quantitative goodwill impairment test. An entity is not required to calculate the fair value of a reporting unit unless the entity determines, based on a qualitative assessment, that it is more likely than not that its fair value is less than its carrying amount. Alternatively, ASC 350 permits an entity to bypass the qualitative assessment and proceed directly to performing the two steps goodwill impairment test. The first step, identifying a potential impairment, compares the fair value of the reporting unit with its carrying amount. If the carrying amount exceeds its fair value, the second step will be performed; otherwise, no further step is required. The second step, measuring the impairment loss, compares the implied fair value of the goodwill with the carrying amount of the goodwill. Any excess of the goodwill carrying amount over the applied fair value is recognized as an impairment loss, and the carrying value of goodwill is written down to fair value. During 2014, 2015 and 2016, no impairment of goodwill was identified.
Acquired finite-lived intangible assets are amortized over their estimated useful lives. We evaluate the recoverability of our intangible assets for possible impairment whenever events or circumstances indicate that the carrying amount of such assets may not be recoverable. Recoverability of these assets is measured by a comparison of the carrying amounts to the future undiscounted cash flows the assets are expected to generate. If such review indicates that the carrying amount of property and equipment and intangible assets is not recoverable, the carrying amount of such assets is reduced to fair value. We have not recorded any such impairment charge during the years presented.
In addition to the recoverability assessment, we routinely review the remaining estimated useful lives of our finite-lived intangible assets. If we reduce the estimated useful life assumption for any asset, the remaining unamortized balance would be amortized over the revised estimated useful life.
35
Table of Contents
Income Taxes
We are subject to income taxes mainly in Israel, France, the U.S. and Ireland. Significant judgment is required in evaluating our uncertain tax positions and determining our provision for income taxes. We recognize income taxes under the liability method. Tax benefits are recognized from uncertain tax positions only if we believe that it is more likely than not that the tax position will be sustained on examination by the taxing authorities based on the technical merits of the position. Although we believe we have adequately reserved for our uncertain tax positions, no assurance can be given that the final tax outcome of these matters will not be different. We adjust these reserves when facts and circumstances change, such as the closing of a tax audit, the refinement of an estimate or changes in tax laws. To the extent that the final tax outcome of these matters is different than the amounts recorded, such differences will impact the provision for income taxes in the period in which such determination is made. The provision for income taxes includes the effects of any reserves that are considered appropriate, as well as the related net interest and penalties.
We recognize deferred tax assets and liabilities for future tax consequences arising from differences between the carrying amounts of existing assets and liabilities under GAAP and their respective tax bases, and for net operating loss carryforwards and tax credit carryforwards. We regularly review our deferred tax assets for recoverability and establish a valuation allowance if it is more likely than not that some portion or all of the deferred tax assets will not be realized. To make this judgment, we must make predictions of the amount and category of taxable income from various sources and weigh all available positive and negative evidence about these possible sources of taxable income.
Accounting for tax positions requires judgments, including estimating reserves for potential uncertainties. We also assess our ability to utilize tax attributes, including those in the form of carry forwards for which the benefits have already been reflected in the financial statements. While we believe the resulting tax balances as of December 31, 2015 and 2016 are appropriately accounted for, the ultimate outcome of such matters could result in favorable or unfavorable adjustments to our consolidated financial statements and such adjustments could be material. See Note 13 to our Consolidated Financial Statements for the year ended December 31, 2016 for further information regarding income taxes. We have filed or are in the process of filing local and foreign tax returns that are subject to audit by the respective tax authorities. The amount of income tax we pay is subject to ongoing audits by the tax authorities, which often result in proposed assessments. We believe that we adequately provided for any reasonably foreseeable outcomes related to tax audits and settlement. However, our future results may include favorable or unfavorable adjustments to our estimated tax liabilities in the period the assessments are made or resolved, audits are closed or when statute of limitations on potential assessments expire.
Equity-Based Compensation
We account for equity-based compensation in accordance with FASB ASC No. 718, “Stock Compensation” which requires the recognition of compensation expenses based on estimated fair values for all equity-based awards made to employees and non-employee directors.
We estimate the fair value of options and stock appreciation right (“SAR”) awards on the date of grant using an option-pricing model. The value of the portion of an award that is ultimately expected to vest is recognized as an expense over the requisite service period in our consolidated statement of operations. We recognize compensation expenses for the value of our options and SARs, which have graded vesting based on the accelerated attribution method over the requisite service period of each of the awards, net of estimated forfeitures. Estimated forfeitures are based on actual historical pre-vesting forfeitures and the rate is adjusted to reflect changes in facts and circumstances, if any. Estimated forfeiture rate will be revised if actual forfeitures differ from the initial estimates.
We recognize compensation expenses for the value of our restricted stock unit (“RSU”) awards, based on the straight-line method over the requisite service period of each of the awards, net of estimated forfeitures. The fair value of each RSU is the market value as determined by the closing price of the common stock on the day of grant.
36
Table of Contents
We use the Monte-Carlo simulation model for options and SARs granted. Expected volatility was calculated based upon actual historical stock price movements over the most recent periods ending on the grant date, equal to the expected option and SAR term. We have historically not paid dividends and have no foreseeable plans to pay dividends. The risk-free interest rate is based on the yield from U.S. Treasury zero-coupon bonds with an equivalent term. The Monte-Carlo model also considers the suboptimal exercise multiple which is based on the average exercise behavior of our employees over the past years, the contractual term of the options and SARs, and the probability of termination or retirement of the holder of the options and SARs in computing the value of the options and SARs. Although our management believes that their estimates and judgments about equity-based compensation expense are reasonable, actual results and future changes in estimates may differ substantially from our current estimates.
Impairment of Marketable Securities
Marketable securities consist mainly of corporate bonds. We determine the appropriate classification of marketable securities at the time of purchase and re-evaluate such designation at each balance sheet date. In accordance with FASB ASC No. 320, “Investment Debt and Equity Securities,” we classify marketable securities as available-for-sale. Available-for-sale securities are stated at fair value, with unrealized gains and losses reported in accumulated other comprehensive income (loss), a separate component of stockholders’ equity, net of taxes. Realized gains and losses on sales of marketable securities, as determined on a specific identification basis, are included in financial income, net. The amortized cost of marketable securities is adjusted for amortization of premium and accretion of discount to maturity, both of which, together with interest, are included in financial income, net. We have classified all marketable securities as short-term, even though the stated maturity date may be one year or more beyond the current balance sheet date, because it is probable that we will sell these securities prior to maturity to meet liquidity needs or as part of risk versus reward objectives.
We recognize an impairment charge when a decline in the fair value of our investments in debt securities below the cost basis of such securities is judged to be other-than-temporary. The determination of credit losses requires significant judgment and actual results may be materially different from our estimates. Factors considered in making such a determination include the duration and severity of the impairment, the reason for the decline in value, the ability of the issuer to meet payment obligations and the potential recovery period . For securities that are deemed other-than-temporarily impaired, the amount of impairment is recognized in the statement of income and is limited to the amount related to credit losses, while impairment related to other factors is recognized in other comprehensive income (loss).
During the years ended December 31, 2014, 2015 and 2016, no other-than temporary impairment were recorded related to our marketable securities.
Recently Issued and Adopted Accounting Pronouncement
(a) Revenue recognition
In May 2014, the Financial Accounting Standards Board (“FASB”) issued a new standard related to revenue recognition. Under the new standard, revenue is recognized when a customer obtains control of promised goods or services and is recognized in an amount that reflects the consideration which the entity expects to receive in exchange for those goods or services. In addition, the standard requires disclosure of the nature, amount, timing, and uncertainty of revenue and cash flows arising from contracts with customers. The FASB has recently issued several amendments to the standard, including clarification on identifying performance obligations.
The guidance permits two methods of modification: retrospectively to each prior reporting period presented (full retrospective method), or retrospectively with the cumulative effect of initially applying the guidance recognized at the date of initial application (the cumulative catch-up transition method). We currently anticipate adopting the standard using the modified retrospective method rather than full retrospective method.
37
Table of Contents
The new standard will be effective for us beginning January 1, 2018, but adoption as of the original effective date of January 1, 2017 is permitted. We will adopt the new standard as of January 1, 2018.
We have made progress toward completing our evaluation of the potential changes from adopting this new standard on our financial reporting and disclosures. We have evaluated the impact of the standard on majority of our revenue streams and associated contracts. We expect to complete the contract evaluations and validate the results during the first half of 2017. We formed an implementation work group and expect to complete the evaluation of the impact of the accounting and disclosure changes on our business processes, controls and systems throughout 2017, design any changes to such business processes, controls and systems, and implement the changes before the end of 2017.
Under the new standard, an entity recognizes revenue when or as it satisfies a performance obligation by transferring IP license or services to the customer, either at a point in time or over time. We expect to continue to recognize most of our revenue at a point in time upon delivery of our products. We expect to recognize revenue over time on significant license customization contracts that are covered by contract accounting standards using cost inputs to measure progress toward completion of our performance obligations, which is similar to the current method.
Based on our current analysis the most significant effect, if any, will be related to certain deliverables that may be considered as a distinct performance obligations separate from other performance obligations and will be measured using the relative standalone selling price basis.
In addition, incremental costs that are related to sales from contracts signed during the period would require capitalization. We also will consider if there is a significant financing component if the time between payment and performance is more than one year.
We continue to assess all potential impacts under the new revenues standard.
(b) Other accounting standards
In February 2016, the FASB issued ASU 2016-02, “Leases (Topic 842),” which will replace the existing guidance in ASC 840, “Leases.” The updated standard aims to increase transparency and comparability among organizations by requiring lessees to recognize lease assets and lease liabilities on the balance sheet and requiring disclosure of key information about leasing arrangements. This ASU is effective for annual periods beginning after December 15, 2018, and interim periods within those annual periods; early adoption is permitted and modified retrospective application is required. We are in the process of evaluating this guidance to determine the impact it will have on our financial statements and related disclosures.
In March 2016, the FASB issued ASU 2016-09, “Compensation-Stock Compensation,” which simplifies several aspects of the accounting for share-based payments, including immediate recognition of all excess tax benefits and deficiencies in the income statement, changing the threshold to qualify for equity classification up to the employees’ maximum statutory tax rates, allowing an entity-wide accounting policy election to either estimate the number of awards that are expected to vest or account for forfeitures as they occur, and clarifying the classification on the statement of cash flows for the excess tax benefit and employee taxes paid when an employer withholds shares for tax-withholding purposes. The amendments in this update became effective on January 1, 2017. Our adoption of ASU 2016-09 will not have a material impact on our consolidated financial statements.
The FASB issued ASU 2016-13 “Measurement of Credit Losses on Financial Instruments” requiring an allowance to be recorded for all expected credit losses for financial assets. The allowance for credit losses is based on historical information, current conditions and reasonable and supportable forecasts. The new standard
38
Table of Contents
also makes revisions to the other than temporary impairment model for available-for-sale debt securities. Disclosures of credit quality indicators in relation to the amortized cost of financing receivables are further disaggregated by year of origination. The new accounting guidance is effective for interim and annual periods beginning after December 15, 2019 with early adoption permitted for interim and annual periods beginning after December 15, 2018. The amendments will be applied through a cumulative-effect adjustment to retained earnings as of the beginning of the first reporting period in which the guidance is effective. We are analyzing the impact of this new standard and, at this time, cannot estimate the impact of adoption on our net income. We plan to adopt ASU 2016-13 effective January 1, 2020.
In August 2016, FASB issued ASU 2016-15, “Statement of Cash Flows (Topic 230): Classification of Certain Cash Receipts and Cash Payments.” This update will make eight targeted changes to how cash receipts and cash payments are presented and classified in the statement of cash flows. The update is effective for fiscal years beginning after December 15, 2017. The new standard will require adoption on a retrospective basis unless it is impracticable to apply, in which case it would be required to apply the amendments prospectively as of the earliest date practicable. We are currently evaluating the effect of this update on our consolidated financial statements and related disclosures.
In January 2017, the FASB issued ASU No. 2017-04, Intangibles: Goodwill and Other: Simplifying the Test for Goodwill Impairment. To simplify the subsequent measurement of goodwill, the amendments eliminate Step 2 from the goodwill impairment test. The annual, or interim, goodwill impairment test is performed by comparing the fair value of a reporting unit with its carrying amount. An impairment charge should be recognized for the amount by which the carrying amount exceeds the reporting unit’s fair value; however, the loss recognized should not exceed the total amount of goodwill allocated to that reporting unit. In addition, the income tax effects of tax deductible goodwill on the carrying amount of the reporting unit should be considered when measuring the goodwill impairment loss, if applicable. The amendments also eliminate the requirements for any reporting unit with a zero or negative carrying amount to perform Step 2 of the goodwill impairment test. An entity still has the option to perform the qualitative assessment for a reporting unit to determine if the qualitative impairment test is necessary. The amendments should be applied on a prospective basis. The nature of and reason for the change in accounting principle should be disclosed upon transition. The amendments in this update should be adopted for annual or any interim goodwill impairment tests in fiscal years beginning after December 15, 2019. Early adoption is permitted on testing dates after January 1, 2017. We are currently evaluating the impact of adopting this new guidance on our consolidated financial statements, but it is not expected to have a material impact.
In January 2017, the FASB issued ASU No. 2017-01, Business Combinations (Topic 805): Clarifying the Definition of a Business. The amendments in this update provide a more robust framework to use in determining when a set of assets and activities is a business. Because the current definition of a business is interpreted broadly and can be difficult to apply, stakeholders indicated that analyzing transactions is inefficient and costly and that the definition does not permit the use of reasonable judgment. The amendments provide more consistency in applying the guidance, reduce the costs of application, and make the definition of a business more operable. The amendments in this update become effective for annual periods and interim periods within those annual periods beginning after December 15, 2017. We are currently evaluating the impact of adopting this new guidance on our consolidated financial statements, but it is not expected to have a material impact.
In 2016, we adopted ASU 2014-15, Disclosure of Uncertainties about an Entity’s Ability to Continue as a Going Concern (ASU 2014-15), that provides guidance on management’s responsibility in evaluating whether there is substantial doubt about a company’s ability to continue as a going concern and to provide related footnote disclosures. The adoption of ASU 2014-15 did not have an impact on our consolidated financial statements or related disclosures.
39
Table of Contents
RESULTS OF OPERATIONS
The following table presents line items from our consolidated statements of income as percentages of our total revenues for the periods indicated:
| 2014 | 2015 | 2016 | ||||||||||
| Consolidated Statements of Income Data: |
||||||||||||
| Revenues: |
||||||||||||
| Licensing and related revenue |
55.8 | % | 54.0 | % | 43.9 | % | ||||||
| Royalties |
44.2 | % | 46.0 | % | 56.1 | % | ||||||
|
|
|
|
|
|
|
|||||||
| Total revenues |
100.0 | % | 100.0 | % | 100.0 | % | ||||||
|
|
|
|
|
|
|
|||||||
| Cost of revenues |
9.8 | % | 9.1 | % | 8.4 | % | ||||||
| Gross profit |
90.2 | % | 90.9 | % | 91.6 | % | ||||||
| Operating expenses: |
||||||||||||
| Research and development, net |
50.8 | % | 47.2 | % | 42.4 | % | ||||||
| Sales and marketing |
19.3 | % | 17.1 | % | 15.9 | % | ||||||
| General and administrative |
15.9 | % | 13.8 | % | 11.8 | % | ||||||
| Amortization of intangible assets |
1.3 | % | 2.2 | % | 1.7 | % | ||||||
|
|
|
|
|
|
|
|||||||
| Total operating expenses |
87.3 | % | 80.3 | % | 71.8 | % | ||||||
|
|
|
|
|
|
|
|||||||
| Operating income |
2.9 | % | 10.6 | % | 19.8 | % | ||||||
| Financial income, net |
1.9 | % | 1.8 | % | 2.8 | % | ||||||
| Other loss |
(0.8 | )% | — | — | ||||||||
|
|
|
|
|
|
|
|||||||
| Income before taxes on income |
4.0 | % | 12.4 | % | 22.6 | % | ||||||
| Income taxes |
5.6 | % | 1.9 | % | 4.6 | % | ||||||
|
|
|
|
|
|
|
|||||||
| Net income (loss) |
(1.6 | )% | 10.5 | % | 18.0 | % | ||||||
|
|
|
|
|
|
|
|||||||
Discussion and Analysis
Below we provide information on the significant line items in our consolidated statements of income for each of the past three fiscal years, including the percentage changes year-on-year, as well as an analysis of the principal drivers of change in these line items from year-to-year.
Revenues
Total Revenues
| 2014 | 2015 | 2016 | ||||||||||
| Total revenues (in millions) |
$ | 50.8 | $ | 59.5 | $ | 72.7 | ||||||
| Change year-on-year |
— | 17.1 | % | 22.1 | % | |||||||
We derive a significant amount of revenues from a limited number of customers. Sales to Spreadtrum represented 27%, 31% and 25% of our total revenues for 2016, 2015 and 2014, respectively. Generally, the identity of our other customers representing 10% or more of our total revenues varies from period to period, especially with respect to our licensing customers as we generate licensing revenues generally from new customers on a quarterly basis. With respect to our royalty revenues, two royalty paying customers each represented 10% or more of our total royalty revenues for 2016, and collectively represented 80% of our total royalty revenues for 2016; two royalty paying customers each represented 10% or more of our total royalty revenues for 2015, and collectively represented 72% of our total royalty revenues for 2015; and three royalty paying customers each representing 10% or more of our total royalty revenues for 2014, and collectively represented 79% of our total royalty revenues for 2014. We expect that a significant portion of our future
40
Table of Contents
revenues will continue to be generated by a limited number of customers. The concentration of our customers is explainable in part by consolidation in the semiconductor industry. The loss of any significant customer could adversely affect our near-term future operating results.
The following table sets forth the products and services as percentages of our total revenues in each of the periods set forth below:
| Year ended December 31, | ||||||||||||
| 2014 | 2015 | 2016 | ||||||||||
| DSP products (DSP cores and platforms): |
||||||||||||
| Baseband for handset and other devices |
72 | % | 68 | % | 69 | % | ||||||
| Other non-baseband (audio, imaging and vision) |
15 | % | 14 | % | 15 | % | ||||||
| Connectivity products (Bluetooth, WiFi and SATA/SAS) |
13 | % | 18 | % | 16 | % | ||||||
We expect to continue to generate a significant portion of our revenues for 2017 from the above products and services.
Licensing and related revenue
| 2014 | 2015 | 2016 | ||||||||||
| Licensing and related revenue (in millions) |
$ | 28.3 | $ | 32.1 | $ | 31.9 | ||||||
| Change year-on-year |
— | 13.4 | % | (0.8 | )% | |||||||
The slight decrease in licensing and related revenues from 2015 to 2016 is explained by lower revenues from the handset baseband markets, partially offset by positive licensing demand and a continuation of an increase in a number of deals for our connectivity IPs, in particular Bluetooth IPs, and our vision-related products. The increase in licensing and related revenues from 2014 to 2015 principally reflected higher revenues from our connectivity IP products, mainly from Bluetooth IP, due to our acquisition of RivieraWaves, and from higher revenues of our imaging and vision DSP cores and platforms, partially offset by lower revenues from our non- handset baseband DSP cores and platforms.
Our higher licensing and related revenue in 2016 and 2015 illustrate that we have successfully transformed CEVA into a vertically integrated, one-stop IP house for wireless broadband and IoT-related technologies. Our unique portfolio of LTE-Advanced and 5G baseband, Bluetooth, Wi-Fi, imaging, vision and voice platforms continue to set new milestones in innovation and customer traction. In 2016, we concluded a record 49 licensing agreements (45 of which were for non-handset baseband and 17 were with first-time customers), compared to 47 and 36 in 2015 and 2014, respectively.
Our technologies are now designed in by leading semiconductor companies and OEMs in their base stations, smartphone application processors, imaging chips, drones, surveillance systems, audio chips, as well as automotive, smart grid, Wi-Fi, satellite communication, connectivity, GPS devices and connectivity for Internet-of-Things.
Licensing and related revenue accounted for 43.9% of our total revenues for 2016, compared with 54.0% and 55.8% of our total revenues for 2015 and 2014, respectively.
Royalty Revenues
| 2014 | 2015 | 2016 | ||||||||||
| Royalty revenues (in millions) |
$ | 22.5 | $ | 27.4 | $ | 40.8 | ||||||
| Change year-on-year |
— | 21.8 | % | 49.0 | % | |||||||
41
Table of Contents
We generate royalty revenues from our customers who ship units of chips incorporating our technologies. The royalties are invoiced and recognized on a quarterly basis in arrears as we receive quarterly shipment reports from our licensees. The royalty rate is based either on a certain percent of the chipset price or a fixed amount per chipset based on volume discounts.
Based on internal data and Strategy Analytics’ provisional worldwide shipment data, CEVA’s worldwide market share of baseband chips that incorporate our technologies represented approximately 36%, 30% and 34% of the worldwide baseband volume in 2016, 2015 and 2014, respectively, and accounted for approximately 91%, 88% and 86% of our total royalty revenues for 2016, 2015 and 2014, respectively.
The increase in royalty revenues from 2015 to 2016 mainly reflected an exceptional royalty revenue growth from CEVA-powered smartphones in general and LTE shipments in particular. The growth of LTE baseband shipments powered by our DSPs has accelerated noticeably both in high tier premium phones as well as lower cost LTE smartphones, reaching 83 million devices reported for the fourth quarter of 2016 and overall 226 million for 2016, up from 70 million in 2015. The increase in royalty revenues from 2014 to 2015 mainly reflected first time acceleration of CEVA-powered LTE smartphone shipments in the second half of the year, which enabled us to reach a record 70 million LTE units for the year. The five largest royalty-paying customers accounted for 92% of our total royalty revenues for 2016, compared to 87% of our total royalty revenues for both 2015 and 2014.
Our customers reported sales of 1,076 million chipsets incorporating our technologies in 2016, compared to 917 million in 2015 and 881 million in 2014. The increase in units shipped in 2016 as compared to 2015 is attributable to a significant increase in smartphone baseband chip shipments, including LTE baseband chips (which also bear higher average selling prices than feature phone baseband products), partially offset by lower feature phone baseband chip shipments. The increase in units shipped in 2015 as compared to 2014 primarily resulted from ramp up of both CEVA-powered LTE smartphones and Bluetooth products, offset by lower feature phone products.
Geographic Revenue Analysis
| 2014 |
2015 |
2016 |
||||||||||||||||||||||
| (in millions, except percentages) | ||||||||||||||||||||||||
| United States |
$ | 11.7 | 23.0 | % | $ | 9.7 | 16.4 | % | $ | 9.2 | 12.6 | % | ||||||||||||
| Europe, Middle East (EME) |
$ | 5.6 | 11.1 | % | $ | 7.1 | 11.9 | % | $ | 10.9 | 15.0 | % | ||||||||||||
| Asia Pacific (APAC) (1) (2) |
$ | 33.5 | 65.9 | % | $ | 42.7 | 71.7 | % | $ | 52.6 | 72.4 | % | ||||||||||||
| (1) China |
$ | 20.6 | 40.5 | % | $ | 30.0 | 50.4 | % | $ | 30.0 | 41.3 | % | ||||||||||||
| (2) S. Korea |
* | ) | * | ) | $ | 6.2 | 10.4 | % | $ | 15.5 | 21.4 | % | ||||||||||||
| *) | Less than 10% |
Due to the nature of our license agreements and the associated potential large individual contract amounts, the geographic spilt of revenues both in absolute dollars and percentage terms generally varies from period to period.
The decrease in revenues in absolute dollars and percentage terms in the United States from 2015 to 2016 reflected lower licensing and royalty revenues mainly due to less design starts and production ramp ups. The decrease in revenues in absolute dollars and percentage terms in the United States from 2014 to 2015 reflected lower royalty revenues mainly from Broadcom after it elected to shut down its wireless handset chip business.
The increase in revenues in absolute dollars and percentage in the EME region from 2015 to 2016 primarily reflected higher licensing activities for base station applications and connectivity products as well higher royalty
42
Table of Contents
revenues. The increase in revenues in absolute dollars and percentage in the EME region from 2014 to 2015 primarily reflected higher licensing activities for connectivity products, partially offset by lower royalty revenues mainly due to key customers that decided to exit or refocus their efforts in the baseband market, like STMicroelectronics and Intel.
The increase in revenues in absolute dollars and percentage terms in the APAC region from both 2015 to 2016 and 2014 to 2015 primarily reflected higher royalty revenues from production ramp up and market share gains of our customers.
Cost of Revenues
| 2014 | 2015 | 2016 | ||||||||||
| Cost of revenues (in millions) |
$ | 5.0 | $ | 5.4 | $ | 6.1 | ||||||
| Change year-on-year |
— | 8.5 | % | 12.2 | % | |||||||
Cost of revenues accounted for 8.4% of our total revenues for 2016, compared to 9.1% of our total revenues for 2015 and 9.8% of our total revenues for 2014. The absolute dollar increase in cost of revenues for 2016 as compared to 2015 principally reflected higher customization work for our licensees. The absolute dollar increase in cost of revenues for 2015 as compared to 2014 principally reflected higher salary and related costs and higher payments to the Israeli Innovation Authority of the Ministry of Economy and Industry in Israel (previously known as Office of the Chief Scientist of Israel) (the “IIA”).
Cost of revenues includes labor-related costs and, where applicable, costs related to overhead, subcontractors, materials, travel, royalty expenses payments to the IIA and non-cash equity-based compensation expenses. Non-cash equity-based compensation expenses included in cost of revenues for the years 2016, 2015 and 2014 were $246,000, $155,000 and $193,000, respectively. Royalty expenses relate to royalties payable to the IIA that amount to 3%-3.5% of the actual sales of certain of our products, the development of which previously included grants from the IIA. The obligation to pay these royalties is contingent on actual sales of these products.
Operating Expenses
| 2014 | 2015 | 2016 | ||||||||||
| (in millions) |
||||||||||||
| Research and development, net |
$ | 25.8 | $ | 28.1 | $ | 30.8 | ||||||
| Sales and marketing |
$ | 9.8 | $ | 10.2 | $ | 11.5 | ||||||
| General and administration |
$ | 8.1 | $ | 8.2 | $ | 8.6 | ||||||
| Amortization of intangible assets |
$ | 0.6 | $ | 1.3 | $ | 1.2 | ||||||
|
|
|
|
|
|
|
|||||||
| Total operating expenses |
$ | 44.3 | $ | 47.8 | $ | 52.1 | ||||||
| Change year-on-year |
— | 7.7 | % | 9.2 | % | |||||||
The increase in total operating expenses for 2016 as compared to 2015 principally reflected higher salary and related costs mainly due to higher headcount, higher project-related expenses and higher non-cash equity-based compensation expenses, partially offset by higher research grants received from the IIA. The increase in total operating expenses for 2015 as compared to 2014 principally reflected: (1) higher salary and related costs, which mainly included salary and related costs associated with the RivieraWaves employees as a result of our acquisition in July 2014; (2) higher project-related expenses; and (3) amortization charges for intangible assets acquired from RivieraWaves, partially offset by French research tax benefits applicable to Crédit Impôt Recherche (“CIR”) and lower non-cash equity-based compensation expenses.
43
Table of Contents
Research and Development Expenses, Net
| 2014 | 2015 | 2016 | ||||||||||
| Research and development expenses, net (in millions) |
$ | 25.8 | $ | 28.1 | $ | 30.8 | ||||||
| Change year-on-year |
— | 8.8 | % | 9.7 | % | |||||||
The net increase in research and development expenses for 2016 as compared to 2015 principally reflected higher salary and related costs mainly due to higher headcount, higher project-related expenses and higher non-cash equity-based compensation expenses, partially offset by higher research grants received from the IIA. The net increase in research and development expenses for 2015 as compared to 2014 principally reflected: (1) higher salary and related costs, which mainly included: (i) higher number of research and development personnel; (ii) salary and related costs associated with the RivieraWaves employees as a result of our acquisition in July 2014; and (iii) salary raises and higher employee compensation accruals, partially offset by lower currency exchange expenses as a result of the devaluation of the Israeli NIS against the U.S. dollar, and (2) higher project-related expenses, partially offset by higher research tax benefits applicable to CIR and higher research grants received from the IIA. The average number of research and development personnel in 2016 was 194, compared to 182 in 2015 and 155 in 2014. The number of research and development personnel was 199 at December 31, 2016 as compared with 184 at year-end 2015 and 174 at year-end 2014.
Research and development expenses, net of related government grants and CIR, were 42.4% of our total revenues for 2016, as compared with 47.2% for 2015 and 50.8% for 2014. We recorded research grants under funding programs of $6,410,000 in 2016, compared with $4,997,000 in 2015 and $4,586,000 in 2014. We recorded CIR benefits of $1,485,000, $1,414,000 and $675,000 in 2016, 2015 and 2014, respectively.
Research and development expenses consist primarily of salaries and associated costs, facilities expenses associated with research and development activities, project-related expenses connected with the development of our intellectual property which are expensed as incurred, and non-cash equity-based compensation expenses. Non-cash equity-based compensation expenses included in research and development expenses, net for the years 2016, 2015 and 2014 were $2,860,000, $1,838,000and $2,027,000, respectively. Research and development expenses are net of related government research grants and research tax benefits applicable to CIR. We view research and development as a principal strategic investment and have continued our commitment to invest heavily in this area, which represents the largest of our ongoing operating expenses. We will need to continue to invest in research and development and such expenses may increase in the future to keep pace with new trends in our industry.
Sales and Marketing Expenses
| 2014 | 2015 | 2016 | ||||||||||
| Sales and marketing expenses (in millions) |
$ | 9.8 | $ | 10.2 | $ | 11.5 | ||||||
| Change year-on-year |
— | 3.6 | % | 13.5 | % | |||||||
The increase in sales and marketing expenses for 2016 as compared to 2015 principally reflected higher salary and related costs, higher commission costs, higher travel costs and higher non-cash equity-based compensation expenses. The increase in sales and marketing expenses for 2015 as compared to 2014 principally reflected higher salary and related costs, partially due to additional number of personnel, higher commission expenses and higher marketing and trade shows activities, offset by lower non-cash equity-based compensation expenses.
Sales and marketing expenses as a percentage of our total revenues were 15.9% for 2016, as compared with 17.1% for 2015 and 19.3% for 2014. The total number of sales and marketing personnel was 35 at year-end 2016, as compared with 34 at year-end of 2015 and 29 at year-end of 2014. Sales and marketing expenses consist
44
Table of Contents
primarily of salaries, commissions, travel and other costs associated with sales and marketing activities, as well as advertising, trade show participation, public relations and other marketing costs and non-cash equity-based compensation expenses. Non-cash equity-based compensation expenses included in sales and marketing expenses for the years 2016, 2015 and 2014 were $922,000, $568,000 and $909,000, respectively.
General and Administrative Expenses
| 2014 | 2015 | 2016 | ||||||||||
| General and administrative expenses (in millions) |
$ | 8.1 | $ | 8.2 | $ | 8.6 | ||||||
| Change year-on-year |
— | 1.6 | % | 4.7 | % | |||||||
The increase in general and administrative expenses for 2016 as compared to 2015 principally reflected higher non-cash equity-based compensation expenses, partially offset by lower professional services costs. The increase in general and administrative expenses for 2015 as compared to 2014 principally reflected higher salary and related costs, partially offset by lower non-cash equity-based compensation expenses.
General and administrative expenses as a percentage of our total revenues were 11.8% for 2016, as compared with 13.8% for 2015 and 15.9% for 2014. The total number of general and administrative personnel was 23 at year-end 2016, as compared with 23 at year-end of 2015 and 21 at year-end of 2014. General and administrative expenses consist primarily of fees for directors, salaries for management and administrative employees, accounting and legal fees, expenses related to investor relations and facilities expenses associated with general and administrative activities and non-cash equity-based compensation expenses. Non-cash equity-based compensation expenses included in general and administrative expenses for the years 2016, 2015 and 2014 were $2,208,000, $1,454,000and $1,882,000, respectively.
Amortization of Intangible Assets
Our amortization charges were $1.2 million, $1.3 million and $0.6 million for 2016, 2015 and 2014, respectively. The charges were incurred in connection with the amortization of intangible assets associated with the acquisition of RivieraWaves in July 2014. As of December 31, 2016, the net amount of intangible assets was $3.0 million.
Financial Income, net
| 2014 | 2015 | 2016 | ||||||||||
| (in millions) |
||||||||||||
| Financial income, net |
$ | 0.97 | $ | 1.07 | $ | 2.04 | ||||||
| of which: |
||||||||||||
| Interest income and gains and losses from marketable securities, net |
$ | 1.71 | $ | 1.66 | $ | 2.23 | ||||||
| Foreign exchange loss |
$ | (0.57 | ) | $ | (0.49 | ) | $ | (0.19 | ) | |||
| Accretion of Contingent Consideration |
$ | (0.17 | ) | $ | (0.10 | ) | — | |||||
Financial income, net, consists of interest earned on investments, gains and losses from sale of marketable securities, accretion (amortization) of discount (premium) on marketable securities, foreign exchange movements and changes in fair value related to Contingent Consideration as part of the acquisition of RivieraWaves.
The increase in interest income and gains and losses from marketable securities, net, for 2016 as compared to 2015 reflected higher combined cash, bank deposits and marketable securities balances held and higher yields. The slight decrease in interest income and gains and losses from marketable securities, net, for 2015 as compared to 2014 reflected lower combined cash, bank deposits and marketable securities balances held, offset by higher yields.
45
Table of Contents
We review our monthly expected major non-U.S. dollar denominated expenditures and look to hold equivalent non-U.S. dollar cash balances to mitigate currency fluctuations. However, our EURO cash balances increased significantly beyond our ordinary course EURO business liabilities as a result of the acquisition of RivieraWaves in July 2014 because we acquired cash balances of RivieraWaves on hand at the time of the closing of the transaction. This has resulted in an increase in foreign exchange loss during both 2015 and 2014 due to the devaluation of our EURO cash balances as the U.S. dollar strengthened significantly during those periods as compared to the EURO.
Other Loss
In 2014, we received an initial consideration of 773,563 EURO ($1,032,351) when Antcor Advanced Network Technologies S.A. (“Antcor”), a company in which we had a minority investment, was acquired. In 2015, we received 98,700 EURO (approximately $111,000), which amount was held by the buyer to secure Antcor’s indemnification claims. Pursuant to the acquisition agreement, we may receive additional proceeds from the buyer within five years after closing of the acquisition based on achievement of certain performance and other milestones by Antcor. During the year ended December 31, 2014, we recorded a capital loss of $0.4 million from the sale of our investment in Antcor as a result of the acquisition.
Provision for Income Taxes
During the years 2016, 2015 and 2014, we recorded tax expenses of $3.3 million, $1.1 million and $2.9 million, respectively. The increase in provision for income taxes in 2016 as compared to 2015 principally reflected: (1) higher income before taxes on income; (2) tax expenses relating to an uncertain tax position for prior years; and (3) a one-time write off of a deferred tax liabilities in 2015 related to the RivieraWaves acquisition. The decrease in provision for income taxes in 2015 as compared to 2014 principally reflected a one-time write off of a deferred tax asset in 2014 due to a change in the estimation for taxable income for future years of our U.S operations, partially offset by: (i) higher income before taxes on income, and (ii) tax benefits in 2014 resulting from the expiration of statute of limitations in a certain foreign tax jurisdiction. We have significant operations in Israel and operations in France and the Republic of Ireland. A substantial portion of our taxable income is generated in Israel. Currently, our Israeli and Irish subsidiaries are taxed at rates substantially lower than U.S. tax rates.
Our Irish subsidiary qualified for a 12.5% tax rate on its trade. Interest income generated by our Irish subsidiary is taxed at a rate of 25%. Our French subsidiary qualified for a 33.33% tax rate on its profits.
Our Israeli subsidiary is entitled to various tax benefits by virtue of the “Approved Enterprise” and/or “Benefited Enterprise” status granted to its eight investment programs, as defined by the Israeli Investment Law. In accordance with the Investment Law, our Israeli subsidiary’s first six investment programs were subject to corporate tax rate of 25% in 2016, and our Israeli subsidiary’s seventh and eighth investment programs were subject to corporate tax rate of 10% in 2016. However, our Israeli subsidiary received an approval for the erosion of tax basis with respect to its second, third, fourth, fifth and sixth investment programs, and this resulted in an increase in the taxable income attributable to the seventh and eighth investment programs, which were subject to a reduced tax rate of 10% in 2016. The tax benefits under our Israeli subsidiary’s active investment programs are scheduled to gradually expire starting in 2017.
To maintain our Israeli subsidiary’s eligibility for the above tax benefits, it must continue to meet certain conditions under the Investment Law. Should our Israeli subsidiary fail to meet such conditions in the future, these benefits would be cancelled and it would be subject to corporate tax in Israel at the standard corporate rate and could be required to refund tax benefits already received, with interest and adjustments for inflation based on the Israeli consumer price index.
For more information about our provision for income taxes, see Note 13 to the attached Notes to Consolidated Financial Statement for the year ended December 31, 2016.
46
Table of Contents
LIQUIDITY AND CAPITAL RESOURCES
As of December 31, 2016, we had approximately $18.4 million in cash and cash equivalents, $46.2 million in short term bank deposits, $61.9 million in marketable securities, and $30.0 million in long term bank deposits, totaling $156.5 million, as compared to $139.3 million at December 31, 2015. The increase in 2016 as compared to 2015 principally reflected cash provided by operating activities and cash proceeds from exercise of stock-based awards, partially offset by the repurchase of 180,013 shares of common stock.
Out of total cash, cash equivalents, bank deposits and marketable securities of $156.5 million at year end 2016, $121.9 million was held by our foreign subsidiaries. Our intent is to permanently reinvest earnings of our foreign subsidiaries and our current operating plans do not demonstrate a need to repatriate foreign earnings to fund our U.S. operations. However, if these funds were needed for our operations in the United States, we would be required to accrue and pay U.S. taxes as well as taxes in other countries to repatriate these funds. The determination of the amount of additional taxes related to the repatriation of these earnings is not practicable, as it may vary based on various factors such as the location of the cash and the effect of regulation in the various jurisdictions from which the cash would be repatriated.
During 2016, we invested $85.0 million of cash in bank deposits and marketable securities with maturities up to 59 months from the balance sheet date. In addition, during the same period, bank deposits and marketable securities were sold or redeemed for cash amounting to $66.4 million. During 2015, we invested $83.1 million of cash in bank deposits and marketable securities with maturities up to 40 months from the balance sheet date. In addition, during the same period, bank deposits and marketable securities were sold or redeemed for cash amounting to $75.6 million. During 2014, we invested $89.9 million of cash in bank deposits and marketable securities with maturities up to 36 months from the balance sheet date. In addition, during the same period, bank deposits and marketable securities were sold or redeemed for cash amounting to $102.9 million. All of our marketable securities are classified as available-for-sale. The purchase and sale or redemption of available-for-sale marketable securities are considered part of investing cash flow. Available-for-sale marketable securities are stated at fair value, with unrealized gains and losses reported in accumulated other comprehensive income (loss), a separate component of stockholders’ equity, net of taxes. Realized gains and losses on sales of investments, as determined on a specific identification basis, are included in the consolidated statements of operations. We did not recognize any other-than-temporarily-impaired charges on marketable securities in 2016, 2015 and 2014. For more information about our marketable securities, see Notes 1 and 3 to the attached Notes to Consolidated Financial Statement for the year ended December 31, 2016.
Bank deposits are classified as short-term bank deposits and long-term bank deposits. Short-term bank deposits are deposits with maturities of more than three months but no longer than one year from the balance sheet date, whereas long-term bank deposits are deposits with maturities of more than one year as of the balance sheet date. Bank deposits are presented at their cost, including accrued interest, and purchases and sales are considered part of cash flows from investing activities.
Operating Activities
Cash provided by operating activities in 2016 was $14.5 million and consisted of net income of $13.1 million, adjustments for non-cash items of $10.0 million, and changes in operating assets and liabilities of $8.6 million. Adjustments for non-cash items primarily consisted of $2.6 million of depreciation and amortization of intangible assets, $6.2 million of equity-based compensation expenses and $1.1 million of amortization of premiums on available-for-sale marketable securities. The decrease in cash from changes in operating assets and liabilities primarily consisted of an increase in trade receivables of $11.0 million, an increase in prepaid expenses and other current assets of $0.6 million, and an increase in deferred tax, net of $0.6 million, partially offset by an increase in deferred revenues of $3.5 million and an increase in income tax payable of $0.7 million.
Cash provided by operating activities in 2015 was $19.4 million and consisted of net income of $6.3 million, adjustments for non-cash items of $7.8 million, and changes in operating assets and liabilities of $5.3
47
Table of Contents
million. Adjustments for non-cash items primarily consisted of $2.4 million of depreciation and amortization of intangible assets, $4.0 million of equity-based compensation expenses, $1.1 million of amortization of premiums on available-for-sale marketable securities and $0.2 million of unrealized foreign exchange loss. The increase in cash from changes in operating assets and liabilities primarily consisted of a decrease in trade receivables of $4.3 million, an increase in deferred revenues of $1.1 million and an increase in accrued payroll and related benefits of $1.7 million, partially offset by an increase in deferred tax assets, net, of $1.2 million and an increase in accrued interest on bank deposits of $0.3 million.
Cash provided by operating activities in 2014 was $9.1 million and consisted of net loss of $0.8 million, adjustments for non-cash items of $8.5 million, and changes in operating assets and liabilities of $1.4 million. Adjustments for non-cash items primarily consisted of $1.4 million of depreciation and amortization of intangible assets, $5.0 million of equity-based compensation expenses, $1.1 million of amortization of premiums on available-for-sale marketable securities, $0.6 million of unrealized foreign exchange loss and $0.4 million of loss on realization of investment in Antcor. The increase in cash from changes in operating assets and liabilities primarily consisted of a decrease in prepaid expenses and other current assets of $0.8 million, a decrease in accrued interest on bank deposits of $0.4 million, a decrease in deferred tax assets, net, of $2.5 million, an increase in deferred revenues of $1.0 million and an increase in accrued payroll and related benefits of $0.8 million, partially offset by an increase in trade receivables of $2.4 million, a decrease in trade payables of $0.7 million and a decrease in income tax payable of $1.1 million.
Cash flows from operating activities may vary significantly from quarter to quarter depending on the timing of our receipts and payments. Our ongoing cash outflows from operating activities principally relate to payroll-related costs and obligations under our property leases and design tool licenses. Our primary sources of cash inflows are receipts from our accounts receivable, to some extent funding from the IIA and interest earned from our cash, deposits and marketable securities. The timing of receipts of accounts receivable from customers is based upon the completion of agreed milestones or agreed dates as set out in the contracts.
Investing Activities
Net cash used in investing activities in 2016 was $21.0 million, as compared to net cash used in investing activities of $9.6 million in 2015 and net cash used in investing activities of $0.9 million in 2014. We had a cash outflow of $43.5 million with respect to investments in marketable securities and a cash inflow of $28.8 million with respect to maturity and sell of marketable securities during 2016. Included in the cash outflow during 2016 was net investment of $3.9 million in bank deposits. We had a cash outflow of $29.8 million with respect to investments in marketable securities and a cash inflow of $28.1 million with respect to maturity and sell of marketable securities during 2015. Included in the cash outflow during 2015 was net investment of $5.9 million in bank deposits. We had a cash outflow of $38.4 million with respect to investments in marketable securities and a cash inflow of $57.6 million with respect to maturity and sell of marketable securities during 2014 (to some extent, to finance the $13.5 million cash payment, net of cash acquired, to acquire RivieraWaves in 2014). Included in the cash outflow during 2014 was net investment of $6.2 million in bank deposits. Capital equipment purchases of computer hardware and software used in engineering development, furniture and fixtures amounted to approximately $2.4 million in 2016, $2.2 million in 2015 and $1.4 million in 2014. We had a cash inflow of $0.1 million and $1.0 million in 2015 and 2014, respectively, from the sale of our investment in Antcor.
Financing Activities
Net cash provided by financing activities in 2016 was $6.2 million, as compared to net cash used in financing activities of $7.0 million and $15.7 million in 2015 and 2014, respectively.
In August 2008, we announced that our board of directors approved a share repurchase program for up to one million shares of common stock which was further extended collectively by an additional five million shares in 2010, 2013 and 2014. In 2016, we repurchased 180,013 shares of common stock at an average purchase price
48
Table of Contents
of $18.98 per share for an aggregate purchase price of $3.4 million. In 2015, we repurchased 508,931 shares of common stock at an average purchase price of $19.80 per share for an aggregate purchase price of $10.1 million. In 2014, we repurchased 1,227,148 shares of common stock at an average purchase price of $15.20 per share for an aggregate purchase price of $18.7 million. As of December 31, 2016, 311,056 shares of common stock remained authorized for repurchase pursuant to our share repurchase program.
In 2016, 2015 and 2014, we received $9.6 million, $6.7 million and $3.0 million, respectively, from the exercise of stock-based awards.
In 2015, we paid $3.7 million of the Contingent Consideration in connection with our acquisition of RivieraWaves.
In 2015, we classified $0.1 million of excess tax benefit from equity-based compensation expenses as financing cash flows.
We believe that our cash and cash equivalent, short-term bank deposits and marketable securities, along with cash from operations, will provide sufficient capital to fund our operations for at least the next 12 months. We cannot provide assurance, however, that the underlying assumed levels of revenues and expenses will prove to be accurate.
In addition, as part of our business strategy, we occasionally evaluate potential acquisitions of businesses, products and technologies and minority equity investments. Accordingly, a portion of our available cash may be used at any time for the acquisition of complementary products or businesses or minority equity investments. Such potential transactions may require substantial capital resources, which may require us to seek additional debt or equity financing. We cannot assure you that we will be able to successfully identify suitable acquisition or investment candidates, complete acquisitions or investments, integrate acquired businesses into our current operations, or expand into new markets. Furthermore, we cannot provide assurance that additional financing will be available to us in any required time frame and on commercially reasonable terms, if at all. See “Risk Factors—We may seek to expand our business in ways that could result in diversion of resources and extra expenses.” for more detailed information.
Contractual Obligations
The table below presents the principal categories of our contractual obligations as of December 31, 2016:
| Payments Due by Period |
||||||||||||||||||||
| ($ in thousands) |
||||||||||||||||||||
| Total | Less than 1 year |
1-3 years | 3-5 years | More than 5 years |
||||||||||||||||
| Operating Lease Obligations—Leasehold properties |
3,112 | 1,295 | 1,562 | 255 | — | |||||||||||||||
| Purchase Obligations—design tools |
7,119 | 3,019 | 4,100 | — | — | |||||||||||||||
| Other purchase Obligations |
2,456 | 2,456 | — | — | — | |||||||||||||||
|
|
|
|
|
|
|
|
|
|
|
|||||||||||
| Total |
12,687 | 6,770 | 5,662 | 255 | — | |||||||||||||||
|
|
|
|
|
|
|
|
|
|
|
|||||||||||
Operating leasehold obligations principally relate to our offices in Israel, Ireland, France, China, Japan and the United States. Purchase obligations relate to license agreements entered into for maintenance of design tools. Other purchase obligations consist of capital and operating purchase order commitments. Other than set forth in the table above, we have no long-term debt or capital lease obligations.
At December 31, 2016, our income tax payable, net of withholding tax credits, included $3,784,000 related to uncertain tax positions. Due to uncertainties in the timing of the completion of tax audits, the timing of the resolution of these positions is uncertain and we are unable to make a reasonably reliable estimate of the timing of payments. As a result, this amount is not included in the above table.
49
Table of Contents
In addition, at December 31, 2016, the amount of accrued severance pay was $8,349,000. Severance pay relates to accrued severance obligations to our Israeli employees as required under Israeli labor laws. These obligations are payable only upon termination, retirement or death of the respective employee. Of this amount, $408,000 is unfunded.
Off-Balance Sheet Arrangements
We do not have any off-balance sheet arrangements, as such term is defined in recently enacted rules by the Securities and Exchange Commission, that have or are reasonably likely to have a current or future effect on our financial condition, changes in financial condition, revenues or expenses, results of operations, liquidity, capital expenditures or capital resources that are material to investors.
| ITEM 7A. | QUANTITATIVE AND QUALITATIVE DISCLOSURES ABOUT MARKET RISK |
A majority of our revenues and a portion of our expenses are transacted in U.S. dollars and our assets and liabilities together with our cash holdings are predominately denominated in U.S. dollars. However, the majority of our expenses are denominated in currencies other than the U.S. dollar, principally the NIS and the EURO. Increases in volatility of the exchange rates of currencies other than the U.S. dollar versus the U.S. dollar could have an adverse effect on the expenses and liabilities that we incur when remeasured into U.S. dollars. We review our monthly expected non-U.S. dollar denominated expenditures and look to hold equivalent non-U.S. dollar cash balances to mitigate currency fluctuations. However, during the second half of 2014, our EURO cash balances increased significantly beyond our ordinary course EURO business liabilities as a result of the acquisition of RivieraWaves. This has resulted in a foreign exchange loss of $0.19 million, $0.49 million and $0.57 million for 2016, 2015 and 2014, respectively. The foreign exchange losses during 2016, 2015 and 2014 principally reflected a significant devaluation of our EURO cash balances as the U.S. dollar strengthened significantly as compared to the EURO.
As a result of currency fluctuations and the remeasurement of non-U.S. dollar denominated expenditures to U.S. dollars for financial reporting purposes; we may experience fluctuations in our operating results on an annual and quarterly basis. To protect against the increase in value of forecasted foreign currency cash flow resulting from salaries paid in currencies other than the U.S. dollar during the year, we follow a foreign currency cash flow hedging program. We hedge portions of the anticipated payroll for our non-U.S. employees denominated in currencies other than the U.S. dollar for a period of one to twelve months with forward and option contracts. During 2016, 2015 and 2014, we recorded accumulated other comprehensive loss of $3,000, accumulated other comprehensive gain of $65,000 and accumulated other comprehensive loss of $41,000, respectively, from our forward and option contracts, net of taxes, with respect to anticipated payroll expenses for our non-U.S. employees. As of December 31, 2016, the amount of other comprehensive gain from our forward and option contracts, net of taxes, was $5,000, which will be recorded in the consolidated statements of income during the following three months. We recognized a net gain of $0.16 million for 2016, a net gain of $0.10 million for 2015 and a net loss of $0.38 million for 2014, related to forward and options contracts. We note that hedging transactions may not successfully mitigate losses caused by currency fluctuations. We expect to continue to experience the effect of exchange rate and currency fluctuations on an annual and quarterly basis.
The majority of our cash and cash equivalents are invested in high grade certificates of deposits with major U.S., European and Israeli banks. Generally, cash and cash equivalents and bank deposits may be redeemed and therefore minimal credit risk exists with respect to them. Nonetheless, deposits with these banks exceed the Federal Deposit Insurance Corporation (“FDIC”) insurance limits or similar limits in foreign jurisdictions, to the extent such deposits are even insured in such foreign jurisdictions. While we monitor on a systematic basis the cash and cash equivalent balances in the operating accounts and adjust the balances as appropriate, these balances could be impacted if one or more of the financial institutions with which we deposit our funds fails or is subject to other adverse conditions in the financial or credit markets. To date, we have experienced no loss of principal or lack of access to our invested cash or cash equivalents; however, we can provide no assurance that access to
50
Table of Contents
our invested cash and cash equivalents will not be affected if the financial institutions that we hold our cash and cash equivalents fail.
We hold an investment portfolio consisting principally of corporate bonds. We have the ability to hold such investments until recovery of temporary declines in market value or maturity. Accordingly, as of December 31, 2016, we believe the losses associated with our investments are temporary and no impairment loss was recognized in 2016. However, we can provide no assurance that we will recover present declines in the market value of our investments.
Interest income and gains and losses from marketable securities, net, were $2.23 million in 2016, $1.66 million in 2015 and $1.71 million in 2014. The increase in interest income and gains and losses from marketable securities, net, for 2016 as compared to 2015 reflected higher combined cash, bank deposits and marketable securities balances held and higher yields. The slight decrease in interest income and gains and losses from marketable securities, net, for 2015 as compared to 2014 reflected lower combined cash, bank deposits and marketable securities balances held, offset by higher yields.
We are exposed primarily to fluctuations in the level of U.S. interest rates. To the extent that interest rates rise, fixed interest investments may be adversely impacted, whereas a decline in interest rates may decrease the anticipated interest income for variable rate investments. We typically do not attempt to reduce or eliminate our market exposures on our investment securities because the majority of our investments are short-term. We currently do not have any derivative instruments but may put them in place in the future. Fluctuations in interest rates within our investment portfolio have not had, and we do not currently anticipate such fluctuations will have, a material effect on our financial position on an annual or quarterly basis.
| ITEM 8. | FINANCIAL STATEMENTS AND SUPPLEMENTARY DATA |
See the Index to Financial Statements and Supplementary Data on page F-1.
| ITEM 9. | CHANGES IN AND DISAGREEMENTS WITH ACCOUNTANTS ON ACCOUNTING AND FINANCIAL DISCLOSURE |
Not Applicable.
| ITEM 9A. | CONTROLS AND PROCEDURES |
Evaluation of Disclosure Controls and Procedures.
As of the end of the period covered by this report, we carried out an evaluation, under the supervision and with the participation of our Chief Executive Officer and Chief Financial Officer, of the effectiveness of the design and operation of our disclosure controls and procedures. Based on this evaluation, our Chief Executive Officer and Chief Financial Officer concluded that our disclosure controls and procedures were effective as of December 31, 2016.
There has been no change in our internal control over financial reporting that occurred during our most recent fiscal quarter that has materially affected or is reasonably likely to materially affect our internal control over financial reporting.
Management’s Annual Report on Internal Control Over Financial Reporting.
CEVA, Inc.’s management is responsible for establishing and maintaining adequate internal control over the company’s financial reporting as defined in Rules 13a-15(f) and 15d-15(f) under the Securities Exchange Act of 1934. CEVA, Inc.’s internal control over financial reporting is designed to provide reasonable assurance
51
Table of Contents
regarding the reliability of financial reporting and the preparation of financial statements for external purposes in accordance with generally accepted accounting principles. There are inherent limitations in the effectiveness of any internal control, including the possibility of human error and the circumvention or overriding of controls. Accordingly, even effective internal controls can provide only reasonable assurances with respect to financial statement preparation. Further because of changes in conditions, the effectiveness of internal controls may vary over time such that the degree of compliance with the policies or procedures may deteriorate.
Management assessed the effectiveness of CEVA, Inc.’s internal control over financial reporting as of December 31, 2016. In making this assessment, management used the criteria set forth by the Committee of Sponsoring Organizations of the Treadway Commission (2013 Framework) (COSO) in Internal Control-Integrated Framework. Based on its assessment using those criteria, management believes that CEVA, Inc.’s internal control over financial reporting was effective as of December 31, 2016.
CEVA, Inc.’s independent registered public accountants audited the financial statements included in this Annual Report on Form 10-K and have issued a report concurring with management’s assessment of the company’s internal control over financial reporting, which appears in Item 8 of this Annual Report.
| ITEM 9B. | OTHER INFORMATION |
None.
52
Table of Contents
PART III
| ITEM 10. | DIRECTORS, EXECUTIVE OFFICERS AND CORPORATE GOVERNANCE |
The information regarding our directors required by this item is incorporated herein by reference to the 2017 Proxy Statement. Information regarding the members of the Audit Committee, our code of business conduct and ethics, the identification of the Audit Committee Financial Expert, stockholder nominations of directors and compliance with Section 16(a) of the Securities Exchange Act of 1934 is also incorporated herein by reference to the 2017 Proxy Statement.
The information regarding our executive officers required by this item is contained in Part I of this annual report.
| ITEM 11. | EXECUTIVE COMPENSATION |
The information required by this item is incorporated herein by reference to the 2017 Proxy Statement.
| ITEM 12. | SECURITY OWNERSHIP OF CERTAIN BENEFICIAL OWNERS AND MANAGEMENT AND RELATED STOCK HOLDER MATTERS |
The information required by this item is incorporated herein by reference to the 2017 Proxy Statement.
| ITEM 13. | CERTAIN RELATIONSHIPS AND RELATED TRANSACTIONS, AND DIRECTOR INDEPENDENCE |
The information required by this item is incorporated herein by reference to the 2017 Proxy Statement.
| ITEM 14. | PRINCIPAL ACCOUNTANT FEES AND SERVICES |
The information required by this item is incorporated herein by reference to the 2017 Proxy Statement.
53
Table of Contents
PART IV
| ITEM 15. | EXHIBITS AND FINANCIAL STATEMENT SCHEDULES |
(a) The following documents are filed as part of or are included in this Annual Report on Form 10-K:
1. Financial Statements:
| • | Consolidated Balance Sheets as of December 31, 2016 and 2015. |
| • | Consolidated Statements of Income for the Years Ended December 31, 2016, 2015 and 2014. |
| • | Consolidated Statements of Comprehensive Income (Loss) for the Years Ended December 31, 2016, 2015 and 2014. |
| • | Statements of Changes in Stockholders’ Equity for the Years Ended December 31, 2016, 2015 and 2014. |
| • | Consolidated Statements of Cash Flows for the Years Ended December 31, 2016, 2015 and 2014. |
| • | Notes to the Consolidated Financial Statements. |
2. Financial Statement Schedules:
| • | Schedule II: Valuation and Qualifying Accounts. |
Other financial statement schedules have been omitted since they are either not required or the information is otherwise included.
3. Exhibits:
The exhibits filed as part of this Annual Report on Form 10-K are listed on the exhibit index immediately preceding such exhibits, which exhibit index is incorporated herein by reference. Some of these documents have previously been filed as exhibits with the Securities and Exchange Commission and are being incorporated herein by reference to such earlier filings. CEVA’s file number under the Securities Exchange Act of 1934 is 000-49842.
54
Table of Contents
| ITEM 8. | FINANCIAL STATEMENTS AND SUPPLEMENTARY DATA |
CONSOLIDATED FINANCIAL STATEMENTS
AS OF DECEMBER 31, 2016
| Page | ||||
| F-2 | ||||
| F-4 | ||||
| F-5 | ||||
| F-6 | ||||
| F-7 | ||||
| F-8 | ||||
| F-10 | ||||
F-1
Table of Contents
CEVA, INC.

REPORT OF INDEPENDENT REGISTERED PUBLIC ACCOUNTING FIRM
The Board of Directors and Stockholders of CEVA, Inc.
We have audited the accompanying consolidated balance sheets of CEVA, Inc. as of December 31, 2015 and 2016, and the related consolidated statements of income, comprehensive income, stockholders’ equity and cash flows for each of the three years in the period ended December 31, 2016. Our audits also included the financial statement schedule listed in the Index at item 15(a) 2. These financial statements and schedule are the responsibility of the Company’s management. Our responsibility is to express an opinion on these financial statements and schedule based on our audits.
We conducted our audits in accordance with the standards of the Public Company Accounting Oversight Board (United States). Those standards require that we plan and perform the audit to obtain reasonable assurance about whether the financial statements are free of material misstatement. An audit includes examining, on a test basis, evidence supporting the amounts and disclosures in the financial statements. An audit also includes assessing the accounting principles used and significant estimates made by management, as well as evaluating the overall financial statement presentation. We believe that our audits provide a reasonable basis for our opinion.
In our opinion, the financial statements referred to above present fairly, in all material respects, the consolidated financial position of CEVA, Inc. at December 31, 2015 and 2016, and the consolidated results of its operations and its cash flows for each of the three years in the period ended December 31, 2016, in conformity with U.S. generally accepted accounting principles. Also, in our opinion, the related financial statement schedule, when considered in relation to the basic financial statements taken as a whole, presents fairly in all material respects the information set forth therein.
We also have audited, in accordance with the standards of the Public Company Accounting Oversight Board (United States), CEVA, Inc.’s internal control over financial reporting as of December 31, 2016, based on criteria established in Internal Control-Integrated Framework issued by the Committee of Sponsoring Organizations of the Treadway Commission (2013 framework) and our report dated March 10, 2017 expressed an unqualified opinion thereon.
| /s/ KOST FORER GABBAY & KASIERER |
| A Member of Ernst & Young Global |
Tel Aviv, Israel
March 10, 2017
F-2
Table of Contents

|
CEVA, INC. |
REPORT OF INDEPENDENT REGISTERED PUBLIC ACCOUNTING FIRM
The Board of Directors and Stockholders of CEVA, Inc.
We have audited CEVA, Inc.`s internal control over financial reporting as of December 31, 2016, based on criteria established in Internal Control—Integrated Framework issued by the Committee of Sponsoring Organizations of the Treadway Commission (2013 framework) (the COSO criteria). CEVA, Inc.`s management is responsible for maintaining effectiveness of internal control over financial reporting, and for its assessment of the effectiveness of internal control over financial reporting included in the accompanying Management’s Report on Internal Control over Financial Reporting. Our responsibility is to express an opinion on the company’s internal control over financial reporting based on our audit.
We conducted our audit in accordance with the standards of the Public Company Accounting Oversight Board (United States). Those standards require that we plan and perform the audit to obtain reasonable assurance about whether effective internal control over financial reporting was maintained in all material respects. Our audit included obtaining an understanding of internal control over financial reporting, assessing the risk that a material weakness exists, testing and evaluating the design and operating effectiveness of internal control based on the assessed risk, and performing such other procedures as we considered necessary in the circumstances. We believe that our audit provides a reasonable basis for our opinion.
A company’s internal control over financial reporting is a process designed to provide reasonable assurance regarding the reliability of financial reporting and the preparation of financial statements for external purposes in accordance with generally accepted accounting principles. A company’s internal control over financial reporting includes those policies and procedures that (1) pertain to the maintenance of records that, in reasonable detail, accurately and fairly reflect the transactions and dispositions of the assets of the company; (2) provide reasonable assurance that transactions are recorded as necessary to permit preparation of financial statements in accordance with generally accepted accounting principles, and that receipts and expenditures of the company are being made only in accordance with authorizations of management and directors of the company; and (3) provide reasonable assurance regarding prevention or timely detection of unauthorized acquisition, use or disposition of the company’s assets that could have a material effect on the financial statements.
Because of its inherent limitations, internal control over financial reporting may not prevent or detect misstatements. Also, projections of any evaluation of effectiveness to future periods are subject to the risk that controls may become inadequate because of changes in conditions, or that the degree of compliance with the policies or procedures may deteriorate.
In our opinion, CEVA Inc. maintained, in all material respects, effective internal control over financial reporting as of December 31, 2016, based on the COSO criteria.
We also have audited, in accordance with the standards of the Public Company Accounting Oversight Board (United States), the consolidated balance sheets of CEVA, Inc. as of December 31, 2015 and 2016 and the related consolidated statements of income, comprehensive income, stockholders’ equity, and cash flows for each of the three years in the period ended December 31, 2016 of CEVA, Inc. and our report dated March 10, 2017 expressed an unqualified opinion thereon.
| /s/ KOST FORER GABBAY & KASIERER |
| A Member of Ernst & Young Global |
Tel Aviv, Israel
March 10, 2017
F-3
Table of Contents
CEVA, INC.
(U.S. dollars in thousands, except share and per share data)
| December 31, | ||||||||
| 2015 | 2016 | |||||||
| ASSETS |
||||||||
| Current assets: |
||||||||
| Cash and cash equivalents |
$ | 18,909 | $ | 18,401 | ||||
| Short-term bank deposits |
30,767 | 46,247 | ||||||
| Marketable securities (Note 3) |
48,266 | 61,868 | ||||||
| Trade receivables (net of allowance for doubtful accounts of $0 and $25 at December 31, 2016 and December 31, 2015, respectively) |
4,068 | 15,044 | ||||||
| Prepaid expenses and other current assets |
4,017 | 3,152 | ||||||
|
|
|
|
|
|||||
| Total current assets |
106,027 | 144,712 | ||||||
|
|
|
|
|
|||||
| Long-term assets: |
||||||||
| Bank deposits |
41,334 | 29,977 | ||||||
| Severance pay fund |
7,297 | 7,941 | ||||||
| Deferred tax assets (Note 13) |
1,628 | 2,252 | ||||||
| Property and equipment, net (Note 5) |
3,731 | 4,805 | ||||||
| Goodwill |
46,612 | 46,612 | ||||||
| Intangible assets, net (Note 6) |
4,214 | 2,978 | ||||||
| Investments in other company |
1,806 | 1,806 | ||||||
| Other long-term assets |
— | 1,412 | ||||||
|
|
|
|
|
|||||
| Total long-term assets |
106,622 | 97,783 | ||||||
|
|
|
|
|
|||||
| Total assets |
$ | 212,649 | $ | 242,495 | ||||
|
|
|
|
|
|||||
| LIABILITIES AND STOCKHOLDERS’ EQUITY |
||||||||
| Current liabilities: |
||||||||
| Trade payables |
$ | 693 | $ | 571 | ||||
| Deferred revenues |
2,763 | 6,258 | ||||||
| Accrued expenses and other payables (Note 7) |
3,633 | 4,015 | ||||||
| Accrued payroll and related benefits |
11,894 | 11,751 | ||||||
|
|
|
|
|
|||||
| Total current liabilities |
18,983 | 22,595 | ||||||
|
|
|
|
|
|||||
| Long-term liabilities: |
||||||||
| Accrued severance pay |
7,571 | 8,349 | ||||||
|
|
|
|
|
|||||
| Total long-term liabilities |
7,571 | 8,349 | ||||||
|
|
|
|
|
|||||
| Stockholders’ equity (Note 8): |
||||||||
| Preferred stock: |
||||||||
| $0.001 par value: 5,000,000 shares authorized; none issued and outstanding |
— | — | ||||||
| Common stock: |
||||||||
| $0.001 par value: 60,000,000 shares authorized; 23,595,160 shares issued at December 31, 2015 and 2016; 20,529,933 and 21,273,500 shares outstanding at December 31, 2015 and 2016, respectively |
21 | 21 | ||||||
| Additional paid in-capital |
208,744 | 212,103 | ||||||
| Treasury stock at cost (3,065,227 and 2,321,660 shares of common stock at December 31, 2015 and 2016, respectively) |
(51,798 | ) | (39,507 | ) | ||||
| Accumulated other comprehensive loss (Note 10) |
(419 | ) | (497 | ) | ||||
| Retained earnings |
29,547 | 39,431 | ||||||
|
|
|
|
|
|||||
| Total stockholders’ equity |
186,095 | 211,551 | ||||||
|
|
|
|
|
|||||
| Total liabilities and stockholders’ equity |
$ | 212,649 | $ | 242,495 | ||||
|
|
|
|
|
|||||
The accompanying notes are an integral part of the consolidated financial statements.
F-4
Table of Contents
CEVA, INC.
CONSOLIDATED STATEMENTS OF INCOME
(U.S. dollars in thousands, except per share data)
| Year Ended December 31, | ||||||||||||
| 2014 | 2015 | 2016 | ||||||||||
| Revenues: |
||||||||||||
| Licensing and related revenue |
$ | 28,348 | $ | 32,135 | $ | 31,874 | ||||||
| Royalties |
22,460 | 27,364 | 40,779 | |||||||||
|
|
|
|
|
|
|
|||||||
| Total revenues |
50,808 | 59,499 | 72,653 | |||||||||
|
|
|
|
|
|
|
|||||||
| Cost of revenues |
5,000 | 5,424 | 6,086 | |||||||||
|
|
|
|
|
|
|
|||||||
| Gross profit |
45,808 | 54,075 | 66,567 | |||||||||
|
|
|
|
|
|
|
|||||||
| Operating expenses: |
||||||||||||
| Research and development, net |
25,828 | 28,113 | 30,838 | |||||||||
| Sales and marketing |
9,815 | 10,168 | 11,540 | |||||||||
| General and administrative |
8,054 | 8,184 | 8,567 | |||||||||
| Amortization of intangible assets (Note 6) |
649 | 1,298 | 1,236 | |||||||||
|
|
|
|
|
|
|
|||||||
| Total operating expenses |
44,346 | 47,763 | 52,181 | |||||||||
|
|
|
|
|
|
|
|||||||
| Operating income |
1,462 | 6,312 | 14,386 | |||||||||
| Financial income, net (Note 12) |
975 | 1,069 | 2,039 | |||||||||
| Other loss (Note 1) |
(404 | ) | — | — | ||||||||
|
|
|
|
|
|
|
|||||||
| Income before taxes on income |
2,033 | 7,381 | 16,425 | |||||||||
| Income taxes (Note 13) |
2,852 | 1,114 | 3,325 | |||||||||
|
|
|
|
|
|
|
|||||||
| Net income (loss) |
$ | (819 | ) | $ | 6,267 | $ | 13,100 | |||||
|
|
|
|
|
|
|
|||||||
| Basic net income (loss) per share |
$ | (0.04 | ) | $ | 0.31 | $ | 0.63 | |||||
|
|
|
|
|
|
|
|||||||
| Diluted net income (loss) per share |
$ | (0.04 | ) | $ | 0.30 | $ | 0.61 | |||||
|
|
|
|
|
|
|
|||||||
| Weighted average shares used to compute net income (loss) per share (in thousands): |
||||||||||||
| Basic |
20,622 | 20,480 | 20,850 | |||||||||
|
|
|
|
|
|
|
|||||||
| Diluted |
20,622 | 20,989 | 21,565 | |||||||||
|
|
|
|
|
|
|
|||||||
The accompanying notes are an integral part of the consolidated financial statements.
F-5
Table of Contents
CEVA, INC.
CONSOLIDATED STATEMENTS OF COMPREHENSIVE INCOME (LOSS)
(U.S. dollars in thousands)
| Year Ended December 31, | ||||||||||||
| 2014 | 2015 | 2016 | ||||||||||
| Net income (loss): |
$ | (819 | ) | $ | 6,267 | $ | 13,100 | |||||
| Other comprehensive loss before tax: |
||||||||||||
| Available-for-sale securities: |
||||||||||||
| Changes in unrealized losses |
(324 | ) | (151 | ) | (95 | ) | ||||||
| Reclassification adjustments for (gains) losses included in net income |
(6 | ) | 78 | 9 | ||||||||
|
|
|
|
|
|
|
|||||||
| Net change |
(330 | ) | (73 | ) | (86 | ) | ||||||
|
|
|
|
|
|
|
|||||||
| Cash flow hedges: |
||||||||||||
| Changes in unrealized gains (losses) |
(430 | ) | 177 | 158 | ||||||||
| Reclassification adjustments for (gains) losses included in net income |
382 | (104 | ) | (161 | ) | |||||||
|
|
|
|
|
|
|
|||||||
| Net change |
(48 | ) | 73 | (3 | ) | |||||||
|
|
|
|
|
|
|
|||||||
| Other comprehensive loss before tax |
(378 | ) | — | (89 | ) | |||||||
| Income tax benefit related to components of other comprehensive loss |
(23 | ) | (17 | ) | (11 | ) | ||||||
|
|
|
|
|
|
|
|||||||
| Other comprehensive income (loss), net of taxes |
(355 | ) | 17 | (78 | ) | |||||||
|
|
|
|
|
|
|
|||||||
| Comprehensive income (loss) |
$ | (1,174 | ) | $ | 6,284 | $ | 13,022 | |||||
|
|
|
|
|
|
|
|||||||
The accompanying notes are an integral part of the consolidated financial statements.
F-6
Table of Contents
CEVA, INC.
STATEMENTS OF CHANGES IN STOCKHOLDERS’ EQUITY
(U.S. dollars in thousands, except share data)
| Common Stock | Additional paid-in capital |
Accumulated other comprehensive income (loss) |
Retained earnings |
Total stockholders’ equity |
||||||||||||||||||||||||
| Number of shares outstanding |
Amount | Treasury stock |
||||||||||||||||||||||||||
| Balance as of January 1, 2014 |
21,181,730 | $ | 21 | $ | 204,415 | $ | (41,005 | ) | $ | (81 | ) | $ | 27,545 | $ | 190,895 | |||||||||||||
| Net loss |
— | — | — | — | — | (819 | ) | (819 | ) | |||||||||||||||||||
| Other comprehensive loss |
— | — | — | — | (355 | ) | — | (355 | ) | |||||||||||||||||||
| Equity-based compensation |
— | — | 5,011 | — | — | — | 5,011 | |||||||||||||||||||||
| Purchase of Treasury stock |
(1,227,148 | ) | (1 | ) | — | (18,656 | ) | — | — | (18,657 | ) | |||||||||||||||||
| Issuance of Treasury stock upon exercise of stock-based awards |
297,908 | — | (*) | — | 4,953 | — | (1,979 | ) | 2,974 | |||||||||||||||||||
|
|
|
|
|
|
|
|
|
|
|
|
|
|
|
|||||||||||||||
| Balance as of December 31, 2014 |
20,252,490 | $ | 20 | $ | 209,426 | $ | (54,708 | ) | $ | (436 | ) | $ | 24,747 | $ | 179,049 | |||||||||||||
|
|
|
|
|
|
|
|
|
|
|
|
|
|
|
|||||||||||||||
| Net income |
— | — | — | — | — | 6,267 | 6,267 | |||||||||||||||||||||
| Other comprehensive income |
— | — | — | — | 17 | — | 17 | |||||||||||||||||||||
| Equity-based compensation |
— | — | 4,015 | — | — | — | 4,015 | |||||||||||||||||||||
| Tax benefit related to exercise of stock-based awards |
— | — | 112 | — | — | — | 112 | |||||||||||||||||||||
| Purchase of Treasury stock |
(508,931 | ) | — | — | (10,078 | ) | — | — | (10,078 | ) | ||||||||||||||||||
| Issuance of Treasury stock upon exercise of stock-based awards |
786,374 | 1 | (4,809 | ) | 12,988 | — | (1,467 | ) | 6,713 | |||||||||||||||||||
|
|
|
|
|
|
|
|
|
|
|
|
|
|
|
|||||||||||||||
| Balance as of December 31, 2015 |
20,529,933 | $ | 21 | $ | 208,744 | $ | (51,798 | ) | $ | (419 | ) | $ | 29,547 | $ | 186,095 | |||||||||||||
|
|
|
|
|
|
|
|
|
|
|
|
|
|
|
|||||||||||||||
| Net income |
— | — | — | — | — | 13,100 | 13,100 | |||||||||||||||||||||
| Other comprehensive loss |
— | — | — | — | (78 | ) | — | (78 | ) | |||||||||||||||||||
| Equity-based compensation |
— | — | 6,236 | — | — | — | 6,236 | |||||||||||||||||||||
| Purchase of Treasury stock |
(180,013 | ) | (1 | ) | — | (3,416 | ) | — | — | (3,417 | ) | |||||||||||||||||
| Issuance of Treasury stock upon exercise of stock-based awards |
923,580 | 1 | (2,877 | ) | 15,707 | — | (3,216 | ) | 9,615 | |||||||||||||||||||
|
|
|
|
|
|
|
|
|
|
|
|
|
|
|
|||||||||||||||
| Balance as of December 31, 2016 |
21,273,500 | $ | 21 | $ | 212,103 | $ | (39,507 | ) | $ | (497 | ) | $ | 39,431 | $ | 211,551 | |||||||||||||
|
|
|
|
|
|
|
|
|
|
|
|
|
|
|
|||||||||||||||
| Accumulated unrealized loss from available-for-sale securities, net of taxes of $77 |
|
$ | (502 | ) | ||||||||||||||||||||||||
| Accumulated unrealized gain from hedging activities, net of taxes of $1 |
|
$ | 5 | |||||||||||||||||||||||||
|
|
|
|||||||||||||||||||||||||||
| Accumulated other comprehensive loss, net as of December 31, 2016 |
|
$ | (497 | ) | ||||||||||||||||||||||||
|
|
|
|||||||||||||||||||||||||||
| (*) | Represent an amount lower than $1. |
The accompanying notes are an integral part of the consolidated financial statements.
F-7
Table of Contents
CEVA, INC.
CONSOLIDATED STATEMENTS OF CASH FLOWS
(U.S. dollars in thousands)
| Year ended December 31, | ||||||||||||
| 2014 | 2015 | 2016 | ||||||||||
| Cash flows from operating activities: |
||||||||||||
| Net income (loss) |
$ | (819 | ) | $ | 6,267 | $ | 13,100 | |||||
| Adjustments required to reconcile net income (loss) to net cash provided by operating activities: |
||||||||||||
| Depreciation |
752 | 1,058 | 1,399 | |||||||||
| Amortization of intangible assets |
649 | 1,298 | 1,236 | |||||||||
| Equity-based compensation |
5,011 | 4,015 | 6,236 | |||||||||
| Realized (gain) loss, net on sale of available-for-sale marketable securities |
(6 | ) | 78 | 9 | ||||||||
| Amortization of premiums on available-for-sale marketable securities |
1,121 | 1,111 | 1,064 | |||||||||
| Unrealized foreign exchange loss, net |
604 | 237 | 75 | |||||||||
| Loss on realization of investment in other company |
404 | — | — | |||||||||
| Changes in operating assets and liabilities: |
||||||||||||
| Trade receivables |
(2,381 | ) | 4,279 | (10,966 | ) | |||||||
| Prepaid expenses and other current assets |
819 | (136 | ) | (622 | ) | |||||||
| Accrued interest on bank deposits |
351 | (318 | ) | (195 | ) | |||||||
| Deferred tax, net |
2,531 | (1,213 | ) | (613 | ) | |||||||
| Trade payables |
(655 | ) | (161 | ) | (190 | ) | ||||||
| Deferred revenues |
950 | 1,082 | 3,495 | |||||||||
| Accrued expenses and other payables |
(188 | ) | (158 | ) | (277 | ) | ||||||
| Accretion of contingent consideration |
169 | 97 | — | |||||||||
| Accrued payroll and related benefits |
800 | 1,679 | (94 | ) | ||||||||
| Income taxes payable |
(1,057 | ) | 93 | 668 | ||||||||
| Excess tax benefit from equity-based compensation |
— | (112 | ) | — | ||||||||
| Accrued severance pay, net |
54 | 184 | 134 | |||||||||
|
|
|
|
|
|
|
|||||||
| Net cash provided by operating activities |
9,109 | 19,380 | 14,459 | |||||||||
|
|
|
|
|
|
|
|||||||
| Cash flows from investing activities: |
||||||||||||
| Acquisition of subsidiary, net of cash acquired (Note 2) |
(13,489 | ) | — | — | ||||||||
| Purchase of property and equipment |
(1,416 | ) | (2,184 | ) | (2,387 | ) | ||||||
| Investment in bank deposits |
(51,511 | ) | (53,328 | ) | (41,476 | ) | ||||||
| Proceeds from bank deposits |
45,306 | 47,451 | 37,594 | |||||||||
| Investment in available-for-sale marketable securities |
(38,413 | ) | (29,800 | ) | (43,537 | ) | ||||||
| Proceeds from maturity of available-for-sale marketable securities |
2,033 | 4,392 | 8,022 | |||||||||
| Proceeds from sale of available-for-sale marketable securities |
55,566 | 23,713 | 20,754 | |||||||||
| Proceeds from realization of investment in other company |
1,032 | 111 | — | |||||||||
|
|
|
|
|
|
|
|||||||
| Net cash used in investing activities |
(892 | ) | (9,645 | ) | (21,030 | ) | ||||||
|
|
|
|
|
|
|
|||||||
| Cash flows from financing activities: |
||||||||||||
| Payment of contingent consideration (Note 2) |
— | (3,700 | ) | — | ||||||||
| Purchase of Treasury Stock |
(18,657 | ) | (10,078 | ) | (3,417 | ) | ||||||
| Proceeds from exercise of stock-based awards |
2,974 | 6,713 | 9,615 | |||||||||
| Excess tax benefit from equity-based compensation |
— | 112 | — | |||||||||
|
|
|
|
|
|
|
|||||||
| Net cash provided by (used in) financing activities |
(15,683 | ) | (6,953 | ) | 6,198 | |||||||
|
|
|
|
|
|
|
|||||||
| Effect of exchange rate changes on cash and cash equivalents |
(485 | ) | (39 | ) | (135 | ) | ||||||
| Increase (decrease) in cash and cash equivalents |
(7,951 | ) | 2,743 | (508 | ) | |||||||
| Cash and cash equivalents at the beginning of the year |
24,117 | 16,166 | 18,909 | |||||||||
|
|
|
|
|
|
|
|||||||
| Cash and cash equivalents at the end of the year |
$ | 16,166 | $ | 18,909 | $ | 18,401 | ||||||
|
|
|
|
|
|
|
|||||||
The accompanying notes are an integral part of the consolidated financial statements.
F-8
Table of Contents
CEVA, INC.
CONSOLIDATED STATEMENTS OF CASH FLOWS—(Continued)
(U.S. dollars in thousands)
| Year ended December 31, | ||||||||||||
| 2014 | 2015 | 2016 | ||||||||||
| Supplemental information of cash-flows activities: |
||||||||||||
| Cash paid during the year for: |
||||||||||||
| Income and withholding taxes, net of refunds |
$ | 1,276 | $ | 2,185 | $ | 3,287 | ||||||
|
|
|
|
|
|
|
|||||||
| Property and equipment purchases incurred but unpaid at period end |
$ | — | $ | — | $ | 86 | ||||||
|
|
|
|
|
|
|
|||||||
The accompanying notes are an integral part of the consolidated financial statements.
F-9
Table of Contents
CEVA, INC.
NOTES TO THE CONSOLIDATED FINANCIAL STATEMENTS
(in thousands, except share data)
NOTE 1: ORGANIZATION AND SIGNIFICANT ACCOUNTING POLICIES
Organization:
CEVA, Inc. (“CEVA” or the “Company”) was incorporated in Delaware on November 22, 1999. The Company was formed through the combination of Parthus Technologies plc (“Parthus”) and the digital signal processor (DSP) cores licensing business and operations of DSP Group, Inc. in November 2002. The Company had no business or operations prior to the combination.
CEVA licenses a family of signal processing IPs, including programmable DSP cores and application-specific platforms for vision, advanced imaging, computer vision and deep learning for many camera-enabled devices, sound, voice and audio, as well as long and short range wireless technologies for LTE/LTE-A/5G baseband processing in handsets and infrastructure, short range wireless for Wi-Fi, Bluetooth IPs , and wired interface for storage, Serial ATA (SATA) and Serial Attached SCSI (SAS).
CEVA’s technologies are licensed to leading semiconductor and original equipment manufacturer (OEM) companies in the form of intellectual property (IP). These companies design, manufacture, market and sell application-specific integrated circuits (“ASICs”) and application-specific standard products (“ASSPs”) based on CEVA’s technology to wireless, consumer electronics and automotive companies for incorporation into a wide variety of end products.
Basis of presentation:
The consolidated financial statements have been prepared according to U.S Generally Accepted Accounting Principles (“U.S. GAAP”).
Use of estimates:
The preparation of the consolidated financial statements in conformity with U.S. GAAP requires management to make estimates, judgments and assumptions. The Company’s management believes that the estimates, judgments and assumptions used are reasonable based upon information available at the time they are made. These estimates, judgments and assumptions can affect the reported amounts of assets and liabilities and disclosure of contingent assets and liabilities as of the dates of the financial statements, and the reported amounts of revenues and expenses during the reporting period. Actual results could differ from those estimates.
Financial statements in U.S. dollars:
A majority of the revenues of the Company and its subsidiaries is generated in U.S. dollars (“dollars”). In addition, a portion of the Company and its subsidiaries’ costs are incurred in dollars. The Company’s management has determined that the dollar is the primary currency of the economic environment in which the Company and its subsidiaries principally operate. Thus, the functional and reporting currency of the Company and its subsidiaries is the dollar.
Accordingly, monetary accounts maintained in currencies other than the dollar are remeasured into dollars in accordance with Financial Accounting Standards Board (“FASB”) Accounting Standards Codification (“ASC”) No. 830, “Foreign Currency Matters.” All transaction gains and losses from remeasurement of monetary balance sheet items are reflected in the consolidated statements of income as financial income or expenses, as appropriate, which is included in “financial income, net.” The foreign exchange losses arose principally on the EURO and the NIS monetary balance sheet items as a result of the currency fluctuations of the EURO and the NIS against the dollar.
F-10
Table of Contents
CEVA, INC.
NOTES TO THE CONSOLIDATED FINANCIAL STATEMENTS—(Continued)
(in thousands, except share data)
Principles of consolidation:
The consolidated financial statements incorporate the financial statements of the Company and all of its subsidiaries. All significant inter-company balances and transactions have been eliminated on consolidation.
Cash equivalents:
Cash equivalents are short-term highly liquid investments that are readily convertible to cash with original maturities of three months or less from the date acquired.
Short-term bank deposits:
Short-term bank deposits are deposits with maturities of more than three months but less than one year from the balance sheet date. The deposits are presented at their cost, including accrued interest. The deposits bear interest annually at an average rate of 1.58%, 1.51% and 1.76% during 2014, 2015 and 2016, respectively.
Marketable securities:
Marketable securities consist mainly of corporate bonds. The Company determines the appropriate classification of marketable securities at the time of purchase and re-evaluates such designation at each balance sheet date. In accordance with FASB ASC No. 320 “Investments- Debt and Equity Securities,” the Company classifies marketable securities as available-for-sale. Available-for-sale securities are stated at fair value, with unrealized gains and losses reported in accumulated other comprehensive income (loss), a separate component of stockholders’ equity, net of taxes. Realized gains and losses on sales of marketable securities, as determined on a specific identification basis, are included in financial income, net. The amortized cost of marketable securities is adjusted for amortization of premium and accretion of discount to maturity, both of which, together with interest, are included in financial income, net. The Company has classified all marketable securities as short-term, even though the stated maturity date may be one year or more beyond the current balance sheet date, because it is probable that the Company will sell these securities prior to maturity to meet liquidity needs or as part of risk versus reward objectives.
The Company recognizes an impairment charge when a decline in the fair value of its investments in debt securities below the cost basis of such securities is judged to be other-than-temporary. Factors considered in making such a determination include the duration and severity of the impairment, the reason for the decline in value and the potential recovery period. For securities that are deemed other-than-temporarily impaired (“OTTI”), the amount of impairment is recognized in the statement of income and is limited to the amount related to credit losses, while impairment related to other factors is recognized in other comprehensive income (loss). The Company did not recognize OTTI on its marketable securities in 2014, 2015 and 2016.
Long-term bank deposits:
Long-term bank deposits are deposits with maturities of more than one year as of the balance sheet date. The deposits presented at their cost, including accrued interest. The deposits bear interest annually at an average rate of 1.74%, 1.82% and 1.97% during 2014, 2015 and 2016, respectively.
F-11
Table of Contents
CEVA, INC.
NOTES TO THE CONSOLIDATED FINANCIAL STATEMENTS—(Continued)
(in thousands, except share data)
Property and equipment, net:
Property and equipment are stated at cost, net of accumulated depreciation. Depreciation is calculated using the straight-line method over the estimated useful lives of the assets, at the following annual rates:
| % | ||
| Computers, software and equipment |
10-33 | |
| Office furniture and equipment |
7-33 | |
| Leasehold improvements |
10-25 | |
| (the shorter of the expected lease term or useful economic life) |
The Company’s long-lived assets are reviewed for impairment in accordance with FASB ASC No. 360-10-35, “Impairment or Disposal of Long-Lived Assets,” whenever events or changes in circumstances indicate that the carrying amount of an asset may not be recoverable. Recoverability of the carrying amount of an asset to be held and used is measured by a comparison of its carrying amount to the future undiscounted cash flows expected to be generated by such asset. If such asset is considered to be impaired, the impairment to be recognized is measured by the amount by which the carrying amount of such asset exceeds its fair value. In determining the fair value of long-lived assets for purposes of measuring impairment, the Company’s assumptions include those that market participants would consider in valuations of similar assets.
An asset to be disposed is reported at the lower of its carrying amount or fair value less selling costs. No impairment was recorded in 2014, 2015 and 2016.
Goodwill:
Goodwill is carried at cost and is not amortized but rather is tested for impairment at least annually or between annual tests in certain circumstances. The Company conducts its annual test of impairment for goodwill on October 1st of each year.
The Company operates in one operating segment and this segment comprises the only reporting unit.
There is a two-phase process for impairment testing of goodwill. The first phase screens for potential impairment, while the second phase (if necessary) measures impairment. Goodwill impairment is deemed to exist if the net book value of a reporting unit exceeds its estimated fair value. In such case, the second phase is then performed, and the Company measures impairment by comparing the carrying amount of the reporting unit’s goodwill to the implied fair value of that goodwill. An impairment loss is recognized in an amount equal to the excess. For each of the three years in the period ended December 31, 2016, no impairment of goodwill has been identified.
Intangible assets, net:
Acquired intangible assets with definite lives are amortized over their estimated useful lives. The Company amortizes intangible assets on a straight-line basis with definite lives over periods ranging from one and a half to five and a half years.
F-12
Table of Contents
CEVA, INC.
NOTES TO THE CONSOLIDATED FINANCIAL STATEMENTS—(Continued)
(in thousands, except share data)
Intangible assets with definite lives are reviewed for impairment whenever events or changes in circumstances indicate the carrying amount of an asset may not be recoverable. Recoverability of these assets is measured by comparison of their carrying amounts to future undiscounted cash flows the assets are expected to generate. If such assets are considered to be impaired, the impairment to be recognized equals the amount by which the carrying value of the assets exceeds its fair market value. The Company did not record any impairments during the years ended December 31, 2014, 2015 and 2016.
Investments in other company:
The Company’s investment in one private company, in which it holds minority equity interests, is presented at cost because the Company does not have significant influence over the underlying investee. The investment is reviewed periodically to determine if its value has been impaired and adjustments are recorded as necessary. During the years ended December 31, 2014, 2015 and 2016, no impairment loss was identified.
During 2014 and 2015, the Company received consideration of 774 EURO (approximately $1,032) and 99 EURO (approximately $111), respectively, when one of its private companies, Antcor Advanced Network Technologies S.A. (“Antcor”), a company in which the Company had a minority investment, was acquired. Pursuant to the acquisition agreement, the Company may receive additional proceeds from the buyer within five years after closing of the acquisition based on achievement of certain performance and other milestones by Antcor. During the year ended December 31, 2014, the Company recorded a loss of $404 from the sale of its investment in Antcor.
Revenue recognition:
The Company generates its revenues from (1) licensing intellectual property, which in certain circumstances is modified for customer-specific requirements, (2) royalty revenues, and (3) other revenues, which include revenues from support, training and sale of development systems.
The Company accounts for its IP license revenues and related services in accordance with FASB ASC No. 985-605, “Software Revenue Recognition.” Revenues are recognized when persuasive evidence of an arrangement exists and no further obligation exists, delivery has occurred, the license fee is fixed or determinable, and collection is reasonably assured. A license may be perpetual or time limited in its application. Revenue earned on licensing arrangements involving multiple elements are allocated to each element based on the “residual method” when vendor specific objective evidence (“VSOE”) of fair value exists for all undelivered elements and VSOE does not exist for one of the delivered elements. VSOE of fair value of the undelivered elements is determined based on the substantive renewal rate as stated in the agreement.
Extended payment terms in a licensing arrangement may indicate that the license fees are not deemed to be fixed or determinable. If the fee is not fixed or determinable, revenue is recognized as payments become due from the customer unless collection is not considered reasonably assured, then revenue is recognized as payments are collected from the customer, provided all other revenue recognition criteria have been met.
Revenues from license fees that involve significant customization of the Company’s IP to customer-specific specifications are recognized in accordance with the principles set out in FASB ASC No. 605-35-25, “Construction-Type and Production-Type Contracts Recognition ,” using contract accounting on a percentage of completion method. The amount of revenue recognized is based on the total license fees under the agreement and the percentage of completion achieved. The percentage of completion is measured by the actual time incurred to
F-13
Table of Contents
CEVA, INC.
NOTES TO THE CONSOLIDATED FINANCIAL STATEMENTS—(Continued)
(in thousands, except share data)
date on the project compared to the total estimated project requirements, which corresponds to the costs related to earned revenues. Provisions for estimated losses on uncompleted contracts are made during the period in which such losses are first determined, in the amount of the estimated loss on the entire contract.
Revenues that are derived from the sale of a licensee’s products that incorporate the Company’s IP are classified as royalty revenues. Royalty revenues are recognized during the quarter in which the Company receives a report from the licensee detailing the shipment of products that incorporate the Company’s IP, which receipt is in the quarter following the licensee’s sale of such products to its customers. Royalties are calculated either as a percentage of the revenues received by the Company’s licensees on sales of products incorporating the Company’s IP or on a per unit basis, as specified in the agreements with the licensees. Non-refundable payments on account of prepaid units (prepaid royalties) are included within the Company’s licensing and related revenue line on the consolidated statements of operations.
In addition to license fees, contracts with customers generally contain an agreement to provide for post contract support and training, which consists of telephone or e-mail support, correction of errors (bug fixing) and unspecified updates and upgrades. Fees for post contract support, which takes place after delivery to the customer, are specified in the contract and are generally mandatory for the first year. After the mandatory period, the customer may extend the support agreement on similar terms on an annual basis. The Company recognizes revenue for post contract support on a straight-line basis over the period for which technical support is contractually agreed to be provided to the licensee, typically 12 months. Revenues from training are recognized as the training is performed.
Revenues from the sale of development systems are recognized when title to the product passes to the customer and all other revenue recognition criteria have been met.
The Company usually does not provide rights of return. When rights of return are included in the license agreements, revenue is deferred until rights of return expire.
Deferred revenues include unearned amounts received under license agreements, unearned technical support and amounts paid by customers not yet recognized as revenues.
Cost of revenue:
Cost of revenue includes the costs of products, services and royalty expense payments to the Israeli Innovation Authority of the Ministry of Economy and Industry in Israel (previously known as Office of the Chief Scientist of Israel) “the Israeli Innovation Authority”) (refer to Note 15c for further details). Cost of product revenue includes materials and the portion of development costs associated with product development arrangements. Cost of service revenue includes salary and related costs for personnel engaged in services, training and customer support, and travel, telephone and other support costs.
Income taxes:
The Company recognizes income taxes under the liability method. It recognizes deferred income tax assets and liabilities for the expected future consequences of temporary differences between the financial reporting and tax bases of assets and liabilities. These differences are measured using the enacted statutory tax rates that are expected to apply to taxable income for the years in which differences are expected to reverse. The effect of a change in tax rates on deferred income taxes is recognized in the statements of income during the period that includes the enactment date.
F-14
Table of Contents
CEVA, INC.
NOTES TO THE CONSOLIDATED FINANCIAL STATEMENTS—(Continued)
(in thousands, except share data)
Valuation allowance is recorded to reduce the deferred tax assets to the net amount that the Company believes is more likely than not to be realized. The Company considers all available evidence, both positive and negative, including historical levels of income, expectations and risks associated with estimates of future taxable income and ongoing tax planning strategies, in assessing the need for a valuation allowance.
The Company accounts for uncertain tax positions in accordance with ASC 740. ASC 740-10 contains a two-step approach to recognizing and measuring uncertain tax positions. The first step is to evaluate the tax position taken or expected to be taken in a tax return by determining if the weight of available evidence indicates that it is more likely than not that, on an evaluation of the technical merits, the tax position will be sustained on audit, including resolution of any related appeals or litigation processes. The second step is to measure the tax benefit as the largest amount that is more than 50% (cumulative probability) likely to be realized upon ultimate settlement. The Company accrues interest and penalties related to unrecognized tax benefits under taxes on income.
Research and development:
Research and development costs are charged to the consolidated statements of income as incurred.
Government grants and tax credits:
Government grants received by the Company relating to categories of operating expenditures are credited to the consolidated statements of income during the period in which the expenditure to which they relate is charged. Royalty and non-royalty-bearing grants from the Israeli Innovation Authority for funding certain approved research and development projects are recognized at the time when the Company is entitled to such grants, on the basis of the related costs incurred, and included as a deduction from research and development expenses.
The Company recorded grants in the amounts of $4,586, $4,997 and $6,410 for the years ended December 31, 2014, 2015 and 2016, respectively. The Company’s Israeli subsidiary is obligated to pay royalties amounting to 3%-3.5% of the sales of certain products the development of which received grants from the Israeli Innovation Authority in previous years. The obligation to pay these royalties is contingent on actual sales of the products. Grants received from the Israeli Innovation Authority may become repayable if certain criteria under the grants are not met.
The French Research Tax Credit, Crédit d’Impôt Recherche (“CIR”), is a French tax incentive to stimulate research and development (“R&D”) which is relevant for the Company’s French subsidiaries (RivieraWaves and CEVA France). Generally, the CIR offsets the income tax to be paid and the remaining portion (if any) can be refunded. The CIR is calculated based on the claimed volume of eligible R&D expenditures by the Company. As a result, the CIR is presented as a deduction to “Research and development expenses” in the consolidated statements of operations. During the year ended December 31, 2014, 2015 and 2016, the Company recorded CIR in the amount of $675, $1,414 and $1,485 respectively.
Employee benefit plan:
Certain of the Company’s employees are eligible to participate in a defined contribution pension plan (the “Plan”). Participants in the Plan may elect to defer a portion of their pre-tax earnings into the Plan, which is run by an independent party. The Company makes pension contributions at rates varying up to 10% of the participant’s pensionable salary. Contributions to the Plan are recorded as an expense in the consolidated statements of operations.
F-15
Table of Contents
CEVA, INC.
NOTES TO THE CONSOLIDATED FINANCIAL STATEMENTS—(Continued)
(in thousands, except share data)
The Company’s U.S. operations maintain a retirement plan (the “U.S. Plan”) that qualifies as a deferred salary arrangement under Section 401(k) of the Internal Revenue Code. Participants in the U.S. Plan may elect to defer a portion of their pre-tax earnings, up to the Internal Revenue Service annual contribution limit. The Company matches 100% of each participant’s contributions up to a maximum of 6% of the participant’s base pay. Each participant may contribute up to 15% of base remuneration. Contributions to the U.S. Plan are recorded during the year contributed as an expense in the consolidated statements of operations.
Total contributions for the years ended December 31, 2014, 2015 and 2016 were $561, $733 and $1,020, respectively.
Accrued severance pay:
The liability of CEVA’s Israeli subsidiary for severance pay is calculated pursuant to Israeli severance pay law for all Israeli employees, based on the most recent salary of each employee multiplied by the number of years of employment for that employee as of the balance sheet date. The Israeli subsidiary’s liability is fully provided for by monthly deposits with severance pay funds, insurance policies and an accrual.
The deposited funds include profits and losses accumulated up to the balance sheet date. The deposited funds may be withdrawn only upon the fulfillment of the obligation pursuant to Israeli severance pay law or labor agreements. The value of these policies is recorded as an asset on the Company’s consolidated balance sheets.
Severance pay expenses, net of related income, for the years ended December 31, 2014, 2015 and 2016, were $1,113, $1,285 and $1,348, respectively.
Equity-based compensation:
The Company accounts for equity-based compensation in accordance with FASB ASC No. 718, “Stock Compensation” which requires the recognition of compensation expenses based on estimated fair values for all equity-based awards made to employees and non-employee directors.
The Company estimates the fair value of options and stock appreciation right (“SAR”) awards on the date of grant using an option-pricing model. The value of the portion of an award that is ultimately expected to vest is recognized as an expense over the requisite service period in the Company’s consolidated statements of income. The Company recognizes compensation expenses for the value of its options and SARs, which have graded vesting based on the accelerated attribution method over the requisite service period of each of the awards, net of estimated forfeitures. Estimated forfeitures are based on actual historical pre-vesting forfeitures and the rate is adjusted to reflect changes in facts and circumstances, if any. Estimated forfeiture rate will be revised if actual forfeitures differ from the initial estimates.
The Company recognizes compensation expenses for the value of its restricted stock unit (“RSU”) awards, based on the straight-line method over the requisite service period of each of the awards, net of estimated forfeitures. The fair value of each RSU is the market value as determined by the closing price of the common stock on the day of grant.
The Company uses the Monte-Carlo simulation model for options and SARs granted. The Monte-Carlo simulation model uses the assumptions noted below. Expected volatility was calculated based upon actual historical stock price movements over the most recent periods ending on the grant date, equal to the expected
F-16
Table of Contents
CEVA, INC.
NOTES TO THE CONSOLIDATED FINANCIAL STATEMENTS—(Continued)
(in thousands, except share data)
option and SAR term. The Company has historically not paid dividends and has no foreseeable plans to pay dividends. The risk-free interest rate is based on the yield from U.S. Treasury zero-coupon bonds with an equivalent term. The Monte-Carlo model also considers the suboptimal exercise multiple which is based on the average exercise behavior of the Company’s employees over the past years, the contractual term of the options and SARs, and the probability of termination or retirement of the holder of the options and SARs in computing the value of the options and SARs.
The fair value for the Company’s stock options and SARs (other than share issuances in connection with the employee stock purchase plan, as detailed below) granted to employees and non-employees directors was estimated using the following assumptions:
| 2014 | 2015 | 2016 (* | ||||
| Expected dividend yield |
0% | 0% | 0% | |||
| Expected volatility |
33%-52% | 33%-49% | 38%-49% | |||
| Risk-free interest rate |
0.1%-2.5% | 0.2%-2.4% | 0.5%-2.4% | |||
| Expected forfeiture (employees) |
10% | 10% | — | |||
| Expected forfeiture (executives) |
5% | 5% | 5% | |||
| Contractual term of up to |
10 years | 10 years | 10 years | |||
| Suboptimal exercise multiple (employees) |
2.1 | 2.1 | — | |||
| Suboptimal exercise multiple (executives) |
2.4 | 2.4 | 2.4 |
| (* | During 2016, the Company did not grant stock options nor SARs to its employees. |
The fair value for rights to purchase shares of common stock under the Company’s employee stock purchase plan was estimated on the date of grant using the following assumptions:
| 2014 | 2015 | 2016 | ||||
| Expected dividend yield |
0% | 0% | 0% | |||
| Expected volatility |
29%-52% | 35%-36% | 29%-57% | |||
| Risk-free interest rate |
0.1%-0.2% | 0.1%-0.3% | 0.3%-0.5% | |||
| Expected forfeiture |
0% | 0% | 0% | |||
| Contractual term of up to |
24 months | 24 months | 24 months |
During the years ended December 31, 2014, 2015 and 2016, the Company recognized equity-based compensation expense related to stock options, SARs, RSUs and employee stock purchase plan as follows:
| Year ended December 31, | ||||||||||||
| 2014 | 2015 | 2016 | ||||||||||
| Cost of revenue |
$ | 193 | $ | 155 | $ | 246 | ||||||
| Research and development, net |
2,027 | 1,838 | 2,860 | |||||||||
| Sales and marketing |
909 | 568 | 922 | |||||||||
| General and administrative |
1,882 | 1,454 | 2,208 | |||||||||
|
|
|
|
|
|
|
|||||||
| Total equity-based compensation expense |
$ | 5,011 | $ | 4,015 | $ | 6,236 | ||||||
|
|
|
|
|
|
|
|||||||
As of December 31, 2016, there was $1,724 of unrecognized compensation expense related to unvested stock options, SARs and employee stock purchase plan . This amount is expected to be recognized over a weighted-average period of 1.4 years. As of December 31, 2016, there was $7,559 of unrecognized compensation
F-17
Table of Contents
CEVA, INC.
NOTES TO THE CONSOLIDATED FINANCIAL STATEMENTS—(Continued)
(in thousands, except share data)
expense related to unvested RSUs. This amount is expected to be recognized over a weighted-average period of 1.5 years. To the extent the actual forfeiture rate is different from what the Company has estimated, equity-based compensation related to these awards will be different from the Company’s expectations.
FASB ASC No. 718 requires the cash flows resulting from the tax deductions in excess of the equity-based compensation costs recognized for those equity-based awards to be classified as financing cash flows. During the years ended December 31, 2014, 2015 and 2016, the Company classified $0, $112 and $0, respectively, of excess tax benefit from equity-based compensation as financing cash flows.
Fair value of financial instruments:
The carrying amount of cash, cash equivalents, short term bank deposits, trade receivables, other accounts receivable, trade payables and other accounts payable approximates fair value due to the short-term maturities of these instruments. Marketable securities and derivative instruments are carried at fair value. See Note 4 for more information.
Comprehensive income (loss):
The Company accounts for comprehensive income (loss) in accordance with FASB ASC No. 220, “Comprehensive Income.” This statement establishes standards for the reporting and display of comprehensive income (loss) and its components in a full set of general purpose financial statements. Comprehensive income (loss) generally represents all changes in stockholders’ equity during the period except those resulting from investments by, or distributions to, stockholders. The Company determined that its items of other comprehensive income (loss) relate to unrealized gains and losses, net of tax, on hedging derivative instruments and marketable securities.
Concentration of credit risk:
Financial instruments that potentially subject the Company to concentrations of credit risk consist principally of cash, cash equivalents, bank deposits, marketable securities, foreign exchange contracts and trade receivables. The Company invests its surplus cash in cash deposits and marketable securities in financial institutions and has established guidelines relating to diversification and maturities to maintain safety and liquidity of the investments.
The majority of the Company’s cash and cash equivalents are invested in high grade certificates of deposits with major U.S., European and Israeli banks. Generally, cash and cash equivalents and bank deposits may be redeemed on demand and therefore minimal credit risk exists with respect to them. Nonetheless, deposits with these banks exceed the Federal Deposit Insurance Corporation (“FDIC”) insurance limits or similar limits in foreign jurisdictions, to the extent such deposits are even insured in such foreign jurisdictions. While the Company monitors on a systematic basis the cash and cash equivalent balances in the operating accounts and adjust the balances as appropriate, these balances could be impacted if one or more of the financial institutions with which the Company deposit its funds fails or is subject to other adverse conditions in the financial or credit markets. To date the Company has experienced no loss of principal or lack of access to its invested cash or cash equivalents; however, the Company can provide no assurance that access to its invested cash and cash equivalents will not be affected if the financial institutions in which the Company holds its cash and cash equivalents fail. Furthermore, the Company holds an investment portfolio consisting principally of corporate bonds. The Company has the ability to hold such investments until recovery of temporary declines in market
F-18
Table of Contents
CEVA, INC.
NOTES TO THE CONSOLIDATED FINANCIAL STATEMENTS—(Continued)
(in thousands, except share data)
value or maturity; accordingly, as of December 31, 2016, the Company believes the losses associated with its investments are temporary and no impairment loss was recognized during 2016. However, the Company can provide no assurance that it will recover declines in the market value of its investments.
The Company is exposed primarily to fluctuations in the level of U.S. interest rates. To the extent that interest rates rise, fixed interest investments may be adversely impacted, whereas a decline in interest rates may decrease the anticipated interest income for variable rate investments.
The Company is exposed to financial market risks, including changes in interest rates. The Company typically does not attempt to reduce or eliminate its market exposures on its investment securities because the majority of its investments are short-term.
The Company’s trade receivables are geographically diverse, mainly in the United States, Europe and Asia Pacific. Concentration of credit risk with respect to trade receivables is limited by credit limits, ongoing credit evaluation and account monitoring procedures. The Company performs ongoing credit evaluations of its customers and to date has not experienced any material losses. The Company makes judgments on its ability to collect outstanding receivables and provides allowances for the portion of receivables for which collection becomes doubtful. Provisions are made based upon a specific review of all significant outstanding receivables. In determining the provision, the Company considers the expected collectability of receivables. Allowance for doubtful accounts amounted to $25 and $0 as of December 31, 2015 and 2016, respectively.
The Company has no off-balance-sheet concentration of credit risk.
Derivative and hedging activities:
The Company follows the requirements of FASB ASC No. 815,” Derivatives and Hedging” which requires companies to recognize all of their derivative instruments as either assets or liabilities in the statement of financial position at fair value. The accounting for changes in fair value (i.e., gains or losses) of a derivative instrument depends on whether it has been designated and qualifies as part of a hedging transaction and further, on the type of hedging transaction. For those derivative instruments that are designated and qualify as hedging instruments, a company must designate the hedging instrument, based upon the exposure being hedged, as a fair value hedge, cash flow hedge, or a hedge of a net investment in a foreign operation. Due to the Company’s global operations, it is exposed to foreign currency exchange rate fluctuations in the normal course of its business. The Company’s treasury policy allows it to offset the risks associated with the effects of certain foreign currency exposures through the purchase of foreign exchange forward or option contracts (“Hedging Contracts”). The policy, however, prohibits the Company from speculating on such Hedging Contracts for profit. To protect against the increase in value of forecasted foreign currency cash flow resulting from salaries paid in currencies other than the U.S. dollar during the year, the Company instituted a foreign currency cash flow hedging program. The Company hedges portions of the anticipated payroll of its non-U.S. employees denominated in the currencies other than the U.S. dollar for a period of one to twelve months with Hedging Contracts. Accordingly, when the dollar strengthens against the foreign currencies, the decline in present value of future foreign currency expenses is offset by losses in the fair value of the Hedging Contracts. Conversely, when the dollar weakens, the increase in the present value of future foreign currency expenses is offset by gains in the fair value of the Hedging Contracts. These Hedging Contracts are designated as cash flow hedges.
For derivative instruments that are designated and qualify as a cash flow hedge (i.e., hedging the exposure to variability in expected future cash flows that is attributable to a particular risk), the effective portion of the gain
F-19
Table of Contents
CEVA, INC.
NOTES TO THE CONSOLIDATED FINANCIAL STATEMENTS—(Continued)
(in thousands, except share data)
or loss on the derivative instrument is reported as a component of other comprehensive income (loss) and reclassified into earnings in the same period or periods during which the hedged transaction affects earnings. Any gain or loss on a derivative instrument in excess of the cumulative change in the present value of future cash flows of the hedged item is recognized in current earnings during the period of change. As of December 31, 2015 and 2016, the notional principal amount of the Hedging Contracts to sell U.S. dollars held by the Company was $3,200 and $3,300, respectively.
Advertising expenses:
Advertising expenses are charged to consolidated statements of income as incurred. Advertising expenses for the years ended December 31, 2014, 2015 and 2016 were $792, $928 and $1,033, respectively.
Treasury stock:
The Company repurchases its common stock from time to time pursuant to a board-authorized share repurchase program through open market purchases and repurchase plans in accordance with Rules 10b5-1 and 10b-18 of the United States Securities Exchange Act of 1934, as amended.
The repurchases of common stock are accounted for as treasury stock, and result in a reduction of stockholders’ equity. When treasury shares are reissued, the Company accounts for the reissuance in accordance with FASB ASC No. 505-30, “Treasury Stock” and charges the excess of the repurchase cost over issuance price using the weighted average method to retained earnings . The purchase cost is calculated based on the specific identified method. In the case where the repurchase cost over issuance price using the weighted average method is lower than the issuance price, the Company credits the difference to additional paid-in capital.
Net income (loss) per share of common stock:
Basic net income (loss) per share is computed based on the weighted average number of shares of common stock outstanding during each year. Diluted net income (loss) per share is computed based on the weighted average number of shares of common stock outstanding during each year, plus dilutive potential shares of common stock considered outstanding during the year, in accordance with FASB ASC No. 260, “Earnings Per Share.”
| Year ended December 31, | ||||||||||||
| 2014 | 2015 | 2016 | ||||||||||
| Numerator: |
||||||||||||
| Net income (loss) |
$ | (819 | ) | $ | 6,267 | $ | 13,100 | |||||
| Denominator (in thousands): |
||||||||||||
| Basic weighted-average common stock outstanding |
20,622 | 20,480 | 20,850 | |||||||||
| Effect of stock options, stock appreciation rights and restricted stock units |
— | 509 | 715 | |||||||||
|
|
|
|
|
|
|
|||||||
| Diluted weighted-average common stock outstanding |
20,622 | 20,989 | 21,565 | |||||||||
|
|
|
|
|
|
|
|||||||
| Basic net income (loss) per share |
$ | (0.04 | ) | $ | 0.31 | $ | 0.63 | |||||
|
|
|
|
|
|
|
|||||||
| Diluted net income (loss) per share |
$ | (0.04 | ) | $ | 0.30 | $ | 0.61 | |||||
|
|
|
|
|
|
|
|||||||
F-20
Table of Contents
CEVA, INC.
NOTES TO THE CONSOLIDATED FINANCIAL STATEMENTS—(Continued)
(in thousands, except share data)
The weighted-average number of shares related to outstanding options, SARs and RSUs excluded from the calculation of diluted net income per share, since their effect was anti-dilutive, were 820,631 and 282,696 shares for the years ended December 31, 2015 and 2016, respectively. The total number of shares related to the outstanding options excluded from the calculation of diluted net loss per share was 3,316,380 for the year ended December 31, 2014.
Recently Issued and Adopted Accounting Pronouncement:
(a) Revenue recognition
In May 2014, the FASB issued a new standard related to revenue recognition. Under the new standard, revenue is recognized when a customer obtains control of promised goods or services and is recognized in an amount that reflects the consideration which the entity expects to receive in exchange for those goods or services. In addition, the standard requires disclosure of the nature, amount, timing, and uncertainty of revenue and cash flows arising from contracts with customers. The FASB has recently issued several amendments to the standard, including clarification on identifying performance obligations.
The guidance permits two methods of modification: retrospectively to each prior reporting period presented (full retrospective method), or retrospectively with the cumulative effect of initially applying the guidance recognized at the date of initial application (the cumulative catch-up transition method). The Company currently anticipates adopting the standard using the modified retrospective method rather than full retrospective method.
The new standard will be effective for the Company beginning January 1, 2018, but adoption as of the original effective date of January 1, 2017 is permitted. The Company will adopt the new standard as of January 1, 2018.
The Company has made progress toward completing its evaluation of the potential changes from adopting this new standard on its financial reporting and disclosures. The Company has evaluated the impact of the standard on majority of its revenue streams and associated contracts. The Company expects to complete the contract evaluations and validate the results during the first half of 2017. The Company formed an implementation work group and expects to complete the evaluation of the impact of the accounting and disclosure changes on its business processes, controls and systems throughout 2017, design any changes to such business processes, controls and systems, and implement the changes before the end of 2017.
Under the new standard, an entity recognizes revenue when or as it satisfies a performance obligation by transferring IP license or services to the customer, either at a point in time or over time. The Company expects to continue to recognize most of its revenue at a point in time upon delivery of its products. The Company expects to recognize revenue over time on significant license customization contracts that are covered by contract accounting standards using cost inputs to measure progress toward completion of its performance obligations, which is similar to the current method.
Based on its current analysis the most significant effect, if any, will be related to certain deliverables that may be considered as a distinct performance obligations separate from other performance obligations and will be measured using the relative standalone selling price basis.
F-21
Table of Contents
CEVA, INC.
NOTES TO THE CONSOLIDATED FINANCIAL STATEMENTS—(Continued)
(in thousands, except share data)
In addition incremental costs that are related to sales from contracts signed during the period would require capitalization. The company also will consider if there is a significant financing component if the time between payment and performance is more than one year.
The Company continues to assess all potential impacts under the new revenues standard.
(b) Other accounting standards
In February 2016, the FASB issued ASU 2016-02, “Leases (Topic 842),” which will replace the existing guidance in ASC 840, “Leases.” The updated standard aims to increase transparency and comparability among organizations by requiring lessees to recognize lease assets and lease liabilities on the balance sheet and requiring disclosure of key information about leasing arrangements. This ASU is effective for annual periods beginning after December 15, 2018, and interim periods within those annual periods; early adoption is permitted and modified retrospective application is required. The Company is in the process of evaluating this guidance to determine the impact it will have on its financial statements and related disclosures.
In March 2016, the FASB issued ASU 2016-09, “Compensation-Stock Compensation,” which simplifies several aspects of the accounting for share-based payments, including immediate recognition of all excess tax benefits and deficiencies in the income statement, changing the threshold to qualify for equity classification up to the employees’ maximum statutory tax rates, allowing an entity-wide accounting policy election to either estimate the number of awards that are expected to vest or account for forfeitures as they occur, and clarifying the classification on the statement of cash flows for the excess tax benefit and employee taxes paid when an employer withholds shares for tax-withholding purposes. The amendments in this update became effective on January 1, 2017. The Company’s adoption of ASU 2016-09 will not have a material impact on its consolidated financial statements.
The FASB issued ASU 2016-13 “Measurement of Credit Losses on Financial Instruments” requiring an allowance to be recorded for all expected credit losses for financial assets. The allowance for credit losses is based on historical information, current conditions and reasonable and supportable forecasts. The new standard also makes revisions to the other than temporary impairment model for available-for-sale debt securities. Disclosures of credit quality indicators in relation to the amortized cost of financing receivables are further disaggregated by year of origination. The new accounting guidance is effective for interim and annual periods beginning after December 15, 2019 with early adoption permitted for interim and annual periods beginning after December 15, 2018. The amendments will be applied through a cumulative-effect adjustment to retained earnings as of the beginning of the first reporting period in which the guidance is effective. The Company is analyzing the impact of this new standard and, at this time, cannot estimate the impact of adoption on its net income. The Company plans to adopt ASU 2016-13 effective January 1, 2020.
In August 2016, FASB issued ASU 2016-15, “Statement of Cash Flows (Topic 230): Classification of Certain Cash Receipts and Cash Payments.” This update will make eight targeted changes to how cash receipts and cash payments are presented and classified in the statement of cash flows. The update is effective for fiscal years beginning after December 15, 2017. The new standard will require adoption on a retrospective basis unless it is impracticable to apply, in which case it would be required to apply the amendments prospectively as of the earliest date practicable. The Company is currently evaluating the effect of this update on its consolidated financial statements and related disclosures.
In January 2017, the FASB issued ASU No. 2017-04, Intangibles: Goodwill and Other: Simplifying the Test for Goodwill Impairment. To simplify the subsequent measurement of goodwill, the amendments eliminate Step 2
F-22
Table of Contents
CEVA, INC.
NOTES TO THE CONSOLIDATED FINANCIAL STATEMENTS—(Continued)
(in thousands, except share data)
from the goodwill impairment test. The annual, or interim, goodwill impairment test is performed by comparing the fair value of a reporting unit with its carrying amount. An impairment charge should be recognized for the amount by which the carrying amount exceeds the reporting unit’s fair value; however, the loss recognized should not exceed the total amount of goodwill allocated to that reporting unit. In addition, the income tax effects of tax deductible goodwill on the carrying amount of the reporting unit should be considered when measuring the goodwill impairment loss, if applicable. The amendments also eliminate the requirements for any reporting unit with a zero or negative carrying amount to perform Step 2 of the goodwill impairment test. An entity still has the option to perform the qualitative assessment for a reporting unit to determine if the qualitative impairment test is necessary. The amendments should be applied on a prospective basis. The nature of and reason for the change in accounting principle should be disclosed upon transition. The amendments in this update should be adopted for annual or any interim goodwill impairment tests in fiscal years beginning after December 15, 2019. Early adoption is permitted on testing dates after January 1, 2017. The Company is currently evaluating the impact of adopting this new guidance on its consolidated financial statements, but it is not expected to have a material impact.
In January 2017, the FASB issued ASU No. 2017-01, Business Combinations (Topic 805): Clarifying the Definition of a Business. The amendments in this update provide a more robust framework to use in determining when a set of assets and activities is a business. Because the current definition of a business is interpreted broadly and can be difficult to apply, stakeholders indicated that analyzing transactions is inefficient and costly and that the definition does not permit the use of reasonable judgment. The amendments provide more consistency in applying the guidance, reduce the costs of application, and make the definition of a business more operable. The amendments in this update become effective for annual periods and interim periods within those annual periods beginning after December 15, 2017. The Company is currently evaluating the impact of adopting this new guidance on its consolidated financial statements, but it is not expected to have a material impact.
In 2016, the company adopted ASU 2014-15, Disclosure of Uncertainties about an Entity’s Ability to Continue as a Going Concern (ASU 2014-15), that provides guidance on management’s responsibility in evaluating whether there is substantial doubt about a company’s ability to continue as a going concern and to provide related footnote disclosures. The adoption of ASU 2014-15 did not have an impact on the Company’s consolidated financial statements or related disclosures.
NOTE 2: ACQUISITION OF RIVIERAWAVES
On July 4, 2014 (the “Closing Date”), the Company acquired 100% of RivieraWaves SAS (“RivieraWaves”), a privately-held, French-based company and a provider of wireless connectivity intellectual property for Wi-Fi and Bluetooth technologies. The Company agreed to pay an aggregate of $18,378 to acquire RivieraWaves with $14,678 paid on the Closing Date and the remaining amount of $3,700 payable upon the satisfaction of certain milestones (the “Contingent Consideration”). The Contingent Consideration was recognized as a liability at fair value. During 2015, the Company fully paid the Contingent Consideration.
In addition, the Company incurred acquisition-related costs in an amount of $310, which were included in general and administrative expenses for the year ended December 31, 2014.
The acquisition was accounted in accordance with Financial Accounting Standards Board (“FASB”) Accounting Standards Codification (“ASC”) No. 805, “Business Combinations.” Under the acquisition method of accounting, the total purchase price was allocated to the net tangible and intangible assets of RivieraWaves acquired in the acquisition, based on their fair values on the Closing Date.
F-23
Table of Contents
CEVA, INC.
NOTES TO THE CONSOLIDATED FINANCIAL STATEMENTS—(Continued)
(in thousands, except share data)
The results of operations of RivieraWaves are included in the Company’s consolidated financial statements as of the Closing Date. The primary rationale for this acquisition was to further expand CEVA’s non-cellular baseband business into advanced technology offerings in connectivity, including Wi-Fi and Bluetooth IP. The goodwill is primarily attributable to expected synergies resulting from the acquisition.
In addition, as part of the acquisition, the Company established an employee retention plan for the RivieraWaves employees at a cost of approximately $3,400, to be payable on a semiannual basis for a period of two years after the Closing Date. As of December 31, 2016, the Company fully paid the employee retention plan.
Details of the fair value of consideration transferred and the purchase price allocation are as follows:
| (a) | Consideration transferred: |
| Cash |
$ | 14,678 | ||
| Fair value of Contingent Consideration |
3,434 | |||
|
|
|
|||
| Total |
$ | 18,112 | ||
|
|
|
| (b) | Under business combination accounting, the total purchase price was allocated to RivieraWaves’ net tangible and intangible assets based on their estimated fair values as set forth below. The excess of the purchase price over the net tangible and identifiable intangible assets was recorded as goodwill. |
| Cash and cash equivalents |
$ | 1,189 | ||
| Bank deposits |
1,384 | |||
| Other assets |
2,898 | |||
| Intangible assets |
6,161 | |||
| Goodwill |
10,114 | |||
|
|
|
|||
| Total assets |
21,746 | |||
| Current liabilities |
(2,201 | ) | ||
| Deferred tax liabilities, net |
(1,433 | ) | ||
|
|
|
|||
| Total liabilities |
(3,634 | ) | ||
| Total |
$ | 18,112 | ||
|
|
|
In performing the purchase price allocation, the Company considered, among other factors, analysis of historical financial performance, highest and best use of the acquired assets and estimates of future performance of RivieraWaves’ products. In its allocation, the Company also considered the fair value of intangible assets based on a market participant approach to valuation performed by a third party valuation firm using an income approach and estimates and assumptions provided by management. The following table sets forth the components of intangible assets associated with the RivieraWaves acquisition:
| Fair value | ||||
| Core technologies (1) |
$ | 5,796 | ||
| Customer relationships (2) |
272 | |||
| Customer backlog (3) |
93 | |||
|
|
|
|||
| Total intangible assets |
$ | 6,161 | ||
|
|
|
|||
F-24
Table of Contents
CEVA, INC.
NOTES TO THE CONSOLIDATED FINANCIAL STATEMENTS—(Continued)
(in thousands, except share data)
| (1) | Core technologies represent a combination of RivieraWaves’ processes and trade secrets related to the design and development of its products. This proprietary know-how can be leveraged to develop new technology and improve the Company’s products and is amortized using the straight line method. |
| (2) | Customer relationships represent the underlying relationships and agreements with RivieraWaves’ installed customer base and are amortized using the straight line method. |
| (3) | Customer backlog represents an order or production backlog arises from contracts or sales orders and are amortized using the straight line method. |
NOTE 3: MARKETABLE SECURITIES
The following is a summary of available-for-sale marketable securities at December 31, 2015 and 2016:
| As at December 31, 2016 | ||||||||||||||||
| Amortized cost |
Gross unrealized gains |
Gross unrealized losses |
Fair value |
|||||||||||||
| Available-for-sale—matures within one year: |
||||||||||||||||
| Corporate bonds |
$ | 9,456 | $ | 4 | $ | (15 | ) | $ | 9,445 | |||||||
|
|
|
|
|
|
|
|
|
|||||||||
| 9,456 | 4 | (15 | ) | 9,445 | ||||||||||||
| Available-for-sale—matures after one year through five years: |
||||||||||||||||
| Government bonds |
501 | — | (4 | ) | 497 | |||||||||||
| Corporate bonds |
52,490 | 3 | (567 | ) | 51,926 | |||||||||||
|
|
|
|
|
|
|
|
|
|||||||||
| 52,991 | 3 | (571 | ) | 52,423 | ||||||||||||
| Total |
$ | 62,447 | $ | 7 | $ | (586 | ) | $ | 61,868 | |||||||
|
|
|
|
|
|
|
|
|
|||||||||
| As at December 31, 2015 | ||||||||||||||||
| Amortized cost |
Gross unrealized gains |
Gross unrealized losses |
Fair value |
|||||||||||||
| Available-for-sale—matures within one year: |
||||||||||||||||
| Certificate of deposits |
$ | 1 | $ | — | $ | — | $ | 1 | ||||||||
| Corporate bonds |
9,257 | 1 | (50 | ) | 9,208 | |||||||||||
|
|
|
|
|
|
|
|
|
|||||||||
| 9,258 | 1 | (50 | ) | 9,209 | ||||||||||||
| Available-for-sale—matures after one year through three years: : |
||||||||||||||||
| Corporate bonds |
39,501 | — | (444 | ) | 39,057 | |||||||||||
|
|
|
|
|
|
|
|
|
|||||||||
| 39,501 | — | (444 | ) | 39,057 | ||||||||||||
| Total |
$ | 48,759 | $ | 1 | $ | (494 | ) | $ | 48,266 | |||||||
|
|
|
|
|
|
|
|
|
|||||||||
F-25
Table of Contents
CEVA, INC.
NOTES TO THE CONSOLIDATED FINANCIAL STATEMENTS—(Continued)
(in thousands, except share data)
The following table presents gross unrealized losses and fair values for those investments that were in an unrealized loss position as of December 31, 2015 and 2016, and the length of time that those investments have been in a continuous loss position:
| Less than 12 months | 12 months or greater | |||||||||||||||
| Fair Value |
Gross unrealized loss |
Fair Value |
Gross unrealized loss |
|||||||||||||
| As of December 31, 2016 |
$ | 48,663 | $ | (557 | ) | $ | 4,875 | $ | (29 | ) | ||||||
| As of December 31, 2015 |
$ | 32,695 | $ | (389 | ) | $ | 14,488 | $ | (105 | ) | ||||||
As of December 31, 2015 and 2016, management believes the impairments are not other than temporary and therefore the impairment losses were recorded in accumulated other comprehensive income (loss).
The following table presents gross realized gains and losses from sale of available-for-sale marketable securities:
| Year ended December 31, |
||||||||||||
| 2014 | 2015 | 2016 | ||||||||||
| Gross realized gains from sale of available-for-sale marketable securities |
$ | 99 | $ | 4 | $ | 24 | ||||||
| Gross realized losses from sale of available-for-sale marketable securities |
$ | (93 | ) | $ | (82 | ) | $ | (33 | ) | |||
NOTE 4: FAIR VALUE MEASUREMENT
FASB ASC No. 820, “Fair Value Measurements and Disclosures” defines fair value, establishes a framework for measuring fair value. Fair value is an exit price, representing the amount that would be received for selling an asset or paid for the transfer of a liability in an orderly transaction between market participants. As such, fair value is a market-based measurement that should be determined based on assumptions that market participants would use in pricing an asset or a liability. A three-tier fair value hierarchy is established as a basis for considering such assumptions and for inputs used in the valuation methodologies in measuring fair value:
| Level I |
Unadjusted quoted prices in active markets that are accessible on the measurement date for identical, unrestricted assets or liabilities; | |
| Level II |
Quoted prices in markets that are not active, or inputs that are observable, either directly or indirectly, for substantially the full term of the asset or liability; and | |
| Level III |
Prices or valuation techniques that require inputs that are both significant to the fair value measurement and unobservable (supported by little or no market activity). | |
The Company measures its marketable securities and foreign currency derivative contracts at fair value. Marketable securities and foreign currency derivative contracts are classified within Level II as the valuation inputs are based on quoted prices and market observable data of similar instruments.
F-26
Table of Contents
CEVA, INC.
NOTES TO THE CONSOLIDATED FINANCIAL STATEMENTS—(Continued)
(in thousands, except share data)
The table below sets forth the Company’s assets and liabilities measured at fair value by level within the fair value hierarchy. Assets and liabilities are classified in their entirety based on the lowest level of input that is significant to the fair value measurement.
| Description | December 31, 2016 |
Level I | Level II | Level III | ||||||||||||
| Assets: |
||||||||||||||||
| Marketable securities: |
||||||||||||||||
| Government bonds |
$ | 497 | — | $ | 497 | — | ||||||||||
| Corporate bonds |
61,371 | — | 61,371 | — | ||||||||||||
| Foreign exchange contracts |
6 | — | 6 | — | ||||||||||||
| Description | December 31, 2015 |
Level I | Level II | Level III | ||||||||||||
| Assets: |
||||||||||||||||
| Marketable securities: |
||||||||||||||||
| Certificate of deposits |
$ | 1 | — | $ | 1 | — | ||||||||||
| Corporate bonds |
$ | 48,265 | — | $ | 48,265 | — | ||||||||||
| Foreign exchange contracts |
9 | — | 9 | — | ||||||||||||
NOTE 5: PROPERTY AND EQUIPMENT, NET
Composition of assets, grouped by major classifications, is as follows:
| As at December 31, | ||||||||
| 2015 | 2016 | |||||||
| Cost: |
||||||||
| Computers, software and equipment |
$ | 13,503 | $ | 10,031 | ||||
| Office furniture and equipment |
759 | 766 | ||||||
| Leasehold improvements |
1,865 | 2,204 | ||||||
|
|
|
|
|
|||||
| 16,127 | 13,001 | |||||||
| Less—Accumulated depreciation |
(12,396 | ) | (8,196 | ) | ||||
|
|
|
|
|
|||||
| Property and equipment, net |
$ | 3,731 | $ | 4,805 | ||||
|
|
|
|
|
|||||
NOTE 6: INTANGIBLE ASSETS, NET
| Year ended December 31, 2015 | Year ended December 31, 2016 | |||||||||||||||||||||||||||
| Weighted Average Amortization Period (Years) |
Gross Carrying Amount |
Accumulated Amortization |
Net | Gross Carrying Amount |
Accumulated Amortization |
Net | ||||||||||||||||||||||
| Intangible assets—amortizable: |
||||||||||||||||||||||||||||
| Customer relationships |
4.5 | 272 | 91 | 181 | 272 | 151 | 121 | |||||||||||||||||||||
| Customer backlog |
1.5 | 93 | 93 | — | 93 | 93 | — | |||||||||||||||||||||
| Core technologies |
5.1 | 5,796 | 1,763 | 4,033 | 5,796 | 2,939 | 2,857 | |||||||||||||||||||||
|
|
|
|
|
|
|
|
|
|
|
|
|
|||||||||||||||||
| Total intangible assets |
$ | 6,161 | $ | 1,947 | $ | 4,214 | $ | 6,161 | $ | 3,183 | $ | 2,978 | ||||||||||||||||
|
|
|
|
|
|
|
|
|
|
|
|
|
|||||||||||||||||
F-27
Table of Contents
CEVA, INC.
NOTES TO THE CONSOLIDATED FINANCIAL STATEMENTS—(Continued)
(in thousands, except share data)
Future estimated annual amortization charges are as follows:
| 2017 |
1,236 | |||
| 2018 |
901 | |||
| 2019 |
841 | |||
|
|
|
|||
| $ | 2,978 | |||
|
|
|
NOTE 7: ACCRUED EXPENSES AND OTHER PAYABLES
| As at December 31, | ||||||||
| 2015 | 2016 | |||||||
| Engineering accruals |
807 | 466 | ||||||
| Professional fees |
642 | 583 | ||||||
| Government grants |
288 | 263 | ||||||
| Income taxes payable, net |
830 | 1,489 | ||||||
| Other |
1,066 | 1,214 | ||||||
|
|
|
|
|
|||||
| $ | 3,633 | $ | 4,015 | |||||
|
|
|
|
|
|||||
NOTE 8: STOCKHOLDERS’ EQUITY
a. Common stock:
Holders of common stock are entitled to one vote per share on all matters to be voted upon by the Company’s stockholders. In the event of a liquidation, dissolution or winding up of the Company, holders of common stock are entitled to share ratably in all of the Company’s assets. The Board of Directors may declare a dividend out of funds legally available therefore and the holders of common stock are entitled to receive ratably any such dividends. Holders of common stock have no preemptive rights or other subscription rights to convert their shares into any other securities.
b. Preferred stock:
The Company is authorized to issue up to 5,000,000 shares of “blank check” preferred stock, par value $0.001 per share. Such preferred stock may be issued by the Board of Directors from time to time in one or more series. These series may have designations, preferences and relative, participating, optional or other special rights and any qualifications, limitations or restrictions thereof, including dividend rights, conversion rights, exchange rights, voting rights, redemption rights (including sinking and purchase fund provisions), and dissolution preferences as may be determined by the Company’s Board of Directors.
c. Share repurchase program:
In August 2008, the Company announced that its Board of Directors approved a share repurchase program for up to one million shares of common stock which was further extended by an additional four million shares in 2010 and 2013. In October 2014, the Company’s Board of Directors authorized the repurchase by the Company of an additional one million shares of common stock pursuant to Rule 10b-18 of the Exchange Act. As of December 31, 2016, 311,056 shares of common stock remained authorized for repurchase under to the Company’s share repurchase program.
F-28
Table of Contents
CEVA, INC.
NOTES TO THE CONSOLIDATED FINANCIAL STATEMENTS—(Continued)
(in thousands, except share data)
In 2014, the Company repurchased 1,227,148 shares of common stock at an average purchase price of $15.20 per share for an aggregate purchase price of $18,657. In 2015, the Company repurchased 508,931 shares of common stock at an average purchase price of $19.80 per share for an aggregate purchase price of $10,078. In 2016, the Company repurchased 180,013 shares of common stock at an average purchase price of $18.98 per share for an aggregate purchase price of $3,417.
d. Employee and non-employee stock plans:
The Company grants a mix of stock options, SARs capped with a ceiling and RSUs to employees and non-employee directors of the Company and its subsidiaries under the Company’s equity plans and provides the right to purchase common stock pursuant to the Company’s 2002 employee stock purchase plan to employees of the Company and its subsidiaries.
The SAR unit confers the holder the right to stock appreciation over a preset price of the Company’s common stock during a specified period of time. When the unit is exercised, the appreciation amount is paid through the issuance of shares of the Company’s common stock. The ceiling limits the maximum income for each SAR unit. SARs are considered an equity instrument as it is a net share settled award capped with a ceiling (400% for SAR grants made in 2014 and 2015. No SARs were granted in 2016). The options and SARs granted under the Company’s stock incentive plans have been granted at the fair market value of the Company’s common stock on the grant date. Options and SARs granted to employees under stock incentive plans vest at a rate of 25% of the shares underlying the option after one year and the remaining shares vest in equal portions over the following 36 months, such that all shares are vested after four years. Options granted to non-employee directors vest 25% of the shares underlying the option on each anniversary of the option grant. RSUs granted to employees under stock incentive plans vest as to 1/3 on each anniversary of the grant date. RSUs granted to non-employee directors under stock incentive plans vest fully one year after the grant date.
In connection with the Company’s acquisition of RivieraWaves, on July 7, 2014, the Company issued an aggregate of 113,000 SARs to 27 employees of RivieraWaves who joined the Company in connection with the acquisition. The value of these grants was not included in the acquisition price of RivieraWaves. The SARs were granted outside of the Company’s existing equity plans and were granted as a material inducement to such individuals entering into employment with the Company, in accordance with NASDAQ Listing Rule 5635(c)(4). All of the SARs were priced at $15.17, the fair market value on the grant date, and will vest over four years, with 25% of the SARs vesting after one year and the remaining vest in equal portions over the following 36 months, such that all SARs will vest after four years, subject to the employee’s continuous service through each vesting date. The SARs have a ceiling limit for maximum income capped at 400%, expire seven years from the grant date and are subject to the terms and condition of the individual SAR agreements. The SAR grants were approved by the compensation committee of the Board of Directors of the Company.
F-29
Table of Contents
CEVA, INC.
NOTES TO THE CONSOLIDATED FINANCIAL STATEMENTS—(Continued)
(in thousands, except share data)
A summary of the Company’s stock option and SARs activities and related information for the year ended December 31, 2016, is as follows:
| Number of options and SAR units |
Weighted average exercise price |
Weighted average remaining contractual term |
Aggregate intrinsic- value |
|||||||||||||
| Outstanding at the beginning of the year |
2,406,455 | $ | 18.15 | |||||||||||||
| Granted (1) |
104,000 | 28.42 | ||||||||||||||
| Exercised |
(1,012,151 | ) | 16.89 | |||||||||||||
| Forfeited or expired |
(42,396 | ) | 17.93 | |||||||||||||
|
|
|
|
|
|||||||||||||
| Outstanding at the end of the year (2) |
1,455,908 | $ | 19.76 | 4.7 | $ | 20,077 | ||||||||||
|
|
|
|
|
|
|
|
|
|||||||||
| Vested or expected to vest at the end of the year |
1,422,492 | $ | 19.78 | 4.7 | $ | 19,587 | ||||||||||
|
|
|
|
|
|
|
|
|
|||||||||
| Exercisable at the end of the year (3) |
972,229 | $ | 19.88 | 3.9 | $ | 13,286 | ||||||||||
|
|
|
|
|
|
|
|
|
|||||||||
| (1) | In 2016, the Company granted 104,000 stock options only to non-employee directors of the Company. No SARs were granted during 2016. |
| (2) | Due to the ceiling imposed on the SAR grants, the outstanding amount equals a maximum of 1,305,719 shares of the Company’s common stock issuable upon exercise. |
| (3) | Due to the ceiling imposed on the SAR grants, the exercisable amount equals a maximum of 882,273 shares of the Company’s common stock issuable upon exercise. |
The weighted average fair value of options and SARs granted during the years ended December 2014 and 2015 was $6.1 and $7.8 per share, respectively. The weighted average fair value of options granted during the year ended December 2016 was $12.9 per share. The total intrinsic value of options and SARs exercised during the years ended December 31, 2014, 2015 and 2016 was $1,372, $8,960 and $12,282, respectively.
The options and SARs granted to employees of the Company and its subsidiaries and the options granted to non-employee directors of the Company which were outstanding as of December 31, 2016 have been classified into a range of exercise prices as follows:
| Outstanding | Exercisable | |||||||||||||||||||||||
| Exercise price (range) |
Number of options |
Weighted average remaining contractual life (years) |
Weighted average exercise price |
Number of options |
Weighted average remaining contractual life (years) |
Weighted average exercise price |
||||||||||||||||||
| 12.60-15.54 |
396,969 | 4.7 | $ | 14.63 | 237,614 | 4.1 | $ | 14.59 | ||||||||||||||||
| 16.08-18.62 |
381,257 | 4.1 | $ | 16.72 | 292,617 | 4.1 | $ | 16.73 | ||||||||||||||||
| 19.36-24.86 |
438,579 | 4.4 | $ | 21.65 | 306,895 | 3.4 | $ | 22.26 | ||||||||||||||||
| 27.01-32.34 |
239,103 | 6.4 | $ | 29.67 | 135,103 | 3.9 | $ | 30.62 | ||||||||||||||||
|
|
|
|
|
|||||||||||||||||||||
| 1,455,908 | 4.7 | $ | 19.76 | 972,229 | 3.9 | $ | 19.88 | |||||||||||||||||
|
|
|
|
|
|
|
|
|
|
|
|
|
|||||||||||||
A RSU award is an agreement to issue shares of the Company’s common stock at the time the award or a portion thereof vests. RSUs granted to employees generally vest in three equal annual installments starting on the first anniversary of the grant date. RSUs granted to non-employee directors generally vest in full on the first anniversary of the grant date.
F-30
Table of Contents
CEVA, INC.
NOTES TO THE CONSOLIDATED FINANCIAL STATEMENTS—(Continued)
(in thousands, except share data)
A summary of the Company’s RSU activities and related information for the year ended December 31, 2016, is as follows:
| Number of RSUs |
Weighted average Grant-Date fair value |
|||||||
| Unvested as at the beginning of the year |
234,000 | $ | 19.89 | |||||
| Granted |
394,417 | 22.05 | ||||||
| Vested |
(99,972 | ) | 19.73 | |||||
| Forfeited |
(23,303 | ) | 20.16 | |||||
|
|
|
|||||||
| Unvested at the end of the year |
505,142 | $ | 21.59 | |||||
|
|
|
|
|
|||||
| Expected to vest at the end of the year |
463,757 | $ | 21.58 | |||||
|
|
|
|
|
|||||
Stock Plans
As of December 31, 2016, the Company maintains the Company’s 2003 Director Stock Option Plan (the “Director Plan”) and the 2011 Stock Incentive Plan (the “2011 Plan” and together with the Director Plan, the “Stock Plans”).
As of December 31, 2016, options, SARs and RSUs to purchase 756,244 shares of common stock were available for grant under the Stock Plans.
2011 Stock Incentive Plan
The 2011 Plan was adopted by the Company’s Board of Directors in February 2011 and stockholders on May 17, 2011. Up to 1,750,000 shares of common stock (subject to adjustment in the event of future stock splits, future stock dividends or other similar changes in the common stock or the Company’s capital structure), plus the number of shares that remain available for grant of awards under the Company’s 2002 Stock Incentive Plan (the “2002 Plan), plus any shares that would otherwise return to the 2002 Plan as a result of forfeiture, termination or expiration of awards previously granted under the 2002 plan (subject to adjustment in the event of stock splits and other similar events), are reserved for issuance under the 2011 Plan. The 2002 Plan was automatically terminated and replaced and superseded by the 2011 Plan, except that any awards previously granted under the 2002 Plan shall remain in effect pursuant to their term.
The 2011 Plan provides for the grant of incentive stock options intended to qualify under Section 422 of the Internal Revenue Code, nonqualified stock options, restricted stock, RSUs, dividend equivalent rights and stock appreciation rights. Officers, employees, directors, outside consultants and advisors of the Company and those of the Company’s present and future parent and subsidiary corporations are eligible to receive awards under the 2011 Plan. Under current U.S. tax laws, incentive stock options may only be granted to employees. The 2011 Plan permits the Company’s Board of Directors or a committee thereof to determine how grantees may pay the exercise or purchase price of their awards.
Unless sooner terminated, the 2011 Plan is effective until February 2021.
The Company’s Board of Directors or a committee thereof has authority to administer the 2011 Plan. The Company’s Board of Directors has the authority to adopt, amend and repeal the administrative rules, guidelines and practices relating to the 2011 Plan and to interpret its provisions.
F-31
Table of Contents
CEVA, INC.
NOTES TO THE CONSOLIDATED FINANCIAL STATEMENTS—(Continued)
(in thousands, except share data)
2003 Director Stock Option Plan
Under the Director Plan, 1,350,000 shares of common stock (subject to adjustment in the event of future stock splits, future stock dividends or other similar changes in the common stock or the Company’s capital structure) are authorized for issuance.
The Director Plan provides for the grant of nonqualified stock options to non-employee directors. Options must be granted at an exercise price equal to the fair market value of the common stock on the date of grant. Options may not be granted for a term in excess of ten years.
Under the original terms of the Director Plan, (a) any person who becomes a non-employee director of the Company was automatically granted an option to purchase 38,000 shares of common stock, (b) on June 30 of each year, beginning in 2004, each non-employee director who had served on the Company’s Board of Directors for at least six (6) months as of such date was automatically granted an option with the exercise price being the fair market value of the Company’s common stock as of July 1st of each year to purchase 13,000 shares of common stock, and each non-employee director would receive an option with the exercise price being the fair market value of the Company’s common stock as of July 1st of each year to purchase 13,000 shares of common stock for each committee on which he or she had served as chairperson for at least six months prior to such date, and (c) the Chairman of the Board was granted an additional option with the exercise price being the fair market value of the Company’s common stock as of July 1st of each year to purchase 15,000 shares of common stock on an annual basis. In February 2015, the Board suspended the automatic grant of stock options to each non-employee director and the Chairman of the Board under the Director Plan. In lieu of the automatic stock option grants under the Director Plan, the Board approved an equity award to all directors of the Company consisting of a mix of stock options granted under the Director Plan and RSUs granted under the 2011 Plan. For 2016, the directors of the Company received in the aggregate 66,000 stock options and 23,517 RSUs.
On December 8, 2016, the Company’s Board of Directors unanimously approved the appointment of Maria Marced as an independent member of the Board of Directors. In accordance with the Company’s Director Plan, Ms. Marced received a stock option award to purchase 38,000 shares of the Company’s common stock under the Company’s Director Plan.
The Company’s Board of Directors or a committee thereof may grant additional options to purchase common stock with a vesting schedule to be determined by the Board of Directors in recognition of services provided by a non-employee director in his or her capacity as a director.
The Company’s Board of Directors or a committee thereof has authority to administer the Director Plan. The Company’s Board of Directors or a committee thereof has the authority to adopt, amend and repeal the administrative rules, guidelines and practices relating to the Director Plan and to interpret its provisions.
2002 Employee Stock Purchase Plan (“ESPP”)
The ESPP was adopted by the Company’s Board of Directors and stockholder in July 2002. The ESPP is intended to qualify as an “Employee Stock Purchase Plan” under Section 423 of the U.S. Internal Revenue Code and is intended to provide the Company’s employees with an opportunity to purchase shares of common stock through payroll deductions. An aggregate of 2,500,000 shares of common stock (subject to adjustment in the event of future stock splits, future stock dividends or other similar changes in the common stock or the Company’s capital structure) are reserved for issuance. As of December 31, 2016, 183,003 shares of common stock were available for future issuance under the ESPP.
F-32
Table of Contents
CEVA, INC.
NOTES TO THE CONSOLIDATED FINANCIAL STATEMENTS—(Continued)
(in thousands, except share data)
All of the Company’s employees who are regularly employed for more than five months in any calendar year and work 20 hours or more per week are eligible to participate in the ESPP. Non-employee directors, consultants, and employees subject to the rules or laws of a foreign jurisdiction that prohibit or make impractical their participation in an employee stock purchase plan are not eligible to participate in the ESPP.
The ESPP designates offer periods, purchase periods and exercise dates. Offer periods generally will be overlapping periods of 24 months. Purchase periods generally will be six-month periods. Exercise dates are the last day of each purchase period. In the event the Company merges with or into another corporation, sells all or substantially all of the Company’s assets, or enters into other transactions in which all of the Company’s stockholders before the transaction own less than 50% of the total combined voting power of the Company’s outstanding securities following the transaction, the Company’s Board of Directors or a committee designated by the Board may elect to shorten the offer period then in progress.
The price per share at which shares of common stock may be purchased under the ESPP during any purchase period is the lesser of:
| • | 85% of the fair market value of common stock on the date of grant of the purchase right, which is the commencement of an offer period; or |
| • | 85% of the fair market value of common stock on the exercise date, which is the last day of a purchase period. |
The participant’s purchase right is exercised in the above noted manner on each exercise date arising during the offer period unless, on the first day of any purchase period, the fair market value of common stock is lower than the fair market value of common stock on the first day of the offer period. If so, the participant’s participation in the original offer period will be terminated, and the participant will automatically be enrolled in the new offer period effective the same date.
The ESPP is administered by the Board of Directors or a committee designated by the Board, which will have the authority to terminate or amend the plan, subject to specified restrictions, and otherwise to administer and resolve all questions relating to the administration of the plan.
e. Dividend policy:
The Company has never declared or paid any cash dividends on its capital stock and does not anticipate paying any cash dividends in the foreseeable future.
NOTE 9: DERIVATIVES AND HEDGING ACTIVITIES
The fair value of the Company’s outstanding derivative instruments is as follows:
| As at December 31, |
||||||||
| 2015 | 2016 | |||||||
| Derivative assets: |
||||||||
| Derivatives designated as cash flow hedging instruments: |
||||||||
| Foreign exchange forward contracts |
$ | 9 | $ | 6 | ||||
|
|
|
|
|
|||||
| Total |
$ | 9 | $ | 6 | ||||
|
|
|
|
|
|||||
F-33
Table of Contents
CEVA, INC.
NOTES TO THE CONSOLIDATED FINANCIAL STATEMENTS—(Continued)
(in thousands, except share data)
The Company recorded the fair value of derivative assets in “prepaid expenses and other accounts receivable” on the Company’s consolidated balance sheets.
The increase (decrease) in unrealized gains (losses) recognized in “accumulated other comprehensive income (loss)” on derivatives, before tax effect, is as follows:
| Year ended December 31, | ||||||||||||
| 2014 | 2015 | 2016 | ||||||||||
| Derivatives designated as cash flow hedging instruments: |
||||||||||||
| Foreign exchange option contracts |
$ | (389 | ) | $ | 83 | $ | 67 | |||||
| Foreign exchange forward contracts |
(41 | ) | 94 | 91 | ||||||||
|
|
|
|
|
|
|
|||||||
| $ | (430 | ) | $ | 177 | $ | 158 | ||||||
|
|
|
|
|
|
|
|||||||
The net (gains) losses reclassified from “accumulated other comprehensive income (loss)” into income, are as follows:
| Year ended December 31, | ||||||||||||
| 2014 | 2015 | 2016 | ||||||||||
| Derivatives designated as cash flow hedging instruments: |
||||||||||||
| Foreign exchange option contracts |
$ | 337 | $ | (31 | ) | $ | (67 | ) | ||||
| Foreign exchange forward contracts |
45 | (73 | ) | (94 | ) | |||||||
|
|
|
|
|
|
|
|||||||
| $ | 382 | $ | (104 | ) | $ | (161 | ) | |||||
|
|
|
|
|
|
|
|||||||
The Company recorded in cost of revenues and operating expenses, a net loss of $382, a net gain of $104 and a net gain of $161 during the years ended December 31, 2014, 2015 and 2016, respectively, related to its Hedging Contracts.
F-34
Table of Contents
CEVA, INC.
NOTES TO THE CONSOLIDATED FINANCIAL STATEMENTS—(Continued)
(in thousands, except share data)
NOTE 10: ACCUMULATED OTHER COMPREHENSIVE INCOME (LOSS)
The following table summarizes the changes in accumulated balances of other comprehensive income (loss), net of taxes:
| Year ended December 31, 2015 | Year ended December 31, 2016 | |||||||||||||||||||||||
| Unrealized gains (losses) on available- for-sale marketable securities |
Unrealized gains (losses) on cash flow hedges |
Total | Unrealized gains (losses) on available-for- sale marketable securities |
Unrealized gains (losses) on cash flow hedges |
Total | |||||||||||||||||||
| Beginning balance |
$ | (379 | ) | $ | (57 | ) | $ | (436 | ) | $ | (427 | ) | $ | 8 | $ | (419 | ) | |||||||
| Other comprehensive income (loss) before reclassifications |
(118 | ) | 158 | 40 | (83 | ) | 140 | 57 | ||||||||||||||||
| Amounts reclassified from accumulated other comprehensive income (loss) |
70 | (93 | ) | (23 | ) | 8 | (143 | ) | (135 | ) | ||||||||||||||
|
|
|
|
|
|
|
|
|
|
|
|
|
|||||||||||||
| Net current period other comprehensive income (loss) |
(48 | ) | 65 | 17 | (75 | ) | (3 | ) | (78 | ) | ||||||||||||||
|
|
|
|
|
|
|
|
|
|
|
|
|
|||||||||||||
| Ending balance |
$ | (427 | ) | $ | 8 | $ | (419 | ) | $ | (502 | ) | $ | 5 | $ | (497 | ) | ||||||||
|
|
|
|
|
|
|
|
|
|
|
|
|
|||||||||||||
The following table provides details about reclassifications out of accumulated other comprehensive income (loss):
| Details about Accumulated Other |
Amount Reclassified from Accumulated Other Comprehensive Income (Loss) |
Affected Line Item in the | ||||||||||||
| Year ended December 31, |
||||||||||||||
| 2014 | 2015 | 2016 | ||||||||||||
| Unrealized gains (losses) on cash flow hedges |
$ | (17 | ) | $ | — | $ | 4 | Cost of revenues | ||||||
| (305 | ) | 91 | 132 | Research and development | ||||||||||
| (34 | ) | 5 | 12 | Sales and marketing | ||||||||||
| (26 | ) | 8 | 13 | General and administrative | ||||||||||
|
|
|
|
|
|
|
|||||||||
| (382 | ) | 104 | 161 | Total, before income taxes | ||||||||||
| (36 | ) | 11 | 18 | Income tax expense (benefit) | ||||||||||
|
|
|
|
|
|
|
|||||||||
| (346 | ) | 93 | 143 | Total, net of income taxes | ||||||||||
| Unrealized gains (losses) on available-for-sale marketable securities |
6 | (78 | ) | (9 | ) | Financial income, net | ||||||||
| 3 | (8 | ) | (1 | ) | Income tax expense (benefit) | |||||||||
|
|
|
|
|
|
|
|||||||||
| 3 | (70 | ) | (8 | ) | Total, net of income taxes | |||||||||
| $ | (343 | ) | $ | 23 | $ | 135 | Total, net of income taxes | |||||||
|
|
|
|
|
|
|
|||||||||
F-35
Table of Contents
CEVA, INC.
NOTES TO THE CONSOLIDATED FINANCIAL STATEMENTS—(Continued)
(in thousands, except share data)
NOTE 11: GEOGRAPHIC INFORMATION AND MAJOR CUSTOMER AND PRODUCT DATA
a. Summary information about geographic areas:
FASB ASC No. 280, “Segment Reporting,” establishes standards for reporting information about operating segments. Operating segments are defined as components of an enterprise about which separate financial information is available that is evaluated regularly by the chief operating decision maker in deciding how to allocate resources and in assessing performance. The Company manages its business on a basis of one reportable segment: the licensing of intellectual property to semiconductor companies and electronic equipment manufacturers (see Note 1 for a brief description of the Company’s business). The following is a summary of revenues within geographic areas:
| Year ended December 31, | ||||||||||||
| 2014 | 2015 | 2016 | ||||||||||
| Revenues based on customer location: |
||||||||||||
| United States |
$ | 11,671 | $ | 9,737 | $ | 9,134 | ||||||
| Europe, Middle East |
5,655 | 7,064 | 10,901 | |||||||||
| Asia Pacific (1) (2) |
33,482 | 42,698 | 52,618 | |||||||||
|
|
|
|
|
|
|
|||||||
| $ | 50,808 | $ | 59,499 | $ | 72,653 | |||||||
|
|
|
|
|
|
|
|||||||
| (1) China |
$ | 20,568 | $ | 29,982 | $ | 30,030 | ||||||
| (2) S. Korea |
* | ) | $ | 6,173 | $ | 15,512 | ||||||
| *) | Less than 10% |
| 2015 | 2016 | |||||||
| Long-lived assets by geographic region: |
||||||||
| Israel |
3,090 | 4,026 | ||||||
| France |
279 | 365 | ||||||
| United States |
331 | 240 | ||||||
| Other |
31 | 174 | ||||||
|
|
|
|
|
|||||
| $ | 3,731 | $ | 4,805 | |||||
|
|
|
|
|
|||||
b. Major customer data as a percentage of total revenues:
The following table sets forth the customers that represented 10% or more of the Company’s total revenues in each of the periods set forth below:
| Year ended December 31, | ||||||||||||
| 2014 | 2015 | 2016 | ||||||||||
| Customer A |
25 | % | 31 | % | 27 | % | ||||||
| Customer B |
* | ) | * | ) | 19 | % | ||||||
| *) | Less than 10% |
F-36
Table of Contents
CEVA, INC.
NOTES TO THE CONSOLIDATED FINANCIAL STATEMENTS—(Continued)
(in thousands, except share data)
c. Information about Products and Services:
The following table sets forth the products and services as percentages of the Company’s total revenues in each of the periods set forth below:
| Year ended December 31, | ||||||||||||
| 2014 | 2015 | 2016 | ||||||||||
| DSP products (DSP Cores and Platforms) |
87 | % | 82 | % | 84 | % | ||||||
| Connectivity products (Bluetooth, WiFi and SATA/SAS) |
13 | % | 18 | % | 16 | % | ||||||
NOTE 12: SELECTED STATEMENTS OF INCOME DATA
Financial income, net:
| Year ended December 31, | ||||||||||||
| 2014 | 2015 | 2016 | ||||||||||
| Interest income |
$ | 2,824 | $ | 2,845 | $ | 3,300 | ||||||
| Gain (loss) on available-for-sale marketable securities, net |
6 | (78 | ) | (9 | ) | |||||||
| Amortization of premium on available-for-sale marketable securities, net |
(1,121 | ) | (1,111 | ) | (1,064 | ) | ||||||
| Foreign exchange loss, net |
(565 | ) | (490 | ) | (188 | ) | ||||||
| Accretion of Contingent Consideration |
(169 | ) | (97 | ) | — | |||||||
|
|
|
|
|
|
|
|||||||
| $ | 975 | $ | 1,069 | $ | 2,039 | |||||||
|
|
|
|
|
|
|
|||||||
NOTE 13: TAXES ON INCOME
a. A number of the Company’s operating subsidiaries are taxed at rates lower than U.S. rates.
1. Irish Subsidiaries
The Irish operating subsidiary qualified for a 12.5% tax rate on its trade. Interest income earned by the Irish subsidiary is taxed at a rate of 25%. As of December 31, 2016, the open tax years, subject to review by the applicable taxing authorities for the Irish subsidiary, are 2011 and subsequent years.
2. Israeli Subsidiary
The Israeli subsidiary has been granted “Approved Enterprise” and “Benefited Enterprise” status under the Israeli Law for the Encouragement of Capital Investments. For such Approved Enterprises and Benefited Enterprises, the Israeli subsidiary elected to apply for alternative tax benefits—the waiver of government grants in return for tax exemptions on undistributed income. Upon distribution of such exempt income, the Israeli subsidiary will be subject to corporate tax at the rate ordinarily applicable to the Approved Enterprise’s or Benefited Enterprise’s income. Such tax exemption on undistributed income applies for a limited period of between two to ten years, depending upon the location of the enterprise. During the remainder of the benefits period (generally until the expiration of ten years), a corporate tax rate not exceeding 25% will apply.
The Israeli subsidiary is a foreign investor company, or FIC, as defined by the Investment Law. FICs are entitled to further reductions in the tax rate normally applicable to Approved Enterprises and Benefited
F-37
Table of Contents
CEVA, INC.
NOTES TO THE CONSOLIDATED FINANCIAL STATEMENTS—(Continued)
(in thousands, except share data)
Enterprises. Depending on the foreign ownership in each tax year, the tax rate can range between 10% (when foreign ownership exceeds 90%) to 20% (when foreign ownership exceeds 49%). There can be no assurance that the subsidiary will continue to qualify as an FIC in the future or that the benefits described herein will be granted in the future.
The Company’s Israeli subsidiary’s tax-exempt profit from Approved Enterprises and Benefited Enterprises is permanently reinvested as the Company’s management has determined that the Company does not currently intend to distribute dividends. Therefore, deferred taxes have not been provided for such tax-exempt income. The Company intends to continue to reinvest these profits and does not currently foresee a need to distribute dividends out of such tax-exempt income.
Income not eligible for Approved Enterprise benefits or Benefited Enterprise benefits is taxed at a regular rate, which was 25% in 2016, 26.5% in 2015 and 26.5% in 2014.
In December 2016, the Israeli Parliament approved the Economic Efficiency Law (Legislative Amendments for Applying the Economic Policy for the 2017 and 2018 Budget Years), 2016 which reduces the corporate income tax rate to 24% (instead of 25%) effective on January 1, 2017 and to 23% effective on January 1, 2018.
The Israeli subsidiary elected to compute taxable income in accordance with Income Tax Regulations (Rules for Accounting for Foreign Investors Companies and Certain Partnerships and Setting their Taxable Income), 1986. Accordingly, the taxable income or loss is calculated in U.S. dollars. Applying these regulations reduces the effect of the foreign exchange rate (of NIS against the U.S. dollar) on the Company’s Israeli taxable income.
As of December 31, 2016, the open tax years, subject to review by the applicable taxing authorities for the Israeli subsidiary, are 2011 and subsequent years.
3. French Subsidiaries
The French operating subsidiaries qualified for a 33.33% tax rate on its profits. As of December 31, 2016, the open tax years, subject to review by the applicable taxing authorities for the French subsidiaries, are 2014 and subsequent years.
b. Taxes on income comprised of:
| Year ended December 31, | ||||||||||||
| 2014 | 2015 | 2016 | ||||||||||
| Domestic taxes: |
||||||||||||
| Current |
$ | 7 | $ | 115 | $ | 6 | ||||||
| Deferred |
2,987 | — | — | |||||||||
| Foreign taxes: |
||||||||||||
| Current |
314 | 2,212 | 3,932 | |||||||||
| Deferred |
(456 | ) | (1,213 | ) | (613 | ) | ||||||
|
|
|
|
|
|
|
|||||||
| $ | 2,852 | $ | 1,114 | $ | 3,325 | |||||||
|
|
|
|
|
|
|
|||||||
| Income (loss) before taxes on income: |
||||||||||||
| Domestic |
$ | (2,379 | ) | $ | (3,360 | ) | $ | (3,488 | ) | |||
| Foreign |
4,412 | 10,741 | 19,913 | |||||||||
|
|
|
|
|
|
|
|||||||
| $ | 2,033 | $ | 7,381 | $ | 16,425 | |||||||
|
|
|
|
|
|
|
|||||||
F-38
Table of Contents
CEVA, INC.
NOTES TO THE CONSOLIDATED FINANCIAL STATEMENTS—(Continued)
(in thousands, except share data)
c. Reconciliation between the Company’s effective tax rate and the U.S. statutory rate:
| Year ended December 31, | ||||||||||||
| 2014 | 2015 | 2016 | ||||||||||
| Income before taxes on income |
$ | 2,033 | $ | 7,381 | $ | 16,425 | ||||||
|
|
|
|
|
|
|
|||||||
| Theoretical tax at U.S. statutory rate |
691 | 2,510 | 5,585 | |||||||||
| Foreign income taxes at rates other than U.S. rate |
(489 | ) | (958 | ) | (1,831 | ) | ||||||
| Approved and benefited enterprises benefits (*) |
(785 | ) | (1,653 | ) | (2,767 | ) | ||||||
| Subpart F |
394 | 434 | 538 | |||||||||
| Non-deductible items |
723 | 349 | 682 | |||||||||
| Non-taxable items |
(230 | ) | (481 | ) | (505 | ) | ||||||
| Changes in uncertain tax position |
(920 | ) | — | 505 | ||||||||
| Changes in valuation allowance |
3,356 | 839 | 1,212 | |||||||||
| Other, net |
112 | 74 | (94 | ) | ||||||||
|
|
|
|
|
|
|
|||||||
| Taxes on income |
$ | 2,852 | $ | 1,114 | $ | 3,325 | ||||||
|
|
|
|
|
|
|
|||||||
| (*) Basic and diluted earnings per share amounts of the benefit resulting from the “Approved Enterprise” and “Benefited Enterprise” status |
$ | 0.04 | $ | 0.08 | $ | 0.13 | ||||||
|
|
|
|
|
|
|
|||||||
d. Deferred taxes on income:
Significant components of the Company’s deferred tax assets are as follows:
| As at December 31, | ||||||||
| 2015 | 2016 | |||||||
| Deferred tax assets |
||||||||
| Operating loss carryforward |
$ | 9,066 | $ | 9,638 | ||||
| Accrued expenses |
1,165 | 1,128 | ||||||
| Temporary differences related to R&D expenses |
1,052 | 1,435 | ||||||
| Equity-based compensation |
2,625 | 2,685 | ||||||
| Tax credit carry forward |
875 | 1,237 | ||||||
| Other |
529 | 562 | ||||||
|
|
|
|
|
|||||
| Total gross deferred tax assets |
15,312 | 16,685 | ||||||
| Valuation allowance |
(12,740 | ) | (13,780 | ) | ||||
|
|
|
|
|
|||||
| Net deferred tax assets |
$ | 2,572 | $ | 2,905 | ||||
|
|
|
|
|
|||||
| Deferred tax liabilities |
||||||||
| Intangible assets |
$ | 915 | $ | 621 | ||||
| Other |
29 | 32 | ||||||
|
|
|
|
|
|||||
| Total deferred tax liabilities |
$ | 944 | $ | 653 | ||||
|
|
|
|
|
|||||
| Net deferred tax assets (*) |
$ | 1,628 | $ | 2,252 | ||||
|
|
|
|
|
|||||
(*) Net deferred taxes for the years ended December 31, 2015 and 2016 are all from foreign jurisdictions.
F-39
Table of Contents
CEVA, INC.
NOTES TO THE CONSOLIDATED FINANCIAL STATEMENTS—(Continued)
(in thousands, except share data)
Changes in valuation allowances on deferred tax assets result from management’s assessment of the Company’s ability to utilize certain future tax deductions, operating losses and tax credit carryforwards prior to expiration. Valuation allowances were recorded to reduce deferred tax assets to an amount that will, more likely than not, be realized in the future. The net change in the valuation allowance primarily reflects an increase in deferred tax assets on net operating and other temporary differences for which full valuation allowance is recorded.
The Company does not have a provision for U.S. Federal income taxes on the undistributed earnings of its international subsidiaries because such earnings are considered to be indefinitely reinvested. The Company would recognize a deferred income tax liability if it was determined that such earnings are no longer indefinitely reinvested. At December 31, 2016, undistributed earnings of the Company’s foreign subsidiaries amounted to approximately $146,172. The determination of the amount of additional taxes related to the distribution of these earnings is not practicable. In addition, the Company operates within multiple taxing jurisdictions involving complex issues, and it has provisions for tax liabilities on investment activities as appropriate.
e. Uncertain tax positions
A reconciliation of the beginning and ending amount of gross unrecognized tax benefits based on the provisions of FASB ASC No. 740 is as follows:
| Year ended December 31, | ||||||||
| 2015 | 2016 | |||||||
| Beginning of year |
$ | 2,859 | $ | 3,076 | ||||
| Additions for current year tax positions |
217 | 232 | ||||||
| Additions for prior year’s tax positions |
— | 476 | ||||||
|
|
|
|
|
|||||
| Balance at December 31 |
$ | 3,076 | $ | 3,784 | ||||
|
|
|
|
|
|||||
As of December 31, 2015 and 2016, there were $3,076 and $3,784, respectively, of unrecognized tax benefits that if recognized would affect the annual effective tax rate. As of December 31, 2015 and 2016, the Company had accrued interest related to unrecognized tax benefits of $54 and $130, respectively. The Company did not accrue penalties during the years ended December 31, 2015 and 2016.
The Company believes that an adequate provision has been made for any adjustments that may result from tax examinations. However, the outcome of tax audits cannot be predicted with certainty. If any issues addressed in the Company’s tax audits are resolved in a manner not consistent with management’s expectations, the Company could be required to adjust its provision for income taxes in the period such resolution occurs. The Company does not expect uncertain tax positions to change significantly over the next 12 months, except in the case of settlements with tax authorities, the likelihood and timing of which are difficult to estimate.
f. Tax loss carryforwards:
As of December 31, 2016, CEVA and its subsidiaries had net operating loss carryforwards for federal income tax purposes of approximately $10,066, which are available to offset future federal taxable income. Of that amount, $8,662 is due to excess tax benefits from stock option exercises. Excess tax benefits related to stock option exercises cannot be recognized until realized through a reduction of current taxes payable. Such loss carryforwards begin to expire in 2030.
F-40
Table of Contents
CEVA, INC.
NOTES TO THE CONSOLIDATED FINANCIAL STATEMENTS—(Continued)
(in thousands, except share data)
As of December 31, 2016, CEVA and its subsidiaries had net operating loss carryforwards for California income tax purposes of approximately $6,952, which are available to offset future California taxable income. Of that amount, $5,581 is due to excess tax benefits from stock option exercises. Excess tax benefits related to stock option exercises cannot be recognized until realized through a reduction of current taxes payable. Such loss carryforwards begin to expire in 2017.
As of December 31, 2016, CEVA’s Irish subsidiary had foreign operating losses of approximately $62,306, which are available to offset future taxable income indefinitely. A full valuation allowance was provided in relation to those carryforward tax losses due to the uncertainty of their utilization in the foreseeable future. As of December 31, 2016, CEVA’s French subsidiaries had foreign operating losses of approximately $3,875, which are available to offset future taxable income indefinitely.
g. Tax returns:
CEVA files income tax returns in the U.S. federal jurisdiction and various state and local jurisdictions. With few exceptions, CEVA is no longer subject to U.S. federal income tax examinations by tax authorities, and state and local income tax examinations, for the years prior to 2010.
NOTE 14: RELATED PARTY TRANSACTIONS
One of the Company’s directors, Bruce Mann, served as a partner of Morrison & Foerster LLP, the Company’s outside legal counsel, until December 31, 2014. Fees attributed to Morrison & Foerster LLP during the year ended December 31, 2014 were $275. There were no related party transactions during the years ended December 31, 2015 and 2016.
NOTE 15: COMMITMENTS AND CONTINGENCIES
a. The Company is not a party to any litigation or other legal proceedings that the Company believes could reasonably be expected to have a material adverse effect on the Company’s business, results of operations and financial condition.
b. As of December 31, 2016, the Company and its subsidiaries had several non-cancelable operating leases, primarily for facilities and equipment. These leases generally contain renewal options and require the Company and its subsidiaries to pay all executory costs such as maintenance and insurance. In addition, the Company has several fixed service agreements with sub-contractors.
Rent expenses for the years ended December 31, 2014, 2015 and 2016, were $955, $1,094 and $1,259, respectively.
F-41
Table of Contents
CEVA, INC.
NOTES TO THE CONSOLIDATED FINANCIAL STATEMENTS—(Continued)
(in thousands, except share data)
As of December 31, 2016, future purchase obligations and minimum rental commitments for leasehold properties and operating leases with non-cancelable terms are as follows:
| Minimum rental commitments for leasehold properties |
Commitments for other lease obligations |
Other purchase obligations |
Total | |||||||||||||
| 2017 |
$ | 1,295 | $ | 3,019 | $ | 2,456 | $ | 6,770 | ||||||||
| 2018 |
1,269 | 2,833 | — | 4,102 | ||||||||||||
| 2019 |
293 | 1,267 | — | 1,560 | ||||||||||||
| 2020 |
230 | — | — | 230 | ||||||||||||
| 2021 |
25 | — | — | 25 | ||||||||||||
|
|
|
|
|
|
|
|
|
|||||||||
| $ | 3,112 | $ | 7,119 | $ | 2,456 | $ | 12,687 | |||||||||
|
|
|
|
|
|
|
|
|
|||||||||
c. Royalties:
The Company participated in programs sponsored by the Israeli government for the support of research and development activities. Through December 31, 2016, the Company had obtained grants from the Israeli Innovation Authority for certain of the Company’s research and development projects. The Company is obligated to pay royalties to the Israeli Innovation Authority, amounting to 3%-3.5% of the sales of the products and other related revenues (based on the dollar) generated from such projects, up to 100% of the grants received. Royalty payment obligations also bear interest at the LIBOR rate. The obligation to pay these royalties is contingent on actual sales of the products and in the absence of such sales, no payment is required.
Royalty expenses relating to the Israeli Innovation Authority grants included in cost of revenues for the years ended December 31, 2014, 2015 and 2016 amounted to $300, $482 and $539, respectively. As of December 31, 2016, the aggregate contingent liability to the Israeli Innovation Authority (including interest) amounted to $19,445.
F-42
Table of Contents
Pursuant to the requirements of Section 13 or 15(d) of the Securities Exchange Act of 1934, the Registrant has duly caused this Annual Report on Form 10-K to be signed on its behalf by the undersigned, thereunto duly authorized.
| CEVA, INC. | ||
| By: | /S/ Gideon Wertheizer | |
| Gideon Wertheizer | ||
| Chief Executive Officer | ||
March 10, 2017
POWER OF ATTORNEY
KNOW ALL MEN BY THESE PRESENTS, that each person whose signature appears below constitutes and appoints Gideon Wertheizer and Yaniv Arieli or either of them, his true and lawful attorneys-in-fact and agents, with full power of substitution and re-substitution, for him and in his name, place and stead, in any and all capacities to sign any and all amendments to this Annual Report on Form 10-K, and to file the same, with all exhibits thereto and other documents in connection therewith, with the SEC, granting unto said attorneys-in-fact and agents, and each of them, full power and authority to do and perform each and every act and thing requisite and necessary to be done in connection therewith, as fully to all intents and purposes as he might or could do in person, hereby ratifying and confirming all that said attorneys-in-fact and agents, or either of them, or their or his substitutes or substitute, may lawfully do or cause to be done by virtue hereof.
Pursuant to the requirements of the Securities Exchange Act of 1934, this report on Form 10-K has been signed below by the following persons on behalf of the Registrant and in the capacities and on the dates indicated.
| Signature |
Title |
Date | ||
| /S/ GIDEON WERTHEIZER Gideon Wertheizer |
Chief Executive Officer and Director (Principal Executive Officer & Director) | March 10, 2017 | ||
| /S/ YANIV ARIELI Yaniv Arieli |
Chief Financial Officer and Treasurer (Principal Financial Officer and Principal Accounting Officer) | March 10, 2017 | ||
| /S/ PETER MCMANAMON Peter McManamon |
Director and Chairman | March 10, 2017 | ||
| /S/ ELIYAHU AYALON Eliyahu Ayalon |
Director | March 10, 2017 | ||
| /S/ ZVI LIMON Zvi Limon |
Director | March 10, 2017 | ||
| /S/ BRUCE MANN Bruce Mann |
Director | March 10, 2017 | ||
| /S/ MARIA MARCED Maria Marced |
Director | March 10, 2017 | ||
| /S/ SVEN-CHRISTER-NILSSON Sven-Christer Nilsson |
Director | March 10, 2017 | ||
| /S/ LOUIS SILVER Louis Silver |
Director | March 10, 2017 | ||
Table of Contents
CEVA, INC.
SCHEDULE II — VALUATION AND QUALIFYING ACCOUNTS
| Balance at beginning of period |
Additions | Deduction | Balance at end of period |
|||||||||||||
| Year ended December 31, 2016 Allowance for doubtful accounts |
$ | 25 | $ | — | $ | 25 | $ | — | ||||||||
| Year ended December 31, 2015 Allowance for doubtful accounts |
$ | 25 | $ | — | $ | — | $ | 25 | ||||||||
| Year ended December 31, 2014 Allowance for doubtful accounts |
$ | — | $ | 25 | $ | — | $ | 25 | ||||||||
Table of Contents
EXHIBIT INDEX
| Exhibit |
Description | |
| 3.1(1) | Amended and Restated Certificate of Incorporation of the Registrant | |
| 3.2(2) | Certificate of Ownership and Merger (merging CEVA, Inc. into ParthusCeva, Inc.) | |
| 3.3(3) | Amended and Restated Bylaws of the Registrant | |
| 3.7(4) | Amendment to the Amended and Restated Certificate of Incorporation of the Registrant | |
| 4.1(5) | Specimen of Common Stock Certificate | |
| 10.1(6)† | CEVA, Inc. 2000 Stock Incentive Plan | |
| 10.7(6)† | CEVA, Inc. 2002 Stock Incentive Plan | |
| 10.8(18)† | CEVA, Inc. 2003 Director Stock Option Plan | |
| 10.9(6)† | Parthus 2000 Share Option Plan | |
| 10.10(17)† | CEVA, Inc. 2002 Employee Stock Purchase Plan | |
| 10.11(1) | Form of Indemnification Agreement | |
| 10.12(7)† | Employment Agreement between the Registrant and Gideon Wertheizer dated as of November 1, 2002 | |
| 10.13(7)† | Employment Agreement between the Registrant and Issachar Ohana dated as of November 1, 2002 | |
| 10.14(8)† | Personal and Special Employment Agreement between the Registrant and Yaniv Arieli dated as of August 18, 2005 | |
| 10.15(9)† | Form of Stock Option Agreement under the CEVA, Inc. 2002 Stock Incentive Plan | |
| 10.16(9)† | Form of Israeli Stock Option Agreement under the CEVA, Inc. 2002 Stock Incentive Plan | |
| 10.17(9)† | Form of Stock Option Agreement under the CEVA, Inc. 2000 Stock Incentive Plan | |
| 10.18(9)† | Form of Israeli Stock Option Agreement under the CEVA, Inc. 2000 Stock Incentive Plan | |
| 10.19(9)† | Form of Option Agreement under the CEVA, Inc. 2003 Director Stock Option Plan | |
| 10.20(10)† | Form of Stock Option Agreement for Directors under the CEVA, Inc. 2000 Stock Incentive Plan | |
| 10.21(10)† | Yaniv Arieli’s Amended and Restated Nonstatutory Stock Option Agreement under the CEVA, Inc. 2002 Stock Incentive Plan, dated as of August 1, 2007 | |
| 10.22(11)† | Amendment, dated July 22, 2003, to the Employment Agreement by and between Issachar Ohana and CEVA, Inc., dated November 1, 2002 | |
| 10.23(12)† | Amendment, effective as of November 1, 2007, to the Employment Agreement by and between Issachar Ohana and CEVA, Inc., dated November 1, 2002 and as amended on July 22, 2003 | |
| 10.24(13)† | CEVA, Inc. 2011 Stock Incentive Plan | |
| 10.25(14)† | 2016 Incentive Plan for Issachar Ohana, EVP Worldwide Sales, effective as of January 1, 2016 (portions of this exhibit is redacted). | |
| 10.25(15)† | 2016 Executive Bonus Plan for Gideon Wertheizer and Yaniv Arieli, effective as of January 1, 2016 (portions of this exhibit is redacted). | |
| 10.25(16)† | 2017 Incentive Plan for Issachar Ohana, EVP Worldwide Sales, effective as of January 1, 2017 (portions of this exhibit is redacted). | |
Table of Contents
| Exhibit |
Description | |
| 10.26†(19) | Form of Stock Appreciation Right Agreement under the CEVA, Inc. 2011 Stock Incentive Plan | |
| 10.27†(19) | Form of Israeli Stock Appreciation Right Agreement under the CEVA, Inc. 2011 Stock Incentive Plan | |
| 10.28†(19) | Form of Israeli Restricted Stock Unit Agreement for employees under the CEVA, Inc. 2011 Stock Incentive Plan | |
| 10.29†(19) | Form of Restricted Stock Unit Agreement for employees under the CEVA, Inc. 2011 Stock Incentive Plan | |
| 10.30†(19) | Form of Restricted Stock Unit Agreement for non-employee directors under the CEVA, Inc. 2011 Stock Incentive Plan | |
| 10.31†(19) | Form of Restricted Stock Unit Agreement for Israeli non-employee directors under the CEVA, Inc. 2011 Stock Incentive Plan | |
| 10.32†(19) | Israeli Sub-plan under the CEVA, Inc. 2011 Stock Incentive Plan | |
| 10.33†(20) | 2017 Executive Bonus Plan for Gideon Wertheizer and Yaniv Arieli, effective as of January 1, 2017 (portions of this exhibit is redacted). | |
| 21.1* | Subsidiaries of the Registrant | |
| 23.1* | Consent of Kost Forer Gabbay & Kasierer, a member of Ernst & Young Global | |
| 24.1* | Power of Attorney (See signature page of this Annual Report on Form 10-K) | |
| 31.1* | Rule 13a-14(a)/15d-14(a) Certification of Chief Executive Officer | |
| 31.2* | Rule 13a-14(a)/15d-14(a) Certification of Chief Financial Officer | |
| 32* | Section 1350 Certification of Chief Executive Officer and Chief Financial Officer | |
| 101.INS | XBRL Instance Document | |
| 101.SCH | XBRL Taxonomy Extension Schema Document | |
| 101.CAL | XBRL Taxonomy Extension Calculation Linkbase Document | |
| 101.DEF | XBRL Taxonomy Extension Definition Linkbase Document | |
| 101.LAB | XBRL Taxonomy Extension Labels Linkbase Document | |
| 101.PRE | XBRL Taxonomy Extension Presentation Linkbase Document | |
| (1) | Filed as an exhibit to CEVA’s registration statement on Form 10, as amended, initially filed with the Commission on June 3, 2002 (registration number 000-49842), and incorporated herein by reference. |
| (2) | Filed as an exhibit to CEVA’s Report on Form 8-K, filed with the Commission on December 8, 2003, and incorporated hereby by reference. |
| (3) | Filed as an exhibit to CEVA’s Current Report on Form 8-K, filed with the Commission on December 12, 2016, and incorporated hereby by reference. |
| (4) | Filed as an exhibit to CEVA’s Report on Form 8-K, filed with the Commission on July 22, 2005, and incorporated hereby by reference. |
| (5) | Filed as an exhibit to CEVA’s registration statement on Form S-1, as amended, initially filed with the Commission on July 30, 2002 (registration number 333-97353), and incorporated herein by reference. |
| (6) | Filed as an exhibit to CEVA’s 2007 Annual Report on Form 10-K, filed with the Commission on March 14, 2008, and incorporated hereby by reference. |
| (7) | Filed as an exhibit to CEVA’s 2002 Annual Report on Form 10-K, filed with the Commission on March 28, 2003, and incorporated hereby by reference. |
| (8) | Filed as an exhibit to CEVA’s Quarterly Report on Form 10-Q, filed with the Commission on November 9, 2005, and incorporated hereby by reference. |
Table of Contents
| (9) | Filed as an exhibit to CEVA’s Quarterly Report on Form 10-Q, filed with the Commission on August 9, 2006, and incorporated hereby by reference. |
| (10) | Filed as an exhibit of the same number to CEVA’s Quarterly Report on Form 10-Q, filed with the Securities and Exchange Commission on August 9, 2007, and incorporated hereby by reference. |
| (11) | Filed as Exhibit 10.27 to CEVA’s Quarterly Report on Form 10-Q, filed with the Securities and Exchange Commission on November 9, 2007, and incorporated hereby by reference. |
| (12) | Filed as Exhibit 99.1 to CEVA’s Current Report on Form 8-K, filed with the Securities and Exchange Commission on November 7, 2007, and incorporated hereby by reference. |
| (13) | Filed as an appendix to CEVA’s proxy statement for its 2011 annual meeting of stockholders filed with the Securities and Exchange Commission on April 8, 2011. |
| (14) | Filed as an exhibit to CEVA’s Current Report on Form 8-K, filed with the Securities and Exchange Commission on February 5, 2016, and incorporated hereby by reference. |
| (15) | Description filed in CEVA’s Current Report on Form 8-K, filed with the Securities and Exchange Commission on February 5, 2016, and incorporated hereby by reference. |
| (16) | Filed as an exhibit to CEVA’s Current Report on Form 8-K, filed with the Securities and Exchange Commission on February 3, 2017, and incorporated hereby by reference. |
| (17) | Filed as an exhibit to CEVA’s Quarterly Report on Form 10-Q, filed with the Commission on August 8, 2015, and incorporated hereby by reference. |
| (18) | Filed as Exhibit 10.8 to CEVA’s Annual Report on Form 10-K filed with the Commission on March 15, 2012, and incorporated hereby by reference. |
| (19) | Filed as an exhibit to CEVA’s Annual Report on Form 10-K filed with the Commission on March 11, 2016, and incorporated hereby by reference. |
| (20) | Description filed in CEVA’s Current Report on Form 8-K, filed with the Securities and Exchange Commission on February 3, 2017, and incorporated hereby by reference. |
| † | Management contract or compensatory plan or arrangement required to be filed as an exhibit pursuant to Item 15(c) of Form 10-K. |
| * | Filed herewith. |