Attached files
| file | filename |
|---|---|
| EX-31.2 - EXHIBIT 31.2 - HARMONIC INC | hlit-20161231xex312.htm |
| EX-32.2 - EXHIBIT 32.2 - HARMONIC INC | hlit-20161231xex322.htm |
| EX-32.1 - EXHIBIT 32.1 - HARMONIC INC | hlit-20161231xex321.htm |
| EX-31.1 - EXHIBIT 31.1 - HARMONIC INC | hlit-20161231xex311.htm |
| EX-23.1 - EXHIBIT 23.1 - HARMONIC INC | hlit-20161231xex231.htm |
| EX-21.1 - EXHIBIT 21.1 - HARMONIC INC | hlit-20161231xex211.htm |
| EX-3.2 - EXHIBIT 3.2 - HARMONIC INC | hlit-20161231xex32bylaw.htm |

2016 Annual Report
UNITED STATES
SECURITIES AND EXCHANGE COMMISSION
Washington, D.C. 20549
_______________________________________________________
Form 10-K
_______________________________________________________
(Mark One)
ý | ANNUAL REPORT PURSUANT TO SECTION 13 OR 15(d) OF THE SECURITIES EXCHANGE ACT OF 1934 |
For the Fiscal Year Ended December 31, 2016
¨ | TRANSITION REPORT PURSUANT TO SECTION 13 OR 15(d) OF THE SECURITIES EXCHANGE ACT OF 1934 |
Commission File No. 000-25826
_______________________________________________________
HARMONIC INC.
(Exact name of Registrant as specified in its charter)
Delaware | 77-0201147 |
(State or other jurisdiction of incorporation or organization) | (I.R.S. Employer Identification Number) |
4300 North First Street
San Jose, CA 95134
(408) 542-2500
(Address, including zip code, and telephone number, including area code, of Registrant’s principal executive offices)
Securities registered pursuant to section 12(b) of the Act:
Title of Each Class | Name of Each Exchange on Which Registered |
Common Stock, par value $.001 per share | The NASDAQ Stock Market LLC |
Securities registered pursuant to Section 12(g) of the Act:
None
_______________________________________________________
Indicate by check mark if the Registrant is a well-known seasoned issuer, as defined in Rule 405 of the Securities Act. Yes ¨ No ý
Indicate by check mark if the Registrant is not required to file reports pursuant to Section 13 or 15(d) of the Exchange Act. Yes ¨ No ý
Indicate by check mark whether the Registrant (1) has filed all reports required to be filed by Section 13 or 15(d) of the Securities Exchange Act of 1934 during the preceding 12 months (or for such shorter period that the Registrant was required to file such reports), and (2) has been subject to such filing requirements for the past 90 days. Yes ý No ¨
Indicate by check mark whether the Registrant has submitted electronically and posted on its corporate Web site, if any, every Interactive Data File required to be submitted and posted pursuant to Rule 405 of Regulation S-T during the preceding 12 months (or for such shorter period that the Registrant was required to submit and post such files). Yes ý No ¨
Indicate by check mark if disclosure of delinquent filers pursuant to Item 405 of Regulation S-K is not contained herein, and will not be contained, to the best of the Registrant’s knowledge, in definitive proxy or information statements incorporated by reference in Part III of this Form 10-K or any amendment to this Form 10-K. ý
Indicate by check mark whether the registrant is a large accelerated filer, an accelerated filer, a non-accelerated filer, or a smaller reporting company. See the definitions of “large accelerated filer,” “accelerated filer” and “smaller reporting company” in Rule 12b-2 of the Exchange Act. (Check one):
Large accelerated filer | ¨ | Accelerated filer | ý |
Non-accelerated filer | ¨ (Do not check if a smaller reporting company) | Smaller reporting company | ¨ |
Indicate by check mark whether the Registrant is a shell company (as defined in Rule 12b-2 of the Exchange Act). Yes ¨ No ý
Based on the closing sale price of the Common Stock on The NASDAQ Global Select Market on July 1, 2016, the aggregate market value of the voting Common Stock held by non-affiliates of the Registrant was approximately $113,914,000. Shares of Common Stock held by each executive officer and director and by each person who owns 5% or more of the outstanding Common Stock have been excluded in that such persons may be deemed to be affiliates. This determination of affiliate status is not necessarily a conclusive determination for other purposes.
The number of shares outstanding of the Registrant’s Common Stock, $.001 par value, was 79,773,003 on February 28, 2017.
_______________________________________________________
DOCUMENTS INCORPORATED BY REFERENCE
Portions of the Proxy Statement for the Registrant’s 2016 Annual Meeting of Stockholders (which will be filed with the Securities and Exchange Commission within 120 days of the end of the fiscal year ended December 31, 2016) are incorporated by reference in Part III of this Annual Report on Form 10-K.
HARMONIC INC.
FORM 10-K
TABLE OF CONTENTS
Page | ||
ITEM 1 | ||
ITEM 1A | ||
ITEM 1B | ||
ITEM 2 | ||
ITEM 3 | ||
ITEM 4 | ||
ITEM 5 | ||
ITEM 6 | ||
ITEM 7 | ||
ITEM 7A | ||
ITEM 8 | ||
ITEM 9 | ||
ITEM 9A | ||
ITEM 9B | ||
ITEM 10 | ||
ITEM 11 | ||
ITEM 12 | ||
ITEM 13 | ||
ITEM 14 | ||
ITEM 15 | ||
ITEM 16 | ||
2
Forward Looking Statements
Some of the statements contained in this Annual Report on Form 10-K are forward-looking statements that involve risk and uncertainties. The statements contained in this Annual Report on Form 10-K that are not purely historical are forward-looking statements within the meaning of Section 27A of the Securities Act of 1933, as amended (the “Securities Act”), and Section 21E of the Securities Exchange Act of 1934, as amended (the “Exchange Act”), including, without limitation, statements regarding our expectations, beliefs, intentions or strategies regarding the future. In some cases, you can identify forward-looking statements by terminology such as, “may,” “will,” “should,” “expects,” “plans,” “anticipates,” “believes,” “intends,” “estimates,” “predicts,” “potential,” or “continue” or the negative of these terms or other comparable terminology. These forward-looking statements include, but are not limited to, statements regarding:
• | developing trends and demands in the markets we address, particularly emerging markets; |
• | economic conditions, particularly in certain geographies, and in financial markets; |
• | new and future products and services; |
• | capital spending of our customers; |
• | our strategic direction, future business plans and growth strategy; |
• | industry and customer consolidation; |
• | expected demand for and benefits of our products and services; |
• | seasonality of revenue and concentration of revenue sources; |
• | expectations regarding the impact of our acquisition of Thomson Video Networks (“TVN”); |
• | expectations regarding the change in TVN’s business model; |
• | potential future acquisitions and dispositions; |
• | anticipated results of potential or actual litigation; |
• | our competitive environment; |
• | the impact of governmental regulation; |
• | anticipated revenue and expenses, including the sources of such revenue and expenses; |
• | expected impacts of changes in accounting rules; |
• | expectations regarding the usability of our inventory and the risk that inventory will exceed forecasted demand; |
• | expectations and estimates related to goodwill and intangible assets and their associated carrying value; |
• | use of cash, cash needs and ability to raise capital; and |
• | the condition of our cash investments. |
These statements are subject to known and unknown risks, uncertainties and other factors, which may cause our actual results to differ materially from those implied by the forward-looking statements. Important factors that may cause actual results to differ from expectations include those discussed in “Risk Factors” beginning on page 13 in this Annual Report on Form 10-K. All forward-looking statements included in this Annual Report on Form 10-K are based on information available to us on the date thereof, and we assume no obligation to update any such forward-looking statements. The terms “Harmonic,” “Company,” “we,” “us,” “its,” and “our”, as used in this Annual Report on Form 10-K, refer to Harmonic Inc. and its subsidiaries and its predecessors as a combined entity, except where the context requires otherwise.
3
PART I
Item 1. | BUSINESS |
We design, manufacture and sell versatile and high performance video infrastructure products and system solutions that enable our customers to efficiently create, prepare and deliver a full range of video and broadband services to consumer devices, including televisions, personal computers, laptops, tablets and smart phones. We operate in two segments, Video and Cable Edge. Our Video business sells video processing and production and playout solutions and services worldwide to cable operators and satellite and telecommunications (telco) Pay-TV service providers, which we refer to collectively as “service providers,” and to broadcast and media companies, including streaming new media companies. Our Cable Edge business sells cable access solutions, including Cable OS and related services, primarily to cable operators globally.
Across our two business segments, we derived approximately 51% of our revenue from the Americas in 2016. The Europe, Middle East and Africa (EMEA) and Asia Pacific (APAC) regions accounted for the remaining 31% and 18% of our 2016 revenue, respectively.
Harmonic was initially incorporated in California in June 1988, and was reincorporated in Delaware in May 1995. Our principal executive offices are located at 4300 North First Street, San Jose, California 95134. Our telephone number is (408) 542-2500. Our Internet website is http://www.harmonicinc.com. Other than the information expressly set forth in this Annual Report on Form 10-K, the information contained or referred to on our website is not part of this report.
Industry Overview
Demand for Video Services Anytime, Anywhere
The delivery of video programming and Internet-based services to consumers continues to rapidly converge. Consumers increasingly seek a more personalized and dynamic video experience that can be delivered at any time to any location to a variety of devices, ranging from high-definition (HD) and ultra-high-definition (Ultra HD) televisions and Internet-enabled “smart” televisions, to traditional desktop and laptop computers, to mobile platforms such as smart phones and tablet computers. In this multiscreen video environment, video programming and content needs to be transformed into multiple formats, bit rates and resolutions for display on a broad range of devices.
Consumers have grown accustomed to watching video programming and content at their convenience rather than on fixed timeframes scheduled by broadcasters and service providers. “Time-shifting” technologies such as digital video recorders (DVRs) and video-on-demand (VOD) services are enabling this flexibility, and the introduction of network DVRs by some service providers has eliminated the need for local storage, allowing a subscriber to store programming on the service provider’s servers for future playback at any time, on any device.
Consumers are also accustomed to video download and streaming services from new media companies such as Netflix, Hulu, Google (YouTube), Amazon (Amazon Instant Video) and Apple (iTunes). These and other similar services aggregate third-party and original content and stream video “over-the-top” (OTT) to any Internet-connected device utilizing Internet service providers’ networks at no incremental infrastructure cost to the consumer. In response, a number of service providers and broadcast and media companies are now providing more of their own OTT streaming video services.
Demand for High Quality Video
Consumer demand for high quality video anytime, anywhere and on any device requires ever-increasing bandwidth capacity in service providers’ networks, as well as technology that maximizes network bandwidth efficiency. With the advent of Ultra HD televisions and OTT services increasingly being rendered in “4K” high resolution and consuming approximately four times the bandwidth of traditional HD channels, we believe next generation compression technologies, such as High Efficiency Video Compression (HEVC) or advances in H.264/AVC codecs, will continue to remain a high priority for distributors of video.
Service Provider Trends
Service providers are competing intensely to offer higher quality video signals in HD, including evolving initiatives to deliver video in 4K Ultra HD resolution. In response to the growing success of new media OTT streaming companies, in addition to the time-shifting technologies described above, service providers are broadly expanding their video streaming offerings to customers, for viewing on any device. Increasingly, these services are featuring content in the bandwidth intensive, high resolution 4K standard in order to provide consumers with higher value, differentiated video services. Service providers
4
are developing and expanding their content delivery and Internet Protocol (IP) networks, and increasing the capacity and efficiency of their networks with investments in various delivery infrastructure technologies to, among other things, maximize video quality, minimize bandwidth utilization and enable new network capacity. We believe that the delivery of video over IP will continue to change traditional video viewing habits and distribution methods and may alter the traditional advertising and subscription business models of major service providers.
Service providers continue to consolidate to achieve greater economies of scale and subscriber concentration, and to compete more effectively, especially against the growing disruptive threat of OTT offerings. In addition, service providers continue to enhance and differentiate their offerings by creating and delivering their own branded content, either through organic in-house development of new content or through acquisitions of existing content brands. For example, Comcast Corporation (“Comcast”), a cable operator, owns NBC Universal, a broadcast and media company; AT&T, a telecommunications company, has announced its intent to acquire Time Warner, a media and entertainment company; and Sky Broadcasting, a European satellite service provider, has developed its own channels and content.
Content Provider Trends
Content owners and media companies in the U.S. and internationally continue to launch OTT streaming offerings to reach consumers directly, with OTT streaming of live programming becoming increasingly relevant. These offerings may be in partnership or competition with service providers.
As service providers deliver more video services to more devices and platforms, they are increasingly requiring content providers to supply content that is properly formatted for each device. As the number and types of devices continue to grow, the lack of consistent video standards means content providers must reformat and package their content in dozens of different formats to enable their content to be viewable across different devices. As a result, some broadcasters and media companies are beginning to outsource playout functionality to service providers.
In order to achieve faster time-to-market as well as reduce operational costs, content providers are adopting cloud-based technologies and transitioning portions of their operations into public cloud environments. This enables content providers to offer expanded services at a more rapid pace, distribute video directly to consumers or to distributors over IP and public networks and operate globally in a more efficient manner at greater scale.
Market Trends
Cable Market
To address increasing competition, increase average revenue per user (ARPU) and differentiate themselves, cable operators continue to focus on a number of initiatives to improve their product offerings:
• | Bundled digital video, voice and high speed data services; |
• | Expansion of VOD libraries and on-demand service offerings; |
• | Refresh of the user experience with upgraded consumer-facing applications; |
• | Video delivery over IP to broadband enabled consumer devices; |
• | Capacity enhancement of high-speed data services; |
• | Expansion of network capacity to support the growing number of available services, including HDTV in foreign markets; and |
• | Collaboration with content owners on offering access to on-line content. |
To support this rapid expansion of service offerings, cable operators are investing in video processing solutions that can receive, process, and distribute content from a variety of sources to a broad array of consumer devices; video storage equipment; and servers to ingest, store and intelligently distribute content. These technologies are complemented by the latest cable edge solutions to significantly scale broadband network capacity and speed.
Satellite and Telco Markets
Over 100 satellite operators around the world have established digital television services that serve tens of millions of subscribers. These services are capable of providing tens of thousands of linear channels, including an increasing number of HD channels and the introduction of Ultra HD channels. These linear services will likely continue to expand as operators offer premium packages targeted towards specific consumer groups, with the goal of gaining loyalty and expanding ARPU. In parallel, satellite operators have begun offering the same linear services and VOD options to their customer base via
5
broadband-connected consumer devices such as smart phones, tablets and set-top boxes. These services are deployed in conjunction with content delivery networks (CDNs) and are accessible through partnerships, acquisitions or internal investments. Satellite operators are expanding their video infrastructure in order to attain greater operational efficiency for the creation and distribution of these new services across a wide range of mediums and platforms.
Internationally, and specifically in emerging markets, satellite operators continue to enjoy substantial growth in their customer base, driven mainly by rapid economic development, and the rise of a growing middle class with disposable income. As this growth continues, it is expected that these satellite operators will expand their product offerings to leverage the growing customer base and increase overall revenue.
Over the past several years, telcos around the world have added video services as a competitive response to cable and satellite operators and as a potential source of revenue growth. As their businesses have grown and matured, they have also expanded their offerings in an effort to successfully compete in the video arena, including high-quality HD content, larger VOD libraries, time-shifting television services, bundled voice, data and video packages, multiscreen video offerings to a broad range of devices, and branded mobile-specific services. The last of these offerings, mobile wireless services, is a key competitive advantage for telcos today, as it provides a clear differentiator in anytime, anywhere service offerings for consumers looking to view content on the move. In many cases, telcos are making significant infrastructure investments to expand their video offerings into IP services and gain market share, while certain telcos are also acquiring satellite and/or cable companies to buy the market reach and scale needed to be competitive in the video space.
Broadcast and Media Markets
Network broadcasters, programmers and content owners transmit live programming of news and sports to their studios for subsequent broadcast, and deliver the same programming and content to service providers for distribution to their subscribers. These broadcasters generally produce their own news and sports highlight content, along with hundreds of channels of network programming that is played-to-air under strict reliability requirements.
In the terrestrial broadcasting market, operators in many countries in EMEA, APAC and South America are now required by regulation to convert from analog to digital transmission in order to free up broadcast spectrum. These broadcasters are faced with requirements of converting analog signals to digital signals prior to transmission over the air, as well as to distribute these new signals across a new terrestrial network. The conversion to digital transmission provides the opportunity to deliver new channels; HD and Ultra HD services; premium content; and interactive services.
Media companies, in order to effectively address consumer demands, are expanding their offerings to support a wide range of live and linear content, and to make content available in higher quality video formats and on-demand. These trends are increasing demand for media servers and video-optimized storage equipped to support higher resolution formats, and are accelerating demand for functionally collapsed playout systems with integrated media orchestration software. In addition, distribution networks responsible for moving video content to service providers are being upgraded to handle larger volumes of digital content more efficiently and with greater flexibility. To effectively support these rapidly developing needs, a wide range of media companies are utilizing public cloud infrastructures for video infrastructure needs, and we believe this trend will accelerate.
New Media and OTT Markets
OTT video streaming accounts for the majority of downstream Internet traffic in North America, and new media OTT companies are aggressively pushing into international markets. These companies will continue to require high-quality video processing solutions in order to process and distribute large amounts of content from a wide variety of sources to a broad array of consumer devices, and to optimize adaptive bitrate video streaming quality and bandwidth utilization. Also, OTT companies are increasingly developing and introducing original content, as well as developing and launching program channels similar to channels currently available from service providers. In many cases, these OTT companies can monetize their content via the use of national, regionalized and personalized advertising delivered to the devices of individual viewers. We believe these developments may result in increased investments in video production and playout solutions by OTT companies.
Emerging Markets
With a growing middle class across emerging markets, we believe the Pay-TV business is poised for growth over the coming decade in the Asia Pacific region, South Asia, the Middle East, Africa and Central and South America. We currently derive a meaningful portion of our revenue from countries in emerging markets. Many consumers who are entering the middle class are now able to afford a monthly video service to gain access to their favorite programs and movies. Considering the early stages of economic development in many of these regions, together with very large populations, we believe some of the leading video service providers serving emerging markets will experience high subscriber growth rates and may become worldwide industry leaders. In addition, since the video services currently available to consumers in these markets are generally more
6
basic when compared to services available in more developed markets, we believe subscribers will demand increasingly sophisticated video services over time as consumer consumption trends in these markets track to those in more developed markets. As a result, we believe that the infrastructure and technology investments of these service providers and new market entrants are likely to grow significantly for the foreseeable future.
Further, media companies addressing emerging markets are aggressively investing in the creation of new content, particularly content that is localized and responsive to consumer demands, with the goal of creating strong brands and a growing, loyal customer base. We believe that this growth in content creation will require these media companies to significantly increase their investments in video storage, processing and related technologies.
Our Video Business
Overview
We offer a range of products and solutions that address the demand and market trends shaping our industry, including next-generation software-based media processing platforms.
In light of more complicated workflows inherent in managing the delivery of greater quantities of content across multiple formats to a growing population of set-top-boxes and consumer electronic devices, we believe the industry is moving towards unified video processing systems. These systems integrate what had been historically discrete hardware video processing functions into software, enabling significant cost efficiencies, greater flexibility and improved business agility across the entire video workplace. Additionally, we believe there is gaining industry momentum towards network function virtualization, whereby core video chain functions are being re-engineered and collapsed to run on the latest Intel processors in order to leverage high-performance and scalable appliance-based hardware, or as software-only virtual instances designed to run on industry standard servers in data center environments.
From production studios to broadcast newsrooms, consumer demand for higher resolution video programming and more viewing options is escalating network touch points and the server capacity needed to administer channel production and playout processes, thereby elevating costs and space restrictions. As more content is filmed in 4K and played-to-air on newly created channels supporting higher resolution HD and Ultra HD formats, these constraints are likely to be exacerbated. We believe these issues are resulting in increased demand for software-based playout systems that integrate previously discrete functionality, including graphics and branding insertion and media orchestration. This type of software provides an automated control system that streamlines playout processes, improves video quality, and reduces server overhead by combining historically discrete video chain functions into a unified playout system where content can be ingested, formatted, stored and played-to-air, a technological development known as function collapse or function integration.
We believe functionally collapsed video playout infrastructures with media orchestration systems, along with video optimized storage solutions, will enable content providers to produce more channels in higher resolution formats faster and more cost-effectively, and provide content in the widest possible range of formats and at the highest possible video quality.
As a result, we believe service providers and broadcast and media companies are likely to make significant investments in these newly architected systems in the foreseeable future.
Video Products
Video Processing Solutions
Our video processing solutions, which include network management software and application software and hardware products, provide our customers with the ability to acquire a variety of signals from different sources and in different protocols in order to deliver a variety of real-time and stored content to their subscribers for viewing on a broad range of devices.
Cloud media processing. An increasing number of service providers and media professionals are looking to cloud-based architectures for their media processing workflows, which is a fundamental shift from traditional, hardware-based approaches. We have addressed, and continue to address, this changing landscape with our VOS Cloud software application, which transforms traditional video preparation and delivery architectures into a fully integrated set of cloud-native functions, accelerating the time to market for new broadcast and OTT services. Our VOS 360 offering provides these same capabilities through our software-as-a-service solution.
Broadcast and distribution encoders. Our high-performance encoders compress video, audio and data channels to low bit rates while maintaining high video quality. Our latest software-based Electra encoders can deliver video in multiple formats, including standard, HD and Ultra HD, and in any video compression standard, including the MPEG-2, MPEG-4 AVC, HEVC and AVS+ codecs. This capability allows the encoders to converge workflows targeted for all forms of video delivery, whether broadcast, cable, satellite, IPTV or OTT. Today’s Electra and VOS solutions all leverage the Harmonic PURE Compression
7
Engine, a software-based technology that incorporates many of the encoding algorithm and processing techniques developed by Harmonic over the past two decades. The benefits of the PURE Compression Engine include a faster rate of video quality innovation, the ability to dynamically balance workflow efficiency and resource utilization, and improved investment protection. Our EyeQ real-time video compression optimization solution is an optional enhancement for systems featuring PURE Compression. The EyeQ solution leverages the function of the human visual system to provide a superior viewing experience on any device at low bitrates.
Contribution encoders. Our ViBE contribution encoders provide broadcasters with video compression solutions for real-time news gathering, live sports coverage and other remote events, and enable our customers to deliver these feeds to their studios for further processing. Our latest models can encode HD and Ultra HD video signals in HEVC or AVC 4:2:2 10-bit resolution, enabling the transmission of very high-quality video with low latency. Broadcasters and other operators also use our contribution encoders for delivery of their programming to their customers, which are typically cable, telco and satellite operators.
Multiscreen transcoders and stream processing. We offer high-density, real-time transcoding of video for broadcast and OTT delivery with our Electra XT Xtream transcoder. This scalable platform is designed to accelerate time to market for operators faced with fast channel lineup growth and a rise in multiscreen applications. Our latest ProStream X and ProStream XVM real-time stream processing systems are software-based and provide high-performance, high-throughput processing for mission-critical IP video delivery applications, including multiplexing, scrambling, splicing and blackout switching.
Content preparation and delivery for multiscreen applications. Our ProMedia multiscreen solutions enable the preparation and delivery of high-quality OTT services, including live streaming, VOD, catch-up TV, start-over TV and network DVR services through hypertext transfer protocol (HTTP) streaming to any device. Capabilities include real-time and file-based transcoding, stream packaging, and multiscreen workflow management. Our ProMedia X Origin multiscreen video server ingests transcoded, segmented and encrypted output from Electra and ProMedia systems to provide high-volume live adaptive bitrate streaming and the delivery of time-shifted services.
Decoders and descramblers. Our family of ProView integrated receivers-decoder (IRD) products allows service providers to acquire content delivered via satellite, IP or terrestrial networks for distribution to their subscribers. These products, including the ProView 7100 and ProView 8100, are used by broadcasters to decode signals backhauled from live news and sporting events in contribution applications, as well as by content owners looking to distribute their content in a controlled manner to a large base of video service providers.
Video Production Platforms and Playout Solutions
Our video production platforms consist of video-optimized storage and content management applications, which provide broadcast and media companies with file-based infrastructure to support video content production activities, such as editing, post-production and finishing. Our video playout solutions, including media orchestration software, are based on scalable video servers used by broadcast and media companies to create and playout television channels.
Video servers. Our Spectrum family of video server systems are used by broadcast and media companies to create play-to-air television channels. Our customers typically use these video server products to record incoming content from either live feeds or from tapes, encoding that content in real-time into standard media files that are then stored in the server’s file system until the content is needed for playback as part of a scheduled playlist. Clips stored in the server are decoded in real-time and played-to-air according to a playout schedule in a frame-accurate, back-to-back manner to create a seamless television channel. Our Spectrum servers support SD, HD and Ultra HD programming, as well as many different media formats. Our Polaris media orchestration software solutions work with our Spectrum products and provide our customers with playout management and control tools for channel-in-a-box and integrated channel playout applications.
Video-optimized storage. Our MediaGrid shared storage system is a scale-out, network-attached storage system with a built-in media file system optimized for media production workflows. Architected as a clustered storage system with a distributed file system, MediaGrid provides highly scalable storage capacity and access bandwidth to support demanding media production applications, such as video editing, content transformation and media library management. In addition, MediaGrid systems are increasingly being employed for VOD, time-shifted television services and OTT adaptive bitrate streaming.
Our Cable Edge Business
Overview
We believe the market and industry trends highlighted above are similarly creating opportunities for our Cable Edge business, especially for the deployment of software-based solutions.
8
As consumption of VOD services accelerates, service provider demand for video edge QAMs increases. In addition, with heightened competition from non-cable service providers such as AT&T, Verizon and local municipalities to deliver gigabit data rates, cable operators are aggressively driving enabling broadband access technologies, including the Converged Cable Access Platform (CCAP) architecture. We also believe the cable industry will move rapidly to DOCSIS 3.1, which enables increased bandwidth data transfer over existing broadband infrastructure as cable operators begin migrating to distributed solutions.
In the last few years, the cable industry has been developing and promulgating the CCAP architecture for next-generation cable edge solutions, which combines edge QAM and CMTS functions in a single system in order to combine resources for video and data delivery. We believe a software-based, centralized CCAP-based system can significantly reduce cable headend costs and increase operational efficiency, and that the deployment of these systems will be an important step in cable operators’ transition to all-IP networks.
In addition to centralized CCAP systems, we believe there is growing interest in distributed remote PHY solutions, particularly in competitive gigabit service markets where cable operators are competing with FTTH services and are extending fiber access networks deeper into their distribution networks. A remote PHY architecture alleviates the power and space requirements of centralized systems at headend sites, and we believe will enable service providers to efficiently scale to support data and video growth.
Cable Edge Products
Software-Based CCAP Solution. Demand continues to grow for high-speed broadband services such as OTT streaming, VOD, time-shift TV and cloud DVR. We help cable operators take advantage of this opportunity with our CableOS software-based CCAP, an end-to-end cable access solution that we believe delivers unprecedented scalability, agility and cost savings. CableOS enables the migration to multi-gigabit broadband capacity and the fast deployment of DOCSIS 3.1 data, video and voice services. We believe the solution resolves space and power constraints in the headend and hub, eliminates dependence on hardware upgrade cycles, and reduces total cost of ownership.
Edge QAM products. Our Narrowcast Services Gateway (NSG) products are fully integrated edge gateway products that integrate routing, multiplexing, scrambling and modulation into a single package for the delivery of narrowcast services to subscribers over cable networks. NSG systems allow cable operators to deliver IP signals from the headend to the edge of the network for subsequent modulation onto a HFC network. Originally developed for VOD applications, the NSG has evolved to support multiple applications, including switched digital video and modular CMTS applications, as well as large-scale VOD deployments.
We believe CCAP systems will, over time, replace and make obsolete current cable edge QAM products, as well as current CMTS products, since fully compliant CCAP-based solutions will combine the functionality of these products into one system. Since we historically have not addressed the CMTS market, we believe that our CableOS solution, which includes a software-based CMTS, will have an opportunity to be sold into a significantly larger and growing market created by the CCAP standard.
Technical Support and Professional Services
We provide maintenance and support services to most of our customers under service level agreements that are generally renewed on an annual basis. We also provide consulting, implementation and integration services to our customers worldwide. We draw upon our expertise in broadcast television, communications networking and compression technology to design, integrate and install complete solutions for our customers, including integration with third-party products and services. We offer a broad range of services, including program management, technical design and planning, building and site preparation, integration and equipment installation, end-to-end system testing and comprehensive training.
Customers
We sell our products to a variety of cable, satellite and telco, and broadcast and media companies. Set forth below is a representative list of our significant end user and integrator/reseller customers, based, in part, on revenue during 2016.
9
United States | International |
CenturyLink | AM Technolgia SA de CV |
Charter Communications | Com Hem AB |
Comcast Cable | Dayang Technology Development Inc. |
Cox Communications | France Televisions SA |
DirecTV | Groupe Canal+SA |
EchoStar Holding | Huawei Technologies Co Ltd. |
Heartland Video | Netorium GmbH |
Suddenlink Communications | NYL Electronica SA |
Time Warner Cable | Telefonia Por Cable SA de CV |
Turner Broadcasting | Vodafone |
Sales to our 10 largest customers in 2016, 2015 and 2014 accounted for approximately 28%, 32% and 35% of our net revenue, respectively. Although we continue to seek to broaden our customer base by penetrating new markets and further expanding internationally, we expect to see continuing industry consolidation and customer concentration.
During 2016, no customer accounted for more than 10% of our net revenue. During 2015 and 2014, revenue from Comcast accounted for approximately 12% and 16% of our net revenue, respectively. The loss of any significant customer, or any material reduction in orders from any significant customer, or our failure to qualify our new products with any significant customer could materially and adversely affect our operating results, financial condition and cash flows. In addition, we are involved in most quarters in one or more relatively large individual transactions. A decrease in the number of relatively larger individual transactions in which we are involved in any quarter could adversely affect our operating results for that quarter.
Sales and Marketing
In the U.S. and internationally, we sell our products through our own direct sales force, as well as through independent resellers and systems integrators. Our direct sales team is organized geographically and by major customers and markets to support customer requirements. Our principal sales offices outside of the U.S. are located in Europe and Asia, and we have a support center in Switzerland to support our international customers and operations. Our international resellers are generally responsible for importing our products and providing certain installation, technical support and other services to customers in their territory after receiving training from us.
Our direct sales force and resellers are supported by a highly trained technical staff, which includes application engineers who work closely with our customers to develop technical proposals and design systems to optimize system performance and economic benefits for our customers. Our technical support teams provide a customized set of services, as required, for ongoing maintenance, support-on-demand and training for our customers and resellers, both in our facilities and on-site.
Our product management organization develops strategies for product lines and markets and, in conjunction with our sales force, identifies the evolving technical and application needs of customers so that our product development resources can be most effectively and efficiently deployed to meet anticipated product requirements. Our product management organization is also responsible for setting price levels, demand forecasting and general support of the sales force, particularly at major accounts.
Our corporate marketing organization is responsible for building awareness of the Harmonic brand in our markets and driving engagement with our strategies, solutions and products. The group develops all of our corporate messaging and manages all customer and industry communication mechanisms, including advertising, our Web presence, speakers’ bureau, events and trade shows. The marketing organization also manages product launches and demand generation in conjunction with our sales force.
Manufacturing and Suppliers
We rely on third-party contract manufacturers to assemble our products and the subassemblies and modules for our products. In 2003, we entered into an agreement with Plexus Services Corp. to act as our primary contract manufacturer. Plexus currently provides us with a substantial majority, by dollar amount, of the products we purchase from our contract manufacturers. This agreement has automatic annual renewals, unless prior notice for nonrenewal is given, and has been automatically renewed for a term expiring in October 2017. We do not generally maintain long-term agreements with any of our contract manufacturers.
10
Many components, subassemblies and modules necessary for the manufacture or integration of our products are obtained from a sole supplier or a limited group of suppliers. While we expend considerable efforts to qualify additional component sources, consolidation of suppliers in the industry and the small number of viable alternatives have limited the results of these efforts. We do not generally maintain long-term agreements with any of our suppliers.
Intellectual Property
As of December 31, 2016, we held 71 issued U.S. patents and 44 issued foreign patents and had 78 patent applications pending. Although we attempt to protect our intellectual property rights through patents, trademarks, copyrights, licensing arrangements, maintaining certain technology as trade secrets and other measures, we cannot assure you that any patent, trademark, copyright or other intellectual property rights owned by us will not be invalidated, circumvented or challenged, that such intellectual property rights will provide competitive advantages to us, or that any of our pending or future patent applications will be issued with the claims, or the scope of the claims, sought by us, if at all. We cannot assure you that others will not develop technologies that are similar or superior to our technology, duplicate our technology or design around the patents that we own. In addition, effective patent, copyright and trade secret protection may be unavailable or limited in which we do business or may do business in the future.
We generally enter into confidentiality or license agreements with our employees, consultants, vendors and customers as needed, and generally limit access to, and distribution of, our proprietary information. However, no assurances can be given that these actions will prevent misappropriation of our technology. In addition, if necessary, we are prepared to take legal action, in the future, to enforce our patents and other intellectual property rights, to protect our trade secrets, to determine the validity and scope of the proprietary rights of others, or to defend against claims of infringement or invalidity. Any such litigation could result in substantial costs and diversion of resources, including management time, and could negatively affect our business, operating results, financial position and cash flows.
In order to successfully develop and market our products, we may be required to enter into technology development or licensing agreements with third parties. Although many companies are often willing to enter into such technology development or licensing agreements, we cannot assure you that such agreements can be negotiated on reasonable terms or at all. The failure to enter into technology development or licensing agreements, when necessary, could limit our ability to develop and market new products and could harm our business.
Backlog
We schedule production of our products and solutions based upon our backlog, open contracts, informal commitments from customers and sales projections. Our backlog consists of firm purchase orders by customers. Approximately 75% of our backlog is projected to be converted to revenue within a rolling one-year period. Our backlog, including deferred revenue at December 31, 2016 was approximately $188.4 million. Delivery schedules on such orders may be deferred or canceled for a number of reasons, including reductions in capital spending by our customers or changes in specific customer requirements. In addition, due to annual capital spending budget cycles at many of our customers, the amount of our backlog at any given time is not necessarily indicative of actual revenues for any succeeding period.
Competition
The markets for video infrastructure systems are extremely competitive and have been characterized by rapid technological change and declining average selling prices. The principal competitive factors in these markets include product performance, functionality and features, reliability, pricing, breadth of product offerings, brand recognition and awareness, sales and distribution capabilities, technical support and services, and relationships with end customers. We believe that we compete favorably in each of these categories.
Our competitors in our Video business segment include vertically integrated system suppliers, such as Arris Group, Cisco Systems and Ericsson, and, in certain product lines, other companies including ATEME and Elemental Technologies (an Amazon Web Services company). With respect to production and playout products, competitors include Evertz Microsystems, EVS, Grass Valley (a Belden brand) and Imagine Communications. Our competitors in our Cable Edge business include Arris, Casa Systems and Cisco Systems.
Consolidation in the industry has led to the acquisition of a number of our historic competitors over the last several years. For example, Motorola Home, BigBand Networks and C-Cor were acquired by Arris; NDS and Scientific Atlanta were acquired by Cisco Systems; Envivio and Tandberg Television were acquired by Ericsson; Elemental Technologies was acquired by Amazon; and Miranda Technologies and Grass Valley were acquired by Belden Inc. Consequently, some of our principal competitors are substantially larger and have greater financial, technical, marketing and other resources than we have.
11
Research and Development
We have historically devoted a significant amount of our resources to research and development. Research and development expenses in 2016, 2015 and 2014 were approximately $98.4 million, $87.5 million and $93.1 million, respectively. Research and development expenses as a percent of revenue in 2016, 2015 and 2014 were approximately 24.2%, 23.2% and 21.5%, respectively. Our internal research and development activities are conducted primarily in the United States (California, Oregon and New Jersey), France, Israel and Hong Kong. In addition, a portion of our research and development is conducted through third-party partners with engineering resources in Ukraine and in India.
Our research and development program is primarily focused on developing new products and systems, and adding new features and other improvements to existing products and systems. Our development strategy is to identify features, products and systems, in both software and hardware solutions, that are, or are expected to be, needed by our customers. Our current research and development efforts are focused on next-generation video processing and delivery across different deployment environments, particularly cloud-native and SaaS delivery models, and enhanced video compression, video quality, and multiscreen solutions. We also devote significant resources to production and playout and distribution solutions. Other major research and development efforts are focused on cable edge solutions for both video and data, particularly the ongoing development of our CableOS software-based CCAP solution.
Our success in designing, developing, manufacturing and selling new or enhanced products will depend on a variety of factors, including the identification of market demand for new products, product selection, timely product design and development, product performance, effective manufacturing and assembly processes and sales and marketing. Because of the complexity inherent in such research and development efforts, we cannot assure you that we will successfully develop new products, or that new products developed by us will achieve market acceptance. Our failure to successfully develop and introduce new products would materially and adversely affect our business, operating results, financial condition and cash flows.
Employees
As of December 31, 2016, we employed a total of 1,376 full time employees, including 523 in research and development, 233 in sales, 303 in service and support, 80 in operations, 87 in marketing (corporate and product) and 150 in a general and administrative capacity. Of those employees, 507 were located in the U.S. and 869 employees were located in foreign countries in South America, the Middle East, Europe, Asia and Canada. From time to time, we also employ a number of temporary employees and consultants on a contract basis. Our employees in France are represented by labor unions and an employee works council. None of our other employees are represented by a labor union with respect to his or her employment with us. We have not experienced any work stoppages, and we consider our relations with our employees to be good.
12
Item 1A. | RISK FACTORS |
We depend on cable, satellite and telco, and broadcast and media industry capital spending for our revenue and any material decrease or delay in capital spending in any of these industries would negatively impact our operating results, financial condition and cash flows.
Our revenue has been derived from worldwide sales to service providers and broadcast and media companies, as well as, more recently, emerging streaming media companies. We expect that these markets will provide our revenue for the foreseeable future. Demand for our products will depend on the magnitude and timing of capital spending by customers in each of these markets for the purpose of creating, expanding or upgrading their systems. These capital spending patterns are dependent on a variety of factors, including:
• the impact of general economic conditions, actual and projected;
• access to financing;
• annual capital spending budget cycles of each of the industries we serve;
• the impact of industry consolidation;
• customers suspending or reducing capital spending in anticipation of: (i) new standards, such as HEVC and DOCSIS 3.1; (ii) industry trends and technology shifts, such as virtualization, and (iii) new products, such as products based on our VOS software platform or the CCAP architecture, such as CableOS;
• federal, state, local and foreign government regulation of telecommunications, television broadcasting and streaming media;
• overall demand for communication services and consumer acceptance of new video and data technologies and services;
• competitive pressures, including pricing pressures;
• the impact of fluctuations in currency exchange rates; and
• discretionary end-user customer spending patterns.
In the past, specific factors contributing to reduced capital spending have included:
• weak or uncertain economic and financial conditions in the U.S. or one or more international markets;
• uncertainty related to development of digital video industry standards;
• delays in evaluations of new services, new standards and systems architectures by many operators;
• emphasis by operators on generating revenue from existing customers, rather than from new customers, through construction, expansion or upgrades;
• a reduction in the amount of capital available to finance projects of our customers and potential customers;
• proposed and completed business combinations and divestitures by our customers and the length of regulatory review of each;
• completion of a new system or significant expansion or upgrade to a system; and
• bankruptcies and financial restructuring of major customers.
In the past, adverse economic conditions in one or more of the geographies in which we offer our products have adversely affected our customers’ capital spending in those geographies and, as a result, our business. During challenging economic
13
times, and in tight credit markets, many customers may delay or reduce capital expenditures. This could result in reductions in revenue from our products, longer sales cycles, difficulties in collection of accounts receivable, slower adoption of new technologies and increased price competition. If global economic and market conditions, or economic conditions in the U.S., Europe or other key markets, deteriorate, we could experience a material and adverse effect on our business, results of operations, financial condition and cash flows. Additionally, since most of our international revenue is denominated in U.S. dollars, global economic and market conditions may impact currency exchange rates and cause our products to become relatively more expensive to customers in a particular country or region, which could lead to delayed or reduced capital spending in those countries or regions, thereby negatively impacting our business and financial condition.
In addition, industry consolidation has in the past constrained, and may in the future constrain or delay, capital spending by our customers. Further, if our product portfolio and product development plans do not position us well to capture an increased portion of the capital spending of customers in the markets on which we focus, our revenue may decline.
As a result of these capital spending issues, we may not be able to maintain or increase our revenue in the future, and our operating results, financial condition and cash flows could be materially and adversely affected.
The markets in which we operate are intensely competitive.
The markets for our products are extremely competitive and have been characterized by rapid technological change and declining average sales prices in the past. Our competitors in our Video business segment include vertically integrated system suppliers, such as Arris Group, Cisco Systems and Ericsson, and, in certain product lines, other companies including ATEME and Elemental Technologies (an Amazon Web Services company). With respect to production and playout products, competitors include Evertz Microsystems, EVS, Grass Valley (a Belden brand) and Imagine Communications. Our competitors in our Cable Edge business include Arris, Casa Systems and Cisco Systems.
Many of our competitors are substantially larger, or as a result of consolidation activity have become larger, and have greater financial, technical, marketing and other resources than we have, and have been in operation longer than we have. Consolidation in the industry has led to the acquisition of a number of our historic competitors over the last several years. For example, Motorola Home, BigBand Networks and C-Cor were acquired by Arris; NDS and Scientific Atlanta were acquired by Cisco Systems; Envivio and Tandberg Television were acquired by Ericsson; Elemental Technologies was acquired by Amazon; and Miranda Technologies and Grass Valley were acquired by Belden Inc.
In addition, some of our larger competitors have more long-standing and established relationships with domestic and foreign customers. Many of these large enterprises are in a better position to withstand any significant reduction in capital spending by customers in our markets. They often have broader product lines and market focus, and may not be as susceptible to downturns in a particular market. These competitors may also be able to bundle their products together to meet the needs of a particular customer, and may be capable of delivering more complete solutions than we are able to provide. To the extent large enterprises that currently do not compete directly with us choose to enter our markets by acquisition or otherwise, competition would likely intensify.
Further, some of our competitors that have greater financial resources have offered, and in the future may offer, their products at lower prices than we offer for our competing products or on more attractive financing or payment terms, which has in the past caused, and may in the future cause, us to lose sales opportunities and the resulting revenue or to reduce our prices in response to that competition. Also, some competitors that are smaller than we are have engaged in, and may continue to engage in, aggressive price competition in order to gain customer traction and market share. Reductions in prices for any of our products could materially and adversely affect our operating margins and revenue.
Additionally, certain customers and potential customers have developed, and may continue to develop, their own solutions that may cause such customers or potential customers to not consider our product offerings or to displace our installed products with their own solutions. The growing availability of open source codecs and related software, as well as new server chipsets that incorporate encoding technology, has, in certain respects, lowered the barriers to entry for the video processing industry. The development of solutions by potential and existing customers and the reduction of the barriers to entry to enter the video processing industry could result in increased competition and adversely affect our results of operations and business.
If any of our competitors’ products or technologies were to become the industry standard, our business could be seriously harmed. If our competitors are successful in bringing their products to market earlier than us, or if these products are more technologically capable than ours, our revenue could be materially and adversely affected.
14
We need to develop and introduce new and enhanced products in a timely manner to meet the needs of our customers and to remain competitive.
All of the markets we address are characterized by continuing technological advancement, changes in customer requirements and evolving industry standards. To compete successfully, we must continually design, develop, manufacture and sell new or enhanced products that provide increasingly higher levels of performance and reliability and meet our customers changing needs. However, we may not be successful in those efforts if, among other things, our products:
• are not cost effective;
• are not brought to market in a timely manner;
• are not in accordance with evolving industry standards;
• fail to meet market acceptance or customer requirements; or
• are ahead of the needs of their markets.
We are currently developing and marketing products based on the latest video compression standards, such as HEVC, which provides significantly greater compression efficiency, thereby making more bandwidth available to operators. At the same time, we continue to devote development resources to enhance the existing AVC/H.264 compression of our products, which many of our customers continue to require. There can be no assurance that these efforts will be successful in the near future, or at all, or that our competitors will not take significant market share in encoding or transcoding.
We continue to focus our development efforts on key product solutions in our Video and Cable Edge businesses. Our VOS solution is a software-based, cloud-enabled platform that unifies the entire media processing chain, from ingest to delivery. We have launched a number of VOS-based product solutions and services, including Electra XVM, VOS Cloud and VOS360. In our Cable Edge business, we have launched and continue to develop our CableOS software-based CCAP systems, and we continue to develop, market and sell our NSG edgeQAM solutions.
Many of these products and initiatives are intended to integrate existing and new features and functions in response to shifts in customer demands in the relevant market, as well as to general technology trends (such as virtualized and cloud-based computing, and integrated QAM and CMTS functionality in CCAP-based products) that we believe will significantly impact our industry. The success of these significant and costly development efforts will be predicated, for certain products and initiatives, on the timing of market adoption of the new standards on which the resulting products are based, and for other products, the timing of customer adoption of our products and solutions, as well as our ability to timely develop the features and capabilities of our products and solutions. If new standards or some of our new products are adopted later than we predict or not adopted at all, or if adoption occurs earlier than we are able to deliver the applicable products or functionality, we risk spending significant research and development time and dollars on products or features that may never achieve market acceptance or that miss the customer demand window and thus do not produce the revenue that a timely introduction would have likely produced.
If we fail to develop and market new and enhanced products on a timely basis, our operating results, financial condition and cash flows could be materially and adversely affected.
Our CCAP-based product initiatives expose us to certain technology transition risks that may adversely impact our operating results, financial condition and cash flows.
In the last few years, the cable industry has begun to develop and promulgate the CCAP architecture for next-generation cable edge solutions, which combines edge QAM and CMTS functions in a single system in order to combine resources for video and data delivery. We believe our CableOS software-based CCAP systems, available as either a centralized or distributed remote PHY solution, will significantly reduce cable headend costs and increase operational efficiency, and are an important step in cable operators’ transition to all-IP networks. If we are unsuccessful in developing these capabilities in a timely manner, or are otherwise delayed in making such capabilities available to our customers, our business may be adversely impacted, particularly if our competitors develop and market fully compliant products before we do.
We believe CCAP-based systems will, over time, replace and make obsolete current cable edge-QAM solutions, including our cable edge QAM products, as well as current CMTS solutions, which is a market our products have previously not addressed. If demand for our CCAP systems is weaker than expected, or sales of our CCAP-based systems do not adequately
15
offset the expected decline in demand for our non-CCAP cable edge products, or the decline in demand for our non-CCAP cable edge products is more rapid and precipitous than expected, our near and long-term operating results, financial condition and cash flows could be adversely impacted. Further, in September 2016 we granted Comcast a warrant (the “Warrant”) to purchase shares of our common stock to further incentivize them to purchase our products and adopt our technologies, particularly our CableOS software-based CCAP solution. If Comcast does not adopt our CableOS system, or does so more slowly than we anticipate, we may be unable to realize the anticipated benefits of our relationship with Comcast and our business and operating results, financial condition and cash flows could be materially and adversely effected. Moreover, if a new or competitive architecture for next-generation cable edge solutions is promulgated that renders our CCAP-based systems obsolete, our business may be adversely impacted.
Our future growth depends on market acceptance of several broadband services, on the adoption of new broadband technologies, and on several other broadband industry trends.
Future demand for many of our products will depend significantly on the growing market acceptance of emerging broadband services, including digital video, VOD, Ultra HD, IP video services (particularly streaming to tablet computers, connected TVs and mobile devices) and very high-speed data services. The market demand for such emerging services is rapidly growing, with many custom or proprietary systems in use, which increases the challenge of delivering interoperable products intended to address the requirements of such services.
The effective delivery of these services will depend, in part, on a variety of new network architectures, standards and devices, such as:
• the adoption of cloud-native media processing architectures;
• the adoption of advanced video compression standards, such as next generation H.264 compression and HEVC;
• the CCAP architecture;
• fiber to the premises, or FTTP, networks designed to facilitate the delivery of video services by telcos;
• the greater use of protocols such as IP;
• the further adoption of bandwidth-optimization techniques, such as DOCSIS 3.0 and DOCSIS 3.1; and
• the introduction of new consumer devices, such as advanced set-top boxes, DVRs and network DVRs, connected TVs, tablet computers, and a variety of smart phone mobile devices.
If adoption of these emerging services and/or technologies is not as widespread or as rapid as we expect, or if we are unable to develop new products based on these technologies on a timely basis, our operating results, financial condition and cash flows could be materially and adversely affected.
Furthermore, other technological, industry and regulatory trends and requirements may affect the growth of our business.
These trends and requirements include the following:
• convergence, whereby network operators bundle video, voice and data services to consumers, including mobile delivery options;
• the increasing availability of traditional broadcast video content and video-on-demand on the Internet;
• adoption of high-bandwidth technology, such as DOCSIS 3.x, next generation LTE and FTTP;
• the use of digital video by businesses, governments and educational institutions;
• efforts by regulators and governments in the U.S. and internationally to encourage the adoption of broadband and digital technologies, as well as to regulate broadband access and delivery;
• consumer interest in higher resolution video such as Ultra HD or retina-display technologies on mobile devices;
16
• the need to develop partnerships with other companies involved in video infrastructure workflow and broadband services;
• the continued adoption of the television viewing behaviors of consumers in developed economies by the growing middle class across emerging economies;
• the extent and nature of regulatory attitudes towards issues such as network neutrality, competition between operators, access by third parties to networks of other operators, local franchising requirements for telcos to offer video, and other new services, such as mobile video; and
• the outcome of disputes and negotiations between content owners and service providers regarding rights of service providers to store and distribute recorded broadcast content, which outcomes may drive adoption of one technology over another in some cases.
If we fail to recognize and respond to these trends, by timely developing products, features and services required by these trends, we are likely to lose revenue opportunities and our operating results, financial condition and cash flows could be materially and adversely affected.
We depend significantly on our international revenue and are subject to the risks associated with international operations, including those of our resellers, contract manufacturers and outsourcing partners, which may negatively affect our operating results.
Revenue derived from customers outside of the U.S. in the fiscal years ended December 31, 2016, 2015 and 2014 represented approximately 58%, 53% and 52% of our revenue, respectively. Although no assurance can be given with respect to international sales growth in any one or more regions, we expect that international revenue will likely continue to represent, from year to year, a majority, and potentially increasing, percentage of our annual revenue for the foreseeable future. A significant percentage of our revenue is generated from sales to resellers, value-added resellers (“VARs”) and systems integrators, particularly in emerging market countries. Furthermore, a significant percentage of our employees are based in our international offices and locations, and most of our contract manufacturing occurs outside of the U.S. In addition, we outsource a portion of our research and development activities to certain third-party partners with development centers located in different countries, particularly Ukraine and India.
Our international operations, the international operations of our resellers, contract manufacturers and outsourcing partners, and our efforts to maintain and increase revenue in international markets are subject to a number of risks, which are generally greater with respect to emerging market countries, including the following:
• growth and stability of the economy in one or more international regions;
• fluctuations in currency exchange rates;
• changes in foreign government regulations and telecommunications standards;
• import and export license requirements, tariffs, taxes, economic sanctions, contractual limitations and other trade barriers;
• our significant reliance on resellers and others to purchase and resell our products and solutions, particularly in emerging market countries;
• availability of credit, particularly in emerging market countries;
• longer collection periods and greater difficulty in enforcing contracts and collecting accounts receivable, especially from smaller customers and resellers, particularly in emerging market countries;
• compliance with the U.S. Foreign Corrupt Practices Act (the “FCPA”), the U.K. Bribery Act and/or similar anti-corruption and anti-bribery laws, particularly in emerging market countries;
• the burden of complying with a wide variety of foreign laws, treaties and technical standards;
• fulfilling “country of origin” requirements for our products for certain customers;
17
• difficulty in staffing and managing foreign operations;
• business and operational disruptions or delays caused by political, social and economic instability and unrest, including risks related to terrorist activity, particularly in emerging market countries (e.g., recent significant civil, political and economic disturbances in Ukraine);
• changes in economic policies by foreign governments, including the imposition and potential continued expansion of economic sanctions by the U.S. and the European Union on the Russian Federation;
• the effects and any resulting negative economic impact of the recent U.S. election or the U.K.’s referendum to exit the European Union; and
• business and economic disruptions and delays caused by outbreaks of disease, epidemics and potential pandemics.
We have certain international customers who are billed in their local currency, primarily the Euro, British pound and Japanese yen, which subjects us to foreign currency risk. In addition, a portion of our operating expenses relating to the cost of certain international employees, are denominated in foreign currencies, primarily the Israeli shekel, British pound, Euro, Singapore dollar, Chinese yuan and Indian rupee, although we do hedge against the Israeli shekel. Gains and losses on the conversion to U.S. dollars of accounts receivable, accounts payable and other monetary assets and liabilities arising from international operations may contribute to fluctuations in our operating results. Furthermore, payment cycles for international customers are typically longer than those for customers in the U.S. Unpredictable payment cycles could cause us to fail to meet or exceed the expectations of security analysts and investors for any given period.
Most of our international revenue is denominated in U.S. dollars, and fluctuations in currency exchange rates could cause our products to become relatively more expensive to customers in a particular country or region, leading to a reduction in revenue or profitability from sales in that country or region. The potential negative impact of a strong U.S. dollar on our business may be exacerbated by the significant devaluation of a number of foreign currencies. Also, if the U.S. dollar were to weaken against many foreign currencies, there can be no assurance that a weaker dollar would lead to growth in capital spending in foreign markets.
Our operations outside the U.S. also require us to comply with a number of U.S. and international regulations that prohibit improper payments or offers of payments to foreign governments and their officials and political parties for corrupt purposes. For example, our operations in countries outside the U.S. are subject to the FCPA and similar laws, including the U.K. Bribery Act. Our activities in certain emerging countries create the risk of unauthorized payments or offers of payments by one of our employees, consultants, sales agents or channel partners that could be in violation of various anti-corruption laws, even though these parties may not be under our control. Under the FCPA and U.K. Bribery Act, companies may be held liable for the corrupt actions taken by their directors, officers, employees, channel partners, sales agents, consultants, or other strategic or local partners or representatives. We have internal control policies and procedures with respect to FCPA compliance, have implemented FCPA training and compliance programs for our employees, and include in our agreements with resellers a requirement that those parties comply with the FCPA. However, we cannot provide assurances that our policies, procedures and programs will prevent violations of the FCPA or similar laws by our employees or agents, particularly in emerging market countries, and as we expand our international operations. Any such violation, even if prohibited by our policies, could result in criminal or civil sanctions against us.
The effect of one or more of these international risks could have a material and adverse effect on our business, financial condition, operating results and cash flows.
We purchase several key components, subassemblies and modules used in the manufacture or integration of our products from sole or limited sources, and we rely on contract manufacturers and other subcontractors.
Many components, subassemblies and modules necessary for the manufacture or integration of our products are obtained from a sole supplier or a limited group of suppliers. For example, we depend on two suppliers for certain video encoding chips which are incorporated into several products. Our reliance on sole or limited suppliers, particularly foreign suppliers, and our reliance on contractors for manufacturing and installation of our products, involves several risks, including a potential inability to obtain an adequate supply of required components, subassemblies or modules; reduced control over costs, quality and timely delivery of components, subassemblies or modules; supplier discontinuation of components, subassemblies or modules we require; and timely installation of products. In addition, the result of the recent presidential election in the United States has created uncertainty regarding trade policies. Specifically, the new administration has suggested imposing tariffs or other
18
restrictions on foreign imports. If any such tariffs are imposed on products or components that we import, including those obtained from a sole supplier or a limited group of suppliers, we could experience reduced revenues or may have to raise our prices, either of which could have an adverse effect on our business, financial condition and operating results.
These risks could be heightened during a substantial economic slowdown, because our suppliers and subcontractors are more likely to experience adverse changes in their financial condition and operations during such a period. Further, these risks could materially and adversely affect our business if one of our sole sources, or a sole source of one of our suppliers or contract manufacturers, is adversely affected by a natural disaster. While we expend resources to qualify additional component sources, consolidation of suppliers and the small number of viable alternatives have limited the results of these efforts. Managing our supplier and contractor relationships is particularly difficult during time periods in which we introduce new products and during time periods in which demand for our products is increasing, especially if demand increases more quickly than we expect.
Plexus Services Corp., which manufactures our products at its facilities in Malaysia, currently serves as our primary contract manufacturer, and currently provides us with a substantial majority, by dollar amount, of the products that we purchase from our contract manufacturers. Most of the products manufactured by our Israeli operations are outsourced to another third-party manufacturer in Israel. From time to time we assess our relationship with our contract manufacturers, and we do not generally maintain long-term agreements with any of our suppliers or contract manufacturers. Our agreement with Plexus has automatic annual renewals, unless prior notice is given by either party, and has been automatically renewed for a term expiring in October 2017.
Difficulties in managing relationships with any of our current contract manufacturers, particularly Plexus, that manufacture our products off-shore, or any of our suppliers of key components, subassemblies and modules used in our products, could impede our ability to meet our customers’ requirements and adversely affect our operating results. An inability to obtain adequate and timely deliveries of our products or any materials used in our products, or the inability of any of our contract manufacturers to scale their production to meet demand, or any other circumstance that would require us to seek alternative sources of supply, could negatively affect our ability to ship our products on a timely basis, which could damage relationships with current and prospective customers and harm our business and materially and adversely affect our revenue and other operating results. Furthermore, if we fail to meet customers’ supply expectations, our revenue would be adversely affected and we may lose sales opportunities, both short and long term, which could materially and adversely affect our business and our operating results, financial condition and cash flows. Increases, from time to time, in demand on our suppliers and subcontractors from our customers or from other parties have, on occasion, caused delays in the availability of certain components and products. In response, we may increase our inventories of certain components and products and expedite shipments of our products when necessary. These actions could increase our costs and could also increase our risk of holding obsolete or excess inventory, which, despite our use of a demand order fulfillment model, could materially and adversely affect our business, operating results, financial condition and cash flows.
The loss of one or more of our key customers, a failure to continue diversifying our customer base, or a decrease in the number of larger transactions could harm our business and our operating results.
Historically, a significant portion of our revenue has been derived from relatively few customers, due in part to the consolidation of the ownership of cable television and direct broadcast satellite system companies. Sales to our top 10 customers in the fiscal years ended December 31, 2016, 2015 and 2014 accounted for approximately 28%, 32% and 35% of revenue, respectively. Although we have broadened our customer base by further penetrating new markets and expanding internationally, we expect to see continuing industry consolidation and customer concentration.
In fiscal year ended December 31, 2016, no customer accounted for more than 10% of our net revenue. In the fiscal years ended December 31, 2015 and 2014, revenue from Comcast accounted for approximately 12% and 16% of our revenue, respectively, and further consolidation in the cable industry could lead to additional revenue concentration for us. The loss of any significant customer, or any material reduction in orders from any other significant customer, or our failure to qualify our new products with any significant customer could materially and adversely affect, either long term or in a particular quarter, our operating results, financial condition and cash flows. Further, if Comcast does not increase its adoption of our technologies or purchases of our products in connection with the Warrant we issued to them in September 2016, or does so more slowly than we anticipate, we may be unable to realize the anticipated benefits of the Warrant and our operating results, financial condition and cash flows could be materially and adversely effected.
In addition, we are involved in most quarters in one or more relatively large individual transactions. A decrease in the number of the relatively larger individual transactions in which we are involved in any quarter could materially and adversely affect our operating results for that quarter.
19
As a result of these and other factors, we may be unable to increase our revenues from some or all of the markets we address, or to do so profitably, and any failure to increase revenues and profits from these customers could materially and adversely affect our operating results, financial condition and cash flows.
We rely on resellers, value-added resellers and systems integrators for a significant portion of our revenue, and disruptions to, or our failure to develop and manage our relationships with these customers or the processes and procedures that support them could adversely affect our business.
We generate a significant percentage of our revenue through sales to resellers, VARs and systems integrators that assist us with fulfillment or installation obligations. We expect that these sales will continue to generate a significant percentage of our revenue in the future. Accordingly, our future success is highly dependent upon establishing and maintaining successful relationships with a variety of channel partners.
We generally have no long-term contracts or minimum purchase commitments with any of our reseller, VAR or system integrator customers, and our contracts with these parties do not prohibit them from purchasing or offering products or services that compete with ours. Our competitors may provide incentives to any of our reseller, VAR or systems integrator customers to favor their products or, in effect, to prevent or reduce sales of our products. Any of our reseller, VAR or systems integrator customers may independently choose not to purchase or offer our products. Many of our resellers, and some of our VARs and system integrators are small, are based in a variety of international locations, and may have relatively unsophisticated processes and limited financial resources to conduct their business. Any significant disruption of our sales to these customers, including as a result of the inability or unwillingness of these customers to continue purchasing our products, or their failure to properly manage their business with respect to the purchase of, and payment for, our products, could materially and adversely affect our business, operating results, financial condition and cash flows. In addition, our failure to continue to establish or maintain successful relationships with reseller, VAR and systems integrator customers could likewise materially and adversely affect our business, operating results, financial condition and cash flows.
We have made, and may continue to make, acquisitions, and any acquisition could disrupt our operations, cause dilution to our stockholders and materially and adversely affect our business, operating results, cash flows and financial condition.
As part of our business strategy, from time to time we have acquired, and we may continue to acquire, businesses, technologies, assets and product lines that we believe complement or expand our existing business. For example, on February 29, 2016, we announced the closing of our acquisition of Thomson Video Networks (“TVN”), which is headquartered in Rennes, France. Acquisitions involve numerous risks, including the following:
• unanticipated costs or delays associated with an acquisition;
• difficulties in the assimilation and integration of acquired operations, technologies and/or products;
• potential disruption of our business and the diversion of management’s attention from the regular operations of the business during the acquisition process;
• the challenges of managing a larger and more geographically widespread operation and product portfolio after the closing of the acquisition;
• potential adverse effects on new and existing business relationships with suppliers, contract manufacturers, resellers, partners and customers;
• compliance with regulatory requirements, such as local employment regulations and organized labor in France;
• risks associated with entering markets in which we may have no or limited prior experience;
• the potential loss of key employees of acquired businesses and our own business as a result of integration;
• difficulties in bringing acquired products and businesses into compliance with applicable legal requirements in jurisdictions in which we operate and sell products;
• impact of known potential liabilities or unknown liabilities, including litigation and infringement claims, associated with companies we acquire;
20
• substantial charges for acquisition costs or for the amortization of certain purchased intangible assets, deferred stock compensation or similar items;
• substantial impairments to goodwill or intangible assets in the event that an acquisition proves to be less valuable than the price we paid for it;
• difficulties in establishing and maintaining uniform financial and other standards, controls, procedures and policies;
• delays in realizing, or failure to realize, the anticipated benefits of an acquisition; and
• the possibility that any acquisition may be viewed negatively by our customers or investors or the financial markets.
Competition within our industry for acquisitions of businesses, technologies, assets and product lines has been, and is likely to continue to be, intense. As such, even if we are able to identify an acquisition that we would like to consummate, we may not be able to complete the acquisition on commercially reasonable terms or because the target chooses to be acquired by another company. Furthermore, in the event that we are able to identify and consummate any future acquisitions, we may, in each of those acquisitions:
• issue equity securities which would dilute current stockholders’ percentage ownership;
• incur substantial debt to finance the acquisition or assume substantial debt in the acquisition;
• incur significant acquisition-related expenses;
• assume substantial liabilities, contingent or otherwise; or
• expend significant cash.
These financing activities or expenditures could materially and adversely affect our operating results, cash flows and financial condition or the price of our common stock. Alternatively, due to difficulties in the capital or credit markets at the time, we may be unable to secure capital necessary to complete an acquisition on reasonable terms, or at all. Moreover, even if we were to obtain benefits from acquisitions in the form of increased revenue and earnings per share, there may be a delay between the time the expenses associated with an acquisition are incurred and the time we recognize such benefits.
In addition to the risks outlined above, if we are unable to continue to achieve the objectives of our TVN acquisition, the anticipated benefits and potential synergies of the acquisition may not be realized fully or at all or may take longer to realize than expected. Any failure to timely realize these anticipated benefits would have a material adverse effect on our business, operating results and financial condition. Further, if we are unable to successfully receive payment of any significant portion of TVN’s existing French R&D tax credit receivables from the French tax authority as expected, or are unable to successfully apply for or otherwise obtain the financial benefit of new French R&D tax credits in future years, our ability to achieve the anticipated benefits of the acquisition as well as our business, operating results and financial condition could be adversely affected.
As of December 31, 2016, we had approximately $237 million of goodwill recorded on our balance sheet associated with prior acquisitions. In the event we determine that our goodwill is impaired, we would be required to write down all or a portion of such goodwill, which could result in a material non-cash charge to our results of operations in the period in which such write-down occurs.
If we are unable to successfully address one or more of these risks, our business, operating results, financial condition and cash flows could be materially and adversely affected.
We may not be able to effectively manage our operations.
We have grown significantly, principally through acquisitions, and expanded our international operations. For example, upon the closing of our acquisition of TVN on February 29, 2016, we added 438 employees, most of whom are based in France.
As of December 31, 2016, we had 869 employees in our international operations, representing approximately 63% of our worldwide workforce. Our ability to manage our business effectively in the future, including with respect to any future growth, our operation as both a hardware and increasingly software-centric business, the integration of any acquisition efforts such as
21
our recent acquisition of TVN, and the breadth of our international operations, will require us to train, motivate and manage our employees successfully, to attract and integrate new employees into our overall operations, to retain key employees and to continue to improve and evolve our operational, financial and management systems. There can be no assurance that we will be successful in any of these efforts, and our failure to effectively manage our operations could have a material and adverse effect on our business, operating results, cash flows and financial condition.
We face risks associated with having outsourced engineering resources located in Ukraine.
We outsource a portion of our research and development activities to a third-party partner with engineering resources located in Ukraine. Political, social and economic instability and unrest or violence in Ukraine, including the ongoing conflict with Russian-backed separatists or conflict with the Russian Federation directly, could cause disruptions to the business and operations of our outsourcing partner, which could slow or delay the development work our partner is undertaking for us. Instability, unrest or conflict could limit or prevent our employees from traveling to, from, or within Ukraine to direct and coordinate our outsourced engineering teams, or cause us to shift all or portions of the development work occurring in Ukraine to other locations or countries. The resulting delays could negatively impact our product development efforts, operating results and our business.
We face risks associated with having facilities and employees located in Israel.
As of December 31, 2016, we maintained facilities in Israel with a total of 185 employees, or approximately 13% of our worldwide workforce. Our employees in Israel engage in a number of activities, for both our Video and Cable Edge business segments, including research and development, product development, and supply chain management for certain product lines and sales activities.
As such, we are directly affected by the political, economic and military conditions affecting Israel. Any significant conflict involving Israel could have a direct effect on our business or that of our Israeli contract manufacturers, in the form of physical damage or injury, restrictions from traveling or reluctance to travel to from or within Israel by our Israeli and other employees or those of our subcontractors, or the loss of Israeli employees to active military duty. Most of our employees in Israel are currently obligated to perform annual reserve duty in the Israel Defense Forces, and approximately 10% of those employees were called for active military duty in 2016. In the event that more of our employees are called to active duty, certain of our research and development activities may be significantly delayed and adversely affected. Further, the interruption or curtailment of trade between Israel and its trading partners, as a result of terrorist attacks or hostilities, conflicts between Israel and any other Middle Eastern country or organization, or any other cause, could significantly harm our business. Additionally, current or future tensions or conflicts in the Middle East could materially and adversely affect our business, operating results, financial condition and cash flows.
Our operating results are likely to fluctuate significantly and, as a result, may fail to meet or exceed the expectations of securities analysts or investors, causing our stock price to decline.
Our operating results have fluctuated in the past and are likely to continue to fluctuate in the future, on an annual and a quarterly basis, as a result of several factors, many of which are outside of our control. Some of the factors that may cause these fluctuations include:
• the level and timing of capital spending of our customers in the U.S., Europe and in other markets;
• economic and financial conditions specific to each of the cable, satellite and telco, and broadcast and media industries, as well as general economic and financial market conditions, including any stemming from an unstable political environment in the United States or abroad as well as those resulting from regulatory or tax policy changes from the Trump administration;
• changes in market acceptance of and demand for our products or our customers’ services or products;
• the timing and amount of orders, especially from large individual transactions and transactions with our significant customers;
• the mix of our products sold and the effect it has on gross margins;
• the timing of revenue recognition, including revenue recognition on sales arrangements and from transactions with significant service and support components, which may span several quarters;
22
• the timing of completion of our customers’ projects;
• the length of each customer product upgrade cycle and the volume of purchases during the cycle;
• competitive market conditions, including pricing actions by our competitors;
• the level and mix of our domestic and international revenue;
• new product introductions by our competitors or by us;
• uncertainty in both the U.K. and the European Union due to the U.K.’s referendum to exit the European Union, which could adversely affect our results, financial condition and prospects;
• changes in domestic and international regulatory environments affecting our business;
• the evaluation of new services, new standards and system architectures by our customers;
• the cost and timely availability to us of components, subassemblies and modules;
• the mix of our customer base, by industry and size, and sales channels;
• changes in our operating and extraordinary expenses;
• the timing of acquisitions and dispositions by us and the financial impact of such transactions;
• impairment of our goodwill and intangibles;
• the impact of litigation, such as related litigation expenses and settlement costs;
• write-downs of inventory and investments;
• changes in our effective federal tax rate, including as a result of changes in our valuation allowance against our deferred tax assets, and changes in our effective state tax rates, including as a result of apportionment;
• changes to tax rules related to the deferral of foreign earnings and compliance with foreign tax rules;
• the impact of applicable accounting guidance on accounting for uncertainty in income taxes that requires us to establish reserves for uncertain tax positions and accrue potential tax penalties and interest; and
• the impact of applicable accounting guidance on business combinations that requires us to record charges for certain acquisition related costs and expenses and generally to expense restructuring costs associated with a business combination subsequent to the acquisition date.
The timing of deployment of our products by our customers can be subject to a number of other risks, including the availability of skilled engineering and technical personnel, the availability of third-party equipment and services, our customers’ ability to negotiate and enter into rights agreements with video content owners that provide the customers with the right to deliver certain video content, and our customers’ need for local franchise and licensing approvals.
We often recognize a substantial portion of our quarterly revenue in the last month of the quarter. We establish our expenditure levels for product development and other operating expenses based on projected revenue levels for a specified period, and expenses are relatively fixed in the short term. Accordingly, even small variations in the timing of revenue, particularly from relatively large individual transactions, can cause significant fluctuations in operating results in a particular quarter.
As a result of these factors and other factors, our operating results in one or more future periods may fail to meet or exceed the expectations of securities analysts or investors. In that event, the trading price of our common stock would likely decline.
23
Fluctuations in our future effective tax rates could affect our future operating results, financial condition and cash flows.
We are required to periodically review our deferred tax assets and determine whether, based on available evidence, a valuation allowance is necessary. The realization of our deferred tax assets, which are predominantly in the U.S., is dependent upon the generation of sufficient U.S. and foreign taxable income in the future to offset these assets. Based on our evaluation, a history of operating losses in recent years has led to uncertainty with respect to our ability to realize certain of our net deferred tax assets, and as a result we recorded a net increase in valuation allowance of $18.3 million and $3.1 million in 2016 and 2015, respectively, against U.S. net deferred tax assets. This increase in valuation allowance was offset partially by the release of $8.4 million of valuation allowance associated with TVN.
The calculation of tax liabilities involves dealing with uncertainties in the application of complex global tax regulations. We recognize potential liabilities for anticipated tax audit issues in the U.S. and other tax jurisdictions based on our estimate of whether, and the extent to which, additional taxes will be due. In the event we determine that it is appropriate to create a reserve or increase an existing reserve for any such potential liabilities, the amount of the additional reserve is charged as an expense in the period in which it is determined. If payment of these amounts ultimately proves to be unnecessary, the reversal of the liabilities would result in tax benefits being recognized in the period when we determine the liabilities are no longer necessary. If the estimate of tax liabilities proves to be less than the ultimate tax assessment for the applicable period, a further charge to expense in the period such short fall is determined would result. Either such charge to expense could have a material and adverse effect on our operating results for the applicable period.
We continue to be in the process of expanding our international operations and staffing to better support our expansion into international markets. This expansion involves the implementation of an international structure that includes, among other things, an international support center in Europe, research and development cost sharing arrangements, and certain licenses and other contractual arrangements between us and our wholly-owned domestic and foreign subsidiaries. As a result of these changes, we anticipate that our consolidated pre-tax income will be subject to foreign tax at relatively lower tax rates when compared to the U.S. federal statutory tax rate and, as a consequence, our effective income tax rate is expected to be lower than the U.S. federal statutory rate.
Our future effective income tax rates could be adversely affected if tax authorities challenge our international tax structure or if the relative mix of U.S. and international income changes for any reason. Accordingly, there can be no assurance that our income tax rate will be less than the U.S. federal statutory rate in future periods.
We or our customers may face intellectual property infringement claims from third parties.
Our industry is characterized by the existence of a large number of patents and frequent claims and related litigation regarding patent and other intellectual property rights. In particular, leading companies in the telecommunications industry have extensive patent portfolios. Also, patent infringement claims and litigation by entities that purchase or control patents, but do not produce goods or services covered by the claims of such patents (so-called “non-practicing entities” or “NPEs”), have increased rapidly over the last decade or so. From time to time, third parties, including NPEs, have asserted, and may assert in the future, patent, copyright, trademark and other intellectual property rights against us or our customers. Our suppliers and their customers, including us, may have similar claims asserted against them. A number of third parties, including companies with greater financial and other resources than us, have asserted patent rights to technologies that are important to us.
Any intellectual property litigation, regardless of its outcome, could result in substantial expense and significant diversion of the efforts of our management and technical personnel. An adverse determination in any such proceeding could subject us to significant liabilities and temporary or permanent injunctions and require us to seek licenses from third parties or pay royalties that may be substantial. Furthermore, necessary licenses may not be available on terms satisfactory to us, or at all. An unfavorable outcome on any such litigation matter could require that we pay substantial damages, could require that we pay ongoing royalty payments, or could prohibit us from selling certain of our products. Any such outcome could have a material and adverse effect on our business, operating results, financial condition and cash flows.
Our suppliers and customers may have intellectual property claims relating to our products asserted against them. We have agreed to indemnify some of our suppliers and most of our customers for patent infringement relating to our products. The scope of this indemnity varies, but, in some instances, includes indemnification for damages and expenses (including reasonable attorney’s fees) incurred by the supplier or customer in connection with such claims. If a supplier or a customer seeks to enforce a claim for indemnification against us, we could incur significant costs defending such claim, the underlying claim or both. An adverse determination in either such proceeding could subject us to significant liabilities and have a material and adverse effect on our operating results, cash flows and financial condition.
24
We may be the subject of litigation which, if adversely determined, could harm our business and operating results.
We may be subject to claims arising in the normal course of business. The costs of defending any litigation, whether in cash expenses or in management time, could harm our business and materially and adversely affect our operating results and cash flows. An unfavorable outcome on any litigation matter could require that we pay substantial damages, or, in connection with any intellectual property infringement claims, could require that we pay ongoing royalty payments or prohibit us from selling certain of our products. In addition, we may decide to settle any litigation, which could cause us to incur significant settlement costs. A settlement or an unfavorable outcome on any litigation matter could have a material and adverse effect on our business, operating results, financial condition and cash flows.
We may sell one or more of our product lines, from time to time, as a result of our evaluation of our products and markets, and any such divestiture could adversely affect our continuing business and our expenses, revenues, results of operation, cash flows and financial position.
We periodically evaluate our various product lines and may, as a result, consider the divestiture of one or more of those product lines. For example, in February 2013, we entered into an Asset Purchase Agreement with Aurora Networks pursuant to which we agreed to sell our cable access HFC Business for $46 million in cash. Any such divestiture could adversely affect our continuing business and expenses, revenues, results of operations, cash flows and financial position.
Divestitures of product lines have inherent risks, including the expense of selling the product line, the possibility that any anticipated sale will not occur, delays in closing any sale, the risk of lower-than-expected proceeds from the sale of the divested business, unexpected costs associated with the separation of the business to be sold from the seller’s information technology and other operating systems, and potential post-closing claims for indemnification or breach of transition services obligations of the seller. Expected cost savings, which are offset by revenue losses from divested businesses, may also be difficult to achieve or maximize due to the seller’s fixed cost structure, and a seller may experience varying success in reducing fixed costs or transferring liabilities previously associated with the divested business.
In order to manage our growth, we must be successful in addressing management succession issues and attracting and retaining qualified personnel.
Our future success will depend, to a significant extent, on the ability of our management to operate effectively, both individually and as a group. We must successfully manage transition and replacement issues that may result from the departure or retirement of members of our executive management. We cannot provide assurances that changes of management personnel in the future would not cause disruption to operations or customer relationships or a decline in our operating results.
We are also dependent on our ability to retain and motivate our existing highly qualified personnel, in addition to attracting new highly qualified personnel. Competition for qualified management, technical and other personnel is often intense, and we may not be successful in attracting and retaining such personnel. Competitors and others have in the past attempted, and are likely in the future to attempt, to recruit our employees. While our employees are required to sign standard agreements concerning confidentiality and ownership of inventions, we generally do not have employment contracts or non-competition agreements with any of our personnel. The loss of the services of any of our key personnel, the inability to attract or retain highly qualified personnel in the future or delays in hiring such personnel, particularly senior management and engineers and other technical personnel, could negatively affect our business and operating results. Furthermore, a certain portion of our personnel is comprised of foreign nationals whose ability to work for us depends on obtaining the necessary visas. Our ability to hire and retain foreign nationals, and their ability to remain and work in the United States, is affected by various laws and regulations, including limitations on the availability of visas. Changes in the laws or regulations affecting the availability of visas may adversely affect our ability to hire or retain key personnel and as a result may impair our operations.
We could be negatively affected as a result of a future proxy contest and the actions of activist stockholders.
If a proxy contest with respect to election of our directors is initiated in the future, or if other activist stockholder activities occur, our business could be adversely affected because:
• responding to a proxy contest and other actions by activist stockholders can be costly and time-consuming, disrupting our operations and diverting the attention of management and our employees;
• perceived uncertainties as to our future direction caused by activist activities may result in the loss of potential business opportunities, and may make it more difficult to attract and retain qualified personnel and business partners; and
25
• if individuals are elected to our Board of Directors (the “Board”) with a specific agenda, it may adversely affect our ability to effectively and timely implement our strategic plans.
Our failure to adequately protect our proprietary rights and data may adversely affect us.
At December 31, 2016, we held 71 issued U.S. patents and 44 issued foreign patents, and had 78 patent applications pending. Although we attempt to protect our intellectual property rights through patents, trademarks, copyrights, licensing arrangements, maintaining certain technology as trade secrets and other measures, we can give no assurances that any patent, trademark, copyright or other intellectual property rights owned by us will not be invalidated, circumvented or challenged, that such intellectual property rights will provide competitive advantages to us, or that any of our pending or future patent applications will be issued with the scope of the claims sought by us, if at all. We can give no assurances that others will not develop technologies that are similar or superior to our technologies, duplicate our technologies or design around the patents that we own. In addition, effective patent, copyright and trade secret protection may be unavailable or limited in certain foreign countries in which we do business or may do business in the future.
We generally enter into confidentiality or license agreements with our employees, consultants, and vendors and our customers, as needed, and generally limit access to, and distribution of, our proprietary information. Nevertheless, we cannot provide assurances that the steps taken by us will prevent misappropriation of our technology. In addition, we have taken in the past, and may take in the future, legal action to enforce our patents and other intellectual property rights, to protect our trade secrets, to determine the validity and scope of the proprietary rights of others, or to defend against claims of infringement or invalidity. Such litigation could result in substantial costs and diversion of management time and other resources, and could materially and adversely affect our business, operating results, financial condition and cash flows.
Recently reported hacking attacks on government and commercial computer systems, particularly attacks sponsored by foreign governments or enterprises, raise the risks that such an attack may compromise, in a material respect, one or more of our computer systems and permit hackers access to our proprietary information and data. If such an attack does, in fact, allow access to or theft of our proprietary information or data, our business, operating results, financial condition and cash flows could be materially and adversely affected.
Our products include third-party technology and intellectual property, and our inability to acquire new technologies or use third-party technology in the future could harm our business.
In order to successfully develop and market certain of our planned products, we may be required to enter into technology development or licensing agreements with third parties. Although companies with technology useful to us are often willing to enter into technology development or licensing agreements with respect to such technology, we cannot provide assurances that such agreements may be negotiated on commercially reasonable terms, or at all. The failure to enter, or a delay in entering, into such technology development or licensing agreements, when necessary or desirable, could limit our ability to develop and market new products and could materially and adversely affect our business.
We incorporate certain third-party technologies, including software programs, into our products, and, as noted, intend to utilize additional third-party technologies in the future. In addition, the technologies that we license may not operate properly or as specified, and we may not be able to secure alternatives in a timely manner, either of which could harm our business. We could face delays in product releases until alternative technology can be identified, licensed or developed, and integrated into our products, if we are able to do so at all. These delays, or a failure to secure or develop adequate technology, could materially and adversely affect our business, operating results, financial condition and cash flows.
Our use of open source software in some of our products may expose us to certain risks.
Some of our products contain software modules licensed for use from third-party authors under open source licenses. Use and distribution of open source software may entail greater risks than use of third-party commercial software, as open source licensors generally do not provide warranties or other contractual protections regarding infringement claims or the quality of the code. Some open source licenses contain requirements that we make available source code for modifications or derivative works we create based upon the type of open source software we use. If we combine our proprietary software with open source software in a certain manner, we could, under certain of the open source licenses, be required to release the source code of our proprietary software to the public. This could allow our competitors to create similar products with lower development effort and in less time and ultimately could result in a loss of product sales for us.
26
Although we monitor our use of open source closely, it is possible our past, present or future use of open source has triggered or may trigger the foregoing requirements. Furthermore, the terms of many open source licenses have not been interpreted by U.S. courts, and there is a risk that such licenses could be construed in a manner that could impose unanticipated conditions or restrictions on our ability to commercialize our products. In such event, we could be required to seek licenses from third parties in order to continue offering our products, to re-engineer our products or to discontinue the sale of our products in the event re-engineering cannot be accomplished on a timely basis, any of which could materially and adversely affect our operating results, financial condition and cash flows.
We are subject to import and export control and trade and economic sanction laws and regulations that could subject us to liability or impair our ability to compete in international markets.
Our products are subject to U.S. export control laws, and may be exported outside the U.S. only with the required export license or through an export license exception, in most cases because we incorporate encryption technology into certain of our products. We are also subject to U.S. trade and economic sanction regulations which include prohibitions on the sale or supply of certain products and services to U.S. embargoed or sanctioned countries, governments, persons and entities. In addition, various countries regulate the import of certain technology and have enacted laws that could limit our ability to distribute our products, or could limit our customers’ ability to implement our products, in those countries. Although we take precautions and have processes in place to prevent our products and services from being provided in violation of such laws, our products may have been in the past, and could in the future be, provided inadvertently in violation of such laws, despite the precautions we take. If we fail to comply with these laws, we and certain of our employees could be subject to civil or criminal penalties, including the possible loss of export privileges, monetary penalties, and, in extreme cases, imprisonment of responsible employees for knowing and willful violations of these laws. Additionally, our business and operating results be adversely affected through penalties, reputational harm, loss of access to certain markets, or otherwise.
In addition, we may be subject to customs duties that could have a significant adverse impact on our operating results or, if we are able to pass on the related costs in any particular situation, would increase the cost of the related product to our customers. As a result, the future imposition of significant increases in the level of customs duties or the creation of import quotas on our products in Europe or in other jurisdictions, or any of the limitations on international sales described above, could have a material adverse effect on our business, operating results, financial condition and cash flows. Further, some of our customers in Europe have been, or are being, audited by local governmental authorities regarding the tariff classifications used for importation of our products. Import duties and tariffs vary by country and a different tariff classification for any of our products may result in higher duties or tariffs, which could have an adverse impact on our operating results and potentially increase the cost of the related products to our customers.
We may need additional capital in the future and may not be able to secure adequate funds at all or on terms acceptable to us.
We have been engaged in the design, manufacture and sale of a variety of video products and system solutions since inception, which has required, and will continue to require, significant research and development expenditures.
We believe that our existing cash and short-term investments of approximately $63 million at December 31, 2016 will satisfy our cash requirements for at least the next 12 months. However, we may need to raise additional funds to take advantage of presently unanticipated strategic opportunities, satisfy our other cash requirements from time to time, or strengthen our financial position. Our ability to raise funds may be adversely affected by a number of factors, including factors beyond our control, such as weakness in the economic conditions in markets in which we sell our products and continued uncertainty in financial, capital and credit markets. There can be no assurance that equity or debt financing will be available to us on reasonable terms, if at all, when and if it is needed.
We may raise additional financing through public or private equity offerings, debt financings, or corporate partnership or licensing arrangements. To the extent we raise additional capital by issuing equity securities or convertible debt, our stockholders may experience dilution. To the extent that we raise additional funds through collaboration and licensing arrangements, it may be necessary to relinquish some rights to our technologies or products, or grant licenses on terms that are not favorable to us. To the extent we raise capital through debt financing arrangements, we may be required to pledge assets or enter into covenants that could restrict our operations or our ability to incur further indebtedness and the interest on such debt may adversely affect our operating results.
If adequate capital is not available, or is not available on reasonable terms, when needed, we may not be able to take advantage of acquisition or other market opportunities, to timely develop new products, or to otherwise respond to competitive pressures.
27
Our operating results could be adversely affected by natural disasters affecting us or impacting our third-party manufacturers, suppliers, resellers or customers.
Our corporate headquarters is located in California, which is prone to earthquakes. We have employees, consultants and contractors located in regions and countries around the world. In the event that any of our business, sales or research and development centers or offices in the U.S. or internationally are adversely affected by an earthquake or by any other natural disaster, we may sustain damage to our operations and properties, which could cause a sustained interruption or loss of affected operations, and cause us to suffer significant financial losses.
We rely on third-party contract manufacturers for the production of our products. Any significant disruption in the business or operations of such manufacturers or of their or our suppliers could adversely impact our business. Our principal contract manufacturers and several of their and our suppliers and our resellers have operations in locations that are subject to natural disasters, such as severe weather, tsunamis, floods and earthquakes, which could disrupt their operations and, in turn, our operations.
In addition, if there is a natural disaster in any of the locations in which our significant customers are located, we face the risk that our customers may incur losses or sustained business interruption, or both, which may materially impair their ability to continue their purchase of products from us. Accordingly, natural disaster in one of the geographies in which we, or our third-party manufacturers, their or our suppliers or our customers, operate could have a material and adverse effect on our business, operating results, cash flows and financial condition.
Our business and industry are subject to various laws and regulations that could adversely affect our business, operating results, cash flows and financial condition.
Our business and industry are regulated under various federal, state, local and international laws. For example, we are subject to environmental regulations such as the European Union’s Waste Electrical and Electronic Equipment (WEEE) and Restriction on the Use of Certain Hazardous Substances in Electrical and Electronic Equipment (RoHS) directives and similar legislation enacted in other jurisdictions worldwide. Our failure to comply with these laws could result in our being directly or indirectly liable for costs, fines or penalties and third-party claims, and could jeopardize our ability to conduct business in such regions and countries. We expect that our operations will be affected by other new environmental laws and regulations on an ongoing basis. Although we cannot predict the ultimate impact of any such new laws and regulations, they would likely result in additional costs, and could require that we redesign or change how we manufacture our products, any of which could have a material and adverse effect on our operating results, financial condition and cash flows.
We are subject to the Sarbanes-Oxley Act of 2002 which, among other things, requires an annual review and evaluation of our internal control over financial reporting. If we conclude in future periods that our internal control over financial reporting is not effective or if our independent registered public accounting firm is unable to provide an unqualified attestation as of future year-ends, we may incur substantial additional costs in an effort to correct such problems, and investors may lose confidence in our financial statements, and our stock price may decrease in the short term, until we correct such problems, and perhaps in the long term, as well.
We are subject to requirements under the Dodd-Frank Wall Street Reform and Consumer Protection Act of 2010 that require us to conduct research, disclose, and report whether or not our products contain certain conflict minerals sourced from the Democratic Republic of Congo or its surrounding countries. The implementation of these requirements could adversely affect the sourcing, availability, and pricing of the materials used in the manufacture of components used in our products. In addition, we may incur certain additional costs to comply with the disclosure requirements, including costs related to conducting diligence procedures to determine the sources of conflict minerals that may be used or necessary to the production of our products and, if applicable, potential changes to products, processes or sources of supply as a consequence of such verification activities. It is also possible that we may face reputational harm if we determine that certain of our products contain minerals not determined to be conflict-free and/or we are unable to alter our products, processes or sources of supply to avoid such materials.
Changes in telecommunications legislation and regulations in the U.S. and other countries could affect our sales and the revenue we are able to derive from our products. In particular, “net neutrality” rules issued by the U.S. Federal Communications Commission (FCC) or regulations dealing with access by competitors to the networks of incumbent operators could slow or stop infrastructure and services investments or expansion by service providers. Increased regulation of our customers’ pricing or service offerings could limit their investments and, consequently, revenue from our products. The impact
28
of new or revised legislation or regulations could have a material adverse effect on our business, operating results, financial condition and cash flows.
Some anti-takeover provisions contained in our certificate of incorporation and bylaws, as well as provisions of Delaware law, could impair a takeover attempt.
We have provisions in our certificate of incorporation and bylaws that could have the effect of rendering more difficult or discouraging an acquisition deemed undesirable by our Board. These include provisions:
• authorizing blank check preferred stock, which could be issued with voting, liquidation, dividend and other rights superior to our common stock;
• limiting the liability of, and providing indemnification to, our directors and officers;
• limiting the ability of our stockholders to call, and bring business before, special meetings;
• requiring advance notice of stockholder proposals for business to be conducted at meetings of our stockholders and for nominations of candidates for election to our Board;
• controlling the procedures for conducting and scheduling of Board and stockholder meetings; and
• providing the Board with the express power to postpone previously scheduled annual meetings and to cancel previously scheduled special meetings.
These provisions could delay hostile takeovers, changes in control of the Company or changes in our management. As a Delaware corporation, we are also subject to provisions of Delaware law, including Section 203 of the Delaware General Corporation law, which prevents some stockholders holding more than 15% of our outstanding common stock from engaging in certain business combinations without approval of the holders of substantially all of our outstanding common stock. Any provision of our certificate of incorporation or bylaws or Delaware law that has the effect of delaying or deterring a change in control could limit the opportunity for our stockholders to receive a premium for their shares of our common stock, and could also affect the price that some investors are willing to pay for our common stock.
The nature of our business requires the application of complex revenue and expense recognition rules and the current legislative and regulatory environment affecting generally accepted accounting principles is uncertain. Significant changes in current principles could affect our financial statements going forward and changes in financial accounting standards or practices may cause adverse, unexpected financial reporting fluctuations and harm our operating results.
The accounting rules and regulations that we must comply with are complex and subject to interpretation by the Financial Accounting Standards Board (the “FASB”), the SEC and various bodies formed to promulgate and interpret appropriate accounting principles. Recent actions and public comments from the FASB and the SEC have focused on the integrity of financial reporting and internal controls. In addition, many companies’ accounting policies are being subject to heightened scrutiny by regulators and the public. Further, the accounting rules and regulations are continually changing in ways that could materially impact our financial statements. For example, in May 2014, the FASB issued Accounting Standards Update (“ASU”) No. 2014-09, Revenue from Contracts with Customers (“Topic 606”), as amended, which will supersede nearly all existing revenue recognition guidance. Although the new standard permits early adoption as early as the first quarter of 2017, the effective date of the new revenue standard is our first quarter of 2018. We do not plan to early adopt, and accordingly, we will adopt the new standard effective January 1, 2018. The new standard permits adoption either by using (i) a full retrospective approach for all periods presented in the period of adoption or (ii) a modified retrospective approach with the cumulative effect of initially applying the new standard recognized at the date of initial application and providing certain additional disclosures. We currently plan to adopt using the modified retrospective approach; however, a final decision regarding the adoption method has not been finalized at this time. Our final determination will depend on a number of factors such as the significance of the impact of the new standard on our financial results, system readiness, including that of software procured from third-party providers, and our ability to accumulate and analyze the information necessary to assess the impact on prior period financial statements, as necessary. While we continue to assess the potential impacts, under the new standards there is the potential for significant impacts to the accounting for software licenses with undelivered features and professional services revenue with acceptances, and contract acquisition costs, both with respect to the amounts that will be capitalized as well as the period of amortization. We cannot predict the impact of future changes to accounting principles or our accounting policies on our financial statements going forward, which could have a significant effect on our reported financial results, and could affect the reporting of transactions completed before the announcement of the change. In addition, if we were to change our critical
29
accounting estimates, including those related to the recognition of license revenue and other revenue sources, our operating results could be significantly affected.
The conditional conversion feature of our convertible senior notes, if triggered, may adversely affect our financial condition and operating results.
In December 2015, we issued $128.25 million aggregate principal amount of 4.00% convertible senior notes due 2020 (the “Notes”) through a private placement with a financial institution. The Notes bear interest at 4.00% per annum, which is payable semiannually in arrears on June 1 and December 1 of each year, commencing June 1, 2016. In the event the conditional conversion feature of the Notes is triggered, holders of the Notes will be entitled to convert the Notes at any time during specified periods at their option. If one or more holders elect to convert their Notes, unless we elect to satisfy our conversion obligation by delivering solely shares of our common stock (other than paying cash in lieu of delivering any fractional share), we would be required to settle a portion or all of our conversion obligation through the payment of cash, which could adversely affect our liquidity. In addition, even if holders do not elect to convert their Notes, we could be required under applicable accounting rules to reclassify all or a portion of the outstanding principal of the Notes as a current rather than long-term liability, which would result in a material reduction of our net working capital.
The accounting method for convertible debt securities that may be settled in cash, such as the Notes, could have a material effect on our reported financial results.
In May 2008, FASB issued FASB Staff Position No. APB 14-1, “Accounting for Convertible Debt Instruments That May Be Settled in Cash Upon Conversion (Including Partial Cash Settlement)”, which has subsequently been codified as Accounting Standards Codification 470-20, Debt with Conversion and Other Options, which we refer to as ASC 470-20. Under ASC 470-20, an entity must separately account for the liability and equity components of the convertible debt instruments (such as the Notes) that may be settled entirely or partially in cash upon conversion in a manner that reflects the issuer’s economic interest cost. The effect of ASC 470-20 on the accounting for the Notes is that the equity component is required to be included in the additional paid-in capital section of stockholders’ equity on our consolidated balance sheet, and the value of the equity component would be treated as debt discount for purposes of accounting for the debt component of the Notes. As a result, we will be required to record a greater amount of non-cash interest expense in current and future periods presented as a result of the amortization of the discounted carrying value of the Notes to their face amount over the term of the Notes. We will report lower net income in our financial results because ASC 470-20 will require interest to include both the current period’s amortization of the debt discount and the instrument’s non-convertible interest rate, which could adversely affect our reported or future financial results, the trading price of our common stock and the trading price of the Notes.
In addition, under certain circumstances, convertible debt instruments (such as the Notes) that may be settled entirely or partly in cash are currently accounted for utilizing the treasury stock method, the effect of which is that the shares issuable upon conversion of the Notes are not included in the calculation of diluted earnings per share except to the extent that the conversion value of the Notes exceeds their principal amount. Under the treasury stock method, for diluted earnings per share purposes, the transaction is accounted for as if the number of shares of common stock that would be necessary to settle such excess, if we elected to settle such excess in shares, are issued. We cannot be sure that the accounting standards in the future will continue to permit the use of the treasury stock method or that circumstances would not change such that we would no longer be permitted to use the treasury stock method. If we are unable to use the treasury stock method in accounting for the shares issuable upon conversion of the Notes, then our diluted earnings per share would be adversely affected.
Our common stock price, and therefore the price of our Notes, may be extremely volatile, and the value of an investment in our stock may decline.
Our common stock price has been highly volatile. We expect that this volatility will continue in the future due to factors such as:
• general market and economic conditions;
• actual or anticipated variations in operating results;
• increases or decreases in the general stock market or to the stock prices of technology companies;
• announcements of technological innovations, new products or new services by us or by our competitors or customers;
30
• changes in financial estimates or recommendations by stock market analysts regarding us or our competitors;
• announcements by us or our competitors of significant acquisitions, dispositions, strategic partnerships, joint ventures or capital commitments;
• announcements by our customers regarding end user market conditions and the status of existing and future infrastructure network deployments;
• additions or departures of key personnel; and
• future equity or debt offerings or our announcements of these offerings.
In addition, in recent years, the stock market in general, and The NASDAQ Stock Market and the securities of technology companies in particular, have experienced extreme price and volume fluctuations. These fluctuations have often been unrelated or disproportionate to the operating performance of individual companies. These broad market fluctuations have in the past, and may in the future, materially and adversely affect our stock price, regardless of our operating results. In these circumstances, investors may be unable to sell their shares of our common stock at or above their purchase price over the short term, or at all.
Our stock price may decline if additional shares are sold in the market or if analysts drop coverage of or downgrade our stock.
Future sales of substantial amounts of shares of our common stock by our existing stockholders in the public market, or the perception that these sales could occur, may cause the market price of our common stock to decline. In addition, we issue additional shares upon exercise of stock options, including under our ESPP, and in connection with grants of restricted stock units (“RSUs”) on an ongoing basis. To the extent we do not elect to pay solely cash upon conversion of our Notes, we will also be required to issue additional shares of common stock upon conversion. Increased sales of our common stock in the market after exercise of outstanding stock options or grants of restricted stock units could exert downward pressure on our stock price. These sales also might make it more difficult for us to sell equity or equity-related securities in the future at a time and price we deem appropriate.
The trading market for our common stock relies in part on the availability of research and reports that third-party industry or securities analysts publish about us. If one or more of the analysts who do cover us downgrade our stock, our stock price may decline. If one or more of these analysts cease coverage of us, we could lose visibility in the market, which in turn could cause the liquidity of our stock and our stock price to decline.
Available Information
Harmonic makes available free of charge, on the Harmonic web site, the Company’s Annual Report on Form 10-K, Quarterly Reports on Form 10-Q, Current Reports on Form 8-K (via link to the SEC website), and amendments to those reports filed or furnished pursuant to Section 13(a) or 15(d) of the Exchange Act as soon as reasonably practicable after Harmonic files such material with, or furnishes such material to, the Securities and Exchange Commission. The address of the Harmonic web site is http://www.harmonicinc.com. Except as expressly set forth in this Form 10-K, the contents of our web site are not incorporated into, or otherwise to be regarded as part of, this report.
Item 1B. | UNRESOLVED STAFF COMMENTS |
None
Item 2. | PROPERTIES |
All of our facilities are leased, including our principal operations and corporate headquarters in San Jose, California. We have research and development centers in the United States, France, Israel and Hong Kong. We have sales and service offices primarily in the U.S. and various locations in Europe and Asia. Our leases, which expire at various dates through April 2027, are for an aggregate of approximately 416,000 square feet of space, of which the San Jose lease, expiring August 2020, is for
31
approximately 160,000 square feet of space. This excludes 28,000 square feet of space that is vacant and available for sublease since the beginning of 2016. We have two business segments: Video and Cable Edge. Because of the interrelation of these segments, a majority of these segments use substantially all of the properties, at least in part, and we retain the flexibility to use each of the properties in whole or in part for each of the segments. We believe that the facilities that we currently occupy are adequate for our current needs and that suitable additional space will be available, as needed, to accommodate the presently foreseeable expansion of our operations.
Item 3. | LEGAL PROCEEDINGS |
From time to time, we are involved in lawsuits as well as subject to various legal proceedings, claims, threats of litigation, and investigations in the ordinary course of business, including claims of alleged infringement of third-party patents and other intellectual property rights, commercial, employment, and other matters. While certain matters to which we are a party may specify the damages claimed, such claims may not represent reasonably possible losses. Given the inherent uncertainties of litigation, the ultimate outcome of these matters cannot be predicted at this time, nor can the amount of possible loss or range of loss, if any, be reasonably estimated.
In October 2011, Avid filed a complaint in the United States District Court for the District of Delaware alleging that Harmonic’s Media Grid product infringes two patents held by Avid. A jury trial on this complaint commenced on January 23, 2014 and, on February 4, 2014, the jury returned a unanimous verdict in favor of us, rejecting Avid’s infringement allegations in their entirety. On May 23, 2014, Avid filed a post-trial motion asking the court to set aside the jury’s verdict, and the judge issued an order on December 17, 2014, denying the motion. On January 5, 2015, Avid filed an appeal with respect to the jury’s verdict with the Federal Circuit, which was docketed on January 9, 2015, as Case No. 2015-1246. Avid filed its opening brief with respect to this appeal on March 24, 2015, we filed our response brief on May 7, 2015, and Avid filed its reply brief on June 16, 2015. Oral arguments were held on December 11, 2015. On January 29, 2016, the Federal Circuit issued an order vacating the verdict of noninfringement and remanding the case to the trial court for a new trial on infringement. On February 26, 2016, Harmonic filed a request for rehearing and rehearing en banc at the Federal Circuit. On March 31, 2016, the Federal Circuit denied the request for rehearing and rehearing en banc and a mandate issued on April 8, 2016. The court conducted a supplemental claim construction hearing on May 27, 2016 and issued a claim construction order on June 29, 2016. On June 17, 2016, Harmonic filed requests for ex parte reexaminations for the ’808 and ’309 patents with the United States Patent and Trademark Office (“USPTO”). The USPTO ordered reexamination of both the ’309 and ’808 patents in August 2016. The USPTO issued a Non-Final Office Action on November 25, 2016 for the ’309 patent, including rejecting all challenged claims. The USPTO issued a Non-Final Office Action for the ’808 patent on December 15, 2016, rejecting all challenged claims. The Patent Owner filed its response in both reexaminations on February 15, 2017. A status conference was held with the District Court on February 23, 2017.
In June 2012, Avid served a subsequent complaint in the United States District Court for the District of Delaware alleging that our Spectrum product infringes one patent held by Avid. The complaint seeks injunctive relief and unspecified damages. In September 2013, the U.S. Patent Trial and Appeal Board (“PTAB”) authorized an inter partes review to be instituted as to claims 1-16 of the patent asserted in this second complaint. A hearing before the PTAB was conducted on May 20, 2014. On July 10, 2014, the PTAB issued a decision finding claims 1-10 invalid and claims 11-16 not invalid. We filed an appeal with respect to the PTAB’s decision on claims 11-16 on September 11, 2014. The appeal was docketed with the Federal Circuit on October 22, 2014, as Case No. 2015-1072, and we filed our opening brief with respect to this appeal on January 29, 2015. Avid and PTAB each filed a response brief on April 27, 2015, and we filed a reply brief on May 28, 2015. Oral arguments were held on October 8, 2015. The Federal Circuit issued an order on March 1, 2016, affirming the PTAB’s decision and a mandate issued on April 7, 2016. On July 25, 2016, the court issued a scheduling order for the case and set the trial date for November 6, 2017.
An unfavorable outcome on any litigation matters could require us to pay substantial damages, or, in connection with any intellectual property infringement claims, could require us to pay ongoing royalty payments or could prevent us from selling certain of our products. As a result, a settlement of, or an unfavorable outcome on, any of the matters referenced above or other litigation matters could have a material adverse effect on our business, operating results, financial position and cash flows.
Our industry is characterized by the existence of a large number of patents and frequent claims and related litigation regarding patent and other intellectual property rights. From time to time, third parties have asserted, and may in the future assert, exclusive patent, copyright, trademark and other intellectual property rights against us or our customers. Such assertions arise in the normal course of our operations. The resolution of any such assertions and claims cannot be predicted with certainty.
32
Item 4. | MINE SAFETY DISCLOSURE |
Not applicable.
33
PART II
Item 5. | MARKET FOR REGISTRANT’S COMMON EQUITY, RELATED STOCKHOLDER MATTERS AND ISSUER PURCHASES OF EQUITY SECURITIES |
Market Information of our Common Stock
Our common stock is traded on The NASDAQ Global Select Market under the symbol HLIT, and has been listed on NASDAQ since our initial public offering on May 22, 1995. The following table sets forth, for the periods indicated, the high and low sales price per share of our common stock as reported on The NASDAQ Global Select Market:
2016 | 2015 | ||||||||||||||
Sales Price | Sales Price | ||||||||||||||
Quarter ended | High | Low | High | Low | |||||||||||
First quarter | $ | 4.04 | $ | 2.85 | $ | 7.98 | $ | 6.53 | |||||||
Second quarter | 3.64 | 2.51 | 7.64 | 6.55 | |||||||||||
Third quarter | 5.99 | 2.72 | 7.09 | 5.40 | |||||||||||
Fourth quarter | 6.13 | 3.80 | 6.31 | 4.07 | |||||||||||
Holders
As of February 28, 2017, there were approximately 374 holders of record of our common stock.
Dividend Policy
We have never declared or paid any dividends on our capital stock. At this time, we expect to retain future earnings, if any, for use in the operation and expansion of our business and do not anticipate paying any cash dividends in the foreseeable future.
Repurchases of Equity Securities by the Issuer
There were no stock repurchases during the year ended December 31, 2016. Our stock repurchase program expired on December 31, 2016. Further stock repurchases would require authorization from the Board.
Sales of Unregistered Securities
On September 26, 2016, we granted a warrant to purchase shares of our common stock to Comcast (the “Warrant”), pursuant to which Comcast may purchase up to 7,816,162 shares of our common stock, par value $0.001 per share, subject to adjustment in accordance with the terms of the Warrant, for a per share exercise price of $4.76, which was the weighted-average trading price of our common stock for the 10 trading days prior to the issue date.
Comcast’s right to exercise the Warrant is subject to certain vesting triggers relating to the execution of the Warrant, certain pricing elections by Comcast, the successful completion of field trials of certain of our products, and certain payments by Comcast for our products and services. The offer and sale of such securities was made only to an “accredited investor” (as defined by Rule 501 under the Securities Act) in reliance upon exemptions from registration under the Securities Act afforded by Section 4(a)(2) of the Securities Act and corresponding provisions of state securities laws. Reliance on Section 4(2) is based on the nature of the offering and sale and the representations made by Comcast in the Warrant with respect to its investment experience and intent. (See Note 17, “Warrants,” of the notes to our Consolidated Financial Statements for additional information).
Stock Performance Graph
34
Set forth below is a line graph comparing the annual percentage change in the cumulative return to the stockholders of our common stock with the cumulative return of The NASDAQ Telecommunications Index and of the Standard & Poor’s (S&P) 500 Index for the period commencing December 31, 2011 and ending on December 31, 2016. The graph assumes that $100 was invested in each of the Company’s common stock, the S&P 500 and The NASDAQ Telecommunications Index on December 31, 2011, and assumes the reinvestment of dividends, if any. The comparisons shown in the graph below are based upon historical data. Harmonic cautions that the stock price performance shown in the graph below is not indicative of, nor intended to forecast, the potential future performance of the Company’s common stock.
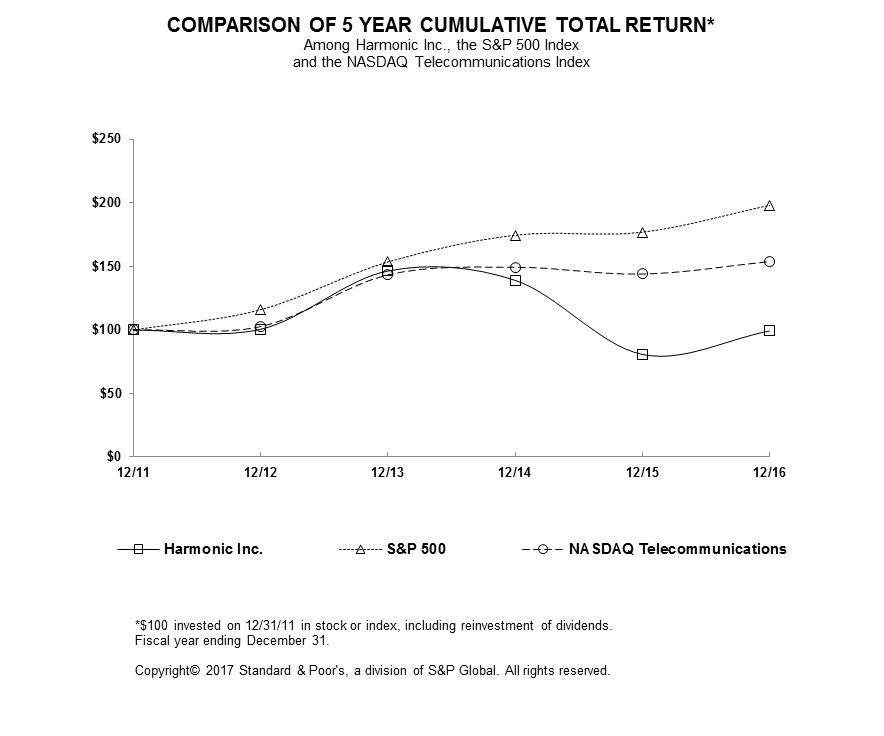
12/11 | 12/12 | 12/13 | 12/14 | 12/15 | 12/16 | |||||||||||||
Harmonic Inc. | 100.00 | 100.60 | 146.43 | 139.09 | 80.75 | 99.21 | ||||||||||||
S&P 500 | 100.00 | 116.00 | 153.58 | 174.60 | 177.01 | 198.18 | ||||||||||||
NASDAQ Telecom | 100.00 | 102.78 | 143.40 | 149.42 | 144.02 | 153.88 | ||||||||||||
The information contained in this Stock Performance Graph section shall not be deemed to be “soliciting material”, “filed” or incorporated by reference in previous or future filings with the SEC, or subject to the liabilities of Section 18 of the Exchange Act, except to the extent that Harmonic specifically incorporates it by reference into a document filed under the Securities Act or the Exchange Act.
35
Item 6. | SELECTED FINANCIAL DATA |
The selected financial data set forth below as of December 31, 2016 and 2015, and for the fiscal years ended December 31, 2016, 2015 and 2014, are derived from our Consolidated Financial Statements included elsewhere in this Annual Report on Form 10-K. The selected financial data as of December 31, 2014, 2013 and 2012, and for the fiscal years ended December 31, 2013 and 2012 are derived from audited financial statements not included in this Annual Report on Form 10-K. This financial data should be read in conjunction with Item 7, Management’s Discussion and Analysis of Financial Condition and Results of Operations, and the Consolidated Financial Statements and related notes included elsewhere in this Annual Report on Form 10-K. These historical results are not necessarily indicative of the results to be expected in the future.
On March 5, 2013, we completed the sale of our cable access HFC business to Aurora Networks. As such, the results of operations associated with cable access HFC business are presented as discontinued operations in our Consolidated Statements of Operations for all periods presented.
On February 29, 2016, we completed our acquisition of TVN and applied the acquisition method of accounting for the business combination. The selected consolidated balance sheet data as of December 31, 2016 represents the consolidated statement of financial position of the combined company. The selected consolidated statement of operations data for the year ended December 31, 2016 of the combined entity includes 10 months of operating results of TVN, beginning March 1, 2016.
36
Year ended December 31, | |||||||||||||||||||
2016 (1) (2) | 2015 | 2014 | 2013 | 2012 | |||||||||||||||
(In thousands, except per share amounts) | |||||||||||||||||||
Consolidated Statements of Operations Data | |||||||||||||||||||
Net revenue | $ | 405,911 | $ | 377,027 | $ | 433,557 | $ | 461,940 | $ | 476,871 | |||||||||
Cost of revenue | 205,161 | 174,315 | 221,209 | 241,495 | 256,339 | ||||||||||||||
Gross profit (3) | 200,750 | 202,712 | 212,348 | 220,445 | 220,532 | ||||||||||||||
Operating expenses: | |||||||||||||||||||
Research and development | 98,401 | 87,545 | 93,061 | 99,938 | 102,627 | ||||||||||||||
Selling, general and administrative | 144,381 | 120,960 | 131,322 | 134,014 | 127,117 | ||||||||||||||
Amortization of intangibles | 10,402 | 5,783 | 6,775 | 8,096 | 8,705 | ||||||||||||||
Restructuring and related charges | 14,602 | 1,372 | 2,761 | 1,421 | — | ||||||||||||||
Total operating expenses | 267,786 | 215,660 | 233,919 | 243,469 | 238,449 | ||||||||||||||
Loss from operations | (67,036 | ) | (12,948 | ) | (21,571 | ) | (23,024 | ) | (17,917 | ) | |||||||||
Interest income (expense), net (8) | (10,628 | ) | (333 | ) | 132 | 219 | 515 | ||||||||||||
Other expense, net | (31 | ) | (282 | ) | (356 | ) | (347 | ) | (293 | ) | |||||||||
Loss on impairment of long-term investment (4) | (2,735 | ) | (2,505 | ) | — | — | — | ||||||||||||
Loss from continuing operations before income taxes | (80,430 | ) | (16,068 | ) | (21,795 | ) | (23,152 | ) | (17,695 | ) | |||||||||
Provision for (benefit from) income taxes (5)(6) | (8,116 | ) | (407 | ) | 24,453 | (44,741 | ) | (1,506 | ) | ||||||||||
Income (loss) from continuing operations (7) | $ | (72,314 | ) | $ | (15,661 | ) | $ | (46,248 | ) | $ | 21,589 | $ | (16,189 | ) | |||||
Net income (loss) per share from continuing operations: | |||||||||||||||||||
Basic | $ | (0.93 | ) | $ | (0.18 | ) | $ | (0.50 | ) | $ | 0.20 | $ | (0.14 | ) | |||||
Diluted | $ | (0.93 | ) | $ | (0.18 | ) | $ | (0.50 | ) | $ | 0.20 | $ | (0.14 | ) | |||||
Shares used in per share calculation: | |||||||||||||||||||
Basic | 77,705 | 87,514 | 92,508 | 106,529 | 116,457 | ||||||||||||||
Diluted | 77,705 | 87,514 | 92,508 | 107,808 | 116,457 | ||||||||||||||
As of December 31, | |||||||||||||||||||
2016 | 2015 | 2014 | 2013 | 2012 | |||||||||||||||
(In thousands) | |||||||||||||||||||
Consolidated Balance Sheet Data | |||||||||||||||||||
Cash, cash equivalents and short-term investments | $ | 62,558 | $ | 152,794 | $ | 104,879 | $ | 170,581 | $ | 201,176 | |||||||||
Working capital | $ | 71,938 | $ | 201,250 | $ | 142,754 | $ | 243,650 | $ | 293,978 | |||||||||
Total assets | $ | 554,069 | $ | 524,957 | $ | 480,518 | $ | 606,084 | $ | 717,531 | |||||||||
Convertible debt, long-term(8) | $ | 103,259 | $ | 98,295 | $ | — | $ | — | $ | — | |||||||||
Stockholders’ equity | $ | 270,641 | $ | 328,168 | $ | 371,813 | $ | 494,166 | $ | 553,413 | |||||||||
(1) In 2016, we recorded $18.0 million of restructuring and related charges, of which $14.6 million is included in operating expenses and $3.4 million is included in cost of revenue. This $18.0 million of restructuring and related charges comprised primarily of $17.8 million of severance and benefits for the termination of 118 employees worldwide, including 83 employees in France who participated in the TVN voluntary departure plan (“TVN VDP”) and $2.2 million related to the cost for exiting from our excess facility in the U.S., offset partially by approximately $2.0 million of gain from TVN pension curtailment. (See Note 11, “Restructuring and related charges,” of the notes to our Consolidated Financial Statements for detail information on restructuring and related charges and pension curtailment gain).
(2) In 2016, as a result of the TVN acquisition, we incurred acquisition-and integration-related expenses in aggregate of $16.9 million, of which $14.9 million was included in selling, general and administrative expenses and the remainder in research and development expenses and cost of revenue. (See Note 3, “Business Acquisition,” of the notes to our Consolidated Financial Statements for additional information).
(3) Gross margin decreased to 49.5% in 2016 compared to 53.8% in 2015. The decrease in gross margin was primarily due to the inclusion of TVN’s operating results which resulted in higher material, labor and overhead costs attributable to the additional headcount and facilities acquired in connection with the TVN acquisition as well as the restructuring costs incurred in 2016 related to the termination of employees of the Company’s acquired TVN subsidiary in France (the “TVN French
37
Subsidiary”) under the TVN VDP, as well as an increase of $3.7 million in amortization expense related to the intangibles acquired from TVN acquisition. Additionally, the gross margin in 2016 was unfavorably impacted by an inventory obsolescence charge of approximately $4.0 million for some older Cable Edge product lines. Gross margin increased to 53.8% in 2015 compared to 49.0% in 2014. The increase in gross margin was primarily due to decreased expenses related to amortization, operational efficiencies and product mix shifts in our product portfolio. The expense related to amortization of intangibles included in cost of revenue decreased from $13.7 million in 2014 to $0.7 million in 2015, due to majority of the purchased tangible assets becoming fully amortized.
(4) As a result of our assessment, in 2016 and 2015, we recorded impairment charges of $2.7 million and $2.5 million for our investment in Vislink plc (“Vislink”) and VJU iTV Development GmbH (“VJU”), respectively, as we determined both of these investments were impaired on an other-than-temporary basis. (See Note 5, “Investments in Other Equity Securities,” of the notes to our Consolidated Financial Statements for additional information).
(5) In 2014, we recorded a net increase in valuation allowance of $29.0 million in 2014 against U.S. net deferred tax assets. A history of operating losses in recent years has led to uncertainty with respect to our ability to realize certain of our net deferred tax assets. This unfavorable impact was partially offset by the release of $9.0 million of tax reserves in 2014, including accrued interests and penalties, for our 2010 tax year in the United States, as a result of the expiration of the statute of limitation for that tax year. In 2016, we recorded a net increase in valuation allowance of $18.3 million against all of our U.S. deferred tax assets as well as the net operating losses generated in 2016 due to significant cumulative losses in the United States. This increase in valuation allowance was partially offset by the release of $8.4 million valuation allowance associated with the Company’s TVN French Subsidiary. Due to a change in its business model, as of December 31, 2016, our TVN French Subsidiary is forecasted to generate pretax income in future periods.
(6) In 2013, we released $39.0 million of tax reserves, including accrued interests and penalties, for our 2008 and 2009 tax years in the United States, as a result of the expiration of the statute of limitations for those tax years.
(7) Loss from operations for 2016, 2015, 2014, 2013 and 2012 included stock-based compensation expense of $13.1 million, $15.6 million, $17.3 million, $16.0 million and $18.4 million, respectively.
(8) In December 2015, we issued the Notes through a private placement with a financial institution. The Notes bear interest at 4.00% per annum, which is payable semiannually in arrears on June 1 and December 1 of each year, commencing June 1, 2016. In accordance with accounting guidance on embedded conversion features, we valued and bifurcated the conversion option associated with the Notes recording $26.9 million in stockholders’ equity. We incurred approximately $4.1 million of debt issuance costs in connection with the issuance of the Notes, which we recorded as a deduction to the carrying amount of the Notes and $0.8 million of debt issuance costs was allocated to stockholders’ equity. The resulting net debt discount, difference between the principal amount of the Notes and the carrying value of the Notes, of $30.2 million is amortized to interest expenses at an effective interest rate of 9.94% over the contractual term of the Notes. In 2015, we recorded $240,000 of coupon interest expense and $216,000 of interest expenses related to the amortization of debt discount and debt issuance costs. In 2016, we recorded $5.1 million of coupon interest expense and $5.0 million of interest expenses related to the amortization of debt discount and debt issuance costs. (See Note 12, “Convertible Notes, Other Debts, and Capital Leases,” of the notes to our Consolidated Financial Statements for additional information on the Notes).
38
Item 7. | MANAGEMENT’S DISCUSSION AND ANALYSIS OF FINANCIAL CONDITION AND RESULTS OF OPERATIONS |
The following discussion should be read in conjunction with the consolidated financial statements and the related notes. The following discussion contains forward-looking statements that reflect our plans, estimates and beliefs. Our actual results could differ materially from those discussed in the forward-looking statements. Factors that could cause or contribute to these differences include, but are not limited to, those discussed below and those listed under Item 1A, Risks Factors.
Business Overview
We design, manufacture and sell versatile and high performance video infrastructure products and system solutions that enable our customers to efficiently create, prepare and deliver a full range of video and broadband services to consumer devices, including televisions, personal computers, laptops, tablets and smart phones.
We do business in three geographic regions: the Americas, EMEA and APAC and operate in two segments, Video and Cable Edge. Our Video business sells video processing and production and playout solutions and services worldwide to cable operators and satellite and telecommunications (telco) Pay-TV service providers, which we refer to collectively as “service providers,” as well as to broadcast and media companies, including streaming new media companies. Our Cable Edge business sells cable access solutions and related services, primarily to cable operators globally.
Acquisition of TVN
On February 29, 2016, through our wholly-owned subsidiary Harmonic International AG, we completed our acquisition of 100% of the share capital and voting rights of TVN for $82.5 million in cash. TVN, a global leader in advanced video compression solutions, is headquartered in Rennes, France. The TVN acquisition was primarily funded with cash proceeds from the issuance of the Notes in December 2015.
TVN is now a part of our Video segment and its results of operations are included in our Consolidated Statements of Operations beginning March 1, 2016. The acquisition of TVN is intended to strengthen our competitive position in the video infrastructure market as well as enhance the depth and scale of our research and development and service and support capabilities in the video arena. We believe that the combined product portfolios, research and development teams and global sales and service personnel of Harmonic and TVN will allow us to accelerate innovation for our customers while leveraging greater scale to drive operational efficiencies. (See Note 3, “Business Acquisition,” of the notes to our Consolidated Financial Statements for additional information on the TVN acquisition).
Historically, our revenue has been dependent upon capital spending in the cable, satellite, telco, broadcast and media industries, including streaming media. Our customers’ capital spending patterns are dependent on a variety of factors, including but not limited to: economic conditions in the U.S. and international markets; access to financing; annual budget cycles of each of the industries we serve; impact of industry consolidations; and customers suspending or reducing capital spending in anticipation of new products or new standards, new industry trends and/or technology shifts. If our product portfolio and product development plans do not position us well to capture an increased portion of the capital spending in the markets in which we compete, our revenue may decline. As we attempt to further diversify our customer base in these markets, we may need to continue to build alliances with other equipment manufacturers, content providers, resellers and system integrators, manage services providers and software developers; adapt our products for new applications; take orders at prices resulting in lower margins; and build internal expertise to handle the particular operational, payment, financing and/or contractual demands of our customers, which could result in higher operating costs for us. Implementation issues with our products or those of other vendors have caused in the past, and may cause in the future, delays in project completion for our customers and delay our recognition of revenue.
A majority of our revenue has been derived from relatively few customers, due in part to the consolidation of our service provider customers. Sales to our 10 largest customers in 2016, 2015 and 2014 accounted for approximately 28%, 32% and 35% of our revenue, respectively. Although we are attempting to broaden our customer base by penetrating new markets and further expanding internationally, we expect to see continuing industry consolidation and customer concentration. During 2016, no customers accounted for more than 10% of our net revenue. During 2015 and 2014, revenue from Comcast accounted for 12% and 16%, of our net revenue, respectively. No other customers accounted for more than 10% of our net revenue in 2015 and 2014. The loss of any significant customer, or any material reduction in orders from any significant customer, or our failure to qualify our new products with any significant customer could materially and adversely affect our operating results, financial condition and cash flows.
39
Our Video segment revenue increased in 2016 compared to 2015 primarily due to our acquisition of TVN, which led to stronger demand from both our service provider and broadcast and media customers, particularly within EMEA and the Americas.
Our Video segment customers continue to be cautious with investments in new technologies, such as next-generation IP architecture and Ultra HD. We believe a material and growing portion of the opportunities for our video business are linked to a migration by our customers to IP workflows and the distribution of linear and on-demand, over-the-top, and new mobile video services. We believe we are well positioned to address these opportunities as we continue to steadily transition our video business away from legacy and customized computing hardware to more software-centric solutions, enabling video compression and processing through our VOS software platform running on standard off-the-shelf servers, data centers and in the cloud.
Our Cable Edge strategy is to become a major player in the approximately $2 billion CCAP market by delivering innovative new DOCSIS 3.1 CMTS technology, which we refer to as CableOS. In the meantime, our Cable Edge segment is experiencing weaker demand as some of our customers have decreased spending on current Cable Edge products as they prepare to make investments in new converged data and video DOCSIS 3.1 CMTS solutions. While these trends present near-term challenges for us, we believe we have made significant progress on the development of our DOCSIS 3.1 CMTS solutions and we began addressing this market opportunity with our first CableOS shipments in the fourth quarter of 2016.
To support our Cable Edge strategy and foster the further development and growth of this segment, in September 2016, we granted Comcast a warrant (the “Warrant”) to purchase shares of our common stock to further incentivize them to purchase our products and adopt our technologies, particularly our CableOS software-based CCAP systems. Pursuant to the Warrant, Comcast may, subject to certain vesting provisions, purchase up to 7,816,162 shares of our common stock, for a per share exercise price of $4.76. Comcast’s right to purchase 781,617 shares under the Warrant was vested as of the issuance date as an incentive to enter into the software license product supply agreement with us. Comcast’s rights to purchase an additional 1,954,042 shares vest upon achievement of milestones that occur upon or prior to Comcast’s election for enterprise license pricing for certain of our software products. Such pricing would obligate Comcast to make certain total payments to us over the term of the product supply agreement. Comcast’s rights to purchase an additional 1,172,425 shares vest when Comcast exceeds specified cumulative purchase amounts from us under the product supply agreement. Comcast’s rights to purchase the remaining 3,908,081 shares vest in specified tranches at the earlier of Comcast’s enterprise license pricing election (if completed by a certain date) or achievement of specified cumulative purchase amounts from us. Because the Warrant is considered an incentive for Comcast to purchase certain of the Company’s products, the value of the Warrant will be recorded as a reduction in the Company’s net revenues to the extent such value does not exceed net revenues from pertinent sales to Comcast. (See Note 17, “Warrants,” of the Notes to our Consolidated Financial Statements for additional information).
As a result of the continued uncertainty regarding the timing of our customers’ investment decisions, we implemented restructuring plans to bring our operating expenses more in line with net revenues, while simultaneously implementing an extensive Company-wide expense control program. (See Note 11, “Restructuring and Related Charges” of the Notes to our Consolidated Financial Statements for additional information).
Our aggregate balance of cash, cash equivalents and short-term investments as of December 31, 2016 was $62.6 million and during the fiscal year 2016, we generated $0.4 million of cash from operations.
We expect that our current sources of liquidity together with our current projections of cash flow from operating activities will provide us adequate liquidity based on our current plan for the next twelve months.
Critical Accounting Policies, Judgments and Estimates
The preparation of financial statements and related disclosures requires Harmonic to make judgments, assumptions and estimates that affect the reported amounts of assets and liabilities, the disclosure of contingencies and the reported amounts of revenue and expenses in the financial statements and accompanying notes. Material differences may result in the amount and timing of revenue and expenses if different judgments or different estimates were made. See Note 2 of the notes to our Consolidated Financial Statements for details of our accounting policies. Critical accounting policies, judgments and estimates that we believe have the most significant impact on Harmonic’s financial statements are set forth below:
• | Business combination; |
• | Revenue recognition; |
• | Valuation of inventories; |
• | Impairment of goodwill or long-lived assets; |
40
• | Assessment of the probability of the outcome of current litigation; |
• | Accounting for income taxes; and |
• | Stock-based compensation. |
Business Combination
We applied the acquisition method of accounting for business combinations to our acquisition of TVN, which closed on February 29, 2016. (See Note 3, “Business Acquisition,” for additional information on TVN acquisition). Under this method of accounting, all assets acquired and liabilities assumed are recorded at their respective fair values at the date of the completion of the transaction. Determining the fair value of assets acquired and liabilities assumed requires management’s judgment and often involves the use of significant estimates and assumptions, including assumptions with respect to future cash inflows and outflows, discount rates, intangibles and other asset lives, among other items. Fair value is defined as the price that would be received in a sale of an asset or paid to transfer a liability in an orderly transaction between market participants at the measurement date (an exit price). Market participants are assumed to be buyers and sellers in the principal (most advantageous) market for the asset or liability. Additionally, fair value measurements for an asset assume the highest and best use of that asset by market participants. As a result, we may have been required to value the acquired assets at fair value measurements that do not reflect its intended use of those assets. Use of different estimates and judgments could yield different results. Any excess of the purchase price over the fair value of the net assets acquired is recognized as goodwill.
During the fourth quarter of 2016, we completed the accounting for this business combination.
Revenue Recognition
Harmonic’s principal sources of revenue are from the sale of hardware, software, hardware and software maintenance contracts, and the sale of end-to-end solutions, encompassing design, manufacture, test, integration and installation of products. Harmonic recognizes revenue when persuasive evidence of an arrangement exists, delivery has occurred or services have been provided, the sale price is fixed or determinable, and collectability is reasonably assured.
We generally use contracts and customer purchase orders to determine the existence of an arrangement. Shipping documents and customer acceptance, when applicable, are used to verify delivery. We assess whether the sales price is fixed or determinable based on the payment terms associated with the transaction and whether the price is subject to refund or adjustment. We assess collectability based primarily on the creditworthiness of the customer, as determined by credit checks and analysis, as well as the customer’s payment history.
Significant management judgments and estimates must be made in connection with determination of the revenue to be recognized in any accounting period. Because of the concentrated nature of our customer base, different judgments or estimates made for any one large contract or customer could result in material differences in the amount and timing of revenue recognized in any particular period.
We have multiple-element revenue arrangements that include hardware and software essential to the hardware product’s functionality, non-essential software, services and support. We allocate revenue to all deliverables based on their relative selling prices. We determine the relative selling prices by first considering vendor-specific objective evidence of fair value (“VSOE”), if it exists; otherwise third-party evidence (“TPE”) of the selling price is used. When we are unable to establish selling price using VSOE or TPE, we use our best estimate of selling price (“BESP”) in our allocation of arrangement consideration. The objective of BESP is to determine the price at which we would transact a sale if the product or service were sold on a stand-alone basis. BESP is generally used for offerings that are not typically sold on a stand-alone basis or for new or highly customized offerings. The Company’s process for determining BESP involves management’s judgment, and considers multiple factors that may vary over time, depending upon the unique facts and circumstances related to each deliverable. If the facts and circumstances underlying the factors considered change or should future facts and circumstances lead the Company to consider additional factors, the Company’s BESP may also change. Once revenue is allocated to all deliverables based on their relative selling prices, revenue related to hardware elements (hardware, essential software and related services) are recognized using a relative selling price allocation and non-essential software and related services are recognized under the residual method.
Sales of stand-alone software that are not considered essential to the functionality of the hardware continue to be subject to the software revenue recognition guidance. In accordance with the software revenue recognition guidance, the Company applies the residual method to recognize revenue for the delivered elements in stand-alone software transactions. Under the residual method, the amount of revenue allocated to delivered elements equals the total arrangement consideration, less the aggregate fair value of any undelivered elements, typically maintenance, provided that VSOE of fair value exists for all
41
undelivered elements. We establish fair value by reference to the price the customer is required to pay when an item is sold separately, using contractually stated, substantive renewal rates, when applicable, or the price of recently completed stand alone sales transactions. Accordingly, the determination as to whether appropriate objective and reliable evidence of fair value exists can impact the timing of revenue recognition for an arrangement.
Solution sales for the design, manufacture, test, integration and installation of products are accounted for in accordance with applicable guidance on accounting for performance of construction/production contracts, using the percentage-of-completion method of accounting when various requirements for the use of this accounting guidance exist. Under the percentage-of-completion method, our revenue recognized reflects the portion of the anticipated contract revenue that has been earned, equal to the ratio of actual labor hours expended to total estimated labor hours to complete the project. Costs are recognized proportionally to the labor hours incurred. Management believes that, for each such project, labor hours expended in proportion to total estimated hours at completion represents the most reliable and meaningful measure for determining a project’s progress toward completion. This requires us to estimate, at the outset of each project, a detailed project plan and associated labor hour estimates for that project. For contracts that include customized services for which labor costs are not reasonably estimable, the Company uses the completed contract method of accounting. Under the completed contract method, 100% of the contract’s revenue and cost is recognized upon the completion of all services under the contract. If the estimated costs to complete a project exceed the total contract amount, indicating a loss, the entire anticipated loss is recognized. Our application of the percentage-of-completion method of accounting is subject to our estimates of labor hours to complete each project. In the event that actual results differ from these estimates or we adjust these estimates in future periods, our operating results, financial position or cash flows for a particular period could be adversely affected.
Revenue on shipments to resellers and systems integrators is generally recognized on delivery. Resellers and systems integrators purchase our products for specific capital equipment projects of the end-user and do not hold inventory as a standard operating practice. They perform functions that include importation, delivery to the end-customer, installation or integration, and post-sales service and support. Our agreements with these resellers and systems integrators have terms which are generally consistent with the standard terms and conditions for the sale of our equipment to end users and do not provide for product rotation or pricing allowances, as are typically found in agreements with stocking resellers. We have long-term relationships with most of these resellers and systems integrators and substantial experience with similar sales of similar products. We do have instances of accepting product returns from resellers and system integrators. However, such returns typically occur in instances where the system integrator has designed a product into a project for the end user, but the integrator requests permission to return the component as it does not meet the specific project’s functional requirements. Such returns are made solely at our discretion, as our agreements with resellers and system integrators do not provide for return rights. We have sufficient experience monitoring product returns from our resellers, and, accordingly, we have concluded that we should use a sell-in model for our reseller sales.
Valuation of Inventories
We state inventories at the lower of cost or market. Cost is computed using standard cost, which approximates actual cost, on a first-in, first-out basis. We write down the cost of excess or obsolete inventory to net realizable value based on future demand forecasts and historical consumption. If there were to be a sudden and significant decrease in demand for our products, or if there were a higher incidence of inventory obsolescence because of rapidly changing technology and customer requirements, we could be required to record additional charges for excess and obsolete inventory and our gross margin could be adversely affected. Inventory management is of critical importance in order to balance the need to maintain strategic inventory levels to ensure competitive lead times against the risk of inventory obsolescence because of rapidly changing technology and customer requirements.
Impairment of Goodwill or Long-lived Assets
Goodwill represents the difference between the purchase price and the estimated fair value of the identifiable assets acquired and liabilities assumed. We test for goodwill impairment at the reporting unit level, which is the same as our operating segment, on an annual basis in the fourth quarter of each of our fiscal years, and at any other time at which events occur or circumstances indicate that the carrying amount of goodwill may exceed its fair value.
The provisions of the accounting standard for goodwill and other intangibles allows us to first assess qualitative factors to determine whether it is necessary to perform the two-step quantitative goodwill impairment test. Various factors are considered in the qualitative assessment, including macroeconomic conditions, financial performance, or a sustained decrease in share price. If as a result of the qualitative assessment, it is deemed more likely than not that the fair value of a reporting unit is less than its carrying amount, management will perform the quantitative test.
We use a two-step process to determine the amount of goodwill impairment. The first step requires comparing the fair value of the reporting unit to its net book value, including goodwill. A potential impairment exists if the fair value of the
42
reporting unit is lower than its net book value. The second step of the process, which is performed only if a potential impairment exists, involves determining the difference between the fair value of the reporting unit’s net assets other than goodwill and the fair value of the reporting unit. If this difference is less than the net book value of goodwill, an impairment exists and is recorded.
In the first step, the fair value of each of our reporting units is determined using both the income and market valuation approaches. Under the income approach, the fair value of the reporting unit is based on the present value of estimated future cash flows that the reporting unit is expected to generate over its remaining life. Under the market approach, the value of the reporting unit is based on an analysis that compares the value of the reporting unit to values of publicly-traded companies in similar lines of business. In the application of the income and market valuation approaches, we are required to make estimates of future operating trends and judgments on discount rates and other variables. Determining the fair value of a reporting unit is highly judgmental in nature and involves the use of significant estimates and assumptions. We base our fair value estimates on assumptions we believe to be reasonable but that are unpredictable and inherently uncertain. Actual future results related to assumed variables could differ from these estimates. In addition, we make certain judgments and assumptions in allocating shared assets and liabilities to determine the carrying values for each of our reporting units.
Under the income approach, we calculate the fair value of a reporting unit based on the present value of estimated future cash flows. Cash flow projections are based on management's estimates of revenue growth rates and operating margins, taking into consideration industry and market conditions. The discount rate used is based on the weighted-average cost of capital adjusted for the relevant risk associated with business-specific characteristics and the uncertainty related to the business's ability to execute on the projected cash flows. Under the market approach, we estimate the fair value based on market multiples of revenue and earnings derived from comparable publicly-traded companies with similar operating and investment characteristics as the reporting units, and then apply a control premium which is determined by considering control premiums offered as part of the acquisitions that have occurred in market segments that are comparable with our reporting units.
During the second quarter of 2016, the sustained decline in our stock price led to a triggering event for goodwill impairment assessment. As of July 1, 2016, with a closing stock price of $3.01 on The NASDAQ Stock Market, our market capitalization was approximately $235 million. As this market capitalization was less than our net book value, further analysis was performed to determine if an impairment existed. Based on the impairment test performed, we determined that our goodwill was not impaired as of July 1, 2016.
During the fourth quarter of 2016, we performed the first step of goodwill impairment testing for our two reporting units as part of our annual goodwill impairment test and concluded that goodwill was not impaired as the Video and Cable Edge reporting units had estimated fair values in excess of their carrying value by approximately 67% and 123%, respectively. We have not recorded any impairment charges related to goodwill for any prior periods.
We evaluate the recoverability of intangible assets and other long-lived assets when indicators of impairment are present. When impairment indicators are present, we evaluate the recoverability of intangible assets and other long-lived assets on the basis of undiscounted cash flows expected to result from the use of each asset group and its eventual disposition. If the undiscounted expected future cash flows are less than the carrying amount of the asset, an impairment loss is recognized in order to writedown the carrying value of the asset to its estimated fair market value. In connection with restructuring actions initiated during 2014, we recorded an impairment charge of $1.1 million in 2014 related to software development costs incurred for a discontinued IT project.
In 2015, we recorded an impairment charge of $2.5 million for our investment in VJU as we determined that the entire investment in VJU was impaired on an other-than-temporary basis. Factors considered included the severity of the impairment, expected cash flows and recent events specific to VJU. In 2016, the stock price of Vislink, our other equity investment, fell below the cost basis for several months. Based on our assessment of the positive and negative factors of Vislink’s financial and business conditions, we determined that more-likely-than-not, Vislink’s stock price would not recover to its cost basis and, as a result, we recorded a total of $2.7 million of impairment charges reflecting the new reduced cost basis. (See Note 5, “Investments in Other Equity Securities,” of the notes to our Consolidated Financial Statements for additional information).
Assessment of the Probability of the Outcome of Current Litigation
From time to time, we are involved in lawsuits as well as subject to various legal proceedings, claims, threats of litigation, and investigations in the ordinary course of business, including claims of alleged infringement of third-party patents and other intellectual property rights, commercial, employment and other matters. We assess potential liabilities in connection with each lawsuit and threatened lawsuits and accrue an estimated loss for these loss contingencies if both of the following conditions are met: information available prior to issuance of the financial statements indicates that it is probable that a liability has been incurred at the date of the financial statements and the amount of loss can be reasonably estimated. While certain matters to which we are a party specify the damages claimed, such claims may not represent reasonably probable losses. Given
43
the inherent uncertainties of litigation, the ultimate outcome of these matters cannot be predicted at this time, nor can the amount of possible loss or range of loss, if any, be reasonably estimated.
In October 2011, Avid Technology, Inc. (“Avid”) filed a complaint in the United States District Court for the District of Delaware alleging that Harmonic’s Media Grid product infringes two patents held by Avid. A jury trial on this complaint commenced on January 23, 2014 and, on February 4, 2014, the jury returned a unanimous verdict in our favor, rejecting Avid’s infringement allegations in their entirety. On May 23, 2014, Avid filed a post-trial motion asking the court to set aside the jury’s verdict, and the judge issued an order on December 17, 2014, denying the motion. On January 5, 2015, Avid filed an appeal with respect to the jury’s verdict with the Federal Circuit, which was docketed on January 9, 2015, as Case No. 2015-1246. Avid filed its opening brief with respect to this appeal on March 24, 2015, we filed our response brief on May 7, 2015, and Avid filed its reply brief on June 16, 2015. Oral arguments were held on December 11, 2015. On January 29, 2016, the Federal Circuit issued an order vacating the verdict of noninfringement and remanding the case to the trial court for a new trial on infringement. On February 26, 2016, Harmonic filed a request for rehearing and rehearing en banc at the Federal Circuit. On March 31, 2016, the Federal Circuit denied the request for rehearing and rehearing en banc and a mandate issued on April 8, 2016. The court conducted a supplemental claim construction hearing on May 27, 2016 and issued a claim construction order on June 29, 2016. On June 17, 2016, Harmonic filed requests for ex parte reexaminations for the ’808 and ’309 patents with the United States Patent and Trademark Office (“USPTO”). The USPTO ordered reexamination of both the ’309 and ’808 patents in August 2016. The USPTO issued a Non-Final Office Action on November 25, 2016 for the ’309 patent, including rejecting all challenged claims. The USPTO issued a Non-Final Office Action for the ’808 patent on December 15, 2016, rejecting all challenged claims. The Patent Owner filed its response in both reexaminations on February 15, 2017. A status conference was held with the District Court on February 23, 2017.
In June 2012, Avid served a subsequent complaint in the United States District Court for the District of Delaware alleging that our Spectrum product infringes one patent held by Avid. The complaint seeks injunctive relief and unspecified damages. In September 2013, the U.S. Patent Trial and Appeal Board (“PTAB”) authorized an inter partes review to be instituted as to claims 1-16 of the patent asserted in this second complaint. A hearing before the PTAB was conducted on May 20, 2014. On July 10, 2014, the PTAB issued a decision finding claims 1-10 invalid and claims 11-16 not invalid. We filed an appeal with respect to the PTAB’s decision on claims 11-16 on September 11, 2014. The appeal was docketed with the Federal Circuit on October 22, 2014, as Case No. 2015-1072, and we filed our opening brief with respect to this appeal on January 29, 2015. Avid and PTAB each filed a response brief on April 27, 2015, and we filed a reply brief on May 28, 2015. Oral arguments were held on October 8, 2015. The Federal Circuit issued an order on March 1, 2016, affirming the PTAB’s decision and a mandate issued on April 7, 2016. On July 25, 2016, the court issued a scheduling order for the case and set the trial date for November 6, 2017.
An unfavorable outcome on any litigation matters could require us to pay substantial damages, or, in connection with any intellectual property infringement claims, could require us to pay ongoing royalty payments or could prevent us from selling certain of our products. As a result, a settlement of, or an unfavorable outcome on, any of the matters referenced above or other litigation matters could have a material adverse effect on our business, operating results, financial position and cash flows.
Accounting for Income Taxes
In preparing our financial statements, we estimate our income taxes for each of the jurisdictions in which we operate. This involves estimating our actual current tax exposures and assessing temporary differences resulting from differing treatment of items, such as reserves and accruals, for tax and accounting purposes. These differences result in deferred tax assets and liabilities, which are included within our Consolidated Balance Sheet.
Significant management judgment is required in determining our provision for income taxes, our deferred tax assets and liabilities and our future taxable income for purposes of assessing our ability to realize any future benefit from our deferred tax assets. A history of operating losses in recent years has led to uncertainty with respect to our ability to realize certain of our net deferred tax assets, and as a result we applied full valuation allowance against our U.S. net deferred tax assets as of December 31, 2015 and continued into 2016, attributing to a $18.3 million increase in valuation allowance in 2016. This increase in valuation allowance in 2016 is offset partially by the release of $8.4 million of valuation allowance associated with our TVN French Subsidiary. Due to a change in business model, as of December 31, 2016, the French Subsidiary is forecasted to generate pretax income in future periods. After considering all the positive and negative evidence, we determined that the valuation allowance for the TVN French Subsidiary should be released as of December 31, 2016 based on its projected income. In the event that actual results differ from these estimates or we adjust these estimates in future periods, our operating results and financial position could be materially affected.
We are subject to examination of our income tax returns by various tax authorities on a periodic basis. We regularly assess the likelihood of adverse outcomes resulting from such examinations to determine the adequacy of our provision for income taxes. We apply the provisions of the applicable accounting guidance regarding accounting for uncertainty in income
44
taxes, which requires application of a more-likely-than-not threshold to the recognition and derecognition of uncertain tax positions. If the recognition threshold is met, the applicable accounting guidance permits us to recognize a tax benefit measured at the largest amount of such tax benefit that, in our judgment, is more than fifty percent likely to be realized upon settlement. It further requires that a change in judgment related to the expected ultimate resolution of uncertain tax positions be recognized in earnings in the period in which such determination is made.
We file U.S. federal, state, and foreign income tax returns in jurisdictions with varying statutes of limitations during which such tax returns may be audited and adjusted by the relevant tax authorities. In 2016, the U.S. Internal Revenue Service concluded its audit for our 2012 tax year and as a result, we released $1.1 million of related tax reserves, including accrued interests and penalties. We also released $9.0 million and $0.5 million of related tax reserves, including accrued interests and penalties, for the 2010 and 2011 tax years in 2014 and 2015, respectively, as a result of the expiration of the statute of limitations.
The 2013 through 2015 tax years generally remain subject to examination by U.S. federal and most state tax authorities. In significant foreign jurisdictions, the 2007 through 2015 tax years generally remain subject to examination by their respective tax authorities. In 2016, the U.S. Internal Revenue Service concluded its examination of our income tax return for the tax year 2012, which commenced in August 2015. In addition, one of our subsidiaries is under audit for the 2012 and 2013 tax years, which commenced in 2015, by the Israel tax authority. If, upon the conclusion of these audits, the ultimate determination of taxes owed in the United States or Israel is for an amount in excess of the tax provision the Company has recorded in the applicable period, the Company’s overall tax expense, effective tax rate, operating results and cash flow could be materially and adversely impacted in the period of adjustment.
On July 27, 2015, the U.S. Tax Court issued an opinion in Altera Corp. v. Commissioner, 145 T.C. No.3 (2015) related to the treatment of stock-based compensation expense in an intercompany cost-sharing arrangement. A final decision was entered by the U.S. Tax Court on December 1, 2015. On February 19, 2016, the U.S. Internal Revenue Service filed a notice of appeal in Altera Corp. v. Commissioner, 145 T.C. No. 3 (2015), to the Ninth Circuit Court of Appeal. The Ninth Circuit will decide whether a regulation that mandates that stock-based compensation costs related to the intangible development activity of a qualified cost sharing arrangement (a “QCSA”) must be included in the joint cost pool of the QCSA (the “all costs rule”) is consistent with the arm’s length standard as set forth in Section 482 of the Internal Revenue Code. We concluded that no adjustment to the consolidated financial statements as of December 31, 2016 is appropriate at this time due to the uncertainties with respect to the ultimate resolution of this case.
We file annual income tax returns in multiple taxing jurisdictions around the world. A number of years may elapse before an uncertain tax position is audited and finally resolved. While it is often difficult to predict the final outcome or the timing of resolution of any particular uncertain tax position, we believe that our reserves for income taxes reflect the most likely outcome. We adjust these reserves, as well as the related interest and penalties, in light of changing facts and circumstances. If our estimate of tax liabilities proves to be less than the ultimate assessment, a further charge to expense would result. If payment of these amounts ultimately proves to be unnecessary, the reversal of the liabilities would result in tax benefits being recognized in the period when we determine the liabilities are no longer necessary. Any changes in estimate, or settlement of any particular position, could have a material impact on our operating results, financial condition and cash flows.
Stock-based Compensation
We measure and recognize compensation expense for all stock-based compensation awards made to employees and directors, including stock options, restricted stock units and awards related to our Employee Stock Purchase Plan (“ESPP”), based upon the grant-date fair value of those awards. The grant date fair value of restricted stock units is based on the fair value of our common stock on the date of grant. The grant date fair value of our stock options and ESPP is estimated using the Black-Scholes option pricing model.
The determination of fair value of stock options and ESPP on the date of grant, using an option-pricing model, is affected by our stock price, as well as assumptions regarding a number of highly complex and subjective variables. These variables include our expected stock price volatility over the term of the awards, actual and projected employee stock option exercise behaviors, risk-free interest rates, and expected dividends. We estimated the expected life of the awards based on an analysis of our historical experience of employee exercise and post-vesting termination behavior considered in relation to the contractual life of the options and purchase rights. The risk-free interest rate assumption is based upon observed interest rates appropriate for the expected term of the awards. We do not currently pay cash dividends on our common stock and do not anticipate doing so in the foreseeable future. Accordingly, our expected dividend yield is zero. In addition, we apply an expected forfeiture rate in determining the amount of stock-based compensation. We use historical forfeitures to estimate our future forfeiture rates.
We recognize the stock-based compensation expense for performance-based RSUs (“PRSUs”) based on the probability of achieving certain performance criteria, as defined in the PRSU agreements. We estimate the number of PRSUs ultimately
45
expected to vest and recognize expense using the graded vesting attribution method over the requisite service period. Changes in our estimates related to probability of achieving certain performance criteria and number of PRSUs expected to vest could significantly affect the stock-based compensation expense from one period to the next.
If factors change and we employ different assumptions to determine the fair value of our stock-based compensation awards granted in future periods, the compensation expense that we record under it may differ significantly from what we have recorded in the current period.
See Note 13, “Employee Benefit Plans and Stock-based Compensation,” of the notes to our Consolidated Financial Statements for additional information.
Results of Operations
Net Revenue
The following table presents the breakdown of revenue for each of our business segments described in Item 1 of this Annual Report on Form 10-K for each of the three years ended December 31, 2016, 2015 and 2014 (in thousands, except percentages):
Year ended December 31, | |||||||||||||||||||||||
2016 | 2015 | 2014 | 2016 vs. 2015 | 2015 vs. 2014 | |||||||||||||||||||
Video | $ | 351,489 | $ | 291,779 | $ | 326,756 | $ | 59,710 | 20 | % | $ | (34,977 | ) | (11 | )% | ||||||||
Cable Edge | 54,422 | 85,248 | 106,801 | (30,826 | ) | (36 | )% | (21,553 | ) | (20 | )% | ||||||||||||
Total net revenue | $ | 405,911 | $ | 377,027 | $ | 433,557 | $ | 28,884 | 8 | % | $ | (56,530 | ) | (13 | )% | ||||||||
Segment revenue as a % of total net revenue: | |||||||||||||||||||||||
Video | 87 | % | 77 | % | 75 | % | |||||||||||||||||
Cable Edge | 13 | % | 23 | % | 25 | % | |||||||||||||||||
The following table presents the breakdown of revenue by geographical region for each of the three years ended December 31, 2016, 2015 and 2014 (in thousands, except percentages):
Year ended December 31, | |||||||||||||||||||||||
2016 | 2015 | 2014 | 2016 vs. 2015 | 2015 vs. 2014 | |||||||||||||||||||
Americas | $ | 207,249 | $ | 212,568 | $ | 245,849 | $ | (5,319 | ) | (3 | )% | $ | (33,281 | ) | (14 | )% | |||||||
EMEA | 126,752 | 92,422 | 109,645 | 34,330 | 37 | % | (17,223 | ) | (16 | )% | |||||||||||||
APAC | 71,910 | 72,037 | 78,063 | (127 | ) | — | % | (6,026 | ) | (8 | )% | ||||||||||||
Total net revenue | $ | 405,911 | $ | 377,027 | $ | 433,557 | $ | 28,884 | 8 | % | $ | (56,530 | ) | (13 | )% | ||||||||
Regional revenue as a % of total net revenue: | |||||||||||||||||||||||
Americas | 51 | % | 56 | % | 57 | % | |||||||||||||||||
EMEA | 31 | % | 25 | % | 25 | % | |||||||||||||||||
APAC | 18 | % | 19 | % | 18 | % | |||||||||||||||||
Fiscal 2016 compared to Fiscal 2015
Our Video segment net revenue increased $59.7 million, or 20%, in 2016 compared to 2015. This increase was primarily attributable to a $40.6 million increase in video product revenue and a $19.1 million increase in video service revenue, and such increases were primarily due to the acquisition of TVN which contributed approximately $60.0 million of revenue in 2016. While demand for video infrastructure from our customers in the Americas and EMEA regions improved, overall demand trends were impacted due to several significant ongoing technology transitions and evolving Pay-TV business models.
Our Cable Edge segment net revenue decreased $30.8 million, or 36%, in 2016 compared to 2015. The decrease was primarily due to lower revenue in the Americas, and to a lesser extent in the APAC and EMEA regions. The decrease was
46
primarily due to lower spending associated with a decrease in demand as some of our customers are deferring purchases as they plan their migration to next generation DOCSIS 3.1 technologies and CCAP architectures. Several of our cable customers have started planning for the transition from DOCSIS 3.0 to DOCSIS 3.1 technologies, which will improve high speed data services and enable our customers’ networks to adopt new CCAP architectures. We are currently developing solutions based on DOCSIS 3.1 technologies and the CCAP architecture and made our first CableOS shipments in the fourth quarter of 2016.
Net revenue in the Americas decreased $5.3 million, or 3%, in 2016 compared to 2015, primarily due to the pending transition to new DOCSIS 3.1 technologies, which has impacted our Cable Edge business in the near-term, offset in part by improved service provider spending for our Video products and services.
EMEA net revenue increased $34.3 million, or 37%, in 2016 compared to 2015, primarily due to improved Video product and service revenue, which was partially offset by the decline in service provider demand for our Cable Edge products as they prepare to transition to new DOCSIS 3.1 technologies.
APAC net revenue decreased $0.1 million in 2016 compared to 2015, primarily attributable to softer demand for our Cable Edge products due to the pending transition to DOCISIS 3.1 technologies, partially offset by increased Video service revenue from our service provider customers.
Fiscal 2015 compared to Fiscal 2014
Our Video segment net revenue decreased $35.0 million, or 11%, in 2015 compared to 2014. This decrease was primarily attributable to a $44.2 million decrease in video product revenue, offset partially by a $9.2 million increase in video service revenue. Starting in 2014, we experienced the investment pause of several of our customers as they looked ahead towards the industry’s transition to Ultra HD and high-efficiency video coding (“HEVC”) compression and new virtualized architectures for video processing and this negative factor extended into 2015 as we saw our customers making investment decisions much slower than before. The consolidation of some of our customers in the North America and EMEA regions also contributed to the spending pause we experienced, particularly in the second half of 2015. In addition, the strengthening of the U.S. dollar contributed to the decline in our international video business, as over half of our video product revenue was derived from international customers. The increases in our service revenue were primarily due to an increase in the installed base of equipment being serviced for our customers, primarily in the Americas, in both the service provider and the broadcast and media markets.
Our Cable Edge segment net revenue decreased $21.6 million, or 20%, in 2015 compared to 2014. Revenue decreased in our edgeQAM products in 2015 compared to 2014. The decrease was primarily due to lower spending associated with the consolidations of certain cable operators, both in the United States and Europe, particularly in the second half of 2015, which led to a delay in several of our anticipated large projects as well as some decrease in demand as some of our customers looked ahead to our new next generation CCAP technologies.
Net revenue in the Americas decreased $33.3 million, or 14%, in 2015 compared to 2014 primarily due to the decreased demand for both our video processing products and Cable Edge products and the unfavorable impacts from industry consolidations and spending delays ahead of new next generation product technologies and architectures. This technology spending pause also contributed to the continued decline in net revenue in EMEA and APAC in 2015. APAC net revenue decreased $6.0 million, or 8%, in 2015 compared to 2014, primarily due to softer demand for our video processing products offset in part by increased revenue from our Cable Edge products. EMEA net revenue decreased $17.2 million, or 16%, in 2015 compared to 2014 with decreases across all product categories. The fragile economic and geopolitical climates in EMEA persisted in 2015 and coupled with the strengthening of the U.S. dollar, primarily drove the overall decline in revenue throughout pockets of Europe and Russia. EMEA revenue was also negatively impacted by industry consolidation in the second half of 2015.
Gross Profit
The following presents the gross profit and gross profit as a percentage of net revenue (“gross margin”) for each of the three years ended December 31, 2016, 2015 and 2014 (in thousands, except percentages):
Year ended December 31, | |||||||||||||||||||||||
2016 | 2015 | 2014 | 2016 vs. 2015 | 2015 vs. 2014 | |||||||||||||||||||
Gross profit | $ | 200,750 | $ | 202,712 | $ | 212,348 | $ | (1,962 | ) | (1 | )% | $ | (9,636 | ) | (5 | )% | |||||||
As a percentage of net revenue (“gross margin”) | 49.5 | % | 53.8 | % | 49.0 | % | |||||||||||||||||
47
Gross margin decreased to 49.5% in 2016 compared to 53.8% in 2015. The decrease in gross margin was primarily due to the inclusion of TVN’s operating results which resulted in higher material, labor and overhead costs attributable to the additional headcount and facilities acquired in connection with the TVN acquisition, as well as the restructuring costs incurred in 2016 related to the termination of employees of the TVN French Subsidiary under the TVN VDP, and the increase of $3.7 million in amortization expense related to intangibles acquired from TVN. Additionally, gross margin was unfavorably impacted by an inventory obsolescence charge of approximately $4.0 million for some older Cable Edge product lines, recorded in accordance with our policy for excess and obsolete inventory and also as part of our strategic plan to reposition and dedicate our primary resources to our new CableOS product. These unfavorable margin impacts were offset in part by increased service and support revenue in 2016 compared to 2015.
Gross margin increased to 53.8% in 2015 compared to 49.0% in 2014. The increase in gross margin was primarily due to decreased expenses related to amortization, operational efficiencies and product mix shifts in our product portfolio. The expense related to amortization of intangibles included in cost of revenue decreased from $13.7 million in 2014 to $0.7 million in 2015, primarily due to the majority of our purchased tangible assets becoming fully amortized.
Research and Development
Our research and development expense consists primarily of employee salaries and related expenses, contractors and outside consultants, supplies and materials, equipment depreciation and facilities costs, all associated with the design and development of new products and enhancements of existing products. The following table presents the research and development expenses and the expense as a percentage of net revenue for each of the three years ended December 31, 2016, 2015 and 2014 (in thousands, except percentages):
Year ended December 31, | |||||||||||||||||||||||
2016 | 2015 | 2014 | 2016 vs. 2015 | 2015 vs. 2014 | |||||||||||||||||||
Research and development | $ | 98,401 | $ | 87,545 | $ | 93,061 | $ | 10,856 | 12 | % | $ | (5,516 | ) | (6 | )% | ||||||||
As a percentage of net revenue | 24.2 | % | 23.2 | % | 21.5 | % | |||||||||||||||||
The $10.9 million, or 12%, increase in research and development expense in 2016 compared to 2015 was primarily due to the inclusion of TVN’s post-acquisition research and development expenses and higher expenses for CableOS product development. Such increase was offset in part by approximately $6.0 million in reimbursements of engineering spending by one of our large customers, as well as approximately $6.1 million of R&D tax credits in 2016.
Our TVN French Subsidiary participates in the French CIR program which allows companies to monetize eligible research expenses. We recognize R&D tax credits receivable from the French government for spending on innovative research and development as an offset to research and development expenses.
The $5.5 million, or 6%, decrease in research and development expense in 2015 compared to 2014 was primarily attributable to decreased headcount and related expenses as a result of our worldwide workforce reduction related to our restructuring plans, and to a lesser extent, due to a favorable impact from the strengthened U.S. dollar on our spending denominated in Israeli shekels, reimbursement of research and development expenses for work performed for one of our customers, and decreased depreciation for testing equipment.
Selling, General and Administrative
The following table presents the selling, general and administrative expenses and the expense as a percentage of net revenue for each of the three years ended December 31, 2016, 2015 and 2014 (in thousands, except percentages):
Year ended December 31, | |||||||||||||||||||||||
2016 | 2015 | 2014 | 2016 vs. 2015 | 2015 vs. 2014 | |||||||||||||||||||
Selling, general and administrative | $ | 144,381 | $ | 120,960 | $ | 131,322 | $ | 23,421 | 19 | % | $ | (10,362 | ) | (8 | )% | ||||||||
As a percentage of net revenue | 35.6 | % | 32.1 | % | 30.3 | % | |||||||||||||||||
The $23.4 million, or 19%, increase in selling, general and administrative expenses in 2016 compared to 2015 was primarily due to the inclusion of TVN’s post-acquisition selling, general and administrative expenses, as well as TVN acquisition- and integration-related costs. Such increases were offset in part by lower variable employee compensation related
48
expenses mainly due to a decrease in headcount and efforts to reduce sales and marketing related expenses. See Note 3, “Business Acquisition,” of the notes to our Consolidated Financial Statements for additional information on TVN acquisition- and integration-related costs.
The $10.4 million, or 8%, decrease in selling, general and administrative expenses in 2015 compared to 2014 was primarily attributable to decreased headcount and related expenses as a result of our worldwide workforce reduction related to our restructuring plans and lower variable employee compensation related expenses as well as decreased depreciation for demonstration equipment and cost containment effort in sales and marketing related expenses. These decreases were offset in part by an increase in legal and professional expenses in connection with the acquisition of TVN.
Segment Operating Income (Loss)
The following table presents a breakdown of operating income (loss) by segment for each of the three years ended December 31, 2016, 2015 and 2014 (in thousands, except percentages):
Year ended December 31, | |||||||||||||||||||||||
2016 | 2015 | 2014 | 2016 vs. 2015 | 2015 vs. 2014 | |||||||||||||||||||
Video | $ | 11,963 | $ | 13,529 | $ | 18,073 | $ | (1,566 | ) | (12 | )% | $ | (4,544 | ) | (25 | )% | |||||||
Cable Edge | (12,131 | ) | (1,599 | ) | 1,239 | (10,532 | ) | 659 | % | (2,838 | ) | (229 | )% | ||||||||||
Total segment operating income (loss) | $ | (168 | ) | $ | 11,930 | $ | 19,312 | (12,098 | ) | (101 | )% | (7,382 | ) | (38 | )% | ||||||||
Segment operating income (loss) as a % of segment revenue: | |||||||||||||||||||||||
Video | 3.4 | % | 4.6 | % | 5.5 | % | |||||||||||||||||
Cable Edge | (22.3 | )% | (1.9 | )% | 1.2 | % | |||||||||||||||||
The following table presents a reconciliation of total segment operating income (loss) to consolidated loss before income taxes (in thousands):
Year ended December 31, | |||||||||||
2016 | 2015 | 2014 | |||||||||
Total segment operating income (loss) | $ | (168 | ) | $ | 11,930 | $ | 19,312 | ||||
Unallocated corporate expenses | (38,972 | ) | (2,794 | ) | (3,076 | ) | |||||
Stock-based compensation | (13,060 | ) | (15,582 | ) | (17,287 | ) | |||||
Amortization of intangibles | (14,836 | ) | (6,502 | ) | (20,520 | ) | |||||
Loss from operations | (67,036 | ) | (12,948 | ) | (21,571 | ) | |||||
Non-operating expense, net | (13,394 | ) | (3,120 | ) | (224 | ) | |||||
Loss before income taxes | $ | (80,430 | ) | $ | (16,068 | ) | $ | (21,795 | ) | ||
Fiscal 2016 compared to Fiscal 2015
Video segment operating income decreased $1.6 million, or 12%, in 2016 compared to 2015, and operating margin decreased from 4.6% in 2015 to 3.4% in 2016. The decrease was primarily attributable to unfavorable product mix and the inclusion of TVN’s lower gross margins and higher headcount-related and facilities costs related to the TVN acquisition.
Cable Edge segment operating loss increased $10.5 million, or 659%, in 2016 compared to 2015, and operating margin decreased from (1.9)% in 2015 to (22.3)% in 2016. The increase in operating loss was primarily due to a 36% decrease in Cable Edge segment revenue and higher research and development expenses for CableOS development.
Fiscal 2015 compared to Fiscal 2014
Video segment operating income decreased $4.5 million, or 25%, in 2015 compared to 2014, and operating margin decreased from 5.5% in 2014 to 4.6% in 2015. The decrease was primarily attributable to an 11% decrease in Video segment revenue, offset in part by the favorable impact from a reduction in operating expenses primarily due to decreased headcount and employee variable compensation related expenses, depreciation for demonstration equipment and cost containment effort in sales and marketing related expenses, as well as efficiencies from manufacturing and overhead spending.
49
Cable Edge segment operating income decreased $2.8 million, or 229%, in 2015 compared to 2014, and operating margin decreased from 1.2% in 2014 to (1.9)% in 2015. The unfavorable impact from a 20% decrease in Cable Edge segment revenue was primarily offset by efficiencies from manufacturing and overhead spending, especially for our NSG Pro products as well as lower research and development expenses.
Unallocated Corporate Expenses
Unallocated corporate expenses include certain corporate-level operating expenses and charges such as restructuring and related charges and excess facilities charges. Additionally, the unallocated corporate expenses in 2016 included $16.9 million of TVN acquisition- and integration-related costs (see Note 3, “Business Acquisition,” of the notes to our Consolidated Financial Statements for additional information) and $13.1 million of restructuring costs related to the TVN voluntary departure plan (see Note 11, “Restructuring and Asset Impairment charges-TVN VDP,” of the notes to our Consolidated Financial Statements for additional information) and an inventory obsolescence charge of approximately $4.0 million recorded for some older Cable Edge product lines in accordance with our policy for excess and obsolete inventory and also as part of our strategic plan to re-position and dedicate our primary Cable Edge resources to our new CableOS products.
Amortization of Intangibles
Year ended December 31, | |||||||||||||||||||||||
2016 | 2015 | 2014 | 2016 vs. 2015 | 2015 vs. 2014 | |||||||||||||||||||
Amortization of intangibles | $ | 10,402 | $ | 5,783 | $ | 6,775 | $ | 4,619 | 80 | % | $ | (992 | ) | (15 | )% | ||||||||
As a percentage of net revenue | 2.6 | % | 1.5 | % | 1.6 | % | |||||||||||||||||
The increase in the amortization of intangibles expense in 2016 compared to 2015 was primarily due to the amortization of intangibles related to the acquisition of TVN. The decrease in the amortization of intangibles expense in 2015 compared to 2014 was primarily due to certain purchased tangible assets from prior business acquisition becoming fully amortized.
Restructuring and Related Charges
We implemented several restructuring plans in the past few years and recorded restructuring and related charges of $18.0 million, $1.5 million and $3.1 million for the years ended December 31, 2016, 2015 and 2014, respectively. The goal of these plans was to bring operational expenses to appropriate levels relative to our net revenues, while simultaneously implementing extensive company-wide expense control programs.
We account for our restructuring plans under the authoritative guidance for exit or disposal activities. The restructuring and related charges are included in “Product cost of revenue” and “Operating expenses-restructuring and related charges” in the Consolidated Statements of Operations. The following table summarizes the restructuring and related charges (in thousands):
Year ended December 31, | |||||||||||||||||||||||||
2016 | 2015 | 2014 | 2016 vs. 2015 | 2015 vs. 2014 | |||||||||||||||||||||
Product cost of revenue | $ | 3,400 | $ | 113 | $ | 315 | $ | 3,287 | 2,909 | % | $ | (202 | ) | (64 | )% | ||||||||||
Operating expenses-Restructuring and related charges | 14,602 | 1,372 | 2,761 | 13,230 | 964 | % | (1,389 | ) | (50 | )% | |||||||||||||||
Total | $ | 18,002 | $ | 1,485 | $ | 3,076 | $ | 16,517 | 1,112 | % | $ | (1,591 | ) | (52 | )% | ||||||||||
The restructuring charges of $18.0 million in 2016 were primarily related to the 2016 restructuring plan implemented in the first quarter of 2016 (the “Harmonic 2016 Restructuring Plan”), net of $2.0 million of gain from TVN pension curtailment. The restructuring charges of $1.5 million in 2015 were primarily related to the 2015 restructuring plan (the “Harmonic 2015 Restructuring Plan”) implemented during the fourth quarter of 2014. Of the $3.1 million restructuring charges recorded in 2014, $2.2 million was recorded in the fourth quarter of 2014 related to the Harmonic 2015 Restructuring plan and the remaining $0.9 million were related to restructuring plan implemented in the first quarter of 2013 (the “Harmonic 2013 Restructuring Plan”).
Harmonic 2016 Restructuring Plan
In the first quarter of 2016, we implemented a new restructuring plan to streamline the corporate organization, thereby reducing operating costs by consolidating duplicative resources in connection with the acquisition of TVN. The planned activities have primarily resulted, and will primarily result, in cash expenditures related to severance and related benefits,
50
exiting certain operating facilities and disposing of excess assets. In the second quarter of 2016, as part of the Harmonic 2016 Restructuring Plan, we also initiated the TVN VDP to streamline the organization of our TVN French Subsidiary.
In 2016, we recorded an aggregate of $20.0 million of restructuring and related charges under the Harmonic 2016 Restructuring Plan, of which $2.2 million is primarily related to the exit from the excess facility at our U.S. headquarters and the remaining $17.8 million is related to severance and benefits for the termination of 118 employees worldwide, including 83 employees in France who participated in the TVN VDP. Additionally, the restructuring and related charges under the Harmonic 2016 Restructuring Plan is offset by approximately $2.0 million of gain from TVN pension curtailment. For the employees who participated in the TVN VDP, their pension benefit will be funded by the TVN VDP and as a result, the TVN defined benefit pension plan was remeasured at December 31, 2016, which resulted in a non-cash curtailment gain. We also incurred $16.9 million of TVN acquisition- and integration-related expenses in 2016 (See Note 3, “Business Acquisition,” of the notes to our Consolidated Financial Statements for additional information on TVN acquisition-and integration-related expenses).
A majority of the 2016 restructuring and integration activities were completed in 2016 but some of the TVN VDP activities will continue into 2017 based on the contractual terms with each employee. We anticipate incurring approximately $5 million of additional restructuring and TVN acquisition- and integration-related expenses, under this plan in 2017. The estimated synergies from these restructuring activities and the TVN integration effort is anticipated to exceed $20 million on an annualized basis.
TVN VDP
In the second quarter of 2016, we initiated a consultative process with the works council for the TVN French Subsidiary and applicable union representatives to establish a voluntary departure plan to enable French employees of TVN to voluntarily terminate their employment with certain benefits. We finalized the consultation process and the terms of the voluntary departure plan in the third quarter of 2016. Following approval of the TVN VDP by the applicable French authorities in September 2016, employees were invited to apply for the voluntary termination benefits detailed in the TVN VDP. A total of 83 employees applied for the TVN VDP and were duly approved by us in the fourth quarter of 2016.
The total TVN VDP costs, including severance, certain benefits and taxes, as well as administration costs, is estimated to be approximately $15.3 million, in the aggregate, and will be paid over a period of four years, based on the TVN VDP terms agreed upon with each employee. The fair value of the total TVN VDP liability at inception is estimated to be approximately $14.8 million.
We account for these special termination benefits in accordance with ASC 712, “Compensation - Non-retirement Post-employment Benefits,” which requires that the special termination benefits be recognized as a liability and a loss beginning when an employee accepts the offer of voluntary termination and the amount can be reasonably estimated. Where an employee is required to work beyond a minimum statutory notice period, the cost of the special termination benefit is recognized as an expense over the employee’s remaining service period. Where the employee is not required to work beyond a minimum statutory notice period, the cost of the special termination benefit is recognized upon the date the employee accepts the offer of voluntary termination, provided that the amount of the benefit can be estimated. Out of the 83 employees who applied for the TVN VDP, 11 of them are required to work beyond the minimum statutory notice period into 2017. Based on the application of the accounting guidance, we recorded a charge of $13.1 million for TVN VDP costs in the fourth quarter of 2016, of which $3.5 million was already paid in 2016, resulting in a TVN VDP liability balance of $9.6 million at December 31, 2016.
Future TVN VDP payments, including severance, certain benefits and taxes, as well as administration costs, at December 31, 2016, are as follows (in thousands):
Years ending December 31, | |||
2017 | $ | 6,757 | |
2018 | 3,021 | ||
2019 | 1,492 | ||
2020 | 696 | ||
Total VDP payments | $ | 11,966 | |
Excess Facilities in San Jose, California
In January 2016, we exited an excess facility at our U.S. headquarters in San Jose, California and recorded $1.4 million in facility exit costs. We account for facility exit costs in accordance with ASC 420, “Exit or Disposal Cost Obligations”, which requires that a liability for such costs be recognized and measured initially at fair value on the cease-use date based on remaining lease rentals, adjusted for the effects of any prepaid or deferred items recognized, reduced by the estimated sublease
51
rentals that could be reasonably obtained even if it is not the intent to sublease. The fair value of these liabilities is based on a net present value model using a credit-adjusted risk-free rate. The liability will be paid out over the remainder of the leased properties’ terms, which continue through August 2020. Actual sublease terms may differ from the estimates originally made by us. Any future changes in the estimates or in the actual sublease income could require future adjustments to the liabilities, which would impact net income in the period the adjustment is recorded. As of the cease-use date, the fair value of this restructuring liability totaled $2.5 million. Offsetting these charges was an adjustment for deferred rent liability relating to this space of $1.1 million. In December 2016, as a result of a change in the estimate in sublease income, the restructuring liability was increased by $0.6 million.
Harmonic Prior Restructuring plans
The restructuring and related charges of $1.5 million in 2015 were under the Harmonic 2015 Restructuring Plan which primarily consisted of severance and benefits for the termination of 56 employees worldwide.
The restructuring and related charges of $3.1 million in 2014 consisted of $2.2 million and $0.9 million incurred under the Harmonic 2015 Restructuring Plan and Harmonic 2013 Restructuring Plan, respectively. The $3.1 million restructuring and related charges in 2014 consisted primarily of $1.5 million of severance and benefits related to 44 employees terminated worldwide, $1.1 million of fixed asset impairment charge related to software development costs incurred for a discontinued project, and $0.5 million of other charges.
See Note 11, “Restructuring and related Charges,” of the notes to our Consolidated Financial Statements for additional information on each restructuring plan.
Interest Income (Expense), Net
Interest income (expense), net was $(10.6) million, $(0.3) million and $0.1 million during 2016, 2015 and 2014, respectively. Interest expense increased in 2016 due to the additional interest expenses associated with the Notes issued in December 2015.
In December 2015, we issued $128.25 million aggregate principal amount of convertible senior notes due 2020 (“the Notes”) through a private placement with a financial institution. The Notes bear interest at 4.00% per annum, which is payable semiannually in arrears on June 1 and December 1 of each year, commencing June 1, 2016. In accordance with accounting guidance on embedded conversion features, we valued and bifurcated the conversion option associated with the Notes recording $26.9 million in stockholders’ equity. We incurred approximately $4.1 million of debt issuance costs in connection with the issuance of the Notes which we recorded as a deduction to the carrying amount of the Notes and $0.8 million of debt issuance costs was allocated to stockholders’ equity. The resulting net debt discount, difference between the principal amount of the Notes and the carrying value of the Notes, of $30.2 million is amortized to interest expenses at an effective interest rate of 9.94% over the contractual term of the Notes. In 2016, we recorded $5.1 million of coupon interest expense and $5.0 million of interest expenses related to the amortization of debt discount and debt issuance costs. In 2015, we recorded $240,000 of coupon interest expense and $216,000 of interest expenses related to the amortization of debt discount and debt issuance costs. (See Note 12, “Convertible Notes, Other Debts and Capital Leases,” of the notes to our Consolidated Financial Statements for additional information on the Notes).
Other Expense, Net
Other expense, net was $31,000, $0.3 million and $0.4 million during 2016, 2015 and 2014, respectively. Other expense, net is primarily comprised of foreign exchange gains and losses on cash, accounts receivable and intercompany balances denominated in currencies other than the functional currency of the reporting entity. Our foreign currency exposure is primarily driven by the fluctuations in the foreign currency exchanges rates of the Euro, British pound, Japanese yen and Israeli shekels. To mitigate the volatility related to fluctuations in the foreign exchange rates, we enter into various foreign currency forward contracts. See “Foreign Currency Exchange Risk” under Item 7A of this Annual Report on Form 10-K for additional information.
Loss on Impairment of Long-term Investment
In 2016, the stock price of Vislink, our equity investment which trades on the AIM exchange, continued to be below its cost basis for several months. Based on our assessment of the positive and negative factors of Vislink’s financial and business conditions, we believe that more-likely-than-not, Vislink’s stock price may not recover to its cost basis and, as a result, we recorded a total of $2.7 million impairment charges in 2016 reflecting a new reduced cost basis. Our remaining maximum exposure to loss from the Vislink investment at December 31, 2016 was limited to our reduced investment cost of $0.8 million.
52
In March 2015, we attended a VJU board meeting as an observer. At that meeting, we were made aware of significant decreases in VJU’s business prospects, VJU’S existing working capital and prospects for additional funding, compared to the prior information we had received from VJU. Based on our assessment, we determined that our investment in VJU was impaired on an other-than-temporary basis. As a result, we recorded an impairment charge of $2.5 million in 2015. Our impairment loss in VJU is limited to our initial cost of investment of $2.5 million as well as the $0.1 million of research and development cost expensed in September 2014.
See Note 5, “Investments in Other Equity Securities,” of the notes to our Consolidated Financial Statements for additional information.
Income Taxes
We reported the following operating results for each of the three years ended December 31, 2016, 2015 and 2014 (in thousands, except percentages):
Year ended December 31, | ||||||||
2016 | 2015 | 2014 | ||||||
Loss before income taxes | (80,430 | ) | (16,068 | ) | (21,795 | ) | ||
Provision for (benefit from) income taxes | (8,116 | ) | (407 | ) | 24,453 | |||
Effective income tax rate | 10 | % | 3 | % | (112 | )% | ||
Our effective tax rate generally differs from the U.S. federal statutory rate of 35% due to favorable tax rates associated with certain earnings from our operations in lower tax jurisdictions throughout the world. In addition, our effective tax rates vary in each period primarily due to specific one-time, discrete items that affected the tax rate in the respective period.
In 2016, our effective income tax rate of 10% differed from the U.S. federal statutory rate of 35% primarily due to our geographical income mix and our tax valuation allowance, favorable tax rates associated with certain earnings from operations in lower-tax jurisdictions, favorable resolutions of uncertain tax positions, and the tax benefit from the realization of certain deferred tax assets as a result of the TVN acquisition, partially offset by the increase in the valuation allowance against U.S. federal, California and other state deferred tax assets, detriment from non-deductible stock-based compensation, non-deductible amortization of foreign intangibles, and the net of various discrete tax adjustments.
In 2015, our effective income tax rate of 3% differed from the U.S. federal statutory rate of 35%, primarily due to a difference in foreign tax rates and our losses generated in the United States for the year received no tax benefit as a result of a full valuation allowance against all of our U.S. deferred tax assets, as well as adjustments relating to our 2014 U.S. federal tax return filed in September 2015 and a reversal of uncertain tax positions resulting from the expiration of statutes of limitations. In addition, the impairment of the VJU investment (see Note 5, “Investments in Other Equity Securities”) received no tax benefit.
In 2014, as a result of cumulated losses in the recent years and the analysis of all available positive and negative evidence, we recorded a full valuation allowance against the beginning of year U.S. net deferred tax assets of $34.0 million. In addition, in 2014, we carried back our 2013 federal net operating loss to 2011 resulting in a tax refund. Certain federal R&D credits were also freed up as a result and utilized to offset income tax reserves as a result of the adoption of ASU 2013-11. These two events reduced the valuation allowance by approximately $5.0 million and led to the net change of valuation allowance of $29.0 million. This unfavorable net impact was offset partially by a tax benefit of $9.0 million associated with the release of tax reserves including accrued interest and penalties, for our 2010 tax year in the United States, as a result of the expiration of the applicable statute of limitation for that year.
For a reconciliation of our effective tax rate to the U.S. federal statutory rate of 35% and further explanation of our provision for taxes, see Note 15, “Income Taxes,” of the notes to our Consolidated Financial Statements.
Liquidity and Capital Resources
As of December 31, 2016, our principal sources of liquidity consisted of cash and cash equivalents of $55.6 million, short-term investments of $6.9 million, net accounts receivable of $86.8 million and borrowings from the capital markets as well as financing from French government agencies. We assumed certain debts as a result of the TVN acquisition which were primarily related to long-term financing arrangements with French government agencies, and to a lesser extent, financing obtained from other financing institutions and the aggregate balance of these debts was $21.2 million at December 31, 2016. Our principal uses of cash will include repayments of debt and related interest, purchases of inventory, payroll, restructuring
53
expenses, TVN acquisition- and integration-related expenses and other operating expenses related to the development and marketing of our products, purchases of property and equipment and other contractual obligations for the foreseeable future. We believe that our cash and cash equivalents and short-term investments of $62.6 million at December 31, 2016 will be sufficient to fund our principal uses of cash for at least the next 12 months. However, if our expectations are incorrect, we may need to raise additional funds to fund our operations, to take advantage of unanticipated strategic opportunities or to strengthen our financial position. In the future, we may enter into other arrangements for potential investments in, or acquisitions of, complementary businesses, services or technologies, which could require us to seek additional equity or debt financing. Additional funds may not be available on terms favorable to us or at all.
As of December 31, 2016, $42.1 million of the cash and cash equivalents balance was held in our foreign subsidiaries. At present, such foreign funds are considered to be indefinitely reinvested in foreign countries to the extent of indefinitely reinvested foreign earnings. In the event funds from foreign operations, to the extent such funds are indefinitely reinvested foreign earnings, are needed to fund cash needs in the United States and if U.S. taxes have not already been previously accrued, we would be required to accrue and pay additional U.S. taxes in order to repatriate these funds.
In December 2015, we issued $128.25 million aggregate principal amount of the Notes. We incurred approximately $4.1 million of debt issuance cost, of which $3.5 million was paid in 2015 and the remainder was paid in the first quarter of 2016. The Notes bear interest at a fixed rate of 4.00% per year, payable semiannually in arrears on June 1 and December 1 of each year, beginning on June 1, 2016 and mature on December 1, 2020. Concurrent with the issuance of the Notes, we used $49.9 million of the net proceeds from the Notes to repurchase 11.1 million shares of our common stock. The remaining net proceeds from the Notes were used to fund our acquisition of TVN, which was completed on February 29, 2016. (See Note 3, “Business Acquisition,” of the notes to our Consolidated Financial Statements for additional information on TVN Acquisition).
On December 22, 2014, we entered into a Credit Agreement (the “Credit Agreement”) with JPMorgan Chase Bank, N.A. (“JPMorgan”) for a $20.0 million revolving credit facility, with a sublimit of $10.0 million for the issuance of commercial and standby letters of credit on our behalf. Revolving loans under the Credit Agreement may be borrowed, repaid and re-borrowed until December 22, 2015, at which time all amounts borrowed must be repaid. On December 7, 2015, we entered into a first amendment to the Credit Agreement with JPMorgan to permit us to incur the indebtedness related to issuance of the Notes. On December 15, 2015, we entered into a second amendment to the Credit Agreement with JPMorgan to extend the expiration date of the Credit Agreement to February 20, 2016. The credit agreement with JPMorgan expired on February 20, 2016 and we did not renew the agreement or enter into any new credit agreement.
The table below presents selected cash flow data for the periods presented (in thousands):
Year ended December 31, | |||||||||||
2016 | 2015 | 2014 | |||||||||
(In thousands) | |||||||||||
Net cash provided by operating activities | $ | 438 | $ | 6,351 | $ | 47,369 | |||||
Net cash (used in) provided by investing activities | (70,478 | ) | (10,414 | ) | 27,799 | ||||||
Net cash (used in) provided by financing activities | (152 | ) | 57,533 | (92,007 | ) | ||||||
Effect of exchange rate changes on cash and cash equivalents | (363 | ) | (312 | ) | (458 | ) | |||||
Net (decrease) increase in cash and cash equivalents | $ | (70,555 | ) | $ | 53,158 | $ | (17,297 | ) | |||
Operating Activities
Net cash provided by operating activities decreased $5.9 million in 2016 compared to 2015, primarily due to a $43.5 million increase in net loss, after adjustments for non-cash items, mainly attributable to a lower operating margin and the payment of TVN’s post-acquisition expenses and restructuring expenses. These decreases were offset in part by less cash used for net working capital needs, primarily attributable to an increase in deferred revenue due to the timing of customer renewals of their annual service and support contracts, and, to a lesser extent, less cash spent on the purchase of inventory due to the netting of an $8.5 million advance payment made in 2015 for inventories received in 2016.
Net cash provided by operating activities decreased $41.0 million in 2015 compared to 2014, primarily due to a $21.3 million increase in net loss, after adjustments for non-cash items, and more cash used in net working capital, including an advance payment of $8.5 million to an inventory supplier in 2015 in order to secure more favorable pricing from the supplier and this arrangement and advance payment was absent in 2014.
We expect that cash provided by operating activities may fluctuate in future periods as a result of a number of factors, including fluctuations in our operating results, shipment linearity, accounts receivable collections performance, inventory and supply chain management, income tax reserves adjustments, and the timing and amount of compensation and other payments.
54
Investing Activities
Net cash used in investing activities increased $60.1 million in 2016 compared to 2015, primarily due to the $75.7 million net cash paid for the TVN acquisition in 2016, offset in part by lower cash used for purchases of marketable investments. In 2016, no cash was used for the purchase of marketable investments, compared to $25.3 million used for purchases of marketable investments in 2015.
Net cash used in investing activities increased $38.2 million in 2015 compared to 2014, primarily due to lower proceeds from net sales of available-for-sale investments in 2015 as well as higher capital expenditures in 2015.
Financing Activities
Net cash provided by financing activities decreased $57.7 million in 2016 compared to 2015, primarily due to the net proceeds of $124.7 million from the sale and issuance of the Notes in December 2015, offset in part by $72.9 million cash used for share repurchases in 2015.
Net cash provided by financing activities increased $149.5 million in 2015 compared to 2014. The increase was primarily due to net proceeds of $124.7 million from the sale and issuance of the Notes in December 2015 as well as lower amount of cash used for share repurchases in 2015 and to a lesser extent, higher net proceeds from sale of shares through equity incentive plans during 2015. Cash used for share repurchases in 2015 was $72.9 million, consisting of $23.0 million under our regular common stock repurchase program and $49.9 million of the net proceeds from the issuance of the Notes.
Off-Balance Sheet Arrangements
None as of December 31, 2016.
Contractual Obligations and Commitments
Future payments under contractual obligations and other commercial commitments, as of December 31, 2016 are as follows (in thousands):
Payments due in each fiscal year | |||||||||||||||||||
Total Amounts Committed | 2017 | 2018 and 2019 | 2020 and 2021 | Thereafter | |||||||||||||||
Convertible debt | $ | 128,250 | $ | — | $ | — | $ | 128,250 | $ | — | |||||||||
Interest on convertible debt | 20,520 | 5,130 | 10,260 | 5,130 | — | ||||||||||||||
Other debts | 19,330 | 6,304 | 11,671 | 1,005 | 350 | ||||||||||||||
Capital Lease | 1,860 | 971 | 864 | 25 | |||||||||||||||
Operating leases (1) | 53,313 | 12,971 | 22,992 | 9,427 | 7,923 | ||||||||||||||
Purchase commitments (2) | 23,985 | 19,970 | 4,015 | — | — | ||||||||||||||
TVN VDP obligations (3) | 11,966 | 6,757 | 4,513 | 696 | — | ||||||||||||||
Total contractual obligations | $ | 259,224 | $ | 52,103 | $ | 54,315 | $ | 144,533 | $ | 8,273 | |||||||||
Other commercial commitments: | |||||||||||||||||||
Standby letters of credit | $ | 1,048 | $ | 1,018 | $ | 30 | $ | — | $ | — | |||||||||
Indemnification obligations (4) | — | — | — | — | — | ||||||||||||||
Total commercial commitments | $ | 1,048 | $ | 1,018 | $ | 30 | $ | — | $ | — | |||||||||
(1) We lease facilities under operating leases expiring through April 2027. Certain of these leases provide for renewal option for periods ranging from one to five years in the normal course of business and we may exercise the renewal option.
(2) During the normal course of business, in order to reduce manufacturing lead times and ensure adequate component supply, we enter into agreements with certain contract manufacturers and suppliers that allow them to procure inventory and services based upon criteria as defined by the Company.
(3) In 2016, we established the TVN VDP to enable the French employees of TVN to voluntarily terminate their employment with certain benefits. The TVN VDP was approved by the applicable French authorities in September 2016 and
55
we approved and accepted 83 employee applications. See Note 11, “Restructuring and Related Charges-TVN VDP,” of the notes to our Consolidated Financial Statements for additional information on TNV VDP.
(4) We indemnify our officers and the members of our Board pursuant to our bylaws and contractual indemnity agreements. We also indemnify some of our suppliers and most of our customers for specified intellectual property matters and some of our other vendors, such as building contractors, pursuant to certain parameters and restrictions. The scope of these indemnities varies, but, in some instances, includes indemnification for defense costs, damages and other expenses (including reasonable attorneys’ fees).
Due to the uncertainty with respect to the timing of future cash flows associated with our unrecognized tax benefits at December 31, 2016, we are unable to make reasonably reliable estimates of the period of cash settlement with the respective taxing authority. Therefore, approximately $2.9 million of unrecognized tax benefits classified as “Income taxes payable, long-term” in the accompanying Consolidated Balance Sheet as of December 31, 2016, had been excluded from the contractual obligations table above. See Note 15, “Income Taxes,” of the notes to our Consolidated Financial Statements for a discussion on income taxes.
New Accounting Pronouncements
See Note 2 of the accompanying Consolidated Financial Statements for a full description of recent accounting pronouncements, including the respective expected dates of adoption and effects on results of operations and financial condition.
Item 7A. | QUANTITATIVE AND QUALITATIVE DISCLOSURES ABOUT MARKET RISK. |
Foreign Currency Exchange Risk
We market and sell our products and services through our direct sales force and indirect channel partners in North America, EMEA, APAC and Latin America. Accordingly, we are subject to exposure from adverse movements in foreign currency exchange rates, primarily the Euro, British pound and Japanese yen. Our U.S. dollar functional subsidiaries, which account for approximately 90% of our consolidated net revenue, recorded net billings denominated in foreign currencies of approximately 13%, 12% and 10% of their net revenues in 2016, 2015 and 2014, respectively. In addition, a portion of our operating expenses, primarily the cost of personnel to deliver technical support on our products and professional services, sales and sales support and research and development, are denominated in foreign currencies, primarily the Israeli shekel.
As a result of the TVN acquisition, our international operations have become more significant. The functional currency of our foreign subsidiaries is generally the local currency, except for our subsidiaries in Israel and Switzerland where the functional currency is the U.S. dollar. Our primary foreign currency translation exposure is related to the magnitude of foreign net profits and losses denominated in foreign currencies, in particular the Euro. However, as a result of our TVN integration plans initiated in 2016, we estimated that upon completing the TVN integration plans in 2017, our foreign currency translation risk would be significantly reduced. A 10% change in the Euro to U.S. dollar exchange applied to the results of our foreign subsidiaries that have the Euro as their functional currency would not have a material impact to our consolidated net profit and losses.
We use derivative instruments, primarily forward contracts, to manage exposures to foreign currency exchange rates and we do not enter into foreign currency forward contracts for trading purposes.
Derivatives Designated as Hedging Instruments (Cash Flow Hedges)
Beginning December 2014, we entered into forward currency contracts to hedge forecasted operating expenses and service cost related to employee salaries and benefits denominated in Israeli shekels (“ILS”) for our subsidiaries in Israel. These ILS forward contacts mature generally within 12 months and are designated as cash flow hedges. The effective portion of the gains or losses on the derivative is reported as a component of “Accumulated other comprehensive income (loss)” (“AOCI”) in the Consolidated Balance Sheet and subsequently reclassified into earnings in the same period during which the hedged transactions are recognized in earnings. If the hedge program becomes ineffective or if the underlying forecasted transaction does not occur for any reason, or it becomes probable that it will not occur, the gain or loss on the related derivative will be reclassified from AOCI to earnings immediately.
Derivatives Not Designated as Hedging Instruments (Balance Sheet Hedges)
56
We also enter into forward currency contracts to hedge foreign currency denominated monetary assets and liabilities. These derivative instruments are marked to market through earnings every period and mature generally within three months. Changes in the fair value of these foreign currency forward contracts are recognized in “Other expense, net” in the Consolidated Statement of Operations, and are largely offset by the changes in the fair value of the assets or liabilities being hedged.
The U.S. dollar equivalent of all outstanding notional amounts of foreign currency forward contracts are summarized as follows (in thousands):
December 31, | ||||||||
2016 | 2015 | |||||||
Derivatives designated as cash flow hedges: | ||||||||
Purchase | $ | — | $ | 12,984 | ||||
Derivatives not designated as hedging instruments: | ||||||||
Purchase | $ | 4,056 | $ | 6,942 | ||||
Sell | $ | 11,157 | $ | 11,332 | ||||
Interest Rate Risk
Our exposure to market risk for changes in interest rates relates primarily to our investment portfolio of marketable investment securities and outstanding debt arrangements with variable rate interests.
As of December 31, 2016, our cash, cash equivalents and short-term investments balance was $62.6 million. These amounts are held for working capital purposes and we do not hold derivative instruments in our investment portfolio. Our investment portfolio consists of fixed income securities that are classified as “available-for-sale securities.” These securities, like all fixed income instruments, are subject to interest rate risk and will change in value if market interest rates change. We attempt to limit this exposure by investing primarily in short-term and investment-grade instruments with original maturities of less than two years. Due to the short duration and conservative nature of our investment portfolio, a movement of 10% in market interest rates would not have a material impact on our operating results, nor the total value of the portfolio over the next fiscal year. If overall interest rates had decreased by 10% during the fourth quarter of 2016, our interest income on our cash, cash equivalents and short-term investments would have declined by less than $0.1 million, on an annualized basis, assuming a constant investment balance over the time period.
As a result of the TVN acquisition, we assumed various debt instruments. The aggregate debt balance of such instruments at December 31, 2016 was $21.2 million, of which $1.9 million relates to obligations under capital leases with fixed interest rates. The remaining $19.3 million are debt instruments primarily financed by French government agencies, and, to a lesser extent, term loans from other financing institutions. These debt instruments have maturities ranging from three to eight years; expiring from 2017 through 2023. A majority of the loans are tied to the 1 month EURIBOR rate plus spread. (See Note 12, “Convertible notes, Other Debts and Capital Leases,” of the notes to our Consolidated Balance Sheets for additional information). As of December 31, 2016, a hypothetical 1.0% increase in market interest rates on our debts subject to variable interest rate fluctuations would increase our interest expense by approximately $0.3 million annually.
As of December 31, 2016, we had $128.25 million aggregate principal amount of the Notes outstanding, which have a fixed 4.0% coupon rate.
57
Item 8. | FINANCIAL STATEMENTS AND SUPPLEMENTARY DATA |
Index to Consolidated Financial Statements
Page | |
58
REPORT OF INDEPENDENT REGISTERED PUBLIC ACCOUNTING FIRM
To the Board of Directors and Stockholders of Harmonic Inc.:
In our opinion, the accompanying Consolidated Balance Sheets and the related Consolidated Statements of Operations, Consolidated Statements of Comprehensive Loss, Consolidated Statements of Stockholders’ Equity, and Consolidated Statements of Cash Flows present fairly, in all material respects, the financial position of Harmonic Inc. and its subsidiaries at December 31, 2016 and December 31, 2015, and the results of their operations and their cash flows for each of the three years in the period ended December 31, 2016 in conformity with accounting principles generally accepted in the United States of America. Also in our opinion, the Company maintained, in all material respects, effective internal control over financial reporting as of December 31, 2016, based on criteria established in Internal Control — Integrated Framework (2013) issued by the Committee of Sponsoring Organizations of the Treadway Commission (COSO). The Company’s management is responsible for these financial statements, for maintaining effective internal control over financial reporting and for its assessment of the effectiveness of internal control over financial reporting, included in Management’s Report on Internal Control over Financial Reporting appearing under Item 9A. Our responsibility is to express opinions on these financial statements and on the Company’s internal control over financial reporting based on our integrated audits. We conducted our audits in accordance with the standards of the Public Company Accounting Oversight Board (United States). Those standards require that we plan and perform the audits to obtain reasonable assurance about whether the financial statements are free of material misstatement and whether effective internal control over financial reporting was maintained in all material respects. Our audits of the financial statements included examining, on a test basis, evidence supporting the amounts and disclosures in the financial statements, assessing the accounting principles used and significant estimates made by management, and evaluating the overall financial statement presentation. Our audit of internal control over financial reporting included obtaining an understanding of internal control over financial reporting, assessing the risk that a material weakness exists, and testing and evaluating the design and operating effectiveness of internal control based on the assessed risk. Our audits also included performing such other procedures as we considered necessary in the circumstances. We believe that our audits provide a reasonable basis for our opinions.
A company’s internal control over financial reporting is a process designed to provide reasonable assurance regarding the reliability of financial reporting and the preparation of financial statements for external purposes in accordance with generally accepted accounting principles. A company’s internal control over financial reporting includes those policies and procedures that (i) pertain to the maintenance of records that, in reasonable detail, accurately and fairly reflect the transactions and dispositions of the assets of the company; (ii) provide reasonable assurance that transactions are recorded as necessary to permit preparation of financial statements in accordance with generally accepted accounting principles, and that receipts and expenditures of the company are being made only in accordance with authorizations of management and directors of the company; and (iii) provide reasonable assurance regarding prevention or timely detection of unauthorized acquisition, use, or disposition of the company’s assets that could have a material effect on the financial statements.
Because of its inherent limitations, internal control over financial reporting may not prevent or detect misstatements. Also, projections of any evaluation of effectiveness to future periods are subject to the risk that controls may become inadequate because of changes in conditions, or that the degree of compliance with the policies or procedures may deteriorate.
As described in Management’s Report on Internal Control over Financial Reporting, appearing under Item 9A, management has excluded certain Thomson Video Networks entities from its assessment of internal control over financial reporting as of December 31, 2016 because they were acquired by the Company in a purchase business combination during 2016 and have not been integrated into the Company’s overall internal control over financial reporting process. We have also excluded these entities from our audit of internal control over financial reporting. The total assets of these entities are 20% and total revenues represent 12% of the related consolidated financial statement amounts as of and for the year ended December 31, 2016.
/S/ PRICEWATERHOUSECOOPERS LLP |
PRICEWATERHOUSECOOPERS LLP |
San Jose, California
March 3, 2017
59
HARMONIC INC.
CONSOLIDATED BALANCE SHEETS
(In thousands, except per share data)
December 31, | |||||||
2016 | 2015 | ||||||
ASSETS | |||||||
Current assets: | |||||||
Cash and cash equivalents | $ | 55,635 | $ | 126,190 | |||
Short-term investments | 6,923 | 26,604 | |||||
Accounts receivable, net | 86,765 | 69,515 | |||||
Inventories | 41,193 | 38,819 | |||||
Prepaid expenses and other current assets | 26,319 | 25,003 | |||||
Total current assets | 216,835 | 286,131 | |||||
Property and equipment, net | 32,164 | 27,012 | |||||
Goodwill | 237,279 | 197,781 | |||||
Intangibles, net | 29,231 | 4,097 | |||||
Other long-term assets | 38,560 | 9,936 | |||||
Total assets | $ | 554,069 | $ | 524,957 | |||
LIABILITIES AND STOCKHOLDERS’ EQUITY | |||||||
Current liabilities: | |||||||
Other debts and capital lease obligations, current | $ | 7,275 | $ | — | |||
Accounts payable | 28,892 | 19,364 | |||||
Income taxes payable | 1,166 | 307 | |||||
Deferred revenue | 52,414 | 33,856 | |||||
Accrued and other current liabilities | 55,150 | 31,354 | |||||
Total current liabilities | 144,897 | 84,881 | |||||
Convertible notes, long-term | 103,259 | 98,295 | |||||
Other debts and capital lease obligations, long-term | 13,915 | — | |||||
Income taxes payable, long-term | 2,926 | 3,886 | |||||
Other non-current liabilities | 18,431 | 9,727 | |||||
Total liabilities | 283,428 | 196,789 | |||||
Commitments and contingencies (Note 19) | |||||||
Stockholders’ equity: | |||||||
Preferred stock, $0.001 par value, 5,000 shares authorized; no shares issued or outstanding | — | — | |||||
Common stock, $0.001 par value, 150,000 shares authorized; 78,456 and 76,015 shares issued and outstanding at December 31, 2016 and 2015, respectively | 78 | 76 | |||||
Additional paid-in capital | 2,254,055 | 2,236,418 | |||||
Accumulated deficit | (1,976,222 | ) | (1,903,908 | ) | |||
Accumulated other comprehensive loss | (7,270 | ) | (4,418 | ) | |||
Total stockholders’ equity | 270,641 | 328,168 | |||||
Total liabilities and stockholders’ equity | $ | 554,069 | $ | 524,957 | |||
The accompanying notes are an integral part of these consolidated financial statements.
60
HARMONIC INC.
CONSOLIDATED STATEMENTS OF OPERATIONS
(In thousands, except per share data)
Year ended December 31, | |||||||||||
2016 | 2015 | 2014 | |||||||||
Revenue: | |||||||||||
Product | $ | 285,260 | $ | 276,876 | $ | 343,186 | |||||
Service | 120,651 | 100,151 | 90,371 | ||||||||
Total net revenue | 405,911 | 377,027 | 433,557 | ||||||||
Cost of revenue: | |||||||||||
Product | 145,714 | 121,988 | 172,280 | ||||||||
Service | 59,447 | 52,327 | 48,929 | ||||||||
Total cost of revenue | 205,161 | 174,315 | 221,209 | ||||||||
Total gross profit | 200,750 | 202,712 | 212,348 | ||||||||
Operating expenses: | |||||||||||
Research and development | 98,401 | 87,545 | 93,061 | ||||||||
Selling, general and administrative | 144,381 | 120,960 | 131,322 | ||||||||
Amortization of intangibles | 10,402 | 5,783 | 6,775 | ||||||||
Restructuring and related charges | 14,602 | 1,372 | 2,761 | ||||||||
Total operating expenses | 267,786 | 215,660 | 233,919 | ||||||||
Loss from operations | (67,036 | ) | (12,948 | ) | (21,571 | ) | |||||
Interest (expense) income, net | (10,628 | ) | (333 | ) | 132 | ||||||
Other expense, net | (31 | ) | (282 | ) | (356 | ) | |||||
Loss on impairment of long-term investment | (2,735 | ) | (2,505 | ) | — | ||||||
Loss before income taxes | (80,430 | ) | (16,068 | ) | (21,795 | ) | |||||
Provision for (benefit from) income taxes | (8,116 | ) | (407 | ) | 24,453 | ||||||
Net loss | $ | (72,314 | ) | $ | (15,661 | ) | $ | (46,248 | ) | ||
Net loss per share: | |||||||||||
Basic and diluted | $ | (0.93 | ) | $ | (0.18 | ) | $ | (0.50 | ) | ||
Shares used in per share calculations: | |||||||||||
Basic and diluted | 77,705 | 87,514 | 92,508 | ||||||||
The accompanying notes are an integral part of these consolidated financial statements.
61
HARMONIC INC.
CONSOLIDATED STATEMENTS OF COMPREHENSIVE LOSS
(In thousands)
Year ended December 31, | |||||||||||
2016 | 2015 | 2014 | |||||||||
Net loss | $ | (72,314 | ) | $ | (15,661 | ) | $ | (46,248 | ) | ||
Other comprehensive income (loss), before tax: | |||||||||||
Change in unrealized gains (losses) on cash flow hedges: | |||||||||||
Unrealized gains (losses), net arising during the period | 202 | (133 | ) | 311 | |||||||
Losses (gains) reclassified into earnings | 44 | (424 | ) | — | |||||||
246 | (557 | ) | 311 | ||||||||
Change in unrealized gains (losses) on available-for-sale securities: | |||||||||||
Unrealized losses, net arising during the period | (903 | ) | (785 | ) | (815 | ) | |||||
Losses reclassified into earnings | 2,735 | — | — | ||||||||
1,832 | (785 | ) | (815 | ) | |||||||
Adjustment to pension benefit plan | (279 | ) | — | — | |||||||
Change in foreign currency translation adjustments | (4,633 | ) | (1,111 | ) | (1,281 | ) | |||||
Other comprehensive loss before tax | (2,834 | ) | (2,453 | ) | (1,785 | ) | |||||
Provision for (benefit from) income taxes | 18 | (15 | ) | (14 | ) | ||||||
Other comprehensive loss, net of tax | (2,852 | ) | (2,438 | ) | (1,771 | ) | |||||
Total comprehensive loss | $ | (75,166 | ) | $ | (18,099 | ) | $ | (48,019 | ) | ||
The accompanying notes are an integral part of these consolidated financial statements.
62
HARMONIC INC.
CONSOLIDATED STATEMENTS OF STOCKHOLDERS’ EQUITY
(In thousands)
Common Stock | Additional Paid-in Capital | Accumulated Deficit | Accumulated Other Comprehensive Loss | Total Stockholders’ Equity | ||||||||||||||||||
Shares | Amount | |||||||||||||||||||||
Balance at December 31, 2013 | 99,413 | $ | 99 | $ | 2,336,275 | $ | (1,841,999 | ) | $ | (209 | ) | $ | 494,166 | |||||||||
Net loss | — | — | — | (46,248 | ) | — | (46,248 | ) | ||||||||||||||
Other comprehensive loss, net of tax | — | — | — | — | (1,771 | ) | (1,771 | ) | ||||||||||||||
Issuance of common stock under option, stock award and purchase plans | 2,181 | 2 | 1,104 | — | — | 1,106 | ||||||||||||||||
Repurchase of common stock | (13,894 | ) | (13 | ) | (93,115 | ) | — | — | (93,128 | ) | ||||||||||||
Stock-based compensation | — | — | 17,287 | — | — | 17,287 | ||||||||||||||||
Excess tax benefits from stock-based compensation | — | — | 401 | — | — | 401 | ||||||||||||||||
Balance at December 31, 2014 | 87,700 | 88 | 2,261,952 | (1,888,247 | ) | (1,980 | ) | 371,813 | ||||||||||||||
Net loss | — | — | — | (15,661 | ) | — | (15,661 | ) | ||||||||||||||
Other comprehensive loss, net of tax | — | — | — | — | (2,438 | ) | (2,438 | ) | ||||||||||||||
Issuance of common stock under option, stock award and purchase plans | 2,855 | 3 | 5,670 | — | — | 5,673 | ||||||||||||||||
Repurchase of common stock | (14,540 | ) | (15 | ) | (72,848 | ) | — | — | (72,863 | ) | ||||||||||||
Stock-based compensation | — | — | 15,582 | — | — | 15,582 | ||||||||||||||||
Conversion feature of convertible notes due 2020 | — | — | 26,062 | — | — | 26,062 | ||||||||||||||||
Balance at December 31, 2015 | 76,015 | 76 | 2,236,418 | (1,903,908 | ) | (4,418 | ) | 328,168 | ||||||||||||||
Net loss | — | — | — | (72,314 | ) | — | (72,314 | ) | ||||||||||||||
Other comprehensive loss, net of tax | — | — | — | — | (2,852 | ) | (2,852 | ) | ||||||||||||||
Issuance of common stock under option, stock award and purchase plans | 2,441 | 2 | 2,798 | — | — | 2,800 | ||||||||||||||||
Stock-based compensation | — | — | 13,242 | — | — | 13,242 | ||||||||||||||||
Issuance of warrant | — | — | 1,597 | — | — | 1,597 | ||||||||||||||||
Balance at December 31, 2016 | 78,456 | $ | 78 | $ | 2,254,055 | $ | (1,976,222 | ) | $ | (7,270 | ) | $ | 270,641 | |||||||||
The accompanying notes are an integral part of these consolidated financial statements.
63
HARMONIC INC.
CONSOLIDATED STATEMENTS OF CASH FLOWS
(In thousands)
Year ended December 31, | |||||||||||
2016 | 2015 | 2014 | |||||||||
Cash flows from operating activities: | |||||||||||
Net loss | $ | (72,314 | ) | $ | (15,661 | ) | $ | (46,248 | ) | ||
Adjustments to reconcile net loss to net cash provided by operating activities: | |||||||||||
Amortization of intangibles | 14,836 | 6,502 | 20,520 | ||||||||
Depreciation | 18,819 | 13,241 | 16,459 | ||||||||
Stock-based compensation | 13,060 | 15,582 | 17,287 | ||||||||
Amortization of discount on convertible debt | 4,964 | 216 | — | ||||||||
Provision for non-cash warrant | 434 | — | — | ||||||||
Restructuring, asset impairment and (gain) loss on retirement of fixed assets | 2,305 | 641 | 1,622 | ||||||||
Loss on impairment of long-term investment | 2,735 | 2,505 | — | ||||||||
Gain on pension curtailment | (1,955 | ) | — | — | |||||||
Deferred income taxes, net | (10,085 | ) | (512 | ) | 32,163 | ||||||
Provision for doubtful accounts, returns and discounts | 2,589 | 2,034 | 1,943 | ||||||||
Provision for excess and obsolete inventories | 6,871 | 1,585 | 2,569 | ||||||||
Excess tax benefits from stock-based compensation | — | — | (15 | ) | |||||||
Other non-cash adjustments, net | 408 | — | 1,108 | ||||||||
Changes in operating assets and liabilities, net of effects of acquisition: | |||||||||||
Accounts receivable | (2,563 | ) | 2,595 | (1,035 | ) | ||||||
Inventories | (4,107 | ) | (5,954 | ) | 1,610 | ||||||
Prepaid expenses and other assets | (1,892 | ) | (8,206 | ) | (3,332 | ) | |||||
Accounts payable | 5,793 | 4,683 | 56 | ||||||||
Deferred revenues | 18,106 | (4,541 | ) | 11,162 | |||||||
Income taxes payable | (133 | ) | (1,637 | ) | (7,094 | ) | |||||
Accrued and other liabilities | 2,567 | (6,722 | ) | (1,406 | ) | ||||||
Net cash provided by operating activities | 438 | 6,351 | 47,369 | ||||||||
Cash flows from investing activities: | |||||||||||
Acquisition of business, net of cash acquired | (75,669 | ) | — | — | |||||||
Purchases of investments | — | (25,261 | ) | (26,599 | ) | ||||||
Proceeds from maturities of investments | 19,707 | 30,379 | 60,811 | ||||||||
Proceeds from sales of investments | — | — | 13,045 | ||||||||
Purchases of property and equipment | (15,107 | ) | (14,356 | ) | (10,065 | ) | |||||
Purchases of long-term investments | — | (85 | ) | (9,393 | ) | ||||||
Restricted cash | 591 | (1,091 | ) | — | |||||||
Net cash (used in) provided by investing activities | (70,478 | ) | (10,414 | ) | 27,799 | ||||||
Cash flows from financing activities: | |||||||||||
Proceeds from convertible debt | — | 128,250 | — | ||||||||
Payment of convertible debt issuance cost | (582 | ) | (3,527 | ) | — | ||||||
Proceeds from other debts and capital leases | 5,968 | — | — | ||||||||
Repayment of other debts and capital leases | (8,338 | ) | — | — | |||||||
Proceeds from common stock issued to employees | 4,444 | 9,222 | 4,742 | ||||||||
Payment of tax withholding obligations related to net share settlements of restricted stock units | (1,644 | ) | (3,549 | ) | (3,636 | ) | |||||
Payments for repurchases of common stock | — | (72,863 | ) | (93,128 | ) | ||||||
Excess tax benefits from stock-based compensation | — | — | 15 | ||||||||
Net cash (used in) provided by financing activities | (152 | ) | 57,533 | (92,007 | ) | ||||||
Effect of exchange rate changes on cash and cash equivalents | (363 | ) | (312 | ) | (458 | ) | |||||
Net (decrease) increase in cash and cash equivalents | (70,555 | ) | 53,158 | (17,297 | ) | ||||||
Cash and cash equivalents at beginning of period | 126,190 | 73,032 | 90,329 | ||||||||
Cash and cash equivalents at end of period | $ | 55,635 | $ | 126,190 | $ | 73,032 | |||||
Supplemental disclosures of cash flow information: | |||||||||||
Income tax payments (refunds), net | $ | (54 | ) | $ | 952 | $ | 1,926 | ||||
Interest payments, net | 5,275 | — | — | ||||||||
Supplemental schedule of non-cash investing and financing activities: | |||||||||||
Capital expenditures incurred but not yet paid | $ | 394 | $ | 235 | $ | 854 | |||||
Debt issuance costs incurred but not yet paid | — | 582 | — | ||||||||
The accompanying notes are an integral part of these consolidated financial statements.
64
HARMONIC INC.
NOTES TO CONSOLIDATED FINANCIAL STATEMENTS
NOTE 1: DESCRIPTION OF BUSINESS
Harmonic Inc. (“Harmonic” or the “Company”) designs, manufactures and sells versatile and high performance video infrastructure products and system solutions that enable its customers to efficiently create, prepare and deliver a full range of video services to televisions and other devices, such as personal computers, laptops, tablets and smart phones. Our products generally fall into three principal categories: video production platforms and playout solutions, video processing solutions and cable edge solutions. Harmonic also provides technical support and professional services to its customers worldwide. We sell our products and services to cable operators, broadcast and media companies, satellite and telecommunications (telco) Pay-TV service providers and streaming new media companies.
NOTE 2: SUMMARY OF SIGNIFICANT ACCOUNTING POLICIES
Basis of Presentation
The accompanying consolidated financial statements of Harmonic include the accounts of the Company and its wholly-owned subsidiaries. All significant intercompany accounts and transactions have been eliminated in consolidation. The Company’s fiscal quarters are based on 13-week periods, except for the fourth quarter which ends on December 31.
Use of Estimates
The preparation of consolidated financial statements in conformity with generally accepted accounting principles in the United States of America requires management to make estimates and assumptions that affect the reported amounts of assets and liabilities and disclosure of contingent assets and liabilities at the date of the consolidated financial statements and the reported amounts of revenues and expenses during the reporting period. Actual results could differ from those estimates.
Reclassifications / Out-of-Period Adjustments
Starting in the second quarter of 2015, in lieu of presenting the amortization of investment premium as a positive adjustment in the reconciliation of net income to operating cash flows, the entire cash flow, including premium is now reflected as an investing outflow, akin to a return of capital. The Company adopted this new classification method on a prospective basis starting 2015 because the new classification method does not have a material impact to the Company’s Consolidated Statements of Cash Flow for all prior periods effected.
Cash and Cash Equivalents
Cash and cash equivalents include all cash and highly liquid investments with maturities of three months or less at the date of purchase. The carrying amount of cash and cash equivalents approximates fair value because of the short maturity of those instruments.
Restricted Cash and Deposits
As of December 31, 2016, the Company had $1.8 million of total restricted cash. $0.7 million of the restricted cash balances are held as cash collateral security for certain bank guarantees and is included in “Prepaid expenses and other current assets”. The remaining $1.1 million is for the bank guarantee associated with the TVN French Subsidiary’s office building lease and is included in “Other Long-term Assets” in the Company’s Consolidated Balance Sheet. These restricted funds are invested in bank deposits and cannot be withdrawn from the Company’s accounts without the prior written consent of the applicable secured party.
Short-Term Investments
The Company’s short-term investments, which are classified as available-for-sale securities, comprised primarily of corporate bonds with stated maturities greater than three months from the date of purchase. The Company may or may not hold these securities until maturity because after considering the Company’s liquidity requirements, the Company may sell these securities prior to their stated maturities. Since these securities are considered as available to support current operations, the Company classifies securities with maturities beyond 12 months as current assets under short-term investments in the Consolidated Balance Sheets.
Short-term investments are stated at fair value, with unrealized gains and losses reported in accumulated other comprehensive loss in the Consolidated Balance Sheet. The specific identification method is used to determine the cost of
65
securities disposed of, with realized gains and losses reflected in other expense, net in the Company’s Consolidated Statements of Operations. The Company monitors its investment portfolio for impairment on a periodic basis. In the event a decline in value is determined to be other than temporary, an impairment charge is recorded. The Company considers current market conditions, as well as the likelihood that it would need to sell its investments prior to a recovery of par value, when determining if a loss is other than temporary.
Investments in Equity Securities
From time to time, the Company may acquire certain equity investments for the promotion of business and strategic objectives and these investments may be in marketable equity securities or non-marketable equity securities. The Company accounts for its investments in entities that it does not have significant influence under the cost method. Investments in equity securities are carried at fair value if the fair value of the security is readily determinable. Equity investments carried at fair value are classified as long-term investments and included in “Other long-term assets” in the Company’s Consolidated Balance Sheet. Unrealized gains and losses, net of taxes, on the long-term investments are included in the Company’s Consolidated Balance Sheet as a component of accumulated other comprehensive loss. Investments in equity securities that do not qualify for fair value accounting or equity method accounting are accounted for under the cost method. In accordance with the cost method, the Company’s initial investment is recorded at cost and the Company reviews all of its cost method investments quarterly to determine if impairment indicators exist. Cost method investments are classified as long-term investments and included in “Other long-term assets” in the Company’s Consolidated Balance Sheet.
Variable Interest Entities
From time to time, the Company may enter into investments in entities that are considered variable interest entities under Accounting Standards Codification (ASC) Topic 810. If the Company is the primary beneficiary of a variable interest entity (“VIE”), it is required to consolidate it. To determine if the Company is the primary beneficiary of a VIE, the Company evaluates whether it has (1) the power to direct the activities that most significantly impact the VIE’s economic performance, and (2) the obligation to absorb losses or the right to receive benefits from the VIE that could potentially be significant to the VIE. The assessment of whether the Company is the primary beneficiary of its VIE requires significant assumptions and judgments. The Company has concluded that none of the Company’s equity investments require consolidation as they are either not variable interest entities or, of the equity investments that are variable interest entities, the Company is not considered to be the primary beneficiary based on an assessment performed by management.
Concentrations of Credit Risk/Major Customers/Supplier Concentration
Financial instruments which subject the Company to concentrations of credit risk consist primarily of cash, cash equivalents, short-term investments and accounts receivable. Cash, cash equivalents and short-term investments are invested in short-term, highly liquid, investment-grade obligations of commercial or governmental issuers, in accordance with the Company’s investment policy. The investment policy limits the amount of credit exposure to any one financial institution, commercial or governmental issuer. The Company’s accounts receivable are derived from sales to cable, satellite, telco, and broadcast and media companies. The Company generally does not require collateral from its customers, and performs ongoing credit evaluations of its customers and provides for expected losses. The Company maintains an allowance for doubtful accounts based upon the expected collectability of its accounts receivable. No customers had a balance greater than 10% of the Company’s net accounts receivable balance as of December 31, 2016 and 2015. In the year ended December 31, 2016, no customer accounted for more than 10% of our net revenue. In the years ended December 31, 2015 and 2014, sales to Comcast accounted for 12% and 16% of the Company’s net revenue, respectively, and no other single customer accounts for more than 10% of total net revenue.
Certain of the components and subassemblies included in the Company’s products are obtained from a single source or a limited group of suppliers. Although the Company seeks to reduce dependence on those sole source and limited source suppliers, the partial or complete loss of certain of these sources could have at least a temporary adverse effect on the Company’s results of operations and damage customer relationships.
Revenue Recognition
The Company’s principal sources of revenue are from the sale of hardware, software, hardware and software maintenance contracts, and end-to-end solutions, encompassing design, manufacture, test, integration and installation of products. The Company recognizes revenue when persuasive evidence of an arrangement exists, delivery has occurred or services have been provided, the sale price is fixed or determinable, and collectability is reasonably assured.
66
Revenue from the sale of hardware and software products is recognized when risk of loss and title have transferred. For most of the Company’s product sales, these criteria are met at the time the product is shipped or delivery has occurred. Revenue from distributors and system integrators is recognized on delivery of the related products, provided all other revenue recognition criteria have been met. The Company’s agreements with these distributors and system integrators have terms which are generally consistent with the standard terms and conditions for the sale of the Company’s equipment to end users, and do not provide for product rotation or pricing allowances, as are typically found in agreements with stocking distributors. The Company accrues for sales returns and other allowances based on probable customer returns.
Deferred revenue includes billings in excess of revenue recognized, net of deferred cost of revenue, and invoiced amounts remain deferred until applicable revenue recognition criteria are met.
Shipping and handling costs incurred for inventory purchases and product shipments are recorded in cost of revenue in the Company’s Consolidated Statements of Operations. Costs associated with services are generally recognized as incurred.
The Company recognizes revenue from the sale of hardware products and software bundled with hardware that is essential to the functionality of the hardware in accordance with applicable revenue recognition accounting guidance. For the sale of stand-alone software products, bundled with hardware but not essential to the functionality of the hardware, revenue is allocated between the hardware, including essential software and related elements, and the non-essential software and related elements. Revenue for the hardware and essential software elements are recognized under the relative allocation method. Revenue for the non-essential software and related elements are recognized under the residual method in accordance with software accounting guidance. Revenue associated with service and maintenance agreements is recognized on a straight-line basis over the period in which the services are performed, generally one year. The Company recognizes revenue associated with solution sales using the percentage of completion or completed contract methods of accounting. Further details of these accounting policies are described below.
Multiple Element Arrangements. The Company has revenue arrangements that include hardware and software essential to the hardware product’s functionality, and non-essential software, services and support. The Company allocates revenue to all deliverables based on their relative selling prices. The Company determines the relative selling prices by first considering vendor-specific objective evidence of fair value (“VSOE”), if it exists; otherwise third-party evidence (“TPE”) of the selling price is used. If neither VSOE nor TPE exists for a deliverable, the Company uses a best estimate of the selling price (“BESP”) for that deliverable. Once revenue is allocated to all deliverables based on their relative selling prices, revenue related to hardware elements (hardware, essential software and related services) are recognized using a relative selling price allocation and non-essential software and related services are recognized under the residual method.
The Company has established VSOE for certain elements of its arrangements based on either historical stand-alone sales to third parties or stated renewal rates for maintenance. The Company has VSOE of fair value for maintenance, training and certain professional services.
TPE is determined based on competitor prices for similar deliverables when sold separately. The Company is typically not able to determine TPE for competitors’ products or services. Generally, the Company’s go-to-market strategy differs from that of its competitors’ and the Company’s offerings contain a significant level of differentiation, such that the comparable pricing of products with similar functionality cannot be obtained. Furthermore, the Company is unable to reliably determine what competitor similar products’ selling prices are on a stand-alone basis.
When the Company is unable to establish fair value of non-software deliverables using VSOE or TPE, the Company uses BESP in its allocation of arrangement consideration. The objective of using BESP is to determine the price at which the Company would transact a sale if the product or service were sold on a stand-alone basis. The Company determines BESP for a product or service by considering multiple factors, including, but not limited to, pricing practices, market conditions, competitive landscape, internal costs, geographies and gross margin. The determination of BESP is made through consultation with Company’s management, taking into consideration the Company’s go-to-market strategy.
Software. Sales of stand-alone software that are not considered essential to the functionality of the hardware continue to be subject to the software revenue recognition guidance.
In accordance with the software revenue recognition guidance, the Company applies the residual method to recognize revenue for the delivered elements in stand-alone software transactions. Under the residual method, the amount of revenue allocated to delivered elements equals the total arrangement consideration, less the aggregate fair value of any undelivered elements, typically maintenance, provided that VSOE of fair value exists for all undelivered elements. VSOE of fair value is based on the price charged when the element is sold separately or, in the case of maintenance, substantive renewal rates for maintenance.
67
Solution Sales. Solution sales for the design, manufacture, test, integration and installation of products, including equipment acquired from third parties to be integrated with Harmonic’s products, that are customized to meet the customer’s specifications are accounted for in accordance with applicable guidance on accounting for performance of construction/production contracts. Accordingly, for each arrangement that the Company enters into that includes both products and services, the Company performs a detailed evaluation to determine whether the arrangement should be accounted for under guidance for construction/production contracts or, alternatively, for arrangements that do not involve significant production, modification or customization, under other applicable accounting guidance. The Company has a long-standing history of entering into contractual arrangements to deliver the solution sales described.
For contracts that include customized services for which labor costs are not reasonably estimable, the Company uses the completed contract method of accounting. Under the completed contract method, 100% of the contract’s revenue and cost is recognized upon the completion of all services under the contract. If the estimated costs to complete a project exceed the total contract amount, indicating a loss, the entire anticipated loss is recognized.
Inventories
Inventories are stated at the lower of cost or market. Cost is computed using standard cost, which approximates actual cost, on a first-in, first-out basis. The cost of inventories is comprised of material, labor and manufacturing overhead. The Company’s manufacturing overhead standards for product costs are calculated assuming full absorption of forecasted spending over projected volumes. The Company establishes provisions for excess and obsolete inventories to reduce such inventories to their estimated net realizable value after evaluation of historical sales, future demand and market conditions, expected product life cycles and current inventory levels. Such provisions are charged to cost of revenue in the Company’s Consolidated Statements of Operations.
Capitalized Software Development Costs
Costs related to research and development are generally charged to expense as incurred. Capitalization of material software development costs begins when a product’s technological feasibility has been established. To date, the time period between achieving technological feasibility, which the Company has defined as the establishment of a working model, which typically occurs when beta testing commences, and the general availability of such software has been short, and, as such, software development costs qualifying for capitalization have been insignificant.
The Company incurs costs associated with developing software for internal use and for which no plan exists to market the software externally. The Company capitalizes the costs as part of property and equipment and recognizes the associated depreciation over the software’s estimated useful life of generally three years. Capitalized software costs for internal use have been insignificant in each of the periods presented.
Property and Equipment
Property and equipment are recorded at cost. Depreciation and amortization are computed using the straight-line method over the estimated useful lives of the assets. Estimated useful lives are five years for furniture and fixtures, three years for software developed for internal use and typically four years for machinery and equipment. Depreciation and amortization for leasehold improvements are computed using the shorter of the remaining useful lives of the assets, up to 10 years, or the lease term of the respective assets.
Acquisitions
The Company recognizes identifiable assets acquired and liabilities assumed at their acquisition date fair values. Goodwill as of the acquisition date is measured as the excess of consideration transferred over the net of the acquisition date fair values of assets acquired and the liabilities assumed. While the Company uses its best estimates and assumptions as part of the purchase price allocation process to accurately value assets acquired and liabilities assumed at the acquisition date, the Company’s estimates are inherently uncertain and subject to refinement. As a result, during the measurement period, which may be up to one year from the acquisition date, the Company records adjustments to the assets acquired and liabilities assumed, with the corresponding offset to goodwill to the extent the Company identifies adjustments to the preliminary purchase price allocation. Upon the conclusion of the measurement period or final determination of the values of assets acquired or liabilities assumed, whichever comes first, any subsequent adjustments are recorded to the consolidated statements of operations.
Goodwill
Goodwill represents the difference between the purchase price and the estimated fair value of the identifiable assets acquired and liabilities assumed. The Company tests for goodwill impairment at the reporting unit level on an annual basis in the fourth quarter of each of its fiscal years, and at any other time at which events occur or circumstances indicate that the
68
carrying amount of goodwill may exceed its fair value. The Company uses a two-step process to determine the amount of goodwill impairment. The first step requires comparing the fair value of the reporting unit to its net book value, including goodwill. A potential impairment exists if the fair value of the reporting unit is lower than its net book value. The second step of the process, which is performed only if a potential impairment exists, involves determining the difference between the fair value of the reporting unit’s net assets, other than goodwill, and the fair value of the reporting unit. If this difference is less than the net book value of goodwill, an impairment exists and is recorded.
The Company has two reporting units, which are the same as its operating segments. Goodwill is assigned to the reporting units using the relative fair values of the reporting units and the fair values of the reporting units were determined utilizing a blend of the income approach and the market approach. The Company acquired TVN on February 29, 2016 and recorded additional goodwill of $41.7 million based on the allocation of the purchase consideration (see Note 3, “Business Acquisition,” for additional information). Goodwill from the TVN acquisition was assigned to the Video reporting unit. There was no impairment of goodwill resulting from the Company’s fiscal 2016 annual impairment testing in the fourth quarter of 2016 (See Note 8, “Goodwill and Identified Intangible Assets,” for additional information).
Long-lived Assets
Long-lived assets represent property and equipment and purchased intangible assets. Purchased intangible assets from business combinations and asset acquisitions include customer contracts, trademarks and trade names, and maintenance agreements and related relationships, the amortization of which is charged to general and administrative expenses, and core technology and developed technology, the amortization of which is charged to cost of revenue. The Company evaluates the recoverability of intangible assets and other long-lived assets when indicators of impairment are present. When impairment indicators are present, the Company evaluates the recoverability of intangible assets and other long-lived assets on the basis of undiscounted cash flows expected to result from the use of each asset group and its eventual disposition. If the undiscounted expected future cash flows are less than the carrying amount of the asset, an impairment loss is recognized in order to writedown the carrying value of the asset to its estimated fair market value.
In connection with restructuring actions initiated during 2014, the Company recorded a fixed assets impairment charge of $1.1 million in fiscal 2014 related to software development costs incurred for a discontinued project.
Foreign Currency
The functional currency of the Company’s Israeli, Cayman and Swiss operations is the U.S. dollar. All other foreign subsidiaries use the respective local currency as the functional currency. When the local currency is the functional currency, gains and losses from translation of these foreign currency financial statements into U.S. dollars are recorded as a separate component of other comprehensive loss in stockholders’ equity.
The Company’s foreign currency exposure is also related to its net position of monetary assets and monetary liabilities held by its subsidiaries in their nonfunctional currencies. These monetary assets and monetary liabilities are being remeasured into the functional currencies of the subsidiaries using exchange rates prevailing on the balance sheet date. Such remeasurement gains and losses are included in other expense, net in the Company’s Consolidated Statements of Operations. During the years ended December 31, 2016, 2015 and 2014, the Company recorded remeasurement losses of $0.2 million, $0.5 million and $0.4 million, respectively.
Derivative Instruments
The Company enters into derivative instruments, primarily foreign currency forward contracts, to minimize the short-term impact of foreign currency exchange rate fluctuations on certain foreign currency denominated assets and liabilities as well as certain foreign currencies denominated expenses. The Company does not enter into derivative instruments for trading purposes and these derivatives generally have maturities within twelve months.
The derivative instruments are recorded at fair value in prepaid expenses and other current assets or accrued and other current liabilities in the Company’s Consolidated Balance Sheet. For derivative instruments designated and qualifying as cash flow hedges of forecasted foreign currency denominated transactions expected to occur within twelve months, the effective portion of the gain or loss on these hedges is reported as a component of “Accumulated other comprehensive loss” in stockholders’ equity, and is reclassified into earnings when the hedged transaction affects earnings. If the transaction being hedged fails to occur, or if a portion of any derivative is (or becomes) ineffective, the gain or loss on the associated financial instrument is recorded immediately in earnings. For derivative instruments used to hedge existing foreign currency denominated assets or liabilities, the gains or losses on these hedges are recorded immediately in earnings to offset the changes in the fair value of the assets or liabilities being hedged.
Fair Value of Financial Instruments
69
The carrying value of the Company’s financial instruments, including cash equivalents, restricted cash, short-term investments, accounts receivable, accounts payable and accrued and other current liabilities, approximate fair value due to their short maturities.
The fair value of the Company’s liability for the TVN voluntary departure plan (“TVN VDP”), a post-employment benefit plan for employees of the TVN French Subsidiary, as of December 31, 2016, is determined based on a discount rate of 4.25% (4-Year LIBOR + 2.5%). The Company believes this discount rate approximates it’s incremental borrowing rate in France. (See Note 11, “Restructuring and related Charges-TVN VDP,” for additional information on the TVN VDP).
Research and Development
Research and development (“R&D”) costs are expensed as incurred and consists primarily of employee salaries and related expenses, contractors and outside consultants, supplies and materials, equipment depreciation and facilities costs, all associated with the design and development of new products and enhancements of existing products. R&D expense was $98.4 million, $87.5 million and $93.1 million for the years ended December 31, 2016, 2015 and 2014, respectively.
The R&D expenses for the year ended December 31, 2016 was net of approximately $6.0 million in reimbursements of engineering spending by one of our large customers, as well as approximately $6.1 million of R&D tax credits in 2016. Our TVN French Subsidiary participates in the French CIR program which allows companies to monetize eligible research expenses. The R&D tax credits receivable from the French government for spending on innovative R&D is recorded as an offset to R&D expenses.
Restructuring and Related Charges
The Company’s restructuring charges consist primarily of employee severance, one-time termination benefits related to the reduction of its workforce, lease exit costs, and other costs. Liabilities for costs associated with a restructuring activity are recognized when the liability is incurred and are measured at fair value. One-time termination benefits are expensed at the date the entity notifies the employee, unless the employee must provide future service, in which case the benefits are expensed ratably over the future service period. Termination benefits are calculated based on regional benefit practices and local statutory requirements. Costs to terminate a lease before the end of its term are recognized when the entity terminates the contract in accordance with the contract terms. The Company determines the excess facilities accrual based on expected cash payments, under the applicable facility lease, reduced by any estimated sublease rental income for such facility. Other costs primarily consist of costs to write down the values of inventories and leasehold improvement write-down as a result of restructuring activities (see Note 11, “Restructuring and related Charges” for additional information).
Warranty
The Company accrues for estimated warranty costs at the time of revenue recognition and records such accrued liabilities as part of cost of revenue. Management periodically reviews its warranty liability and adjusts the accrued liability based on the terms of warranties provided to customers, historical and anticipated warranty claims experience, and estimates of the timing and cost of warranty claims.
Advertising Expenses
All advertising costs are expensed as incurred and included in “Selling, general and administrative expenses” in the Company’s Consolidated Statements of Operations. Advertising expense was $1.4 million, $1.4 million and $0.2 million for the years ended December 31, 2016, 2015 and 2014, respectively.
Stock-based Compensation Expense
The Company measures and recognizes compensation expense for all stock-based compensation awards made to employees and directors, including stock options, restricted stock units and awards related to the Company’s Employee Stock Purchase Plan (“ESPP”), based upon the grant-date fair value of those awards.
Applicable accounting guidance requires companies to estimate the fair value of stock-based compensation awards on the date of grant. The value of the portion of the award that is ultimately expected to vest is recognized as expense over the requisite service period in the Company’s Consolidated Statements of Operations.
The fair value of stock options is estimated at grant date using the Black-Scholes option pricing model. The Company’s determination of fair value of stock options on the date of grant, using an option pricing model, is affected by the Company’s stock price, as well as the assumptions regarding a number of highly complex and subjective variables. These variables include, but are not limited to, the Company’s expected stock price volatility over the term of the awards and projected employee stock
70
option exercise behaviors. The fair value of each restricted stock unit grant is based on the underlying value of the Company’s common stock on the date of grant.
The Company recognizes the stock-based compensation expense for performance-based RSUs (“PRSUs”) based on the probability of achieving certain performance criteria, as defined in the PRSU agreements. The Company estimates the number of PRSUs ultimately expected to vest and recognize expense using the graded vesting attribution method over the requisite service period. Changes in the estimates related to probability of achieving certain performance criteria and number of PRSUs expected to vest could significantly affect the stock-based compensation expense from one period to the next.
Pension Plan
As part of the TVN acquisition, the Company assumed obligations to the employees of its TVN French Subsidiary under defined benefit pension plan which was unfunded as of the acquisition date. The Company records annual amounts relating to the pension plans based on calculations which include various actuarial assumptions including employees’ age and period of service with the company; projected mortality rates, mobility rates and increases in salaries; and a discount rate. The Company reviews its actuarial assumptions on an annual basis as of December 31 (or more frequently if a significant event requiring remeasurement occurs) and modifies the assumptions based on current rates and trends when it is appropriate to do so. The Company believes that the assumptions utilized in recording its obligations under its pension plan are reasonable based on its experience, market conditions and input from its actuaries. The Company determines its assumption for the discount rate to be used for purposes of computing annual service and interest costs based on Euro Zone AA rated corporate bonds + 10
years. The discount rate for pension benefit obligations at December 31, 2016 was 1.5%. The defined benefit obligation for the pension plan was $4.3 million as of December 31, 2016.
The Company accounts for the actuarial gains (losses) in accordance with ASC 715, “Compensation - Retirement Benefits”. If the net accumulated gain or loss exceeds 10% of the projected plan benefit obligation a portion of the net gain or loss is amortized and included in expense for the following year based upon the average remaining service period of active plan participants, unless the Company’s policy is to recognize all actuarial gains (losses) when they occur. The Company elected to defer actuarial gains (losses) in accumulated other comprehensive income (loss). As of December 31, 2016, the Company did not meet the 10% requirement, and therefore no amortization of 2016 actuarial loss would be recorded in fiscal 2017.
See Note 13, “Employee Benefit Plans and Stock-based Compensation-TVN Retirement Benefit Plan,” for additional information.
Income Taxes
In preparing the Company’s financial statements, the Company estimates the income taxes for each of the jurisdictions in which the Company operates. This involves estimating the Company’s actual current tax exposures and assessing temporary and permanent differences resulting from differing treatment of items, such as reserves and accruals, for tax and accounting purposes. These differences result in deferred tax assets and liabilities, which are included within the Company’s Consolidated Balance Sheet.
The Company’s income tax policy is to record the estimated future tax effects of temporary differences between the tax bases of assets and liabilities and amounts reported in the Company’s accompanying Consolidated Balance Sheets, as well as operating loss and tax credit carryforwards. The Company follows the guidelines set forth in the applicable accounting guidance regarding the recoverability of any tax assets recorded on the Consolidated Balance Sheet and provides any necessary allowances as required. Determining necessary allowances requires the Company to make assessments about the timing of future events, including the probability of expected future taxable income and available tax planning opportunities. A history of operating losses in recent years has led to uncertainty with respect to our ability to realize certain of our net deferred tax assets, and as a result we applied full valuation allowance against our U.S. net deferred tax assets as of December 31, 2016. In the event that actual results differ from these estimates or the Company adjusts these estimates in future periods, the Company’s operating results and financial position could be materially affected.
The Company is subject to examination of its income tax returns by various tax authorities on a periodic basis. The Company regularly assesses the likelihood of adverse outcomes resulting from such examinations to determine the adequacy of its provision for income taxes. The Company has applied the provisions of the applicable accounting guidance on accounting for uncertainty in income taxes, which requires application of a more-likely-than-not threshold to the recognition and de-recognition of uncertain tax positions. If the recognition threshold is met, the applicable accounting guidance permits the Company to recognize a tax benefit measured at the largest amount of tax benefit that, in the Company’s judgment, is more than 50% likely to be realized upon settlement. It further requires that a change in judgment related to the expected ultimate resolution of uncertain tax positions be recognized in earnings in the period of such change.
71
The Company files annual income tax returns in multiple taxing jurisdictions around the world. A number of years may elapse before an uncertain tax position is audited and finally resolved. While it is often difficult to predict the final outcome or the timing of resolution of any particular uncertain tax position, the Company believes that its reserves for income taxes reflect the most likely outcome. The Company adjusts these reserves and penalties, as well as the related interest, in light of changing facts and circumstances. Changes in the Company’s assessment of its uncertain tax positions or settlement of any particular position could materially and adversely impact the Company’s income tax rate, operating results, financial position and cash flows.
Sales Taxes
The Company accounts for sales taxes imposed on its goods and services on a net basis in the Consolidated Statements of Operations.
Segment Reporting
Operating segments are defined as components of an enterprise that engage in business activities for which separate financial information is available and is evaluated by the Chief Operating Decision Maker (“CODM”), which for the Company is its Chief Executive Officer, in deciding how to allocate resources and assess performance. The Company has two operating segments: Video and Cable Edge.
Comprehensive Income (Loss)
Comprehensive income (loss) includes net income (loss) and other comprehensive income (loss). Other comprehensive income (loss) includes cumulative translation adjustments, unrealized gains and losses on certain foreign currency forward contracts that qualify as cash flow hedges and available-for-sale securities, as well as actuarial gains and losses on pension plan.
Recent Accounting Pronouncements
New Standards to be Implemented
In May 2014, the Financial Accounting Standards Board (“FASB”) issued a new standard, Accounting Standards Update (“ASU”) No. 2014-09, Revenue from Contracts with Customers, as amended, which will supersede nearly all existing revenue recognition guidance. Under ASU 2014-09, an entity is required to recognize revenue upon transfer of promised goods or services to customers in an amount that reflects the expected consideration received in exchange for those goods or services. ASU No. 2014-09 defines a five-step process in order to achieve this core principle, which may require the use of judgment and estimates, and also requires expanded qualitative and quantitative disclosures relating to the nature, amount, timing and uncertainty of revenue and cash flows arising from contracts with customers, including significant judgments and estimates used.
The FASB has recently issued several amendments to the new standard, including clarification on accounting for licenses of intellectual property and identifying performance obligations. The amendments include ASU No. 2016-08, Revenue from Contracts with Customers (Topic 606)-Principal versus Agent Considerations, which was issued in March 2016, and clarifies the implementation guidance for principal versus agent considerations in ASU 2014-09, and ASU No. 2016-10, Revenue from Contracts with Customers (Topic 606)-Identifying Performance Obligations and Licensing, which was issued in April 2016, and amends the guidance in ASU No. 2014-09 related to identifying performance obligations and accounting for licenses of intellectual property.
The new standard permits adoption either by using (i) a full retrospective approach for all periods presented in the period of adoption or (ii) a modified retrospective approach with the cumulative effect of initially applying the new standard recognized at the date of initial application and providing certain additional disclosures. The new standard is effective for annual reporting periods beginning after December 15, 2017, with early adoption permitted for annual reporting periods beginning after December 15, 2016. The Company does not plan to early adopt, and accordingly, it will adopt the new standard effective January 1, 2018.
The Company currently plans to adopt using the modified retrospective approach. However, a final decision regarding the adoption method has not been finalized at this time. The Company’s final determination will depend on a number of factors, such as the significance of the impact of the new standard on its financial results, system readiness, including that of software procured from third-party providers, and its ability to accumulate and analyze the information necessary to assess the impact on prior period financial statements, as necessary.
72
The Company is in the initial stages of its evaluation of the impact of the new standard on its accounting policies, processes, and system requirements. The Company has assigned internal resources in addition to the engagement of third party service providers to assist in the evaluation. Furthermore, the Company has made and will continue to make investments in systems to enable timely and accurate reporting under the new standard. While the Company continues to assess all potential impacts under the new standard, there is the potential for significant impacts to the timing of recognition of software licenses with undelivered features and professional services revenue with acceptances, and contract acquisition costs, both with respect to the amounts that will be capitalized as well as the period of amortization.
Under current industry-specific software revenue recognition guidance, the Company has historically concluded that it did not have VSOE of fair value of the undelivered features relating to delivered software licenses, and accordingly, it has deferred entire revenue for such software licenses until the delivery of features. Professional services included in arrangements with acceptances have also been recognized on receipt of acceptance. The new standard, which does not retain the concept of VSOE, requires an evaluation of whether the undelivered features are distinct performance obligations and, therefore, should be separately recognized when delivered compared to the timing of delivery of software license. Professional services will be recorded as services are provided. Depending on the outcome of the Company’s evaluation, the timing of when revenue is recognized could change for future features and professional services under the new standard.
As part of the Company’s preliminary evaluation, it has also considered the impact of the guidance in ASC 340-40, Other Assets and Deferred Costs; Contracts with Customers, and the interpretations of the FASB Transition Resource Group for Revenue Recognition (“TRG”) from their November 7, 2016 meeting with respect to capitalization and amortization of incremental costs of obtaining a contract. As a result of this new guidance, the Company preliminarily believes that it will capitalize certain costs of obtaining the contract, including additional sales commissions, as the new cost guidance, as interpreted by the TRG, requires the capitalization of all incremental costs that the Company incurs to obtain a contract with a customer that it would not have incurred if the contract had not been obtained, provided it expects to recover the costs. Additionally, after the adoption of the new guidance, the Company preliminarily believes that the amortization period for the capitalized costs will be longer than the contract term, as the new cost guidance requires entities to determine whether the costs relate to specific anticipated contracts. Therefore, the Company believe that the period of benefit, as interpreted by the TRG, for deferred commission costs will likely be longer than the initial contract period. Under the Company’s current accounting policy, it expense the commission costs immediately as incurred.
While the Company continues to assess the potential impacts of the new standard, including the areas described above, the Company does not know or cannot reasonably estimate quantitative information related to the impact of the new standard on its financial statements at this time.
In July 2015, the FASB issued an accounting standard update that requires inventory to be measured at the lower of cost and net realizable value. Net realizable value is the estimated selling prices in the ordinary course of business, less reasonably predictable costs of completion, disposal, and transportation. This accounting standard update will be effective for the Company beginning in the first quarter of fiscal 2017 and early adoption is permitted. The adoption of this new guidance is not expected to have a material impact on the Company’s consolidated financial statements.
In January 2016, the FASB issued an accounting standard update which requires equity investments to be measured at fair value with changes in fair value recognized in net income and simplifies the impairment assessment of equity investments without readily determinable fair values by requiring a qualitative assessment to identify impairment. The accounting standard update also updates certain presentation and disclosure requirements. This accounting standard update will be effective for the Company beginning in the first quarter of fiscal 2018 and early adoption is permitted. The Company is currently evaluating the impact of this accounting standard update on its consolidated financial statements.
In February 2016, the FASB amends the existing accounting standard for lease accounting. Under this guidance, lessees and lessors should apply a “right-of-use” model in accounting for all leases (including subleases) and eliminate the concept of operating leases and off-balance sheet leases. This new leases standard requires a modified retrospective transition approach for all leases existing at, or entered into after, the date of initial application, with an option to use certain transition relief. The new standard will be effective for the Company beginning in the first quarter of fiscal 2019 and early adoption is permitted. The Company is currently evaluating the methods and impact of adopting the new leases standard on its consolidated financial statements.
In March 2016, the FASB issued an accounting standard update to clarify the requirements for assessing whether contingent call (put) options that can accelerate the payment of principal on debt instruments are clearly and closely related to their debt hosts. An entity performing the assessment under the amendments is required to assess the embedded call (put) options solely in accordance with the four-step decision sequence. The standard will be effective for the Company beginning in
73
the first quarter of fiscal 2017 and early adoption is permitted. The adoption of this accounting standard update is not expected to have any impact on the financial statements of the Company.
In March 2016, the FASB issued an accounting standard update for the accounting for share-based payment transactions, including the income tax consequences, classification of awards as either equity or liabilities and classification on the statement of cash flows. This accounting standard update requires that all excess tax benefits and deficiencies from stock-based compensation be recognized as income tax expense or benefits in the statement of operations, as these amounts are currently recognized in additional paid-in capital in the balance sheet. Additionally, all excess income tax benefits and deficiencies from stock-based compensation arrangements are to be classified as a cash flow from operations, rather than as a cash flow from financing activities. This accounting standard update will be effective for the Company beginning in the first quarter of fiscal 2017 and may be applied retrospectively or prospectively. The Company will apply both changes prospectively. The Company is currently unable to reasonably estimate the impact of these changes due to the dependency of these items on the underlying share price of the Company.
In June 2016, the FASB issued new guidance that changes the impairment model for most financial assets and certain other instruments. For trade receivables and other instruments, the Company will be required to use a new forward-looking “expected loss” model. Additionally, credit losses on available-for-sale debt securities should be recorded through an allowance for credit losses limited to the amount by which fair value is below amortized cost. The new guidance will be effective for the Company beginning in the first quarter of fiscal 2019 and early adoption is permitted. The Company is currently evaluating the impact of adopting this new accounting guidance on its consolidated financial statements.
In August 2016, the FASB issued an accounting standard update that addresses eight specific cash flow issues with the objective of reducing the existing diversity in practice. This accounting standard update will be effective for the Company beginning in the first quarter of fiscal 2018 and early adoption is permitted. The Company is currently evaluating the methods and impact of adopting the new accounting standard on its consolidated financial statements.
In October 2016, the FASB issued an accounting standard update which removes the prohibition in ASC 740 against the immediate recognition of the current and deferred income tax effects of intra-entity transfers of assets other than inventory. This accounting standard update is intended to reduce the complexity of U.S. GAAP and diversity in practice related to the tax consequences of certain types of intra-entity asset transfers, particularly those involving intellectual property. This accounting standard update will be effective for the Company beginning in the first quarter of fiscal 2018 and early adoption is permitted. The Company is currently evaluating the impact of adopting the new accounting standard on its consolidated financial statements.
In November 2016, the FASB issued an accounting standard update which requires companies to include restricted cash and restricted cash equivalents in its cash and cash equivalent balances in the statement of cash flows. Transfers between cash, cash equivalent, restricted cash, and restricted cash equivalents are no longer presented in the statement of cash flows. The new guidance requires a reconciliation of the totals in the statement of cash flows to the related captions. This accounting standard update will be effective for the Company beginning in the first quarter of fiscal 2018 and early adoption is permitted. The adoption of this new guidance is not expected to have a material impact on the Company’s consolidated financial statements.
Standards Implemented
In November 2014, the FASB issued an accounting standard update for determining when separation of certain embedded derivative features in a hybrid financial instrument is required. An entity will continue to evaluate whether the economic characteristics and risks of the embedded derivative feature are clearly and closely related to those of the host contract, among other relevant criteria. The amendments clarify how current GAAP should be interpreted in evaluating the economic characteristics and risks of a host contract in a hybrid financial instrument that is issued in the form of a share. The Company adopted this accounting standard update in the first quarter of fiscal 2016 and the adoption did not have an impact to the Company’s consolidated financial statements.
In February 2015, the FASB issued an accounting standard update that changes the analysis that a reporting entity must perform to determine whether it should consolidate certain types of legal entities. The Company adopted this accounting standard update in the first quarter of fiscal 2016 and the adoption did not have an impact to the Company’s consolidated financial statements.
In April 2015, the FASB issued an accounting standard update on whether a cloud computing arrangement includes a software license. The guidance requires the accounting for a cloud computing arrangement that includes a software license element to be consistent with the accounting for acquisition of other software licenses. Cloud computing arrangement without software licenses are to be accounted for as a service contract. The Company adopted this accounting standard update beginning in the first quarter of fiscal 2016. The adoption of this standard update did not have a material impact on the Company’s consolidated financial statements.
74
In November 2015, the FASB issued an accounting standard update that all deferred tax assets and liabilities, along with any related valuation allowance, be classified as non-current on the balance sheet. The accounting standard update will be effective for the Company beginning in the first quarter of fiscal 2017 and early adoption is permitted. The Company early-adopted prospectively this accounting standard update as of the end of its fiscal 2015, resulting in $15.9 million of net deferred tax assets, along with its related valuation allowance, being classified as non-current on the Consolidated Balance Sheet at December 31, 2015. Other than this reclassification, the adoption of this accounting standard update did not have an impact on the Company’s consolidated financial statements.
In September 2015, the FASB issued new guidance related to business combinations. The new guidance requires that any adjustments to provisional amounts in a business combination be recorded in the period such adjustments are determined, rather than retrospectively adjusting previously reported amounts. The Company adopted the amendments beginning in the first quarter of fiscal 2016. The adoption did not have a material impact on the Company's consolidated financial statements.
NOTE 3: BUSINESS ACQUISITION
On February 29, 2016, the Company, through its wholly-owned subsidiary Harmonic International AG, completed its acquisition of 100% of the share capital and voting rights of TVN, a global leader in advanced video compression solutions headquartered in Rennes, France. In the first quarter of 2016, the Company recorded a provisional purchase price of $84.6 million, including an estimated contingent consideration of approximately $8.0 million. In the second quarter of 2016, the Company recorded a $2.1 million reduction to the contingent consideration upon finalizing the pending post-closing adjustments and, as a result, the purchase price was reduced to $82.5 million. Pursuant to the Securities Purchase Agreement entered into between the Company and the other parties thereto, dated February 11, 2016 (“TVN Purchase Agreement”), $13.5 million of the purchase consideration may remain in escrow for a period of up to 18 months and relates to certain indemnification obligations of TVN’s former equity holders. The TVN acquisition was primarily funded with cash proceeds from the issuance of convertible senior notes by the Company in December 2015. (See Note 12, “Convertible Notes, Other Debts and Capital Leases,” for additional information on the notes).
The Company believes that its acquisition of TVN has strengthened, and will continue to strengthen, the Company’s competitive position in the video infrastructure market as well as to enhance the depth and scale of the Company’s research and development (“R&D”) and service and support capabilities in the video arena. The Company believes that the combined product portfolios, R&D teams and global sales and service personnel will allow the Company to accelerate innovation for its customers while leveraging greater scale to drive operational efficiencies.
The TVN acquisition has been accounted for using the acquisition method of accounting in accordance with ASC 805, Business Combinations, which requires, among other things, that the assets acquired and liabilities assumed be recognized at their acquisition date fair values, with any excess of the consideration transferred over the estimated fair values of the identifiable net assets acquired recorded as goodwill. During the fourth quarter of 2016, the Company completed the accounting for this business combination.
The final TVN purchase price has been allocated on to tangible and intangible assets acquired and liabilities assumed on the basis of their respective estimated fair values on the acquisition date. The Company’s allocation of TVN purchase consideration is as follows (in thousands):
75
Assets: | |||
Cash and cash equivalents | $ | 6,843 | |
Accounts receivable, net | 14,933 | ||
Inventories | 3,462 | ||
Prepaid expenses and other current assets | 2,412 | ||
Property and equipment, net | 9,942 | ||
French R&D tax credit receivables (1) | 26,421 | ||
Other long-term assets | 2,134 | ||
Total assets | $ | 66,147 | |
Liabilities: | |||
Other debts and capital lease obligations, current | 8,362 | ||
Accounts payable | 12,494 | ||
Deferred revenue | 2,504 | ||
Accrued and other current liabilities | 18,365 | ||
Other debts and capital lease obligations, long-term | 16,087 | ||
Other non-current liabilities | 6,467 | ||
Deferred tax liabilities | 2,126 | ||
Total liabilities | $ | 66,405 | |
Goodwill | 41,670 | ||
Intangibles | 41,100 | ||
Total purchase consideration | $ | 82,512 | |
(1) See Note 10, “Certain Balance Sheet Components-Prepaid expenses and other current assets,” for more information on French R&D tax credit receivables.
The following table presents details of the intangible assets acquired through this business combination (in thousands, except years):
Estimated Useful Life | Fair Value | ||||
Backlog | 6 months | $ | 3,600 | ||
Developed technology | 4 years | 21,700 | |||
Customer relationships | 5 years | 15,200 | |||
In-process research and development (1) | N/A | — | |||
Trade name | 4 years | 600 | |||
$ | 41,100 | ||||
(1) By the end of the second quarter of 2016, the Company completed the TVN in-process research and development activities and, as a result, the in-process research and development of $1.1 million was reclassified to developed technology.
Acquired identifiable intangible assets were valued using the income method and are amortized on a straight line basis over their respective estimated useful lives. Goodwill of $41.7 million arising from the acquisition was derived from expected benefits from the business synergies to be derived from the combined entities and the experienced workforce who joined the Company in connection with the acquisition. The goodwill is assigned to the Company’s video reporting unit and it is not expected to be deductible for income tax purposes.
The amortization for the developed technology is recorded in “Cost of revenues” for product and the amortization for the remaining intangibles is recorded in “Amortization of intangibles,” which are part of operating expenses, on the Consolidated Statement of Operations. The intangibles assets acquired are assigned to the Company’s video reporting unit and are expected to be deductible for income tax purposes in certain jurisdictions after completing the integration of TVN’s operations.
76
The Company also acquired an indefinite lived asset of $1.1 million which represents the fair value of in-process research and development activities that were estimated to be completed within six months of the acquisition date. The related research and development efforts were completed by the end of the second quarter of 2016 and the Company determined that it has become a finite lived intangible asset (developed technology) with an estimated useful life of four years.
The results of operations of TVN are included in the Company’s Consolidated Statements of Operations beginning March 1, 2016. For the year ended December 31, 2016, $60.0 million of revenue and $22.0 million of gross profit from TVN were included in the Company’s Consolidated Statement of Operations. Since the Company is in the process of integrating TVN’s operations, the Company believes it is impracticable to determine TVN’s stand-alone income (loss) from operations and net income (loss) as these measures are not meaningful representations of TVN’s stand-alone performance.
Acquisition-and integration-related expenses
As a result of the TVN acquisition, the Company incurred acquisition-and integration-related expenses in aggregate of $16.9 million for the year ended December 31, 2016. These costs consisted of acquisition-related costs which include outside legal, accounting and other professional services as well as integration-related costs which include incremental costs resulting from the TVN acquisition that are not expected to generate future benefits once the integration is fully consummated. These costs are expensed as incurred.
Acquisition-and integration-related expenses for the TVN acquisition are summarized in the table below (in thousands):
Year ended December 31, 2016 | |||||||
Acquisition-related | Integration-related | ||||||
(unaudited) | |||||||
Product cost of revenue | $ | — | $ | 1,049 | |||
Research and development | — | 974 | |||||
Selling, general and administrative | 3,855 | 11,058 | |||||
Total acquisition- and integration-related expenses | $ | 3,855 | $ | 13,081 | |||
Pro Forma Financial Information
The following unaudited pro forma summary presents consolidated information of the Company as if the acquisition of TVN had occurred on January 1, 2015, the beginning of the comparable prior annual period. The unaudited pro forma combined results are provided for illustrative purpose only and are not indicative of the Company’s actual consolidation results.
The pro forma adjustments primarily relate to the amortization of acquired intangibles and interest expense related to financing arrangements. In addition, the unaudited pro forma net loss for the year ended December 31, 2015 was adjusted to include $16.9 million of acquisition- and integration- related expenses and $14.6 million of restructuring and related charges, as well as $3.8 million reduction in revenue related to the fair value adjustment of deferred revenue. The unaudited pro forma net loss for the year ended December 31, 2016 was adjusted to exclude $16.9 million of acquisition- and integration- related expenses and $14.6 million of restructuring and related charges. These adjustments exclude the income tax impact.
Year ended December 31, | |||||||
2016 | 2015 | ||||||
(in millions, except per share amounts) | |||||||
Net revenue | $ | 414.6 | $ | 456.3 | |||
Net loss | $ | (48.8 | ) | $ | (65.1 | ) | |
Net loss per share-basic and diluted | $ | (0.63 | ) | $ | (0.74 | ) | |
NOTE 4: SHORT-TERM INVESTMENTS
The following table summarizes the Company’s short-term investments (in thousands):
77
Amortized Cost | Gross Unrealized Gains | Gross Unrealized Losses | Estimated Fair Value | ||||||||||||
As of December 31, 2016 | |||||||||||||||
Corporate bonds | $ | 6,928 | $ | — | $ | (5 | ) | $ | 6,923 | ||||||
Total short-term investments | $ | 6,928 | $ | — | $ | (5 | ) | $ | 6,923 | ||||||
As of December 31, 2015 | |||||||||||||||
Corporate bonds | $ | 25,557 | $ | — | $ | (52 | ) | $ | 25,505 | ||||||
Commercial paper | 1,099 | — | — | 1,099 | |||||||||||
Total short-term investments | $ | 26,656 | $ | — | $ | (52 | ) | $ | 26,604 | ||||||
The following table summarizes the maturities of the Company’s short-term investments (in thousands):
December 31, | |||||||
2016 | 2015 | ||||||
Less than one year | $ | 6,923 | $ | 19,642 | |||
Due in 1 - 2 years | — | 6,962 | |||||
Total short-term investments | $ | 6,923 | $ | 26,604 | |||
Short-term investments are used to fund the Company’s current operations. In the event the Company needs or desires to access funds from the short-term investments that it holds, it is possible that the Company may not be able to do so due to market conditions. If a buyer is found, but is unwilling to purchase the investments at par or the Company’s cost, it may incur a loss. Further, rating downgrades of the security issuer or the third parties insuring such investments may require the Company to adjust the carrying value of these investments through an impairment charge. The Company’s inability to sell all or some of the Company’s short-term investments at par or the Company’s cost, or rating downgrades of issuers or insurers of these securities, could adversely affect the Company’s results of operations or financial condition.
For the years ended December 31, 2016, 2015 and 2014, realized gains and realized losses from the sale of short-term investments were not material.
At December 31, 2016 and 2015, $4.4 million and $5.4 million, respectively, of investments in equity securities of other privately and publicly held companies are considered as long-term investments and are included in “Other long-term assets” in the Consolidated Balance sheet (See Note 5, “Investments in Other Equity Securities,” for additional information).
Impairment of Short-term Investments
The Company monitors its investment portfolio for impairment on a periodic basis. In the event that the carrying value of an investment exceeds its fair value and the decline in value is determined to be other-than-temporary, an impairment charge is recorded and a new cost basis for the investment is established. A decline of fair value below amortized costs of debt securities is considered other-than temporary if the Company has the intent to sell the security or it is more likely than not that the Company will be required to sell the security before recovery of the entire amortized cost basis. At the present time, the Company does not intend to sell its investments that have unrealized losses in accumulated other comprehensive loss. In addition, the Company does not believe that it is more likely than not that it will be required to sell its investments that have unrealized losses in accumulated other comprehensive loss before the Company recovers the principal amounts invested. The Company believes that the unrealized losses are temporary and do not require an other-than-temporary impairment, based on its evaluation of available evidence as of December 31, 2016.
As of December 31, 2016, there were no individual available-for-sale securities in a material unrealized loss position and the amount of unrealized losses on the total investment balance was insignificant.
NOTE 5: INVESTMENTS IN OTHER EQUITY SECURITIES
From time to time, the Company may acquire certain equity investments for the promotion of business objectives and these investments are classified as long-term investments and included in “Other long-term assets” in the Consolidated Balance Sheet.
78
On September 2, 2014, the Company acquired a 3.3% interest in Vislink plc (“Vislink”), a U.K. public company listed on the AIM exchange, for $3.3 million. The investment in Vislink is being accounted for as a cost method investment as the Company does not have significant influence over the operational and financial policies of Vislink. Since the Vislink investment is also an available-for-sale security, its value is marked to market for the difference in fair value at period end. The carrying value of Vislink was $0.8 million and $1.8 million as of December 31, 2016 and December 31, 2015, respectively, and Vislink’s accumulated unrealized gain (loss), net of taxes was $0.3 million and $(1.5) million as of December 31, 2016 and December 31, 2015, respectively. The accumulated unrealized gain (loss) is included in the Consolidated Balance Sheet as a component of “Accumulated other comprehensive loss”.
The Company assessed this available-for-sale investment that was in a gross unrealized loss position on an individual basis to determine if the decline in fair value was other than temporary. The assessment as to the nature of a decline in fair value is based on, among other things, the length of time and the extent to which the market value has been less than the Company’s cost basis; the financial condition and near-term prospects of the investment; and the Company’s intent and ability to retain the investment for a period of time sufficient to allow for any anticipated recovery in market value. As a result of these assessments, it was determined that the decline in fair value of Vislink investment at December 31, 2015 was not other than temporary due to the relatively short duration in which the fair value of the Vislink investment was less than the Company’s cost basis, and, as a result, the Company did not record any impairment charges as of December 2015. Vislink’s $1.5 million accumulated unrealized loss, net of taxes, at December 31, 2015 was included in the Consolidated Balance Sheets as a component of “Accumulated other comprehensive loss”.
By May 2016, Vislink’s stock price had continued to be below the Company’s cost basis for approximately seven months. The prolonged decline in Vislink’s stock price led the Company to conclude the impairment was other than temporary. Furthermore, the Company’s assessment of Vislink's near-term prospects based on Vislink’s recent financial performance suggest that Vislink's stock price may not recover to the Company’s original cost basis in 2016. As a result, the Company recorded an impairment charge in the first quarter of 2016 of $1.5 million reflecting the new reduced cost basis of the Vislink investment at April 1, 2016. As of September 30, 2016, Vislink’s stock price had declined an additional 70% from the stock price as of April 1, 2016. The Company further observed several recent adverse changes in Vislink’s financial and liquidity conditions. Based on the Company’s assessment of the positive and negative factors of Vislink’s financial and business conditions, the Company believed that more likely-than-not, Vislink’s stock price will not recover to the Company’s cost basis established at April 1, 2016. As a result, the Company recorded an additional impairment charge in the third quarter of 2016 of $1.2 million reflecting the new reduced cost basis of the Vislink investment at September 30, 2016. As of December 31, 2016, Vislink’s stock price had increased approximately 67% from the stock price as of September 30, 2016. The Company’s remaining maximum exposure to loss from the Vislink investment at December 31, 2016 was limited to its reduced investment cost of $0.8 million.
Unconsolidated Variable Interest Entities (“VIE”)
VJU
On September 26, 2014, the Company acquired a 19.8% interest in VJU ITV Development GmbH (“VJU”), a software company based in Austria, for $2.5 million. Since VJU’s equity is deemed not sufficient to permit it to finance its activities without additional support from its shareholders, VJU is considered a variable interest entity (“VIE”). The Company determined that it is not the primary beneficiary of VJU because its financial interest in VJU’s equity and its research and development agreement with VJU do not empower the Company to direct VJU’s activities that will most significantly impact VJU’s economic performance. VJU is accounted for as a cost method investment as the Company does not have significant influence over the operational and financial policies of VJU.
The Company attended a VJU board meeting on March 5, 2015 as an observer. At that meeting, the Company was made aware of significant decreases in VJU’s business prospects, VJU’s existing working capital and prospects for additional funding, compared to the prior information the Company had received from VJU. Based on the Company’s assessment, the Company determined that its investment in VJU was impaired on an other-than-temporary basis. Factors considered included the severity of the impairment and recent events specific to VJU. Based on the Company’s assessment of VJU’s expected cash flows, the entire investment is expected to be non-recoverable. As a result, the Company recorded an impairment charge of $2.5 million in the first quarter of 2015. The Company has no remaining loss exposure from the VJU investment at December 31, 2016.
At VJU’s shareholders meeting held on October 15, 2015, additional contributions by existing shareholders were approved. The Company did not provide additional contributions to VJU, and as a result, the Company‘s equity interest in VJU decreased from 19.8% to 9.9%.
EDC
79
On October 22, 2014, the Company acquired an 18.4% interest in Encoding.com, Inc. (“EDC”), a video transcoding service company headquartered in San Francisco, California, for $3.5 million by subscribing to EDC’s Series B preferred stock. Since EDC’s equity is deemed not sufficient to permit it to finance its activities without additional support from its shareholders, EDC is considered a VIE. The Company determined that it is not the primary beneficiary of EDC because its financial interest in EDC’s equity does not empower the Company to direct EDC’s activities that will most significantly impact EDC’s economic performance. In addition, the Company determined that its investment in EDC’s Series B preferred stock does not have the risk and reward characteristics that are substantially similar to EDC’s common stock. Therefore, Harmonic does not hold an investment in EDC’s common stock or in-substance common stock. According to the applicable accounting guidance, EDC investment is accounted for as a cost-method investment. The Company determined that there were no indicators existing at December 31, 2016 that would indicate that the EDC investment was impaired. As of December 31, 2016 and December 31, 2015, the carrying value of EDC was both $3.6 million.
The following table presents the carrying values and maximum exposure of the unconsolidated VIEs as of December 31, 2016 (in thousands):
Carrying Value | Maximum exposure to loss(1) | ||||||
VJU | $ | — | $ | — | |||
EDC (2) | 3,593 | 3,593 | |||||
Total | $ | 3,593 | $ | 3,593 | |||
(1) The Company did not provide financial support to any of its unconsolidated VIEs during the year ended December 31, 2016. As of December 31, 2016, there were no explicit arrangements or implicit variable interests that could require the Company to provide financial support to any of its unconsolidated VIEs.
(2) The Company’s maximum exposure to loss with respect to EDC as of December 31, 2016 was limited to the investment cost of $3.6 million, including $0.1 million of transaction costs.
Each reporting period, the Company reviews all of its unconsolidated VIE investments to determine whether there are any reconsideration events that may result in the Company being a primary beneficiary of the unconsolidated VIE which would then require the Company to consolidate the VIE. The Company also reviews all its cost-method investments at each reporting period to determine whether a significant event of change in circumstances has occurred that may have an adverse effect on the fair value of each investment.
NOTE 6: DERIVATIVES AND HEDGING ACTIVITIES
The Company uses forward contracts, to manage exposures to foreign currency exchange rates. The Company’s primary objective in holding derivative instruments is to reduce the volatility of earnings and cash flows associated with fluctuations in foreign currency exchange rates and the Company does not use derivative instruments for trading purposes. The use of derivative instruments expose the Company to credit risk to the extent that the counterparties may be unable to meet their contractual obligations, as such, the potential risk of loss with any one counterparty is closely monitored by the Company.
Derivatives Designated as Hedging Instruments (Cash Flow Hedges)
Beginning in December 2014, the Company entered into forward currency contracts to hedge forecasted operating expenses and service costs related to employee salaries and benefits denominated in Israeli shekels (“ILS”) for its subsidiaries in Israel. These ILS forward contacts mature generally within twelve months and are designated as cash flow hedges. For derivatives that are designated as hedges of forecasted foreign currency denominated operating expenses and service costs, the Company assesses effectiveness based on changes in spot currency exchange rates. Changes in spot rates on the derivative are recorded as a component of “Accumulated other comprehensive income (loss)” (“AOCI”) in the Consolidated Balance Sheet until such time as the hedged transaction impacts earnings. The change in fair value of the forward points, which reflects the interest rate differential between the two countries on the derivative, is excluded from the effectiveness assessment. Gains or losses on the derivative representing either hedge ineffectiveness or hedge components excluded from the assessment of effectiveness are recognized in current earnings.
Derivatives Not Designated as Hedging Instruments (Balance Sheet Hedges)
Balance sheet hedges consist of foreign currency forward contracts, mature generally within three months, are carried at fair value and they are used to minimize the short-term impact of foreign currency exchange rate fluctuation on cash and certain trade and inter-company receivables and payables. Changes in the fair value of these foreign currency forward contracts are
80
recognized in “Other expense, net” in the Consolidated Statement of Operations and are largely offset by the changes in the fair value of the assets or liabilities being hedged.
The locations and amounts of designated and non-designated derivative instruments’ gains and losses reported in the Company’s AOCI and Consolidated Statements of Operations were as follows (in thousands):
Years ended December 31, | ||||||||||||||
Financial Statement Location | 2016 | 2015 | 2014 | |||||||||||
Derivatives designated as hedging instruments: | ||||||||||||||
Gains (losses) in AOCI on derivatives (effective portion) | AOCI | $ | 202 | $ | (133 | ) | $ | 311 | ||||||
Gains (losses) reclassified from AOCI into income (effective portion) | Cost of Revenue | $ | (6 | ) | $ | 59 | $ | — | ||||||
Operating Expense | (38 | ) | 365 | — | ||||||||||
Total | $ | (44 | ) | $ | 424 | $ | — | |||||||
Gains (losses) recognized in income on derivatives (ineffectiveness portion and amount excluded from effectiveness testing) | Other income (expense), net | $ | (63 | ) | $ | (87 | ) | $ | 18 | |||||
Derivatives not designated as hedging instruments: | ||||||||||||||
Gains (losses) recognized in income | Other income (expense), net | $ | 343 | $ | 344 | $ | (72 | ) | ||||||
As of December 31, 2016, there was no AOCI balance as there were no cash flow hedge contracts outstanding at December 31, 2016.
The U.S. dollar equivalent of all outstanding notional amounts of foreign currency forward contracts are summarized as follows (in thousands):
December 31, | ||||||||
2016 | 2015 | |||||||
Derivatives designated as cash flow hedges: | ||||||||
Purchase | $ | — | $ | 12,984 | ||||
Derivatives not designated as hedging instruments: | ||||||||
Purchase | $ | 4,056 | $ | 6,942 | ||||
Sell | $ | 11,157 | $ | 11,332 | ||||
The locations and fair value amounts of the Company’s derivative instruments reported in its Consolidated Balance Sheets are as follows (in thousands):
81
Asset Derivatives | Liability Derivatives | |||||||||||||||||||
Balance Sheet Location | December 31, 2016 | December 31, 2015 | Balance Sheet Location | December 31, 2016 | December 31, 2015 | |||||||||||||||
Derivatives designated as hedging instruments: | ||||||||||||||||||||
Foreign currency contracts | Prepaid expenses and other current assets | $ | — | $ | 13 | Accrued and other current Liabilities | $ | — | $ | 281 | ||||||||||
$ | — | $ | 13 | $ | — | $ | 281 | |||||||||||||
Derivatives not designated as hedging instruments: | ||||||||||||||||||||
Foreign currency contracts | Prepaid expenses and other current assets | $ | 54 | $ | 100 | Accrued and other current Liabilities | $ | 40 | $ | 90 | ||||||||||
$ | 54 | $ | 100 | $ | 40 | $ | 90 | |||||||||||||
Total derivatives | $ | 54 | $ | 113 | $ | 40 | $ | 371 | ||||||||||||
Offsetting of Derivative Assets and Liabilities
The Company recognizes all derivative instruments on a gross basis in the Consolidated Balance Sheets. However, the arrangements with its counterparties allows for net settlement, which are designed to reduce credit risk by permitting net settlement with the same counterparty. As of December 31, 2016, information related to the offsetting arrangements was as follows (in thousands):
Gross Amounts of Derivatives Not Offset in the Consolidated Balance Sheets | ||||||||||||||||||||||||
Gross Amounts of Derivatives | Gross Amounts of Derivatives Offset in the Consolidated Balance Sheets | Net Amounts of Derivatives Presented in the Consolidated Balance Sheets | Financial Instrument | Cash Collateral Pledged | Net Amount | |||||||||||||||||||
Derivative Assets | $ | 54 | $ | — | $ | 54 | $ | (9 | ) | $ | — | $ | 45 | |||||||||||
Derivative Liabilities | $ | 40 | $ | — | $ | 40 | $ | (9 | ) | $ | — | $ | 31 | |||||||||||
In connection with the foreign currency derivatives entered in Israel, the Company’s subsidiaries in Israel are required to maintain a compensating balance with their bank at the end of each month. These compensating balance arrangements do not legally restrict the use of cash. As of December 31, 2016, the total compensating balance maintained was $2.5 million.
NOTE 7: FAIR VALUE MEASUREMENTS
The applicable accounting guidance establishes a framework for measuring fair value and requires disclosure about the fair value measurements of assets and liabilities. This guidance requires the Company to classify and disclose assets and liabilities measured at fair value on a recurring basis, as well as fair value measurements of assets and liabilities measured on a nonrecurring basis in periods subsequent to initial measurement, in a three-tier fair value hierarchy as described below.
The guidance defines fair value as the exchange price that would be received for an asset or paid to transfer a liability, in the principal or most advantageous market for the asset or liability, in an orderly transaction between market participants on the measurement date.
Valuation techniques used to measure fair value must maximize the use of observable inputs and minimize the use of unobservable inputs. The guidance describes three levels of inputs that may be used to measure fair value:
• | Level 1 — Observable inputs that reflect quoted prices for identical assets or liabilities in active markets. |
82
• | Level 2 — Observable inputs other than Level 1 prices, such as quoted prices for similar assets or liabilities, quoted prices in markets that are not active, or other inputs that are observable or can be corroborated by observable market data for substantially the full term of the assets or liabilities. The Company primarily uses broker quotes for valuation of its short-term investments. The forward exchange contracts are classified as Level 2 because they are valued using quoted market prices and other observable data for similar instruments in an active market. |
• | Level 3 — Unobservable inputs that are supported by little or no market activity and that are significant to the fair value of the assets or liabilities. |
The carrying value of the Company’s financial instruments, including cash equivalents, restricted cash, short-term investments, accounts receivable, accounts payable and accrued and other current liabilities, approximate fair value due to their short maturities.
The Company uses the market approach to measure fair value for its financial assets and liabilities. The market approach uses prices and other relevant information generated by market transactions involving identical or comparable assets or liabilities. The fair value of the Company’s convertible notes is influenced by interest rates, the Company’s stock price and stock market volatility. The estimated fair value of the Company’s convertible notes based on a market approach was approximately $143.5 million and $123.1 million as of December 31, 2016 and December 31, 2015, respectively, and represents a Level 2 valuation. The Company’s other debts and capital leases assumed from the TVN acquisition are classified within Level 2 because these borrowings are not actively traded and the majority of them have a variable interest rate structure based upon market rates currently available to the Company for debt with similar terms and maturities. Additionally, the Company considers the carrying amount of its capital lease obligations to approximate their fair value because the weighted average interest rate used to formulate the carrying amounts approximates current market rates. The other debts and capital leases outstanding as of December 31, 2016 were $21.2 million in the aggregate. (See Note 12, “Convertible Notes, Other debts and Capital Leases,” for additional information).
The Company’s liability for the TVN VDP as of December 31, 2016 of $9.6 million is classified within Level 3 because discount rates which are unobservable in the market were being used to measure the fair value of this liability. (See Note 11, “Restructuring and related Charges-TVN VDP,” for additional information). The fair value of the TVN defined pension benefit plan liability of $4.3 million as of December 31, 2016 is disclosed in Note 13, “Employee Benefit Plans and Stock-based Compensation-TVN Retirement Benefit Plan.”
During the years ended December 31, 2016, 2015 and 2014 there were no nonrecurring fair value measurements of assets and liabilities subsequent to initial recognition.
The following tables provide the fair value measurement amounts for other financial assets recorded in the Company’s Consolidated Balance Sheets at December 31, 2016 and 2015 based on the three-tier fair value hierarchy:
Level 1 | Level 2 | Level 3 | Total | ||||||||||||
As of December 31, 2016 | |||||||||||||||
Cash equivalents | |||||||||||||||
Money market funds | $ | 8,301 | $ | — | $ | — | $ | 8,301 | |||||||
Short-term investments | |||||||||||||||
Corporate bonds | — | 6,923 | — | 6,923 | |||||||||||
Prepaids and other current assets | |||||||||||||||
Derivative assets | — | 54 | — | 54 | |||||||||||
Other assets | |||||||||||||||
Long-term investment | 809 | — | — | 809 | |||||||||||
Total assets measured and recorded at fair value | $ | 9,110 | $ | 6,977 | $ | — | $ | 16,087 | |||||||
Accrued and other current liabilities | |||||||||||||||
Derivative liabilities | $ | — | $ | 40 | $ | — | $ | 40 | |||||||
Accrued TVN VDP, current portion | — | — | 6,597 | 6,597 | |||||||||||
Other non-current liabilities | |||||||||||||||
Accrued TVN VDP, long-term portion | — | — | 3,053 | 3,053 | |||||||||||
Total liabilities measured and recorded at fair value | $ | — | $ | 40 | $ | 9,650 | $ | 9,690 | |||||||
83
Level 1 | Level 2 | Level 3 | Total | ||||||||||||
As of December 31, 2015 | |||||||||||||||
Cash equivalents | |||||||||||||||
Money market funds | $ | 53,434 | $ | — | $ | — | $ | 53,434 | |||||||
U.S. Treasury bills | 24,998 | — | — | 24,998 | |||||||||||
Short-term investments | |||||||||||||||
Corporate bonds | — | 25,505 | — | 25,505 | |||||||||||
Commercial paper | — | 1,099 | — | 1,099 | |||||||||||
Prepaids and other current assets | |||||||||||||||
Time deposit pledged for credit card facility | — | 580 | — | 580 | |||||||||||
Derivative assets | — | 113 | — | 113 | |||||||||||
Other assets | |||||||||||||||
Long-term investment | 1,840 | — | — | 1,840 | |||||||||||
Total assets measured and recorded at fair value | $ | 80,272 | $ | 27,297 | $ | — | $ | 107,569 | |||||||
Accrued and other current liabilities | |||||||||||||||
Derivative liabilities | $ | — | $ | 371 | $ | — | $ | 371 | |||||||
Total liabilities measured and recorded at fair value | $ | — | $ | 371 | $ | — | $ | 371 | |||||||
NOTE 8: GOODWILL AND IDENTIFIED INTANGIBLE ASSETS
Goodwill
Goodwill represents the difference between the purchase price and the estimated fair value of the identifiable assets acquired and liabilities assumed. Goodwill is allocated among and evaluated for impairment at the reporting unit level, which is defined as an operating segment or one level below an operating segment. The Company has two reporting units, Video and Cable Edge.
The Company tests for goodwill impairment at the reporting unit level on an annual basis, or more frequently if events or changes in circumstances indicate that the asset is more likely than not impaired. The Company’s annual goodwill impairment test is performed in the fiscal fourth quarter, with a testing date at the end of fiscal October.
As of December 31, 2016, the Company has recorded goodwill of $41.7 million which includes the impact of measurement period adjustments for the TVN acquisition. Goodwill from the TVN acquisition is assigned to the Video reporting unit.
The changes in the carrying amount of goodwill for the year ended December 31, 2016 are as follows (in thousands):
Video | Cable Edge | Total | ||||||||||
Balance as of December 31, 2015 | $ | 136,904 | $ | 60,877 | $ | 197,781 | ||||||
Goodwill from TVN acquisition | 41,670 | — | 41,670 | |||||||||
Foreign currency translation adjustment | (2,055 | ) | (117 | ) | (2,172 | ) | ||||||
Balance as of December 31, 2016 | $ | 176,519 | $ | 60,760 | $ | 237,279 | ||||||
Application of the goodwill impairment test requires judgment, including the identification of reporting units, assigning assets and liabilities to reporting units, assigning goodwill to reporting units, and determining the fair value of each reporting unit. Significant judgments required to estimate the fair value of reporting units include estimating future cash flows and determining appropriate discount rates, growth rates, an appropriate control premium and other assumptions. Changes in these estimates and assumptions could materially affect the determination of fair value for each reporting unit which could trigger impairment. If the Company’s assumptions and related estimates change in the future, or if the Company’s reporting structure changes or other events and circumstances change (e.g. such as a sustained decrease in the Company’s stock price), the Company may be required to record impairment charges in future periods. Any impairment charges that the Company may take in the future could be material to its results of operations and financial condition.
84
A significant decline in a company’s stock price may suggest that an adverse change in the business climate may have caused the fair value of one or more reporting units to fall below their carrying value. During the second quarter of 2016, the sustained decline in the Company’s stock price led to a triggering event for goodwill impairment assessment. As of July 1, 2016, with a closing stock price of $3.01 on The NASDAQ Stock Market, the Company’s market capitalization was approximately $235 million. As this market capitalization was less than the Company’s net book value, further analysis was performed to determine if an impairment exists. When assessing goodwill for impairment, the Company used multiple valuation methodologies to determine its enterprise value. The valuation methods used included the Company’s market capitalization adjusted for a control premium and the Company’s discounted cash flow analysis, which involves making significant assumptions and estimates, including expectations of the Company’s future financial performance, the Company’s weighted average cost of capital and the Company’s interpretation of currently enacted tax laws. Based on the impairment test performed, management determined that the Company’s goodwill was not impaired as of July 1, 2016. As of September 30, 2016, the Company’s closing stock price was $5.93.
The Company performed its annual goodwill impairment review at October 31, 2016. As of October 31, 2016, with a closing stock price of $5.10 on The NASDAQ Stock Market, the Company’s market capitalization was approximately $400 million. The Company used the same methodologies as in the second quarter of 2016 to determine its enterprise value but with updated assumptions and estimates to reflect the most current expectations of the Company’s future financial performance. Based on the impairment test performed, management concluded that goodwill was not impaired as the Video and Cable Edge reporting units had estimated fair values in excess of their carrying value by approximately 67% and 123%, respectively. As of December 31, 2016, the Company’s closing stock price was $5.00.
The Company has not recorded any impairment charges related to goodwill for any prior periods.
Intangible Assets
For the year ended December 31, 2016, the gross amount for intangible assets increased $39.5 million, of which $41.1 million was due to the TVN acquisition, offset in part by $1.6 million of foreign currency exchange effect. The following is a summary of the Company’s identified intangible assets (in thousands):
December 31, 2016 | December 31, 2015 | ||||||||||||||||||||||||
Weighted Average Remaining Life (Years) | Gross Carrying Amount | Accumulated Amortization | Net Carrying Amount | Gross Carrying Amount | Accumulated Amortization | Net Carrying Amount | |||||||||||||||||||
Developed core technology | 3.2 | $ | 31,707 | $ | (15,216 | ) | $ | 16,491 | $ | 10,987 | $ | (10,987 | ) | $ | — | ||||||||||
Customer relationships/contracts | 4.2 | 44,384 | (32,098 | ) | 12,286 | 29,200 | (25,752 | ) | 3,448 | ||||||||||||||||
Trademarks and tradenames | 3.2 | 573 | (119 | ) | 454 | — | — | — | |||||||||||||||||
Maintenance agreements and related relationships | N/A | 5,500 | (5,500 | ) | — | 5,500 | (4,851 | ) | 649 | ||||||||||||||||
Order Backlog | N/A | 3,011 | (3,011 | ) | — | — | — | — | |||||||||||||||||
Total identifiable intangibles | $ | 85,175 | $ | (55,944 | ) | $ | 29,231 | $ | 45,687 | $ | (41,590 | ) | $ | 4,097 | |||||||||||
The TVN in-process research and development efforts were completed by the end of the second quarter of 2016 and the Company determined that it has become a finite lived intangible asset (developed technology) with an estimated useful life of four years.
Amortization expense for the identifiable intangible assets for the years ended December 31, 2016, 2015 and 2014 was allocated as follows (in thousands):
December 31, | |||||||||||
2016 | 2015 | 2014 | |||||||||
Included in cost of revenue | $ | 4,434 | $ | 719 | $ | 13,745 | |||||
Included in operating expenses | 10,402 | 5,783 | 6,775 | ||||||||
Total amortization expense | $ | 14,836 | $ | 6,502 | $ | 20,520 | |||||
85
The estimated future amortization expense of identifiable intangible assets with definite lives is as follows (in thousands):
Cost of Revenue | Operating Expenses | Total | |||||||||
Year ended December 31, | |||||||||||
2017 | $ | 5,180 | $ | 3,092 | $ | 8,272 | |||||
2018 | 5,180 | 3,092 | 8,272 | ||||||||
2019 | 5,180 | 3,092 | 8,272 | ||||||||
2020 | 951 | 2,972 | 3,923 | ||||||||
2021 | — | 492 | 492 | ||||||||
Total future amortization expense | $ | 16,491 | $ | 12,740 | $ | 29,231 | |||||
NOTE 9: ACCOUNTS RECEIVABLE
Accounts receivable, net of allowances, consisted of the following (in thousands):
December 31, | |||||||
2016 | 2015 | ||||||
Accounts receivable, net: | |||||||
Accounts receivable | $ | 91,596 | $ | 73,855 | |||
Less: allowance for doubtful accounts and sales returns | (4,831 | ) | (4,340 | ) | |||
Total | $ | 86,765 | $ | 69,515 | |||
Trade accounts receivable are recorded at invoiced amounts and do not bear interest. The Company generally does not require collateral and performs ongoing credit evaluations of its customers and provides for expected losses. The Company maintains an allowance for doubtful accounts based upon the expected collectability of its accounts receivable. The expectation of collectability is based on the Company’s review of credit profiles of customers, contractual terms and conditions, current economic trends and historical payment experience.
The following is a summary of activity in allowances for doubtful accounts and sales returns for the three years ended December 31, 2016, 2015 and 2014 (in thousands):
Balance at Beginning of Period | Charges to Revenue | Charges (Credits) to Expense | Additions to (Deductions from) Reserves | Balance at End of Period | |||||||||||||||
Year ended December 31, | |||||||||||||||||||
2016 | $ | 4,340 | $ | 1,488 | $ | 1,100 | $ | (2,097 | ) | $ | 4,831 | ||||||||
2015 | $ | 7,057 | $ | 1,826 | $ | 208 | $ | (4,751 | ) | $ | 4,340 | ||||||||
2014 | $ | 8,214 | $ | 2,181 | $ | (238 | ) | $ | (3,100 | ) | $ | 7,057 | |||||||
NOTE 10: CERTAIN BALANCE SHEET COMPONENTS
The following tables provide details of selected balance sheet components (in thousands):
86
December 31, | |||||||
2016 | 2015 | ||||||
Prepaid expenses and other current assets: | |||||||
Deferred cost of revenue | $ | 6,856 | $ | 4,601 | |||
French R&D tax credits receivables (1) | 5,895 | — | |||||
Prepaid maintenance, royalty, rent, property taxes and value added tax | 5,526 | 7,167 | |||||
Prepaid customer incentive (2) | 1,162 | — | |||||
Restricted cash (3) | 731 | 1,093 | |||||
Prepaid inventories to contract manufacturer (4) | — | 8,500 | |||||
Other | 6,149 | 3,642 | |||||
Total | $ | 26,319 | $ | 25,003 | |||
(1) The Company’s acquired TVN subsidiary in France (the “TVN French Subsidiary”) participates in the French Crédit d’Impôt Recherche (“CIR”) program (the “R&D tax credits”) which allows companies to monetize eligible research expenses. The R&D tax credits can be used to offset against income tax payable to the French government in each of the four years after being incurred, or if not utilized, are recoverable in cash. The amount of R&D tax credits recoverable are subject to audit by the French government and during the second quarter of 2016, the French government approved the 2012 claim and refunded $5.8 million to the TVN French Subsidiary. The remaining R&D tax credit receivables at December 31, 2016 were approximately $25.7 million and are expected to be recoverable from 2017 through 2020 with $5.9 million reported under “Prepaid and other Current Assets” and $19.8 million reported under “Other Long-term Assets” on the Company’s Consolidated Balance Sheets.
(2) On September 26, 2016, the Company granted a warrant to purchase shares of common stock (the “Warrant”) to Comcast pursuant to which Comcast may, subject to certain vesting provisions. The Warrant issued to Comcast is considered an incentive for Comcast to purchase certain of the Company’s products. Therefore the value of the Warrant will be recorded as a reduction in the Company’s net revenues to the extent such value does not exceed net revenues from pertinent sales to Comcast. The portion of the Warrant which vested on September 26, 2016 had a value of $1.6 million and is deemed a customer incentive paid upfront and in the fourth quarter of 2016, $0.4 million of this prepaid incentive has been recorded as a reduction to the Company’s 2016 net revenues from Comcast and remaining $1.2 million of this prepaid incentive is recorded as an asset under “Prepaid expenses and other current assets” on the Company’s Consolidated Balance Sheet as of December 31, 2016.
(3) The restricted cash balances are held as cash collateral security for certain bank guarantees. These restricted funds are invested in bank deposits and cannot be withdrawn from the Company’s accounts without the prior written consent of the applicable secured party. Additionally, as of December 31, 2016, the Company had approximately $1.1 million of restricted cash for the bank guarantee associated with the TVN French Subsidiary’s office building lease. This amount is reported under “Other Long-term Assets” on the Company’s Consolidated Balance Sheets.
(4) From time to time, the Company makes advance payment to a supplier for future inventory in order to secure more favorable pricing. The advance payment balance at December 31, 2015 was fully offset in 2016 against the accounts payable owed to this supplier. No advance payment to this supplier was outstanding at December 31, 2016.
December 31, | |||||||
2016 | 2015 | ||||||
Inventories: | |||||||
Raw materials | $ | 9,889 | $ | 5,421 | |||
Work-in-process | 2,318 | 1,950 | |||||
Finished goods | 17,776 | 19,827 | |||||
Service-related spares | 11,210 | 11,621 | |||||
Total | $ | 41,193 | $ | 38,819 | |||
87
December 31, | |||||||
2016 | 2015 | ||||||
Property and equipment, net: | |||||||
Machinery and equipment | $ | 97,989 | $ | 93,010 | |||
Capitalized software | 34,519 | 29,391 | |||||
Leasehold improvements | 14,455 | 10,000 | |||||
Furniture and fixtures | 8,993 | 7,808 | |||||
Property and equipment, gross | 155,956 | 140,209 | |||||
Less: accumulated depreciation and amortization | (123,792 | ) | (113,197 | ) | |||
Total | $ | 32,164 | $ | 27,012 | |||
December 31, | |||||||
2016 | 2015 | ||||||
Accrued and other current liabilities: | |||||||
Accrued employee compensation and related expenses | $ | 19,377 | $ | 12,083 | |||
Accrued TVN VDP, current (1) | 6,597 | — | |||||
Accrued warranty | 4,862 | 3,913 | |||||
Customer deposits | 4,537 | 953 | |||||
Contingent inventory reserves | 2,210 | 1,315 | |||||
Accrued royalty payments | 1,912 | 873 | |||||
Other | 15,655 | 12,217 | |||||
Total | $ | 55,150 | $ | 31,354 | |||
December 31, | |||||||
2016 | 2015 | ||||||
Other non-current Liabilities: | |||||||
Deferred revenue, long-term | $ | 4,652 | $ | 3,093 | |||
Pension, long-term | 4,237 | — | |||||
Deferred rent, long-term | 4,226 | 6,340 | |||||
Accrued TVN VDP, long-term (1) | 3,053 | — | |||||
Other | 2,263 | 294 | |||||
Total | $ | 18,431 | $ | 9,727 | |||
(1) See Note 11, “Restructuring and related charges-TVN VDP,” for additional information on the Company’s TVN VDP liabilities.
NOTE 11: RESTRUCTURING AND RELATED CHARGES
The Company implemented several restructuring plans in the past few years and recorded restructuring and related charges of $18.0 million, $1.5 million and $3.1 million for the years ended December 31, 2016, 2015 and 2014, respectively. The goal of these plans was to bring operational expenses to appropriate levels relative to its net revenues, while simultaneously implementing extensive company-wide expense control programs.
The restructuring charges of $18.0 million in 2016 were primarily related to 2016 restructuring plan implemented in the first quarter of 2016. The restructuring charges of $1.5 million in 2015 were primarily related to the 2015 restructuring plan implemented during fourth quarter of 2014. Of the $3.1 million restructuring charges recorded in 2014, $2.2 million was recorded in the fourth quarter of 2014 related to the 2015 restructuring plan and the remaining $0.9 million were related to restructuring plan implemented in 2013.
The Company accounts for its restructuring plans under the authoritative guidance for exit or disposal activities. The restructuring and asset impairment charges are included in “Product cost of revenue” and “Operating expenses-restructuring
88
and related charges” in the Consolidated Statements of Operations. The following table summarizes the restructuring and related charges (in thousands):
Year ended December 31, | |||||||||||
2016 (1) | 2015 | 2014 | |||||||||
Product cost of revenue | $ | 3,400 | $ | 113 | $ | 315 | |||||
Operating expenses-Restructuring and related charges | 14,602 | 1,372 | 2,761 | ||||||||
Total | $ | 18,002 | $ | 1,485 | $ | 3,076 | |||||
(1) The restructuring and related charges for the year ended December 31, 2016 is net of $0.6 million and $1.4 million, in product cost of revenue and operating expenses-restructuring and related charges, respectively, of gain from TVN pension curtailment. See Note 13, “Employee Benefit Plans and Stock-based Compensation-TVN Retirement Benefit Plan,” for additional information on gain from TVN pension curtailment.
Harmonic 2016 Restructuring
In the first quarter of 2016, the Company implemented a new restructuring plan (the “Harmonic 2016 Restructuring Plan”) to streamline the corporate organization, thereby reducing operating costs by consolidating duplicative resources in connection with the acquisition of TVN. The planned activities have primarily resulted, and will primarily result, in cash expenditures related to severance and related benefits and exiting certain operating facilities and disposing of excess assets. In the second quarter of 2016, as part of the Company’s 2016 restructuring initiative, the Company also initiated a voluntary departure plan in France to streamline the organization of the TVN French Subsidiary (the “TVN VDP”).
In 2016, the Company recorded an aggregate of $20.0 million of restructuring and related charges under the Harmonic 2016 Restructuring Plan, of which $2.2 million is primarily related to the Company exiting from the excess facility at its U.S. headquarters and the remaining $17.8 million is related to severance and benefits for the termination of 118 employees worldwide, including 83 employees in France who participated in the TVN VDP. (See details of TVN VDP described below). Additionally, the restructuring and related charges under the Harmonic 2016 Restructuring Plan is offset by approximately $2.0 million of gain from TVN pension curtailment. For the employees who participated in the TVN VDP, their pension benefit will be funded by the TVN VDP and as a result, the TVN defined benefit pension plan was remeasured at December 31, 2016, which resulted in a non-cash curtailment gain. This gain was recorded as an offset to restructuring costs in the Company’s Statement of Operations, of which $0.6 million is included in product cost of revenue and the remaining $1.4 million is included in operating expenses-restructuring and related charges. (See Note 13, “Employee Benefit Plans and Stock-based Compensation-TVN Retirement Benefit Plan,” for additional information on gain from TVN pension curtailment).
The Company also incurred $16.9 million of TVN acquisition- and integration-related expenses in 2016 (See Note 3, “Business Acquisition,” for additional information on TVN acquisition-and integration-related expenses).
A majority of the 2016 restructuring and integration activities were completed in 2016 but some of the TVN VDP activities will continue into 2017 based on the contractual terms with each employee. The Company anticipates incurring approximately $5 million of additional restructuring and TVN acquisition- and integration-related expenses, under this plan in 2017. The estimated synergies from these restructuring activities and the TVN integration effort is anticipated to exceed $20 million on an annualized basis.
TVN VDP
In the second quarter of 2016, the Company initiated a consultative process with the works council for the French Subsidiary and applicable union representatives to establish a voluntary departure plan to enable French employees of TVN to voluntarily terminate with certain benefits. The Company finalized the consultation process and the terms of the voluntary departure plan in the third quarter of 2016. Following approval of the TVN VDP by the applicable French authorities in September 2016, employees were invited to apply for the voluntary termination benefits detailed in the TVN VDP. A total of 83 employees applied for the TVN VDP and were duly approved by the Company in the fourth quarter of 2016.
The total TVN VDP costs, including severance, certain benefits and taxes, as well as administration costs, is estimated at approximately $15.3 million, in aggregate, and will be paid over a period of four years, based on the TVN VDP terms agreed with each employee. The fair value of the total TVN VDP liability at inception is estimated to be approximately $14.8 million.
The Company accounts for these special termination benefits in accordance with ASC 712, “Compensation - Non-retirement Post-employment Benefits,” which requires that the special termination benefits be recognized as a liability and a
89
loss beginning when an employee accepts the offer of voluntary termination and the amount can be reasonably estimated. Where an employee is required to work beyond a minimum statutory notice period, the cost of the special termination benefit is recognized as an expense over the employee’s remaining service period. Where the employee is not required to work beyond a minimum statutory notice period, the cost of the special termination benefit is recognized upon the date the employee accepts the offer of voluntary termination, provided that the amount of the benefit can be estimated. Out of the 83 employees who applied for TVN VDP, 11 of them are required to work beyond the minimum statutory notice period into 2017. Based on the application of the accounting guidance, the Company recorded a charge of $13.1 million for TVN VDP costs in the fourth quarter of 2016, of which $3.5 million was already paid in 2016, resulting in a TVN VDP liability balance of $9.6 million at December 31, 2016.
The table below shows the estimated future payments for TVN VDP as of December 31, 2016 (in thousands):
Years ending December 31, | |||
2017 | $ | 6,757 | |
2018 | 3,021 | ||
2019 | 1,492 | ||
2020 | 696 | ||
Total | $ | 11,966 | |
Excess Facilities in San Jose, California
In January 2016, the Company exited an excess facility at its U.S. headquarters in San Jose, California and recorded $1.4 million in facility exit costs. The Company accounts for facility exit costs in accordance with ASC 420, “Exit or Disposal Cost Obligations”, which requires that a liability for such costs be recognized and measured initially at fair value on the cease-use date based on remaining lease rentals, adjusted for the effects of any prepaid or deferred items recognized, reduced by the estimated sublease rentals that could be reasonably obtained even if it is not the intent to sublease. The fair value of these liabilities is based on a net present value model using a credit-adjusted risk-free rate. The liability will be paid out over the remainder of the leased properties’ terms, which continue through August 2020. Actual sublease terms may differ from the estimates originally made by the Company. Any future changes in the estimates or in the actual sublease income could require future adjustments to the liabilities, which would impact net income in the period the adjustment is recorded. As of the cease-use date, the fair value of this restructuring liability totaled $2.5 million. Offsetting these charges was an adjustment for deferred rent liability relating to this space of $1.1 million. In December 2016, as a result of a change in the estimate in sublease income, the restructuring liability was increased by $0.6 million.
The following table summarizes the activity in the Company’s restructuring accrual related to the Harmonic 2016 Restructuring Plan as of December 31, 2016 (in thousands):
Excess facilities (1) | VDP (2) | Non-VDP Severance and benefits (3) | Other charges | Total | |||||||||||||||
Charges for 2016 Restructuring Plan | $ | 1,655 | $ | 13,175 | $ | 4,702 | $ | 247 | $ | 19,779 | |||||||||
Adjustments to restructuring provisions | 582 | — | (88 | ) | (247 | ) | 247 | ||||||||||||
Reclassification of deferred rent | 1,087 | — | — | — | 1,087 | ||||||||||||||
Cash payments | (948 | ) | (3,484 | ) | (3,075 | ) | — | (7,507 | ) | ||||||||||
Foreign exchange loss | (1 | ) | (41 | ) | (20 | ) | — | (62 | ) | ||||||||||
Balance at December 31, 2016 | 2,375 | 9,650 | 1,519 | — | 13,544 | ||||||||||||||
Less: current portion (4) | (1,085 | ) | (6,597 | ) | (1,519 | ) | — | (9,201 | ) | ||||||||||
Long-term portion (4) | $ | 1,290 | $ | 3,053 | $ | — | $ | — | $ | 4,343 | |||||||||
(1) In December 2016, the Company also exited from an excess facility at its office in Paris, France and recorded $0.2 million of facility exit costs. This liability will be fully paid in the first quarter of 2017.
(2) See discussion on TVN VDP above for future estimated payments under the TVN VDP through 2020.
(3) The Company anticipates that the remaining severance and benefits (non-TVN VDP related) accrual at December 31, 2016 will be fully paid by the first quarter of 2017.
(4) The current portion and long-term portion of the restructuring liability are reported under “Accrued and other current liabilities” and “Other non-current liabilities”, respectively, on the Company’s Consolidated Balance Sheets.
Harmonic 2015 Restructuring
90
In the fourth quarter of 2014, the Company implemented a restructuring plan (the “Harmonic 2015 Restructuring Plan”) to reduce 2015 operating costs and the planned restructuring activities involve headcount reduction, exiting certain operating facilities and disposing excess assets. The Company recorded $2.2 million and $1.5 million of restructuring and impairment charges under the Harmonic 2015 Restructuring Plan in fiscal 2014 and 2015, respectively, consisting primarily of severance and benefits for the termination of 56 employees worldwide as well as a fixed asset impairment charge related to software development costs incurred for a discontinued information technology.
The following table summarizes the activities in the Harmonic 2015 restructuring accrual during the years ended December 31, 2016, 2015 and 2014 (in thousands):
Termination of an information technology ("IT") project | Severance and benefits | Termination of a research and development project | Other charges | Total | |||||||||||||||
Charges for 2015 Restructuring Plan | $ | 1,138 | $ | 599 | $ | 307 | $ | 125 | $ | 2,169 | |||||||||
Cash payments | — | (294 | ) | (307 | ) | — | (601 | ) | |||||||||||
Non-cash write-offs | (1,138 | ) | — | — | (108 | ) | (1,246 | ) | |||||||||||
Balance at December 31, 2014 | — | 305 | — | 17 | 322 | ||||||||||||||
Charges for 2015 Restructuring Plan | — | 1,413 | — | 204 | 1,617 | ||||||||||||||
Adjustments to restructuring provisions | — | (126 | ) | — | (6 | ) | (132 | ) | |||||||||||
Cash payments | — | (1,328 | ) | — | (13 | ) | (1,341 | ) | |||||||||||
Non-cash write-offs | — | — | — | (202 | ) | (202 | ) | ||||||||||||
Balance at December 31, 2015 | — | 264 | — | — | 264 | ||||||||||||||
Adjustments to restructuring provisions | — | (70 | ) | — | (70 | ) | |||||||||||||
Cash payments | — | (194 | ) | — | (194 | ) | |||||||||||||
Balance at December 31, 2016 | $ | — | $ | — | $ | — | $ | — | $ | — | |||||||||
Harmonic 2013 Restructuring
The Company implemented a series of restructuring plans in 2013 to reduce costs and improve efficiencies and the actions extended through the third quarter of 2014. The Company recorded restructuring charges of $2.2 million in 2013 under this plan consisting primarily of severance and benefits related to the termination of 85 employees worldwide and, to a lesser extent, the costs associated with writing down some of its inventory to net realizable value due to restructuring activities in its Israel facilities. The Company recorded an additional $0.9 million restructuring charges in 2014 under this plan primarily for severance and benefits related to the termination of 25 employees worldwide.
The following table summarizes the activities in the Harmonic 2013 restructuring accrual during the years ended December 31, 2014 and 2013 (in thousands):
Severance | Impairment of Leasehold Improvement | Obsolete Inventories | Termination of a Research and Development Project | Excess Facilities | Total | ||||||||||||||||||
Charges for 2013 Restructuring Plan | $ | 1,663 | $ | 101 | $ | 404 | $ | — | $ | — | $ | 2,168 | |||||||||||
Adjustments to restructuring provisions | 29 | 48 | — | — | — | 77 | |||||||||||||||||
Cash payments | (1,513 | ) | — | — | — | — | (1,513 | ) | |||||||||||||||
Non-cash write-offs | — | (149 | ) | (404 | ) | — | — | (553 | ) | ||||||||||||||
Balance at December 31, 2013 | 179 | — | — | — | — | 179 | |||||||||||||||||
Charges for 2013 Restructuring Plan | 829 | — | — | 63 | 32 | 924 | |||||||||||||||||
Adjustments to restructuring provisions | (17 | ) | — | — | — | — | (17 | ) | |||||||||||||||
Cash payments | (991 | ) | — | — | (63 | ) | (32 | ) | (1,086 | ) | |||||||||||||
Balance at December 31, 2014 | $ | — | $ | — | $ | — | $ | — | $ | — | $ | — | |||||||||||
91
NOTE 12: CONVERTIBLE NOTES, OTHER DEBTS AND CAPITAL LEASES
4.00% Convertible Senior Notes
In December 2015, the Company issued $128.25 million aggregate principal amount of unsecured convertible senior notes due 2020 (the “offering” or “Notes”, as applicable) through a private placement with a financial institution. The Notes do not contain any financial covenants. The Notes bear interest at a fixed rate of 4.00% per year, payable semiannually in arrears on June 1 and December 1 of each year, beginning on June 1, 2016. The Notes will mature on December 1, 2020, unless earlier repurchased or converted. The Company incurred approximately $4.1 million of debt issuance cost, of which $3.5 million was paid in 2015 and the remainder was paid in the first quarter of 2016.
Concurrent with the closing of the offering, the Company used $49.9 million of the net proceeds to repurchase 11.1 million shares of the Company’s common stock from purchasers of the offering in privately negotiated transactions effected through the initial purchaser or its affiliate as the Company’s agent. Additionally, the Company used the remaining net proceeds from the offering to fund the TVN acquisition, which closed on February 29, 2016.
Subject to satisfaction of certain conditions and during certain periods, the Notes will be convertible at the option of holders into cash, shares of the Company’s common stock or a combination thereof, at the Company’s election, at an initial conversion rate of 173.9978 shares of Common Stock per $1,000 principal amount of Notes (which is equivalent to an initial conversion price of approximately $5.75 per share). The conversion rate and the corresponding conversion price will be subject to adjustment upon the occurrence of certain events.
Prior to September 1, 2020, the Notes will be convertible only under the following circumstances: (1) during any fiscal quarter commencing after the fiscal quarter ending on April 1, 2016 (and only during such fiscal quarter), if the last reported sale price of the Company’s common stock for at least 20 trading days (whether or not consecutive) during a period of 30 consecutive trading days ending on the last trading day of the immediately preceding fiscal quarter is greater than or equal to 130% of the conversion price of the Notes on each applicable trading day; (2) during the five business day period after any five consecutive trading day period (the “ measurement period ”) in which the trading price per $1,000 principal amount of Notes for each trading day of the measurement period was less than 98% of the product of the last reported sale price of the Company’s common stock and the conversion rate on each such trading day; or (3) upon the occurrence of specified corporate events. Commencing on September 1, 2020 until the close of business on the second scheduled trading day immediately preceding the maturity date, the Notes will be convertible in multiples of $1,000 principal amount regardless of the foregoing circumstances.
If a fundamental change occurs, holders of the Notes may require the Company to purchase all or any portion of their Notes for cash at a repurchase price equal to 100% of the principal amount of the Notes to be repurchased, plus any accrued and unpaid interest to, but excluding, the fundamental change repurchase date. In addition, if specific corporate events occur prior to the maturity date, the conversion rate may be increased for a holder who elects to convert the Notes in connection with such a corporate event.
In accounting for the issuance of the Notes, the Company separated the Notes into liability and equity components. The carrying amount of the liability component was calculated by measuring the fair value of a similar liability that does not have an associated convertible feature. The carrying amount of the equity component representing the conversion option was determined by deducting the fair value of the liability component from the initial proceeds of the Notes as a whole. The difference between the initial proceeds of the Notes and the liability component (the “debt discount”) of $26.9 million is amortized to interest expense using the effective interest method over the term of the Notes. The equity component of the Notes is included in additional paid-in capital in the Consolidated Balance Sheets and is not remeasured as long as it continues to meet the conditions for equity classification.
In accounting for the transaction costs related to the issuance of the Notes, the Company allocated the total amount of $4.1 million incurred to the liability and equity components using the same proportions as the proceeds from the Notes. Transaction costs attributable to the liability component were $3.2 million and were recorded as a direct deduction from the carrying amount of the debt liability in long-term liability in the Consolidated Balance Sheets and are being amortized to interest expense in the Consolidated Statements of Operations using the effective interest method over the term of the Notes. Transaction costs attributable to the equity component were $0.9 million and were netted with the equity component of the Notes in additional paid-in capital in the Consolidated Balance Sheets.
The following table presents the components of the Notes as of December 31, 2016 and December 31, 2015 (in thousands, except for years and percentages):
92
December 31, 2016 | December 31, 2015 | ||||||
Liability: | |||||||
Principal amount | $ | 128,250 | $ | 128,250 | |||
Less: Debt discount, net of amortization | (22,302 | ) | (26,732 | ) | |||
Less: Debt issuance costs, net of amortization | (2,689 | ) | (3,223 | ) | |||
Carrying amount | $ | 103,259 | $ | 98,295 | |||
Remaining amortization period (years) | 3.9 years | 4.9 years | |||||
Effective interest rate on liability component | 9.94 | % | 9.94 | % | |||
Equity: | |||||||
Value of conversion option | $ | 26,925 | $ | 26,925 | |||
Less: Equity issuance costs | (863 | ) | (863 | ) | |||
Carrying amount | $ | 26,062 | $ | 26,062 | |||
The following table presents interest expense recognized related to the Notes for the years ended December 31, 2016 and December 31, 2015 (in thousands):
Year ended December 31, | |||||||
2016 | 2015 | ||||||
Contractual interest expense | $ | 5,130 | $ | 240 | |||
Amortization of debt discount | 4,430 | 193 | |||||
Amortization of debt issuance costs | 534 | 23 | |||||
Total interest expense recognized | $ | 10,094 | $ | 456 | |||
Other Debts and Capital Leases
In connection with the TVN acquisition, the Company assumed a variety of debt and credit facilities in France to satisfy the financing requirements of TVN operations. These arrangements are summarized in the table below (in thousands):
December 31, 2016 | |||
Financing from French government agencies related to various government incentive programs (1) | $ | 17,930 | |
Term loans (2) | 1,400 | ||
Secured borrowings (3) | — | ||
Obligations under capital leases | 1,860 | ||
Total debt obligations | 21,190 | ||
Less: current portion | (7,275 | ) | |
Long-term portion | $ | 13,915 | |
Other than the 4.00% Notes, the Company did not have any other indebtedness as of December 31, 2015.
(1) As of December 31, 2016, the Company’s TVN French Subsidiary had an aggregate of $17.9 million of loans due to various financing programs of French government agencies, $14.7 million of which is related to loans backed by R&D tax credit receivables. As of December 31, 2016, the TVN French Subsidiary had an aggregate of $25.7 million of R&D tax credit receivables from the French government from 2017 through 2020. (See Note 10, “Certain Balance Sheet Components-Prepaid expenses and other current assets,” for more information). These tax loans have a fixed rate of 0.6%, plus EURIBOR 1 month plus 1.3% and matures between 2017 through 2019. The remaining loans of $3.3 million at December 31, 2016 primarily relates to financial support from French government agencies for R&D innovation projects at minimal interest rates and these loans mature between 2020 through 2023.
(2) One of the term loans with a certain financial institution contains annual covenants that require the TVN French Subsidiary to maintain a minimum working capital balance and various other financial covenants and restrictions that limit the French Subsidiary’s ability to incur additional indebtedness. The annual covenant is based on French statutory year-end results and the TVN French Subsidiary failed the 2016 covenant test primarily due to the Company’s plan to integrate TVN’s
93
operations into other subsidiaries for tax planning and logistic purpose. The Company has informed the financial institution of the 2016 covenant test results and has made plans to pay off the entire loan balance of approximately $0.4 million in early 2017 and as a result, the entire loan balance is recorded under “Other debts and capital lease obligations, current,” in the Consolidated Balance Sheets.
(3) The TVN French Subsidiary obtained advances under a credit line with BPI France against a pool of eligible receivables with recourse. The maximum advance under this credit line for receivables is €2 million (approximately $2.1 million as converted using the exchange rate at December 31, 2016), less applicable fees, and €200,000 (approximately $0.2 million as converted using the exchange rate at December 31, 2016) of cash is pledged for this program. This credit line was renewed in July 2016 for an additional year with no material change to the terms of the credit agreement. There was no balance outstanding to BPI France as of December 31, 2016.
Future minimum repayments
The table below shows the future minimum repayments of debts and capital lease obligations as of December 31, 2016 (in thousands):
Years ending December 31, | Capital lease obligations | Other Debt obligations | |||||
2017 | $ | 971 | $ | 6,304 | |||
2018 | 801 | 5,416 | |||||
2019 | 63 | 6,255 | |||||
2020 | 25 | 554 | |||||
2021 | — | 451 | |||||
Thereafter | — | 350 | |||||
Total | $ | 1,860 | $ | 19,330 | |||
Credit Facilities
On December 22, 2014, the Company entered into a Credit Agreement (the “Credit Agreement”) with JPMorgan Chase Bank, N.A. (“JPMorgan”) for a $20.0 million revolving credit facility, with a sublimit of $10.0 million for the issuance of commercial and standby letters of credit on the Company’s behalf. Revolving loans under the Credit Agreement may be borrowed, repaid and re-borrowed until December 22, 2015, at which time all amounts borrowed must be repaid. On December 7, 2015, the Company entered into a first amendment to the Credit Agreement with JPMorgan to permit the Company to incur the indebtedness related to issuance of the Notes mentioned above. On December 15, 2015, the Company entered into a second amendment to the Credit Agreement with JPMorgan to extend the expiration date of the Credit Agreement to February 20, 2016. The Company did not renew the agreement or enter into any new agreement.
NOTE 13: EMPLOYEE BENEFIT PLANS AND STOCK-BASED COMPENSATION
The Company’s stock benefit plans include the employee stock purchase plan and current active stock plans adopted in 1995 and 2002 as well as one stock plan assumed through an acquisition in 2010. Other than the employee stock purchase plan, the 1995 stock plan and the 2002 director plan described below, the other inactive plans have no shares available for future grant. The Company also assumed two existing TVN employee equity benefit plans in connection with the TVN acquisition. As of December 31, 2016, for the stock plan assumed through an acquisition, 121,043 shares were reserved for issuance.
Employee Stock Plans
1995 Stock Plan
The 1995 Stock Plan provides for the grant of incentive stock options, non-statutory stock options and restricted stock units (“RSUs”). Incentive stock options may be granted only to employees. All other awards may be granted to employees and consultants. Under the terms of the 1995 Stock Plan, incentive stock options may be granted at prices not less than 100% of the fair value of the Company’s common stock on the date of grant and non-statutory stock options may be granted at prices not less than 85% of the fair value of the Company’s common stock on the date of grant. RSUs have no exercise price. Both options and RSUs vest over a period of time as determined by the Company’s Board of Directors (the “Board”), generally two to four years, and expire seven years from date of grant. Options granted prior to February 2006 expire 10 years from the date of grant. Grants of RSUs and any non-statutory stock options issued at prices less than the fair market value on the date of grant
94
decrease the plan reserve 1.5 shares for every unit or share granted and any forfeitures of these awards due to their not vesting would increase the plan reserve by 1.5 shares for every unit or share forfeited. In connection with the Company’s acquisition of TVN, the Company agreed to make grants of RSUs with respect to a total of up to 1,750,000 shares (taking into account the share count provision for RSUs in the Company’s 1995 Stock Plan). The Company’s stockholders approved an amendment to the 1995 Stock Plan at the Company’s 2016 annual meeting of stockholders (“2016 Annual Meeting”) which increased the number of shares of common stock reserved for issuance under the 1995 Stock Plan by 2,000,000 shares. As of December 31, 2016, an aggregate of 12,029,588 shares of common stock were reserved for issuance under the 1995 Stock Plan, of which 3,501,498 shares remained available for grant.
In August 2016, the Company granted 898,533 shares of performance-based RSUs (“PRSUs”) under the 1995 Stock Plan to fund a portion of its 2016 incentive bonus payment obligations to its key executives and other eligible employees. The vesting of the PRSUs is based on the achievement of certain financial and non-financial operating goals of the Company and occurs within the next three to six months from the grant date.
2002 Director Plan
The 2002 Director Plan provides for the grant of non-statutory stock options and RSUs to non-employee directors of the Company. Under the terms of the 2002 Director Plan, non-statutory stock options may be granted at prices not less than 100% of the fair value of the Company’s common stock on the date of grant. RSUs have no exercise price. Both options and RSUs vest over a period of time as determined by the Board, generally three years for the initial grant and one year for subsequent grants to a non-employee director, and expire seven years from date of grant. Grants of RSUs decrease the plan reserve 1.5 shares for every unit granted and any forfeiture of these awards due to their not vesting would increase the plan reserve by 1.5 shares for every unit forfeited. In November 2015, the authorized number of shares under the 2002 Director Plan was increased from 2,000,000 to 2,350,000. As of December 31, 2016, an aggregate of 643,244 shares of common stock were reserved for issuance under the 2002 Director Plan, of which 409,244 shares remained available for grant.
Employee Stock Purchase Plan
The 2002 Employee Stock Purchase Plan (“ESPP”) provides for the issuance of share purchase rights to employees of the Company. The ESPP is intended to qualify as an “employee stock purchase plan” under Section 423 of the Internal Revenue Code. The ESPP enables employees to purchase shares at 85% of the fair market value of the Common Stock at the beginning or end of the offering period, whichever is lower. Offering periods generally begin on the first trading day on or after January 1 and July 1 of each year. Employees may participate through payroll deductions of 1% to 10% of their earnings. In the event that there are insufficient shares in the plan to fully fund the issuance, the available shares will be allocated across all participants based on their contributions relative to the total contributions received for the offering period. Under the ESPP, 1,265,458, 888,152 and 440,040 shares were issued during fiscal 2016, 2015 and 2014, respectively, representing $3.7 million, $5.2 million and $2.7 million in contributions. As of December 31, 2016, 906,390 shares were reserved for future purchases by eligible employees.
Stock Options, RSUs and PRSUs
The following table summarizes the Company’s stock option, RSU and PRSU activities during the year ended December 31, 2016 (in thousands, except per share amounts):
Stock Options Outstanding | Restricted Stock Units * Outstanding | |||||||||||||||
Shares Available for Grant | Number of Shares | Weighted Average Exercise Price | Number of Units | Weighted Average Grant Date Fair Value | ||||||||||||
Balance at December 31, 2015 | 6,150 | 5,674 | $ | 6.56 | 2,182 | $ | 6.99 | |||||||||
Authorized | 2,000 | — | — | — | — | |||||||||||
Granted | (6,201 | ) | 946 | 3.19 | 3,503 | 3.78 | ||||||||||
Options exercised | — | (150 | ) | 4.77 | — | — | ||||||||||
Shares released | — | — | — | (1,480 | ) | 6.57 | ||||||||||
Forfeited or canceled | 1,963 | (1,451 | ) | 6.46 | (341 | ) | 5.56 | |||||||||
Balance at December 31, 2016 | 3,912 | 5,019 | $ | 6.01 | 3,864 | $ | 4.26 | |||||||||
* The preceding table includes PRSUs activities during the year ended December 31, 2016.
95
The following table summarizes information about stock options outstanding as of December 31, 2016 (in thousands, except per share amounts and term):
Number of Shares | Weighted Average Exercise Price | Weighted Average Remaining Contractual Term (Years) | Aggregate Intrinsic Value | |||||||||
Vested and expected to vest | 4,839 | $ | 6.05 | 3.8 | $ | 1,930 | ||||||
Exercisable | 3,240 | 6.61 | 3.0 | 388 | ||||||||
The intrinsic value of options vested and expected to vest and exercisable as of December 31, 2016 is calculated based on the difference between the exercise price and the fair value of the Company’s common stock as of December 31, 2016. The intrinsic value of options exercised during the years ended December 31, 2016, 2015 and 2014 was $0.1 million, $1.7 million and $0.8 million, respectively, and is calculated based on the difference between the exercise price and the fair value of the Company’s common stock as of the exercise date.
The following table summarizes information about RSUs and PRSUs outstanding as of December 31, 2016 (in thousands, except term):
Number of Shares Underlying Restricted Stock Units | Weighted Average Remaining Vesting Period (Years) | Aggregate Fair Value | ||||||
Vested and expected to vest | 3,606 | 0.6 | $ | 18,031 | ||||
The fair value of RSUs and PRSUs vested and expected to vest as of December 31, 2016 is calculated based on the fair value of the Company’s common stock as of December 31, 2016.
TVN Employee Equity Benefit Plan
TVN’s existing employee equity benefit plans consist of the French Employee Incentive plan and the Overseas Long Term Incentive plan. The Company’s acquisition of TVN gave rise to a change-in-control event which causes both plans to become fully vested and the settlement of both plans have to be made in cash according to the agreements. The payment was made in full in the second quarter of 2016 in the amount of approximately $2.9 million upon finalizing the closing adjustments to the TVN purchase price.
TVN Retirement Benefit Plan
As part of the TVN acquisition the Company assumed obligations under defined benefit pension plans which were unfunded as of the acquisition date. Under French law, the TVN French Subsidiary is required to make certain payments to employees upon their retirement from the Company. These payments are based on the retiring employee’s salary for a number of months that varies according to the employee’s period of service and position. Salary used in the calculation is the employee’s average monthly salary for the twelve months prior to retirement. The payments are made in one lump-sum at the time of retirement.
The company’s pension obligations are measured as of December 31. The present value of these lump-sum payments is determined on an actuarial basis and the actuarial valuation takes into account the employees’ age and period of service with the company; projected mortality rates, mobility rates and increases in salaries; and a discount rate. The table below shows the present value of the Company’s pension obligations as of December 31, 2016 and changes to the Company’s pension obligations (in thousands):
96
December 31, 2016 | |||
Projected benefit obligation: | |||
Acquired from TVN acquisition | $ | 5,907 | |
Service cost | 217 | ||
Interest cost | 87 | ||
Actuarial losses | 279 | ||
Curtailment | (1,955 | ) | |
Foreign currency translation adjustment | (271 | ) | |
As of December 31, 2016 | $ | 4,264 | |
Presented on the Consolidated Balance Sheets under: | |||
Current portion (presented under “Accrued and other current liabilities”) | $ | 27 | |
Long-term portion (presented under “Other non-current liabilities”) | $ | 4,237 | |
The plan was unfunded as of December 31, 2016. There are no contributions to the plan required by any laws or funding regulations, discretionary contributions or non-cash contributions expected to be made.
Net periodic costs for the year ended December 31, 2016 were $304,000 and the accumulated benefit obligation as of December 31, 2016 was $3.3 million. During the year ended December 31, 2016, the Company recorded an actuarial loss of $0.3 million as a component of accumulated other comprehensive Income (loss) (“AOCI”). The Company accounts for the actuarial loss in accordance with ASC 715, “Compensation - Retirement Benefits”. If the net accumulated gain or loss exceeds 10% of the projected plan benefit obligation or the market-related value of plan assets, a portion of the net gain or loss is amortized and included in expense for the following year based upon the average remaining service period of active plan participants, unless the Company’s policy is to recognize all actuarial gains (losses) when they occur. The Company elected to defer actuarial gains (losses) in AOCI. As of December 31, 2016, the Company did not meet the 10% requirement, and therefore no amortization of 2016 actuarial loss would be recorded in fiscal 2017.
As indicated in Note 11, “Restructuring and related charges”, the Company finalized the terms of the TVN VDP and 83 employee applications were approved by the Company in the fourth quarter of 2016. The Company settled its retirement obligations under the TVN defined benefit pension plan for the terminating employees through payment of voluntary termination benefits. The Company accounts for these settlements in accordance with ASC 715, “Compensation - Retirement Benefits”, which requires that the settlement be accounted for when an employee accepts the offer of voluntary termination. As a result of the TVN VDP, the defined benefit pension plan was remeasured, which resulted in a non-cash curtailment gain of approximately $2.0 million. The curtailment gain was recognized in the Consolidated Statement of Operations during the fourth quarter of 2016 and the Company’s pension liability was reduced by the same amount. Of the $2.0 million pension curtailment gain, $0.6 million is included in product cost of revenue and the remaining $1.4 million is included in operating expenses-restructuring and related charges in the Consolidated Statement of Operations. The remeasurement did not have a material effect on other components of net periodic pension expense for the year ended December 31, 2016.
The following assumptions were used in determining the Company’s pension obligation:
December 31, 2016 | ||
Discount rate | 1.5 | % |
Mobility rate | 3.0 | % |
Salary progression rate | 2.0 | % |
The Company evaluates the discount rate assumption annually. The discount rate used for the Company’s valuation study was based on the rate of long-term Euro zone AA rated 10 year corporate bonds as of December 31, 2016, which yielded 1.5%.
The Company also evaluates other assumptions related to demographic factors, such as retirement age, mortality rates and turnover periodically, updating them to reflect experience and expectations for the future. The mortality assumption related to the Company’s defined benefit pension plan used mortality tables published in January 2017 by the French National Institute of Statistics and Economic Studies.
97
Future benefits expected to be paid in each of the next five years, and in the aggregate for the five year period thereafter are as follows (in thousands):
Years ending December 31, | |||
2017 | $ | 29 | |
2018 | 29 | ||
2019 | 46 | ||
2020 | — | ||
2021 | 66 | ||
2022 - 2026 | 2,015 | ||
$ | 2,185 | ||
401(k) Plan
The Company has a retirement/savings plan which qualifies as a thrift plan under Section 401(k) of the Internal Revenue Code. This plan allows participants to contribute up to the applicable Internal Revenue Code limitations under the plan. The Company can make discretionary contributions to the plan of 25% of the first 4% contributed by eligible participants, up to a maximum contribution per participant of $1,000 per year. The Company’s contributions to the plan was $0.4 million for each of the fiscal years from 2014 through 2016.
Stock-based Compensation
The following table summarizes stock-based compensation expense for all plans (in thousands):
Year ended December 31, | |||||||||||
2016 | 2015 | 2014 | |||||||||
Stock-based compensation in: | |||||||||||
Cost of revenue | $ | 1,554 | $ | 1,862 | $ | 2,359 | |||||
Research and development expense | 3,711 | 4,435 | 4,844 | ||||||||
Selling, general and administrative expense | 7,795 | 9,285 | 10,084 | ||||||||
Total stock-based compensation in operating expense | 11,506 | 13,720 | 14,928 | ||||||||
Total stock-based compensation recognized in net loss | $ | 13,060 | $ | 15,582 | $ | 17,287 | |||||
As of December 31, 2016, total unrecognized stock-based compensation cost, net of estimated forfeitures, related to unvested stock options, RSUs and PRSUs was $11.8 million and is expected to be recognized over a weighted-average period of 1.6 years.
As part of its equity incentive program, the Company grants PRSUs, the vesting of which depends on the achievement of certain financial and non-financial goals of the Company. The Company assesses the expected achievement levels of the performance goals at the end of each reporting period. The grant date fair value of the PRSUs expected to vest based on the Company’s best estimate of its performance against the performance goals is recognized as compensation expense. During the years ended December 31, 2016 and 2015, the Company recorded approximately $2.8 million and $0.6 million of stock-based compensation expenses related to PRSUs, respectively. There were no stock-based compensation expenses related to PRSUs recorded in the year ended December 31, 2014.
Valuation Assumptions
The Company estimates the fair value of employee stock options and stock purchase rights under the ESPP using a Black-Scholes option valuation model. The value of the stock purchase rights under the ESPP consists of: (1) the 15% discount on the purchase of the stock; (2) 85% of the fair value of the call option; and (3) 15% of the fair value of the put option. The call option and put option were valued using the Black-Scholes option pricing model. At the date of grant, the Company estimated the fair value of each stock option grant and stock purchase right granted under the ESPP using the following weighted average assumptions:
98
Employee Stock Options | ESPP | ||||||||||||||||
2016 | 2015 | 2014 | 2016 | 2015 | 2014 | ||||||||||||
Expected term (in years) | 4.30 | 4.65 | 4.70 | 0.50 | 0.50 | 0.50 | |||||||||||
Volatility | 36 | % | 38 | % | 40 | % | 70 | % | 34 | % | 32 | % | |||||
Risk-free interest rate | 1.4 | % | 1.5 | % | 1.7 | % | 0.6 | % | 0.3 | % | 0.1 | % | |||||
Expected dividends | 0.0 | % | 0.0 | % | 0.0 | % | 0.0 | % | 0.0 | % | 0.0 | % | |||||
The expected term of the employee stock option represents the weighted-average period that the stock options are expected to remain outstanding. The computation of expected term was determined based on historical experience of similar awards, giving consideration to the contractual terms of the stock-based awards, vesting schedules and expectations of future employee behavior. The expected term of the stock purchase right under ESPP represents the period of time from the beginning of the offering period to the purchase date. The Company uses its historical volatility for a period equivalent to the expected term of the options to estimate the expected volatility. The risk-free interest rate that the Company uses in the Black-Scholes option valuation model is based on U.S. Treasury zero-coupon issues with remaining terms similar to the expected term. The Company has never declared or paid any cash dividends and does not plan to pay cash dividends in the foreseeable future, and, therefore, used an expected dividend yield of zero in the valuation model.
The Company is required to estimate forfeitures at the time of grant and revise those estimates in subsequent periods if actual forfeitures differ from those estimates. The Company uses historical data to estimate pre-vesting option forfeitures and records stock-based compensation expense only for those awards that are expected to vest. All stock-based payment awards are amortized on a straight-line basis over the requisite service periods of the awards, which are generally the vesting periods.
The weighted-average fair value per share of options granted for the years ended December 31, 2016, 2015 and 2014 was $0.99, $2.51 and $2.36, respectively. The fair value of all stock options vested during the years ended December 31, 2016, 2015 and 2014 was $2.3 million, $3.0 million and $3.2 million, respectively.
The estimated weighted-average fair value per share of stock purchase rights granted for the years ended December 31, 2016, 2015 and 2014 was $1.04, $1.69 and $1.79, respectively.
The Company realized no income tax benefit from stock option exercises for the year ended December 31, 2016 and 2015 due to recurring losses and valuation allowances. As required, the Company presents excess tax benefits from the exercise of stock options, if any, as financing cash flows rather than operating cash flows. The total realized tax benefit attributable to stock options exercised during the year ended December 31, 2014 was $15,000.
The estimated fair value of RSUs is based on the market price of the Company’s common stock on the grant date. The fair value of all restricted stock units issued during the years ended December 31, 2016, 2015 and 2014 was $9.7 million, $11.1 million and $12.0 million, respectively.
NOTE 14: STOCKHOLDERS’ EQUITY
Preferred Stock
Harmonic has 5,000,000 authorized shares of preferred stock. No shares of preferred stock were issued or outstanding in any of the periods presented.
Common Stock Repurchases
In April 2012, the Board approved a stock repurchase program that provided for the repurchase of up to $25 million of the Company’s outstanding common stock. Under the program, the Company was authorized to repurchase shares of common stock in open market transactions or pursuant to any trading plan that was adopted in accordance with Rule 10b5-1 of the Exchange Act. From time to time, the Board approved further increases to the program and the amount approved for this program was increased to $300 million periodically through May 2014 and the repurchase period expired on December 31, 2016. There were no stock repurchases during the year ended December 31, 2016 and the stock repurchase program expired on December 31, 2016. Further stock repurchases would require authorization from the Board.
During the years ended December 31, 2015 and 2014, the Company repurchased from open market transactions 3.4 million and 13.9 million shares of its common stock, respectively, at a total cost of $23.0 million and $93.1 million, respectively, and at an average share price of $6.70 for each of those period. The excess of cost over par value for the repurchase of the Company’s common stock is recorded to additional paid-in-capital. Common stock repurchased under the
99
program was recorded based upon the trade date for accounting purposes. All common shares repurchased under this program have been retired.
Additionally, on December 8, 2015, the Board approved the use of part of the proceeds from the sale and issuance of the Notes, issued on December 14, 2015, (see Note 12, “Convertible Notes, Other Debts and Capital Leases,” for additional information on the Notes) to repurchase shares of the Company’s common stock from purchasers of the Note offering in privately negotiated transactions effected through the initial purchaser or its affiliate as the Company’s agent. Repurchases of 11.1 million shares of the Company’s common stock effected concurrently with the Note offering was completed on December 14, 2015 at a price of $4.49 per share for an aggregate purchase price of $49.9 million.
Accumulated Other Comprehensive Income (Loss) (“AOCI”)
The components of AOCI, on an after-tax basis where applicable, were as follows (in thousands):
December 31, | |||||||
2016 | 2015 | ||||||
Foreign currency translation adjustments | $ | (7,267 | ) | $ | (2,634 | ) | |
Gain (loss) on investments, net of taxes (1) | 276 | (1,538 | ) | ||||
Loss on cash flow hedges (1) | — | (246 | ) | ||||
Actuarial loss | (279 | ) | — | ||||
Total accumulated other comprehensive loss | $ | (7,270 | ) | $ | (4,418 | ) | |
(1) See Consolidated Statements of Comprehensive Loss for the amounts related to cash flow hedges and investments that were reclassified into the Consolidated Statements of Operations for the periods presented.
NOTE 15: INCOME TAXES
Loss from operations before income taxes consists of the following (in thousands):
Year ended December 31, | |||||||||||
2016 | 2015 | 2014 | |||||||||
United States | $ | (53,833 | ) | $ | (16,826 | ) | $ | (15,515 | ) | ||
International | (26,597 | ) | 758 | (6,280 | ) | ||||||
Loss before income taxes | $ | (80,430 | ) | $ | (16,068 | ) | $ | (21,795 | ) | ||
The components of the provision for (benefit from) income taxes consist of the following (in thousands):
Year ended December 31, | |||||||||||
2016 | 2015 | 2014 | |||||||||
Current: | |||||||||||
Federal | $ | (950 | ) | $ | (1,981 | ) | $ | (11,525 | ) | ||
State | 181 | 120 | 8 | ||||||||
International | 2,738 | 1,966 | 1,619 | ||||||||
Deferred: | |||||||||||
Federal | (713 | ) | — | 25,722 | |||||||
State | — | — | 8,249 | ||||||||
International | (9,372 | ) | (512 | ) | 380 | ||||||
Total provision for (benefit from) income taxes | $ | (8,116 | ) | $ | (407 | ) | $ | 24,453 | |||
100
The differences between the provision for (benefit from) income taxes computed at the U.S. federal statutory rate at 35% and the Company’s actual provision for (benefit from) income taxes are as follows (in thousands):
Year ended December 31, | |||||||||||
2016 | 2015 | 2014 | |||||||||
Benefit from for income taxes at U.S. Federal statutory rate | $ | (28,150 | ) | $ | (5,624 | ) | $ | (7,628 | ) | ||
State taxes | 150 | 120 | 5,368 | ||||||||
Differential in rates on foreign earnings | 11,741 | 1,584 | 4,311 | ||||||||
Non-deductible amortization expense | 617 | 947 | 3,138 | ||||||||
Change in valuation allowance | 4,465 | 2,230 | 26,053 | ||||||||
Change in liabilities for uncertain tax positions | (960 | ) | (1,083 | ) | (8,126 | ) | |||||
Non-deductible stock-based compensation | 1,480 | 1,398 | 1,665 | ||||||||
Research and development tax credits | (129 | ) | (178 | ) | (841 | ) | |||||
Non-deductible meals and entertainment | 441 | 395 | 361 | ||||||||
Non-deductible acquisition cost | — | 457 | — | ||||||||
Adjustments related to tax positions taken during prior years | (163 | ) | (781 | ) | — | ||||||
Adjustments made under intercompany transactions | 1,779 | — | — | ||||||||
Withholding tax | 457 | — | — | ||||||||
Other | 156 | 128 | 152 | ||||||||
Total provision for (benefit from) income taxes | $ | (8,116 | ) | $ | (407 | ) | $ | 24,453 | |||
The Company operates in multiple jurisdictions and its profits are taxed pursuant to the tax laws of these jurisdictions. Our effective income tax rate may be affected by changes in or interpretations of tax laws and tax agreements in any given jurisdiction, utilization of net operating loss and tax credit carry forwards, changes in geographical mix of income and expense, and changes in management’s assessment of matters such as the ability to realize deferred tax assets. The Company’s effective tax rate varies from year to year primarily due to the absence of several onetime, discrete items that benefited or decremented the tax rates in the previous years.
In 2016, the Company had worldwide consolidated loss before tax of $80.4 million and tax benefit of $8.1 million, with an effective income tax rate of 10%. The Company’s 2016 effective income tax rate differed from the U.S. federal statutory rate of 35% primarily due to the Company’s geographical income mix and its tax valuation allowance, favorable tax rates associated with certain earnings from operations in lower-tax jurisdictions, favorable resolutions of uncertain tax positions, and the tax benefit from the realization of certain deferred tax assets as a result of the TVN acquisition, partially offset by the increase in the valuation allowance against U.S. federal, California and other state deferred tax assets, detriment from non-deductible stock-based compensation, non-deductible amortization of foreign intangibles, and the net of various discrete tax adjustments.
In 2015, the Company had worldwide consolidated loss before tax of $16.1 million and tax benefit of $0.4 million, with an effective income tax rate of 3%. The Company’s 2015 effective income tax rate differed from the U.S. federal statutory rate of 35% primarily due to a difference in foreign tax rates and the Company’s U.S. losses generated for the year received no tax benefit as a result of a full valuation allowance against all of its U.S. deferred tax assets, as well as adjustments relating to its 2014 U.S. federal tax return filed in September 2015 and the reversal of uncertain tax positions resulting from the expiration of the statutes of limitations. In addition, the impairment of the VJU investment (see Note 5, “Investments in Other Equity Securities”) received no tax benefit.
In 2014, as a result of cumulated losses in the recent years and the analysis of all available positive and negative evidence, the Company recorded a full valuation allowance against the beginning of year U.S. net deferred tax assets of $34.0 million. In addition, in 2014, the Company carried back its 2013 federal net operating loss to 2011 resulting in a tax refund. Certain federal R&D credits were also freed up as a result and utilized to offset income tax reserves as a result of the adoption of the ASU 2013-11. These two events reduced the valuation allowance by approximately $5.0 million and led to the net change of valuation allowance of $29.0 million. This unfavorable net impact was offset partially by a tax benefit of $9.0 million associated with the release of tax reserves including accrued interest and penalties, for our 2010 tax year in the United States, as a result of the expiration of the applicable statute of limitations for that year.
The components of net deferred tax assets included in the Consolidated Balance Sheets are as follows (in thousands):
101
December 31, | |||||||
2016 | 2015 | ||||||
Deferred tax assets: | |||||||
Reserves and accruals | $ | 25,527 | $ | 16,413 | |||
Net operating loss carryovers | 33,321 | 27,023 | |||||
Research and development credit carryovers | 28,759 | 27,595 | |||||
Deferred stock-based compensation | 4,292 | 5,834 | |||||
Depreciation and amortization | 554 | — | |||||
Other tax credits | 2,738 | 2,738 | |||||
Gross deferred tax assets | 95,191 | 79,603 | |||||
Valuation allowance | (74,480 | ) | (64,545 | ) | |||
Gross deferred tax assets after valuation allowance | 20,711 | 15,058 | |||||
Deferred tax liabilities: | |||||||
Depreciation and amortization | — | (1,189 | ) | ||||
Intangibles | (1,417 | ) | (899 | ) | |||
Convertible notes | (8,603 | ) | (10,233 | ) | |||
Other | (510 | ) | (510 | ) | |||
Gross deferred tax liabilities | (10,530 | ) | (12,831 | ) | |||
Net deferred tax assets | $ | 10,181 | $ | 2,227 | |||
The following table summarizes the activities related to the Company’s valuation allowance (in thousands):
Year ended December 31, | |||||||||||
2016 | 2015 | 2014 | |||||||||
Balance at beginning of period | $ | 64,545 | $ | 75,199 | $ | 38,644 | |||||
Additions | 18,291 | 3,068 | 39,556 | ||||||||
Deductions | (8,356 | ) | (13,722 | ) | (3,001 | ) | |||||
Balance at end of period | $ | 74,480 | $ | 64,545 | $ | 75,199 | |||||
Management regularly assesses the ability to realize deferred tax assets recorded based upon the weight of available evidence, including such factors as recent earnings history and expected future taxable income on a jurisdiction by jurisdiction basis. In the event that the Company changes its determination as to the amount of realizable deferred tax assets, the Company will adjust its valuation allowance with a corresponding impact to the provision for income taxes in the period in which such determination is made.
In 2016, the Company continued to record a valuation allowance against all of its United States deferred tax assets as well as its net operating losses generated in 2016 due to significant cumulative losses in the United States, resulting in a net increase in valuation allowance of $18.3 million. This increase in valuation allowance is offset partially by the release of $8.4 million of valuation allowance associated with the TVN French Subsidiary. Due to a change in its business model, as of December 31, 2016, the TVN French Subsidiary is forecasted to generate pretax income in future periods. After considering all the positive and negative evidence, the Company determined that the valuation allowance for the TVN French Subsidiary should be released as of December 31, 2016 based on its projected income. As of December 31, 2016, the Company had a valuation allowance of $74.5 million against all of its U.S. federal, California and other state net deferred tax assets, including net operating loss carryforwards and R&D tax credit carryforwards, and against majority of its foreign deferred tax assets.
In November 2015, the FASB issued an accounting standard update that all deferred tax assets and liabilities, along with any related valuation allowance, be classified as non-current on the balance sheet. The accounting standard update will be effective for the Company beginning in the first quarter of fiscal 2017 and early adoption is permitted. The Company early-adopted this accounting standard update as of the end of its fiscal 2015 on a prospective basis, resulting in $15.9 million of net deferred tax assets, along with its related valuation allowance, being classified from current assets to non-current assets on the Consolidated Balance Sheet as of December 31, 2015. Other than this reclassification, the adoption of this accounting standard update did not have an impact on the Company’s consolidated financial statements.
As of December 31, 2016, the Company had $103.7 million, $23.1 million, $31.3 million and $23.1 million of foreign, U.S. federal, U.S. California state, and U.S. other states net operating loss carryforwards (“NOL”), respectively. There is no expiration to the utilization of the foreign NOL, while the U.S. federal and California NOL will begin to expire at various dates
102
beginning in 2017 through 2036, if not utilized. As of December 31, 2016, the U.S. federal and California NOL included approximately $1.4 million and $5.9 million relating to stock options tax deductions. These amounts are not included in the Company’s gross or net deferred tax assets pursuant to applicable accounting guidance and, if and when realized, through a reduction in income tax payable will be accounted for as a credit to additional paid-in capital.
As of December 31, 2016, the Company had U.S. federal and California state tax credit carryforwards of approximately $10.0 million and $32.6 million, respectively. If not utilized, the U.S. federal tax credit carryforwards will begin to expire in 2031, while the California tax credit forward will not expire. In addition, as of December 31, 2016, the Company had U.S. federal alternative minimum tax (“AMT”) credit carryforward of approximately $2.7 million, which will not expire.
The Company has not provided U.S. federal and California state income taxes, as well as foreign withholding taxes, on approximately $7.0 million of cumulative undistributed earnings for certain non-U.S. subsidiaries, because such earnings are intended to be indefinitely reinvested. Determination of the amount of unrecognized deferred tax liability for temporary differences related to investment in these non-U.S. subsidiaries that are essentially permanent in duration is not practicable.
The Company applies the provisions of the applicable accounting guidance regarding accounting for uncertainty in income taxes, which requires application of a more-likely-than-not threshold to the recognition and derecognition of uncertain tax positions. If the recognition threshold is met, the applicable accounting guidance permits the recognition of a tax benefit measured at the largest amount of such tax benefit that, in our judgment, is more than fifty percent likely to be realized upon settlement. It further requires that a change in judgment related to the expected ultimate resolution of uncertain tax positions be recognized in earnings in the period in which such determination is made. The Company will continue to review its tax positions and provide for, or reverse, unrecognized tax benefits as issues arise. As of December 31, 2016, the Company had $19.2 million that would favorably impact the effective tax rate in future periods if recognized. The following table summarizes the activity related to the Company’s gross unrecognized tax benefits (in millions):
Year ended December 31, | |||||||||||
2016 | 2015 | 2014 | |||||||||
Balance at beginning of period | $ | 15.6 | $ | 15.7 | $ | 24.2 | |||||
Increase in balance related to tax positions taken during current year | 4.6 | 0.7 | 1.0 | ||||||||
Decrease in balance as a result of a lapse of the applicable statues of limitations | (1.0 | ) | (0.9 | ) | (9.5 | ) | |||||
Increase in balance related to tax positions taken during prior years | — | 0.3 | — | ||||||||
Decrease in balance related to tax positions taken during prior years | — | (0.2 | ) | — | |||||||
Balance at end of period | $ | 19.2 | $ | 15.6 | $ | 15.7 | |||||
The Company recognizes interest and penalties related to unrecognized tax positions in income tax expenses on the Consolidated Statements of Operations. The net interest and penalties reduction recorded for the years ended December 31, 2016, 2015 and 2014 related to unrecognized tax benefits was ($35,000), ($31,000), and ($1.0) million, respectively. The net reduction in interest and penalties in 2016, 2015 and 2014 was attributable to the reversal of accrued interest and penalties of $0.2 million, $0.2 million, and $1.8 million, respectively, due to decreases in unrecognized tax benefits resulting from the expiration of the statutes of limitations on the Company’s U.S. corporate tax returns for 2008 through 2012 tax years. The Company had approximately $0.5 million of accrued interest and penalties related to uncertain tax positions as of December 31, 2016 and December 31, 2015.
The Company files U.S. federal, state, and foreign income tax returns in jurisdictions with varying statutes of limitations during which such tax returns may be audited and adjusted by the relevant tax authorities. The U.S. Internal Revenue Service has concluded its audit for the 2012 tax year. As a result, the Company released $1.1 million of related tax reserves, including accrued interests and penalties. Additionally, the Company released $9.0 million and $0.5 million of related tax reserves, including accrued interests and penalties, for the 2010 and 2011 tax years in 2014 and 2015, respectively, as a result of the expiration of the statute of limitations.
The 2013 through 2015 tax years generally remain subject to examination by U.S. federal and most state tax authorities. In significant foreign jurisdictions, the 2007 through 2015 tax years generally remain subject to examination by their respective tax authorities. In the quarter ended September 30, 2016, the U.S. Internal Revenue Service concluded its examination of the Company’s income tax return for the tax year 2012, which commenced in August 2015. In addition, a subsidiary of the Company is under audit for the 2012 and 2013 tax years, which commenced in the first quarter of 2015, by the Israel tax authority. If, upon the conclusion of these audits, the ultimate determination of taxes owed in the United States or Israel is for an amount in excess of the tax provision the Company has recorded in the applicable period, the Company’s overall tax expense, effective tax rate, operating results and cash flow could be materially and adversely impacted in the period of adjustment.
103
On July 27, 2015, the U.S. Tax Court issued an opinion in Altera Corp. v. Commissioner, 145 T.C. No.3 (2015) related to the treatment of stock-based compensation expense in an intercompany cost-sharing arrangement. A final decision was entered by the U.S. Tax Court on December 1, 2015. On February 19, 2016, the U.S. Internal Revenue Service filed a notice of appeal in Altera Corp. v. Commissioner, 145 T.C. No. 3 (2015), to the Ninth Circuit Court of Appeal. The Ninth Circuit will decide whether a regulation that mandates that stock-based compensation costs related to the intangible development activity of a qualified cost sharing arrangement (a “QCSA”) must be included in the joint cost pool of the QCSA (the “all costs rule”) is consistent with the arm’s length standard as set forth in Section 482 of the Internal Revenue Code. The Company concluded that no adjustment to the consolidated financial statements as of December 31, 2016 is appropriate at this time due to the uncertainties with respect to the ultimate resolution of this case.
The Company’s operations in Switzerland are subject to a reduced tax rate under the Switzerland tax holiday which requires various thresholds of investment and employment in Switzerland. The Company has met these various thresholds and the Switzerland tax holiday is effective through the end of 2018. The income tax benefits attributable to the Switzerland holiday were estimated to be approximately $0.7 million for each of the fiscal years 2016, 2015 and 2014, respectively, increasing diluted earnings per share by approximately $0.008 for each of the fiscal years 2016, 2015 and 2014, respectively.
NOTE 16: NET LOSS PER SHARE
Basic net loss per share is computed by dividing the net loss attributable to common stockholders for the applicable period by the weighted average number of common shares outstanding during the period. Potentially dilutive shares, consisting of outstanding stock options, restricted stock units, ESPP plan awards as well as the Notes, are excluded from the net loss per share computations when their effect is anti-dilutive.
The following table presents the calculation of basic and diluted net loss per share (in thousands, except per share amounts):
December 31, | |||||||||||
2016 | 2015 | 2014 | |||||||||
Numerator: | |||||||||||
Net loss | $ | (72,314 | ) | $ | (15,661 | ) | $ | (46,248 | ) | ||
Denominator: | |||||||||||
Weighted average number of shares outstanding: | |||||||||||
Basic and diluted | 77,705 | 87,514 | 92,508 | ||||||||
Net loss per share: | |||||||||||
Basic and diluted | $ | (0.93 | ) | $ | (0.18 | ) | $ | (0.50 | ) | ||
The diluted net loss per share is the same as basic net loss per share for the years ended December 31, 2016, 2015 and 2014 because potential common shares are only considered when their effect would be dilutive. The following table presents the potential weighted common shares outstanding that were excluded from the computation of basic and diluted net loss per share calculations (in thousands):
December 31, | ||||||||
2016 | 2015 | 2014 | ||||||
Stock options | 5,295 | 6,460 | 7,115 | |||||
Restricted stock units | 2,536 | 2,178 | 2,066 | |||||
Stock purchase rights under the ESPP | 659 | 518 | 346 | |||||
Warrants (1) | 206 | — | — | |||||
Total | 8,696 | 9,156 | 9,527 | |||||
(1) On September 26, 2016, in connection with the execution of a product supply agreement pursuant to which an affiliate of Comcast Corporation (together with Comcast Corporation, “Comcast”) may, in its sole discretion, purchase from the Company licenses to certain of the Company’s software products, the Company granted Comcast a warrant to purchase shares of its common stock. (See Note 17, “Warrants” for additional information).
Also excluded from the table above are the Notes, which are convertible under certain conditions into an aggregate of 22,304,348 shares of common stock (see Note 12, “Convertible Notes, Other Debts and Capital Leases” for additional
104
information on the Notes). Since the Company’s intent is to settle the principal amount of the Notes in cash, the treasury stock method is being used to calculate any potential dilutive effect of the conversion spread on diluted net income per share, if applicable. The conversion spread will have a dilutive impact on diluted net income per share when the Company’s average market price of its common stock for a given period exceeds the conversion price of $5.75 per share.
NOTE 17: WARRANTS
On September 26, 2016, the Company granted a warrant to purchase shares of common stock (the “Warrant”) to Comcast pursuant to which Comcast may, subject to certain vesting provisions, purchase up to 7,816,162 shares of the Company’s common stock subject to adjustment in accordance with the terms of the Warrant, for a per share exercise price of
$4.76. Comcast may exercise the Warrant for cash or on a net share basis. The Warrant expires on September 26, 2023 or the prior consummation of a change of control of the Company.
Comcast’s right to purchase 781,617 shares vested as of the issuance date as an incentive to enter into the software license product supply agreement. Comcast’s rights to purchase an additional 1,954,042 shares vest upon achievement of milestones that occur upon or prior to Comcast’s election for enterprise license pricing for certain of the Company’s software products. Such pricing would obligate Comcast to make certain total payments to the Company over the term of the product supply agreement. These rights are expected to vest in 2018. Comcast’s rights to purchase an additional 1,172,425 shares vest when Comcast exceeds specified cumulative purchase amounts from the Company under the product supply agreement. Comcast’s rights to purchase the remaining 3,908,081 shares vest in specified tranches at the earlier of Comcast’s enterprise license pricing election (if completed by a certain date) or achievement of specified cumulative purchase amounts from the Company.
The $1.6 million value of the vested portion of the Warrant was determined using the Black-Scholes option valuation model using the following assumptions: expected term of 7 years, volatility of 42%, risk-free interest rate of 1.4%, and expected dividends of 0.0%. The Warrant is considered indexed to the Company’s common stock and classified as stockholders’ equity based on its terms. Accordingly, the vested Warrant amount was included in “Additional paid-in capital” on the Company’s Consolidated Balance Sheets and will not be remeasured in the future periods.
The Warrant is considered an incentive for Comcast to purchase certain of the Company’s products. Therefore the value of the Warrant will be recorded as a reduction in the Company’s net revenues to the extent such value does not exceed net revenues from pertinent sales to Comcast. The portion of the Warrant which vested on September 26, 2016 had a value of $1.6 million and is deemed a customer incentive paid upfront and in the fourth quarter of 2016, $0.4 million of this prepaid incentive has been recorded as a reduction to the Company’s 2016 net revenues from Comcast. The remaining $1.2 million of this prepaid incentive is recorded as an asset under “Prepaid expenses and other current assets” on the Company’s Consolidated Balance Sheet as of December 31, 2016. The Company considers this asset to be recoverable based on the expectation of Comcast’s future purchase of the pertinent products. The asset will be assessed for impairment if no longer deemed recoverable.
NOTE 18: SEGMENT INFORMATION, GEOGRAPHIC INFORMATION AND CUSTOMER CONCENTRATION
Segment Information
Operating segments are defined as components of an enterprise that engage in business activities for which separate financial information is available and evaluated by the Company’s CODM, which for the Company is its Chief Executive Officer, in deciding how to allocate resources and assess performance. Based on our internal reporting structure, the Company consists of two operating segments: Video and Cable Edge. The operating segments were determined based on the nature of the products offered. The Video segment sells video processing and production and playout solutions and services worldwide to broadcast and media companies, streaming new media companies, cable operators, and satellite and telecommunications (telco) Pay-TV service providers. The Cable Edge segment sells cable edge solutions and related services to cable operators globally.
The Company does not allocate amortization of intangibles, stock-based compensation, restructuring and related charges, TVN acquisition- and integration-related costs, and certain other non-recurring charges to the operating income for each segment because management does not include this information in the measurement of the performance of the operating segments. A measure of assets by segment is not applicable as segment assets are not included in the discrete financial information provided to the CODM.
On February 29, 2016, the Company completed its acquisition of 100% of the outstanding equity of TVN and assigned TVN to its Video operating segment.
105
The following tables provide summary financial information by reportable segment (in thousands):
Year ended December 31, | |||||||||||
2016 | 2015 | 2014 | |||||||||
Net revenue: | |||||||||||
Video | $ | 351,489 | $ | 291,779 | $ | 326,756 | |||||
Cable Edge | 54,422 | 85,248 | 106,801 | ||||||||
Total consolidated net revenue | $ | 405,911 | $ | 377,027 | $ | 433,557 | |||||
Operating income (loss): | |||||||||||
Video | $ | 11,963 | $ | 13,529 | $ | 18,073 | |||||
Cable Edge | (12,131 | ) | (1,599 | ) | 1,239 | ||||||
Total segment operating income (loss) | (168 | ) | 11,930 | 19,312 | |||||||
Unallocated corporate expenses | (38,972 | ) | (2,794 | ) | (3,076 | ) | |||||
Stock-based compensation | (13,060 | ) | (15,582 | ) | (17,287 | ) | |||||
Amortization of intangibles | (14,836 | ) | (6,502 | ) | (20,520 | ) | |||||
Loss from operations | (67,036 | ) | (12,948 | ) | (21,571 | ) | |||||
Non-operating expense, net | (13,394 | ) | (3,120 | ) | (224 | ) | |||||
Loss before income taxes | $ | (80,430 | ) | $ | (16,068 | ) | $ | (21,795 | ) | ||
Unallocated corporate expenses include certain corporate-level operating expenses and charges such as restructuring and related charges and excess facilities charges. Additionally, the unallocated corporate expenses in 2016 included $16.9 million of TVN acquisition- and integration-related costs (see Note 3, “Business Acquisition,” of the notes to our Consolidated Financial Statements for additional information) and $13.1 million of restructuring costs related to the TVN VDP (see Note 11, “Restructuring and Related charges-TVN VDP,” of the notes to our Consolidated Financial Statements for additional information) and an inventory obsolescence charge of approximately $4.0 million recorded for some older Cable Edge product lines in accordance with the Company’s policy for excess and obsolete inventory and also as part of our strategic plan to re-position and dedicate the Company’s primary Cable Edge resources to its new CableOS products.
Geographic Information
Revenue by geographic region, based on the location at which each sale originates, and property and equipment, net by geographic region, are summarized as follows (in thousands):
Year ended December 31, | |||||||||||
2016 | 2015 | 2014 | |||||||||
Net revenue: | |||||||||||
United States | $ | 171,016 | $ | 175,466 | $ | 206,610 | |||||
Other countries | 234,895 | 201,561 | 226,947 | ||||||||
Total | $ | 405,911 | $ | 377,027 | $ | 433,557 | |||||
Other than the U.S., no country accounted for 10% or more of the Company’s net revenues for the years ended December 31, 2016, 2015 and 2014.
As of December 31, | |||||||
2016 | 2015 | ||||||
Property and equipment, net: | |||||||
United States | $ | 15,197 | $ | 17,086 | |||
Israel | 9,966 | 7,560 | |||||
France | 4,872 | — | |||||
Other countries | 2,129 | 2,366 | |||||
Total | $ | 32,164 | $ | 27,012 | |||
Customer Concentration
106
During the year ended December 31, 2016, no customer accounted for more than 10% of our net revenue. Net revenue from Comcast accounted for 12% and 16%, respectively, of the Company’s total net revenue during the years ended December 31, 2015 and 2014. Other than Comcast, no customer accounted for 10% or more of the Company’s total net revenue for fiscal years 2015 and 2014.
NOTE 19: COMMITMENTS AND CONTINGENCIES
Leases
The Company leases its facilities under non-cancelable operating leases which expire at various dates through April 2027. In addition, the Company leases vehicles and phones in Israel under non-cancelable operating leases, the last of which expires in 2019. Total rent expense related to these operating leases was $9.7 million, $9.0 million and $9.8 million for the years ended December 31, 2016, 2015 and 2014, respectively. Future minimum lease payments under non-cancellable operating leases at December 31, 2016, are as follows (in thousands):
Operating Leases | |||
Year ending December 31, | |||
2017 | $ | 12,971 | |
2018 | 12,361 | ||
2019 | 10,631 | ||
2020 | 7,407 | ||
2021 | 2,020 | ||
Thereafter | 7,923 | ||
Total minimum payments | $ | 53,313 | |
Warranty
The Company accrues for estimated warranty costs at the time of product shipment. Management periodically reviews the estimated fair value of its warranty liability and records adjustments based on the terms of warranties provided to customers, historical and anticipated warranty claims experience, and estimates of the timing and cost of warranty claims. Activities for the Company’s warranty accrual for each fiscal year, which is included in accrued and other current liabilities, is summarized below (in thousands):
2016 | 2015 | 2014 | |||||||||
Balance at beginning of period | $ | 3,913 | $ | 4,242 | $ | 3,606 | |||||
Accrual for current period warranties | 5,655 | 5,470 | 7,278 | ||||||||
Balance assumed from TVN acquisition | 1,012 | — | — | ||||||||
Changes in liability related to pre-existing warranties | (173 | ) | (92 | ) | 3 | ||||||
Warranty costs incurred | (5,545 | ) | (5,707 | ) | (6,645 | ) | |||||
Balance at end of period | $ | 4,862 | $ | 3,913 | $ | 4,242 | |||||
Standby Letters of Credit and Guarantees
The Company’s financial guarantees consisted of standby letters of credit and bank guarantees. As of December 31, 2016, the Company had $1.0 million of standby letters of credit outstanding primarily related to its credit card facility in Switzerland and, to a lesser extent, performance bond and state requirements imposed on employers. In addition, the Company had $1.9 million of bank guarantees outstanding as of December 31, 2016, of which $1.2 million was related to a building lease for the TVN French Subsidiary, $0.4 million was related to the building leases in Israel, and the remaining amount was mostly related to performance bonds issued to customers of the TVN French Subsidiary.
Indemnification
The Company is obligated to indemnify it’s officers and its directors pursuant to its bylaws and contractual indemnity agreements. The Company also indemnifies some of its suppliers and most of its customers for specified intellectual property matters pursuant to certain contractual arrangements, subject to certain limitations. The scope of these indemnities varies, but, in some instances, includes indemnification for damages and expenses (including reasonable attorneys’ fees). There have been no amounts accrued in respect of the indemnification provisions through December 31, 2016.
107
Royalties
The Company has licensed certain technologies from various companies. It incorporates these technologies into its own products and is required to pay royalties for such use, usually based on shipment of the related products. In addition, the Company has obtained research and development grants under various Israeli government programs that require the payment of royalties on sales of certain products resulting from such research. During the years ended December 31, 2016, 2015 and 2014 royalty expenses were $4.1 million, $2.9 million and $3.2 million, respectively, and they are included in product cost of revenue in the Company’s Consolidated Statements of Operations.
Purchase Obligations
The Company relies on a limited number of contract manufacturers and suppliers to provide manufacturing services for a substantial majority of its products. Obligations to purchase inventory and other commitments are generally expected to be fulfilled within one year. The Company had approximately $24.0 million of non-cancelable commitments to purchase inventories and other commitments as of December 31, 2016.
NOTE 20: LEGAL PROCEEDINGS
From time to time, the Company is involved in lawsuits as well as subject to various legal proceedings, claims, threats of litigation, and investigations in the ordinary course of business, including claims of alleged infringement of third-party patents and other intellectual property rights, commercial, employment, and other matters. The Company assesses potential liabilities in connection with each lawsuit and threatened lawsuits and accrues an estimated loss for these loss contingencies if both of the following conditions are met: information available prior to issuance of the financial statements indicates that it is probable that a liability has been incurred at the date of the financial statements and the amount of loss can be reasonably estimated. While certain matters to which the Company is a party specify the damages claimed, such claims may not represent reasonably probable losses. Given the inherent uncertainties of litigation, the ultimate outcome of these matters cannot be predicted at this time, nor can the amount of possible loss or range of loss, if any, be reasonably estimated.
In October 2011, Avid Technology, Inc. (“Avid”) filed a complaint in the United States District Court for the District of Delaware alleging that Harmonic’s Media Grid product infringes two patents held by Avid. A jury trial on this complaint commenced on January 23, 2014 and, on February 4, 2014, the jury returned a unanimous verdict in favor of the Company, rejecting Avid’s infringement allegations in their entirety. On May 23, 2014, Avid filed a post-trial motion asking the court to set aside the jury’s verdict, and the judge issued an order on December 17, 2014, denying the motion. On January 5, 2015, Avid filed an appeal with respect to the jury’s verdict with the Federal Circuit, which was docketed on January 9, 2015, as Case No. 2015-1246. Avid filed its opening brief with respect to this appeal on March 24, 2015, the Company filed its response brief on May 7, 2015, and Avid filed its reply brief on June 16, 2015. Oral arguments were held on December 11, 2015. On January 29, 2016, the Federal Circuit issued an order vacating the verdict of noninfringement and remanding the case to the trial court for a new trial on infringement. On February 26, 2016, Harmonic filed a request for rehearing and rehearing en banc at the Federal Circuit. On March 31, 2016, the Federal Circuit denied the request for rehearing and rehearing en banc and a mandate issued on April 8, 2016. The court conducted a supplemental claim construction hearing on May 27, 2016 and issued a claim construction order on June 29, 2016. On June 17, 2016, Harmonic filed requests for ex parte reexaminations for the ’808 and ’309 patents with the United States Patent and Trademark Office (“USPTO”). The USPTO ordered reexamination of both the ’309 and ’808 patents in August 2016. The USPTO issued a Non-Final Office Action on November 25, 2016 for the ’309 patent, including rejecting all challenged claims. The USPTO issued a Non-Final Office Action for the ’808 patent on December 15, 2016, rejecting all challenged claims. The Patent Owner filed its response in both reexaminations on February 15, 2017. A status conference was held with the District Court on February 23, 2017.
In June 2012, Avid served a subsequent complaint in the United States District Court for the District of Delaware alleging that the Company’s Spectrum product infringes one patent held by Avid. The complaint seeks injunctive relief and unspecified damages. In September 2013, the U.S. Patent Trial and Appeal Board (“PTAB”) authorized an inter partes review to be instituted as to claims 1-16 of the patent asserted in this second complaint. A hearing before the PTAB was conducted on May 20, 2014. On July 10, 2014, the PTAB issued a decision finding claims 1-10 invalid and claims 11-16 not invalid. The Company filed an appeal with respect to the PTAB’s decision on claims 11-16 on September 11, 2014. The appeal was docketed with the Federal Circuit on October 22, 2014, as Case No. 2015-1072, and the Company filed its opening brief with respect to this appeal on January 29, 2015. Avid and PTAB each filed a response brief on April 27, 2015, and the Company filed a reply brief on May 28, 2015. Oral arguments were held on October 8, 2015. The Federal Circuit issued an order on March 1, 2016, affirming the PTAB’s decision and a mandate issued on April 7, 2016. On July 25, 2016, the court issued a scheduling order for the case and set the trial date for November 6, 2017.
The Company is unable to predict the outcome of these lawsuits and therefore is unable to estimate an amount or range of any reasonably possible losses resulting from them. An unfavorable outcome on any litigation matter could require that the
108
Company pay substantial damages, or, in connection with any intellectual property infringement claims, could require that the Company pay ongoing royalty payments or could prevent the Company from selling certain of its products. As a result, a settlement of, or an unfavorable outcome on, any of the matters referenced above or other litigation matters could have a material adverse effect on the Company’s business, operating results, financial condition and cash flows.
109
SELECTED QUARTERLY FINANCIAL DATA
(UNAUDITED, IN THOUSANDS, EXCEPT PER SHARE AMOUNTS)
The following table sets forth our unaudited quarterly Consolidated Statement of Operations data for each of the eight quarters ended December 31, 2016. In management’s opinion, the data has been prepared on the same basis as the audited Consolidated Financial Statements included in this report, and reflects all necessary adjustments, consisting only of normal recurring adjustments, necessary for a fair statement of this data.
Fiscal 2016 (1) | |||||||||||||||
1st Quarter (6) | 2nd Quarter | 3rd Quarter (6) | 4th Quarter (3) (5) | ||||||||||||
(In thousands, except per share amounts) | |||||||||||||||
Quarterly Data: | |||||||||||||||
Net revenue | $ | 81,832 | $ | 109,571 | $ | 101,406 | $ | 113,102 | |||||||
Gross profit (4) | 40,654 | 51,040 | 51,363 | 57,693 | |||||||||||
Net loss (2) | $ | (25,180 | ) | $ | (20,679 | ) | $ | (16,012 | ) | $ | (10,443 | ) | |||
Net loss per share: | |||||||||||||||
Basic | $ | (0.33 | ) | $ | (0.27 | ) | $ | (0.21 | ) | $ | (0.13 | ) | |||
Diluted | $ | (0.33 | ) | $ | (0.27 | ) | $ | (0.21 | ) | $ | (0.13 | ) | |||
Shares used in per share calculations: | |||||||||||||||
Basic and diluted | 76,996 | 77,342 | 78,092 | 78,389 | |||||||||||
Fiscal 2015 | |||||||||||||||
1st Quarter (6) | 2nd Quarter | 3rd Quarter | 4th Quarter (5) | ||||||||||||
(In thousands, except per share amounts) | |||||||||||||||
Quarterly Data: | |||||||||||||||
Net revenue | $ | 104,016 | $ | 103,103 | $ | 83,305 | $ | 86,603 | |||||||
Gross profit (4) | 55,028 | 54,385 | 46,231 | 47,068 | |||||||||||
Net loss | $ | (2,657 | ) | $ | (994 | ) | $ | (4,811 | ) | $ | (7,199 | ) | |||
Net loss per share: | |||||||||||||||
Basic | $ | (0.03 | ) | $ | (0.01 | ) | $ | (0.05 | ) | $ | (0.08 | ) | |||
Diluted | $ | (0.03 | ) | $ | (0.01 | ) | $ | (0.05 | ) | $ | (0.08 | ) | |||
Shares used in per share calculations: | |||||||||||||||
Basic and diluted | 88,655 | 88,426 | 87,991 | 84,932 | |||||||||||
(1) On February 29, 2016, the Company completed the acquisition of TVN and applied the acquisition method of accounting for the business combination. The selected quarterly financial data for the year ended December 31, 2016 of the combined entity includes 10 months of operating results of TVN beginning March 1, 2016.
(2) In 2016, as a result of the TVN acquisition, the Company incurred acquisition-and integration-related expenses of $3.0 million, $3.4 million, $5.3 million and $5.2 million, in the first through fourth quarter of 2016, respectively. These costs consisted of acquisition-related costs which include outside legal, accounting and other professional services as well as integration-related costs which include incremental costs resulting from the TVN acquisition that are not expected to generate future benefits once the integration is fully consummated. These costs are expensed as incurred.
(3) In 2016, as part of the TVN integration plan, the Company established the TVN VDP to enable the French employees of TVN to voluntarily terminate with certain benefits. The plan was approved by the applicable French authorities and a total of 83 employees applied for the TVN VDP and were duly approved by the Company in the fourth quarter of 2016. Based on the applicable accounting guidance, the Company recorded a charge of $13.1 million for TVN VDP in the fourth quarter of 2016. This charge is offset partially by a $2.0 million pension curtailment gain. (See Note 11, “Restructuring and related charges-TVN VDP,” of the notes to the Consolidated Financial Statements for additional information on the TVN VDP and pension curtailment gain).
(4) Gross margin decreased to 49.7% in the first quarter of 2016 compared to 54.3% in the fourth quarter of 2015, primarily due to a $4.8 million decline in revenue resulting mostly from timing in revenue recognition for certain projects. Gross margin decreased to 46.6% in the second quarter of 2016 compared to 49.7% in the first quarter of 2016, primarily due to the inclusion of TVN’s operating results which resulted in higher material, labor and overhead costs attributable to the additional headcount and facilities acquired in connection with the TVN acquisition, as well as an approximately $4.5 million inventory obsolescence charge for some older Cable Edge product lines. Gross margin increased to 50.7% in the third quarter of 2016
110
compared to 46.6% in the second quarter of 2016 primarily due to the absence of the Cable Edge inventory obsolescence charge in the third quarter of 2016.
(5) A history of operating losses in recent years has led to uncertainty with respect to the Company’s ability to realize certain net deferred tax assets. In 2015, the Company recorded a valuation allowance against all of its U.S. net deferred tax assets, resulting in an increase in valuation allowance of $3.1 million in the fourth quarter of 2015. This increase in valuation allowance is offset partially by the release of $0.9 million valuation allowance against one of its Israel subsidiaries due to cumulative income generated in recent years. In the fourth quarter of 2016, the Company recorded an additional valuation allowance of $18.3 million against all of the United States deferred tax assets as well as its net operating losses generated in 2016. This increase in valuation allowance is offset partially by the release of $8.4 million of valuation allowance associated with the TVN French Subsidiary. Due to a change in its business model, as of December 31, 2016, the TVN French Subsidiary is forecasted to generate pretax income in future periods.
(6) In the first and third quarter of 2016, the Company recorded impairment charges of $1.5 million and $1.2 million, respectively, for its investment in Vislink. In the first quarter of 2015, the Company recorded an impairment charge of $2.5 million for its investment in VJU. These impairment charges were recorded as a result of the Company’s assessment which concluded that their impairment were on an other-than-temporary basis. (See Note 5, “Investments in Other Equity Securities,” of the notes to the Consolidated Financial Statements for additional information).
111
Item 9. | CHANGES IN AND DISAGREEMENTS WITH ACCOUNTANTS ON ACCOUNTING AND FINANCIAL DISCLOSURE |
None.
Item 9A. | CONTROLS AND PROCEDURES |
Evaluation of Disclosure Controls and Procedures
We maintain “disclosure controls and procedures,” as such term is defined in Rule 13a-15(e) under the Exchange Act, that are designed to ensure that information required to be disclosed by us in reports that we file or submit under the Exchange Act is recorded, processed, summarized and reported within the time periods specified in SEC rules and forms, and that such information is accumulated and communicated to our management, including our Chief Executive Officer and Chief Financial Officer, as appropriate to allow timely decisions regarding required disclosure. In designing and evaluating our disclosure controls and procedures, management recognized that disclosure controls and procedures, no matter how well conceived and operated, can provide only reasonable, not absolute, assurance that the objectives of the disclosure controls and procedures are met. Additionally, in designing disclosure controls and procedures, our management necessarily was required to apply its judgment in evaluating the cost-benefit relationship of possible disclosure controls and procedures. The design of any disclosure controls and procedures also is based in part upon certain assumptions about the likelihood of future events, and there can be no assurance that any design will succeed in achieving its stated goals under all potential future conditions.
Based on their evaluation as of the end of the period covered by this Annual Report on Form 10-K, our Chief Executive Officer and Chief Financial Officer have concluded that our disclosure controls and procedures were effective.
Management’s Report on Internal Control over Financial Reporting
Our management is responsible for establishing and maintaining adequate internal control over financial reporting (as defined in Rule 13a-15(f) under the Exchange Act). Management conducted an assessment of the effectiveness of the Company’s internal control over financial reporting based on the criteria set forth in Internal Control - Integrated Framework (2013) issued by the Committee of Sponsoring Organizations of the Treadway Commission. Based on the Company’s assessment, management has concluded that its internal control over financial reporting was effective as of December 31, 2016.
We acquired TVN on February 29, 2016 and are in the process of integrating the acquired business of TVN entities into our overall internal control over financial reporting process. As of December 31, 2016 certain TVN entities have been integrated into our internal control over financial reporting process. For those TVN entities which are not integrated, their post acquisition revenue included in the year ended December 31, 2016 accounted for approximately 12% of our consolidated net revenue for the year ended December 31, 2016 and their total assets as of December 31, 2016 accounted for approximately 20% of our consolidated total assets as of December 31, 2016. We excluded the TVN business for the non-integrated TVN entities from the assessment of internal control over financial reporting as of December 31, 2016.
The Company’s independent registered public accounting firm, PricewaterhouseCoopers LLP, has issued a report on the effectiveness of the Company’s internal control over financial reporting, which appears in Part II, Item 8 of this Form 10-K.
Changes in Internal Control over Financial Reporting
There was no change in our internal control over financial reporting that occurred during the fourth quarter of fiscal year 2016 that has materially affected, or is reasonably likely to materially affect, our internal control over financial reporting.
Item 9B. | OTHER INFORMATION |
None.
PART III
Certain information required by Part III is omitted from this Annual Report on Form 10-K pursuant to Instruction G to Exchange Act Form 10-K, and the Registrant will file its definitive Proxy Statement for its 2017 Annual Meeting of Stockholders, pursuant to Regulation 14A of the Securities Exchange Act of 1934, as amended (the “2017 Proxy Statement”), not later than 120 days after the end of the fiscal year covered by this Annual Report on Form 10-K, and certain information included in the 2017 Proxy Statement is incorporated herein by reference.
112
Item 10. | DIRECTORS, EXECUTIVE OFFICERS AND CORPORATE GOVERNANCE |
The information required by this item will be set forth in the 2017 Proxy Statement and is incorporated herein by reference.
Harmonic has adopted a Code of Business Conduct and Ethics for Senior Operational and Financial Leadership (the “Code”), which applies to its Chief Executive Officer, its Chief Financial Officer, its Corporate Controller and other senior operational and financial management. The Code is available on the Company’s website at www.harmonicinc.com.
Harmonic intends to satisfy the disclosure requirement under Form 8-K regarding an amendment to, or waiver from, a provision of this Code of Ethics by posting such information on our website, at the address specified above, and, to the extent required by the listing standards of The NASDAQ Global Select Market, by filing a Current Report on Form 8-K with the Securities and Exchange Commission disclosing such information.
Item 11. | EXECUTIVE COMPENSATION |
The information required by this item will be set forth in the 2017 Proxy Statement and is incorporated herein by reference.
Item 12. | SECURITY OWNERSHIP OF CERTAIN BENEFICIAL OWNERS AND MANAGEMENT AND RELATED STOCKHOLDER MATTERS |
Information related to security ownership of certain beneficial owners and security ownership of management and related stockholder matters will be set forth in the 2017 Proxy Statement and is incorporated herein by reference.
Item 13. | CERTAIN RELATIONSHIPS AND RELATED TRANSACTIONS, AND DIRECTOR INDEPENDENCE |
The information required by this item will be set forth in the 2017 Proxy Statement and is incorporated herein by reference.
Item 14. | PRINCIPAL ACCOUNTING FEES AND SERVICES |
The information required by this item will be set forth in the 2017 Proxy Statement and is incorporated herein by reference.
PART IV
Item 15. | EXHIBITS AND FINANCIAL STATEMENT SCHEDULES |
1. Financial Statements. See Index to Consolidated Financial Statements in Item 8 on page 57 of this Annual Report on Form 10-K.
2. Financial Statement Schedules. Financial statement schedules have been omitted because the information is not required to be set forth herein, is not applicable or is included in the financial statements or the notes thereto.
3. Exhibits. The documents listed in the Exhibit Index of this Annual Report on Form 10-K are filed herewith or are incorporated by reference in this Annual Report on Form 10-K, in each case as indicated therein.
Item 16. | FORM 10-K SUMMARY |
None.
113
SIGNATURES
Pursuant to the requirements of Section 13 or 15 (d) of the Securities Exchange Act of 1934, the Registrant, Harmonic Inc., a Delaware corporation, has duly caused this Annual Report on Form 10-K to be signed on its behalf by the undersigned, thereunto duly authorized, in the City of San Jose, State of California, on March 3, 2017.
HARMONIC INC. | |
By: | /s/ PATRICK J. HARSHMAN |
Patrick J. Harshman | |
President and Chief Executive Officer | |
Pursuant to the requirements of the Securities Exchange Act of 1934, this Annual Report on Form 10-K has been signed by the following persons on behalf of the Registrant and in the capacities and on the dates indicated.
Signature | Title | Date |
/s/ PATRICK J. HARSHMAN | President & Chief Executive Officer (Principal Executive Officer) | March 3, 2017 |
(Patrick J. Harshman) | ||
/s/ HAROLD L. COVERT | Chief Financial Officer | March 3, 2017 |
(Harold L. Covert) | (Principal Financial and Accounting Officer) | |
/s/ PATRICK GALLAGHER | Chairman | March 3, 2017 |
(Patrick Gallagher) | ||
/s/ E. FLOYD KVAMME | Director | March 3, 2017 |
(E. Floyd Kvamme) | ||
/s/ WILLIAM REDDERSEN | Director | March 3, 2017 |
(William Reddersen) | ||
/s/ SUSAN G. SWENSON | Director | March 3, 2017 |
(Susan G. Swenson ) | ||
/s/ MITZI REAUGH | Director | March 3, 2017 |
(Mitzi Reaugh) | ||
/s/ NIKOS THEODOSOPOULOS | Director | March 3, 2017 |
(Nikos Theodosopoulos) | ||
/s/ TOM LOOKABAUGH | Director | March 3, 2017 |
(Tom Lookabaugh) | ||
114
EXHIBIT INDEX
The following Exhibits to this report are filed herewith or, as shown below, are incorporated herein by reference.
Exhibit Number | |
2.1(xiii) | Asset Purchase Agreement, dated as of February 18, 2013, by and between Harmonic Inc. and Aurora Networks |
3.1(ii) | Certificate of Incorporation of Harmonic Inc., as amended |
3.2 | Amended and Restated Bylaws of Harmonic Inc. |
4.1(i) | Form of Common Stock Certificate |
4.2(iii) | Certificate of Designation of Rights, Preferences and Privileges of Series A Participating Preferred Stock of Harmonic Inc. |
4.3(xxi) | Indenture, dated December 14, 2015, by and between the Company and U.S. Bank National Association |
4.4(xxi) | Form of 4.00% Senior Convertible Note due 2020 (included in Exhibit 4.3) |
4.5(xxiii)† | Warrant to Purchase Shares of Common Stock of Harmonic, Inc. |
10.1(i)* | Form of Indemnification Agreement |
10.2(xii)* | 1995 Stock Plan, as amended and restated on June 27, 2012 |
10.4(xix)* | 2002 Director Stock Plan, as amended and restated on June 9, 2016 |
10.5(xv)* | 2002 Employee Stock Purchase Plan, as amended and restated on June 9, 2016 |
10.6(v)* | Change of Control Severance Agreement between Harmonic Inc. and Patrick Harshman, effective May 30, 2006 |
10.7(vi)* | Change of Control Severance Agreement between Harmonic Inc. and Neven Haltmayer, effective April 19, 2007 |
10.8(vii)* | Change of Control Severance Agreement between Harmonic Inc. and Nimrod Ben-Natan, effective April 11, 2008 |
10.9(viii)* | Harmonic Inc. 2002 Director Stock Plan Restricted Stock Unit Agreement |
10.10(viii) | Professional Service Agreement between Harmonic Inc. and Plexus Services Corp., dated September 22, 2003 |
10.11(viii) | Amendment, dated January 6, 2006, to the Professional Services Agreement for Manufacturing between Harmonic Inc. and Plexus Services Corp., dated September 22, 2003 |
10.12(viii) | Addendum 1, dated November 26, 2007, to the Professional Services Agreement between Harmonic Inc. and Plexus Services Corp., dated September 22, 2003 |
10.13(ix)* | Harmonic Inc. 1995 Stock Plan Restricted Stock Unit Agreement |
10.14(x) | Lease Agreement between Harmonic Inc. and CRP North First Street, L.L.C. dated December 15, 2009 |
10.17(xvii)* | Letter Agreement with Bart Spriester, dated July 29, 2014 |
10.18(xvii)* | Change of Control Severance Agreement between Harmonic Inc. and Bart Spriester, effective September 10, 2014 |
10.21(xviii)* | Offer Letter Agreement with Harold Covert, dated October 22, 2015 |
10.22(xviii)* | Change of Control Severance Agreement between Harmonic Inc. and Harold Covert, dated October 27, 2015 |
10.24 (xx) | Purchase Agreement, dated as of December 8, 2015, by and between Harmonic Inc. and Merrill Lynch, Pierce, Fenner & Smith Incorporated |
115
10.25(xxvi) | Put Option Agreement, dated as of December 7, 2015, by and between Harmonic Inc. and Mr. Eric Louvet, Mr. Eric Gallier, Mr. Jean-Marc Guiot, Mr. Claude Perron, Mrs. Crystele Trévisan-Jallu, Mrs. Delphine Sauvion, Mr. Marc Procureur, Mr. Christophe Delahousse, Mr. Hervé Congard, Mr. Arnaud de Puyfontaine, FPCI Winch Capital 3, Montalivet Networks and FPCI CIC Mezzanine 3 |
10.26(xxvi) | Sale and Purchase Agreement, dated as of February 11, 2016, by and between Harmonic International AG and Mr. Eric Louvet, Mr. Eric Gallier, Mr. Jean-Marc Guiot, Mr. Claude Perron, Mrs. Crystele Trévisan-Jallu, Mrs. Delphine Sauvion, Mr. Marc Procureur, Mr. Christophe Delahousse, Mr. Hervé Congard, Mr. Arnaud de Puyfontaine, FPCI Winch Capital 3, Montalivet Networks and FPCI CIC Mezzanine 3 for the acquisition of Thomson Video Networks |
10.27(xxiv) | Registration Rights Agreement, dated September 26, 2016, by and between the Company and Comcast. |
10.28(xxv)* | Transition letter agreement, dated December 12, 2016, by and between the Company and Harold Covert. |
21.1 | Subsidiaries of Harmonic Inc. |
23.1 | Consent of Independent Registered Public Accounting Firm |
31.1 | Certification of Principal Executive Officer pursuant to Section 302 of the Sarbanes-Oxley Act of 2002 |
31.2 | Certification of Principal Financial Officer pursuant to Section 302 of the Sarbanes-Oxley Act of 2002 |
32.1 | Certification of Principal Executive Officer pursuant to 18 U.S.C. Section 1350, as adopted pursuant to Section 906 of the Sarbanes-Oxley Act of 2002 |
32.2 | Certification of Principal Financial Officer pursuant to 18 U.S.C. Section 1350, as adopted pursuant to Section 906 of the Sarbanes-Oxley Act of 2002 |
101 | The following materials from Registrant’s Annual Report on Form 10-K for the year ended December 31, 2016, formatted in Extensible Business Reporting Language (XBRL) includes: Consolidated Balance Sheets at December 31, 2016 and December 31, 2015; (ii) Consolidated Statements of Operations for the Years Ended December 31, 2016, December 31, 2015 and December 31, 2014; (iii) Consolidated Statements of Comprehensive Loss for the Years Ended December 31, 2016, December 31, 2015 and December 31, 2014; (iv) Consolidated Statements of Stockholders’ Equity for the Years Ended December 31, 2016, December 31, 2015 and December 31, 2014; (v) Consolidated Statements of Cash Flows for the Years Ended December 31, 2016, December 31, 2015 and December 31, 2014; and (vi) Notes to Consolidated Financial Statements. |
* | Indicates a management contract or compensatory plan or arrangement relating to executive officers or directors of the Company. |
† | Registrant has omitted portions of this exhibit and filed such exhibit separately with the Securities and Exchange Commission pursuant to a grant of confidential treatment under Rule 406 promulgated under the Securities Act. |
(i) | Previously filed as an Exhibit to the Company’s Registration Statement on Form S-1 No. 33-90752. |
(ii) | Previously filed as an Exhibit to the Company’s Annual Report on Form 10-K for the year ended December 31, 2001. |
(iii) | Previously filed as an Exhibit to the Company’s Current Report on Form 8-K dated July 25, 2002. |
(iv) | Previously filed as an Exhibit to the Company’s Current Report on Form S-8 dated June 5, 2003. |
(v) | Previously filed as an Exhibit to the Company’s Current Report on Form 8-K dated May 31, 2006. |
(vi) | Previously filed as an Exhibit to the Company’s Current Report on Form 8-K dated April 19, 2007. |
(vii) | Previously filed as an Exhibit to the Company’s Current Report on Form 8-K dated April 16, 2008. |
(viii) | Previously filed as an Exhibit to the Company’s Current Annual Report on Form 10-K for the year ended December 31, 2008. |
(ix) | Previously filed as an Exhibit to the Company’s Quarterly Report on Form 10-Q for the quarter ended April 3, 2009. |
116
(x) | Previously filed as an Exhibit to the Company’s Current Report on Form 8-K dated December 18, 2009. |
(xi) | Previously filed as an Exhibit to the Company’s Registration Statement on Form S-8 dated September 21, 2010. |
(xii) | Previously filed as an Exhibit to the Company’s Registration Statement on Form S-8, dated July 30, 2012. |
(xiii) | Previously filed as an Exhibit to the Company’s Current Report on Form 8-K dated March 11, 2013. |
(xiv) | Previously filed as an Exhibit to the Company’s Current Report on Form 10-Q for the quarter ended September 26, 2014. |
(xv) | Previously filed as an Exhibit to the Company’s Registration Statement on Form S-8 dated November 7, 2014. |
(xvi) | Previously filed as an Exhibit to the Company’s Current Report on Form 8-K dated December 19, 2014. |
(xvii) | Previously filed as an Exhibit to the Company’s Annual Report on Form 10-K for the year ended December 31, 2014. |
(xviii) Previously filed as an Exhibit to the Company’s Current Report on Form 8-K dated October 21, 2015.
(xix) Previously filed as an Exhibit to the Company’s Registration Statement on Form S-8 dated November 6, 2015.
(xx) Previously filed as an Exhibit to the Company’s Current Report on Form 8-K dated December 7, 2015.
(xxi) Previously filed as an Exhibit to the Company’s Current Report on Form 8-K dated December 14, 2015.
(xxiii) Previously filed as an Exhibit to the Company’s Current Report on Form 8-K dated September 26, 2016.
(xxiv) Previously filed as an Exhibit to the Company’s Current Report on Form 8-K dated September 26, 2016.
(xxv) Previously filed as an Exhibit to the Company’s Current Report on Form 8-K dated December 13, 2016.
(xxvi) | Previously filed as an Exhibit to the Company’s Annual Report on Form 10-K for the year ended December 31, 2016. |
117