Attached files
| file | filename |
|---|---|
| EX-32.2 - EXHIBIT 32.2 - LATTICE SEMICONDUCTOR CORP | lsccex-322201610xk.htm |
| EX-32.1 - EXHIBIT 32.1 - LATTICE SEMICONDUCTOR CORP | lsccex-321201610xk.htm |
| EX-31.2 - EXHIBIT 31.2 - LATTICE SEMICONDUCTOR CORP | lsccex-312201610xk.htm |
| EX-31.1 - EXHIBIT 31.1 - LATTICE SEMICONDUCTOR CORP | lsccex-311201610xk.htm |
| EX-23.1 - EXHIBIT 23.1 - LATTICE SEMICONDUCTOR CORP | lsccex231201610-k.htm |
| EX-21.1 - EXHIBIT 21.1 - LATTICE SEMICONDUCTOR CORP | lsccex-211201610xk.htm |
| EX-10.14 - EXHIBIT 10.14 - LATTICE SEMICONDUCTOR CORP | lsccex-1014201610xk.htm |
| EX-3.2 - EXHIBIT 3.2 - LATTICE SEMICONDUCTOR CORP | lsccex-32201610xk.htm |
UNITED STATES SECURITIES AND EXCHANGE COMMISSION | ||||
Washington, D.C. 20549 | ||||
FORM 10-K | ||||
(Mark One) | ||||
[X] | ANNUAL REPORT PURSUANT TO SECTION 13 OR 15(d) OF THE SECURITIES EXCHANGE ACT OF 1934 FOR THE FISCAL YEAR ENDED DECEMBER 31, 2016 | |||
or | ||||
o | TRANSITION REPORT PURSUANT TO SECTION 13 OR 15(d) OF THE SECURITIES EXCHANGE ACT OF 1934 | |||
FOR THE TRANSITION PERIOD FROM __________ TO __________ | ||||
Commission file number: 000-18032

LATTICE SEMICONDUCTOR CORPORATION
(Exact name of registrant as specified in its charter)
Delaware | 93-0835214 |
(State of Incorporation) | (I.R.S. Employer Identification Number) |
111 SW Fifth Ave, Ste 700, Portland, OR | 97204 |
(Address of principal executive offices) | (Zip Code) |
Registrant's telephone number, including area code: (503) 268-8000
________________________________________
Securities registered pursuant to Section 12(b) of the Act:
________________________________________
(Title of Class) | (Name of each exchange on which registered) |
Common Stock, $.01 par value | NASDAQ Global Select Market |
Securities registered pursuant to Section 12(g) of the Act: None
Indicate by check mark if the registrant is a well-known seasoned issuer, as defined in Rule 405 of the Securities Act. Yes o No [X]
Indicate by check mark if the registrant is not required to file reports pursuant to Section 13 or Section 15(d) of the Act. Yes o No [X]
Indicate by check mark whether the registrant (1) has filed all reports required to be filed by Section 13 or 15(d) of the Securities Exchange Act of 1934 during the preceding 12 months (or for such shorter period that the registrant was required to file such reports), and (2) has been subject to such filing requirements for the past 90 days. Yes [X] No o
Indicate by check mark whether the registrant has submitted electronically and posted on its corporate Web site, if any, every Interactive Data File required to be submitted and posted pursuant to Rule 405 of Regulation S-T (§232.405 of this chapter) during the preceding 12 months (or for such shorter period that the registrant was required to submit and post such files). Yes [X] No o
Indicate by check mark if disclosure of delinquent filers pursuant to Item 405 of Regulation S-K (§229.405 of this chapter) is not contained herein, and will not be contained, to the best of the registrant's knowledge, in definitive proxy or information statements incorporated by reference in Part III of this Form 10-K or any amendment to this Form 10-K. [X]
Indicate by check mark whether the registrant is a large accelerated filer, an accelerated filer, a non-accelerated filer, or a smaller reporting company. See the definitions of “large accelerated filer”, “accelerated filer”, and “smaller reporting company” in Rule 12b-2 of the Exchange Act. (Check one):
Large accelerated filer o | Accelerated filer [X] |
Non-accelerated filer o | Smaller reporting company o |
Indicate by check mark whether the registrant is a shell company (as defined in Rule 12b-2 of the Act). Yes o No [X] | |||
Aggregate market value of voting stock held by non-affiliates of the registrant as of July 2, 2016 | $ | 494,446,306 | |
Number of shares of common stock outstanding as of February 27, 2017 | 121,748,458 | ||
DOCUMENTS INCORPORATED BY REFERENCE
The information required by Part III of this Report, to the extent not set forth herein, is incorporated herein by reference from the registrant's definitive proxy statement relating to the 2017 Annual Meeting of Stockholders, which definitive proxy statement shall be filed with the Securities and Exchange Commission within 120 days after the end of the fiscal year to which this Report relates.
LATTICE SEMICONDUCTOR CORPORATION
ANNUAL REPORT ON FORM 10-K
TABLE OF CONTENTS
Page | |||
PART I | |||
Item 1. | |||
Item 1A. | |||
Item 1B. | |||
Item 2. | |||
Item 3. | |||
Item 4. | |||
PART II | |||
Item 5. | |||
Item 6. | |||
Item 7. | |||
Item 7A. | |||
Item 8. | |||
Item 9. | |||
Item 9A. | |||
Item 9B. | |||
PART III | |||
Item 10. | |||
Item 11. | |||
Item 12. | |||
Item 13. | |||
Item 14. | |||
PART IV | |||
Item 15. | |||
2
Forward-Looking Statements
This Annual Report on Form 10-K contains forward-looking statements within the meaning of Section 27A of the Securities Act of 1933, as amended, and Section 21E of the Securities Exchange Act of 1934, as amended. These involve estimates, assumptions, risks and uncertainties. Any statements about our expectations, beliefs, plans, objectives, assumptions or future events or performance are not historical facts and may be forward-looking. We use words or phrases such as “anticipates,” “believes,” “could,” “estimates,” “expects,” “intends,” “plans,” “predicts,” “projects,” “may,” “will,” “should,” “continue,” “ongoing,” “future,” “potential” and similar words or phrases to identify forward-looking statements.
Examples of forward-looking statements include, but are not limited to, statements about: our strategies and beliefs regarding the markets we serve or may serve; growth opportunities and growth in markets we may serve; the advantages our products provide to our customers, including faster time to market and advanced features in an increasingly intense global technology market; our competitive advantage over our competitors; our future product development and marketing plans; our intention to continually introduce new products and enhancements and reduce manufacturing costs; our belief that video consumption will continue to grow and how our product portfolio will allow us to reach new markets; our plans to introduce new product families in high-growth market niches where we believe that we have sustainable and differentiated positions; the anticipation that we will become increasingly dependent on revenue from newer products; our expectations regarding customer preferences and product use; acceptance of our devices; our expectations that a significant portion of our revenue will continue to be dependent on the Mobile and Consumer, Communications and Computing, and Industrial and Automotive end markets; the Asia Pacific market being the primary source of our revenue; a significant portion of our revenue being through our sell-through distributors; our expectations regarding seasonal and economic trends; our estimates and judgment to reconcile distributors’ inventories; our making significant future investments in research and development; the costs of making and developing various products; our expectation that we will continue to transition to increasingly smaller geometry process technologies; our ability to maintain or develop successful foundry relationships to produce new products; the adequacy of assembly and test capacity commitments; the impact of products, customers and downward pressure on pricing and effects on gross margin; expected synergies from the acquisition of Silicon Image; the expected cost and timing of our internal restructuring plans; our expectations regarding protection of and defenses to claims against our intellectual property; our defenses to claims and the finalization and settlement of litigation or administrative proceedings; the impact of our global tax structure and expectations regarding taxes and tax adjustments; our ability to forecast future sales and the relative product mix of those revenues; our expectation regarding the sufficiency of our financial resources to meet our working capital needs through at least the next 12 months; our expectation that we may consider acquisition opportunities to further extend our product or technology portfolios and further expand our product offerings; our belief that our business as a whole is not materially dependent on any particular license or group of licenses; the impact of new accounting pronouncements; our beliefs concerning the adequacy of our liquidity and facilities, and our ability to meet our operating and capital requirements and obligations; our continued participation in consortia that develop and promote the High-Definition Multimedia Interface ("HDMI"), Mobile High-Definition Link ("MHL") and WirelessHD specifications, and our participation in other standard setting initiatives and deep engagement with the standards bodies; the effect of termination of our agent functions regarding the HDMI consortium, related reduction in adopter fees, and impairment charges; our ability to implement a company-wide enterprise resource planning system; any other changes in the agreements relating to various intellectual property or standards consortia and their sharing of past or present fees or royalties; and our expectation that the proposed acquisition of the outstanding shares of the Company by Canyon Bridge Acquisition Company, Inc. will occur in early 2017.
Forward-looking statements involve estimates, assumptions, risks, and uncertainties that could cause actual results to differ materially from those expressed in the forward-looking statements. The key factors, among others, that could cause our actual results to differ materially from the forward-looking statements included global economic conditions and uncertainty, the concentration of our sales in the Mobile and Consumer and Communications and Computing end markets, particularly as it relates to the concentration of our sales in the Asia Pacific region, market acceptance and demand for our new products, our ability to license our intellectual property, any disruption of our distribution channels, the impact of competitive products and pricing, unexpected charges, delays or results relating to our restructuring plans, unexpected changes to our implementation of a company-wide enterprise resource planning system, the effect of the downturn in the economy on capital markets and credit markets, unanticipated taxation requirements or positions of the U.S. Internal Revenue Service, or unexpected impacts of recent accounting guidance. In addition, actual results are subject to other risks and uncertainties that relate more broadly to our overall business, including those more fully described herein and that are otherwise described from time to time in our filings with the Securities and Exchange Commission, including but not limited to the items discussed in “Risk Factors” in Item 1A of Part I of this Annual Report on Form 10-K.
You should not unduly rely on forward-looking statements because our actual results could differ materially from those expressed in any forward-looking statements made by us. In addition, any forward-looking statement applies only as of the date on which it is made. We do not plan to, and undertake no obligation to, update any forward-looking statements to reflect events or circumstances that occur after the date on which such statements are made or to reflect the occurrence of unanticipated events.
3
PART I
Item 1. Business
Overview
Lattice Semiconductor Corporation and its subsidiaries (“Lattice,” the “Company,” “we,” “us,” or “our”) develop semiconductor technologies that we monetize through products, solutions, and licenses.
We enable our customers to quickly and easily develop smart and connected products. We help their products become more aware, interact more intelligently, and make better and faster connections. In an increasingly intense global technology market, we help our customers get their products to market faster than their competitors.
Our historic focus was on the programmable logic devices (PLDs). In 2011, we made the strategic decision to competitively differentiate from other established programmable logic companies with ultra-low power and ultra-small sized field programmable gate array (FPGA) solutions, a type of PLD. As a result, we acquired a leader in this technology, SiliconBlue Technologies, Inc. In 2015, we extended our capabilities beyond PLDs with the acquisition of Silicon Image, Inc. and its portfolio of standards-driven Video Connectivity application specific standard products (ASSPs), 60 GHz mmWave devices, and associated intellectual property (IP). We believe that video consumption will continue to grow and our broader product portfolio will allow us to reach markets that we could not previously access. Video expertise combined with FPGA-based hardware acceleration and both wired and wireless ways to distribute data allow us to penetrate new markets.
Our results for the year ended January 2, 2016 (fiscal 2015) include the results of Silicon Image for the approximately 10-month period from March 11, 2015 through January 2, 2016. Results presented for periods prior to fiscal 2015 are those historically reported for Lattice only. Our results for the year ended December 31, 2016 fully include the results of Silicon Image.
Our Markets and Customers
We sell globally into three markets: Mobile and Consumer, Communications and Computing, and Industrial and Automotive.
In the Mobile and Consumer Market, you can find our solutions making consumer products smarter and thinner, including: smartphones, tablets and e-readers, wearables, accessories such as chargers and docks, smart home devices, Virtual Reality (VR) headsets, Ultra High-Definition (UHD) TVs, digital SLR cameras, drones, and other connected devices.
Our Mobile and Consumer customers are driven by the need to deliver richer and more responsive experiences. They typically require:
• | More intelligence and computing power. Products need to be always-on and always-aware. |
• | Longer battery lives for handheld devices and reduced energy consumption for plugged-in devices. |
• | Real-time transmission of higher resolution video content on larger screen sizes. |
• | Fast design cycles. Products must be quickly and easily differentiated. |
• | Smaller form factors. Products need to lay flatter on the wall or fit more easily in people’s pockets. |
Lattice solutions help solve these challenges with the following products and services (described in detail below):
• | PLDs which bring multiple benefits to our customers. PLD’s parallel architecture enables faster processing than competing devices, such as processors, allowing for a user experience with shorter pauses and fewer delays. Our FPGAs are among the lowest power in the industry, enabling the application processor and other high power components to remain dormant longer, resulting in longer battery life. Finally, with some of the industry’s smallest packages, we enable thinner end products. |
• | mmWave Devices such as our SiBEAM Snap and WirelessHD products that simplify connectivity. SiBEAM Snap is a wireless connection technology that can transfer a high definition movie to a mobile device in seconds while eliminating the connector port. WirelessHD products enable laptops, projectors, accessories, and other Consumer products to wirelessly communicate at very high speeds. |
• | A full suite of standards-based HDMI and MHL Video Connectivity ASSPs which enable the immersive audio-visual experience that consumers demand. |
• | Intellectual Property Licensing which enables customers who wish to develop a proprietary solution to use our proven technology. |
4
Our proprietary solutions help our customers get their products to market faster than typical development cycles. With re-programmability and flexibility, our PLDs inherently allow our customers to have quicker product development. Our deep engagement with industry standards bodies gives us an intimate knowledge of that technology and the ability to get better products to market faster. Our mmWave technology is at the forefront of wireless connectivity innovation. These time-to-market advantages are critical given shorter product life cycles and higher competition in our customers’ end markets.
In the Communications and Computing Market, our solutions play key roles in data center systems such as servers, HetNet small cell base stations, network backhaul, wired access aggregation, and other related applications.
Our Communications and Computing customers need to “connect anything to everything,” at ever-increasing data rates.
• | As data center servers become smaller and power costs become more dominant, there is a growing requirement for smaller form factors with lower installed and operational costs. |
• | Additionally, they need simplified control logic, enhanced security, and rigorous power and thermal management. |
• | Networks typically require progressively higher bandwidth and increased reliability as more data is demanded by consumer and other connected devices. Bandwidth demands are also driven by the rapid transition to a cloud-based infrastructure. |
• | As wireless cells become smaller, there is a growing requirement for smaller form factors with lower costs. |
We help customers solve these problems with the following products:
• | PLDs optimized for Input-Output (I/O) expansion, acceleration and hardware management. Our FPGAs consume very low power, which reduces operating costs. Their small form factor enables higher functional density in less space. Finally, our FPGAs are I/O rich, which allows for more connections with system application specific integrated circuits (ASICs) and ASSPs. Our programmable mixed signal devices make power and thermal management easy and reliable. |
• | mmWave transceivers feature high-integration, low power design, and internal / external antenna options. Our beam-steering technology makes point-to-point links lighter, cheaper, lower power and easier to install, enabling backhaul at “wireless fiber” data rates. |
Examples of our products enabling intelligent automation in the Industrial and Automotive Market include: machine vision, robotics, factory automation, industrial handhelds, surveillance cameras and DVRs, digital signage, driver assistance, automotive infotainment, servers, and data center networks.
Our Industrial and Automotive customers face numerous challenges:
• | As smart factories develop, sensors are proliferating and machine vision is becoming higher definition, in turn requiring increasing amounts of data to be gathered, connected, and processed. |
• | Cars, trucks, and trains are also becoming smarter and more connected. Drivers and passengers are demanding better in-cabin experiences including entertainment, diagnostics, and enhanced safety - often involving multiple displays, cameras, and sensors. |
Our product portfolio helps solve these challenges with the following products and services:
• | Our small-sized, low-power PLDs not only provide the I/O expansion, bridging, connectivity and processing inherent in FPGAs to the full Industrial Market, but they also form the backbone of several integrated solutions, including complete HD camera and DVR solutions on a single FPGA device and Human-Machine Interfaces (HMI) on a chip. |
• | Performance-tested and regulatory-approved mmWave modules greatly reduce the complexity of adding high-performance wireless video capabilities to displays, without the wires that clutter a factory floor or medical suite. |
• | Automotive qualified MHL / HDMI Video Connectivity ASSPs allow consumers to stream UHD video from their mobile phones to their in-car entertainment system, delivering the ultimate connected car experience. |
Our Products, Services, and Competition
We deliver three types of semiconductor devices to help solve our customers' problems: PLDs, Video Connectivity ASSPs, and mmWave devices. We also serve our customers with IP licensing and various other services.
Programmable Logic Devices (“PLDs”)
PLDs are regular arrays of logic that can be custom-configured by the user through software. This programmability allows our customers flexibility and reduced time to market while allowing us to offer the chips to many different customers in many different markets. Five product family lines anchor our PLD offerings:
• | The ECP families are our “Connectivity & Acceleration FPGAs.” They offer customers the lowest cost per gate, Digital Signal Processing (DSP) capability, and Serialize-Deserialize (SerDes) connectivity. ECP devices are optimized for the Communications and Computing market but also find significant use in the Industrial and Automotive market. |
5
• | The MachXO families are known as “Bridging and Expansion FPGAs.” They are control oriented and offer the lowest cost per I/O. MachXO3L was chosen by the trade publication EDN as one of the “100 Hot Products of 2014”. MachXO families are widely used across our three primary target markets: Communications and Computing, Industrial and Automotive, and Mobile and Consumer. |
• | iCE40 families are known as the “World’s Smallest FPGAs.” Their small size and ultra-low power, make them the optimal products for customizing Consumer mobile and Industrial handheld products. The iCE40 UltraLite, was named “Digital Semiconductor Product of the Year” by the 2015 Elektra European Electronics Industry Awards. In 2016, we released the latest member of the family, iCE40 UltraPlus, focused on smart phone and IoT edge devices. |
• | CrossLink was introduced in 2016 as the world’s first video “pASSP” (programmable Application Specific Standard Part). CrossLink combines the power and speed benefits of hardened camera and display bridging cores with the flexibility of FPGA fabric. CrossLink was named the 2016 recipient of the “Editor’s Choice Award” by EEPW magazine. |
• | Programmable Mixed Signal devices, such as our Platform Manger 2 and L-ASC10 combine programmable digital logic with analog functionality to help customers manage power, thermal, and control planes in real time. |
• | To enable our customers to get to market faster we support the PLDs with intellectual property cores, reference designs, development kits, and design software. |
Competition for our PLDs is fragmented.
• | While ASICs, ASSPs, and microcontrollers have historically dominated high-volume market segments through low cost and reduced power consumption, our PLDs have become small enough with sufficiently low power that we are now considered by customers in cases where they need the architectural benefits of PLDs, namely programmability with its accelerated time-to-market and the speed that comes from parallelism. If a customer’s design is not working as intended, the customer can quickly change it using the programmability of our PLDs through software. In contrast, ASICs and ASSPs require time consuming and expensive redesign and fabrication. Against microcontrollers we differentiate our products with smaller sized packages and higher performance. |
• | Our main PLD competitors are Xilinx and Intel/Altera. Both make PLDs but are generally focused on the high-density end of the market, making devices that are up to a full order of magnitude larger than ours with the associated increases in power and size. We differentiate from them with ultra-low power and very small sized packages. |
Video Connectivity ASSPs
In the Mobile and Consumer market, consumers need to connect many different types of audio-video devices and expect them to work seamlessly together. We refer to these connections as “Video Connectivity.” Industry standards, such as HDMI, MHL, and USB Type-C, ensure that consumers are able to successfully make those connections. These industry standards support resolutions up to 8K, High Dynamic Range, Deep Color, and HDCP 2.2 content protection. Our Video Connectivity ASSPs implement these standards along with value-added features and allow Consumer original equipment manufacturers (OEMs) manufacturers to quickly get feature rich and interoperable products to market.
Our Video Connectivity ASSPs perform many functions, including ensuring interoperability, enhancing picture quality, converting between resolutions, and transmitting / receiving content without the need for additional components. Specific device types include port processors, port controllers, video processors, transmitters, receivers, bridges, and converters. These devices are used in products such as mobile phones, UHD TVs, home theater systems, HDMI cable extenders, automotive infotainment, PCs, accessories, projectors, and monitors.
In general, our Video Connectivity competition includes:
• | HDMI or MHL functionality offered in either discrete devices or integrated into system-on-a-chip products. These are offered by a small number of companies. |
• | In-house semiconductor solutions designed by large consumer electronics OEMs. |
• | Alternative HD connectivity technologies such as DisplayPort and MiraCast which are offered by a small number of companies. |
While our competition mainly tries to win with price, we believe that we have an advantage because of our deep engagement with industry standards bodies. This involvement enables us to bring our “standards plus” products to market more quickly and gives our customers confidence that we have the expertise needed to successfully execute.
6
mmWave Devices
Our mmWave devices and modules allow customers to wirelessly transfer data and UHD video content at gigabit speeds. Built using our proprietary 60 GHz SiBEAM technology, our mmWave transceivers, processors, and antenna arrays are divided into three groups, differentiated by their transmission range:
• | Gigabit Connector devices “eliminate the connectors on your mobile products.” Built with SiBEAM Snap technology these devices under development connect consumer products and are effective across centimeter distances. |
• | Our Gigabit Indoor devices and modules “cut the wires in home, office, and factory.” Geared around the Consumer and Industrial Markets these devices reach distances measured in meters. |
• | Gigabit Outdoor products provide “wireless fiber for network backhaul.” Achieving a range of 100’s of meters these devices provide the Communications market with ultra-high speed links for point-to-point connectivity. |
Our competition includes a small number of established semiconductor companies that work to create an advantage by bundling mmWave technology into their reference designs and processors. We believe that the depth of our 60 GHz experience enables us to get products to market faster and when combined with advanced features, such as our advanced beam-forming technology, gives us an edge over our competition.
Intellectual Property (IP) Licensing
Lattice has a broad set of technological capabilities and many US and international patents. We generate revenue from our technology portfolio via upfront fees and on-going royalty payments with three sets of activities:
1. | Standard IP Licensing - these activities include our participation in two consortia for the licensing of HDMI and MHL technologies to customers who adopt the technology into their products and voluntarily report their usage and royalties. The royalties are split between consortia members, including us. |
2. | IP Core Licensing - some customers need Lattice’s technology for specific functions or features, but for various reasons are not able to use our silicon solutions. In those cases, we may sell them IP cores which they can integrate into their own ASICs. In contrast to the use of consortia, these licensing activities are generally performed internally. |
3. | Patent Monetization - we sell certain patents from our portfolio generally for technology that we are no longer actively developing. The revenue from these sales generally consists of upfront payments and potential future royalties. |
Simplay Labs, LLC (“Simplay Labs”)
Simplay Labs develops performance standards, testing services, development tools, and technologies for Mobile and Consumer product manufacturers. By partnering with Simplay Labs, manufacturers can reduce the time and cost to market, providing products that are distinguished by reliability and ease of operation while delivering the high-performance HD their customers demand. The products that Simplay Labs tests include televisions, A/V receivers, sound bars, set-top boxes, gaming consoles, and media hubs. Simplay Labs has service centers operating in the United States, South Korea, China, and Taiwan. Simplay’s service centers provide compliance, interoperability and performance testing.
Research and Development
We place a substantial emphasis on new product development, with a priority on return on investment, and believe that continued investment in research and development is required to maintain and improve our competitive position. Our product development activities emphasize new proprietary products, advanced packaging, enhancement of existing products and process technologies, improvement of software development tools, development of innovative technology standards, and enhanced services. Research and development activities occur primarily in: Hillsboro, Oregon; San Jose, California; Shanghai, China; Alabang, Philippines; and Hyderabad, India.
Research and development expenses were $117.5 million in 2016, $136.9 million in 2015, and $88.1 million in 2014. The increase in fiscal 2015 as compared to fiscal 2014 is substantially due to the inclusion of approximately ten months of activity from Silicon Image following acquisition. We expect to continue to make significant investments in research and development.
Operations
We do not manufacture our own silicon products. We maintain strategic relationships with large semiconductor foundries to source our finished silicon wafers. This strategy allows us to focus our internal resources on product and market development, and eliminates the fixed cost of owning and operating semiconductor manufacturing facilities. We are also able to take advantage of the ongoing advanced process technology development efforts of semiconductor foundries.
7
Lattice and Fujitsu Limited ("Fujitsu") have entered into agreements pursuant to which Fujitsu manufactures our products on its 130nm, 90nm and 65nm CMOS process technologies, as well as on 130nm, 90nm and 65nm technologies with embedded flash memory that we have jointly developed with Fujitsu. Taiwan Semiconductor Manufacturing Company Ltd. (“TSMC”) manufactures our 40nm iCE and legacy Silicon Image products. United Microelectronics Corporation ("UMC") manufactures certain of our 40nm products, as well as some of our 350nm and 180nm products. Seiko Epson ("Epson") manufactures some of our 500nm, 350nm, 250nm and 180nm products.
All of our assembly and volume test operations are performed by outside suppliers.
We rely on third party vendors to provide cost-effective and efficient supply chain services. Among other activities, these outsourced services relate to direct sales logistics, including order fulfillment, inventory management and warehousing, and shipment of inventory to third party distributors.
We perform certain test operations as well as reliability and quality assurance processes internally. We have achieved and maintained ISO9001:2008 Quality Management Systems Certification and released a line of products qualified to the AEC-Q100 Reliability Standard.
Wafer Fabrication
We source silicon wafers from our foundry partners, Fujitsu and Epson in Japan, and TSMC and UMC in Taiwan, pursuant to agreements with each company and their respective affiliates. We negotiate wafer volumes, prices and other terms with our foundry partners and their respective affiliates on a periodic basis.
Assembly
After wafer fabrication and initial testing, we ship wafers to independent subcontractors for assembly. During assembly, wafers are separated into individual die and encapsulated in plastic packages. We have qualified assembly partners in Indonesia, Malaysia, Taiwan, the Philippines, South Korea, Singapore, Japan, and the United States. We negotiate assembly prices, volumes and other terms with our assembly partners and their respective affiliates on a periodic basis.
We currently offer an extensive list of standard products in lead (Pb) free packaging. We believe our lead-free products meet the European Parliament Directive entitled "Restrictions on the use of Hazardous Substances" ("ROHS"). A select and growing subset of our ROHS compliant products are also offered with a "Halogen Free" material set.
Testing
We electrically sort test the die on most wafers prior to shipment for assembly. Following assembly, but prior to customer shipment, each product undergoes final testing and quality assurance procedures. Wafer sort testing is performed by independent contractors in Malaysia, Japan, Indonesia, Taiwan, and Singapore. Final testing is performed by independent contractors in Indonesia, Malaysia, the Philippines, Singapore, Taiwan, South Korea, Japan, and the United States. We also perform certain test operations, as well as reliability and quality assurance processes, internally.
Sales and Revenue
We generate revenue by monetizing our technology and patents using two go-to-market strategies.
• | Product and Technology Sales involve direct and channel sales of silicon based products with their associated solutions and services. |
• | Intellectual Property Licensing involves either the license or sale of intellectual property that we have developed, some of which is used in our products. |
Seasonality
While we periodically may experience some seasonal trends in the sale of our products, general economic conditions and the cyclical nature of the end markets we serve generally have a greater impact on our business and financial results than seasonal trends.
8
Backlog
Our backlog consists of orders from distributors and certain OEMs that require delivery within the next year. Historically, our backlog has not been a predictor of future sales or customer demand for the following reasons:
• | Purchase orders, consistent with common industry practices, can generally be revised or canceled up to 30 days before the scheduled delivery date without significant penalty. |
• | Our backlog for sell-through distributors is valued at list price, which in most cases is substantially higher than the prices ultimately recognized as revenue. |
• | A sizable portion of our revenue comes from our "turns business," where the product is ordered and delivered within the same quarter. |
A growing portion of our revenue arises from vendor managed inventory arrangements where the timing and volume of customer utilization is difficult to predict.
Sales and Customers
We primarily sell our products to end customers from Lattice Semiconductor Corporation or our wholly-owned subsidiary, Lattice SG Pte. Ltd. We sell both directly and through a network of independent manufacturers' representatives. Additionally, we sell indirectly through independent sell-in (primarily Japan) and sell-through distributors. We also employ a direct sales management and field applications engineering organization to support our end customers and indirect sales resources. Our end customers are primarily original equipment manufacturers ("OEMs") in the Communications and Computing, Mobile and Consumer, and Industrial and Automotive end markets.
We have agreements with 19 manufacturers' representatives in North America. We have established sales channels in over 44 foreign countries and maintain a network of 14 international sales representatives. A substantial portion of our sales are made through distributors.
We provide global technical support to our end customers with engineering staff based at our headquarters, product development centers and selected field sales offices. We maintain numerous domestic and international field sales offices in major metropolitan areas.
Resale of product by sell-through distributors accounted for approximately 61% of our net revenue in fiscal 2016, and approximately 45% of our net revenue in each of fiscal 2015, and 2014, and we expect our distributors to generate a significant portion of our revenue in the future. We depend on our distributors to sell our products to end customers, complete order fulfillment, and maintain sufficient inventory of our products. Our distributors also provide technical support and other value-added services to our end customers. We have two global sell-through distributors. We also have regional distribution in Asia, Japan, Israel, and North America, and we sell through three major on-line distributors.
In fiscal years 2016 and 2015, our revenue was broadly distributed across end markets and end customers, with no individual end customer accounting for more than 10% of the total revenue for the year. In fiscal 2014, our top two end customers accounted for 19% and 12%, respectively, of total revenue. No other individual end customers, in any end markets, accounted for more than 10% of total revenue in fiscal year 2014.
Revenue from foreign sales as a percentage of total revenue was 88%, 92%, and 92%, for fiscal 2016, 2015, and 2014, respectively. We assign revenue to geographies based on customer ship-to address at the point where revenue is recognized. Revenue attributed to China for fiscal 2016 was approximately 34% of total revenue, compared to 36% and 43% in fiscal 2015 and fiscal 2014, respectively. In the case of sell-in distributors and OEMs, revenue is typically recognized, and geography is assigned, when products are shipped. In the case of sell-through distributors, revenue is recognized when resale to the end customer occurs and geography is assigned based on the end customer location on the resale reports provided by the distributor. Both foreign and domestic sales are denominated in U.S. dollars, with the exception of certain historical sales in Japan, where were denominated in yen.
9
The composition of our revenue by geography, based on ship-to location, is as follows:
Year Ended | % Change in | |||||||||||||||||||||||||
(In thousands) | December 31, 2016 | January 2, 2016 | January 3, 2015 | 2016 | 2015 | |||||||||||||||||||||
Asia | $ | 305,093 | 71 | % | $ | 308,534 | 76 | % | $ | 266,831 | 73 | % | (1 | ) | 16 | |||||||||||
Europe | 59,835 | 14 | 55,596 | 14 | 59,041 | 16 | 8 | (6 | ) | |||||||||||||||||
Americas | 62,126 | 15 | 41,836 | 10 | 40,255 | 11 | 48 | 4 | ||||||||||||||||||
Total revenue | $ | 427,054 | 100 | % | $ | 405,966 | 100 | % | $ | 366,127 | 100 | % | 5 | 11 | ||||||||||||
Intellectual Property, Patents, and Licensing
Intellectual Property
We seek to protect our products and technologies primarily through patents, trade secrecy measures, copyrights, mask work protection, trademark registrations, licensing restrictions, confidentiality agreements and other approaches designed to protect proprietary information. There can be no assurance that others may not independently develop competitive technology not covered by our intellectual property rights or that measures we take to protect our technology will be effective.
Patents
We hold numerous United States and international patents and have patent applications pending in the United States and internationally. Our current patents will expire at various times between 2017 and 2035, subject to our payment of periodic maintenance fees. There can be no assurance that pending or future patent applications will result in issued patents, or that any issued patents will survive challenges to their validity. Although we believe that our patents have value, there can be no assurance that our patents, or any additional patents that may be issued in the future, will provide meaningful protection from competition. We believe that our success will depend primarily upon the technical expertise, experience, and creativity, and the sales and marketing abilities of our personnel.
Patent and other proprietary rights infringement claims are common in our industry. There can be no assurance that, with respect to any claim made against us, we would be able to successfully defend against the claim or that we could obtain a license that would allow us to use the proprietary rights on terms or under conditions that would not harm our business.
Licenses
We have acquired various licenses from third parties to certain technologies that are implemented in IP cores or embedded in our products. Those licenses support our continuing ability to make and sell these products to our customers. While our various licenses are important to our success, we believe our business as a whole is not materially dependent on any particular license, or group of licenses.
Our Team
As of December 31, 2016, we had 986 full-time employees worldwide. We believe that our future success will depend, in part, on our ability to continue to attract and retain highly skilled technical, sales, and management personnel. None of our employees are represented by a collective bargaining agreement. We have never experienced any work stoppages and consider our employee relations to be good.
Corporate Background
Lattice was incorporated in Oregon in 1983 and reincorporated in Delaware in 1985. Our headquarters is located at 111 SW Fifth Avenue, Suite 700, Portland, Oregon 97204, and our website is www.latticesemi.com. Information contained or referenced on our website is not incorporated by reference into, and does not form a part of, this Annual Report on Form 10-K. Our common stock trades on the NASDAQ Global Select Market under the symbol LSCC.
10
Reporting Calendar
We report based on a 52 or 53-week fiscal year ending on the Saturday closest to December 31. Our fiscal 2016 and 2015 were 52-week years that ended December 31, 2016 and January 2, 2016, respectively. Our fiscal 2014 was a 53-week year, with a 14-week fourth quarter, that ended January 3, 2015. Our fiscal 2017 will be a 52-week year and will end on December 30, 2017. All references to quarterly or yearly financial results are references to the results for the relevant fiscal period.
Available Information
We make available, free of charge through the Investor Relations section of our website at www.latticesemi.com, our annual reports on Form 10-K, quarterly reports on Form 10-Q, current reports on Form 8-K, proxy statements and amendments to those reports and statements as soon as reasonably practicable after such materials are electronically filed with, or furnished to, the SEC. You may also obtain free copies of these materials by contacting our Investor Relations Department at 111 SW Fifth Ave, Ste. 700, Portland, Oregon 97204, telephone (503) 268-8000. Our SEC filings are also available at the SEC's website at www.sec.gov, and they may be read and copied at the SEC's public reference room at 100 F Street NE, Washington, DC 20549. Information on the operation of the Public Reference Room can be obtained by calling the SEC at 1-800-SEC-0330. The content on any website referred to in this filing is not incorporated by reference into this filing unless expressly noted otherwise.
ITEM 1A. Risk factors
The following risk factors and other information included in this Annual Report should be carefully considered before making an investment decision relating to our common stock. If any of the risks described below occur, our business, financial condition, operating results and cash flows could be materially adversely affected. The risks and uncertainties described below are not the only ones we face. Additional risks and uncertainties not presently known to us or that we currently deem immaterial also may impair our business operations and financial results.
The announcement and pendency of our proposed acquisition by Canyon Bridge Acquisition Company, Inc. could materially adversely affect our business, financial condition, and results of operations.
On November 3, 2016, Lattice Semiconductor Corporation and Canyon Bridge Capital Partners, Inc. (“Canyon Bridge”) announced that the Company and Canyon Bridge Acquisition Company, Inc. (“Parent”), an affiliate of Canyon Bridge, have signed a definitive agreement (the "Merger Agreement") under which Parent will acquire all outstanding shares of Lattice for approximately $1.3 billion inclusive of Lattice’s net debt, or $8.30 per share in cash. The transaction (the "Merger") was unanimously approved by both companies’ boards of directors and is expected to close in early 2017 subject to customary closing conditions, regulatory approvals and approval by Lattice’s shareholders. Upon the completion of the transaction, Lattice will be a wholly owned subsidiary of Parent. The announcement and pendency of our proposed acquisition by Parent could disrupt our business and create uncertainty about our future, which could have a material and negative impact on our business, financial condition, and results of operations, regardless of whether the acquisition is completed. These risks to our business, all of which could be exacerbated by any delay in the closing of the acquisition, include:
• | restrictions in the Merger Agreement on the conduct of our business prior to the closing of the acquisition, which prevent us from taking specified actions without the prior consent of Parent, which actions we might otherwise take in the absence of the Merger Agreement; |
• | the attention of our management may be directed towards the closing of the acquisition and may be diverted from our day-to-day business operations, and matters related to the acquisition may require commitments of time and resources that could otherwise have been devoted to other opportunities that might have been beneficial to us; |
• | our customers, suppliers and other third parties may decide not to renew or seek to terminate, change or renegotiate their relationships with us, whether pursuant to the terms of their existing agreements with us or otherwise; |
• | our employees may experience uncertainty regarding their future roles, which might adversely affect our ability to retain, recruit and motivate key personnel; and |
• | potential litigation relating to the merger and the related costs. |
Any of these matters could adversely affect our stock price, business, financial condition, results of operations, or business prospects.
11
The parties may be unable to satisfy the conditions to the closing of our acquisition by Parent and the acquisition may not be consummated, and the failure of the acquisition to be completed may adversely affect our business and our share price.
Consummation of our acquisition by Parent is subject to various closing conditions, including, among other things, (i) the pending adoption of the Merger Agreement by our stockholders, (ii) the absence of any legal restraints or prohibitions on the consummation of the Merger, and (iii) approval from the Committee on Foreign Investment in the United States (CFIUS), expiration or termination of the applicable waiting period under the Hart-Scott-Rodino Antitrust Improvements Act of 1976, and other regulatory approvals. The obligation of each party to consummate the Merger is also conditioned upon the other party’s representations and warranties being true and correct (subject to certain materiality exceptions), and the other party having performed in all material respects its obligations under the Merger Agreement. The obligation of Parent to consummate the Merger is also conditioned upon our not having suffered a Company Material Adverse Effect (as defined in the Merger Agreement). These and other conditions to the consummation of the Merger may fail to be satisfied. In addition, satisfying the conditions to the Merger may take longer than we and Parent currently expect. The satisfaction of all of the required conditions could delay the completion of the Merger for a significant period of time or prevent it from occurring. Thus, there can be no assurance that the conditions to the Merger will be satisfied or waived or that the Merger will be consummated.
In addition, the Merger Agreement may be terminated under specified circumstances, including by Parent upon a change in the recommendation of our board of directors in connection with our entering into an acquisition agreement with respect to a Superior Proposal (as defined in the Merger Agreement). Failure to complete the Merger could adversely affect our business and the market price of our common stock in a number of ways, including:
• | our current stock price may reflect a market assumption that the proposed acquisition will occur, meaning that a failure to complete the proposed transaction could result in a decline in the price of our common stock; |
• | we are subject to legal proceedings related to the Merger; |
• | the failure of the Merger to be consummated may result in negative publicity and a negative impression of us in the investment community; |
• | any disruptions to our business resulting from the announcement and pendency of the Merger, including any adverse changes in our relationships with our customers, vendors and employees, may continue or intensify in the event the Merger is not consummated; |
• | we may not be able to take advantage of alternative business opportunities or effectively respond to competitive pressures; |
• | we may be required to pay a termination fee of $34.18 million if the Merger Agreement is terminated under certain circumstances; |
• | we expect to incur substantial transaction costs in connection with the proposed transaction, whether or not it is completed; and |
• | we may not be entitled to receive a termination payment from Parent in all circumstances where the Merger Agreement is terminated due to Parent’s breach of its obligations under the Merger Agreement or where we fail to obtain CFIUS approval. |
Litigation challenging the Merger Agreement may prevent the Merger from being consummated at all or within the expected timeframe.
Lawsuits have been filed and additional lawsuits may be filed against us, our Board of Directors and other parties to the Merger Agreement, challenging our acquisition by Parent. Such lawsuits have been and may be brought by our purported stockholders and may seek, among other things, to enjoin consummation of the Merger. One of the conditions to the consummation of the Merger is that no order will be in effect that prevents, makes illegal or prohibits the consummation of the Merger. As such, if the plaintiffs in such potential lawsuits are successful in obtaining an injunction prohibiting the defendants from completing the Merger on the agreed upon terms, then such injunction may prevent the Merger from becoming effective, or from becoming effective within the expected timeframe.
We rely on a limited number of independent suppliers for the manufacture of all of our products and a failure by our suppliers to provide timely, cost-effective, and quality products could adversely affect our operations and financial results.
We depend on independent foundries to supply silicon wafers for our products. These foundries include Fujitsu in Japan and United Microelectronics Corporation in Taiwan, which supply the majority of our programmable logic wafers, and Taiwan Semiconductor Manufacturing, which supplies most of our HDMI and MHL integrated circuits. We negotiate wafer volumes, prices, and other terms with our foundry partners and their respective affiliates on a periodic basis typically resulting in short-term agreements which do not ensure long-term supply or allocation commitments. We rely on our foundry partners to produce wafers with competitive performance attributes. If the foundries that supply our wafers experience manufacturing problems, including unacceptable yields, delays in the realization of the requisite process technologies, or difficulties due to limitations of new and existing process technologies, our operating results could be adversely affected.
12
If for any reason the foundries are unable to, or do not manufacture sufficient quantities of our products or continue to manufacture a product for the full life of the product, we may be required to prematurely limit or discontinue the sales of certain products or incur significant costs to transfer products to other foundries, and our customer relationships and operating results could be adversely affected. In addition, weak economic conditions may adversely impact the financial health and viability of the foundries and cause them to limit or discontinue their business operations, resulting in shortages of supply and an inability to meet their commitments to us, which could adversely affect our financial condition and operating results.
A disruption of one or more of our foundry partners' operations as a result of a fire, earthquake, act of terrorism, political or labor unrest, governmental uncertainty, war, disease, or other natural disaster or catastrophic event, or any other reason, could disrupt our wafer supply and could adversely affect our operating results.
Establishing, maintaining and managing multiple foundry relationships requires the investment of management resources as well as additional costs. If we fail to maintain our foundry relationships, or elect or are required to change foundries, we will incur significant costs and manufacturing delays. The success of certain of our next generation products is dependent upon our ability to successfully partner with Fujitsu, Taiwan Semiconductor and other foundry partners. If for any reason one or more of our foundry partners does not provide its facilities and support for our development efforts, we may be unable to effectively develop new products in a timely manner.
Should a change in foundry relationships be required, we may be unsuccessful in establishing new foundry relationships for our current or next generation products, or we may incur substantial cost and or manufacturing delays until we form and ramp relationships and migrate products, each of which could adversely affect our operating results.
The Mobile and Consumer end market is rapidly changing and cyclical, and a downturn in this end market or our failure to accurately predict the frequency, duration, timing, and severity of these cycles could adversely affect our financial condition and results.
With the acquisition of Silicon Image, the Mobile and Consumer end market has increased in importance to us. Revenue from the Mobile and Consumer end market accounted for 30% of our revenue in fiscal 2016. Revenue from the Mobile and Consumer end market consists primarily of revenue from our products designed and used in a broad range of consumer electronics products including smartphones, tablets and e-readers, wearables, accessories such as chargers and docks, Ultra High-Definition (UHD) TVs, Digital SLR cameras, drones, and other connected devices. This market is characterized by rapidly changing requirements and product features and volatility in consumer demand. Our success in this market will depend principally on our ability to:
• | meet the market windows for consumer products; |
• | predict technology and market trends; |
• | develop IP cores to meet emerging market needs; |
• | develop products on a timely basis; |
• | maintain multiple design wins across different markets and customers to dampen the effects of market volatility; |
• | be designed into our customers' products; and |
• | avoid cancellations or delay of products. |
Our inability to accomplish any of the foregoing, or to offset the volatility of this end market through diversification into other markets, could materially and adversely affect our business, financial condition, and results of operations. Cyclicality in the Mobile and Consumer end market could periodically result in higher or lower levels of revenue and revenue concentration with a single or small number of customers. In addition, rapid changes in this market may affect demand for our products, and may cause our revenue derived from sales in this market to vary significantly over time, adversely affecting our financial results.
A downturn in the Communications and Computing end market could cause a meaningful reduction in demand for our products and limit our ability to maintain revenue levels and operating results.
Revenue from the Communications and Computing end market accounted for 29% of our revenue in fiscal 2016. Three of our top five programmable logic customers participate primarily in the Communications and Computing end market. In the past, cyclical weakening in demand for programmable logic products from customers in the Communications and Computing end market has adversely affected our revenue and operating results. In addition, telecommunication equipment providers are building network infrastructure for which we compete for product sales. Any deterioration in the Communications and Computing end market, our end customers' reduction in spending, or a reduction in spending by their customers to support this end market or use of our competitors’ products could lead to a reduction in demand for our products which could adversely affect our revenue and results of operations. This type of decline impacted our results in the past and could do so again in the future.
13
We depend on a concentrated group of customers for a significant portion of our revenues. If any of these customers reduce their use of our products, our revenue could decrease significantly.
A significant portion of our revenue depends on sales to a limited number of customers. In fiscal 2016, our top two end customers accounted for 9.9% and 6.8% of our total revenue. During fiscal 2015, our top two end customers accounted for 9.3% and 7.8% of our total revenue. Additionally, in fiscal 2016, our top five end customers accounted for approximately 27% of our total revenue, which is down from fiscal 2015, during which our top five end customers accounted for approximately 32% of our total revenue. If any of these relationships were to diminish, if these customers were to develop their own solutions or adopt alternative solutions or competitors' solutions, or if our relationship with any future customer which accounts for a significant portion of our revenue were to diminish due to these factors, our results could be adversely affected.
While we strive to maintain strong relationships with our customers, their continued use of our products is frequently reevaluated, as certain of our customers' product life cycles are relatively short and they continually develop new products. The selection process for our products to be included in our customers' new products is highly competitive. There are no guarantees that our products will be included in the next generation of products introduced by these customers. For example, in December 2014, one of its largest customers informed Silicon Image that the customer had decided not to include Silicon Image’s MHL functionality in certain designs in order to reduce costs. Any significant loss of, or a significant reduction in purchases by, one or more of these customers or their failure to meet their commitments to us, could have an adverse effect on our financial condition and results of operations. If any one or more of our concentrated groups of customers were to experience significantly adverse financial conditions, our financial condition and business could be adversely affected as well, as occurred when Silicon Image’s fiscal 2014 mobile product revenue decreased as a result of a significant production slowdown by one of its key customers.
Our outstanding indebtedness could reduce our strategic flexibility and liquidity and may have other adverse effects on our results of operations.
In connection with our acquisition of Silicon Image, we entered into a secured Credit Agreement providing for a $350 million term loan. Our obligations under the Credit Agreement are guaranteed by our U.S. subsidiaries. Our obligations include a requirement to pay up to 75% of our excess cash flow toward repayment of the facility. The Credit Agreement also contains certain restrictive covenants, including limitations on liens, mergers and consolidations, sales of assets, payment of dividends, and additional indebtedness. The amount and terms of our indebtedness, as well as our credit rating, could have important consequences, including the following:
• | we may be more vulnerable to economic downturns, less able to withstand competitive pressures, and less flexible in responding to changing business and economic conditions; |
• | our cash flow from operations may be allocated to the payment of outstanding indebtedness, and not to research and development, operations or business growth; |
• | we might not generate sufficient cash flow from operations or other sources to enable us to meet our payment obligations under the facility and to fund other liquidity needs; |
• | our ability to make distributions to our stockholders in a sale or liquidation may be limited until any balance on the facility is repaid in full; and |
• | our ability to incur additional debt, including for working capital, acquisitions, or other needs, is more limited. |
If we breach a loan covenant, the lenders could accelerate the repayment of the term loan. We might not have sufficient assets to repay such indebtedness upon acceleration. If we are unable to repay the indebtedness, the lenders could initiate a bankruptcy proceeding against us or collection proceedings with respect to our assets and subsidiaries securing the facility, which could materially decrease the value of our common stock.
We depend on distributors to generate a significant portion of our revenue and complete order fulfillment and any adverse change in our relationship or our distributors' financial health, reduction of selling efforts, or inaccuracy in resale reports could harm our sales or result in misreporting our results.
We depend on our distributors to sell our products to end customers, complete order fulfillment, and maintain sufficient inventory of our products. Our distributors also provide technical support and other value-added services to our end customers. Resales of product through sell-through distributors accounted for 61% of our revenue in 2016, with two distributors accounting for 46% of our revenue in 2016.
We expect our distributors to generate a significant portion of our revenue in the future. Any adverse change to our relationships with our distributors or a failure by one or more of our distributors to perform its obligations to us could have a material impact on our business. In addition, a significant reduction of effort by a distributor to sell our products or a material change in our relationship with one or more distributors may reduce our access to certain end customers and adversely affect our ability to sell our products.
14
The financial health of our distributors is important to our success. Economic conditions may adversely impact the financial health of one or more of our distributors. This could result in the inability of distributors to finance the purchase of our products or cause the distributors to delay payment of their obligation to us and increase our credit risk. If the financial health of our distributors impairs their performance and we are unable to secure alternate distributors, our financial condition and results of operations may be negatively impacted.
Since we have limited ability to forecast inventory levels of our end customers, it is possible that there may be significant build-up of inventories in the distributor channel, with the OEM or the OEM’s contract manufacturer. Such a buildup could result in a slowdown in orders, requests for returns from customers, or requests to move out planned shipments. This could adversely affect our revenues and profits. Any failure to manage these challenges could disrupt or reduce sales of our products and unfavorably impact our financial results.
We depend on the timeliness and accuracy of resale reports from our distributors. Late or inaccurate resale reports could have a detrimental effect on our ability to properly recognize revenue and our ability to predict future sales.
Acquisitions, strategic investments and strategic partnerships present risks, and we may not realize the goals that were contemplated at the time of a transaction.
On March 10, 2015, we acquired Silicon Image, and we may make further acquisitions and strategic investments in the future. Acquisitions and strategic investments, including our acquisition of Silicon Image, present risks, including:
• | our ongoing business may be disrupted and our management's attention may be diverted by investment, acquisition, transition, or integration activities; |
• | an acquisition or strategic investment may not perform as well or further our business strategy as we expected, and we may not integrate an acquired company or technology as successfully as we expected; |
• | we may incur unexpected costs, claims, or liabilities that we assume from an acquired company or technology or that are otherwise related to an acquisition; |
• | we may discover adverse conditions post-acquisition that are not covered by representations and warranties; |
• | we may increase some of our risks, such as increasing customer or end product concentration; |
• | we may have difficulty incorporating acquired technologies or products with our existing product lines; |
• | we may have higher than anticipated costs in continuing support and development of acquired products, and in general and administrative functions that support such products; |
• | we may have difficulty integrating and retaining key personnel; |
• | we may have difficulty integrating business systems, processes, and tools, such as accounting software, inventory management systems, or revenue systems which may have an adverse effect on our business; |
• | our liquidity and/or capital structure may be adversely impacted; |
• | our strategic investments may not perform as expected; |
• | we may experience unexpected changes in how we are required to account for our acquisitions and strategic investments pursuant to U.S. GAAP; |
• | we may have difficulty integrating acquired entities into our global tax structure with potentially negative impacts on our effective tax rate; |
• | if the acquisition or strategic investment does not perform as projected, we might take a charge to earnings due to impaired goodwill; |
• | we may divest certain assets of acquired businesses, leading to charges against earnings; |
• | we may experience unexpected negative responses from vendors or customers to the acquisition, which may adversely impact our operations; and |
• | we may have difficulty integrating the processes and control environment from Silicon Image. |
The occurrence of any of these risks could have a material adverse effect on our business, results of operations, financial condition, or cash flows, particularly in the case of a larger acquisition or several concurrent acquisitions or strategic investments. In addition, we may enter into strategic partnerships with third parties with the goal of gaining access to new and innovative products and technologies. Strategic partnerships pose many of the same risks as acquisitions or investments.
We cannot guarantee that we will be able to complete any future acquisitions or that we will realize any anticipated benefits from any of our past or future acquisitions, strategic investments, or strategic partnerships. We may not be able to find suitable acquisition opportunities that are available at attractive valuations, if at all. A sustained decline in the price of our common stock may make it more difficult and expensive to initiate or complete additional acquisitions on commercially acceptable terms.
15
We are required under U.S. GAAP to test goodwill for possible impairment on an annual basis and to test goodwill and long-lived assets, including amortizable intangible assets, for impairment at any other time that circumstances arise indicating the carrying value may not be recoverable. For purposes of testing for impairment, the Company currently operates as one reporting unit: the core Lattice ("Core") business, which includes intellectual property and semiconductor devices. Qterics, a discrete software-as-a-service business unit, was previously an immaterial operating segment in the Lattice legal entity structure until it was sold in April 2016. Following our assessment of goodwill and long-lived asset impairment in the fourth quarter of 2015, we concluded that goodwill and long-lived assets had been impaired in the Qterics segment. As a result, we recorded impairment charges related to goodwill and intangible assets in the Qterics segment amounting to $12.7 million and $9.0 million, respectively, in the Consolidated Statements of Operations for the year ended January 2, 2016. In the third quarter of 2016, we determined that the amendment to the HDMI Founders Agreement constituted an impairment indicator in the Core segment related to the intangible assets associated with future HDMI adopter fees. Our assessment of the new value of these intangible assets concluded that they had been impaired as of October 1, 2016, and we recorded a $7.9 million non-cash impairment charge in the Consolidated Statements of Operations. No impairment charges related to goodwill were recorded in fiscal 2016 and no impairment charges were recorded for the Core segment in fiscal 2015. There is no assurance that future impairment tests will indicate that goodwill will be deemed recoverable.
Our success and future revenue depends on our ability to innovate, develop and introduce new products that achieve customer and market acceptance and to successfully compete in the highly competitive semiconductor industry, and failure to do so could have a material adverse effect on our financial condition and results of operations.
The semiconductor industry is highly competitive and many of our direct and indirect competitors have substantially greater financial, technological, manufacturing, marketing, and sales resources. Consolidation in our industry may increasingly mean that our competitors have greater resources, or other synergies, that could put us at a competitive disadvantage. We currently compete directly with companies that have licensed our technology or have developed similar products, as well as numerous semiconductor companies that offer products based on alternative solutions, such as applications processor, application specific standard product, microcontroller, analog, and digital signal processing technologies. Competition from these semiconductor companies may intensify as we offer more products in any of our end markets. These competitors include established, multinational semiconductor companies, as well as emerging companies.
The markets in which we compete are characterized by rapid technology and product evolution, generally followed by a relatively longer process of ramping up to volume production on advanced technologies. Our markets are also characterized by evolving industry standards, frequent new product introduction, short product life cycles, and increased demand for higher levels of integration and smaller process geometry. Our competitive position and success depends on our ability to innovate, develop, and introduce new products that compete effectively on the basis of price, density, functionality, power consumption, form factor, and performance addressing the evolving needs of the markets we serve. These new products typically are more technologically complex than their predecessors.
Our future growth and the success of new product introductions depend upon numerous factors, including:
• | timely completion and introduction of new product designs; |
• | ability to generate new design opportunities and design wins, including those which result in sales of significant volume; |
• | availability of specialized field application engineering resources supporting demand creation and customer adoption of new products; |
• | ability to utilize advanced manufacturing process technologies; |
• | achieving acceptable yields and obtaining adequate production capacity from our wafer foundries and assembly and test subcontractors; |
• | ability to obtain advanced packaging; |
• | availability of supporting software design tools; |
• | utilization of predefined IP logic; |
• | market acceptance of our MHL-enabled and wireless mobile products, and our 60 GHz wireless products; |
• | customer acceptance of advanced features in our new products; |
• | availability of competing alternative technologies; and |
• | market acceptance of our customers' products. |
Our product innovation and development efforts may not be successful; our new products, MHL-enabled products, and 60GHz wireless products may not achieve market or customer acceptance; and we may not achieve the necessary volume of production to achieve acceptable cost. Revenue relating to our mature products is expected to decline in the future, which is normal for our product life cycles. As a result, we may be increasingly dependent on revenue derived from our newer products as well as anticipated cost reductions in the manufacture of our current products. We rely on obtaining yield improvements and corresponding cost reductions in the manufacture of existing products and on introducing new products that incorporate advanced features and other price/performance factors that enable us to increase revenues while maintaining acceptable margins. To the extent such cost reductions and new product introductions do not occur in a timely manner, or that our products do not achieve market acceptance or market acceptance at acceptable pricing, our forecasts of future revenue, financial condition, and operating results could be materially adversely affected.
16
General economic conditions and deterioration in the global business environment could have a material adverse effect on our business, operating results, and financial condition.
Adverse economic conditions or our customers’ perceptions of the economic environment may negatively affect customer demand for our products and services and result in delayed or decreased spending. Weak global economic conditions in the past have resulted in weak demand for our products in certain geographies and had an adverse impact on our results of operations. If weak economic conditions persist or worsen, our business could be harmed due to customers or potential customers reducing or delaying orders. In addition, the inability of customers to obtain credit, the insolvency of one or more customers, or the insolvency of key suppliers could result in sales or production delays. Any of these effects could impact our ability to effectively manage inventory levels and collect receivables, require additional restructuring actions, and decrease our revenue and profitability. Uncertainty about future economic conditions makes it difficult for us to forecast operating results and to make decisions about future investments. Any or all of these factors could adversely affect our financial condition and results of operations in the future.
The intellectual property licensing component of our business strategy increases our business risk and fluctuation of our revenue.
Our business strategy includes licensing our intellectual property to companies that incorporate it into their respective technologies that address markets in which we do not directly participate or compete. We also license our intellectual property into markets where we do participate and compete. Our licensing and services revenue may be impacted by the introduction of new technologies by customers in place of the technologies based on our intellectual property, changes in the law that may weaken our ability to prevent the use of our patented technology by others, and changes of selling prices for products using licensed patents. We cannot assure that our licensing customers will continue to license our technology on commercially favorable terms or at all, or that these customers will introduce and sell products incorporating our technology, accurately report royalties owed to us, pay agreed upon royalties, honor agreed upon market restrictions, maintain the confidentiality of our proprietary information, or will not infringe upon or misappropriate our intellectual property. Our intellectual property licensing agreements are complex and depend upon many factors, including completion of milestones, allocation of values to delivered items and customer acceptances. Many of these require significant judgments. Additionally, this is a new end market for us, with which we do not yet have extensive experience.
We have also generated revenue from the sale of certain patents from our portfolio, generally for technology that we are no longer actively developing. While we plan to continue to monetize our patent portfolio through sales of non-core patents, we may not be able to realize adequate interest or prices for those patents. Accordingly, we cannot provide assurance that we will continue to generate revenue from these sales. In addition, although we seek to be strategic in our decisions to sell patents, we might incur reputational harm if a purchaser of our patents sues one of our customers for infringement of the purchased patent, and we might later decide to enter a space that requires the use of one or more of the patents we sold.
Our licensing and services revenue fluctuates, sometimes significantly, from period to period because it is heavily dependent on a few key transactions being completed in a given period, the timing of which is difficult to predict and may not match our expectations. Because of its high margin, the licensing and services revenue portion of our overall revenue can have a disproportionate impact on gross profit and profitability. Generating revenue from intellectual property licenses is a lengthy and complex process that may last beyond the period in which our efforts begin, and the accounting rules governing the recognition of revenue from intellectual property licensing transactions are increasingly complex and subject to interpretation. As a result, the amount of license revenue recognized in any period may differ significantly from our expectations.
A single large customer may be in a position to demand certain functionality, pricing or timing requirements that may detract from or interfere with our normal business activities. If this happens, delays in our normal development schedules could occur, causing our products to miss market windows, thereby reducing the total number of units sold of a particular product.
The products we develop are complex and require significant planning and resources. In the Mobile and Consumer end market, new products are typically introduced early in the year, often in association with key trade shows. In order to meet these deadlines, our customers must complete their product development by year-end, which usually means we must ship sample parts in early spring. If we cannot ship sample parts in early spring, customers may be forced to remove the feature provided by our product, use a competitor’s product, or use an alternate technology in order to meet their timelines. We plan our product development with these market windows in mind, but if we receive requests from a large customer to deploy resources to meet their requirements or work on a specific solution, our normal development path could be delayed, causing us to miss sample deadlines and therefore future revenues.
17
A number of factors, including our inventory strategy, can impact our gross margins.
A number of factors, including how products are manufactured to support the consumer market segment, yield, wafer pricing, cost of packaging raw materials, product mix, market acceptance of our new products, competitive pricing dynamics, geographic and/or end market mix, and pricing strategies, can cause our gross margins to fluctuate significantly either positively or negatively from period to period. In addition, forecasting our gross margins is difficult because a significant portion of our business is based on turns within the same quarter.
Our customers typically test and evaluate our products prior to deciding to design our product into their own products, and then require additional time to begin volume production of those products. This lengthy sales cycle may cause us to experience significant delays and to incur additional inventory costs until we generate revenue from our products. It is possible that we may never generate any revenue from products after incurring significant expenditures.
While our sales cycles are typically long, our average product life cycles tend to be short as a result of the rapidly changing technology environment in which we operate. In addition, our inventory levels may be higher than historical norms, from time to time, due to inventory build decisions aimed at meeting expected demand from a single large customer, reducing direct material cost or enabling responsiveness to expected demand. In the event the expected demand does not materialize, or if our short sales cycle does not generate sufficient revenue, we may be subject to incremental excess and obsolescence costs. In addition, future product cost reductions could impact our inventory valuation, which could adversely affect our operating results.
We and our connectivity customers depend on the availability of certain functions and capabilities within mobile and personal computing operating systems over which we may have no control. New releases of these operating systems may render certain of our products inoperable or may require significant engineering effort to create new device driver software.
Certain portions of our business operate within a market that is dominated by a few key OEMs. These OEMs could play a role in driving the growth of our business or could prevent our growth through deliberate or non-deliberate action. We do not have a presence in the Windows eco-system or in all iOS or Android devices. Our success and ability to grow depend upon our ability to continue to be successful within the iOS and Android eco-systems or gain significant traction within the Windows eco-system. Failure to maintain and grow our presence in these key eco-systems could adversely affect unit volumes.
Further, many of our products depend on the availability of certain functionality in the device operating system, typically Android, Linux, Windows, or iOS. Certain operating system primitives are needed to support video output. We have no control over these operating systems or the companies that produce them, and it is unlikely that we could influence any internal decision these companies make that may have a negative impact on our integrated circuits and their function. Updates to these operating systems that, for example, change the way video is output or remove the ability to output video could materially affect sales of MHL and HDMI integrated circuits.
Products targeted to personal computing or mobile, laptop, or notebook designs often require device driver software to operate. This software is difficult to produce and may require certifications before being released. Failure to produce this software could have a negative impact on our relation with operating system providers and may damage our reputation with end consumers as a quality supplier of products.
We may experience difficulties in transitioning to smaller geometry process technologies or in achieving higher levels of design integration, which may result in reduced manufacturing yields, delays in product deliveries, and increased expenses.
To remain competitive, we expect to continue to transition our semiconductor products to increasingly smaller geometries. This requires us to change the manufacturing processes for our products and to redesign some products as well as standard cells and other integrated circuit designs we may use in multiple products. We periodically evaluate the benefits, on a product-by-product basis, of migrating to smaller geometry process technologies to reduce our costs. The transition to lower nanometer geometry process technologies will result in significantly higher mask and prototyping costs, as well as additional expenditures for engineering design tools.
We depend on our relationships with our foundry partners to transition to smaller geometry processes successfully. We make no assurance that our foundry partners will be able to effectively manage the transition in a timely manner, or at all. If we or any of our foundry partners experience significant delays in this transition or fail to efficiently implement this transition, we could experience reduced manufacturing yields, delays in product deliveries, and increased expenses, all of which could adversely affect our relationships with our customers and our financial condition and operating results.
18
Shortages in, or increased costs of, wafers and materials could adversely impact our gross margins and lead to reduced revenues.
Worldwide manufacturing capacity for silicon wafers is relatively inelastic. If the demand for silicon wafers or assembly material materially exceeds market supply, our supply of silicon wafers or assembly material could quickly become limited. A shortage in manufacturing capacity could hinder our ability to meet product demand and therefore reduce our revenue. In addition, silicon wafers constitute a material portion of our product cost. If we are unable to purchase wafers at favorable prices, our gross margins will be adversely affected.
We depend on independent contractors for most of our assembly and test services, and disruption of their services, or an increased in cost of these services, could negatively impact our financial condition and results of operations.
We depend on subcontractors to assemble, test, and ship our products with acceptable quality and yield levels. Our operations and operating results may be adversely affected if we experience problems with our subcontractors that impact the delivery of product to our customers. Those problems may include: prolonged inability to obtain wafers or packaging materials with competitive performance and cost attributes; inability to achieve adequate yields or timely delivery; disruption or defects in assembly, test, or shipping services; or delays in stabilizing manufacturing processes or ramping up volume for new products. Economic conditions may adversely impact the financial health and viability of our subcontractors and result in their inability to meet their commitments to us resulting in product shortages, quality assurance problems, reduced revenue, and/or increased costs which could negatively impact our financial condition and results of operations.
In the past, we have experienced delays in obtaining assembled and tested products and in securing assembly and test capacity commitments from our suppliers. We currently anticipate that our assembly and test capacity commitments are adequate; however, these existing commitments may not be sufficient for us to satisfy customer demand in future periods. We negotiate assembly and test prices and capacity commitments from our contractors on a periodic basis. If any of our assembly or test contractors reduce their capacity commitment or increase their prices, and we cannot find alternative sources, our operating results could be adversely affected.
The semiconductor industry routinely experiences cyclical market patterns and a significant industry downturn could adversely affect our operating results.
Our revenue and gross margin can fluctuate significantly due to downturns in the semiconductor industry. These downturns can be severe and prolonged and can result in price erosion and weak demand for our products. Weak demand for our products resulting from general economic conditions affecting the end markets we serve or the semiconductor industry specifically and reduced spending by our customers can result, and in the past has resulted, in excess and obsolete inventories and corresponding inventory write-downs. The dynamics of the markets in which we operate make prediction of and timely reaction to such events difficult. Due to these and other factors, our past results are not reliable predictors of our future results.
Our expense levels are based, in part, on our expectations of future sales. Many of our expenses, particularly those relating to facilities, capital equipment, and other overhead, are relatively fixed. We might be unable to reduce spending quickly enough to compensate for reductions in sales. Accordingly, shortfalls in sales could adversely affect our operating results.
Our participation in HDMI and MHL has included our acting as agent for these consortia for which we have been receiving adopter fees. We will no longer be acting as agent for the HDMI standard and there is no guarantee that we will continue to act as agent for the MHL standard. Starting in 2017, we will lose HDMI adopter fees and we could in the future lose MHL adopter fees.
Through our wholly owned subsidiary, HDMI Licensing, LLC, we acted as agent of the HDMI consortium until December 31, 2016 and were responsible for promoting and administering the specification. We received all of the adopter fees paid by adopters of the HDMI specification in connection with our role as agent. In September 2016, the founders of the HDMI consortium ("Founders"), of which we are a member, amended the Founders Agreement resulting in changes to our role as agent for the HDMI consortium and to the model for sharing adopter fee revenues. Under the terms of the agreement, our role as the agent was terminated effective January 1, 2017 and a new independent entity was appointed to act as the new HDMI licensing agent with responsibility for licensing and the distribution of royalties among Founders. As a result of the amended model for sharing revenue, we will be entitled to a reduced share of adopter fees paid by parties adopting the HDMI standard.
In addition, another member of the HDMI consortium asserts that we owe the other HDMI consortium founders their respective shares of any HDMI adopter fees not used by us in the marketing and other activities in furtherance of the HDMI standard from our time as agent. The consortium member has previously indicated its belief that the HDMI founders enjoy a right to these funds but has never pursued such claim. If a determination is made that there were excess adopter fees or if it is determined that we were obligated to share such fees with other consortium members, it could negatively impact our financial position. At this stage of the proceedings, we do not have an estimate of the likelihood or the amount of any financial consequences to us.
19
We share HDMI royalties with the other HDMI founders based on an allocation formula, which is reviewed every three years. The most recent royalty sharing formula covered the period from January 1, 2014 through December 31, 2016, and a new agreement is yet to be signed. Our portion of the royalty allocation has declined for the last several years. In 2015, we received between 24% and 25% of the royalty allocation, while for 2016, we received 20% of the royalty allocation. The royalty allocation for 2017 and future years is not yet known, but if the level continues to decline, our financial performance could be adversely affected. In addition, if there is a delay in the signing of a new sharing agreement, this may impact our timing of revenue recognition of the related royalties.
Through our wholly owned subsidiary, MHL, LLC, we act as agent of the MHL specification and are responsible for promoting and administering the specification. As agent, we are entitled to receive license fees paid by adopters of the MHL specification sufficient to reimburse us for the costs we incur to promote and administer the specification. Given the limited number of MHL adopters to date, we do not believe the license fees paid by such adopters will be sufficient to reimburse us for these costs and we make no assurance that the license fees paid by MHL adopters will ever be sufficient to reimburse us the costs we incur as agent of the specification.
We currently intend to promote and continue to be involved and actively participate in other standard setting initiatives. For example, through Silicon Image’s acquisition of SiBEAM, Inc. in May 2011, it achieved SiBEAM’s prior position as founder and chair of the WirelessHD Consortium. We may decide to license additional elements of our intellectual property to others for use in implementing, developing, promoting, or adopting standards in our target markets, in certain circumstances at little or no cost. This may make it easier for others to compete with us in such markets. In addition, even if we receive license fees or royalties in connection with the licensing of our intellectual property, we make no assurance that such license fees or royalties will compensate us adequately.
We rely on independent software and hardware developers and disruption of their services could negatively affect our operations and financial results.
We rely on independent software and hardware developers for the design, development, supply, and support of intellectual property cores; design and development software; and certain elements of evaluation boards. As a result, failure or significant delay to complete software or deliver hardware in accordance with our plans, specifications, and agreements could disrupt the release of or introduction of new or existing products, which could be detrimental to the capability of our new or existing products to win designs. Any of these delays or inability to complete the design or development could have an adverse effect on our business, financial condition, or operating results.
Our failure to control unauthorized access to our IT systems may cause problems with key business partners or liability.
We may be subject to unauthorized access to our IT systems through a security breach or cyber-attack. In the ordinary course of our business, we maintain sensitive data on our networks, including our intellectual property and proprietary or confidential business information relating to our business and that of our customers and business partners. The secure maintenance of this information is critical to our business and reputation. We believe that companies have been increasingly subject to a wide variety of security incidents, cyber-attacks, and other attempts to gain unauthorized access. Cyber-attacks have become more prevalent and much harder to detect and defend against. Our network and storage applications may be subject to unauthorized access by hackers or breached due to operator error, malfeasance, or other system disruptions. It is often difficult to anticipate or immediately detect such incidents and to assess the damage caused by them. In the past, third parties have attempted to penetrate and/or infect our network and systems with malicious software in an effort to gain access to our network and systems.
These data breaches and any unauthorized access or disclosure of our information or intellectual property could compromise our intellectual property and expose sensitive business information. Cyber-attacks could also cause us to incur significant remediation costs, result in product development delays, disrupt key business operations, and divert attention of management and key information technology resources. Our reputation, brand, and business could be significantly harmed, and we could be subject to third party claims in the event of such a security breach.
20
Foreign sales, accounting for the majority of our revenue, are subject to various risks associated with selling in international markets, which could have a material adverse effect on our operations, financial condition, and results of operations.
We derive the majority of our revenue from sales outside of the United States. Accordingly, if we experience a decline in foreign sales, our operating results could be adversely affected. Our foreign sales are subject to numerous risks, including:
• | changes in local economic conditions; |
• | currency exchange rate volatility; |
• | governmental stimulus packages, controls, and trade restrictions; |
• | governmental policies that promote development and consumption of domestic products; |
• | export license requirements, foreign trade compliance matters, and restrictions on the use of technology; |
• | political instability, war, terrorism, or pandemic disease; |
• | changes in tax rates, tariffs, or freight rates; |
• | reduced protection for intellectual property rights; |
• | longer receivable collection periods; |
• | natural or man-made disasters in the countries where we sell our products; |
• | interruptions in transportation; |
• | interruptions in the global communication infrastructure; and |
• | labor regulations. |
Any of these factors could adversely affect our financial condition and results of operations in the future.
We have significant international operations exposing us to various economic, regulatory, political, and business risks, which could have a material adverse effect on our operations, financial condition, and results of operations.
We have significant international operations, including foreign sales offices to support our international customers and distributors, and operational and research and development sites in China, India, the Philippines, and other Asian locations. In addition, we purchase our wafers from foreign foundries; have our commercial products assembled, packaged, and tested by subcontractors located outside of the United States; and rely on an international service provider for inventory management, order fulfillment, and direct sales logistics.
These and other integral business activities outside of the United States are subject to the risks and uncertainties associated with conducting business in foreign economic and regulatory environments including trade barriers; economic sanctions; environmental regulations; import and export regulations; duties and tariffs and other trade restrictions; changes in trade policies; anti-corruption laws; domestic and foreign governmental regulations; potential vulnerability of and reduced protection for intellectual property; disruptions or delays in production or shipments; and instability or fluctuations in currency exchange rates, any of which could have a material adverse effect on our business, financial condition, and operating results. In addition, with the acquisition of Silicon Image, we have increased the operational challenges of conducting our business in and across multiple geographic regions around the world, especially in the face of different business practices, social norms, and legal standards.
Moreover, our financial condition and results of operations could be affected in the event of political instability, including as a result of the United Kingdom referendum on June 23, 2016, in which voters approved an exit from the European Union (commonly referred to as "Brexit"), terrorist activity, U.S. or other military actions, or economic crises in countries where our main wafer suppliers, end customers, contract manufacturers, and logistics providers are located.
Our global organizational structure and operations expose us to unanticipated tax consequences.
Our legal organizational structure could result in unanticipated unfavorable tax or other consequences which could have an adverse effect on our financial condition and results of operations. We have a global tax structure to more effectively align our corporate structure with our business operations including responsibility for sales and purchasing activities. We created new and realigned existing legal entities; completed intercompany sales of rights to intellectual property, inventory, and fixed assets across different tax jurisdictions; and implemented cost-sharing and intellectual property licensing and royalty agreements between our legal entities. We currently operate legal entities in countries where we conduct supply-chain management, design, and sales operations around the world. In some countries, we maintain multiple entities for tax or other purposes. In addition, we are currently conducting further restructuring activities following our acquisition of Silicon Image as we integrate Silicon Image and its subsidiaries, which include numerous foreign entities, into our existing global tax and corporate structures. These integration activities, changes in tax laws, regulations, future jurisdictional profitability of the Company and its subsidiaries, and related regulatory interpretations in the countries in which we operate may impact the taxes we pay or tax provision we record, which could adversely affect our results of operations.
21
We are subject to taxation in the United States, Singapore, and other countries. Future effective tax rates could be affected by changes in the composition of earnings in countries with differing tax rates, changes in the valuation of deferred tax assets and liabilities, or changes in tax laws. We compute our effective tax rate using actual jurisdictional profits and losses. Changes in the jurisdictional mix of profits and losses may cause fluctuations in the effective tax rate. Adverse changes in tax rates, our tax assets, and tax liabilities could negatively affect our results in the future.
We make no assurance as to what taxes we pay or the ability to estimate our future effective tax rate because of, among other things, uncertainty regarding the tax policies of the jurisdictions where we operate. The U.S. government and the Organization for Economic Cooperation and Development have proposed tax policy changes with respect to the taxation of global operations of multinational companies. As a result, our actual effective tax rate or taxes paid may vary materially from our expectations. Changes in tax laws, regulations, and related interpretations in the countries in which we operate may have an adverse effect on our business, financial condition, or operating results.
Product quality problems could lead to reduced revenue, gross margins, and net income.
In general, we warrant our products for varying lengths of time against non-conformance to our specifications and certain other defects. Because our products, including hardware, software, and intellectual property cores, are highly complex and increasingly incorporate advanced technology, our quality assurance programs may not detect all defects, whether manufacturing defects in individual products or systematic defects that could affect numerous shipments. Inability to detect a defect could result in a diversion of our engineering resources from product development efforts, increased engineering expenses to remediate the defect, and increased costs due to customer accommodation or inventory impairment charges. On occasion we have also repaired or replaced certain components, made software fixes, or refunded the purchase price or license fee paid by our customers due to product or software defects. If there are significant product defects, the costs to remediate such defects, net of reimbursed amounts from our vendors, if any, or to resolve warranty claims may adversely affect our revenue, gross margins, and net income.
The nature of our business makes our revenue and gross margin subject to fluctuation and difficult to predict with accuracy, which could have an adverse impact on our business and our ability to provide forward-looking revenue and gross margin guidance.
In addition to the challenging market conditions we may face, we have limited visibility into the demand for our products, particularly new products, because demand for our products depends upon our products being designed into our end customers' products and those products achieving market acceptance. Due to the complexity of our customers' designs, the design to volume production process for many of our customers requires a substantial amount of time, frequently longer than a year. In addition, we are dependent upon "turns," orders received and turned for shipment in the same quarter. These factors make it difficult for us to accurately forecast future sales and project quarterly revenues. The difficulty in forecasting future sales weakens our ability to project our inventory requirements, which could result, and in the past has resulted, in inventory write-downs or failure to meet customer product demands in a timely manner. While we may give guidance, the difficulty in forecasting revenues as well as the relative customer and product mix of those revenues limits our ability to provide accurate forward-looking revenue and gross margin guidance.
In addition, effective with the announcement of the proposed acquisition by Parent, the Company has discontinued the provision of forward-looking revenue and gross margin guidance.
Reductions in the average selling prices of our products could have a negative impact on our gross margins.
The average selling prices of our products generally decline as the products mature or may decline as we compete for market share or customer acceptance in competitive markets. We seek to offset the decrease in selling prices through yield improvement, manufacturing cost reductions, and increased unit sales. We also seek to continue to develop higher value products or product features that increase, or slow the decline of, the average selling price of our products. However, we cannot guarantee that our ongoing efforts will be successful or that they will keep pace with the decline in selling prices of our products, which could ultimately lead to a decline in revenues and have a negative effect on our gross margins.
22
If we are unable to adequately protect our intellectual property rights, our financial results and our ability to compete effectively may suffer.
Our success depends in part on our proprietary technology and we rely upon patent, copyright, trade secret, mask work, and trademark laws to protect our intellectual property. We intend to continue to protect our proprietary technology, however, we may be unsuccessful in asserting our intellectual property rights or such rights may be invalidated, violated, circumvented, or challenged. From time to time, third parties, including our competitors, have asserted against us patent, copyright, and other intellectual property rights to technologies that are important to us. Third parties may attempt to misappropriate our intellectual property through electronic or other means or assert infringement claims against us in the future. Such assertions by third parties may result in costly litigation, indemnity claims, or other legal actions, and we may not prevail in such matters or be able to license any valid and infringed patents from third parties on commercially reasonable terms. This could result in the loss of our ability to import and sell our products or require us to pay costly royalties to third parties in connection with sales of our products. Any infringement claim, indemnification claim, or impairment or loss of use of our intellectual property could materially adversely affect our financial condition and results of operations.
A material change in the agreements governing encryption keys we use could place additional restrictions on us, or our distributors or contract manufacturers, which could restrict product shipment or significantly increase the cost to track products throughout the distribution chain.
Many of the components in our products contain encryption keys used in connection with High Definition Content Protection (HDCP). The regulation and distribution of these encryption keys are controlled through license agreements with Digital Content Protection (DCP), a wholly owned subsidiary of Intel Corporation. These license agreements have been modified by DCP from time to time, and such changes could impact us, our distributors, and our customers. An important element of both HDMI and MHL is the ability to implement link protection for high definition (HD), and more recently, 4K UltraHD, content. We implement various aspects of the HDCP link protection within certain parts we sell. We also, for the benefit of our customers, include the necessary HDCP encryption keys in parts we ship to customers. These encryption keys are provided to us from DCP. We have a specific process for tracking and handling these encryption keys. If DCP changes any of the tracking or handling requirements associated with HDCP encryption keys, we may be required to change our manufacturing and distribution processes, which could adversely affect our manufacturing and distribution costs associated with these products. If we cannot satisfy new requirements for the handling and tracking of encryption keys, we may have to cease shipping or manufacturing certain products.
Our participation in consortia for the development and promotion of industry standards in certain of our target markets, including the HDMI, MHL, and WirelessHD standards, requires us to license some of our intellectual property for free or under specified terms and conditions, which makes it easier for others to compete with us in such markets.
An element of our business strategy includes participating in consortia to establish industry standards in certain of our target markets; promoting and enhancing specifications; and developing and marketing products based on those specifications and future enhancements. We intend to continue participating in consortia that develop and promote the HDMI, MHL, and WirelessHD specifications. In connection with our participation in these consortia, we make certain commitments regarding our intellectual property, in each case with the effect of making certain of our intellectual property available to others, including our competitors, desiring to implement the specification in question. For example, we must license specific elements of our intellectual property to others for use in implementing the HDMI specification, including enhancements, as long as we remain part of the consortium. Also, we must agree not to assert certain necessary patent claims against other members of the MHL consortium, even if those members may have infringed upon those patents in implementing the MHL specification.
Accordingly, certain companies that implement these specifications in their products may use specific elements of our intellectual property to compete with us. Although in the case of the HDMI and MHL consortia, there are annual fees and royalties associated with the adopters’ use of the technology, we make no assurance that our shares of such annual fees and royalties will adequately compensate us for having to license or refrain from asserting our intellectual property. In September 2016, the Founders of the HDMI consortium, of which we are a member, amended the Founders Agreement resulting in changes to our role as agent for the HDMI consortium and to the model for sharing adopter fee revenues. Under the terms of the agreement, our role as the agent was terminated effective January 1, 2017 and a new independent entity was appointed to act as the new HDMI licensing agent with responsibility for licensing and the distribution of royalties among Founders. As a result of the amended model for sharing revenue, we will be entitled to a reduced share of adopter fees paid by parties adopting the HDMI standard.
23
Our business depends, in part, on the continued adoption and widespread implementation of the HDMI and MHL specifications and the new implementation and adoption of the WirelessHD specifications.
Silicon Image has depended on its participation in standard setting organizations, such as the HDMI and MHL consortiums, and the widespread adoption and success of those standards. From time to time, competing standards have been established which negatively affect the success of existing standards or jeopardize the creation of new standards.
Our future success depends, in part, upon the continued adoption and widespread implementation of the HDMI, MHL, and WirelessHD specifications. A significant portion of Silicon Image’s total revenue was derived from the sale of HDMI and MHL-enabled products and the licensing of our HDMI and MHL technology. Silicon Image’s leadership in the market for HDMI and MHL-enabled products and intellectual property has been based on the ability to introduce first-to-market semiconductor and intellectual property solutions to customers and to continue to innovate within the standard. Our inability to continue to drive innovation in the HDMI and MHL specifications could have an adverse effect on our business going forward.
MHL has not been widely adopted and Silicon Image had a reduction in mobile design wins at one of our largest customers as a result of not including MHL. If other manufacturers who have included MHL in their designs decide that MHL is no longer necessary or cost-effective as a product feature, they too could choose to omit the MHL functionality (and our product) from their designs. Such decisions would adversely affect our revenues. Similarly, if our largest customer decides to remove MHL from other products, our revenue would be adversely affected.
We now have 60GHz wireless technology that we hope will be made widely available and adopted by the marketplace through the efforts of the WirelessHD consortium and incorporated into certain of our future products. As with our HDMI and MHL products and intellectual property, our success with this technology will depend on our ability to introduce first-to-market WirelessHD-enabled semiconductor and intellectual property solutions to our customers and to continue to innovate within the WirelessHD standard. WiGig is an example of a competing 60GHz standard that has been created as an alternative high-bandwidth wireless connectivity solution for the personal computing industry. While the WiGig standard has not been in the market as long as the WirelessHD standard, it does represent a viable alternative to WirelessHD for 60GHz connectivity. If WiGig should gain broader adoption before WirelessHD is adopted, it could negatively impact the adoption of WirelessHD.
As successor-in-interest to Silicon Image, we have granted Intel Corporation certain rights with respect to our intellectual property, which could allow Intel to develop products that compete with ours or otherwise reduce the value of our intellectual property.
Silicon Image entered into a patent cross-license agreement with Intel in which each of them granted the other a license to use the patents filed by the grantor prior to a specified date, except for use related to identified types of products. We believe that the scope of this license to Intel excludes our current products and anticipated future products. Intel could, however, exercise its rights under this agreement to use certain of our patents received in the acquisition of Silicon Image to develop and market other products that compete with ours, without payment to us. Additionally, Intel’s rights to these patents could reduce the value of the patents to any third-party who otherwise might be interested in acquiring rights to use these patents in such products. Finally, Intel could endorse competing products, including a competing digital interface, or develop its own proprietary digital interface. Any of these actions could substantially harm our business and results of operations.
Litigation and unfavorable results of legal proceedings could adversely affect our financial condition and operating results.
From time to time we are subject to various legal proceedings and claims that arise out of the ordinary conduct of our business. Certain claims are not yet resolved, including those that are discussed under Note 20 contained in the Notes to Consolidated Financial Statements, and additional claims may arise in the future. Results of legal proceedings cannot be predicted with certainty. Regardless of merit, litigation may be both time-consuming and disruptive to our operations and cause significant expense and diversion of management attention and we may enter into material settlements to avoid these risks. Should we fail to prevail in certain matters, we may be faced with significant monetary damages or injunctive relief against us that could materially and adversely affect our financial condition and operating results and certain portions of our business.
We depend upon a third party to provide inventory management, order fulfillment, and direct sales logistics and disruption of these services could adversely impact our business and results of operations.
We rely on a third party vendor to provide cost-effective and efficient supply chain services. Among other activities, these outsourced services relate to direct sales logistics, including order fulfillment, inventory management and warehousing, and distribution of inventory to third party distributors. If our third party supply chain provider were to discontinue services for us or its operations are disrupted as a result of a fire, earthquake, act of terrorism, political unrest, governmental uncertainty, war, disease, or other natural disaster or catastrophic event, or any other reason, our ability to fulfill direct sales orders and distribute inventory timely, cost effectively, or at all, would be hindered, which could adversely affect our business.
24
We rely on information technology systems, and failure of these systems to function properly may cause business disruptions.
We rely in part on various information technology ("IT") systems to manage our operations, including financial reporting, and we regularly make changes to improve them as necessary by periodically implementing new, or upgrading or enhancing existing, operational and IT systems, procedures, and controls. We are undergoing a significant integration and systems implementation as we integrate the operations and systems of Silicon Image into our operations and systems following the acquisition. Our current implementation has been delayed to 2017. Such a delay in the implementation of, or disruption in the transition to or integration of, new or enhanced systems, procedures, or controls, could harm our ability to record and report financial and management information on a timely and accurate basis, and could impact our internal control compliance efforts especially because Silicon Image is now in scope for SOX testing in 2016. In addition, we are presently upgrading our main enterprise resource planning system, which if not completed on time and as planned, could result in cost overruns or limit our ability to manufacture and ship products as planned. These systems are also subject to power and telecommunication outages or other general system failures. Failure of our IT systems or difficulties or delays in managing and integrating them could result in excessive cost or business disruption.
We may have failed to adequately insure against certain risks, and, as a result, our financial condition and results may be adversely affected.
We carry insurance customary for companies in our industry, including, but not limited to, liability, property, and casualty; workers' compensation; and business interruption insurance. We also insure our employees for basic medical expenses. In addition, we have insurance contracts that provide director and officer liability coverage for our directors and officers. Other than the specific areas mentioned above, we are self-insured with respect to most other risks and exposures, and the insurance we carry in many cases is subject to a significant policy deductible or other limitation before coverage applies. Based on management's assessment and judgment, we have determined that it is more cost effective to self-insure against certain risks than to incur the insurance premium costs. The risks and exposures for which we self-insure include, but are not limited to, certain natural disasters, certain product defects, political risk, certain theft, patent infringement, and employment practice matters. Should there be a catastrophic loss due to an uninsured event (such as an earthquake) or a loss due to adverse occurrences in any area in which we are self-insured, our financial condition or operating results could be adversely affected.
We compete with others to attract and retain key personnel, and any loss of, or inability to attract, such personnel could adversely affect our ability to compete effectively.
We depend on the efforts and abilities of certain key members of management and other technical personnel. Our future success depends, in part, upon our ability to retain such personnel and attract and retain other highly qualified personnel, particularly product engineers who can respond to market demands and required product innovation. Competition for such personnel is intense and we may not be successful in hiring or retaining new or existing qualified personnel. From time to time we have effected restructurings which have eliminated a number of positions. Even if such personnel are not directly affected by the restructuring effort, such terminations can have a negative impact on morale and our ability to attract and hire new qualified personnel in the future. If we lose existing qualified personnel or are unable to hire new qualified personnel, as needed, we could have difficulty competing in our highly-competitive and innovative environment.
The conflict minerals provisions of the Dodd-Frank Wall Street Reform and Consumer Protection Act could result in additional costs and liabilities.
As part of the Dodd-Frank Wall Street Reform and Consumer Protection Act, the Securities and Exchange Commission established new disclosure and reporting requirements for those companies who use "conflict" minerals mined from the Democratic Republic of Congo and adjoining countries in their products, whether or not these products are manufactured by third parties. As these new requirements are fully implemented, they could affect the sourcing and availability of minerals used in the manufacture of our semiconductor products. Although enforcement of the disclosure requirements by the Securities and Exchange Commission remain uncertain, certain customers may still require disclosure related to the sources of certain minerals used in our products. There are costs associated with complying with the disclosure requirements, including for due diligence in regard to the sources of any conflict minerals used in our products, in addition to the cost of any required remediation and other changes to products, processes, or sources of supply as a consequence of such verification activities. Although we filed the required conflict minerals reports in 2014, 2015, and 2016 it may be several years before we can fully assess the internal and external cost of compliance of the effect the rules will have on our business.
25
Item 1B. Unresolved Staff Comments
None.
Item 2. Properties
In March 2015, our corporate headquarters and executive office moved to a 23,680 square foot leased space in Portland, Oregon through March 2025. In November 2014, we sold the property where our headquarters was formerly located in Hillsboro, Oregon and leased back a 47,800 square foot portion of this property as a research and development facility through November 2022. We currently lease a 98,874 square foot research and development facility in San Jose, California through September 2026.
In Muntinlupa City, Philippines, we lease a total of 48,565 square feet through May 2025 and 1,938 square feet through June 2025 for research and development and operations facilities. In this location, we also lease another 9,734 square feet through July 2017 and 2,856 square feet through April 2018. The latter two leases were restructured in 2015.
The March 2015 acquisition of Silicon Image added 128,154, 66,385 and 22,507 square feet of leased spaces in Sunnyvale, California, Shanghai, China and Hyderabad, India through June 2018, May 2018 and December 2017, respectively. We terminated the Sunnyvale lease in February 2017. In Shanghai, China, we also had another lease for 3,212 square feet, prior to the acquisition of Silicon Image, which we terminated in November 2015.
In Shanghai, China, we also own an 18,869 square foot research and development facility for which we have entered into a contract to sell in January 2017. We expect the sale to be complete in the first quarter of fiscal 2017.
We also lease office facilities in multiple other metropolitan locations for our domestic and international sales staff. We believe that our existing facilities are suitable and adequate for our current and foreseeable future needs.
Item 3. Legal Proceedings
In February 2016, we filed a complaint against Technicolor SA and its affiliates in the United States District Court for the Northern District of California alleging that Technicolor had infringed on certain patents relating to the HDMI specification. Technicolor filed an answer to our complaint on April 11, 2016, which included various defenses to the alleged patent infringement. In November 2016, Technicolor amended its answer and asserted a counterclaim, alleging that the Company’s action constituted a breach of the HDMI Founders Agreement to provide licenses on fair, reasonable and non-discriminatory terms. Technicolor seeks declaratory relief and compensation for the alleged breach. At this stage of the proceedings, we do not have an estimate of the likelihood or the amount of any financial consequences to us.
On or about January 9, 2017, Lattice, members of our Board, Canyon Bridge Capital Partners, Inc., Canyon Bridge Acquisition Company, Inc. and Canyon Bridge Merger Sub Inc. were named as defendants in a complaint filed in the United States District Court for the District of Oregon by an alleged stockholder of the Company in connection with the proposed acquisition of the Company by Canyon Bridge. The complaint was captioned Paul Parshall, et al. v. Lattice, et al. and alleges violations of federal securities laws based on alleged deficiencies in the disclosure provided to shareholders regarding the transaction. An additional complaint was subsequently filed on or about January 27, 2017, naming Lattice and members of our Board, in the United States district Court for the District of Delaware. This complaint is captioned Robert Sellers, et al. v. Lattice, et al. We believe that we possess defenses to these claims and intend to vigorously defend this litigation. At this stage of the proceedings, we do not have an estimate of the likelihood or the amount of any potential exposure to the Company, if any.
We are exposed to certain other asserted and unasserted potential claims. There can be no assurance that, with respect to potential claims made against us, we could resolve such claims under terms and conditions that would not have a material adverse effect on our business, our liquidity or our financial results. Periodically, we review the status of each significant matter and assess its potential financial exposure. If the potential loss from any claim or legal proceeding is considered probable and a range of possible losses can be estimated, we then accrue a liability for the estimated loss based on the provisions of FASB ASC 450, “Contingencies" (“ASC 450”). Legal proceedings are subject to uncertainties, and the outcomes are difficult to predict. Because of such uncertainties, accruals are based only on the best information available at the time. As additional information becomes available, we reassess the potential liability related to pending claims and litigation and may revise estimates.
Item 4. Mine Safety Disclosures
Not applicable.
26
PART II
Item 5. Market for Registrant's Common Equity, Related Stockholder Matters, and Issuer Purchases of Equity Securities
Market Information
Our common stock is traded on the NASDAQ Global Select Market under the symbol "LSCC". The following table sets forth the low and high intraday sale prices for our common stock for the last two fiscal years, as reported by NASDAQ.
Low | High | ||||||
2016: | |||||||
First Quarter | $ | 4.02 | $ | 6.67 | |||
Second Quarter | 4.89 | 6.47 | |||||
Third Quarter | 5.21 | 6.69 | |||||
Fourth Quarter | 5.91 | 7.99 | |||||
2015: | |||||||
First Quarter | $ | 5.87 | $ | 7.66 | |||
Second Quarter | 5.76 | 6.98 | |||||
Third Quarter | 3.25 | 6.10 | |||||
Fourth Quarter | 3.68 | 7.07 | |||||
Holders
As of February 27, 2017, we had approximately 255 stockholders of record.
Dividends
The payment of dividends on our common stock is within the discretion of our Board of Directors. We intend to retain earnings to finance the growth of our business. We have never paid cash dividends.
Recent Sales of Unregistered Securities
None.
Issuer Purchases of Equity Securities
On March 3, 2014, our Board of Directors approved a stock repurchase program pursuant to which up to $20.0 million of outstanding common stock could be repurchased from time to time. The duration of the repurchase program was twelve months. Under this program during fiscal 2015, approximately 1.9 million shares were repurchased for $13.1 million. The 2014 program completed during the first quarter of fiscal 2015, during which approximately 1.1 million shares were repurchased for approximately $7.0 million. All shares repurchased under the 2014 program were retired by the end of the fiscal year in which they were repurchased. All repurchases were open market transactions funded from available working capital.
Comparison of Total Cumulative Stockholder Return
The following graph shows the five-year comparison of cumulative stockholder return on our common stock, the Standard and Poor's (“S&P”) 500 Index and the Philadelphia Semiconductor Index (“PHLX”) from December 2011 through December 2016. Cumulative stockholder return assumes $100 invested at the beginning of the period in our common stock, the S&P and PHLX. Historical stock price performance is not necessarily indicative of future stock price performance.
27
Lattice Cumulative Stockholder Return
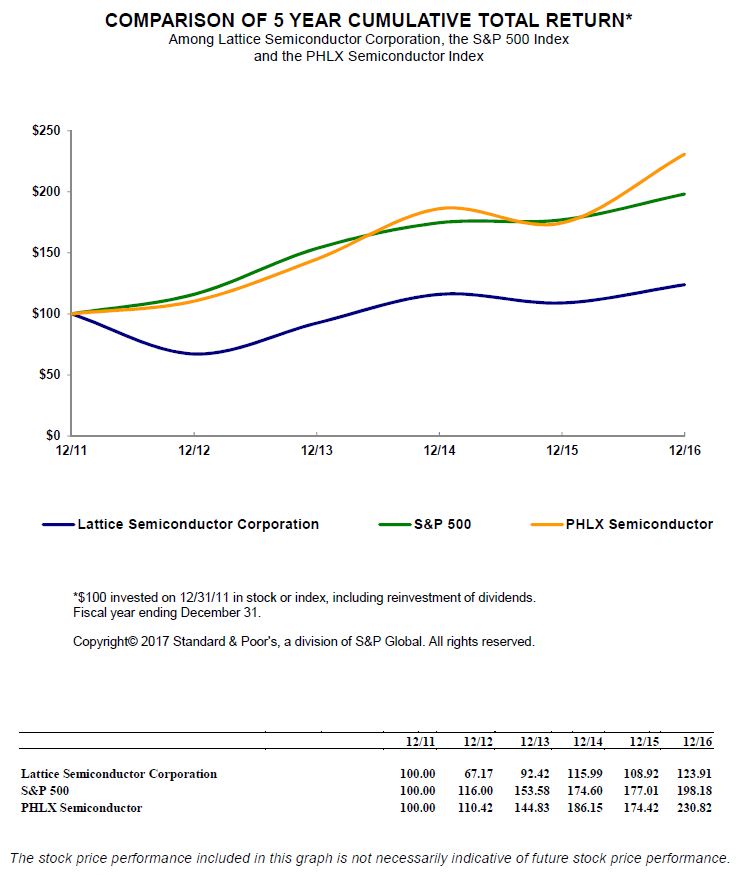
28
Item 6. Selected Financial Data
Year Ended * | |||||||||||||||||||
STATEMENT OF OPERATIONS: | December 31, 2016 | January 2, 2016 ** | January 3, 2015 | December 28, 2013 | December 29, 2012 | ||||||||||||||
(In thousands, except per share data) | |||||||||||||||||||
Revenue: | |||||||||||||||||||
Product | $ | 390,704 | $ | 369,200 | $ | 366,127 | $ | 332,525 | $ | 279,256 | |||||||||
Licensing and services | 36,350 | 36,766 | — | — | — | ||||||||||||||
Total Revenue | 427,054 | 405,966 | 366,127 | 332,525 | 279,256 | ||||||||||||||
Costs and expenses: | |||||||||||||||||||
Cost of products sold | 179,983 | 184,914 | 159,940 | 154,281 | 128,499 | ||||||||||||||
Cost of licensing and services revenue | 637 | 1,143 | — | — | — | ||||||||||||||
Research and development | 117,518 | 136,868 | 88,079 | 80,966 | 77,610 | ||||||||||||||
Selling, general, and administrative | 98,602 | 97,349 | 73,527 | 67,144 | 72,317 | ||||||||||||||
Amortization of acquired intangible assets | 33,575 | 29,580 | 2,948 | 2,960 | 4,178 | ||||||||||||||
Restructuring charges | 9,267 | 19,239 | 17 | 388 | 6,018 | ||||||||||||||
Acquisition related charges | 6,305 | 22,450 | — | — | — | ||||||||||||||
Impairment of goodwill and intangible assets | 7,866 | 21,655 | — | — | — | ||||||||||||||
453,753 | 513,198 | 324,511 | 305,739 | 288,622 | |||||||||||||||
(Loss) Income from operations | (26,699 | ) | (107,232 | ) | 41,616 | 26,786 | (9,366 | ) | |||||||||||
Interest expense | (20,327 | ) | (18,389 | ) | (172 | ) | (152 | ) | — | ||||||||||
Other income (expense), net | 4,303 | (580 | ) | 1,497 | (148 | ) | 505 | ||||||||||||
(Loss) income before income taxes and equity in net loss of an unconsolidated affiliate | (42,723 | ) | (126,201 | ) | 42,941 | 26,486 | (8,861 | ) | |||||||||||
Income tax expense (benefit) | 9,917 | 32,540 | (5,639 | ) | 4,165 | 20,745 | |||||||||||||
Equity in net loss of an unconsolidated affiliate, net of tax | (1,459 | ) | (492 | ) | — | — | — | ||||||||||||
Net (loss) income | $ | (54,099 | ) | $ | (159,233 | ) | $ | 48,580 | $ | 22,321 | $ | (29,606 | ) | ||||||
Net (loss) income per share | |||||||||||||||||||
Basic | $ | (0.45 | ) | $ | (1.36 | ) | $ | 0.41 | $ | 0.19 | $ | (0.25 | ) | ||||||
Diluted | $ | (0.45 | ) | $ | (1.36 | ) | $ | 0.40 | $ | 0.19 | $ | (0.25 | ) | ||||||
Shares used in per share calculations: | |||||||||||||||||||
Basic | 119,994 | 117,387 | 117,708 | 115,701 | 117,194 | ||||||||||||||
Diluted | 119,994 | 117,387 | 120,245 | 117,081 | 117,194 | ||||||||||||||
At | |||||||||||||||||||
BALANCE SHEET: | December 31, 2016 | January 2, 2016 | January 3, 2015 | December 28, 2013 | December 29, 2012 | ||||||||||||||
(In thousands) | |||||||||||||||||||
Cash, cash equivalents and short-term marketable securities | $ | 116,860 | $ | 102,574 | $ | 254,844 | $ | 215,815 | $ | 183,401 | |||||||||
Total assets | $ | 766,883 | $ | 785,920 | $ | 510,530 | $ | 447,876 | $ | 414,619 | |||||||||
Long term liabilities | $ | 338,903 | $ | 369,223 | $ | 8,809 | $ | 3,588 | $ | 3,976 | |||||||||
Total liabilities | $ | 496,453 | $ | 480,400 | $ | 69,555 | $ | 62,196 | $ | 57,069 | |||||||||
Total stockholders' equity | $ | 270,430 | $ | 305,520 | $ | 440,975 | $ | 385,680 | $ | 357,550 | |||||||||
* The year ended January 3, 2015 was a 53-week year as compared to the other years presented, which were based on our standard 52-week year. | |||||||||||||||||||
** Our results for the year ended January 2, 2016 include the results of Silicon Image for the approximately 10-month period from | |||||||||||||||||||
March 11, 2015 through January 2, 2016. Results presented for periods prior to fiscal 2015 are those historically reported for | |||||||||||||||||||
Lattice only. Our results for the year ended December 31, 2016 fully include the results of Silicon Image. | |||||||||||||||||||
29
ITEM 7. MANAGEMENT'S DISCUSSION AND ANALYSIS OF FINANCIAL CONDITION AND RESULTS OF OPERATIONS
Overview
Lattice Semiconductor (“Lattice,” the “Company,” “we,” “us,” or “our”) engages in smart connectivity solutions, providing intellectual property ("IP") and low-power, small form-factor devices that enable global customers to quickly deliver innovative and differentiated cost and power efficient products. Our broad end-market exposure extends from mobile devices and consumer electronics to industrial and automotive equipment, communications and computing infrastructure, and licensing.
Lattice was founded in 1983 and is headquartered in Portland, Oregon. We acquired Silicon Image, Inc. ("Silicon Image") in March 2015. Silicon Image was engaged in setting industry standards including the HDMI®, DVI®, MHL® and WirelessHD® standards. Our results for the year ended January 2, 2016 include the results of Silicon Image for the approximately 10-month period from March 11, 2015 through January 2, 2016. Results presented for periods prior to fiscal 2015 are those historically reported for Lattice only. Our results for the year ended December 31, 2016 fully include the results of Silicon Image.
Plan of Merger and Reorganization
On November 3, 2016, we entered into an Agreement and Plan of Merger (the “Merger Agreement”) with Canyon Bridge Acquisition Company, Inc., a Delaware corporation (“Parent”), and Canyon Bridge Merger Sub, Inc., a Delaware corporation and wholly owned subsidiary of Parent (“Merger Sub”), providing for the merger of Merger Sub with and into the Company (the “Merger”), with the Company surviving the Merger as a wholly owned subsidiary of Parent.
At the effective time of the Merger, each share of common stock, par value $0.01 per share, of the Company (the “Shares”) that is outstanding immediately prior to such time (other than (i) Shares owned by Parent, Merger Sub, the Company (including any Shares held in the treasury of the Company) or by any direct or indirect wholly owned subsidiary of Parent, Merger Sub or the Company, or (ii) Shares held by stockholders of the Company who not have voted in favor of the Merger and who are entitled to demand and properly demand their statutory rights of appraisal in accordance with the Delaware General Corporation Law) will be canceled and extinguished and automatically converted into the right to receive cash in an amount equal to $8.30 per share (without interest and subject to deduction for any required withholding tax).
Completion of the Merger is subject to various conditions, including the receipt on a timely basis or at all of any required regulatory clearances related to the Merger, including under the Hart-Scott-Rodino Antitrust Improvements Act of 1976 (HSR) and from the Committee on Foreign Investment in the United States ("CFIUS"). On January 4, 2017, the parties’ request for early termination of the waiting period provided by the Hart-Scott-Rodino Act was granted.
Critical Accounting Policies and Estimates
Critical accounting policies are those that are both most important to the portrayal of a company's financial condition and results and require management's most difficult, subjective, and complex judgments, often as a result of the need to make estimates about the effect of matters that are inherently uncertain. A description of our critical accounting policies follows.
Use of Estimates
The preparation of financial statements in conformity with U.S. generally accepted accounting principles ("U.S. GAAP") requires management to make estimates and assumptions that affect the reported amounts and classification of assets, such as marketable securities, accounts receivable, inventory, goodwill (including the assessment of reporting unit), intangible assets, current and deferred income taxes, accrued liabilities (including restructuring charges and bonus arrangements), deferred income and allowances on sales to sell-through distributors, disclosure of contingent assets and liabilities at the date of the financial statements, amounts used in acquisition valuations and purchase accounting, and the reported amounts of product revenue, licensing and services revenue, and expenses during the fiscal periods presented. Actual results could differ from those estimates.
Revenue Recognition and Deferred Income
Product Revenue
We sell our products directly to end customers, through a network of independent manufacturers' representatives, and indirectly through a network of independent sell-in and sell-through distributors. Distributors provide periodic data regarding the product, price, quantity, and end customer when products are resold, as well as the quantities of our products they still have in stock.
30
Revenue from sales to original equipment manufacturers ("OEMs") and sell-in distributors is generally recognized upon shipment. Reserves for sell-in stock rotations, where applicable, are estimated based primarily on historical experience and provided for at the time of shipment. Revenue from sales by our sell-through distributors is recognized at the time of reported resale. Under both types of revenue recognition, persuasive evidence of an arrangement exists, the price is fixed or determinable, title has transferred, collection of resulting receivables is reasonably assured, and there are no remaining customer acceptance requirements and no remaining significant performance obligations.
Orders from our sell-through distributors are initially recorded at published list prices; however, for a majority of our sales, the final selling price is determined at the time of resale and in accordance with a distributor price agreement. For this reason, we do not recognize revenue until products are resold by sell-through distributors to an end customer. In certain circumstances, we allow sell-through distributors to return unsold products. At times, we protect our sell-through distributors against reductions in published list prices.
At the time of shipment to sell-through distributors, we (a) record Accounts receivable at published list price since there is a legally enforceable obligation from the distributor to pay us currently for product delivered, (b) relieve inventory for the carrying value of goods shipped since legal title has passed to the distributor, and (c) record deferred revenue and deferred cost of sales in deferred income and allowances on sales to sell-through distributors in the liability section of our Consolidated Balance Sheets. Revenue and cost of sales to sell-through distributors are deferred until either the product is resold by the distributor or, in certain cases, return privileges terminate, at which time Revenue and Cost of products sold are reflected in Net (loss) income, and Accounts receivable, net are adjusted to reflect the final selling price.
We use estimates and apply judgment to reconcile sell-through distributors' inventories. Errors in our estimates or judgments could result in inaccurate reporting of our Revenue, Cost of products sold, Deferred income and allowances on sales to sell-through distributors, and Net (loss) income.
Licensing and Services Revenue
Our licensing and services revenue is comprised of revenue from our IP core licensing activity, patent monetization activities, and royalty and adopter fee revenue from our standards activities. These activities are complementary to our product sales and help us monetize our IP and accelerate market adoption curves associated with our technology and standards.
From time to time we enter into patent sale and licensing agreements to monetize and license a broad portfolio of our patented inventions. Such licensing agreements may include upfront license fees and ongoing royalties. The contractual terms of the agreements generally provide for payments of upfront license fees and/or royalties over an extended period of time. Revenue from such license fees is recognized when payments become due and payable as long as all other revenue recognition criteria are met, while revenue from royalties is recognized when reported to us by customers.
We enter into IP licensing agreements that generally provide licensees the right to incorporate our IP components into their products pursuant to terms and conditions that vary by licensee. Revenue earned under these agreements is classified as Licensing and services revenue. Our IP licensing agreements generally include multiple elements, which may include one or more off-the-shelf or customized IP licenses bundled with support services covering a fixed period of time, generally one year. If the different elements of a multiple-element arrangement qualify as separate units of accounting, we allocate the total arrangement consideration to each element based on relative selling price.
Amounts allocated to off-the-shelf IP licenses are recognized at the time of sale provided the other conditions for revenue recognition have been met. Amounts allocated to the support services are deferred and recognized on a straight-line basis over the support period, generally one year. Certain licensing agreements provide for royalty payments based on agreed-upon royalty rates, which may be fixed or variable depending on the terms of the agreement. The amount of revenue we recognize is based on a specified time period or on the agreed-upon royalty rate multiplied by the reported number of units shipped by the customer.
From time to time, we enter into IP licensing agreements that involve significant modification, customization or engineering services. Revenues derived from these contracts are accounted for using the percentage-of-completion method or completed contract method. The completed contract method is used for contracts where there is a risk associated with final acceptance by the customer or for short-term contracts.
HDMI royalty revenue is determined by a contractual allocation formula agreed to by the Founders of the HDMI consortium. Evidence of an arrangement, as it relates to HDMI royalty revenue, is deemed complete when all of the Founders agree on the royalty sharing formula. From time to time through December 31, 2016, as an agent of the HDMI Consortium, we performed audits on our royalty reporting customers to ensure compliance. As a result of those compliance efforts, we entered into settlement agreements for the payment of unreported royalties. The contractual terms of those agreements provided for upfront payment of unreported royalties or payment over a period of time, generally not to exceed one year. Revenue from those arrangements was recognized when the agreement was executed by both parties, as long as price was fixed and determinable and collection was reasonably assured.
31
Fair Value of Financial Instruments
We invest in various financial instruments, which may include corporate and government bonds, notes, and commercial paper. We were also invested in auction rate securities until June 2014. We value these instruments at their fair value and monitor our portfolio for impairment on a periodic basis. In the event that the carrying value of an investment exceeds its fair value and the decline in value is determined to be other than temporary, we would record an impairment charge and establish a new carrying value. We assess other-than-temporary impairment of marketable securities in accordance with Financial Accounting Standards Board (“FASB”) Accounting Standards Codification (“ASC”) 820, “Fair Value Measurements and Disclosures.” The framework under the provisions of ASC 820 establishes three levels of inputs that may be used to measure fair value. Each level of input has different levels of subjectivity and difficulty involved in determining fair value.
Level 1 instruments generally represent quoted prices for identical assets or liabilities in active markets. Therefore, determining fair value for Level 1 instruments generally does not require significant management judgment and the estimation is not difficult. Our Level 1 instruments consist of U.S. Government agency, corporate notes and bonds, and commercial paper that are traded in active markets and are classified as short-term marketable securities on our Consolidated Balance Sheets.
Level 2 instruments include inputs other than Level 1 that are observable, either directly or indirectly, such as quoted prices for similar assets or liabilities, quoted prices for identical instruments in markets that are not active, or other inputs that are observable or can be corroborated by observable market data for substantially the full term of the assets or liabilities. Our Level 2 instruments consist of certificates of deposit and foreign currency exchange contracts, entered into to hedge against fluctuation in the Japanese yen.
Level 3 instruments include unobservable inputs that are supported by little or no market activity and that are significant to the fair value of the assets or liabilities. As a result, the determination of fair value for Level 3 instruments requires significant management judgment and subjectivity. Our Level 3 instruments had been entirely made up of auction rate securities consisting of student loan asset-backed notes, all of which were sold during fiscal 2014.
Inventory
Inventories are recorded at the lower of actual cost determined on a first-in-first-out basis or market. We establish provisions for inventory if it is obsolete or we hold quantities which are in excess of projected customer demand. The creation of such provisions results in a write-down of inventory to net realizable value and a charge to cost of products revenue.
Property and Equipment
Property and equipment are stated at cost. Depreciation and amortization are computed using the straight-line method for financial reporting purposes over the estimated useful lives of the related assets, generally three to five years for equipment and software, one to three years for tooling and thirty years for buildings. Leasehold improvements are amortized over the shorter of the non-cancelable lease term or the estimated useful life of the assets. Upon disposal of property and equipment, the accounts are relieved of the costs and related accumulated depreciation and amortization, and resulting gains or losses are reflected in the Consolidated Statements of Operations for recognized gains and losses, or in the Consolidated Balance Sheets for deferred gains and losses. Repair and maintenance costs are expensed as incurred.
Impairment of Long-Lived Assets
Long-lived assets, including amortizable intangible assets, are carried on our financial statements based on their cost less accumulated depreciation or amortization. We monitor the carrying value of our long-lived assets for potential impairment and test the recoverability of such assets annually during the fourth quarter and whenever events or changes in circumstances indicate that their carrying amounts may not be recoverable. These events or changes in circumstances, including management decisions pertaining to such assets, are referred to as impairment indicators. If an impairment indicator occurs, we perform a test of recoverability by comparing the carrying value of the asset group to its undiscounted expected future cash flows. If the carrying values are in excess of undiscounted expected future cash flows, we measure any impairment by comparing the fair value of the asset group to its carrying value. Fair value is generally determined by considering (i) internally developed discounted projected cash flow analysis of the asset group; (ii) actual third-party valuations; and/or (iii) information available regarding the current market for similar asset groups. If the fair value of the asset group is determined to be less than the carrying amount of the asset group, an impairment in the amount of the difference is recorded in the period that the impairment indicator occurs and is included in our Consolidated Statements of Operations. Estimating future cash flows requires significant judgment and projections may vary from the cash flows eventually realized, which could impact our ability to accurately assess whether an asset has been impaired.
32
Valuation of Goodwill
Goodwill is an asset representing the future economic benefits arising from other assets acquired in a business combination that are not individually identified and separately recognized. We review goodwill for impairment annually during the fourth quarter and whenever events or changes in circumstances indicate the carrying value of goodwill may not be recoverable. When evaluating whether goodwill is impaired, we make a qualitative assessment to determine if it is more likely than not that the reporting unit's fair value is less than the carrying amount. If the qualitative assessment determines that it is more likely than not that the fair value is less than the carrying amount, the fair value of the reporting unit is compared with its carrying value (including goodwill). If the fair value of the reporting unit is less than its carrying value, an indication of goodwill impairment exists for the reporting unit and we must measure the impairment loss. The impairment loss, if any, is recognized for any excess of the carrying amount of the reporting unit's goodwill over the implied fair value of the goodwill. The implied fair value of goodwill is determined by allocating the fair value of the reporting unit in a manner similar to purchase price allocation and the residual fair value after this allocation is the implied fair value of the reporting unit goodwill. Fair value of the reporting unit is determined using a discounted cash flow analysis. If the fair value of the reporting unit exceeds its carrying value, no further impairment analysis is needed. For purposes of testing goodwill for impairment, we currently operate as a single reporting unit: the core Lattice ("Core") business, which includes intellectual property and semiconductor devices. In fiscal 2015 only, we separately tested goodwill for impairment in Qterics, a discrete software-as-a-service business unit in the Lattice legal entity structure. We sold Qterics to an unrelated third party in April 2016. Although these two operating units constituted two reportable segments in fiscal 2015, we combined Qterics with our Core business and reported them together as one reportable segment due to the immaterial nature of the Qterics unit.
Restructuring Charges
Expenses associated with exit or disposal activities are recognized when incurred under ASC 420, “Exit or Disposal Cost Obligations” for everything but severance. However, because we have a history of paying severance benefits, the cost of severance benefits associated with a restructuring plan is recorded when such costs are probable and the amount can be reasonably estimated in accordance with ASC 712, “Compensation - Nonretirement Postemployment Benefits.” When leased facilities are vacated, an amount equal to the total future lease obligations from the date of vacating the premises through the expiration of the lease, net of estimated sublease income, is recorded as a part of restructuring charges.
Accounting for Income Taxes
Our provision for income tax is comprised of our current tax liability and changes in deferred tax assets and liabilities. Deferred tax assets and liabilities are recognized for the expected tax consequences of temporary differences between the tax bases of assets and liabilities and their reported amounts in the financial statements using enacted tax rates and laws that will be in effect when the difference is expected to reverse. Valuation allowances are provided to reduce deferred tax assets to an amount that in management’s judgment is more-likely-than-not to be recoverable against future taxable income. At December 31, 2016, U.S. income taxes were not provided on approximately $3.0 million of the undistributed earnings of our Chinese subsidiary as we intend to reinvest these earnings indefinitely. If these earnings were distributed to the U.S. in the form of dividends or otherwise, these earnings would be subject to Chinese withholding taxes and would be subject to additional U.S. income taxes but offset by net operating loss carryforwards which have been fully reserved.
Our income tax calculations are based on application of the respective U.S. federal, state or foreign tax law. Our tax filings, however, are subject to audit by the relevant tax authorities. Accordingly, we recognize tax liabilities based upon our estimate of whether, and the extent to which, additional taxes will be due when such estimates are more-likely-than-not to be sustained. An uncertain income tax position will not be recognized if it has less than a 50% likelihood of being sustained. To the extent the final tax liabilities are different than the amounts originally accrued, the increases or decreases as well as any interest or penalties are recorded as income tax expense or benefit in the Consolidated Statements of Operations.
In assessing the realizability of deferred tax assets, we evaluate both positive and negative evidence that may exist and consider whether it is more-likely-than-not that some portion or all of the deferred tax assets will be realized. The ultimate realization of deferred tax assets is dependent upon the generation of future taxable income during the periods in which those temporary differences become deductible.
Any adjustment to the net deferred tax asset valuation allowance is recorded in the Consolidated Statements of Operations for the period that the adjustment is determined to be required.
Stock-Based Compensation
We use the Black-Scholes option pricing model to estimate the fair value of substantially all share-based awards consistent with the provisions of ASC 718, “Compensation - Stock Compensation.” Option pricing models, including the Black-Scholes model, require the use of input assumptions, including expected volatility, expected term, expected dividend rate, and expected risk-free rate of return. The assumptions for expected volatility and expected term most significantly affect the grant date fair value.
33
We have also used a lattice-based option-pricing model to determine and fix the fair value of stock options with a market condition granted to certain executives. This valuation model incorporates a Monte-Carlo simulation, and considered the likelihood that we would achieve the market condition. The options have a two year vesting and vest between 0% and 200% of the target amount, based on the Company's relative Total Shareholder Return ("TSR") when compared to the TSR of a component of companies of the PHLX Semiconductor Sector Index over a two year period. TSR is a measure of stock price appreciation plus dividends paid, if any, in the performance period.
Results of Operations*
Key elements of our Consolidated Statements of Operations were as follows:
Year Ended** | ||||||||||||||||||||
(In thousands) | December 31, 2016 | January 2, 2016 | January 3, 2015 | |||||||||||||||||
Revenue | $ | 427,054 | 100.0 | % | $ | 405,966 | 100.0 | % | $ | 366,127 | 100.0 | % | ||||||||
Gross margin | 246,434 | 57.7 | 219,909 | 54.2 | 206,187 | 56.3 | ||||||||||||||
Research and development | 117,518 | 27.5 | 136,868 | 33.7 | 88,079 | 24.1 | ||||||||||||||
Selling, general, and administrative | 98,602 | 23.1 | 97,349 | 24.0 | 73,527 | 20.1 | ||||||||||||||
Amortization of acquired intangible assets | 33,575 | 7.9 | 29,580 | 7.3 | 2,948 | 0.8 | ||||||||||||||
Restructuring charges | 9,267 | 2.2 | 19,239 | 4.7 | 17 | — | ||||||||||||||
Acquisition related charges | 6,305 | 1.5 | 22,450 | 5.5 | — | — | ||||||||||||||
Impairment of goodwill and intangible assets | 7,866 | 1.8 | 21,655 | 5.3 | — | — | ||||||||||||||
(Loss) income from operations | $ | (26,699 | ) | (6.3 | )% | $ | (107,232 | ) | (26.4 | )% | $ | 41,616 | 11.4 | % | ||||||
* Lattice acquired Silicon Image on March 10, 2015. Results of Operations for fiscal 2015 include the financial results of Silicon
Image for the approximately 10-month period from March 11, 2015 through January 2, 2016. Silicon Image's revenue and net
loss for that period were approximately $135.6 million and $77.0 million, respectively. Silicon Image's acquisition related
charges in that period, which were expensed as incurred, were approximately $8.2 million.
** The year ended January 3, 2015 (fiscal 2014) was a 53-week year as compared to the current and most recent previous years
(fiscal 2016 and fiscal 2015, respectively) which were based on our standard 52-week year.
Revenue
Year Ended | % Change in | ||||||||||||||
(In thousands) | December 31, 2016 | January 2, 2016 | January 3, 2015 | 2016 | 2015 | ||||||||||
Revenue | $ | 427,054 | $ | 405,966 | $ | 366,127 | 5 | 11 | |||||||
Revenue increased $21.1 million, or 5%, in fiscal 2016 compared to fiscal 2015, primarily driven by approximately $40.6 million of growth in the Industrial and Automotive end market for programmable logic devices, along with the inclusion of additional revenue in connection with our acquisition of Silicon Image for the full year of fiscal 2016 relative to only an approximately 10-month period in fiscal 2015, partially offset by approximately $20.4 million of decline in the Communications and Computing end market for programmable logic devices.
Revenue increased $39.8 million, or 11%, in fiscal 2015 compared to fiscal 2014, primarily driven by the acquisition of Silicon Image during the first quarter of fiscal 2015. The contribution by the addition of Silicon Image products was primarily in Consumer silicon products and licensing fees associated with certain IP and royalties and license fees from HDMI and MHL branded products. These increases were offset by a 26% decrease in revenue from programmable logic devices primarily in the Mobile and Consumer and the Communications and Computing end markets.
In fiscal 2014, one Mobile and Consumer end market customer accounted for 19% of total revenue, and one Communications and Computing end market customer accounted for 12% of total revenue.
34
Revenue by End Market
The end market data below is derived from data provided to us by our distributors and end customers. With a diverse base of customers who may manufacture end products spanning multiple end markets, the assignment of revenue to a specific end market requires the use of estimates and judgment. Therefore, actual results may differ from those reported. With our acquisition of Silicon Image, we added a Licensing end market to report Licensing and services revenue, which includes the licensing of our IP, the collection of certain royalties, patent sales, the revenue related to our participation in consortia and standard-setting activities, and services. While Licensing products are primarily sold into the Consumer market, Licensing and services revenue is reported separately as it has characteristics that differ from other categories, most notably its high gross margin.
The following are examples of end market applications:
Communications and Computing | Mobile and Consumer | Industrial and Automotive | Licensing and Services |
Wireless | Smartphones | Security and Surveillance | IP Royalties |
Wireline | Cameras | Machine Vision | Adopter Fees |
Data Backhaul | Displays | Industrial Automation | IP Licenses |
Computing | Tablets | Human Machine Interface | Patent Sales |
Servers | Wearables | Automotive | Testing Services |
Data Storage | Televisions and Home Theater | Drones | |
The composition of our revenue by end market for fiscal years 2016, 2015 and 2014 was as follows:
Year Ended * | % Change in | |||||||||||||||||||||||||
(In thousands) | December 31, 2016 | January 2, 2016 | January 3, 2015 | 2016 | 2015 | |||||||||||||||||||||
Communications and Computing | $ | 123,021 | 29 | % | $ | 143,424 | 35 | % | $ | 180,612 | 49 | % | (14 | ) | (21 | ) | ||||||||||
Mobile and Consumer | 127,405 | 30 | 126,130 | 31 | 92,152 | 25 | 1 | 37 | ||||||||||||||||||
Industrial and Automotive | 140,278 | 33 | 99,646 | 25 | 93,363 | 26 | 41 | 7 | ||||||||||||||||||
Licensing and Services | 36,350 | 8 | 36,766 | 9 | — | — | (1 | ) | — | |||||||||||||||||
Total revenue | $ | 427,054 | 100 | % | $ | 405,966 | 100 | % | $ | 366,127 | 100 | % | 5 | 11 | ||||||||||||
* During the first quarter of fiscal 2016, we realigned our end market categories to group Computing with Communications rather than with
Industrial, as had been the previous grouping. Prior periods have been reclassified to match current period presentation.
Our revenue in the Communications and Computing end market is largely dependent on a small number of large telecommunications equipment providers. For fiscal 2016, Communications and Computing end market revenue declined 14% primarily in programmable products, and was across a general cross section of communications customers and modestly in our largest computing customer. For fiscal 2015, Communications and Computing end market revenue decreased 21% primarily driven by a decrease in demand relative to fiscal 2014 from communications customers supporting 4G-LTE infrastructure build out in China as that program returned to more normal volumes.
Mobile and Consumer end market revenue increased 1% in fiscal 2016, after increasing 37% in fiscal 2015. Mobile and Consumer end market revenue increased in fiscal 2016 primarily due to a significant increase in new programmable production volume for a major mobile handset provider offset by a nearly equal decline in ASSP shipments related to high-definition television ("HDTV") and mobile handsets. Mobile and Consumer end market revenue increased in fiscal 2015 primarily due to the acquisition of Silicon Image, offset by a 60% decline in our FPGA product revenue due primarily to lower demand at a major OEM for certain of our iCE40 products. The products acquired were concentrated in the DTV, home theater, and mobile communications markets.
For fiscal 2016, Industrial and Automotive end market revenue increased 41% when compared to fiscal 2015. This is primarily due to strength in programmable products revenue resulting from line item reduction and complex programmable logic device ("CPLD") conversions affecting both the Americas and Europe. For fiscal 2015, Industrial and Automotive end market revenue increased 7% when compared to fiscal 2014 primarily due to Industrial and Automotive end market growth in Asia and the acquisition of Silicon Image.
Licensing and Services revenue decreased by 1% in fiscal 2016 primarily due to slightly reduced adopter fees and audit revenues at licensed end customers. Licensing and Services revenue was first recognized in fiscal 2015 following the acquisition of Silicon Image in March 2015. Previously, we did not have Licensing and Services revenue. Revenue from this end market is expected to fluctuate, sometimes significantly, from period to period as a result of the timing of completion of IP license arrangements, IP sales, patent sales, and settlement of royalty audits. As a result of the amended model for sharing revenue and the appointment of a new independent agent for the HDMI consortium, we will be entitled to a reduced share of adopter fees paid by parties adopting the HDMI standard in 2017.
35
Revenue by Geography
We assign revenue to geographies based on customer ship-to address at the point where revenue is recognized. In the case of sell-in distributors and OEM customers, revenue is typically recognized, and geography is assigned, when products are shipped to our distributor or OEM customer. In the case of sell-through distributors, revenue is recognized when resale to the end customer occurs and geography is assigned based on the end customer location on the resale reports provided by the distributor. Both foreign and domestic sales are denominated in U.S. dollars, with the exception of certain historical sales in Japan, which were denominated in yen.
The composition of our revenue by geography, based on ship-to location, for fiscal years 2016, 2015 and 2014 was as follows:
Year Ended | % Change in | |||||||||||||||||||||||||
(In thousands) | December 31, 2016 | January 2, 2016 | January 3, 2015 | 2016 | 2015 | |||||||||||||||||||||
Asia | $ | 305,093 | 71 | % | $ | 308,534 | 76 | % | $ | 266,831 | 73 | % | (1 | ) | 16 | |||||||||||
Europe | 59,835 | 14 | 55,596 | 14 | 59,041 | 16 | 8 | (6 | ) | |||||||||||||||||
Americas | 62,126 | 15 | 41,836 | 10 | 40,255 | 11 | 48 | 4 | ||||||||||||||||||
Total revenue | $ | 427,054 | 100 | % | $ | 405,966 | 100 | % | $ | 366,127 | 100 | % | 5 | 11 | ||||||||||||
Revenue in Asia decreased 1% in fiscal 2016 and increased 16% in fiscal 2015. In fiscal 2016, revenue decreased in Asia primarily due to declines in HDTV and ASSP revenue, although these were substantially offset by increases in revenue from programmable logic products in the Mobile and Consumer end market. In fiscal 2015, revenue growth in Asia was due primarily to the acquisition of Silicon Image, a high concentration of whose products are in the Consumer market with the end products they serve heavily manufactured in Asia. We believe the Asia Pacific region will remain the primary source of our revenue due to relatively more favorable business conditions in Asia and a continuing trend towards the migration of manufacturing by North American and European customers to the Asia Pacific region.
Revenue in Europe increased 8% in fiscal 2016 primarily due to line item reduction and CPLD conversions. Revenue in Europe decreased 6% in fiscal 2015 primarily due to the completion of a specific program at a large Communications customer and a decrease in volume at an Industrial customer.
Revenue from the Americas increased 48% in fiscal 2016 primarily due to line item reduction and CPLD conversions. Americas revenue increased 4% in fiscal 2015 due to the addition of Silicon Image which contributed revenue both in devices and Licensing and services enough to offset a decline in programmable products revenue in the region.
Revenue from foreign sales as a percentage of total revenue was 88%, 92%, and 92% for fiscal 2016, 2015 and 2014, respectively.
Revenue from End Customers
Our top five end customers constituted approximately 27% in fiscal 2016, compared to approximately 32% and 45% in fiscal years 2015 and 2014, respectively, primarily due to a more diverse customer base.
During fiscal years 2016 and 2015, no end customer accounted for more than 10% of total revenue. Our largest end customer in fiscal 2016 accounted for approximately 9.9% of total revenue, while our largest end customer in fiscal 2015 accounted for approximately 9.3% of total revenue. In fiscal 2014, our two largest end customers accounted for 19.1% and 12.3%, respectively, of total revenue. No other customers accounted for more than 10% of total revenue during these periods.
Revenue by Distributors
Sales through distributors have historically accounted for a significant portion of our total revenue. Revenue attributable to resale of products by our primary sell-through distributors for fiscal years 2016, 2015 and 2014 was as follows:
% of Total Revenue | ||||||||
2016 | 2015 | 2014 | ||||||
Arrow Electronics Inc. | 24 | % | 20 | % | 24 | % | ||
Weikeng Group | 22 | 12 | 10 | |||||
All others | 15 | 13 | 11 | |||||
All sell-through distributors | 61 | % | 45 | % | 45 | % | ||
36
Revenue from sell-through distributors as a percent of total revenue increased in fiscal 2016 primarily due to an increase in new programmable production volume in consumer mobile devices shipped through a sell-through distributor in 2016, as well as declines in channels other than sell-through distributors from 2015 levels, mainly due to declines in DTV and Home Theater related devices and handset content revenues. Revenue from sell-through distributors as a percent of total revenue was flat over the two-year period from fiscal 2015 through fiscal 2014.
Gross margin
The composition of our gross margin, including as a percentage of revenue, for fiscal years 2016, 2015 and 2014 was as follows:
Year Ended | |||||||||||
(In thousands) | December 31, 2016 | January 2, 2016 | January 3, 2015 | ||||||||
Gross margin | $ | 246,434 | $ | 219,909 | $ | 206,187 | |||||
Percentage of revenue | 57.7 | % | 54.2 | % | 56.3 | % | |||||
Product gross margin % | 53.9 | % | 49.9 | % | 56.3 | % | |||||
Licensing and services gross margin % | 98.2 | % | 96.9 | % | — | % | |||||
Gross margin and Product gross margin, as a percentage of revenue, increased 3.5 and 4.0 percentage points, respectively, from fiscal 2015 to fiscal 2016. Of this increase, approximately 2.5 percentage points was due to product cost reductions from lower overhead burden rates, reduced wafer and packaging costs, and improved yields. Approximately another 1.5 percentage points of the increase was due to the reduced amortization in the current year of purchase price accounting adjustments (now substantially completed) associated with the sell-through of acquired inventory and deferred revenue. These increases were partially offset by a less favorable product and customer mix.
Gross margin and Product gross margin, as a percentage of revenue, declined 2.1 and 6.4 percentage points, respectively, from fiscal 2014 to fiscal 2015, primarily due to purchase accounting adjustments (now substantially completed) from the acquisition of Silicon Image in March 2015 associated with the sell-through of acquired inventory and deferred revenue combined with a degradation of product mix. The unfavorable product mix was mainly driven by the acquired mobile communications and DTV product groups in our Consumer end market slightly offset by the high margins from the acquired Licensing and services revenue.
Because of its higher margin, the licensing and services portion of our overall revenue can have a disproportionate impact on gross margin and profitability. For programmable and standard products, we expect that product, end market, and customer mix will subject our gross margin to fluctuation, while we expect downward pressure on average selling price to adversely affect our gross margin in the future. If we are unable to realize additional or sufficient product cost reductions in the future to balance changes in product and customer mix, we may experience degradation in our product gross margin.
Operating Expenses
Research and development expense
The composition of our research and development expenses, including as a percentage of revenue, for fiscal years 2016, 2015, and 2014 was as follows:
Year Ended | % Change in | ||||||||||||||||
(In thousands) | December 31, 2016 | January 2, 2016 | January 3, 2015 | 2016 | 2015 | ||||||||||||
Research and development | $ | 117,518 | $ | 136,868 | $ | 88,079 | (14.1 | )% | 55.4 | % | |||||||
Percentage of revenue | 27.5 | % | 33.7 | % | 24.1 | % | |||||||||||
Mask costs included in Research and development | $ | 3,328 | $ | 5,770 | $ | 2,877 | (42.3 | )% | 100.6 | % | |||||||
Research and development expense includes costs for compensation and benefits, stock compensation, development masks, engineering wafers, depreciation, licenses, and outside engineering services. These expenditures are for the design of new products, IP cores, processes, packaging, and software to support new products.
We believe that a continued commitment to research and development is essential to maintaining product leadership and providing innovative new product offerings and, therefore, we expect to continue to make significant future investments in research and development.
37
The decrease in research and development expense for fiscal 2016 compared to fiscal 2015 is due mainly to significantly reduced headcount expenses and, to a lesser extent, reduced mask and wafer costs, lab supplies, time-based licenses, and outside services.
The increase in research and development expense for fiscal 2015 compared to fiscal 2014 was the result of increased headcount, masks costs, and outside service expenses primarily from the inclusion of Silicon Image research and development, partially offset by decreased variable compensation expense.
Selling, general, and administrative expense
The composition of our selling, general and administrative expenses, including as a percentage of revenue, for fiscal years 2016, 2015, and 2014 was as follows:
Year Ended | % Change in | ||||||||||||||||
(In thousands) | December 31, 2016 | January 2, 2016 | January 3, 2015 | 2016 | 2015 | ||||||||||||
Selling, general, and administrative | $ | 98,602 | $ | 97,349 | $ | 73,527 | 1.3 | % | 32.4 | % | |||||||
Percentage of revenue | 23.1 | % | 24.0 | % | 20.1 | % | |||||||||||
Selling, general, and administrative expense includes costs for compensation and benefits related to selling, general, and administrative employees, commissions, depreciation, professional and outside services, trade show, and travel expenses.
The increase in selling, general, and administrative expense for fiscal 2016 compared to fiscal 2015 was due mainly to an increase in bad debt expense related to the bankruptcy of one of our distributor groups, substantially offset by the decrease in expenses due to restructuring and integration of operations undertaken since the acquisition of Silicon Image, predominantly headcount reductions and site consolidations.
The increase in selling, general, and administrative expense for fiscal 2015 compared to fiscal 2014 was primarily due to increased headcount and outside service expenses driven primarily by the inclusion of Silicon Image, partially offset by decreased variable compensation expense.
Amortization of Acquired Intangible Assets
The composition of our amortization of acquired intangible assets, including as a percentage of revenue, for fiscal years 2016, 2015 and 2014 was as follows:
Year Ended | % Change in | |||||||||||||||
(In thousands) | December 31, 2016 | January 2, 2016 | January 3, 2015 | 2016 | 2015 | |||||||||||
Amortization of acquired intangible assets | $ | 33,575 | $ | 29,580 | $ | 2,948 | 13.5 | % | 100+% | |||||||
Percentage of revenue | 7.9 | % | 7.3 | % | 0.8 | % | ||||||||||
For fiscal 2016 compared to fiscal 2015, amortization of acquired intangible assets increased due to the inclusion of additional amortization expense from new intangible assets acquired in connection with our acquisition of Silicon Image for the full year of fiscal 2016 relative to only an approximately 10-month period in fiscal 2015, partially offset by the reduction of certain intangibles as a result of impairment charges in late 2015, and the sale of Qterics in April 2016.
For fiscal 2015 compared to fiscal 2014, amortization of acquired intangible assets increased primarily due to additional amortization expense from intangible assets acquired in connection with our acquisition of Silicon Image in March 2015.
38
Restructuring charges
The composition of our restructuring charges, including as a percentage of revenue, for fiscal years 2016, 2015 and 2014 was as follows:
Year Ended | % Change in | |||||||||||||||
(In thousands) | December 31, 2016 | January 2, 2016 | January 3, 2015 | 2016 | 2015 | |||||||||||
Restructuring charges | $ | 9,267 | $ | 19,239 | $ | 17 | (51.8 | )% | 100+% | |||||||
Percentage of revenue | 2.2 | % | 4.7 | % | — | % | ||||||||||
Restructuring charges include expenses resulting from reductions in our worldwide workforce, consolidation of our facilities, and cancellation of software contracts and engineering tools.
In March 2015, our Board of Directors approved an internal restructuring plan (the "March 2015 Plan"), in connection with our acquisition of Silicon Image. The March 2015 Plan was designed to realize synergies from the acquisition by eliminating redundancies created as a result of combining the two companies. The March 2015 Plan is substantially complete, subject to certain remaining expected costs that we do not expect to be material and any changes in sublease assumptions should they occur, which will be expensed as incurred under U.S. GAAP rules through the first quarter of fiscal 2017. Approximately $20.6 million of total expense has been incurred through December 31, 2016 under the Mach 2015 Plan. We expect the total cost of the March 2015 Plan to be approximately $21.0 million.
In September 2015, we implemented a further reduction of our worldwide workforce (the "September 2015 Reduction") separate from the March 2015 Plan. The September 2015 Reduction was designed to resize the company in line with the market environment and to better balance our workforce with the long-term strategic needs of our business. The September 2015 Reduction is substantially complete, subject to certain remaining expected costs, which we do not expect to be material, which will be expensed as incurred under U.S. GAAP rules through the first quarter of fiscal 2017. Approximately $7.9 million of total expense has been incurred through December 31, 2016 under the September 2015 Reduction. We expect the total cost of the September 2015 Reduction to be approximately $8.0 million.
The $10.0 million decrease in restructuring expense from fiscal 2015 to fiscal 2016 is primarily the result of decreased headcount related restructuring charges in the current year slightly offset by an incremental net charge in the fourth quarter of 2016 to terminate the lease for our Sunnyvale site.
The increase in Restructuring charges for fiscal 2015 compared to fiscal 2014 was driven by the combination of both the March 2015 Plan and the September 2015 Reduction in fiscal 2015 versus only residual restructuring activity in fiscal 2014 related to past restructuring plans.
Acquisition related charges
The composition of our acquisition related charges, including as a percentage of revenue, for fiscal years 2016, 2015 and 2014 was as follows:
Year Ended | % Change in | |||||||||||||||
(In thousands) | December 31, 2016 | January 2, 2016 | January 3, 2015 | 2016 | 2015 | |||||||||||
Acquisition related charges | $ | 6,305 | $ | 22,450 | $ | — | (71.9 | )% | 100+% | |||||||
Percentage of revenue | 1.5 | % | 5.5 | % | — | % | ||||||||||
Acquisition related charges includes severance and professional fees directly related to acquisitions.
For fiscal 2016, acquisition related charges were attributable to professional fees associated with our pending acquisition by Canyon Bridge Acquisition Company, Inc.
For fiscal 2015, acquisition related charges were entirely attributable to our acquisition of Silicon Image in March 2015 and were comprised of professional services including legal, accounting, licenses and fees, and severance and stock compensation costs related to change of control payments to departing executives. Charges related to the acquisition of Silicon Image were substantially completed as of January 2, 2016. There were no acquisition related charges in fiscal 2014.
39
Impairment of goodwill and intangible assets
The composition of our Impairment of goodwill and intangible assets, including as a percentage of revenue, for fiscal years 2016, 2015 and 2014 was as follows:
Year Ended | % Change in | |||||||||||||||
(In thousands) | December 31, 2016 | January 2, 2016 | January 3, 2015 | 2016 | 2015 | |||||||||||
Impairment of goodwill and intangible assets | $ | 7,866 | $ | 21,655 | $ | — | (63.7 | )% | 100+% | |||||||
Percentage of revenue | 1.8 | % | 5.3 | % | — | % | ||||||||||
In September 2016, the Founders of the HDMI consortium, of which we are a member, amended the Founders Agreement resulting in changes to our role as agent for the HDMI consortium and to the model for sharing adopter fee revenues. Lattice historically served the role of the HDMI licensing agent via a wholly owned subsidiary, HDMI Licensing LLC. Under the terms of the agreement, our role as the agent was terminated effective January 1, 2017 and a new independent entity was appointed to act as the new HDMI licensing agent with responsibility for licensing and the distribution of royalties among Founders. As a result of the amended model for sharing revenue, we will be entitled to a reduced share of adopter fees paid by parties adopting the HDMI standard. We determined that this modification constituted an impairment indicator related to the intangible assets associated with future HDMI adopter fees. Our assessment of the new value of these intangible assets concluded that they had been impaired as of the end of the third quarter of fiscal 2016, and we recorded a $7.9 million non-cash impairment charge in the Consolidated Statements of Operations. We do not anticipate any future cash expenditures related to this impairment. No impairment charges related to goodwill were recorded in fiscal 2016 as no indicators of impairment were present.
For fiscal 2015, the impairment of goodwill and intangible assets was related to Qterics, Inc., which was acquired in the March 2015 acquisition of Silicon Image. During the fourth quarter of fiscal 2015, we determined that we experienced an impairment indicator related to the long-lived assets of the Qterics operating segment. For purposes of testing for impairment in fiscal 2015, the Company operated as two reporting units: the continuing core Lattice ("Core") business, which includes intellectual property and semiconductor devices, and Qterics, which was a discrete software-as-a-service business unit in the Lattice legal entity structure until it was sold in April 2016. Although these two operating segments constituted two reportable segments in fiscal 2015, we combined Qterics with our Core business and reported them together as one reportable segment due to the immaterial nature of the Qterics segment. Following this assessment, we concluded that goodwill and intangible assets had been impaired in the Qterics segment as of January 2, 2016. As a result, we recorded impairment charges amounting to $21.7 million, or approximately 92% of the previous value of goodwill and intangible assets, in the Consolidated Statements of Operations for the year ended January 2, 2016, comprising $12.7 million pertaining to goodwill, $3.9 million pertaining to developed technology, and $5.1 million pertaining to customer relationships. The valuation was based on the market approach and was our best estimate of fair value as of the end of fiscal 2015. No impairment charges were recorded for the Core segment in fiscal 2015, and we had no impairment charges in fiscal 2014.
Interest Expense
The composition of our Interest expense, including as a percentage of revenue, for fiscal years 2016, 2015 and 2014 was as follows:
Year Ended | % Change in | |||||||||||||||
(In thousands) | December 31, 2016 | January 2, 2016 | January 3, 2015 | 2016 | 2015 | |||||||||||
Interest expense | $ | (20,327 | ) | $ | (18,389 | ) | $ | (172 | ) | 10.5 | % | 100+% | ||||
Percentage of revenue | (4.8 | )% | (4.5 | )% | — | % | ||||||||||
The increase in interest expense for fiscal 2016 compared to fiscal 2015 was primarily driven by the interest expense related to our debt acquired to partially fund the Silicon Image acquisition, which is further discussed in the Credit Arrangements section under Liquidity and Capital Resources. This interest expense is comprised of contractual interest and amortization of original issue discount and debt issuance costs based on the effective interest method and was recognized for the full year of fiscal 2016 versus only an approximately 10-month period in fiscal 2015. The latter shorter period was the result of the Silicon Image acquisition date late in the first quarter of fiscal 2015.
For fiscal 2015, the $18.2 million increase in interest expense from fiscal 2014 was primarily driven by the issuance of debt to partially fund the Silicon Image acquisition in fiscal 2015.
40
Other income (expense), net
The composition of our other income (expense), net, including as a percentage of revenue, for fiscal years 2016, 2015 and 2014 was as follows:
Year Ended | % Change in | ||||||||||||||
(In thousands) | December 31, 2016 | January 2, 2016 | January 3, 2015 | 2016 | 2015 | ||||||||||
Other income (expense), net | $ | 4,303 | $ | (580 | ) | $ | 1,497 | 100+% | (100+)% | ||||||
Percentage of revenue | 1.0 | % | (0.1 | )% | 0.4 | % | |||||||||
For fiscal 2016 compared to fiscal 2015, the increase in other income (expense), net is driven by the $2.6 million gain on the sale of Qterics to an unrelated third party, escrow proceeds received from the sale of assets by Silicon Image prior to our acquisition in 2015, proceeds received from the bankruptcy settlement distribution of a prior customer, all in fiscal 2016, and the loss on sale of assets in the prior year, not recurring in the current year.
The $0.6 million other expense in fiscal 2015 primarily consisted of a loss on sale of assets combined with foreign exchange losses as compared to the $1.5 million other income in fiscal 2014, which resulted primarily from the realization of a gain on the sale of auction rate securities.
Income taxes
The composition of our income taxes for fiscal years 2016, 2015 and 2014 was as follows:
Year Ended | % Change in | |||||||||||||||
(In thousands) | December 31, 2016 | January 2, 2016 | January 3, 2015 | 2016 | 2015 | |||||||||||
Income tax expense (benefit) | $ | 9,917 | $ | 32,540 | $ | (5,639 | ) | (69.5 | )% | 100+% | ||||||
Our overall tax expense for fiscal 2016, compared to fiscal 2015 decreased primarily due to the recording of a valuation allowance in 2015 resulting in an increase to the tax provision of $21 million, not recurring in the current year.
In the first quarter of 2015, we completed the acquisition of Silicon Image, Inc. At the time of the acquisition, we evaluated the combined entity's net deferred income taxes, which included an assessment of the cumulative income or loss over the prior three-year period and future periods, to determine if a valuation allowance is required. After considering the impact of the acquisition including interest expense and other restructuring expenses, we recorded a valuation allowance on our net federal and state deferred tax assets.
During the fourth quarter of 2014, we concluded that it was more-likely-than-not that we would be able to realize the benefit of a portion of our remaining deferred tax assets, resulting in a tax benefit of $11.5 million. We based this conclusion on improved operating results over the previous two years and our expectations about generating taxable income in the foreseeable future. We exercised significant judgment and considered estimates about our ability to generate revenue, gross profits, operating income and taxable income in future periods under our global tax structure in reaching this decision.
We are not currently paying U.S. federal income taxes and do not expect to pay such taxes until we fully utilize our tax net operating loss and credit carryforwards. We expect to pay a nominal amount of state income tax. We are paying foreign income taxes, which are primarily related to withholding taxes on income from foreign royalties, and to a lesser extent related to foreign sales and to the cost of operating offshore research and development, marketing, and sales subsidiaries. We accrue interest and penalties related to uncertain tax positions in income tax expense on our Consolidated Statements of Operations.
The inherent uncertainties related to the geographical distribution and relative level of profitability among various high and low tax jurisdictions make it difficult to estimate the impact of the global tax structure on our future effective tax rate.
41
Equity in net loss of an unconsolidated affiliate
The composition of our equity in net loss of an unconsolidated affiliate for fiscal years 2016, 2015 and 2014 was as follows:
Year Ended | % Change in | |||||||||||||||
(In thousands) | December 31, 2016 | January 2, 2016 | January 3, 2015 | 2016 | 2015 | |||||||||||
Equity in net loss of an unconsolidated affiliate, net of tax | $ | (1,459 | ) | $ | (492 | ) | $ | — | 196.5 | % | 100+% | |||||
As of December 31, 2016, we held a 22.7% preferred stock ownership interest in a privately-held company that designs human-computer interaction technology for a total investment of $6.0 million. Due to the level of our ownership interest and after considering the nature of our participation in the management and interaction with the investee, we have determined that we have the ability to exert significant influence on the investee. Accordingly, we have accounted for the investment using the equity method and have recognized our proportionate share of the investee’s net loss in the Consolidated Statements of Operations
The increase in equity in net loss of an unconsolidated affiliate for fiscal 2016 compared to fiscal 2015 was due to recognition for the full year of fiscal 2016 versus only for the fourth quarter of fiscal 2015, the period in which we converted from cost to the equity method of accounting for this investment.
Liquidity and Capital Resources
The following sections discuss the effects of changes in our Consolidated Balance Sheets and the effects of our credit arrangements and contractual obligations on our liquidity and capital resources, our share repurchase program, as well as our non-GAAP measures.
We classify our marketable securities as short-term based on their nature and availability for use in current operations. Our cash equivalents and short-term marketable securities consist primarily of high quality, investment-grade securities.
We have historically financed our operating and capital resource requirements through cash flows from operations. Cash provided by or used in operating activities will fluctuate from period to period due to fluctuations in operating results, the timing and collection of accounts receivable, and required inventory levels, among other things.
We believe that our financial resources will be sufficient to meet our working capital needs through at least the next 12 months. As of December 31, 2016, we did not have significant long-term commitments for capital expenditures. In the future, and to the extent our Credit Agreement permits, we may continue to consider acquisition opportunities to further extend our product or technology portfolios and further expand our product offerings. In connection with funding capital expenditures, completing other acquisitions, securing additional wafer supply, or increasing our working capital, we may seek to obtain equity or additional debt financing, or advance purchase payments or similar arrangements with wafer manufacturers. We may also need to obtain equity or additional debt financing if we experience downturns or cyclical fluctuations in our business that are more severe or longer than we anticipated when determining our current working capital needs, which financing may now be more difficult to obtain in light of our indebtedness related to the Credit Agreement.
Liquidity
Cash and cash equivalents and Short-term marketable securities
(In thousands) | December 31, 2016 | January 2, 2016 | $ Change | ||||||||
Cash and cash equivalents | $ | 106,552 | $ | 84,606 | $ | 21,946 | |||||
Short-term marketable securities | 10,308 | 17,968 | (7,660 | ) | |||||||
Total Cash and cash equivalents and Short-term marketable securities | $ | 116,860 | $ | 102,574 | $ | 14,286 | |||||
As of December 31, 2016, we had total cash and cash equivalents and short-term marketable securities of $116.9 million, of which approximately $65.9 million in cash and cash equivalents was held by our foreign subsidiaries. We manage our global cash requirements considering (i) available funds among the subsidiaries through which we conduct business, (ii) the geographic location of our liquidity needs, and (iii) the cost to access international cash balances. The repatriation of non-U.S. earnings may have adverse tax consequences as we may be required to pay and record income tax expense on those funds to the extent they were previously considered permanently reinvested. As of December 31, 2016, we could access all cash held by our foreign subsidiaries without incurring significant additional expense.
42
The net increase in cash and cash equivalents and short-term investments of $14.3 million as compared to January 2, 2016, was primarily the result of $41.7 million of cash provided by operations and $2.0 million in proceeds received from the sale of the Qterics business unit, offset by $25.8 million of cash used in capital expenditures and payment for software licenses and $5.2 million of cash used in the repayment of debt.
Accounts receivable, net
(In thousands) | December 31, 2016 | January 2, 2016 | $Change | %Change | ||||||||||
Accounts receivable, net | $ | 99,637 | $ | 88,471 | $ | 11,166 | 12.6 | % | ||||||
Days sales outstanding - Overall | 77 | 80 | (3 | ) | ||||||||||
Days sales outstanding - Product | 75 | 70 | 5 | |||||||||||
Days sales outstanding - Licensing and services | 106 | 149 | (43 | ) | ||||||||||
Accounts receivable, net increased $11.2 million or 13% as of December 31, 2016 compared to January 2, 2016, due to an increase in shipments to certain distributors at the end of the current fiscal year as compared to the end of the prior fiscal year, partially offset by decreases in HDMI royalty audit settlements and IP license billings.
Overall days sales outstanding at December 31, 2016 was 77, a decrease of 3 days from 80 days at January 2, 2016. Days sales outstanding at December 31, 2016 related to Product revenue was 75, an increase of 5 days from 70 days at January 2, 2016. Days sales outstanding at December 31, 2016 related to Licensing and services revenue was 106 days, a decrease of 43 days from 149 days at January 2, 2016.
Inventories
(In thousands) | December 31, 2016 | January 3, 2015 | $Change | %Change | ||||||||||
Inventories | $ | 79,168 | $ | 75,896 | $ | 3,272 | 4.3 | % | ||||||
Months of inventory on hand | 4.3 | 4.8 | (0.5 | ) | ||||||||||
Inventory increased $3.3 million, or 4.3%, as of December 31, 2016 compared to January 2, 2016 primarily due to a net shift in demand for certain product lines. Inventory related to newer offerings increased approximately $15 million, which was offset by an approximately $10 million decrease in inventory related to older lines, plus an additional decrease in inventory value of approximately $1 million as production volumes in 2016 lowered overhead costs. Months of inventory on hand decreased to 4.3 months at the end of fiscal 2016 from 4.8 months at the end of fiscal 2015.
Credit Arrangements
On March 10, 2015, we entered into a secured credit agreement (the "Credit Agreement") with Jefferies Finance, LLC and certain other lenders for purposes of funding, in part, our acquisition of Silicon Image. The Credit Agreement provided for a $350 million term loan (the "Term Loan") maturing on March 10, 2021 (the "Term Loan Maturity Date"). We received $346.5 million, net of an original issue discount of $3.5 million and we paid debt issuance costs of $8.3 million. The Term Loan bears variable interest equal to the 6-month LIBOR, subject to a 1.00% floor, plus a spread of 4.25% as of December 31, 2016. The current effective interest rate on the Term Loan is 6.20%.
The Term Loan is payable through a combination of (i) quarterly installments of approximately $0.9 million which began on July 4, 2015, (ii) annual excess cash flow payments as defined in the Credit Agreement, which are due 95 days after the last day of our fiscal year, and (iii) any payments due upon certain issuances of additional indebtedness and certain asset dispositions, with any remaining outstanding principal amount due and payable on the Term Loan Maturity Date. The percentage of excess cash flow we are required to pay ranges from 0% to 75%, depending on our leverage and other factors as defined in the Credit Agreement. Currently, the Credit Agreement would require a 75% excess cash flow payment. In the second quarter of fiscal 2016, we made a required additional principal payment of $1.7 million due to the sale of Qterics.
Due to the combination of payments described above, our calculation of the current portion of long-term debt depends on activity that has occurred subsequent to December 31, 2016. Since our Earnings Release on February 15, 2017, we have entered into a patent monetization transaction that has triggered a $17.9 million increase to current portion of long-term debt presented in the Consolidated Balance Sheets. Over the next twelve months, we expect to be required to make principal payments of approximately $32.5 million, in addition to required quarterly payments.
While the Credit Agreement does not contain financial covenants, it does contain informational covenants and certain restrictive covenants, including limitations on liens, mergers and consolidations, sales of assets, payment of dividends, and indebtedness. We were in compliance with all such covenants at December 31, 2016.
43
As of December 31, 2016, we had no significant long-term purchase commitments for capital expenditures or existing used or unused credit arrangements.
Share Repurchase Program
On March 3, 2014, our Board of Directors approved a stock repurchase program pursuant to which up to $20.0 million of outstanding common stock could be repurchased from time to time. The duration of the repurchase program was twelve months. Under this program during fiscal 2014, approximately 1.9 million shares were repurchased for $13.1 million. The 2014 program completed during the first quarter of fiscal 2015, during which approximately 1.1 million shares were repurchased for approximately $7.0 million. All shares repurchased under the 2014 program were retired by the end of the fiscal year in which they were repurchased. All repurchases were open market transactions funded from available working capital.
Contractual Cash Obligations
The following table summarizes our contractual cash obligations at December 31, 2016:
(In thousands) | |||||||
Fiscal year | Operating leases (1) | Long-term Debt (2) | |||||
2017 | $ | 7,220 | $ | 55,056 | |||
2018 | 5,890 | 38,355 | |||||
2019 | 4,559 | 67,455 | |||||
2020 | 4,528 | 99,362 | |||||
2021 | 4,583 | 145,282 | |||||
Thereafter | 18,965 | — | |||||
$ | 45,745 | $ | 405,510 | ||||
(1) Certain of our facilities and equipment are leased under operating leases, which expire at various times through 2026.
(2) Cash payments due for long-term debt include estimated interest payments, which are based on outstanding principal amounts, currently effective interest rates as of December 31, 2016, timing of scheduled payments and the debt term. See Liquidity section of Item 7 for further discussion pertaining to our Credit Arrangements.
Our significant operating leases are for our facilities in Portland and Hillsboro, Oregon; San Jose, California; Muntinlupa City, Philippines; Shanghai, China, and Hyderabad, India. We also had a significant lease for a facility in Sunnyvale, California which was terminated in February 2017.
In November 2014, we entered into a lease for a new corporate headquarters facility in Portland, Oregon which expires in March 2025. Annual rental costs are estimated at $0.6 million with average annual increases of approximately 5%. We commenced operations at the new headquarters location in March 2015. In November 2014, we sold the property where our headquarters was formerly located in Hillsboro, Oregon for net proceeds of $14.6 million. We leased back the majority of this facility from November 2014 until March 2015, after which we leased a smaller portion of the facility until November 2022. Annual rental costs are estimated at $0.5 million with 3% annual increases.
Our lease in San Jose, California expires September 2026 with total annual rental costs estimated to be $2.2 million and annual increases of approximately 3%. Two of our leases in Muntinlupa City, Philippines expire in May 2025 and June 2025, with total annual rental costs estimated to be $0.7 million and annual increases of approximately 5%. The other two leases in this location expire in July 2017 and August 2018, with remaining rental costs estimated to be $0.1 million. Our lease in Shanghai expires in May 2018, with remaining rental costs estimated to be $2.6 million, and our lease in Hyderabad expires in December 2017, with remaining rental costs estimated to be $0.3 million. Leasehold improvements are amortized over the shorter of the non-cancelable lease term or the estimated useful life of the assets.
44
New Accounting Pronouncements
The information contained under the heading "New Accounting Pronouncements" in Note 1 - Nature of Operations and Significant Accounting Policies to our Consolidated Financial Statements in Part II, Item 8 is incorporated by reference into this Part II, Item 7.
Off-Balance Sheet Arrangements
As of December 31, 2016, we did not have any off-balance sheet arrangements, as defined in Item 303(a)(4)(ii) of SEC Regulation S-K.
Non-GAAP Financial Measures
To supplement our consolidated financial results presented in accordance with U.S. Generally Accepted Accounting Principles ("GAAP"), we also present non-GAAP financial measures which are adjusted from the most directly comparable U.S. GAAP financial measures. The non-GAAP measures set forth below exclude charges and adjustments primarily related to stock-based compensation, restructuring charges, acquisition-related charges, amortization of acquired intangible assets, purchase accounting adjustments, impairment of goodwill and intangible assets, gain on the sale of a business unit, and the estimated tax effect of these items. These charges and adjustments may be nonrecurring in nature but are a result of periodic or non-core operating activities of the company.
Management believes that these non-GAAP financial measures provide an additional and useful way of viewing aspects of our performance that, when viewed in conjunction with our U.S. GAAP results, provide a more comprehensive understanding of the various factors and trends affecting our ongoing financial performance and operating results than GAAP measures alone. In particular, investors may find the non-GAAP measures useful in reviewing our operating performance without the significant accounting charges resulting from the Silicon Image acquisition, alongside the comparably adjusted prior year results. Management also uses these non-GAAP measures for strategic and business decision-making, internal budgeting, forecasting, and resource allocation processes and believes that investors should have access to similar data when making their investment decisions. In addition, these non-GAAP financial measures facilitate management’s internal comparisons to our historical operating results and comparisons to competitors’ operating results.
These non-GAAP measures are included solely for informational and comparative purposes and are not meant as a substitute for GAAP and should be considered together with the consolidated financial information located in this report. Pursuant to the requirements of Regulation S-K and to make clear to our investors the adjustments we make to U.S. GAAP measures, we have provided the following reconciliations of the non-GAAP measures to the most directly comparable U.S. GAAP financial measures.
45
Reconciliation of U.S. GAAP to Non-GAAP Financial Measures
(In thousands, except per share amounts) | Year Ended | ||||||||||
(unaudited) | December 31, 2016 | January 2, 2016 | January 3, 2015 | ||||||||
Revenue Reconciliation | |||||||||||
GAAP Revenue | $ | 427,054 | $ | 405,966 | $ | 366,127 | |||||
Acquisition related deferred revenue effect (1) | — | 5,187 | — | ||||||||
Non-GAAP Revenue | $ | 427,054 | $ | 411,153 | $ | 366,127 | |||||
Gross Margin Reconciliation | |||||||||||
GAAP Gross margin | $ | 246,434 | $ | 219,909 | $ | 206,187 | |||||
Acquisition related net deferred revenue effect (1) (2) | — | 3,691 | — | ||||||||
Acquisition related inventory fair value effect (3) | 523 | 6,078 | — | ||||||||
Stock-based compensation expense - gross margin | 888 | 1,416 | 819 | ||||||||
Non-GAAP Gross margin | $ | 247,845 | $ | 231,094 | $ | 207,006 | |||||
Gross Margin % Reconciliation | |||||||||||
GAAP Gross margin % | 57.7 | % | 54.2 | % | 56.3 | % | |||||
Cumulative effect of non-GAAP Gross Margin adjustments | 0.3 | % | 2.0 | % | 0.2 | % | |||||
Non-GAAP Gross margin % | 58.0 | % | 56.2 | % | 56.5 | % | |||||
Operating Expenses Reconciliation | |||||||||||
GAAP Operating expenses | $ | 273,133 | $ | 327,141 | $ | 164,571 | |||||
Amortization of acquired intangible assets | (33,575 | ) | (29,580 | ) | (2,948 | ) | |||||
Restructuring charges | (9,267 | ) | (19,239 | ) | (17 | ) | |||||
Acquisition related charges (4) | (6,305 | ) | (22,450 | ) | — | ||||||
Impairment of goodwill and intangible assets | (7,866 | ) | (21,655 | ) | — | ||||||
Stock-based compensation expense - operations | (15,325 | ) | (15,934 | ) | (11,983 | ) | |||||
Non-GAAP Operating expenses | $ | 200,795 | $ | 218,283 | $ | 149,623 | |||||
(Loss) Income from Operations Reconciliation | |||||||||||
GAAP (Loss) income from operations | $ | (26,699 | ) | $ | (107,232 | ) | $ | 41,616 | |||
Acquisition related net deferred revenue effect (1) (2) | — | 3,691 | — | ||||||||
Acquisition related inventory fair value effect (3) | 523 | 6,078 | — | ||||||||
Stock-based compensation expense - gross margin | 888 | 1,416 | 819 | ||||||||
Amortization of acquired intangible assets | 33,575 | 29,580 | 2,948 | ||||||||
Restructuring charges | 9,267 | 19,239 | 17 | ||||||||
Acquisition related charges (4) | 6,305 | 22,450 | — | ||||||||
Impairment of goodwill and intangible assets | 7,866 | 21,655 | — | ||||||||
Stock-based compensation expense - operations | 15,325 | 15,934 | 11,983 | ||||||||
Non-GAAP Income from operations | $ | 47,050 | $ | 12,811 | $ | 57,383 | |||||
(1) Fair value adjustment to deferred revenue from purchase accounting | |||||||||||
(2) Fair value adjustment to deferred cost of sales from purchase accounting | |||||||||||
(3) Fair value adjustment for inventory step-up from purchase accounting | |||||||||||
(4) Includes stock-based compensation and severance costs related to change in control | |||||||||||
46
Reconciliation of U.S. GAAP to Non-GAAP Financial Measures | |||||||||||
(In thousands, except per share amounts) | Year Ended | ||||||||||
(unaudited) | December 31, 2016 | January 2, 2016 | January 3, 2015 | ||||||||
(Loss) Income from Operations % Reconciliation | |||||||||||
GAAP (Loss) income from operations % | (6.3 | )% | (26.4 | )% | 11.4 | % | |||||
Cumulative effect of non-GAAP Gross Margin and Operating adjustments | 17.3 | % | 29.5 | % | 4.3 | % | |||||
Non-GAAP Income from operations % | 11.0 | % | 3.1 | % | 15.7 | % | |||||
Income Tax Expense Reconciliation | |||||||||||
GAAP Income tax expense (benefit) | $ | 9,917 | $ | 32,540 | $ | (5,639 | ) | ||||
Estimated tax effect of non-GAAP adjustments (5) | — | (21,030 | ) | 7,238 | |||||||
Non-GAAP Income tax expense | $ | 9,917 | $ | 11,510 | $ | 1,599 | |||||
Net (Loss) Income Reconciliation | |||||||||||
GAAP Net (loss) income | $ | (54,099 | ) | $ | (159,233 | ) | $ | 48,580 | |||
Acquisition related net deferred revenue effect (1) (2) | — | 3,691 | — | ||||||||
Acquisition related inventory fair value effect (3) | 523 | 6,078 | — | ||||||||
Stock-based compensation expense - gross margin | 888 | 1,416 | 819 | ||||||||
Amortization of acquired intangible assets | 33,575 | 29,580 | 2,948 | ||||||||
Restructuring charges | 9,267 | 19,239 | 17 | ||||||||
Acquisition related charges (4) | 6,305 | 22,450 | — | ||||||||
Impairment of goodwill and intangible assets | 7,866 | 21,655 | — | ||||||||
Stock-based compensation expense - operating expense | 15,325 | 15,934 | 11,983 | ||||||||
Gain on sale of Qterics | (2,646 | ) | — | — | |||||||
Estimated tax effect of non-GAAP adjustments (5) | — | 21,030 | (7,238 | ) | |||||||
Non-GAAP Net income (loss) | $ | 17,004 | $ | (18,160 | ) | $ | 57,109 | ||||
(1) Fair value adjustment to deferred revenue from purchase accounting | |||||||||||
(2) Fair value adjustment to deferred cost of sales from purchase accounting | |||||||||||
(3) Fair value adjustment for inventory step-up from purchase accounting | |||||||||||
(4) Includes stock-based compensation and severance costs related to change in control | |||||||||||
(5) During the second quarter of fiscal 2016, we refined our calculation of non-GAAP tax expense by applying our tax | |||||||||||
provision model to year-to-date and projected income after adjusting for non-GAAP items. The difference between | |||||||||||
calculated values for GAAP and non-GAAP tax expense has been included as the “Estimated tax effect of | |||||||||||
non-GAAP adjustments.” Prior periods have been similarly recalculated to conform to the current presentation. | |||||||||||
47
Reconciliation of U.S. GAAP to Non-GAAP Financial Measures | |||||||||||
(In thousands, except per share amounts) | Year Ended | ||||||||||
(unaudited) | December 31, 2016 | January 2, 2016 | January 3, 2015 | ||||||||
Basic Net (Loss) Income Per Share Reconciliation | |||||||||||
GAAP Net (loss) income per share - basic | $ | (0.45 | ) | $ | (1.36 | ) | $ | 0.41 | |||
Cumulative effect of Non-GAAP adjustments | 0.59 | 1.21 | 0.08 | ||||||||
Non-GAAP Net income (loss) per share - basic | $ | 0.14 | $ | (0.15 | ) | $ | 0.49 | ||||
Diluted Net (Loss) Income Per Share Reconciliation | |||||||||||
GAAP Net (loss) income per share - diluted | $ | (0.45 | ) | $ | (1.36 | ) | $ | 0.40 | |||
Cumulative effect of Non-GAAP adjustments | 0.59 | 1.21 | 0.07 | ||||||||
Non-GAAP Net income (loss) per share - diluted | $ | 0.14 | $ | (0.15 | ) | $ | 0.47 | ||||
Shares used in per share calculations: | |||||||||||
Basic | 119,994 | 117,387 | 117,708 | ||||||||
Diluted - GAAP (6) | 119,994 | 117,387 | 120,245 | ||||||||
Diluted - non-GAAP (6) | 121,957 | 117,387 | 120,245 | ||||||||
(6) Diluted shares are calculated using the GAAP treasury stock method. In a loss position, diluted shares equal basic shares. | |||||||||||
Item 7A. Quantitative and Qualitative Disclosures About Market Risk
Foreign Currency Exchange Rate Risk
A portion of our silicon wafer and other purchases were historically denominated in Japanese yen, we billed our Japanese customers in yen, and we continue to collect a Japanese consumption tax refund in yen. As a result of this, as well as having various international subsidiary and branch operations, our financial position and results of operations are subject to foreign currency exchange rate risk.
We mitigate the resulting foreign currency exchange rate exposure by entering into foreign currency forward exchange contracts. Although these hedges mitigate our foreign currency exchange rate exposure from an economic perspective, they were not designated as "effective" hedges under U.S. GAAP and as such are adjusted to fair value through Other (expense) income, net. We do not engage in speculative trading in any financial or capital market.
At December 31, 2016 and January 2, 2016, we had forward contracts for Japanese yen of $2.3 million and $3.3 million, respectively. The net fair value of these contracts was favorable by approximately $0.2 million at December 31, 2016 and unfavorable by less than $0.1 million at January 2, 2016. A hypothetical 10% unfavorable exchange rate change in the yen against the U.S. dollar would have resulted in an unfavorable change in net fair value of $0.2 million and $0.4 million at December 31, 2016 and January 2, 2016, respectively. Changes in fair value resulting from foreign exchange rate fluctuations would be substantially offset by the change in value of the underlying hedged transactions.
Interest Rate Risk
At December 31, 2016, we had $342.2 million outstanding on the $350.0 million gross term loan outstanding under our Credit Agreement, with a variable contractual interest rate based on the LIBOR, subject to a 1.00% floor, plus a spread of 4.25%. A hypothetical 10% increase in the LIBOR would not have increased the LIBOR above this 1.00% floor used in the interest rate calculation, and thus would not have had an impact on Interest expense for the twelve month period ended December 31, 2016.
48
Item 8. Financial Statements and Supplementary Data
Index to Consolidated Financial Statements
Page | |
Consolidated Financial Statements: | |
49
LATTICE SEMICONDUCTOR CORPORATION
CONSOLIDATED BALANCE SHEETS
(In thousands, except share and par value data) | December 31, 2016 | January 2, 2016 | |||||
ASSETS | |||||||
Current assets: | |||||||
Cash and cash equivalents | $ | 106,552 | $ | 84,606 | |||
Short-term marketable securities | 10,308 | 17,968 | |||||
Accounts receivable, net of allowance for doubtful accounts | 99,637 | 88,471 | |||||
Inventories | 79,168 | 75,896 | |||||
Prepaid expenses and other current assets | 19,035 | 18,922 | |||||
Total current assets | 314,700 | 285,863 | |||||
Property and equipment, less accumulated depreciation of $134,786 at December 31, 2016 and $118,943 at January 2, 2016 | 49,481 | 51,852 | |||||
Intangible assets, net of amortization | 118,863 | 162,583 | |||||
Goodwill | 269,758 | 267,549 | |||||
Deferred income taxes | 372 | 578 | |||||
Other long-term assets | 13,709 | 17,495 | |||||
Total assets | $ | 766,883 | $ | 785,920 | |||
LIABILITIES AND STOCKHOLDERS' EQUITY | |||||||
Current liabilities: | |||||||
Accounts payable and accrued expenses (includes restructuring) | $ | 80,933 | $ | 74,298 | |||
Accrued payroll obligations | 9,865 | 9,463 | |||||
Current portion of long-term debt | 33,767 | 7,557 | |||||
Deferred income and allowances on sales to sell-through distributors | 32,257 | 17,866 | |||||
Deferred licensing and services revenue | 728 | 1,993 | |||||
Total current liabilities | 157,550 | 111,177 | |||||
Long-term debt | 300,855 | 330,870 | |||||
Other long-term liabilities | 38,048 | 38,353 | |||||
Total liabilities | 496,453 | 480,400 | |||||
Commitments and contingencies (Notes 13 and 20) | — | — | |||||
Stockholders' equity: | |||||||
Preferred stock, $.01 par value, 10,000,000 shares authorized, none issued and outstanding | — | — | |||||
Common stock, $.01 par value, 300,000,000 shares authorized; 121,645,000 shares issued and outstanding as of December 31, 2016 and 118,651,000 shares issued and outstanding as of January 2, 2016 | 1,216 | 1,187 | |||||
Additional paid-in capital | 680,315 | 660,089 | |||||
Accumulated deficit | (406,945 | ) | (352,846 | ) | |||
Accumulated other comprehensive loss | (4,156 | ) | (2,910 | ) | |||
Total stockholders' equity | 270,430 | 305,520 | |||||
Total liabilities and stockholders' equity | $ | 766,883 | $ | 785,920 | |||
The accompanying notes are an integral part of these Consolidated Financial Statements.
50
LATTICE SEMICONDUCTOR CORPORATION
CONSOLIDATED STATEMENTS OF OPERATIONS
Year Ended | ||||||||||||
(In thousands, except per share data) | December 31, 2016 | January 2, 2016 | January 3, 2015 | |||||||||
Revenue: | ||||||||||||
Product | $ | 390,704 | $ | 369,200 | $ | 366,127 | ||||||
Licensing and services | 36,350 | 36,766 | — | |||||||||
Total revenue | 427,054 | 405,966 | 366,127 | |||||||||
Costs and expenses: | ||||||||||||
Cost of product revenue | 179,983 | 184,914 | 159,940 | |||||||||
Cost of licensing and services revenue | 637 | 1,143 | — | |||||||||
Research and development | 117,518 | 136,868 | 88,079 | |||||||||
Selling, general, and administrative | 98,602 | 97,349 | 73,527 | |||||||||
Amortization of acquired intangible assets | 33,575 | 29,580 | 2,948 | |||||||||
Restructuring charges | 9,267 | 19,239 | 17 | |||||||||
Acquisition related charges | 6,305 | 22,450 | — | |||||||||
Impairment of goodwill and intangible assets | 7,866 | 21,655 | — | |||||||||
453,753 | 513,198 | 324,511 | ||||||||||
(Loss) income from operations | (26,699 | ) | (107,232 | ) | 41,616 | |||||||
Interest expense | (20,327 | ) | (18,389 | ) | (172 | ) | ||||||
Other income (expense), net | 4,303 | (580 | ) | 1,497 | ||||||||
(Loss) income before income taxes and equity in net loss of an unconsolidated affiliate | (42,723 | ) | (126,201 | ) | 42,941 | |||||||
Income tax expense (benefit) | 9,917 | 32,540 | (5,639 | ) | ||||||||
Equity in net loss of an unconsolidated affiliate, net of tax | (1,459 | ) | (492 | ) | — | |||||||
Net (loss) income | $ | (54,099 | ) | $ | (159,233 | ) | $ | 48,580 | ||||
Net (loss) income per share | ||||||||||||
Basic | $ | (0.45 | ) | $ | (1.36 | ) | $ | 0.41 | ||||
Diluted | $ | (0.45 | ) | $ | (1.36 | ) | $ | 0.40 | ||||
Shares used in per share calculations: | ||||||||||||
Basic | 119,994 | 117,387 | 117,708 | |||||||||
Diluted | 119,994 | 117,387 | 120,245 | |||||||||
The accompanying notes are an integral part of these Consolidated Financial Statements
51
LATTICE SEMICONDUCTOR CORPORATION
CONSOLIDATED STATEMENTS OF COMPREHENSIVE (LOSS) INCOME
Year Ended | ||||||||||||
(In thousands) | December 31, 2016 | January 2, 2016 | January 3, 2015 | |||||||||
Net (loss) income | $ | (54,099 | ) | $ | (159,233 | ) | $ | 48,580 | ||||
Other comprehensive (loss) income: | ||||||||||||
Unrealized loss related to marketable securities, net of tax | (172 | ) | (69 | ) | (373 | ) | ||||||
Reclassification adjustment for losses related to marketable securities included in other income (expense) | 79 | 442 | 170 | |||||||||
Realized gain on sale of auction rate securities, previously unrealized, net of tax | — | — | (1,147 | ) | ||||||||
Translation adjustment loss, net of tax | (1,303 | ) | (1,243 | ) | (330 | ) | ||||||
Change in actuarial valuation of defined benefit pension | 150 | (156 | ) | (59 | ) | |||||||
Comprehensive (loss) income | $ | (55,345 | ) | $ | (160,259 | ) | $ | 46,841 | ||||
The accompanying notes are an integral part of these Consolidated Financial Statements
52
LATTICE SEMICONDUCTOR CORPORATION
CONSOLIDATED STATEMENTS OF STOCKHOLDERS' EQUITY
Common Stock ($.01 par value) | Paid-in capital | Treasury stock | Accumulated deficit | Accumulated other comprehensive loss | ||||||||||||||||||||||
(In thousands, except par value data) | Shares | Amount | Total | |||||||||||||||||||||||
Balances, December 28, 2013 | 115,671 | $ | 1,157 | $ | 626,861 | $ | — | $ | (242,193 | ) | $ | (145 | ) | $ | 385,680 | |||||||||||
Net income for 2014 | — | — | — | — | 48,580 | 48,580 | ||||||||||||||||||||
Unrealized loss related to marketable securities, net of tax | — | — | — | — | — | (373 | ) | (373 | ) | |||||||||||||||||
Realized gain on sale of auction rate securities, previously unrealized, net of tax | — | — | — | — | — | (1,147 | ) | (1,147 | ) | |||||||||||||||||
Recognized loss on redemption of marketable securities, previously unrealized | — | — | — | — | — | 170 | 170 | |||||||||||||||||||
Translation adjustments, net of tax | — | — | — | — | — | (330 | ) | (330 | ) | |||||||||||||||||
Common stock issued in connection with the exercise of stock options, ESPP and vested RSUs, net of tax | 3,560 | 35 | 8,706 | — | — | — | 8,741 | |||||||||||||||||||
Stock repurchase | — | — | — | (13,089 | ) | — | — | (13,089 | ) | |||||||||||||||||
Retirement of treasury stock | (1,943 | ) | (19 | ) | (13,070 | ) | 13,089 | — | — | — | ||||||||||||||||
Stock-based compensation expense related to options, ESPP and RSUs | — | — | 12,802 | — | — | — | 12,802 | |||||||||||||||||||
Change in actuarial valuation of defined benefit pension | — | — | — | — | — | (59 | ) | (59 | ) | |||||||||||||||||
Balance, January 3, 2015 | 117,288 | $ | 1,173 | $ | 635,299 | $ | — | $ | (193,613 | ) | $ | (1,884 | ) | $ | 440,975 | |||||||||||
Net loss for 2015 | — | — | — | — | (159,233 | ) | — | (159,233 | ) | |||||||||||||||||
Unrealized loss related to marketable securities, net of tax | — | — | — | — | — | (69 | ) | (69 | ) | |||||||||||||||||
Recognized loss on redemption of marketable securities, previously unrealized | — | — | — | — | — | 442 | 442 | |||||||||||||||||||
Translation adjustments, net of tax | — | — | — | — | — | (1,243 | ) | (1,243 | ) | |||||||||||||||||
Common stock issued in connection with the exercise of stock options, ESPP and vested RSUs, net of tax | 2,415 | 25 | 2,161 | — | — | — | 2,186 | |||||||||||||||||||
Stock repurchase | — | — | — | (6,970 | ) | — | — | (6,970 | ) | |||||||||||||||||
Retirement of treasury stock | (1,052 | ) | (11 | ) | (6,959 | ) | 6,970 | — | — | — | ||||||||||||||||
Stock-based compensation expense related to options, ESPP and RSUs | — | — | 18,396 | — | — | — | 18,396 | |||||||||||||||||||
Fair value of partially vested stock options and RSUs assumed in acquisition | — | — | 5,139 | — | — | — | 5,139 | |||||||||||||||||||
Change in actuarial valuation of defined benefit pension | — | — | — | — | — | (156 | ) | (156 | ) | |||||||||||||||||
Redemption of noncontrolling interest, net of previous accretion to redemption value. | — | — | 6,053 | — | — | — | 6,053 | |||||||||||||||||||
Balance, January 2, 2016 | 118,651 | $ | 1,187 | $ | 660,089 | $ | — | $ | (352,846 | ) | $ | (2,910 | ) | $ | 305,520 | |||||||||||
Net loss for 2016 | — | — | — | — | (54,099 | ) | — | (54,099 | ) | |||||||||||||||||
Unrealized loss related to marketable securities, net of tax | — | — | — | — | — | (172 | ) | (172 | ) | |||||||||||||||||
Recognized gain on redemption of marketable securities, previously unrealized | — | — | — | — | — | 79 | 79 | |||||||||||||||||||
Translation adjustments, net of tax | — | — | — | — | — | (1,303 | ) | (1,303 | ) | |||||||||||||||||
Common stock issued in connection with the exercise of stock options, ESPP and vested RSUs, net of tax | 2,994 | 29 | 4,013 | — | — | — | 4,042 | |||||||||||||||||||
Stock-based compensation expense related to stock options, ESPP and RSUs | — | — | 16,213 | — | — | — | 16,213 | |||||||||||||||||||
Change in actuarial valuation of defined benefit pension | — | — | — | — | — | 150 | 150 | |||||||||||||||||||
Balances as of December 31, 2016 | 121,645 | $ | 1,216 | $ | 680,315 | $ | — | $ | (406,945 | ) | $ | (4,156 | ) | $ | 270,430 | |||||||||||
The accompanying notes are an integral part of these Consolidated Financial Statements
53
LATTICE SEMICONDUCTOR CORPORATION
CONSOLIDATED STATEMENTS OF CASH FLOWS
Year Ended | |||||||||||
(In thousands) | December 31, 2016 | January 2, 2016 | January 3, 2015 | ||||||||
Cash flows from operating activities: | |||||||||||
Net (loss) income | $ | (54,099 | ) | $ | (159,233 | ) | $ | 48,580 | |||
Adjustments to reconcile net (loss) income to net cash (used in) provided by operating activities: | |||||||||||
Depreciation and amortization | 61,806 | 60,808 | 22,248 | ||||||||
Impairment of goodwill and intangible assets | 7,866 | 21,655 | — | ||||||||
Amortization of debt issuance costs and discount | 1,350 | 2,835 | — | ||||||||
Change in deferred income tax provision | 90 | 21,367 | (7,222 | ) | |||||||
Loss (gain) on sale or maturity of marketable securities | 79 | 333 | (1,698 | ) | |||||||
Gain on forward contracts | (184 | ) | — | — | |||||||
Stock-based compensation expense | 16,213 | 18,396 | 12,802 | ||||||||
Loss on disposal of fixed assets | 597 | — | — | ||||||||
Gain on sale of business unit | (2,646 | ) | — | — | |||||||
Equity in net loss of an unconsolidated affiliate, net of tax | 1,459 | 492 | — | ||||||||
Changes in assets and liabilities: | |||||||||||
Accounts receivable, net | (11,419 | ) | 4,578 | (12,287 | ) | ||||||
Inventories | (3,272 | ) | 9,868 | (18,703 | ) | ||||||
Prepaid expenses and other assets | (2,270 | ) | (6,710 | ) | (3,200 | ) | |||||
Accounts payable and accrued expenses (includes restructuring) | 8,338 | 6,301 | (7,819 | ) | |||||||
Accrued payroll obligations | 402 | (10,202 | ) | (30 | ) | ||||||
Income taxes payable | 3,216 | 1,749 | — | ||||||||
Deferred income and allowances on sales to sell-through distributors | 14,391 | 2,920 | 7,451 | ||||||||
Deferred licensing and services revenue | (183 | ) | 1,958 | — | |||||||
Net cash (used in) provided by operating activities | 41,734 | (22,885 | ) | 40,122 | |||||||
Cash flows from investing activities: | |||||||||||
Proceeds from sales of and maturities of marketable securities | 14,897 | 142,956 | 101,861 | ||||||||
Purchase of marketable securities, net | (7,490 | ) | (15,982 | ) | (139,792 | ) | |||||
Proceeds from sale of auction rate securities | — | — | 5,488 | ||||||||
Cash paid for business acquisition, net of cash acquired | — | (431,068 | ) | — | |||||||
Proceeds from sale of land and building | — | — | 14,625 | ||||||||
Capital expenditures | (16,717 | ) | (18,209 | ) | (10,267 | ) | |||||
Proceeds from sale of business unit, net of cash sold | 1,972 | — | — | ||||||||
Cash paid for a non-marketable equity-method investment | (1,000 | ) | (5,000 | ) | — | ||||||
Cash paid for software licenses | (9,035 | ) | (9,515 | ) | (6,059 | ) | |||||
Net cash used in investing activities | (17,373 | ) | (336,818 | ) | (34,144 | ) | |||||
Cash flows from financing activities: | |||||||||||
Proceeds from issuance of restricted stock units, net of withholding taxes | (3,565 | ) | (3,493 | ) | (3,427 | ) | |||||
Purchase of treasury stock | — | (6,970 | ) | (13,089 | ) | ||||||
Net proceeds from issuance of common stock | 7,607 | 5,679 | 12,168 | ||||||||
Net proceeds from issuance of long-term debt | — | 346,500 | — | ||||||||
Cash paid for debt issuance costs | — | (8,283 | ) | — | |||||||
Repayment of debt | (5,154 | ) | (2,625 | ) | — | ||||||
Cash paid to redeem noncontrolling interest | — | (867 | ) | — | |||||||
Net cash provided by (used in) financing activities | $ | (1,112 | ) | $ | 329,941 | $ | (4,348 | ) | |||
The accompanying notes are an integral part of these Consolidated Financial Statements | |||||||||||
54
LATTICE SEMICONDUCTOR CORPORATION | |||||||||||
CONSOLIDATED STATEMENTS OF CASH FLOWS (continued) | |||||||||||
Year Ended | |||||||||||
(In thousands) | December 31, 2016 | January 2, 2016 | January 3, 2015 | ||||||||
Effect of exchange rate change on cash | $ | (1,303 | ) | $ | (1,243 | ) | $ | (329 | ) | ||
Net (decrease) increase in cash and cash equivalents | 21,946 | (31,005 | ) | 1,301 | |||||||
Beginning cash and cash equivalents | 84,606 | 115,611 | 114,310 | ||||||||
Ending cash and cash equivalents | $ | 106,552 | $ | 84,606 | $ | 115,611 | |||||
Supplemental cash flow information: | |||||||||||
Change in unrealized loss related to marketable securities, net of tax, included in Accumulated other comprehensive loss | $ | 172 | $ | 69 | $ | 373 | |||||
Income taxes paid, net of refunds | $ | 9,359 | $ | 8,339 | $ | 1,599 | |||||
Interest paid | $ | 18,159 | $ | 11,071 | $ | — | |||||
Accrued purchases of property and equipment | $ | 1,028 | $ | 1,277 | $ | 478 | |||||
Transfer of residual temporary equity to additional paid-in capital on redemption of noncontrolling interest | $ | — | $ | 6,773 | $ | — | |||||
The accompanying notes are an integral part of these Consolidated Financial Statements
55
LATTICE SEMICONDUCTOR CORPORATION
NOTES TO CONSOLIDATED FINANCIAL STATEMENTS
Note 1 - Nature of Operations and Significant Accounting Policies
Nature of Operations
Lattice Semiconductor (“Lattice,” the “Company,” “we,” “us,” or “our”) is a Delaware company that engages in smart connectivity solutions, providing intellectual property and low-power, small form-factor devices that enable global customers to quickly deliver innovative and differentiated cost and power efficient products. The Company's broad end-market exposure extends from mobile and consumer electronics to industrial and automotive equipment, communications and computing infrastructure, and licensing.
We do not manufacture our own silicon wafers. We maintain strategic relationships with large semiconductor foundries located in Asia to source our finished silicon wafers. In addition, all of our assembly operations and most of our test and logistics operations are performed by outside suppliers located in Asia. We perform certain test operations and reliability and quality assurance processes internally.
We place substantial emphasis on new product development and believe that continued investment in this area is required to maintain and improve our competitive position. Our product development activities emphasize new proprietary products, advanced packaging, enhancement of existing products and process technologies, and improvement of software development tools. Research and development activities occur primarily in: Hillsboro, Oregon; San Jose and Sunnyvale, California; Shanghai, China; Alabang, Philippines; and Hyderabad, India.
Fiscal Reporting Period
We report based on a 52 or 53-week fiscal year ending on the Saturday closest to December 31. Our fiscal 2016 and 2015 were 52-week years that ended December 31, 2016 and January 2, 2016, respectively. Our fiscal 2014 was a 53-week year, with a 14-week fourth quarter, that ended January 3, 2015. Our fiscal 2017 will be a 52-week year and will end on December 30, 2017. All references to quarterly or yearly financial results are references to the results for the relevant fiscal period.
Principles of Consolidation and Presentation
The accompanying Consolidated Financial Statements include the accounts of Lattice and its subsidiaries after the elimination of all intercompany balances and transactions. Our results for the year ended January 2, 2016 include the results of Silicon Image, Inc. ("Silicon Image") for the approximately 10-month period from March 11, 2015 through January 2, 2016. Results presented for periods prior to fiscal 2015 are those historically reported for Lattice only. Our results for the year ended December 31, 2016 fully include the results of Silicon Image. Certain balances in prior fiscal years have been reclassified to conform to the presentation adopted in the current year. Net loss attributable to noncontrolling interest amounting to approximately $0.3 million that was reported separately for the year ended January 2, 2016 is now included in Other income (expense), net.
Use of Estimates
The preparation of financial statements in conformity with U.S. generally accepted accounting principles ("U.S. GAAP") requires management to make estimates and assumptions that affect the reported amounts and classification of assets, such as marketable securities, accounts receivable, inventory, goodwill (including the assessment of reporting unit), intangible assets, current and deferred income taxes, accrued liabilities (including restructuring charges and bonus arrangements), deferred income and allowances on sales to sell-through distributors, disclosure of contingent assets and liabilities at the date of the financial statements, amounts used in acquisition valuations and purchase accounting, and the reported amounts of product revenue, licensing and services revenue, and expenses during the fiscal periods presented. Actual results could differ from those estimates.
Cash Equivalents and Marketable Securities
We consider all investments that are readily convertible into cash and have original maturities of three months or less, to be cash equivalents. Cash equivalents consist primarily of highly liquid investments in time deposits or money market accounts and are carried at cost. We account for marketable securities as available-for-sale investments, as defined by U.S. GAAP, and record unrealized gains or losses to Accumulated other comprehensive loss on our Consolidated Balance Sheets, unless losses are considered other than temporary, in which case, those are recorded directly to the Consolidated Statements of Operations and Statements of Comprehensive (Loss) Income. Deposits with financial institutions at times exceed Federal Deposit Insurance Corporation insurance limits.
56
Fair Value of Financial Instruments
We invest in various financial instruments, which may include corporate and government bonds, notes, and commercial paper. We were also invested in auction rate securities until June 2014. We value these instruments at their fair value and monitor our portfolio for impairment on a periodic basis. In the event that the carrying value of an investment exceeds its fair value and the decline in value is determined to be other than temporary, we would record an impairment charge and establish a new carrying value. We assess other-than-temporary impairment of marketable securities in accordance with Financial Accounting Standards Board (“FASB”) Accounting Standards Codification (“ASC”) 820, “Fair Value Measurements and Disclosures.” The framework under the provisions of ASC 820 establishes three levels of inputs that may be used to measure fair value. Each level of input has different levels of subjectivity and difficulty involved in determining fair value.
Level 1 instruments generally represent quoted prices for identical assets or liabilities in active markets. Therefore, determining fair value for Level 1 instruments generally does not require significant management judgment, and the estimation is not difficult. Our Level 1 instruments consist of U.S. Government agency, corporate notes and bonds, and commercial paper that are traded in active markets and are classified as Short-term marketable securities on our Consolidated Balance Sheets.
Level 2 instruments include inputs other than Level 1 that are observable, either directly or indirectly, such as quoted prices for similar assets or liabilities, quoted prices for identical instruments in markets that are not active, or other inputs that are observable or can be corroborated by observable market data for substantially the full term of the assets or liabilities. Our Level 2 instruments consist of certificates of deposit and foreign currency exchange contracts, entered into to hedge against fluctuation in the Japanese yen.
Level 3 instruments include unobservable inputs that are supported by little or no market activity and that are significant to the fair value of the assets or liabilities. As a result, the determination of fair value for Level 3 instruments requires significant management judgment and subjectivity. During fiscal 2014 we sold all of our Level 3 instruments, which had been entirely made up of auction rate securities consisting of student loan asset-backed notes. These were classified as Long-term marketable securities on our Consolidated Balance Sheets, and management derived the fair value of the auction rate securities from a combination of market and income approaches, including third party valuation results, investment broker-provided market information, and available information on the credit quality of the underlying collateral.
Foreign Exchange and Translation of Foreign Currencies
While our revenues and the majority of our expenses are denominated in U.S. dollars, we have international subsidiary and branch operations that conduct some transactions in foreign currencies. In addition, a portion of our silicon wafer and other purchases were historically denominated in Japanese yen, we billed certain Japanese customers in yen, and we continue to collect a Japanese consumption tax refund in yen. Gains or losses from foreign exchange rate fluctuations on balances denominated in foreign currencies are reflected in Other (expense) income, net. Realized and unrealized gains or losses on foreign currency transactions were not significant for the periods presented. We translate accounts denominated in foreign currencies in accordance with ASC 830, “Foreign Currency Matters,” using the current rate method under which asset and liability accounts are translated at the current rate, while stockholders' equity accounts are translated at the appropriate historical rates, and revenue and expense accounts are translated at average monthly exchange rates. Translation adjustments related to the consolidation of foreign subsidiary financial statements are reflected in Accumulated other comprehensive loss in Stockholders' equity.
Derivative Financial Instruments
We mitigate foreign currency exchange rate risk by entering into foreign currency forward exchange contracts. At December 31, 2016 and January 2, 2016, we had open contracts for Japanese yen of $2.3 million and $3.3 million, respectively. The two contract outstanding at December 31, 2016 will settle in June 2017. Of the six contracts outstanding at January 2, 2016, two settled in January 2016 and the other four contracts settled in June 2016. Although such hedges mitigate our foreign currency exchange rate exposure from an economic perspective they were not designated as "effective" hedges for accounting purposes and are adjusted to fair value through Other (expense) income, net, with a gain of approximately $0.2 million and a loss of less than $0.1 million for the years ended December 31, 2016 and January 2, 2016, respectively.
Concentration Risk
Potential exposure to concentration risk may impact revenue, trade receivables, marketable securities, and supply of wafers for our new products.
Customer concentration risk may impact revenue. For fiscal years 2016, 2015, and 2014, our top five end customers constituted approximately 27%, 32%, and 45%, respectively, of our revenue. Our largest end customer in fiscal year 2016 accounted for 9.9% of total revenue. Our largest end customer in fiscal year 2015 accounted for 9.3% of total revenue, and our two largest end customers in fiscal year 2014 accounted for 19.1% and 12.3%, respectively, of total revenue.
57
Sales through distributors have historically accounted for a significant portion of our total revenue. For fiscal year 2016, revenue attributable to resale of products by sell-through distributors as a percentage of our total revenue was 61%. For both of the fiscal years 2015 and 2014, revenue attributable to resale of products by sell-through distributors as a percentage of our total revenue was 45%. Our two largest distributor groups also account for a substantial portion of our trade receivables. At December 31, 2016 and January 2, 2016, one distributor group accounted for 38% and 29%, respectively, and the other accounted for 24% and 15%, respectively, of gross trade receivables. No other distributor groups or end customers accounted for more than 10% of gross trade receivables at these dates.
Concentration of credit risk with respect to trade receivables is mitigated by our credit and collection process including active management of collections, credit limits, routine credit evaluations for essentially all customers, and secure transactions with letters of credit or advance payments where appropriate. We regularly review our allowance for doubtful accounts and the aging of our accounts receivable. Accounts receivable do not bear interest and are shown net of allowances for doubtful accounts of $9.3 million and $0.6 million at December 31, 2016 and January 2, 2016, respectively. During the third quarter of fiscal 2016, we received notice from one of our distributor groups that indicated a high likelihood of their bankruptcy. As a result, we reserved our accounts receivable, net of deferred revenue, from the distributor group resulting in an increase in allowance for doubtful accounts of $9.0 million and bad debt expense of $7.5 million for fiscal 2016.
We place our investments primarily through one financial institution and mitigate the concentration of credit risk by limiting the maximum portion of the investment portfolio which may be invested in any one instrument. Our investment policy defines approved credit ratings for investment securities. Investments on-hand in marketable securities consisted primarily of money market instruments, “AA” or better corporate notes and bonds and commercial paper, and U.S. government agency obligations. See Note 3 for a discussion of the liquidity attributes of our marketable securities.
We rely on a limited number of foundries for our wafer purchases including Fujitsu Limited, Seiko Epson Corporation, Taiwan Semiconductor Manufacturing Company, Ltd, and United Microelectronics Corporation. We seek to mitigate the concentration of supply risk by establishing, maintaining and managing multiple foundry relationships; however, certain of our products are sourced from a single foundry.
Revenue Recognition and Deferred Income
Product Revenue
We sell our products directly to end customers, through a network of independent manufacturers' representatives, and indirectly through a network of independent sell-in and sell-through distributors. Distributors provide periodic data regarding the product, price, quantity, and end customer when products are resold, as well as the quantities of our products they still have in stock.
Revenue from sales to original equipment manufacturers ("OEMs") and sell-in distributors is generally recognized upon shipment. Reserves for sell-in stock rotations, where applicable, are estimated based primarily on historical experience and provided for at the time of shipment. Revenue from sales by our sell-through distributors is recognized at the time of reported resale. Under both types of revenue recognition, persuasive evidence of an arrangement exists, the price is fixed or determinable, title has transferred, collection of resulting receivables is reasonably assured, and there are no remaining customer acceptance requirements and no remaining significant performance obligations.
Orders from our sell-through distributors are initially recorded at published list prices; however, for a majority of our sales, the final selling price is determined at the time of resale and in accordance with a distributor price agreement. For this reason, we do not recognize revenue until products are resold by sell-through distributors to an end customer. In certain circumstances, we allow sell-through distributors to return unsold products. At times, we protect our sell-through distributors against reductions in published list prices.
At the time of shipment to sell-through distributors, we (a) record Accounts receivable at published list price since there is a legally enforceable obligation from the distributor to pay us currently for product delivered, (b) relieve inventory for the carrying value of goods shipped since legal title has passed to the distributor, and (c) record deferred revenue and deferred cost of sales in Deferred income and allowances on sales to sell-through distributors in the liability section of our Consolidated Balance Sheets. Revenue and cost of sales to sell-through distributors are deferred until either the product is resold by the distributor or, in certain cases, return privileges terminate, at which time Revenue and Cost of products sold are reflected in Net (loss) income, and Accounts receivable, net are adjusted to reflect the final selling price.
58
The components of Deferred income and allowances on sales to sell-through distributors are presented in the following table:
(In thousands) | December 31, 2016 | January 2, 2016 | ||||||
Inventory valued at published list price and held by sell-through distributors with right of return | $ | 86,218 | $ | 47,086 | ||||
Allowance for distributor advances | (37,090 | ) | (22,290 | ) | ||||
Deferred cost of sales related to inventory held by sell-through distributors | (16,871 | ) | (6,930 | ) | ||||
Total Deferred income and allowances on sales to sell-through distributors | $ | 32,257 | $ | 17,866 | ||||
A significant portion of our revenue in fiscal 2016 was from sell-through distributors. For fiscal year 2016, resale of products by sell-through distributors as a percentage of our total revenue was 61%. For fiscal years 2015 and 2014, resale of products by sell-through distributors as a percentage of our total revenue was 45% in each year.
We use estimates and apply judgment to reconcile sell-through distributors' inventories. Errors in our estimates or judgments could result in inaccurate reporting of our Revenue, Cost of product sold, Deferred income and allowances on sales to sell-through distributors, and Net (loss) income.
Licensing and Services Revenue
Our licensing and services revenue is comprised of revenue from our intellectual property ("IP") core licensing activity, patent monetization activities, and royalty and adopter fee revenue from our standards activities. These activities are complementary to our product sales and help us monetize our IP and accelerate market adoption curves associated with our technology and standards.
From time to time we enter into patent sale and licensing agreements to monetize and license a broad portfolio of our patented inventions. Such licensing agreements may include upfront license fees and ongoing royalties. The contractual terms of the agreements generally provide for payments of upfront license fees and/or royalties over an extended period of time. Revenue from such license fees is recognized when payments become due and payable as long as all other revenue recognition criteria are met, while revenue from royalties is recognized when reported to us by customers.
We enter into IP licensing agreements that generally provide licensees the right to incorporate our IP components into their products pursuant to terms and conditions that vary by licensee. Revenue earned under these agreements is classified as Licensing and services revenue. Our IP licensing agreements generally include multiple elements, which may include one or more off-the-shelf or customized IP licenses bundled with support services covering a fixed period of time, generally one year. If the different elements of a multiple-element arrangement qualify as separate units of accounting, we allocate the total arrangement consideration to each element based on relative selling price.
Amounts allocated to off-the-shelf IP licenses are recognized at the time of sale provided the other conditions for revenue recognition have been met. Amounts allocated to the support services are deferred and recognized on a straight-line basis over the support period, generally one year. Certain licensing agreements provide for royalty payments based on agreed-upon royalty rates, which may be fixed or variable depending on the terms of the agreement. The amount of revenue we recognize is based on a specified time period or on the agreed-upon royalty rate multiplied by the reported number of units shipped by the customer.
From time to time, we enter into IP licensing agreements that involve significant modification, customization or engineering services. Revenues derived from these contracts are accounted for using the percentage-of-completion method or completed contract method. The completed contract method is used for contracts where there is a risk associated with final acceptance by the customer or for short-term contracts.
HDMI royalty revenue is determined by a contractual allocation formula agreed to by the Founders of the HDMI consortium. Evidence of an arrangement, as it relates to HDMI royalty revenue, is deemed complete when all of the Founders agree on the royalty sharing formula. From time to time through December 31, 2016, as an agent of the HDMI Consortium, we performed audits on our royalty reporting customers to ensure compliance. As a result of those compliance efforts, we entered into settlement agreements for the payment of unreported royalties. The contractual terms of those agreements provided for upfront payment of unreported royalties or payment over a period of time, generally not to exceed one year. Revenue from those arrangements was recognized when the agreement was executed by both parties, as long as price was fixed and determinable and collection was reasonably assured.
Inventories
Inventories are recorded at the lower of actual cost determined on a first-in-first-out basis or market. We establish provisions for inventory if it is obsolete or we hold quantities which are in excess of projected customer demand. The creation of such provisions results in a write-down of inventory to net realizable value and a charge to Cost of product revenue.
59
Property and Equipment
Property and equipment are stated at cost. Depreciation and amortization are computed using the straight-line method for financial reporting purposes over the estimated useful lives of the related assets, generally three to five years for equipment and software, one to three years for tooling, and thirty years for buildings and building space. Leasehold improvements are amortized over the shorter of the non-cancelable lease term or the estimated useful life of the assets. Upon disposal of property and equipment, the accounts are relieved of the costs and related accumulated depreciation and amortization, and resulting gains or losses are reflected in the Consolidated Statements of Operations for recognized gains and losses, or in the Consolidated Balance Sheets for deferred gains and losses. Repair and maintenance costs are expensed as incurred.
Equity Investments in Privately Held Companies
Equity investments in privately-held companies are reviewed on a quarterly basis to determine if their values have been impaired and adjustments are recorded as necessary. We assess the potential impairment of these investments by considering available evidence such as the investee’s historical and projected operating results, progress towards meeting business milestones, ability to meet expense forecasts, and the prospects for industry or market in which the investee operates. Upon disposition of these investments, the specific identification method is used to determine the cost basis in computing realized gains or losses. Declines in value that are judged to be other-than-temporary are reported in other income (expense), net in the accompanying Consolidated Statements of Operations.
The accounting method for equity investments in privately-held companies is assessed under ASC 323-10, Equity Method and Joint Ventures. Investments for which we have the ability to exert significant influence on the investee are accounted for under the equity method with our proportionate share of the investee’s operating results recognized through the Consolidated Statements of Operations, along with a commensurate increase or decrease in the carrying value of the investment.
Impairment of Long-Lived Assets
Long-lived assets, including amortizable intangible assets, are carried on our financial statements based on their cost less accumulated depreciation or amortization. We monitor the carrying value of our long-lived assets for potential impairment and test the recoverability of such assets annually during the fourth quarter and whenever events or changes in circumstances indicate that their carrying amounts may not be recoverable. These events or changes in circumstances, including management decisions pertaining to such assets, are referred to as impairment indicators. If an impairment indicator occurs, we perform a test of recoverability by comparing the carrying value of the asset group to its undiscounted expected future cash flows. If the carrying values are in excess of undiscounted expected future cash flows, we measure any impairment by comparing the fair value of the asset group to its carrying value. Fair value is generally determined by considering (i) internally developed discounted projected cash flow analysis of the asset group; (ii) actual third-party valuations; and/or (iii) information available regarding the current market for similar asset groups. If the fair value of the asset group is determined to be less than the carrying amount of the asset group, an impairment in the amount of the difference is recorded in the period that the impairment indicator occurs and is included in our Consolidated Statements of Operations. Estimating future cash flows requires significant judgment and projections may vary from the cash flows eventually realized, which could impact our ability to accurately assess whether an asset has been impaired. The results of our assessments are detailed in Note 9.
Valuation of Goodwill
Goodwill is an asset representing the future economic benefits arising from other assets acquired in a business combination that are not individually identified and separately recognized. We review goodwill for impairment annually during the fourth quarter and whenever events or changes in circumstances indicate the carrying value of goodwill may not be recoverable. When evaluating whether goodwill is impaired, we make a qualitative assessment to determine if it is more likely than not that the reporting unit's fair value is less than the carrying amount. If the qualitative assessment determines that it is more likely than not that the fair value is less than the carrying amount, the fair value of the reporting unit is compared with its carrying value (including goodwill). If the fair value of the reporting unit is less than its carrying value, an indication of goodwill impairment exists for the reporting unit and we must measure the impairment loss. The impairment loss, if any, is recognized for any excess of the carrying amount of the reporting unit's goodwill over the implied fair value of the goodwill. The implied fair value of goodwill is determined by allocating the fair value of the reporting unit in a manner similar to purchase price allocation and the residual fair value after this allocation is the implied fair value of the reporting unit goodwill. Fair value of the reporting unit is determined using a discounted cash flow analysis. If the fair value of the reporting unit exceeds its carrying value, no further impairment analysis is needed. For purposes of testing goodwill for impairment, we currently operate as a single reporting unit: the core Lattice ("Core") business, which includes intellectual property and semiconductor devices. In fiscal 2015 only, we separately tested goodwill for impairment in Qterics, a discrete software-as-a-service business unit in the Lattice legal entity structure. We sold Qterics to an unrelated third party in April 2016. Although these two operating units constituted two reportable segments in fiscal 2015, we combined Qterics with our Core business and reported them together as one reportable segment due to the immaterial nature of the Qterics unit. The results of our assessments are detailed in Note 9.
60
Leases
We lease office space and classify our leases as either operating or capital lease arrangements in accordance with the criteria of ASC 840, “Leases.” Certain of our office space operating leases contain provisions under which monthly rent escalates over time and certain leases may also contain provisions for reimbursement of a specified amount of leasehold improvements. When lease agreements contain escalating rent clauses, we recognize expense on a straight-line basis over the term of the lease. When lease agreements provide allowances for leasehold improvements, we capitalize the leasehold improvement assets and amortize them on a straight-line basis over the lesser of the lease term or the estimated useful life of the asset, and reduce rent expense on a straight-line basis over the term of the lease by the amount of the asset capitalized.
Restructuring Charges
Expenses associated with exit or disposal activities are recognized when incurred under ASC 420, “Exit or Disposal Cost Obligations,” for everything but severance. Because the Company has a history of paying severance benefits, the cost of severance benefits associated with a restructuring plan is recorded when such costs are probable and the amount can be reasonably estimated in accordance with ASC 712, “Compensation - Nonretirement Postemployment Benefits.” When leased facilities are vacated, an amount equal to the total future lease obligations from the date of vacating the premises through the expiration of the lease, net of any future sublease income, is recorded as a part of restructuring charges.
Research and Development
Research and development expenses include costs for compensation and benefits, development masks, engineering wafers, depreciation, licenses, and outside engineering services. These expenditures are for the design of new products, intellectual property cores, processes, packaging, and software to support new products. Research and development costs are expensed as incurred.
Accounting for Income Taxes
Our provision for income tax is comprised of our current tax liability and changes in deferred tax assets and liabilities. Deferred tax assets and liabilities are recognized for the expected tax consequences of temporary differences between the tax bases of assets and liabilities and their reported amounts in the financial statements using enacted tax rates and laws that will be in effect when the difference is expected to reverse. Valuation allowances are provided to reduce deferred tax assets to an amount that in management’s judgment is more-likely-than-not to be recoverable against future taxable income. At December 31, 2016, U.S. income taxes were not provided on approximately $3.0 million of the undistributed earnings of our Chinese subsidiary as we intend to reinvest these earnings indefinitely. If these earnings were distributed to the U.S. in the form of dividends or otherwise, these earnings would be subject to Chinese withholding taxes and would be subject to additional U.S. income taxes but offset by net operating loss carryforwards which have been fully reserved.
Our income tax calculations are based on application of the respective U.S. federal, state or foreign tax law. Our tax filings, however, are subject to audit by the relevant tax authorities. Accordingly, we recognize tax liabilities based upon our estimate of whether, and the extent to which, additional taxes will be due when such estimates are more-likely-than-not to be sustained. An uncertain income tax position will not be recognized if it has less than a 50% likelihood of being sustained. To the extent the final tax liabilities are different than the amounts originally accrued, the increases or decreases as well as any interest or penalties are recorded as income tax expense or benefit in the Consolidated Statements of Operations.
In assessing the ability to realize deferred tax assets, the Company evaluates both positive and negative evidence that may exist and considers whether it is more-likely-than-not that some portion or all of the deferred tax assets will be realized. The ultimate realization of deferred tax assets is dependent upon the generation of future taxable income during the periods in which those temporary differences become deductible.
Any adjustment to the net deferred tax asset valuation allowance is recorded in the Consolidated Statements of Operations for the period that the adjustment is determined to be required.
Stock-Based Compensation
We use the Black-Scholes option pricing model to estimate the fair value of substantially all share-based awards consistent with the provisions of ASC 718, “Compensation - Stock Compensation.” Option pricing models, including the Black-Scholes model, require the use of input assumptions, including expected volatility, expected term, expected dividend rate, and expected risk-free rate of return. The assumptions for expected volatility and expected term most significantly affect the grant date fair value.
61
We have also used a lattice-based option-pricing model to determine and fix the fair value of stock options with a market condition granted to certain executives. This valuation model incorporates a Monte-Carlo simulation, and considered the likelihood that we would achieve the market condition. The options have a two year vesting and vest between 0% and 200% of the target amount, based on the Company's relative Total Shareholder Return ("TSR") when compared to the TSR of a component of companies of the PHLX Semiconductor Sector Index over a two year period. TSR is a measure of stock price appreciation plus dividends paid, if any, in the performance period.
New Accounting Pronouncements
In May 2014, the FASB issued Accounting Standards Update (ASU) No. 2014-09, Revenue from Contracts with Customers, which requires an entity to recognize the amount of revenue to which it expects to be entitled for the transfer of promised goods or services to customers. In August 2015, the FASB issued ASU 2015-14 deferring the effective date of ASU 2014-09 to periods beginning on or after December 15, 2017, with early adoption permitted for annual reporting periods beginning after December 15, 2016, and interim periods within that year. We intend to adopt ASU 2014-09 on December 31, 2017 which is the first day of our fiscal 2018. The new standard allows for two transition methods - (i) apply it retrospectively to each prior reporting period presented, or (ii) apply it prospectively with the cumulative effect of adoption recognized on December 31, 2017, the first day of our fiscal 2018. We have not yet concluded upon our selection of the transition method. We have commenced our implementation efforts, which have thus far focused on developing a project plan and performing a preliminary assessment of potential impacts of the new standard to our financial statements. Key elements of our project plan include the final determination of the impacts of the standard to revenues, contract acquisition costs, income taxes and various balance sheet accounts; the identification of additional system requirements, if any, to support our application of the new standard; and the design and implementation of relevant internal controls. We believe that we have sufficient time and resources to complete our implementation efforts no later than the fourth quarter of fiscal 2017.
In July 2015, the FASB issued ASU 2015-11, Simplifying the Measurement of Inventory. Under this ASU, inventory will be measured at the “lower of cost and net realizable value” and options that currently exist for “market value” will be eliminated. The ASU defines net realizable value as the “estimated selling prices in the ordinary course of business, less reasonably predictable costs of completion, disposal, and transportation.” ASU 2015-11 is effective for interim and annual periods beginning after December 15, 2016. Early application is permitted and should be applied prospectively. We do not expect the adoption of this accounting standard update to have a material impact on our consolidated financial statements.
In January 2016, the FASB issued ASU No. 2016-01, Recognition and Measurement of Financial Assets and Financial Liabilities, to mainly change the accounting for investments in equity securities and financial liabilities carried at fair value as well as to modify the presentation and disclosure requirements for financial instruments. The ASU is effective for interim and annual periods beginning after December 15, 2017, with early adoption permitted. Adoption of the ASU is retrospective with a cumulative adjustment to retained earnings or accumulated deficit as of the adoption date. We are currently evaluating the impact of ASU 2016-01 on our consolidated financial statements and related disclosures.
In February 2016, the FASB issued ASU 2016-02, Leases (Topic 842), which requires that substantially all leases, including current operating leases, be recognized by lessees on their balance sheet as a right-of-use asset and corresponding lease liability. For public business entities, the standard is effective for fiscal years beginning after December 15, 2018, including interim periods within those fiscal years. Early application is permitted for all entities. We are currently evaluating the impact of ASU 2016-02 on our consolidated financial statements and related disclosures.
In March 2016, the FASB issued ASU 2016-09, Compensation - Stock Compensation, Improvements to Employee Share-Based payment Accounting (Topic 718). This update is intended to provide simplification of the accounting for share based payment transactions, including the accounting for income taxes, forfeitures, and statutory tax withholding requirements, as well as classification in the statement of cash flows. The guidance is effective for interim and annual periods beginning after December 15, 2016. Early application is permitted and should be applied prospectively. We do not expect the adoption of this accounting standard update to have a material impact on our consolidated financial statements.
In August 2016, the FASB issued ASU 2016-15, Statement of Cash Flows (Topic 230): Classification of Certain Cash Receipts and Cash Payments. The new guidance is intended to reduce diversity in practice in how cash receipts and cash payments are classified in the statement of cash flows. For public business entities, this guidance will be effective for interim and annual periods beginning after December 15, 2017. Early adoption is permitted. We are currently evaluating the impact of ASU 2016-15 on our consolidated financial statements and related disclosures.
In October 2016, the FASB issued ASU 2016-16, Income Taxes (Topic 740): Intra-Entity Transfers of Assets Other Than Inventory. This update is intended to recognize the income tax consequences of intra-entity transfers of assets other than inventory when they occur by removing the exception to postpone recognition until the asset has been sold to an outside party. For public business entities, this guidance is effective for interim and annual periods beginning after December 15, 2017. Early adoption is permitted, and it is required to be applied on a modified retrospective basis through a cumulative-effect adjustment to the balance sheet as of the beginning of the fiscal year of adoption. We are currently evaluating the impact of ASU 2016-16 on our consolidated financial statements and related disclosures.
62
In January 2017, the FASB issued ASU No. 2017-01, Clarifying the Definition of a Business, which narrows the existing definition of a business and provides a framework for evaluating whether a transaction should be accounted for as an acquisition (or disposal) of assets or a business. This update requires an entity to evaluate if substantially all of the fair value of the gross assets acquired is concentrated in a single identifiable asset or a group of similar identifiable assets; if so, the set of transferred assets and activities (collectively, the set) is not a business. To be considered a business, the set would need to include an input and a substantive process that together significantly contribute to the ability to create outputs. The standard also narrows the definition of outputs. The definition of a business affects areas of accounting such as acquisitions, disposals and goodwill. Under the new guidance, fewer acquired sets are expected to be considered businesses. For public business entities, this guidance is effective for interim and annual periods beginning after December 15, 2017. We are currently evaluating the impact of ASU 2017-01 on our consolidated financial statements and related disclosures.
In January 2017, the FASB issued ASU 2017-04, Intangibles—Goodwill and Other (Topic 350): Simplifying the Test for Goodwill Impairment, which simplifies the subsequent measurement of goodwill by eliminating step two from the goodwill impairment test. Under the new guidance, an entity will recognize an impairment charge for the amount by which the carrying value exceeds the fair value. This standard is effective for annual or any interim goodwill impairment tests in fiscal years beginning after December 15, 2019. Early adoption is permitted for interim or annual goodwill impairment tests performed on testing dates after January 1, 2017 and requires a prospective transition method. We are currently evaluating the impact of ASU 2017-04 on our consolidated financial statements and related disclosures.
Note 2 - Net (Loss) Income Per Share
We compute basic net (loss) income per share by dividing net (loss) income by the weighted average number of common shares outstanding during the period. To determine diluted share count, we apply the treasury stock method to determine the dilutive effect of outstanding stock option shares, restricted stock units ("RSUs"), and Employee Stock Purchase Plan ("ESPP") shares. Our application of the treasury stock method includes, as assumed proceeds, the average unamortized stock-based compensation expense for the period and the impact of the pro forma deferred tax benefit or cost associated with stock-based compensation expense. When we are in a net loss position, we do not include dilutive securities as their inclusion would reduce the net loss per share.
A reconciliation of basic and diluted net (loss) income per share is presented below:
Year Ended | ||||||||||||
(in thousands, except per share data) | December 31, 2016 | January 2, 2016 | January 3, 2015 | |||||||||
Net (loss) income | $ | (54,099 | ) | $ | (159,233 | ) | $ | 48,580 | ||||
Shares used in basic net (loss) income per share | 119,994 | 117,387 | 117,708 | |||||||||
Dilutive effect of stock options, RSUs and ESPP shares | — | — | 2,537 | |||||||||
Shares used in diluted net (loss) income per share | 119,994 | 117,387 | 120,245 | |||||||||
Basic net (loss) income per share | $ | (0.45 | ) | $ | (1.36 | ) | $ | 0.41 | ||||
Diluted net (loss) income per share | $ | (0.45 | ) | $ | (1.36 | ) | $ | 0.40 | ||||
The computation of diluted net (loss) income per share for fiscal years 2016 and 2015 excludes the effects of stock options, RSUs, and ESPP shares, aggregating approximately 9.0 million shares and 9.2 million shares, respectively, which are antidilutive. The computation of diluted net (loss) income per share for fiscal year 2014 includes the effects of stock options, RSUs and ESPP shares aggregating approximately 2.5 million shares, as they are dilutive, and excludes the effects of stock options, RSUs and ESPP shares aggregating approximately 2.6 million shares, as they are antidilutive. Stock options, RSUs and ESPP shares are considered antidilutive when the aggregate of exercise price, unrecognized stock-based compensation expense, and excess tax benefit are greater than the average market price for our common stock during the period or when the Company is in a net loss position, as the effects would reduce the loss per share. Stock options and RSUs that are antidilutive at December 31, 2016 could become dilutive in the future.
63
Note 3 - Marketable Securities
We classify our marketable securities as short-term based on their nature and availability for use in current operations. Our short-term marketable securities have contractual maturities of up to two years. The following table summarizes the remaining maturities of our marketable securities at fair value:
(In thousands) | December 31, 2016 | January 2, 2016 | |||||
Short-term marketable securities: | |||||||
Maturing within one year | $ | 10,308 | $ | 12,144 | |||
Maturing between one and two years | — | 5,824 | |||||
Total marketable securities | $ | 10,308 | $ | 17,968 | |||
The following table summarizes the composition of our marketable securities at fair value:
(In thousands) | December 31, 2016 | January 2, 2016 | |||||
Short-term marketable securities: | |||||||
Corporate and government bonds and notes | $ | 10,230 | $ | 17,888 | |||
Certificates of deposit | 78 | 80 | |||||
Total marketable securities | $ | 10,308 | $ | 17,968 | |||
Note 4 - Fair Value of Financial Instruments
Fair value measurements as of December 31, 2016 | Fair value measurements as of January 2, 2016 | ||||||||||||||||||||||||||||||
(In thousands) | Total | Level 1 | Level 2 | Level 3 | Total | Level 1 | Level 2 | Level 3 | |||||||||||||||||||||||
Short-term marketable securities | $ | 10,308 | $ | 10,230 | $ | 78 | $ | — | $ | 17,968 | $ | 17,888 | $ | 80 | $ | — | |||||||||||||||
Foreign currency forward exchange contracts, net | 184 | — | 184 | — | (12 | ) | — | (12 | ) | — | |||||||||||||||||||||
Total fair value of financial instruments | $ | 10,492 | $ | 10,230 | $ | 262 | $ | — | $ | 17,956 | $ | 17,888 | $ | 68 | $ | — | |||||||||||||||
We invest in various financial instruments that may include corporate and government bonds and notes, commercial paper, and certificates of deposit. In the past we have also invested in auction rate securities. In addition, we enter into foreign currency forward exchange contracts to mitigate our foreign currency exchange rate exposure. We carry these instruments at their fair value in accordance with ASC 820. The framework under the provisions of ASC 820 establishes three levels of inputs that may be used to measure fair value. Each level of input has different levels of subjectivity and difficulty involved in determining fair value. There were no transfers between any of the levels during fiscal 2016, 2015, and 2014.
During the fiscal years ended December 31, 2016 and January 2, 2016, we had no Level 3 instruments. In the second quarter of the fiscal year ended January 3, 2015, we sold our remaining auction rate securities with a par value of $5.7 million with an estimated fair value of $5.2 million, for $5.5 million. As a result, we reported a gain of $1.7 million in the Consolidated Statements of Operations and relieved $1.1 million of previously unrealized gain, net of taxes, from accumulated other comprehensive loss in fiscal 2014.
In accordance with ASC 320, “Investments-Debt and Equity Securities,” we recorded an unrealized loss of approximately $0.2 million during the fiscal year ended December 31, 2016, and an unrealized loss of less than $0.1 million during the fiscal year ended January 2, 2016 on certain Short-term marketable securities (Level 1 instruments), which have been recorded in accumulated other comprehensive loss. Future fluctuations in fair value related to these instruments that we deem to be temporary, including any recoveries of previous write-downs, would be recorded to accumulated other comprehensive loss. If we were to determine in the future that any further decline in fair value is other-than-temporary, we would record an impairment charge, which could have a materially adverse effect on our operating results. If we were to liquidate our position in these securities, it is likely that the amount of any future realized gain or loss would be different from the unrealized gain or loss reported in accumulated other comprehensive loss.
64
Note 5 - Inventories
(In thousands) | December 31, 2016 | January 2, 2016 | |||||
Work in progress | $ | 50,688 | $ | 57,865 | |||
Finished goods | 28,480 | 18,031 | |||||
Total inventories | $ | 79,168 | $ | 75,896 | |||
Note 6 - Property and Equipment
(In thousands) | December 31, 2016 | January 2, 2016 | |||||
Buildings | $ | 3,554 | $ | 3,554 | |||
Computer and test equipment | 162,388 | 148,995 | |||||
Office furniture and equipment | 3,460 | 3,880 | |||||
Leasehold and building improvements | 14,865 | 14,366 | |||||
184,267 | 170,795 | ||||||
Accumulated depreciation and amortization | (134,786 | ) | (118,943 | ) | |||
$ | 49,481 | $ | 51,852 | ||||
Depreciation and amortization expense for property and equipment was $18.4 million, $18.1 million including $1.5 million of restructuring expense, and $11.4 million for fiscal years 2016, 2015, and 2014, respectively.
As of December 31, 2016, our owned building space in Shanghai, China was classified as held for sale as a result of planned facilities consolidation under our March 2015 Restructuring Plan. We have halted depreciation as of December 31, 2016 and entered into a contract to sell the building in January 2017. We expect the sale to be completed in the first quarter of fiscal 2017. The office space had a carrying value of $2.2 million as of December 31, 2016 and is included in property and equipment in the Consolidated Balance Sheets.
In November 2014, we sold land and buildings, comprising the former location of our corporate headquarters and executive office in Hillsboro, Oregon, for net proceeds of approximately $14.6 million. This property had a historical cost of $30.9 million and accumulated depreciation of $17.9 million, resulting in a net gain on sale of $1.6 million. We leased back a portion of the facilities for a lease term of eight years, resulting in deferral of the gain, which is being amortized over the life of the lease.
Note 7 - Business Combinations and Goodwill
On March 10, 2015, we acquired 100% of the outstanding equity of Silicon Image, Inc. ("Silicon Image"), a provider of video, audio, and data connectivity solutions for the mobile, consumer electronics, and personal computer markets.
The fair value of the purchase price consideration consisted of the following:
(In thousands) | Estimated Fair Value | ||
Cash paid to Silicon Image shareholders | $ | 575,955 | |
Cash paid for options and RSUs | 7,383 | ||
Fair value of partially vested stock options and RSUs assumed | 5,139 | ||
Total purchase consideration | $ | 588,477 | |
There is no contingent consideration in this acquisition.
Purchase consideration was allocated to the tangible and intangible assets and liabilities assumed on the basis of the respective estimated fair values on the acquisition date. In the first quarter of 2016, we revised our valuation and allocation of purchase price consideration resulting in $2.1 million of additional long-term liabilities related to an uncertain tax position with an equivalent revision to Goodwill, which is reflected in the Consolidated Balance Sheets for the year ended December 31, 2016.
65
The final allocation of the total purchase price is as follows:
(In thousands) | Estimated Fair Value | ||
Assets acquired: | |||
Cash, cash equivalents and short-term investments | $ | 157,923 | |
Accounts receivable | 30,677 | ||
Inventory | 20,839 | ||
Other current assets | 7,183 | ||
Property and equipment | 23,429 | ||
Other non-current assets | 1,573 | ||
Intangible assets | 192,079 | ||
Goodwill | 237,608 | ||
Total assets acquired | 671,311 | ||
Less liabilities assumed: | |||
Accounts payable and other accrued liabilities | 47,735 | ||
Other current liabilities | 1,252 | ||
Long-term liabilities | 26,675 | ||
Redeemable noncontrolling interest | 7,172 | ||
Total liabilities assumed | 82,834 | ||
Fair value of net assets acquired | $ | 588,477 | |
The following table presents details of the identified intangible assets acquired through the acquisition of Silicon Image:
(In thousands) | Asset Life in Years | Fair Value | |||
Developed technology | 3-5 | $ | 125,000 | ||
Customer relationships | 4-7 | 29,458 | |||
Licensed technology | 3-5 | 1,852 | |||
Patents | 5 | 769 | |||
Total identified finite-lived intangible assets | 157,079 | ||||
In-process research and development | indefinite | 35,000 | |||
Total identified intangible assets | $ | 192,079 | |||
We do not believe there is any significant residual value associated with these intangible assets. We are amortizing the intangible assets using the straight-line method over their estimated useful lives. The estimation of the fair values of the intangible assets required the use of valuation techniques including the income approach and the cost approach, and entailed consideration of all the relevant factors that might affect the fair value such as present value factors, and estimates of future revenues and costs.
Silicon Image’s results of operations and the estimated fair value of the assets acquired and liabilities assumed are included in Lattice's consolidated financial statements effective March 11, 2015. Silicon Image's revenue and net loss for the approximately 10-month period from March 11, 2015 through January 2, 2016 were approximately $135.6 million and $77.0 million, respectively. Silicon Image's acquisition related charges in that period, which were expensed as incurred, were approximately $8.2 million.
Goodwill
Goodwill represents the excess of the purchase price over the fair value of the underlying net tangible and intangible assets. The goodwill recognized in the acquisition of Silicon Image was derived from expected benefits from cost synergies and knowledgeable and experienced workforce who joined the Company after the acquisition. Goodwill is not amortized, but is instead tested for impairment annually or more frequently if certain indicators of impairment are present. We do not expect goodwill impairment to be tax deductible for income tax purposes. No impairment charges relating to goodwill were recorded in fiscal 2016 as no indicators of impairment were present. A $13 million charge to fully impair the Qterics goodwill was recorded for fiscal 2015 (Note 9). No impairment charges related to goodwill were recorded in fiscal 2014 as no indicators of impairment were present. The goodwill balance of $270 million at December 31, 2016 is comprised of $45 million from prior acquisitions combined with the $238 million from the acquisition of Silicon Image, reduced by the fiscal 2015 goodwill impairment charge of $13 million.
66
Unaudited Pro Forma Financial Information
The unaudited pro forma financial information in the table below summarizes the combined results of operations for the Company and Silicon Image as if the merger occurred on December 29, 2013, the first day of our 2014 fiscal year. The pro forma financial information for the periods presented includes adjustments to amortization and depreciation for intangible assets and property and equipment acquired; adjustments to share-based compensation expense; and interest expense for the additional indebtedness incurred as part of the acquisition. The total of nonrecurring pro forma adjustments directly attributable to the business combination included in the reported pro forma revenue and earnings for the year ended January 3, 2015 and excluded from the reported pro forma revenue and earnings for the year ended January 2, 2016 was $30.6 million related to acquisition-related charges. The pro forma financial information as presented below is for informational purposes only, is based on certain assumptions and estimates, and is not indicative of the results of operations that would have been achieved if the acquisition had taken place at the beginning of the first period presented.
The unaudited pro forma financial information for the fiscal year ended January 2, 2016 combined the historical results of the Company for the fiscal year ended January 2, 2016, the historical results of Silicon Image for the fiscal year ended January 2, 2016, and the effects of the pro forma adjustments described above.
The unaudited pro forma financial information for the fiscal year ended January 3, 2015 combined the historical results of the Company for the fiscal year ended January 3, 2015, the historical results of Silicon Image for the fiscal year ended January 3, 2015, and the effects of the pro forma adjustments described above.
Year Ended | ||||||||
(Dollars in thousands, except per share data) | January 2, 2016 | January 3, 2015 | ||||||
Total revenues | $ | 450,867 | $ | 624,179 | ||||
Net (loss) income attributable to stockholders | $ | (147,436 | ) | $ | 10,376 | |||
Basic net (loss) income per share | $ | (1.26 | ) | $ | 0.09 | |||
Diluted net (loss) income per share | $ | (1.26 | ) | $ | 0.09 | |||
The pro forma adjustments did not have any impact on the pro forma combined provision for income taxes for fiscal 2015 and 2014 due to net loss positions and valuation allowances on deferred income tax assets in those periods.
Note 8 - Intangible Assets
In connection with our acquisitions of Silicon Image in March 2015 and SiliconBlue in December 2011 we recorded identifiable intangible assets related to developed technology, customer relationships, licensed technology, patents, and in-process research and development based on guidance for determining fair value under the provisions of ASC 820, "Fair Value Measurements and Disclosures." Additionally, during fiscal 2015, we licensed additional third-party technology.
We monitor the carrying value of our intangible assets for potential impairment and test the recoverability of such assets annually during the fourth quarter and whenever events or changes in circumstances indicate that their carrying amounts may not be recoverable. The results of our assessments are summarized below and more fully detailed in Note 9.
During the third quarter of fiscal 2016, we recorded a $7.9 million non-cash impairment charge to the intangible assets associated with future HDMI adopter fees. During the fourth quarter of fiscal 2015, we recorded a $9.0 million impairment charge to the intangible assets of the then Qterics operating segment comprising developed technology of $3.9 million, and customer relationships of $5.1 million. With the sale of Qterics in April 2016, its balances for intangible assets, accumulated amortization, and impairment have been removed from the balance for intangible assets, net of amortization in the Consolidated Balance Sheet as of December 31, 2016. No impairment charges related to intangible assets were recorded during fiscal 2014 as no indicators of impairment were present.
67
The following tables summarize the details of our total purchased intangible assets as of December 31, 2016 and January 2, 2016:
December 31, 2016 | ||||||||||||||||||
(In thousands) | Weighted Average Amortization Period (in years) | Gross | Impairment | Accumulated Amortization | Intangible assets, net of amortization | |||||||||||||
Developed technology | 4.7 | $ | 141,359 | $ | — | $ | (55,493 | ) | $ | 85,866 | ||||||||
Customer relationships | 6.1 | 30,800 | (7,866 | ) | (13,694 | ) | 9,240 | |||||||||||
Licensed technology | 3.3 | 2,127 | — | (1,201 | ) | 926 | ||||||||||||
Patents | 5 | 769 | — | (279 | ) | 490 | ||||||||||||
Total identified finite-lived intangible assets | 175,055 | (7,866 | ) | (70,667 | ) | 96,522 | ||||||||||||
In-process research and development | indefinite | 22,341 | — | — | 22,341 | |||||||||||||
Total identified intangible assets | $ | 197,396 | $ | (7,866 | ) | $ | (70,667 | ) | $ | 118,863 | ||||||||
January 2, 2016 | ||||||||||||||||||
(In thousands) | Weighted Average Amortization Period (in years) | Gross | Impairment | Accumulated Amortization | Intangible assets, net of amortization | |||||||||||||
Developed technology | 4.7 | $ | 135,700 | $ | (3,856 | ) | $ | (28,384 | ) | $ | 103,460 | |||||||
Customer relationships | 5.5 | 37,258 | (5,139 | ) | (10,156 | ) | 21,963 | |||||||||||
Licensed technology | 2.5 | 2,127 | — | (610 | ) | 1,517 | ||||||||||||
Patents | 5 | 769 | — | (126 | ) | 643 | ||||||||||||
Total identified finite-lived intangible assets | 175,854 | (8,995 | ) | (39,276 | ) | 127,583 | ||||||||||||
In-process research and development | indefinite | 35,000 | — | — | 35,000 | |||||||||||||
Total identified intangible assets | $ | 210,854 | $ | (8,995 | ) | $ | (39,276 | ) | $ | 162,583 | ||||||||
We recorded amortization expense associated with these intangible assets on the Consolidated Statements of Operations as follows:
Year Ended | |||||||||||
(In thousands) | December 31, 2016 | January 2, 2016 | January 3, 2015 | ||||||||
Research and development | $ | 745 | $ | 731 | $ | — | |||||
Amortization of acquired intangible assets | 33,575 | 28,849 | 2,948 | ||||||||
$ | 34,320 | $ | 29,580 | $ | 2,948 | ||||||
The annual expected amortization expense of acquired intangible assets with finite lives is as follows:
(In thousands) | Amount | ||
2017 | $ | 33,759 | |
2018 | 27,877 | ||
2019 | 25,093 | ||
2020 | 7,145 | ||
2021 | 2,547 | ||
Thereafter | 101 | ||
Total | $ | 96,522 | |
68
Note 9 - Impairment of Goodwill and Intangible Assets
In connection with our acquisitions of Silicon Image in March 2015 and SiliconBlue in December 2011 we recorded goodwill and identifiable intangible assets related to developed technology, customer relationships, licensed technology, patents, and in-process research. We monitor the carrying value of our goodwill and intangible assets for potential impairment and test the recoverability of such assets annually during the fourth quarter and whenever events or changes in circumstances indicate that their carrying amounts may not be recoverable.
In September 2016, the Founders of the HDMI consortium, of which we are a member, amended the existing Founders Agreement resulting in changes to our role as agent for the HDMI consortium and to the model for sharing adopter fee revenues. Lattice historically served the role of the HDMI licensing agent via a wholly owned subsidiary, HDMI Licensing LLC. Under the terms of the new agreement, our role as the agent was terminated effective January 1, 2017 and a new independent entity was appointed to act as the new HDMI licensing agent with responsibility for licensing and the distribution of royalties among Founders. As a result of the amended model for sharing revenue, we will be entitled to a reduced share of adopter fees paid by parties adopting the HDMI standard. We determined that this modification constituted an impairment indicator related to the intangible assets associated with future HDMI adopter fees. Our assessment of the new value of these intangible assets concluded that they had been impaired as of the end of the third quarter of fiscal 2016, and we recorded a $7.9 million non-cash impairment charge in the Consolidated Statements of Operations. We do not anticipate any future cash expenditures related to this impairment. No impairment charges related to goodwill were recorded in fiscal 2016 as no indicators of impairment were present.
For fiscal 2015, the impairment of goodwill and intangible assets was related to Qterics, Inc., which was acquired in the March 2015 acquisition of Silicon Image. During the fourth quarter of fiscal 2015, we determined that we experienced an impairment indicator related to the long-lived assets of the Qterics operating segment. For purposes of testing for impairment in fiscal 2015, the Company operated as two reporting units: the continuing core Lattice ("Core") business, which includes intellectual property and semiconductor devices, and Qterics, which was a discrete software-as-a-service business unit in the Lattice legal entity structure until it was sold in April 2016. Although these two operating segments constituted two reportable segments in fiscal 2015, we combined Qterics with our Core business and reported them together as one reportable segment due to the immaterial nature of the Qterics segment. Following this assessment, we concluded that goodwill and intangible assets had been impaired in the Qterics segment as of January 2, 2016. As a result we recorded an impairment charge amounting to $21.7 million, or approximately 92% of the previous value of goodwill and intangible assets, in the Consolidated Statements of Operations for the year ended January 2, 2016, comprising $12.7 million pertaining to goodwill, $3.9 million pertaining to developed technology, and $5.1 million pertaining to customer relationships. The valuation was based on the market approach and was our best estimate of fair value as of the end of fiscal 2015. No impairment charges were recorded for the Core segment in fiscal 2015, and we had no impairment charges in fiscal 2014.
Note 10 - Equity Method Investment
In the first and third quarters of fiscal 2015, we purchased a preferred stock ownership interest in a privately-held company that designs human-computer interaction technology for total consideration of $3.0 million. This investment accounted for a 15.8% ownership interest by the end of the third quarter of fiscal 2015 and was accounted for under the cost method as we did not have the ability to exert significant influence over the investee.
In the fourth quarter of fiscal 2015, we increased our ownership interest to 22.7% by making an additional investment of $2.0 million. This increased our gross investment in the investee to $5.0 million. As a result of the change in ownership interest and after considering the changes in the level of our participation in the management and interaction with the investee, we determined that we have the ability to exert significant influence over the investee. Accordingly, we changed our accounting for the investment from the cost method to the equity method and have since recognized our proportionate share of the investee’s operating results in the Consolidated Statements of Operations.
In the third quarter of fiscal 2016, we made an additional investment of $1.0 million via a convertible debt instrument, bringing our gross investment in the investee to $6.0 million. We have determined that this additional investment is an in-substance common stock and has been included in our equity method accounting but that, in its unconverted state, it does not change our ownership interest.
69
Applying the equity method, the proportionate share of the investee's net loss that we have recognized in the Consolidated Statements of Operations for fiscal years 2016, 2015, and 2014 was as follows:
Year Ended | ||||||||||||
(In thousands) | December 31, 2016 | January 2, 2016 | January 3, 2015 | |||||||||
Equity in net loss of an unconsolidated affiliate, net of tax | $ | (1,459 | ) | $ | (492 | ) | $ | — | ||||
Through December 31, 2016, we have reduced the value of our investment by approximately $2.0 million, representing our cumulative proportionate share of the privately-held company’s net loss accumulated to that date. The net balance of our investment included in other long-term assets in the Consolidated Balance Sheets is detailed in the following table:
(In thousands) | Total | |||
Balance at January 3, 2015 | $ | — | ||
Investment made during fiscal year | 5,000 | |||
Equity in net loss of an unconsolidated affiliate, net of tax | (492 | ) | ||
Balance at January 2, 2016 | 4,508 | |||
Investment made during fiscal year | 1,000 | |||
Equity in net loss of an unconsolidated affiliate, net of tax | (1,459 | ) | ||
Balance at December 31, 2016 | $ | 4,049 | ||
Note 11 - Accounts Payable and Accrued Expenses
Included in accounts payable and accrued liabilities in the Consolidated Balance Sheets are the following balances:
(In thousands) | December 31, 2016 | January 2, 2016 | |||||
Trade accounts payable | $ | 37,800 | $ | 18,616 | |||
Payable to members of the HDMI and MHL consortia* | 9,698 | 16,643 | |||||
Other accrued expenses | 33,435 | 39,039 | |||||
Total accounts payable and accrued expenses | $ | 80,933 | $ | 74,298 | |||
* As an agent of the HDMI and MHL consortia, we administer royalty reporting and distributions to the members of these
consortia. This excludes amounts payable to us, and is payable quarterly based on collections from HDMI and MHL
customers. Our role as the agent of the HDMI consortium terminated on January 1, 2017.
Note 12 - Redeemable Noncontrolling Interest
With the acquisition of Silicon Image on March 10, 2015, we also assumed a redeemable noncontrolling interest which comprised a 7% investment in Qterics amounting to $7.0 million invested by the noncontrolling interest holder initially entered into on December 4, 2014. The investment was redeemable at fair market value at the third-party holder's option on the third, fourth, or fifth year anniversaries. If the fair market value at the redemption date, as negotiated and agreed to by the parties, did not exceed $21 million, the redemption price would be 130% of the fair market value.
As of the acquisition date, the fair value of the noncontrolling interest was determined to be $7.2 million (Note 7), recorded as temporary equity and reported as Redeemable noncontrolling interest in the Consolidated Balance Sheets. The Company elected to accrete the carrying value to the estimated redemption value over the three-year redemption period and reported the accretion charge as a reduction to additional-paid-in-capital. During fiscal 2015, we recorded cumulative accretion charges amounting to $0.4 million bringing the value of the redeemable noncontrolling interest to $7.6 million.
During the fourth quarter of fiscal 2015, we entered into an agreement with the holder pursuant to which the entire interest was redeemed for a cash payment of approximately $0.9 million. The difference between the carrying value and the redemption amount totaling approximately $6.7 million was recorded as additional-paid-in-capital during the year ended January 2, 2016.
70
Note 13 - Lease Obligations
Certain of our facilities are leased under operating leases, which expire at various times through 2026. Rental expense under operating leases was $9.5 million, $7.4 million and $4.5 million for fiscal years 2016, 2015 and 2014, respectively. Future minimum lease commitments at December 31, 2016 were as follows:
Fiscal year | Amount | |||
(In thousands) | ||||
2017 | $ | 7,220 | ||
2018 | 5,890 | |||
2019 | 4,559 | |||
2020 | 4,528 | |||
2021 | 4,583 | |||
Thereafter | 18,965 | |||
$ | 45,745 | |||
Note 14 - Income Taxes
The domestic and foreign components of (loss) income before income taxes were as follows:
Year Ended | ||||||||||||
(In thousands) | December 31, 2016 | January 2, 2016 | January 3, 2015 | |||||||||
Domestic | $ | (32,503 | ) | $ | (92,737 | ) | $ | 6,292 | ||||
Foreign | (10,220 | ) | (33,464 | ) | 36,649 | |||||||
(Loss) income before taxes | $ | (42,723 | ) | $ | (126,201 | ) | $ | 42,941 | ||||
The components of the income tax expense (benefit) are as follows:
Year Ended | ||||||||||||
(In thousands) | December 31, 2016 | January 2, 2016 | January 3, 2015 | |||||||||
Current: | ||||||||||||
Federal | $ | 1,896 | $ | 968 | $ | 329 | ||||||
State | 13 | 80 | 5 | |||||||||
Foreign | 7,918 | 10,634 | 1,944 | |||||||||
9,827 | 11,682 | 2,278 | ||||||||||
Deferred: | ||||||||||||
Federal | — | 18,713 | (7,416 | ) | ||||||||
State | — | 2,318 | (513 | ) | ||||||||
Foreign | 90 | (173 | ) | 12 | ||||||||
90 | 20,858 | (7,917 | ) | |||||||||
Income tax expense (benefit) | $ | 9,917 | $ | 32,540 | $ | (5,639 | ) | |||||
71
Income tax expense (benefit) differs from the amount of income tax determined by applying the applicable U.S. statutory federal income tax rate to pretax income as a result of the following differences:
Year Ended | ||||||
December 31, 2016 | January 2, 2016 | January 3, 2015 | ||||
% | % | % | ||||
Statutory federal rate | (35) | (35) | 35 | |||
Adjustments for tax effects of: | ||||||
State taxes, net | 7 | (6) | 1 | |||
Research and development credits | (2) | (3) | (9) | |||
Stock compensation | 3 | 1 | 1 | |||
Foreign rate differential | 14 | 12 | (25) | |||
Foreign dividends | — | 5 | 1 | |||
Foreign withholding taxes | 9 | 3 | — | |||
Capital loss expiration | — | — | 7 | |||
Other permanent | 3 | 4 | — | |||
Goodwill impairment | — | 4 | — | |||
Valuation allowance | 17 | 46 | (23) | |||
Change in uncertain tax benefit accrual | 5 | (8) | 1 | |||
Tax rate change | — | 3 | (4) | |||
Other | 2 | — | 2 | |||
Effective income tax rate | 23 | 26 | (13) | |||
ASC 740, “Income Taxes”, provides for the recognition of deferred tax assets if realization of these assets is more-likely-than-not. We evaluate both positive and negative evidence to determine if some or all of our deferred tax assets should be recognized on a quarterly basis.
During the fourth quarter of 2014, we concluded that it was more-likely-than-not that we would be able to realize the benefit of a portion of our remaining deferred tax assets, resulting in a tax benefit of $11.5 million and a federal and state net deferred tax asset of $21.3 million. We based this conclusion on improved operating results over the past two years and our expectations about generating taxable income in the foreseeable future. We exercised significant judgment and considered estimates about our ability to generate revenue, gross profits, operating income and jurisdictional taxable income in future periods under our tax structure in reaching this decision.
In 2015, we completed the acquisition of Silicon Image, Inc. At the time of the acquisition, we evaluated the combined entity's net deferred income taxes, which included an assessment of the cumulative income or loss over the prior three-year period, to determine if a valuation allowance is required. After considering the significant loss for 2015, we concluded that it was more-likely-than-not that we would not be able to realize the benefit of our remaining U.S. deferred tax assets, resulting in an increase to the valuation allowance and an increase to the tax provision of $21.0 million. We exercised significant judgment and considered estimates about our ability to generate revenue and gross profits sufficient enough to offset expenditures in future periods within the United States.
In 2016, we continued to evaluate the valuation allowance position in the United States and concluded we should maintain a valuation allowance against the net federal and state deferred tax assets.
We will continue to evaluate both positive and negative evidence in future periods to determine if more deferred tax assets should be recognized. We don't have a valuation allowance in any foreign jurisdictions as it has been concluded it is more likely than not that we will realize the net deferred tax assets in future periods. The net increase in the total valuation allowance affecting the effective tax rate for the year ended December 31, 2016 was approximately $7.5 million.
72
The components of our net deferred tax assets are as follows:
(In thousands) | December 31, 2016 | January 2, 2016 | ||||||
Deferred tax assets: | ||||||||
Accrued expenses and reserves | $ | 5,143 | $ | 5,690 | ||||
Inventory | 290 | 303 | ||||||
Deferred Revenue | 426 | 3,177 | ||||||
Stock-based and deferred compensation | 7,269 | 7,674 | ||||||
Intangible assets | 20,063 | 16,959 | ||||||
Fixed assets | 678 | — | ||||||
Net operating loss carry forwards | 137,521 | 131,829 | ||||||
Tax credit carry forwards | 89,174 | 87,909 | ||||||
Capital loss carry forwards | 962 | 1,262 | ||||||
Other | 2,975 | 2,458 | ||||||
264,501 | 257,261 | |||||||
Less: valuation allowance | (260,687 | ) | (252,578 | ) | ||||
Net deferred tax assets | 3,814 | 4,683 | ||||||
Deferred tax liabilities: | ||||||||
Fixed Assets | — | 791 | ||||||
Other | 3,746 | 3,734 | ||||||
Total deferred tax liabilities | 3,746 | 4,525 | ||||||
Net deferred tax assets | $ | 68 | $ | 158 | ||||
At December 31, 2016, we had federal net operating loss carryforwards (pretax) of approximately $367.0 million that expire at various dates between 2025 and 2036. We had state net operating loss carryforwards (pretax) of approximately $193.3 million that expire at various dates from 2017 through 2036. We also had federal and state credit carryforwards of $49.2 million and $56.7 million of which $55.5 million do not expire. The remaining credits expire at various dates from 2017 through 2036.
Future utilization of federal and state net operating losses and tax credit carry forwards may be limited if cumulative changes to ownership exceed 50% within any three-year period, which has not occurred through fiscal 2016. However, if there is a significant change in ownership, the future utilization may be limited and the deferred tax asset would be reduced to the amount available.
At December 31, 2016, U.S. income taxes were not provided for approximately $3.0 million of the undistributed earnings of our Chinese subsidiary. We intend to reinvest these earnings indefinitely. If these earnings were distributed to the U.S. in the form of dividends or otherwise, we would be subject to additional U.S. income taxes and foreign withholding taxes.
At December 31, 2016, our unrecognized tax benefits associated with uncertain tax positions were $47.6 million, of which $44.5 million, if recognized, would affect the effective tax rate, subject to valuation allowance. As of December 31, 2016, interest and penalties associated with unrecognized tax benefits were $7.5 million.
73
The following table summarizes the changes to unrecognized tax benefits for fiscal years 2016, 2015 and 2014:
(In thousands) | Amount | |||
Balance at December 28, 2013 | $ | 22,643 | ||
Additions based on tax positions related to the current year | 770 | |||
Additions based on tax positions of prior years | — | |||
Reduction for tax positions of prior years | (4,673 | ) | ||
Settlements | — | |||
Reduction as a result of lapse of applicable statute of limitations | (67 | ) | ||
Balance at January 3, 2015 | 18,673 | |||
Additions based on tax positions related to the current year | 4,381 | |||
Additions based on tax positions of prior years | — | |||
Additions due to acquisition | 41,083 | |||
Reduction for tax positions of prior years | (14,958 | ) | ||
Settlements | — | |||
Reduction as a result of lapse of applicable statute of limitations | (972 | ) | ||
Balance at January 2, 2016 | 48,207 | |||
Additions based on tax positions related to the current year | 2,573 | |||
Additions based on tax positions of prior years | 530 | |||
Additions due to acquisition | — | |||
Reductions for tax positions of prior years | (1,824 | ) | ||
Settlements | — | |||
Reduction as a result of lapse of applicable statute of limitations | (1,863 | ) | ||
Balance at December 31, 2016 | $ | 47,623 | ||
At December 31, 2016, it is reasonably possible that $2.2 million of unrecognized tax benefits and $0.1 million of associated interest and penalties could significantly change during the next twelve months. Our liability for uncertain tax positions (including penalties and interest) was $29.6 million and $26.9 million at December 31, 2016 and January 2, 2016, respectively, and is recorded as a component of other long-term liabilities on our Consolidated Balance Sheets. The remainder of our uncertain tax position exposure is netted against deferred tax assets.
Our income tax return for India is currently under examination for the tax year ended March 31, 2015. We are not under examination in any other jurisdiction.
We are subject to federal and state income tax as well as income tax in the various foreign jurisdictions in which we operate. Additionally, the years that remain subject to examination are 2013 for federal income taxes, 2012 for state income taxes, and 2010 for foreign income taxes, including years ending thereafter. However, to the extent allowed by law, the tax authorities may have the right to examine prior periods where net operating losses or tax credits were generated and carried forward, and make adjustments up to the amount of the net operating losses or credit carryforward amount.
The Tax Increase Prevention Tax Act of 2014 was enacted into law in the fourth quarter of 2014 and extended the research and development tax credit through December 31, 2014. On December 18, 2015, the Protecting Americans from Tax Hikes Act of 2015 was enacted. The Act included several business tax provisions including the permanent extension of the credit for qualified research and development. The tax benefit in each year resulting from these reinstatements of the federal research and development tax credit was offset by a valuation allowance and therefore did not impact our annual effective tax rate.
74
Note 15 - Restructuring
In March 2015, our Board of Directors approved an internal restructuring plan (the "March 2015 Plan"), in connection with our acquisition of Silicon Image. The March 2015 Plan was designed to realize synergies from the acquisition by eliminating redundancies created as a result of combining the two companies. This included reductions in our worldwide workforce, consolidation of facilities, and cancellation of software contracts and engineering tools. The March 2015 Plan is substantially complete, subject to certain remaining expected costs that we do not expect to be material and any changes in sublease assumptions should they occur, which will be expensed as incurred under U.S. GAAP rules through the first quarter of fiscal 2017. Under this plan, approximately $7.3 million and $13.3 million of expense was incurred during the years ended December 31, 2016 and January 2, 2016, respectively. Approximately $20.6 million of total expense has been incurred through December 31, 2016 under the March 2015 Plan. We expect the total cost of the March 2015 Plan to be approximately $21.0 million.
In September 2015, we implemented a further reduction of our worldwide workforce (the "September 2015 Reduction") separate from the March 2015 Plan. The September 2015 Reduction was designed to resize the company in line with the market environment and to better balance our workforce with the long-term strategic needs of our business. The September 2015 Reduction is substantially complete, subject to certain remaining expected costs, which we do not expect to be material, which will be expensed as incurred under U.S. GAAP rules through the first quarter of fiscal 2017. Under this reduction, approximately $2.0 million and $5.9 million of expense was incurred during the years ended December 31, 2016 and January 2, 2016, respectively. Approximately $7.9 million of total expense has been incurred through December 31, 2016 under the September 2015 Reduction. We expect the total cost of the September 2015 Reduction to be approximately $8.0 million.
In each of the fiscal years 2015 and 2014, less than $0.1 million of expense was incurred related to a prior restructuring plan. No charges were incurred in fiscal 2016 under this prior plan.
These expenses were recorded to restructuring charges on our Consolidated Statements of Operations. The restructuring accrual balance is presented in accounts payable and accrued expenses (includes restructuring) on the Consolidated Balance Sheets.
The following table displays the activity related to the restructuring plans described above:
(In thousands) | Severance & related * | Lease termination | Software Contracts & Engineering Tools** | Other | Total | ||||||||||||||
Balance at December 28, 2013 | $ | 17 | $ | 368 | $ | — | $ | 147 | $ | 532 | |||||||||
Restructuring charges | — | 1 | — | 9 | 10 | ||||||||||||||
Costs paid or otherwise settled | (8 | ) | (341 | ) | — | (18 | ) | (367 | ) | ||||||||||
Adjustments to prior restructuring costs | (9 | ) | 15 | — | 1 | 7 | |||||||||||||
Balance at January 3, 2015 | $ | — | $ | 43 | — | $ | 139 | $ | 182 | ||||||||||
Restructuring charges | 12,861 | 2,667 | 3,040 | 671 | 19,239 | ||||||||||||||
Costs paid or otherwise settled | (9,165 | ) | (1,705 | ) | (2,663 | ) | (810 | ) | (14,343 | ) | |||||||||
Balance at January 2, 2016 | $ | 3,696 | $ | 1,005 | 377 | $ | — | $ | 5,078 | ||||||||||
Restructuring charges | 2,883 | 2,993 | 1,903 | 1,488 | 9,267 | ||||||||||||||
Costs paid or otherwise settled | (5,778 | ) | (2,962 | ) | (2,255 | ) | (1,476 | ) | (12,471 | ) | |||||||||
Balance at December 31, 2016 | $ | 801 | $ | 1,036 | $ | 25 | $ | 12 | $ | 1,874 | |||||||||
* Includes employee relocation costs
**Includes cancellation of contracts, asset impairments, and accelerated depreciation on certain enterprise resource planning and customer
relationship management systems
Note 16 - Long-Term Debt
On March 10, 2015, we entered into a secured credit agreement (the "Credit Agreement") with Jefferies Finance, LLC and certain other lenders for purposes of funding, in part, our acquisition of Silicon Image. The Credit Agreement provided for a $350 million term loan (the "Term Loan") maturing on March 10, 2021 (the "Term Loan Maturity Date"). We received $346.5 million net of an original issue discount of $3.5 million and we paid debt issuance costs of $8.3 million. The Term Loan bears variable interest equal to the 6-month LIBOR as of December 31, 2016, subject to a 1.00% floor, plus a spread of 4.25%. The current effective interest rate on the Term Loan is 6.20%.
75
The Term Loan is payable through a combination of (i) quarterly installments of approximately $0.9 million, which began on July 4, 2015, (ii) annual excess cash flow payments as defined in the Credit Agreement, which are due 95 days after the last day of our fiscal year, and (iii) any payments due upon certain issuances of additional indebtedness and certain asset dispositions, with any remaining outstanding principal amount due and payable on the Term Loan Maturity Date. The percentage of excess cash flow we are required to pay ranges from 0% to 75%, depending on our leverage and other factors as defined in the Credit Agreement. Currently, the Credit Agreement would require a 75% excess cash flow payment. In the second quarter of fiscal 2016, we made a required additional principal payment of $1.7 million due to the sale of Qterics.
Due to the combination of payments described above, our calculation of the current portion of long-term debt depends on activity that has occurred subsequent to December 31, 2016. Since our Earnings Release on February 15, 2017, we have entered into a patent monetization transaction that has triggered a $17.9 million increase to current portion of long-term debt presented in the Consolidated Balance Sheets. Over the next twelve months, we expect to be required to make principal payments of approximately $32.5 million, in addition to required quarterly payments.
While the Credit Agreement does not contain financial covenants, it does contain informational covenants and certain restrictive covenants, including limitations on liens, mergers and consolidations, sales of assets, payment of dividends, and indebtedness. We were in compliance with all such covenants at December 31, 2016.
The original issue discount and the debt issuance costs have been accounted for as a reduction to the carrying value of the Term Loan on our Consolidated Balance Sheets and are being amortized to interest expense in our Consolidated Statements of Operations over the contractual term, using the effective interest method.
The fair value of the Term Loan approximates the carrying value, which is reflected in our Consolidated Balance Sheets as follows:
(in thousands) | December 31, 2016 | January 2, 2016 | |||||
Principal amount | $ | 342,221 | $ | 347,375 | |||
Unamortized original issue discount and debt issuance costs | (7,599 | ) | (8,948 | ) | |||
Less: Current portion of long-term debt | (33,767 | ) | (7,557 | ) | |||
Long-term debt | $ | 300,855 | $ | 330,870 | |||
Interest expense related to the Term Loan was included in Interest expense on the Consolidated Statements of Operations as follows:
Year Ended | |||||||||||
(in thousands) | December 31, 2016 | January 2, 2016 | January 3, 2015 | ||||||||
Contractual interest | $ | 18,518 | $ | 15,225 | $ | — | |||||
Amortization of debt issuance costs and discount | 1,350 | 2,835 | — | ||||||||
Total Interest expense related to the Term Loan | $ | 19,868 | $ | 18,060 | $ | — | |||||
As of December 31, 2016, minimum expected future principal payments on the Term Loan were as follows:
Fiscal year | (in thousands) | |||
2017 | $ | 35,996 | ||
2018 | 20,813 | |||
2019 | 52,583 | |||
2020 | 89,113 | |||
2021 | 143,716 | |||
$ | 342,221 | |||
Note 17 - Common Stock Repurchase Program
On March 3, 2014, our Board of Directors approved a stock repurchase program pursuant to which up to $20.0 million of outstanding common stock may be repurchased from time to time. The duration of the repurchase program was twelve months. Under this program during fiscal 2014, approximately 1.9 million shares were repurchased for $13.1 million. The 2014 program completed during the first quarter of fiscal 2015, during which approximately 1.1 million shares were repurchased for approximately $7.0 million. All shares repurchased under the 2014 program were retired by the end of the fiscal year in which they were repurchased. All repurchases were open market transactions funded from available working capital.
76
Note 18 - Stockholders' Equity
Employee and Director Stock Options, Restricted Stock and ESPP
We have four equity incentive plans (the "1996 Stock Incentive Plan," the "2001 Stock Plan," the "2013 Incentive Plan" and the "2011 Non-Employee Director Equity Incentive Plan"). Awards granted under the 1996 Stock Incentive Plan and the 2001 Stock Plan remain outstanding, but no shares are available for future awards under these plans. Shares remain available for grants to employees and non-employee directors only under the 2013 Incentive Plan and the 2011 Non-Employee Director Equity Incentive Plan. "Incentive stock options" under Section 422 of the U.S. Internal Revenue Code and restricted stock unit ("RSU") grants are part of our equity compensation practices for employees who receive equity grants. Options and RSUs generally vest quarterly over a four-year period beginning on the grant date. The contractual terms of options granted do not exceed ten years.
In May 2012, the Company's stockholders approved the 2012 Employee Stock Purchase Plan ("2012 ESPP"), which authorizes the issuance of 3.0 million shares of common stock to eligible employees to purchase shares of common stock through payroll deductions, which cannot exceed 10% of an employee's compensation. The purchase price of the shares is the lower of 85% of the fair market value of the stock at the beginning of each six-month offering period or 85% of the fair market value at the end of such period. Employees are required to hold purchased shares for six months. We have treated the 2012 ESPP as a compensatory plan and recorded related compensation expense of $0.6 million, $0.4 million and $0.3 million for the fiscal years 2016, 2015 and 2014, respectively.
At December 31, 2016, a total of 1.3 million shares of our common stock were available for future grants under the 2013 Incentive Plan and the 2011 Non-Employee Director Equity Incentive Plan. Shares subject to stock option grants that expire or are canceled, without delivery of such shares, generally become available for re-issuance under equity incentive plans. At December 31, 2016, a total of 1.9 million shares of our common stock were available for future purchases under the 2012 ESPP. On March 10, 2015, in conjunction with the acquisition of Silicon Image, we assumed certain outstanding stock option and RSU grants of the Silicon Image Equity Incentive Plans. We assumed all stock option grants that were unvested or vested and out-of-the-money and all outstanding unvested RSU grants. The exchange ratio for the conversion was 1.09816 for all grants. The conversion ratio was determined by the weighted average closing price of Lattice common stock for the ten days prior to the acquisition date divided by the offer price of $7.30. The converted outstanding option grants totaled 2,087,605 shares and converted RSU grants totaled 2,025,255 shares as of March 10, 2015. As of December 31, 2016, 787,130 options and 228,659 RSU shares arising from this conversion remained outstanding.
Stock-Based Compensation
Total stock-based compensation expense included in our Consolidated Statements of Operations was as follows:
Year Ended | ||||||||||||
(In thousands) | December 31, 2016 | January 2, 2016 | January 3, 2015 | |||||||||
Cost of products sold | $ | 888 | $ | 1,416 | $ | 819 | ||||||
Research and development | 7,928 | 9,141 | 5,176 | |||||||||
Selling, general, and administrative | 7,397 | 6,793 | 6,807 | |||||||||
Acquisition related charges | — | 4,293 | — | |||||||||
Total stock-based compensation | $ | 16,213 | $ | 21,643 | $ | 12,802 | ||||||
Of the $21.6 million total stock-based compensation for the twelve months ended January 2, 2016, $3.9 million was paid in cash during the period as a result of the acquisition of Silicon Image on March 10, 2015.
ASC 718, “Compensation-Stock Compensation (“ASC 718”),” requires that we recognize compensation expense for only the portion of employee and director options and ESPP rights that are expected to vest.
The fair values of each option award on the date of grant and of the shares expected to be issued under the employee stock purchase plan are estimated using the Black-Scholes valuation model and the assumptions noted in the following table. The expected term is based on historical vested option exercises and includes an estimate of the expected term for options that are fully vested and outstanding. The expected volatility of both stock options and ESPP shares is based on the daily historical volatility of our stock price, measured over the expected term of the option or the ESPP purchase period. The risk-free interest rate is based on the implied yield on a U.S. Treasury zero-coupon issue with a remaining term closest to the expected term of the option. The dividend yield reflects that we have not paid any cash dividends since inception and do not intend to pay any cash dividends in the foreseeable future.
77
The following table summarizes the assumptions used in the valuation of stock option and ESPP compensation for fiscal years 2016, 2015, and 2014:
Year Ended | |||||
December 31, 2016 | January 2, 2016 | January 3, 2015 | |||
Employee and Director Stock Options | |||||
Expected volatility | 44.2% to 50.8% | 43.6% to 47.3% | 45.4% to 50.4% | ||
Risk-free interest rate | .94% - 2.06% | 1.4% to 1.7% | 1.5% to 1.7% | ||
Expected term (years) | 4.06 - 4.78 | 4.08 to 4.75 | 4.1 to 4.7 | ||
Dividend yield | —% | —% | —% | ||
Employee Stock Purchase Plan | |||||
Weighted average expected volatility | 57.9% | 33.6% | 38.7% | ||
Weighted average risk-free interest rate | 0.43% | 0.12% | 0.08% | ||
Expected term | 6 months | 6 months | 6 months | ||
Dividend yield | —% | —% | —% | ||
At December 31, 2016, there was $11.0 million of total unrecognized compensation cost related to unvested employee and director stock options, which is expected to be recognized over a weighted average period of 2.6 years. Our current practice is to issue new shares to satisfy option exercises. Compensation expense for all stock-based compensation awards is recognized using the straight-line method.
The following table summarizes our stock option activity and related information for the year ended December 31, 2016:
(Shares and aggregate intrinsic value in thousands) | Shares | Weighted average exercise price | Weighted average remaining contractual term (years) | Aggregate Intrinsic Value | ||||||||
Balance, January 2, 2016 | 11,444 | $ | 5.46 | |||||||||
Granted | 3,907 | 5.65 | ||||||||||
Exercised | (1,466 | ) | 3.91 | |||||||||
Forfeited or expired | (1,319 | ) | 5.47 | |||||||||
Balance, December 31, 2016 | 12,566 | $ | 5.70 | |||||||||
Vested and expected to vest at December 31, 2016 | 12,566 | $ | 5.70 | 4.39 | $ | 20,966 | ||||||
Exercisable, December 31, 2016 | 6,876 | $ | 5.65 | 3.15 | $ | 11,851 | ||||||
The aggregate intrinsic value in the table above represents the total pretax intrinsic value (the difference between the Company's closing stock price on the last trading day of the fiscal year and the exercise price, multiplied by the number of in-the-money options) that would have been received by the option holders had all option holders exercised their options on that day. This amount changes based on the fair market value of the Company's stock. Total intrinsic value of options exercised for fiscal 2016, 2015 and 2014, and was $3.3 million, $2.5 million and $7.8 million, respectively. The total fair value of options and RSUs vested and expensed in fiscal 2016, 2015 and 2014 and was $15.6 million, $18.0 million and $12.8 million, respectively.
The resultant grant date weighted-average fair values for stock options granted, calculated using the Black-Scholes option pricing model with the noted assumptions for stock options, were $2.14, $2.35 and $2.93 for fiscal years 2016, 2015 and 2014, respectively. The weighted average fair values for the ESPP, calculated using the Black-Scholes option pricing model with the noted assumptions for the ESPP, were $1.82, $1.51 and $1.73 for fiscal years 2016, 2015 and 2014, respectively.
78
The following table summarizes our RSU activity for the year ended December 31, 2016:
(Shares in thousands) | Shares | Weighted average grant date fair value | ||||
Balance, January 2, 2016 | 4,757 | $ | 5.95 | |||
Granted | 1,376 | 5.64 | ||||
Exercised | (1,742 | ) | 5.97 | |||
Forfeited or expired | (1,144 | ) | 5.68 | |||
Balance, December 31, 2016 | 3,247 | $ | 5.90 | |||
At December 31, 2016 there was $16.2 million of total unrecognized compensation cost related to unvested RSUs. Our current practice is to issue new shares when RSUs vest. Compensation expense for RSUs is recognized using the straight-line method over the related vesting period.
We granted stock options and RSUs with a market condition to certain executives, amounting to approximately 321,900 stock options during fiscal 2016 and approximately 327,200 stock options and 70,000 RSUs during fiscal 2015. Of fiscal 2015 grants, 21,540 stock options and 70,000 RSUs were canceled in fiscal 2016 upon the departure of certain executives. The options and RSUs have a two year vesting and vest between 0% and 200% of the target amount, based on the Company's relative Total Shareholder Return (TSR) when compared to the TSR of a component of companies of the PHLX Semiconductor Sector Index over a two year period. TSR is a measure of stock price appreciation plus dividends paid, if any, in the performance period. The fair values of the options were determined and fixed on the date of grant using a lattice-based option-pricing valuation model, which incorporates a Monte-Carlo simulation, and considered the likelihood that we would achieve the market condition. Of these grants with a market condition, approximately 596,600 stock options were outstanding as of December 31, 2016. We incurred stock compensation expense related to these market condition awards of approximately $0.8 million in fiscal 2016 and approximately $0.6 million in fiscal 2015.
During fiscal year 2014, we granted approximately 98,600 market-based RSUs in two equal tranches, each of which vest upon achievement of certain market-based conditions. The fair values of the market-based RSUs were determined and fixed on the date of grant using a lattice-based option-pricing valuation model, which incorporates a Monte-Carlo simulation, and considered the likelihood that we would achieve the market-based conditions. Both tranches vested and we incurred total stock compensation expense related to performance based awards of $0.7 million for the fiscal year ended January 3, 2015.
The following table summarizes the assumptions used in the valuation of stock options and RSUs with a market condition for fiscal years 2016, 2015 and 2014:
Year Ended | |||||
December 31, 2016 | January 2, 2016 | January 3, 2015 | |||
Executive stock options with a market condition | |||||
Expected volatility | 46% | 44% to 46% | n/a | ||
Risk-free interest rate | 1.1% | 1.4% | n/a | ||
Expected term (years) | 4.5 | 4.5 | n/a | ||
Dividend yield | —% | —% | n/a | ||
Executive RSUs with a market condition | |||||
Expected volatility | n/a | 36.9% | 53.5% | ||
Risk-free interest rate | n/a | 0.6% | 2.2% | ||
Expected term (years) | n/a | 2.0 | 0.2 | ||
Dividend yield | n/a | —% | —% | ||
Note 19 - Employee Benefit Plans
Qualified Investment Plan
In 1990, we adopted a 401(k) plan, which provides participants with an opportunity to accumulate funds for retirement. The plan does not allow investments in the Company's common stock. The plan allows for the Company to make discretionary matching contributions in cash. We recorded matching contributions of $0.9 million in each of fiscal 2016 and 2015. No matching contributions were recorded in fiscal 2014.
79
2016 Cash Incentive Plan
On December 21, 2015, upon the recommendation of the Compensation Committee, the Board of Directors of the Company approved the 2016 Cash Incentive Plan (the “2016 Cash Plan”). The chief executive officer, other executive officers, and other members of senior management, including vice presidents and director-level employees, together with all other employees of the Company not on the Company's sales incentive plan are eligible to participate in the 2016 Cash Plan. Under the 2016 Cash Plan, individual cash incentive payments for the eligible employees will be based both on Company financial performance, as measured by achievement of operating income (before incentive plan accruals) and revenue goals within specified ranges established by the Compensation Committee, and Company performance, as measured by the achievement of personal management objectives. The Compensation Committee determines the performance of the chief executive officer, the chief financial officer and other participants based on the achievement of the management objectives established by the Compensation Committee during the first fiscal quarter of 2016. There was $4.7 million of expense recorded under this plan in fiscal 2016.
2015 Cash Incentive Plan
On December 4, 2014, upon the recommendation of the Compensation Committee, the Board of Directors of the Company approved the 2015 Cash Incentive Plan (the “2015 Cash Plan”). The chief executive officer, other executive officers, and other members of senior management, including vice presidents and director-level employees, together with all other employees of the Company not on the Company's sales incentive plan were eligible to participate in the 2015 Cash Plan. Under the 2015 Cash Plan, individual cash incentive payments for the eligible employees were based both on Company financial performance, as measured by achievement of operating income (before incentive plan accruals) and revenue goals within specified ranges established by the Compensation Committee, and Company performance, as measured by the achievement of personal management objectives. The Compensation Committee determined the performance of the chief executive officer, the chief financial officer and other participants based on the achievement of the management objectives established by the Compensation Committee during the first fiscal quarter of 2015. There was $1.0 million of expense recorded under this plan in fiscal 2015.
2014 Cash Incentive Plan
On February 3, 2014, upon the recommendation of the Compensation Committee, the Board of Directors of the Company approved the 2014 Cash Incentive Plan (the “2014 Cash Plan”). The chief executive officer, other executive officers, and other members of senior management, including vice presidents and director-level employees, together with all other employees of the Company not on the Company's sales incentive plan were eligible to participate in the 2014 Cash Plan. Under the 2014 Cash Plan, individual cash incentive payments for the eligible employees were based both on Company financial performance, as measured by achievement of operating income (before incentive plan accruals) and revenue goals within specified ranges established by the Compensation Committee, and Company performance, as measured by the achievement of personal management objectives. The Compensation Committee determined the performance of the chief executive officer, the chief financial officer and other participants based on the achievement of the management objectives established by the Compensation Committee during the first fiscal quarter of 2014. There was $11.6 million of expense recorded under this plan in fiscal 2014.
Note 20 - Contingencies
Legal Matters
In February 2016, we filed a complaint against Technicolor SA and its affiliates in the United States District Court for the Northern District of California alleging that Technicolor had infringed on certain patents relating to the HDMI specification. Technicolor filed an answer to our complaint on April 11, 2016, which included various defenses to the alleged patent infringement. In November 2016, Technicolor amended its answer and asserted a counterclaim, alleging that the Company’s action constituted a breach of the HDMI Founders Agreement to provide licenses on fair, reasonable and non-discriminatory terms. Technicolor seeks declaratory relief and compensation for the alleged breach. At this stage of the proceedings, we do not have an estimate of the likelihood or the amount of any financial consequences to us.
On or about January 9, 2017, Lattice, members of our Board, Canyon Bridge Capital Partners, Inc., Canyon Bridge Acquisition Company, Inc. and Canyon Bridge Merger Sub Inc. were named as defendants in a complaint filed in the United States District Court for the District of Oregon by an alleged stockholder of the Company in connection with the proposed acquisition of the Company by Canyon Bridge. The complaint was captioned Paul Parshall, et al. v. Lattice, et al. and alleges violations of federal securities laws based on alleged deficiencies in the disclosure provided to shareholders regarding the transaction. An additional complaint was subsequently filed on or about January 27, 2017, naming Lattice and members of our Board, in the United States district Court for the District of Delaware. This complaint is captioned Robert Sellers, et al. v. Lattice, et al. We believe that we possess defenses to these claims and intend to vigorously defend this litigation. At this stage of the proceedings, we do not have an estimate of the likelihood or the amount of any potential exposure to the Company, if any.
80
We are exposed to certain other asserted and unasserted potential claims. There can be no assurance that, with respect to potential claims made against us, we could resolve such claims under terms and conditions that would not have a material adverse effect on our business, our liquidity or our financial results. Periodically, we review the status of each significant matter and assess its potential financial exposure. If the potential loss from any claim or legal proceeding is considered probable and a range of possible losses can be estimated, we then accrue a liability for the estimated loss based on the provisions of FASB ASC 450, “Contingencies" (“ASC 450”). Legal proceedings are subject to uncertainties, and the outcomes are difficult to predict. Because of such uncertainties, accruals are based only on the best information available at the time. As additional information becomes available, we reassess the potential liability related to pending claims and litigation and may revise estimates.
Note 21 - Valuation and Qualifying Accounts
The following table displays the activity related to changes in our valuation and qualifying accounts:
(In thousands) | Balance at beginning of period | Balance received through acquisition | Charged (Credit) to costs and expenses | Charged to other accounts | Settlements & write-offs net of recoveries | Balance at end of period | |||||||||||||||||
Fiscal year ended December 31, 2016 | |||||||||||||||||||||||
Allowance for deferred taxes | $ | 252,578 | $ | — | $ | 7,450 | $ | 659 | $ | — | $ | 260,687 | |||||||||||
Allowance for doubtful accounts | 621 | — | 7,362 | 2,284 | (968 | ) | 9,299 | ||||||||||||||||
Allowance for warranty expense | 370 | — | 216 | — | (234 | ) | 352 | ||||||||||||||||
$ | 253,569 | $ | — | $ | 15,028 | $ | 2,943 | $ | (1,202 | ) | $ | 270,338 | |||||||||||
Fiscal year ended January 2, 2016 | |||||||||||||||||||||||
Allowance for deferred taxes | $ | 141,215 | $ | 52,481 | $ | 58,658 | $ | 224 | $ | — | $ | 252,578 | |||||||||||
Allowance for doubtful accounts | 875 | — | (438 | ) | 189 | (5 | ) | 621 | |||||||||||||||
Allowance for warranty expense | 81 | 136 | 153 | — | — | 370 | |||||||||||||||||
$ | 142,171 | $ | 52,617 | $ | 58,373 | $ | 413 | $ | (5 | ) | $ | 253,569 | |||||||||||
Fiscal year ended January 3, 2015 | |||||||||||||||||||||||
Allowance for deferred taxes | $ | 150,528 | $ | — | $ | (9,958 | ) | $ | 645 | $ | — | $ | 141,215 | ||||||||||
Allowance for doubtful accounts | 878 | — | — | — | (3 | ) | 875 | ||||||||||||||||
Allowance for warranty expense | — | — | 81 | — | — | 81 | |||||||||||||||||
$ | 151,406 | $ | — | $ | (9,877 | ) | $ | 645 | $ | (3 | ) | $ | 142,171 | ||||||||||
Note 22 - Segment and Geographic Information
Segment Information
As of December 31, 2016, we had one operating segment: the core Lattice business, which includes IP and semiconductor devices. Qterics, a discrete software-as-a-service business unit, was previously an immaterial operating segment in the Lattice legal entity structure. In April 2016, we sold Qterics to an unrelated third party for net proceeds of $2.0 million, net of cash sold, resulting in a gain of $2.6 million. The gain has been included in other income (expense), net for the year ended December 31, 2016 in the Consolidated Statements of Operations.
81
Geographic Information
Our revenue by major geographic area based on ship-to location was as follows:
Year Ended | ||||||||||||||||||
(In thousands) | December 31, 2016 | January 2, 2016 | January 3, 2015 | |||||||||||||||
United States: | $ | 51,752 | 12% | $ | 33,677 | 8% | $ | 30,848 | 8% | |||||||||
China | 146,645 | 34 | 147,688 | 36 | 159,155 | 43 | ||||||||||||
Europe | 59,835 | 14 | 55,596 | 14 | 59,041 | 16 | ||||||||||||
Japan | 49,080 | 12 | 44,067 | 11 | 31,207 | 9 | ||||||||||||
Taiwan | 31,322 | 7 | 31,181 | 8 | 6,691 | 2 | ||||||||||||
Other Asia | 78,046 | 18 | 85,598 | 21 | 69,778 | 19 | ||||||||||||
Other Americas | 10,374 | 3 | 8,159 | 2 | 9,407 | 3 | ||||||||||||
Total foreign revenue | 375,302 | 88 | 372,289 | 92 | 335,279 | 92 | ||||||||||||
Total revenue | $ | 427,054 | 100% | $ | 405,966 | 100% | $ | 366,127 | 100% | |||||||||
We assign revenue to geographies based on the customer ship-to address at the point where revenue is recognized. In the case of sell-in distributors and OEM customers, revenue is typically recognized, and geography is assigned, when products are shipped to our distributor or customer. In the case of sell-through distributors, revenue is recognized when resale occurs and geography is assigned based on the customer location on the resale reports provided by the distributor.
Our property and equipment, net by country at the end of each period was as follows:
(In thousands) | December 31, 2016 | January 2, 2016 | |||||
United States | $ | 30,532 | $ | 25,615 | |||
China | 10,617 | 14,998 | |||||
Philippines | 4,928 | 3,948 | |||||
Taiwan | 2,310 | 3,677 | |||||
India | 215 | 1,470 | |||||
Japan | 637 | 1,211 | |||||
Other | 242 | 933 | |||||
Total foreign property and equipment, net | 18,949 | 26,237 | |||||
Total property and equipment, net | $ | 49,481 | $ | 51,852 | |||
Revenue by Distributors
Our largest customers are often distributors and sales through distributors have historically made up a significant portion of our total revenue. Revenue attributable to resales of products by our primary distributors are as follows:
% of Total Revenue | ||||||||
2016 | 2015 | 2014 | ||||||
Arrow Electronics Inc. | 24 | % | 20 | % | 24 | % | ||
Weikeng Group | 22 | 12 | 10 | |||||
All others | 15 | 13 | 11 | |||||
All sell-through distributors | 61 | % | 45 | % | 45 | % | ||
Orders from our sell-through distributors are initially recorded at published list prices; however, for a majority of our sales, the final selling price is determined at the time of resale and in accordance with a distributor price agreement. For this reason, we do not recognize revenue until products are resold by sell-through distributors to an end customer. In certain circumstances, we allow sell-through distributors to return unsold products. At times, we protect our sell-through distributors against reductions in published list prices.
82
Note 23 - Quarterly Financial Data (Unaudited)
A summary of the Company's consolidated quarterly results of operations is as follows:
2016 | 2015 * | |||||||||||||||||||||||||||||||
(In thousands, except per share data) | Q4 | Q3 | Q2 | Q1 | Q4 | Q3 | Q2 | Q1 | ||||||||||||||||||||||||
Revenue | $ | 118,108 | $ | 113,225 | $ | 99,209 | $ | 96,512 | $ | 101,194 | $ | 109,715 | $ | 106,460 | $ | 88,597 | ||||||||||||||||
Gross margin | 63,480 | 67,424 | 58,426 | 57,104 | 54,102 | 59,849 | 58,126 | 47,832 | ||||||||||||||||||||||||
Restructuring charges | 951 | 317 | 2,568 | 5,431 | 3,459 | 6,818 | 4,068 | 4,894 | ||||||||||||||||||||||||
Net loss | $ | (8,164 | ) | $ | (12,414 | ) | $ | (13,810 | ) | $ | (19,711 | ) | $ | (45,454 | ) | $ | (24,862 | ) | $ | (35,570 | ) | $ | (53,347 | ) | ||||||||
Net loss per share - basic and diluted | $ | (0.07 | ) | $ | (0.10 | ) | $ | (0.12 | ) | $ | (0.17 | ) | $ | (0.38 | ) | $ | (0.21 | ) | $ | (0.30 | ) | $ | (0.46 | ) | ||||||||
* Our results for the year ended January 2, 2016 include the results of Silicon Image for the approximately 10-month period from
March 11, 2015 through January 2, 2016. Our results for the year ended December 31, 2016 fully include the results of Silicon
Image. The first quarter of fiscal 2015 ended on April 4, 2015.
83
Report of Independent Registered Public Accounting Firm
The Board of Directors and Stockholders
Lattice Semiconductor Corporation:
We have audited the accompanying consolidated balance sheets of Lattice Semiconductor Corporation and subsidiaries (the Company) as of December 31, 2016 and January 2, 2016, and the related consolidated statements of operations, comprehensive (loss) income, stockholders’ equity, and cash flows for each of the years in the three-year period ended December 31, 2016. These consolidated financial statements are the responsibility of the Company’s management. Our responsibility is to express an opinion on these consolidated financial statements based on our audits.
We conducted our audits in accordance with the standards of the Public Company Accounting Oversight Board (United States). Those standards require that we plan and perform the audit to obtain reasonable assurance about whether the financial statements are free of material misstatement. An audit includes examining, on a test basis, evidence supporting the amounts and disclosures in the financial statements. An audit also includes assessing the accounting principles used and significant estimates made by management, as well as evaluating the overall financial statement presentation. We believe that our audits provide a reasonable basis for our opinion.
In our opinion, the consolidated financial statements referred to above present fairly, in all material respects, the financial position of the Company as of December 31, 2016 and January 2, 2016, and the results of their operations and their cash flows for each of the years in the three-year period ended December 31, 2016, in conformity with U.S. generally accepted accounting principles.
We also have audited, in accordance with the standards of the Public Company Accounting Oversight Board (United States), the Company’s internal control over financial reporting as of December 31, 2016, based on criteria established in Internal Control - Integrated Framework (2013) issued by the Committee of Sponsoring Organizations of the Treadway Commission (COSO), and our report dated March 1, 2017 expressed an unqualified opinion on the effectiveness of the Company’s internal control over financial reporting.
/s/ KPMG LLP
Portland, Oregon
March 1, 2017
84
Report of Independent Registered Public Accounting Firm
The Board of Directors and Stockholders
Lattice Semiconductor Corporation:
We have audited Lattice Semiconductor Corporation and subsidiaries' (the Company) internal control over financial reporting as of December 31, 2016, based on criteria established in Internal Control - Integrated Framework (2013) issued by the Committee of Sponsoring Organizations of the Treadway Commission (COSO). The Company’s management is responsible for maintaining effective internal control over financial reporting and for its assessment of the effectiveness of internal control over financial reporting, included in the accompanying Management’s Report on Internal Control over Financial Reporting appearing under Item 9A. Our responsibility is to express an opinion on the Company’s internal control over financial reporting based on our audit.
We conducted our audit in accordance with the standards of the Public Company Accounting Oversight Board (United States). Those standards require that we plan and perform the audit to obtain reasonable assurance about whether effective internal control over financial reporting was maintained in all material respects. Our audit included obtaining an understanding of internal control over financial reporting, assessing the risk that a material weakness exists, and testing and evaluating the design and operating effectiveness of internal control based on the assessed risk. Our audit also included performing such other procedures as we considered necessary in the circumstances. We believe that our audit provides a reasonable basis for our opinion.
A company’s internal control over financial reporting is a process designed to provide reasonable assurance regarding the reliability of financial reporting and the preparation of financial statements for external purposes in accordance with generally accepted accounting principles. A company’s internal control over financial reporting includes those policies and procedures that (1) pertain to the maintenance of records that, in reasonable detail, accurately and fairly reflect the transactions and dispositions of the assets of the company; (2) provide reasonable assurance that transactions are recorded as necessary to permit preparation of financial statements in accordance with generally accepted accounting principles, and that receipts and expenditures of the company are being made only in accordance with authorizations of management and directors of the company; and (3) provide reasonable assurance regarding prevention or timely detection of unauthorized acquisition, use, or disposition of the company’s assets that could have a material effect on the financial statements.
Because of its inherent limitations, internal control over financial reporting may not prevent or detect misstatements. Also, projections of any evaluation of effectiveness to future periods are subject to the risk that controls may become inadequate because of changes in conditions, or that the degree of compliance with the policies or procedures may deteriorate.
In our opinion, the Company maintained, in all material respects, effective internal control over financial reporting as of December 31, 2016, based on criteria established in Internal Control - Integrated Framework (2013) issued by the Committee of Sponsoring Organizations of the Treadway Commission (COSO).
We also have audited, in accordance with the standards of the Public Company Accounting Oversight Board (United States), the consolidated balance sheets of the Company as of December 31, 2016 and January 2, 2016, and the related consolidated statements of operations, comprehensive (loss) income, stockholders’ equity, and cash flows for each of the years in the three-year period ended December 31, 2016, and our report dated March 1, 2017 expressed an unqualified opinion on those consolidated financial statements.
/s/ KPMG LLP
Portland, Oregon
March 1, 2017
85
Item 9. Changes in and Disagreements with Accountants On Accounting and Financial Disclosure
None.
Item 9A. Controls and Procedures
Conclusion Regarding the Effectiveness of Disclosure Controls and Procedures
Based on management’s evaluation (with the participation of our principal executive officer and principal financial officer), as of the end of the period covered by this annual report, our principal executive officer and principal financial officer have concluded that our disclosure controls and procedures (as defined in Rules 13a-15(e) and 15d-15(e) under the Securities Exchange Act of 1934, as amended, (the “Exchange Act”)) are effective to ensure that information required to be disclosed by us in reports that we file or submit under the Exchange Act is recorded, processed, summarized, and reported within the time periods specified in Securities and Exchange Commission rules and forms and is accumulated and communicated to our management, including our principal executive officer and principal financial officer, as appropriate to allow timely decisions regarding required disclosure.
Management's Report on Internal Control Over Financial Reporting
The management of the Company is responsible for establishing and maintaining adequate internal control over financial reporting as defined in Rules 13a-15(f) or 15d-15(f) under the Securities Exchange Act of 1934. The Company's internal control over financial reporting is a process designed to provide reasonable assurance regarding reliability of financial reporting and the preparation and fair presentation of published financial statements for external purposes in accordance with generally accepted accounting principles.
Because of its inherent limitations, internal control over financial reporting may not prevent or detect misstatements. Also, projections of any evaluation of effectiveness to future periods are subject to the risk that controls may become inadequate because of changes in conditions, or that the degree of compliance with the policies or procedures may deteriorate.
Management assessed the effectiveness of the company's internal control over financial reporting as of December 31, 2016. In making this assessment, management used the criteria set forth by the Committee of Sponsoring Organizations of the Treadway Commission (COSO) in Internal Control - Integrated Framework (2013). Based on this assessment, management concluded that, as of December 31, 2016, the Company's internal control over financial reporting was effective.
KPMG LLP, an independent registered public accounting firm, has audited the Company's financial statements in this report on Form 10-K and issued its report on the effectiveness of the Company's internal control over financial reporting as of December 31, 2016.
Changes in Internal Control over Financial Reporting
On March 10, 2015, we acquired Silicon Image, which had operated under its own set of systems and internal controls. Management excluded the Silicon Image control environment from its assessment of internal controls over financial reporting for the fiscal year ended January 2, 2016, as allowed in the year of acquisition. For the current fiscal year ended December 31, 2016, our financial reporting control environment includes Silicon Image's systems and much of its continuing control environment, which we are maintaining until we incorporate those processes into our planned implementation of a new company-wide enterprise resource planning ("ERP") system in fiscal 2017. We are currently preparing for updates to our control environment in anticipation of this integration and ERP transition.
Other than as described above, there were no changes in our internal controls over financial reporting (as defined in Rules 13a - 15(f) and 15(d) - 15(f) under the Exchanges Act) that occurred during the fourth quarter of fiscal 2016 that have materially affected, or are reasonably likely to materially affect, our internal control over financial reporting.
Item 9B. Other Information
None.
86
PART III
Certain information required by Part III is incorporated by reference from our definitive proxy statement (the “Proxy Statement”) for the 2017 Annual Meeting of Stockholders, pursuant to Regulation 14A of the Securities Exchange Act of 1934, as amended, which we will file not later than 120 days after the end of the fiscal year covered by this report. With the exception of the information expressly incorporated by reference from the Proxy Statement, the Proxy Statement is not to be deemed filed as a part of this report.
Item 10. Directors, Executive Officers and Corporate Governance
Information regarding our directors that is required by this item is incorporated by reference from the information contained under the captions “Proposal 1: Election of Directors” and “Corporate Governance and Other Matters--Board Meetings and Committees” in the Proxy Statement. Information regarding our executive officers that is required by this item is incorporated by reference from the information contained under the caption "Proposal 2: Executive Compensation--The Executive Officers of the Company” in the Proxy Statement.
Information regarding Section 16(a) reporting compliance that is required by this item is incorporated by reference from the information contained under the caption “Section 16(a) Beneficial Ownership Reporting Compliance” in the Proxy Statement.
We have adopted a Code of Conduct that applies to all of our employees, including our principal executive officer, principal financial officer, principal accounting officer, and persons performing similar functions. The Code of Conduct is posted on our website at www.latticesemi.com. There were no changes to our code of conduct during fiscal 2016. Amendments to the Code of Conduct or any grant of a waiver from a provision of the code of ethics requiring disclosure under applicable SEC rules, if any, will be disclosed on our website at www.latticesemi.com.
Information about our “Director Code of Ethics” and written committee charters for our Audit Committee, Compensation Committee, and Nominating and Governance Committee are available free of charge on the Company's website at www.latticesemi.com and are available in print to any shareholder upon request.
There have been no material changes to the procedures by which security holders may recommend nominees to our Board of Directors since the filing of our Annual Report on Form 10-K for the year ended January 2, 2016. The procedures by which security holders may recommend nominees to our Board of Directors were described in detail in the information concerning our Nominating and Governance Committee under the caption “Board Meetings and Committees” in our Proxy Statement filed April 20, 2016.
Information regarding our Audit Committee that is required by this Item is incorporated by reference from the information concerning our Audit Committee contained under the caption “Corporate Governance and Other Matters--Board Meetings and Committees” in the Proxy Statement.
Item 11. Executive Compensation
The information contained under the captions “Executive Compensation,” "Director Compensation," “Compensation Committee Interlocks and Insider Participation,” and “Compensation Committee Report” in the Proxy Statement is incorporated herein by reference.
Item 12. Security Ownership of Certain Beneficial Owners and Management and Related Stockholder Matters
The information contained under the captions “Security Ownership of Certain Beneficial Owners and Management” and "Equity Compensation Plan Information" in the Proxy Statement is incorporated herein by reference.
87
Item 13. Certain Relationships and Related Transactions, and Director Independence
Brian Beattie, the Executive Vice President, Business Operations, and Chief Administrative Officer of Synopsys, Inc. was appointed to our Board effective July 3, 2016. During the years ended December 31, 2016, January 2, 2016, and January 3, 2015, we paid approximately $2.5 million, $2.4 million, and $1.6 million, respectively, to Synopsys Inc. for new and renewed license arrangements. Subsequent to July 3, 2016, we paid Synopsys $1.4 million. Accounts payable to Synopsys was less than $0.1 million at December 31, 2016. Mr. Beattie received no direct compensation from the transactions. In addition, the information contained under the captions entitled “Certain Relationships and Related Transactions” and “Corporate Governance and Other Matters--Director Independence” in the Proxy Statement is incorporated herein by reference.
Item 14. Principal Accountant Fees and Services
The information contained under the caption entitled “Audit and Related Fees” in the Proxy Statement is incorporated herein by reference.
88
PART IV
Item 15. Exhibits.
(a) List of Documents Filed as Part of this Report
(1) All financial statements.
The following financial statements are filed as part of this report under Item 8.
Consolidated Financial Statements: | Page |
All other schedules have been omitted because the required information is included in the Consolidated Financial Statements or the notes thereto, or is not applicable or required.
(2) Exhibits.
Exhibit Number | Description | |
2.1 | Agreement and Plan of Merger, dated January 26, 2015, by and among Lattice Semiconductor Corporation, Cayabyab Merger Company and Silicon Image, Inc. (Incorporated by reference to Exhibit 2.1 filed with the Company’s Current Report on Form 8-K filed January 27, 2015). | |
2.2 | Agreement and Plan of Merger, dated November 3, 2016, by and among Lattice Semiconductor Corporation, Canyon Bridge Acquisition Company, Inc. and Canyon Bridge Merger Sub, Inc. (Incorporated by reference to Exhibit 2.1 filed with the Company’s Current Report on Form 8-K filed November 3, 2016). | |
3.1 | The Company’s Restated Certificate of Incorporation filed, as amended on June 4, 2009 (Incorporated by reference to Exhibit 3.1 filed with the Company's Current Report on Form 8-K filed June 4, 2009). | |
3.2 | The Company’s Bylaws, as amended as of November 3, 2016. | |
10.1* | Lattice Semiconductor Corporation Employee Stock Purchase Plan, as amended (incorporated by reference to Appendix B to the Company's Definitive Proxy Statement on Schedule 14A for the 2007 Annual Meeting of Stockholders filed on April 5, 2007). | |
10.2* | Lattice Semiconductor Corporation 1996 Stock Incentive Plan, as amended, and Related Form of Option Agreement (Incorporated by reference to Exhibit 10.24 filed with the Company's Annual Report on Form 10-K for the fiscal year ended December 29, 2012). | |
10.3* | 2001 Outside Directors' Stock Option Plan, as amended and restated (Incorporated by reference to Exhibit 10.33 filed with the Company's Annual Report on Form 10-K for the fiscal year ended December 29, 2012). | |
10.4* | 2001 Stock Plan, as amended, and related Form of Option Agreement (Incorporated by reference to Exhibit 10.34 filed with the Company's Annual Report on Form 10-K for the fiscal year ended December 29, 2012). | |
89
Exhibit Number | Description | |
10.5* | Form of Indemnification Agreement executed by each director and executive officer of the Company and certain other officers and employees of the Company and its subsidiaries (Incorporated by reference to Exhibit 10.41 filed with the Company’s Annual Report on Form 10-K for the fiscal year ended January 3, 2004). | |
10.6* | Form of Amendment to Stock Option Agreements for 1996 Stock Incentive Plan, as amended, and 2001 Stock Plan, as amended (Incorporated by reference to Exhibit 99.3 filed with the Company’s Current Report on Form 8-K filed on December 12, 2005). | |
10.7* | Form of Notice of Grant of Restricted Stock Units to Executive Officer (Incorporated by reference to Exhibit 99.1 filed with the Company’s Current Report on Form 8-K filed on February 8, 2007). | |
10.8* | Employment Agreement between Lattice Semiconductor Corporation and Byron Milstead effective as of December 30, 2008 (Incorporated by reference to Exhibit 10.66 filed with the Company's Annual Report on Form 10-K filed for the fiscal year ended January 3, 2009). | |
10.9* | Employment Agreement between Lattice Semiconductor Corporation and Darin G. Billerbeck dated as of November 8, 2010 (Incorporated by reference to Exhibit 10.70 filed with the Company's Quarterly Report on Form 10-Q for the quarter ended October 2, 2010). | |
10.10* | Lattice Semiconductor Corporation 2012 Employee Stock Purchase Plan (incorporated by reference to Annex 1 to the Company's Definitive Proxy Statement on Schedule 14A for the 2012 Annual Meeting of Stockholders filed on April 12, 2012). | |
10.11* | Lattice Semiconductor Corporation Amended 2011 Non-Employee Director Equity Incentive Plan (Incorporated by reference to Appendix B to the Company's Definitive Proxy Statement on Schedule 14A for the 2014 Annual Meeting of Stockholders filed on March 20, 2014). | |
10.12* | Lattice Semiconductor Corporation 2013 Incentive Plan (Incorporated by reference to Appendix A to the Company's Definitive Proxy Statement on Schedule 14A for the 2014 Annual Meeting of Stockholders filed on March 20, 2014). | |
10.13 | Office Lease, effective as of October 21, 2014, between 555 SW Oak, LLC and Lattice Semiconductor Corporation (Incorporated by reference to Exhibit 10.1 filed with the Company’s Current Report on Form 8-K filed October 27, 2014). | |
10.14* | Lattice Semiconductor Corporation 2016 Cash Incentive Plan | |
10.15* | Employment Agreement between Lattice Semiconductor Corporation and Glen Hawk dated November 6, 2015 (Incorporated by reference to Exhibit 10.79 filed with the Company’s Annual Report on Form 10-K filed March 2, 2016). | |
10.16* | Letter Agreement between Lattice Semiconductor Corporation, Canyon Bridge Acquisition Company, Inc., and Darin G. Billerbeck, dated November 3, 2016 (Incorporated by reference to Exhibit 10.1 filed with the Company’s Current Report on Form 8-K filed November 4, 2016). | |
10.17* | Employment Agreement between Lattice Semiconductor Corporation and Max Downing, dated November 3, 2016 (Incorporated by reference to Exhibit 10.2 filed with the Company’s Current Report on Form 8-K filed November 4, 2016). | |
10.18* | Letter Agreement between Lattice Semiconductor Corporation, Canyon Bridge Acquisition Company, Inc., and Max Downing, dated November 3, 2016 (Incorporated by reference to Exhibit 10.3 filed with the Company’s Current Report on Form 8-K filed November 4, 2016). | |
10.19* | Letter Agreement between Lattice Semiconductor Corporation, Canyon Bridge Acquisition Company, Inc., and Glen Hawk, dated November 3, 2016 (Incorporated by reference to Exhibit 10.4 filed with the Company’s Current Report on Form 8-K filed November 4, 2016). | |
10.20* | Letter Agreement between Lattice Semiconductor Corporation, Canyon Bridge Acquisition Company, Inc., and Byron Milstead, dated November 3, 2016 (Incorporated by reference to Exhibit 10.5 filed with the Company’s Current Report on Form 8-K filed November 4, 2016). | |
90
Exhibit Number | Description | |
21.1 | Subsidiaries of the Registrant. | |
23.1 | Consent of Independent Registered Public Accounting Firm. | |
31.1 | Certification of Chief Executive Officer pursuant to Rule 13a-14(a) of the Securities Exchange Act of 1934, as amended. | |
31.2 | Certification of Chief Financial Officer pursuant to Rule 13a-14(a) of the Securities Exchange Act of 1934, as amended. | |
32.1 | Certification of Chief Executive Officer pursuant to 18 U.S.C. 1350, as adopted pursuant to Section 906 of the Sarbanes-Oxley Act of 2002. | |
32.2 | Certification of Chief Financial Officer pursuant to 18 U.S.C. 1350, as adopted pursuant to Section 906 of the Sarbanes-Oxley Act of 2002. | |
101.INS | XBRL Instance Document | |
101.SCH | XBRL Taxonomy Extension Schema Document | |
101.CAL | XBRL Taxonomy Extension Calculation Linkbase Document | |
101.DEF | XBRL Taxonomy Extension Definition Linkbase Document | |
101.LAB | XBRL Taxonomy Extension Labels Linkbase Document | |
101.PRE | XBRL Taxonomy Extension Presentation Linkbase Document | |
* | Management contract or compensatory plan or arrangement required to be filed as an Exhibit to this Annual Report on Form 10-K pursuant to Item 15(b) thereof. |
91
SIGNATURES
Pursuant to the requirements of Section 13 or 15(d) of the Securities Exchange Act of 1934, the registrant has duly caused this report to be signed on its behalf by the undersigned, thereunto duly authorized.
LATTICE SEMICONDUCTOR CORPORATION | |
(Registrant) | |
By: | /s/ Max Downing |
Max Downing Chief Financial Officer (Duly Authorized Officer and Principal Financial and Accounting Officer) | |
Date: | March 1, 2017 |
KNOW ALL PERSONS BY THESE PRESENTS, that each person whose signature appears below constitutes and appoints Darin G. Billerbeck and Max Downing, or either of them, his or her attorneys-in-fact, each with the power of substitution, for such person in any and all capacities, to sign any amendments to this report and to file the same, with exhibits thereto and other documents in connection therewith, with the Securities and Exchange Commission, hereby ratifying and confirming all that either of said attorneys-in-fact, or his substitute or substitutes, may do or cause to be done by virtue hereof.
Pursuant to the requirements of the Securities Exchange Act of 1934, this report has been signed below by the following persons on behalf of the registrant in the capacities indicated and on the dates indicated:
Signature | Title | Date |
Principal Executive Officer | ||
/s/ Darin G. Billerbeck | March 1, 2017 | |
Darin G. Billerbeck | President, Chief Executive Officer and Director | |
Principal Financial and Accounting Officer | ||
/s/ Max Downing | March 1, 2017 | |
Max Downing | Chief Financial Officer | |
Directors | ||
/s/ Robin Abrams | March 1, 2017 | |
Robin Abrams | Director | |
/s/ Brian Beattie | March 1, 2017 | |
Brian Beattie | Director | |
/s/ John Bourgoin | March 1, 2017 | |
John Bourgoin | Director | |
/s/ Robert Herb | March 1, 2017 | |
Robert Herb | Director | |
/s/ Mark Jensen | March 1, 2017 | |
Mark Jensen | Director | |
/s/ Jeff Richardson | March 1, 2017 | |
Jeff Richardson | Director | |
/s/ Fred Weber | March 1, 2017 | |
Fred Weber | Director | |
92