Attached files
| file | filename |
|---|---|
| EX-32.1 - EX-32.1 - COMPX INTERNATIONAL INC | cix-ex321_7.htm |
| EX-31.2 - EX-31.2 - COMPX INTERNATIONAL INC | cix-ex312_8.htm |
| EX-31.1 - EX-31.1 - COMPX INTERNATIONAL INC | cix-ex311_10.htm |
| EX-23.1 - EX-23.1 - COMPX INTERNATIONAL INC | cix-ex231_9.htm |
| EX-21.1 - EX-21.1 - COMPX INTERNATIONAL INC | cix-ex211_6.htm |
| EX-10.5 - EX-10.5 - COMPX INTERNATIONAL INC | cix-ex105_177.htm |
SECURITIES AND EXCHANGE COMMISSION
Washington, D.C. 20549
FORM 10-K
ANNUAL REPORT PURSUANT TO SECTION 13 OR 15(d) OF THE SECURITIES
EXCHANGE ACT OF 1934 – For the fiscal year ended December 31, 2016
Commission file number 1-13905
COMPX INTERNATIONAL INC.
(Exact name of Registrant as specified in its charter)
|
Delaware |
|
57-0981653 |
|
(State or other jurisdiction of incorporation or organization) |
|
(IRS Employer Identification No.) |
|
5430 LBJ Freeway, Suite 1700, Three Lincoln Centre, Dallas, Texas |
|
75240-2697 |
|
(Address of principal executive offices) |
|
(Zip Code) |
|
|
|
|
|
Registrant’s telephone number, including area code |
|
(972) 448-1400 |
|
|
||
|
Securities registered pursuant to Section 12(b) of the Act: |
||
|
Title of each class |
|
Name of each exchange on which registered |
|
Class A common stock ($.01 par value per share) |
|
NYSE MKT |
Securities registered pursuant to Section 12(g) of the Act: None.
Indicate by check mark:
If the Registrant is a well-known seasoned issuer, as defined in Rule 405 of the Securities Act. Yes ☐ No ☒
If the Registrant is not required to file reports pursuant to Section 13 or Section 15(d) of the Act. Yes ☐ No ☒
Whether the Registrant (1) has filed all reports required to be filed by Section 13 or 15(d) of the Securities Exchange Act of 1934 during the preceding 12 months (or for such shorter period that the Registrant was required to file such reports), and (2) has been subject to such filing requirements for the past 90 days. Yes ☒ No ☐
Whether the registrant has submitted electronically and posted on its corporate website, if any, every Interactive Data File required to be submitted and posted pursuant to Rule 405 of Regulation S-T during the preceding 12 months (or for such shorter period that the registration was required to submit and post such files). Yes ☒ No ☐
If disclosure of delinquent filers pursuant to Item 405 of Regulation S-K is not contained herein, and will not be contained, to the best of Registrant’s knowledge, in definitive proxy or information statements incorporated by reference in Part III of this Form 10-K or any amendment to this Form 10-K. Yes ☒ No ☐
Whether the registrant is a large accelerated filer, an accelerated filer or a non-accelerated filer (as defined in Rule 12b-2 of the Act).
|
Large accelerated filer |
|
☐ |
|
Accelerated filer |
|
☐ |
|
Non-accelerated filer |
|
☒ |
|
Smaller reporting company |
|
☐ |
Whether the Registrant is a shell Company (as defined in Rule 12b-2 of the Exchange Act). Yes ☐ No ☒
The aggregate market value of the 1.7 million shares of voting stock held by nonaffiliates of CompX International Inc. as of June 30, 2016 (the last business day of the Registrant’s most recently completed second fiscal quarter) approximated $19.0 million.
As of February 24, 2017, 2,419,107 shares of Class A common stock were outstanding.
Documents incorporated by reference
The information required by Part III is incorporated by reference from the Registrant’s definitive proxy statement to be filed with the Commission pursuant to Regulation 14A not later than 120 days after the end of the fiscal year covered by this report.
|
ITEM 1. |
BUSINESS |
General
CompX International Inc. (NYSE MKT: CIX), incorporated in Delaware in 1993, is a leading manufacturer of security products used in the recreational transportation, postal, office and institutional furniture, cabinetry, tool storage, healthcare and a variety of other industries. We are also a leading manufacturer of stainless steel exhaust systems, gauges, throttle controls, and trim tabs for the recreational marine industry. Our products are principally designed for use in medium to high-end product applications, where design, quality and durability are valued by our customers.
At December 31, 2016, (i) NL Industries, Inc. (NYSE: NL) owns 87% of our outstanding common stock, Valhi, Inc. (NYSE: VHI) owns 83% of NL’s outstanding common stock and a subsidiary of Contran Corporation owns 93% of Valhi’s outstanding common stock. As discussed in Note 1 to our Consolidated Financial Statements, Lisa K. Simmons and Serena Simmons Connelly may be deemed to control Contran, Valhi, NL and us.
Our corporate offices are located at Three Lincoln Centre, 5430 LBJ Freeway, Suite 1700, Dallas, Texas 75240. Our telephone number is (972) 448-1400. We maintain a website at www.compx.com.
Unless otherwise indicated, references in this report to “we,” “us,” or “our” refer to CompX International Inc. and its subsidiaries taken as a whole.
Forward-Looking Statements
This Annual Report on Form 10-K contains forward-looking statements within the meaning of the Private Securities Litigation Reform Act of 1995, as amended. Statements in this Annual Report that are not historical facts are forward-looking in nature and represent management’s beliefs and assumptions based on currently available information. In some cases, you can identify forward-looking statements by the use of words such as “believes,” “intends,” “may,” “should,” “could,” “anticipates,” “expects” or comparable terminology, or by discussions of strategies or trends. Although we believe that the expectations reflected in such forward-looking statements are reasonable, we do not know if these expectations will be correct. Such statements by their nature involve substantial risks and uncertainties that could significantly impact expected results. Actual future results could differ materially from those predicted. The factors that could cause actual future results to differ materially from those described herein are the risks and uncertainties discussed in this Annual Report and those described from time to time in our other filings with the U.S. Securities and Exchange Commission (the “SEC”) and include, but are not limited to, the following:
|
|
• |
Future demand for our products, |
|
|
• |
Changes in our raw material and other operating costs (such as zinc, brass and energy costs) and our ability to pass those costs on to our customers or offset them with reductions in other operating costs, |
|
|
• |
Price and product competition from low-cost manufacturing sources (such as China), |
|
|
• |
The impact of pricing and production decisions, |
|
|
• |
Customer and competitor strategies including substitute products, |
|
|
• |
Uncertainties associated with the development of new product features, |
|
|
• |
Future litigation, |
|
|
• |
Potential difficulties in integrating future acquisitions, |
|
|
• |
Decisions to sell operating assets other than in the ordinary course of business, |
|
|
• |
Environmental matters (such as those requiring emission and discharge standards for existing and new facilities), |
- 2 -
|
|
• |
The impact of current or future government regulations (including employee healthcare benefit related regulations), |
|
|
• |
Potential difficulties in upgrading or implementing new manufacturing and accounting software systems, |
|
|
• |
General global economic and political conditions that introduce instability into the U.S. economy (such as changes in the level of gross domestic product in various regions of the world), |
|
|
• |
Operating interruptions (including, but not limited to labor disputes, hazardous chemical leaks, natural disasters, fires, explosions, unscheduled or unplanned downtime, transportation interruptions and cyber attacks); and |
|
|
• |
Possible disruption of our business or increases in the cost of doing business resulting from terrorist activities or global conflicts. |
Should one or more of these risks materialize or if the consequences worsen, or if the underlying assumptions prove incorrect, actual results could differ materially from those currently forecasted or expected. We disclaim any intention or obligation to update or revise any forward-looking statement whether as a result of changes in information, future events or otherwise.
Industry Overview
We manufacture engineered components that are sold to a variety of industries including recreational transportation (including boats), postal, office and institutional furniture, cabinetry, tool storage, healthcare, gas stations and vending equipment. We continuously seek to diversify into new markets and identify new applications and features for our products, which we believe provide a greater potential for higher rates of earnings growth as well as diversification of risk. See also Item 6 – “Selected Financial Data” and Item 7 – “Management’s Discussion and Analysis of Financial Condition and Results of Operations.”
Business Segments
We currently have two operating business segments – Security Products and Marine Components. For additional information regarding our segments, see “Part II – Item 7. Management’s Discussion and Analysis of Financial Condition and Results of Operations” and Note 2 to the Consolidated Financial Statements.
Manufacturing, Operations and Products
Security Products. Our Security Products segment manufactures mechanical and electronic cabinet locks and other locking mechanisms used in a variety of applications including ignition systems, mailboxes, file cabinets, desk drawers, tool storage cabinets, vending and gaming machines, high security medical cabinetry, electronic circuit panels, storage compartments and gas station security. Our Security Products segment has one manufacturing facility in Mauldin, South Carolina and one in Grayslake, Illinois shared with Marine Components. We believe we are a North American market leader in the manufacture and sale of cabinet locks and other locking mechanisms. These products include:
|
|
• |
disc tumbler locks which provide moderate security and generally represent the lowest cost lock to produce; |
|
|
• |
pin tumbler locking mechanisms which are more costly to produce and are used in applications requiring higher levels of security, including KeSet® and System 64® (which each allow the user to change the keying on a single lock 64 times without removing the lock from its enclosure) TuBar® and Turbine™; and |
|
|
• |
our innovative CompX eLock® and StealthLock® electronic locks which provide stand-alone or networked security and audit trail capability for drug storage and other valuables through the use of a proximity card, magnetic stripe or keypad credentials. |
- 3 -
A substantial portion of our Security Products’ sales consist of products with specialized adaptations to an individual customer’s specifications, some of which are listed above. We also have a standardized product line suitable for many customers, which is offered through a North American distribution network to locksmith and smaller original equipment manufacturer distributors via our STOCK LOCKS® distribution program.
Marine Components. Our Marine Components segment manufactures and distributes stainless steel exhaust components, gauges, throttle controls, trim tabs, hardware and accessories primarily for performance and ski/wakeboard boats. Our Marine Components segment has a facility in Neenah, Wisconsin and a facility in Grayslake, Illinois shared with Security Products. Our specialty Marine Component products are high precision components designed to operate within tight tolerances in the highly demanding marine environment. These products include:
|
|
• |
original equipment and aftermarket stainless steel exhaust headers, exhaust pipes, mufflers and other exhaust components; |
|
|
• |
high performance gauges such as GPS speedometers and tachometers; |
|
|
• |
mechanical and electronic controls and throttles; |
|
|
• |
steering wheels, trim tabs and other billet aluminum accessories; and |
|
|
• |
dash panels, LED lighting, wire harnesses and other accessories. |
For information regarding our three manufacturing and other facilities, see “Item 2 – Properties,” including information regarding leased and distribution-only facilities.
Raw Materials
Our primary raw materials are:
|
|
• |
zinc and brass (used in the Security Products segment for the manufacture of locking mechanisms); and |
|
|
• |
stainless steel (used primarily in the Marine Components segment for the manufacture of exhaust headers and pipes), aluminum (used for the manufacture of throttles and trim tabs), and other components. |
These raw materials are purchased from several suppliers, are readily available from numerous sources and accounted for approximately 10% of our total cost of sales for 2016. Total material costs, including purchased components, represented approximately 45% of our cost of sales in 2016.
We occasionally enter into short-term commodity-related raw material supply arrangements to mitigate the impact of future increases in commodity-related raw material costs. These arrangements generally provide for stated unit prices based upon specified purchase volumes, which help us to stabilize our commodity-related raw material costs to a certain extent. We periodically enter into such arrangements for zinc and brass. During 2015 and 2016, markets for our primary commodity-related raw materials, including zinc, brass and stainless steel, have generally been stable and relatively soft compared to historical levels. Markets for our primary commodity-related raw materials are expected to remain relatively stable into 2017 with the possible exception of zinc, which has increased in price over the final months of 2016. When purchased on the spot market, each of these raw materials may be subject to sudden and unanticipated price increases. We generally seek to mitigate the impact of fluctuations in these raw material costs on our margins through improvements in production efficiencies or other operating cost reductions. In the event we are unable to offset raw material cost increases with other cost reductions, it may be difficult to recover those cost increases through increased product selling prices or raw material surcharges due to the competitive nature of the markets served by our products. Consequently, overall operating margins can be affected by commodity-related raw material cost pressures. Commodity market prices are cyclical, reflecting overall economic trends, specific developments in consuming industries and speculative investor activities.
- 4 -
We hold a number of patents relating to our component products, certain of which we believe to be important to us and our continuing business activity. Patents generally have a term of 20 years, and our patents have remaining terms ranging from less than 1 year to 17 years at December 31, 2016. Our major trademarks and brand names in addition to CompX® include:
|
Security Products |
|
Security Products |
|
Marine Components |
|
CompX® Security Products™ National Cabinet Lock® Fort Lock® Timberline® Lock Chicago Lock® STOCK LOCKS® KeSet® TuBar® StealthLock® ACE® ACE® II CompX eLock® |
|
Lockview® System 64® SlamCAM® RegulatoR® CompXpress® GEM® |
|
CompX Marine® Custom Marine® Livorsi® Marine Livorsi II® Marine CMI Industrial® Custom Marine® Stainless Exhaust The #1 Choice in Performance Boating® Mega Rim® Race Rim® Vantage View® GEN-X® |
Sales, Marketing and Distribution
A majority of our component sales are direct to large OEM customers through our factory-based sales and marketing professionals supported by engineers working in concert with field salespeople and independent manufacturer’s representatives. We select manufacturer’s representatives based on special skills in certain markets or relationships with current or potential customers.
In addition to sales to large OEM customers, a substantial portion of our Security Products sales are made through distributors. We have a significant North American market share of cabinet lock security product sales as a result of the locksmith distribution channel. We support our locksmith distributor sales with a line of standardized products used by the largest segments of the marketplace. These products are packaged and merchandised for easy availability and handling by distributors and end users.
We sell to a diverse customer base with only two customers representing 10% or more of our sales in 2016 (United States Postal Service and Harley Davidson representing 14% and 11%, respectively). Our largest ten customers accounted for approximately 46% of our sales in 2016.
Competition
The markets in which we participate are highly competitive. We compete primarily on the basis of product design, including space utilization and aesthetic factors, product quality and durability, price, on-time delivery, service and technical support. We focus our efforts on the middle and high-end segments of the market, where product design, quality, durability and service are valued by the customer. Our Security Products segment competes against a number of domestic and foreign manufacturers. Our Marine Components segment competes with small domestic manufacturers and is minimally affected by foreign competitors.
Regulatory and Environmental Matters
Our operations are subject to federal, state and local laws and regulations relating to the use, storage, handling, generation, transportation, treatment, emission, discharge, disposal, remediation of and exposure to hazardous and non-hazardous substances, materials and wastes (“Environmental Laws”). Our operations also are subject to federal, state and local laws and regulations relating to worker health and safety. We believe we are in substantial compliance with all such laws and regulations. To date, the costs of maintaining compliance with such laws and regulations have not significantly impacted our results. We currently do not anticipate any significant
- 5 -
costs or expenses relating to such matters; however, it is possible future laws and regulations may require us to incur significant additional expenditures.
Employees
As of December 31, 2016, we employed 516 people, all in the United States. We believe our labor relations are good at all of our facilities.
Available Information
Our fiscal year end is always the Sunday closest to December 31, and our operations are reported on a 52 or 53-week fiscal year. We furnish our stockholders with annual reports containing audited financial statements. In addition, we file annual, quarterly and current reports; proxy and information statements; and other information with the SEC. We also make our annual report on Form 10-K, quarterly reports on Form 10-Q, current reports on Form 8-K and all related amendments, available free of charge through our website at www.compx.com as soon as reasonably practical after they have been filed with the SEC. We also provide to anyone, without charge, copies of the documents upon written request. Requests should be directed to the attention of the Corporate Secretary at our address on the cover page of this Form 10-K.
Additional information, including our Audit Committee Charter, our Code of Business Conduct and Ethics and our Corporate Governance Guidelines, can also be found on our website. Information contained on our website is not a part of this Annual Report.
The general public may read and copy any materials we file with the SEC at the SEC’s Public Reference Room at 100 F. Street, NE, Washington, DC 20549. The public may obtain information on the operation of the Public Reference Room by calling the SEC at 1-800-SEC-0330. We are an electronic filer. The SEC maintains an Internet website at www.sec.gov that contains reports, proxy and information statements and other information regarding issuers, such as us, that file electronically with the SEC.
|
ITEM 1A. |
RISK FACTORS |
Listed below are certain risk factors associated with us and our businesses. In addition to the potential effect of these risk factors discussed below, any risk factor which could result in reduced earnings or operating losses, or reduced liquidity, could in turn adversely affect our ability to service our liabilities or pay dividends on our common stock or adversely affect the quoted market prices for our securities.
We operate in mature and highly competitive markets, resulting in pricing pressure and the need to continuously reduce costs.
Many of the markets we serve are highly competitive, with a number of competitors offering similar products. We focus our efforts on the middle and high-end segment of the market where we feel that we can compete due to the importance of product design, quality and durability to the customer. However, our ability to effectively compete is impacted by a number of factors. The occurrence of any of these factors could result in reduced earnings or operating losses.
|
|
• |
Competitors may be able to drive down prices for our products beyond our ability to adjust costs because their costs are lower than ours, especially products sourced from Asia. |
|
|
• |
Competitors’ financial, technological and other resources may be greater than our resources, which may enable them to more effectively withstand changes in market conditions. |
|
|
• |
Competitors may be able to respond more quickly than we can to new or emerging technologies and changes in customer requirements. |
|
|
• |
Consolidation of our competitors or customers in any of the markets in which we compete may result in reduced demand for our products. |
- 6 -
|
|
• |
New competitors could emerge by modifying their existing production facilities to manufacture products that compete with our products. |
|
|
• |
We may not be able to sustain a cost structure that enables us to be competitive. |
|
|
• |
Customers may no longer value our product design, quality or durability over the lower cost products of our competitors. |
Our development of innovative features for current products is critical to sustaining and growing our sales.
Historically, our ability to provide value-added custom engineered products that address requirements of technology and space utilization has been a key element of our success. We spend a significant amount of time and effort to refine, improve and adapt our existing products for new customers and applications. Since expenditures for these types of activities are not considered research and development expense under accounting principles generally accepted in the United States of America (“GAAP”), the amount of our research and development expenditures, which is not significant, is not indicative of the overall effort involved in the development of new product features. The introduction of new product features requires the coordination of the design, manufacturing and marketing of the new product features with current and potential customers. The ability to coordinate these activities with current and potential customers may be affected by factors beyond our control. While we will continue to emphasize the introduction of innovative new product features that target customer-specific opportunities, we do not know if any new product features we introduce will achieve the same degree of success that we have achieved with our existing products. Introduction of new product features typically requires us to increase production volume on a timely basis while maintaining product quality. Manufacturers often encounter difficulties in increasing production volumes, including delays, quality control problems and shortages of qualified personnel or raw materials. As we attempt to introduce new product features in the future, we do not know if we will be able to increase production volume without encountering these or other problems, which might negatively impact our financial condition or results of operations.
Higher costs of our commodity-related raw materials may decrease our liquidity.
Certain of the raw materials used in our products are commodities that are subject to significant fluctuations in price in response to world-wide supply and demand as well as speculative investor activity. Zinc and brass are the principal raw materials used in the manufacture of security products. Stainless steel tubing is the major raw material used in the manufacture of marine exhaust systems. These raw materials are purchased from several suppliers and are generally readily available from numerous sources. We occasionally enter into short-term raw material supply arrangements to mitigate the impact of future increases in commodity-related raw material costs. Materials purchased outside of these arrangements are sometimes subject to unanticipated and sudden price increases. Should our vendors not be able to meet their contractual obligations or should we be otherwise unable to obtain necessary raw materials, we may incur higher costs for raw materials or may be required to reduce production levels, either of which may decrease our liquidity or negatively impact our financial condition or results of operations as we may be unable to offset the higher costs with increases in our selling prices or reductions in other operating costs.
Failure to protect our intellectual property rights or claims by others that we infringe their intellectual property rights could substantially harm our business.
We rely on patent, trademark and trade secret laws in the United States and similar laws in other countries to establish and maintain our intellectual property rights in our technology and designs. Despite these measures, any of our intellectual property rights could be challenged, invalidated, circumvented or misappropriated. Others may independently discover our trade secrets and proprietary information, and in such cases we could not assert any trade secret rights against such parties. Further, we do not know if any of our pending trademark or patent applications will be approved. Costly and time-consuming litigation could be necessary to enforce and determine the scope of our intellectual property rights. In addition, the laws of certain countries do not protect intellectual property rights to the same extent as the laws of the United States. Therefore, in certain jurisdictions, we may be unable to protect our technology and designs adequately against unauthorized third party use, which could adversely affect our competitive position.
- 7 -
Third parties may claim that we or our customers are infringing upon their intellectual property rights. Even if we believe that such claims are without merit, they can be time-consuming and costly to defend and distract our management’s and technical staff’s attention and resources. Claims of intellectual property infringement also might require us to redesign affected technology, enter into costly settlement or license agreements or pay costly damage awards, or face a temporary or permanent injunction prohibiting us from marketing or selling certain of our technology. If we cannot or do not license the infringed technology on reasonable pricing terms or at all, or substitute similar technology from another source, our business could be adversely impacted.
Global climate change legislation could negatively impact our financial results or limit our ability to operate our businesses.
All of our production facilities are located in the United States and we believe all of our production facilities are in substantial compliance with applicable environmental laws. To date, legislation and regulatory actions related to climate change have not had a material adverse effect on our financial results. However, if new legislation or regulatory actions related to climate change were to be enacted or implemented, it could negatively impact our future results from operations through increased costs of production, particularly as it relates to our energy requirements. If such increased costs of production were to materialize, we may be unable to pass price increases on to our customers to compensate for increased production costs, which may decrease our liquidity, operating income and results of operations.
|
ITEM 1B. |
UNRESOLVED STAFF COMMENTS |
None.
|
ITEM 2. |
PROPERTIES |
Our principal executive offices are located in leased space at 5430 LBJ Freeway, Dallas, Texas 75240. The following table sets forth the location, size and business operating segment for each of our operating facilities.
|
Facility Name |
|
Business Segment |
|
Location |
|
Size |
|
|
|
Owned Facilities: |
|
|
|
|
|
|
|
|
|
National (1) |
|
SP |
|
Mauldin, SC |
|
|
198,000 |
|
|
Grayslake(1) |
|
SP/MC |
|
Grayslake, IL |
|
|
133,000 |
|
|
Custom(2) |
|
MC |
|
Neenah, WI |
|
|
95,000 |
|
|
Leased Facilities: |
|
|
|
|
|
|
|
|
|
Distribution Center |
|
SP/MC |
|
Rancho Cucamonga, CA |
|
|
11,500 |
|
SP – Security Products business segment
MC – Marine Components business segment
|
(1) |
ISO-9001 registered facilities |
|
(2) |
ISO-9002 registered facility |
We believe all of our facilities are well maintained and satisfactory for their intended purposes.
- 8 -
|
ITEM 3. |
LEGAL PROCEEDINGS |
We are involved, from time to time, in various environmental, contractual, product liability, patent (or intellectual property), employment and other claims and disputes incidental to our business. See Note 10 to the Consolidated Financial Statements. We currently believe that the disposition of all claims and disputes, individually or in the aggregate, should not have a material adverse effect on our consolidated financial condition, results of operations or liquidity.
ITEM 4.MINE SAFETY DISCLOSURES
Not applicable.
- 9 -
|
ITEM 5. |
MARKET FOR REGISTRANT’S COMMON EQUITY AND RELATED STOCKHOLDER MATTERS |
Common Stock and Dividends. Our Class A common stock is listed and traded on the NYSE MKT (symbol: CIX). As of February 24, 2017, there were approximately 18 holders of record of CompX Class A common stock. The following table sets forth the high and low closing sales prices per share for our Class A common stock for the periods indicated, according to Bloomberg, and dividends paid during each period. On February 24, 2017, the closing price per share of our Class A common stock was $14.70.
|
|
|
High |
|
|
Low |
|
|
Dividends |
|
|||
|
Year ended December 31, 2015
|
|
|
|
|
|
|
|
|
|
|
|
|
|
First Quarter |
|
$ |
12.13 |
|
|
$ |
10.55 |
|
|
$ |
.05 |
|
|
Second Quarter |
|
|
12.39 |
|
|
|
11.16 |
|
|
|
.05 |
|
|
Third Quarter |
|
|
12.00 |
|
|
|
10.75 |
|
|
|
.05 |
|
|
Fourth Quarter |
|
|
11.82 |
|
|
|
10.76 |
|
|
|
.05 |
|
|
Year ended December 31, 2016 |
|
|
|
|
|
|
|
|
|
|
|
|
|
First Quarter |
|
$ |
11.68 |
|
|
$ |
9.27 |
|
|
$ |
.05 |
|
|
Second Quarter |
|
|
11.70 |
|
|
|
10.00 |
|
|
|
.05 |
|
|
Third Quarter |
|
|
15.19 |
|
|
|
11.12 |
|
|
|
.05 |
|
|
Fourth Quarter |
|
|
16.25 |
|
|
|
10.80 |
|
|
|
.05 |
|
|
January 1, 2017 through February 24, 2017 |
|
$ |
15.60 |
|
|
$ |
13.10 |
|
|
$ |
- |
|
In February of 2017, our board of directors declared a first quarter 2017 dividend of $.05 per share, to be paid on March 21, 2017 to CompX stockholders of record as of March 13, 2017. However, declaration and payment of future dividends and the amount thereof, if any, is discretionary and is dependent upon our results of operations, financial condition, cash requirements for our businesses, contractual requirements and restrictions and other factors deemed relevant by our board of directors. The amount and timing of past dividends is not necessarily indicative of the amount or timing of any future dividends which we might pay.
- 10 -
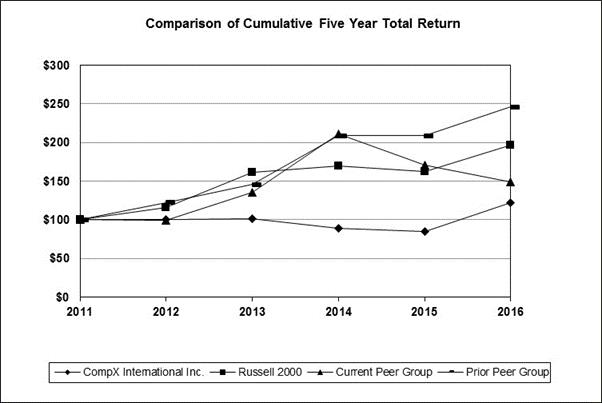
Performance Graph. Set forth below is a line graph comparing the yearly change in our cumulative total stockholder returns on our Class A common stock against the cumulative total return of the Russell 2000 Index and an index of a self-selected peer group of companies for the period from December 31, 2011 through December 31, 2016. The peer group index is comprised of The Eastern Company and Strattec Security Corporation. The graph shows the value at December 31 of each year assuming an original investment of $100 at December 31, 2011 and reinvestment of dividends. We previously included Leggett & Platt Inc. in our peer group index. However, based on changes in our products and markets over the past few years, we no longer believe such company is sufficiently comparable to us. In accordance with applicable regulations of the SEC, the performance graph set forth below reflects both our current peer group and our prior peer group (which included Leggett & Platt).
|
|
|
December 31, |
|
|||||||||||||||||||||
|
|
|
2011 |
|
|
2012 |
|
|
2013 |
|
|
2014 |
|
|
2015 |
|
|
2016 |
|
||||||
|
CompX International Inc. |
|
$ |
100 |
|
|
$ |
101 |
|
|
$ |
101 |
|
|
$ |
88 |
|
|
$ |
85 |
|
|
$ |
122 |
|
|
Russell 2000 Index |
|
|
100 |
|
|
|
116 |
|
|
|
162 |
|
|
|
169 |
|
|
|
162 |
|
|
|
196 |
|
|
Current Peer Group |
|
|
100 |
|
|
|
99 |
|
|
|
135 |
|
|
|
211 |
|
|
|
170 |
|
|
|
149 |
|
|
Prior Peer Group |
|
|
100 |
|
|
|
122 |
|
|
|
146 |
|
|
|
208 |
|
|
|
209 |
|
|
|
246 |
|
Equity compensation plan information. We have a share based incentive compensation plan, approved by our stockholders, pursuant to which an aggregate of 200,000 shares of our common stock can be awarded to non-employee members of our board of directors. At December 31, 2016, 173,000 shares are available for award under this plan. See Note 8 to the Consolidated Financial Statements.
- 11 -
The following selected financial data should be read in conjunction with the Consolidated Financial Statements and Item 7 - “Management’s Discussion and Analysis of Financial Condition and Results of Operations.”
Our fiscal year end is always the Sunday closest to December 31, and our operations are reported on a 52 or 53-week fiscal year. 2015 was a 53-week year; all other years shown are 52-week years.
|
|
|
Years ended December 31, |
|
|||||||||||||||||
|
|
|
2012 |
|
|
2013 |
|
|
2014 |
|
|
2015 |
|
|
2016 |
|
|||||
|
|
|
($ in millions, except per share data) |
|
|||||||||||||||||
|
Statements of Operations Data: |
|
|
|
|
|
|
|
|
|
|
|
|
|
|
|
|
|
|
|
|
|
Net sales |
|
$ |
83.2 |
|
|
$ |
92.0 |
|
|
$ |
103.8 |
|
|
$ |
109.0 |
|
|
$ |
108.9 |
|
|
Gross profit |
|
|
24.3 |
|
|
|
27.6 |
|
|
|
32.2 |
|
|
|
33.4 |
|
|
|
35.2 |
|
|
Operating income |
|
|
5.4 |
|
|
|
9.3 |
|
|
|
13.6 |
|
|
|
14.0 |
|
|
|
15.6 |
|
|
Provision for income taxes |
|
|
1.4 |
|
|
|
3.2 |
|
|
|
5.0 |
|
|
|
4.9 |
|
|
|
5.5 |
|
|
|
|
|
|
|
|
|
|
|
|
|
|
|
|
|
|
|
|
|
|
|
|
Income from continuing operations |
|
$ |
3.5 |
|
|
$ |
6.0 |
|
|
$ |
8.7 |
|
|
$ |
9.1 |
|
|
$ |
10.5 |
|
|
Discontinued operations, net of tax(1) |
|
|
31.5 |
|
|
|
- |
|
|
|
- |
|
|
|
- |
|
|
|
- |
|
|
Net income |
|
$ |
35.0 |
|
|
$ |
6.0 |
|
|
$ |
8.7 |
|
|
$ |
9.1 |
|
|
$ |
10.5 |
|
|
Diluted Earnings Per Share Data: |
|
|
|
|
|
|
|
|
|
|
|
|
|
|
|
|
|
|
|
|
|
Continuing operations |
|
$ |
.28 |
|
|
$ |
.49 |
|
|
$ |
.70 |
|
|
$ |
.73 |
|
|
$ |
.84 |
|
|
Discontinued operations |
|
|
2.54 |
|
|
|
- |
|
|
|
- |
|
|
|
- |
|
|
|
- |
|
|
Net income |
|
$ |
2.82 |
|
|
$ |
.49 |
|
|
$ |
.70 |
|
|
$ |
.73 |
|
|
$ |
.84 |
|
|
|
|
|
|
|
|
|
|
|
|
|
|
|
|
|
|
|
|
|
|
|
|
Cash dividends |
|
$ |
.50 |
|
|
$ |
.275 |
|
|
$ |
.20 |
|
|
$ |
.20 |
|
|
$ |
.20 |
|
|
Weighted average common shares outstanding |
|
|
12.4 |
|
|
|
12.4 |
|
|
|
12.4 |
|
|
|
12.4 |
|
|
|
12.4 |
|
|
Balance Sheet Data (at year end): |
|
|
|
|
|
|
|
|
|
|
|
|
|
|
|
|
|
|
|
|
|
Cash and other current assets |
|
$ |
87.9 |
|
|
$ |
61.1 |
|
|
$ |
71.7 |
|
|
$ |
76.9 |
|
|
$ |
59.2 |
|
|
Total assets |
|
|
147.5 |
|
|
|
119.2 |
|
|
|
129.1 |
|
|
|
134.8 |
|
|
|
144.0 |
|
|
Current liabilities |
|
|
24.5 |
|
|
|
10.1 |
|
|
|
13.2 |
|
|
|
12.1 |
|
|
|
13.3 |
|
|
Long-term debt and note payable, including current maturities |
|
|
18.5 |
|
|
|
- |
|
|
|
- |
|
|
|
- |
|
|
|
- |
|
|
Stockholders’ equity |
|
|
102.1 |
|
|
|
104.7 |
|
|
|
111.0 |
|
|
|
117.7 |
|
|
|
125.8 |
|
|
Statements of Cash Flow Data: |
|
|
|
|
|
|
|
|
|
|
|
|
|
|
|
|
|
|
|
|
|
Cash provided by (used in): |
|
|
|
|
|
|
|
|
|
|
|
|
|
|
|
|
|
|
|
|
|
Operating activities |
|
$ |
13.8 |
|
|
$ |
(4.1 |
) |
|
$ |
12.2 |
|
|
$ |
13.5 |
|
|
$ |
13.9 |
|
|
Investing activities |
|
|
51.7 |
|
|
|
1.0 |
|
|
|
(2.9 |
) |
|
|
(4.2 |
) |
|
|
(30.6 |
) |
|
Financing activities |
|
|
(12.0 |
) |
|
|
(21.9 |
) |
|
|
(2.5 |
) |
|
|
(2.5 |
) |
|
|
(2.5 |
) |
|
|
(1) |
In 2012, we sold our Furniture Components segment for a net gain of $27.6 million which is included in discontinued operations. |
- 12 -
Business Overview
We are a leading manufacturer of engineered components utilized in a variety of applications and industries. Through our Security Products segment we manufacture mechanical and electrical cabinet locks and other locking mechanisms used in recreational transportation, postal, office and institutional furniture, cabinetry, tool storage and healthcare applications. We also manufacture stainless steel exhaust systems, gauges, throttle controls and trim tabs for the recreational marine and other industries through our Marine Components segment.
Operating Income Overview
We reported operating income of $15.6 million in 2016 compared to operating income of $14.0 million in 2015 and $13.6 million in 2014. The increase in operating income from 2015 to 2016 primarily resulted from a favorable customer and product mix at Security Products, in addition to higher sales and continued margin improvement for Marine Components.
The increase in operating income from 2014 to 2015 resulted from the positive impact of higher gross margins in 2015, primarily attributable to higher gross margins at Marine Components resulting from increased sales which allowed the segment to better leverage fixed costs.
Our product offerings consist of a significantly large number of products that have a wide variation in selling price and manufacturing cost, which results in certain practical limitations on our ability to quantify the impact of changes in individual product sales quantities and selling prices on our net sales, cost of goods sold and gross profit. In addition, small variations in period-to-period net sales, cost of goods sold and gross profit can result from changes in the relative mix of our products sold.
Results of Operations - 2016 Compared to 2015 and 2015 Compared to 2014
|
|
|
Years ended December 31, |
|
|
%Change |
|
|||||||||||||||
|
|
|
2014 |
|
|
2015 |
|
|
2016 |
|
|
2014-15 |
|
|
2015-16 |
|
||||||
|
|
|
(Dollars in millions) |
|
|
|
|
|
|
|
||||||||||||
|
Net sales |
|
$ |
103.8 |
|
$ |
|
109.0 |
|
$ |
|
108.9 |
|
|
|
5 |
% |
|
|
- |
% |
|
|
Cost of goods sold |
|
|
71.6 |
|
|
|
75.6 |
|
|
|
73.7 |
|
|
|
6 |
% |
|
|
-2 |
% |
|
|
Gross profit |
|
|
32.2 |
|
|
|
33.4 |
|
|
|
35.2 |
|
|
|
4 |
% |
|
|
5 |
% |
|
|
Operating costs and expenses |
|
|
18.6 |
|
|
|
19.4 |
|
|
|
19.6 |
|
|
|
4 |
% |
|
|
1 |
% |
|
|
Operating income |
|
$ |
13.6 |
|
$ |
|
14.0 |
|
$ |
|
15.6 |
|
|
|
3 |
% |
|
|
11 |
% |
|
|
Percent of net sales: |
|
|
|
|
|
|
|
|
|
|
|
|
|
|
|
|
|
|
|
|
|
|
Cost of goods sold |
|
|
69 |
% |
|
|
69 |
% |
|
|
68 |
% |
|
|
|
|
|
|
|
|
|
|
Gross margin |
|
|
31 |
% |
|
|
31 |
% |
|
|
32 |
% |
|
|
|
|
|
|
|
|
|
|
Operating costs and expenses |
|
|
18 |
% |
|
|
18 |
% |
|
|
18 |
% |
|
|
|
|
|
|
|
|
|
|
Operating income |
|
|
13 |
% |
|
|
13 |
% |
|
|
14 |
% |
|
|
|
|
|
|
|
|
|
Net Sales. Net sales for 2016 were comparable to 2015 because our Security Products segment was able to substantially replace revenue for a government security end-user project which did not recur in 2016 with a new project with the same customer. Marine Components also contributed with higher sales to the waterski/wakeboard boat market. Relative changes in selling prices did not have a material impact on net sales comparisons.
Net sales increased approximately $5.2 million from 2014 to 2015 led by strong demand within Security Products from existing government customers. Marine Components also contributed to the increase primarily through higher sales to the waterski/wakeboard boat market. Relative changes in selling prices did not have a material impact on net sales comparisons.
- 13 -
Cost of Goods Sold and Gross Profit. Cost of goods sold for 2016 was down from 2015 on comparable sales, resulting in an increase in gross profit. As a percentage of sales, gross profit for 2016 was favorable to 2015 due primarily to higher variable margins resulting from favorable customer and product mix for both Security Products and Marine Components.
Cost of goods sold and gross profit both increased from 2014 to 2015 primarily due to increased sales volumes. As a percentage of sales, cost of goods sold and resulting gross profit for 2015 were comparable to 2014 as improved variable margins and manufacturing efficiencies attributable to Marine Components were substantially offset by slightly lower variable margins and increased fixed costs within Security Products.
Operating Costs and Expenses. Operating costs and expenses consist primarily of sales and administrative-related personnel costs, sales commissions and advertising expenses directly related to product sales and administrative costs relating to business unit and corporate management activities, as well as gains and losses on plant, property and equipment. Operating costs and expenses in 2016 was comparable to 2015 on an absolute basis and as a percentage of sales. Operating costs and expenses increased slightly from 2014 to 2015 primarily as a result of increased personnel costs for Security Products.
Operating Income. As a percentage of net sales, operating income increased slightly from 2015 to 2016 while 2015 was comparable to 2014. Operating margins were primarily impacted by the factors impacting cost of goods sold, gross margin and operating costs discussed above.
General. Our profitability primarily depends on our ability to utilize our production capacity effectively, which is affected by, among other things, the demand for our products and our ability to control our manufacturing costs, primarily comprised of labor costs and materials. The materials used in our products consist of purchased components and raw materials some of which are subject to fluctuations in the commodity markets such as zinc, brass and stainless steel. Total material costs represented approximately 45% of our cost of sales in 2016, with commodity-related raw materials accounting for approximately 10% of our cost of sales. During 2015 and 2016, markets for our primary commodity-related raw materials, including zinc, brass and stainless steel, have generally been stable and relatively soft compared to historical levels. Markets for our primary commodity-related raw materials are expected to remain relatively stable into 2017 with the possible exception of zinc, which has increased in price over the final months of 2016. We occasionally enter into short-term commodity-related raw material supply arrangements to mitigate the impact of future increases in commodity related raw material costs. See Item 1 - “Business- Raw Materials.”
Provision for income taxes. A tabular reconciliation of our actual tax provision to the U.S. federal statutory income tax rate of 35% is included in Note 7 to the Consolidated Financial Statements. As a member of the group of companies consolidated for U.S. federal income tax purposes with Contran, the parent of our consolidated U.S. federal income tax group, we compute our provision for income taxes on a separate company basis, using the tax elections made by Contran.
Our effective income tax rate was 37% in 2014 and 35% in 2015 and 2016. Our effective income tax rate was lower in 2015 as compared to 2014 primarily due to a decrease in our state tax provision related to the scheduled reduction to the state tax rate in one of the jurisdictions in which we operate. Our effective income tax rate in 2016 was comparable to our effective income tax rate in 2015. See Notes 7 and 10 to the Consolidated Financial Statements. We currently expect our effective income tax rate for 2017 to be comparable to our effective income tax rate for 2016.
- 14 -
The key performance indicator for our segments is the level of their operating income (see discussion below). For additional information regarding our segments refer to Note 2 to the Consolidated Financial Statements.
|
|
|
Years ended December 31, |
|
|
% Change |
|
||||||||||||||
|
|
|
2014 |
|
|
2015 |
|
|
2016 |
|
|
2014 – 2015 |
|
|
2015 – 2016 |
|
|||||
|
|
|
(In millions) |
|
|
|
|
||||||||||||||
|
Net sales: |
|
|
|
|
|
|
|
|
|
|
|
|
|
|
|
|
|
|
|
|
|
Security Products |
|
$ |
91.4 |
|
|
$ |
95.6 |
|
|
$ |
94.7 |
|
|
|
5 |
% |
|
|
-1 |
% |
|
Marine Components |
|
|
12.4 |
|
|
|
13.4 |
|
|
|
14.2 |
|
|
|
8 |
% |
|
|
6 |
% |
|
Total net sales |
|
$ |
103.8 |
|
|
$ |
109.0 |
|
|
$ |
108.9 |
|
|
|
5 |
% |
|
|
- |
% |
|
Gross profit: |
|
|
|
|
|
|
|
|
|
|
|
|
|
|
|
|
|
|
|
|
|
Security Products |
|
$ |
29.5 |
|
|
$ |
29.9 |
|
|
$ |
31.2 |
|
|
|
1 |
% |
|
|
4 |
% |
|
Marine Components |
|
|
2.7 |
|
|
|
3.5 |
|
|
|
4.0 |
|
|
|
29 |
% |
|
|
12 |
% |
|
Total gross profit |
|
$ |
32.2 |
|
|
$ |
33.4 |
|
|
$ |
35.2 |
|
|
|
4 |
% |
|
|
5 |
% |
|
Operating income: |
|
|
|
|
|
|
|
|
|
|
|
|
|
|
|
|
|
|
|
|
|
Security Products |
|
$ |
18.7 |
|
|
$ |
18.6 |
|
|
$ |
20.0 |
|
|
|
-1 |
% |
|
|
8 |
% |
|
Marine Components |
|
|
0.7 |
|
|
|
1.4 |
|
|
|
1.7 |
|
|
|
103 |
% |
|
|
19 |
% |
|
Corporate operating expenses |
|
|
(5.8 |
) |
|
|
(6.0 |
) |
|
|
(6.1 |
) |
|
|
-4 |
% |
|
|
-1 |
% |
|
Total operating income |
|
$ |
13.6 |
|
|
$ |
14.0 |
|
|
$ |
15.6 |
|
|
|
3 |
% |
|
|
11 |
% |
|
Operating income margin: |
|
|
|
|
|
|
|
|
|
|
|
|
|
|
|
|
|
|
|
|
|
Security Products |
|
|
20 |
% |
|
|
19 |
% |
|
|
21 |
% |
|
|
|
|
|
|
|
|
|
Marine Components |
|
|
6 |
% |
|
|
11 |
% |
|
|
12 |
% |
|
|
|
|
|
|
|
|
|
Total operating income margin |
|
|
13 |
% |
|
|
13 |
% |
|
|
14 |
% |
|
|
|
|
|
|
|
|
Security Products. Security Products net sales decreased 1% to $94.7 million in 2016 compared to $95.6 million in 2015. Sales for 2015 included approximately $6.3 million for a government security end-user project which did not recur in 2016. During the second half of 2016, we were awarded a substantial new project for the same customer which began to ship in August and was completed in December, totaling $5.8 million in net sales. Gross profit margins for 2016 increased compared to 2015 on favorable variable margins resulting from relative changes in product and customer mix particularly in the fourth quarter. Operating costs and expenses for 2016 were comparable to 2015. Security Products operating income as a percentage of net sales for 2016 increased compared to 2015 primarily as a result of the factors impacting gross profit and operating costs and expenses discussed above.
Security Products net sales increased 5% to $95.6 million in 2015 compared to $91.4 million in 2014. The increase in sales was primarily due to an increase of approximately $3.0 million in sales to existing government customers. Gross profit margin for 2015 decreased compared to 2014 due to relative changes in customer and product mix driving lower variable margins, and increased fixed costs. Operating costs and expenses increased approximately $510,000 in 2015 compared to 2014 primarily as a result of increased personnel costs. Security Products operating income as a percentage of net sales for 2015 decreased compared to 2014 primarily as a result of the factors impacting gross profit and operating costs and expenses discussed above.
Marine Components. Marine Components net sales increased 6% in 2016 as compared to 2015, while 2015 net sales increased 8% over 2014. The increase in sales each year was primarily due to improved demand for products sold to the ski/wakeboard boat market, including the continuing introduction of new product lines to that market. As a percentage of net sales, gross margin and the operating income percentage for each period improved due to improved pricing, changes in customer and product mix, improved manufacturing efficiencies and increased leverage of fixed costs as a result of higher production volumes.
- 15 -
We experienced robust demand for our products in 2015 and 2016 buoyed by continued high demand from certain large existing customers, including significant projects for government security applications which are not expected to recur. We continue to benefit from innovation and diversification in our product offerings to the recreational boat markets served by our Marine Components segment. We anticipate continued strong demand for our products in 2017, though we do not expect demand for government security applications to equal 2016 volumes. As in prior periods, we will continue to monitor general economic conditions and sales order rates and respond to fluctuations in customer demand through continuous evaluation of staffing levels and consistent execution of our lean manufacturing and cost improvement initiatives. Additionally, we continue to seek opportunities to gain market share in markets we currently serve, to expand into new markets and to develop new product features in order to mitigate the impact of changes in demand as well as broaden our sales base.
Critical Accounting Policies and Estimates
We have based the accompanying “Management’s Discussion and Analysis of Financial Condition and Results of Operations” upon our Consolidated Financial Statements. We prepared our Consolidated Financial Statements in accordance with GAAP. In preparing our Consolidated Financial Statements, we are required to make estimates and judgments that affect the reported amounts of assets and liabilities and disclosure of contingent assets and liabilities at the date of the financial statements, and the reported amount of revenues and expenses during the reported period. On an on-going basis, we evaluate our estimates, including those related to inventory reserves, the recoverability of long-lived assets (including goodwill and other intangible assets) and the realization of deferred income tax assets. We base our estimates on historical experience and on various other assumptions that we believe are reasonable under the circumstances, the results of which form the basis for making judgments about the reported amounts of assets, liabilities, revenues and expenses. Our actual future results might differ from previously estimated amounts under different assumptions or conditions.
We believe the following critical accounting policies affect our more significant judgments and estimates used in the preparation of our Consolidated Financial Statements and are applicable to all of our operating segments:
|
|
• |
Goodwill – Our goodwill totaled $23.7 million at December 31, 2016. We perform a goodwill impairment test annually in the third quarter of each year. Goodwill is also evaluated for impairment at other times whenever an event occurs or circumstances change that would more likely than not reduce the fair value of a reporting unit below its carrying value. All of our goodwill at December 31, 2016 is related to our Security Products segment. One of the requirements for the permitted use of a qualitative assessment is that a quantitative assessment must be performed periodically, and we used the quantitative assessment of ASC 350-20-35 for our 2016 annual impairment test to estimate the fair value of the Security Products reporting unit, using Level 3 inputs of a discounted cash flow technique since Level 1 or Level 2 inputs of market prices were not available. No goodwill impairment was deemed to exist as a result of such 2016 annual impairment review, as the estimated fair value of our Security Products segment was substantially in excess of its net carrying amount. See Notes 1 and 5 to the Consolidated Financial Statements. |
When performing a quantitative assessment, considerable management judgment is necessary to estimate future cash flows. Assumptions used in our impairment evaluations, such as forecasted growth rates and our cost of capital, are consistent with our internal projections and operating plans. However, different assumptions and estimates could result in materially different findings which could result in the recognition of a material goodwill impairment.
When performing a qualitative assessment considerable management judgment is necessary to evaluate the qualitative impact of events and circumstances on the fair value of a reporting unit. Events and circumstances considered in our impairment evaluations, such as historical profits and stability of the markets served, are consistent with factors utilized with our internal projections and operating plan. However, future events and circumstances could result in materially different findings which could result in the recognition of a material goodwill impairment.
- 16 -
|
|
Significant judgment is required in estimating such cash flows. Adverse changes in such estimates of future net cash flows or estimates of fair value could result in an inability to recover the carrying value of the long-lived asset, thereby possibly requiring an impairment charge to be recognized in the future. We do not assess our property and equipment for impairment unless certain impairment indicators specified in ASC Topic 360-10-35 are present. We did not evaluate any long-lived assets for impairment during 2016 because no such impairment indicators were present. |
|
|
• |
Income taxes – We recognize deferred taxes for future tax effects of temporary differences between financial and income tax reporting. Deferred income tax assets and liabilities for each tax-paying jurisdiction in which we operate are netted and presented as either a noncurrent deferred income tax asset or liability, as applicable. While we have considered future taxable income and ongoing prudent and feasible tax planning strategies in assessing the need for a valuation allowance, it is possible that in the future we may change our estimate of the amount of the deferred income tax assets that would more-likely-than-not be realized in the future resulting in an adjustment to the deferred income tax asset valuation allowance that would either increase or decrease, as applicable, reported net income in the period the change in estimate was made. |
|
|
We record a reserve for uncertain tax positions in accordance with the provisions of ASC Topic 740, Income Taxes, for tax positions where we believe it is more-likely-than-not our position will not prevail with the applicable tax authorities. Our reserve for uncertain tax positions is nil for each of 2015 and 2016. |
|
|
• |
Accruals – We record accruals for environmental, legal and other contingencies and commitments when estimated future expenditures associated with the contingencies become probable, and we can reasonably estimate the amounts of the future expenditures. However, new information may become available to us, or circumstances (such as applicable laws and regulations) may change, thereby resulting in an increase or decrease in the amount we are required to accrue for such matters (and, therefore, a corresponding decrease or increase of our reported net income in the period of such change). |
Liquidity and Capital Resources
Summary
Our primary source of liquidity on an on-going basis is our cash flow from operating activities, which is generally used to (i) fund capital expenditures, (ii) repay short-term or long-term indebtedness incurred primarily for capital expenditures, business combinations or buying back shares of our outstanding stock and (iii) provide for the payment of dividends (if declared). From time-to-time, we may incur indebtedness to fund capital expenditures, business combinations or other investment activities. In addition, from time-to-time, we may also sell assets outside the ordinary course of business, the proceeds of which are generally used to repay indebtedness (including indebtedness which may have been collateralized by the assets sold) or to fund capital expenditures or business combinations.
Consolidated cash flows
Operating activities. Trends in cash flows from operating activities, excluding changes in assets and liabilities, for the last three years have generally been similar to the trends in our earnings. Depreciation and amortization was comparable in each of 2016, 2015 and 2014. See Note 1 to the Consolidated Financial Statements.
Changes in assets and liabilities result primarily from the timing of production, sales and purchases. Such changes in assets and liabilities generally tend to even out over time. However, year-to-year relative changes in assets and liabilities can significantly affect the comparability of cash flows from operating activities. Cash provided by operating activities was comparable at $13.9 million and $13.5 million in 2016 and 2015, respectively,
- 17 -
as higher operating income of $1.6 million in 2016 was offset by a higher amount of net cash used by relative changes in inventories, receivables, payables and non-tax accruals of $1.9 million.
Cash provided by operating activities was $13.5 million in 2015 compared to $12.2 million in 2014. The $1.3 million increase in cash provided by operating activities is primarily the net result of the positive impact of lower net cash used by relative changes in our inventories, receivables, payables and non-tax related accruals of $1.2 million in 2015.
Relative changes in working capital can have a significant effect on cash flows from operating activities. As shown below, our total average days sales outstanding increased from December 31, 2015 to December 31, 2016 primarily as a result of the timing of sales and collections in the last month of 2016 as compared to 2015. For comparative purposes, we have provided 2014 numbers below.
|
Days Sales Outstanding: |
|
December 31, |
|
|
December 31, |
|
|
December 31, |
|
|
Security Products |
|
32 Days |
|
|
32 Days |
|
|
36 Days |
|
|
Marine Components |
|
32 Days |
|
|
26 Days |
|
|
33 Days |
|
|
Total |
|
32 Days |
|
|
31 Days |
|
|
36 Days |
|
As shown below, our average number of days in inventory increased slightly from December 31, 2015 to December 31, 2016 after assuming more normalized levels following an intentional inventory build in each of our segments at the end of 2014. The variability in days in inventory among our segments primarily relates to the complexity of the production processes, and therefore the length of time it takes to produce end products, as well as seasonal cycles. For comparative purposes, we have provided 2014 numbers below.
|
Days in Inventory: |
|
December 31 |
|
|
December 31, |
|
|
December 31, |
|
|
Security Products |
|
85 Days |
|
|
70 Days |
|
|
73 Days |
|
|
Marine Components |
|
125 Days |
|
|
120 Days |
|
|
122 Days |
|
|
Total |
|
90 Days |
|
|
76 Days |
|
|
79 Days |
|
Investing activities. Capital expenditures have primarily emphasized improving our manufacturing facilities and investing in manufacturing equipment, utilizing new technologies and increased automation of the manufacturing process, to provide for increased productivity and efficiency in order to meet expected customer demand and properly maintain our facilities and technology infrastructure. Capital expenditures were $2.8 million in 2014, $4.2 million in 2015 and $3.2 million in 2016. See Note 2 to our Consolidated Financial Statements. Capital expenditures in 2015 and 2016 include approximately $543,000 and $994,000, respectively, for an expansion to our Grayslake facility which was completed in April 2016. Approximately $481,000 of our 2014 capital expenditures relates to the implementation of a new manufacturing and accounting system for our operating segments that was implemented in January 2014.
Capital expenditures for 2017 are estimated at approximately $3.6 million. Capital spending for 2017 is expected to be funded through cash on hand and cash generated from operations.
In August 2016, we entered into an unsecured revolving demand promissory note with Valhi whereby we have agreed to loan Valhi up to $40 million. Our loan to Valhi bears interest at prime rate plus 1.00%, payable quarterly, with all principal due on demand, but in any event no earlier than December 31, 2018. The amount of our outstanding loans to Valhi at any time is at our discretion. During the third and fourth quarters of 2016, Valhi had borrowed a net $27.4 million under the promissory note ($36.6 million of gross borrowings and $9.2 million of gross repayments). See Note 9 to the Consolidated Financial Statements.
Financing activities. Cash dividends paid totaled $2.5 million ($.20 per share) in each of 2014, 2015 and 2016.
- 18 -
Off balance sheet financing arrangements
Other than certain operating leases discussed in Note 10 to the Consolidated Financial Statements, neither we nor any of our subsidiaries or affiliates are parties to any off-balance sheet financing arrangements.
Other
We believe cash generated from operations together with cash on hand will be sufficient to meet our liquidity needs for working capital, capital expenditures, debt service and dividends (if declared) for the next twelve months and our long term obligations for the next five years. To the extent that actual operating results or other developments differ materially from our expectations, our liquidity could be adversely affected.
All of our $33.2 million aggregate cash and cash equivalents at December 31, 2016, were held in the U.S.
We periodically evaluate our liquidity requirements, alternative uses of capital, capital needs and available resources in view of, among other things, our capital expenditure requirements, dividend policy and estimated future operating cash flows. As a result of this process, we have in the past and may in the future seek to raise additional capital, refinance or restructure indebtedness, issue additional securities, repurchase shares of our common stock, modify our dividend policy or take a combination of such steps to manage our liquidity and capital resources. In the normal course of business, we may review opportunities for acquisitions, joint ventures or other business combinations in the component products industry. In the event of any such transaction, we may consider using available cash, issuing additional equity securities or increasing our indebtedness or that of our subsidiaries.
Contractual obligations
As more fully described in the notes to the Consolidated Financial Statements, we are a party to various leases and other agreements that contractually and unconditionally commit us to pay certain amounts in the future. See Note 10 to the Consolidated Financial Statements. The following table summarizes such contractual commitments as of December 31, 2016 by the type and date of payment.
|
|
|
Payments due by period |
|
|||||||||||||||||
|
|
|
Total |
|
|
2017 |
|
|
2018–2019 |
|
|
2020–2021 |
|
|
2022 and |
|
|||||
|
|
|
(In thousands) |
|
|||||||||||||||||
|
Operating leases |
|
$ |
559 |
|
|
$ |
151 |
|
|
$ |
251 |
|
|
$ |
157 |
|
|
$ |
- |
|
|
Purchase obligations |
|
|
10,099 |
|
|
|
9,664 |
|
|
|
435 |
|
|
|
- |
|
|
|
- |
|
|
Income taxes |
|
|
1,441 |
|
|
|
1,441 |
|
|
|
- |
|
|
|
- |
|
|
|
- |
|
|
Fixed asset acquisitions |
|
|
905 |
|
|
|
905 |
|
|
|
- |
|
|
|
- |
|
|
|
- |
|
|
Total contractual cash obligations |
|
$ |
13,004 |
|
|
$ |
12,161 |
|
|
$ |
686 |
|
|
$ |
157 |
|
|
$ |
- |
|
The timing and amount shown for our commitments related to operating leases and fixed asset acquisitions are based upon the contractual payment amount and the contractual payment date for those commitments. The timing and amount shown for purchase obligations, which consist of all open purchase orders and contractual obligations (primarily commitments to purchase raw materials) is also based on the contractual payment amount and the contractual payment date for those commitments. The amount shown for income taxes is the consolidated amount of income taxes payable at December 31, 2016, which is assumed to be paid during 2017. Fixed asset acquisitions include firm purchase commitments for capital projects.
Commitments and contingencies
See Note 10 to the Consolidated Financial Statements.
- 19 -
Recent accounting pronouncements
See Note 12 to the Consolidated Financial Statements.
|
ITEM 7A. |
QUANTITATIVE AND QUALITATIVE DISCLOSURES ABOUT MARKET RISK |
General. We are exposed to market risk from changes in raw materials prices.
Raw materials. We will occasionally enter into short term commodity-related raw material supply arrangements to mitigate the impact of future increases in commodity-related raw material costs. We do not have long-term supply agreements for our raw material requirements because either we believe the risk of unavailability of those raw materials is low and we believe the downside risk of price volatility to be too great or because long-term supply agreements for those materials are generally not available. We do not engage in commodity raw material hedging programs.
|
ITEM 8. |
FINANCIAL STATEMENTS AND SUPPLEMENTARY DATA |
The information called for by this Item is contained in a separate section of this Annual Report. See “Index of Financial Statements” (page F-1).
|
ITEM 9. |
CHANGES IN AND DISAGREEMENTS WITH ACCOUNTANTS ON ACCOUNTING AND FINANCIAL DISCLOSURE |
None.
|
ITEM 9A. |
CONTROLS AND PROCEDURES |
Evaluation of Disclosure Controls and Procedures. We maintain disclosure controls and procedures which, as defined in Exchange Act Rule 13a-15(e), means controls and other procedures that are designed to ensure that information required to be disclosed in the reports that we file or submit to the SEC under the Securities Exchange Act of 1934, as amended (the “Act”), is recorded, processed, summarized and reported, within the time periods specified in the SEC’s rules and forms. Disclosure controls and procedures include, without limitation, controls and procedures designed to ensure that information we are required to disclose in the reports that we file or submit to the SEC under the Act is accumulated and communicated to our management, including our principal executive officer and our principal financial officer, or persons performing similar functions, as appropriate to allow timely decisions to be made regarding required disclosure. Our management with the participation of David A. Bowers, our Vice Chairman of the Board and Chief Executive Officer, and James W. Brown, our Vice President, Chief Financial Officer and Controller, have evaluated the design and operating effectiveness of our disclosure controls and procedures as of December 31, 2016. Based upon their evaluation, these executive officers have concluded that our disclosure controls and procedures are effective as of the date of such evaluation.
Management’s Report on Internal Control Over Financial Reporting. Our management is responsible for establishing and maintaining adequate internal control over financial reporting which, as defined in Exchange Act Rule 13a-15(f), means a process designed by, or under the supervision of, our principal executive and principal financial officers, or persons performing similar functions, and effected by our board of directors, management and other personnel, to provide reasonable assurance regarding the reliability of financial reporting and the preparation of financial statements for external purposes in accordance with generally accepted accounting principles, and includes those policies and procedures that:
|
|
• |
Pertain to the maintenance of records that in reasonable detail accurately and fairly reflect the transactions and dispositions of our assets. |
|
|
• |
Provide reasonable assurance that transactions are recorded as necessary to permit preparation of financial statements in accordance with GAAP, and that receipts and expenditures are being made only in accordance with authorizations of our management and directors, and |
- 20 -
Our evaluation of the effectiveness of our internal control over financial reporting is based upon the framework established in Internal Control – Integrated Framework issued by the Committee of Sponsoring Organizations of the Treadway Commission in 2013 (commonly referred to as the “2013 COSO” framework). Based on our evaluation under that framework, our management has concluded that our internal control over financial reporting was effective as of December 31, 2016.
This annual report does not include an attestation report of our registered public accounting firm regarding internal control over financial reporting. Management’s report was not subject to attestation by our registered public accounting firm pursuant to rules of the SEC that permit us to provide only management’s report in this annual report.
Changes in Internal Control Over Financial Reporting. There have been no changes in our internal control over financial reporting during the quarter ended December 31, 2016 that have materially affected, or are reasonably likely to materially affect, our internal control over financial reporting.
Certifications. Our chief executive officer and chief financial officer are required to, among other things, quarterly file a certification with the SEC regarding the quality of our public disclosures, as required by Section 302 of the Sarbanes-Oxley Act of 2002. We have filed the certifications for the quarter ended December 31, 2016 as exhibits 31.1 and 31.2 to this Annual Report on Form 10-K.
|
ITEM 9B. |
OTHER INFORMATION |
Not applicable.
PART III
|
ITEM 10. |
DIRECTORS, EXECUTIVE OFFICERS AND CORPORATE GOVERNANCE |
The information required by this Item is incorporated by reference to our definitive Proxy Statement to be filed with the Securities and Exchange Commission pursuant to Regulation 14A within 120 days after the end of the fiscal year covered by this report (“Proxy Statement”).
|
ITEM 11. |
EXECUTIVE COMPENSATION |
The information required by this Item is incorporated by reference to our Proxy Statement.
|
ITEM 12. |
SECURITY OWNERSHIP OF CERTAIN BENEFICIAL OWNERS AND MANAGEMENT AND RELATED STOCKHOLDER MATTERS |
The information required by this Item is incorporated by reference to our Proxy Statement.
|
ITEM 13. |
CERTAIN RELATIONSHIPS AND RELATED TRANSACTIONS AND DIRECTOR INDEPENDENCE |
The information required by this Item is incorporated by reference to our Proxy Statement. See also Note 9 to the Consolidated Financial Statements.
|
ITEM 14. |
PRINCIPAL ACCOUNTING FEES AND SERVICES |
The information required by this Item is incorporated by reference to our Proxy Statement.
- 21 -
|
ITEM 15. |
EXHIBITS, FINANCIAL STATEMENT SCHEDULES |
(a) and (c) Financial Statements
The consolidated financial statements listed on the accompanying Index of Financial Statements (see page F-1) are filed as part of this Annual Report.
All financial statement schedules have been omitted either because they are not applicable or required, or the information that would be required to be included is disclosed in the notes to the consolidated financial statements.
|
(b) |
Exhibits |
We have retained a signed original of any of these exhibits that contain signatures, and we will provide such exhibits to the Commission or its staff. Included as exhibits are the items listed in the Exhibit Index. We, upon request, will furnish a copy of any of the exhibits listed below upon payment of $4.00 per exhibit to cover our costs of furnishing the exhibits. Instruments defining the rights of holders of long-term debt issues which do not exceed 10% of consolidated total assets will be furnished to the Commission upon request. Such requests should be directed to the attention of our Corporate Secretary at our corporate offices located at 5430 LBJ Freeway, Suite 1700, Dallas, Texas 75240.
|
Item No. |
|
Exhibit Item |
|
|
|
|
|
3.1 |
|
Restated Certificate of Incorporation of Registrant – incorporated by reference to Exhibit 3.1 of the Registrant’s Registration Statement on Form S-1/A (File No. 333-42643) filed on February 5,1998. |
|
|
|
|
|
3.2 |
|
Amended and Restated Bylaws of Registrant, adopted by the Board of Directors October 24, 2007 – incorporated by reference to Exhibit 3.1 of the Registrant’s Current Report on Form 8-K filed October 30, 2007 (File No 1-13905). |
|
|
|
|
|
10.1 |
|
Intercorporate Services Agreement between the Registrant and Contran Corporation effective as of January 1, 2004 – incorporated by reference to Exhibit 10.2 of the Registrant’s Annual Report on Form 10-K for the year ended December 31, 2003 (File No. 1-13905) filed on March 4, 2004. |
|
|
|
|
|
10.2* |
|
CompX International Inc. 2012 Director Stock Plan – incorporated by reference to Exhibit 10.2 of the Registrant’s Annual Report on Form 10-K for the year ended December 31, 2012 (File No. 1-13905) filed on March 6, 2013. |
|
|
|
|
|
10.3 |
|
Tax Sharing Agreement between the Registrant, NL Industries, Inc. and Contran Corporation dated as of December 1, 2012 - incorporated by reference to Exhibit 10.2 of the Registrant’s Annual Report on Form 10-K for the year ended December 31, 2012 (File No. 1-13905) filed on March 6, 2013. |
|
|
|
|
|
10.4 |
|
First Amended and Restated Agreement Regarding Shared Insurance among the Registrant, Contran Corporation, Keystone Consolidated Industries, Inc., Kronos Worldwide, Inc., NL Industries, Inc., and Valhi, Inc. dated October 15, 2015 - incorporated by reference to Exhibit 10.4 of the Registrant’s Annual Report on Form 10-K for the year ended December 31, 2015 (File No. 1-13905) filed on March 3, 2016. |
|
|
|
|
|
10.5** |
|
First Amended and Restated Unsecured Revolving Demand Promissory Note dated December 31, 2016 in the original principal amount of $40.0 million executed by Valhi, Inc. and payable to the Registrant. |
|
|
|
|
|
10.6* |
|
Form of Indemnification Agreement – incorporated by reference to Exhibit 10.1 of the Registrant’s Current Report on Form 8-K filed May 26, 2016 (File No 1-13905). |
- 22 -
|
Item No. |
|
Exhibit Item (continued) |
||
|
|
|
|
||
|
|
|
|
||
|
21.1** |
|
Subsidiaries of the Registrant. |
||
|
|
|
|
||
|
23.1** |
|
Consent of PricewaterhouseCoopers LLP. |
||
|
|
|
|
||
|
31.1** |
|
Certification |
||
|
|
|
|
||
|
31.2** |
|
Certification |
||
|
|
|
|
||
|
32.1** |
|
Certification |
||
|
|
|
|
||
|
101.INS** |
|
XBRL Instance Document |
||
|
|
|
|
||
|
101.SCH** |
|
XBRL Taxonomy Extension Schema |
||
|
|
|
|
||
|
101.CAL** |
|
XBRL Taxonomy Extension Calculation Linkbase |
||
|
|
|
|
||
|
101.DEF** |
|
XBRL Taxonomy Extension Definition Linkbase |
||
|
|
|
|
||
|
101.LAB** |
|
XBRL Taxonomy Extension Label Linkbase |
||
|
|
|
|
||
|
101.PRE** |
|
XBRL Taxonomy Extension Presentation Linkbase |
||
|
|
|
|
||
|
* |
Management contract, compensatory plan or agreement. |
|
** |
Filed herewith. |
- 23 -
Pursuant to the requirements of Section 13 or 15(d) of the Securities Exchange Act of 1934, the Registrant has duly caused this report to be signed on its behalf by the undersigned, thereunto duly authorized.
|
|
|
|
|
COMPX INTERNATIONAL INC. |
||
|
|
|
|
|
|||
|
Date: March 1, 2017 |
|
|
|
By: |
|
/s/ David A. Bowers |
|
|
|
|
|
|
|
David A. Bowers |
|
|
|
|
|
|
|
Vice Chairman of the Board and |
|
|
|
|
|
|
|
Chief Executive Officer |
|
|
|
|
|
|
|
(Principal Executive Officer) |
Pursuant to the requirements of the Securities Exchange Act of 1934, this report has been signed by the following persons in the capacities and on the dates indicated.
|
Signature |
|
Title |
|
Date |
|
|
|
|
|
|
|
/s/ Robert D. Graham |
|
Chairman of the Board |
|
March 1, 2017 |
|
Robert D. Graham |
|
|
|
|
|
|
|
|
||
|
/s/ David A. Bowers |
|
Vice Chairman of the |
|
March 1, 2017 |
|
David A. Bowers |
|
Board and Chief Executive Officer (Principal Executive Officer) |
|
|
|
|
|
|
||
|
/s/ James W. Brown |
|
Vice President, |
|
March 1, 2017 |
|
James W. Brown |
|
Chief Financial Officer and Controller (Principal Financial and Accounting Officer) |
|
|
|
|
|
|
|
|
|
/s/ Thomas E. Barry |
|
Director |
|
March 1, 2017 |
|
Thomas E. Barry |
|
|
|
|
|
|
|
|
||
|
/s/ Loretta J. Feehan |
|
Director |
|
March 1, 2017 |
|
Loretta J. Feehan |
|
|
|
|
|
|
|
|
||
|
/s/ Elisabeth C. Fisher |
|
Director |
|
March 1, 2017 |
|
Elisabeth C. Fisher |
|
|
|
|
|
|
|
|
|
|
|
/s/ Ann Manix |
|
Director |
|
March 1, 2017 |
|
Ann Manix |
|
|
|
|
|
|
|
|
|
|
|
/s/ Cecil H. Moore, Jr. |
|
Director |
|
March 1, 2017 |
|
Cecil H. Moore, Jr. |
|
|
|
|
|
|
|
|
||
|
/s/ Mary A. Tidlund |
|
Director |
|
March 1, 2017 |
|
Mary A. Tidlund |
|
|
|
|
- 24 -
Items 8 and 15(a)
Index of Financial Statements
All financial statement schedules have been omitted either because they are not applicable or required, or the information that would be required to be included is disclosed in the notes to the consolidated financial statements.
REPORT OF INDEPENDENT REGISTERED PUBLIC ACCOUNTING FIRM
To the Board of Directors and Stockholders of CompX International Inc.:
In our opinion, the accompanying consolidated balance sheets and the related consolidated statements of income, of cash flows and of stockholders’ equity present fairly, in all material respects, the financial position of CompX International Inc. and its subsidiaries at January 3, 2016 and January 1, 2017, and the results of their operations and their cash flows for the fiscal years ended December 28, 2014, January 3, 2016 and January 1, 2017, in conformity with accounting principles generally accepted in the United States of America. These financial statements are the responsibility of the Company’s management. Our responsibility is to express an opinion on these financial statements based on our audits. We conducted our audits of these statements in accordance with the standards of the Public Company Accounting Oversight Board (United States). Those standards require that we plan and perform the audit to obtain reasonable assurance about whether the financial statements are free of material misstatement. An audit includes examining, on a test basis, evidence supporting the amounts and disclosures in the financial statements, assessing the accounting principles used and significant estimates made by management, and evaluating the overall financial statement presentation. We believe that our audits provide a reasonable basis for our opinion.
/s/PricewaterhouseCoopers LLP
Dallas, Texas
March 1, 2017
F-2
COMPX INTERNATIONAL INC. AND SUBSIDIARIES
(In thousands, except share data)
|
|
December 31, |
|
|||||
|
ASSETS |
2015 |
|
|
2016 |
|
||
|
|
|
|
|
|
|
|
|
|
Current assets: |
|
|
|
|
|
|
|
|
Cash and cash equivalents |
$ |
52,347 |
|
|
$ |
33,153 |
|
|
Accounts receivable |
|
8,760 |
|
|
|
10,347 |
|
|
Inventories |
|
15,098 |
|
|
|
14,974 |
|
|
Prepaid expenses and other |
|
704 |
|
|
|
701 |
|
|
|
|
|
|
|
|
|
|
|
Total current assets |
|
76,909 |
|
|
|
59,175 |
|
|
|
|
|
|
|
|
|
|
|
Other assets: |
|
|
|
|
|
|
|
|
Note receivable from affiliate |
|
- |
|
|
|
27,400 |
|
|
Goodwill |
|
23,742 |
|
|
|
23,742 |
|
|
Other noncurrent |
|
590 |
|
|
|
590 |
|
|
|
|
|
|
|
|
|
|
|
Total other assets |
|
24,332 |
|
|
|
51,732 |
|
|
|
|
|
|
|
|
|
|
|
Property and equipment: |
|
|
|
|
|
|
|
|
Land |
|
4,928 |
|
|
|
4,935 |
|
|
Buildings |
|
21,231 |
|
|
|
22,541 |
|
|
Equipment |
|
63,539 |
|
|
|
65,570 |
|
|
Construction in progress |
|
1,567 |
|
|
|
1,098 |
|
|
|
|
91,265 |
|
|
|
94,144 |
|
|
|
|
|
|
|
|
|
|
|
Less accumulated depreciation |
|
57,714 |
|
|
|
61,071 |
|
|
|
|
|
|
|
|
|
|
|
Net property and equipment |
|
33,551 |
|
|
|
33,073 |
|
|
|
|
|
|
|
|
|
|
|
Total assets |
$ |
134,792 |
|
|
$ |
143,980 |
|
F-3
COMPX INTERNATIONAL INC. AND SUBSIDIARIES
CONSOLIDATED BALANCE SHEETS (CONTINUED)
(In thousands, except share data)
|
|
December 31, |
|
|||||
|
LIABILITIES AND STOCKHOLDERS' EQUITY |
2015 |
|
|
2016 |
|
||
|
|
|
|
|
|
|
|
|
|
Current liabilities: |
|
|
|
|
|
|
|
|
Accounts payable and accrued liabilities |
$ |
11,618 |
|
|
$ |
11,882 |
|
|
Income taxes payable to affiliate |
|
470 |
|
|
|
1,441 |
|
|
|
|
|
|
|
|
|
|
|
Total current liabilities |
|
12,088 |
|
|
|
13,323 |
|
|
|
|
|
|
|
|
|
|
|
Noncurrent liabilities - |
|
|
|
|
|
|
|
|
Deferred income taxes |
|
5,001 |
|
|
|
4,887 |
|
|
|
|
|
|
|
|
|
|
|
Stockholders' equity: |
|
|
|
|
|
|
|
|
Preferred stock, $.01 par value; 1,000 shares |
|
|
|
|
|
|
|
|
authorized, none issued |
|
- |
|
|
|
- |
|
|
Class A common stock, $.01 par value; |
|
|
|
|
|
|
|
|
20,000,000 shares authorized; 2,411,107 and |
|
|
|
|
|
|
|
|
2,419,107 shares issued and outstanding |
|
24 |
|
|
|
24 |
|
|
Class B common stock, $.01 par value; |
|
|
|
|
|
|
|
|
10,000,000 shares authorized, issued and outstanding |
|
100 |
|
|
|
100 |
|
|
Additional paid-in capital |
|
55,422 |
|
|
|
55,515 |
|
|
Retained earnings |
|
62,157 |
|
|
|
70,131 |
|
|
|
|
|
|
|
|
|
|
|
Total stockholders' equity |
|
117,703 |
|
|
|
125,770 |
|
|
|
|
|
|
|
|
|
|
|
Total liabilities and stockholders’ equity |
$ |
134,792 |
|
|
$ |
143,980 |
|
|
|
|
|
|
|
|
|
|
|
|
|
|
|
|
|
|
|
|
|
|
|
|
|
|
|
|
|
Commitments and contingencies (Note 10) |
|
|
|
|
|
|
|
See accompanying Notes to Consolidated Financial Statements.
F-4
COMPX INTERNATIONAL INC. AND SUBSIDIARIES
CONSOLIDATED STATEMENTS OF INCOME
(In thousands, except per share data)
|
|
Years ended December 31, |
|
|||||||||
|
|
2014 |
|
|
2015 |
|
|
2016 |
|
|||
|
|
|
|
|
|
|
|
|
|
|
|
|
|
Net sales |
$ |
103,846 |
|
|
$ |
108,994 |
|
|
$ |
108,920 |
|
|
Cost of goods sold |
|
71,598 |
|
|
|
75,593 |
|
|
|
73,753 |
|
|
|
|
|
|
|
|
|
|
|
|
|
|
|
Gross profit |
|
32,248 |
|
|
|
33,401 |
|
|
|
35,167 |
|
|
|
|
|
|
|
|
|
|
|
|
|
|
|
Selling, general and administrative expense |
|
18,641 |
|
|
|
19,430 |
|
|
|
19,593 |
|
|
|
|
|
|
|
|
|
|
|
|
|
|
|
Operating income |
|
13,607 |
|
|
|
13,971 |
|
|
|
15,574 |
|
|
|
|
|
|
|
|
|
|
|
|
|
|
|
Interest income |
|
66 |
|
|
|
50 |
|
|
|
390 |
|
|
|
|
|
|
|
|
|
|
|
|
|
|
|
Income before income taxes |
|
13,673 |
|
|
|
14,021 |
|
|
|
15,964 |
|
|
|
|
|
|
|
|
|
|
|
|
|
|
|
Provision for income taxes |
|
5,012 |
|
|
|
4,903 |
|
|
|
5,507 |
|
|
|
|
|
|
|
|
|
|
|
|
|
|
|
Net income |
$ |
8,661 |
|
|
$ |
9,118 |
|
|
$ |
10,457 |
|
|
|
|
|
|
|
|
|
|
|
|
|
|
|
|
|
|
|
|
|
|
|
|
|
|
|
|
Basic and diluted earnings per common share |
$ |
0.70 |
|
|
$ |
0.73 |
|
|
$ |
0.84 |
|
|
|
|
|
|
|
|
|
|
|
|
|
|
|
|
|
|
|
|
|
|
|
|
|
|
|
|
Cash dividends per share |
$ |
0.20 |
|
|
$ |
0.20 |
|
|
$ |
0.20 |
|
|
|
|
|
|
|
|
|
|
|
|
|
|
|
|
|
|
|
|
|
|
|
|
|
|
|
|
Basic and diluted weighted average |
|
|
|
|
|
|
|
|
|
|
|
|
shares outstanding |
|
12,401 |
|
|
|
12,408 |
|
|
|
12,416 |
|
See accompanying Notes to Consolidated Financial Statements.
F-5
COMPX INTERNATIONAL INC. AND SUBSIDIARIES
CONSOLIDATED STATEMENTS OF CASH FLOWS
(In thousands)
|
|
Years ended December 31, |
|
|||||||||
|
|
2014 |
|
|
2015 |
|
|
2016 |
|
|||
|
|
|
|
|
|
|
|
|
|
|
|
|
|
Cash flows from operating activities: |
|
|
|
|
|
|
|
|
|
|
|
|
Net income |
$ |
8,661 |
|
|
$ |
9,118 |
|
|
$ |
10,457 |
|
|
Depreciation and amortization |
|
3,533 |
|
|
|
3,536 |
|
|
|
3,698 |
|
|
Deferred income taxes |
|
468 |
|
|
|
125 |
|
|
|
(114 |
) |
|
Provision for inventory reserves |
|
24 |
|
|
|
233 |
|
|
|
161 |
|
|
Other, net |
|
133 |
|
|
|
125 |
|
|
|
169 |
|
|
Change in assets and liabilities: |
|
|
|
|
|
|
|
|
|
|
|
|
Accounts receivable, net |
|
(251 |
) |
|
|
(46 |
) |
|
|
(1,596 |
) |
|
Inventories, net |
|
(3,652 |
) |
|
|
1,532 |
|
|
|
(37 |
) |
|
Accounts payable and accrued liabilities |
|
3,119 |
|
|
|
(1,036 |
) |
|
|
153 |
|
|
Accounts with affiliates |
|
93 |
|
|
|
37 |
|
|
|
970 |
|
|
Other, net |
|
42 |
|
|
|
(148 |
) |
|
|
3 |
|
|
|
|
|
|
|
|
|
|
|
|
|
|
|
Net cash provided by operating activities |
|
12,170 |
|
|
|
13,476 |
|
|
|
13,864 |
|
|
|
|
|
|
|
|
|
|
|
|
|
|
|
Cash flows from investing activities: |
|
|
|
|
|
|
|
|
|
|
|
|
Capital expenditures |
|
(2,825 |
) |
|
|
(4,218 |
) |
|
|
(3,175 |
) |
|
Note receivable from affiliate: |
|
|
|
|
|
|
|
|
|
|
|
|
Collections |
|
- |
|
|
|
- |
|
|
|
9,200 |
|
|
Advances |
|
- |
|
|
|
- |
|
|
|
(36,600 |
) |
|
Other, net |
|
(48 |
) |
|
|
- |
|
|
|
- |
|
|
|
|
|
|
|
|
|
|
|
|
|
|
|
Net cash used in investing activities |
|
(2,873 |
) |
|
|
(4,218 |
) |
|
|
(30,575 |
) |
|
|
|
|
|
|
|
|
|
|
|
|
|
|
Cash flows from financing activities - |
|
|
|
|
|
|
|
|
|
|
|
|
Dividends paid |
|
(2,480 |
) |
|
|
(2,481 |
) |
|
|
(2,483 |
) |
|
|
|
|
|
|
|
|
|
|
|
|
|
|
Net cash used in financing activities |
|
(2,480 |
) |
|
|
(2,481 |
) |
|
|
(2,483 |
) |
|
|
|
|
|
|
|
|
|
|
|
|
|
|
Net increase (decrease) |
$ |
6,817 |
|
|
$ |
6,777 |
|
|
$ |
(19,194 |
) |
F-6
COMPX INTERNATIONAL INC. AND SUBSIDIARIES
CONSOLIDATED STATEMENTS OF CASH FLOWS (CONTINUED)
(In thousands)
|
|
Years ended December 31, |
|
|||||||||
|
|
2014 |
|
|
2015 |
|
|
2016 |
|
|||
|
|
|
|
|
|
|
|
|
|
|
|
|
|
Cash and cash equivalents - |
|
|
|
|
|
|
|
|
|
|
|
|
Net increase (decrease) from: |
|
|
|
|
|
|
|
|
|
|
|
|
Operating, investing and financing activities |
$ |
6,817 |
|
|
$ |
6,777 |
|
|
$ |
(19,194 |
) |
|
Balance at beginning of year |
|
38,753 |
|
|
|
45,570 |
|
|
|
52,347 |
|
|
|
|
|
|
|
|
|
|
|
|
|
|
|
Balance at end of year |
$ |
45,570 |
|
|
$ |
52,347 |
|
|
$ |
33,153 |
|
|
|
|
|
|
|
|
|
|
|
|
|
|
|
|
|
|
|
|
|
|
|
|
|
|
|
|
Supplemental disclosures - |
|
|
|
|
|
|
|
|
|
|
|
|
Cash paid for income taxes |
$ |
4,449 |
|
|
$ |
4,743 |
|
|
$ |
4,646 |
|
|
|
|
|
|
|
|
|
|
|
|
|
|
|
|
|
|
|
|
|
|
|
|
|
|
|
|
|
|
|
|
|
|
|
|
|
|
|
|
See accompanying Notes to Consolidated Financial Statements.
F-7
COMPX INTERNATIONAL INC. AND SUBSIDIARIES
CONSOLIDATED STATEMENTS OF STOCKHOLDERS’ EQUITY
Years ended December 31, 2014, 2015 and 2016
(In thousands)
|
|
|
|
|
|
|
|
|
|
|
|
|
|
|
|
|
|
|
|
|
|
|
|
|
|
Additional |
|
|
|
|
|
|
Total |
|
|||||||
|
|
Common stock |
|
|
paid-in |
|
|
Retained |
|
|
stockholders' |
|
||||||||
|
|
Class A |
|
|
Class B |
|
|
capital |
|
|
earnings |
|
|
equity |
|
|||||
|
|
|
|
|
|
|
|
|
|
|
|
|
|
|
|
|
|
|
|
|
|
Balance at December 31, 2013 |
$ |
24 |
|
|
$ |
100 |
|
|
$ |
55,265 |
|
|
$ |
49,339 |
|
|
$ |
104,728 |
|
|
|
|
|
|
|
|
|
|
|
|
|
|
|
|
|
|
|
|
|
|
|
Net income |
|
- |
|
|
|
- |
|
|
|
- |
|
|
|
8,661 |
|
|
|
8,661 |
|
|
Cash dividends |
|
- |
|
|
|
- |
|
|
|
- |
|
|
|
(2,480 |
) |
|
|
(2,480 |
) |
|
Issuance of common stock |
|
- |
|
|
|
- |
|
|
|
77 |
|
|
|
- |
|
|
|
77 |
|
|
|
|
|
|
|
|
|
|
|
|
|
|
|
|
|
|
|
|
|
|
|
Balance at December 31, 2014 |
|
24 |
|
|
|
100 |
|
|
|
55,342 |
|
|
|
55,520 |
|
|
|
110,986 |
|
|
|
|
|
|
|
|
|
|
|
|
|
|
|
|
|
|
|
|
|
|
|
Net income |
|
- |
|
|
|
- |
|
|
|
- |
|
|
|
9,118 |
|
|
|
9,118 |
|
|
Cash dividends |
|
- |
|
|
|
- |
|
|
|
- |
|
|
|
(2,481 |
) |
|
|
(2,481 |
) |
|
Issuance of common stock |
|
- |
|
|
|
- |
|
|
|
80 |
|
|
|
- |
|
|
|
80 |
|
|
|
|
|
|
|
|
|
|
|
|
|
|
|
|
|
|
|
|
|
|
|
Balance at December 31, 2015 |
|
24 |
|
|
|
100 |
|
|
|
55,422 |
|
|
|
62,157 |
|
|
|
117,703 |
|
|
|
|
|
|
|
|
|
|
|
|
|
|
|
|
|
|
|
|
|
|
|
Net income |
|
- |
|
|
|
- |
|
|
|
- |
|
|
|
10,457 |
|
|
|
10,457 |
|
|
Cash dividends |
|
- |
|
|
|
- |
|
|
|
- |
|
|
|
(2,483 |
) |
|
|
(2,483 |
) |
|
Issuance of common stock |
|
- |
|
|
|
- |
|
|
|
93 |
|
|
|
- |
|
|
|
93 |
|
|
|
|
|
|
|
|
|
|
|
|
|
|
|
|
|
|
|
|
|
|
|
Balance at December 31, 2016 |
$ |
24 |
|
|
$ |
100 |
|
|
$ |
55,515 |
|
|
$ |
70,131 |
|
|
$ |
125,770 |
|
See accompanying Notes to Consolidated Financial Statements.
F-8
COMPX INTERNATIONAL INC. AND SUBSIDIARIES
NOTES TO CONSOLIDATED FINANCIAL STATEMENTS
December 31, 2016
Note 1 – Summary of significant accounting policies:
Organization. We (NYSE MKT: CIX) are 87% owned by NL Industries, Inc. (NYSE: NL) at December 31, 2016. We manufacture and sell component products (security products and recreational marine components). At December 31, 2016, Valhi, Inc. (NYSE: VHI) owns 83% of NL’s outstanding common stock and a wholly-owned subsidiary of Contran Corporation owns 93% of Valhi’s outstanding common stock. All of Contran’s outstanding voting stock is held by a family trust established for the benefit of Lisa K. Simmons and Serena Simmons Connelly and their children, for which Ms. Simmons and Ms. Connelly are co-trustees, or is held directly by Ms. Simmons and Ms. Connelly or entities related to them. Consequently, Ms. Simmons and Ms. Connelly may be deemed to control Contran, Valhi, NL and us.
Unless otherwise indicated, references in this report to “we,” “us,” or “our” refer to CompX International Inc. and its subsidiaries, taken as a whole.
Management estimates. In preparing our financial statements in conformity with accounting principles generally accepted in the United States of America (“GAAP”) we are required to make estimates and assumptions that affect the reported amounts of assets and liabilities and disclosure of contingent assets and liabilities at each balance sheet date and the reported amounts of our revenues and expenses during each reporting period. Actual results may differ significantly from previously estimated amounts under different assumptions or conditions.
Principles of consolidation. Our consolidated financial statements include the accounts of CompX International Inc. and our wholly-owned subsidiaries. We eliminate all material intercompany accounts and balances.
Fiscal year. Our fiscal year end is always the Sunday closest to December 31, and our operations are reported on a 52 or 53-week fiscal year. Each of the years ended December 31, 2014 and 2016 consisted of 52 weeks. The year ended December 31, 2015 consisted of 53 weeks. For presentation purposes, annual and quarterly information in the consolidated financial statements and accompanying notes are presented as ended on March 31, June 30, September 30 and December 31, as applicable. The actual date of our fiscal years ended December 31, 2014, 2015 and 2016 are December 28, 2014, January 3, 2016 and January 1, 2017, respectively.
Cash and cash equivalents. We classify as cash and cash equivalents, bank time deposits and government and commercial notes and bills with original maturities of three months or less.
Net sales. We record sales when products are shipped and title and other risks and rewards of ownership have passed to the customer. Amounts charged to customers for shipping and handling are not material. Sales are stated net of price, early payment and distributor discounts and volume rebates. We report any tax assessed by a governmental authority that we collect from our customers that is both imposed on and concurrent with our revenue producing activities (such as sales and use taxes) on a net basis (meaning we do not recognize these taxes either in our revenues or in our costs and expenses).
Accounts receivable. We provide an allowance for doubtful accounts for known and estimated potential losses arising from our sales to customers based on a periodic review of these accounts.
F-9
Inventories and cost of sales. We state inventories at the lower of cost or market, net of allowance for obsolete and slow-moving inventories. We generally base inventory costs for all inventory categories on average cost that approximates the first-in, first-out method. Inventories include the costs for raw materials, the cost to manufacture the raw materials into finished goods and overhead. Depending on the inventory’s stage of completion, our manufacturing costs can include the costs of packing and finishing, utilities, maintenance and depreciation, shipping and handling, and salaries and benefits associated with our manufacturing process. We allocate fixed manufacturing overhead costs based on normal production capacity. Unallocated overhead costs resulting from periods with abnormally low production levels are charged to expense as incurred. As inventory is sold to third parties, we recognize the cost of sales in the same period that the sale occurs. We periodically review our inventory for estimated obsolescence or instances when inventory is no longer marketable for its intended use, and we record any write-down, equal to the difference between the cost of inventory and its estimated net realizable value, based on assumptions about alternative uses, market conditions and other factors.
Selling, general and administrative expenses; advertising costs. Selling, general and administrative expenses include costs related to marketing, sales, distribution, research and development and administrative functions such as accounting, treasury and finance, and includes costs for salaries and benefits, travel and entertainment, promotional materials and professional fees. We expense advertising and research and development costs as incurred. Advertising costs were not significant in 2014, 2015 or 2016.
Goodwill. Goodwill represents the excess of cost over fair value of individual net assets acquired in business combinations. Goodwill is not subject to periodic amortization. We evaluate goodwill for impairment annually or when circumstances indicate the carrying value may not be recoverable. See Note 5.
Property and equipment; depreciation expense. We state property and equipment, including purchased computer software for internal use, at cost. We compute depreciation of property and equipment for financial reporting purposes principally by the straight-line method over the estimated useful lives of 15 to 40 years for buildings and 3 to 20 years for equipment and software. We use accelerated depreciation methods for income tax purposes, as permitted. Depreciation expense was $3.5 million in each of 2014 and 2015 and $3.7 million in 2016. Upon sale or retirement of an asset, the related cost and accumulated depreciation are removed from the accounts and any gain or loss is recognized in income currently. Expenditures for maintenance, repairs and minor renewals are expensed; expenditures for major improvements are capitalized.
We perform impairment tests when events or changes in circumstances indicate the carrying value may not be recoverable. We consider all relevant factors. We perform the impairment test by comparing the estimated future undiscounted cash flows associated with the asset to the asset’s net carrying value to determine if impairment exists.
Employee benefit plans. We maintain various defined contribution plans in which we make contributions based on matching or other formulas. Defined contribution plan expense approximated $2.3 million in 2014, $2.4 million in 2015 and $2.6 million in 2016.
Self-insurance. We are partially self-insured for workers’ compensation and certain employee health benefits and self-insured for most environmental issues. We purchase coverage in order to limit our exposure to any significant levels of workers’ compensation or employee health benefit claims. We accrue self-insured losses based upon estimates of the aggregate liability for uninsured claims incurred using certain actuarial assumptions followed in the insurance industry and our own historical claims experience.
Income taxes. We, and our parent NL, are members of the Contran Tax Group. We have been and currently are a part of the consolidated tax returns filed by Contran for U.S. federal purposes as well as for certain U.S. state jurisdictions. As a member of the Contran Tax Group, we are jointly and severally liable for the federal income tax liability of Contran and the other companies included in the Contran Tax Group for all periods in which we are included in the Contran Tax Group. See Note 10.
As a member of the Contran Tax Group, we are a party to a tax sharing agreement which provides that we compute our provision for U.S. income taxes on a separate-company basis. Pursuant to the tax sharing agreement, we make payments to or receive payments from NL in amounts we would have paid to or received from
F-10
the U.S. Internal Revenue Service or the applicable state tax authority had we not been a member of the Contran Tax Group. The separate company provisions and payments are computed using the tax elections made by Contran. We made net cash payments for income taxes to NL of $4.4 million in 2014, $4.7 million in 2015 and $4.6 million in 2016.
Deferred income tax assets and liabilities are recognized for the expected future tax consequences of temporary differences between the income tax and financial reporting carrying amounts of assets and liabilities. Deferred income tax assets and liabilities for each tax-paying jurisdiction in which we operate are netted and presented as either a noncurrent deferred income tax asset or liability, as applicable. We periodically evaluate our deferred tax assets in the various taxing jurisdictions in which we operate and adjust any related valuation allowance based on the estimate of the amount of deferred tax assets which we believe do not meet the more-likely-than-not recognition criteria. See Notes 7 and 12.
We record a reserve for uncertain tax positions for tax positions where we believe it is more-likely-than-not our position will not prevail with the applicable tax authorities. Our reserve for uncertain tax positions was nil in each of 2015 and 2016.
Note 2 – Business and geographic segments:
Our operating segments are defined as components of our operations about which separate financial information is available that is regularly evaluated by our chief operating decision maker in determining how to allocate resources and in assessing performance. At December 31, 2016, we had two operating segments – Security Products and Marine Components.
The Security Products segment, with a facility in South Carolina and a facility shared with Marine Components in Illinois, manufactures locking mechanisms and other security products for sale to the transportation, postal, office and institutional furniture, cabinetry, tool storage, healthcare and other industries.
Our Marine Components segment, with a facility in Wisconsin and a facility shared with Security Products in Illinois, manufactures and distributes stainless steel exhaust systems, gauges and throttle controls primarily for recreational boats.
The chief operating decision maker evaluates segment performance based on segment operating income, which is defined as income before income taxes and interest expense (if any), exclusive of certain general corporate income and expense items (primarily interest income) and certain non-recurring items (such as gains or losses on the disposition of business units and other long-lived assets outside the ordinary course of business). The accounting policies of the reportable operating segments are the same as those described in Note 1. Capital expenditures include additions to property and equipment, but exclude amounts attributable to business combinations.
Segment assets are comprised of all assets attributable to the reportable segments. Corporate assets are not attributable to the operating segments and consist primarily of cash and cash equivalents. For geographic information, the point of origin (place of manufacture) for all net sales is the U.S., the point of destination for net sales is based on the location of the customer, and property and equipment are attributable to their physical location. Intersegment sales are not material.
F-11
|
|
|
Years ended December 31, |
|
|||||||||
|
|
|
2014 |
|
|
2015 |
|
|
2016 |
|
|||
|
|
|
(In thousands) |
|
|||||||||
|
Net sales: |
|
|
|
|
|
|
|
|
|
|
|
|
|
Security Products |
|
$ |
91,470 |
|
|
$ |
95,614 |
|
|
$ |
94,693 |
|
|
Marine Components |
|
|
12,376 |
|
|
|
13,380 |
|
|
|
14,227 |
|
|
Total |
|
$ |
103,846 |
|
|
$ |
108,994 |
|
|
$ |
108,920 |
|
|
Operating income (loss): |
|
|
|
|
|
|
|
|
|
|
|
|
|
Security Products |
|
$ |
18,740 |
|
|
$ |
18,585 |
|
|
$ |
19,981 |
|
|
Marine Components |
|
|
705 |
|
|
|
1,433 |
|
|
|
1,707 |
|
|
Corporate |
|
|
(5,838 |
) |
|
|
(6,047 |
) |
|
|
(6,114 |
) |
|
Total operating income |
|
|
13,607 |
|
|
|
13,971 |
|
|
|
15,574 |
|
|
Interest income |
|
|
66 |
|
|
|
50 |
|
|
|
390 |
|
|
|
|
|
|
|
|
|
|
|
|
|
|
|
|
Income before income taxes |
|
$ |
13,673 |
|
|
$ |
14,021 |
|
|
$ |
15,964 |
|
|
|
|
|
|
|||||||||
|
Depreciation and amortization: |
|
|
|
|
|
|
|
|
|
|
|
|
|
Security Products |
|
$ |
2,771 |
|
|
$ |
2,831 |
|
|
$ |
3,025 |
|
|
Marine Components |
|
|
732 |
|
|
|
695 |
|
|
|
663 |
|
|
Corporate |
|
|
30 |
|
|
|
10 |
|
|
|
10 |
|
|
Total |
|
$ |
3,533 |
|
|
$ |
3,536 |
|
|
$ |
3,698 |
|
|
Capital expenditures: |
|
|
|
|
|
|
|
|
|
|
|
|
|
Security Products |
|
$ |
2,571 |
|
|
$ |
3,805 |
|
|
$ |
3,017 |
|
|
Marine Components |
|
|
250 |
|
|
|
408 |
|
|
|
153 |
|
|
Corporate |
|
|
4 |
|
|
|
5 |
|
|
|
5 |
|
|
Total |
|
$ |
2,825 |
|
|
$ |
4,218 |
|
|
$ |
3,175 |
|
|
|
|
|
|
|||||||||
|
Net sales point of destination: |
|
|
|
|
|
|
|
|
|
|
|
|
|
United States |
|
$ |
98,994 |
|
|
$ |
103,737 |
|
|
$ |
98,526 |
|
|
Canada |
|
|
1,927 |
|
|
|
2,352 |
|
|
|
7,515 |
|
|
Mexico |
|
|
1,124 |
|
|
|
1,334 |
|
|
|
1,315 |
|
|
Other |
|
|
1,801 |
|
|
|
1,571 |
|
|
|
1,564 |
|
|
Total |
|
$ |
103,846 |
|
|
$ |
108,994 |
|
|
$ |
108,920 |
|
|
|
|
December 31, |
|
|||||||||
|
|
|
2014 |
|
|
2015 |
|
|
2016 |
|
|||
|
|
|
(In thousands) |
|
|||||||||
|
Total assets: |
|
|
|
|
|
|
|
|
|
|
|
|
|
Security Products |
|
$ |
70,244 |
|
|
$ |
72,561 |
|
|
$ |
73,345 |
|
|
Marine Components |
|
|
9,951 |
|
|
|
12,761 |
|
|
|
12,209 |
|
|
Corporate and eliminations |
|
|
48,896 |
|
|
|
49,470 |
|
|
|
58,426 |
|
|
Total |
|
$ |
129,091 |
|
|
$ |
134,792 |
|
|
$ |
143,980 |
|
|
|
|
|
|
|
|
|
|
|
|
|
|
|
|
Net property and equipment for 2014, 2015 and 2016 is entirely located in the United States. |
F-12
Note 3 – Accounts receivable, net:
|
|
|
December 31, |
|
|||||
|
|
|
2015 |
|
|
2016 |
|
||
|
|
|
(In thousands) |
|
|||||
|
Account receivable, net: |
|
|
|
|
|
|
|
|
|
Security Products |
|
$ |
7,995 |
|
|
$ |
9,329 |
|
|
Marine Components |
|
|
852 |
|
|
|
1,088 |
|
|
Allowance for doubtful accounts |
|
|
(87 |
) |
|
|
(70 |
) |
|
Total accounts receivable, net |
|
$ |
8,760 |
|
|
$ |
10,347 |
|
Note 4 – Inventories:
|
|
|
December 31, |
|
|||||
|
|
|
2015 |
|
|
2016 |
|
||
|
|
|
(In thousands) |
|
|||||
|
Raw materials: |
|
|
|
|
|
|
|
|
|
Security Products |
|
$ |
2,426 |
|
|
$ |
2,365 |
|
|
Marine Components |
|
|
381 |
|
|
|
378 |
|
|
Total raw materials |
|
|
2,807 |
|
|
|
2,743 |
|
|
Work-in-process: |
|
|
|
|
|
|
|
|
|
Security Products |
|
|
7,732 |
|
|
|
7,387 |
|
|
Marine Components |
|
|
1,614 |
|
|
|
1,601 |
|
|
Total work-in-process |
|
|
9,346 |
|
|
|
8,988 |
|
|
Finished goods: |
|
|
|
|
|
|
|
|
|
Security Products |
|
|
2,041 |
|
|
|
2,440 |
|
|
Marine Components |
|
|
904 |
|
|
|
803 |
|
|
Total finished goods |
|
|
2,945 |
|
|
|
3,243 |
|
|
Total inventories, net |
|
$ |
15,098 |
|
|
$ |
14,974 |
|
F-13
Note 5 – Goodwill:
We assign goodwill based on reporting unit (as that term is defined in ASC Topic 350-20-20, Goodwill) which corresponds to our operating segments. All of our goodwill recognized during the past three years relates to our Security Products segment and was generated from acquisitions relating to our Security Products segment prior to 2001. We test for goodwill impairment at the reporting unit level. In accordance with the requirements of ASC Topic 350-20-20, we review goodwill for each of our reporting units for impairment during the third quarter of each year or when circumstances arise that indicate an impairment might be present.
In 2014, 2015 and 2016, our goodwill was tested for impairment only in the third quarter of each year in connection with our annual testing date. No impairment was indicated as part of such annual reviews of goodwill. As permitted by GAAP, during 2014 and 2015 we used the qualitative assessment of ASC 350-20-35 for our annual impairment test and determined it was not necessary to perform the two-step quantitative goodwill impairment test. During 2016, we used the quantitative assessment of ASC 350-20-35 for our annual impairment test using discounted cash flows to determine the estimated fair value of our Security Products reporting unit. Such discounted cash flows are a Level 3 input as defined by ASC 820-10-35.
Our gross goodwill at December 31, 2016 is $33.6 million. Prior to 2014, we recorded a $9.9 million goodwill impairment in our Marine Components segment resulting in a net consolidated carrying amount of $23.7 million. There have been no changes in the carrying amount of our goodwill during the past three years.
Note 6 – Accounts payable and accrued liabilities:
|
|
|
December 31, |
|
|||||
|
|
|
2015 |
|
|
2016 |
|
||
|
|
|
(In thousands) |
|
|||||
|
Accounts payable |
|
$ |
2,671 |
|
|
$ |
2,614 |
|
|
Accrued liabilities: |
|
|
|
|
|
|
|
|
|
Employee benefits |
|
|
7,652 |
|
|
|
7,644 |
|
|
Customer tooling |
|
|
320 |
|
|
|
346 |
|
|
Taxes other than on income |
|
|
253 |
|
|
|
300 |
|
|
Insurance |
|
|
244 |
|
|
|
233 |
|
|
Professional |
|
|
75 |
|
|
|
219 |
|
|
Sales rebates |
|
|
96 |
|
|
|
140 |
|
|
Other |
|
|
307 |
|
|
|
386 |
|
|
Total |
|
$ |
11,618 |
|
|
$ |
11,882 |
|
F-14
Note 7 – Income taxes:
The provision for income taxes and the difference between such provision for income taxes and the amount that would be expected using the U.S. federal statutory income tax rate of 35% are presented below. All of our pre-tax income relates to operations in the United States.
|
|
|
Years ended December 31, |
|
|||||||||
|
|
|
2014 |
|
|
2015 |
|
|
2016 |
|
|||
|
|
|
(In thousands) |
|
|||||||||
|
Provision for income taxes: |
|
|
|
|
|
|
|
|
|
|
|
|
|
Currently payable |
|
$ |
4,544 |
|
|
$ |
4,778 |
|
|
$ |
5,621 |
|
|
Deferred income tax expense (benefit) |
|
|
468 |
|
|
|
125 |
|
|
|
(114 |
) |
|
Total |
|
$ |
5,012 |
|
|
$ |
4,903 |
|
|
$ |
5,507 |
|
|
Expected tax expense, at the U.S. federal statutory income tax rate of 35% |
|
$ |
4,787 |
|
|
$ |
4,908 |
|
|
$ |
5,588 |
|
|
State income taxes |
|
|
604 |
|
|
|
387 |
|
|
|
388 |
|
|
Domestic production activities deduction |
|
|
(378 |
) |
|
|
(415 |
) |
|
|
(495 |
) |
|
Valuation allowance |
|
|
(24 |
) |
|
|
- |
|
|
|
- |
|
|
Other, net |
|
|
23 |
|
|
|
23 |
|
|
|
26 |
|
|
Total |
|
$ |
5,012 |
|
|
$ |
4,903 |
|
|
$ |
5,507 |
|
|
|
|
|
|
|
|
|
|
|
|
|
|
|
The components of the net deferred tax liability are summarized below.
|
|
|
December 31, |
|
|||||
|
|
|
2015 |
|
|
2016 |
|
||
|
|
|
(In thousands) |
|
|||||
|
Tax effect of temporary differences related to: |
|
|
|
|
|
|
|
|
|
Inventories |
|
$ |
538 |
|
|
$ |
507 |
|
|
Property and equipment |
|
|
(4,650 |
) |
|
|
(4,468 |
) |
|
Accrued liabilities and other deductible differences |
|
|
45 |
|
|
|
110 |
|
|
Accrued employee benefits |
|
|
1,695 |
|
|
|
1,592 |
|
|
Other deductible differences |
|
|
4 |
|
|
|
4 |
|
|
Goodwill |
|
|
(2,625 |
) |
|
|
(2,625 |
) |
|
Other taxable differences |
|
|
(8 |
) |
|
|
(7 |
) |
|
Total deferred tax liability |
|
$ |
(5,001 |
) |
|
$ |
(4,887 |
) |
|
|
|
|
|
|
|
|
|
|
We previously had certain U.S. state net operating loss carryforwards, the benefit of which we had not recognized under the more-likely-than-not recognition criteria. We utilized all of the remaining state net operating loss carryforward in 2014. Our provision for income taxes includes a benefit of $24,000 in 2014 related to changes in the deferred tax asset valuation allowance associated with such carryforwards.
We and Contran file income tax returns in U.S. federal and various state and local jurisdictions. Our income tax returns prior to 2013 are generally considered closed to examination by applicable tax authorities.
F-15
Note 8 – Stockholders’ equity:
|
|
|
Shares of common stock |
|
|||||
|
|
|
Class A |
|
|
Class B |
|
||
|
|
|
Issued and |
|
|
Issued and |
|
||
|
Balance at December 31, 2013 |
|
|
2,397,107 |
|
|
|
10,000,000 |
|
|
Issued |
|
|
7,000 |
|
|
|
- |
|
|
Balance at December 31, 2014 |
|
|
2,404,107 |
|
|
|
10,000,000 |
|
|
Issued |
|
|
7,000 |
|
|
|
- |
|
|
Balance at December 31, 2015 |
|
|
2,411,107 |
|
|
|
10,000,000 |
|
|
Issued |
|
|
8,000 |
|
|
|
- |
|
|
Balance at December 31, 2016 |
|
|
2,419,107 |
|
|
|
10,000,000 |
|
Class A and Class B common stock. The shares of Class A common stock and Class B common stock are identical in all respects, except for certain voting rights and certain conversion rights in respect of the shares of the Class B common stock. Holders of Class A common stock are entitled to one vote per share. NL, which holds all of the outstanding shares of Class B common stock, is entitled to one vote per share in all matters except for election of directors, for which NL is entitled to ten votes per share. Holders of all classes of common stock entitled to vote will vote together as a single class on all matters presented to the stockholders for their vote or approval, except as otherwise required by applicable law. Each share of Class A common stock and Class B common stock have an equal and ratable right to receive dividends to be paid from our assets when and if declared by the board of directors. In the event of the dissolution, liquidation or winding up of our operations, the holders of Class A common stock and Class B common stock will be entitled to share equally and ratably in the assets available for distribution after payments are made to our creditors and to the holders of any of our preferred stock that may be outstanding at the time. Shares of the Class A common stock have no conversion rights. Under certain conditions, shares of Class B common stock will convert, on a share-for-share basis, into shares of Class A common stock.
Share repurchases and cancellations. Prior to 2014, our board of directors authorized various repurchases of shares of our Class A common stock in open market transactions, including block purchases, or in privately-negotiated transactions at unspecified prices and over an unspecified period of time. We may repurchase our common stock from time to time as market conditions permit. The stock repurchase program does not include specific price targets or timetables and may be suspended at any time. Depending on market conditions, we may terminate the program prior to its completion. We will generally use cash on hand to acquire the shares. Repurchased shares will be added to our treasury and cancelled. We made no treasury purchases during 2014, 2015 or 2016 and at December 31, 2016, approximately 678,000 shares were available for purchase under these authorizations.
Incentive compensation plan. We have a share based incentive compensation plan pursuant to which an aggregate of up to 200,000 shares of our common stock can be awarded to non-employee members of our board of directors. All of the Class A common shares we issued in 2014, 2015 and 2016 were issued under this plan. At December 31, 2016, 173,000 shares were available for award under this plan.
Dividends. We paid regular quarterly dividends of $.05 per share during 2014, 2015 and 2016. Declaration and payment of future dividends and the amount thereof, if any, is discretionary and dependent upon our results of operations, financial condition, cash requirements for our businesses, contractual requirements and restrictions and other factors deemed relevant by our board of directors.
Note 9 – Related party transactions:
We may be deemed to be controlled by Ms. Lisa Simmons and Ms. Serena Connelly. See Note 1. Corporations that may be deemed to be controlled by or affiliated with these individuals sometimes engage in (a) intercorporate transactions such as guarantees, management and expense sharing arrangements, shared fee arrangements, joint ventures, partnerships, loans, options, advances of funds on open account, and sales, leases and exchanges of assets, including securities issued by both related and unrelated parties and (b) common investment and acquisition strategies, business combinations, reorganizations, recapitalizations, securities repurchases, and
F-16
purchases and sales (and other acquisitions and dispositions) of subsidiaries, divisions or other business units, which transactions have involved both related and unrelated parties and have included transactions that resulted in the acquisition by one related party of a publicly-held minority equity interest in another related party. We continuously consider, review and evaluate, and understand that Contran and related entities consider, review and evaluate such transactions. Depending upon the business, tax and other objectives then relevant, it is possible that we might be a party to one or more such transactions in the future.
From time to time, we may have loans and advances outstanding between us and various related parties pursuant to term and demand notes. We generally enter into these loans and advances for cash management purposes. When we loan funds to related parties, we are generally able to earn a higher rate of return on the loan than we would earn if we invested the funds in other instruments. While certain of these loans may be of a lesser credit quality than cash equivalent instruments otherwise available to us, we believe we have evaluated the credit risks in the terms of the applicable loans. In this regard, in August, 2016 we entered into an unsecured revolving demand promissory note with Valhi whereby we have agreed to loan Valhi up to $40 million. Our loan to Valhi, as amended, bears interest at prime plus 1.00%, payable quarterly, with all principal due on demand, but in any event no earlier than December 31, 2018. The amount of our outstanding loans to Valhi at any time is at our discretion. At December 31, 2016, the outstanding principal balance receivable from Valhi under the promissory note was $27.4 million. Interest income (including unused commitment fees) on our loan to Valhi was $0.2 million in 2016.
Under the terms of an Intercorporate Service Agreement (“ISA”) with Contran, employees of Contran perform certain management, tax planning, financial, legal and administrative services for us on a fee basis. Such fees are based upon estimates of time devoted to our affairs by individual Contran employees and the compensation of such persons. Because of the large number of companies affiliated with Contran, we believe we benefit from cost savings and economies of scale gained by not having certain management, financial and administrative staffs duplicated at each entity, thus allowing certain individuals to provide services to multiple companies but only be compensated by one entity. Fees pursuant to these agreements aggregated $3.0 million in each of 2014 and 2015 and $3.1 million in 2016. This agreement is renewed annually, and we expect to pay $2.8 million under the ISA during 2017.
Contran and certain of its subsidiaries and affiliates, including us, purchase certain of their insurance policies as a group, with the costs of the jointly-owned policies being apportioned among the participating companies. Tall Pines Insurance Company (“Tall Pines”) and EWI RE, Inc. (“EWI”), each subsidiaries of Valhi, provide for or broker certain insurance policies for Contran and certain of its subsidiaries and affiliates, including us. Tall Pines purchases reinsurance from third-party insurance carriers with an A.M. Best Company rating of generally at least A-(Excellent) for substantially all of the risks it underwrites. Consistent with insurance industry practices, Tall Pines and EWI receive commissions from the insurance and reinsurance underwriters and/or assess fees for the policies that they provide or broker. The aggregate premiums we paid to Tall Pines and EWI were approximately $1.1 million in 2014, $1.6 million in 2015 and $1.7 million in 2016. These amounts principally represent payments for insurance premiums, which include premiums or fees paid to Tall Pines or fees paid to EWI. These amounts also include payments to insurers or reinsurers through EWI for the reimbursement of claims within our applicable deductible or retention ranges that such insurers or reinsurers paid to third parties on our behalf, as well as amounts for claims and risk management services and various other third-party fees and expenses incurred by the program. We expect that these relationships with Tall Pines and EWI will continue in 2017.
With respect to certain of such jointly-owned insurance policies, it is possible that unusually large losses incurred by one or more insureds during a given policy period could leave the other participating companies without adequate coverage under that policy for the balance of the policy period. As a result, and in the event that the available coverage under a particular policy would become exhausted by one or more claims, Contran and certain of its subsidiaries and affiliates, including us, have entered into a loss sharing agreement under which any uninsured loss arising because the available coverage had been exhausted by one or more claims will be shared ratably amongst those entities that had submitted claims under the relevant policy. We believe the benefits in the form of reduced premiums and broader coverage associated with the group coverage for such policies justifies the risk associated with the potential for any uninsured loss.
F-17
Note 10 – Commitments and contingencies:
Legal proceedings. We are involved, from time to time, in various environmental, contractual, product liability, patent (or intellectual property), employment and other claims and disputes incidental to our business. We currently believe the disposition of all claims and disputes, individually or in the aggregate, should not have a material long-term adverse effect on our consolidated financial condition, results of operations or liquidity.
Environmental matters and litigation. Our operations are governed by various federal, state and local environmental laws and regulations. Our policy is to comply with environmental laws and regulations at all of our facilities and to continually strive to improve environmental performance in association with applicable industry initiatives. We believe that our operations are in substantial compliance with applicable requirements of environmental laws. From time to time, we may be subject to environmental regulatory enforcement under various statutes, resolution of which typically involves the establishment of compliance programs.
Income taxes. From time to time, we undergo examinations of our income tax returns, and tax authorities have or may propose tax deficiencies. We believe that we have adequately provided accruals for additional income taxes and related interest expense which may ultimately result from such examinations and we believe that the ultimate disposition of all such examinations should not have a material adverse effect on our consolidated financial position, results of operations or liquidity.
We are a party to a tax sharing agreement with Contran and NL providing for the allocation of tax liabilities and tax payments as described in Note 1. Under applicable law, we, as well as every other member of the Contran Tax Group, are each jointly and severally liable for the aggregate federal income tax liability of Contran and the other companies included in the Contran Tax Group for all periods in which we are included in the Contran Tax Group. NL has agreed, however, to indemnify us for any liability for income taxes of the Contran Tax Group in excess of our tax liability in accordance with the tax sharing agreement.
Concentration of credit risk. Our products are sold primarily in North America to original equipment manufacturers. Our ten largest customers accounted for approximately 47% of sales in 2014, 48% in 2015, and 46% in 2016. One customer of the Security Products segment accounted for 13% of consolidated sales in each of 2014 and 2015, and 14% in 2016. Another customer of the Security Products segment accounted for approximately 12% of consolidated sales in each of 2014 and 2015, and 11% in 2016.
Rent expense was not significant in 2014, 2015 or 2016 and at December 31, 2016, future minimum rentals under non-cancellable operating leases having an initial or remaining term of more than one year were as follows:
|
Years ending December 31, |
|
Amount |
|
|
|
|
(In thousands) |
|
|
2017 |
$ |
151 |
|
|
2018 |
|
135 |
|
|
2019 |
|
116 |
|
|
2020 |
|
104 |
|
|
2021 |
|
53 |
|
|
2022 and thereafter |
|
- |
|
|
Total |
$ |
559 |
|
F-18
Note 11 – Financial instruments:
The following table presents the financial instruments that are not carried at fair value but which require fair value disclosure:
|
|
|
December 31, |
|
|
December 31, |
|
||||||||||
|
|
|
2015 |
|
|
2016 |
|
||||||||||
|
|
|
Carrying |
|
|
Fair |
|
|
Carrying |
|
|
Fair |
|
||||
|
|
|
amount |
|
|
value |
|
|
amount |
|
|
value |
|
||||
|
Cash and cash equivalents |
|
$ |
52,347 |
|
|
$ |
52,347 |
|
|
$ |
33,153 |
|
|
$ |
33,153 |
|
|
Accounts receivable, net |
|
|
8,760 |
|
|
|
8,760 |
|
|
|
10,347 |
|
|
|
10,347 |
|
|
Accounts payable |
|
|
2,671 |
|
|
|
2,671 |
|
|
|
2,614 |
|
|
|
2,614 |
|
Due to their near-term maturities, the carrying amounts of accounts receivable and accounts payable are considered equivalent to fair value.
Note 12 – Recent Accounting Pronouncements:
Pending Adoption
In May 2014, the Financial Accounting Standards Board (“FASB”) issued Accounting Standards Update (“ASU”) No. 2014-09, Revenue from Contracts with Customers (Topic 606). This standard replaces existing revenue recognition guidance, which in many cases was tailored for specific industries, with a uniform accounting standard applicable to all industries and transactions. The new standard, as amended, is currently effective for us beginning with the first quarter of 2018. Entities may elect to adopt ASU No. 2014-09 retrospectively for all periods for all contracts and transactions which occurred during the period (with a few exceptions for practical expediency) or retrospectively with a cumulative effect recognized as of the date of adoption. ASU No. 2014-09 is a fundamental rewriting of existing GAAP with respect to revenue recognition, and we are still evaluating the effect the Standard will have on our Consolidated Financial Statements. We currently expect to adopt the standard in the first quarter of 2018 using the modified retrospective approach to adoption. Our sales generally involve single performance obligations to ship goods pursuant to customer purchase orders without further underlying contracts, and as such we expect adoption of this standard will have minimal effect on our revenues. We are in the process of evaluating the additional disclosure requirements.
In February 2016, the FASB issued ASU 2016-02, Leases (Topic 842), which is a comprehensive rewriting of the lease accounting guidance which aims to increase comparability and transparency with regard to lease transactions. The primary change will be the recognition of lease assets for the right-of –use of the underlying asset and lease liabilities for the obligation to make payments by lessees on the balance sheet for leases currently classified as operating leases. The ASU also requires increased qualitative disclosure about leases in addition to quantitative disclosures currently required. Companies are required to use a modified retrospective approach to adoption with a practical expedient which will allow companies to continue to account for existing leases under the prior guidance unless a lease is modified, other than the requirement to recognize the right-of-use asset and lease liability for all operating leases. The changes indicated above will be effective for us beginning in the first quarter of 2019, with early adoption permitted. We have not yet evaluated the effect this ASU will have on our Consolidated Financial Statements, but given the amount of our future minimum payments under non-cancellable operating leases at December 31, 2016 disclosed in Note 10, we do not expect the adoption of this standard to have a material effect on our Consolidated Balance Sheet.
F-19
Note 13 – Quarterly results of operations (unaudited):
|
|
|
Quarter ended |
|
|||||||||||||
|
|
|
March 31 |
|
|
June 30 |
|
|
Sept. 30 |
|
|
Dec. 31 |
|
||||
|
|
|
(In millions, except per share amounts) |
|
|||||||||||||
|
2015: |
|
|
|
|
|
|
|
|
|
|
|
|
|
|
|
|
|
Net sales |
|
$ |
27.9 |
|
|
$ |
28.9 |
|
|
$ |
26.5 |
|
|
$ |
25.7 |
|
|
Gross profit |
|
|
8.6 |
|
|
|
9.2 |
|
|
|
8.1 |
|
|
|
7.5 |
|
|
Operating income |
|
|
3.7 |
|
|
|
4.3 |
|
|
|
3.4 |
|
|
|
2.6 |
|
|
Net income |
|
|
2.4 |
|
|
|
2.8 |
|
|
|
2.2 |
|
|
|
1.7 |
|
|
|
|
|
|
|
|
|
|
|
|
|
|
|
|
|
|
|
|
Basic and diluted earnings per share |
|
$ |
.19 |
|
|
$ |
.23 |
|
|
$ |
.18 |
|
|
$ |
.13 |
|
|
2016: |
|
|
|
|
|
|
|
|
|
|
|
|
|
|
|
|
|
Net sales |
|
$ |
27.1 |
|
|
$ |
27.1 |
|
|
$ |
28.4 |
|
|
$ |
26.3 |
|
|
Gross profit |
|
|
8.2 |
|
|
|
8.5 |
|
|
|
9.4 |
|
|
|
9.1 |
|
|
Operating income |
|
|
3.4 |
|
|
|
3.7 |
|
|
|
4.5 |
|
|
|
4.0 |
|
|
Net income |
|
|
2.2 |
|
|
|
2.4 |
|
|
|
3.0 |
|
|
|
2.9 |
|
|
|
|
|
|
|
|
|
|
|
|
|
|
|
|
|
|
|
|
Basic and diluted earnings per share |
|
$ |
.18 |
|
|
$ |
.20 |
|
|
$ |
.24 |
|
|
$ |
.23 |
|
The sum of the quarterly per share amounts may not equal the annual per share amounts due to relative changes in the weighted-average number of shares used in the per share computations.
F-20