Attached files
| file | filename |
|---|---|
| EX-32.1 - EXHIBIT 32.1 - WESTINGHOUSE AIR BRAKE TECHNOLOGIES CORP | wabex321-10k2016.htm |
| EX-31.2 - EXHIBIT 31.2 - WESTINGHOUSE AIR BRAKE TECHNOLOGIES CORP | wabex312-10k2016.htm |
| EX-31.1 - EXHIBIT 31.1 - WESTINGHOUSE AIR BRAKE TECHNOLOGIES CORP | wabex311-10k2016.htm |
| EX-23.2 - EXHIBIT 23.2 - WESTINGHOUSE AIR BRAKE TECHNOLOGIES CORP | wabex232-10k2016.htm |
| EX-23.1 - EXHIBIT 23.1 - WESTINGHOUSE AIR BRAKE TECHNOLOGIES CORP | wabex231-10k2016.htm |
| EX-21 - EXHIBIT 21 - WESTINGHOUSE AIR BRAKE TECHNOLOGIES CORP | wabex21-10k2016.htm |
| EX-10.14 - EXHIBIT 10.14 - WESTINGHOUSE AIR BRAKE TECHNOLOGIES CORP | wabex1014-10k20162.htm |
| EX-10.13 - EXHIBIT 10.13 - WESTINGHOUSE AIR BRAKE TECHNOLOGIES CORP | wabex1013-10k2016.htm |
| EX-4.9 - EXHIBIT 4.9 - WESTINGHOUSE AIR BRAKE TECHNOLOGIES CORP | wabex4910k2016.htm |
UNITED STATES
SECURITIES AND EXCHANGE COMMISSION
WASHINGTON, D.C. 20549
FORM 10-K
ý | Annual Report Pursuant to Section 13 or 15(d) of the Securities Exchange Act of 1934 |
For the fiscal year ended December 31, 2016
OR
¨ | Transition Report Pursuant to Section 13 or 15(d) of the Securities Exchange Act of 1934 |
For the transition period from to
Commission file number 033-90866
WESTINGHOUSE AIR BRAKE TECHNOLOGIES CORPORATION
(Exact name of registrant as specified in its charter)
Delaware | 25-1615902 |
(State or other jurisdiction of incorporation or organization) | (IRS Employer Identification No.) |
1001 Air Brake Avenue Wilmerding, Pennsylvania 15148 | (412) 825-1000 |
(Address of principal executive offices, including zip code) | (Registrant’s telephone number) |
Securities registered pursuant to Section 12(b) of the Act:
Title of Class | Name of Exchange on which registered |
Common Stock, par value $.01 per share | New York Stock Exchange |
Securities registered pursuant to Section 12(g) of the Act: None
Indicate by check mark if the registrant is a well-known seasoned issuer, as defined in Rule 405 of the Securities Act. Yes ý No ¨.
Indicate by check mark if the registrant is not required to file reports pursuant to Section 13 or 15(d) of the Act. Yes ¨ No ý.
Indicate by check mark whether the registrant (1) has filed all reports required to be filed by Section 13 or 15(d) of the Securities Exchange Act of 1934 during the preceding 12 months (or for such shorter period that the registrant was required to file such reports) and (2) has been subject to such filing requirements for the past 90 days. Yes ý No ¨.
Indicate by check mark whether the registrant has submitted electronically and posted on its corporate Web site, if any, every Interactive Data File required to be submitted and posted pursuant to Rule 405 of Regulation S-T during the preceding 12 months (or for such shorter period that the registrant was required to submit and post such files) Yes ý No ¨.
Indicate by check mark if disclosure of delinquent filers pursuant to Item 405 of Regulation S-K is not contained herein, and will not be contained, to the best of registrant’s knowledge, in definitive proxy or information statements incorporated by reference in Part III of this Form 10-K or any amendment to this Form 10-K. ý.
Indicate by check mark whether the registrant is a large accelerated filer, an accelerated filer, a non-accelerated filer, or a smaller reporting company. See the definitions of “large accelerated filer,” “accelerated filer” and “smaller reporting company” in Rule 12b-2 of the Exchange Act. (Check one):
Large accelerated filer ý Accelerated filer ¨ Non-accelerated filer ¨ Smaller reporting company ¨
Indicate by check mark whether the registrant is a shell company (as defined in Rule 12b-2 of the Exchange Act. Yes ¨ No ý.
The registrant estimates that as of June 30, 2016, the aggregate market value of the voting shares held by non-affiliates of the registrant was approximately $6.0 billion based on the closing price on the New York Stock Exchange for such stock.
As of February 17, 2017, 95,786,017 shares of Common Stock of the registrant were issued and outstanding.
DOCUMENTS INCORPORATED BY REFERENCE:
Portions of the Proxy Statement for the registrant’s Annual Meeting of Stockholders to be held on May 10, 2017 are incorporated by reference into Part III of this Form 10-K.
TABLE OF CONTENTS
Page | ||
PART I | ||
Item 1. | ||
Item 1A. | ||
Item 1B. | ||
Item 2. | ||
Item 3. | ||
Item 4. | ||
PART II | ||
Item 5. | ||
Item 6. | ||
Item 7. | ||
Item 7A. | ||
Item 8. | ||
Item 9. | ||
Item 9A. | ||
Item 9B. | ||
PART III | ||
Item 10. | ||
Item 11. | ||
Item 12. | ||
Item 13. | ||
Item 14. | ||
PART IV | ||
Item 15. | ||
Item 16. | ||
2
PART I
Item 1. | BUSINESS |
General
Westinghouse Air Brake Technologies Corporation, doing business as Wabtec Corporation, is a Delaware corporation with headquarters at 1001 Air Brake Avenue in Wilmerding, Pennsylvania. Our telephone number is 412-825-1000, and our website is located at www.wabtec.com. All references to “we”, “our”, “us”, the “Company” and “Wabtec” refer to Westinghouse Air Brake Technologies Corporation and its consolidated subsidiaries. George Westinghouse founded the original Westinghouse Air Brake Co. in 1869 when he invented the air brake. Westinghouse Air Brake Company (“WABCO”) was formed in 1990 when it acquired certain assets and operations from American Standard, Inc., now known as Trane (“Trane”). The company went public on the New York Stock Exchange in 1995. In 1999, WABCO merged with MotivePower Industries, Inc. (“MotivePower”) and adopted the name Wabtec.
In 2016, Wabtec acquired majority ownership of Faiveley Transport, S.A. (“Faiveley Transport”), a leading provider of value-added, integrated systems and services, primarily for the global transit rail market, for a purchase price of approximately $746.5 million. Based in France, Faiveley Transport has roots to 1919 and became a leader in manufacturing pantographs, automatic door mechanisms and air conditioning systems. Faiveley Transport was listed on the Paris Stock Exchange in 1994 and during the next 20 years acquired a number of rail industry leaders including Sab Wabco, a specialist in railway braking systems and couplers. Faiveley Transport had revenues of about $1.2 billion in 2016. Wabtec believes that the acquisition of Faiveley Transport provides the following strategic benefits:
• | Increased diversity of revenues by product, geography and market. A majority of Faiveley Transport’s revenues are outside the U.S. and in the transit market, which helps to balance the cyclicality of Wabtec’s North American freight business. |
• | Broadened product line. Faiveley Transport provides many products that Wabtec did not previously offer, including braking and door systems for high-speed trains and air conditioning systems. |
• | Expanded international presence in the transit market. A majority of Faiveley Transport’s revenues come from transit markets outside the U.S., where Wabtec did not have a strong presence. |
• | Increased technical and engineering expertise. With its more than 1,500 engineers, Faiveley Transport strengthens Wabtec’s technical capabilities and product development efforts. |
Today, Wabtec is one of the world’s largest providers of value-added, technology-based equipment, systems and services for the global freight and transit rail industries. We believe we hold a leading market share for many of our core product lines globally. Our highly engineered products, which are intended to enhance safety, improve productivity and reduce maintenance costs for customers, can be found on most U.S. locomotives, freight cars, passenger transit cars and buses around the world. In 2016, the Company had sales of approximately $2.9 billion and net income attributable to Wabtec shareholders of about $304.9 million. In 2016, sales of aftermarket parts and services represented about 59% of total sales, while sales to customers outside of the U.S. accounted for about 54% of total sales.
Industry Overview
The Company primarily serves the worldwide freight and transit rail industries. As such, our operating results are largely dependent on the level of activity, financial condition and capital spending plans of railroads and passenger transit agencies around the world, and transportation equipment manufacturers who serve those markets. Many factors influence these industries, including general economic conditions; traffic volumes, as measured by freight carloadings and passenger ridership; government spending on public transportation; and investment in new technologies. In general, trends such as increasing urbanization, a focus on sustainability and environmental awareness, an aging equipment fleet, and growth in global trade are expected to drive continued investment in freight and transit rail.
According to the 2016 edition of a market study by UNIFE, the Association of the European Rail Industry, the accessible global market for railway products and services is more than $100 billion, and it is expected to grow at about 3.2% annually through 2021. The three largest geographic markets, which represent about 80% of the total accessible market, are Europe, North America and Asia Pacific. Over the next five years, UNIFE projects above-average growth in Asia Pacific and Europe due to overall economic growth and trends such as urbanization and increasing mobility, deregulation, investments in new technologies, energy and environmental issues, and increasing government support. The largest product segments of the market are rolling stock, services and infrastructure, which represent almost 90% of the accessible market. Over the next five years, UNIFE projects spending on rolling stock to grow at an above-average rate due to increased investment in passenger transit vehicles. UNIFE estimates that the global installed base of locomotives is about 114,000 units, with about 32% in Asia Pacific, about 25% in North America and about 18% in Russia-CIS (Commonwealth of Independent States). Wabtec estimates that
3
about 3,400 new locomotives were delivered worldwide in 2016, and it expects deliveries of about 3,200 in 2017. UNIFE estimates the global installed base of freight cars is about 5.5 million units, with about 37% in North America, about 26% in Russia-CIS and about 20% in Asia Pacific. Wabtec estimates that about 108,000 new freight cars were delivered worldwide in 2016, and it expects deliveries of about 97,000 in 2017. UNIFE estimates the global installed base of passenger transit vehicles to be about 569,000 units, with about 43% in Asia Pacific, about 32% in Europe and about 14% in Russia-CIS. UNIFE estimates that about 208,000 new passenger transit vehicles were ordered annually from 2013-2015, and that about 184,000 will be ordered annually from 2016-2018.
In Europe, the majority of the rail system serves the passenger transit market, which is expected to continue growing as energy and environmental factors encourage continued investment in public mass transit. France, Germany and the United Kingdom are the largest Western European transit markets, representing almost two-thirds of industry spending in the European Union. UNIFE projects the Western European rail market to grow at about 3.6% annually during the next five years, led by investments in new rolling stock in France and Germany. Significant investments are also expected in Turkey, the largest market in Eastern Europe. About 75% of freight traffic in Europe is hauled by truck, while rail accounts for about 20%. The largest freight markets in Europe are Germany, Poland and the United Kingdom. In recent years, the European Commission has adopted a series of measures designed to increase the efficiency of the European rail network by standardizing operating rules and certification requirements. UNIFE believes that adoption of these measures should have a positive effect on ridership and investment in public transportation over time.
In North America, railroads carry about 40% of intercity freight, as measured by ton-miles, which is more than any other mode of transportation. Through direct ownership and operating partnerships, U.S. railroads are part of an integrated network that includes railroads in Canada and Mexico, forming what is regarded as the world’s most-efficient and lowest-cost freight rail service. There are more than 500 railroads operating in North America, with the largest railroads, referred to as “Class I,” accounting for more than 90% of the industry’s revenues. The railroads carry a wide variety of commodities and goods, including coal, metals, minerals, chemicals, grain, and petroleum. These commodities represent about 55% of total rail carloadings, with intermodal carloads accounting for the rest. Railroads operate in a competitive environment, especially with the trucking industry, and are always seeking ways to improve safety, cost and reliability. New technologies offered by Wabtec and others in the industry can provide some of these benefits. Demand for our freight related products and services in North America is driven by a number of factors, including rail traffic, and production of new locomotives and new freight cars. In the U.S., the passenger transit industry is dependent largely on funding from federal, state and local governments, and from fare box revenues. Demand for North American passenger transit products is driven by a number of factors, including government funding, deliveries of new subway cars and buses, and ridership. The U.S. federal government provides money to local transit authorities, primarily to fund the purchase of new equipment and infrastructure for their transit systems.
Growth in the Asia Pacific market has been driven mainly by the continued urbanization of China and India, and by investments in freight rail rolling stock and infrastructure in Australia to serve its mining and natural resources markets. During the next five years, UNIFE expects India to make significant investments in rolling stock and infrastructure to modernize its rail system; for example, the country has awarded a 1,000-unit locomotive order to a U.S. manufacturer. UNIFE expects the increased spending in India to offset decreased spending on very-high-speed rolling stock in China during the next five years.
Other key geographic markets include Russia-CIS and Africa-Middle East. With about 1.4 million freight cars and about 20,000 locomotives, Russia-CIS is among the largest freight rail markets in the world, and it’s expected to invest in both freight and transit rolling stock. PRASA, the Passenger Rail Agency of South Africa, is expected to continue to invest in new transit cars and new locomotives. According to UNIFE, emerging markets are expected to grow at above-average rates as global trade creates increases in freight volumes and urbanization leads to increased demand for efficient mass-transportation systems. As this growth occurs, Wabtec expects to have additional opportunities to provide products and services in these markets.
In its study, UNIFE also said it expects increased investment in digital tools for data and asset management, and in rail control technologies, both of which would improve efficiency in the global rail industry during the next five years. UNIFE said data-driven asset management tools have the potential to reduce equipment maintenance costs and improve asset utilization, while rail control technologies have been focused on increasing track capacity, improving operational efficiency and ensuring safer railway traffic. Wabtec offers products and services to help customers make ongoing investments in these initiatives.
Business Segments and Products
We provide our products and services through two principal business segments, the Freight Segment and the Transit Segment, both of which have different market characteristics and business drivers. The acquisition of Faiveley Transport significantly strengthened our capabilities and presence in the worldwide transit market.
4
The Freight Segment primarily manufactures and services components for new and existing locomotives and freight cars; supplies rail control and infrastructure products including electronics, positive train control equipment, and signal design and engineering services; overhauls locomotives; and provides heat exchangers and cooling systems for rail and other industrial markets. Customers include large, publicly traded railroads, leasing companies, manufacturers of original equipment such as locomotives and freight cars, and utilities. Demand is primarily driven by general economic conditions; traffic volumes, as measured by freight carloadings; investment in new technologies; and deliveries of new locomotives and freight cars. In 2016, the Freight Segment accounted for 53% of our total sales, with about 59% of its sales in the U.S. In 2016, slightly more than half of the Freight Segment’s sales were in aftermarket.
The Transit Segment, mainly operating worldwide as Faiveley Transport, primarily manufactures and services components for new and existing passenger transit vehicles, typically regional trains, high speed trains, subway cars, light-rail vehicles and buses; supplies rail control and infrastructure products including electronics, positive train control equipment, and signal design and engineering services; builds new commuter locomotives; and refurbishes passenger transit vehicles. Customers include public transit authorities and municipalities, leasing companies, and manufacturers of passenger transit vehicles and buses around the world. Demand in the transit market is primarily driven by general economic conditions, passenger ridership levels, government spending on public transportation, and investment in new rolling stock. In 2016, the Transit Segment accounted for 47% of our total sales, with about 33% of its sales in the U.S. About two-thirds of the Transit Segment’s sales are in the aftermarket with the remainder in the original equipment market. The addition of Faiveley Transport’s key products strengthens Wabtec’s presence in the following areas: high-speed braking and door systems; heating, ventilation and air conditioning systems; pantographs and power collection; information systems; platform screen doors and gates; couplers; and aftermarket services, maintenance and spare parts. Geographically, Wabtec’s presence in the European and Asia Pacific transit markets has been strengthened significantly through the acquisition of Faiveley Transport.
Following is a summary of our leading product lines in both aftermarket and original equipment across both of our business segments:
Specialty Products & Electronics:
• | Positive Train Control equipment and electronically controlled pneumatic braking products |
• | Railway electronics, including event recorders, monitoring equipment and end of train devices |
• | Signal design and engineering services |
• | Freight car trucks and couplers |
• | Draft gears, couplers and slack adjusters |
• | Air compressors and dryers |
• | Heat exchangers and cooling products for locomotives and power generation equipment |
• | Track and switch products |
Brake Products:
• | Railway braking equipment and related components for Freight and Transit applications, including high-speed passenger transit vehicles |
• | Friction products, including brake shoes, discs and pads |
Remanufacturing, Overhaul and Build:
• | New commuter and switcher locomotives |
• | Transit car and locomotive overhaul and refurbishment |
Transit Products:
• | Heating, ventilation and air conditioning equipment |
• | Doors for buses and subway cars |
• | Platform screen doors |
• | Pantographs |
• | Window assemblies |
• | Couplers |
5
• | Accessibility lifts and ramps for buses and subway cars |
• | Traction motors |
We have become a leader in the freight and transit rail industries by capitalizing on the strength of our existing products, technological capabilities and new product innovation, and by our ability to harden products to protect them from severe conditions, including extreme temperatures and high-vibration environments. Supported by our technical staff of over 2,900 engineers and specialists, we have extensive experience in a broad range of product lines, which enables us to provide comprehensive, systems-based solutions for our customers.
Over the past several years, we introduced a number of significant new products, including electronic braking equipment and train control equipment that encompasses onboard digital data and global positioning communication protocols. In the U.S., for example, the Federal Railroad Administration ("FRA") approved the use of our Electronic Train Management System®, or Positive Train Control (“PTC”) technology, which offers safety benefits to the rail industry. PTC includes on-board locomotive computer and related software, which must be installed on a majority of the locomotives and track in the U.S. to meet the requirements of a 2008 rail safety bill. With our Electronic Train Management System®, we are the leading supplier of this on-board train control equipment, and we are working with the U.S. Class I railroads, commuter rail authorities and other industry suppliers to implement this technology by the deadline of December 31, 2018. In 2016, Wabtec recorded about $345 million of revenue from freight and transit train control and signaling projects, which includes PTC. New products introduced for the transit market in recent years include HVAC inverter integrated solutions, brake discs, and platform doors and gates.
For additional information on our business segments, see Note 20 of “Notes to Consolidated Financial Statements” included in Part IV, Item 15 of this report.
Competitive Strengths
Our key strengths include:
• | Leading market positions in core products. Dating back to 1869 and George Westinghouse’s invention of the air brake, we are an established leader in the development and manufacture of pneumatic braking equipment for freight and passenger transit vehicles. Faiveley Transport, founded nearly 100 years ago, has a long history and is a market leader for its core products, including pantographs, automatic door mechanisms and air conditioning systems. We have leveraged our leading positions by focusing on research and engineering to expand beyond pneumatic braking components to supplying integrated parts and assemblies for the locomotive through the end of the train. We are a recognized leader in the development and production of electronic recording, measuring and communications systems, positive train control equipment, highly engineered compressors and heat exchangers for locomotives, and a leading manufacturer of freight car components, including electronic braking equipment, draft gears, trucks, brake shoes and electronic end-of-train devices. We are also a leading provider of braking equipment; heating, ventilation and air conditioning equipment; door assemblies and platform screen doors; lifts and ramps; couplers and current collection equipment, such as pantographs, for passenger transit vehicles. |
• | Breadth of product offering with a stable mix of original equipment market (OEM) and aftermarket business. Our product portfolio is one of the broadest in the rail industry, as we offer a wide selection of quality parts, components and assemblies across the entire train and worldwide. We provide our products in both the original equipment market and the aftermarket. Our substantial installed base of products with end-users such as the railroads and the passenger transit authorities is a significant competitive advantage for providing products and services to the aftermarket because these customers often look to purchase safety- and performance-related replacement parts from the original equipment components supplier. In addition, as OEMs and railroad operators attempt to modernize fleets with new products designed to improve and maintain safety and efficiency, these products must be designed to be interoperable with existing equipment. On average, over the last several years, more than 61% of our total net sales have come from our aftermarket products and services business. |
• | Leading design and engineering capabilities. We believe a hallmark of our relationship with our customers has been our leading design and engineering practice, which has, in our opinion, assisted in the improvement and modernization of global railway equipment. We believe both our customers and the government authorities value our technological capabilities and commitment to innovation, as we seek not only to enhance the efficiency and profitability of our customers, but also to improve the overall safety of the railways through continuous improvement of product performance. The Company has an established record of product improvements and new product development. We have assembled a wide range of patented products, which we believe provides us with a competitive advantage. Wabtec currently owns 2,382 active patents worldwide and 683 U.S. patents. During the last three years, we have filed for more than 437 patents worldwide in support of our new and evolving product lines. These figures include Faiveley Transport's patent portfolio, which has been a key factor in its success, as well. |
6
• | Experience with industry regulatory requirements. The freight rail and passenger transit industries are governed by various government agencies and regulators in each country and region. These groups mandate rigorous manufacturer certification, new product testing and approval processes that we believe are difficult for new entrants to meet cost-effectively and efficiently without the scale and extensive experience we possess. Certification processes are lengthy, and often require local presence and expertise. In addition, each transit agency places a high degree of importance on vehicle customization, which requires experience and technical expertise to meet ever-evolving specifications. |
• | Experienced management team and the Wabtec Excellence Program (WEP), formerly known as the Wabtec Performance System. Wabtec’s lean manufacturing and continuous improvement initiatives have been a part of the Company’s culture for more than 25 years and have enabled Wabtec to manage successfully through cycles in the rail supply market. With the acquisition of Faiveley Transport (see Note 3 of "Notes to Consolidated Financial Statements" for further details), which introduced its Worldwide Excellence Program several years ago, we have combined the best practices of both organizations into WEP. We expect WEP will drive a successful integration of Wabtec and Faiveley Transport, will result in a reduced cost structure and will ensure standardized excellence in all processes. By using WEP as our operational foundation, we will strive for continuous improvements in safety, quality, cost, delivery and all aspects of serving our customers and other stakeholders. |
Business strategy
Using WEP, we strive to generate sufficient cash to invest in our growth strategies and to build on what we consider to be a leading position as a low-cost producer in the industry while maintaining world-class product quality, technology and customer responsiveness. Through WEP and employee-directed initiatives such as Kaizen, a Japanese-developed team concept, we continuously strive to improve quality, delivery and productivity, and to reduce costs such as global sourcing and supply chain management. These practices enable us to streamline processes, improve product reliability and customer satisfaction, reduce product cycle times and respond more rapidly to market developments. We also rely on functional experts within the company across various disciplines to train, coach and share best practices throughout the corporation, while benchmarking against best-in-class competitors and peers. Over time, we believe the principles of WEP will enable us to continue to increase operating margins, improve cash flow and strengthen our ability to invest in the following growth strategies:
• | Product innovation and new technologies. We continue to emphasize innovation and development funding to create new and improved products. We are focusing on technological advances, especially in the areas of electronics, braking products and other on-board equipment, as a means of new product growth. We seek to provide customers with incremental technological advances that offer immediate benefits with cost-effective investments. |
• | Global and market expansion. We believe that international markets represent a significant opportunity for future growth. In 2016, sales to non-U.S. customers were $1.6 billion, including export sales from the Company’s U.S. operations of $470.5 million. We intend to increase our existing international sales through strategic acquisitions, direct sales of products through our existing subsidiaries and licensees, and joint ventures with railway suppliers which have a strong presence in their local markets. We are specifically targeting markets that operate significant fleets of U.S.-style locomotives and freight cars, including Australia, Brazil, China, India, Russia, South Africa, and other select areas within Europe and South America. In addition, we have opportunities to increase the sale of certain products that we currently manufacture for the rail industry into other industrial markets, such as mining, off-highway and energy. These products include heat exchangers and friction materials. |
• | Aftermarket products and services. Historically, aftermarket sales are less cyclical than OEM sales because a certain level of aftermarket maintenance and service work must be performed, even during an industry slowdown. In 2016, Wabtec’s aftermarket sales and services represented approximately 59% of the Company’s total sales across both of our business segments. Wabtec provides aftermarket parts and services for its components, and the Company is seeking to expand this business with customers who currently perform the work in-house. In this way, we expect to take advantage of the rail industry trend toward outsourcing, as railroads and transit authorities focus on their core function of transporting goods and people. |
• | Acquisitions, joint ventures and alliances. We invest in acquisitions, joint ventures and alliances using a disciplined, selective approach and rigorous financial criteria. These transactions are expected to meet the financial criteria and contribute to our growth strategies of product innovation and new technologies, global expansion, and aftermarket products and services. We believe these expansion strategies will help Wabtec to grow profitably, expand geographically, and dampen the impact from potential cycles in the North American rail industry. |
7
Recent Acquisitions and Joint Ventures
In addition to the Faiveley Transport acquisition, Wabtec has completed the following acquisitions in support of its growth strategies mentioned above:
• | On December 14, 2016, the Company acquired Workhorse Rail LLC ("Workhorse"), a supplier of engineered freight car components, mainly for the aftermarket for a purchase price of approximately $44.3 million, net of cash acquired, resulting in preliminary goodwill of $23.1 million, 37.8% of which will be deductible for tax purposes. |
• | On November 17, 2016, the Company acquired the assets of Precision Turbo & Engine ("Precision Turbo"), a designer and manufacturer of high-performance, aftermarket turbochargers, wastegates, and heat exchangers for the automotive performance market for a purchase price of approximately $13.8 million, net of cash acquired, resulting in preliminary goodwill of $3.9 million, all of which will be deductible for tax purposes. |
• | On August 1, 2016, the Company acquired Gerken Group S.A. ("Gerken"), a manufacturer of specialty carbon and graphite products for rail and other industrial applications, for a purchase price of approximately $62.8 million, net of cash acquired, resulting in preliminary goodwill of $17.5 million, none of which will be deductible for tax purposes. |
• | On May 5, 2016, the Company acquired the assets of Unitrac Railroad Materials ("Unitrac"), a leading designer and manufacturer of railroad products and track work services for a purchase price of approximately $14.4 million, net of cash acquired, resulting in preliminary goodwill of $1.4 million, all of which will be deductible for tax purposes. |
• | On October 30, 2015, the Company acquired Relay Monitoring Systems PTY Ltd. ("RMS"), an Australian based manufacturer of electrical protection and control products for a purchase price of approximately $18.7 million, net of cash acquired, resulting in preliminary goodwill of $8.9 million, none of which will be deductible for tax purposes. |
• | On October 8, 2015, the Company acquired Track IQ, an Australian based manufacturer of wayside sensor systems for the global rail industry for a purchase price of approximately $9.3 million, net of cash acquired, resulting in preliminary goodwill of $6.5 million, all of which will be deductible for tax purposes. |
• | On June 17, 2015, the Company acquired Metalocaucho ("MTC"), a manufacturer of transit products, primarily rubber components for suspension and vibration control systems, for a purchase price of approximately $23.4 million, net of cash acquired, resulting in preliminary goodwill of $13.2 million, none of which will be deductible for tax purposes. |
• | On February 4, 2015, the Company acquired Railroad Controls L.P. ("RCL"), a provider of railway signal construction services, for a purchase price of approximately $78.0 million, net of cash acquired, resulting in goodwill of $14.8 million, all of which will be deductible for tax purposes. |
Backlog
The Company’s backlog was about $4.0 billion at December 31, 2016. For 2016, about 59% of total sales came from aftermarket orders, which typically carry lead times of less than 30 days, and are not recorded in backlog for a significant period of time.
The Company’s contracts are subject to standard industry cancellation provisions, including cancellations on short notice or upon completion of designated stages. Substantial scope-of-work adjustments are common. For these and other reasons, completion of the Company’s backlog may be delayed or canceled. The railroad industry, in general, has historically been subject to fluctuations due to overall economic conditions and the level of use of alternative modes of transportation.
The backlog of firm customer orders as of December 31, 2016 and December 31, 2015, and the expected year of completion are as follows:
Total | Expected Delivery | Total | Expected Delivery | |||||||||||||||||||||
Backlog | Other | Backlog | Other | |||||||||||||||||||||
In thousands | 12/31/2016 | 2017 | Years | 12/31/2015 | 2016 | Years | ||||||||||||||||||
Freight Segment | $ | 575,931 | $ | 396,160 | $ | 179,771 | $ | 671,910 | $ | 585,981 | $ | 85,929 | ||||||||||||
Transit Segment | 3,405,561 | 1,565,519 | 1,840,042 | 1,474,974 | 621,736 | 853,238 | ||||||||||||||||||
Total | $ | 3,981,492 | $ | 1,961,679 | $ | 2,019,813 | $ | 2,146,884 | $ | 1,207,717 | $ | 939,167 | ||||||||||||
Engineering and Development
To execute our strategy to develop new products, we invest in a variety of engineering and development activities. For the fiscal years ended December 31, 2016, 2015, and 2014, we invested about $71.4 million, $71.2 million and $61.9 million, respectively, on product development and improvement activities. The engineering resources of the Company are allocated between research and development activities and the execution of original equipment customer contracts. Across the
8
corporation we have established multiple Centers of Competence, which have specialized, technical expertise in various disciplines and product areas.
Our engineering and development program includes investment in train control and new braking technologies, with an emphasis on applying electronics to traditional pneumatic equipment. Electronic braking has been used in the transit industry for years, and freight railroads are conducting pilot programs to test its reliability and benefits. Freight railroads have generally been slower to accept the technology due to issues over interoperability, connectivity and durability. We are proceeding with efforts to enhance the major components for existing hard-wired braking equipment and development of new electronic technologies for the freight railroads. We have also developed advanced cooling systems that enable lower emissions from diesel engines used in rail and other industrial markets. Sometimes we conduct specific research projects in conjunction with universities, customers and other industry suppliers.
We use our Product Development System (PDS) to develop and monitor new product programs. The system requires the product development team to follow consistent steps throughout the development process, from concept to launch, to ensure the product will meet customer expectations and internal profitability targets.
Intellectual Property
We have 2,382 active patents worldwide and on average file for approximately 150 new patents each year. We also rely on a combination of trade secrets and other intellectual property laws, nondisclosure agreements and other protective measures to establish and protect our proprietary rights in our intellectual property. We also follow the product development practices of our competitors to monitor any possible patent infringement by them, and to evaluate their strategies and plans.
Certain trademarks, among them the name WABCO®, were acquired or licensed from American Standard Inc., now known as Trane, in 1990 at the time of our acquisition of the North American operations of the Railway Products Group of Trane. Other trademarks have been developed through the normal course of business, or acquired as a part of our ongoing merger and acquisition program.
We have entered into a variety of license agreements as licensor and licensee. We do not believe that any single license agreement is of material importance to our business or either of our business segments as a whole.
We have issued licenses to the two sole suppliers of railway air brakes and related products in Japan, Nabtesco and Mitsubishi Electric Company. The licensees pay annual license fees to us and also assist us by acting as liaisons with key Japanese passenger transit vehicle builders for projects in North America. We believe that our relationships with these licensees have been beneficial to our core transit business and customer relationships in North America.
Customers
We provide products and services for more than 500 customers worldwide. Our customers include railroads and passenger transit authorities throughout North America, Europe, Asia Pacific, South Africa and South America; manufacturers of transportation equipment, such as locomotives, freight cars, passenger transit vehicles and buses; and companies that lease and maintain such equipment.
Top customers can change from year to year. For the fiscal year ended December 31, 2016, our top five customers accounted for 23% of net sales: CSX Corporation, Trinity Industries, the BNSF Railway, the Greenbrier Companies, and Norfolk Southern Railway. No one customer represents 10% or more of consolidated sales. We believe that we have strong relationships with all of our key customers.
Competition
We believe we hold a leading market share for many of our core product lines globally. Our market shares are typically higher in North America and lower in other regions of the world, depending on specific product lines and geographies. We operate in a highly competitive marketplace. Price competition is strong because we have a relatively small number of customers and they are very cost-conscious. In addition to price, competition is based on product performance and technological leadership, quality, reliability of delivery, and customer service and support.
Our principal competitors vary across product lines and geographies. Within North America, New York Air Brake Company, a subsidiary of the German air brake producer Knorr-Bremse AG (“Knorr”) and Amsted Rail Company, Inc., a subsidiary of Amsted Industries Corporation, are our principal overall OEM competitors. Our competition for locomotive, freight and passenger transit service and repair is mostly from the railroads’ and passenger transit authorities’ in-house operations, Electro-Motive Diesel, a division of Caterpillar, GE Transportation Systems, and New York Air Brake/Knorr. We believe our key strengths, which include leading market positions in core products, breadth of product offering with a stable mix of OEM and aftermarket business, leading design and engineering capabilities, significant barriers to entry and an experienced management team, enable us to compete effectively in this marketplace. Outside of North America, no individual
9
company is our principal competitor in all of our operating locations. The largest competitor for Brake and Transit products is Knorr. In addition, our competitors often include smaller, local suppliers in most international markets.
Employees
At December 31, 2016, we had approximately 20,000 full-time employees, approximately 35% of whom were unionized. A majority of the employees subject to collective bargaining agreements are outside North America and these agreements are generally effective from 2017 through 2019. Agreements expiring at various times during 2017 cover approximately 20% of the Company’s workforce. We consider our relations with employees and union representatives to be good, but cannot assure that future contract negotiations will be favorable to us.
Regulation
In the course of our operations, we are subject to various regulations and standards of governments and other agencies in the U.S. and around the world. These entities typically govern equipment, safety and interoperability standards for freight rail and passenger transit rolling stock, oversee a wide variety of rules and regulations governing safety and design of equipment, and evaluate certification and qualification requirements for suppliers. New products generally must undergo testing and approval processes that are rigorous and lengthy. As a result of these regulations and requirements, we must usually obtain and maintain certifications in a variety of jurisdictions and countries. The governing bodies include the FRA and AAR in the U.S., and the International Union of Railways (“UIC”) and the European Railway Agencies ("EUAR") in Europe. Also in Europe, the European Committees for Standardization ("CEN" and "CENELEC") continually draft new European standards which cover, for example, the Reliability, Availability, Maintainability and Safety of railways systems. To guarantee interoperability in Europe, the European Union for Railway Agencies is responsible for defining and implementing Technical Standards of Interoperability (TSI), which covers areas such as infrastructure, energy, rolling stock, telematic applications, traffic operation and management subsystems, noise pollution and waste generation, protection against fire and smoke, and system safety.
Most countries and regions in which Wabtec does business have similar rule-making bodies. In Russia, a GOST-R certificate of conformity is mandatory for all products related to the safety of individuals on Russian territory. In China, any product or system sold on the Chinese market must have been certified in accordance with national standards. In the local Indian market, most products are covered by regulations patterned after AAR and UIC standards.
Effects of Seasonality
Our business is not typically seasonal, although the third quarter results may be affected by vacation and scheduled plant shutdowns at several of our major customers during this period. Quarterly results can also be affected by the timing of projects in backlog and by project delays.
Environmental Matters
Additional information on environmental matters is included in Note 19 of “Notes to Consolidated Financial Statements” included in Part IV, Item 15 of this report.
Available Information
We maintain an Internet site at www.wabtec.com. Our annual reports on Form 10-K, quarterly reports on Form 10-Q, current reports on Form 8-K and amendments to such reports filed or furnished pursuant to Section 13(a) or 15(d) of the Securities Exchange Act of 1934, as well as the annual report to stockholders and other information, are available free of charge on this site. The Internet site and the information contained therein or connected thereto are not incorporated by reference into this Form 10-K. The following are also available free of charge on this site and are available in print to any shareholder who requests them: Our Corporate Governance Guidelines, the charters of our Audit, Compensation and Nominating and Corporate Governance Committees, our Code of Conduct, which is applicable to all employees, our Code of Ethics for Senior Officers, which is applicable to our executive officers, our Policies on Related Party Transactions and Conflict Minerals, and our Sustainability Report.
10
Item 1A. | RISK FACTORS |
Prolonged unfavorable economic and market conditions could adversely affect our business.
Unfavorable general economic and market conditions in the United States and internationally could have a negative impact on our sales and operations. To the extent that these factors result in continued instability of capital markets, shortages of raw materials or component parts, longer sales cycles, deferral or delay of customer orders or an inability to market our products effectively, our business and results of operations could be materially adversely affected.
We are dependent upon key customers.
We rely on several key customers who represent a significant portion of our business. Our top customers can change from year to year. For the fiscal year ended December 31, 2016, our top five customers accounted for 23% of our net sales. While we believe our relationships with our customers are generally good, our top customers could choose to reduce or terminate their relationships with us. In addition, many of our customers place orders for products on an as-needed basis and operate in cyclical industries. As a result, their order levels have varied from period to period in the past and may vary significantly in the future. Such customer orders are dependent upon their markets and customers, and may be subject to delays and cancellations. As a result of our dependence on our key customers, we could experience a material adverse effect on our business, results of operations and financial condition if we lost any one or more of our key customers or if there is a reduction in their demand for our products.
Our business operates in a highly competitive industry.
We operate in a global, competitive marketplace and face substantial competition from a limited number of established competitors, some of which may have greater financial resources than we do. Price competition is strong and, coupled with the existence of a number of cost conscious customers, has historically limited our ability to increase prices. In addition to price, competition is based on product performance and technological leadership, quality, reliability of delivery and customer service and support. There can be no assurance that competition in one or more of our markets will not adversely affect us and our results of operations.
We intend to pursue acquisitions, joint ventures and alliances that involve a number of inherent risks, any of which may cause us not to realize anticipated benefits.
One aspect of our business strategy is to selectively pursue acquisitions, joint ventures and alliances that we believe will improve our market position, and provide opportunities to realize operating synergies. These transactions involve inherent risks and uncertainties, any one of which could have a material adverse effect on our business, results of operations and financial condition including:
• | difficulties in achieving identified financial and operating synergies, including the integration of operations, services and products; |
• | diversion of management’s attention from other business concerns; |
• | the assumption of unknown liabilities; and |
• | unanticipated changes in the market conditions, business and economic factors affecting such an acquisition. |
We cannot assure that we will be able to consummate any future acquisitions, joint ventures or other business combinations. If we are unable to identify suitable acquisition candidates or to consummate strategic acquisitions, we may be unable to fully implement our business strategy, and our business and results of operations may be adversely affected as a result. In addition, our ability to engage in strategic acquisitions will be dependent on our ability to raise substantial capital, and we may not be able to raise the funds necessary to implement our acquisition strategy on terms satisfactory to us, if at all.
As we introduce new products and services, a failure to predict and react to customer demand could adversely affect our business.
We have dedicated significant resources to the development, manufacturing and marketing of new products. Decisions to develop and market new transportation products are typically made without firm indications of customer acceptance. Moreover, by their nature, new products may require alteration of existing business methods or threaten to displace existing equipment in which our customers may have a substantial capital investment. There can be no assurance that any new products that we develop will gain widespread acceptance in the marketplace or that such products will be able to compete successfully with other new products or services that may be introduced by competitors. In addition, we may incur additional warranty or other costs as new products are tested and used by customers.
11
A portion of our sales are related to delivering products and services to help our U.S. railroad and transit customers meet the Positive Train Control (PTC) mandate from the U.S. federal government, which requires the use of on-board locomotive computers and software by the end of 2018.
For the year ended December 31, 2016, we had sales of about $345 million related to Train Control and Signaling, which includes PTC. In 2015, the industry's PTC deadline was extended by three years through December 31, 2018, which also included the ability of railroads to request an additional two years for compliance with the approval of the Department of Transportation if certain parameters are met. This could change the timing of our revenues and could cause us to reassess the staffing, resources and assets deployed in delivering Positive Train Control services.
Our revenues are subject to cyclical variations in the railway and passenger transit markets and changes in government spending.
The railway industry historically has been subject to significant fluctuations due to overall economic conditions, the use of alternate methods of transportation and the levels of government spending on railway projects. In economic downturns, railroads have deferred, and may defer, certain expenditures in order to conserve cash in the short term. Reductions in freight traffic may reduce demand for our replacement products.
The passenger transit railroad industry is also cyclical. New passenger transit car orders vary from year to year and are influenced greatly by major replacement programs and by the construction or expansion of transit systems by transit authorities. To the extent that future funding for proposed public projects is curtailed or withdrawn altogether as a result of changes in political, economic, fiscal or other conditions beyond our control, such projects may be delayed or cancelled, resulting in a potential loss of business for us, including transit aftermarket and new transit car orders. There can be no assurance that economic conditions will be favorable or that there will not be significant fluctuations adversely affecting the industry as a whole and, as a result, us.
Our backlog is not necessarily indicative of the level of our future revenues.
Our backlog represents future production and estimated potential revenue attributable to firm contracts with, or written orders from, our customers for delivery in various periods. Instability in the global economy, negative conditions in the global credit markets, volatility in the industries that our products serve, changes in legislative policy, adverse changes in the financial condition of our customers, adverse changes in the availability of raw materials and supplies, or un-remedied contract breaches could possibly lead to contract termination or cancellations of orders in our backlog or request for deferred deliveries of our backlog orders, each of which could adversely affect our cash flows and results of operations.
A growing portion of our sales may be derived from our international operations, which exposes us to certain risks inherent in doing business on an international level.
In fiscal year 2016, approximately 54% of our consolidated net sales were to customers outside of the U.S. and we intend to continue to expand our international operations in the future. With the acquisition of Faiveley Transport, we anticipate over 60% of our consolidated net sales will be to customers outside of the U.S. Our global headquarters for the Transit group is located in France, and we currently conduct other international operations through a variety of wholly and majority-owned subsidiaries and joint ventures in Australia, Austria, Brazil, Canada, China, Czech Republic, France, Germany, India, Italy, Macedonia, Mexico, the Netherlands, Poland, Russia, Spain, South Africa, Turkey, and the United Kingdom. As a result, we are subject to various risks, any one of which could have a material adverse effect on those operations and on our business as a whole, including:
• | lack of complete operating control; |
• | lack of local business experience; |
• | currency exchange fluctuations and devaluations; |
• | foreign trade restrictions and exchange controls; |
• | difficulty enforcing agreements and intellectual property rights; |
• | the potential for nationalization of enterprises; and |
• | economic, political and social instability and possible terrorist attacks against American interests. |
In addition, certain jurisdictions have laws that limit the ability of non-U.S. subsidiaries and their affiliates to pay dividends and repatriate cash flows.
12
We may have liability arising from asbestos litigation.
Claims have been filed against the Company and certain of its affiliates in various jurisdictions across the United States by persons alleging bodily injury as a result of exposure to asbestos-containing products. Most of these claims have been made against our wholly owned subsidiary, Railroad Friction Products Corporation (RFPC), and are based on a product sold by RFPC prior to the time that the Company acquired any interest in RFPC.
Most of these claims, including all of the RFPC claims, are submitted to insurance carriers for defense and indemnity or to non-affiliated companies that retain the liabilities for the asbestos-containing products at issue. We cannot, however, assure that all these claims will be fully covered by insurance or that the indemnitors or insurers will remain financially viable. Our ultimate legal and financial liability with respect to these claims, as is the case with most other pending litigation, cannot be estimated.
We are subject to a variety of environmental laws and regulations.
We are subject to a variety of environmental laws and regulations governing discharges to air and water, the handling, storage and disposal of hazardous or solid waste materials and the remediation of contamination associated with releases of hazardous substances. We believe our operations currently comply in all material respects with all of the various environmental laws and regulations applicable to our business; however, there can be no assurance that environmental requirements will not change in the future or that we will not incur significant costs to comply with such requirements.
Future climate change regulation could result in increased operating costs, affect the demand for our products or affect the ability of our critical suppliers to meet our needs.
The Company has followed the current debate over climate change and the related policy discussion and prospective legislation. The potential challenges for the Company that climate change policy and legislation may pose have been reviewed by the Company. Any such challenges are heavily dependent on the nature and degree of climate change legislation and the extent to which it applies to our industry. At this time, the Company cannot predict the ultimate impact of climate change and climate change legislation on the Company’s operations. Further, when or if these impacts may occur cannot be assessed until scientific analysis and legislative policy are more developed and specific legislative proposals begin to take shape. Any laws or regulations that may be adopted to restrict or reduce emissions of greenhouse gas could require us to incur increased operating costs, and could have an adverse effect on demand for our products. In addition, the price and availability of certain of the raw materials that we use could vary in the future as a result of environmental laws and regulations affecting our suppliers. An increase in the price of our raw materials or a decline in their availability could adversely affect our operating margins or result in reduced demand for our products.
The occurrence of litigation in which we could be named as a defendant is unpredictable.
From time to time, the Company is subject to litigation or other commercial disputes and other legal and regulatory proceedings with respect to our business, customers, suppliers, creditors, shareholders, product liability, intellectual property infringement, warranty claims or environmental-related matters. Due to the inherent uncertainties of any litigation, commercial disputes or other legal or regulatory proceedings, the Company cannot accurately predict their ultimate outcome, including the outcome of any related appeals. We may incur significant expense to defend or otherwise address current or future claims. Any litigation, even a claim without merit, could result in substantial costs and diversion of resources and could have a material adverse effect on our business and results of operations. Although we maintain insurance policies for certain risks, we cannot make assurances that this insurance will be adequate to protect us from all material judgments and expenses related to potential future claims or that these levels of insurance will be available in the future at economical prices or at all.
The Company is subject to national and international laws and regulations, such as the anti-corruption laws of the U.S. Foreign Corrupt Practices Act, the French Law n° 2016-1691 (Sapin II) and the U.K. Bribery Act, relating to its business and its employees. Despite the Company's policies, procedures and compliance programs, its internal controls and compliance systems may not be able to protect the Company from prohibited acts willfully committed by its employees, agents or business partners that would violate such applicable laws and regulations. Any such improper acts could damage the Company's reputation, subject it to civil or criminal judgments, fines or penalties, and could otherwise disrupt the Company's business, and as a result, could materially adversely impact the Company's business, financial condition or results of operations.
If we are not able to protect our intellectual property and other proprietary rights, we may be adversely affected.
Our success can be impacted by our ability to protect our intellectual property and other proprietary rights. We rely primarily on patents, trademarks, copyrights, trade secrets and unfair competition laws, as well as license agreements and other contractual provisions, to protect our intellectual property and other proprietary rights. However, a significant portion of our
13
technology is not patented and we may be unable or may not seek to obtain patent protection for this technology. Moreover, existing U.S. legal standards relating to the validity, enforceability and scope of protection of intellectual property rights offer only limited protection, may not provide us with any competitive advantages and may be challenged by third parties. The laws of countries other than the United States may be even less protective of intellectual property rights. Accordingly, despite our efforts, we may be unable to prevent third parties from infringing upon or misappropriating our intellectual property or otherwise gaining access to our technology. If we fail to protect our intellectual property and other proprietary rights, then our business, results of operations or financial condition could be negatively impacted.
Our manufacturer’s warranties or product liability may expose us to potentially significant claims.
We warrant the workmanship and materials of many of our products. Accordingly, we are subject to a risk of product liability or warranty claims in the event that the failure of any of our products results in personal injury or death, or does not conform to our customers’ specifications. In addition, in recent years, we have introduced a number of new products for which we do not have a history of warranty experience. Although we have not had any material product liability or warranty claims made against us and we currently maintain liability insurance coverage, we cannot assure that product liability claims, if made, would not exceed our insurance coverage limits or that insurance will continue to be available on commercially acceptable terms, if at all. The possibility exists for these types of warranty claims to result in costly product recalls, significant repair costs and damage to our reputation.
Labor disputes may have a material adverse effect on our operations and profitability.
We collectively bargain with labor unions that represent approximately 35% of our employees. Our current collective bargaining agreements are generally effective from 2017 through 2019. Agreements expiring at various times during 2017 cover approximately 20% of the Company’s workforce. Failure to reach an agreement could result in strikes or other labor protests which could disrupt our operations. If we were to experience a strike or work stoppage, it would be difficult for us to find a sufficient number of employees with the necessary skills to replace these employees. We cannot assure that we will reach any such agreement or that we will not encounter strikes or other types of conflicts with the labor unions of our personnel. Such labor disputes could have an adverse effect on our business, financial condition or results of operations, could cause us to lose revenues and customers and might have permanent effects on our business.
We may incur increased costs due to fluctuations in interest rates and foreign currency exchange rates
In the ordinary course of business, we are exposed to increases in interest rates that may adversely affect funding costs associated with variable-rate debt and changes in foreign currency exchange rates. We may seek to minimize these risks through the use of interest rate swap contracts and currency hedging agreements. There can be no assurance that any of these measures will be effective. Any material changes in interest or exchange rates could result in material losses to us.
Our indebtedness could adversely affect our financial health.
At December 31, 2016, we had total debt of $1,892.8 million. If it becomes necessary to access our available borrowing capacity under our 2016 Refinancing Credit Agreement, the $796.2 million currently borrowed under this facility and the $747.5 million 3.450% senior notes, and the $248.3 million 4.375% senior notes, being indebted could have important consequences to us. For example, it could:
• | increase our vulnerability to general adverse economic and industry conditions; |
• | require us to dedicate a substantial portion of our cash flow from operations to payments on our indebtedness, thereby reducing the availability of our cash flow to fund working capital, capital expenditures, acquisitions and other general corporate purposes; |
• | limit our flexibility in planning for, or reacting to, changes in our business and the industries in which we operate; |
• | place us at a disadvantage compared to competitors that have less debt; and |
• | limit our ability to borrow additional funds. |
The indenture for our $747.5 million 3.450% senior notes due in 2026, our $248.3 million 4.375% senior notes due in 2023, and our 2016 Refinancing Credit Agreement contain various covenants that limit our management’s discretion in the operation of our businesses.
The 2016 Refinancing Credit Agreement limits the Company’s ability to declare or pay cash dividends and prohibits the Company from declaring or making other distributions, subject to certain exceptions. The 2016 Refinancing Credit Agreement contains various other covenants and restrictions including the following limitations: incurrence of additional indebtedness; mergers, consolidations and sales of assets and acquisitions; additional liens; sale and leasebacks; permissible investments,
14
loans and advances; certain debt payments; capital expenditures; and imposes a minimum interest expense coverage ratio and a maximum debt to EBITDA ratio.
The indentures under which the senior notes were issued contains covenants and restrictions which limit among other things, the following: the incurrence of indebtedness, payment of dividends and certain distributions, sale of assets, change in control, mergers and consolidations and the incurrence of liens.
The integration of our recently completed acquisitions may not result in anticipated improvements in market position or the realization of anticipated operating synergies or may take longer to realize than expected.
In 2015 and 2016, we completed multiple acquisitions with a combined investment of $996.0 million, which included our acquisition of a 51% controlling stake in Faiveley Transport for $746.5 million. Additionally, we launched a tender offer for the remaining publicly traded shares with the intention of acquiring 100% ownership of Faiveley Transport and currently having a 78% controlling interest. Although we believe that the acquisitions will improve our market position and realize positive operating results, including operating synergies, operating expense reductions and overhead cost savings, we cannot be assured that these improvements will be obtained or the timing of such improvements. The management and acquisition of businesses involves substantial risks, any of which may result in a material adverse effect on our business and results of operations, including:
• | the uncertainty that an acquired business will achieve anticipated operating results; |
• | significant expenses to integrate; |
• | diversion of Management’s attention; |
• | departure of key personnel from the acquired business; |
• | effectively managing entrepreneurial spirit and decision-making; |
• | integration of different information systems; |
• | unanticipated costs and exposure to unforeseen liabilities; and |
• | impairment of assets. |
Item 1B. | UNRESOLVED STAFF COMMENTS |
None.
15
Item 2. | PROPERTIES |
Facilities
The following table provides certain summary information about the principal facilities owned or leased by the Company as of December 31, 2016. The Company believes that its facilities and equipment are generally in good condition and that, together with scheduled capital improvements, they are adequate for its present and immediately projected needs. Leases on the facilities are long-term and generally include options to renew. The Company’s corporate headquarters are located at the Wilmerding, PA site.
Location | Primary Use | Segment | Own/Lease | Approximate Square Feet | ||||||||
Domestic | ||||||||||||
Rothbury, MI | Manufacturing/Warehouse/Office | Freight | Own | 500,000 | ||||||||
Wilmerding, PA | Manufacturing/Service | Freight | Own | 365,000 | (1 | ) | ||||||
Lexington, TN | Manufacturing | Freight | Own | 170,000 | ||||||||
Jackson, TN | Manufacturing | Freight | Own | 150,000 | ||||||||
Berwick, PA | Manufacturing/Warehouse | Freight | Own | 150,000 | ||||||||
Chicago, IL | Manufacturing/Service | Freight | Own | 123,140 | ||||||||
Greensburg, PA | Manufacturing | Freight | Own | 113,000 | ||||||||
Chillicothe, OH | Manufacturing/Office | Freight | Own | 104,000 | ||||||||
Warren, OH | Manufacturing | Freight | Own | 102,650 | ||||||||
Delray Beach, FL | Warehouse | Freight | Lease | 125,888 | ||||||||
Boise, ID | Manufacturing | Freight/Transit | Own | 326,000 | ||||||||
Maxton, NC | Manufacturing | Freight/Transit | Own | 105,000 | ||||||||
Salem, VA | Manufacturing | Transit | Own | 320,000 | ||||||||
Greenville, SC | Manufacturing | Transit | Own | 253,996 | ||||||||
Greenville, SC | Manufacturing | Transit | Own | 154,020 | ||||||||
Brenham, TX | Manufacturing/Office | Transit | Own | 144,671 | ||||||||
Shreveport, LA | Office/Warehouse | Transit | Lease | 258,915 | ||||||||
Spartanburg, SC | Manufacturing/Service | Transit | Lease | 183,600 | ||||||||
Carson City, NV | Manufacturing | Transit | Lease | 176,033 | ||||||||
Buffalo Grove, IL | Manufacturing | Transit | Lease | 115,570 | ||||||||
International | ||||||||||||
Sao Paulo, Brazil | Manufacturing/Office | Freight | Own | 176,872 | ||||||||
Wallaceburg (Ontario), Canada | Manufacturing | Freight | Own | 126,000 | ||||||||
Northampton, UK | Manufacturing | Freight | Lease | 300,000 | ||||||||
Shenyang City, Liaoning Province, China | Manufacturing | Freight | Lease | 290,550 | ||||||||
Lincolnshire, UK | Manufacturing/Office | Freight | Lease | 149,468 | ||||||||
London (Ontario), Canada | Manufacturing | Freight | Lease | 103,540 | ||||||||
Doncaster, UK | Manufacturing/Service | Freight/Transit | Own | 330,000 | ||||||||
Kilmarnock, UK | Manufacturing | Freight/Transit | Own | 107,975 | ||||||||
Loughborough, UK | Manufacturing | Freight/Transit | Lease | 245,245 | ||||||||
Kempton Park, South Africa | Manufacturing | Freight/Transit | Lease | 156,077 | ||||||||
Piossasco, Italy | Manufacturing | Transit | Own | 301,389 | ||||||||
Monte Alto, Brazil | Manufacturing/Office | Transit | Own | 244,081 | ||||||||
Tamil Nadu, India | Manufacturing | Transit | Own | 220,132 | ||||||||
Schkeuditz, Germany | Manufacturing | Transit | Own | 219,411 | ||||||||
16
Location | Primary Use | Segment | Own/Lease | Approximate Square Feet | ||||||||
Schuttorf, Germany | Manufacturing/Office | Transit | Own | 189,445 | ||||||||
Amiens, France | Manufacturing | Transit | Own | 142,395 | ||||||||
Chard, UK | Manufacturing/Office | Transit | Own | 141,610 | ||||||||
St Pierre Des Corps, France | Manufacturing | Transit | Own | 133,278 | ||||||||
Avellino, Italy | Manufacturing/Office | Transit | Own | 132,495 | ||||||||
Burton on Trent, UK | Manufacturing/Office | Transit | Lease | 253,453 | ||||||||
Blovice, Czech Republic | Manufacturing | Transit | Lease | 234,814 | ||||||||
Witten, Germany | Manufacturing | Transit | Lease | 209,422 | ||||||||
Verviers, Belgium | Manufacturing/Office | Transit | Lease | 137,024 | ||||||||
Camisano, Italy | Manufacturing/Office | Transit | Lease | 136,465 | ||||||||
San Luis Potosi, Mexico | Manufacturing/Office | Transit | Lease | 112,825 | ||||||||
Birkenhead, UK | Overhaul/Manufacturing | Transit | Lease | 109,146 | ||||||||
Shanghai, China | Manufacturing | Transit | Lease | 104,097 | ||||||||
(1) | Approximately 250,000 square feet are currently used in connection with the Company’s corporate and manufacturing operations. The remainder is leased to third parties. |
Item 3. | LEGAL PROCEEDINGS |
During 2016, the Company paid a settlement in the amount of $0.2 million to the United States Environmental Protection Agency ("EPA") concerning the failure of its Longwood subsidiary, which was acquired in September 2013, to make certain filings with the EPA during the period between 2011 and 2014.
Additional information with respect to legal proceedings is included in Note 19 of “Notes to Consolidated Financial Statements” included in Part IV, Item 15 of this report and incorporate by reference herein.
Item 4. | MINE SAFETY DISCLOSURES |
Not applicable.
17
EXECUTIVE OFFICERS OF THE REGISTRANT
The following table provides information on our executive officers as of December 31, 2016. They are elected periodically by our Board of Directors and serve at its discretion.
Officers | Age | Position | ||
Albert J. Neupaver | 66 | Executive Chairman | ||
Raymond T. Betler | 61 | President and Chief Executive Officer | ||
Stephane Rambaud-Measson | 54 | Executive Vice President, President and Chief Executive Officer-Transit Segment | ||
Patrick D. Dugan | 50 | Executive Vice President Finance, and Chief Financial Officer | ||
Guillaume Bouhours | 40 | Senior Vice President and Chief Financial Officer-Transit Segment | ||
R. Mark Cox | 48 | Executive Vice President, Corporate Development | ||
David L. DeNinno | 61 | Executive Vice President, General Counsel and Secretary | ||
Scott E. Wahlstrom | 53 | Executive Vice President, Human Resources | ||
John A. Mastalerz | 50 | Vice President of Finance, Corporate Controller and Principal Accounting Officer | ||
Timothy R. Wesley | 55 | Vice President, Investor Relations and Corporate Communications | ||
Albert J. Neupaver was named Executive Chairman of the Company in May 2014. Previously, Mr. Neupaver served as Chairman and CEO from May 2013 to May 2014 and as the Company’s President and CEO from February 2006 to May 2013. Prior to joining Wabtec, Mr. Neupaver served in various positions at AMETEK, Inc., a leading global manufacturer of electronic instruments and electric motors. Most recently he served as President of its Electromechanical Group for nine years.
Raymond T. Betler was named President and Chief Executive Officer in May 2014. Previously, Mr. Betler was President and Chief Operating Officer since May 2013 and the Company’s Chief Operating Officer since December 2010. Prior to that, he served as Vice President, Group Executive of the Company since August 2008. Prior to joining Wabtec, Mr. Betler served in various positions of increasing responsibility at Bombardier Transportation since 1979. Most recently, Mr. Betler served as President, Total Transit Systems from 2004 until 2008 and before that as President, London Underground Projects from 2002 to 2004.
Stephane Rambaud-Measson was named Executive Vice President and President and CEO Transit Segment effective December 2016. Previously, Mr. Rambaud-Measson was Chairman of the Management Board and Chief Executive Officer of Faiveley Transport from April 2014 until November 30, 2016. Prior to that position, he served as Executive Vice President of Faiveley Transport from March 2014 to April 2014. Prior to joining Faiveley Transport, Mr. Rambaud-Measson was Chief Executive Officer of Veolia Verkehr. Prior to that, Mr. Rambaud-Measson served in various management roles at Bombardier Transport including President of the Passengers Division beginning in 2008. Before that, in 2005, he was appointed President of Mainline & Metro after serving as Group Vice President Project Management and Administration, which he began in 2004.
Patrick D. Dugan was named Executive Vice President and Chief Financial Officer effective December 2016. Previously Mr. Dugan served as Senior Vice President and Chief Financial Officer since January 2014. Previously, Mr. Dugan was Senior Vice President, Finance and Corporate Controller from January 2012 until November 2013. He originally joined Wabtec in 2003 as Vice President, Corporate Controller. Prior to joining Wabtec, Mr. Dugan served as Vice President and Chief Financial Officer of CWI International, Inc. from December 1996 to November 2003. Prior to 1996, Mr. Dugan was a Manager with PricewaterhouseCoopers.
Guillaume Bouhours was named Senior Vice President and Chief Financial Officer - Transit Segment effective December 2016. Prior to that, Mr. Bouhours served as Chief Financial Officer for Faiveley Transport since September 2010 and as a member of the Faiveley Transport Management Board since April 2011.
R. Mark Cox was named Executive Vice President, Corporate Development effective December 2016. Previously, Mr. Cox served as Sr. Vice President Corporate Development from January 2012, and has been with Wabtec since September 2006 as Vice President, Corporate Development. Prior to joining Wabtec, Mr. Cox served as Director of Business Development for the Electrical Group of Eaton Corporation since 2002. Prior to joining Eaton, Mr. Cox was an investment banker with UBS Warburg, Prudential and Stephens.
David L. DeNinno was named Executive Vice President, General Counsel and Secretary of the Company effective December 2016. Previously, Mr. DeNinno served as Sr. Vice President, General Counsel and Secretary since February 2012. Previously, Mr. DeNinno served as a partner at K&L Gates LLP since May 2011 and prior to that with Reed Smith LLP.
18
Scott E. Wahlstrom was named Executive Vice President, Human Resources effective December 2016. Previously, Mr. Wahlstrom served as Senior Vice President, Human Resources since January 2012. Prior to that, Mr. Wahlstrom has been Vice President, Human Resources, since November 1999. Previously, Mr. Wahlstrom was Vice President, Human Resources & Administration of MotivePower Industries, Inc. from August 1996 until November 1999.
John A. Mastalerz was named Vice President of Finance, Corporate Controller and Principal Accounting Officer in January 2016. Mr. Mastalerz served as Vice President and Corporate Controller from January 2014 to January 2016. Prior to joining Wabtec, Mr. Mastalerz served in various executive management roles with the H.J. Heinz Company from January 2001 to December 2013, most recently as Corporate Controller and Principal Accounting Officer. Prior to 2001, Mr. Mastalerz was a Senior Manager with PricewaterhouseCoopers.
Timothy R. Wesley was named Vice President, Investor Relations and Corporate Communications in November 1999. Previously, Mr. Wesley was Vice President, Investor and Public Relations of MotivePower Industries, Inc. from August 1996 until November 1999.
19
PART II
Item 5. | MARKET FOR REGISTRANT’S COMMON EQUITY, RELATED STOCKHOLDER MATTERS AND ISSUER PURCHASES OF EQUITY SECURITIES |
The Common Stock of the Company is listed on the New York Stock Exchange under the symbol “WAB”. As of February 17, 2017, there were 95,786,017 shares of Common Stock outstanding held by 491 holders of record. The high and low sales price of the shares and dividends declared per share were as follows:
2016 | High | Low | Dividends | |||||||||
First Quarter | $ | 80.61 | $ | 60.28 | $ | 0.080 | ||||||
Second Quarter | $ | 88.46 | $ | 66.14 | $ | 0.080 | ||||||
Third Quarter | $ | 82.00 | $ | 65.54 | $ | 0.100 | ||||||
Fourth Quarter | $ | 89.18 | $ | 74.32 | $ | 0.100 | ||||||
2015 | High | Low | Dividends | |||||||||
First Quarter | $ | 97.16 | $ | 81.21 | $ | 0.060 | ||||||
Second Quarter | $ | 105.10 | $ | 93.49 | $ | 0.060 | ||||||
Third Quarter | $ | 103.07 | $ | 87.95 | $ | 0.080 | ||||||
Fourth Quarter | $ | 94.61 | $ | 67.96 | $ | 0.080 | ||||||
The Company’s 2016 Refinancing Credit Agreement restricts the ability to make dividend payments, with certain exceptions. See “Management’s Discussion and Analysis of Financial Condition and Results of Operations” and see Note 8 of “Notes to Consolidated Financial Statements” included in Part IV, Item 15 of this report.
At the close of business on February 17, 2017, the Company’s Common Stock traded at $87.77 per share.
The following performance graph and related information shall not be deemed “soliciting material” or to be “filed” with the Securities and Exchange Commission, nor shall such information be incorporated by reference to any future filings under the Securities Act of 1933 and the Securities Exchange Act of 1934, each as amended, except to the extent that Wabtec specifically incorporates it by reference into such filing. The graph below compares the total stockholder return through December 31, 2016, of Wabtec’s common stock to (i) the S&P 500, (ii) our former peer group of manufacturing companies which consisted of the following publicly traded companies: The Greenbrier Companies, Trinity Industries, AMETEK, Regal Beloit, Harsco, Valmont, Lincoln Electric, Kennametal, Pall, Crane, Donaldson, WABCO, ITT, Briggs & Stratton, IDEX, Woodward, Titan Wheel, Actuant and Koppers; and (iii) our new peer group of manufacturing companies which consists of the following publicly traded companies: AGCO, AMETEK, Colfax, Dana, Dover, Flowserve, The Greenbrier Companies, Navistar, Oshkosh, Regal Beloit, Rockwell Automation, Rockwell Collins, Terex, Trinity Industries, Snap-On, WABCO and Xylem. The peer group was revised to better match the operations and products of Wabtec.
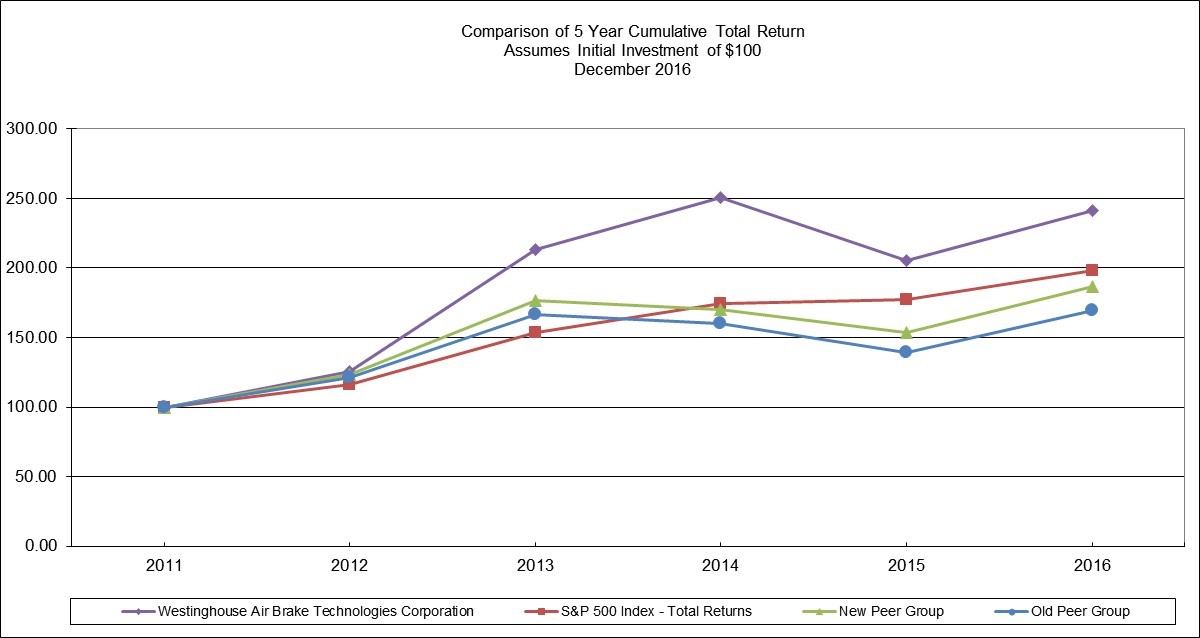
20
On November 9, 2015, the Board of Directors amended its stock repurchase authorization to $350 million of the Company’s outstanding shares. Through December 31, 2015, 4,042,123 shares had been repurchased under this authorization totaling $316.7 million leaving $33.3 million remaining under the authorization. All purchases were made on the open market.
On February 9, 2016 the Board of Directors amended its stock repurchase authorization to $350 million of the Company's outstanding shares. This new stock repurchase authorization supersedes the previous authorization of $350 million of which $33.3 million remained. During the twelve months ended December 31, 2016, the Company repurchased 3,046,408 shares, leaving $137.8 million under the authorization. During the quarter ended December 31, 2016, the Company did not repurchase any shares.
The Company intends to purchase shares on the open market or in negotiated or block trades. No time limit was set for the completion of the programs which conform to the requirements under the 2016 Refinancing Credit Agreement, as well as the senior notes currently outstanding.
21
Item 6. | SELECTED FINANCIAL DATA |
The following table shows selected consolidated financial information of the Company and has been derived from audited financial statements. This financial information should be read in conjunction with, and is qualified by reference to, “Management’s Discussion and Analysis of Financial Condition and Results of Operations” and the Consolidated Financial Statements of the Company and the Notes thereto included elsewhere in this Form 10-K.
Year Ended December 31, | ||||||||||||||||||||
In thousands, except per share amounts | 2016 | 2015 | 2014 | 2013 | 2012 | |||||||||||||||
Income Statement Data | ||||||||||||||||||||
Net sales | $ | 2,931,188 | $ | 3,307,998 | $ | 3,044,454 | $ | 2,566,392 | $ | 2,391,122 | ||||||||||
Gross profit | 924,239 | 1,047,816 | 935,982 | 764,027 | 694,567 | |||||||||||||||
Operating expenses | (465,878 | ) | (440,249 | ) | (408,873 | ) | (326,717 | ) | (302,288 | ) | ||||||||||
Income from operations | $ | 458,361 | $ | 607,567 | $ | 527,109 | $ | 437,310 | $ | 392,279 | ||||||||||
Interest expense, net | $ | (42,561 | ) | $ | (16,888 | ) | $ | (17,574 | ) | $ | (15,341 | ) | $ | (14,251 | ) | |||||
Other (expense) income, net | (2,963 | ) | (5,311 | ) | (1,680 | ) | (882 | ) | (670 | ) | ||||||||||
Net income attributable to Wabtec shareholders | $ | 304,887 | $ | 398,628 | $ | 351,680 | $ | 292,235 | $ | 251,732 | ||||||||||
Diluted Earnings per Common Share | ||||||||||||||||||||
Net income attributable to Wabtec shareholders (1) | $ | 3.34 | $ | 4.10 | $ | 3.62 | $ | 3.01 | $ | 2.60 | ||||||||||
Cash dividends declared per share (1) | $ | 0.36 | $ | 0.28 | $ | 0.20 | $ | 0.13 | $ | 0.08 | ||||||||||
Fully diluted shares outstanding (1) | 91,141 | 97,006 | 96,885 | 96,832 | 96,742 | |||||||||||||||
Balance Sheet Data | ||||||||||||||||||||
Total assets | $ | 6,581,018 | $ | 3,229,513 | $ | 3,303,841 | $ | 2,821,997 | $ | 2,351,542 | ||||||||||
Cash | 398,484 | 226,191 | 425,849 | 285,760 | 215,766 | |||||||||||||||
Total debt | 1,892,776 | 692,238 | 521,195 | 450,709 | 317,896 | |||||||||||||||
Shareholder' equity | 2,976,825 | 1,701,339 | 1,808,298 | 1,587,167 | 1,282,017 | |||||||||||||||
(1) | Information above for net income attributable to Wabtec shareholders, cash dividends declared per share and fully diluted shares outstanding for all periods presented reflects the two-for-one split of the Company’s common stock, which occurred on May 14, 2013. |
22
Item 7. | MANAGEMENT’S DISCUSSION AND ANALYSIS OF FINANCIAL CONDITION AND RESULTS OF OPERATIONS |
OVERVIEW
Wabtec is one of the world’s largest providers of value-added, technology-based products and services for the global rail industry. Our products are found on virtually all U.S. locomotives, freight cars and passenger transit vehicles, as well as in more than 100 countries throughout the world. Our products enhance safety, improve productivity and reduce maintenance costs for customers, and many of our core products and services are essential in the safe and efficient operation of freight rail and passenger transit vehicles. Wabtec is a global company with operations in 30 countries. In 2016, about 54% of the Company’s revenues came from customers outside the U.S.
Management Review and Future Outlook
Wabtec’s long-term financial goals are to generate cash flow from operations in excess of net income, maintain a strong credit profile while minimizing our overall cost of capital, increase margins through strict attention to cost controls and implementation of the Wabtec Excellence Program, and increase revenues through a focused growth strategy, including product innovation and new technologies, global and market expansion, aftermarket products and services, and acquisitions. In addition, Management evaluates the Company’s current operational performance through measures such as quality and on-time delivery.
The Company monitors a variety of factors and statistics to gauge market activity. Freight rail markets around the world are driven primarily by overall economic conditions and activity, while Transit markets are driven primarily by government funding and passenger ridership. Changes in these market drivers can cause fluctuations in demand for Wabtec’s product and services. In its 2016 study, UNIFE estimates the accessible global market for railway products and services is more than $100 billion, and it is expected to grow at about 3.2% annually through 2021, with the highest expected growth rates in Asia Pacific and Europe.
In North America, the AAR compiles statistics that gauge the level of activity in the freight rail industry, including carloadings, which is generally referred to as “rail traffic”. Based on changes in rail traffic trends, railroads can increase or decrease purchases of new locomotives and freight cars. In 2016, North American carloadings decreased 4.5%, including a 7.2% decrease in commodity carloadings and a 1.5% decrease in intermodal carloadings. Deliveries of new locomotives decreased 20%, and deliveries of new freight cars decreased 27%. In 2017, we expect locomotive and freight car deliveries to be lower than in 2016. UNIFE projects an annual growth rate of about 2.3% in North America, but the actual figure depends on the growth of the economy.
In North America, the American Public Transportation Association ("APTA") compiles ridership statistics and trends. Based on preliminary figures for 2016, ridership decreased about 1.0% in the U.S. and was about flat in Canada. Ridership provides fare box revenues to transit authorities, which use these funds, along with state and local money, primarily, for equipment maintenance. In 2015, the U.S. Congress passed a new, five-year transportation funding bill, which includes annual spending increases. A majority of the money that transit agencies spend to purchase new equipment or infrastructure comes from the federal government.
Wabtec continues to expand its presence in freight rail and passenger transit markets outside the U.S., particularly in Europe and Asia Pacific. To gauge activity in these markets, we monitor trends in rail traffic and the spending plans of our customers. In Europe, the majority of the rail system serves the passenger transit market, which is significantly larger than the transit market in the U.S. Our presence in the U.K. and continental Europe, and especially the acquisition of a majority ownership of Faiveley Transport, has positioned the Company to take advantage of this market. UNIFE projects the Western European rail market to grow annually by about 3.6% during the next five years, with France and Germany expected to invest in new rolling stock. UNIFE projects the market in Asia-Pacific, the world’s second largest according to the study, to grow annually by about 5.4%, primarily reflecting strong spending in China. Other growth markets around the world, according to UNIFE, include Latin America, projected to grow at about 2.1%; Africa/Middle East, projected to grow at about 1.9%; and Russia-CIS, projected to grow at about 1.5%. Actual growth rates will be affected by the general global economic conditions and specific economic conditions in each market. Through wholly owned subsidiaries and joint ventures, Wabtec has a presence in every key freight rail and passenger transit market around the world.
In 2016 and beyond, general economic and market conditions in the United States and internationally will have an impact on our sales and operations. To the extent that these factors cause instability of capital markets, shortages of raw materials or component parts, longer sales cycles, deferral or delay of customer orders or an inability to market our products effectively, our business and results of operations could be materially adversely affected. In addition, we face risks associated with our four-point growth strategy including the level of investment that customers are willing to make in new technologies
23
developed by the industry and the Company, and risks inherent in global expansion. When necessary, we will modify our financial and operating strategies to reflect changes in market conditions and risks.
ACQUISITION OF FAIVELEY TRANSPORT S.A.
On July 27, 2015, the Company announced plans to acquire all of the issued and outstanding shares of Faiveley Transport S.A. ("Faiveley Transport") under the terms of a Share Purchase Agreement (the "Share Purchase Agreement") and a Tender Offer Agreement (the "Tender Offer Agreement"). On October 24, 2016, the Company entered into amendments to the Share Purchase Agreement and the Tender Offer Agreement. Faiveley Transport is a leading global provider of value-added, integrated systems and services for the railway industry with annual sales of about $1.2 billion and more than 5,700 employees in 24 countries. Faiveley Transport supplies railway manufacturers, operators and maintenance providers with a range of valued-added, technology-based systems and services in Energy & Comfort (air conditioning, power collectors and converters, and passenger information), Access & Mobility (passenger access systems and platform doors), and Brakes and Safety (braking systems and couplers).
The transaction has been structured in three steps:
• | Wabtec made an irrevocable offer to the owners of approximately 51% of Faiveley Transport's shares for a purchase price of €100 per share, payable between 25% and 45% in cash at the election of those shareholders with the remainder in common stock. |
• | Upon completion of required labor group consultations, on October 6, 2015, the 51% shareholders entered into a definitive Share Purchase Agreement, which was amended on October 24, 2016, and Faiveley Transport entered into the Tender Offer Agreement with Wabtec which was also amended on October 24, 2016. |
• | Upon completing the share purchase under the Share Purchase Agreement, Wabtec commenced a tender offer for the remaining publicly traded Faiveley Transport shares. The public shareholders will have the option to elect to receive €100 per share in cash or Wabtec common stock. The common stock portion of the consideration is subject to a cap on issuance of Faiveley common shares that will be equivalent to the rates of cash and stock elected by the 51% owners. Wabtec intends to delist Faiveley Transport from Euronext after the tender offer if minority interests represent less than 5%. |
On November 30, 2016, the Company acquired majority ownership of Faiveley Transport, after completing the purchase of the Faiveley family’s ownership interest, which represented approximately 51% of outstanding share capital and approximately 49% of the outstanding voting shares of Faiveley Transport. Under the variable interest entity model the Company concluded that it is the primary beneficiary of Faiveley Transport as it possesses the power to direct the activities of Faiveley Transport that most significantly impact its economic performance and it possesses the obligation and right to absorb losses and benefits from Faiveley Transport; therefore, Faiveley Transport was consolidated by Wabtec under the variable interest model at acquisition. Based on the Company’s $84.77 stock price on November 30, 2016, the aggregate value of consideration paid for the Faiveley Transport family’s ownership interest was $978.1 million, including $534.7 million in stock or approximately 6.3 million shares, $211.8 million in cash, $409.9 million in debt assumed, less $178.3 million in cash acquired. The Company launched a tender offer for the remaining publicly traded Faiveley Transport shares in December 2016. Through the tender offer, the public shareholders of Faiveley Transport will have the option to elect to receive €100 per share of Faiveley Transport in cash or 1.1538 Wabtec common shares per share of Faiveley Transport. On February 3, 2017, the initial cash tender offer was closed which resulted in the Company acquiring an additional 27.5% of outstanding share capital of Faiveley Transport for approximately $411.8 million in cash and $25.2 million in Wabtec stock. The tender offer will be reopened with dates and duration to be determined by the French regulator. The total purchase price for 100% of the shares of Faiveley Transport is approximately $1.7 billion, including assumed debt and net of cash acquired. The approximate $1.0 billion cash portion of the transaction is being funded from cash on hand, the net proceeds from a recent $750 million senior notes offering and the company’s existing revolving credit facility and term note.
24
RESULTS OF OPERATIONS
The following table shows our Consolidated Statements of Operations for the years indicated.
Year Ended December 31, | ||||||||||||
In thousands | 2016 | 2015 | 2014 | |||||||||
Net sales | $ | 2,931,188 | $ | 3,307,998 | $ | 3,044,454 | ||||||
Cost of sales | (2,006,949 | ) | (2,260,182 | ) | (2,108,472 | ) | ||||||
Gross profit | 924,239 | 1,047,816 | 935,982 | |||||||||
Selling, general and administrative expenses | (371,805 | ) | (347,373 | ) | (324,539 | ) | ||||||
Engineering expenses | (71,375 | ) | (71,213 | ) | (61,886 | ) | ||||||
Amortization expense | (22,698 | ) | (21,663 | ) | (22,448 | ) | ||||||
Total operating expenses | (465,878 | ) | (440,249 | ) | (408,873 | ) | ||||||
Income from operations | 458,361 | 607,567 | 527,109 | |||||||||
Interest expense, net | (42,561 | ) | (16,888 | ) | (17,574 | ) | ||||||
Other (expense) income, net | (2,963 | ) | (5,311 | ) | (1,680 | ) | ||||||
Income from operations before income taxes | 412,837 | 585,368 | 507,855 | |||||||||
Income tax expense | (99,433 | ) | (186,740 | ) | (156,175 | ) | ||||||
Net income | 313,404 | 398,628 | 351,680 | |||||||||
Noncontrolling interest | (8,517 | ) | — | — | ||||||||
Net income attributable to Wabtec shareholders | $ | 304,887 | $ | 398,628 | $ | 351,680 | ||||||
2016 COMPARED TO 2015
The following table summarizes the results of operations for the period:
For the year ended December 31, | |||||||||||
Percent | |||||||||||
In thousands | 2016 | 2015 | Change | ||||||||
Freight Segment | $ | 1,543,098 | $ | 2,054,715 | (24.9 | )% | |||||
Transit Segment | 1,388,090 | 1,253,283 | 10.8 | % | |||||||
Net sales | 2,931,188 | 3,307,998 | (11.4 | )% | |||||||
Income from operations | 458,361 | 607,567 | (24.6 | )% | |||||||
Net income | $ | 313,404 | $ | 398,628 | (21.4 | )% | |||||
The following table shows the major components of the change in sales in 2016 from 2015:
Freight | Transit | |||||||||||
In thousands | Segment | Segment | Total | |||||||||
2015 Net Sales | $ | 2,054,715 | $ | 1,253,283 | $ | 3,307,998 | ||||||
Acquisitions | 55,097 | 134,095 | 189,192 | |||||||||
Change in Sales by Product Line: | ||||||||||||
Specialty Products & Electronics | (438,285 | ) | 35,611 | (402,674 | ) | |||||||
Brake Products | (50,665 | ) | (4,442 | ) | (55,107 | ) | ||||||
Other | (26,908 | ) | 57 | (26,851 | ) | |||||||
Remanufacturing, Overhaul & Build | (33,700 | ) | 22,743 | (10,957 | ) | |||||||
Other Transit Products | — | 656 | 656 | |||||||||
Foreign exchange | (17,156 | ) | (53,913 | ) | (71,069 | ) | ||||||
2016 Net Sales | $ | 1,543,098 | $ | 1,388,090 | $ | 2,931,188 | ||||||
Net sales decreased by $376.8 million to $2,931.2 million in 2016 from $3,308.0 million in 2015. The decrease is primarily due to lower sales for Specialty Products and Electronics of $402.7 million and lower Brake Products sales of $55.1 million due to decreased demand for freight products attributable to lower freight car and locomotive builds, and train control and signaling products and services, and lower Other Products sales of $26.9 million from decreased demand for freight spare part kits. Acquisitions increased sales $189.2 million and unfavorable foreign exchange decreased sales $71.1 million.
Freight Segment sales decreased by $511.6 million, or 24.9%, primarily due to a $438.3 million decrease for Specialty Products and Electronics sales from lower demand for freight original equipment rail products and train control and signaling products attributable to lower freight car and locomotive builds, a decrease of $50.7 million for Brake Products sales from
25
lower demand for original equipment brakes and aftermarket services, a decrease of $33.7 million for Remanufacturing, Overhaul and Build sales due to a large locomotive rebuild contract that completed in 2016, and a decrease of $26.9 million for Other Product sales from decreased demand for freight spare part kits. Acquisitions increased sales by $55.1 million and unfavorable foreign exchange decreased sales by $17.2 million.
Transit Segment sales increased by $134.8 million, or 10.8%, primarily due to a $35.6 million increase for Specialty Products and Electronics from higher demand for original equipment conduction systems and current collectors, and an increase of $22.7 million for Remanufacturing, Overhaul and Build sales from higher demand for aftermarket locomotive builds. Acquisitions increased sales by $134.1 million and unfavorable foreign exchange decreased sales by $53.9 million.
Cost of Sales and Gross Profit The following table shows the major components of cost of sales for the periods indicated:
Twelve Months Ended December 31, 2016 | ||||||||||||||||||||
In thousands | Freight | Percentage of Sales | Transit | Percentage of Sales | Total | Percentage of Sales | ||||||||||||||
Material | $ | 590,876 | 38.3 | % | $ | 587,516 | 42.3 | % | $ | 1,178,392 | 40.2 | % | ||||||||
Labor | 176,518 | 11.4 | % | 170,481 | 12.3 | % | 346,999 | 11.8 | % | |||||||||||
Overhead | 242,956 | 15.7 | % | 213,821 | 15.4 | % | 456,777 | 15.6 | % | |||||||||||
Other/Warranty | 5,575 | 0.4 | % | 19,206 | 1.4 | % | 24,781 | 0.8 | % | |||||||||||
Total cost of sales | $ | 1,015,925 | 65.8 | % | $ | 991,024 | 71.4 | % | $ | 2,006,949 | 68.4 | % | ||||||||
Twelve Months Ended December 31, 2015 | ||||||||||||||||||||
In thousands | Freight | Percentage of Sales | Transit | Percentage of Sales | Total | Percentage of Sales | ||||||||||||||
Material | $ | 854,728 | 41.6 | % | $ | 531,152 | 42.4 | % | $ | 1,385,880 | 41.9 | % | ||||||||
Labor | 219,495 | 10.7 | % | 156,357 | 12.5 | % | 375,852 | 11.4 | % | |||||||||||
Overhead | 282,132 | 13.7 | % | 182,501 | 14.6 | % | 464,633 | 14.0 | % | |||||||||||
Other/Warranty | 5,926 | 0.3 | % | 27,891 | 2.2 | % | 33,817 | 1.0 | % | |||||||||||
Total cost of sales | $ | 1,362,281 | 66.3 | % | $ | 897,901 | 71.7 | % | $ | 2,260,182 | 68.3 | % | ||||||||
Cost of sales decreased by $253.2 million to $2,006.9 million in 2016 compared to $2,260.2 million in the same period of 2015. For the twelve months ended 2016, cost of sales as a percentage of sales was 68.4% compared to 68.3% in the same period of 2015.
Freight Segment cost of sales decreased 0.5% as a percentage of sales to 65.8% in 2016 compared to 66.3% for the same period of 2015. The decrease as a percentage of sales is primarily related to sales with lower material content, lower overall material costs due to ongoing sourcing efforts, and decreases in various commodity prices partially offset by an increase in overhead costs as a percentage of sales which is primarily due to certain fixed overhead costs.
Transit Segment cost of sales decreased 0.3% as a percentage of sales to 71.4% in 2016 compared to 71.7% for the same period in 2015. The decrease is primarily due to better margin performance from prior year acquisitions and ongoing sourcing savings. These benefits were partially offset by $13.8 million of costs related to adjustments on certain long-term contracts.
Included in cost of sales is warranty expense. The provision for warranty expense is generally established for specific losses, along with historical estimates of customer claims as a percentage of sales, which can cause variability in warranty expense between quarters. Warranty expense was $28.9 million in 2016 compared to $35.4 million in 2015.
26
Operating expenses The following table shows our operating expenses:
For the year ended December 31, | ||||||||||||||
Percentage of | Percentage of | |||||||||||||
In thousands | 2016 | Sales | 2015 | Sales | ||||||||||
Selling, general and administrative expenses | $ | 371,805 | 12.7 | % | $ | 347,373 | 10.5 | % | ||||||
Engineering expenses | 71,375 | 2.4 | % | 71,213 | 2.2 | % | ||||||||
Amortization expense | 22,698 | 0.8 | % | 21,663 | 0.7 | % | ||||||||
Total operating expenses | $ | 465,878 | 15.9 | % | $ | 440,249 | 13.4 | % | ||||||
Total operating expenses were 15.9% and 13.4% of sales for 2016 and 2015, respectively. Selling, general, and administrative expenses increased $24.4 million, or 7.0%, primarily due to $38.9 million of costs related to the Faiveley acquisition and $5.4 million in costs related to restructuring activity. These costs were partially offset by lower incentive and non-cash compensation expense and the effects of foreign exchange. Engineering expense was consistent with the prior year. Amortization expense increased $1.0 million due to amortization of intangibles associated with acquisitions.
The following table shows our segment operating expenses:
For the year ended December 31, | |||||||||||
Percent | |||||||||||
In thousands | 2016 | 2015 | Change | ||||||||
Freight Segment | $ | 182,718 | $ | 208,773 | (12.5 | )% | |||||
Transit Segment | 225,620 | 205,415 | 9.8 | % | |||||||
Corporate | 57,540 | 26,061 | 120.8 | % | |||||||
Total operating expenses | $ | 465,878 | $ | 440,249 | 5.8 | % | |||||
Freight Segment operating expenses decreased $26.1 million, or 12.5%, in 2016 and increased 160 basis points to 11.8% of sales. The decrease is primarily attributable to reduced sales volumes and realized benefits associated with the cost saving initiatives undertaken in 2016 partially offset by $8.8 million of incremental operating expenses from acquisitions.
Transit Segment operating expenses increased $20.2 million, or 9.8%, in 2016 and decreased 10 basis points to 16.3% of sales. The increase is primarily related to $26.2 million of incremental operating expenses related to acquisitions and $7.1 million related to the Faiveley Transport transaction. This increase is partially offset by lower operating expenses due to foreign exchange.
Corporate non-allocated operating expenses increased $31.5 million in 2016 primarily due to $31.8 million of costs related to the Faiveley acquisition partially offset by realized benefits from cost saving initiatives in 2016.
Interest expense, net Overall interest expense, net, increased $25.7 million in 2016 due to a higher overall debt balance in 2016 compared to 2015, primarily related to the Faiveley Transport acquisition and $14.9 million of debt refinancing costs. Refer to Note 8 of the "Notes to Condensed Consolidated Financial Statements" for additional information on debt.
Other expense, net Other expense, net, decreased $2.3 million to $3.0 million for 2016, compared to 2015 primarily due to foreign exchange adjustments.
Income taxes The effective income tax rate was 24.1% and 31.9% in 2016 and 2015, respectively. The decrease in the effective rate is primarily the result of an enacted tax rate change which reduces the corporate income tax rate in France and a higher earnings mix in lower tax rate jurisdictions, partially offset by 2016 transaction charges related to the acquisition of Faiveley Transport that are not deductible.
27
2015 COMPARED TO 2014
The following table summarizes the results of operations for the period:
For the year ended December 31, | |||||||||||
Percent | |||||||||||
In thousands | 2015 | 2014 | Change | ||||||||
Freight Segment | $ | 2,054,715 | $ | 1,731,477 | 18.7 | % | |||||
Transit Segment | 1,253,283 | 1,312,977 | (4.5 | )% | |||||||
Net sales | 3,307,998 | 3,044,454 | 8.7 | % | |||||||
Income from operations | 607,567 | 527,109 | 15.3 | % | |||||||
Net income attributable to Wabtec shareholders | $ | 398,628 | $ | 351,680 | 13.3 | % | |||||
The following table shows the major components of the change in sales in 2015 from 2014:
Freight | Transit | |||||||||||
In thousands | Segment | Segment | Total | |||||||||
2014 Net Sales | $ | 1,731,477 | $ | 1,312,977 | $ | 3,044,454 | ||||||
Acquisition | 145,529 | 117,291 | 262,820 | |||||||||
Change in Sales by Product Line: | ||||||||||||
Specialty Products & Electronics | 145,680 | 10,776 | 156,456 | |||||||||
Remanufacturing, Overhaul & Build | 80,443 | (53,883 | ) | 26,560 | ||||||||
Brake Products | 18,905 | (23,094 | ) | (4,189 | ) | |||||||
Other Transit Products | — | (10,408 | ) | (10,408 | ) | |||||||
Other | (17,764 | ) | 1,894 | (15,870 | ) | |||||||
Foreign exchange | (49,555 | ) | (102,270 | ) | (151,825 | ) | ||||||
2015 Net Sales | $ | 2,054,715 | $ | 1,253,283 | $ | 3,307,998 | ||||||
Net sales increased by $263.5 million to $3,308.0 million in 2015 from $3,044.5 million in 2014. The increase is primarily due to a $156.5 million increase for Specialty Products and Electronics sales from higher demand for freight original equipment products and aftermarket electronic and PTC electronic products. Acquisitions increased sales $262.8 million and unfavorable foreign exchange decreased sales $151.8 million.
Freight Segment sales increased by $323.2 million, or 18.7%, primarily due to a $145.7 million increase for Specialty Products and Electronics sales from higher demand for freight original equipment rail products, PTC electronics, and aftermarket rail products and $80.4 million for Remanufacturing, Overhaul and Build products due to higher demand for aftermarket locomotive builds. Acquisitions increased sales by $145.5 million and unfavorable foreign exchange decreased sales by $49.6 million.
Transit Segment sales decreased by $59.7 million, or 4.5%, due to a decrease of $102.3 million related to unfavorable foreign exchange, a $53.9 million decrease in Remanufacturing, Overhaul and Build from lower demand for original transit locomotive because a multi-year project was substantially completed in 2014, and a $23.1 million decrease for Brake Products from lower demand for braking products in Europe and braking systems in North America. These decreases were partially offset by $117.3 million in sales from acquisitions.
28
Cost of Sales and Gross Profit The following table shows the major components of cost of sales for the periods indicated:
Twelve Months Ended December 31, 2015 | ||||||||||||||||||||
In thousands | Freight | Percentage of Sales | Transit | Percentage of Sales | Total | Percentage of Sales | ||||||||||||||
Material | $ | 854,728 | 41.6 | % | $ | 531,152 | 42.4 | % | $ | 1,385,880 | 41.9 | % | ||||||||
Labor | 219,495 | 10.7 | % | 156,357 | 12.5 | % | 375,852 | 11.4 | % | |||||||||||
Overhead | 282,132 | 13.7 | % | 182,501 | 14.6 | % | 464,633 | 14.0 | % | |||||||||||
Other/Warranty | 5,926 | 0.3 | % | 27,891 | 2.2 | % | 33,817 | 1.0 | % | |||||||||||
Total cost of sales | $ | 1,362,281 | 66.3 | % | $ | 897,901 | 71.7 | % | $ | 2,260,182 | 68.3 | % | ||||||||
Twelve Months Ended December 31, 2014 | ||||||||||||||||||||
In thousands | Freight | Percentage of Sales | Transit | Percentage of Sales | Total | Percentage of Sales | ||||||||||||||
Material | $ | 730,395 | 42.2 | % | $ | 586,571 | 44.7 | % | $ | 1,316,966 | 43.3 | % | ||||||||
Labor | 178,309 | 10.3 | % | 165,260 | 12.6 | % | 343,569 | 11.3 | % | |||||||||||
Overhead | 228,147 | 13.2 | % | 196,481 | 15.0 | % | 424,628 | 13.9 | % | |||||||||||
Other/Warranty | 1,691 | 0.1 | % | 21,618 | 1.6 | % | 23,309 | 0.8 | % | |||||||||||
Total cost of sales | $ | 1,138,542 | 65.8 | % | $ | 969,930 | 73.9 | % | $ | 2,108,472 | 69.3 | % | ||||||||
Cost of sales increased by $151.7 million to $2,260.2 million in 2015 compared to $2,108.5 million in the same period of 2014. For the twelve months ended 2015, cost of sales as a percentage of sales was 68.3% compared to 69.3% in the same period of 2014. The decrease of cost of sales as a percentage of sales is due to lower material costs primarily due to lower original equipment transit locomotive sales and higher specialty product and electronics sales.
Freight Segment cost of sales increased 0.5% as a percentage of sales to 66.3% in 2015 compared to 65.8% for the same period of 2014. The increase is primarily related to slightly lower margins related to recent acquisitions, and cost overruns on a project nearing completion, partially offset by higher Specialty Products and Electronics sales.
Transit Segment cost of sales decreased 2.2% as a percentage of sales to 71.7% in 2015 compared to 73.9% for the same period in 2014. The decrease in 2015 is primarily due to lower material costs associated with lower original equipment locomotive sales and lower original equipment and aftermarket brake product sales which carry higher raw material content, partially offset by additional costs incurred on the closeout of several projects.
Included in cost of sales is warranty expense. The provision for warranty expense is generally established for specific losses, along with historical estimates of customer claims as a percentage of sales, which can cause variability in warranty expense between quarters. Warranty expense for the twelve months ended December 31, 2015 increased $1.3 million to $35.4 million from $34.1 million in 2014 primarily due to increased sales.
Gross profit for the twelve months ended December 31, 2015 increased $111.8 million to $1,047.8 million from $936.0 million for the twelve months ended December 2014 and the gross profit margin increased 100 basis points to 31.7% from 30.7% at December 31, 2014. These increases are due to higher sales volume, favorable sales mix, and the reasons discussed above.
Operating expenses The following table shows our operating expenses:
For the year ended December 31, | ||||||||||||||
Percentage of | Percentage of | |||||||||||||
In thousands | 2015 | Sales | 2014 | Sales | ||||||||||
Selling, general and administrative expenses | $ | 347,373 | 10.7 | % | $ | 324,539 | 10.7 | % | ||||||
Engineering expenses | 71,213 | 2.0 | % | 61,886 | 2.0 | % | ||||||||
Amortization expense | 21,663 | 0.7 | % | 22,448 | 0.7 | % | ||||||||
Total operating expenses | $ | 440,249 | 13.4 | % | $ | 408,873 | 13.4 | % | ||||||
Total operating expenses were 13.4% for both the years ending December 31 2015, and 2014. Selling, general, and administrative expenses increased $22.8 million, or 7.0%, primarily due to $24.7 million of expenses from acquisitions partially offset by lower incentive and non-cash compensation expense and the effects of foreign exchange. Engineering
29
expense increased by $9.3 million, or 15.1%, primarily due to $3.5 million of expenses from acquisitions. The remainder of the increase can be attributed to the company concentrating resources on new product development, specifically in the electronics market. Costs related to engineering for specific customer contracts are included in cost of sales. Amortization expense decreased $0.8 million due to lower amortization of intangibles associated with acquisitions.
The following table shows our segment operating expenses:
For the year ended December 31, | |||||||||||
Percent | |||||||||||
In thousands | 2015 | 2014 | Change | ||||||||
Freight Segment | $ | 208,773 | $ | 188,929 | 10.5 | % | |||||
Transit Segment | 205,415 | 196,776 | 28.5 | % | |||||||
Corporate | 26,061 | 23,168 | 49.9 | % | |||||||
Total operating expenses | $ | 440,249 | $ | 408,873 | 25.1 | % | |||||
Freight Segment operating expenses increased $19.8 million, or 10.5%, in 2015 but decreased 70 basis points to 10.2% of sales. The increase primarily relates to $8.4 million of incremental operating expenses from acquisitions and $7.9 million for engineering attributable to the Company concentrating resources on new product development.
Transit Segment operating expenses increased $8.6 million, or 4.4%, in 2015 and increased 140 basis points to 16.4% of sales. The increase is primarily related to $19.8 million of incremental operating expenses related to acquisitions. This increase is partially offset by lower operating expenses due to foreign exchange.
Corporate non-allocated operating expenses increased $2.9 million in 2015 primarily due to higher administrative and transaction costs associated with growing our business.
Income from operations Income from operations totaled $607.6 million or 18.4% of sales in 2015 compared to $527.1 million or 17.3% of sales in 2014. Income from operations increased due to higher sales volume, partially offset by increased operating expenses discussed above.
Interest expense, net Overall interest expense, net, decreased $0.7 million in 2015 due to lower average debt balances.
Other expense, net Other expense, net, increased $3.6 million to $5.3 million for 2015, compared to 2014 primarily due to foreign exchange adjustments.
Income taxes The effective income tax rate was 31.9% and 30.8% in 2015 and 2014, respectively. The increase in the effective rate is primarily the result of a higher earnings mix in higher tax rate jurisdictions.
Net income Net income for 2015 increased 13.3% or $46.9 million to $398.6 million, compared to 2014. The increase in net income is due to the reasons discussed above.
30
Liquidity and Capital Resources
Liquidity is provided by operating cash flow and borrowings under the Company’s unsecured credit facility with a consortium of commercial banks. The following is a summary of selected cash flow information and other relevant data:
For the year ended December 31, | ||||||||||||
In thousands | 2016 | 2015 | 2014 | |||||||||
Cash provided by (used for): | ||||||||||||
Operating activities | $ | 449,307 | $ | 448,260 | $ | 472,385 | ||||||
Investing activities | (775,065 | ) | (380,136 | ) | (347,678 | ) | ||||||
Financing activities: | ||||||||||||
Proceeds from debt | 1,875,000 | 787,400 | 563,400 | |||||||||
Payments of debt | (1,102,748 | ) | (612,680 | ) | (493,819 | ) | ||||||
Stock repurchase | (212,176 | ) | (387,787 | ) | (26,757 | ) | ||||||
Cash dividends | (32,430 | ) | (26,963 | ) | (19,246 | ) | ||||||
Other | (3,452 | ) | (8,884 | ) | 1,928 | |||||||
Operating activities. Cash provided by operations in 2016 was $449.3 million compared with $448.3 million in 2015. In comparison to 2015, cash provided by operations in 2016 increased slightly due to positive changes in other assets and liabilities and net working capital, mostly offset by lower operating results (net income plus net-add back for non-cash transactions in earnings). Other assets and liabilities changed favorably by $49.5 million primarily due to an increase in other accrued liabilities. The favorable changes in working capital primarily related to a $57.7 million favorable change in accounts payable principally due to the timing of payments, $25.2 million favorable change in inventory driven by successful efforts to control the amount of inventory on hand. These favorable changes in working capital were partially offset by an unfavorable change in accrued income taxes of $33.5 million driven by lower income taxes owed at the end of 2016 given the decrease in pretax income.
Cash provided by operations in 2015 was $448.3 million compared with $472.4 million in 2014. In comparison to 2014, cash provided by operations in 2015 decreased due to unfavorable working capital requirements partially offset by higher operating results. The unfavorable working capital requirements primarily related to an unfavorable change in accounts payable and accrued liabilities of $132.0 million and $86.9 million, respectively. These cash outflows were partially offset by a favorable change in accounts receivable of $38.9 million driven by collections due to achieving certain project related milestones and a favorable change in inventory of $84.2 million due to successful efforts to control the amount of inventory on hand.
Investing activities. In 2016, 2015 and 2014, cash used in investing activities was $775.1 million, $380.1 million and $347.7 million, respectively. The major components of the cash outflow in 2016 were planned additions to property, plant, and equipment of $50.2 million for continued investments in our facilities and manufacturing processes and $183.1 million in net cash paid for acquisitions. This compares to $49.4 million for property, plant, and equipment and $129.6 million in net cash paid for acquisitions in 2015. Additionally, $744.7 million of cash was deposited into escrow to finance the pending tender offer for the purchase the noncontrolling interest of Faiveley Transport, which was partially offset by $202.9 million of cash deposited into escrow to finance the purchase of a controlling interest in Faiveley Transport in 2015 which was released from escrow in 2016. Refer to Note 3 of the “Notes to Condensed Consolidated Financial Statements” for additional information on acquisitions.
Financing activities. In 2016, cash provided by financing activities was $524.2 million, which included $1,125.0 million in proceeds from the revolving credit facility debt, $770.0 million of repayments of debt on the revolving credit facility, $332.7 million in repayments of other debt, which was primarily driven by repayments of debt acquired from the purchase of Faiveley Transport, $750.0 million of new borrowings on the 2026 Senior Notes, $32.4 million of dividend payments and $212.2 million of Wabtec stock repurchases. In 2015, cash used for financing activities was $248.9 million, which included $787.4 million in proceeds from the revolving credit facility debt, $612.7 million of repayments of debt on the revolving credit facility, $27.0 million of dividend payments and $387.8 million of Wabtec stock repurchases.
31
The following table shows outstanding indebtedness at December 31, 2016 and 2015.
December 31, | ||||||||
In thousands | 2016 | 2015 | ||||||
3.45% Senior Notes, due 2026, net of unamortized debt issuance costs of $2,526 and $0 | $ | 747,474 | $ | — | ||||
4.375% Senior Notes, due 2023, net of unamortized discount and debt issuance costs of $1,690 and $1,947 | 248,310 | 248,053 | ||||||
Revolving Credit Facility and Term Loan, net of unamortized debt issuance costs of $3,850 and $1,542 | 796,150 | 443,458 | ||||||
Schuldschein Loan | 98,671 | — | ||||||
Other Borrowings | 1,153 | — | ||||||
Capital Leases | 1,018 | 727 | ||||||
Total | 1,892,776 | 692,238 | ||||||
Less - current portion | 129,809 | 433 | ||||||
Long-term portion | $ | 1,762,967 | $ | 691,805 | ||||
Cash balances at December 31, 2016 and 2015 were $398.5 million and $226.2 million, respectively.
3.45% Senior Notes Due November 2026
In October 2016, the Company issued $750.0 million of Senior Notes due in 2026 (the “2016 Notes”). The 2016 Notes were issued at 99.965% of face value. Interest on the 2016 Notes accrues at a rate of 3.45% per annum and is payable semi-annually on May 15 and November 15 of each year. The proceeds were used to finance the cash portion of the Faiveley Transport acquisition, refinance Faiveley Transport’s indebtedness, and for general corporate purposes. The principal balance is due in full at maturity. The Company incurred $2.6 million of deferred financing costs related to the issuance of the 2016 Notes.
The 2016 Notes are senior unsecured obligations of the Company and rank pari passu with all existing and future senior debt and senior to all existing and future subordinated indebtedness of the Company. The indenture under which the 2016 Notes were issued contains covenants and restrictions which limit among other things, the following: the incurrence of indebtedness, payment of dividends and certain distributions, sale of assets, change in control, mergers and consolidations and the incurrence of liens.
The Company is in compliance with the restrictions and covenants in the indenture under which the 2016 Notes were issued and expects that these restrictions and covenants will not be any type of limiting factor in executing our operating activities.
4.375% Senior Notes Due August 2023
In August 2013, the Company issued $250.0 million of Senior Notes due in 2023 (the “2013 Notes”). The 2013 Notes were issued at 99.879% of face value. Interest on the 2013 Notes accrues at a rate of 4.375% per annum and is payable semi-annually on February 15 and August 15 of each year. The proceeds were used to repay debt outstanding under the Company’s existing credit agreement, and for general corporate purposes. The principal balance is due in full at maturity. The Company incurred $2.6 million of deferred financing costs related to the issuance of the 2013 Notes.
The 2013 Notes are senior unsecured obligations of the Company and rank pari passu with all existing and future senior debt and senior to all existing and future subordinated indebtedness of the Company. The indenture under which the 2013 Notes were issued contains covenants and restrictions which limit among other things, the following: the incurrence of indebtedness, payment of dividends and certain distributions, sale of assets, change in control, mergers and consolidations and the incurrence of liens.
The Company is in compliance with the restrictions and covenants in the indenture under which the 2013 Notes were issued and expects that these restrictions and covenants will not be any type of limiting factor in executing our operating activities.
2016 Refinancing Credit Agreement
On June 22, 2016, the Company amended its existing revolving credit facility with a consortium of commercial banks. This “2016 Refinancing Credit Agreement” provides the Company with a $1.2 billion, 5 year revolving credit facility and a $400.0 million delayed draw term loan (the “Term Loan”). The Company incurred approximately $3.3 million of deferred financing cost related to the 2016 Refinancing Credit Agreement. The facility expires on June 22, 2021. The 2016 Refinancing
32
Credit Agreement borrowings bear variable interest rates indexed as described below. At December 31, 2016, the Company had available bank borrowing capacity, net of $20.2 million of letters of credit, of approximately $783.7 million, subject to certain financial covenant restrictions.
The Term Loan was drawn on November 25, 2016. The Company incurred a 10 basis point commitment fee from June 22, 2016 until the initial draw on November 25, 2016.
Under the 2016 Refinancing Credit Agreement, the Company may elect a Base Rate of interest for U.S. Dollar denominated loans or, for certain currencies, an interest rate based on the London Interbank Offered Rate (“LIBOR”) of interest, or other rates appropriate for such currencies (in any case, “the Alternate Rate”). The Base Rate adjusts on a daily basis and is the greater of the Federal Funds Effective Rate plus 0.50% per annum, the PNC, N.A. prime rate or the Daily LIBOR Rate plus 100 basis points, plus a margin that ranges from 0 to 75 basis points. The Alternate Rate is based on the quoted rates specific to the applicable currency, plus a margin that ranges from 75 to 175 basis points. Both the Base Rate and Alternate Rate margins are dependent on the Company’s consolidated total indebtedness to EBITDA ratios. The initial Base Rate margin is 0 basis points and the Alternate Rate margin is 175 basis points.
At December 31, 2016, the weighted average interest rate on the Company’s variable rate debt was 2.51%. On January 12, 2012, the Company entered into a forward starting interest rate swap agreement with a notional value of $150.0 million. The effective date of the interest rate swap agreement is July 31, 2013, and the termination date was November 7, 2016. The impact of the interest rate swap agreement converted a portion of the Company’s outstanding debt from a variable rate to a fixed-rate borrowing. During the term of the interest rate swap agreement the interest rate on the notional value was fixed at 1.415% plus the Alternate Rate margin. On June 5, 2014, the Company entered into a forward starting interest rate swap agreement with a notional value of $150.0 million. The effective date of the interest rate swap agreement is November 7, 2016, and the termination date is December 19, 2018. The impact of the interest rate swap agreement converts a portion of the Company’s outstanding debt from a variable rate to a fixed-rate borrowing. During the term of the interest rate swap agreement the interest rate on the notional value will be fixed at 2.56% plus the Alternate Rate margin. As for these agreements, the Company is exposed to credit risk in the event of nonperformance by the counterparties. However, since only the cash interest payments are exchanged, exposure is significantly less than the notional amount. The counterparties are large financial institutions with excellent credit ratings and history of performance. The Company currently believes the risk of nonperformance is negligible.
The 2016 Refinancing Credit Agreement limits the Company’s ability to declare or pay cash dividends and prohibits the Company from declaring or making other distributions, subject to certain exceptions. The 2016 Refinancing Credit Agreement contains various other covenants and restrictions including the following limitations: incurrence of additional indebtedness; mergers, consolidations, sales of assets and acquisitions; additional liens; sale and leasebacks; permissible investments, loans and advances; certain debt payments; and imposes a minimum interest expense coverage ratio of 3.0 and a maximum debt to EBITDA ratio of 3.25. The Company is in compliance with the restrictions and covenants of the 2016 Refinancing Credit Agreement and does not expect that these measurements will limit the Company in executing our operating activities.
2013 Refinancing Credit Agreement
On December 19, 2013, the Company amended its then existing revolving credit facility with a consortium of commercial banks. This “2013 Refinancing Credit Agreement” provided the Company with an $800.0 million, 5-year revolving credit facility. The Company incurred approximately $1.0 million of deferred financing cost related to the 2013 Refinancing Credit Agreement. The 2013 Refinancing Credit Agreement was replaced by the 2016 Refinancing Credit Agreement.
Under the 2013 Refinancing Credit Agreement, the Company could have elected a Base Rate of interest for U.S. Dollar denominated loans or, for certain currencies, an interest rate based on the LIBOR of interest, or other rates appropriate for such currencies (in any case, “the Alternate Rate”). The Base Rate adjusted on a daily basis and was the greater of the Federal Funds Effective Rate plus 0.5% per annum, the PNC, N.A. prime rate or the Daily LIBOR Rate plus 100 basis points, plus a margin that ranged from 0 to 75 basis points. The Alternate Rate was based on the quoted rates specific to the applicable currency, plus a margin that ranged from 75 to 175 basis points. Both the Base Rate and Alternate Rate margins were dependent on the Company’s consolidated total indebtedness to EBITDA ratios.
33
Schuldschein Loan, Due 2016
In conjunction with the acquisition of Faiveley Transport, Wabtec acquired $137.2 million of a Schuldshein private placement loan which was originally issued by Faiveley Transport on March 5, 2014 in Germany, in which approximately 20 international investors participated. This loan is denominated in euros. Subsequent to the acquisition of Faiveley Transport, the Company repaid $38.5 million of the outstanding Schuldshein loan. The remaining balance of $98.7 million as of December 31, 2016 is divided into three tranches with original maturities of 5, 7 and 10 years bearing fixed or variable rates. A summary of the tranches as of December 31, 2016 are as follows:
Maturity | Rate | Amounts | ||||
March 2019 | Euribor 6 months + 1.30% | $ | 15,831 | |||
March 2019 | 2.32% | 2,630 | ||||
December 2020 | 3.04% | 21,110 | ||||
March 2021 | Euribor 6 months + 1.65% | 23,220 | ||||
March 2021 | 3.07% | 14,770 | ||||
March 2024 | 4.00% | 21,110 | ||||
Total | $ | 98,671 | ||||
The Schuldschein loan is senior unsecured and ranks pari passu with all and future senior debt and senior to all existing and future subordinated indebtedness of Faiveley Transport. The Schuldschein loan agreement contains covenants and undertakings which limit among other things, the following: factoring of receivables, the incurrence of indebtedness, sale of assets, change of control, mergers and consolidations and the incurrence of liens. At December 31, 2016, Faiveley Transport is in compliance with the undertakings and covenants contained in the loan agreement.
In January 2017, the Company notified investors of its intention to repay the variable tranches of the private placement in full totaling $39.1 million on March 6, 2017 and its desire to repay the fixed tranches of the private placement in full. As of February 28, 2017, the Company has repaid $18.7 million of the private placement fixed tranches outstanding at December 31, 2016.
34
Contractual Obligations and Off-Balance Sheet Arrangements
The Company is obligated to make future payments under various contracts such as debt agreements, lease agreements and have certain contingent commitments such as debt guarantees. The Company has grouped these contractual obligations and off-balance sheet arrangements into operating activities, financing activities, and investing activities in the same manner as they are classified in the Statement of Consolidated Cash Flows to provide a better understanding of the nature of the obligations and arrangements and to provide a basis for comparison to historical information. The table below provides a summary of contractual obligations and off-balance sheet arrangements as of December 31, 2016:
Less than | 1 - 3 | 3 - 5 | More than | |||||||||||||||||
In thousands | Total | 1 year | years | years | 5 years | |||||||||||||||
Operating activities: | ||||||||||||||||||||
Purchase obligations (1) | $ | 70,028 | $ | 3,230 | $ | 49,931 | $ | 4,016 | $ | 12,851 | ||||||||||
Operating leases (2) | 138,581 | 26,372 | 41,457 | 29,691 | 41,061 | |||||||||||||||
Pension benefit payments (3) | 158,655 | 14,920 | 29,222 | 31,248 | 83,265 | |||||||||||||||
Postretirement benefit payments (4) | 11,537 | 1,269 | 2,463 | 2,384 | 5,421 | |||||||||||||||
Financing activities: | ||||||||||||||||||||
Interest payments (5) | 374,688 | 47,231 | 91,369 | 91,262 | 144,826 | |||||||||||||||
Long-term debt (6) | 1,892,776 | 129,809 | 274 | 766,206 | 996,487 | |||||||||||||||
Dividends to shareholders (7) | 38,170 | 38,170 | — | — | — | |||||||||||||||
Investing activities: | ||||||||||||||||||||
Capital projects (8) | 110,655 | 110,655 | — | — | — | |||||||||||||||
Other: | ||||||||||||||||||||
Standby letters of credit (9) | 53,915 | 42,996 | 7,179 | 390 | 3,350 | |||||||||||||||
Total | $ | 2,849,005 | $ | 414,652 | $ | 221,895 | $ | 925,197 | $ | 1,287,261 | ||||||||||
(1) | Purchase obligations represent non-cancelable contractual obligations at December 31, 2016. In addition, the Company had $243.2 million of open purchase orders for which the related goods or services had not been received. Although open purchase orders are considered enforceable and legally binding, their terms generally allow us the option to cancel, reschedule and adjust our requirements based on our business needs prior to the delivery of goods or performance of services. |
(2) | Future minimum payments for operating leases are disclosed by year in Note 14 of the “Notes to Consolidated Financial Statements” included in Part IV, Item 15 of this report. |
(3) | Annual payments to participants are expected to continue into the foreseeable future at the amounts or ranges noted. Pension benefit payments are based on actuarial estimates using current assumptions for discount rates, expected return on long-term assets and rate of compensation increases. The Company expects to contribute about $7.1 million to pension plan investments in 2016. See further disclosure in Note 9 of the “Notes to Consolidated Financial Statements” included in Part IV, Item 15 of this report. |
(4) | Annual payments to participants are expected to continue into the foreseeable future at the amounts or ranges noted. Postretirement payments are based on actuarial estimates using current assumptions for discount rates and health care costs. See further disclosure in Note 9 of the “Notes to Consolidated Financial Statements” included in Part IV, Item 15 of this report. |
(5) | Interest payments are payable May and November of each year at 3.45% of $750 million Senior Notes due in 2026. Interest payments are payable February and August of each year at 4.375% of $250 million Senior Notes due in 2023. Interest payments for the Revolving Credit Facility and Capital Leases are based on contractual terms and the Company’s current interest rates. |
(6) | Scheduled principal repayments of outstanding loan balances are disclosed in Note 8 of the “Notes to Consolidated Financial Statements” included in Part IV, Item 15 of this report. |
(7) | Shareholder dividends are subject to approval by the Company’s Board of Directors, currently at an annual rate of approximately $38.2 million. |
(8) | The annual capital expenditure budget is subject to approval by the Board of Directors. The 2016 budget amount was approved at the January 2017 Board of Directors meeting. |
(9) | The $53.9 million of standby letters of credit is comprised of $53.1 million in outstanding letters of credit for performance and bid bond purposes and $0.8 million in interest, which expire in various dates through 2050. Amounts include interest payments based on contractual terms and the Company’s current interest rate. |
35
The above table does not reflect uncertain tax positions of $8.4 million, the timing of which are uncertain except for $3.3 million that may become payable during 2017. Refer to Note 10 of the “Notes to Consolidated Financial Statements” for additional information on uncertain tax positions.
Obligations for operating activities. The Company has entered into $70.0 million of material long-term non-cancelable materials and supply purchase obligations. Operating leases represent multi-year obligations for rental of facilities and equipment. Estimated pension funding and post-retirement benefit payments are based on actuarial estimates using current assumptions for discount rates, expected return on long-term assets, rate of compensation increases and health care cost trend rates. Benefits paid for pension obligations were $13.3 million and $11.7 million in 2016 and 2015, respectively. Benefits paid for post-retirement plans were $0.9 million and $1.6 million in 2016 and in 2015, respectively.
Obligations for financing activities. Cash requirements for financing activities consist primarily of long-term debt repayments, interest payments and dividend payments to shareholders. The Company has historically paid quarterly dividends to shareholders, subject to quarterly approval by our Board of Directors, currently at a rate of approximately $38.2 million annually.
The Company arranges for performance bonds to be issued by third party insurance companies to support certain long term customer contracts. At December 31, 2016 initial value of performance bonds issued on the Company’s behalf is about $210.3 million.
Obligations for investing activities. Including the recent acquisition of Faiveley Transport, the Company expects to spend approximately $100 million to $120 million a year for capital expenditures, primarily related to facility expansion efficiency and modernization, health and safety, and environmental control.
Forward Looking Statements
We believe that all statements other than statements of historical facts included in this report, including certain statements under “Business” and “Management’s Discussion and Analysis of Financial Condition and Results of Operations,” may constitute forward-looking statements. We have based these forward-looking statements on our current expectations and projections about future events. Although we believe that our assumptions made in connection with the forward-looking statements are reasonable, we cannot assure that our assumptions and expectations are correct.
These forward-looking statements are subject to various risks, uncertainties and assumptions about us, including, among other things:
Economic and industry conditions
• | prolonged unfavorable economic and industry conditions in the markets served by us, including North America, South America, Europe, Australia, Asia, and South Africa; |
• | decline in demand for freight cars, locomotives, passenger transit cars, buses and related products and services; |
• | reliance on major original equipment manufacturer customers; |
• | original equipment manufacturers’ program delays; |
• | demand for services in the freight and passenger rail industry; |
• | demand for our products and services; |
• | orders either being delayed, canceled, not returning to historical levels, or reduced or any combination of the foregoing; |
• | consolidations in the rail industry; |
• | continued outsourcing by our customers; |
• | industry demand for faster and more efficient braking equipment; |
• | fluctuations in interest rates and foreign currency exchange rates; or |
• | availability of credit; |
Operating factors
• | supply disruptions; |
• | technical difficulties; |
• | changes in operating conditions and costs; |
• | increases in raw material costs; |
• | successful introduction of new products; |
• | performance under material long-term contracts; |
• | labor relations; |
36
• | the outcome of our existing or any future legal proceedings, including litigation involving our principal customers and any litigation with respect to environmental matters, asbestos-related matters, pension liabilities, warranties, product liabilities or intellectual property claims; |
• | completion and integration of acquisitions, including the acquisition of Faiveley Transport; or |
• | the development and use of new technology; |
Competitive factors
• | the actions of competitors; |
Political/governmental factors
• | political stability in relevant areas of the world; |
• | future regulation/deregulation of our customers and/or the rail industry; |
• | levels of governmental funding on transit projects, including for some of our customers; |
• | political developments and laws and regulations, including those related to Positive Train Control; or |
• | federal and state income tax legislation; and |
Transaction or commercial factors
• | the outcome of negotiations with partners, governments, suppliers, customers or others. |
Statements in this 10-K apply only as of the date on which such statements are made, and we undertake no obligation to update any statement to reflect events or circumstances after the date on which the statement is made or to reflect the occurrence of unanticipated events.
Critical Accounting Estimates
The preparation of the financial statements in accordance with generally accepted accounting principles requires Management to make judgments, estimates and assumptions regarding uncertainties that affect the reported amounts of assets and liabilities, disclosure of contingent assets and liabilities and the reported amounts of revenues and expenses. Areas of uncertainty that require judgments, estimates and assumptions include the accounting for allowance for doubtful accounts, inventories, the testing of goodwill and other intangibles for impairment, warranty reserves, pensions and other postretirement benefits, stock based compensation and tax matters. Management uses historical experience and all available information to make these judgments and estimates, and actual results will inevitably differ from those estimates and assumptions that are used to prepare the Company’s financial statements at any given time. Despite these inherent limitations, Management believes that Management’s Discussion and Analysis of Financial Condition and Results of Operations (MD&A) and the financial statements and related footnotes provide a meaningful and fair perspective of the Company. A discussion of the judgments and uncertainties associated with accounting for derivatives and environmental matters can be found in Notes 2 and 17, respectively, in the “Notes to Consolidated Financial Statements” included in Part IV, Item 15 of this report.
A summary of the Company’s significant accounting policies is included in Note 2 in the “Notes to Consolidated Financial Statements” included in Part IV, Item 15 of this report and is incorporated by reference herein. Management believes that the application of these policies on a consistent basis enables the Company to provide the users of the financial statements with useful and reliable information about the Company’s operating results and financial condition.
Accounts Receivable and Allowance for Doubtful Accounts:
Description The Company provides an allowance for doubtful accounts to cover anticipated losses on uncollectible accounts receivable.
Judgments and Uncertainties The allowance for doubtful accounts receivable reflects our best estimate of probable losses inherent in our receivable portfolio determined on the basis of historical experience, specific allowances for known troubled accounts and other currently available evidence.
Effect if Actual Results Differ From Assumptions If our estimates regarding the collectability of troubled accounts, and/or our actual losses within our receivable portfolio exceed our historical experience, we may be exposed to the expense of increasing our allowance for doubtful accounts.
37
Inventories:
Description Inventories are stated at the lower of cost or market and are reviewed to ensure that an adequate provision is recognized for excess, slow moving and obsolete inventories.
Judgments and Uncertainties Cost is determined under the first-in, first-out (FIFO) method. Inventory costs include material, labor and overhead. The Company compares inventory components to prior year sales history and current backlog and anticipated future requirements. To the extent that inventory parts exceed estimated usage and demand, a reserve is recognized to reduce the carrying value of inventory. Also, specific reserves are established for known inventory obsolescence.
Effect if Actual Results Differ From Assumptions If the market value of our products were to decrease due to changing market conditions, the Company could be at risk of incurring write-downs to adjust inventory value to a market value lower than stated cost. If our estimates regarding sales and backlog requirements are inaccurate, we may be exposed to the expense of increasing our reserves for slow moving and obsolete inventory.
Goodwill and Indefinite-Lived Intangibles:
Description Goodwill and indefinite-lived intangibles are required to be tested for impairment at least annually. The Company performs its annual impairment test during the fourth quarter and more frequently when indicators of impairment are present. The Company reviews goodwill for impairment at the reporting unit level. The evaluation of impairment involves comparing the current fair value of the business to the recorded value (including goodwill).
Judgments and Uncertainties A number of significant assumptions and estimates are involved in the application of the impairment test, including the identification of macroeconomic conditions, industry and market considerations, cost factors, overall financial performance, Wabtec specific events and share price trends and making the assessment on whether each relevant factor will impact the impairment test positively or negatively and the magnitude of any such amount.
Effect if Actual Results Differ From Assumptions Management considers historical experience and all available information at the time the fair values of its reporting units are estimated. However, actual amounts realized may differ from those used to evaluate the impairment of goodwill. If actual results are not consistent with our assumptions and judgments used in estimating future cash flows and asset fair values, we may be exposed to impairment losses that could be material to our results of operations. For example, based on the quantitative analysis performed as of October 1, 2016, a decline in the terminal growth rate greater than 50 basis points would decrease fair market value by $477 million, or an increase in the weighted-average cost of capital by 100 basis points would result in a decrease in fair market value by $1,191 million. Even with such changes the fair value of the reporting units would be greater than their net book values, necessitating no Step 2 calculations. See Note 2 in the “Notes to Consolidated Financial Statements” included in Part IV, Item 15 of this report for additional discussion regarding impairment testing.
Warranty Reserves:
Description The Company provides warranty reserves to cover expected costs from repairing or replacing products with durability, quality or workmanship issues occurring during established warranty periods.
Judgments and Uncertainties In general, reserves are provided for as a percentage of sales, based on historical experience. In addition, specific reserves are established for known warranty issues and their estimable losses.
Effect if Actual Results Differ From Assumptions If actual results are not consistent with the assumptions and judgments used to calculate our warranty liability, the Company may be at risk of realizing material gains or losses.
Accounting for Pensions and Postretirement Benefits:
Description The Company provides pension and postretirement benefits for its employees. These amounts are determined using actuarial methodologies and incorporate significant assumptions, including the rate used to discount the future estimated liability, the long-term rate of return on plan assets and several assumptions relating to the employee workforce (salary increases, medical costs, retirement age and mortality).
38
Judgments and Uncertainties Significant judgments and estimates are used in determining the liabilities and expenses for pensions and other postretirement benefits. The rate used to discount future estimated liabilities is determined considering the rates available at year-end on debt instruments that could be used to settle the obligations of the plan. The long-term rate of return is estimated by considering historical returns and expected returns on current and projected asset allocations and is generally applied to a five-year average market value of assets. The differences between actual and expected asset returns are recognized in expense using the normal amortization of gains and losses per ASC 715.
Effect if Actual Results Differ From Assumptions If assumptions used in determining the pension and other postretirement benefits change significantly, these costs can fluctuate materially from period to period. The key assumptions in determining the pension and other postretirement expense and obligation include the discount rate, expected return on assets and health care cost trend rate. For example, a 1% decrease or increase in the discount rate used in determining the pension and postretirement expense would increase expense $1.8 million or decrease expense $1.4 million, respectively. A 1% decrease or increase in the discount rate used in determining the pension and postretirement obligation would increase the obligation $63.4 million or decrease the obligation $49.8 million, respectively. A 1% decrease or increase in the expected return on assets used in determining the pension expense would increase or decrease expense $2.7 million. If the actual asset values at December 31, 2016 had been 1% lower, the amortization of losses in the following year would decrease $0.2 million. A 1% decrease or increase in the health care cost trend rate used in determining the postretirement expense would increase or decrease the expense less than $0.1 million. A 1% decrease or increase in the health care cost trend rate used in determining the postretirement obligation would increase or decrease the obligation $0.3 million.
Stock-based Compensation:
Description The Company has issued incentive stock units to eligible employees that vest upon attainment of certain cumulative three-year performance goals. The program is structured as a rolling three-year plan; each year starts a new three-year performance cycle with the most recently completed cycle being 2014-2016. No incentive stock units will vest for performance below the three-year cumulative threshold. The Company utilizes an economic profit measure for this performance goal. Economic profit is a measure of the extent to which the Company produces financial results in excess of its cost of capital. Based on the Company’s achievement of the threshold and three-year cumulative performance, the stock units vested can range from 0% to 200% of the shares granted.
Judgments and Uncertainties Significant judgments and estimates are used in determining the estimated three-year performance, which is then used to estimate the total shares expected to vest over the three year vesting cycle and corresponding expense based on the grant date fair value of the award. When determining the estimated three-year performance, the Company utilizes a combination of historical actual results, budgeted results and forecasts. In the initial grant year of a performance cycle, the Company estimates the three-year performance at 100%. As actual performance results for a cycle begin to accumulate and the Company completes its budgeting and forecasting cycles the performance estimates are updated. These judgments and estimates are reviewed and updated on a quarterly basis.
Effect if Actual Results Differ From Assumptions If assumptions used in determining the estimated three-year performance change significantly, stock-based compensation expense related to the unvested incentive stock awards can fluctuate materially from period to period. For example a 10% decrease or increase in the estimated vesting percentage for incentive stock awards would decrease or increase stock-based compensation expense by approximately $0.8 million and $0.8 million, respectively.
Income Taxes:
Description Wabtec records an estimated liability or benefit for income and other taxes based on what it determines will likely be paid in various tax jurisdictions in which it operates in accordance with ASC 740-10 Accounting for Income Taxes and Accounting for Uncertainty in Income Taxes.
Judgments and Uncertainties The estimate of our tax obligations are uncertain because Management must use judgment to estimate the exposures associated with our various filing positions, as well as realization of our deferred tax assets. ASC 740-10 establishes a recognition and measurement threshold to determine the amount of tax benefit that should be recognized related to uncertain tax positions.
Effect if Actual Results Differ From Assumptions Management uses its best judgment in the determination of these amounts. However, the liabilities ultimately realized and paid are dependent on various matters including the resolution of the tax audits in the various affected tax jurisdictions and may differ from the amounts recorded. An adjustment to the estimated liability would be recorded through income in the period in which it becomes probable that the amount of the actual liability differs
39
from the recorded amount. A deferred tax valuation allowance is provided when it is more likely than not that some portion or all of the deferred tax assets will not be realized.
Revenue Recognition:
Description Revenue is recognized in accordance with ASC-605 “Revenue Recognition.” The Company recognizes revenues on long-term contracts based on the percentage of completion method of accounting. The units-of-delivery method or other input-based or output-based measures, as appropriate, are used to measure the progress toward completion of individual contracts. Contract revenues and cost estimates are reviewed and revised at a minimum quarterly and adjustments are reflected in the accounting period as such amounts are determined. Certain pre-production costs relating to long term production and supply contracts have been deferred and will be recognized over the life of the contracts.
Judgments and Uncertainties Revenue is recognized when products have been shipped to the respective customers, title has passed and the price for the product has been determined. Contract accounting involves a judgmental process of estimating the total sales and costs for each contract, which results in the development of estimated profit margin percentages. For each contract with revenue recognized using the percentage of completion method, the amount reported as revenues is determined by calculating cost incurred to date as a percentage of the total expected contract costs to determine the percentage of total contract revenue to be recognized in the current period. Due to the size, duration and nature of many of our contracts, the estimation of total sales and costs through completion is complicated and subject to many variables. Total contract sales estimates are based on negotiated contract prices and quantities, modified by our assumptions regarding contract options, change orders, and price adjustment clauses (such as inflation or index-based clauses). Total contract cost estimates are largely based on negotiated or estimated purchase contract terms, historical performance trends, business base and other economic projections. Factors that influence these estimates include inflationary trends, technical and schedule risk, internal and subcontractor performance trends, business volume assumptions, asset utilization, and anticipated labor agreements. For long-term contracts, revenues and cost estimates are reviewed and revised quarterly at a minimum and adjustments are reflected in the accounting period as such amounts are determined. Pre-production costs are recognized over the expected life of the contract usually based on the Company’s progress toward the estimated number of units expected to be delivered under the production or supply contract.
Effect if Actual Results Differ From Assumptions Should market conditions and customer demands dictate changes to our standard shipping terms, the Company may be impacted by longer than typical revenue recognition cycles. The development of expected contract costs and contract profit margin percentages involves procedures and personnel in all areas that provide financial or production information on the status of contracts. Due to the significance of judgment in the estimation process, it is likely that materially different revenue amounts could be recorded if we used different assumptions or if the underlying circumstances were to change. Changes in underlying assumptions/estimates, supplier performance, or circumstances may adversely or positively affect financial performance in future periods. If the combined profit margin for all contracts recognized on the percentage of completion method during 2016 had been estimated to be higher or lower by 1%, it would have increased or decreased revenue and gross profit for the year by approximately $12.1 million. A few of our contracts are expected to be completed in a loss position. Provisions are made currently for estimated losses on uncompleted contracts. A charge to expense for unrecognized portions of pre-production costs could be realized if the Company’s estimate of the number of units to be delivered changes or the underlying contract is cancelled.
Item 7A. | QUANTITATIVE AND QUALITATIVE DISCLOSURES ABOUT MARKET RISK |
Interest Rate Risk
In the ordinary course of business, Wabtec is exposed to risks that increases in interest rates may adversely affect funding costs associated with its variable-rate debt. The Company’s variable rate debt represents 36% and 42% of total long-term debt at December 31, 2016 and 2015, respectively. On an annual basis a 1% change in the interest rate for variable rate debt at December 31, 2016 would increase or decrease interest expense by about $6.8 million.
To reduce the impact of interest rate changes on a portion of this variable-rate debt, the Company entered into interest rate swap agreements which effectively converted a portion of the debt from a variable to a fixed-rate borrowing during the term of the swap contracts. Refer to “Financial Derivatives and Hedging Activities” in Note 2 of “Notes to Consolidated Financial Statements” included in Part IV, Item 15 of this report for additional information regarding interest rate risk.
Foreign Currency Exchange Risk
The Company is subject to certain risks associated with changes in foreign currency exchange rates to the extent our operations are conducted in currencies other than the U.S. dollar. For the year ended December 31, 2016, approximately 46%
40
of Wabtec’s net sales were in the United States, 11% in the United Kingdom, 7% in Canada, 6% in Mexico, 4% in China, 3% in Australia, 3% in Germany, 2% in Brazil, and 18% in other international locations. (See Note 20 of “Notes in Consolidated Financial Statements” included in Part IV, Item 15 of this report). To reduce the impact of changes in currency exchange rates, the Company has periodically entered into foreign currency forward contracts. Refer to “Financial Derivatives and Hedging Activities” in Note 2 of “Notes to Consolidated Financial Statements” included in Part IV, Item 15 of this report for more information regarding foreign currency exchange risk.
Our market risk exposure is not substantially different from our exposure at December 31, 2015.
Item 8. | FINANCIAL STATEMENTS AND SUPPLEMENTARY DATA |
Financial statements and supplementary data are set forth in Item 15 of Part IV hereof.
Item 9. | CHANGES IN AND DISAGREEMENTS WITH ACCOUNTANTS ON ACCOUNTING AND FINANCIAL DISCLOSURE |
There have been no disagreements with our independent registered public accountants.
Item 9A. | CONTROLS AND PROCEDURES |
Evaluation of Disclosure Controls and Procedures
Wabtec’s principal executive officer and its principal financial officer have evaluated the effectiveness of Wabtec’s “disclosure controls and procedures,” (as defined in Exchange Act Rule 13a-15(e)) as of December 31, 2016. Based upon their evaluation, the principal executive officer and principal financial officer concluded that Wabtec’s disclosure controls and procedures are effective to provide reasonable assurance that information required to be disclosed by Wabtec in the reports filed or submitted by it under the Exchange Act is recorded, processed, summarized and reported within the time periods specified in the SEC’s rules and forms, and to provide reasonable assurance that information required to be disclosed by Wabtec in such reports is accumulated and communicated to Wabtec’s Management, including its principal executive officer and principal finance officer, as appropriate to allow timely decisions regarding required disclosure.
Changes in Internal Control over Financial Reporting
There was no change in Wabtec’s “internal control over financial reporting” (as defined in Rule 13a-15(f) under the Exchange Act) that occurred during the quarter ended December 31, 2016, that has materially affected, or is reasonably likely to materially affect, Wabtec’s internal control over financial reporting. Management’s annual report on internal control over financial reporting and the attestation report of the registered public accounting firm are included in Part IV, Item 15 of this report.
Management’s Report on Internal Control over Financial Reporting
Management’s Report on Internal Control Over Financial Reporting appears on page 48 and is incorporated herein by reference.
Report of Independent Registered Public Accounting Firm on Internal Control over Financial Reporting
Ernst & Young LLP's attestation report on internal control over financial reporting appears on page 51 and is incorporated herein by reference.
Item 9B. | OTHER INFORMATION |
41
None.
42
PART III
Items 10 through 14.
In accordance with the provisions of General Instruction G(3) to Form 10-K, the information required by Item 10 (Directors, Executive Officers and Corporate Governance), Item 11 (Executive Compensation), Item 12 (Security Ownership of Certain Beneficial Owners and Management and Related Stockholder Matters), Item 13 (Certain Relationships and Related Transactions, and Director Independence) and Item 14 (Principal Accounting Fees and Services) is incorporated herein by reference from the Company’s definitive Proxy Statement for its Annual Meeting of Stockholders to be held on May 10, 2017, except for the Equity Compensation Plan Information required by Item 12, which is set forth in the table below. The definitive Proxy Statement will be filed with the Securities and Exchange Commission not later than 120 days after December 31, 2016. Information relating to the executive officers of the Company is set forth in Part I.
Wabtec has adopted a Code of Ethics for Senior Officers which is applicable to our executive officers. As described in Item 1 of this report the Code of Ethics for Senior Officers is posted on our website at www.wabtec.com. In the event that we make any amendments to or waivers from this code, we will disclose the amendment or waiver and the reasons for such on our website.
This table provides aggregate information as of December 31, 2016 concerning equity awards under Wabtec’s compensation plans and arrangements.
(a) Number of securities to be issued upon exercise of outstanding options, | (b) Weighted-average exercise price of outstanding options warrants | (c) Number of securities remaining available for future issuance under equity compensation plans (excluding securities | ||||||||
Plan Category | warrants and rights | and rights | reflected in column (a)) | |||||||
Equity compensation plans approved by shareholders | 1,098,823 | $ | 35.39 | 2,469,849 | ||||||
Equity compensation plans not approved by shareholders | — | — | — | |||||||
Total | 1,098,823 | $ | 35.39 | 2,469,849 | ||||||
43
PART IV
Item 15. | EXHIBITS AND FINANCIAL STATEMENT SCHEDULES |
The financial statements, financial statement schedules and exhibits listed below are filed as part of this annual report:
Page | |||
(1) | Financial Statements and Reports on Internal Control | ||
(2) | Financial Statement Schedules | ||
Filing Method | |||
Exhibits | |||
2.1 | Offer relating to Faiveley Transport, S.A. among Financiere Faiveley S.A., Famille Faiveley Participations, Francois Faiveley, Erwan Faiveley, FW Acquisition, LLC, and Wabtec Corporation dated as of July 27, 2015 | 15 | |
2.2 | Exclusivity Agreement among Financiere Faiveley S.A., Famille Faiveley Participations Francois Faiveley, Erwan Faiveley, FW Acquisition, LLC, and Wabtec Corporation dated as of July 27, 2015 | 15 | |
2.3 | Share Purchase Agreement among Financiere Faiveley S.A., Famille Faiveley Participations Francois Faiveley, Erwan Faiveley, FW Acquisition, LLC and Wabtec Corporation dated as of October 6, 2015 | 16 | |
2.4 | Tender Offer Agreement among Faiveley Transport S.A., FW Acquisition, LLC, and Wabtec Corporation dated as of October 6, 2015 | 16 | |
2.5 | Shareholder's Agreement among Financiere Faiveley S.A., FW Acquisition, LLC, and Wabtec Corporation dated as of October 6, 2015 | 16 | |
2.6 | Amendment No. 1 to Share Purchase Agreement among Mr. Erwan Faiveley, Wabtec France, and Wabtec Corporation dated as of October 24, 2016 | 17 | |
2.7 | Amendment No. 1 to Tender Offer Agreement among Faiveley Transport, S.A., Wabtec France, and Wabtec Corporation dated as of October 24, 2016 | 17 | |
2.8 | Amendment No. 1 to Shareholder’s Agreement among Financiere Faiveley S.A., Famille Faiveley Participations, Francois Faiveley, Erwan Faiveley, and Wabtec Corporation dated as of dated as of October 24, 2016 | 17 | |
3.1 | Restated Certificate of Incorporation of the Company dated January 30, 1995, as amended December 31, 2003 | 9 | |
3.2 | Certificate of Amendment of Restated Certificate of Incorporation dated May 14, 2013 | 11 | |
3.3 | Amended and By-Laws of the Company, effective May 14, 2014 | 8 | |
44
4.1 | Indenture, dated August 8, 2013 by and between the Company and Wells Fargo, National Association, as Trustee | 12 | |
4.2 | First Supplemental Indenture, dated August 8, 2013, by and between the Company and Wells Fargo Bank, National Association, as Trustee | 12 | |
4.3 | Form of 4.375% Senior Note due 2023 (included in Exhibit 4.2) | 12 | |
4.4 | Second Supplemental Indenture, dated November 3, 2016, by and among Westinghouse Air Brake Technologies Corporation, the subsidiary guarantors named therein and Wells Fargo Bank, National Association, as Trustee | 19 | |
4.5 | Third Supplemental Indenture, dated November 3, 2016, by and among Westinghouse Air Brake Technologies Corporation, the subsidiary guarantors named therein and Wells Fargo Bank, National Association, as Trustee. | 19 | |
4.6 | Form of 3.450% Senior Note due 2026 (included in Exhibit 4.5). | 19 | |
4.7 | Registration Rights Agreement, by and among Westinghouse Air Brake Technologies Corporation, the guarantors listed therein and J.P. Morgan Securities LLC, Merrill Lynch, Pierce, Fenner & Smith Incorporated and PNC Capital Markets LLC, as representatives of the several initial purchasers named in the Purchase Agreement (as defined therein). | 19 | |
4.8 | Purchase Agreement, dated October 31, 2016, by and among Westinghouse Air Brake Technologies Corporation, the subsidiary guarantors named therein and J.P. Morgan Securities LLC, Merrill Lynch, Pierce, Fenner & Smith Incorporated and PNC Capital Markets LLC, as representatives of the several initial purchasers named therein. | 18 | |
4.9 | Fourth Supplemental Indenture, dated February 9, 2017, by and among Westinghouse Air Brake Technologies Corporation, the subsidiary guarantors named therein and Wells Fargo Bank, National Association, as Trustee. | 1 | |
10.1 | Agreement of Sale and Purchase of the North American Operations of the Railway Products Group, an operating division of American Standard Inc. (now known as Trane), dated as of 1990 between Rail Acquisition Corp. and American Standard Inc. (only provisions on indemnification are reproduced) | 2 | |
10.2 | Letter Agreement (undated) between the Company and American Standard Inc. (now known as Trane) on environmental costs and sharing | 2 | |
10.3 | Purchase Agreement dated as of June 17, 1992 among the Company, Schuller International, Inc., Manville Corporation and European Overseas Corporation (only provisions on indemnification are reproduced) | 2 | |
10.4 | Westinghouse Air Brake Company 1995 Non-Employee Directors’ Fee and Stock Option Plan, as amended * | 4 | |
10.5 | Westinghouse Air Brake Technologies Corporation 2000 Stock Incentive Plan, as amended * | 4 | |
10.6 | Employment Agreement with Albert J. Neupaver, dated February 1, 2006 * | 3 | |
10.7 | Form of Restricted Stock Agreement * | 10 | |
10.8 | Westinghouse Air Brake Technologies Corporation 2011 Stock Incentive Plan * | 5 | |
10.9 | Stock Purchase Agreement, by and among the Company, Standard Car Truck Company and Robclif, Inc., dated September 12, 2008 | 6 | |
10.10 | First Amended and Restated Refinancing Credit Agreement, dated as of December 19, 2013, by and among the Company, Wabtec Cooperatief UA, certain subsidiaries as the guarantors, the lenders party thereto and, PNC Bank, National Association, as Administrative Agent, PNC Capital Markets LLC, J.P. Morgan Securities, Inc., as Joint Lead Arranges and Joint Book Runners, JP Morgan Chase Bank, N.A. as Syndication Agent, Bank of America, N.A., and Citizens Bank of Pennsylvania, Branch Banking and Trust Company and The Bank of Toyko-Mitsubish UFJ, Ltd., as Co-Documentation Agents | 13 | |
10.11 | Second Amended and Restated Refinancing Credit Agreement, dated as of June 22, 2016, by and among the Company, Wabtec Cooperatief UA, as borrowers, certain subsidiaries of the Company as guarantors and the lenders party thereto and PNC Bank, National Association, as Administrative Agent, PNC Capital Markets LLC, Merrill Lynch, Pierce, Fenner & Smith Inc., JPMorgan Chase Bank, N.A., HSBC Bank, USA, National Association and Société Générale, as Joint Lead Arrangers and Joint Bookrunners, Bank of America, National Association and JPMorgan Chase Bank, N.A., as Co-Syndication Agents, and HSBC Bank USA, National Association and Société Générale, as Co-Documentation Agents. | 14 | |
10.12 | Form of Employment Continuation Agreement entered into by the Company with Albert J. Neupaver, Raymond T. Betler, Charles F. Kovac, R. Mark Cox, David L. DeNinno, Patrick D. Dugan, Scott E. Wahlstrom, Michael E. Fetsko and Timothy R. Wesley* | 7 | |
10.13 | Amended and Restated Employment Agreement with Stephane Rambaud-Measson dated October 24, 2016* | 1 | |
45
10.14 | Amended and Restated Employment Agreement with Guillaume Bouhours dated October 24, 2016* | 1 | |
10.15 | Wabtec Corporation Deferred Compensation Plan for Executive Officers and Directors as adopted December 10, 2009 * | 10 | |
10.16 | Form of Agreement for Nonstatutory Stock Option under the 1995 Non-Employee Directors’ Fee and Stock Option Plan, as amended * | 10 | |
10.17 | Form of Agreement for Nonstatutory Stock Options under 2000 Stock Incentive Plan, as amended * | 10 | |
10.18 | Form of Agreement for Nonstatutory Stock Options under 2011 Stock Incentive Plan as amended * | 10 | |
21.0 | List of subsidiaries of the Company | 1 | |
23.1 | Consent of Ernst & Young LLP | 1 | |
23.2 | Consent of PricewaterhouseCoopers Audit | 1 | |
31.1 | Rule 13a-14(a)/15d-14(a) Certifications | 1 | |
31.2 | Rule 13a-14(a)/15d-14(a) Certifications | 1 | |
32.1 | Section 1350 Certifications | 1 | |
101.INS | XBRL Instance Document. | 1 | |
101.SCH | XBRL Taxonomy Extension Calculation Linkbase Document | 1 | |
101.CAL | XBRL Taxonomy Extension Calculation Linkbase Document | 1 | |
101.DEF | XBRL Taxonomy Extension Definition Linkbase Document. | 1 | |
101.LAB | XBRL Taxonomy Extension Label Linkbase Document | 1 | |
101.PRE | XBRL Taxonomy Extension Presentation Linkbase Document | 1 | |
1 | Filed herewith. | |
2 | Filed as an exhibit to the Company’s Registration Statement on Form S-1 (File No. 33-90866). | |
3 | Filed as an exhibit to the Company’s Quarterly Report on Form 10-Q (File No. 033-90866) for the period ended March 31, 2006. | |
4 | Filed as an Annex to the Company’s Schedule 14A Proxy Statement (File No. 1-13782) filed on April 13, 2006. | |
5 | Filed as an Annex to the Company’s Schedule 14A Proxy Statement (File No. 1-13782) filed on March 31, 2011. | |
6 | Filed as an exhibit to the Company’s Quarterly Report on Form 10-Q (File No. 1-13782) for the period ended September 30, 2008. | |
7 | Filed as an exhibit to the Company’s Current Report on Form 8-K (File No. 1-13782) dated July 2, 2009. | |
8 | Filed as an exhibit to the Company’s Current Report on Form 8-K (File No. 1-13782), dated May 19, 2014. | |
9 | Filed as an exhibit to the Company’s Annual Report on Form 10-K (File No. 1-13782), dated February 25, 2011. | |
10 | Filed as an exhibit to the Company’s Annual Report on Form 10-K (File No. 1-13782), dated February 22, 2013. | |
11 | Filed as an exhibit to the Company’s Current Report on Form 8-K (File No. 1-13782), dated May 15, 2013. | |
12 | Filed as an exhibit to the Company’s Current Report on Form 8-K (File No. 1-13782), dated August 8, 2013. | |
46
13 | Filed as an exhibit to the Company’s Annual Report on Form 10-K (File No. 1-13782), dated February 21, 2014. | |
14 | Filed as an exhibit to the Company's Current Report on Form 8-K (File No. 1-13782), dated June 24, 2016. | |
15 | Filed as an exhibit to the Company's Current Report on Form 8-K (File No. 1-13782), dated July 30, 2015. | |
16 | Filed as an exhibit to the Company's Current Report on Form 8-K (File No. 1-13782), dated October 6, 2015. | |
17 | Filed as an exhibit to the Company's Current Report on Form 8-K (File No. 1-13782), dated October 26, 2016. | |
18 | Filed as an exhibit to the Company's Current Report on Form 8-K (File No. 1-13782), dated November 1, 2016. | |
19 | Filed as an exhibit to the Company's Current Report on Form 8-K (File No. 1-13782), dated November 3, 2016. | |
* | Management contract or compensatory plan. |
47
Item 16. | FORM 10-K SUMMARY |
Not applicable.
48
MANAGEMENT’S REPORTS TO WABTEC SHAREHOLDERS
Management’s Report on Financial Statements and Practices
The accompanying consolidated financial statements of Westinghouse Air Brake Technologies Corporation and subsidiaries (the “Company”) were prepared by Management, which is responsible for their integrity and objectivity. The statements were prepared in accordance with U.S. generally accepted accounting principles and include amounts that are based on Management’s best judgments and estimates. The other financial information included in the 10-K is consistent with that in the financial statements.
Management also recognizes its responsibility for conducting the Company’s affairs according to the highest standards of personal and corporate conduct. This responsibility is characterized and reflected in key policy statements issued from time to time regarding, among other things, conduct of its business activities within the laws of host countries in which the Company operates and potentially conflicting outside business interests of its employees. The Company maintains a systematic program to assess compliance with these policies.
Management’s Report on Internal Control over Financial Reporting
Management is responsible for establishing and maintaining adequate internal control over financial reporting for the Company. In order to evaluate the effectiveness of internal control over financial reporting, as required by Section 404 of the Sarbanes-Oxley Act, Management has conducted an assessment, including testing, using the criteria in Internal Control-Integrated Framework issued by the Committee of Sponsoring Organizations of the Treadway Commission (2013 Framework) (COSO). The Company’s system of internal control over financial reporting is designed to provide reasonable assurance regarding the reliability of financial reporting and the preparation of financial statements for external purposes in accordance with generally accepted accounting standards. Because of its inherent limitations, internal control over financial reporting may not prevent or detect misstatements. Also, projections of any evaluation of effectiveness to future periods are subject to the risk that controls may become inadequate because of changes in conditions, or that the degree of compliance with the policies or procedures may deteriorate.
Management has excluded Workhorse Rail LLC ("Workhorse"), Faiveley Transport, S.A. ("Faiveley"), Precision Turbo & Engine ("Precision Turbo"), Unitrac Railroad Materials ("Unitrac"), and Gerken Group SA ("Gerken") from its assessment of internal controls over financial reporting as of December 31, 2016 because the Company acquired Workhorse effective December 14, 2016, Faiveley effective November 30, 2016, Precision Turbo effective November 17, 2016, Gerken effective August 1, 2016, and Unitrac effective May 5, 2016. Workhorse, Faiveley, Precision Turbo, Gerken, and Unitrac are subsidiaries whose total assets represents 0.8%, 55.7%, 0.2%, 1.2%, and 0.2%, respectively, and whose customer revenues represents 0.1%, 3.8%, 0.1%, 0.5%, and 0.5%, respectively, of the related consolidated financial statement amounts as of and for the year ended December 31, 2016.
Based on its assessment, Management has concluded that the Company maintained effective internal control over financial reporting as of December 31, 2016, based on criteria in Internal Control-Integrated Framework issued by the COSO. The effectiveness of the Company’s internal control over financial reporting as of December 31, 2016, has been audited by Ernst & Young LLP, independent registered public accounting firm, as stated in their report which is included herein.
49
REPORT OF INDEPENDENT REGISTERED PUBLIC ACCOUNTING FIRM
The Board of Directors and Shareholders of Westinghouse Air Brake Technologies Corporation:
We have audited the accompanying consolidated balance sheets of Westinghouse Air Brake Technologies Corporation as of December 31, 2016 and 2015, and the related consolidated statements of income, comprehensive income, shareholders’ equity and cash flows for each of the three years in the period ended December 31, 2016. Our audits also included the financial statement schedule listed in the index at Item 15(a). These financial statements and schedule are the responsibility of the Company’s Management. Our responsibility is to express an opinion on these financial statements and schedule based on our audits. We did not audit the pre-acquisition historical basis consolidated financial statements of Faiveley Transport S.A., a consolidated subsidiary, which statements reflect total assets constituting 25.9% in 2016 and total revenues constituting 3.8% in 2016 of the related consolidated totals of the Company. Those statements were audited by other auditors whose report has been furnished to us. Our opinion, insofar as it relates to the pre-acquisition historical amounts included for Faiveley Transport S.A., is based solely on the report of the other auditors. We audited the adjustments necessary to convert the pre-acquisition historical amounts included for Faiveley Transport S.A. to the basis reflected in the Company’s consolidated financial statements.
We conducted our audits in accordance with the standards of the Public Company Accounting Oversight Board (United States). Those standards require that we plan and perform the audit to obtain reasonable assurance about whether the financial statements are free of material misstatement. An audit includes examining, on a test basis, evidence supporting the amounts and disclosures in the financial statements. An audit also includes assessing the accounting principles used and significant estimates made by management, as well as evaluating the overall financial statement presentation. We believe that our audits and the report of other auditors provide a reasonable basis for our opinion.
In our opinion, based on our audits and the report of other auditors, the financial statements referred to above present fairly, in all material respects, the consolidated financial position of Westinghouse Air Brake Technologies Corporation as of December 31, 2016 and 2015, and the consolidated results of its operations and its cash flows for each of the three years in the period ended December 31, 2016, in conformity with U.S. generally accepted accounting principles. Also, in our opinion, the related financial statement schedule, when considered in relation to the basic financial statements taken as a whole, presents fairly in all material respects the information set forth therein.
We also have audited, in accordance with the standards of the Public Company Accounting Oversight Board (United States), Westinghouse Air Brake Technologies Corporation’s internal control over financial reporting as of December 31, 2016, based on criteria established in Internal Control-Integrated Framework issued by the Committee of Sponsoring Organizations of the Treadway Commission (2013 Framework) and our report dated February 28, 2017, expressed an unqualified opinion thereon.
/s/ ERNST & YOUNG LLP
Pittsburgh, Pennsylvania
February 28, 2017
50
REPORT OF INDEPENDENT REGISTERED PUBLIC ACCOUNTING FIRM
To the Management Board of Faiveley Transport
In our opinion, the consolidated balance sheets and the related consolidated statement of income, comprehensive income, shareholders’ equity and cash flows present fairly, in all material respects, the financial position of Faiveley Transport and its subsidiaries as of December 31, 2016 and November 30, 2016, and the results of their operations and their cash flows for the period from November 30, 2016 to December 31, 2016 (not presented separately herein), in conformity with accounting principles generally accepted in the United States of America. These financial statements are the responsibility of the Company’s management. Our responsibility is to express an opinion on these financial statements based on our audits. We conducted our audits of these financial statements in accordance with the standards of the Public Company Accounting Oversight Board (United States). Those standards require that we plan and perform the audit to obtain reasonable assurance about whether the financial statements are free of material misstatement. An audit includes examining, on a test basis, evidence supporting the amounts and disclosures in the financial statements, assessing the accounting principles used and significant estimates made by management, and evaluating the overall financial statement presentation. We believe that our audits provide a reasonable basis for our opinion. As discussed in Note 3, the company has not applied push down accounting for its acquisition by Wabtec.
PricewaterhouseCoopers Audit
/s/ Philippe Vincent
Partner
Neuilly-sur-Seine, France
February 23, 2017
51
REPORT OF INDEPENDENT REGISTERED PUBLIC ACCOUNTING FIRM ON INTERNAL CONTROL OVER FINANCIAL REPORTING
The Board of Directors and Shareholders of Westinghouse Air Brake Technologies Corporation:
We have audited Westinghouse Air Brake Technologies Corporation’s internal control over financial reporting as of December 31, 2016, based on criteria established in Internal Control-Integrated Framework issued by the Committee of Sponsoring Organizations of the Treadway Commission (2013 Framework) (the COSO criteria). Westinghouse Air Brake Technologies Corporation’s management is responsible for maintaining effective internal control over financial reporting, and for its assessment of the effectiveness of internal control over financial reporting included in the accompanying Management’s Report on Internal Control over Financial Reporting. Our responsibility is to express an opinion on the company’s internal control over financial reporting based on our audit.
We conducted our audit in accordance with the standards of the Public Company Accounting Oversight Board (United States). Those standards require that we plan and perform the audit to obtain reasonable assurance about whether effective internal control over financial reporting was maintained in all material respects. Our audit included obtaining an understanding of internal control over financial reporting, assessing the risk that a material weakness exists, testing and evaluating the design and operating effectiveness of internal control based on the assessed risk, and performing such other procedures as we considered necessary in the circumstances. We believe that our audit provides a reasonable basis for our opinion.
A company’s internal control over financial reporting is a process designed to provide reasonable assurance regarding the reliability of financial reporting and the preparation of financial statements for external purposes in accordance with generally accepted accounting principles. A company’s internal control over financial reporting includes those policies and procedures that (1) pertain to the maintenance of records that, in reasonable detail, accurately and fairly reflect the transactions and dispositions of the assets of the company; (2) provide reasonable assurance that transactions are recorded as necessary to permit preparation of financial statements in accordance with generally accepted accounting principles, and that receipts and expenditures of the company are being made only in accordance with authorizations of management and directors of the company; and (3) provide reasonable assurance regarding prevention or timely detection of unauthorized acquisition, use, or disposition of the company’s assets that could have a material effect on the financial statements.
Because of its inherent limitations, internal control over financial reporting may not prevent or detect misstatements. Also, projections of any evaluation of effectiveness to future periods are subject to the risk that controls may become inadequate because of changes in conditions, or that the degree of compliance with the policies or procedures may deteriorate.
As indicated in the accompanying Management’s Report on Internal Control over Financial Reporting, management’s assessment of and conclusion on the effectiveness of internal control over financial reporting did not include the internal controls of Workhorse Rail LLC ("Workhorse"), Faiveley Transport S.A. ("Faiveley"), Precision Turbo & Engine ("Precision Turbo"), Unitrac Railroad Materials ("Unitrac"), and Gerken Group SA ("Gerken") which are included in the 2016 consolidated financial statements of Westinghouse Air Brake Technologies Corporation and constituted 0.8%, 55.7%, 0.2%, 1.2%, and 0.2%, respectively, of total assets as of December 31, 2016, and 0.1%, 3.8%, 0.1%, 0.5%, and 0.5% respectively, of net sales for the year then ended. Our audit of internal control over financial reporting of Westinghouse Air Brake Technologies Corporation also did not include an evaluation of the internal control over financial reporting of Workhorse, Faiveley, Precision Turbo, Unitrac, and Gerken.
In our opinion, Westinghouse Air Brake Technologies Corporation maintained, in all material respects, effective internal control over financial reporting as of December 31, 2016, based on the COSO criteria.
We also have audited, in accordance with the standards of the Public Company Accounting Oversight Board (United States), the consolidated balance sheets of Westinghouse Air Brake Technologies Corporation as of December 31, 2016 and 2015, and the related consolidated statements of income, comprehensive income, shareholders’ equity, and cash flows for each of the three years in the period ended December 31, 2016, and our report dated February 28, 2017, expressed an unqualified opinion thereon.
/s/ ERNST & YOUNG LLP
Pittsburgh, Pennsylvania
February 28, 2017
52
WESTINGHOUSE AIR BRAKE TECHNOLOGIES CORPORATION
CONSOLIDATED BALANCE SHEETS
December 31, | ||||||||
In thousands, except shares and par value | 2016 | 2015 | ||||||
Assets | ||||||||
Current Assets | ||||||||
Cash and cash equivalents | $ | 398,484 | $ | 226,191 | ||||
Accounts receivable | 667,596 | 494,975 | ||||||
Unbilled accounts receivable | 274,912 | 103,814 | ||||||
Inventories | 658,510 | 478,574 | ||||||
Deposits in escrow | 744,748 | 202,942 | ||||||
Other assets | 123,381 | 33,524 | ||||||
Total current assets | 2,867,631 | 1,540,020 | ||||||
Property, plant and equipment | 912,230 | 717,295 | ||||||
Accumulated depreciation | (393,854 | ) | (364,102 | ) | ||||
Property, plant and equipment, net | 518,376 | 353,193 | ||||||
Other Assets | ||||||||
Goodwill | 2,078,765 | 858,532 | ||||||
Other intangibles, net | 1,053,860 | 440,534 | ||||||
Other noncurrent assets | 62,386 | 37,234 | ||||||
Total other assets | 3,195,011 | 1,336,300 | ||||||
Total Assets | $ | 6,581,018 | $ | 3,229,513 | ||||
Liabilities and Shareholders’ Equity | ||||||||
Current Liabilities | ||||||||
Accounts payable | $ | 530,211 | $ | 319,525 | ||||
Customer deposits | 256,591 | 106,127 | ||||||
Accrued compensation | 145,324 | 69,892 | ||||||
Accrued warranty | 123,190 | 72,678 | ||||||
Current portion of long-term debt | 129,809 | 433 | ||||||
Commitment and contingencies | 344 | 494 | ||||||
Other accrued liabilities | 261,170 | 95,627 | ||||||
Total current liabilities | 1,446,639 | 664,776 | ||||||
Long-term debt | 1,762,967 | 691,805 | ||||||
Accrued postretirement and pension benefits | 110,597 | 55,765 | ||||||
Deferred income taxes | 245,680 | 72,519 | ||||||
Commitment and contingencies | 956 | 943 | ||||||
Accrued warranty | 15,802 | 19,386 | ||||||
Other long-term liabilities | 21,552 | 22,980 | ||||||
Total liabilities | 3,604,193 | 1,528,174 | ||||||
Equity | ||||||||
Preferred stock, 1,000,000 shares authorized, no shares issued | — | — | ||||||
Common stock, $.01 par value; 200,000,000 shares authorized: | ||||||||
132,349,534 shares issued and 95,425,432 and 91,836,106 outstanding | ||||||||
at December 31, 2016 and December 31, 2015, respectively | 1,323 | 1,323 | ||||||
Additional paid-in capital | 869,951 | 469,326 | ||||||
Treasury stock, at cost, 36,924,102 and 40,513,428 shares, at | ||||||||
December 31, 2016 and December 31, 2015, respectively | (838,950 | ) | (775,124 | ) | ||||
Retained earnings | 2,553,258 | 2,280,801 | ||||||
Accumulated other comprehensive loss | (379,605 | ) | (276,719 | ) | ||||
Total Westinghouse Air Brake Technologies Corporation shareholders' equity | 2,205,977 | 1,699,607 | ||||||
Non-controlling interest | 770,848 | 1,732 | ||||||
Total equity | 2,976,825 | 1,701,339 | ||||||
Total Liabilities and Equity | $ | 6,581,018 | $ | 3,229,513 | ||||
The accompanying notes are an integral part of these statements.
53
WESTINGHOUSE AIR BRAKE TECHNOLOGIES CORPORATION
CONSOLIDATED STATEMENTS OF INCOME
Year Ended December 31, | ||||||||||||
2016 | 2015 | 2014 | ||||||||||
In thousands, except per share data | ||||||||||||
Net sales | $ | 2,931,188 | $ | 3,307,998 | $ | 3,044,454 | ||||||
Cost of sales | (2,006,949 | ) | (2,260,182 | ) | (2,108,472 | ) | ||||||
Gross profit | 924,239 | 1,047,816 | 935,982 | |||||||||
Selling, general and administrative expenses | (371,805 | ) | (347,373 | ) | (324,539 | ) | ||||||
Engineering expenses | (71,375 | ) | (71,213 | ) | (61,886 | ) | ||||||
Amortization expense | (22,698 | ) | (21,663 | ) | (22,448 | ) | ||||||
Total operating expenses | (465,878 | ) | (440,249 | ) | (408,873 | ) | ||||||
Income from operations | 458,361 | 607,567 | 527,109 | |||||||||
Other income and expenses | ||||||||||||
Interest expense, net | (42,561 | ) | (16,888 | ) | (17,574 | ) | ||||||
Other (expense) income, net | (2,963 | ) | (5,311 | ) | (1,680 | ) | ||||||
Income from operations before income taxes | 412,837 | 585,368 | 507,855 | |||||||||
Income tax expense | (99,433 | ) | (186,740 | ) | (156,175 | ) | ||||||
Net income | 313,404 | 398,628 | 351,680 | |||||||||
Less: Net income attributable to noncontrolling interest | (8,517 | ) | — | — | ||||||||
Net income attributable to Wabtec shareholders | $ | 304,887 | $ | 398,628 | $ | 351,680 | ||||||
Earnings Per Common Share | ||||||||||||
Basic | ||||||||||||
Net income attributable to Wabtec shareholders | $ | 3.37 | $ | 4.14 | $ | 3.66 | ||||||
Diluted | ||||||||||||
Net income attributable to Wabtec shareholders | $ | 3.34 | $ | 4.10 | $ | 3.62 | ||||||
Weighted average shares outstanding | ||||||||||||
Basic | 90,359 | 96,074 | 95,781 | |||||||||
Diluted | 91,141 | 97,006 | 96,885 | |||||||||
The accompanying notes are an integral part of these statements.
54
WESTINGHOUSE AIR BRAKE TECHNOLOGIES CORPORATION
CONSOLIDATED STATEMENTS OF COMPREHENSIVE INCOME
Year Ended December 31, | ||||||||||||
2016 | 2015 | 2014 | ||||||||||
In thousands, except per share data | ||||||||||||
Net income attributable to Wabtec shareholders | $ | 304,887 | $ | 398,628 | $ | 351,680 | ||||||
Foreign currency translation loss | (93,684 | ) | (132,899 | ) | (111,776 | ) | ||||||
Unrealized gain (loss) on derivative contracts | 305 | (1,202 | ) | (338 | ) | |||||||
Unrealized (loss) gain on pension benefit plans and post-retirement benefit plans | (12,021 | ) | 26,689 | (18,508 | ) | |||||||
Other comprehensive loss before tax | (105,400 | ) | (107,412 | ) | (130,622 | ) | ||||||
Income tax benefit (expense) related to components of | ||||||||||||
other comprehensive loss | 2,514 | (9,821 | ) | 5,992 | ||||||||
Other comprehensive loss, net of tax | (102,886 | ) | (117,233 | ) | (124,630 | ) | ||||||
Comprehensive income attributable to Wabtec shareholders | $ | 202,001 | $ | 281,395 | $ | 227,050 | ||||||
The accompanying notes are an integral part of these statements.
55
WESTINGHOUSE AIR BRAKE TECHNOLOGIES CORPORATION
CONSOLIDATED STATEMENTS OF CASH FLOWS
December 31, | ||||||||||||
2016 | 2015 | 2014 | ||||||||||
In thousands, except per share data | ||||||||||||
Operating Activities | ||||||||||||
Net income | $ | 313,404 | $ | 398,628 | $ | 351,680 | ||||||
Adjustments to reconcile net income to cash provided by operations: | ||||||||||||
Depreciation and amortization | 69,795 | 64,734 | 61,261 | |||||||||
Stock-based compensation expense | 20,813 | 26,019 | 26,134 | |||||||||
Deferred income taxes | (10,228 | ) | 4,981 | (7,054 | ) | |||||||
Loss on disposal of property, plant and equipment | 232 | 587 | 812 | |||||||||
Excess income tax benefits from exercise of stock options | (1,223 | ) | (2,584 | ) | (3,020 | ) | ||||||
Changes in operating assets and liabilities, net of acquisitions | ||||||||||||
Accounts receivable and unbilled accounts receivable | 19,728 | 21,500 | (17,413 | ) | ||||||||
Inventories | 45,340 | 20,147 | (64,089 | ) | ||||||||
Accounts payable | (18,932 | ) | (76,650 | ) | 55,378 | |||||||
Accrued income taxes | (11,759 | ) | 21,740 | 23,763 | ||||||||
Accrued liabilities and customer deposits | (11,338 | ) | (14,837 | ) | 68,729 | |||||||
Other assets and liabilities | 33,475 | (16,005 | ) | (23,796 | ) | |||||||
Net cash provided by operating activities | 449,307 | 448,260 | 472,385 | |||||||||
Investing Activities | ||||||||||||
Purchase of property, plant and equipment | (50,216 | ) | (49,428 | ) | (47,662 | ) | ||||||
Proceeds from disposal of property, plant and equipment | 363 | 1,784 | 421 | |||||||||
Acquisitions of business, net of cash acquired | (183,113 | ) | (129,550 | ) | (300,437 | ) | ||||||
Deposit in escrow | (542,099 | ) | (202,942 | ) | — | |||||||
Net cash used for investing activities | (775,065 | ) | (380,136 | ) | (347,678 | ) | ||||||
Financing Activities | ||||||||||||
Proceeds from debt | 1,875,000 | 787,400 | 563,400 | |||||||||
Payments of debt | (1,102,748 | ) | (612,680 | ) | (493,819 | ) | ||||||
Stock re-purchase | (212,176 | ) | (387,787 | ) | (26,757 | ) | ||||||
Proceeds from exercise of stock options and other benefit plans | 1,983 | 3,097 | 3,337 | |||||||||
Excess income tax benefits from exercise of stock options | 1,223 | 2,584 | 3,020 | |||||||||
Payment of income tax withholding on share-based compensation | (6,658 | ) | (14,565 | ) | — | |||||||
Earn-out settlement | — | — | (4,429 | ) | ||||||||
Cash dividends ($0.36, $0.28 and $0.20 per share for the years | ||||||||||||
ended December 31, 2016, 2015 and 2014) | (32,430 | ) | (26,963 | ) | (19,246 | ) | ||||||
Net cash provided by (used for) financing activities | 524,194 | (248,914 | ) | 25,506 | ||||||||
Effect of changes in currency exchange rates | (26,143 | ) | (18,868 | ) | (10,124 | ) | ||||||
Increase (decrease) in cash | 172,293 | (199,658 | ) | 140,089 | ||||||||
Cash, beginning of year | 226,191 | 425,849 | 285,760 | |||||||||
Cash, end of year | $ | 398,484 | $ | 226,191 | $ | 425,849 | ||||||
The accompanying notes are an integral part of these statements.
56
WESTINGHOUSE AIR BRAKE TECHNOLOGIES CORPORATION
CONSOLIDATED STATEMENTS OF SHAREHOLDERS’ EQUITY
Common Stock | Common Stock | Additional Paid-in | Treasury Stock | Treasury Stock | Retained | Accumulated Other Comprehensive | Non-controlling | |||||||||||||||||||||||||||
In thousands, except share and per share data | Shares | Amount | Capital | Shares | Amount | Earnings | Income (Loss) | Interest | Total | |||||||||||||||||||||||||
Balance, December 31, 2013 | 132,349,534 | $ | 1,323 | $ | 415,059 | (36,439,586 | ) | $ | (372,969 | ) | $ | 1,576,702 | $ | (34,856 | ) | $ | 1,732 | $ | 1,586,991 | |||||||||||||||
Cash dividends ($0.20 dividend per share) | — | — | — | — | — | (19,246 | ) | — | — | (19,246 | ) | |||||||||||||||||||||||
Proceeds from treasury stock issued from the exercise of stock | ||||||||||||||||||||||||||||||||||
options and other benefit plans, net of tax | — | — | 9,997 | 711,247 | 7,464 | — | — | — | 17,461 | |||||||||||||||||||||||||
Stock based compensation | — | — | 23,475 | — | — | — | — | — | 23,475 | |||||||||||||||||||||||||
Net income | — | — | — | — | — | 351,680 | — | — | 351,680 | |||||||||||||||||||||||||
Translation adjustment | — | — | — | — | — | — | (111,776 | ) | — | (111,776 | ) | |||||||||||||||||||||||
Unrealized loss on foreign exchange contracts, net of $31 tax | — | — | — | — | — | — | (23 | ) | — | (23 | ) | |||||||||||||||||||||||
Unrealized loss on interest rate swap contracts, net of $136 tax | — | — | — | — | — | — | (210 | ) | — | (210 | ) | |||||||||||||||||||||||
Change in pension and post-retirement benefit plans, net of $5,887 tax | — | — | — | — | — | — | (12,621 | ) | — | (12,621 | ) | |||||||||||||||||||||||
Stock re-purchase | — | — | — | (346,800 | ) | (26,757 | ) | — | — | — | (26,757 | ) | ||||||||||||||||||||||
Balance, December 31, 2014 | 132,349,534 | 1,323 | 448,531 | (36,075,139 | ) | (392,262 | ) | 1,909,136 | (159,486 | ) | 1,732 | 1,808,974 | ||||||||||||||||||||||
Cash dividends ($0.28 dividend per share) | — | — | — | — | — | (26,963 | ) | — | — | (26,963 | ) | |||||||||||||||||||||||
Proceeds from treasury stock issued from the exercise of stock | ||||||||||||||||||||||||||||||||||
options and other benefit plans, net of tax | — | — | (2,918 | ) | 450,738 | 4,925 | — | — | — | 2,007 | ||||||||||||||||||||||||
Stock based compensation | — | — | 23,713 | — | — | — | — | — | 23,713 | |||||||||||||||||||||||||
Net income | — | — | — | — | — | 398,628 | — | — | 398,628 | |||||||||||||||||||||||||
Translation adjustment | — | — | — | — | — | — | (132,899 | ) | — | (132,899 | ) | |||||||||||||||||||||||
Unrealized loss on foreign exchange contracts, net of $14 tax | — | — | — | — | — | — | (66 | ) | — | (66 | ) | |||||||||||||||||||||||
Unrealized loss on interest rate swap contracts, net of $444 tax | — | — | — | — | — | — | (678 | ) | — | (678 | ) | |||||||||||||||||||||||
Change in pension and post-retirement benefit plans, net of $10,279 tax | — | — | — | — | — | — | 16,410 | — | 16,410 | |||||||||||||||||||||||||
Stock re-purchase | — | — | — | (4,889,027 | ) | (387,787 | ) | — | — | — | (387,787 | ) | ||||||||||||||||||||||
Balance, December 31, 2015 | 132,349,534 | 1,323 | 469,326 | (40,513,428 | ) | (775,124 | ) | 2,280,801 | (276,719 | ) | 1,732 | 1,701,339 | ||||||||||||||||||||||
Cash dividends ($0.36 dividend per share) | — | — | — | — | — | (32,430 | ) | — | — | (32,430 | ) | |||||||||||||||||||||||
Proceeds from treasury stock issued from the exercise of stock | ||||||||||||||||||||||||||||||||||
options and other benefit plans, net of tax | — | — | (8,490 | ) | 328,245 | 5,038 | — | — | — | (3,452 | ) | |||||||||||||||||||||||
Stock based compensation | — | — | 17,748 | — | — | — | — | — | 17,748 | |||||||||||||||||||||||||
Non-controlling interests associated with Faiveley Transport Acquisition | — | — | — | — | — | — | — | 760,599 | 760,599 | |||||||||||||||||||||||||
Net income | — | — | — | — | — | 304,887 | — | 8,517 | 313,404 | |||||||||||||||||||||||||
Translation adjustment | — | — | — | — | — | — | (93,684 | ) | — | (93,684 | ) | |||||||||||||||||||||||
Unrealized loss on foreign exchange contracts, net of $45 tax | — | — | — | — | — | — | (324 | ) | — | (324 | ) | |||||||||||||||||||||||
Unrealized gain on interest rate swap contracts, net of $230 tax | — | — | — | — | — | — | 354 | — | 354 | |||||||||||||||||||||||||
Change in pension and post-retirement benefit plans, net of $2,790 tax | — | — | — | — | — | — | (9,232 | ) | — | (9,232 | ) | |||||||||||||||||||||||
Stock issued for Faiveley Transport Acquisition | — | — | 391,367 | 6,307,489 | 143,312 | — | — | — | 534,679 | |||||||||||||||||||||||||
Stock re-purchase | — | — | — | (3,046,408 | ) | (212,176 | ) | — | — | — | (212,176 | ) | ||||||||||||||||||||||
Balance, December 31, 2016 | 132,349,534 | $ | 1,323 | $ | 869,951 | (36,924,102 | ) | $ | (838,950 | ) | $ | 2,553,258 | $ | (379,605 | ) | $ | 770,848 | $ | 2,976,825 | |||||||||||||||
The accompanying notes are an integral part of these statements
57
NOTES TO CONSOLIDATED FINANCIAL STATEMENTS
1. BUSINESS
Wabtec is one of the world’s largest providers of value-added, technology-based products and services for the global rail industry. Our products are found on virtually all U.S. locomotives, freight cars and passenger transit vehicles, as well as in more than 100 countries throughout the world. Our products enhance safety, improve productivity and reduce maintenance costs for customers, and many of our core products and services are essential in the safe and efficient operation of freight rail and passenger transit vehicles. Wabtec is a global company with operations in 30 countries. In 2016, about 54% of the Company’s revenues came from customers outside the U.S.
2. SUMMARY OF SIGNIFICANT ACCOUNTING POLICIES
Principles of Consolidation The consolidated financial statements include the accounts of the Company and all subsidiaries that it controls. For consolidated subsidiaries in which the Company's ownership is less than 100%, the outside shareholders' interests are shown as noncontrolling interests. These statements have been prepared in accordance with U.S. generally accepted accounting principles. Sales between subsidiaries are billed at prices consistent with sales to third parties and are eliminated in consolidation.
Cash Equivalents Cash equivalents are highly liquid investments purchased with an original maturity of three months or less.
Allowance for Doubtful Accounts The allowance for doubtful accounts receivable reflects our best estimate of probable losses inherent in our receivable portfolio determined on the basis of historical experience, specific allowances for known troubled accounts and other currently available evidence. The allowance for doubtful accounts was $7.3 million and $5.6 million as of December 31, 2016 and 2015, respectively.
Inventories Inventories are stated at the lower of cost or market. Cost is determined under the first-in, first-out (FIFO) method. Inventory costs include material, labor and overhead.
Property, Plant and Equipment Property, plant and equipment additions are stated at cost. Expenditures for renewals and improvements are capitalized. Expenditures for ordinary maintenance and repairs are expensed as incurred. The Company computes book depreciation principally on the straight-line method. Accelerated depreciation methods are utilized for income tax purposes.
Leasing Arrangements The Company conducts a portion of its operations from leased facilities and finances certain equipment purchases through lease agreements. In those cases in which the lease term approximates the useful life of the leased asset or the lease meets certain other prerequisites, the leasing arrangement is classified as a capital lease. The remaining arrangements are treated as operating leases.
Goodwill and Intangible Assets Goodwill and other intangible assets with indefinite lives are not amortized. Other intangibles (with definite lives) are amortized on a straight-line basis over their estimated economic lives. Amortizable intangible assets are reviewed for impairment when indicators of impairment are present. The Company tests goodwill and indefinite-lived intangible assets for impairment at the reporting unit level and at least annually. The Company performs its annual impairment test during the fourth quarter after the annual forecasting process is completed, and also tests for impairment whenever events or changes in circumstances indicate that the carrying value may not be recoverable. Periodically, Management of the Company assesses whether or not an indicator of impairment is present that would necessitate an impairment analysis be performed.
For 2016, the Company opted to proceed directly to the two-step quantitative impairment test for all reporting units with goodwill. In the first step of the quantitative assessment, our assets and liabilities, including existing goodwill and other intangible assets, are assigned to the identified reporting units to determine the carrying value of the reporting units. The income approach and the market approach are weighted at 45% and 55%, respectively, in arriving at fair value, which the Company has applied consistently. The discounted cash flow model requires several assumptions including future sales growth, EBIT (earnings before interest and taxes) margins and capital expenditures for the reporting units. The discounted cash flow model also requires the use of a discount rate and a terminal revenue growth rate (the revenue growth rate for the period beyond the years forecasted by the reporting units), as well as projections of future operating margins. The market approach requires several assumptions including EBITDA (earnings before interest, taxes, depreciation and amortization) multiples for comparable companies that operate in the same markets as the Company’s reporting units. The estimated fair value of all
58
reporting units was substantially in excess of its respective carrying value, which resulted in a conclusion that no impairment existed.
Additionally, the Company proceeded directly to the quantitative impairment test for some trade names with indefinite lives. The fair value of all trade names subject to the quantitative impairment test exceeded its respective carrying value, resulting in a conclusion that no impairment existed. For trade names not subject to the quantitative testing, the Company opted to perform a qualitative trade name impairment assessment and determined from the qualitative assessment that it was not more likely than not that the estimated fair values of the trade names were less than their carrying values; therefore, no further analysis was required. In assessing the qualitative factors to determine whether it is more likely than not that the fair value of a trade name is less than its carrying amount, we assess relevant events and circumstances that may impact the fair value and the carrying amount of the trade name. The identification of relevant events and circumstances and how these may impact a trade name’s fair value or carrying amount involve significant judgments and assumptions. The judgment and assumptions include the identification of macroeconomic conditions, industry and market considerations, cost factors, overall financial performance, Wabtec specific events and share price trends and making the assessment on whether each relevant factor will impact the impairment test positively or negatively and the magnitude of any such impact.
Warranty Costs Warranty costs are accrued based on Management’s estimates of repair or upgrade costs per unit and historical experience. Warranty expense was $28.9 million, $35.4 million and $34.1 million for 2016, 2015 and 2014, respectively. Accrued warranty was $139.0 million and $92.1 million at December 31, 2016 and 2015, respectively.
Income Taxes Income taxes are accounted for under the liability method. Deferred tax assets and liabilities are determined based on differences between financial reporting and tax basis of assets and liabilities and are measured using the enacted tax rates and laws. The provision for income taxes includes federal, state and foreign income taxes.
Stock-Based Compensation The Company recognizes compensation expense for stock-based compensation based on the grant date fair value amortized ratably over the requisite service period following the date of grant.
Financial Derivatives and Hedging Activities The Company has entered into foreign currency forward contracts to reduce the impact of changes in currency exchange rates. Foreign currency forward contracts are agreements with a counterparty to exchange two distinct currencies at a set exchange rate for delivery on a set date at some point in the future. There is no exchange of funds until the delivery date. At the delivery date the Company can either take delivery of the currency or settle on a net basis. For further information regarding the foreign currency forward contracts, see Footnote 17.
To reduce the impact of interest rate changes on a portion of its variable-rate debt, the Company has entered into an interest rate swap agreement with a notional value of $150 million. As of December 31, 2016, the Company has recorded a current liability of $3.9 million and a corresponding offset in accumulated other comprehensive loss of $2.3 million, net of tax, related to these agreements. For further information regarding the interest rate swap agreement, see Footnote 8.
Foreign Currency Translation Assets and liabilities of foreign subsidiaries, except for the Company’s Mexican operations whose functional currency is the U.S. Dollar, are translated at the rate of exchange in effect on the balance sheet date while income and expenses are translated at the average rates of exchange prevailing during the period. Foreign currency gains and losses resulting from transactions, and the translation of financial statements are recorded in the Company’s consolidated financial statements based upon the provisions of Accounting Standards Codification (“ASC”) 830, “Foreign Currency Matters.” The effects of currency exchange rate changes on intercompany transactions and balances of a long-term investment nature are accumulated and carried as a component of accumulated other comprehensive loss. The effects of currency exchange rate changes on intercompany transactions that are denominated in a currency other than an entity’s functional currency are charged or credited to earnings. Foreign exchange transaction losses recognized in other (expense) income, net were $4.0 million, $4.7 million and $2.4 million for 2016, 2015 and 2014, respectively.
Noncontrolling Interests In accordance with ASC 810, the Company has classified noncontrolling interests as equity on our condensed consolidated balance sheets as of December 31, 2016 and 2015. Net income attributable to noncontrolling interests for the year ended December 31, 2016 was $8.5 million. Net income attributable to noncontrolling interests for the years ended December 31, 2015 and 2014 was not material. Other comprehensive income attributable to noncontrolling interests for the years ended December 31, 2016, 2015 and 2014 was not material.
Revenue Recognition Revenue is recognized in accordance with ASC 605 “Revenue Recognition,” The Company recognizes revenue when the following criteria are met: 1) persuasive evidence of an arrangement exists; 2) delivery has occurred; 3) an established sales price has been set with the customer; 4) collection of the sale revenue from the customer is reasonably assured; and 5) no contingencies exist. Delivery is considered to have occurred when the customer assumes the risk
59
and rewards of ownership. The Company estimates and records provisions for quantity rebates and sales returns and allowances as an offset to revenue in the same period the related revenue is recognized, based upon its experience. These items are included as a reduction in deriving net sales.
In general, the Company recognizes revenues on long-term contracts based on the percentage of completion method of accounting. The units-of-delivery method or other input-based or output-based measures, as appropriate, are used to measure the progress toward completion of individual contracts. Contract revenues and cost estimates are reviewed and revised quarterly at a minimum and adjustments are reflected in the accounting period as such amounts are determined. Provisions are made currently for estimated losses on uncompleted contracts. Unbilled accounts receivables were $274.9 million and $103.8 million, customer deposits were $256.6 million and $106.1 million, and provisions for loss contracts were $60.5 million and $11.8 million at December 31, 2016 and 2015, respectively.
Certain pre-production costs relating to long-term production and supply contracts have been deferred and will be recognized over the life of the contracts. Deferred pre-production costs were $29.4 million and $30.3 million at December 31, 2016 and 2015, respectively.
Significant Customers and Concentrations of Credit Risk The Company’s trade receivables are from rail and transit industry original equipment manufacturers, Class I railroads, railroad carriers and commercial companies that utilize rail cars in their operations, such as utility and chemical companies. No one customer accounted for more than 10% of the Company’s consolidated net sales in 2016, 2015 or 2014.
Shipping and Handling Fees and Costs All fees billed to the customer for shipping and handling are classified as a component of net revenues. All costs associated with shipping and handling are classified as a component of cost of sales.
Research and Development Research and development costs are charged to expense as incurred. For the years ended December 31, 2016, 2015 and 2014, the Company incurred costs of approximately $71.4 million, $71.2 million, and $61.9 million, respectively.
Employees As of December 31, 2016, approximately 35% of the Company’s workforce was covered by collective bargaining agreements. These agreements are generally effective from 2017 through 2019. Agreements expiring in 2017 cover approximately 20% of the Company’s workforce.
Earnings Per Share Basic and diluted earnings per common share is computed in accordance with ASC 260 “Earnings Per Share.” Unvested share-based payment awards that contain nonforfeitable rights to dividends or dividend equivalents (whether paid or unpaid) are participating securities and included in the computation of earnings per share pursuant to the two-class method included in ASC 260-10-55. (See Note 11 “Earnings Per Share” included herein)
Reclassifications Certain prior year amounts have been reclassified, where necessary, to conform to the current year presentation. Refer to Recently Adopted Accounting Pronouncements below.
Use of Estimates The preparation of financial statements in conformity with generally accepted accounting principles in the United States requires the Company to make estimates and assumptions that affect the reported amounts of assets and liabilities at the date of the financial statements and reported amounts of revenues and expenses during the reporting period. Actual amounts could differ from the estimates. On an ongoing basis, Management reviews its estimates based on currently available information. Changes in facts and circumstances may result in revised estimates.
Recently Issued Accounting Pronouncements In November 2016, the FASB issued Accounting Standards Update ("ASU") No. 2016-18 "Statement of Cash Flows (Topic 230): Restricted Cash". The amendments in this update require a statement of cash flows explain the change during the period in total cash, cash equivalents, and amounts generally described as restricted cash or restricted cash equivalents. Amounts generally described as restricted cash and restricted cash equivalents should be included with cash and cash equivalents when reconciling the beginning-of-period and end-of-period total amounts shown on the statement of cash flows. The ASU is effective for public companies in the fiscal years beginning after December 15, 2017, and interim periods within those fiscal years. Early adoption is permitted. The Company is currently evaluating the potential impact of adopting this guidance on its consolidated financial statements.
In March 2016, the FASB issued ASU No. 2016-09, “Compensation - Stock Compensation (Topic 718): Improvements to Employee Share-Based Payment Accounting”. The ASU simplifies several aspects for the accounting for share-based payment transactions, including the income tax consequences, classification of awards as either equity or liabilities, and classification on the statement of cash flows. The ASU is effective for public companies in the fiscal years beginning after
60
December 15, 2016, and interim periods within those fiscal years. Early adoption is permitted. In accordance with this update, the Company will recognize all excess tax benefits and tax deficiencies from share-based payment awards as income tax expense or benefit in the income statement (currently excess tax benefits are recognized in additional paid-in capital on the consolidated balance sheet). Additionally, upon adoption of this update the Company will classify excess income tax benefits from exercise of stock options as an operating activity on the consolidated statement of cash flows (currently income tax benefits from the exercise of stock options are classified as a financing activity).
In February 2016, the FASB issued ASU No. 2016-02, "Leases (Topic 814)" which requires lessees to recognize a right of use asset and lease liability on the balance sheet for all leases with terms longer than 12 months. For leases with terms less than 12 months, a lessee is permitted to make an accounting policy election by class of underlying asset not to recognize a right of use asset and lease liability. The ASU is effective for public companies in the fiscal years beginning after December 15, 2018, and interim periods within those fiscal years. The Company is currently evaluating the potential impact of adopting this guidance on its consolidated financial statements.
In May 2014, the FASB issued ASU No. 2014-9, “Revenue from Contract with Customers.” The ASU will supersede most of the existing revenue recognition requirements in U.S. GAAP and will require entities to recognize revenue at an amount that reflects the consideration to which the Company expects to be entitled in exchange for transferring goods or services to a customer. The new standard also requires significantly expanded disclosures regarding the qualitative and quantitative information of an entity’s nature, amount, timing and uncertainty of revenue and cash flows arising from contracts with customers. The Board voted to propose that the standard would take effect for reporting periods beginning after December 15, 2017 and that early adoption would be allowed as of the original effective date. The impact of adopting the new standard on 2016 and 2015 net sales and operating income is not expected to be material. The Company also does not expect a material impact to the consolidated balance sheet. The impact to results is not anticipated to be material because the analysis of the Company's current contracts under the new revenue recognition standard supports the recognition of revenue over time under the cost-to-cost method for the majority of our contracts, which is consistent with our current revenue recognition model. The Company plans to adopt this accounting standard update using the modified retrospective method, with the cumulative effect of initially applying this update recognized in the first reporting period of 2018. The Company is in the process of drafting an updated accounting policy, evaluating new disclosure requirements and identifying and implementing appropriate changes to its business processes, systems and controls to support recognition and disclosure under the new guidance.
Recently Adopted Accounting Pronouncements In November 2015, the FASB issued ASU No. 2015-17, "Income Taxes (Topic 740): Balance Sheet Classification of Deferred Taxes" which simplifies the presentation of deferred income taxes by requiring deferred tax assets and liabilities to be classified as noncurrent on the balance sheet. The Company elected to early adopt this ASU as of December 31, 2016; therefore, all deferred income tax assets and liabilities are classified in the noncurrent deferred income taxes line-items on the consolidated balance sheet. Additionally, the Company elected to update the December 31, 2015 balance sheet for comparative purposes. As a result, $71.7 million of current deferred income tax assets (previously reported in current deferred income taxes) and $0.8 million of current deferred income tax liabilities (previously reported in other accrued liabilities) were reclassified to the other noncurrent assets and noncurrent deferred tax line items, respectively, on the December 31, 2015 consolidated balance sheet.
In September 2015, the FASB issued ASU No. 2015-16, "Business Combinations (Topic 805): Simplifying the Accounting for Measurement-Period Adjustments" which require an acquirer to recognize adjustments to provisional amounts that are identified during the measurement period in the reporting period in which the adjustment amounts are determined. The effect on earnings of changes in depreciation, amortization or other income effects as a result of the change to the provisional amounts are to be recorded in the same period's financial statements and calculated as if the accounting had been completed at the acquisition date. The Company adopted this ASU on January 1, 2016. The adoption of this ASU did not have a material impact on the consolidated financial statements.
In April 2015, the FASB issued ASU No. 2015-3, “Simplifying the Presentation of Debt Issuance Costs” (“ASU 2015-3”) which changes the presentation of debt issuance costs in financial statements to present such costs as a direct deduction from the related debt liability rather than as an asset. ASU 2015-3 became effective for public companies during interim and annual reporting periods beginning after December 15, 2015. The Company retrospectively adopted this ASU on January 1, 2016. The adoption of this ASU did not have a material impact on the consolidated financial statements.
61
3. ACQUISITIONS
Faiveley Transport
On July 27, 2015, the Company announced plans to acquire all of the issued and outstanding shares of Faiveley Transport S.A. ("Faiveley Transport") under the terms of a Share Purchase Agreement (the "Share Purchase Agreement") and a Tender Offer Agreement (the "Tender Offer Agreement"). On October 24, 2016, the Company entered into amendments to the Share Purchase Agreement and the Tender Offer Agreement. Faiveley Transport is a leading global provider of value-added, integrated systems and services for the railway industry with annual sales of about $1.2 billion and more than 5,700 employees in 24 countries. Faiveley Transport supplies railway manufacturers, operators and maintenance providers with a range of valued-added, technology-based systems and services in Energy & Comfort (air conditioning, power collectors and converters, and passenger information), Access & Mobility (passenger access systems and platform doors), and Brakes and Safety (braking systems and couplers).
The transaction has been structured in three steps:
• | Wabtec made an irrevocable offer to the owners of approximately 51% of Faiveley Transport's shares for a purchase price of €100 per share, payable between 25% and 45% in cash at the election of those shareholders with the remainder in common stock. |
• | Upon completion of required labor group consultations, on October 6, 2015, the 51% shareholders entered into a definitive share purchase agreement, which was amended on October 24, 2016, and Faiveley Transport entered into the Tender Offer Agreement with Wabtec which was also amended on October 24, 2016. |
• | Upon completing the share purchase under the Share Purchase Agreement, Wabtec commenced a tender offer for the remaining publicly traded Faiveley Transport shares. The public shareholders will have the option to elect to receive €100 per share in cash or Wabtec common stock. The common stock portion of the consideration is subject to a cap on issuance of Faiveley common shares that will be equivalent to the rates of cash and stock elected by the 51% owners. Wabtec intends to delist Faiveley Transport from Euronext after the tender offer if minority interests represent less than 5%. |
On November 30, 2016, the Company acquired majority ownership of Faiveley Transport, after completing the purchase of the Faiveley family’s ownership interest, which represented approximately 51% of outstanding share capital and approximately 49% of the outstanding voting shares of Faiveley Transport. Under the variable interest entity model the Company concluded that it is the primary beneficiary of Faiveley Transport as it possesses the power to direct the activities of Faiveley Transport that most significantly impact its economic performance and it possesses the obligation and right to absorb losses and benefits from Faiveley Transport; therefore, Faiveley Transport was consolidated by Wabtec under the variable interest model at acquisition. Based on the Company’s $84.77 stock price on November 30, 2016, the aggregate value of consideration paid for the Faiveley Transport family’s ownership interest was $978.1 million, including $534.7 million in stock or approximately 6.3 million shares, $211.8 million in cash, $409.9 million in debt assumed, less $178.3 million in cash acquired. The Company launched a tender offer for the remaining publicly traded Faiveley Transport shares in December 2016. Through the tender offer, the public shareholders of Faiveley Transport will have the option to elect to receive €100 per share of Faiveley Transport in cash or 1.1538 Wabtec common shares per share of Faiveley Transport. On February 3, 2017, the initial cash tender offer was closed which resulted in the Company acquiring an additional 27.5% of outstanding share capital of Faiveley Transport for approximately $411.8 million in cash and $25.2 million in Wabtec stock. The tender offer will be reopened with dates and duration to be determined by the French regulator. The total purchase price for 100% of the shares of Faiveley Transport is approximately $1.7 billion, including assumed debt and net of cash acquired. The approximate $1.0 billion cash portion of the transaction is being funded from cash on hand, the net proceeds from a recent $750 million senior notes offering and the company’s existing revolving credit facility and term note. The $744.7 million included as deposits in escrow on the consolidated balance sheet at December 31, 2016 is cash designated for use as consideration for the tender offer.
The Company’s 2016 operating results include the results from Faiveley Transport following the November 30, 2016 acquisition date. The fair value of the noncontrolling interest was preliminarily determined using the market price of Faiveley Transport’s publicly traded common stock multiplied by the number of publicly traded common shares outstanding at the acquisition date and is considered Level 1. The fair values of the assets acquired and liabilities assumed are preliminarily determined using the income, cost and market approaches. The fair value measurements were primarily based on significant inputs that are not observable in the market and are considered Level 3. The December 31, 2016 consolidated balance sheet includes the assets and liabilities of Faiveley Transport, which have been measured at fair value.
62
The following table summarizes the preliminary estimated fair values of the Faiveley Transport assets acquired and liabilities assumed.
In thousands | ||||
Assets acquired | ||||
Cash and cash equivalents | $ | 178,318 | ||
Accounts receivable | 385,754 | |||
Inventories | 207,151 | |||
Other current assets | 66,152 | |||
Property, plant, and equipment | 161,663 | |||
Goodwill | 1,188,296 | |||
Trade names | 333,823 | |||
Customer Relationships | 255,354 | |||
Patents | 1,201 | |||
Other noncurrent assets | 141,756 | |||
Total assets acquired | 2,919,468 | |||
Liabilities assumed | ||||
Current liabilities | 653,679 | |||
Debt | 409,899 | |||
Other noncurrent liabilities | 349,074 | |||
Total liabilities assumed | 1,412,652 | |||
Noncontrolling interest | 760,343 | |||
Net assets acquired | $ | 1,506,816 | ||
These estimates are preliminary in nature and subject to adjustments, which could be material. Any necessary adjustments will be finalized within one year from the date of acquisition. Substantially all of the accounts receivable acquired are expected to be collectible. Included in current liabilities is $25.9 million of accrued compensation for acquired share-based stock plans that are obligated to be settled in cash. Contingent liabilities assumed as part of the transaction were not material. These contingent liabilities are related to environmental, legal and tax matters. Contingent liabilities are recorded at fair value in purchase accounting, aside from those pertaining to uncertainty in income taxes which are an exception to the fair value basis of accounting.
Goodwill was calculated as the difference between the acquisition date fair value of the consideration transferred and the fair value of the net assets acquired, and represents the future economic benefits, including synergies and assembled workforce, that we expect to achieve as a result of the acquisition. Purchased goodwill is not expected to be deductible for tax purposes. The goodwill has been preliminarily allocated to our Transit segment.
For the 31 day period ended December 31, 2016, the Company’s consolidated statement of income included $110.8 million of revenues and $0.6 million of operating income from Faiveley Transport. Additionally, a net tax benefit of $30.6 million was recognized from Faiveley Transport primarily due to an enacted legislative change in the French corporate tax rate and the benefit from charges related to the repayment of debt acquired from Faiveley Transport. Acquisition related costs were $38.9 million in 2016 and are included in selling, general and administrative expenses on the consolidated statements of income.
Other Acquisitions
The Company made the following acquisitions operating as a business unit or component of a business unit in the Freight Segment:
• | On December 14, 2016, the Company acquired Workhorse Rail LLC ("Workhorse"), a supplier of engineered freight car components, mainly for the aftermarket for a purchase price of approximately $44.3 million, net of |
63
cash acquired, resulting in preliminary goodwill of $23.1 million, 37.8% of which will be deductible for tax purposes.
• | On November 17, 2016, the Company acquired the assets of Precision Turbo & Engine ("Precision Turbo"), a designer and manufacturer of high-performance, aftermarket turbochargers, wastegates, and heat exchangers for the automotive performance market for a purchase price of approximately $13.8 million, net of cash acquired, resulting in preliminary goodwill of $3.9 million, all of which will be deductible for tax purposes. |
• | On May 5, 2016, the Company acquired the assets of Unitrac Railroad Materials ("Unitrac"), a leading designer and manufacturer of railroad products and track work services for a purchase price of approximately $14.4 million, net of cash acquired, resulting in preliminary goodwill of $1.4 million, all of which will be deductible for tax purposes. |
• | On October 30, 2015, the Company acquired Relay Monitoring Systems PTY Ltd. ("RMS"), an Australian based manufacturer of electrical protection and control products for a purchase price of approximately $18.7 million, net of cash acquired, resulting in preliminary goodwill of $8.9 million, none of which will be deductible for tax purposes. |
• | On October 8, 2015, the Company acquired Track IQ, an Australian based manufacturer of wayside sensor systems for the global rail industry for a purchase price of approximately $9.3 million, net of cash acquired, resulting in preliminary goodwill of $6.5 million, all of which will be deductible for tax purposes. |
• | On February 4, 2015, the Company acquired Railroad Controls L.P. ("RCL"), a provider of railway signal construction services, for a purchase price of approximately $78.0 million, net of cash acquired, resulting in goodwill of $14.8 million, all of which will be deductible for tax purposes. |
For the Workhorse, Precision Turbo, and Unitrac acquisitions, the following table summarizes the preliminary estimated fair values of the assets acquired and liabilities assumed at the date of the acquisitions. For the RMS, Track IQ, and RCL acquisitions, the following table summarizes the final fair value of assets acquired and liabilities assumed at the date of acquisition.
Workhorse | Precision Turbo | Unitrac | RMS | Track IQ | RCL | |||||||||||||||||||
December 14, 2016 | November 17, 2016 | May 5, 2016 | October 30, 2015 | October 8, 2015 | February 4, 2015 | |||||||||||||||||||
In thousands | ||||||||||||||||||||||||
Current assets | $ | 9,432 | $ | 4,155 | $ | 12,136 | $ | 3,604 | $ | 660 | $ | 16,421 | ||||||||||||
Property, plant & equipment | — | 1,346 | 1,768 | 1,378 | 121 | 12,136 | ||||||||||||||||||
Goodwill | 23,052 | 3,861 | 1,388 | 8,855 | 6,490 | 14,787 | ||||||||||||||||||
Other intangible assets | 20,900 | 5,200 | 1,230 | 8,622 | 3,246 | 40,403 | ||||||||||||||||||
Total assets acquired | 53,384 | 14,562 | 16,522 | 22,459 | 10,517 | 83,747 | ||||||||||||||||||
Total liabilities assumed | (9,093 | ) | (716 | ) | (2,144 | ) | (3,749 | ) | (1,205 | ) | (5,736 | ) | ||||||||||||
Net assets acquired | $ | 44,291 | $ | 13,846 | $ | 14,378 | $ | 18,710 | $ | 9,312 | $ | 78,011 | ||||||||||||
The Company made the following acquisitions operating as a business unit or component of a business unit in the Transit Segment:
• | On August 1, 2016, the Company acquired Gerken Group S.A. ("Gerken"), a manufacturer of specialty carbon and graphite products for rail and other industrial applications, for a purchase price of approximately $62.8 million, net of cash acquired, resulting in preliminary goodwill of $17.5 million, none of which will be deductible for tax purposes. |
• | On June 17, 2015, the Company acquired Metalocaucho ("MTC"), a manufacturer of transit products, primarily rubber components for suspension and vibration control systems, for a purchase price of approximately $23.4 million, net of cash acquired, resulting in preliminary goodwill of $13.2 million, none of which will be deductible for tax purposes. |
64
For the Gerken acquisition, the following table summarizes the preliminary estimated fair value of the assets acquired and liabilities assumed at the date of acquisition. For the MTC acquisition, the following table summarizes the final fair value of the assets acquired and liabilities assumed at the date of the acquisition.
Gerken | MTC | |||||||
August 1, 2016 | June 17, 2015 | |||||||
In thousands | ||||||||
Current assets | $ | 32,706 | $ | 10,348 | ||||
Property, plant & equipment | 7,667 | 1,450 | ||||||
Goodwill | 17,470 | 13,198 | ||||||
Other intangible assets | 30,560 | 7,650 | ||||||
Other assets | 1,706 | 114 | ||||||
Total assets acquired | 90,109 | 32,760 | ||||||
Total liabilities assumed | (27,262 | ) | (9,400 | ) | ||||
Net assets acquired | $ | 62,847 | $ | 23,360 | ||||
The acquisitions listed above include escrow deposits of $42.0 million, which may be released to the Company for indemnity and other claims in accordance with the purchase and escrow agreements.
The total goodwill and other intangible assets for acquisitions listed in the tables above was $1,985.6 million, of which $1,277.4 million and $708.2 million was related to goodwill and other intangible assets, respectively. Of the allocation of $708.2 million of acquired intangible assets, $345.1 million was assigned to customer relationships, $353.1 million was assigned to trade names, $5.0 million was assigned to intellectual property, $2.0 million was assigned to non-compete agreements and $1.8 million was assigned to customer backlog. The trade names are considered to have an indefinite useful life while the intellectual property and customer relationships’ useful life is 20 years and the non-compete agreements' useful life is five years.
The following unaudited pro forma financial information presents income statement results as if the acquisitions listed above had occurred January 1, 2015:
For the year ended December 31, | ||||||||
In thousands | 2016 | 2015 | ||||||
Net sales | $ | 4,091,246 | $ | 4,638,466 | ||||
Gross profit | 1,238,206 | 1,405,746 | ||||||
Net income attributable to Wabtec shareholders | 368,929 | 453,944 | ||||||
Diluted earnings per share | ||||||||
As Reported | $ | 3.34 | $ | 4.10 | ||||
Pro forma | $ | 4.04 | $ | 4.67 | ||||
The historical consolidated financial information of the Company and the acquisitions detailed above have been adjusted in the pro forma information to give effect to pro forma events that are (1) directly attributable to the transactions, (2) factually supportable and (3) expected to have a continuing impact on the combined results. Pro forma data may not be indicative of the results that would have been obtained had these acquisitions occurred at the beginning of the periods presented, nor is it intended to be a projection of future results.
65
4. SUPPLEMENTAL CASH FLOW DISCLOSURES
Year Ended December 31, | ||||||||||||
2016 | 2015 | 2014 | ||||||||||
In thousands | ||||||||||||
Interest paid during the year | $ | 30,211 | $ | 19,372 | $ | 18,445 | ||||||
Income taxes paid during the year, net of amount refunded | $ | 121,563 | $ | 147,958 | $ | 125,212 | ||||||
Business acquisitions: | ||||||||||||
Fair value of assets acquired | 3,118,420 | 156,020 | 454,596 | |||||||||
Liabilities assumed | 1,453,382 | 20,789 | 124,005 | |||||||||
Non-controlling interest assumed | 760,343 | — | — | |||||||||
Stock and cash paid | 904,695 | 135,231 | 330,591 | |||||||||
Less: Cash acquired | 186,903 | 5,681 | 30,154 | |||||||||
Stock used for acquisition | 534,679 | — | — | |||||||||
Net cash paid | $ | 183,113 | $ | 129,550 | $ | 300,437 | ||||||
On November 9, 2015, the Board of Directors amended its stock repurchase authorization to $350 million of the Company’s outstanding shares. Through December 31, 2015, purchases totaled $316.7 million leaving $33.3 million under the authorization.
On February 9, 2016 the Board of Directors amended its stock repurchase authorization to $350 million of the Company's outstanding shares. Through December 31, 2016, purchases totaled $212.2 million leaving $137.8 million under the authorization. This new stock repurchase authorization supersedes the previous authorization of $350 million of which $33.3 million remained.
The Company intends to purchase shares on the open market or in negotiated or block trades. No time limit was set for the completion of the programs which conform to the requirements under the 2016 Refinancing Credit Agreement, as well as the Notes currently outstanding.
During the first quarter of 2016, the Company repurchased 1,950,000 shares at an average price of $68.58 per share. There were no repurchases in the second quarter of 2016. During the third quarter of 2016, the Company repurchased 1,096,408 shares at an average price of $71.54 per share. There were no repurchases in the fourth quarter of 2016. All purchases were on the open market.
During the first and second quarters of 2015, no shares were repurchased. During the third quarter of 2015, the Company repurchased 237,027 shares at an average price of $94.23 per share. During the fourth quarter of 2015, 4,652,000 shares were repurchased at an average price of $78.56. All purchases were on the open market.
5. INVENTORIES
The components of inventory, net of reserves, were:
December 31, | ||||||||
In thousands | 2016 | 2015 | ||||||
Raw materials | $ | 331,465 | $ | 218,247 | ||||
Work-in-progress | 145,462 | 131,719 | ||||||
Finished goods | 181,583 | 128,608 | ||||||
Total inventories | $ | 658,510 | $ | 478,574 | ||||
66
6. PROPERTY, PLANT & EQUIPMENT
The major classes of depreciable assets are as follows:
December 31, | ||||||||
In thousands | 2016 | 2015 | ||||||
Machinery and equipment | $ | 645,354 | $ | 504,956 | ||||
Buildings and improvements | 225,307 | 170,668 | ||||||
Land and improvements | 41,569 | 41,671 | ||||||
PP&E | 912,230 | 717,295 | ||||||
Less: accumulated depreciation | (393,854 | ) | (364,102 | ) | ||||
Total | $ | 518,376 | $ | 353,193 | ||||
The estimated useful lives of property, plant and equipment are as follows:
Years | |
Land improvements | 10 to 20 |
Building and improvements | 20 to 40 |
Machinery and equipment | 3 to 15 |
Depreciation expense was $47.1 million, $43.1 million, and $38.8 million for 2016, 2015 and 2014, respectively.
7. INTANGIBLES
Goodwill and other intangible assets with indefinite lives are not amortized. Other intangibles with definite lives are amortized on a straight-line basis over their estimated economic lives. Goodwill and indefinite lived intangible assets are reviewed annually during the fourth quarter for impairment (See Note 2 “Summary of Significant Accounting Policies” included herein). Goodwill and indefinite live intangible assets were not impaired at December 31, 2016 and 2015.
The change in the carrying amount of goodwill by segment for the year ended December 31, 2016 is as follows:
Freight | Transit | |||||||||||
In thousands | Segment | Segment | Total | |||||||||
Balance at December 31, 2015 | $ | 531,965 | $ | 326,567 | $ | 858,532 | ||||||
Adjustment to preliminary purchase allocation | 1,186 | 755 | 1,941 | |||||||||
Acquisitions | 30,262 | 1,212,354 | 1,242,616 | |||||||||
Foreign currency impact | (12,511 | ) | (11,813 | ) | (24,324 | ) | ||||||
Balance at December 31, 2016 | $ | 550,902 | $ | 1,527,863 | $ | 2,078,765 | ||||||
As of December 31, 2016 and 2015, the Company’s trade names had a net carrying amount of $510.5 million and $167.4 million, respectively, and the Company believes these intangibles have indefinite lives. Intangible assets of the Company, other than goodwill and trade names, consist of the following:
December 31, | ||||||||
In thousands | 2016 | 2015 | ||||||
Patents, non-compete and other intangibles, net of accumulated | ||||||||
amortization of $42,538 and $40,936 | $ | 15,360 | $ | 11,403 | ||||
Customer relationships, net of accumulated amortization | ||||||||
of $87,334 and $70,493 | 528,068 | 261,751 | ||||||
Total | $ | 543,428 | $ | 273,154 | ||||
The remaining weighted average useful lives of patents, customer relationships and intellectual property were 10 years, 16 years and 16 years respectively. Amortization expense for intangible assets was $22.7 million, $21.7 million, and $22.4 million for the years ended December 31, 2016, 2015, and 2014, respectively.
67
Estimated amortization expense for the five succeeding years is as follows (in thousands):
2017 | $ | 34,613 | |
2018 | 33,582 | ||
2019 | 32,549 | ||
2020 | 31,028 | ||
2021 | 30,774 | ||
8. LONG-TERM DEBT
Long-term debt consisted of the following:
December 31, | ||||||||
In thousands | 2016 | 2015 | ||||||
3.45% Senior Notes, due 2026, net of unamortized debt issuance costs of $2,526 and $0 | $ | 747,474 | $ | — | ||||
4.375% Senior Notes, due 2023, net of unamortized discount and debt issuance costs of $1,690 and $1,947 | 248,310 | 248,053 | ||||||
Revolving Credit Facility and Term Loan, net of unamortized debt issuance costs of $3,850 and $1,542 | 796,150 | 443,458 | ||||||
Schuldschein Loan | 98,671 | — | ||||||
Other Borrowings | 1,153 | — | ||||||
Capital Leases | 1,018 | 727 | ||||||
Total | 1,892,776 | 692,238 | ||||||
Less - current portion | 129,809 | 433 | ||||||
Long-term portion | $ | 1,762,967 | $ | 691,805 | ||||
Wabtec's acquisition of the controlling stake of Faiveley Transport triggered the early repayment of a syndicated loan and the mandatory offer to investors to repay the US and Schuldschein private placements. Both the syndicated loan and US private placements were repaid in full in December 2016.
3.45% Senior Notes Due November 2026
In October 2016, the Company issued $750.0 million of Senior Notes due in 2026 (the “2016 Notes”). The 2016 Notes were issued at 99.965% of face value. Interest on the 2016 Notes accrues at a rate of 3.45% per annum and is payable semi-annually on May 15 and November 15 of each year. The proceeds were used to finance the cash portion of the Faiveley Transport acquisition, refinance Faiveley Transport’s indebtedness, and for general corporate purposes. The principal balance is due in full at maturity. The Company incurred $2.6 million of deferred financing costs related to the issuance of the 2016 Notes.
The 2016 Notes are senior unsecured obligations of the Company and rank pari passu with all existing and future senior debt and senior to all existing and future subordinated indebtedness of the Company. The indenture under which the 2016 Notes were issued contains covenants and restrictions which limit among other things, the following: the incurrence of indebtedness, payment of dividends and certain distributions, sale of assets, change in control, mergers and consolidations and the incurrence of liens.
The Company is in compliance with the restrictions and covenants in the indenture under which the 2016 Notes were issued and expects that these restrictions and covenants will not be any type of limiting factor in executing our operating activities.
4.375% Senior Notes Due August 2023
In August 2013, the Company issued $250.0 million of Senior Notes due in 2023 (the “2013 Notes”). The 2013 Notes were issued at 99.879% of face value. Interest on the 2013 Notes accrues at a rate of 4.375% per annum and is payable semi-annually on February 15 and August 15 of each year. The proceeds were used to repay debt outstanding under the Company’s existing credit agreement, and for general corporate purposes. The principal balance is due in full at maturity. The Company incurred $2.6 million of deferred financing costs related to the issuance of the 2013 Notes.
The 2013 Notes are senior unsecured obligations of the Company and rank pari passu with all existing and future senior debt and senior to all existing and future subordinated indebtedness of the Company. The indenture under which the 2013 Notes were issued contains covenants and restrictions which limit among other things, the following: the incurrence of indebtedness,
68
payment of dividends and certain distributions, sale of assets, change in control, mergers and consolidations and the incurrence of liens.
The Company is in compliance with the restrictions and covenants in the indenture under which the 2013 Notes were issued and expects that these restrictions and covenants will not be any type of limiting factor in executing our operating activities.
2016 Refinancing Credit Agreement
On June 22, 2016, the Company amended its existing revolving credit facility with a consortium of commercial banks. This “2016 Refinancing Credit Agreement” provides the Company with a $1.2 billion, 5 year revolving credit facility and a $400.0 million delayed draw term loan (the “Term Loan”). The Company incurred approximately $3.3 million of deferred financing cost related to the 2016 Refinancing Credit Agreement. The facility expires on June 22, 2021. The 2016 Refinancing Credit Agreement borrowings bear variable interest rates indexed as described below. At December 31, 2016, the Company had available bank borrowing capacity, net of $20.2 million of letters of credit, of approximately $783.7 million, subject to certain financial covenant restrictions.
The Term Loan was drawn on November 25, 2016. The Company incurred a 10 basis point commitment fee from June 22, 2016 until the initial draw on November 25, 2016.
Under the 2016 Refinancing Credit Agreement, the Company may elect a Base Rate of interest for U.S. Dollar denominated loans or, for certain currencies, an interest rate based on the London Interbank Offered Rate (“LIBOR”) of interest, or other rates appropriate for such currencies (in any case, “the Alternate Rate”). The Base Rate adjusts on a daily basis and is the greater of the Federal Funds Effective Rate plus 0.50% per annum, the PNC, N.A. prime rate or the Daily LIBOR Rate plus 100 basis points, plus a margin that ranges from 0 to 75 basis points. The Alternate Rate is based on the quoted rates specific to the applicable currency, plus a margin that ranges from 75 to 175 basis points. Both the Base Rate and Alternate Rate margins are dependent on the Company’s consolidated total indebtedness to EBITDA ratios. The initial Base Rate margin is 0 basis points and the Alternate Rate margin is 175 basis points.
At December 31, 2016, the weighted average interest rate on the Company’s variable rate debt was 2.51%. On January 12, 2012, the Company entered into a forward starting interest rate swap agreement with a notional value of $150.0 million. The effective date of the interest rate swap agreement is July 31, 2013, and the termination date was November 7, 2016. The impact of the interest rate swap agreement converted a portion of the Company’s outstanding debt from a variable rate to a fixed-rate borrowing. During the term of the interest rate swap agreement the interest rate on the notional value was fixed at 1.415% plus the Alternate Rate margin. On June 5, 2014, the Company entered into a forward starting interest rate swap agreement with a notional value of $150.0 million. The effective date of the interest rate swap agreement is November 7, 2016, and the termination date is December 19, 2018. The impact of the interest rate swap agreement converts a portion of the Company’s outstanding debt from a variable rate to a fixed-rate borrowing. During the term of the interest rate swap agreement the interest rate on the notional value will be fixed at 2.56% plus the Alternate Rate margin. As for these agreements, the Company is exposed to credit risk in the event of nonperformance by the counterparties. However, since only the cash interest payments are exchanged, exposure is significantly less than the notional amount. The counterparties are large financial institutions with excellent credit ratings and history of performance. The Company currently believes the risk of nonperformance is negligible.
The 2016 Refinancing Credit Agreement limits the Company’s ability to declare or pay cash dividends and prohibits the Company from declaring or making other distributions, subject to certain exceptions. The 2016 Refinancing Credit Agreement contains various other covenants and restrictions including the following limitations: incurrence of additional indebtedness; mergers, consolidations, sales of assets and acquisitions; additional liens; sale and leasebacks; permissible investments, loans and advances; certain debt payments; and imposes a minimum interest expense coverage ratio of 3.0 and a maximum debt to EBITDA ratio of 3.25. The Company is in compliance with the restrictions and covenants of the 2016 Refinancing Credit Agreement and does not expect that these measurements will limit the Company in executing our operating activities.
2013 Refinancing Credit Agreement
On December 19, 2013, the Company amended its then existing revolving credit facility with a consortium of commercial banks. This “2013 Refinancing Credit Agreement” provided the Company with an $800.0 million, 5-year revolving credit facility. The Company incurred approximately $1.0 million of deferred financing cost related to the 2013 Refinancing Credit Agreement. The 2013 Refinancing Credit Agreement was replaced by the 2016 Refinancing Credit Agreement.
Under the 2013 Refinancing Credit Agreement, the Company could have elected a Base Rate of interest for U.S. Dollar denominated loans or, for certain currencies, an interest rate based on the LIBOR of interest, or other rates appropriate for such currencies (in any case, “the Alternate Rate”). The Base Rate adjusted on a daily basis and was the greater of the Federal Funds
69
Effective Rate plus 0.5% per annum, the PNC, N.A. prime rate or the Daily LIBOR Rate plus 100 basis points, plus a margin that ranged from 0 to 75 basis points. The Alternate Rate was based on the quoted rates specific to the applicable currency, plus a margin that ranged from 75 to 175 basis points. Both the Base Rate and Alternate Rate margins were dependent on the Company’s consolidated total indebtedness to EBITDA ratios.
Schuldschein Loan, Due 2016
In conjunction with the acquisition of Faiveley Transport, Wabtec acquired $137.2 million of a Schuldshein private placement loan which was originally issued by Faiveley Transport on March 5, 2014 in Germany, in which approximately 20 international investors participated. This loan is denominated in euros. Subsequent to the acquisition of Faiveley Transport, the Company repaid $38.5 million of the outstanding Schuldshein loan. The remaining balance of $98.7 million as of December 31, 2016 is divided into three tranches with original maturities of 5, 7 and 10 years bearing fixed or variable rates. A summary of the tranches as of December 31, 2016 are as follows:
Maturity | Rate | Amounts | ||||
March 2019 | Euribor 6 months + 1.30% | $ | 15,831 | |||
March 2019 | 2.32% | 2,630 | ||||
December 2020 | 3.04% | 21,110 | ||||
March 2021 | Euribor 6 months + 1.65% | 23,220 | ||||
March 2021 | 3.07% | 14,770 | ||||
March 2024 | 4.00% | 21,110 | ||||
Total | $ | 98,671 | ||||
The Schuldschein loan is senior unsecured and ranks pari passu with all and future senior debt and senior to all existing and future subordinated indebtedness of Faiveley Transport. The Schuldschein loan agreement contains covenants and undertakings which limit among other things, the following: factoring of receivables, the incurrence of indebtedness, sale of assets, change of control, mergers and consolidations and the incurrence of liens. At December 31, 2016, Faiveley Transport is in compliance with the undertakings and covenants contained in the loan agreement.
In January 2017, the Company notified investors of its intention to repay the variable tranches of the private placement in full totaling $39.1 million on March 6, 2017 and its desire to repay the fixed tranches of the private placement in full. As of February 28, 2017, the Company has repaid $18.7 million of the private placement fixed tranches outstanding at December 31, 2016.
Debt and Capital Leases
Scheduled principal repayments of debt and capital lease balances as of December 31, 2016 are as follows: | |||
2017 | $ | 129,809 | |
2018 | 179 | ||
2019 | 95 | ||
2020 | 41 | ||
2021 | 766,165 | ||
Future years | 996,487 | ||
Total | $ | 1,892,776 | |
70
9. EMPLOYEE BENEFIT PLANS
Defined Benefit Pension Plans
The Company sponsors defined benefit pension plans that cover certain U.S., Canadian, German, and United Kingdom employees and which provide benefits of stated amounts for each year of service of the employee. The Company uses a December 31 measurement date for the plans.
The following tables provide information regarding the Company’s defined benefit pension plans summarized by U.S. and international components.
Obligations and Funded Status
U.S. | International | |||||||||||||||
In thousands | 2016 | 2015 | 2016 | 2015 | ||||||||||||
Change in projected benefit obligation | ||||||||||||||||
Obligation at beginning of year | $ | (46,120 | ) | $ | (50,154 | ) | $ | (195,311 | ) | $ | (219,225 | ) | ||||
Service cost | (337 | ) | (381 | ) | (1,379 | ) | (2,015 | ) | ||||||||
Interest cost | (1,475 | ) | (1,914 | ) | (5,774 | ) | (7,091 | ) | ||||||||
Employee contributions | — | — | (195 | ) | (503 | ) | ||||||||||
Plan curtailments and amendments | — | — | 2,061 | — | ||||||||||||
Benefits paid | 3,893 | 3,628 | 9,427 | 8,028 | ||||||||||||
Acquisition | — | — | (114,242 | ) | — | |||||||||||
Actuarial gain (loss) | (1,473 | ) | 2,701 | (33,330 | ) | 3,084 | ||||||||||
Effect of currency rate changes | — | — | 19,192 | 22,411 | ||||||||||||
Obligation at end of year | $ | (45,512 | ) | $ | (46,120 | ) | $ | (319,551 | ) | $ | (195,311 | ) | ||||
Change in plan assets | ||||||||||||||||
Fair value of plan assets at beginning of year | $ | 37,640 | $ | 41,503 | $ | 168,069 | $ | 182,254 | ||||||||
Actual return on plan assets | 2,055 | (235 | ) | 20,066 | 6,572 | |||||||||||
Employer contributions | — | — | 6,933 | 6,746 | ||||||||||||
Employee contributions | — | — | 195 | 503 | ||||||||||||
Benefits paid | (3,893 | ) | (3,628 | ) | (9,427 | ) | (8,028 | ) | ||||||||
Acquisition | — | — | 70,519 | — | ||||||||||||
Effect of currency rate changes | — | — | (15,072 | ) | (19,978 | ) | ||||||||||
Fair value of plan assets at end of year | $ | 35,802 | $ | 37,640 | $ | 241,283 | $ | 168,069 | ||||||||
Funded status | ||||||||||||||||
Fair value of plan assets | $ | 35,802 | $ | 37,640 | $ | 241,283 | $ | 168,069 | ||||||||
Benefit obligations | (45,512 | ) | (46,120 | ) | (319,551 | ) | (195,311 | ) | ||||||||
Funded status | $ | (9,710 | ) | $ | (8,480 | ) | $ | (78,268 | ) | $ | (27,242 | ) | ||||
Amounts recognized in the statement of financial position consist of: | ||||||||||||||||
Noncurrent assets | $ | — | $ | — | $ | 7,130 | $ | 5,554 | ||||||||
Current liabilities | — | — | (2,042 | ) | (362 | ) | ||||||||||
Noncurrent liabilities | (9,709 | ) | (8,480 | ) | (83,356 | ) | (32,434 | ) | ||||||||
Net amount recognized | $ | (9,709 | ) | $ | (8,480 | ) | $ | (78,268 | ) | $ | (27,242 | ) | ||||
Amounts recognized in accumulated other comprehensive income (loss) consist of: | ||||||||||||||||
Initial net obligation | $ | — | $ | — | $ | — | $ | (275 | ) | |||||||
Prior service cost | (8 | ) | (11 | ) | (56 | ) | (80 | ) | ||||||||
Net actuarial loss | (23,884 | ) | (23,305 | ) | (56,411 | ) | (41,782 | ) | ||||||||
Net amount recognized | $ | (23,892 | ) | $ | (23,316 | ) | $ | (56,467 | ) | $ | (42,137 | ) | ||||
71
The aggregate accumulated benefit obligation for the U.S. pension plans was $44.5 million and $45.2 million as of December 31, 2016 and 2015, respectively. The aggregate accumulated benefit obligation for the international pension plans was $312.2 million and $190.2 million as of December 31, 2016 and 2015, respectively.
U.S. | International | |||||||||||||||
In thousands | 2016 | 2015 | 2016 | 2015 | ||||||||||||
Information for pension plans with accumulated benefit obligations in | ||||||||||||||||
excess of Plan assets: | ||||||||||||||||
Projected benefit obligation | $ | (45,512 | ) | $ | (46,120 | ) | $ | (255,682 | ) | $ | (195,311 | ) | ||||
Accumulated benefit obligation | (44,530 | ) | (45,201 | ) | (249,729 | ) | (190,188 | ) | ||||||||
Fair value of plan assets | 35,802 | 37,640 | 170,367 | 168,069 | ||||||||||||
Information for pension plans with projected benefit obligations in | ||||||||||||||||
excess of plan assets: | ||||||||||||||||
Projected benefit obligation | $ | (45,512 | ) | $ | (46,120 | ) | $ | (256,530 | ) | $ | (135,168 | ) | ||||
Fair value of plan assets | 35,802 | 37,640 | 171,133 | 102,372 | ||||||||||||
Components of Net Periodic Benefit Costs
U.S. | International | |||||||||||||||||||||||
In thousands | 2016 | 2015 | 2014 | 2016 | 2015 | 2014 | ||||||||||||||||||
Service cost | $ | 337 | $ | 381 | $ | 334 | $ | 1,379 | $ | 2,015 | $ | 2,138 | ||||||||||||
Interest cost | 1,475 | 1,914 | 2,070 | 5,774 | 7,091 | 8,102 | ||||||||||||||||||
Expected return on plan assets | (2,076 | ) | (2,168 | ) | (2,476 | ) | (9,971 | ) | (9,591 | ) | (9,646 | ) | ||||||||||||
Amortization of initial net obligation and prior service cost | 3 | 3 | 23 | 61 | 212 | 248 | ||||||||||||||||||
Amortization of net loss | 914 | 1,062 | 2,197 | 1,818 | 2,379 | 2,768 | ||||||||||||||||||
Settlement and curtailment losses recognized | — | — | 218 | — | (390 | ) | ||||||||||||||||||
Net periodic benefit cost | $ | 653 | $ | 1,192 | $ | 2,148 | $ | (721 | ) | $ | 2,106 | $ | 3,220 | |||||||||||
Other Changes in Plan Assets and Benefit Obligations Recognized in Other Comprehensive Income during 2016 are as follows:
In thousands | U.S. | International | ||||||
Net loss arising during the year | $ | (1,493 | ) | $ | (20,956 | ) | ||
Effect of exchange rates | — | 4,747 | ||||||
Amortization, settlement, or curtailment recognition of net transition obligation | — | 35 | ||||||
Amortization or curtailment recognition of prior service cost | 3 | 27 | ||||||
Amortization or settlement recognition of net loss | 914 | 1,818 | ||||||
Total recognized in other comprehensive loss | $ | (576 | ) | $ | (14,329 | ) | ||
Total recognized in net periodic benefit cost and other comprehensive loss | $ | (1,229 | ) | $ | (13,608 | ) | ||
The weighted average assumptions in the following table represent the rates used to develop the actuarial present value of the projected benefit obligation for the year listed.
U.S. | International | |||||||||||||||||
2016 | 2015 | 2014 | 2016 | 2015 | 2014 | |||||||||||||
Discount rate | 3.95 | % | 4.21 | % | 3.95 | % | 2.51 | % | 3.56 | % | 3.48 | % | ||||||
Expected return on plan assets | 5.70 | % | 5.70 | % | 5.70 | % | 6.07 | % | 5.81 | % | 5.79 | % | ||||||
Rate of compensation increase | 3.00 | % | 3.00 | % | 3.00 | % | 2.54 | % | 3.10 | % | 3.10 | % | ||||||
The discount rate is based on settling the pension obligation with high grade, high yield corporate bonds, and the rate of compensation increase is based on actual experience. The expected return on plan assets is based on historical performance as well as expected future rates of return on plan assets considering the current investment portfolio mix and the long-term investment strategy.
72
As of December 31, 2016 the following table represents the amounts included in other comprehensive loss that are expected to be recognized as components of periodic benefit costs in 2017.
In thousands | U.S. | International | ||||||
Net transition obligation | $ | — | $ | — | ||||
Prior service cost | 3 | 26 | ||||||
Net actuarial loss | 989 | 2,713 | ||||||
$ | 992 | $ | 2,739 | |||||
Pension Plan Assets
The Company has established formal investment policies for the assets associated with our pension plans. Objectives include maximizing long-term return at acceptable risk levels and diversifying among asset classes. Asset allocation targets are based on periodic asset liability study results which help determine the appropriate investment strategies. The investment policies permit variances from the targets within certain parameters. The plan assets consist primarily of equity security funds, debt security funds, and temporary cash and cash equivalent investments. The assets held in these funds are generally actively managed and are valued at the net asset value per share multiplied by the number of shares held as of the measurement date. Generally, all plan assets are considered Level 2 based on the fair value valuation hierarchy (See Note 18 “Fair Value Measurement” included herein). Plan assets by asset category at December 31, 2016 and 2015 are as follows:
U.S. | International | |||||||||||||||
In thousands | 2016 | 2015 | 2016 | 2015 | ||||||||||||
Pension Plan Assets | ||||||||||||||||
Equity security funds | $ | 17,446 | $ | 20,275 | $ | 92,201 | $ | 87,321 | ||||||||
Debt security funds and other | 17,038 | 16,441 | 145,003 | 77,173 | ||||||||||||
Cash and cash equivalents | 1,318 | 924 | 4,079 | 3,575 | ||||||||||||
Fair value of plan assets | $ | 35,802 | $ | 37,640 | $ | 241,283 | $ | 168,069 | ||||||||
The U.S., Canadian and German pension plans have a target asset allocation of 50% equity securities and 50% debt securities. The United Kingdom plan has a target asset allocation of 30% equity securities and 70% debt securities. Investment policies are determined by the respective Plan’s Pension Committee and set forth in its Investment Policy. Rebalancing of the asset allocation occurs on a quarterly basis.
Cash Flows
The Company’s funding methods are based on governmental requirements and differ from those methods used to recognize pension expense. The Company expects to contribute $7.1 million and $0.5 million to the international and U.S. plans, respectively, during 2017.
Benefit payments expected to be paid to plan participants are as follows:
In thousands | U.S. | International | ||||||
Year ended December 31, | ||||||||
2017 | $ | 3,514 | $ | 11,406 | ||||
2018 | 3,347 | 11,088 | ||||||
2019 | 3,372 | 11,415 | ||||||
2020 | 3,357 | 12,090 | ||||||
2021 | 3,385 | 12,416 | ||||||
2022 through 2026 | 15,151 | 68,114 | ||||||
Post Retirement Benefit Plans
In addition to providing pension benefits, the Company has provided certain unfunded postretirement health care and life insurance benefits for a portion of North American employees. The Company is not obligated to pay health care and life insurance benefits to individuals who had retired prior to 1990.
73
The Company uses a December 31 measurement date for all post retirement plans. The following tables provide information regarding the Company’s post retirement benefit plans summarized by U.S. and international components.
Obligations and Funded Status
U.S. | International | |||||||||||||||
In thousands | 2016 | 2015 | 2016 | 2015 | ||||||||||||
Change in projected benefit obligation | ||||||||||||||||
Obligation at beginning of year | $ | (12,959 | ) | $ | (31,872 | ) | $ | (3,290 | ) | $ | (3,905 | ) | ||||
Service cost | (4 | ) | (9 | ) | (29 | ) | (38 | ) | ||||||||
Interest cost | (389 | ) | (1,233 | ) | (99 | ) | (128 | ) | ||||||||
Plan amendments | 6 | 16,140 | — | — | ||||||||||||
Benefits paid | 720 | 1,478 | 133 | 125 | ||||||||||||
Acquisition | (143 | ) | — | — | — | |||||||||||
Actuarial gain (loss) | 893 | 2,537 | (42 | ) | 37 | |||||||||||
Effect of currency rate changes | — | — | (98 | ) | 619 | |||||||||||
Obligation at end of year | $ | (11,876 | ) | $ | (12,959 | ) | $ | (3,425 | ) | $ | (3,290 | ) | ||||
Change in plan assets | ||||||||||||||||
Fair value of plan assets at beginning of year | $ | — | $ | — | $ | — | $ | — | ||||||||
Employer contributions | 720 | 1,478 | 133 | 125 | ||||||||||||
Benefits paid | (720 | ) | (1,478 | ) | (133 | ) | (125 | ) | ||||||||
Fair value of plan assets at end of year | $ | — | $ | — | $ | — | $ | — | ||||||||
Funded status | ||||||||||||||||
Fair value of plan assets | $ | — | $ | — | $ | — | $ | — | ||||||||
Benefit obligations | (11,876 | ) | (12,959 | ) | (3,425 | ) | (3,290 | ) | ||||||||
Funded status | $ | (11,876 | ) | $ | (12,959 | ) | $ | (3,425 | ) | $ | (3,290 | ) | ||||
U.S. | International | |||||||||||||||
In thousands | 2016 | 2015 | 2016 | 2015 | ||||||||||||
Amounts recognized in the statement of financial position consist of: | ||||||||||||||||
Current liabilities | $ | (1,084 | ) | $ | (1,197 | ) | $ | (185 | ) | $ | (181 | ) | ||||
Noncurrent liabilities | (10,792 | ) | (11,762 | ) | (3,160 | ) | (3,109 | ) | ||||||||
Net amount recognized | $ | (11,876 | ) | $ | (12,959 | ) | $ | (3,345 | ) | $ | (3,290 | ) | ||||
Amounts recognized in accumulated other comprehensive income (loss) | ||||||||||||||||
consist of: | ||||||||||||||||
Initial net obligation | $ | — | $ | — | $ | — | $ | — | ||||||||
Prior service credit | 21,134 | 22,837 | 15 | 21 | ||||||||||||
Net actuarial (loss) gain | (20,023 | ) | (22,202 | ) | 292 | 351 | ||||||||||
Net amount recognized | $ | 1,111 | $ | 635 | $ | 307 | $ | 372 | ||||||||
During 2015, the Company amended its medical plan that amongst other things, provided the participants with HRA funding contributions. The change resulted in a $16.1 million decrease to the accumulated projected benefit obligation.
Components of Net Periodic Benefit Cost
U.S. | International | |||||||||||||||||||||||
In thousands | 2016 | 2015 | 2014 | 2016 | 2015 | 2014 | ||||||||||||||||||
Service cost | $ | 4 | $ | 9 | $ | 29 | $ | 29 | $ | 38 | $ | 47 | ||||||||||||
Interest cost | 389 | 1,233 | 1,155 | 99 | 128 | 173 | ||||||||||||||||||
Amortization of initial net obligation and prior service cost | (1,709 | ) | (2,295 | ) | (2,730 | ) | (7 | ) | (7 | ) | (8 | ) | ||||||||||||
Amortization of net loss (gain) | 1,287 | 1,356 | 1,330 | (29 | ) | (30 | ) | (141 | ) | |||||||||||||||
Net periodic benefit cost (credit) | $ | (29 | ) | $ | 303 | $ | (216 | ) | $ | 92 | $ | 129 | $ | 71 | ||||||||||
74
Other Changes in Plan Assets and Benefit Obligations Recognized in Other Comprehensive Income during 2016 are as follows:
In thousands | U.S. | International | ||||||
Prior service credit | $ | 6 | $ | — | ||||
Net loss arising during the year | 893 | (42 | ) | |||||
Effect of exchange rates | — | 13 | ||||||
Amortization or curtailment recognition of prior service cost | (1,709 | ) | (29 | ) | ||||
Amortization or settlement recognition of net loss (gain) | 1,287 | (7 | ) | |||||
Total recognized in other comprehensive income (loss) | $ | 477 | $ | (65 | ) | |||
Total recognized in net periodic benefit cost and other comprehensive income (loss) | $ | 506 | $ | 157 | ||||
The weighted average assumptions in the following table represent the rates used to develop the actuarial present value of the projected benefit obligation for the year listed and also the net periodic benefit cost for the following year. The discount rate is based on settling the pension obligation with high grade, high yield corporate bonds.
U.S. | International | |||||||||||||||||
2016 | 2015 | 2014 | 2016 | 2015 | 2014 | |||||||||||||
Discount rate | 3.76 | % | 3.95 | % | 3.95 | % | 3.46 | % | 3.80 | % | 3.96 | % | ||||||
As of December 31, 2016 the following table represents the amounts included in other comprehensive loss that are expected to be recognized as components of periodic benefit costs in 2017.
In thousands | U.S. | International | ||||||
Prior service cost | (1,519 | ) | (7 | ) | ||||
Net actuarial loss (gain) | 1,225 | (22 | ) | |||||
$ | (294 | ) | $ | (29 | ) | |||
The assumed health care cost trend rate for the U.S. plans grades from an initial rate of 6.45% to an ultimate rate of 4.50% by 2027 and for international plans from 6.42% to 4.50% by 2027. A 1.0% increase in the assumed health care cost trend rate will increase the service and interest cost components of the expense recognized for the U.S. and international post-retirement plans by less than $0.1 million for 2016, and increase the accumulated post-retirement benefit obligation by less than $0.1 million and $0.3 million, respectively. A 1.0% decrease in the assumed health care cost trend rate will decrease the service and interest cost components of the expense recognized for the U.S. and international post-retirement plans by less than $0.1 million for 2016, and decrease the accumulated post-retirement benefit obligation by less than $0.1 million and $0.2 million, respectively.
Cash Flows
Benefit payments expected to be paid to plan participants are as follows:
In thousands | U.S. | International | ||||||
Year ended December 31, | ||||||||
2017 | $ | 1,084 | $ | 185 | ||||
2018 | 1,045 | 194 | ||||||
2019 | 1,018 | 206 | ||||||
2020 | 986 | 210 | ||||||
2021 | 959 | 229 | ||||||
2022 through 2026 | 4,203 | 1,218 | ||||||
Defined Contribution Plans
The Company also participates in certain defined contribution plans and multiemployer pension plans. Costs recognized under these plans are summarized as follows:
For the year ended December 31, | ||||||||||||
In thousands | 2016 | 2015 | 2014 | |||||||||
Multi-employer pension and health & welfare plans | $ | 2,054 | $ | 2,584 | $ | 2,405 | ||||||
401(k) savings and other defined contribution plans | 23,062 | 21,399 | 19,925 | |||||||||
Total | $ | 25,116 | $ | 23,983 | $ | 22,330 | ||||||
75
The 401(k) savings plan is a participant directed defined contribution plan that holds shares of the Company’s stock as one of the investment options. At December 31, 2016 and 2015, the plan held on behalf of its participants about 551,482 shares with a market value of $45.8 million, and 632,523 shares with a market value of $45.0 million, respectively.
Additionally, the Company has stock option based benefit and other plans further described in Note 12.
The Company contributes to several multi-employer defined benefit pension plans under collective bargaining agreements that cover certain of its union-represented employees. The risks of participating in such plans are different from the risks of single-employer plans. Assets contributed to a multi-employer plan by one employer may be used to provide benefits to employees of other participating employers. If a participating employer ceases to contribute to the plan, the unfunded obligations of the plan may be borne by the remaining participating employers. If the Company ceases to have an obligation to contribute to the multi-employer plan in which it had been a contributing employer, it may be required to pay to the plan an amount based on the underfunded status of the plan and on the history of the Company’s participation in the plan prior to the cessation of its obligation to contribute. The amount that an employer that has ceased to have an obligation to contribute to a multi-employer plan is required to pay to the plan is referred to as a withdrawal liability.
The Company’s participation in multi-employer plans for the year ended December 31, 2016 is outlined in the table below. For plans that are not individually significant to the Company, the total amount of contributions is presented in the aggregate.
Pension Protection Act Zone Status (b) | FIP/ | Contributions by the Company | Expiration Dates of | |||||||||||||||||||||||||||||||
RP Status Pending/ | Surcharge Imposed | Collective Bargaining | ||||||||||||||||||||||||||||||||
Pension Fund | EIN/PN (a) | 2014 | 2013 | Implemented (c) | 2016 | 2015 | 2014 | (d) | Agreements | |||||||||||||||||||||||||
Idaho Operating Engineers- | EIN # | 91-6075538 | Green | Green | No | $ | 1,306 | (1 | ) | $ | 1,820 | (1 | ) | $ | 1,745 | (1 | ) | No | 6/30/2018 | |||||||||||||||
Employers Pension Trust Fund | Plan# | 001 | ||||||||||||||||||||||||||||||||
Automobile Mechanics' Local No 701 Union and | EIN # | 36-6042061 | Red | Red | Yes (2) | $ | 748 | $ | 764 | $ | 660 | No (3) | 12/11/2017 | |||||||||||||||||||||
Industry Pension Plan | Plan # | 001 | ||||||||||||||||||||||||||||||||
Total Contributions | $ | 2,054 | $ | 2,584 | $ | 2,405 | ||||||||||||||||||||||||||||
(1) | The Company’s contribution represents more than 5% of the total contributions to the plan. |
(2) | The Pension Fund’s board adopted a Funding Improvement Plan on October 21, 2015, continuing the existing plan which increased the weekly pension fund contribution rates by $75 with corresponding decreases to the weekly welfare fund contribution rates until December 31, 2017. |
(3) | Critical status triggered a 5% surcharge on employer contributions effective June 2012. Effective January 1, 2013, this surcharge increases to 10%. The surcharge ended on October 21, 2015 when the rehabilitation plan commenced. |
(a) | The “EIN / PN” column provides the Employer Identification Number and the three-digit plan number assigned to a plan by the Internal Revenue Service. |
(b) | The most recent Pension Protection Act Zone Status available for 2014 and 2013 is for plan years that ended in 2014 and 2013, respectively. The zone status is based on information provided to the Company and other participating employers by each plan and is certified by the plan’s actuary. A plan in the “red” zone has been determined to be in “critical status”, based on criteria established under the Internal Revenue Code (“Code”), and is generally less than 65% funded. A plan in the “yellow” zone has been determined to be in “endangered status”, based on criteria established under the Code, and is generally less than 80% funded. A plan in the “green” zone has been determined to be neither in “critical status” nor in “endangered status”, and is generally at least 80% funded. |
(c) | The “FIP/RP Status Pending/Implemented” column indicates whether a Funding Improvement Plan, as required under the Code to be adopted by plans in the “yellow” zone, or a Rehabilitation Plan, as required under the Code to be adopted by plans in the “red” zone, is pending or has been implemented as of the end of the plan year that ended in 2016. |
(d) | The “Surcharge Imposed” column indicates whether the Company’s contribution rate for 2016 included an amount in addition the contribution rate specified in the applicable collective bargaining agreement, as imposed by a plan in “critical status”, in accordance with the requirements of the Code. |
10. INCOME TAXES
The Company is responsible for filing consolidated U.S., foreign and combined, unitary or separate state income tax returns. The Company is responsible for paying the taxes relating to such returns, including any subsequent adjustments resulting from the redetermination of such tax liabilities by the applicable taxing authorities.
76
The components of the income from operations before provision for income taxes for the Company’s domestic and foreign operations for the years ended December 31 are provided below:
For the year ended December 31, | ||||||||||||
In thousands | 2016 | 2015 | 2014 | |||||||||
Domestic | $ | 276,218 | $ | 461,394 | $ | 343,180 | ||||||
Foreign | 136,619 | 123,974 | 164,675 | |||||||||
Income from operations before income taxes | $ | 412,837 | $ | 585,368 | $ | 507,855 | ||||||
Undistributed earnings of the Company’s foreign subsidiaries amounted to approximately $1,256.2 million at December 31, 2016. Those earnings are considered to be indefinitely reinvested; accordingly, no provision for U.S. federal and state income taxes has been provided thereon. Upon repatriation of those earnings, in the form of dividends or otherwise, the Company would be subject to both U.S. income taxes (subject to an adjustment for foreign tax credits) and withholding taxes payable to the various foreign countries. Determination of the amount of unrecognized deferred U.S. income tax liability is not practicable due to the complexities associated with its hypothetical calculation.
The consolidated provision for income taxes included in the Statement of Income consisted of the following:
For the year ended December 31, | ||||||||||||
In thousands | 2016 | 2015 | 2014 | |||||||||
Current taxes | ||||||||||||
Federal | $ | 72,317 | $ | 141,245 | $ | 108,782 | ||||||
State | 9,953 | 16,072 | 17,091 | |||||||||
Foreign | 27,391 | 24,442 | 37,356 | |||||||||
109,661 | 181,759 | 163,229 | ||||||||||
Deferred taxes | ||||||||||||
Federal | 11,013 | 9,606 | 2,287 | |||||||||
State | 1,953 | 770 | 1,404 | |||||||||
Foreign | (23,194 | ) | (5,395 | ) | (10,745 | ) | ||||||
(10,228 | ) | 4,981 | (7,054 | ) | ||||||||
Total provision | $ | 99,433 | $ | 186,740 | $ | 156,175 | ||||||
A reconciliation of the United States federal statutory income tax rate to the effective income tax rate on operations for the years ended December 31 is provided below:
For the year ended December 31, | |||||||||
In thousands | 2016 | 2015 | 2014 | ||||||
U.S. federal statutory rate | 35.0 | % | 35.0 | % | 35.0 | % | |||
State taxes | 2.1 | % | 2.0 | % | 2.2 | % | |||
Tax reserves | (0.2 | )% | (0.4 | )% | 0.3 | % | |||
Foreign | (4.3 | )% | (2.1 | )% | (4.2 | )% | |||
Research and development credit | (1.0 | )% | (0.4 | )% | (0.5 | )% | |||
Manufacturing deduction | (1.8 | )% | (2.3 | )% | (1.8 | )% | |||
France tax rate change | (6.5 | )% | — | % | — | % | |||
Transaction costs related to acquisitions | 1.5 | % | — | % | — | % | |||
Other, net | (0.7 | )% | 0.1 | % | (0.2 | )% | |||
Effective rate | 24.1 | % | 31.9 | % | 30.8 | % | |||
The 6.5% decrease in the effective tax rate due to the France tax rate change was the result of adopted tax legislation that reduces the corporate income tax rate in France from 33.3% to 28.0% over the period 2017 to 2020. The 1.5% increase in the effective tax rate due to Transaction costs related to acquisitions was primarily related to nondeductible costs associated with the acquisition of Faiveley Transport. Deferred income taxes result from temporary differences in the recognition of income and expense for financial and income tax reporting purposes. These deferred income taxes will be recognized as future tax benefits or costs when the temporary differences reverse.
77
Components of deferred tax assets and liabilities were as follows:
December 31, | ||||||||
In thousands | 2016 | 2015 | ||||||
Deferred income tax assets: | ||||||||
Accrued expenses and reserves | $ | 26,117 | $ | 39,426 | ||||
Warranty reserve | 24,131 | 24,544 | ||||||
Deferred compensation/employee benefits | 25,755 | 24,950 | ||||||
Pension and postretirement obligations | 25,595 | 15,507 | ||||||
Inventory | 22,579 | 18,664 | ||||||
Net operating loss carry forwards | 59,416 | 25,636 | ||||||
Tax credit carry forwards | 621 | 959 | ||||||
Other | 2,317 | — | ||||||
Gross deferred income tax assets | 186,531 | 149,686 | ||||||
Valuation allowance | 21,418 | 12,623 | ||||||
Total deferred income tax assets | 165,113 | 137,063 | ||||||
Deferred income tax liabilities: | ||||||||
Property, plant & equipment | 47,321 | 34,518 | ||||||
Intangibles | 359,312 | 167,108 | ||||||
Other | — | 2,243 | ||||||
Total deferred income tax liabilities | 406,633 | 203,869 | ||||||
Net deferred income tax liability | $ | (241,520 | ) | $ | (66,806 | ) | ||
A valuation allowance is provided when it is more likely than not that some portion or all of the deferred tax assets will not be realized. As of December 31, 2016, the valuation allowance for certain foreign carryforwards was $21.4 million primarily in Brazil, China and South Africa.
Net operating loss carry-forwards in the amount of $59.4 million expire in various periods from December 31, 2017 to December 31, 2036.
As of December 31, 2016, the liability for income taxes associated with unrecognized tax benefits was $8.4 million, of which $4.2 million, if recognized, would favorably affect the Company’s effective income tax rate. As of December 31, 2015, the liability for income taxes associated with unrecognized tax benefits was $10.6 million, of which $4.3 million, if recognized, would favorably affect the Company’s effective tax rate. A reconciliation of the beginning and ending amount of the liability for income taxes associated with unrecognized tax benefits follows:
In thousands | 2016 | 2015 | 2014 | |||||||||
Gross liability for unrecognized tax benefits at beginning of year | $ | 10,557 | $ | 12,596 | $ | 10,531 | ||||||
Gross increases - unrecognized tax benefits in prior periods | 6 | — | 30 | |||||||||
Gross increases - current period unrecognized tax benefits | — | 1,682 | 2,756 | |||||||||
Gross decreases - unrecognized tax benefits in prior periods | — | — | (463 | ) | ||||||||
Gross decreases - audit settlement during year | — | (3,027 | ) | (77 | ) | |||||||
Gross decreases - expiration of audit statute of limitations | (2,140 | ) | (694 | ) | (181 | ) | ||||||
Gross liability for unrecognized tax benefits at end of year | $ | 8,423 | $ | 10,557 | $ | 12,596 | ||||||
The Company includes interest and penalties related to unrecognized tax benefits in income tax expense. As of December 31, 2016, the total interest and penalties accrued was approximately $0.8 million and $0.3 million, respectively. As of December 31, 2015, the total interest and penalties accrued was approximately $2.0 million and $0.2 million, respectively.
With limited exception, the Company is no longer subject to examination by various U.S. and foreign taxing authorities for years before 2012. At this time, the Company believes that it is reasonably possible that unrecognized tax benefits of approximately $3.3 million may change within the next 12 months due to the expiration of statutory review periods and current examinations.
78
11. EARNINGS PER SHARE
The computation of earnings per share from operations is as follows:
For the Year Ended December 31, | ||||||||||||
In thousands, except per share data | 2016 | 2015 | 2014 | |||||||||
Numerator | ||||||||||||
Numerator for basic and diluted earnings per common share - net income attributable | ||||||||||||
to Wabtec shareholders | $ | 304,887 | $ | 398,628 | $ | 351,680 | ||||||
Less: dividends declared - common shares and non-vested restricted stock | (32,430 | ) | (26,963 | ) | (19,246 | ) | ||||||
Undistributed earnings | 272,457 | 371,665 | 332,434 | |||||||||
Percentage allocated to common shareholders (1) | 99.7 | % | 99.7 | % | 99.6 | % | ||||||
271,640 | 370,550 | 331,104 | ||||||||||
Add: dividends declared - common shares | 32,333 | 26,875 | 19,167 | |||||||||
Numerator for basic and diluted earnings per common share | $ | 303,973 | $ | 397,425 | $ | 350,271 | ||||||
Denominator | ||||||||||||
Denominator for basic earnings per common share - weighted average shares | 90,359 | 96,074 | 95,781 | |||||||||
Effect of dilutive securities: | ||||||||||||
Assumed conversion of dilutive stock-based compensation plans | 782 | 932 | 1,104 | |||||||||
Denominator for diluted earnings per common share - adjusted weighted average | ||||||||||||
shares and assumed conversion | 91,141 | 97,006 | 96,885 | |||||||||
Net income per common share attributable to Wabtec shareholders | ||||||||||||
Basic | $ | 3.37 | $ | 4.14 | $ | 3.66 | ||||||
Diluted | $ | 3.34 | $ | 4.10 | $ | 3.62 | ||||||
(1) Basic weighted-average common shares outstanding | 90,359 | 96,074 | 95,781 | |||||||||
Basic weighted-average common shares outstanding and non-vested restricted | ||||||||||||
stock expected to vest | 90,627 | 96,388 | 96,175 | |||||||||
Percentage allocated to common shareholders | 99.7 | % | 99.7 | % | 99.6 | % | ||||||
Options to purchase approximately 20,000, 13,000, and 17,000 shares of Common Stock were outstanding in 2016, 2015 and 2014, respectively, but were not included in the computation of diluted earnings per share because the options’ exercise price exceeded the average market price of the common shares.
12. STOCK-BASED COMPENSATION PLANS
As of December 31, 2016, the Company maintains employee stock-based compensation plans for stock options, restricted stock, and incentive stock units as governed by the 2011 Stock Incentive Compensation Plan (the “2011 Plan”) and the 2000 Stock Incentive Plan, as amended (the “2000 Plan”). The 2011 Plan has a 10 year term through March 27, 2021 and as of December 31, 2016 the number of shares available for future grants under the 2011 Plan was 2,469,849 shares, which includes remaining shares to grant under the 2000 Plan. The 2011 Plan was approved by stockholders of Wabtec on May 11, 2011. The Company also maintains a 1995 Non-Employee Directors’ Fee and Stock Option Plan (“the Directors Plan”). The Directors Plan, as amended, authorizes a total of 1,000,000 shares of Common Stock to be issued. Under the Directors Plan options issued become exercisable over a three-year vesting period and expire ten years from the date of grant and restricted stock issued under the plan vests one year from the date of grant. As compensation for directors’ fees for the years ended December 31, 2016, 2015 and 2014, the Company issued a total of 16,972, 11,256 and 12,704 shares of restricted stock to non-employee directors. The total number of shares issued under the plan as of December 31, 2016 was 864,692 shares. No units may be made under the Directors Plan subsequent to October 31, 2016.
Stock-based compensation expense for all of the plans was $20.8 million, $26.0 million and $26.1 million for the years ended December 31, 2016, 2015 and 2014, respectively. The Company recognized associated tax benefits related to the stock-based compensation plans of $14.9 million, $15.3 million and $7.6 million for the respective periods. Included in the stock-based compensation expense for 2016 above is $1.7 million of expense related to stock options, $6.0 million related to non-vested restricted stock, $3.2 million related to restricted stock units, $8.5 million related to incentive stock units and $1.4 million related to units issued for Directors’ fees. At December 31, 2016, unamortized compensation expense related to those stock options, non-vested restricted shares and incentive stock units expected to vest totaled $25.8 million and will be recognized over a weighted average period of 1.1 years.
79
Stock Options Stock options are granted to eligible employees and directors at the fair market value, which is the average of the high and low Wabtec stock price on the date of grant. Under the 2011 Plan and the 2000 Plan, options become exercisable over a four years vesting period and expire 10 years from the date of grant.
The following table summarizes the Company’s stock option activity and related information for the 2011 Plan, the 2000 Plan and Directors Plan for the years ended December 31:
Options | Weighted Average Exercise Price | Weighted Average Remaining Contractual Life | Aggregate Intrinsic value (in thousands) | ||||||||||
Outstanding at December 31, 2013 | 1,232,862 | $ | 24.36 | 6.1 | $ | 61,530 | |||||||
Granted | 81,552 | 73.20 | 1,116 | ||||||||||
Exercised | (163,786 | ) | 20.37 | (10,895 | ) | ||||||||
Canceled | (3,070 | ) | 52.73 | (105 | ) | ||||||||
Outstanding at December 31, 2014 | 1,147,558 | $ | 28.33 | 5.5 | $ | 67,205 | |||||||
Granted | 84,675 | 87.35 | 1,375 | ||||||||||
Exercised | (124,156 | ) | 26.70 | (5,516 | ) | ||||||||
Canceled | (10,754 | ) | 65.22 | (64 | ) | ||||||||
Outstanding at December 31, 2015 | 1,097,323 | $ | 32.70 | 4.8 | $ | 42,154 | |||||||
Granted | 94,115 | 61.39 | 2,035 | ||||||||||
Exercised | (83,790 | ) | 25.58 | (4,813 | ) | ||||||||
Canceled | (8,825 | ) | 71.47 | (102 | ) | ||||||||
Outstanding at December 31, 2016 | 1,098,823 | $ | 35.39 | 4.3 | $ | 52,332 | |||||||
Exercisable at December 31, 2016 | 885,442 | $ | 27.32 | 3.5 | $ | 49,321 | |||||||
Options outstanding at December 31, 2016 were as follows:
Number of Options | Weighted Average Exercise Price of Options | Weighted Average Remaining Contractual | Number of Options Currently | Weighted Average Exercise Price of Options Currently | ||||||||||||
Range of exercise prices | Outstanding | Outstanding | Life | Exercisable | Exercisable | |||||||||||
Under $15.00 | 198,000 | $ | 14.50 | 2.1 | 198,000 | $ | 14.50 | |||||||||
15.00 - 23.00 | 310,149 | 18.29 | 1.9 | 310,149 | 18.29 | |||||||||||
23.00 - 30.00 | 145,779 | 28.74 | 3.8 | 145,779 | 28.74 | |||||||||||
30.00 - 38.00 | 105,924 | 35.25 | 5.1 | 105,924 | 35.25 | |||||||||||
Over 38.00 | 338,971 | 66.16 | 7.7 | 125,590 | 61.48 | |||||||||||
1,098,823 | $ | 35.39 | 885,442 | $ | 27.32 | |||||||||||
The fair value of each option grant is estimated on the date of grant using the Black-Scholes option-pricing model with the following weighted-average assumptions:
For the year ended December 31, | ||||||||||||
2016 | 2015 | 2014 | ||||||||||
Dividend yield | 0.26 | % | 0.14 | % | 0.11 | % | ||||||
Risk-free interest rate | 1.5 | % | 1.8 | % | 2.2 | % | ||||||
Stock price volatility | 26.9 | % | 27.3 | % | 33.0 | % | ||||||
Expected life (years) | 5.0 | 5.0 | 5.0 | |||||||||
Weighted average fair value of options granted during the year | $ | 14.96 | $ | 24.41 | $ | 22.82 | ||||||
The dividend yield is based on the Company’s dividend rate and the current market price of the underlying common stock at the date of grant. Expected life in years is determined from historical stock option exercise data. Expected volatility is based on the historical volatility of the Company’s stock. The risk-free interest rate is based on the 7 years U.S. Treasury bond rates for the expected life of the option.
Restricted Stock and Incentive Stock Beginning in 2006 the Company adopted a restricted stock program. As provided for under the 2011 and 2000 Plans, eligible employees are granted restricted stock that generally vests over four years from the date of grant. Under the Directors Plan, restricted stock units vest one year from the date of grant.
80
In addition, the Company has issued incentive stock units to eligible employees that vest upon attainment of certain cumulative three-year performance goals. Based on the Company’s performance for each three year period then ended, the incentive stock units can vest and be awarded ranging from 0% to 200% of the initial incentive stock units granted. The incentive stock units included in the table below represent the number of shares that are expected to vest based on the Company’s estimate for meeting those established performance targets. As of December 31, 2016, the Company estimates that it will achieve 117%, 92% and 95% for the incentive stock units expected to vest based on performance for the three year periods ending December 31, 2016, 2017, and 2018, respectively, and has recorded incentive compensation expense accordingly. If our estimate of the number of these stock units expected to vest changes in a future accounting period, cumulative compensation expense could increase or decrease and will be recognized in the current period for the elapsed portion of the vesting period and would change future expense for the remaining vesting period.
Compensation expense for the non-vested restricted stock and incentive stock units is based on the closing price of the Company’s common stock on the date of grant and recognized over the applicable vesting period.
The following table summarizes the restricted stock activity and related information for the 2011 Plan, the 2000 Plan, and Directors Plan, and incentive stock units activity and related information for the 2011 Plan and the 2000 Plan with related information for the years ended December 31:
Restricted Stock and Units | Incentive Stock Awards | Weighted Average Grant Date Fair Value | ||||||||
Outstanding at December 31, 2013 | 510,129 | 1,043,594 | $ | 35.27 | ||||||
Granted | 150,886 | 140,240 | 73.68 | |||||||
Vested | (218,502 | ) | (458,536 | ) | 29.83 | |||||
Adjustment for incentive stock awards expected to vest | — | 74,680 | 47.56 | |||||||
Canceled | (3,970 | ) | (8,370 | ) | 48.50 | |||||
Outstanding at December 31, 2014 | 438,543 | 791,608 | $ | 47.97 | ||||||
Granted | 113,945 | 126,050 | 87.90 | |||||||
Vested | (182,776 | ) | (433,932 | ) | 37.76 | |||||
Adjustment for incentive stock awards expected to vest | — | 65,666 | 57.57 | |||||||
Canceled | (12,827 | ) | (7,754 | ) | 67.05 | |||||
Outstanding at December 31, 2015 | 356,885 | 541,638 | $ | 65.89 | ||||||
Granted | 212,600 | 167,850 | 66.03 | |||||||
Vested | (159,975 | ) | (236,591 | ) | 51.80 | |||||
Adjustment for incentive stock awards expected to vest | — | (38,164 | ) | 74.42 | ||||||
Canceled | (13,215 | ) | (9,983 | ) | 71.84 | |||||
Outstanding at December 31, 2016 | 396,295 | 424,750 | $ | 72.18 | ||||||
13. OTHER COMPREHENSIVE LOSS
The components of accumulated other comprehensive loss were:
December 31, | ||||||||
In thousands | 2016 | 2015 | ||||||
Foreign currency translation loss | $ | (321,033 | ) | $ | (227,349 | ) | ||
Unrealized loss on interest rate swap contracts, net of tax of $1,540 and $1,815 | (2,957 | ) | (2,987 | ) | ||||
Unrealized loss on pension and post-retirement benefit plans, net of tax of $20,832 and $18,042 | (55,615 | ) | (46,383 | ) | ||||
Total accumulated other comprehensive loss | $ | (379,605 | ) | $ | (276,719 | ) | ||
81
The changes in accumulated other comprehensive loss by component, net of tax, for the year-ended December 31, 2016 are as follows:
Foreign currency | Derivative | Pension and post retirement | ||||||||||||||
In thousands | translation | contracts | benefits plans | Total | ||||||||||||
Balance at December 31, 2015 | $ | (227,349 | ) | $ | (2,987 | ) | $ | (46,383 | ) | $ | (276,719 | ) | ||||
Other comprehensive income before reclassifications | (93,684 | ) | (1,286 | ) | (10,874 | ) | (105,844 | ) | ||||||||
Amounts reclassified from accumulated other | ||||||||||||||||
comprehensive income | — | 1,316 | 1,642 | 2,958 | ||||||||||||
Net current period other comprehensive income | (93,684 | ) | 30 | (9,232 | ) | (102,886 | ) | |||||||||
Balance at December 31, 2016 | $ | (321,033 | ) | $ | (2,957 | ) | $ | (55,615 | ) | $ | (379,605 | ) | ||||
Reclassifications out of accumulated other comprehensive loss for the year-ended December 31, 2016 are as follows:
Amount reclassified from accumulated other | Affected line item in the Condensed Consolidated | |||||
In thousands | comprehensive income | Statements of Income | ||||
Amortization of defined pension and post retirement items | ||||||
Amortization of initial net obligation and prior service cost | $ | (1,652 | ) | Cost of sales | ||
Amortization of net loss (gain) | 3,989 | Cost of sales | ||||
2,337 | Income from Operations | |||||
(695 | ) | Income tax expense | ||||
$ | 1,642 | Net income | ||||
Derivative contracts | ||||||
Realized loss on derivative contracts | 1,873 | Interest expense, net | ||||
(557 | ) | Income tax expense | ||||
$ | 1,316 | Net income | ||||
The changes in accumulated other comprehensive loss by component, net of tax, for the year-ended December 31, 2015 are as follows:
Foreign currency | Derivative | Pension and post retirement | ||||||||||||||
In thousands | translation | contracts | benefits plans | Total | ||||||||||||
Balance at December 31, 2014 | $ | (94,450 | ) | $ | (2,243 | ) | $ | (62,793 | ) | $ | (159,486 | ) | ||||
Other comprehensive income before reclassifications | (132,899 | ) | (1,972 | ) | 14,586 | (120,285 | ) | |||||||||
Amounts reclassified from accumulated other | ||||||||||||||||
comprehensive income | — | 1,228 | 1,824 | 3,052 | ||||||||||||
Net current period other comprehensive income | (132,899 | ) | (744 | ) | 16,410 | (117,233 | ) | |||||||||
Balance at December 31, 2015 | $ | (227,349 | ) | $ | (2,987 | ) | $ | (46,383 | ) | $ | (276,719 | ) | ||||
Reclassifications out of accumulated other comprehensive loss for the year-ended December 31, 2015 are as follows:
Amount reclassified from accumulated other | Affected line item in the Condensed Consolidated | |||||
In thousands | comprehensive income | Statements of Income | ||||
Amortization of defined pension and post retirement items | ||||||
Amortization of initial net obligation and prior service cost | $ | (2,087 | ) | Cost of sales | ||
Amortization of net loss (gain) | 4,766 | Cost of sales | ||||
2,679 | Income from Operations | |||||
(855 | ) | Income tax expense | ||||
$ | 1,824 | Net income | ||||
Derivative contracts | ||||||
Realized loss on derivative contracts | 1,803 | Interest expense, net | ||||
(575 | ) | Income tax expense | ||||
$ | 1,228 | Net income | ||||
82
14. OPERATING LEASES
The Company leases office and manufacturing facilities under operating leases with terms ranging from one to 15 years, excluding renewal options.
Total net rental expense charged to operations in 2016, 2015, and 2014 was $27.2 million, $20.2 million and $20.0 million, respectively. The amounts above are shown net of sublease rentals of $0.1 million, $0.7 million and $0.1 million for the years 2016, 2015 and 2014, respectively.
Future minimum rental payments under operating leases with remaining non-cancelable terms in excess of one year are as follows:
Real | ||||||||||||
In thousands | Estate | Equipment | Total | |||||||||
2017 | $ | 24,548 | $ | 1,824 | $ | 26,372 | ||||||
2018 | 20,851 | 1,407 | 22,258 | |||||||||
2019 | 18,450 | 749 | 19,199 | |||||||||
2020 | 16,077 | 328 | 16,405 | |||||||||
2021 | 13,107 | 179 | 13,286 | |||||||||
2022 and after | 41,019 | 42 | 41,061 | |||||||||
15. WARRANTIES
The following table reconciles the changes in the Company’s product warranty reserve as follows:
In thousands | 2016 | 2015 | ||||||
Balance at beginning of year | $ | 92,064 | $ | 87,849 | ||||
Warranty expense | 28,947 | 35,418 | ||||||
Acquisitions | 59,685 | 787 | ||||||
Warranty claim payments | (38,772 | ) | (29,441 | ) | ||||
Foreign currency impact/other | (2,932 | ) | (2,549 | ) | ||||
Balance at end of year | $ | 138,992 | $ | 92,064 | ||||
16. PREFERRED STOCK
The Company’s authorized capital stock includes 1,000,000 shares of preferred stock. The Board of Directors has the authority to issue the preferred stock and to fix the designations, powers, preferences and rights of the shares of each such class or series, including dividend rates, conversion rights, voting rights, terms of redemption and liquidation preferences, without any further vote or action by the Company’s shareholders. The rights and preferences of the preferred stock would be superior to those of the common stock. At December 31, 2016 and 2015 there was no preferred stock issued or outstanding.
17. DERIVATIVE FINANCIAL INSTRUMENTS AND HEDGING
Foreign Currency Hedging The Company uses forward contracts to mitigate its foreign currency exchange rate exposure due to forecasted sales of finished goods and future settlement of foreign currency denominated assets and liabilities. Derivatives used to hedge forecasted transactions and specific cash flows associated with foreign currency denominated financial assets and liabilities that meet the criteria for hedge accounting are designated as cash flow hedges. The effective portion of gains and losses is deferred as a component of accumulated other comprehensive income and is recognized in earnings at the time the hedged item affects earnings, in the same line item as the underlying hedged item. The contracts are scheduled to mature within two years. For the twelve months ended December 31, 2016, the amount reclassified into income was $0.6 million.
Other Activities The Company enters into certain derivative contracts in accordance with its risk management strategy that do not meet the criteria for hedge accounting but which have the impact of largely mitigating foreign currency exposure. These foreign exchange contracts are accounted for on a full mark to market basis through earnings, with gains and losses recorded as a component of other expense, net. The net unrealized gain related to these contracts was $0.2 million for the twelve months ended December 31, 2016. The notional amount and fair value of foreign exchange contracts that did not meet the criteria for hedge accounting at December 31, 2016 was not material. These contracts are scheduled to mature within one year.
83
The following table summarizes the gross notional amounts and fair values of the designated and non-designated hedged discussed in the above sections:
In millions | Designated | Non-Designated | Total | |||||||||
Gross notional amount | $ | 911.0 | $ | 490.0 | $ | 1,401.0 | ||||||
Fair Value: | ||||||||||||
Other current assets | 1.1 | 0.4 | 1.5 | |||||||||
Other current liabilities | (0.5 | ) | (0.2 | ) | (0.7 | ) | ||||||
Total | $ | 0.6 | $ | 0.2 | $ | 0.8 | ||||||
Interest Rate Hedging The Company uses interest rate swaps to manage interest rate exposures. The Company is exposed to interest rate volatility with regard to existing floating rate debt. Primary exposure includes the London Interbank Offered Rates (LIBOR). Derivatives used to hedge risk associated with changes in the fair value of certain variable-rate debt are primarily designated as fair value hedges. Consequently, changes in the fair value of these derivatives, along with changes in the fair value of debt obligations are recognized in current period earnings. See long-term debt footnote fair value measurement footnote for further information on current interest rate swaps.
As of December 31, 2016, the Company has recorded a current liability of $3.9 million and an accumulated other comprehensive loss of $2.3 million, net of tax, related to these agreements.
18. FAIR VALUE MEASUREMENT AND FAIR VALUE OF FINANCIAL INSTRUMENTS
ASC 820 “Fair Value Measurements and Disclosures” defines fair value, establishes a framework for measuring fair value and explains the related disclosure requirements. ASC 820 indicates, among other things, that a fair value measurement assumes that the transaction to sell an asset or transfer a liability occurs in the principal market for the asset or liability or, in the absence of a principal market, the most advantageous market for the asset or liability and defines fair value based upon an exit price model.
Valuation Hierarchy. ASC 820 establishes a valuation hierarchy for disclosure of the inputs to valuation used to measure fair value. This hierarchy prioritizes the inputs into three broad levels as follows. Level 1 inputs are quoted prices (unadjusted) in active markets for identical assets or liabilities. Level 2 inputs are quoted prices for similar assets and liabilities in active markets or inputs that are observable for the asset or liability, either directly or indirectly through market corroboration, for substantially the full term of the financial instrument. Level 3 inputs are unobservable inputs based on the Company’s assumptions used to measure assets and liabilities at fair value. A financial asset or liability’s classification within the hierarchy is determined based on the lowest level input that is significant to the fair value measurement.
The following table provides the liabilities carried at fair value measured on a recurring basis as of December 31, 2016, which are included in other current liabilities on the Consolidated Balance sheet:
Fair Value Measurements at December 31, 2016 Using | ||||||||||||||||
Total Carrying Value at December 31, | Quoted Prices in Active Markets for Identical Assets | Significant Other Observable Inputs | Significant Unobservable Inputs | |||||||||||||
In thousands | 2016 | (Level 1) | (Level 2) | (Level 3) | ||||||||||||
Interest rate swap agreements | 3,888 | — | 3,888 | — | ||||||||||||
Total | $ | 3,888 | $ | — | $ | 3,888 | $ | — | ||||||||
The following table provides the liabilities carried at fair value measured on a recurring basis as of December 31, 2015, which are included in other current liabilities on the Consolidated Balance sheet:
Fair Value Measurements at December 31, 2015 Using | ||||||||||||||||
Total Carrying Value at December 31, | Quoted Prices in Active Markets for Identical Assets | Significant Other Observable Inputs | Significant Unobservable Inputs | |||||||||||||
In thousands | 2015 | (Level 1) | (Level 2) | (Level 3) | ||||||||||||
Interest rate swap agreements | 4,474 | — | 4,474 | — | ||||||||||||
Total | $ | 4,474 | $ | — | $ | 4,474 | $ | — | ||||||||
84
To reduce the impact of interest rate changes on a portion of its variable-rate debt, the Company entered into interest rate swaps which effectively converted a portion of the debt from variable to fixed-rate borrowings during the term of the swap contracts. For certain derivative contracts whose fair values are based upon trades in liquid markets, such as interest rate swaps, valuation model inputs can generally be verified and valuation techniques do not involve significant management judgment. The fair values of such financial instruments are generally classified within Level 2 of the fair value hierarchy.
As a result of our global operating activities the Company is exposed to market risks from changes in foreign currency exchange rates, which may adversely affect our operating results and financial position. When deemed appropriate, the Company minimizes these risks through entering into foreign currency forward contracts. The foreign currency forward contracts are valued using broker quotations, or market transactions in either the listed or over-the counter markets. As such, these derivative instruments are classified within level 2.
The Company’s cash and cash equivalents are highly liquid investments purchased with an original maturity of three months or less and are considered Level 1 on the fair value valuation hierarchy. The fair value of cash and cash equivalents approximated the carrying value at December 31, 2016 and December 31, 2015. The Company’s defined benefit pension plan assets consist primarily of equity security funds, debt security funds and temporary cash and cash equivalent investments. Generally, all plan assets are considered Level 2 based on the fair value valuation hierarchy. These investments are comprised of a number of investment funds that invest in a diverse portfolio of assets including equity securities, corporate and governmental bonds, and money markets. Trusts are valued at the net asset value (“NAV”) as determined by their custodian. NAV represents the accumulation of the unadjusted quoted close prices on the reporting date for the underlying investments divided by the total shares outstanding at the reporting dates. The 2013 and 2016 Notes are considered Level 2 based on the fair value valuation hierarchy.
The estimated fair values and related carrying values of the Company’s financial instruments are as follows:
December 31, 2016 | December 31, 2015 | |||||||||||||||
Carry | Fair | Carry | Fair | |||||||||||||
In thousands | Value | Value | Value | Value | ||||||||||||
Interest rate swap agreements | $ | 3,888 | $ | 3,888 | $ | 4,474 | $ | 4,474 | ||||||||
4.375% Senior Notes | 248,310 | 260,265 | 248,053 | 254,075 | ||||||||||||
3.45% Senior Notes | 747,474 | 719,273 | — | — | ||||||||||||
The fair value of the Company’s interest rate swap agreements and the 2013 and 2016 Notes were based on dealer quotes and represent the estimated amount the Company would pay to the counterparty to terminate the agreement.
19. COMMITMENTS AND CONTINGENCIES
The Company is subject to a variety of environmental laws and regulations governing discharges to air and water, the handling, storage and disposal of hazardous or solid waste materials and the remediation of contamination associated with releases of hazardous substances. The Company believes its operations currently comply in all material respects with all of the various environmental laws and regulations applicable to our business; however, there can be no assurance that environmental requirements will not change in the future or that we will not incur significant costs to comply with such requirements.
Under terms of the purchase agreement and related documents for the 1990 Acquisition, American Standard, Inc., now known as Trane (“Trane”), has indemnified the Company for certain items including, among other things, certain environmental claims the Company asserted prior to 2000. If Trane was unable to honor or meet these indemnifications, the Company would be responsible for such items. In the opinion of Management, Trane currently has the ability to meet its indemnification obligations.
Claims have been filed against the Company and certain of its affiliates in various jurisdictions across the United States by persons alleging bodily injury as a result of exposure to asbestos-containing products. Most of these claims have been made against our wholly owned subsidiary, Railroad Friction Products Corporation (“RFPC”), and are based on a product sold by RFPC prior to the time that the Company acquired any interest in RFPC.
Most of these claims, including all of the RFPC claims, are submitted to insurance carriers for defense and indemnity or to non-affiliated companies that retain the liabilities for the asbestos-containing products at issue. We cannot, however, assure that all these claims will be fully covered by insurance or that the indemnitors or insurers will remain financially viable. Our ultimate legal and financial liability with respect to these claims, as is the case with other pending litigation, cannot be estimated.
85
It is management’s belief that the potential range of loss for asbestos-related bodily injury cases is not reasonably determinable at present due to a variety of factors, including: (1) the asbestos case settlement history of the Company’s wholly owned subsidiary, RFPC; (2) the unpredictable nature of personal injury litigation in general; and (3) the uncertainty of asbestos litigation in particular. Despite this uncertainty, and although the results of the Company’s operations and cash flows for any given period could be adversely affected by asbestos-related lawsuits, Management believes that the final resolution of the Company’s asbestos-related cases will not be material to the Company’s overall financial position, results of operations and cash flows. In general, this belief is based upon: (1) Wabtec’s and RFPC’s history of settlements and dismissals of asbestos-related cases to date; (2) the inability of many plaintiffs to establish any exposure or causal relationship to RFPC’s product; and (3) the inability of many plaintiffs to demonstrate any identifiable injury or compensable loss.
More specifically, as to RFPC, management’s belief that any losses due to asbestos-related cases would not be material is also based on the fact that RFPC owns insurance which provides coverage for asbestos-related bodily injury claims. To date, RFPC’s insurers have provided RFPC with defense and indemnity in these actions. The overall number of new claims being filed against RFPC has dropped significantly in recent years; however, these new claims, and all previously filed claims, may take a significant period of time to resolve. As to Wabtec and its divisions, Management’s belief that asbestos-related cases will not have a material impact is also based on its position that it has no legal liability for asbestos-related bodily injury claims, and that the former owners of Wabtec’s assets retained asbestos liabilities for the products at issue. To date, Wabtec has been able to successfully defend itself on this basis, including two arbitration decisions and a judicial opinion, all of which confirmed Wabtec’s position that it did not assume any asbestos liabilities from the former owners of certain Wabtec assets. Although Wabtec has incurred defense and administrative costs in connection with asbestos bodily injury actions, these costs have not been material, and the Company has no information that would suggest these costs would become material in the foreseeable future.
On April 21, 2016, Siemens Industry, Inc. filed a lawsuit against the Company in federal district court in Delaware alleging that the Company has infringed seven patents owned by Siemens, all of which relate to Positive Train Control technology. On November 2, 2016, Siemens amended its complaint to add six additional patents they also claim are infringed by the Company’s Positive Train Control Products. The Company has filed Answers, and asserted counterclaims, in response to Siemens’ complaints. The case is still in the preliminary stages, but the Company has begun filing for Inter-Parties Review proceedings before the U.S. Patent & Trademark Office seeking to invalidate the Siemens patents. Wabtec believes the claims are without merit and is vigorously defending itself.
From time to time the Company is involved in litigation relating to claims arising out of its operations in the ordinary course of business. As of the date hereof, the Company is involved in no litigation that the Company believes will have a material adverse effect on its financial condition, results of operations or liquidity.
20. SEGMENT INFORMATION
Wabtec has two reportable segments—the Freight Segment and the Transit Segment. The key factors used to identify these reportable segments are the organization and alignment of the Company’s internal operations, the nature of the products and services, and customer type. The business segments are:
Freight Segment primarily manufactures and services components for new and existing freight cars and locomotives, builds new switcher locomotives, rebuilds freight locomotives, supplies railway electronics, positive train control equipment, signal design and engineering services, and provides related heat exchange and cooling systems. Customers include large, publicly traded railroads, leasing companies, manufacturers of original equipment such as locomotives and freight cars, and utilities.
Transit Segment primarily manufactures and services components for new and existing passenger transit vehicles, typically regional trains, high speed trains, subway cars, light-rail vehicles and buses, builds new commuter locomotives, refurbishes subway cars, provides heating, ventilation, and air conditioning equipment, and doors for buses and subways. Customers include public transit authorities and municipalities, leasing companies, and manufacturers of subway cars and buses around the world.
The Company evaluates its business segments’ operating results based on income from operations. Intersegment sales are accounted for at prices that are generally established by reference to similar transactions with unaffiliated customers. Corporate activities include general corporate expenses, elimination of intersegment transactions, interest income and expense and other unallocated charges. Since certain administrative and other operating expenses and other items have not been
86
allocated to business segments, the results in the following tables are not necessarily a measure computed in accordance with generally accepted accounting principles and may not be comparable to other companies.
Segment financial information for 2016 is as follows: | ||||||||||||||||
Corporate | ||||||||||||||||
Freight | Transit | Activities and | ||||||||||||||
In thousands | Segment | Segment | Elimination | Total | ||||||||||||
Sales to external customers | $ | 1,543,098 | $ | 1,388,090 | $ | — | $ | 2,931,188 | ||||||||
Intersegment sales/(elimination) | 39,519 | 9,393 | (48,912 | ) | — | |||||||||||
Total sales | $ | 1,582,617 | $ | 1,397,483 | $ | (48,912 | ) | $ | 2,931,188 | |||||||
Income (loss) from operations | $ | 344,455 | $ | 171,446 | $ | (57,540 | ) | $ | 458,361 | |||||||
Interest expense and other, net | — | — | (45,524 | ) | (45,524 | ) | ||||||||||
Income (loss) from operations before income taxes | $ | 344,455 | $ | 171,446 | $ | (103,064 | ) | $ | 412,837 | |||||||
Depreciation and amortization | $ | 36,519 | $ | 31,545 | $ | 1,731 | $ | 69,795 | ||||||||
Capital expenditures | 22,726 | 20,987 | 6,503 | 50,216 | ||||||||||||
Segment assets | 2,949,668 | 6,720,302 | (3,088,952 | ) | 6,581,018 | |||||||||||
Segment financial information for 2015 is as follows: | ||||||||||||||||
Corporate | ||||||||||||||||
Freight | Transit | Activities and | ||||||||||||||
In thousands | Segment | Segment | Elimination | Total | ||||||||||||
Sales to external customers | $ | 2,054,715 | $ | 1,253,283 | $ | — | $ | 3,307,998 | ||||||||
Intersegment sales/(elimination) | 35,372 | 10,895 | (46,267 | ) | $ | — | ||||||||||
Total sales | $ | 2,090,087 | $ | 1,264,178 | $ | (46,267 | ) | $ | 3,307,998 | |||||||
Income (loss) from operations | $ | 482,640 | $ | 150,988 | $ | (26,061 | ) | $ | 607,567 | |||||||
Interest expense and other, net | — | — | (22,199 | ) | (22,199 | ) | ||||||||||
Income (loss) from operations before income taxes | $ | 482,640 | $ | 150,988 | $ | (48,260 | ) | $ | 585,368 | |||||||
Depreciation and amortization | $ | 36,834 | $ | 26,196 | $ | 1,704 | $ | 64,734 | ||||||||
Capital expenditures | 24,715 | 22,996 | 1,717 | 49,428 | ||||||||||||
Segment assets | 2,708,724 | 2,202,614 | (1,681,825 | ) | 3,229,513 | |||||||||||
Segment financial information for 2014 is as follows: | ||||||||||||||||
Corporate | ||||||||||||||||
Freight | Transit | Activities and | ||||||||||||||
In thousands | Segment | Segment | Elimination | Total | ||||||||||||
Sales to external customers | $ | 1,731,477 | $ | 1,312,977 | $ | — | $ | 3,044,454 | ||||||||
Intersegment sales/(elimination) | 36,185 | 7,358 | (43,543 | ) | — | |||||||||||
Total sales | $ | 1,767,662 | $ | 1,320,335 | $ | (43,543 | ) | $ | 3,044,454 | |||||||
Income (loss) from operations | $ | 402,456 | $ | 147,821 | $ | (23,168 | ) | $ | 527,109 | |||||||
Interest expense and other, net | — | — | (19,254 | ) | (19,254 | ) | ||||||||||
Income (loss) from operations before income taxes | $ | 402,456 | $ | 147,821 | $ | (42,422 | ) | $ | 507,855 | |||||||
Depreciation and amortization | $ | 34,579 | $ | 24,956 | $ | 1,726 | $ | 61,261 | ||||||||
Capital expenditures | 22,913 | 22,859 | 1,890 | 47,662 | ||||||||||||
Segment assets | 2,516,645 | 2,024,312 | (1,237,116 | ) | 3,303,841 | |||||||||||
87
The following geographic area data as of and for the years ended December 31, 2016, 2015 and 2014, respectively, includes net sales based on product shipment destination and long-lived assets, which consist of plant, property and equipment, net of depreciation, resident in their respective countries:
Net Sales | Long-Lived Assets | |||||||||||||||||||||||
In thousands | 2016 | 2015 | 2014 | 2016 | 2015 | 2014 | ||||||||||||||||||
United States | $ | 1,362,255 | $ | 1,754,924 | $ | 1,537,002 | $ | 205,895 | $ | 171,362 | $ | 158,913 | ||||||||||||
United Kingdom | 322,563 | 368,505 | 362,855 | 54,215 | 63,694 | 62,305 | ||||||||||||||||||
Canada | 206,258 | 204,674 | 175,561 | 5,156 | 4,876 | 5,462 | ||||||||||||||||||
Mexico | 183,583 | 190,034 | 174,218 | 8,766 | 8,839 | 7,812 | ||||||||||||||||||
China | 106,357 | 100,586 | 101,889 | 42,672 | 12,256 | 12,788 | ||||||||||||||||||
Germany | 98,364 | 92,422 | 86,792 | 57,902 | 31,642 | 33,441 | ||||||||||||||||||
Australia | 82,099 | 86,809 | 113,668 | 8,039 | 8,424 | 6,505 | ||||||||||||||||||
France | 66,287 | 45,565 | 41,469 | 33,636 | 7,194 | 7,686 | ||||||||||||||||||
Brazil | 51,493 | 84,595 | 83,906 | 13,227 | 9,318 | 5,074 | ||||||||||||||||||
Italy | 45,771 | 38,164 | 42,865 | 27,253 | 15,170 | 17,913 | ||||||||||||||||||
Netherlands | 25,452 | 25,869 | 19,452 | 11,534 | 7,506 | 10,201 | ||||||||||||||||||
Other international | 380,706 | 315,851 | 304,777 | 50,081 | 12,912 | 11,011 | ||||||||||||||||||
Total | $ | 2,931,188 | $ | 3,307,998 | $ | 3,044,454 | $ | 518,376 | $ | 353,193 | $ | 339,111 | ||||||||||||
Export sales from the Company’s United States operations were $470.5 million, $508.4 million and $521.7 million for the years ended December 31, 2016, 2015 and 2014, respectively.
Sales by product are as follows:
In thousands | 2016 | 2015 | 2014 | |||||||||
Specialty Products & Electronics | $ | 1,374,580 | $ | 1,733,881 | $ | 1,393,955 | ||||||
Brake Products | 588,081 | 627,552 | 662,336 | |||||||||
Remanufacturing, Overhaul & Build | 559,284 | 606,624 | 618,885 | |||||||||
Transit Products | 276,124 | 189,581 | 201,913 | |||||||||
Other | 133,119 | 150,360 | 167,365 | |||||||||
Total sales | $ | 2,931,188 | $ | 3,307,998 | $ | 3,044,454 | ||||||
88
21. GUARANTOR SUBSIDIARIES FINANCIAL INFORMATION
The obligations under the Company's 2016 Notes, 2013 Notes and Revolving Credit Facility and Term Loan are fully and unconditionally guaranteed by all U.S. subsidiaries as guarantors. Each guarantor is 100% owned by the parent company. In accordance with positions established by the Securities and Exchange Commission, the following shows separate financial information with respect to the parent, the guarantor subsidiaries and the non-guarantor subsidiaries. The principal elimination entries eliminate investment in subsidiaries and certain intercompany balances and transactions.
Balance Sheet for December 31, 2016:
In thousands | Parent | Guarantors | Non-Guarantors | Elimination | Consolidated | ||||||||||||||
Cash and cash equivalents | $ | 2,522 | $ | 9,496 | $ | 386,466 | $ | — | $ | 398,484 | |||||||||
Receivables, net | 79,041 | 202,779 | 660,688 | — | 942,508 | ||||||||||||||
Inventories | 120,042 | 128,076 | 410,392 | — | 658,510 | ||||||||||||||
Current assets - other | 52,576 | (17,844 | ) | 833,397 | — | 868,129 | |||||||||||||
Total current assets | 254,181 | 322,507 | 2,290,943 | — | 2,867,631 | ||||||||||||||
Property, plant and equipment | 49,031 | 126,661 | 342,684 | — | 518,376 | ||||||||||||||
Goodwill | 25,275 | 477,472 | 1,576,018 | — | 2,078,765 | ||||||||||||||
Investment in subsidiaries | 5,388,613 | 1,325,150 | — | (6,713,763 | ) | — | |||||||||||||
Other intangibles, net | 31,897 | 204,512 | 817,451 | — | 1,053,860 | ||||||||||||||
Other long term assets | 9,592 | (1,914 | ) | 54,708 | — | 62,386 | |||||||||||||
Total assets | $ | 5,758,589 | $ | 2,454,388 | $ | 5,081,804 | $ | (6,713,763 | ) | $ | 6,581,018 | ||||||||
Current liabilities | $ | 194,983 | 196,956 | $ | 1,054,700 | — | $ | 1,446,639 | |||||||||||
Inter-company | 1,562,399 | (1,848,777 | ) | 286,378 | — | — | |||||||||||||
Long-term debt | 1,761,933 | 58 | 976 | — | 1,762,967 | ||||||||||||||
Long-term liabilities - other | 33,298 | 74,977 | 286,312 | — | 394,587 | ||||||||||||||
Total liabilities | 3,552,613 | (1,576,786 | ) | 1,628,366 | — | 3,604,193 | |||||||||||||
Shareholders' equity | 2,205,976 | 4,032,250 | 2,681,514 | (6,713,763 | ) | 2,205,977 | |||||||||||||
Non-controlling interest | — | (1,076 | ) | 771,924 | — | 770,848 | |||||||||||||
Total shareholders' equity | $ | 2,205,976 | $ | 4,031,174 | $ | 3,453,438 | $ | (6,713,763 | ) | $ | 2,976,825 | ||||||||
Total Liabilities and Shareholders' Equity | $ | 5,758,589 | $ | 2,454,388 | $ | 5,081,804 | $ | (6,713,763 | ) | $ | 6,581,018 | ||||||||
89
Balance Sheet for December 31, 2015:
In thousands | Parent | Guarantors | Non-Guarantors | Elimination | Consolidated | ||||||||||||||
Cash and cash equivalents | $ | — | $ | 13,157 | $ | 213,034 | $ | — | $ | 226,191 | |||||||||
Receivables, net | 83,449 | 230,221 | 285,119 | — | 598,789 | ||||||||||||||
Inventories | 136,224 | 133,332 | 209,018 | — | 478,574 | ||||||||||||||
Current assets - other | 15,613 | 3,562 | 217,291 | — | 236,466 | ||||||||||||||
Total current assets | 235,286 | 380,272 | 924,462 | — | 1,540,020 | ||||||||||||||
Property, plant and equipment | 43,275 | 128,089 | 181,829 | — | 353,193 | ||||||||||||||
Goodwill | 25,275 | 472,374 | 360,883 | — | 858,532 | ||||||||||||||
Investment in subsidiaries | 3,516,159 | 624,031 | — | (4,140,190 | ) | — | |||||||||||||
Other intangibles, net | 33,224 | 208,040 | 199,270 | — | 440,534 | ||||||||||||||
Other long term assets | (8,525 | ) | 3,162 | 42,597 | — | 37,234 | |||||||||||||
Total assets | $ | 3,844,694 | $ | 1,815,968 | $ | 1,709,041 | $ | (4,140,190 | ) | $ | 3,229,513 | ||||||||
Current liabilities | $ | 178,132 | 222,231 | $ | 264,413 | — | $ | 664,776 | |||||||||||
Inter-company | 1,238,536 | (1,596,142 | ) | 357,606 | — | — | |||||||||||||
Long-term debt | 691,512 | 121 | 172 | — | 691,805 | ||||||||||||||
Long-term liabilities - other | 36,907 | 47,172 | 87,514 | — | 171,593 | ||||||||||||||
Total liabilities | 2,145,087 | (1,326,618 | ) | 709,705 | — | 1,528,174 | |||||||||||||
Shareholders' equity | 1,699,607 | 3,143,472 | 996,718 | (4,140,190 | ) | 1,699,607 | |||||||||||||
Non-controlling interest | — | (886 | ) | 2,618 | — | 1,732 | |||||||||||||
Total shareholders' equity | $ | 1,699,607 | $ | 3,142,586 | $ | 999,336 | $ | (4,140,190 | ) | $ | 1,701,339 | ||||||||
Total Liabilities and Shareholders' Equity | $ | 3,844,694 | $ | 1,815,968 | $ | 1,709,041 | $ | (4,140,190 | ) | $ | 3,229,513 | ||||||||
Income Statement for the Year Ended December 31, 2016:
In thousands | Parent | Guarantors | Non-Guarantors | Elimination | Consolidated | ||||||||||||||
Net Sales | $ | 641,809 | $ | 1,112,001 | $ | 1,322,937 | $ | (145,559 | ) | $ | 2,931,188 | ||||||||
Cost of sales | (473,700 | ) | (708,062 | ) | (928,608 | ) | 103,421 | (2,006,949 | ) | ||||||||||
Gross profit (loss) | 168,109 | 403,939 | 394,329 | (42,138 | ) | 924,239 | |||||||||||||
Total operating expenses | (141,940 | ) | (122,617 | ) | (201,321 | ) | — | (465,878 | ) | ||||||||||
Income (loss) from operations | 26,169 | 281,322 | 193,008 | (42,138 | ) | 458,361 | |||||||||||||
Interest (expense) income, net | (34,975 | ) | 7,012 | (14,598 | ) | — | (42,561 | ) | |||||||||||
Other income (expense), net | 20,509 | (2,284 | ) | (21,188 | ) | — | (2,963 | ) | |||||||||||
Equity earnings (loss) | 322,650 | 131,234 | — | (453,884 | ) | — | |||||||||||||
Pretax income (loss) | 334,353 | 417,284 | 157,222 | (496,022 | ) | 412,837 | |||||||||||||
Income tax expense | (29,466 | ) | (57,667 | ) | (12,300 | ) | — | (99,433 | ) | ||||||||||
Net income (loss) | 304,887 | 359,617 | 144,922 | (496,022 | ) | 313,404 | |||||||||||||
Less: Net income attributable to noncontrolling interest | — | — | (8,517 | ) | — | (8,517 | ) | ||||||||||||
Net income (loss) attributable to Wabtec shareholders | $ | 304,887 | $ | 359,617 | $ | 136,405 | $ | (496,022 | ) | $ | 304,887 | ||||||||
Comprehensive income (loss) attributable to Wabtec shareholders | $ | 305,180 | $ | 359,617 | $ | 33,226 | $ | (496,022 | ) | $ | 202,001 | ||||||||
90
Income Statement for the Year Ended December 31, 2015:
In thousands | Parent | Guarantors | Non-Guarantors | Elimination | Consolidated | ||||||||||||||
Net Sales | $ | 743,262 | $ | 1,436,935 | $ | 1,300,577 | $ | (172,776 | ) | $ | 3,307,998 | ||||||||
Cost of sales | (531,269 | ) | (843,104 | ) | (976,798 | ) | 90,989 | (2,260,182 | ) | ||||||||||
Gross profit (loss) | 211,993 | 593,831 | 323,779 | (81,787 | ) | 1,047,816 | |||||||||||||
Total operating expenses | (142,953 | ) | (131,251 | ) | (166,045 | ) | — | (440,249 | ) | ||||||||||
(Loss) income from operations | 69,040 | 462,580 | 157,734 | (81,787 | ) | 607,567 | |||||||||||||
Interest (expense) income, net | (23,129 | ) | 5,914 | 327 | — | (16,888 | ) | ||||||||||||
Other income (expense), net | 23,193 | (9,140 | ) | (19,364 | ) | — | (5,311 | ) | |||||||||||
Equity earnings (loss) | 506,903 | 112,286 | — | (619,189 | ) | — | |||||||||||||
Pretax income (loss) | 576,007 | 571,640 | 138,697 | (700,976 | ) | 585,368 | |||||||||||||
Income tax expense | (177,379 | ) | 8,989 | (18,350 | ) | — | (186,740 | ) | |||||||||||
Net income (loss) | 398,628 | 580,629 | 120,347 | (700,976 | ) | 398,628 | |||||||||||||
Less: Net income attributable to noncontrolling interest | — | — | — | — | — | ||||||||||||||
Net income attributable to Wabtec shareholders | $ | 398,628 | $ | 580,629 | $ | 120,347 | $ | (700,976 | ) | $ | 398,628 | ||||||||
Comprehensive income (loss) attributable to Wabtec shareholders | $ | 409,734 | $ | 580,629 | $ | (7,992 | ) | $ | (700,976 | ) | $ | 281,395 | |||||||
Income Statement for the Year Ended December 31, 2014:
In thousands | Parent | Guarantors | Non-Guarantors | Elimination | Consolidated | ||||||||||||||
Net Sales | $ | 722,317 | $ | 1,239,154 | $ | 1,278,876 | $ | (195,893 | ) | $ | 3,044,454 | ||||||||
Cost of sales | (516,607 | ) | (730,946 | ) | (982,072 | ) | 121,153 | (2,108,472 | ) | ||||||||||
Gross (loss) profit | 205,710 | 508,208 | 296,804 | (74,740 | ) | 935,982 | |||||||||||||
Total operating expenses | (140,002 | ) | (116,569 | ) | (152,302 | ) | — | (408,873 | ) | ||||||||||
(Loss) income from operations | 65,708 | 391,639 | 144,502 | (74,740 | ) | 527,109 | |||||||||||||
Interest (expense) income, net | (23,551 | ) | 5,793 | 184 | — | (17,574 | ) | ||||||||||||
Other income (expense), net | 18,295 | (3,334 | ) | (16,641 | ) | — | (1,680 | ) | |||||||||||
Equity earnings (loss) | 399,507 | 89,931 | — | (489,438 | ) | — | |||||||||||||
Pretax income (loss) | 459,959 | 484,029 | 128,045 | (564,178 | ) | 507,855 | |||||||||||||
Income tax expense | (108,279 | ) | (15,222 | ) | (32,674 | ) | — | (156,175 | ) | ||||||||||
Net income (loss) | 351,680 | 468,807 | 95,371 | (564,178 | ) | 351,680 | |||||||||||||
Less: Net income attributable to noncontrolling interest | — | — | — | — | — | ||||||||||||||
Net income attributable to Wabtec shareholders | $ | 351,680 | $ | 468,807 | $ | 95,371 | $ | (564,178 | ) | $ | 351,680 | ||||||||
Comprehensive income (loss) attributable to Wabtec shareholders | $ | 345,581 | $ | 468,807 | $ | (23,160 | ) | $ | (564,178 | ) | $ | 227,050 | |||||||
91
Condensed Statement of Cash Flows for the year ended December 31, 2016:
In thousands | Parent | Guarantors | Non-Guarantors | Elimination | Consolidated | ||||||||||||||
Net cash (used in) provided by operating activities | $ | (45,834 | ) | $ | 332,822 | $ | 204,457 | $ | (42,138 | ) | $ | 449,307 | |||||||
Net cash used in investing activities | (829,783 | ) | (14,725 | ) | 69,443 | — | (775,065 | ) | |||||||||||
Net cash provided by (used in) financing activities | 878,139 | (321,758 | ) | (74,325 | ) | 42,138 | 524,194 | ||||||||||||
Effect of changes in currency exchange rates | — | — | (26,143 | ) | — | (26,143 | ) | ||||||||||||
Increase (decrease) in cash | 2,522 | (3,661 | ) | 173,432 | — | 172,293 | |||||||||||||
Cash, beginning of year | — | 13,157 | 213,034 | — | 226,191 | ||||||||||||||
Cash, end of year | $ | 2,522 | $ | 9,496 | $ | 386,466 | $ | — | $ | 398,484 | |||||||||
Condensed Statement of Cash Flows for the year ended December 31, 2015:
In thousands | Parent | Guarantors | Non-Guarantors | Elimination | Consolidated | ||||||||||||||
Net cash provided by (used in) operating activities | $ | (92,958 | ) | $ | 487,516 | $ | 135,489 | $ | (81,787 | ) | $ | 448,260 | |||||||
Net cash used in investing activities | (7,862 | ) | (109,326 | ) | (262,948 | ) | — | (380,136 | ) | ||||||||||
Net cash (used in) provided by financing activities | (45,986 | ) | (378,330 | ) | 93,615 | 81,787 | (248,914 | ) | |||||||||||
Effect of changes in currency exchange rates | — | — | (18,868 | ) | — | (18,868 | ) | ||||||||||||
(Decrease) increase in cash | (146,806 | ) | (140 | ) | (52,712 | ) | — | (199,658 | ) | ||||||||||
Cash, beginning of year | 146,806 | 13,297 | 265,746 | — | 425,849 | ||||||||||||||
Cash, end of year | $ | — | $ | 13,157 | $ | 213,034 | $ | — | $ | 226,191 | |||||||||
Condensed Statement of Cash Flows for the year ended December 31, 2014:
In thousands | Parent | Guarantors | Non-Guarantors | Elimination | Consolidated | ||||||||||||||
Net cash provided by (used in) operating activities | $ | 58,451 | $ | 452,641 | $ | 36,033 | $ | (74,740 | ) | $ | 472,385 | ||||||||
Net cash used in investing activities | (8,637 | ) | (20,239 | ) | (318,802 | ) | — | (347,678 | ) | ||||||||||
Net cash provided by (used in) financing activities | 61,460 | (426,911 | ) | 316,217 | 74,740 | 25,506 | |||||||||||||
Effect of changes in currency exchange rates | — | — | (10,124 | ) | — | (10,124 | ) | ||||||||||||
Increase in cash | 111,274 | 5,491 | 23,324 | — | 140,089 | ||||||||||||||
Cash, beginning of year | 35,532 | 7,806 | 242,422 | — | 285,760 | ||||||||||||||
Cash, end of year | $ | 146,806 | $ | 13,297 | $ | 265,746 | $ | — | $ | 425,849 | |||||||||
22. OTHER (EXPENSE) INCOME, NET
The components of other (expense) income, net are as follows:
For the year ended December 31, | ||||||||||||
In thousands | 2016 | 2015 | 2014 | |||||||||
Foreign currency loss | $ | (4,001 | ) | $ | (4,659 | ) | $ | (2,445 | ) | |||
Other miscellaneous income (expense) | 1,038 | (652 | ) | 765 | ||||||||
Total other (expense) income, net | $ | (2,963 | ) | $ | (5,311 | ) | $ | (1,680 | ) | |||
92
23. SELECTED QUARTERLY FINANCIAL DATA (UNAUDITED)
First | Second | Third | Fourth | |||||||||||||
In thousands, except per share data | Quarter | Quarter | Quarter | Quarter | ||||||||||||
2016 | ||||||||||||||||
Net sales | $ | 772,031 | $ | 723,601 | $ | 675,574 | $ | 759,982 | ||||||||
Gross profit | 255,180 | 237,389 | 212,481 | 219,189 | ||||||||||||
Income from operations | 142,181 | 133,284 | 120,096 | 62,800 | ||||||||||||
Net income attributable to Wabtec shareholders | 94,163 | 90,485 | 82,428 | 37,811 | ||||||||||||
Basic earnings from operations per common share | $ | 1.03 | $ | 1.00 | $ | 0.92 | $ | 0.42 | ||||||||
Diluted earnings from operations per common share | $ | 1.02 | $ | 1.00 | $ | 0.91 | $ | 0.42 | ||||||||
2015 | ||||||||||||||||
Net sales | $ | 818,594 | $ | 847,028 | $ | 809,527 | $ | 832,849 | ||||||||
Gross profit | 255,355 | 267,764 | 257,069 | 267,628 | ||||||||||||
Income from operations | 148,420 | 155,860 | 152,078 | 151,209 | ||||||||||||
Net income attributable to Wabtec shareholders | 96,164 | 101,504 | 99,181 | 101,779 | ||||||||||||
Basic earnings from operations per common share | $ | 1.00 | $ | 1.05 | $ | 1.03 | $ | 1.06 | ||||||||
Diluted earnings from operations per common share | $ | 0.99 | $ | 1.04 | $ | 1.02 | $ | 1.05 | ||||||||
The Company operates on a four-four-five week accounting quarter, and the quarters end on or about March 31, June 30 and September 30. The fiscal year ends on December 31.
93
SCHEDULE II
WESTINGHOUSE AIR BRAKE TECHNOLOGIES CORPORATION
VALUATION AND QUALIFYING ACCOUNTS
For each of the three years ended December 31
In thousands | Balance at beginning of period | Charged/ (credited) to expense | Charged/ (credited) to other accounts (1) | Deductions from reserves (2) | Balance at end of period | |||||||||||||||
2016 | ||||||||||||||||||||
Warranty and overhaul reserves | $ | 92,064 | $ | 28,947 | $ | 56,753 | $ | 38,772 | $ | 138,992 | ||||||||||
Allowance for doubtful accounts | 5,614 | 3,635 | — | 1,909 | 7,340 | |||||||||||||||
Valuation allowance-taxes | 12,623 | 3,405 | 5,390 | — | 21,418 | |||||||||||||||
Merger and restructuring reserve | 622 | — | — | 59 | 563 | |||||||||||||||
2015 | ||||||||||||||||||||
Warranty and overhaul reserves | $ | 87,849 | $ | 35,418 | $ | (1,762 | ) | $ | 29,441 | $ | 92,064 | |||||||||
Allowance for doubtful accounts | 6,270 | 2,026 | — | 2,682 | 5,614 | |||||||||||||||
Valuation allowance-taxes | 1,818 | 7,024 | 3,781 | — | 12,623 | |||||||||||||||
Merger and restructuring reserve | 686 | — | — | 64 | 622 | |||||||||||||||
2014 | ||||||||||||||||||||
Warranty and overhaul reserves | $ | 60,593 | $ | 34,110 | $ | 12,717 | $ | 19,571 | $ | 87,849 | ||||||||||
Allowance for doubtful accounts | 5,707 | 4,200 | — | 3,637 | 6,270 | |||||||||||||||
Valuation allowance-taxes | 3,332 | (1,514 | ) | — | — | 1,818 | ||||||||||||||
Merger and restructuring reserve | 775 | — | — | 89 | 686 | |||||||||||||||
(1) | Reserves of acquired/(sold) companies; valuation allowances for state and foreign deferred tax assets; impact of fluctuations in foreign currency exchange rates. |
(2) | Actual disbursements and/or charges. |
94
SIGNATURES
Pursuant to the requirements of Section 13 or 15(d) of the Securities Exchange Act of 1934, the Company has duly caused this report to be signed on its behalf by the undersigned, thereunto duly authorized.
WESTINGHOUSE AIR BRAKE TECHNOLOGIES CORPORATION | |||
Date: | February 28, 2017 | By: | /S/ RAYMOND T. BETLER |
Raymond T. Betler, | |||
President and Chief Executive Officer, and Director | |||
Pursuant to the requirements of the Securities Exchange Act of 1934, this report has been signed below by the following persons on behalf of the Company and in the capacities and on the dates indicated.
Signature and Title | Date | |
By | /S/ ALBERT J. NEUPAVER | February 28, 2017 |
Albert J. Neupaver, Executive Chairman of the Board | ||
By | /S/ RAYMOND T. BETLER | February 28, 2017 |
Raymond T. Betler, President and Chief Executive Officer and Director (Principal Executive Officer) | ||
By | /S/ PATRICK D. DUGAN | February 28, 2017 |
Patrick D. Dugan, Executive Vice President Finance and Chief Financial Officer (Principal Financial Officer) | ||
By | /S/ JOHN A. MASTALERZ | February 28, 2017 |
John A. Mastalerz, Vice President and Principal Accounting Officer | ||
By | /S/ WILLIAM E. KASSLING | February 28, 2017 |
William E. Kassling, Lead Director | ||
By | /S/ PHILIPPE ALFROID | February 28, 2017 |
Philippe Alfroid, Director | ||
By | /S/ ROBERT J. BROOKS | February 28, 2017 |
Robert J. Brooks, Director | ||
By | /S/ ERWAN FAIVELEY | February 28, 2017 |
Erwan Faiveley, Director | ||
95
/S/ EMILIO A. FERNANDEZ | February 28, 2017 | |
Emilio A. Fernandez, Director | ||
By | /S/ LEE B. FOSTER, II | February 28, 2017 |
Lee B. Foster, II, Director | ||
By | /S/ LINDA S. HARTY | February 28, 2017 |
Linda S. Harty, Director | ||
By | /S/ BRIAN P. HEHIR | February 28, 2017 |
Brian P. Hehir, Director | ||
By | /S/ MICHAEL W. D. HOWELL | February 28, 2017 |
Michael W. D. Howell, Director | ||
By | /S/ NICKOLAS W. VANDE STEEG | February 28, 2017 |
Nickolas W. Vande Steeg, Director | ||
96
EXHIBIT INDEX
Exhibits | Filing Method | ||
2.1 | Offer relating to Faiveley Transport, S.A. among Financiere Faiveley S.A., Famille Faiveley Participations, Francois Faiveley, Erwan Faiveley, FW Acquisition, LLC, and Wabtec Corporation dated as of July 27, 2015 | 15 | |
2.2 | Exclusivity Agreement among Financiere Faiveley S.A., Famille Faiveley Participations Francois Faiveley, Erwan Faiveley, FW Acquisition, LLC, and Wabtec Corporation dated as of July 27, 2015 | 15 | |
2.3 | Share Purchase Agreement among Financiere Faiveley S.A., Famille Faiveley Participations Francois Faiveley, Erwan Faiveley, FW Acquisition, LLC and Wabtec Corporation dated as of October 6, 2015 | 16 | |
2.4 | Tender Offer Agreement among Faiveley Transport S.A., FW Acquisition, LLC, and Wabtec Corporation dated as of October 6, 2015 | 16 | |
2.5 | Shareholder's Agreement among Financiere Faiveley S.A., FW Acquisition, LLC, and Wabtec Corporation dated as of October 6, 2015 | 16 | |
2.6 | Amendment No. 1 to Share Purchase Agreement among Mr. Erwan Faiveley, Wabtec France, and Wabtec Corporation dated as of October 24, 2016 | 17 | |
2.7 | Amendment No. 1 to Tender Offer Agreement among Faiveley Transport, S.A., Wabtec France, and Wabtec Corporation dated as of October 24, 2016 | 17 | |
2.8 | Amendment No. 1 to Shareholder’s Agreement among Financiere Faiveley S.A., Famille Faiveley Participations, Francois Faiveley, Erwan Faiveley, and Wabtec Corporation dated as of dated as of October 24, 2016 | 17 | |
3.1 | Restated Certificate of Incorporation of the Company dated January 30, 1995, as amended December 31, 2003 | 9 | |
3.2 | Certificate of Amendment of Restated Certificate of Incorporation dated May 14, 2013 | 11 | |
3.3 | Amended and By-Laws of the Company, effective May 14, 2014 | 8 | |
4.1 | Indenture, dated August 8, 2013 by and between the Company and Wells Fargo, National Association, as Trustee | 12 | |
4.2 | First Supplemental Indenture, dated August 8, 2013, by and between the Company and Wells Fargo Bank, National Association, as Trustee | 12 | |
4.3 | Form of 4.375% Senior Note due 2023 (included in Exhibit 4.2) | 12 | |
4.4 | Second Supplemental Indenture, dated November 3, 2016, by and among Westinghouse Air Brake Technologies Corporation, the subsidiary guarantors named therein and Wells Fargo Bank, National Association, as Trustee | 19 | |
4.5 | Third Supplemental Indenture, dated November 3, 2016, by and among Westinghouse Air Brake Technologies Corporation, the subsidiary guarantors named therein and Wells Fargo Bank, National Association, as Trustee. | 19 | |
4.6 | Form of 3.450% Senior Note due 2026 (included in Exhibit 4.5). | 19 | |
4.7 | Registration Rights Agreement, by and among Westinghouse Air Brake Technologies Corporation, the guarantors listed therein and J.P. Morgan Securities LLC, Merrill Lynch, Pierce, Fenner & Smith Incorporated and PNC Capital Markets LLC, as representatives of the several initial purchasers named in the Purchase Agreement (as defined therein). | 19 | |
4.8 | Purchase Agreement, dated October 31, 2016, by and among Westinghouse Air Brake Technologies Corporation, the subsidiary guarantors named therein and J.P. Morgan Securities LLC, Merrill Lynch, Pierce, Fenner & Smith Incorporated and PNC Capital Markets LLC, as representatives of the several initial purchasers named therein. | 18 | |
4.9 | Fourth Supplemental Indenture, dated February 9, 2017, by and among Westinghouse Air Brake Technologies Corporation, the subsidiary guarantors named therein and Wells Fargo Bank, National Association, as Trustee. | 1 | |
10.1 | Agreement of Sale and Purchase of the North American Operations of the Railway Products Group, an operating division of American Standard Inc. (now known as Trane), dated as of 1990 between Rail Acquisition Corp. and American Standard Inc. (only provisions on indemnification are reproduced) | 2 | |
10.2 | Letter Agreement (undated) between the Company and American Standard Inc. (now known as Trane) on environmental costs and sharing | 2 | |
97
10.3 | Purchase Agreement dated as of June 17, 1992 among the Company, Schuller International, Inc., Manville Corporation and European Overseas Corporation (only provisions on indemnification are reproduced) | 2 | |
10.4 | Westinghouse Air Brake Company 1995 Non-Employee Directors’ Fee and Stock Option Plan, as amended * | 4 | |
10.5 | Westinghouse Air Brake Technologies Corporation 2000 Stock Incentive Plan, as amended * | 4 | |
10.6 | Employment Agreement with Albert J. Neupaver, dated February 1, 2006 * | 3 | |
10.7 | Form of Restricted Stock Agreement * | 10 | |
10.8 | Westinghouse Air Brake Technologies Corporation 2011 Stock Incentive Plan * | 5 | |
10.9 | Stock Purchase Agreement, by and among the Company, Standard Car Truck Company and Robclif, Inc., dated September 12, 2008 | 6 | |
10.10 | First Amended and Restated Refinancing Credit Agreement, dated as of December 19, 2013, by and among the Company, Wabtec Cooperatief UA, certain subsidiaries as the guarantors, the lenders party thereto and, PNC Bank, National Association, as Administrative Agent, PNC Capital Markets LLC, J.P. Morgan Securities, Inc., as Joint Lead Arranges and Joint Book Runners, JP Morgan Chase Bank, N.A. as Syndication Agent, Bank of America, N.A., and Citizens Bank of Pennsylvania, Branch Banking and Trust Company and The Bank of Toyko-Mitsubish UFJ, Ltd., as Co-Documentation Agents | 13 | |
10.11 | Second Amended and Restated Refinancing Credit Agreement, dated as of June 22, 2016, by and among the Company, Wabtec Cooperatief UA, as borrowers, certain subsidiaries of the Company as guarantors and the lenders party thereto and PNC Bank, National Association, as Administrative Agent, PNC Capital Markets LLC, Merrill Lynch, Pierce, Fenner & Smith Inc., JPMorgan Chase Bank, N.A., HSBC Bank, USA, National Association and Société Générale, as Joint Lead Arrangers and Joint Bookrunners, Bank of America, National Association and JPMorgan Chase Bank, N.A., as Co-Syndication Agents, and HSBC Bank USA, National Association and Société Générale, as Co-Documentation Agents. | 14 | |
10.12 | Form of Employment Continuation Agreement entered into by the Company with Albert J. Neupaver, Raymond T. Betler, Charles F. Kovac, R. Mark Cox, David L. DeNinno, Patrick D. Dugan, Scott E. Wahlstrom, Michael E. Fetsko and Timothy R. Wesley* | 7 | |
10.13 | Amended and Restated Employment Agreement with Stephane Rambaud-Measson dated October 24, 2016* | 1 | |
10.14 | Amended and Restated Employment Agreement with Guillaume Bouhours dated October 24, 2016* | 1 | |
10.15 | Wabtec Corporation Deferred Compensation Plan for Executive Officers and Directors as adopted December 10, 2009 * | 10 | |
10.16 | Form of Agreement for Nonstatutory Stock Option under the 1995 Non-Employee Directors’ Fee and Stock Option Plan, as amended * | 10 | |
10.17 | Form of Agreement for Nonstatutory Stock Options under 2000 Stock Incentive Plan, as amended * | 10 | |
10.18 | Form of Agreement for Nonstatutory Stock Options under 2011 Stock Incentive Plan as amended * | 10 | |
21.0 | List of subsidiaries of the Company | 1 | |
23.1 | Consent of Ernst & Young LLP | 1 | |
23.2 | Consent of PricewaterhouseCoopers Audit | 1 | |
31.1 | Rule 13a-14(a)/15d-14(a) Certifications | 1 | |
31.2 | Rule 13a-14(a)/15d-14(a) Certifications | 1 | |
32.1 | Section 1350 Certifications | 1 | |
101.INS | XBRL Instance Document. | 1 | |
101.SCH | XBRL Taxonomy Extension Calculation Linkbase Document | 1 | |
101.CAL | XBRL Taxonomy Extension Calculation Linkbase Document | 1 | |
101.DEF | XBRL Taxonomy Extension Definition Linkbase Document. | 1 | |
101.LAB | XBRL Taxonomy Extension Label Linkbase Document | 1 | |
101.PRE | XBRL Taxonomy Extension Presentation Linkbase Document | 1 | |
1 | Filed herewith. | |
2 | Filed as an exhibit to the Company’s Registration Statement on Form S-1 (File No. 33-90866). | |
98
3 | Filed as an exhibit to the Company’s Quarterly Report on Form 10-Q (File No. 033-90866) for the period ended March 31, 2006. | |
4 | Filed as an Annex to the Company’s Schedule 14A Proxy Statement (File No. 1-13782) filed on April 13, 2006. | |
5 | Filed as an Annex to the Company’s Schedule 14A Proxy Statement (File No. 1-13782) filed on March 31, 2011. | |
6 | Filed as an exhibit to the Company’s Quarterly Report on Form 10-Q (File No. 1-13782) for the period ended September 30, 2008. | |
7 | Filed as an exhibit to the Company’s Current Report on Form 8-K (File No. 1-13782) dated July 2, 2009. | |
8 | Filed as an exhibit to the Company’s Current Report on Form 8-K (File No. 1-13782), dated May 19, 2014. | |
9 | Filed as an exhibit to the Company’s Annual Report on Form 10-K (File No. 1-13782), dated February 25, 2011. | |
10 | Filed as an exhibit to the Company’s Annual Report on Form 10-K (File No. 1-13782), dated February 22, 2013. | |
11 | Filed as an exhibit to the Company’s Current Report on Form 8-K (File No. 1-13782), dated May 15, 2013. | |
12 | Filed as an exhibit to the Company’s Current Report on Form 8-K (File No. 1-13782), dated August 8, 2013. | |
13 | Filed as an exhibit to the Company’s Annual Report on Form 10-K (File No. 1-13782), dated February 21, 2014. | |
14 | Filed as an exhibit to the Company's Current Report on Form 8-K (File No. 1-13782), dated June 24, 2016. | |
15 | Filed as an exhibit to the Company's Current Report on Form 8-K (File No. 1-13782), dated July 30, 2015. | |
16 | Filed as an exhibit to the Company's Current Report on Form 8-K (File No. 1-13782), dated October 6, 2015. | |
17 | Filed as an exhibit to the Company's Current Report on Form 8-K (File No. 1-13782), dated October 26, 2016. | |
18 | Filed as an exhibit to the Company's Current Report on Form 8-K (File No. 1-13782), dated November 1, 2016. | |
19 | Filed as an exhibit to the Company's Current Report on Form 8-K (File No. 1-13782), dated November 3, 2016. | |
* | Management contract or compensatory plan. |
99