Attached files
| file | filename |
|---|---|
| EX-10.67 - EXHIBIT 10.67 - Univar Solutions Inc. | unvr-12312016xex1067.htm |
| EX-32.2 - EXHIBIT 32.2 - Univar Solutions Inc. | unvr-12312016xex322.htm |
| EX-32.1 - EXHIBIT 32.1 - Univar Solutions Inc. | unvr-12312016xex321.htm |
| EX-31.2 - EXHIBIT 31.2 - Univar Solutions Inc. | unvr-12312016xex312.htm |
| EX-31.1 - EXHIBIT 31.1 - Univar Solutions Inc. | unvr-12312016xex311.htm |
| EX-23.1 - EXHIBIT 23.1 - Univar Solutions Inc. | unvr-12312016xex231.htm |
| EX-21.1 - EXHIBIT 21.1 - Univar Solutions Inc. | unvr-12312016xex211.htm |
| EX-10.68 - EXHIBIT 10.68 - Univar Solutions Inc. | unvr-12312016xex1068.htm |
| EX-10.66 - EXHIBIT 10.66 - Univar Solutions Inc. | unvr-12312016xex1066.htm |
| EX-10.65 - EXHIBIT 10.65 - Univar Solutions Inc. | unvr-12312016xex1065.htm |
| EX-10.25 - EXHIBIT 10.25 - Univar Solutions Inc. | unvr-12312016xex1025.htm |
| EX-10.24 - EXHIBIT 10.24 - Univar Solutions Inc. | unvr-12312016xex1024.htm |
| EX-10.18 - EXHIBIT 10.18 - Univar Solutions Inc. | unvr-12312016xex1018.htm |
UNITED STATES
SECURITIES AND EXCHANGE COMMISSION
Washington, D.C. 20549
__________________________________________________________
Form 10-K
__________________________________________________________
ý | ANNUAL REPORT PURSUANT TO SECTION 13 OR 15(d) OF THE SECURITIES EXCHANGE ACT OF 1934 |
For the fiscal year ended December 31, 2016
or
¨ | TRANSITION REPORT PURSUANT TO SECTION 13 OR 15(d) OF THE SECURITIES EXCHANGE ACT OF 1934 |
For the transition period from to
Commission File Number 001-37443
_________________________________________________________
Univar Inc.
(Exact name of registrant as specified in its charter)
__________________________________________________________
Delaware | 26-1251958 |
(State or other jurisdiction of incorporation or organization) | (I.R.S. Employer Identification No.) |
3075 Highland Parkway, Suite 200 Downers Grove, Illinois | 60515 |
(Address of principal executive offices) | (Zip Code) |
Registrant’s telephone number, including area code: (331) 777-6000
__________________________________________________________
Securities registered pursuant to Section 12(b) of the Act:
Title of each class | Name of each exchange on which registered |
Common Stock ($0.01 par value) | New York Stock Exchange |
Securities registered pursuant to Section 12(g) of the Act: None
Indicate by check mark if the registrant is a well-known seasoned issuer, as defined in Rule 405 of the Securities Act. Yes ý No ¨
Indicate by check mark if the registrant is not required to file reports pursuant to Section 13 or Section 15(d) of the Act. Yes ¨ No ý
Indicate by check mark whether the registrant (1) has filed all reports required to be filed by Section 13 or 15(d) of the Securities Exchange Act of 1934 during the preceding 12 months (or for such shorter period that the registrant was required to file such reports), and (2) has been subject to such filing requirements for the past 90 days. Yes ý No ¨
Indicate by check mark whether the registrant has submitted electronically and posted on its corporate Web site, if any, every Interactive Data File required to be submitted and posted pursuant to Rule 405 of Regulation S-T (§ 232.405 of this chapter) during the preceding 12 months (or for such shorter period that the registrant was required to submit and post such files). Yes ý No ¨
Indicate by check mark if disclosure of delinquent filers pursuant to Item 405 of Regulation S-K (§ 229.405 of this chapter) is not contained herein, and will not be contained, to the best of registrant’s knowledge, in definitive proxy or information statements incorporated by reference in Part III of this Form 10-K or any amendment to this Form 10-K. ¨
Indicate by check mark whether the registrant is a large accelerated filer, an accelerated filer, a non-accelerated filer, or a smaller reporting company. See the definitions of “large accelerated filer,” “accelerated filer” and “smaller reporting company” in Rule 12b-2 of the Exchange Act.
Large accelerated filer | ý | Accelerated filer | ¨ |
Non-accelerated filer | ¨ | Smaller reporting company | ¨ |
Indicate by check mark whether the registrant is a shell company (as defined in Rule 12b-2 of the Act). Yes ¨ No ý
Aggregate market value of common stock held by non-affiliates of registrant on June 30, 2016: $770.5 million (see Item 12, under Part III hereof), based on a closing price of registrant’s Common Stock of $18.91 per share.
At February 10, 2017, 139,846,144 shares of the registrant’s common stock, $0.01 par value, were outstanding.
Documents Incorporated by Reference
Certain portions of the registrant’s Proxy Statement for the Annual Meeting of Stockholders to be held May 4, 2017 and to be filed within 120 days after the registrant’s fiscal year ended December 31, 2016 (hereinafter referred to as “Proxy Statement”) are incorporated by reference into Part III.
Univar Inc.
Form 10-K
TABLE OF CONTENTS
Page | ||
Item 1. | ||
Item 1A. | ||
Item 1B. | ||
Item 2. | ||
Item 3. | ||
Item 4. | ||
Item 5. | ||
Item 6. | ||
Item 7. | ||
Item 7A. | ||
Item 8. | ||
Item 9. | ||
Item 9A. | ||
Item 9B. | ||
Item 10. | ||
Item 11. | ||
Item 12. | ||
Item 13. | ||
Item 14. | ||
Item 15. | ||
2
SUPPLEMENTAL INFORMATION
Unless the context otherwise indicates or requires, as used in this Annual Report on Form 10-K, (i) the terms “we,” “our,” “us,” “Univar” and the “Company,” refer to Univar Inc. and its consolidated subsidiaries, and (ii) the term “issuer” refers to Univar Inc. exclusive of its subsidiaries.
Our fiscal year ends on December 31, and references to “fiscal” when used in reference to any twelve month period ended December 31, refer to our fiscal years ended December 31.
The term “GAAP” refers to accounting principles generally accepted in the United States of America.
____________________________________
Forward-looking statements and information
This Annual Report on Form 10-K contains forward-looking statements within the meaning of the Private Securities litigation Reform Act of 1995. Some of the forward-looking statements can be identified by the use of forward-looking terms such as “believes,” “expects,” “may,” “will,” “should,” “could,” “seeks,” “intends,” “plans,” “estimates,” “anticipates” or other comparable terms. These forward-looking statements include all matters that are not historical facts. They appear in a number of places throughout this Annual Report on Form 10-K and include statements regarding our intentions, beliefs or current expectations concerning, among other things, our results of operations, financial condition, macro-economic conditions, liquidity, prospects, business trends, currency trends, competition, markets, growth strategies and the industries in which we operate and including, without limitation, statements relating to our estimated or anticipated financial performance or results. Forward-looking statements are subject to known and unknown risks and uncertainties, many of which may be beyond our control. We caution you that forward-looking statements are not guarantees of future performance and that our actual results of operations, financial condition and liquidity, and the development of the industries in which we operate may differ materially from those made in or suggested by the forward-looking statements contained in this Annual Report on Form 10-K. In addition, even if our results of operations, financial condition and liquidity, and the development of the industries in which we operate are consistent with the forward-looking statements contained in this Annual Report on Form 10-K, those results or developments may not be indicative of results, conditions or developments in subsequent periods. A number of important factors could cause actual results to differ materially from those contained in or implied by the forward-looking statements, including those reflected in forward-looking statements relating to our operations and business and the risks and uncertainties discussed in “Risk Factors.” Factors that could cause actual results to differ from those reflected in forward-looking statements relating to our operations and business include:
• | general economic conditions, particularly fluctuations in industrial production and the demands of our customers; |
• | disruptions in the supply of chemicals we distribute or our customers' or producers' operations; |
• | termination or change of contracts or relationships with customers or producers on short notice; |
• | the price and availability of chemicals, or a decline in the demand for chemicals; |
• | our ability to pass through cost increases to our customers; |
• | our ability to meet customer demand for a product; |
• | trends in oil and gas prices; |
• | our ability to execute strategic investments, including pursuing acquisitions and/or dispositions, and successfully integrating and operating acquired companies; |
• | challenges associated with international operations, including securing producers and personnel, import/export requirements, compliance with foreign laws and international business laws and changes in economic or political conditions; |
• | our ability to effectively implement our strategies or achieve our business goals; |
• | exposure to interest rate and currency fluctuations; |
• | competitive pressures in the chemical distribution industry; |
• | consolidation of our competitors; |
• | our ability to implement and efficiently operate the systems needed to manage our operations; |
• | the risks associated with security threats, including cybersecurity threats; |
• | increases in transportation costs and changes in our relationship with third party carriers; |
3
• | the risks associated with hazardous materials and related activities; |
• | accidents, safety failures, environmental damage, product quality issues, major or systemic delivery failures involving our distribution network or the products we carry or adverse health effects or other harm related to the materials we blend, manage, handle, store, sell or transport; |
• | evolving laws and regulations relating to hydraulic fracturing and risks associated with chemicals used in hydraulic fracturing; |
• | losses due to potential product liability claims and recalls and asbestos claims; |
• | compliance with extensive environmental, health and safety laws, including laws relating to our environmental services businesses and the investigation and remediation of contamination, that could require material expenditures or changes in our operations; |
• | general regulatory and tax requirements; |
• | operational risks for which we may not be adequately insured; |
• | ongoing litigation and other legal and regulatory actions and risks, including asbestos claims; |
• | potential impairment of goodwill; |
• | inability to generate sufficient working capital; |
• | loss of key personnel; |
• | labor disruptions and other costs associated with the unionized portion of our workforce; |
• | negative developments affecting our pension plans and multi-employer pensions; |
• | the impact of labeling regulations; and |
• | our substantial indebtedness and the restrictions imposed by our debt instruments and indenture. |
All forward-looking statements made in this Annual Report on Form 10-K are qualified by these cautionary statements. These forward-looking statements are made only as of the date of this Annual Report on Form 10-K and we do not undertake any obligation, other than as may be required by law, to update or revise any forward-looking or cautionary statements to reflect changes in assumptions, the occurrence of events, unanticipated or otherwise and changes in future operating results over time or otherwise.
Comparisons of results between current and prior periods are not intended to express any future trends, or indications of future performance, unless expressed as such, and should only be viewed as historical data.
4
PART I
ITEM 1. BUSINESS
Our Company
We are a leading global chemical and ingredients distributor and provider of specialty services. We purchase chemicals from thousands of chemical producers worldwide and warehouse, repackage, blend, dilute, transport and sell those chemicals to more than 100,000 customer locations across approximately 150 countries. Our specialized services include digital promotion or e-marketing of chemicals for our producers, chemical waste removal, and on-site storage of chemicals for our customers, support services for the agricultural and pest control industries and environmental maintenance and response services. We derive competitive advantage from our scale, broad product offering, technical expertise, specialized services, long-standing relationships with leading chemical producers and our industry-leading safety record.
The global chemical distribution industry is large and fragmented with thousands of distributors but represents a relatively small portion of the total chemical industry. While the total chemical industry is projected to grow at rates about equal to the growth of the gross national product of countries we operate in around the world, the distributed chemicals portion of the market is projected to grow faster as producers and customers increasingly realize the benefits of outsourcing. Chemical producers rely on us to warehouse, repackage, transport and sell their products as a way to expand their market access, enhance their geographic reach, lower their costs and grow their business. Customers who purchase products and services from us benefit from a lower total cost of ownership, as they are able to simplify their chemical sourcing process and outsource functions to us such as just-in-time availability of the right product, packaging, mixing, blending and technical expertise. They also rely on us for safe delivery and off-loading of chemicals in a manner that is fully compliant with increasing local and federal regulations.
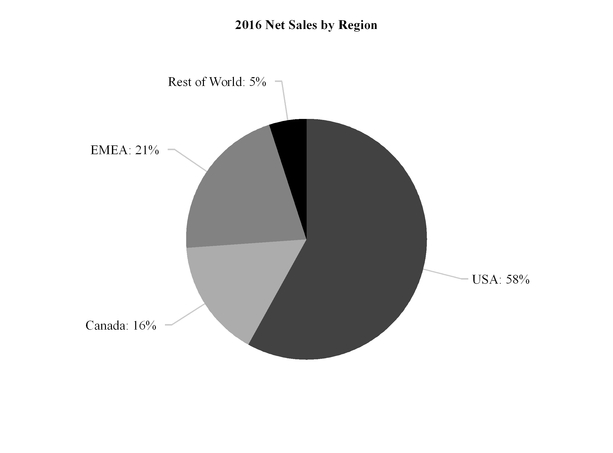
In the year ended December 31, 2016, we generated $8.1 billion in net sales, a net loss of $68.4 million and $562.7 million in Adjusted EBITDA. For a reconciliation of Adjusted EBITDA to net income (loss), see “Selected Financial Data” in Item 6 of this Annual Report on Form 10-K.
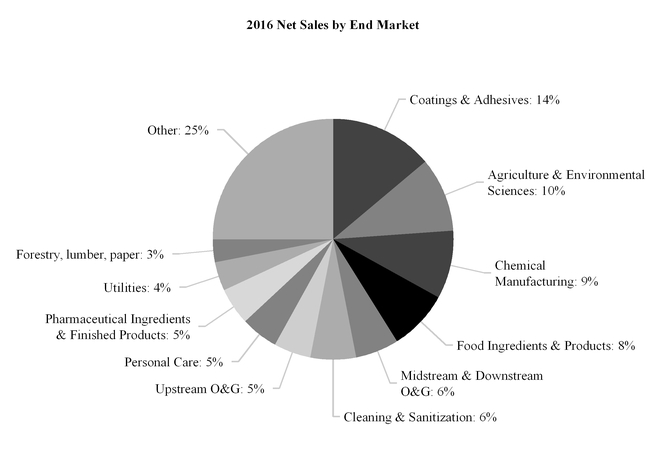
The following charts illustrate the geographical and end market diversity of our 2016 net sales:
5
We maintain strong, long-term relationships with our producers and our customers, many of which span multiple decades. We source materials from thousands of producers worldwide, including premier global leaders. For the year ended December 31, 2016, our 10 largest producers accounted for approximately 35 percent of our total chemical purchases and our 20 largest producers accounted for approximately 42 percent. Similarly, we sell products to thousands of customers globally, ranging from small and medium-sized businesses to large industrial customers. For the year ended December 31, 2016, our top 10 customers accounted for approximately 9 percent of our consolidated net sales and our top 20 customers accounted for 13 percent. Globally, we service our customers with on-time delivery rates greater than 96 percent.
Our Segments
Our business is organized and managed in four geographical segments: Univar USA (“USA”), Univar Canada (“Canada”), Univar Europe and the Middle East and Africa (“EMEA”), and Rest of World (“Rest of World”), which is predominantly in Latin America. For additional information on our geographical segments, see “Note 21: Segments” in Item 8 of this Annual Report on Form 10-K for additional information.
USA
We supply a broad offering of commodity and specialty chemicals, as well as specialized value-added services to a wide range of end markets, touching a majority of the manufacturing and industrial production sectors in the United States. Our close proximity to customers, combined with our deep product knowledge and end market expertise, serves as a competitive advantage.
In the United States, we service these multiple end markets with one-to-three day order lead times from nearby facilities. We repackage and blend bulk chemicals for shipment by our transportation fleet as well as common carriers. Our highly skilled salesforce is deployed by geographic sales district as well as by end-use market and industry, e.g., coatings & adhesives, food products and ingredients, pharmaceutical products and ingredients, water treatment, personal care, and energy.
Canada
Our Canadian operations are regionally focused, with a highly skilled salesforce supplying a broad offering of commodity and specialty chemicals to the local customer base. In Eastern Canada, we primarily focus on industrial markets such as food ingredients and products, pharmaceutical ingredients and finished products, coatings and adhesives, and chemical manufacturing.
6
We also service the cleaning and sanitation, personal care, mining, and oil and gas markets. In Western Canada, we focus on forestry, chemical manufacturing, mining, and oil and gas markets (e.g., midstream gas pipeline, oil sands processing and oil refining). Lastly, due to its size, we have dedicated resources and expertise serving the agriculture end market. In agriculture, we formulate and distribute crop protection and fertilizer products to independent retailers and specialty applicators servicing the agricultural end markets in both Western Canada and Eastern Canada and we provide support services to agricultural chemical producers throughout the country.
Europe, Middle East & Africa (EMEA)
We maintain a strong presence in the United Kingdom and Continental Europe with sales offices in 20 countries. We also have six sales offices in the Middle East and Africa.
We execute primarily on a pan-European basis, leveraging centralized or shared information technology systems, raw materials procurement, logistics, route operations and the management of producer relationships where possible to benefit from economies of scale and improve cost efficiency. We have strong end market expertise and key account management capability across Europe to better support sales representatives in each country and for serving our key customer end markets, namely pharmaceutical products and ingredients, food, coating and adhesives, and personal care.
Rest of World
We operate sales offices and distribution sites in Mexico, Brazil and to a lesser extent the Asia-Pacific region. We expanded our footprint in Latin America through strategic acquisitions, most recently through our 2014 acquisition of D’Altomare, a Brazilian distributor of specialty chemicals and ingredients.
Our Competitive Strengths
We derive strength and competitive advantage from our scale, broad product offering, high service level, long-standing relationships with producers, and our industry leading safety record.
Scale
We operate one of the most extensive chemical distribution networks in the world, comprised of more than 600 distribution facilities, approximately 90 million gallons of chemical storage tank capacity with hundreds of tractors, railcars, tankers and trailers operating daily through our facilities. We purchase thousands of different chemicals from thousands of producers in large quantities. Our purchasing power and global procurement relationships provide us with advantages over local and regional competitors due to economies of scale and our ability to manage our working capital.
Product breadth and market reach
We offer a wide range of chemical products and services across nearly all end-use markets. This enables us to present to customers a “one-stop shop” approach that simplifies their procurement process and lowers their total cost of ownership, and provides customers with the opportunity to achieve growth by accessing new end markets through us.
Service
Globally, we provide our customers with one-to-three day order lead times and greater than 96 percent on-time delivery from our nearby facilities. This highly responsive service level enables our customers to lower their inventory levels and avoid production interruptions from lack of chemical ingredients.
To complement our extensive product portfolio, we offer to our customers several specialized, value-added services, such as our unique distribution business focused on the marketing and sale of specialty and fine chemicals (ChemPoint.com), automated tank monitoring and refill of less than truckload quantities (MiniBulk), chemical waste management (ChemCare), technical support, and specialty product blending and formulation, particularly in agriculture. These services provide efficiency gains to our customers and deepen our relationship with them.
We also provide, through our highly skilled sales force, in-depth product technical knowledge and end market expertise to our customers, as well as valuable market and customer insights to our producers about how their products are performing in the market.
Long-standing producer and customer relationships
We have developed strong, long-term relationships, many spanning several decades, with the world's premier global chemical producers and distribute products to more than 100,000 customer locations around the globe, from small- and medium-sized businesses to global industrial customers. The strength of our relationships has provided opportunities for us to integrate our service
7
and logistics capabilities into our customers’ and producers’ business processes and to promote collaboration on supply chain optimization, marketing and other revenue enhancement strategies.
Safety and regulatory compliance
Our commitment to safety, strong safety record and compliance with federal, state and local environmental regulatory requirements is an increasingly important consideration for producers and customers when choosing a chemical distributor.
Our Growth Strategy
We believe that we are well positioned to drive profitability growth, increase our market share, and capitalize on industry outsourcing trends by focusing on our key initiatives of Commercial Greatness, Operational Excellence and One Univar.
Drive Profitable Growth
Commercial Greatness. We seek to increase the value we provide our customers and our producers by improving our customers’ experience and driving additional growth for our producers. We seek to:
• | continue to develop a highly skilled and well-equipped sales force utilizing a value-based consultative sales approach that is aligned to customer and end market needs by geography, product and service, and industry specialization; |
• | continue to increase our technical and industry-specific product and market expertise; |
• | develop a world-class marketing capability to dynamically identify and align resources with high-growth, high value opportunities; |
• | cultivate and maintain long-term producer relationships by bringing deep market and product knowledge, value-based selling, reducing complexity in producer distribution channels, and offering complementary products and services as a total solution for our customers; and |
• | strengthen our specialized service offerings such as ChemPoint.com, MiniBulk, and ChemCare by providing more growth for our producers and lower total cost of ownership for customers, while enhancing our profitability. We will also continue to work with customers and producers to develop tailored solutions to meet their specific requirements. |
Operational Excellence. We are committed to continuously improving our operating performance and lowering our costs per transaction. We seek to:
• | better align our USA business teams with identified growth opportunities in customer end markets, product markets, services, and industries in a way that narrows focus and increases accountability; |
• | increase our use of digital tools to simplify tasks, lower costs and improve customer experience; |
• | continue to use Lean Six Sigma methodologies to deliver project-by-project productivity gains; |
• | increase the cost efficiency of our warehouses, terminals, tank farms and logistics, and improve our net working capital efficiency; |
• | deliver a compelling customer value proposition by providing simplified sourcing, cost effective just-in-time delivery and managed inventory along with value-added services; and |
• | continue to build on our industry leading safety performance as a differentiator with both customers and producers. |
One Univar. We are committed to developing a healthy, high-performance culture through the selection, recognition and development of engaged employees. We aspire to build an environment where the best people want to work and add value for our customers, producers and shareholders. We will strengthen the overall governance and efficiency of our global business operations with integrated, disciplined operating processes and by leveraging best practices.
Expand our market share
We believe our Commercial Greatness and Operational Excellence initiatives will allow us to outperform competitors and obtain additional product authorizations from producers, leading to market share gains. We are also pursuing selective acquisitions to increase our presence in attractive end markets and whose products and service capabilities can benefit from our scale advantages.
Capitalize on industry outsourcing trends
We believe we are well positioned to benefit from the growing trend of chemical producers and customers to outsource key tasks to chemical distributors. As a leader in chemical distribution, we believe we can accelerate this trend by increasing the attractiveness of our total value proposition to both customers and our producers.
8
Through our Commercial Greatness, Operational Excellence and One Univar initiatives and by reinforcing “one-stop shop” provider capability, we will build on and increase the economic value we create in the global supply chain.
Company History
Our history dates back to 1924 when we were founded as a brokerage business. In 1986, we acquired McKesson Chemical Corporation, then the third largest US chemical distributor, solidifying our presence throughout the United States and making us the largest chemical distributor in North America. In 2001, we continued our expansion into Europe through the acquisition of Ellis & Everard, which specialized in the distribution of chemicals in the United Kingdom and Ireland and had additional facilities in Europe and the Eastern United States. In 2007, we acquired ChemCentral, which enabled us to improve our market share and operational efficiencies in North America.
In 2007, we were acquired by investment funds advised by CVC Capital Partners Advisory (US), Inc. (“CVC”) as well as investment funds associated with Goldman, Sachs & Co. and Parcom. On November 30, 2010, investment funds associated with Clayton, Dubilier & Rice, LLC (“CD&R”) acquired a 42.5 percent ownership interest in us. In December 2010, we acquired Basic Chemicals Solutions, a global distributor and trader of commodity chemicals, which further strengthened our ability to provide value in the supply chain between chemical producers and end-users and reinforced our global sourcing capabilities. In January 2011, we completed our acquisition of Quaron, a chemical distributor operating in Belgium and the Netherlands, which complemented our strong European foothold in specialty chemicals with expanded product portfolio and increased logistical capability. We continued our expansion into the emerging markets in 2011 through our acquisition of Eral-Protek, a leading chemical distributor in Turkey, and the acquisition of Arinos, a leading chemical distributor of specialty and commodity chemicals and high-value services in Brazil. In December 2012, we acquired Magnablend, whose specialty chemical and manufactured products broadened our oil and gas offerings. In May 2013, we expanded our Mexican presence with the acquisition of Quimicompuestos, making us a leading chemical distributor in the Mexican market, which is increasingly connected to the North American market. In November 2014, we acquired D’Altomare Quimica Ltda, or D’Altomare, a Brazilian distributor of specialty chemicals and ingredients, which expanded our geographic footprint and market presence in Brazil. On April 10, 2015, we acquired Key Chemical, Inc., or Key, one of the largest distributors of fluoride to municipalities in the United States, which we expect to help us expand our offerings into the municipal and other industrial markets.
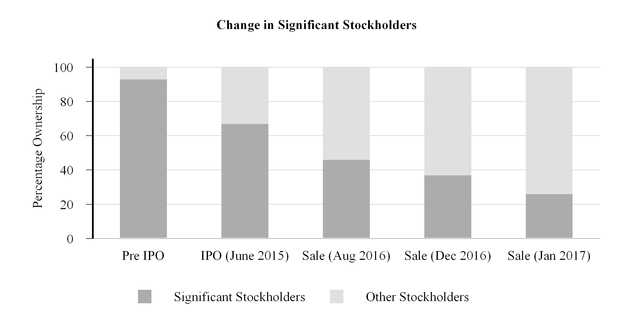
On June 23, 2015, we closed our initial public offering (“IPO”) in which we issued and sold 20.0 million shares of common stock at a public offering price of $22.00 per share. In addition, we completed a concurrent private placement of $350.0 million for shares of common stock (17.6 million shares) to Dahlia Investments Pte. Ltd., an indirect wholly owned subsidiary of Temasek Holdings (Private) Limited (“Temasek”). We received total net proceeds of approximately $760.0 million from the IPO and the private placement after deducting underwriting discounts and commissions and other offering expenses of approximately $30.0 million. These expenses were recorded against the proceeds received from the IPO. Certain selling stockholders sold an additional 25.3 million shares of common stock in the IPO and concurrent private placement. We did not receive any proceeds from the sale of these shares.
In July 2015, we acquired the assets of Chemical Associates, Inc., a marketer, manufacturer, and distributor of oleochemicals, many of which are based on renewable and sustainable resources, which we believe will help increase the value Univar can bring in a number of our key markets such as personal care, food, cleaning and sanitization, lubricants, and coatings and adhesives. On October 2, 2015, we entered into the agrochemical formulation market and expanded our capabilities in the third-party agriculture logistics market in Canada with the acquisition of the Future Group. On November 3, 2015, we acquired Arrow Chemical, Inc., expanding our existing offering with a complementary portfolio of active pharmaceutical ingredients (“APIs”) and other specialty ingredients essential to the formulation of generic and over-the-counter pharmaceuticals. On December 1, 2015, we acquired Weaver Town Oil Services, Inc., and Weavertown Transport Leasing, Inc., operating as the Weavertown Environmental Group, or WEG, which strengthens our ChemCareSM waste management service offering with a broad range of complementary services, including industrial cleaning, waste management and transportation, site remediation, and 24/7 emergency response services. On December 17, 2015, we acquired Polymer Technologies Ltd., a U.K.-based developer and distributor of unique ultraviolet/electron beam curable chemistries used to formulate environmentally responsible paints, inks, and adhesives.
In March 2016, we acquired Bodine Services of the Midwest, further strengthening our ChemCareSM waste management, environmental maintenance and response service offering in key geographic markets. That same month, we acquired the assets of Nexus Ag Business, Inc., enhancing our existing macronutrient and crop protection inputs through a proprietary line of micronutrients, macronutrients and specialty fertilizers. Together with our leading distribution and services network in the region, this acquisition further strengthens our agriculture group’s ability to provide customers in Canada with a complete product service offering that covers the entire growing cycle from start to finish.
Also in 2016 and 2017, we engaged in a series of secondary registrations of our stock. As a result, CVC divested its remaining ownership in our company and both CD&R and Temasek reduced their ownership stakes in our company to 15.4% and 10.1%, respectively.
9
The below chart illustrates the change in our Significant Stockholders since the IPO date.
Products and End Markets
The main focus of our marketing approach is to identify attractive end-user markets and provide customers in those markets all of their commodity and specialty chemical needs. We also offer value-added services as well as procurement solutions that leverage our chemical, supply chain and logistics expertise, networked inventory sourcing and producer relationships. We provide our customers with a “one-stop shop” for their commodity and specialty chemical needs and offer a reliable and stable source of quality products and services.
We buy and inventory chemicals in large quantities such as barge loads, railcars or full truck loads from chemical producers and we sell and distribute smaller quantities to our customers. Approximately 40 percent of the chemicals we purchase are in bulk form, and we repackage them into various size containers for sale and distribution.
Commodity chemicals currently represent and have historically represented the largest portion of our business by sales and volume. Our commodity chemicals portfolio includes acids and bases, surfactants, glycols, inorganic compounds, alcohols and general chemicals used extensively throughout most end markets. Our specialty chemicals sales represent an important, high-value, higher-growth portion of the chemical distribution market. We typically sell specialty chemicals in lower volumes but at a higher profit than commodity chemicals. While many chemical producers supply these products directly to customers, there is an increasing trend toward outsourcing the distribution of these specialized, lower volume products. We believe that customers and producers value Univar’s ability to supply both commodity and specialty products, particularly as the markets continue to consolidate.
We focus on sourcing certain high volume products that we distribute to our customers. We buy products globally at attractive pricing. We largely sell chemicals sourced through our industry focused salesforce. However, a small proportion of the chemicals that we source are sold directly to certain high volume customers through our Basic Chemicals group. Our global sourcing capabilities help us enhance our global market presence and our product expertise across all market segments.
We serve a diverse set of end markets and regions, with no end market accounting for more than 20 percent of our net sales over the past year.
Our key global end markets include:
• | Agricultural and Environmental Sciences. We are a leading wholesale distributor of crop protection products to independent retailers and specialty applicators in Canada. To support this end market, we distribute herbicides, fungicides, insecticides, seed, micronutrients, macronutrients, horticultural products, fertilizers and feed, among other products. In addition, we provide storage, packaging and logistics services for major crop protection companies, storing chemicals, feed-grade materials, seed and equipment. We supply pest control products and equipment to the public health, vegetation management, turf and ornamental, food processing and post-harvest storage, animal health |
10
and hay production markets. We operate a network of over 70 Univar ProCenter distribution centers in North America to serve this end market.
• | Chemical Manufacturing. We distribute a full suite of chemical products in support of the chemical manufacturing industry (organic, inorganic, polymer chemistries and to a lesser extent oil refining). Our broad warehousing and delivery resources permit us to assure our chemical manufacturing customers efficient inventory management, just-in-time delivery, and custom blends and packages. Our industry expertise also assists our customers in making product selections which best suit the customers' objectives and with chemical waste and wastewater issues. |
• | Cleaning and Sanitization. The cleaning and sanitization industry is made up of thousands of large and small formulators that require a multitude of chemical ingredients to make cleaning products and detergents for home and industrial use. We believe that we distribute chemicals manufactured by many of the industry’s leading producers of enzymes, surfactants, solvents, dispersants, thickeners, bleaching aides, builders, sealants, acids, alkalis and other chemicals that are used as processing aids in the manufacturing of cleaning products. |
• | Coatings and Adhesives. The coatings and adhesives industry is one of our largest customer end markets. We sell resins, pigments, solvents, thickeners, dispersants and other additives used to make paints, inks, and coatings. We have a large team of industry and product specialists with the market expertise that enables us to work closely with formulators and producers to offer new technologies, formulations and scale-up support. Our product line includes epoxy resins, polyurethanes, titanium dioxide, fumed silica, esters, plasticizers, silicones and specialty amines. |
• | Food Ingredients and Products. For the food and beverage industry, we distribute a diverse portfolio of commodity and specialty products that are sold as processing aids or food additives. We sell food ingredients such as thickeners, emulsifiers, sweeteners, preservatives, leavening agents and humectants, as well as texturizer and fat replacement products that include xanthan gum, locust bean gum, cellulosics and guar gum. We distribute acidulants such as citric acid, lactic acid and malic acid, as well as alkalis. Additional offerings include supplements and products such as proteins, vitamins and minerals. The major food and beverage markets we serve are meat processing, baked goods, dairy, grain mill products, processed foods, carbonated soft drinks, fruit drinks and alcoholic beverages. We manage our product portfolio to ensure quality standards, security of supply and cost competitiveness. We refresh our product offering with products that meet the key trends impacting the food industry. Our industry experts have developed marketing tools that simplify the ingredient selection process for our customers and provide product performance information and solutions. |
• | Energy. We provide chemicals and service to midstream pipeline and downstream refinery operators primarily in the US and Canada. We offer an expansive product line with a team of highly skilled and uniquely dedicated specialists to stay on top of the latest trends, regulations and technologies. We also service the upstream oil and gas production market, including the US shale hydraulic fracturing sector, by providing a variety of bulk chemicals to the drill sites and also specialty blended products used to fracture rock and stimulate oil and gas production from the well. Other markets include Canada, Mexico, Europe’s North Sea and parts of Africa. In recent years, the number of operating hydraulic fracturing rigs in the US dropped significantly with the fall in oil prices, as has the size of this end market for us. |
• | Personal Care. We are a full-line distributor in the personal care industry providing a wide variety of specialty and basic chemicals used in skin care products, shampoos, conditioners, styling, hair color, body washes, sun care, color cosmetics, and pet care products. The chemicals that we distribute include surfactants, emollients, emulsifiers, rheology modifiers, active ingredients, color, preservatives and processing aids. Our dedicated team of industry experts and technical marketers work with our customers to formulate traditional and cutting-edge personal care products. |
• | Pharmaceutical Ingredients and Finished Products. We are uniquely positioned in the pharmaceutical ingredients industry due to the combination of our product portfolio, logistics footprint and customized solutions to meet the needs of a highly regulated industry. We represent some of the world’s leading excipient, process, solvent and active pharmaceutical ingredient producers, as well as producers of chemicals used to support water treatment, filtering and purification systems, thus offering our customers a broad product offering in the pharmaceutical industry. We sell active ingredients such as aspirin, ascorbic acid, caffeine and ibuprofen, and excipients that include phosphates, polyethylene glycols, polysorbates, methylcellulose, stearyl alcohol and stearates. We also make and sell certain finished pharmaceutical products. |
In some geographic regions we target other markets in addition to the end-user markets described above. Our water treatment products and services are utilized by customers in many of our end markets, and the municipal markets, and we believe that this will continue to be a growth area for our business.
11
Services
In addition to selling and distributing chemicals, we use our transportation and warehousing infrastructure and broad knowledge of chemicals and hazardous materials handling to provide important distribution and value-added services for producers and our customers. This intermediary role is increasingly important, in particular due to the recent trend of increased outsourcing of distribution by chemical producers to satisfy their need for supply chain efficiency. These services include:
Distribution Services
• | Inventory management. We manage our inventory in order to meet customer demands on short notice whenever possible. Our key role in the supply chain to chemical producers also enables us to obtain access to chemicals in times of short supply, when smaller chemical distributors may not able to obtain or maintain stock. Further, our global distribution network permits us to stock products locally to enhance “just-in-time” delivery, providing outsourced inventory management to our customers in a variety of end markets. |
• | Product knowledge and technical expertise. We partner with our customers in their production processes. For example, we employ a team of food technologists and chemicals and petroleum engineers who have the technical expertise to assist in the formulation of chemicals to meet specific customer performance requirements as well as provide customers with after-market support and consultation. |
• | Mixing, blending and repackaging. We provide our customers with a full suite of blending and repackaging services for our customers and in the agriculture industry for producers. Additionally, we can fulfill small orders through our repackaging services, enabling customers to maintain smaller inventories. |
Value-Added Services
• | MiniBulk and Remote Monitoring. MiniBulk is a complete storage and delivery system that improves plant safety and productivity. MiniBulk is a safe and efficient handling and use system for customers receiving less than full truckload quantities of chemicals. Our trained specialists deliver products that minimize employee exposure to hazardous chemicals. In addition drum storage and disposal are eliminated and access to products is improved. Similarly, our remote telemetry systems permit around-the-clock access to inventory information. The result is better inventory management, elimination of manual measurement and better assurance of timely/automatic replenishment. |
• | Specialized Blending. Leveraging our technical expertise, we are able to utilize our blending and mixing capabilities to create specialty chemical formulations to meet specific customer performance demands for agriculture and oil and gas products through our Future Group and Magnablend blending services. |
• | ChemCare and Environmental Response Services. Our ChemCare waste management service collects both hazardous and non-hazardous waste products at customer locations in the United States and Canada, and then works with select vendors in the waste disposal business to safely transport these materials to licensed third party treatment, storage and disposal facilities. ChemCare reviews each waste profile, recommends disposal alternatives to the customer and offers transportation of the waste to the appropriate waste disposal company. Hazardous and non-hazardous waste management technologies provided from our approved treatment storage and disposal facility vendors include recycling, incineration, fuels blending, lab packing, landfill, deep well injection and waste-to-energy. We have also expanded our environmental services capabilities through our recent acquisitions of Bodine and Weavertown Environmental Group. Among other things, we are able to provide our customers with industrial cleaning, site remediation and emergency environmental response services. |
• | ChemPoint. ChemPoint is our unique distribution business that facilitates the marketing and sales of specialty and fine chemicals, operating principally in North America and EMEA. ChemPoint is primarily focused on connecting producers to customers on relatively small volumes of high-value and highly-specialized chemicals. We offer an integrated, digital marketing and sales process that is powered by leading-edge technologies. |
Producers
We source chemicals from many of the premier global chemical manufacturers. Among our largest producers worldwide are the world’s largest general chemical and petrochemical producers, with many of the relationships with these producers having been in place for decades. We typically maintain relationships with multiple producers of commodity chemicals to protect against disruption in supply and distribution logistics as well as to maintain pricing discipline in our supply. Maintaining strong relationships with producers is important to our overall success. Our scale, geographic reach, diversified distribution channels and industry expertise enable us to develop strong, long-term relationships with producers, allowing us to integrate our service and logistics capabilities into their business processes, promoting collaboration on supply chain optimization, marketing and other revenue
12
enhancement strategies. The producers we work with also benefit from the insight we provide into customer buying patterns and trends. More and more, chemical producers are depending on the sales forces and infrastructure of large chemical distributors to efficiently market, warehouse and deliver their chemicals to end users.
Our base of thousands of chemical producers is highly diversified, with our largest producer representing approximately 12% of our 2016 chemicals expenditures, and no other chemical producer accounting for more than 10% of the total. Our 10 largest producers accounted for approximately 35% of our total chemical purchases in 2016. Our 20 largest producers accounted for approximately 42% of our total chemical purchases in 2016.
We typically purchase our chemicals through purchase orders rather than long-term contracts, although we have exclusive supply arrangements for certain chemicals. We normally enter into framework supply contracts with key producers. These framework agreements generally operate on an annual basis either with pricing items fixed to an index or without fixed pricing terms, although they often include financial incentives if we meet or exceed specified purchase volumes. We also have a limited number of longer term agreements with certain producers of commodity chemicals. For all of these chemicals, once we purchase the products, we ship them either directly to a customer or, more commonly, to one of our distribution centers.
Our ability to earn volume-based incentives from producers is an important factor in achieving our financial results. We receive these volume-based incentives in the form of rebates that are payable only when our sales equal or exceed the relevant target. In order to record these incentives throughout the year, we estimate the amount of incentives we expect to receive in order to properly record our cost of sales during the period. Because our right to receive these incentives will depend on our purchases for the entire year, our accounting estimates depend on our ability to forecast our annual purchases accurately which ultimately will vary depending on our customers’ demand and consumption patterns which may be independent of our performance as a distributor.
Sales and Marketing
We organize our business to align with our customers and end markets needs by geography, product and service, and industry specialization, including high-focus industries such as coatings and adhesives, food products and ingredients, pharmaceutical products and ingredients, personal care, agricultural and environmental sciences, energy and water treatment. We train our sales personnel so that they develop expertise in the industries that they serve. Our sales force leverages our strong producer relationships to provide superior product insight and expertise to deliver critical-use specialty, organic and inorganic chemicals to customers. We believe that aligning our business to customer and end markets enables our sales force and supply chain to deliver more valuable market insights to both our customers and producers.
Distribution Channels
We continue to refine our distribution business model to provide producers and our customers with the highest level of service, reliability and timeliness of deliveries while offering cost competitive products. We have multiple channels to market, including warehouse delivery, and direct-to-consumer delivery. The principal determinants of the way a customer is serviced include the size, scale and level of customization of a particular order, the nature of the product and the customer, and the location of the product inventories. For the year ended December 31, 2016, warehouse distribution accounted for approximately 80% of our net sales while direct distribution accounted for approximately 17% of our net sales, with the remaining approximate 3% of net sales derived primarily from our waste management services.
Warehouse Distribution
Our warehouse distribution business is the core of our operations. In our warehouse business, we purchase chemicals in truck load or larger quantities from chemical producers based on contracted demands of our customers or our estimates of anticipated customer purchases. Once received, chemicals are stored in one or more of our distribution facilities, depending on customer location, for sale and distribution in smaller, less-than-truckload quantities to our customers. Our warehouses have various facilities for services such as repackaging, blending and mixing to create specialized chemical solutions needed by our customers in ready-to-use formulations.
Our warehouse business connects large chemical producers with smaller volume customers whose consumption patterns tend to make them uneconomical to be served directly by producers. Thus, the core customer for our warehouse business model is a small or medium volume consumer of commodity and specialty chemicals. Since chemicals comprise only a fraction of the input costs for many of our customers’ products, our warehouse customers typically value quality, reliability of supply and ease of service. Our breadth of chemical product offerings also allows us to provide customers with complete management solutions for their chemical needs as they are able to obtain small volumes of many different products from us more efficiently and economically than if they dealt directly with multiple chemical producers. Our network of warehouses allows us to service most customers from multiple locations and also enables us to move products efficiently and economically throughout our own warehouse system to service customers on a real-time basis. Further, by leveraging our geographic footprint and state-of-the-art logistics
13
platform, we are able to combine multiple customer orders along the same distribution routes to reduce delivery costs and facilitate customer inventory management. For example, we combine multiple less-than-truckload deliveries for different customers along the same route to better utilize our delivery assets while at the same time minimizing our customers’ inventories.
With the leading market position in North America, our operations are capable of serving customers throughout the United States, including Hawaii and Alaska, and all major provinces and major manufacturing centers within Canada including remote areas such as the oil sands regions of Northern Canada. Our close proximity to major transportation arteries allows us to service customers in the most remote locations throughout the United States, particularly those markets that chemical producers are not able to serve profitably. In the USA, we rely mainly on our own fleet of distribution vehicles, while we primarily use third parties for the transportation of chemicals in Canada, EMEA and Rest of World.
Direct Distribution
Our direct distribution business provides point-to-point logistics for full truckloads or larger quantities of chemicals between producers and customers. In direct distribution, we sell and service large quantity purchases that are shipped directly from producers through our logistics infrastructure, which provides customers with sourcing and logistics support services for inventory management and delivery, in many cases far more economically than the producer might provide. We believe that producers view us not as competitors, but as providers of a valuable service, brokering these large orders through the utilization of our broad distribution network. We typically do not maintain inventory for direct distribution, but rather use our existing producer relationships and marketing expertise, ordering and logistics infrastructure to serve this demand, resulting in limited working capital investment for these sales. Our direct distribution service is valuable to major chemical producers as it allows them to deliver larger orders to customers utilizing our existing ordering, delivery and payment systems.
Insurance
The nature of our business exposes us to the possible risk of liabilities arising out of our operations, including damages to the environment, property, employees or the general public. Although we focus on operating safely and prudently, we occasionally receive claims, alleging damages, negligence or other wrongdoing in the planning or performance of work, which resulted in harm to the environment, property, employees or the general public. These liabilities can be significant. Accruals for deductibles are based on claims and actuarial estimates of claims development and claims incurred but not recorded.
We maintain policies of insurance that, subject to limitations, exclusions, or deductibles, provide coverage for these types of claims for our worldwide facilities and activities. To mitigate its aggregate loss potential above these retentions and deductibles, the company purchases insurance coverage from highly rated insurance companies. The company does not currently operate or participate in any captive insurance companies or other non-traditional risk transfer alternatives.
In the normal course of business, we also purchase surety bonds or letters of credit in connection with municipal contracts, import and export activities, environmental remediation, and environmental permits as a financial guarantee of our performance.
Competition
The chemical production, distribution and sales markets are highly competitive. Most of the products that we distribute are made to industry standard specifications and are either produced by, or available from, multiple sources or the producers with which we work may also sell their products through a direct sales force or through multiple chemical distributors.
Chemical distribution itself is a fragmented market in which only a small number of competitors have substantial international operations. Our principal large international competitor is Brenntag, which has a particularly strong position in Europe.
Many other chemical distributors operate on a regional, national or local basis and may have a strong relationship with local producers and customers that may give them a competitive advantage in their local market. Some of our competitors are either local or regional distributors with a broad product portfolio, while others are niche players which focus on a specific end market, either industry or product-based.
Chemical producers may also choose to limit their use of third party distributors, particularly with respect to higher margin products, or to partner with other chemical producers for distribution, each of which could increase competition.
We compete on the basis of price, diversification and flexibility in product offerings and supply availability, market insight and the ability to provide value-added services.
North America
The independent chemical distribution market in North America is fragmented. Our principal competitors in North America include Brenntag, Helm America, Hydrite Chemical, Prinova and Nexeo Solutions. We also compete with a number of smaller companies in certain niche markets.
14
EMEA
The independent chemical distribution market in Europe historically has been highly fragmented. Consolidation among chemical distributors has increased, mirroring developments within the chemical sector as a whole.
Brenntag is our leading competitor in Europe due to its strong market position in Germany, which is the largest European chemical distribution market. Other regional competitors in Europe include Azelis, Helm and IMCD. We believe that we are the leading chemical distributor in the United Kingdom and Ireland.
Rest of World
In Rest of World, the markets for chemical distribution are much more fragmented and credible competitive information for smaller companies is not available. Our relative competitive position in the Rest of World markets is smaller than in North America or EMEA.
Regulatory Matters
Our business is subject to a wide range of regulatory requirements in the jurisdictions in which we operate. Among other things, these laws and regulations relate to environmental protection, economic sanctions, product regulation, anti-terrorism concerns, management, storage, transport and disposal of hazardous chemicals and other dangerous goods, and occupational health and safety issues. Changes in and introductions of regulations have in the past caused us to devote significant management and capital resources to compliance programs and measures. New laws, regulations, or changing interpretations of existing laws or regulations, or a failure to comply with current laws, regulations or interpretations, may have a material adverse effect on our business, financial condition and results of operations. The following summary illustrates some of the significant regulatory and legal requirements applicable to our business.
Environmental, Health and Safety Matters
We operate in a number of jurisdictions and are subject to various foreign, federal, state and local laws and regulations related to the protection of the environment, human health and safety, including laws regulating discharges of hazardous substances into the soil, air and water, blending, managing, handling, storing, selling, transporting and disposing of hazardous substances, investigation and remediation of contaminated properties and protecting the safety of our employees and others. Some of our operations are required to hold environmental permits and licenses and certain of our services businesses are also impacted by these laws. The cost of complying with these environmental, health and safety laws, permits and licenses has, in some instances, been substantial.
Some of our historic operations, including those of companies we acquired, have resulted in contamination at a number of currently and formerly owned or operated sites. We are required to investigate and remediate at many of such sites. Contamination at these sites generally resulted from releases of chemicals and other hazardous substances. We have spent substantial sums on such investigation and remediation and expect to continue to incur such expenditures, or discover additional sites in need of investigation and remediation, until such investigation and remediation is deemed complete. Information on our environmental reserves is included in “Note 19: Commitments and contingencies” to our consolidated financial statements for the year ended December 31, 2016 which are included in Item 8 of this Annual Report on Form 10-K.
CERCLA. The US Comprehensive Environmental Response, Compensation, and Liability Act, or CERCLA, also known as Superfund, as well as similar laws in other jurisdictions, governs the remediation of contaminated sites and establishes liability for the release of hazardous substances at such sites. A party that transported waste, or arranged for the shipment of waste, to a waste disposal facility or other third party site that requires remediation can be liable for the cost of cleanup regardless of fault, the lawfulness of the disposal or the actions of other parties. Under CERCLA, the EPA or a delegated state agency can oversee or require remediation of such sites and seek cost recovery from any party whose wastes were disposed at, or who otherwise contributed to the contamination of, such sites. We are party to consent agreements with the EPA and state regulatory authorities with respect to environmental remediation at a number of such sites. We may be identified as a Potentially Responsible Party at additional third party sites or waste disposal facilities.
RCRA. The EPA regulates the generation, transport, treatment, storage and disposal of hazardous waste under the US Resource Conservation and Recovery Act, or RCRA. RCRA also sets forth a framework for managing non-hazardous waste. Most owners and operators of hazardous waste treatment, storage and disposal facilities must obtain a RCRA permit. RCRA also mandates certain operating, recordkeeping and reporting obligations for owners and operators of hazardous waste facilities. Our facilities generate various hazardous and non-hazardous wastes and we are a hazardous waste transporter and temporary storage facility. As a result of such activities, we are required to comply with RCRA requirements, including the maintenance of financial resources and security to address forced closures or accidental releases.
Clean Air Act. The US Clean Air Act and similar laws in other jurisdictions establish a variety of air pollution control measures, including limits for a number of airborne pollutants. These laws also establish controls for emissions from automobiles
15
and trucks, regulate hazardous air pollutants emitted from industrial sources and address the production of substances that deplete stratospheric ozone. Under the Clean Air Act, we are required to obtain permits for, and report on emissions of, certain air pollutants, or qualify for and maintain records substantiating that we qualify for an exemption. Owners and operators of facilities that handle certain quantities of flammable and toxic substances must implement and regularly update detailed risk management plans filed with and approved by the EPA. Failure to comply with the Clean Air Act may subject us to fines, penalties and other governmental and private actions.
Clean Water Act. Many of the jurisdictions in which we operate regulate water quality and contamination of water. In the United States, the EPA regulates discharges of pollutants into US waters, sets wastewater standards for industry and establishes water quality standards for surface waters, such as streams, rivers and lakes, under the US Clean Water Act. The discharge of any regulated pollutant from point sources (such as pipes and manmade ditches) into navigable waters requires a permit from the EPA or a delegated state agency. Several of our facilities have obtained permits for discharges of treated process wastewater directly to surface waters. In addition, several of our facilities discharge to municipal wastewater treatment facilities and therefore are required to obtain pretreatment discharge permits from local agencies. A number of our facilities also have storm water discharge permits.
Oil Pollution Prevention Regulations. The Oil Pollution Prevention regulations promulgated by the EPA under the authority of the Clean Water Act require that facilities storing oil in excess of threshold quantities or which have the ability to reach navigable water have a spill prevention, control and countermeasure, or SPCC, plan. Many of our facilities have SPCC plans or similar oil storage plans required in non-US jurisdictions.
Storage Requirements. Our warehouse facilities are required to comply with applicable permits and zoning requirements from local regulatory authorities and pursuant to leases. These requirements, which differ based on type of facility and location, define structural specifications and establish limits on building usage. Regulators typically have the authority to address non-compliance with storage requirements through fines, penalties and other administrative sanctions.
EPCRA. The US Emergency Planning and Community Right-To-Know Act, or EPCRA, establishes reporting rules for facilities that store or manage chemicals and requires such facilities to maintain certain safety data. EPCRA is intended to facilitate state and local planning for chemical emergencies. EPCRA requires state and local emergency planning and emergency response authorities to be informed of the presence of specified quantities of “extremely hazardous substances” at a facility and the release of listed hazardous substances above threshold quantities. Facilities that store or use significant amounts of toxic chemicals must also submit annual toxic chemical release reports containing information about the types and amounts of toxic chemicals that are released into the air, water and soil, as well as information on the quantities of toxic chemicals sent to other facilities. We store and handle a number of chemicals subject to EPCRA reporting and recordkeeping requirements.
TSCA and the Lautenberg Act. The US Toxic Substances Control Act, the recently enacted Lautenberg Act (collectively TSCA) and similar laws in other jurisdictions, are intended to ensure that chemicals do not pose unreasonable risks to human health or the environment. TSCA requires the EPA to maintain the TSCA registry listing chemicals manufactured or processed in the United States. Chemicals not listed on the TSCA registry cannot be imported into or sold in the United States until registered with the EPA. TSCA also sets forth specific reporting, recordkeeping and testing rules for chemicals, including requirements for the import and export of certain chemicals, as well as other restrictions relevant to our business. Pursuant to these laws, the EPA from time to time issues Significant New Use Rules, or SNURs, when it identifies new uses of chemicals that could pose risks to human health or the environment and also requires pre-manufacture notification of new chemical substances that do not appear on the TSCA registry. When we import chemicals into the United States, we must ensure that chemicals appear on the TSCA registry prior to import, participate in the SNUR process when a chemical we import requires testing data and report to the EPA information relating to quantities, identities and uses of imported chemicals.
FIFRA and Other Pesticide and Biocide Regulations. We have a significant operation in the distribution and sale of pesticides and biocides. These products are regulated in many jurisdictions. In the United States, the Federal Insecticide, Fungicide, and Rodenticide Act, or FIFRA, authorizes the EPA to oversee and regulate the manufacture, distribution, sale and use of pesticides and biocides. We are required to register with the EPA and certain state regulatory authorities as a seller and repackager of pesticides and biocides. The EPA may cancel registration of any pesticide or biocide that does not comply with FIFRA, effectively prohibiting the manufacture, sale, distribution or use of such product in the United States.
The EPA has established procedures and standards for the design of pesticide and biocide containers, as well as the removal of pesticides and biocides from such containers prior to disposal. Applicable regulations also prescribe specific labeling requirements and establish standards to prevent leaks and spills of pesticides and biocides from containment structures at bulk storage sites and dispensing operations. These standards apply to dealers who repackage pesticides, commercial applicators and custom blenders.
REACH. In Europe, our business is affected by legislation dealing with the Registration, Evaluation, Authorization and Restriction of Chemicals, or REACH. REACH requires manufacturers and importers of chemical substances to register such substances with the European Chemicals Agency, or the ECHA, and enables European and national authorities to track such
16
substances. Depending on the amount of chemical substances to be manufactured or imported, and the specific risks of each substance, REACH requires different sets of data to be included in the registration submitted to the ECHA. Registration of substances with the ECHA imposes significant recordkeeping requirements that can result in significant financial obligations for chemical distributors, such as us, to import products into Europe. REACH is accompanied by legislation regulating the classification, labeling and packaging of chemical substances and mixtures.
GHG Emissions. In the US, various legislative and regulatory measures to address greenhouse gas, or GHG, emissions are in various phases of discussion or implementation. At the federal legislative level, Congress has previously considered legislation requiring a mandatory reduction of GHG emissions. Although Congressional passage of such legislation does not appear likely at this time, it could be adopted at a future date. It is also possible that Congress may pass alternative climate change bills that do not mandate a nationwide cap-and-trade program and instead focus on promoting renewable energy and energy efficiency. In the absence of congressional legislation curbing GHG emissions, the EPA is moving ahead administratively under its Clean Air Act authority.
The implementation of additional EPA regulations and/or the passage of federal or state climate change legislation will likely result in increased costs to operate and maintain our facilities. Increased costs associated with compliance with any future legislation or regulation of GHG emissions, if it occurs, may have a material adverse effect on our results of operations, financial condition and ability to make cash distributions.
Internationally, many of the countries in which we do business (but not the US) have ratified the Kyoto Protocol to the United Nations Framework Convention on Climate Change, or the Kyoto Protocol, and we have been subject to its requirements, particularly in the European Union. Many nations entered into the Copenhagen Accord, which may result in a new international climate change treaty in the future. If so, we may become subject to different and more restrictive regulation on climate change to the extent the countries in which we do business implement such a new treaty.
OSHA. We are subject to workplace safety laws in many jurisdictions, including the United States. The US Occupational Safety and Health Act, or OSHA, which addresses safety and health in workplace environments and establishes maximum workplace chemical exposure levels for indoor air quality. Chemical manufacturers and importers must employ a hazard communication program utilizing labels and other forms of warnings, as well as Material Safety Data Sheets, setting forth safety and hazardous materials information to employees and customers. Employers must provide training to ensure that relevant employees are equipped to properly handle chemicals.
We train employees and visitors who have access to chemical handling areas. OSHA requires the use of personal protective equipment when other controls are not feasible or effective in reducing the risk of exposure to serious workplace injuries or illnesses resulting from contact with hazardous substances or other workplace hazards. Employers must conduct workplace assessments to determine what hazards require personal protective equipment, and must provide appropriate equipment to workers.
OSHA operates a process safety management rule, or PSM Rule, that requires employers to compile written process safety information, operating procedures and facility management plans, conduct hazard analyses, develop written action plans for employee participation in safety management and certify every three years that they have evaluated their compliance with process safety requirements. Employees must have access to safety analyses and related information, and employers must maintain and provide process-specific training to relevant employees. We handle several chemicals that are hazardous and listed under the PSM Rule, which imposes extensive obligations on our handling of these chemicals and results in significant costs on our operations.
OSHA’s Hazardous Waste Operations and Emergency Response rules require employers and employees to comply with certain safety standards when conducting operations involving the exposure or potential exposure to hazardous substances and wastes. These standards require hazardous substances preparedness training for employees and generally apply to individuals engaged in cleanup operations, facility operations entailing the treatment, storage and disposal of hazardous wastes, and emergency responses to uncontrolled releases of hazardous substances.
OSHA regulations require employers to develop and maintain an emergency action plan to direct employer and employee actions in the event of a workplace emergency. Under most circumstances, the plan must be maintained in writing, remain accessible at the workplace and be made available to employees for review.
Chemical Facility Anti-Terrorism Standards. The US Department of Homeland Security, or DHS, regulates certain high-risk chemical facilities through its Chemical Facility Anti-Terrorism Standards. These standards establish a Chemical Security Assessment Tool comprised of four elements, including facility user registration, top-screen evaluation, security vulnerability assessment and site security planning. The site security plan must address any vulnerabilities identified in the security vulnerability assessment, including access control, personnel credentialing, recordkeeping, employee training, emergency response, testing of security equipment, reporting of security incidents and suspicious activity, and deterring, detecting and delaying potential attacks. DHS must approve all security vulnerability assessments and site security plans. We handle a number of chemicals regulated by DHS.
17
FDA. The U.S. Food & Drug Administration (FDA) Food Safety Modernization Act, or FSMA, directs FDA to build an integrated national food safety system in partnership with state and local authorities. Univar facilities that handle FDA regulated products are required to implement a written preventive controls plan. This involves evaluating the hazards that could affect food safety and specifying what preventive steps, or controls, will be put in place to significantly minimize or prevent the hazards. Also, when we import FDA regulated products into the United States, we have an explicit responsibility to verify that our foreign suppliers have adequate preventive controls in place. Finally, the rule establishes requirements for companies involved in transporting FDA regulated products to use sanitary practices to ensure the safety of those products.
Other Regulations
We are subject to other foreign, federal, state and local regulations. For example, many of the products we repackage, blend and distribute are subject to Food and Drug Administration regulations governing the handling of chemicals used in food, food processing or pharmaceutical applications. Compliance with these regulations requires testing, additional policies, procedures and documentation and segregation of products. In addition, we are subject to a variety of state and local regulations, including those relating to the fire protection standards, and local licensing and permitting of various aspects of our operations and facilities.
Legal Proceedings
In the ordinary course of our business, we are subject to periodic lawsuits, investigations and claims. Although we cannot predict with certainty the ultimate resolution of pending or future lawsuits, investigations and claims asserted against us, we do not believe that any currently pending legal proceeding to which we are a party is likely to have a material adverse effect on our business, results of operations, cash flows or financial condition. See “Note 19: Commitments and Contingencies” in Item 8 of this Annual Report on Form 10-K for additional information.
Asbestos Claims
In its 1986 purchase of McKesson Chemical Company from McKesson Corporation, or McKesson, our wholly owned subsidiary, Univar USA Inc., entered into an indemnification agreement with McKesson. Univar USA has an obligation to defend and indemnify McKesson for claims alleging injury from exposure to asbestos-containing products sold by McKesson Chemical Company, or the asbestos claims. Univar USA’s obligation to indemnify McKesson for settlements and judgments arising from asbestos claims is the amount which is in excess of applicable insurance coverage, if any, which may be available under McKesson’s historical insurance coverage. In addition, we are currently defending a small number of claims which name Univar USA as a defendant.
As of December 31, 2016, Univar USA has accepted the tender of, and is defending McKesson in, eight pending separate-plaintiff claims in multi-plaintiff lawsuits filed in the State of Mississippi. These lawsuits have multiple plaintiffs, include a large number of defendants, and provide no specific information on the plaintiffs’ injuries and do not connect the plaintiffs’ injuries to any specific sources of asbestos. Additionally, the majority of the plaintiffs in these lawsuits have not put forth evidence that they have been seriously injured from exposure to asbestos. No new claims in Mississippi have been received since 2010. At the peak there were approximately 16,000 such claims pending against McKesson. To date, the costs for defending these cases have not been material, and the cases that have been finalized have either been dismissed or resolved with either minimal or no payments. Although we cannot predict the outcome of pending or future claims or lawsuits with certainty, we believe the future defense and liability costs for the Mississippi cases will not be material. Univar USA has not recorded a reserve related to these lawsuits, as it has determined that losses are neither probable nor estimable.
As of December 31, 2016, Univar USA was defending fewer than 290 single-plaintiff asbestos claims against McKesson (or Univar USA as a successor in interest to McKesson Chemical Company) pending in 15 states. These cases differ from the Mississippi multi-plaintiff cases in that they are single-plaintiff cases with the plaintiff alleging substantial specific injuries from exposure to asbestos-containing products. These cases are similar to the Mississippi cases in that numerous defendants are named and that they provide little specific information connecting the plaintiffs’ injuries to any specific source of asbestos. Although we cannot predict the outcome of pending or future claims or lawsuits with certainty, we believe the liabilities for these cases will not be material. In 2016, there were 160 single-plaintiff lawsuits filed against McKesson and 69 cases against McKesson which were resolved. As of December 31, 2016, Univar USA had reserved $50,000 related to pending asbestos litigation.
Environmental Remediation
The Company is subject to various federal, state and local environmental laws and regulations that require environmental assessment or remediation efforts (collectively “environmental remediation work”) at approximately 129 locations, some that are now or were previously Company-owned/occupied and some that were never Company-owned/occupied (“non-owned sites”).
The Company’s environmental remediation work at some sites is being conducted pursuant to governmental proceedings or investigations, while the Company, with appropriate state or federal agency oversight and approval, is conducting the environmental remediation work at other sites voluntarily. The Company is currently undergoing remediation efforts or is in the
18
process of active review of the need for potential remediation efforts at approximately 103 current or formerly Company-owned/occupied sites. In addition, the Company may be liable for a share of the cleanup of approximately 26 non-owned sites. These non-owned sites are typically (a) locations of independent waste disposal or recycling operations with alleged or confirmed contaminated soil and/or groundwater to which the Company may have shipped waste products or drums for re-conditioning, or (b) contaminated non-owned sites near historical sites owned or operated by the Company or its predecessors from which contamination is alleged to have arisen.
In determining the appropriate level of environmental reserves, the Company considers several factors such as information obtained from investigatory studies; changes in the scope of remediation; the interpretation, application and enforcement of laws and regulations; changes in the costs of remediation programs; the development of alternative cleanup technologies and methods; and the relative level of the Company’s involvement at various sites for which the Company is allegedly associated. The level of annual expenditures for remedial, monitoring and investigatory activities will change in the future as major components of planned remediation activities are completed and the scope, timing and costs of existing activities are changed. Project lives, and therefore cash flows, range from 2 to 30 years, depending on the specific site and type of remediation project.
Although the Company believes that its reserves are adequate for environmental contingencies, it is possible, due to the uncertainties noted above, that additional reserves could be required in the future that could have a material effect on the overall financial position, results of operations, or cash flows in a particular period. This additional loss or range of losses cannot be recorded at this time, as it is not reasonably estimable.
Other Environmental Matters
On December 9, 2014, the Company was issued a violation notice from the Pollution Control Services Department of Harris County, Texas (“PCS”). The notice relates to claims that the Company’s facility on Luthe Road in Houston, Texas operated with inadequate air emissions controls and improperly discharged certain waste without authorization. On March 6, 2015, PCS notified the Company that the matter was forwarded to the Harris County District Attorney’s Office with a request for an enforcement action. No such action was ever commenced, and, rather than litigate, the Company recently made a payment to PCS in settlement of this matter with no admission of a violation.
Customs and International Trade Laws
In April 2012, the US Department of Justice (“DOJ”) issued a civil investigative demand to the Company in connection with an investigation into the Company’s compliance with applicable customs and international trade laws and regulations relating to the importation of saccharin from 2002 through 2012. The Company also became aware in 2010 of an investigation being conducted by US Customs and Border Patrol (“CBP”) into the Company’s importation of saccharin. Finally, the Company learned that a civil plaintiff had sued the Company and two other defendants in a Qui Tam proceeding, such filing having been made under seal in 2012, and this plaintiff had requested that the DOJ intervene in its lawsuit.
The US government, through the DOJ, declined to intervene in the Qui Tam proceeding in November 2013 and, as a result, the DOJ’s inquiry related to the Qui Tam lawsuit and its initial investigation demand are now finished. On February 26, 2014, the Qui Tam plaintiff also voluntarily dismissed its lawsuit against the Company. CBP, however, continued its investigation on the importation of saccharin by the Company’s subsidiary, Univar USA Inc. On July 21, 2014, CBP sent the Company a “Pre-Penalty Notice” indicating the imposition of a penalty against Univar USA Inc. in the amount of approximately $84.0 million. Univar USA Inc. responded to CBP that the proposed penalty was not justified. On October 1, 2014, the CBP issued a penalty notice to Univar USA Inc. for $84.0 million and has reaffirmed this penalty notice. On August 6, 2015, the DOJ filed a complaint on CBP’s behalf against Univar USA Inc. in the Court of International Trade seeking approximately $84.0 million in allegedly unpaid duties, penalties, interest, costs and attorneys’ fees. The Company continues to defend this matter vigorously. Univar USA Inc. has not recorded a liability related to this investigation as the Company believes a loss is not probable.
Canadian Assessment
In 2007, the outstanding shares of Univar N.V., the ultimate public company parent of the Univar group at that time, were acquired by investment funds advised by CVC. To facilitate the acquisition and leveraged financing of Univar N.V. by CVC, a restructuring of some of the companies in the Univar group, including its Canadian operating company, was completed (the “Restructuring”). In February 2013, the Canada Revenue Agency (“CRA”) issued a Notice of Assessment, asserting the General Anti-Avoidance Rule (“GAAR”) against the Company’s subsidiary Univar Holdco Canada ULC (“Univar Holdco”) for withholding tax of $29.4 million (Canadian), relating to this Restructuring. Univar Holdco appealed the assessment, and the matter was litigated in the Tax Court of Canada in June 2015. On June 22, 2016, the Tax Court of Canada issued its judgment in favor of the CRA. The Company strongly disagrees with the decision of the Tax Court of Canada and filed its appeal to the Canadian Federal Court of Appeal on June 30, 2016. The Company filed its Memorandum of Fact and Law with the Canadian Court of Appeal on October 6, 2016 and the Respondent's Memorandum of Fact and Law was filed on November 21, 2016. A $44.7 million (Canadian) Letter of Credit, covering the initial assessment of $29.4 million (Canadian) and interest of $15.3 million (Canadian), has been issued
19
with respect to this assessment. The Letter of Credit amount was amended in December 2016 to $52.1 million (Canadian) to include $7.4 million (Canadian) in accrued interest.
In September 2014, also relating to the Restructuring, the CRA issued the 2008 and 2009 Notice of Reassessments for federal corporate income tax liabilities of $11.9 million (Canadian) and $11.0 million (Canadian), respectively, and a departure tax liability of $9.0 million (Canadian). Likewise, in April 2015, the Company’s subsidiary received the 2008 and 2009 Alberta Notice of Reassessments of $6.0 million (Canadian) and $5.8 million (Canadian), respectively. These Reassessments reflect the additional tax liability and interest relating to those tax years should the CRA be successful in its assertion of the GAAR relating to the Restructuring described above.
In September 2016, the CRA notified the Company that it agreed to accept security on the above reassessed federal amounts in the form of a Letter of Credit and subsequently the Company requested that it refrain from further collection efforts related to this assessment until the outcome of the appeal of the GAAR matter is concluded. The CRA denied the Company's request, and the Company initiated a review of the matter at the Canada Federal Court in January 2017. The Company expects a decision on the matter in mid-2017.
At December 31, 2016, the total Canadian federal and provincial tax liability assessed related to these matters, inclusive of interest of $38.7 million (Canadian), is $111.8 million (Canadian). The Company has not recorded any liabilities for these matters in its financial statements, as it believes it is more likely than not that the ruling will be reversed on appeal and the Company’s position will be sustained.
Proprietary Rights
We rely primarily on trademarks, copyrights and trade secret laws to establish and maintain our proprietary rights in our intellectual property including technology, creative works and products.
We currently own trademark registrations or pending applications in approximately 86 countries for the Univar name and in approximately 68 countries for the Univar hexagon logo. Each of the issued registrations is current and valid for the maximum available statutory duration and can be renewed prior to expiration of the relevant statutory period. We renew the registrations as they become due for both of these marks. We claim common law rights in the mark “Univar” and other Univar-owned trademarks in those jurisdictions that recognize trademark rights based on use without registration. Additionally, we currently own registrations and pending applications in the United States and various jurisdictions for numerous other trademarks that identify Univar as the source of products and services, including “ChemPoint.com”, “ChemCare”, and “PESTWEB”.
Employees
As of December 31, 2016, we employed more than 8,700 persons on a full time equivalent basis worldwide. Approximately 640 of our employees in the United States are represented by labor unions. As of December 31, 2016, approximately 25% of our labor force was covered by a collective bargaining agreement, including approximately 14% of our labor force in the United States, approximately 20% of our labor force in Canada and approximately 50% of our labor force in Europe, and approximately 3% of our labor force was covered by a collective bargaining agreement that will expire within one year. We have experienced no recent material work stoppages. In addition, in several of our facilities located outside the United States, particularly those in Europe, employees are represented by works councils appointed pursuant to local law consisting of employee representatives who have certain rights to negotiate working terms and to receive notice of significant actions. These arrangements grant certain protections to employees and subject us to employment terms that are similar to collective bargaining agreements.
Item 1A. RISK FACTORS
We are affected by general economic conditions, particularly fluctuations in industrial production and consumption, and an economic downturn could adversely affect our operations and financial results.
We sell chemicals that are used in manufacturing processes and as components of or ingredients in other products and, as a result, our sales are correlated with and affected by fluctuations in the level of industrial production and manufacturing output and general economic activity. Producers of commodity and specialty chemicals are likely to reduce their output in periods of significant contraction in industrial and consumer demand, while demand for the products we distribute depends largely on trends in demand in the end markets our customers serve. A majority of our sales are in North America and Europe and our business is therefore susceptible to downturns in those economies as well as, to a lesser extent, the economies in the rest of the world. Our profit margins, as well as overall demand for our products and services, could decline as a result of a large number of factors outside our control, including economic recessions, changes in industrial production processes or consumer preferences, changes in laws and regulations affecting the chemicals industry and the manner in which they are enforced, inflation, fluctuations in interest and currency exchange rates and changes in the fiscal or monetary policies of governments in the regions in which we operate.
20
General economic conditions and macroeconomic trends, as well as the creditworthiness of our customers, could affect overall demand for chemicals. Any overall decline in the demand for chemicals could significantly reduce our sales and profitability. If the creditworthiness of our customers declines, we would face increased credit risk. In addition, volatility and disruption in financial markets could adversely affect our sales and results of operations by limiting our customers’ ability to obtain financing necessary to maintain or expand their own operations.
A historical feature of past economic weakness has been significant destocking of inventories, including inventories of chemicals used in industrial and manufacturing processes. It is possible that an improvement in our net sales in a particular period may be attributable in part to restocking of inventories by our customers and represent a level of sales or sales growth that will not be sustainable over the longer term. Further economic weakness could lead to insolvencies among our customers or producers, as well as among financial institutions that are counterparties on financial instruments or accounts that we hold. Any of these developments could have a material adverse effect on our business, financial condition and results of operations.
Disruptions in the supply of chemicals we distribute or in the operations of our customers could adversely affect our business.
Our business depends on access to adequate supplies of the chemicals our customers purchase from us. From time to time, we may be unable to procure adequate quantities of certain chemicals because of supply disruptions due to natural disasters (including hurricanes and other extreme weather), industrial accidents, scheduled production outages, producer breaches of contract, producer disruptions, high demand leading to difficulties allocating appropriate quantities, port closures and other transportation disruptions and other circumstances beyond our control, or we may be unable to purchase chemicals that we are obligated to deliver to our customers at prices that enable us to earn a profit. In addition, unpredictable events may have a significant impact on the industries in which many of our customers operate, reducing demand for products that we normally distribute in significant volumes. As examples, recent impacts on supply sources for hydrochloric acid have impacted our ability to meet all of our customers’ demands for this product. Significant disruptions of supply and disruptions in customer industries could have a material adverse effect on our business, financial condition and results of operations.
Significant changes in the business strategies of producers could also disrupt our supply. Large chemical manufacturers may elect to sell certain products (or products in certain regions) directly to customers, instead of relying on distributors such as us. While we do not believe that our results depend materially on access to any individual producer’s products, a reversal of the trend toward more active use of distributors would likely result in increasing margin pressure or products becoming unavailable to us. Any of these developments could have a material adverse effect on our business, financial condition and results of operations.
To the extent we have contracts with producers and our customers, they are generally short term or terminable upon short notice or at will, and termination of our relationships with producers and customers could negatively affect our business.
Our purchases and sales of chemicals are typically made pursuant to purchase orders rather than long-term contracts. While some of our relationships for the distribution and sale of chemicals have exclusivity or preference provisions, we may be unable to enforce these provisions effectively for legal or business reasons. Many of our contracts with both producers and our customers are terminable without cause upon 30 days’ or less notice to us from the producer or customer. Our business relationships and reputation may suffer if we are unable to meet our delivery obligations to our customers which may occur because many producers are not subject to contracts or can terminate contracts on short notice. In addition, renegotiation of purchase or sales terms to our disadvantage could reduce our sales margins. Any of these developments could adversely affect our business, financial condition and results of operations.
The prices and costs of the products we purchase may be subject to large and significant price increases. We might not be able to pass such cost increases through to our customers. We could experience financial losses if our inventories of one or more chemicals exceed our sales and the price of those chemicals decreases significantly while in our inventories or if our inventories fall short of our sales and the purchase price of those chemicals increases significantly.
We purchase and sell a wide variety of chemicals, the price and availability of which may fluctuate, and may be subject to large and significant price increases. Many of our contracts with producers include chemical prices that are not fixed or are tied to an index, which allows our producers to change the prices of the chemicals we purchase as the price of the chemicals fluctuates in the market. Our business is exposed to these fluctuations, as well as to fluctuations in our costs for transportation and distribution due to rising fuel prices or increases in charges from common carriers, rail companies and other third party transportation providers, as well as other factors. Changes in chemical prices affect our net sales and cost of goods sold, as well as our working capital requirements, levels of debt and financing costs. We might not always be able to reflect increases in our chemical costs, transportation costs and other costs in our own pricing. Any inability to pass cost increases onto customers may adversely affect our business, financial condition and results of operations.
21
In order to meet customer demand, we typically maintain significant inventories, and we are therefore subject to a number of risks associated with our inventory levels, including the following:
• | declines in the prices of chemicals that are held by us; |
• | the need to maintain a significant inventory of chemicals that may be in limited supply and therefore difficult to procure; |
• | buying chemicals in bulk for the best pricing and thereby holding excess inventory; |
• | responding to the unpredictable demand for chemicals; |
• | cancellation of customer orders; and |
• | responding to customer requests for quick delivery. |
In order to manage our inventories successfully, we must estimate demand from our customers and purchase chemicals that substantially correspond to that demand. If we overestimate demand and purchase too much of a particular chemical, we face a risk that the price of that chemical will fall, leaving us with inventory that we cannot sell profitably or have to write down such inventory from its recorded value. If we underestimate demand and purchase insufficient quantities of a particular chemical and prices of that chemical rise, we could be forced to purchase that chemical at a higher price and forego profitability in order to meet customer demand. Our business, financial condition and results of operations could suffer a material adverse effect if either or both of these situations occur frequently or in large volumes. We also face the risk of dissatisfied customers and damage to our reputation if we cannot meet customer demand for a particular chemical because we are short on inventories.
We could lose our customers and suffer damage to our reputation if we are unable to meet customer demand for a particular product.
In addition, particularly in cases of pronounced cyclicality in our end markets, it can be difficult to anticipate our customers’ requirements for particular chemicals, and we could be asked to deliver larger-than-expected quantities of a particular chemical on short notice. If for any reason we experience widespread, systemic difficulties in filling customer orders, our customers may be dissatisfied and discontinue their relationship with us or we may be required to pay a higher price in order to obtain the needed chemical on short notice, thereby adversely affecting our margins.
Trends in oil, gas and mineral prices could adversely affect the level of exploration, development and production activity of certain of our customers and in turn the demand for our products and services.
Demand for our oil, gas and mining products and services is sensitive to the level of exploration, drilling, development and production activity of, and the corresponding capital spending by, oil, gas and mining companies and oilfield service providers. The level of exploration, drilling, development and production activity is directly affected by trends in oil, gas and mineral prices, which historically have been volatile and are likely to continue to be volatile. Many factors may affect these prices, including global market conditions, political conditions and weather. The unpredictability of these factors prevents any reasonable forecast on the movements of such prices.
Recently, there has been a significant decline in the prices of oil and gas. This, or any other reduction in oil and gas prices, could depress the immediate levels of exploration, drilling, development and production activity by certain of our customers. Even the perception of longer-term lower oil and gas prices by certain of our customers could similarly reduce or delay major expenditures by these customers given the long-term nature of many large-scale development projects. If any of these events were to occur, it could have an adverse effect on our business, results of operations and financial condition.
Our balance sheet includes significant goodwill and intangible assets, the impairment of which could affect our future operating results.
We carry significant goodwill and intangible assets on our balance sheet. As of December 31, 2016, our goodwill and intangible assets totaled approximately $1.8 billion and $0.3 billion, respectively, including approximately $1.2 billion in goodwill resulting from our 2007 acquisition by investment funds advised by CVC. We may also recognize additional goodwill and intangible assets in connection with future business acquisitions. Goodwill is not amortized for book purposes and is tested for impairment using a fair value based approach annually, or between annual tests if an event occurs or circumstances change that indicate that the fair value of a reporting unit has more likely than not declined below its carrying value. The identification and measurement of impairment involves the estimation of the fair value of reporting units, which requires judgment and involves the use of significant estimates and assumptions by management. The estimates of fair value of reporting units are based on the best information available as of the date of the assessment and incorporate management assumptions about expected future cash flows and contemplate other valuation techniques. Our estimates of future cash flows may differ from actual cash flows that are subsequently realized due to many factors, including future worldwide economic conditions and the expected benefits of our initiatives, among other things.
22
Intangible assets are amortized for book purposes over their respective useful lives and are tested for impairment if any event occurs or circumstances change that indicates that carrying value may not be recoverable. Although we currently do not expect that our goodwill and intangible assets will be further impaired, we cannot guarantee that a material impairment will not occur, particularly in the event of a substantial deterioration in our future prospects either in total or in a particular reporting unit. See “Note 12: Goodwill and intangible assets” in Item 8 of this Annual Report on Form 10-K for a discussion of our 2016 impairment review. If our goodwill and intangible assets become impaired, it could have a material adverse effect on our financial condition and results of operations.
We have in the past and may in the future make acquisitions, ventures and strategic investments, some of which may be significant in size and scope, which have involved in the past and will likely involve in the future numerous risks. We may not be able to address these risks without substantial expense, delay or other operational or financial problems.
We have made and may in the future make acquisitions of, or investments in, businesses or companies (including strategic partnerships with other companies). Acquisitions or investments have involved in the past and will likely involve in the future various risks, such as:
• | integrating the operations and personnel of any acquired business; |
• | the potential disruption of our ongoing business, including the diversion of management attention; |
• | the possible inability to obtain the desired financial and strategic benefits from the acquisition or investment; |
• | customer attrition arising from preferences to maintain redundant sources of supply; |
• | producer attrition arising from overlapping or competitive products; |
• | assumption of contingent or unanticipated liabilities or regulatory liabilities; |
• | dependence on the retention and performance of existing management and work force of acquired businesses for the future performance of these businesses; |
• | regulatory risks associated with acquired businesses (including the risk that we may be required for regulatory reasons to dispose of a portion of our existing or acquired businesses); and |
• | the risks inherent in entering geographic or product markets in which we have limited prior experience. |
Future acquisitions and investments may need to be financed in part through additional financing from banks, through public offerings or private placements of debt or equity securities or through other arrangements, and could result in substantial cash expenditures. The necessary acquisition financing may not be available to us on acceptable terms if and when required, particularly because our current high leverage may make it difficult or impossible for us to secure additional financing for acquisitions.
To the extent that we make acquisitions that result in our recording significant goodwill or other intangible assets, the requirement to review goodwill and other intangible assets for impairment periodically may result in impairments that could have a material adverse effect on our financial condition and results of operations.
In connection with acquisitions, ventures or divestitures, we may become subject to liabilities.
In connection with any acquisitions or ventures, we may acquire liabilities or defects such as legal claims, including but not limited to third party liability and other tort claims; claims for breach of contract; employment-related claims; environmental liabilities, conditions or damage; permitting, regulatory or other compliance with law issues; hazardous materials or liability for hazardous materials; or tax liabilities. If we acquire any of these liabilities, and they are not adequately covered by insurance or an enforceable indemnity or similar agreement from a creditworthy counterparty, we may be responsible for significant out-of-pocket expenditures. In connection with any divestitures, we may incur liabilities for breaches of representations and warranties or failure to comply with operating covenants under any agreement for a divestiture. In addition, we may indemnify a counterparty in a divestiture for certain liabilities of the subsidiary or operations subject to the divestiture transaction. These liabilities, if they materialize, could have a material adverse effect on our business, financial condition and results of operations.
We generate a significant portion of our net sales internationally and intend to continue to expand our international operations. We face particular challenges in emerging markets. Our results of operations could suffer if we are unable to manage our international operations effectively or as a result of various risks related to our international activities.
During the year ended December 31, 2016, approximately 40% of our net sales were generated outside of the United States. We intend to continue to expand our penetration in certain foreign markets and to enter new and emerging foreign markets. Expansion of our international business will require significant management attention and resources. The profitability of our international operations will largely depend on our continued success in the following areas:
23
• | securing key producer relationships to help establish our presence in international markets; |
• | hiring and training personnel capable of supporting producers and our customers and managing operations in foreign countries; |
• | localizing our business processes to meet the specific needs and preferences of foreign producers and customers, which may differ in certain respects from our experience in North America and Europe; |
• | building our reputation and awareness of our services among foreign producers and customers; and |
• | implementing new financial, management information and operational systems, procedures and controls to monitor our operations in new markets effectively, without causing undue disruptions to our operations and customer and producer relationships. |
In addition, we are subject to risks associated with operating in foreign countries, including:
• | varying and often unclear legal and regulatory requirements that may be subject to inconsistent or disparate enforcement, particularly regarding environmental, health and safety issues and security or other certification requirements, as well as other laws and business practices that favor local competitors, such as exposure to possible expropriation, nationalization, restrictions on investments by foreign companies or other governmental actions; |
• | less stable supply sources; |
• | competition from existing market participants that may have a longer history in and greater familiarity with the foreign markets where we operate; |
• | tariffs, export duties, quotas and other barriers to trade; as well as possible limitations on the conversion of foreign currencies into US dollars or remittance of dividends and other payments by our foreign subsidiaries; |
• | possible future changes to tariffs associated with imports and exports from the US; |
• | divergent labor regulations and cultural expectations regarding employment; |
• | different cultural expectations regarding industrialization, international business and business relationships; |
• | foreign taxes and related regulations, including foreign taxes that we may not be able to offset against taxes imposed upon us in the United States, and foreign tax and other laws limiting our ability to repatriate earnings to the United States; |
• | possible changes in foreign and domestic taxes and related regulations; |
• | extended payment terms and challenges in our ability to collect accounts receivable; |
• | changes in a specific country’s or region’s political or economic conditions; |
• | compliance with anti-bribery laws such as the US Foreign Corrupt Practices Act, the UK Bribery Act and similar anti-bribery laws in other jurisdictions, the violation of which could expose us to severe criminal or civil sanctions; and |
• | compliance with anti-boycott, privacy, economic sanctions, anti-dumping, antitrust, import and export laws and regulations by our employees or intermediaries acting on our behalf, the violation of which could expose us to significant fines, penalties or other sanctions. |
If we fail to address the challenges and risks associated with international expansion, we may encounter difficulties implementing our strategy, thereby impeding our growth and harming our operating results.
Our operations in the Asia-Pacific region, Eastern Europe, Latin America and the Middle East and Africa are at an early stage. It may prove difficult to achieve our goals and take advantage of growth and acquisition opportunities in these or in other emerging markets due to a lack of comprehensive market knowledge and network and legal restrictions. Our growth in emerging markets may also be limited by other factors such as significant government influence over local economies, foreign investment restrictions, substantial fluctuations in economic growth, high levels of inflation and volatility in currency values, exchange controls or restrictions on expatriation of earnings, high domestic interest rates, wage and price controls, changes in governmental economic or tax policies, imposition of trade barriers, unexpected changes in regulation and overall political social and economic instability. In addition, the heightened exposure to terrorist attacks or acts of war or civil unrest in certain geographies, if they occur, could result in damage to our facilities, substantial financial losses or injuries to our personnel.
Although we exercise what we believe to be an appropriate level of central control and active supervision of our operations around the world, our local subsidiaries retain significant operational flexibility. There is a risk that our operations around the
24
world will experience problems that could damage our reputation, or that could otherwise have a material adverse effect on our business, financial condition and results of operations.
We may be unable to effectively implement our strategies or achieve our business goals.
The breadth and scope of our business poses several challenges, such as:
• | initiating or maintaining effective communication among and across all of our geographic business segments and industry groups; |
• | identifying new products and product lines and integrating them into our distribution network; |
• | allocating financial and other resources efficiently across all of our business segments and industry groups; |
• | aligning organizational structure with management’s vision and direction; |
• | communicating ownership and accounting over business activities and ensuring responsibilities are properly understood throughout the organization; |
• | ensuring cultural and organizational changes are executed smoothly and efficiently and ensuring personnel resources are properly allocated to effect these changes; and |
• | establishing standardized processes across geographic business segments and industry groups. |
As a result of these and other factors such as these, we may be unable to effectively implement our strategies or achieve our business goals. Any failure to effectively implement our strategies may adversely impact our future prospects and our results of operations and financial condition.
Fluctuations in currency exchange rates may adversely affect our results of operations.
We sell products in over 150 countries and we generated approximately 40% of our 2016 net sales outside the United States. The revenues we receive from such foreign sales are often denominated in currencies other than the US dollar. We do not hedge our foreign currency exposure with respect to our investment in and earnings from our foreign businesses. Accordingly, we might suffer considerable losses if there is a significant adverse movement in exchange rates. For example, in 2016 the US dollar appreciated in value compared to both the Canadian dollar and the euro. The results of operations in our Canada and EMEA segments were negatively impacted due to this appreciation. See “Management’s Discussion and Analysis of Financial Condition and Results of Operations” in Item 7 of this Annual Report on Form 10-K for additional information.
In addition, we report our consolidated results in US dollars. The results of operations and the financial position of our local operations are generally reported in the relevant local currencies and then translated into US dollars at the applicable exchange rates for inclusion in our consolidated financial statements, exposing us to currency translation risk. Consequently, any change in exchange rates between our foreign subsidiaries’ functional currencies and the US dollar will affect our consolidated income statement and balance sheet when the results of those operating companies are translated into US dollars for reporting purposes. Decreases in the value of our foreign subsidiaries’ functional currencies against the US dollar will tend to reduce those operating companies’ contributions in dollar terms to our financial condition and results of operations. In 2016, our most significant currency exposures were to the euro, the Canadian dollar and the British pound sterling versus the US dollar. The exchange rates between these and other foreign currencies and the US dollar may fluctuate substantially and such fluctuations have had a significant effect on our results in recent periods. For additional details on our currency exposure and risk management practices, see “Quantitative and Qualitative Disclosures About Market Risk” in Item 7A of this Annual Report on Form 10-K.
The markets in which we operate are highly competitive.
The chemical distribution market is highly competitive. Chemicals can be purchased from a variety of sources, including traders, brokers, wholesalers and other distributors, as well as directly from producers. Many of the products we distribute are made to industry standard specifications, and are essentially fungible with products offered by our competition. The competitive pressure we face is particularly strong in sectors and markets where local competitors have strong positions. Increased competition from distributors of products similar to or competitive with ours could result in price reductions, reduced margins and a loss of market share.
We expect to continue to experience significant and increasing levels of competition in the future. We must also compete with smaller companies that have been able to develop strong local or regional customer bases. In certain countries, some of our competitors are more established, benefit from greater name recognition and have greater resources within those countries than we do.
25
Consolidation of our competitors in the markets in which we operate could place us at a competitive disadvantage and reduce our profitability.
We operate in an industry which is highly fragmented on a global scale, but in which there has been a trend toward consolidation in recent years. Consolidations of our competitors may jeopardize the strength of our positions in one or more of the markets in which we operate and any advantages we currently enjoy due to the comparative scale of our operations. Losing some of those advantages could adversely affect our business, financial condition and results of operations, as well as our growth potential.
We rely on our computer and data processing systems, and a large-scale malfunction could disrupt our business or create potential liabilities.
Our ability to keep our business operating effectively depends on the functional and efficient operation of our enterprise resource planning, telecommunications systems, inventory tracking, billing and other information systems and related records and information management policies. We rely on these systems to track transactions, billings, payments and inventory, as well as to make a variety of day-to-day business decisions. Our systems are aging and susceptible to malfunctions, lack of support, interruptions (including due to equipment damage, power outages, computer viruses and a range of other hardware, software and network problems) and we may experience such malfunctions, interruptions or security breaches in the future. Our systems may also be older generations of software which are unable to perform as efficiently as, and fail to communicate well with, newer systems. As the development and implementation of our information technology systems continue, we may elect to modify, replace or discontinue certain technology initiatives, which would result in write-downs.
Although our systems are diversified, including multiple server locations and a range of software applications for different regions and functions, a significant or large-scale malfunction, interruption or security breach of our computer or data processing systems could adversely affect our ability to manage and keep our operations running efficiently and damage our reputation if we are unable to track transactions and receive products from producers or deliver products to our customers. A malfunction that results in a wider or sustained disruption to our business could have a material adverse effect on our business, financial condition and results of operations, as well as on the ability of management to align and optimize technology to implement business strategies. A security breach might also lead to potential claims from third parties or employees.
Further, a failure to comply with our records and information management and retention policies could lead to potential claims, liabilities or exposures.
Our business could be negatively affected by security threats, including cybersecurity threats to us, and other disruptions.
We face various security threats, including cybersecurity threats to gain unauthorized access to sensitive information or to render data or systems unusable, threats to the security of our facilities, and threats from terrorist acts. The potential for such security threats subjects our operations to increased risks that could have a material adverse effect on our business. In particular, our implementation of various procedures and controls to monitor and mitigate security threats and to increase security for our information, facilities and infrastructure may result in increased capital and operating costs. Moreover, there can be no assurance that such procedures and controls will be sufficient to prevent security breaches from occurring. If any of these security breaches were to occur, they could lead to losses of sensitive information, critical infrastructure or capabilities essential to our operations and could have a material adverse effect on our reputation, financial position, results of operations or cash flows and could result in claims being brought against us. Cybersecurity attacks in particular are becoming more sophisticated and include, but are not limited to, malicious software, attempts to gain unauthorized access to data (either directly or through our business partners), and other electronic security breaches that could lead to disruptions in critical systems, unauthorized release of confidential or otherwise protected information, and corruption of data. In addition, if any information about our customers and producers retained by us were the subject of a successful cybersecurity attack against us, we could be subject to litigation or other claims by the affected customers and producers. These events could damage our reputation and lead to financial losses from expenses related to remediation actions, loss of business or potential liability.
We depend on transportation assets, some of which we do not own, in order to deliver products to our customers.
Although we maintain a significant portfolio of owned and leased transportation assets, including trucks, trailers and railcars, we also rely on transportation and warehousing provided by third parties (including common carriers and rail companies) to deliver products to our customers. Our access to third party transportation is not guaranteed, and we may be unable to transport chemicals at economically attractive rates in certain circumstances, particularly in cases of adverse market conditions or disruptions to transportation infrastructure. We are also subject to increased costs that we may not always be able to recover from our customers, including fuel prices, as well as charges imposed by common carriers, leasing companies and other third parties involved in transportation. In particular, our US operations rely to a significant extent on rail shipments, and we are therefore required to pay rail companies’ network access fees. We can also experience the availability of trucks and drivers tighten. We are also subject to the risks normally associated with product delivery, including inclement weather, disruptions in the transportation infrastructure, disruptions in our lease arrangements and the availability of fuel, as well as liabilities arising from accidents to the extent we are
26
not adequately covered by insurance or misdelivery of products. Our failure to deliver products in a timely and accurate manner could harm our reputation and brand, which could adversely affect our business, financial condition and results of operations.
Our business exposes us to significant risks associated with hazardous materials and related activities, not all of which are covered by insurance.
Because we are engaged in the blending, managing, handling, storing, selling, transporting and disposing of chemicals, chemical waste products and other hazardous materials, product liability, health impacts, fire damage, safety and environmental risks are significant concerns for us. We maintain substantial reserves, as described below in “—We are subject to extensive general and product-specific environmental, health and safety laws and regulations. Compliance with and changes to these environmental, health and safety laws, including laws relating to the investigation and remediation of contamination, could have a material adverse effect on our business, financial condition and results of operations,” relating to remediation activities at our owned sites and third party sites which are subject to federal and state clean-up requirements. We are also subject in the United States to federal legislation enforced by OSHA as well as to state safety and health laws. We are also exposed to present and future chemical exposure claims by employees, contractors on our premises, other persons located nearby, as well as related workers’ compensation claims. We carry insurance to protect us against many accident-related risks involved in the conduct of our business and we maintain environmental damage and pollution insurance coverage in accordance with our assessment of the risks involved, the ability to bear those risks and the cost and availability of insurance. Each of these insurance policies is subject to exclusions, deductibles and coverage limits we believe are generally in accordance with industry standards and practices. We do not insure against all risks and may not be able to insure adequately against certain risks (whether relating to our or a third party’s activities or other matters) and may not have insurance coverage that will pay any particular claim. We also may be unable to obtain at commercially reasonable rates in the future adequate insurance coverage for the risks we currently insure against, and certain risks are or could become completely uninsurable or eligible for coverage only to a reduced extent. In particular, more stringent environmental, health or safety regulations may increase our costs for, or impact the availability of, insurance against accident-related risks and the risks of environmental damage or pollution. Our business, financial condition and results of operations could be materially impaired by accidents and other environmental risks that substantially reduce our revenues, increase our costs or subject us to other liabilities in excess of available insurance.
Accidents, safety failures, environmental damage, product quality issues, major or systemic delivery failures involving our distribution network or the products we carry, or adverse health effects or other harm related to hazardous materials we blend, manage, handle, store, sell, transport or dispose of could damage our reputation and result in substantial damages or remedial obligations.
Our business depends to a significant extent on our customers’ and producers’ trust in our reputation for reliability, quality, safety and environmental responsibility. Actual or alleged instances of safety deficiencies, mistaken or incorrect deliveries, inferior product quality, exposure to hazardous materials resulting in illness, injury or other harm to persons, property or natural resources, or of damage caused by us or our products, could damage our reputation and lead to customers and producers curtailing the volume of business they do with us. Also, there may be safety, personal injury or other environmental risks related to our products which are not known today. Any of these events, outcomes or allegations could also subject us to substantial legal claims, and we could incur substantial expenses, including legal fees and other costs, in defending such legal claims which could materially impact our financial position and results of operations.
Actual or alleged accidents or other incidents at our facilities or that otherwise involve our personnel or operations could also subject us to claims for damages by third parties. Because many of the chemicals that we handle are dangerous, we are subject to the ongoing risk of hazards, including leaks, spills, releases, explosions and fires, which may cause property damage, illness, physical injury or death. We sell products used in hydraulic fracturing, a process that involves injecting water, sand and chemicals into subsurface rock formations to release and capture oil and natural gas. The use of such hydraulic fracturing fluids by our customers may result in releases that could impact the environment and third parties. Several of our distribution facilities, including our Los Angeles facility, one of our largest, are located near high-density population centers. If any such events occur, whether through our own fault, through preexisting conditions at our facilities, through the fault of a third party or through a natural disaster, terrorist incident or other event outside our control, our reputation could be damaged significantly. We could also become responsible, as a result of environmental or other laws or by court order, for substantial monetary damages or expensive investigative or remedial obligations related to such events, including but not limited to those resulting from third party lawsuits or environmental investigation and cleanup obligations on and off-site. The amount of any costs, including fines, damages and/or investigative and remedial obligations, that we may become obligated to pay under such circumstances could substantially exceed any insurance we have to cover such losses.
Any of these risks, if they materialize, could significantly harm our reputation, expose us to substantial liabilities and have a material adverse effect on our business, financial condition and results of operations.
27
Evolving environmental laws and regulations on hydraulic fracturing and other oil and gas production activities could have an impact on our financial performance.
Hydraulic fracturing is a common practice that is used to stimulate production of crude oil and/or natural gas from dense subsurface rock formations, and is primarily presently regulated by state agencies. Many states have adopted laws and/or regulations that require disclosure of the chemicals used in hydraulic fracturing, and are considering legal requirements that could impose more stringent permitting, disclosure and well construction requirements on oil and/or natural gas drilling activities as well as regulations relating to waste streams from such activities. The EPA is also moving forward with various related regulatory actions, including regulations requiring, among other matters, “green completions” of hydraulically-fractured wells. Similarly, existing and new regulations in the United States and elsewhere relating to oil and gas production could impact the sale of some of our products into these markets.
Our business exposes us to potential product liability claims and recalls, which could adversely affect our financial condition and performance.
The repackaging, blending, mixing, manufacture, sale and distribution of chemical products by us, including products used in hydraulic fracturing operations and products produced with food ingredients or with pharmaceutical and nutritional supplement applications, involve an inherent risk of exposure to product liability claims, product recalls, product seizures and related adverse publicity, including, without limitation, claims for exposure to our products, spills or escape of our products, personal injuries, food related claims and property damage or environmental claims. A product liability claim, judgment or recall against our customers could also result in substantial and unexpected expenditures for us, affect consumer confidence in our products and divert management’s attention from other responsibilities. Although we maintain product liability insurance, there can be no assurance that the type or level of coverage is adequate or that we will be able to continue to maintain our existing insurance or obtain comparable insurance at a reasonable cost, if at all. A product recall or a partially or completely uninsured judgment against us could have a material adverse effect on our business, financial condition and results of operation.
We are subject to extensive general and product-specific environmental, health and safety laws and regulations. Compliance with and changes to these environmental, health and safety laws, including laws relating to the investigation and remediation of contamination, could have a material adverse effect on our business, financial condition and results of operations.
We are subject to extensive environmental, health and safety laws and regulations in multiple jurisdictions because we blend, manage, handle, store, sell, transport and arrange for the disposal of chemicals, hazardous materials and hazardous waste. These include laws and regulations governing our management, storage, transportation and disposal of chemicals; product regulation; air, water and soil contamination; and the investigation and cleanup of contaminated sites, including any spills or releases that may result from our management, handling, storage, sale, transportation of chemicals and other products. We hold a number of environmental permits and licenses. Compliance with these laws, regulations, permits and licenses requires that we expend significant amounts for ongoing compliance, investigation and remediation. If we fail to comply with such laws, regulations, permits or licenses we may be subject to fines and other civil, administrative or criminal sanctions, including the revocation of permits and licenses necessary to continue our business activities.
Previous operations, including those of acquired companies, have resulted in contamination at a number of current and former sites, which must be investigated and remediated. We are currently investigating and/or remediating contamination, or contributing to cleanup costs, at approximately 130 currently or formerly owned, operated or used sites or other sites impacted by our operations. We have spent substantial sums on such investigation and remediation and we expect to continue to incur such expenditures in the future. Based on current estimates, we believe that these ongoing investigation and remediation costs will not materially affect our business. There is no guarantee, however, that our estimates will be accurate, that new contamination will not be discovered or that new environmental laws or regulations will not require us to incur additional costs. Any such inaccuracies, discoveries or new laws or regulations, or the interpretation of existing laws and regulations, could have a material adverse effect on our business, financial condition and results of operations. As of December 31, 2016, we reserved approximately $95.8 million for probable and reasonably estimable losses associated with remediation at currently or formerly owned, operated or used sites or other sites impacted by our operations. We may incur losses in connection with investigation and remediation obligations that exceed our environmental reserve. See “Management’s Discussion and Analysis of Financial Condition and Results of Operations—Critical Accounting Estimates—Environmental Liabilities” in Item 7 of this Annual Report on Form 10-K for additional information. We also may incur substantial costs, including fines, damages, criminal or civil sanctions and investigation and remediation costs, or experience interruptions in our operations, for violations under environmental, health and safety laws or permit requirements.
We could be held liable for the costs to investigate, remediate or otherwise address contamination at any real property we have ever owned, leased, operated or used or other sites impacted by our operations. Some environmental laws could impose on us the entire cost of cleanup of contamination present at a site even though we did not cause all of the contamination. These laws
28
often identify parties who can be strictly and jointly and severally liable for remediation. The discovery of previously unknown contamination at current or former sites or the imposition of other environmental liabilities or obligations in the future, including additional investigation or remediation obligations with respect to contamination that has impacted other properties, could lead to additional costs or the need for additional reserves that have a material adverse effect on our business, financial condition and results of operations. In addition, we may be required to pay damages or civil judgments related to third party claims, including those relating to personal injury (including exposure to hazardous materials or chemicals we blend, handle, store, sell, transport or dispose of), product quality issues, property damage or contribution to remedial obligations.
We have been identified as potentially responsible parties, or Potentially Responsible Parties, at various third party sites at which we have arranged for the disposal of our hazardous wastes. We may be identified as a Potentially Responsible Party at additional sites beyond those for which we currently have financial obligations. Such developments could have a material adverse effect on our business, financial condition and results of operations. See “Business—Regulatory Matters—Environmental, Health and Safety Matters” in Item 1 of this Annual Report on Form 10-K.
Certain agreements to which we are a party contain contractual provisions pursuant to which we agreed to indemnify other parties for contamination at certain real property. We have been, and may in the future be, subject to environmental indemnity claims asserted by other parties with respect to contamination at sites we have ever owned, leased, operated or used. We could incur significant costs in addressing existing and future environmental indemnification claims.
Societal concerns regarding the safety of chemicals in commerce and their potential impact on the environment have resulted in a growing trend towards increasing levels of product safety and environmental protection regulations. These concerns have led to, and could continue to result in, stringent regulatory intervention by governmental authorities. In addition, these concerns could influence public perceptions, impact the commercial viability of the products we sell and increase the costs to comply with increasingly complex regulations, which could have a negative impact on our business, financial condition and results of operations. Additional findings by government agencies that chemicals pose significant environmental, health or safety risks may lead to their prohibition in some or all of the jurisdictions in which we operate.
Environmental, health and safety laws and regulations vary significantly from country to country and change frequently. Future changes in laws and regulations, or the interpretation of existing laws and regulations, could have an adverse effect on us by adding restrictions, reducing our ability to do business, increasing our costs of doing business or reducing our profitability or reducing the demand for our products. See “Business—Regulatory Matters—Environmental, Health and Safety Matters” in Item 1 of this Annual Report on Form 10-K.
Current and future laws and regulations addressing greenhouse gas emissions enacted in the United States, Europe and other jurisdictions around the world could also have a material adverse effect on our business, financial condition and results of operation. Increased energy costs due to such laws and regulations, emissions associated with our customers’ products or development of alternative products having lower emissions of greenhouse gases and other pollutants could materially affect demand for our customers’ products and indirectly affect our business. Changes in and introductions of regulations have in the past caused us to devote significant management and capital resources to compliance programs and measures, and future regulations applicable to us would likely further increase these compliance costs and could have a material adverse effect on our business, financial condition and results of operations.
Our business is subject to additional general regulatory requirements and tax requirements which increase our cost of doing business, could result in regulatory, unclaimed property or tax claims, and could restrict our business in the future.
Our general business operations are subject to a broad spectrum of general regulatory requirements, including antitrust regulations, food and drug regulations, human resources regulations, tax regulations, unclaimed property, banking and treasury regulations, among others. These regulations add cost to our conduct of business and could, in some instances, result in claims or enforcement actions or could reduce our ability to pursue business opportunities. Future changes could result in additional costs and restrictions to our business activities. We are currently undergoing a multi-state unclaimed property audit, the timing and outcome of which cannot be predicted; we will incur significant professional fees in connection with the audit and if we are found not to be in compliance the auditing states may seek significant remittances and other penalties and interest.
We may not be able to repatriate our cash and undistributed earnings held in foreign jurisdictions without incurring additional tax liabilities.
As of December 31, 2016, we had $336.4 million of cash and cash equivalents on our balance sheet, $329.7 million of which was cash and cash equivalents held in foreign jurisdictions, most notably in Canada. Except as required under US tax laws, we do not provide for US taxes on approximately $676.0 million of cumulative undistributed earnings of foreign subsidiaries that have not been previously taxed, as we expect to invest such undistributed earnings indefinitely outside of the United States. We may not be able to repatriate cash and cash equivalents or undistributed earnings held in foreign jurisdictions without incurring additional tax liabilities and higher effective tax rates. Accordingly, our cash and cash equivalents or undistributed earnings held
29
in foreign jurisdictions may effectively be trapped in such foreign jurisdictions unless we are willing to incur additional tax liabilities. In addition, there have been proposals to change US tax laws that would significantly affect how US multinational corporations are taxed on foreign earnings. Although we cannot predict whether or in what form this proposed legislation may pass, if enacted it could have a material adverse effect on our tax expense and cash flow.
We are subject to asbestos claims.
In connection with our purchase of McKesson Chemical Company in 1986, our wholly-owned subsidiary Univar USA Inc. is obligated to indemnify McKesson for claims alleging injury from exposure to asbestos-containing products by McKesson Chemical Company. As of December 31, 2016, we are defending lawsuits by more than one hundred plaintiffs claiming asbestos related injuries, including a small number of which name us as a defendant. See “Business—Legal Proceedings—Asbestos Claims” in Item 1 of this Annual Report on Form 10-K. As of December 31, 2016, Univar USA has not recorded a liability related to the pending litigation as any potential loss is neither probable nor estimable. Although our costs of defense to date have not been material, we cannot predict the ultimate outcome of these lawsuits, which, if determined adversely to us, may result in liability that would have a material adverse effect on our business, financial condition and results of operations. Furthermore, if the number of asbestos claims for which we are obligated to indemnify McKesson, or the number of asbestos claims naming us, were to increase substantially, particularly if the increase were associated with a significant increase in the average cost per lawsuit, our business, financial condition and results of operations could be materially adversely affected.
Our business is subject to many operational risks for which we might not be adequately insured.
We are exposed to risks including, but not limited to, accidents, contamination and environmental damage, safety claims, natural disasters, terrorism, acts of war and civil unrest and other events that could potentially interrupt our business operations and/or result in significant costs. Although we attempt to cover these risks with insurance to the extent that we consider appropriate, we may incur losses that are not covered by insurance or exceed the maximum amounts covered by our insurance policies. Damage to a major facility, whether or not insured, could impair our ability to operate our business in a geographic region and cause loss of business and related expenses. From time to time, insurance for chemical risks have not been available on commercially acceptable terms or, in some cases, not available at all. In the future we may not be able to maintain our current coverages. Due to the variable condition of the insurance market, we have experienced and may experience in the future, increased deductible retention levels and increased premiums. As we assume more risk through higher retention levels, we may experience more variability in our insurance reserves and expense. Increased insurance premiums or our incurrence of significant uncovered losses could have a material adverse effect on our business, financial condition and results of operations. We have incurred environmental risks and losses, often from our historic activities, for which we have no available or remaining insurance.
We are exposed to ongoing litigation and other legal and regulatory actions and risks in the ordinary course of our business, and we could incur significant liabilities and substantial legal fees.
We are subject to the risk of litigation, other legal claims and proceedings, and regulatory enforcement actions in the ordinary course of our business. Also, there may be safety or personal injury risks related to our products which are not known today. The results of legal proceedings cannot be predicted with certainty. We cannot guarantee that the results of current or future legal proceedings against McKesson and a few claims asserted directly against Univar USA Inc. will not materially harm our business, reputation or brand, nor can we guarantee that we will not incur losses in connection with current or future legal proceedings that exceed any provisions we may have set aside in respect of such proceedings or that exceed any applicable insurance coverage. We also cannot guarantee that any tax assessment previously made against us by the Canada Revenue Agency will not result in a material tax liability or that the issues raised by Customs and Border Patrol will not result in a material liability. The occurrence of any of these events could have a material adverse effect on our business, financial condition or results of operations. See “Business—Legal Proceedings” in Item 1 of this Annual Report on Form 10-K.
Many of the products we sell have “long-tail” exposures, giving rise to liabilities many years after their sale and use. Insurance purchased at the time of sale may not be available when costs arise in the future and producers may no longer be available to provide indemnification.
We require significant working capital, and we expect our working capital needs to increase in the future, which could result in having lower cash available for, among other things, capital expenditures and acquisition financing.
We require significant working capital to purchase chemicals from chemical producers and distributors and sell those chemicals efficiently and profitably to our customers. Our working capital needs may increase if the price of products we purchase and inventory increase. Our working capital needs also increase at certain times of the year, as our customers’ requirements for chemicals increase. For example, our customers in the agricultural sector require significant deliveries of chemicals within a growing season that can be very short and depend on weather patterns in a given year. We need inventory on hand to have product available to ensure timely delivery to our customers. If our working capital requirements increase and we are unable to finance
30
our working capital on terms and conditions acceptable to us, we may not be able to obtain chemicals to respond to customer demand, which could result in a loss of sales.
In addition, the amount of working capital we require to run our business is expected to increase in the future due to expansions in our business activities. If our working capital needs increase, the amount of free cash we have at our disposal to devote to other uses will decrease. A decrease in free cash could, among other things, limit our flexibility, including our ability to make capital expenditures and to acquire suitable acquisition targets that we have identified. If increases in our working capital occur and have the effect of decreasing our free cash, it could have a material adverse effect on our business, financial condition and results of operations.
We have a history of net losses and may not sustain profitability in the future.
Although we achieved profitability in 2015, we had a net loss of $68.4 million in 2016 and there can be no assurance that we will return to profitability. We have incurred net losses in five of the last six fiscal years, including net losses of $68.4 million and $20.1 million in the years ended December 31, 2016 and 2014, respectively. Growth of our revenues may slow or revenues may decline for a number of possible reasons, including slowing demand for our products and services, increasing competition or decreasing growth of our overall market. Our cost of goods sold could increase for a number of possible reasons, including increases in chemical prices and increases in chemical handling expenses due to regulatory action or litigation. In addition, our ability to generate profits could be impacted by our substantial indebtedness and the related interest expense. The interest payments on our indebtedness have exceeded operating income in four of our last five fiscal years. All of these factors could contribute to further net losses and, if we are unable to meet these risks and challenges as we encounter them, our business may suffer.
We depend on a limited number of key personnel who would be difficult to replace. If we lose the services of these individuals, or are unable to attract new talent, our business will be adversely affected.
We depend upon the ability and experience of a number of our executive management and other key personnel who have substantial experience with our operations, the chemicals and chemical distribution industries and the selected markets in which we operate. The loss of the services of one or a combination of our senior executives or key employees could have a material adverse effect on our results of operations. We also might suffer an additional impact on our business if one of our senior executives or key employees is hired by a competitor. Our success also depends on our ability to continue to attract, manage and retain other qualified management and technical and clerical personnel as we grow. We may not be able to continue to attract or retain such personnel in the future.
A portion of our workforce is unionized and labor disruptions could decrease our profitability.
As of December 31, 2016, we had approximately 640 employees in the United States subject to various collective bargaining agreements, most of which have a three-year term. In addition, in several of our international facilities, particularly those in Europe, employees are represented by works councils appointed pursuant to local law consisting of employee representatives who have certain rights to negotiate working terms and to receive notice of significant actions. As of December 31, 2016, approximately 25% of our labor force is covered by a collective bargaining agreement, including approximately 14% of our labor force in the United States, approximately 20% of our labor force in Canada and approximately 50% of our labor force in Europe, and approximately 3% of our labor force is covered by a collective bargaining agreement that will expire within one year. These arrangements grant certain protections to employees and subject us to employment terms that are similar to collective bargaining agreements. We cannot guarantee that we will be able to negotiate these or other collective bargaining agreements or arrangements with works councils on the same or more favorable terms as the current agreements or arrangements, or at all, and without interruptions, including labor stoppages at the facility or facilities subject to any particular agreement or arrangement. A prolonged labor dispute, which could include a work stoppage, could have a material adverse effect on our business, financial condition and results of operations.
Negative developments affecting our pension plans and multi-employer pension plans in which we participate may occur.
We operate a number of pension plans for our employees and have obligations with respect to several multi-employer pension plans sponsored by labor unions in the United States. The terms of these plans vary from country to country. Generally, our defined benefit pension plans are funded with trust assets invested in a diversified portfolio of debt and equity securities and other investments. Among other factors, changes in interest rates, investment returns, the market value of plan assets and actuarial assumptions can (1) affect the level of plan funding; (2) cause volatility in the net periodic benefit cost; and (3) increase our future contribution requirements. In or following an economic environment characterized by declining investment returns and interest rates, we may be required to make additional cash contributions to our pension plans to satisfy our funding requirements and recognize further increases in our net periodic benefit cost. A significant decrease in investment returns or the market value of plan assets or a significant decrease in interest rates could increase our net periodic benefit costs and adversely affect our results of operations.
31
Our pension plans in the United States and certain other countries are not fully funded. The funded status of our pension plans is equal to the difference between the value of plan assets and projected benefit obligations. At December 31, 2016, our pension plans had an underfunded status of $271.8 million. This amount could increase or decrease depending on factors such as those mentioned above. Changes to the funded status of our pension plans as a result of updates to actuarial assumptions and actual experience that differs from our estimates will be recognized as gains or losses in the period incurred under our “mark to market” accounting policy, and could result in a requirement for additional funding which would have a direct effect on our cash position. Based on current projections of minimum funding requirements, we expect to make cash contributions of $31.1 million to our defined benefit pension plans in 2017. The timing for any such requirement in future years is uncertain given the implicit uncertainty regarding the future developments of factors mentioned above. The union sponsored multi-employer pension plans in which we participate are also underfunded, including the substantially underfunded Teamsters Central States, Southeast and Southwest Pension Plan, which has liabilities at a level twice that of its assets. This requires us to make often substantial withdrawal liability payments when we close a facility covered by one of these plans, which could hinder our ability to make otherwise appropriate management decisions to operate as efficiently as possible.
Labeling regulations could have an adverse impact on our business.
The United States has recently amended its Right-to-Know laws to require new content in labels affixed to chemical products being sold by chemical manufacturers and chemical distributors. Recent OSHA publications have caused some lack of clarity on this issue and the transition date for the sale of existing inventory. Although we believe we are properly complying with the transition rules, this lack of clarity in these regulations could impact the company in incremental labeling costs, delays or interruption in product supply and compliance issues.
Changes in legislation, regulation and government policy as a result of the 2016 US presidential and congressional elections may have a material adverse effect on our business in the future.
The recent presidential and congressional elections in the United States could result in significant changes in, and uncertainty with respect to, legislation, regulation and government policy directly affecting our business or indirectly affecting us because of impacts on our customers and producers. Legislative and regulatory proposals discussed during and after the election that could have a material direct or indirect impact on us include, but are not limited to, a disallowance of the deduction for net interest expense, a tax on existing unrepatriated foreign earnings, restrictions on imports and exports, modifications to international trade policy, including withdrawal from trade agreements, environmental regulation, changes to immigration policy, changes to health insurance legislation and the imposition of tariffs and other taxes on imports. We are currently unable to predict whether such changes will occur and, if so, the ultimate impact on our business. To the extent that such changes have a negative impact on us, our producers or our customers, including as a result of related uncertainty, these changes may materially and adversely impact our business, financial condition, results of operations and cash flows.
Risks Related to Our Indebtedness
We and our subsidiaries may incur additional debt in the future, which could substantially reduce our profitability, limit our ability to pursue certain business opportunities and reduce the value of your investment.
As of December 31, 2016, we had $2,284.3 million of debt outstanding under our $2,050.0 million US dollar and €250.0 million euro senior term loan facility (the “Senior Term Loan Facility”), $235.3 million of debt outstanding under our $1,300.0 million Senior ABL credit facility and $100.0 million senior ABL term loan facility (the “Senior ABL Facility”), no borrowings outstanding under our €200.0 million senior European ABL facility (the “European ABL Facility”) with approximately $521.3 million available for additional borrowing under these facilities and $399.5 million outstanding under Univar USA Inc.’s 6.75% senior notes due 2023 (the “Unsecured Notes”). Subject to certain limitations set forth in the agreements that govern these facilities and notes, we or our subsidiaries may incur additional debt in the future, or other obligations that do not constitute indebtedness, which could increase the risks described below and lead to other risks. The amount of our debt or such other obligations could have important consequences for holders of our common stock, including, but not limited to:
• | our ability to satisfy obligations to lenders or noteholders may be impaired, resulting in possible defaults on and acceleration of our indebtedness; |
• | our ability to obtain additional financing for refinancing of existing indebtedness, working capital, capital expenditures, including costs associated with our international expansion, product and service development, acquisitions, general corporate purposes and other purposes may be impaired; |
• | our assets that currently serve as collateral for our debt may be insufficient, or may not be available, to support future financings; |
• | a substantial portion of our cash flow from operations could be used to repay the principal and interest on our debt; |
32
• | we may be increasingly vulnerable to economic downturns and increases in interest rates; |
• | our flexibility in planning for and reacting to changes in our business and the markets in which we operate may be limited; and |
• | we may be placed at a competitive disadvantage relative to other companies in our industry with less debt or comparable debt at more favorable interest rates. |
The agreements governing our indebtedness contain operating covenants and restrictions that limit our operations and could lead to adverse consequences if we fail to comply with them.
The agreements governing our indebtedness contain certain operating covenants and other restrictions relating to, among other things, limitations on indebtedness (including guarantees of additional indebtedness) and liens, mergers, consolidations and dissolutions, sales of assets, investments and acquisitions, dividends and other restricted payments, repurchase of shares of capital stock and options to purchase shares of capital stock and certain transactions with affiliates. In addition, our Senior ABL Facility and European ABL Facility include certain financial covenants.
The restrictions in the agreements governing our indebtedness may prevent us from taking actions that we believe would be in the best interest of our business, and may make it difficult for us to successfully execute our business strategy or effectively compete with companies that are not similarly restricted. We may also incur future debt obligations that might subject us to additional restrictive covenants that could affect our financial and operational flexibility.
Failure to comply with these financial and operating covenants could result from, among other things, changes in our results of operations, the incurrence of additional indebtedness, the pricing of our products, our success at implementing cost reduction initiatives, our ability to successfully implement our overall business strategy or changes in general economic conditions, which may be beyond our control. The breach of any of these covenants or restrictions could result in a default under the agreements that govern these facilities that would permit the lenders to declare all amounts outstanding thereunder to be due and payable, together with accrued and unpaid interest. If we are unable to repay such amounts, lenders having secured obligations could proceed against the collateral securing these obligations. The collateral includes the capital stock of our domestic subsidiaries, 65% of the capital stock of our foreign subsidiaries and substantially all of our and our subsidiaries’ other tangible and intangible assets, subject in each case to certain exceptions. This could have serious consequences on our financial condition and results of operations and could cause us to become bankrupt or otherwise insolvent. In addition, these covenants may restrict our ability to engage in transactions that we believe would otherwise be in the best interests of our business and stockholders.
Increases in interest rates would increase the cost of servicing our debt and could reduce our profitability.
Our debt outstanding under the Senior Term Loan Facility, Senior ABL Facility and European ABL Facility bears interest at variable rates. As a result, increases in interest rates would increase the cost of servicing our debt and could materially reduce our profitability and cash flows. For additional information on our indebtedness, debt service obligations and sensitivity to interest rate fluctuations, see “Qualitative and Quantitative Disclosures About Market Risk” in Item 7A of this Annual Report on Form 10-K.
We may have future capital needs and may not be able to obtain additional financing on acceptable terms, or at all.
We have historically relied on debt financing to fund our operations, capital expenditures and expansion. The market conditions and the macroeconomic conditions that affect the markets in which we operate could have a material adverse effect on our ability to secure financing on acceptable terms, if at all. We may be unable to secure additional financing on favorable terms or at all and our operating cash flow may be insufficient to satisfy our financial obligations under the indebtedness outstanding from time to time. The terms of additional financing may limit our financial and operating flexibility. Our ability to satisfy our financial obligations will depend upon our future operating performance, the availability of credit generally, economic conditions and financial, business and other factors, many of which are beyond our control. Furthermore, if financing is not available when needed, or is not available on acceptable terms, we may be unable to take advantage of business opportunities or respond to competitive pressures, any of which could have a material adverse effect on our business, financial condition and results of operations.
If we raise additional funds through further issuances of equity, convertible debt securities or other securities convertible into equity, our existing stockholders could suffer significant dilution in their percentage ownership of our company, and any new securities we issue could have rights, preferences and privileges senior to those of holders of our common stock, including shares of common stock sold in this offering. If we are unable to obtain adequate financing or financing on terms satisfactory to us, if and when we require it, our ability to grow or support our business and to respond to business challenges could be significantly limited.
33
Risks Related to Our Common Stock
Future sales of shares by existing stockholders could cause our stock price to decline.
Sales of substantial amounts of our common stock in the public market, or the perception that these sales could occur, could cause the market price of our common stock to decline. All of the 40,250,000 shares sold pursuant to our IPO in June 2015, the 4,500,000 shares we registered on July 29, 2016, the 20,943,741 shares we registered on August 15, 2016, the 12,500,000 shares we registered on December 12, 2016 and the 15,000,000 shares we registered on January 31, 2017 are immediately tradable without restriction under the Securities Act of 1933, as amended (the “Securities Act”), unless held by “affiliates”, as that term is defined in Rule 144 under the Securities Act. The remaining shares of outstanding common stock are restricted securities within the meaning of Rule 144 under the Securities Act, but will be eligible for resale subject, in certain cases, to applicable volume, means of sale, holding period and other limitations of Rule 144 or pursuant to an exception from registration under Rule 701 under the Securities Act, subject to the terms of the lock-up agreements entered into by the Significant Stockholders, our directors and certain of our key executive officers. The underwriter may, at any time, release all or any portion of the shares subject to lock-up agreements entered into in connection with this offering.
We have also filed a registration statement under the Securities Act to register the shares of common stock to be issued under our equity compensation plans and, as a result, all shares of common stock acquired upon exercise of stock options granted under our plans are also freely tradable under the Securities Act, unless purchased by our affiliates. In addition, certain of our significant stockholders may distribute the shares that they hold to their investors who themselves may then sell into the public market. Such sales may not be subject to the volume, manner of sale, holding period and other limitations of Rule 144. As resale restrictions end, the market price of our common stock could decline if the holders of those shares sell them or are perceived by the market
as intending to sell them. In the future, we may also issue additional shares of common stock or other equity or debt securities convertible into common stock in connection with a financing, acquisition, litigation settlement or employee arrangement or otherwise. Any of these issuances could result in substantial dilution to our existing stockholders and could cause the trading price of our common stock to decline.
Dahlia Investments Pte. Ltd. (“Dahlia”), an indirectly wholly owned subsidiary of Temasek Holdings (Private) Limited purchased $350.0 million of newly issued shares of our common stock from us and 5,000,000 shares of our common stock from Univar N.V. concurrently with the IPO. The shares of our common stock sold in the concurrent private placement were not registered under the Securities Act. As a result, the shares of our common stock purchased by Dahlia are restricted securities within the meaning of Rule 144 under the Securities Act, but are eligible for resale subject to applicable restrictions under Rule 144 or pursuant to any other exemption from registration under the Securities Act. In addition, Dahlia holds certain registration rights with respect to the shares they purchased in the concurrent private placement pursuant to the Fourth Amended and Restated Stockholders’ Agreement of Univar Inc., (the “Amended and Restated Stockholders Agreement”) pursuant to which the Significant Stockholders (as defined below) and certain other stockholders were granted certain registration rights. In December 2016 and January 2017, Dahlia exercised its registration rights under the Amended and Restated Stockholders Agreement and sold 4,475,627 shares and 4,000,000 shares of our common stock, respectively.
If securities or industry analysts do not publish research or publish misleading or unfavorable research about our business, our stock price and trading volume could decline.
The trading market for our common stock may depend in part on the research and reports that securities or industry analysts publish about us or our business. If one or more of these analysts downgrades our stock or publishes misleading or unfavorable research about our business, our stock price would likely decline. If one or more of these analysts ceases coverage of our company or fails to publish reports on us regularly, demand for our stock may decrease, which could cause our stock price or trading volume to decline.
The Significant Stockholders will exercise significant control over the direction of our business and have the right to nominate members of our Board of Directors. If the ownership of our common stock continues to be highly concentrated, it could prevent you and other stockholders from influencing significant corporate decisions.
Investment funds associated with Clayton, Dubilier & Rice, LLC (“CD&R”) and Dahlia are collectively referred to as the “Significant Stockholders.” The Significant Stockholders collectively beneficially own approximately 25.5% of the outstanding shares of our common stock. The Significant Stockholders will continue to exercise significant influence over all matters requiring stockholder approval for the foreseeable future, including approval of significant corporate transactions, which may reduce the market price of our common stock.
Under the Amended and Restated Stockholders’ Agreement, CD&R and investment funds advised by CVC Capital Partners Advisory (US), Inc. (“CVC”) are each entitled to nominate up to three sponsor directors and three independent directors under certain circumstances related to continued ownership of the shares they hold. Dahlia has the right to nominate one director for so long as Dahlia owns at least 10% of the outstanding shares of the Company’s common stock. Upon the consummation of CVC’s
34
sale of its shares of common stock in August 2016, CVC fell below the threshold whereby they were entitled to nominate sponsor or independent directors and all of the CVC-nominated directors resigned from the board. CD&R and Dahlia continue to hold 21,561,039 shares and 14,165,603 shares, respectively, which allows them to continue to nominate members to our board of directors.
These provisions will allow the Significant Stockholders to continue to exercise significant control over our corporate decisions, including over matters which our other stockholders have a right to vote. Our Third Amended and Restated Certificate of Incorporation and our Second Amended and Restated Bylaws also include a number of provisions that may discourage, delay or prevent a change in our management or control for so long as CVC and CD&R own specified percentages of our common stock. See “— Anti-takeover provisions in our charter documents and Delaware law could discourage, delay or prevent a change in control of our company and may affect the trading price of our common stock.” These provisions not only could have a negative impact on the trading price of our common stock, but could also allow the Significant Stockholders to delay or prevent a corporate transaction that the public stockholders might approve.
Our Third Amended and Restated Certificate of Incorporation provides that we will waive any interest or expectancy in corporate opportunities presented to CD&R.
Our Third Amended and Restated Certificate of Incorporation provides that we, on our behalf and on behalf of our subsidiaries, renounce and waive any interest or expectancy in, or in being offered an opportunity to participate in, corporate opportunities that are from time to time presented to CD&R, or their respective officers, directors, agents, stockholders, members, partners, affiliates or subsidiaries, even if the opportunity is one that we or our subsidiaries might reasonably be deemed to have pursued or had the ability or desire to pursue if granted the opportunity to do so. None of CD&R or its respective agents, stockholders, members, partners, affiliates or subsidiaries will generally be liable to us or any of our subsidiaries for breach of any fiduciary or other duty, as a director or otherwise, by reason of the fact that such person pursues, acquires or participates in such corporate opportunity, directs such corporate opportunity to another person or fails to present such corporate opportunity, or information regarding such corporate opportunity, to us or our subsidiaries unless, in the case of any such person who is a director or officer, such corporate opportunity is expressly offered to such director or officer in writing solely in his or her capacity as a director or officer. Stockholders will be deemed to have notice of and consented to this provision of our Third Amended and Restated Certificate of Incorporation. This will allow CD&R to compete with us. Strong competition for investment opportunities could result in fewer such opportunities for us. We likely will not always be able to compete successfully with our competitors and competitive pressures or other factors may also result in significant price competition, particularly during industry downturns, which could have a material adverse effect on our business, prospects, financial condition, results of operations and cash flows.
Fulfilling our obligations incident to being a public company, including with respect to the requirements of and related rules under the Sarbanes-Oxley Act of 2002, is expensive and time-consuming, and any delays or difficulties in satisfying these obligations could have a material adverse effect on our future results of operations and our stock price.
We are subject to the reporting and corporate governance requirements, the listing standards of the NYSE and the Sarbanes-Oxley Act of 2002 (the “Sarbanes-Oxley Act”), which apply to issuers of listed equity, which impose certain compliance costs and obligations upon us. Meeting these standards requires a significant commitment of additional resources and management oversight which increases our operating costs. These requirements also place additional demands on our finance and accounting staff and on our financial accounting and information systems. Other expenses associated with being a public company include increases in auditing, accounting and legal fees and expenses, investor relations expenses, increased directors’ fees and director and officer liability insurance costs, registrar and transfer agent fees and listing fees, as well as other expenses. As a public company, we are required, among other things, to:
• | prepare and file periodic reports, and distribute other stockholder communications, in compliance with the federal securities laws and the NYSE rules; |
• | define and expand the roles and the duties of our Board of Directors and its committees; and |
• | institute more comprehensive compliance, investor relations and internal audit functions. |
In particular, beginning with the year ending December 31, 2016, the Sarbanes-Oxley Act requires us to document and test the effectiveness of our internal control over financial reporting in accordance with an established internal control framework, and to report on our conclusions as to the effectiveness of our internal controls. Likewise, our independent registered public accounting firm will be required to provide an attestation report on the effectiveness of our internal control over financial reporting pursuant to Section 404(b) of the Sarbanes-Oxley Act. In addition, we are required under the Securities Exchange Act of 1934, as amended, (the “Exchange Act”), to maintain disclosure controls and procedures and internal control over financial reporting. Any failure to implement required new or improved controls, or difficulties encountered in their implementation, could harm our operating results or cause us to fail to meet our reporting obligations. If we or our independent auditors are unable to conclude that we have effective internal control over financial reporting, investors could lose confidence in the reliability of our financial
35
statements. This could result in a decrease in the value of our common stock. Failure to comply with the Sarbanes-Oxley Act could potentially subject us to sanctions or investigations by the SEC, the NYSE or other regulatory authorities, which would require additional financial and management resources.
Our ability to successfully implement our business plan and comply with Section 404 requires us to be able to prepare timely and accurate financial statements. Any delay in the implementation of, or disruption in the transition to, new or enhanced systems, procedures or controls, may cause our operations to suffer and we may be unable to conclude that our internal control over financial reporting is effective and to obtain an unqualified report on internal controls from our auditors. Moreover, we cannot be certain that these measures would ensure that we implement and maintain adequate controls over our financial processes and reporting in the future. Even if we were to conclude, and our auditors were to concur, that our internal control over financial reporting provided reasonable assurance regarding the reliability of financial reporting and the preparation of financial statements for external purposes in accordance with GAAP, because of its inherent limitations, internal control over financial reporting may not prevent or detect fraud or misstatements. This, in turn, could have an adverse impact on trading prices for our shares of common stock, and could adversely affect our ability to access the capital markets.
Anti-takeover provisions in our charter documents and Delaware law could discourage, delay or prevent a change in control of our company and may affect the trading price of our common stock.
Our Third Amended and Restated Certificate of Incorporation and Second Amended and Restated By-laws include a number of provisions that may discourage, delay or prevent a change in our management or control over us that stockholders may consider favorable. For example, our Third Amended and Restated Certificate of Incorporation and Second Amended and Restated By-laws:
• | authorize the issuance of “blank check” preferred stock that could be issued by our Board of Directors to thwart a takeover attempt; |
• | establish a classified Board of Directors, as a result of which our board will be divided into three classes, with each class serving for staggered three-year terms, which prevents stockholders from electing an entirely new Board of Directors at an annual meeting; |
• | limit the ability of stockholders to remove directors; |
• | establish advance notice requirements for nominations for election to our Board of Directors or for proposing matters that can be acted upon by stockholders at stockholder meetings; and |
• | require the approval of holders of at least 75% of the outstanding shares of our voting common stock to amend the Second Amended and Restated By-laws and certain provisions of the Third Amended and Restated Certificate of Incorporation. |
These provisions may prevent our stockholders from receiving the benefit from any premium to the market price of our common stock offered by a bidder in a takeover context. Even in the absence of a takeover attempt, the existence of these provisions may adversely affect the prevailing market price of our common stock if the provisions are viewed as discouraging takeover attempts in the future. See “Description of Capital Stock—Anti-Takeover Effects of our Third Amended and Restated Certificate of Incorporation and Second Amended and Restated By-laws." Our Third Amended and Restated Certificate of Incorporation and Second Amended and Restated By-laws may also make it difficult for stockholders to replace or remove our management. These provisions may facilitate management entrenchment that may delay, deter, render more difficult or prevent a change in our control, which may not be in the best interests of our stockholders.
Our Third Amended and Restated Certificate of Incorporation includes provisions limiting the personal liability of our directors for breaches of fiduciary duty under the General Corporation Law of the State of Delaware and we have entered into Indemnification Agreements which provide further protections to our directors.
Our Third Amended and Restated Certificate of Incorporation contains provisions permitted under the General Corporation Law of the State of Delaware (the “DGCL”) relating to the liability of directors. These provisions eliminate a director’s personal liability to the fullest extent permitted by the DGCL for monetary damages resulting from a breach of fiduciary duty, except in circumstances involving:
• | any breach of the director’s duty of loyalty; |
• | acts or omissions not in good faith or which involve intentional misconduct or a knowing violation of the law; |
• | under Section 174 of the DGCL (unlawful dividends); or |
• | any transaction from which the director derives an improper personal benefit. |
36
The principal effect of the limitation on liability provision is that a stockholder will be unable to prosecute an action for monetary damages against a director unless the stockholder can demonstrate a basis for liability for which indemnification is not available under the DGCL. These provisions, however, should not limit or eliminate our rights or any stockholder’s rights to seek non-monetary relief, such as an injunction or rescission, in the event of a breach of a director’s fiduciary duty. These provisions will not alter a director’s liability under federal securities laws. The inclusion of this provision in our Third Amended and Restated Certificate of Incorporation may discourage or deter stockholders or management from bringing a lawsuit against directors for a breach of their fiduciary duties, even though such an action, if successful, might otherwise have benefited us and our stockholders.
We have entered into indemnification agreements with each of our directors and certain of our executive officers. The indemnification agreements provide our directors and certain of our executive officers with contractual rights to the indemnification and expense advancement rights provided under our Second Amended and Restated By-laws, as well as contractual rights to additional indemnification as provided in the indemnification agreements.
Our Third Amended and Restated Certificate of Incorporation designates the Court of Chancery of the State of Delaware as the exclusive forum for certain litigation that may be initiated by our stockholders, which could limit our stockholders’ ability to obtain a favorable judicial forum for disputes with us.
Our Third Amended and Restated Certificate of Incorporation provides that the Court of Chancery of the State of Delaware will be the sole and exclusive forum for (i) any derivative action or proceeding brought on our behalf, (ii) any action asserting a claim of breach of a fiduciary duty owed to us or our stockholders by any of our directors, officers, employees or agents, (iii) any action asserting a claim against us arising under the DGCL, or (iv) any action asserting a claim against us that is governed by the internal affairs doctrine. By becoming a stockholder in our company, you will be deemed to have notice of and have consented to the provisions of our Third Amended and Restated Certificate of Incorporation related to choice of forum. The choice of forum provision in our Third Amended and Restated Certificate of Incorporation may limit our stockholders’ ability to obtain a favorable judicial forum for disputes with us.
We do not intend to pay dividends on our common stock and, consequently, your ability to achieve a return on your investment will depend on appreciation in the price of our common stock.
We do not intend to declare and pay dividends on our common stock for the foreseeable future. We currently intend to invest our future earnings, if any, to fund our growth or repay outstanding indebtedness. Therefore, you are not likely to receive any dividends on your common stock for the foreseeable future and the success of an investment in shares of our common stock will then depend entirely upon any future appreciation in their value. There is no guarantee that shares of our common stock will appreciate in value or even maintain the price at which our stockholders have purchased their shares. See “Dividend Policy.”
We are no longer a “controlled company” within the meaning of the NYSE rules and the rules of the SEC. However, we may continue to rely on exemptions from certain corporate governance requirements during a one year transition period.
The Significant Stockholders no longer own a majority of our outstanding common stock. As a result, we are no longer a “controlled company” within the meaning of the corporate governance rules of NYSE. Consequently, the NYSE rules require that (i) we appoint a majority of independent directors to our Board of Directors within one year of the date we no longer qualify as a “controlled company”, (ii) the compensation and nominating and corporate governance committees be composed entirely of independent directors within one year of such date and (iii) have an annual performance evaluation of the nominating and corporate governance and compensation committees. During these transition periods, we may continue to utilize the available exemptions
from certain corporate governance requirements as permitted by the NYSE rules.
Accordingly, during the transition periods you will not have the same protections afforded to stockholders of companies that are subject to all of the corporate governance requirements of the NYSE. In addition, although we are no longer be a “controlled company”, the Significant Stockholders continue to be able to significantly influence our decisions. The interests of the Significant Stockholders may not always coincide with the interests of the other holders of our common stock. The Significant Stockholders are in the business of making investments in companies, and may from time to time in the future acquire controlling interests in businesses that complement or directly or indirectly compete with certain portions of our business. If the Significant Stockholders pursue such acquisitions in our industry, those acquisition opportunities may not be available to us. See “Risk Factors—Risks Relating to Our Common Stock—The Significant Stockholders will exercise significant control over the direction of our business and have the right to nominate members of our Board of Directors. If the ownership of our common stock continues to be highly concentrated, it could prevent you and other stockholders from influencing significant corporate decisions.”
ITEM 1B. UNRESOLVED STAFF COMMENTS.
None.
37
ITEM 2. PROPERTIES
Our principal executive office is located in Downers Grove, Illinois under a lease expiring in June 2024. As of December 31, 2016, we had 284 locations the United States in 48 states. Of these locations, 269 are warehouse facilities responsible for storing and shipping of products and 15 are dedicated office space. Our warehouse facilities are nearly equally comprised of owned, leased and third party warehouses and our office space is generally leased. Our facilities focus on the storing, repackaging and blending of chemicals and ingredients for distribution. Such facilities do not require substantial investments in equipment, can be opened fairly quickly and replaced with little disruption. As such, we believe that none of our facilities on an individual basis is principal to the operation of our business. We select locations for our warehouses based on proximity to producers and our customers to maintain efficient distribution networks. We believe that our facilities are adequate and suitable for our current operations. We hold a relatively small number of surplus sites for potential disposition. In some instances, our larger owned sites have been mortgaged under our secured credit facilities.
We have 376 locations outside of the United States in 31 countries. These facilities are focused on storing and shipping of products. Approximately half are owned or leased and half are third party warehouses. The majority of the facilities outside of the United States are found in the following countries:
• | Brazil (5 facilities) |
• | Canada (153 facilities) |
• | China (12 facilities) |
• | France (25 facilities) |
• | Germany (9 facilities) |
• | Belgium (5 facilities) |
• | Mexico (36 facilities) |
• | Netherlands (18 facilities) |
• | Sweden (13 facilities) |
• | United Kingdom (37 facilities) |
ITEM 3. LEGAL PROCEEDINGS
“Legal Proceedings” in Item 1 of this Annual Report on Form 10-K and Note 19, entitled “Commitments and Contingencies” in Item 8 of this Annual Report on Form 10-K, are incorporated herein by reference.
ITEM 4. MINE SAFETY DISCLOSURES
Not applicable.
38
PART II
ITEM 5. | MARKET FOR REGISTRANT’S COMMON EQUITY, RELATED STOCKHOLDER MATTERS AND ISSUER PURCHASES OF EQUITY SECUIRITES |
Market Information for Common Stock
Our common stock has been listed on the New York Stock Exchange under the symbol “UNVR” since June 18, 2015. Prior to that time, there was no public market for our stock. The following table sets forth for the indicated periods the high and low intra-day sales prices per share for our common stock on the New York Stock Exchange.
High | Low | ||||||
Fiscal Year 2016 | |||||||
First Quarter | $ | 17.41 | $ | 11.12 | |||
Second Quarter | 19.74 | 16.68 | |||||
Third Quarter | 21.85 | 17.69 | |||||
Fourth Quarter | 28.60 | 21.07 | |||||
Fiscal Year 2015 | |||||||
Second Quarter (from June 18, 2015) | $ | 27.75 | $ | 25.40 | |||
Third Quarter | 25.96 | 18.15 | |||||
Fourth Quarter | 19.99 | 16.28 | |||||
Holders of Record
As of December 31, 2016, there were 40 stockholders of record of our common stock, and the closing price of our common stock was $28.37 per share as reported on the New York Stock Exchange.
Stock performance
The following graph shows a comparison of cumulative total shareholder return, calculated on a dividend reinvested basis, for the Company, the S&P 500 and the S&P 500 Chemical Index for the 18 months ended December 31, 2016. The graph assumes $100 was invested in each of the Company's common stock, the S&P 500 and S&P 500 Chemical Index as of the market close on June 17, 2015. Note that historic stock price performance is not necessarily indicative of future stock price performance.
39
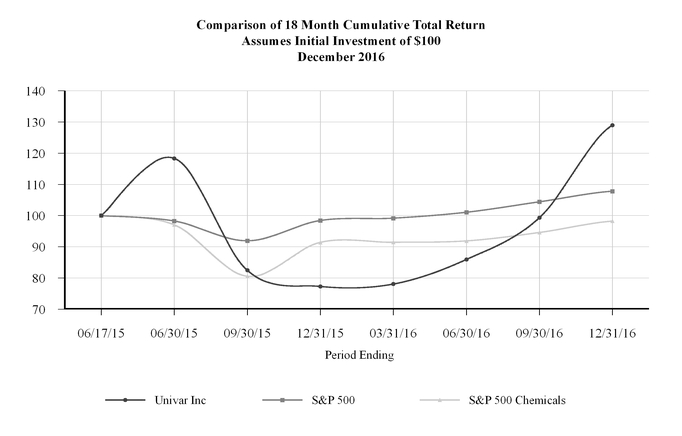
Dividend Policy
We have never declared or paid any cash dividend on our common stock. We intend to retain any future earnings and do not expect to pay dividends in the foreseeable future. In addition, our credit facilities contain restrictions on our ability to pay dividends.
ITEM 6. SELECTED FINANCIAL DATA
The following table presents our summary consolidated financial data as of and for the periods indicated. The selected consolidated financial data as of December 31, 2016 and 2015 and for the years ended December 31, 2016, 2015 and 2014 have been derived from our audited consolidated financial statements included in Item 8 of this Annual Report on Form 10-K. The selected consolidated financial data as of December 31, 2014, 2013 and 2012 and for the fiscal years ended December 31, 2013 and 2012 are derived from our audited consolidated financial statements which are not included in this Annual Report on Form 10-K. Our historical consolidated financial data may not be indicative of our future performance.
This “Selected Financial Data” should be read in conjunction with “Management’s Discussion and Analysis of Financial Condition and Results of Operations” in Item 7 of this Annual Report on Form 10-K and our audited consolidated financial statements and related notes included in Item 8 of this Annual Report on Form 10-K.
40
December 31, 2016 | December 31, 2015 | December 31, 2014 | December 31, 2013 | December 31, 2012 | |||||||||||||||
(in millions except per share data) | |||||||||||||||||||
Consolidated Statements of Operations | |||||||||||||||||||
Net sales | $ | 8,073.7 | $ | 8,981.8 | $ | 10,373.9 | $ | 10,324.6 | $ | 9,747.1 | |||||||||
Gross profit | 1,727.1 | 1,799.1 | 1,930.7 | 1,875.9 | 1,822.5 | ||||||||||||||
Gross margin | 21.4 | % | 20.0 | % | 18.6 | % | 18.2 | % | 18.7 | % | |||||||||
Net (loss) income | (68.4 | ) | 16.5 | (20.1 | ) | (82.3 | ) | (197.4 | ) | ||||||||||
(Loss) income per common share – diluted | (0.50 | ) | 0.14 | (0.20 | ) | (0.83 | ) | (2.01 | ) | ||||||||||
Consolidated Balance Sheet | |||||||||||||||||||
Cash and cash equivalents | $ | 336.4 | $ | 188.1 | $ | 206.0 | $ | 180.4 | $ | 220.9 | |||||||||
Total assets | 5,389.9 | 5,612.4 | 6,067.7 | 6,204.7 | 6,513.8 | ||||||||||||||
Long-term liabilities | 3,240.5 | 3,502.2 | 4,300.7 | 4,232.5 | 4,508.7 | ||||||||||||||
Stockholders’ equity | 809.9 | 816.7 | 248.1 | 381.3 | 526.4 | ||||||||||||||
Other financial data | |||||||||||||||||||
Cash provided by operating activities | $ | 449.6 | $ | 356.0 | $ | 126.3 | $ | 289.3 | $ | 15.5 | |||||||||
Cash used by investing activities | (136.0 | ) | (294.4 | ) | (148.2 | ) | (215.7 | ) | (657.1 | ) | |||||||||
Cash (used) provided by financing activities | (166.1 | ) | (19.8 | ) | 84.1 | (110.5 | ) | 753.8 | |||||||||||
Capital expenditures | 90.1 | 145.0 | 113.9 | 141.3 | 170.1 | ||||||||||||||
Adjusted EBITDA(1) | 562.7 | 600.1 | 641.7 | 598.2 | 607.2 | ||||||||||||||
Adjusted EBITDA margin(1) | 7.0 | % | 6.7 | % | 6.2 | % | 5.8 | % | 6.2 | % | |||||||||
(1) | For a complete discussion of the method of calculating Adjusted EBITDA and its usefulness, see “Management’s Discussion and Analysis of Financial Condition and Results of Operations” in Item 7 of this Annual Report on Form 10-K. We define Adjusted EBITDA margin as Adjusted EBITDA divided by net sales. |
41
The following is a quantitative reconciliation of Adjusted EBITDA to the most directly comparable GAAP financial performance measure, which is net income (loss):
Fiscal year ended December 31, | |||||||||||||||||||
(in millions) | 2016 | 2015 | 2014 | 2013 | 2012 | ||||||||||||||
Net (loss) income | $ | (68.4 | ) | $ | 16.5 | $ | (20.1 | ) | $ | (82.3 | ) | $ | (197.4 | ) | |||||
Impairment charges(1) | 133.9 | — | 0.3 | 135.6 | 75.8 | ||||||||||||||
Pension mark to market loss (gain) | 68.6 | 21.1 | 117.8 | (73.5 | ) | 83.6 | |||||||||||||
Pension curtailment and settlement gains | (1.3 | ) | (4.0 | ) | — | — | — | ||||||||||||
Restructuring charges | 8.0 | 33.8 | 46.2 | 65.8 | 24.2 | ||||||||||||||
Stock based compensation | 10.4 | 7.5 | 12.1 | 15.1 | 17.5 | ||||||||||||||
Contingent consideration fair value adjustments | — | — | — | (24.7 | ) | ||||||||||||||
Acquisition and integration related expenses | 5.5 | 7.1 | 3.7 | 5.0 | 17.7 | ||||||||||||||
French penalty | — | — | — | (4.8 | ) | 17.2 | |||||||||||||
Other operating expenses | 13.3 | 11.6 | 11.4 | 23.9 | 12.3 | ||||||||||||||
Other non-operating items | 0.1 | 4.1 | 2.9 | — | — | ||||||||||||||
Foreign currency transactions | 0.6 | 0.8 | 0.6 | 0.9 | 2.3 | ||||||||||||||
Foreign currency denominated loans revaluation | 13.7 | (8.9 | ) | (8.3 | ) | 10.1 | (1.0 | ) | |||||||||||
Undesignated foreign currency derivative instruments | 1.8 | 4.8 | 3.9 | 0.2 | (6.6 | ) | |||||||||||||
Undesignated interest rate swap contracts | (10.1 | ) | (2.0 | ) | — | — | — | ||||||||||||
Ineffective portion of cash flow hedges | — | 0.4 | (0.2 | ) | 0.2 | — | |||||||||||||
Loss due to discontinuance of cash flow hedges | — | 7.5 | — | — | — | ||||||||||||||
Debt refinancing costs | — | 16.5 | — | 6.2 | 7.2 | ||||||||||||||
Loss on extinguishment of debt | — | 12.1 | 1.2 | 2.5 | 0.5 | ||||||||||||||
Advisory fees to CVC and CD&R | — | 2.8 | 5.9 | 5.2 | 5.2 | ||||||||||||||
Contract termination fee to CVC and CD&R | — | 26.2 | — | — | — | ||||||||||||||
Depreciation and amortization | 237.9 | 225.0 | 229.5 | 228.1 | 205.0 | ||||||||||||||
Interest expense, net | 159.9 | 207.0 | 250.6 | 294.5 | 268.1 | ||||||||||||||
Tax (benefit) expense | (11.2 | ) | 10.2 | (15.8 | ) | (9.8 | ) | 75.6 | |||||||||||
Adjusted EBITDA | $ | 562.7 | $ | 600.1 | $ | 641.7 | $ | 598.2 | $ | 607.2 | |||||||||
(1) | The 2016 impairment charges primarily related to impairment of intangible assets and property, plant and equipment. See "Note: 13 Impairment charges" in Item 8 of this Annual Report on Form 10-K for further information regarding the fiscal year ended December 31, 2016. The 2014 impairment charges primarily related to impairments of idle properties and equipment. The 2013 impairment charges primarily related to the write-off of goodwill related to the Rest of World segment as well as the write-off of capitalized software costs related to a global ERP system. The 2012 impairment charges primarily related to the impairment of goodwill in the EMEA segment. |
ITEM 7. | MANAGEMENT’S DISCUSSION AND ANALYSIS OF FINANCIAL CONDITION AND RESULTS OF OPERATIONS |
Overview
We are a leading global chemical and ingredients distributor and provider of specialty services. We purchase chemicals from thousands of chemical producers worldwide and warehouse, repackage, blend, dilute, transport and sell those chemicals to more than 100,000 customer locations across approximately 150 countries. Our scale and broad geographic reach, combined with our deep product knowledge and end market expertise and our specialty services, provide us with a distinct competitive advantage and enable us to offer customers a “one-stop shop” for their chemical needs. As a result, we believe we are strategically positioned for growth.
Our operations are structured into four operating segments that represent the geographic areas under which we operate and manage our business. These segments are Univar USA (“USA”), Univar Canada (“Canada”), Univar Europe and the Middle East and Africa (“EMEA”), and Rest of World (“Rest of World”), which includes developing businesses in Latin America (including Brazil and Mexico) and the Asia-Pacific region.
42
We monitor the results of our operating segments separately for the purposes of making decisions about resource allocation and performance assessment. We evaluate performance on the basis of Adjusted EBITDA, which we define as our consolidated net income (loss), plus the sum of interest expense, net of interest income, income tax expense (benefit), depreciation, amortization, other operating expenses, net (which primarily consists of pension mark to market adjustments, acquisition and integration related expenses, employee stock-based compensation expense, restructuring charges, advisory fees paid to stockholders, and other unusual or non-recurring expenses), impairment charges, loss on extinguishment of debt and other (expense) income, net (which consists of gains and losses on foreign currency transactions and undesignated derivative instruments, ineffective portion of cash flow hedges, debt refinancing costs, and other nonoperating activity). We believe that Adjusted EBITDA is an important indicator of operating performance because:
• | Adjusted EBITDA excludes the effects of income taxes, as well as the effects of financing and investing activities by eliminating the effects of interest, depreciation and amortization expenses; |
• | we use Adjusted EBITDA in setting performance incentive targets; |
• | we consider gains (losses) on the acquisition, disposal and impairment of assets as resulting from investing decisions rather than ongoing operations; and |
• | other significant items, while periodically affecting our results, may vary significantly from period to period and have a disproportionate effect in a given period, which affects comparability of our results. |
We set transfer prices between operating segments on an arms-length basis in a similar manner to transactions with third parties. We allocate corporate operating expenses that directly benefit our operating segments on a basis that reasonably approximates our estimates of the use of these services.
Other/Eliminations represents the elimination of inter-segment transactions as well as unallocated corporate costs consisting of costs specifically related to parent company operations that do not directly benefit segments, either individually or collectively. In the analysis of our results of operations, we discuss operating segment results for the current reporting period following our consolidated results of operations period-to-period comparison.
The following is management’s discussion and analysis of the financial condition and results of operations for the years ended December 31, 2016, 2015 and 2014. This discussion should be read in conjunction with the consolidated financial statements, including the related notes, see Item 8 “Financial Statements” of this Annual Report on Form 10-K.
For reconciliations of Adjusted EBITDA to net income (loss), see “Selected Financial Data Selected” in Item 6 of this Annual Report on Form 10-K.
Key Factors Affecting Operating Results and Financial Condition
Key factors impacting our operating results and financial condition include the following:
• | Economic conditions and industry trends |
• | Chemical prices |
• | Acquisitions |
• | Volume based pricing |
• | Cost savings |
• | Working capital requirements |
• | Foreign currencies |
For a detailed overview of our business and how the above factors impact us, refer to Item 1 “Business” and Item 1A “Risk Factors” of this Annual Report on Form 10-K.
In addition to the factors listed above, seasonal changes may affect our business and results of operations. Our net sales are affected by the level of industrial production, which tends to decline in the fourth quarter of each year. Certain of our end markets also experience seasonal fluctuations, which also affect our net sales and results of operations. For example, our sales to the agricultural end market, particularly in Canada, tend to peak in the second and third quarters in each year, depending in part on weather-related variations in demand for agricultural chemicals. Sales to other end markets such as paints and coatings or water treatment may also be affected by changing seasonal weather conditions.
43
Results of Operations
Executive Summary
During 2016, we strengthened our management team, reduced our leverage strengthening our financial condition, and began the process of implementing our key strategic initiatives of Commercial Greatness, Operational Excellence, and One Univar. From an operations standpoint, we advanced on each of our strategic priorities which form the framework for our strategy to grow the long-term value of Univar for our equity and debt holders. As a result, in 2016 we:
• | expanded our consolidated Adjusted EBITDA margins; |
• | grew Adjusted EBITDA outside the US by double digits; |
• | completed a series of productivity projects in our USA segment, including phased reductions in resource allocation to upstream oil and gas production, which lowered our cost structure and raised the level of operational excellence in our facilities and branch offices; and |
• | generated significant cash flow and improved our net working capital productivity which helped fund two acquisitions - Bodine Services of the Midwest, which broadens our service capabilities in our ChemCare waste management business, and Nexus Ag, a micronutrients distributor to the agriculture industry in Canada. |
However, the advances in our business were offset by:
• | the substantial strengthening of the US dollar which had the effect of lowering the translated US dollar value of our sales and earnings in Europe, Canada, Mexico and Brazil, in particular; |
• | the historic decline in oil prices continued which depressed demand for chemicals from the hydraulic fracturing segment of the upstream oil and gas market; and |
• | sluggish demand for chemicals from the industrial production sectors of the economies we serve. |
The following tables set forth, for the periods indicated, certain statements of operations data first on the basis of reported data and then as a percentage of total net sales for the relevant period. The financial data set forth below is not necessarily indicative of the results of future operations and should be read in conjunction with our historical consolidated financial statements and accompanying notes included elsewhere herein.
44
Year Ended December 31, 2016 Compared to Year Ended December 31, 2015
Year Ended | Favorable (unfavorable) | % Change | Impact of currency* | ||||||||||||||||||||
(in millions) | December 31, 2016 | December 31, 2015 | |||||||||||||||||||||
Net sales | $ | 8,073.7 | 100.0 | % | $ | 8,981.8 | 100.0 | % | $ | (908.1 | ) | (10.1 | )% | (1.4 | )% | ||||||||
Cost of goods sold (exclusive of depreciation) | 6,346.6 | 78.6 | % | 7,182.7 | 80.0 | % | 836.1 | (11.6 | )% | 1.4 | % | ||||||||||||
Gross profit | 1,727.1 | 21.4 | % | 1,799.1 | 20.0 | % | (72.0 | ) | (4.0 | )% | (1.3 | )% | |||||||||||
Operating expenses: | |||||||||||||||||||||||
Outbound freight and handling | 286.6 | 3.5 | % | 324.6 | 3.6 | % | 38.0 | (11.7 | )% | 0.7 | % | ||||||||||||
Warehousing, selling and administrative | 877.8 | 10.9 | % | 874.4 | 9.7 | % | (3.4 | ) | 0.4 | % | 1.1 | % | |||||||||||
Other operating expenses, net | 104.5 | 1.3 | % | 106.1 | 1.2 | % | 1.6 | (1.5 | )% | 6.0 | % | ||||||||||||
Depreciation | 152.3 | 1.9 | % | 136.5 | 1.5 | % | (15.8 | ) | 11.6 | % | 1.7 | % | |||||||||||
Amortization | 85.6 | 1.1 | % | 88.5 | 1.0 | % | 2.9 | (3.3 | )% | 1.4 | % | ||||||||||||
Impairment charges | 133.9 | 1.7 | % | — | — | % | (133.9 | ) | — | % | — | % | |||||||||||
Total operating expenses | 1,640.7 | 20.3 | % | 1,530.1 | 17.0 | % | (110.6 | ) | 7.2 | % | 1.4 | % | |||||||||||
Operating income | 86.4 | 1.1 | % | 269.0 | 3.0 | % | (182.6 | ) | (67.9 | )% | (0.5 | )% | |||||||||||
Other (expense) income: | |||||||||||||||||||||||
Interest income | 3.9 | — | % | 4.3 | — | % | (0.4 | ) | (9.3 | )% | (2.3 | )% | |||||||||||
Interest expense | (163.8 | ) | (2.0 | )% | (211.3 | ) | (2.4 | )% | 47.5 | (22.5 | )% | 0.7 | % | ||||||||||
Loss on extinguishment of debt | — | — | % | (12.1 | ) | (0.1 | )% | 12.1 | N/M | (200.0 | )% | ||||||||||||
Other expense, net | (6.1 | ) | (0.1 | )% | (23.2 | ) | (0.3 | )% | 17.1 | (73.7 | )% | 26.7 | % | ||||||||||
Total other expense | (166.0 | ) | (2.1 | )% | (242.3 | ) | (2.7 | )% | 76.3 | (31.5 | )% | 3.1 | % | ||||||||||
(Loss) income before income taxes | (79.6 | ) | (1.0 | )% | 26.7 | 0.3 | % | (106.3 | ) | (398.1 | )% | 23.2 | % | ||||||||||
Income tax (benefit) expense | (11.2 | ) | (0.1 | )% | 10.2 | 0.1 | % | 21.4 | (209.8 | )% | 2.0 | % | |||||||||||
Net (loss) income | $ | (68.4 | ) | (0.8 | )% | $ | 16.5 | 0.2 | % | (84.9 | ) | (514.5 | )% | 38.8 | % | ||||||||
* | Foreign currency translation is included in the percentage change. Unfavorable impacts from foreign currency translation are designated with parentheses. |
Net sales
Net sales percentage change due to: | ||
Acquisitions | 1.3 | % |
Reported sales volumes | (4.1 | )% |
Sales pricing and product mix | (5.9 | )% |
Foreign currency translation | (1.4 | )% |
Total | (10.1 | )% |
Net sales were $8,073.7 million in the year ended December 31, 2016, a decrease of $908.1 million, or 10.1%, from the year ended December 31, 2015. The increase in net sales from acquisitions was primarily driven by the November 2015 Weavertown, March 2016 Bodine, and July 2015 Chemical Associates acquisitions in the US and the October 2015 Future/BlueStar and March 2016 Nexus Ag acquisitions in Canada. The decrease in net sales from reported sales volumes primarily resulted from reductions in sales of upstream oil and gas products driven by reduced market demand. The decrease in net sales from changes in sales pricing and product mix was driven by lower average selling prices in all segments. Foreign currency translation decreased net sales, due to the US dollar strengthening against all major currencies. Refer to the “Segment results” for the year ended December 31, 2016 discussion for additional information.
45
Gross profit
Gross profit percentage change due to: | ||
Acquisitions | 2.0 | % |
Reported sales volumes | (4.1 | )% |
Sales pricing, product costs and other adjustments | (0.6 | )% |
Foreign currency translation | (1.3 | )% |
Total | (4.0 | )% |
Gross profit decreased $72.0 million, or 4.0%, to $1,727.1 million for the year ended December 31, 2016. The increase in gross profit from acquisitions was primarily driven by the November 2015 Weavertown, March 2016 Bodine, and July 2015 Chemical Associates acquisitions in the US; and the October 2015 Future/BlueStar and March 2016 Nexus Ag acquisitions in Canada. The decrease in gross profit from reported sales volumes primarily resulted from reductions in upstream oil and gas products driven by reduced market demand. The decrease in gross profit from changes in sales pricing, product costs and other adjustments was primarily driven by the USA segment, partially offset by increases in the Canada, EMEA, and Rest of World segments. Foreign currency translation decreased gross profit due to the US dollar strengthening against all major currencies. Gross margin, which we define as gross profit divided by net sales, increased to 21.4% in the year ended December 31, 2016 from 20.0% in the year ended December 31, 2015. Refer to the “Segment results” for the year ended December 31, 2016 discussion for additional information.
Outbound freight and handling
Outbound freight and handling expenses decreased $38.0 million, or 11.7%, to $286.6 million for the year ended December 31, 2016. Foreign currency translation decreased outbound freight and handling expense by 0.7% or $2.3 million. On a constant currency basis, outbound freight and handling expenses decreased 11.0% or $35.7 million, which was attributable to lower reported sales volumes. Refer to the “Segment results” for the year ended December 31, 2016 discussion for additional information.
Warehousing, selling and administrative
Warehousing, selling and administrative expenses increased $3.4 million, or 0.4%, to $877.8 million for the year ended December 31, 2016. Foreign currency translation decreased warehousing, selling and administrative expenses by 1.1% or $9.8 million. The $13.2 million increase was primarily driven by $16.4 million of incremental operating expenses from acquisitions, $10.4 million in higher personnel expenses primarily due annual compensation increases, and a reduction of $7.9 million of gains from the medical retiree benefit plan have now been fully amortized from accumulated other comprehensive income. Partially offsetting the increases were $12.1 million of lower variable compensation expense and cost reductions of $3.5 million of lower contract labor expenses, $3.1 million of lower travel and entertainment expenses, and $3.0 million of lower information technology expenses driven by efforts to control costs. The remaining $0.2 million increase related to several insignificant components. Refer to the “Segment results” for the year ended December 31, 2016 discussion for additional information.
Other operating expenses, net
Other operating expenses, net decreased $1.6 million, or 1.5%, to $104.5 million for the year ended December 31, 2016. The decrease was primarily related to a reduction of $26.2 million in fees paid to our pre-initial public offering significant stockholders, CVC Capital Partners (“CVC”) and Clayton, Dubilier & Rice, LLC (“CD&R”) resulting from the termination of the management contracts with CVC and CD&R as part of our June 2015 IPO.
Also contributing to the decrease was $25.8 million of lower redundancy and restructuring charges (primarily severance costs) in the year ended December 31, 2016 compared to the year ended December 31, 2015. The cost savings from the prior redundancy and restructuring programs have been largely completed as of December 31, 2016 and represent $10.0 million of annual savings. Approximately 85 percent of the savings are within warehouse, selling and administrative expenses and 15 percent within cost of goods sold. Just over half of these cost savings were achieved this year and were primarily within the USA and EMEA segments. Cost savings from these programs will help offset other investments we make in our business and the impact of inflation. These estimated cost savings are based on information currently available to us. There can be no guarantee that all or any of these cost savings will actually be achieved. The actual amount of costs savings, if any, may differ materially from the above estimates. Refer to “Note 5: Restructuring charges” in Item 8 of this Annual Report on Form 10-K for additional information.
The decrease in costs was primarily offset by a pension mark to market and related adjustments of $67.3 million which was $50.2 million higher than the year ended December 31, 2015, and $2.9 million of stock based compensation primarily due to incremental expenses related to awards made in 2016. The remaining decrease was driven by lower consulting fees incurred of
46
$2.8 million and decreased acquisition and integration expenses of $1.6 million during the year ended December 31, 2016. The remaining $1.7 million increase related to several insignificant components. Foreign currency translation decreased other operating expenses, net by $6.4 million, or 6.0%. Refer to “Note 4: Other operating expenses, net” in Item 8 of this Annual Report on Form 10-K for additional information.
Depreciation and amortization
Depreciation expense increased $15.8 million, or 11.6%, to $152.3 million for the year ended December 31, 2016. Foreign currency translation decreased depreciation expense by $2.3 million, or 1.7%. On a constant currency basis, the increase of $18.1 million, or 13.3%, was primarily related to accelerated depreciation for facility closures and the reassessment of useful lives of certain internally developed software in conjunction with reevaluating our overall information technology enhancement efforts.
Amortization expense decreased $2.9 million, or 3.3%, to $85.6 million for the year ended December 31, 2016. Amortization expense decreased $1.2 million, or 1.4%, due to foreign currency translation. On a constant currency basis, the decrease of $1.7 million, or 1.9%, was primarily driven by third quarter 2016 impairment charge which reduced the intangible asset base, which was partially offset by additional intangible assets related to our recent business acquisitions.
Impairment charges
Impairment charges of $133.9 million were recorded in the year ended December 31, 2016 due to the impairment of certain intangible assets and fixed assets related to the upstream oil and gas customers in the USA segment. Refer to “Note 13: Impairment charges” in Item 8 of this Annual Report on Form 10-K for additional information. There were no impairment charges in the year ended December 31, 2015.
During year ended December 31, 2016, the Company recorded a non-cash, long-lived asset impairment charge of $113.7 million related to intangible assets and $16.5 million related to property, plant and equipment within its condensed consolidated statements of operations. The Company also recorded a non-cash, long-lived asset impairment charge of $0.3 million related to assets held-for-sale. In addition, the Company also impaired $3.4 million of inventory deemed to be unsaleable in connection with the facility closures.
Interest expense
Interest expense decreased $47.5 million, or 22.5%, to $163.8 million for the year ended December 31, 2016 primarily due to the June 2015 and July 2015 debt refinancing activity. Foreign currency translation decreased interest expense by 0.7% or $1.4 million. Refer to “Note 15: Debt” in Item 8 of our Annual Report on Form 10-K for additional information.
Loss on extinguishment of debt
Loss on extinguishment of debt decreased $12.1 million for the year ended December 31, 2016. The $12.1 million loss in the year ended December 31, 2015 related to the write off of unamortized debt issuance costs and debt discount related to the payment of the principal balance of our then outstanding Senior Subordinated Notes during June 2015.
Other (expense) income, net
Other expense, net decreased $17.1 million, or 73.7%, to $6.1 million for the year ended December 31, 2016. The decrease was primarily driven by debt refinancing costs of $16.5 million and the discontinuance of cash flow hedges of $7.5 million that occurred during the year ended December 31, 2015. The additional decrease of $11.1 million was primarily due to change in valuation of an undesignated interest rate swap and foreign derivative contracts. Refer to “Note 15: Debt” and “Note 17: Derivatives” in Item 8 of this Annual Report on Form 10-K for additional information, respectively.
The decrease was partially offset by foreign currency denominated loan revaluation losses of $22.6 million primarily resulting from the revaluation of the Euro Tranche Term Loan for the year ended December 31, 2016. The remaining $4.6 million decrease was related to several insignificant components. Refer to “Note 6: Other (expense) income, net” in Item 8 of this Annual Report on Form 10-K for additional information.
Income tax expense (benefit)
Income tax expense decreased $21.4 million from an income tax expense of $10.2 million in the year ended December 31, 2015 to an income tax benefit of $11.2 million in the year ended December 31, 2016. The decrease is primarily due to a decrease in earnings resulting from an impairment charge and a pension mark to market adjustment. In addition, income tax expense decreased due to the release of a valuation allowance for certain net operating loss utilization in foreign tax jurisdictions and a decrease in the effect of flow-through entities. This was offset by the impact of a December 2016 change in the US tax regulations requiring the Company to revalue its deferred tax asset relating to certain unrealized foreign exchange losses of its non-US branches.
47
Segment results
Our Adjusted EBITDA by operating segment and in aggregate is summarized in the following tables:
(in millions) | USA | Canada | EMEA | Rest of World | Other/ Elimin- ations(1) | Consolidated | |||||||||||||||||
Year ended December 31, 2016 | |||||||||||||||||||||||
Net sales: | |||||||||||||||||||||||
External customers | $ | 4,706.7 | $ | 1,261.0 | $ | 1,704.2 | $ | 401.8 | $ | — | $ | 8,073.7 | |||||||||||
Inter-segment | 104.4 | 8.3 | 4.5 | — | (117.2 | ) | — | ||||||||||||||||
Total net sales | 4,811.1 | 1,269.3 | 1,708.7 | 401.8 | (117.2 | ) | 8,073.7 | ||||||||||||||||
Cost of goods sold (exclusive of depreciation) | 3,769.7 | 1,047.4 | 1,324.6 | 322.1 | (117.2 | ) | 6,346.6 | ||||||||||||||||
Gross profit | 1,041.4 | 221.9 | 384.1 | 79.7 | — | 1,727.1 | |||||||||||||||||
Outbound freight and handling | 191.5 | 34.1 | 54.9 | 6.1 | — | 286.6 | |||||||||||||||||
Warehousing, selling and administrative (operating expenses) | 517.5 | 83.8 | 210.5 | 46.8 | 19.2 | 877.8 | |||||||||||||||||
Adjusted EBITDA | $ | 332.4 | $ | 104.0 | $ | 118.7 | $ | 26.8 | $ | (19.2 | ) | $ | 562.7 | ||||||||||
Other operating expenses, net | 104.5 | ||||||||||||||||||||||
Depreciation | 152.3 | ||||||||||||||||||||||
Amortization | 85.6 | ||||||||||||||||||||||
Impairment charges | 133.9 | ||||||||||||||||||||||
Interest expense, net | 159.9 | ||||||||||||||||||||||
Other expense, net | 6.1 | ||||||||||||||||||||||
Income tax benefit | (11.2 | ) | |||||||||||||||||||||
Net loss | $ | (68.4 | ) | ||||||||||||||||||||
48
(in millions) | USA | Canada | EMEA | Rest of World | Other/ Elimin- ations(1) | Consolidated | |||||||||||||||||
Year ended December 31, 2015 | |||||||||||||||||||||||
Net sales: | |||||||||||||||||||||||
External customers | $ | 5,351.5 | $ | 1,376.6 | $ | 1,780.1 | $ | 473.6 | $ | — | $ | 8,981.8 | |||||||||||
Inter-segment | 112.7 | 8.6 | 4.0 | 0.1 | (125.4 | ) | — | ||||||||||||||||
Total net sales | 5,464.2 | 1,385.2 | 1,784.1 | 473.7 | (125.4 | ) | 8,981.8 | ||||||||||||||||
Cost of goods sold (exclusive of depreciation) | 4,365.9 | 1,161.0 | 1,398.6 | 382.6 | (125.4 | ) | 7,182.7 | ||||||||||||||||
Gross profit | 1,098.3 | 224.2 | 385.5 | 91.1 | — | 1,799.1 | |||||||||||||||||
Outbound freight and handling | 216.9 | 39.3 | 59.6 | 8.8 | — | 324.6 | |||||||||||||||||
Warehousing, selling and administrative (operating expenses) | 492.6 | 87.8 | 226.0 | 54.1 | 13.9 | 874.4 | |||||||||||||||||
Adjusted EBITDA | $ | 388.8 | $ | 97.1 | $ | 99.9 | $ | 28.2 | $ | (13.9 | ) | $ | 600.1 | ||||||||||
Other operating expenses, net | 106.1 | ||||||||||||||||||||||
Depreciation | 136.5 | ||||||||||||||||||||||
Amortization | 88.5 | ||||||||||||||||||||||
Interest expense, net | 207.0 | ||||||||||||||||||||||
Loss on extinguishment of debt | 12.1 | ||||||||||||||||||||||
Other expense, net | 23.2 | ||||||||||||||||||||||
Income tax expense | 10.2 | ||||||||||||||||||||||
Net income | $ | 16.5 | |||||||||||||||||||||
(1) | Other/Eliminations represents the elimination of intersegment transactions as well as unallocated corporate costs consisting of costs specifically related to parent company operations that do not directly benefit segments, either individually or collectively. |
USA.
Net sales percentage change due to: | Gross profit percentage change due to: | |||||
Acquisitions | 1.4 | % | Acquisitions | 2.5 | % | |
Reported sales volumes | (5.2 | )% | Reported sales volumes | (5.2 | )% | |
Sales pricing and product mix | (8.2 | )% | Sales pricing, product costs and other adjustments | (2.5 | )% | |
Total | (12.0 | )% | Total | (5.2 | )% | |
External sales in the USA segment were $4,706.7 million, a decrease of $644.8 million, or 12.0%, in the year ended December 31, 2016. The increase in external net sales from acquisitions was primarily due to the November 2015 Weavertown, March 2016 Bodine, and July 2015 Chemical Associates acquisitions. The decrease in external net sales from reported sales volumes was primarily due to a reduction in sales of upstream oil and gas products driven by reduced market demand. The decrease in external net sales from changes in sales pricing and product mix was primarily driven by lower average selling prices resulting from market driven deflationary pressures. Gross profit decreased $56.9 million, or 5.2%, to $1,041.4 million in the year ended December 31, 2016. The increase in gross profit from acquisitions was primarily due to the November 2015 Weavertown, March 2016 Bodine, and July 2015 Chemical Associates acquisitions. Gross profit decreased due to changes in sales pricing, product costs and other adjustments primarily due to market deflationary pressures and sluggish industrial demand across several end markets. Gross margin increased from 20.5% in the year ended December 31, 2015 to 22.1% during the year ended December 31, 2016 primarily due to favorable product and end market mix.
Outbound freight and handling expenses decreased $25.4 million, or 11.7%, to $191.5 million in the year ended December 31, 2016 primarily due to lower reported sales volumes, lower diesel fuel costs and productivity improvements. Operating expenses increased $24.9 million, or 5.1%, to $517.5 million in the year ended December 31, 2016 primarily driven by $13.3 million of incremental expenses from acquisitions, a reduction of $7.9 million of gains from the medical retiree benefit plan have now been fully amortized from accumulated other comprehensive income, $4.7 million of higher personnel expenses due to annual
49
compensation increases, $4.5 million of higher maintenance and repair expenses, $4.4 million of incremental pension expenses primarily driven by lower expected return on assets, and $3.1 million of incremental bad debt expense reflective of the year's challenging economic conditions. The increases in operating expenses were partially offset by $9.1 million of lower variable compensation expense, and cost reductions of $3.4 million of lower consulting fees and contract labor expenses driven by tighter cost management. The remaining $0.5 million decrease related to several insignificant components. Operating expenses as a percentage of external sales increased from 9.2% in the year ended December 31, 2015 to 11.0% in the year ended December 31, 2016.
Adjusted EBITDA decreased by $56.4 million, or 14.5%, to $332.4 million in the year ended December 31, 2016. Acquisitions contributed $13.1 million of additional Adjusted EBITDA in the year ended December 31, 2016. Adjusted EBITDA margin decreased from 7.3% in the year ended December 31, 2015 to 7.1% in the year ended December 31, 2016 primarily as a result of higher operating expenses as a percentage of sales.
Canada.
Net sales percentage change due to: | Gross profit percentage change due to: | |||||
Acquisitions | 2.4 | % | Acquisitions | 3.3 | % | |
Reported sales volumes | (4.4 | )% | Reported sales volumes | (4.4 | )% | |
Sales pricing and product mix | (3.1 | )% | Sales pricing, product costs and other adjustments | 3.7 | % | |
Foreign currency translation | (3.3 | )% | Foreign currency translation | (3.6 | )% | |
Total | (8.4 | )% | Total | (1.0 | )% | |
External sales in the Canada segment were $1,261.0 million, a decrease of $115.6 million, or 8.4%, in the year ended December 31, 2016. Foreign currency translation decreased external sales dollars as the US dollar strengthened against the Canadian dollar when comparing the year ended December 31, 2016 to the year ended December 31, 2015. On a constant currency basis, external sales dollars decreased $70.3 million or 5.1%. The increase in external net sales from acquisitions was due to the October 2015 Future/BlueStar and March 2016 Nexus Ag acquisitions. The decrease in external net sales from reported sales volumes was primarily due to lower sales in the oil and gas end market within Western Canada. The decrease in external net sales from changes in sales pricing and product mix was primarily driven by lower average selling prices. Gross profit decreased $2.3 million, or 1.0%, to $221.9 million in the year ended December 31, 2016. The increase in gross profit from acquisitions was due to the October 2015 Future/BlueStar and March 2016 Nexus Ag acquisitions. Gross profit increased due to changes in sales pricing, product costs and other adjustments primarily due to increased gross margins across several end markets as well as a shift in product mix towards higher margin products and services during the year ended December 31, 2016. Gross margin increased from 16.3% in the year ended December 31, 2015 to 17.6% in the year ended December 31, 2016.
Outbound freight and handling expenses decreased $5.2 million, or 13.2%, to $34.1 million primarily due to lower reported sales volumes, cost efficiencies and foreign currency translation. Operating expenses decreased by $4.0 million, or 4.6%, to $83.8 million in the year ended December 31, 2016 and increased as a percentage of external sales from 6.4% in the year ended December 31, 2015 to 6.6% in the year ended December 31, 2016. Foreign currency translation decreased operating expenses by $3.0 million, or 3.4%. On a constant currency basis, operating expenses decreased $1.0 million, or 1.1%, primarily due to lower pension expense of $3.3 million resulting from the soft freeze of the Canadian pension plan. The decrease was partially offset by the increase in lease expenses of $2.2 million due to acquisitions. The remaining $0.1 million increase related to several insignificant components.
Adjusted EBITDA increased by $6.9 million, or 7.1%, to $104.0 million in the year ended December 31, 2016. Foreign currency translation decreased Adjusted EBITDA by $3.8 million, or 3.9%. On a constant currency basis, Adjusted EBITDA increased $10.7 million, or 11.0%, primarily due to decreased cost of sales generating increased gross profit and decreased outbound freight and handling expenses. Acquisitions contributed $3.4 million of additional Adjusted EBITDA in the year ended December 31, 2016. Adjusted EBITDA margin increased from 7.1% in the year ended December 31, 2015 to 8.2% in the year ended December 31, 2016.
50
EMEA.
Net sales percentage change due to: | Gross profit percentage change due to: | |||||
Reported sales volumes | (0.2 | )% | Reported sales volumes | (0.2 | )% | |
Sales pricing and product mix | (2.3 | )% | Sales pricing, product costs and other adjustments | 1.4 | % | |
Foreign currency translation | (1.8 | )% | Foreign currency translation | (1.6 | )% | |
Total | (4.3 | )% | Total | (0.4 | )% | |
External sales in the EMEA segment were $1,704.2 million, a decrease of $75.9 million, or 4.3%, in the year ended December 31, 2016. The decrease in external net sales from reported sales volumes was primarily due to the continuing impacts of our previously implemented restructuring programs partially offset by growth in bulk commodity products. The decrease in external net sales from changes in sales pricing and product mix was primarily driven by lower pricing on products linked to oil prices. Foreign currency translation decreased external sales dollars primarily resulting from the US dollar strengthening against the British pound and the Euro, when comparing the year ended December 31, 2016 to the year ended December 31, 2015. Gross profit decreased $1.4 million, or 0.4%, to $384.1 million in the year ended December 31, 2016. Gross profit increased due to changes in sales pricing, product costs and other adjustments primarily due to increased sales of higher margin pharmaceutical finished goods as well as the continued impacts of our product mix enrichment strategy. Gross margin increased from 21.7% in the year ended December 31, 2015 to 22.5% in the year ended December 31, 2016 primarily due to the factors impacting gross profit discussed above.
Outbound freight and handling expenses decreased $4.7 million, or 7.9%, to $54.9 million primarily due to lower reported sales volumes and reduced common carrier costs. Operating expenses decreased $15.5 million, or 6.9%, to $210.5 million in the year ended December 31, 2016, and decreased as a percentage of external sales from 12.7% in the year ended December 31, 2015 to 12.4% in the year ended December 31, 2016. Foreign currency translation decreased operating expenses by 0.7% or $1.5 million. On a constant currency basis, operating expenses decreased $14.0 million, or 6.2%, which was primarily related to lower information technology expenses of $1.9 million, lower bad debt expenses of $1.5 million driven by a large recovery on previously reserved aged receivables, lower lease expense of $1.0 million due to certain operating leases being replaced by capital leases, and lower pension expenses of $0.8 million. The remaining $8.8 million decrease related to cost savings from site closures.
Adjusted EBITDA increased by $18.8 million, or 18.8%, to $118.7 million in the year ended December 31, 2016. Foreign currency translation decreased Adjusted EBITDA by 4.2% or $4.2 million. On a constant currency basis, Adjusted EBITDA increased $23.0 million, or 23.0%, primarily due to sales of pharmaceutical finished goods contributing approximately 65.0% of the increase as well as continuing to benefit from reductions in operating expenses resulting from our previous restructuring activities. Sales of pharmaceutical finished goods represent approximately 29.9% of Adjusted EBITDA for the year ended December 31, 2016. Adjusted EBITDA margin increased from 5.6% in the year ended December 31, 2015 to 7.0% in the year ended December 31, 2016 primarily as a result of product mix, reductions in operating expenses and lower outbound freight and handling expenses.
Rest of World.
Net sales percentage change due to: | Gross profit percentage change due to: | |||||
Reported sales volumes | (5.0 | )% | Reported sales volumes | (5.0 | )% | |
Sales pricing and product mix | (0.2 | )% | Sales pricing, product costs and other adjustments | 2.6 | % | |
Foreign currency translation | (10.0 | )% | Foreign currency translation | (10.1 | )% | |
Total | (15.2 | )% | Total | (12.5 | )% | |
External sales in the Rest of World segment were $401.8 million, a decrease of $71.8 million, or 15.2%, in the year ended December 31, 2016. Foreign currency translation decreased external sales dollars primarily due to the stronger US dollar position in the year ended December 31, 2016 as compared to the year ended December 31, 2015 against the Mexican peso and the Brazilian real. The decrease in external net sales from reported sales volumes was due to weak industrial demand and in particular lower demand for oil and gas products. The decrease in external net sales from changes in sales pricing and product mix was due to lower average selling prices driven by deflationary pressures. Gross profit decreased $11.4 million, or 12.5%, to $79.7 million in the year ended December 31, 2016. Gross profit decreased primarily due to foreign currency translation, which was partially offset by the increase in gross profit due to shift in product mix towards higher margin products and services. Gross margin increased
51
from 19.2% in the year ended December 31, 2015 to 19.8% in the year ended December 31, 2016 primarily due to the factors impacting gross profit discussed above.
Outbound freight and handling expenses decreased $2.7 million, or 30.7%, to $6.1 million in the year ended December 31, 2016. Foreign currency translation decreased outbound freight and handling expenses by 8.0% or $0.7 million. On a constant currency basis, outbound freight and handling expenses decreased $2.0 million or 22.7%, which was primarily due to lower volumes as well as incremental cost savings. Operating expenses decreased $7.3 million, or 13.5%, to $46.8 million in the year ended December 31, 2016 but increased as a percentage of external sales from 11.4% in the year ended December 31, 2015 to 11.6% in the year ended December 31, 2016. Foreign currency translation decreased operating expenses by 9.8% or $5.3 million. On constant currency basis, operating expenses decreased $2.0 million, or 3.7%.
Adjusted EBITDA decreased by $1.4 million, or 5.0%, to $26.8 million in the year ended December 31, 2016. Foreign currency translation decreased Adjusted EBITDA by 11.4% or $3.2 million. On a constant currency basis, Adjusted EBITDA increased $1.8 million, or 6.4%, primarily due to lower operating expenses. Adjusted EBITDA margin increased from 6.0% in the year ended December 31, 2015 to 6.7% in the year ended December 31, 2016 primarily as a result of higher gross margin.
Year Ended December 31, 2015 Compared to Year Ended December 31, 2014
Year ended | Favorable (unfavorable) | % Change | Impact of currency* | ||||||||||||||||||||
(in millions) | December 31, 2015 | December 31, 2014 | |||||||||||||||||||||
Net sales | $ | 8,981.8 | 100.0 | % | $ | 10,373.9 | 100.0 | % | $ | (1,392.1 | ) | (13.4 | )% | (6.3 | )% | ||||||||
Cost of goods sold (exclusive of depreciation) | 7,182.7 | 80.0 | % | 8,443.2 | 81.4 | % | 1,260.5 | 14.9 | % | 6.2 | % | ||||||||||||
Gross profit | 1,799.1 | 20.0 | % | 1,930.7 | 18.6 | % | (131.6 | ) | (6.8 | )% | (6.8 | )% | |||||||||||
Operating expenses: | |||||||||||||||||||||||
Outbound freight and handling | 324.6 | 3.6 | % | 365.5 | 3.5 | % | 40.9 | 11.2 | % | 5.4 | % | ||||||||||||
Warehousing, selling and administrative | 874.4 | 9.7 | % | 923.5 | 8.9 | % | 49.1 | 5.3 | % | 5.6 | % | ||||||||||||
Other operating expenses, net | 106.1 | 1.2 | % | 197.1 | 1.9 | % | 91.0 | 46.2 | % | 2.4 | % | ||||||||||||
Depreciation | 136.5 | 1.5 | % | 133.5 | 1.3 | % | (3.0 | ) | (2.2 | )% | 6.8 | % | |||||||||||
Amortization | 88.5 | 1.0 | % | 96.0 | 0.9 | % | 7.5 | 7.8 | % | 5.0 | % | ||||||||||||
Impairment charges | — | — | % | 0.3 | — | % | 0.3 | 100.0 | % | — | % | ||||||||||||
Total operating expenses | 1,530.1 | 17.0 | % | 1,715.9 | 16.5 | % | 185.8 | 10.8 | % | 6.5 | % | ||||||||||||
Operating income | 269.0 | 3.0 | % | 214.8 | 2.1 | % | 54.2 | 25.2 | % | (8.5 | )% | ||||||||||||
Other (expense) income: | |||||||||||||||||||||||
Interest income | 4.3 | — | % | 8.2 | 0.1 | % | (3.9 | ) | (47.6 | )% | (4.9 | )% | |||||||||||
Interest expense | (211.3 | ) | (2.4 | )% | (258.8 | ) | (2.5 | )% | 47.5 | 18.4 | % | 1.3 | % | ||||||||||
Loss on extinguishment of debt | (12.1 | ) | (0.1 | )% | (1.2 | ) | — | % | (10.9 | ) | N/M | N/M | |||||||||||
Other (expense) income, net | (23.2 | ) | (0.3 | )% | 1.1 | — | % | (24.3 | ) | N/M | N/M | ||||||||||||
Total other expense | (242.3 | ) | (2.7 | )% | (250.7 | ) | (2.4 | )% | 8.4 | 3.4 | % | 2.2 | % | ||||||||||
Income (loss) before income taxes | 26.7 | 0.3 | % | (35.9 | ) | (0.3 | )% | 62.6 | 174.4 | % | (35.9 | )% | |||||||||||
Income tax expense (benefit) | 10.2 | 0.1 | % | (15.8 | ) | (0.2 | )% | (26.0 | ) | (164.6 | )% | 21.5 | % | ||||||||||
Net income (loss) | $ | 16.5 | 0.2 | % | $ | (20.1 | ) | (0.2 | )% | 36.6 | 182.1 | % | (47.3 | )% | |||||||||
* | Foreign currency translation is included in the percentage change. Unfavorable impacts from foreign currency translation are designated with parentheses. |
52
Net sales
Net sales percentage change due to: | ||
Acquisitions | 0.9 | % |
Reported sales volumes | (7.0 | )% |
Sales pricing and product mix | (1.0 | )% |
Foreign currency translation | (6.3 | )% |
Total | (13.4 | )% |
Net sales were $8,981.8 million in the year ended December 31, 2015, a decrease of $1,392.1 million, or 13.4%, from the year ended December 31, 2014. Foreign currency translation decreased net sales due to the US dollar strengthening against all major currencies. The increase in net sales from acquisitions was primarily driven by the November 2014 D’Altomare acquisition in Brazil, and the July 2015 Chemical Associates and April 2015 Key Chemical acquisitions in the US. The decrease in net sales from reported sales volumes primarily resulted from reductions in sales of upstream oil and gas products driven by reduced market demand. The decrease in net sales from changes in sales pricing and product mix was driven by the USA and Rest of World segments partially offset by increases in the Canada and EMEA segments. Refer to the “Segment results” for the year ended December 31, 2015 discussion for additional information.
Gross profit
Gross profit percentage change due to: | ||
Acquisitions | 1.8 | % |
Reported sales volumes | (7.0 | )% |
Sales pricing, product costs and other adjustments | 5.2 | % |
Foreign currency translation | (6.8 | )% |
Total | (6.8 | )% |
Gross profit decreased $131.6 million, or 6.8%, to $1,799.1 million for the year ended December 31, 2015. Foreign currency translation decreased gross profit due to the strengthening of the US dollar against all major currencies, especially the euro, Canadian dollar and Brazilian real. The increase in gross profit from acquisitions was driven by the D’Altomare, Chemical Associates and Key Chemical acquisitions. Excluding the impact of volumes, gross profit increased due to changes in sales pricing, product costs and other adjustments resulting from increases in all segments. Gross margin, which we define as gross profit divided by net sales, increased to 20.0% in the year ended December 31, 2015 from 18.6% in the year ended December 31, 2014 due to favorable product mix, our EMEA restructuring program and productivity initiatives. Refer to the “Segment results” for the year ended December 31, 2015 discussion for additional information.
Outbound freight and handling
Outbound freight and handling expenses decreased $40.9 million, or 11.2%, to $324.6 million for the year ended December 31, 2015. Foreign currency translation decreased outbound freight and handling expense by 5.4% or $19.7 million. On a constant currency basis, outbound freight and handling expenses decreased 5.8% or $21.2 million, which was primarily attributable to lower reported sales volumes as well as lower diesel fuel costs partially offset by the impact of incremental costs from acquisitions and a continued tight third-party carrier market. Refer to the “Segment results” for the year ended December 31, 2015 discussion for additional information.
Warehousing, selling and administrative
Warehousing, selling and administrative expenses decreased $49.1 million, or 5.3%, to $874.4 million for the year ended December 31, 2015. Foreign currency translation decreased warehousing, selling and administrative expenses by 5.6% or $73.8 million. Excluding foreign currency, the increase of $24.7 million is attributable to higher personnel expenses of $25.7 million primarily due to annual compensation increases and acquisitions, increases in information technology expenses of $8.4 million related to internal projects focused on improving operations and higher consulting fees of $8.2 million. These increases were partially offset by lower operating lease expense of $13.9 million primarily due to certain operating leases being replaced by purchased assets as well as capital leases and lower net periodic benefit cost related to our defined benefit and other postretirement benefit plans of $11.4 million. The remaining $7.7 million increase related to several insignificant components. Refer to the “Segment results” for the year ended December 31, 2015 discussion for additional information.
53
Other operating expenses, net
Other operating expenses, net decreased $91.0 million, or 46.2%, to $106.1 million for the year ended December 31, 2015. The decrease was primarily due to a pension mark to market loss of $21.1 million in the year ended December 31, 2015 compared to a mark to market loss of $117.8 million in the year ended December 31, 2014 relating to the annual remeasurement of our defined benefit plans and other postretirement benefit plans. The 2015 mark to market loss primarily relates to lower than expected plan asset returns during the year ended December 31, 2015 partially offset by increases in the defined benefit pension plans discount rates from December 31, 2014 to December 31, 2015. The 2014 mark to market loss primarily relates to the decrease in the defined benefit pension plans discount rates from December 31, 2013 to December 31, 2014 and the adoption of the new US mortality table as of December 31, 2014. This loss was partially offset by higher than expected plan asset returns during the year ended December 31, 2014. The decrease was also related to pension curtailment and settlement gains of $4.0 million for the year ended December 31, 2015 related to the Company’s redundancy and restructuring initiatives. Refer to “Note 8: Employee benefit plans” in Item 8 of this Annual Report on Form 10-K for additional information.
The decrease was also related to a reduction of $12.4 million in redundancy and restructuring charges in the year ended December 31, 2015 compared to the year ended December 31, 2014, which primarily related to higher facility exit costs in the year ended December 31, 2014 largely due to changes in estimated sublease income. Refer to “Note 5: Restructuring charges” in Item 8 of this Annual Report on Form 10-K for additional information. Also contributing to the decrease was $4.6 million of lower stock-based compensation expense in the year ended December 31, 2015 due to a majority of outstanding options vesting in 2014 with fewer grants in the year ended December 31, 2015.
The decrease was partially offset by a contract termination fee of $26.2 million related to terminating consulting agreements between us and CVC and CD&R related to the IPO in the year ended December 31, 2015. The remaining $0.5 million increase was related to several insignificant components. Foreign currency translation decreased other operating expenses, net by 2.4% or $4.7 million. Refer to “Note 4: Other operating expenses, net” in Item 8 of this Annual Report on Form 10-K for additional information.
Depreciation and amortization
Depreciation expense increased $3.0 million, or 2.2%, to $136.5 million for the year ended December 31, 2015. Foreign currency translation decreased depreciation expense by 6.8% or $9.1 million. On a constant currency basis, the increase was primarily related to increased purchases of property, plant and equipment, capital lease asset additions and accelerated depreciation on various sites which were undergoing restructuring initiatives during the year ended December 31, 2015.
Amortization expense decreased $7.5 million, or 7.8%, to $88.5 million for the year ended December 31, 2015. Amortization expense decreased 5.0% or $4.8 million due to foreign currency translation and the additional decrease relates to the lower amortization levels of existing customer relationship intangibles partially offset by amortization related to 2015 business acquisitions. Customer relationship intangible assets are amortized on an accelerated basis to mirror the economic pattern of benefit from such relationships.
Impairment charges
There were no impairment charges in the year ended December 31, 2015. Impairment charges of $0.3 million were recorded in the year ended December 31, 2014 relating to ongoing restructuring initiatives.
Interest expense
Interest expense decreased $47.5 million, or 18.4%, to $211.3 million for the year ended December 31, 2015 primarily due to lower average outstanding borrowings under short-term financing agreements, paying the remaining principal balance related to the $600.0 million of outstanding 10.5% senior subordinated notes due 2017 (the “2017 Subordinated Notes”) and the $50.0 million of outstanding 10.5% senior subordinated notes due 2018 (the “2018 Subordinated Notes” and, together with the 2017 Subordinated Notes, the “Senior Subordinated Notes”) during June 2015 and lower interest rates on our long-term debt as a result of the July 2015 debt refinancing transactions. Foreign currency translation decreased interest expense by 1.3% or $3.3 million. These decreases were partially offset by increased interest expense from capital lease obligations. Refer to “Note 15: Debt” in Item 8 of our Annual Report on Form 10-K for additional information.
Loss on extinguishment of debt
Loss on extinguishment of debt increased $10.9 million to $12.1 million for the year ended December 31, 2015. The $12.1 million loss in the year ended December 31, 2015 related to the July 2015 debt refinancing transactions and the write off of unamortized debt issuance costs and debt discount related to the payment of the principal balance related to the Senior Subordinated Notes during June 2015. The $1.2 million loss in the year ended December 31, 2014 related to the write off of unamortized debt
54
issuance costs related to the closure of then-existing European ABL facility during March 2014. Refer to “Note 15: Debt” in Item 8 of this Annual Report on Form 10-K for additional information.
Other (expense) income, net
Other (expense) income, net increased $24.3 million from income of $1.1 million for the year ended December 31, 2014 to an expense of $23.2 million for the year ended December 31, 2015. The increase was primarily driven by debt refinancing costs of $16.5 million and the discontinuance of cash flow hedges of $7.5 million. Refer to “Note 15: Debt” and “Note 17: Derivatives” in Item 8 of this Annual Report on Form 10-K for additional information, respectively. Refer to “Note 6: Other (expense) income, net” in Item 8 of this Annual Report on Form 10-K for additional information.
Income tax expense (benefit)
Income tax expense increased $26.0 million from an income tax benefit of $15.8 million in the year ended December 31, 2014 to an income tax expense of $10.2 million in the year ended December 31, 2015. The increase is primarily due to a lower benefit related to the release of unrealized tax benefits due to the statute of limitations expiration of $15.9 million, an increase in earnings resulting in an increase of $21.9 million, an increase in the expiration of tax attributes of $7.9 million and an increase in non-deductible stock compensation of $3.2 million, offset by a decrease in foreign losses for which a tax benefit may not be recognized of $14.2 million and an increase in valuation allowance release of $8.8 million.
Segment results
Our Adjusted EBITDA by operating segment and in aggregate is summarized in the following tables:
(in millions) | USA | Canada | EMEA | Rest of World | Other/ Elimin- ations(1) | Consolidated | |||||||||||||||||
Year ended December 31, 2015 | |||||||||||||||||||||||
Net sales: | |||||||||||||||||||||||
External customers | $ | 5,351.5 | $ | 1,376.6 | $ | 1,780.1 | $ | 473.6 | $ | — | $ | 8,981.8 | |||||||||||
Inter-segment | 112.7 | 8.6 | 4.0 | 0.1 | (125.4 | ) | — | ||||||||||||||||
Total net sales | 5,464.2 | 1,385.2 | 1,784.1 | 473.7 | (125.4 | ) | 8,981.8 | ||||||||||||||||
Cost of goods sold (exclusive of depreciation) | 4,365.9 | 1,161.0 | 1,398.6 | 382.6 | (125.4 | ) | 7,182.7 | ||||||||||||||||
Gross profit | 1,098.3 | 224.2 | 385.5 | 91.1 | — | 1,799.1 | |||||||||||||||||
Outbound freight and handling | 216.9 | 39.3 | 59.6 | 8.8 | — | 324.6 | |||||||||||||||||
Warehousing, selling and administrative (operating expenses) | 492.6 | 87.8 | 226.0 | 54.1 | 13.9 | 874.4 | |||||||||||||||||
Adjusted EBITDA | $ | 388.8 | $ | 97.1 | $ | 99.9 | $ | 28.2 | $ | (13.9 | ) | $ | 600.1 | ||||||||||
Other operating expenses, net | 106.1 | ||||||||||||||||||||||
Depreciation | 136.5 | ||||||||||||||||||||||
Amortization | 88.5 | ||||||||||||||||||||||
Interest expense, net | 207.0 | ||||||||||||||||||||||
Loss on extinguishment of debt | 12.1 | ||||||||||||||||||||||
Other expense, net | 23.2 | ||||||||||||||||||||||
Income tax expense | 10.2 | ||||||||||||||||||||||
Net income | $ | 16.5 | |||||||||||||||||||||
55
(in millions) | USA | Canada | EMEA | Rest of World | Other/ Elimin- ations(1) | Consolidated | |||||||||||||||||
Year ended December 31, 2014 | |||||||||||||||||||||||
Net sales: | |||||||||||||||||||||||
External customers | $ | 6,081.4 | $ | 1,512.1 | $ | 2,230.1 | $ | 550.3 | $ | — | $ | 10,373.9 | |||||||||||
Inter-segment | 121.8 | 10.0 | 4.5 | — | (136.3 | ) | — | ||||||||||||||||
Total net sales | 6,203.2 | 1,522.1 | 2,234.6 | 550.3 | (136.3 | ) | 10,373.9 | ||||||||||||||||
Cost of goods sold (exclusive of depreciation) | 5,041.0 | 1,271.5 | 1,797.9 | 469.1 | (136.3 | ) | 8,443.2 | ||||||||||||||||
Gross profit | 1,162.2 | 250.6 | 436.7 | 81.2 | — | 1,930.7 | |||||||||||||||||
Outbound freight and handling | 233.3 | 46.4 | 75.5 | 10.3 | — | 365.5 | |||||||||||||||||
Warehousing, selling and administrative (operating expenses) | 490.9 | 97.4 | 276.2 | 53.3 | 5.7 | 923.5 | |||||||||||||||||
Adjusted EBITDA | $ | 438.0 | $ | 106.8 | $ | 85.0 | $ | 17.6 | $ | (5.7 | ) | $ | 641.7 | ||||||||||
Other operating expenses, net | 197.1 | ||||||||||||||||||||||
Depreciation | 133.5 | ||||||||||||||||||||||
Amortization | 96.0 | ||||||||||||||||||||||
Impairment charges | 0.3 | ||||||||||||||||||||||
Interest expense, net | 250.6 | ||||||||||||||||||||||
Loss on extinguishment of debt | 1.2 | ||||||||||||||||||||||
Other income, net | (1.1 | ) | |||||||||||||||||||||
Income tax benefit | (15.8 | ) | |||||||||||||||||||||
Net loss | $ | (20.1 | ) | ||||||||||||||||||||
(1) | Other/Eliminations represents the elimination of intersegment transactions as well as unallocated corporate costs consisting of costs specifically related to parent company operations that do not directly benefit segments, either individually or collectively. |
USA.
Net sales percentage change due to: | Gross profit percentage change due to: | |||||
Acquisitions | 0.6 | % | Acquisitions | 0.9 | % | |
Reported sales volumes | (7.6 | )% | Reported sales volumes | (7.6 | )% | |
Sales pricing and product mix | (5.0 | )% | Sales pricing, product costs and other adjustments | 1.2 | % | |
Total | (12.0 | )% | Total | (5.5 | )% | |
External sales in the USA segment were $5,351.5 million, a decrease of $729.9 million, or 12.0%, in the year ended December 31, 2015. The increase in external net sales from acquisitions was primarily due to the July 2015 Chemical Associates and April 2015 Key Chemical acquisitions. The decrease in external net sales from reported sales volumes was primarily due to a reduction in sales of upstream oil and gas products driven by reduced market demand. The reduction in external net sales from changes in sales pricing and product mix was primarily driven by lower average selling prices primarily resulting from market driven deflationary pressures on upstream oil and gas product offerings and oil derived products as well as higher sales of lower priced oil and gas products. Gross profit decreased $63.9 million, or 5.5%, to $1,098.3 million in the year ended December 31, 2015. The increase in gross profit from acquisitions was primarily due to the Chemical Associates and Key Chemical acquisitions. Excluding the impact of volumes, gross profit increased due to changes in sales pricing, product costs and other adjustments primarily due to growth in the gross margin rates on several of our industrial chemicals driven by focused margin management efforts and the successful implementation of productivity initiatives in the year ended December 31, 2015. Gross margin increased from 19.1% in the year ended December 31, 2014 to 20.5% during the year ended December 31, 2015.
Outbound freight and handling expenses decreased $16.4 million, or 7.0%, to $216.9 million in the year ended December 31, 2015 primarily due to lower reported sales volumes as well as lower diesel fuel costs partially offset by additional expenses from acquisitions. Operating expenses increased $1.7 million, or 0.3%, to $492.6 million in the year ended December 31, 2015 due to
56
higher personnel expenses of $13.0 million primarily due to annual compensation increases and acquisitions as well as higher consulting fees of $6.8 million and higher information technology expenses of $4.5 million related to internal projects focused on improving operations. These increases were partially offset by lower lease expense of $10.3 million primarily due to certain operating leases being replaced by purchased assets as well as capital leases, lower pension expense of $4.4 million related to higher expected returns on assets in the year ended December 31, 2015, and lower pallets and supplies costs of $1.9 million due to lower volumes. The remaining $6.0 million offsetting decrease related to several insignificant components. Operating expenses as a percentage of external sales increased from 8.1% in the year ended December 31, 2014 to 9.2% in the year ended December 31, 2015.
Adjusted EBITDA decreased by $49.2 million, or 11.2%, to $388.8 million in the year ended December 31, 2015. Acquisitions contributed $4.0 million of additional Adjusted EBITDA in the year ended December 31, 2015. Adjusted EBITDA margin increased from 7.2% in the year ended December 31, 2014 to 7.3% in the year ended December 31, 2015 primarily as a result of improved gross margin partially offset by higher operating expenses as a percentage of external net sales.
Canada.
Net sales percentage change due to: | Gross profit percentage change due to: | |||||
Acquisitions | 0.2 | % | Acquisitions | 1.1 | % | |
Reported sales volumes | (0.7 | )% | Reported sales volumes | (0.7 | )% | |
Sales pricing and product mix | 5.9 | % | Sales pricing, product costs and other adjustments | 3.2 | % | |
Foreign currency translation | (14.4 | )% | Foreign currency translation | (14.1 | )% | |
Total | (9.0 | )% | Total | (10.5 | )% | |
External sales in the Canada segment were $1,376.6 million, a decrease of $135.5 million, or 9.0%, in the year ended December 31, 2015. Foreign currency translation decreased external sales dollars as the US dollar strengthened against the Canadian dollar when comparing the year ended December 31, 2015 to the year ended December 31, 2014. On a constant currency basis, external sales dollars increased $81.7 million or 5.4%. The increase in external net sales from acquisitions was due to the October 2015 acquisition of Future/BlueStar. The decrease in external net sales from reported sales volumes was primarily due to decreases in sales of oil and gas products mostly driven by reduced market demand and lower methanol sales due to warmer weather conditions. These decreases were partially offset by increases in agricultural sales, which were primarily driven by favorable weather conditions, increases in mining driven by the stabilization of mineral and gold prices and increased sales to commodity and manufacturing based end markets, driven by the strengthening of the US dollar against the Canadian dollar increasing manufacturing activity within Canada’s eastern region. The increase in external net sales from changes in sales pricing and product mix was primarily driven by higher average selling prices resulting from margin management efforts. Gross profit decreased $26.4 million, or 10.5%, to $224.2 million in the year ended December 31, 2015. The increase in gross profit from acquisitions was due to the acquisition of Future/BlueStar. Excluding the impact of volumes, gross profit increased due to changes in sales pricing, product costs and other adjustments primarily due to the positive impacts from margin management efforts across several industry sectors during the year ended December 31, 2015. Gross margin decreased from 16.6% in the year ended December 31, 2014 to 16.3% in the year ended December 31, 2015 primarily due to higher sales of lower margin products.
Outbound freight and handling expenses decreased $7.1 million, or 15.3%, to $39.3 million primarily due to foreign currency translation and lower reported sales volumes. Operating expenses decreased by $9.6 million, or 9.9%, to $87.8 million in the year ended December 31, 2015 and remained at 6.4% as a percentage of external sales in the year ended December 31, 2015. Foreign currency translation decreased operating expenses by 14.3% or $13.9 million. On a constant currency basis, operating expenses increased $4.3 million, or 4.4%, and the increase primarily related to increased personnel expenses of $7.5 million driven by annual compensation increases and higher headcount related to business needs partially offset by lower pension expense of $2.4 million resulting from the soft freeze of the Canadian pension plan. The remaining $0.8 million decrease related to several insignificant components.
Adjusted EBITDA decreased by $9.7 million, or 9.1%, to $97.1 million in the year ended December 31, 2015. Foreign currency translation decreased Adjusted EBITDA by 14.4% or $15.4 million. On a constant currency basis, Adjusted EBITDA increased $5.7 million or 5.3%, primarily due to increased external sales generating increased gross profit. Acquisitions contributed $0.8 million of additional Adjusted EBITDA in the year ended December 31, 2015. Adjusted EBITDA margin remained at 7.1% in the year ended December 31, 2015.
57
EMEA.
Net sales percentage change due to: | Gross profit percentage change due to: | |||||
Reported sales volumes | (9.1 | )% | Reported sales volumes | (9.1 | )% | |
Sales pricing and product mix | 3.7 | % | Sales pricing, product costs and other adjustments | 13.7 | % | |
Foreign currency translation | (14.8 | )% | Foreign currency translation | (16.3 | )% | |
Total | (20.2 | )% | Total | (11.7 | )% | |
External sales in the EMEA segment were $1,780.1 million, a decrease of $450.0 million, or 20.2%, in the year ended December 31, 2015. Foreign currency translation decreased external sales dollars primarily resulting from the US dollar strengthening against the euro and British pound when comparing the year ended December 31, 2015 to the year ended December 31, 2014. The decrease in external net sales from reported sales volumes was primarily due to the continuing implementation of restructuring initiatives focused on our product mix enrichment strategy. The increase in external net sales from changes in sales pricing and product mix was primarily driven by a shift in product mix towards products with higher average selling prices. Gross profit decreased $51.2 million, or 11.7%, to $385.5 million in the year ended December 31, 2015. Excluding the impact of volumes, gross profit increased due to changes in sales pricing, product costs and other adjustments primarily due to the continuing implementation of our product mix enrichment strategy including higher sales in the pharmaceutical product and ingredients end market. Gross margin increased from 19.6% in the year ended December 31, 2014 to 21.7% in the year ended December 31, 2015 primarily due to the factors impacting gross profit discussed above.
Outbound freight and handling expenses decreased $15.9 million, or 21.1%, to $59.6 million primarily due to foreign currency translation and lower reported sales volumes. Operating expenses decreased $50.2 million, or 18.2%, to $226.0 million in the year ended December 31, 2015, but increased as a percentage of external sales from 12.4% in the year ended December 31, 2014 to 12.7% in the year ended December 31, 2015. Foreign currency translation decreased operating expenses by 16.7% or $46.2 million. On a constant currency basis, operating expenses decreased $4.0 million, or 1.4%, which was primarily related to lower pension expense of $5.0 million related to higher expected asset returns, lower lease expense of $2.0 million due to certain operating leases being replaced by capital leases and lower personnel expenses of $1.4 million due to reduced headcount from redundancy and restructuring initiatives. The remaining $4.4 million increase related to several insignificant components.
Adjusted EBITDA increased by $14.9 million, or 17.5%, to $99.9 million in the year ended December 31, 2015. Foreign currency translation decreased Adjusted EBITDA by 15.7% or $13.3 million. On a constant currency basis, Adjusted EBITDA increased $28.2 million, or 33.2%, due to increased gross profit as well as slight reductions in operating expenses. Adjusted EBITDA margin increased from 3.8% in the year ended December 31, 2014 to 5.6% in the year ended December 31, 2015 primarily as a result of the increase in gross margin.
Rest of World.
Net sales percentage change due to: | Gross profit percentage change due to: | |||||
Acquisitions | 10.5 | % | Acquisitions | 26.2 | % | |
Reported sales volumes | (2.0 | )% | Reported sales volumes | (2.0 | )% | |
Sales pricing and product mix | (2.6 | )% | Sales pricing, product costs and other adjustments | 17.6 | % | |
Foreign currency translation | (19.8 | )% | Foreign currency translation | (29.6 | )% | |
Total | (13.9 | )% | Total | 12.2 | % | |
External sales in the Rest of World segment were $473.6 million, a decrease of $76.7 million, or 13.9%, in the year ended December 31, 2015. Foreign currency translation decreased external sales dollars when comparing the year ended December 31, 2015 to the year ended December 31, 2014 primarily due to the US dollar strengthening against the Mexican peso and Brazilian real. The increase in external net sales from acquisitions was primarily due to the November 2014 acquisition of D’Altomare. The decrease in external net sales from reported sales volumes was primarily due to decreases in the Asia Pacific region partially offset by increases in Mexico. The decrease in external net sales from changes in sales pricing and product mix was primarily due to lower average selling prices resulting from market driven deflationary pressures on upstream oil and gas product offerings and oil derived products. Gross profit increased $9.9 million, or 12.2%, to $91.1 million in the year ended December 31, 2015. The increase in gross profit from acquisitions was driven by the November 2014 acquisition of D’Altomare. Excluding the impact of volumes, gross profit increased due to changes in sales pricing, product costs and other adjustments primarily due to focused
58
margin management efforts. Gross margin increased from 14.8% in the year ended December 31, 2014 to 19.2% in the year ended December 31, 2015 (17.7% excluding D’Altomare in the year ended December 31, 2015) primarily due to the factors impacting gross profit discussed above.
Outbound freight and handling expenses decreased $1.5 million, or 14.6%, to $8.8 million in the year ended December 31, 2015. Foreign currency translation decreased outbound freight and handling expenses by 21.4% or $2.2 million. On a constant currency basis, outbound freight and handling expenses increased $0.7 million or 6.8%, which was primarily due to D’Altomare. Operating expenses increased $0.8 million, or 1.5%, to $54.1 million in the year ended December 31, 2015 and increased as a percentage of external sales from 9.7% in the year ended December 31, 2014 to 11.4% in the year ended December 31, 2015. D’Altomare contributed additional operating expenses of $10.4 million in the year ended December 31, 2015. Foreign currency translation decreased operating expenses by 25.3% or $13.5 million. Excluding the impact of D’Altomare and foreign currency translation, operating expenses increased $3.9 million primarily due to higher personnel expenses of $2.7 million driven by annual compensation increases and higher variable compensation. The remaining $1.2 million increase related to several insignificant components.
Adjusted EBITDA increased by $10.6 million, or 60.2%, to $28.2 million in the year ended December 31, 2015. D’Altomare contributed additional Adjusted EBITDA of $9.8 million in the year ended December 31, 2015. Foreign currency translation decreased Adjusted EBITDA by 47.7% or $8.4 million. On a constant currency basis and excluding D’Altomare, Adjusted EBITDA increased $9.2 million primarily due to increased gross profit. Adjusted EBITDA margin increased from 3.2% in the year ended December 31, 2014 to 6.0% in the year ended December 31, 2015 (5.0% excluding D’Altomare in the year ended December 31, 2015). The increase is a result of the increase in gross margin.
Liquidity and Capital Resources
Our primary source of liquidity is cash generated from our operations as well as borrowings under our credit facilities. During the year ended December 31, 2015, we restructured a significant portion of our long-term debt obligations. These debt refinancings extended our debt maturity profile and reduced our future interest payments. Refer to “Note 15: Debt” in Item 8 of this Annual Report on Form 10-K for further information on these debt refinancings. As of December 31, 2016, our total liquidity was approximately $857.7 million comprised of $521.3 million available under our credit facilities and $336.4 million of cash and cash equivalents. Our primary liquidity and capital resource needs are to service our debt and to finance working capital, capital expenditures, other liabilities, cost of acquisitions and general corporate purposes. We believe that funds provided by these sources will be adequate to meet our liquidity and capital resource needs for at least the next 12 months under current operating conditions. We have significant working capital needs, although we have implemented several initiatives to improve our working capital and reduce the related financing requirements. The nature of our business, however, requires that we maintain inventories that enable us to deliver products to fill customer orders. As of December 31, 2016, we maintained inventories of $756.6 million, equivalent to approximately 48.7 days of sales (which we calculate on the basis of cost of goods sold for the trailing 90-day period).
The funded status of our defined benefit pension plans is the difference between our plan assets and projected benefit obligations. Our pension plans in the US and certain other countries had an underfunded status of $271.8 million, $244.5 million and $304.2 million at December 31, 2016, 2015 and 2014, respectively. During 2016, we made contributions of $31.6 million. Based on current projections of minimum funding requirements, we expect to make cash contributions of $31.1 million to our defined benefit pension plans in 2017. The timing for any such requirement in future years is uncertain given the implicit uncertainty regarding the future developments of factors described in “Risk Factors” in Item 1A of this Annual Report on Form 10-K and “Note 8: Employee benefit plans” in Item 8 of this Annual Report on Form 10-K.
We may not be able to repatriate our cash and undistributed earnings held in foreign jurisdictions without incurring additional tax liabilities. See also “Risk Factors” in Item 1A of this Annual Report on Form 10-K for more information.
We may from time to time repurchase our debt or take other steps to reduce our debt. These actions may include open market repurchases, negotiated repurchases or opportunistic refinancing of debt. The amount of debt, if any, that may be repurchased or refinanced will depend on market conditions, trading levels of our debt, our cash position, compliance with debt covenants and other considerations. Our affiliates may also purchase our debt from time to time, through open market purchases or other transactions.
59
Cash Flows
The following table presents a summary of our cash flow activity for the periods set forth below:
Fiscal Year Ended | |||||||||||
(in millions) | December 31, 2016 | December 31, 2015 | December 31, 2014 | ||||||||
Net cash provided by operating activities | $ | 449.6 | $ | 356.0 | $ | 126.3 | |||||
Net cash used by investing activities | (136.0 | ) | (294.4 | ) | (148.2 | ) | |||||
Net cash (used) provided by financing activities | (166.1 | ) | (19.8 | ) | 84.1 | ||||||
Cash Provided by Operating Activities
Year Ended December 31, 2016 Compared to Year Ended December 31, 2015
Cash provided by operating activities increased $93.6 million from $356.0 million for the year ended December 31, 2015 to $449.6 million for the year ended December 31, 2016.
Cash provided by operating activities increased by $32.7 million due to an increase in net income exclusive of non-cash items in the year ended December 31, 2016 compared to the year ended December 31, 2015. Refer to “Results of Operations” above for additional information.
Cash provided by operating activities increased $78.9 million primarily due to changes in projected benefit obligations and a reduction in contributions made to pensions and other postretirement benefit liabilities in the year ended December 31, 2016 compared to the year ended December 31, 2015. The increase in cash provided by operating activities was also due to a $69.7 million increase from changes in prepaid expenses and other current assets, which primarily consisted of a $32.7 million increase from the change in income tax receivable primarily due to the prior year recognition of an income tax refund that was realized in the amount of $14.1 million in 2016 and a $37.0 million increase from the change in prepaid expenses primarily due to a change in rebates, deposits, and several other insignificant components.
The above increases were partially offset by a $52.7 million decrease in trade working capital, which includes trade accounts receivables, net, inventories and trade accounts payable. The reduction in cash flows from changes in trade working capital is largely attributable to reduced cash inflows associated with trade accounts receivables, net in the year ended December 31, 2016 compared to the year ended December 31, 2015, which is primarily driven by more consistent year-over-year sales during the year ended December 31, 2016 compared to the year ended December 31, 2015. Partially offsetting the decrease in trade working capital attributable to trade accounts receivables, net was an increase in trade working capital related to trade accounts payable, reflecting improved payment terms. Also contributing to the decrease offsetting the increase in cash provided by operating activities was a $35.0 million decrease in other, net, which is primarily attributable to reductions in outstanding liabilities related to changes in redundancy and restructuring, accrued interest expense, and environmental reserves. The decrease in other, net was partially offset by increased liabilities related to compensation.
Year Ended December 31, 2015 Compared to Year Ended December 31, 2014
Cash provided by operating activities increased $229.7 million from $126.3 million for the year ended December 31, 2014 to $356.0 million for the year ended December 31, 2015.
Cash provided by operating activities increased by $60.4 million due to an increase in net income exclusive of non-cash items in the year ended December 31, 2015 compared to the year ended December 31, 2014. Refer to “Results of Operations” above for additional information.
The increase in cash flows from changes in operating assets and liabilities include an increase of $318.3 million due to changes in trade accounts receivables, net, inventories and trade accounts payable. In the year ended December 31, 2015, trade accounts receivables, net, inventories and trade accounts payable provided cash because net sales during the three months ended December 31, 2015 were lower than net sales during the three months ended December 31, 2014 primarily due to sales declines within the oil and gas markets. In addition, inventory levels were higher than normal as of December 31, 2014 to support our customer driven initiative related to improving on-time delivery.
The increase in cash flows from changes in operating assets and liabilities also related to accrued interest expenses increasing $14.4 million in the year ended December 31, 2015 compared to an increase of $0.4 million in the year ended December 31, 2014 resulting in a net increase of $14.0 million to cash provided by operations. The increase in accrued interest expenses is due to the July 2015 debt refinancing transactions altering the timing of interest payments.
60
The increase in cash flows from changes in operating assets and liabilities also includes an increase in other payables of $9.3 million in the year ended December 31, 2015 compared to a decrease of $8.9 million in the year ended December 31, 2014, which is a net increase of $18.2 million. The increase relates to more in-progress productivity projects during the year ended December 31, 2015 when compared to the year ended December 31, 2014.
The increase in cash flows from changes in operating assets and liabilities was partially offset by changes in redundancy and restructuring liabilities. The redundancy and restructuring liabilities increased $32.2 million during the year ended December 31, 2014, which was primarily due to higher facility exit costs and employee termination costs. In the year ended December 31, 2015, the redundancy and restructuring liabilities decreased $1.9 million as payments were higher than new charges. As a result, cash provided by operating activities decreased by $34.1 million in the year ended December 31, 2015. Another factor offsetting the higher cash provided by changes in operating assets and liabilities was a reduction in pension and other postretirement benefit obligations of $52.0 million in the year ended December 31, 2015 compared to an increase in the obligations of $72.8 million in the year ended December 31, 2014, which is a net decrease of $124.8 million. Refer to “Note 8: Employee benefit plans” in Item 8 of this Annual Report on Form 10-K for additional information. Cash provided by operations also decreased due to $11.0 million of higher variable compensation payments and decreased $7.6 million due to lower rebates driven by lower purchasing volumes during the year ended December 31, 2015. The remaining decrease of $3.7 million related to several insignificant components.
Cash Used by Investing Activities
Year Ended December 31, 2016 Compared to Year Ended December 31, 2015
Cash used by investing activities decreased $158.4 million from $294.4 million for the year ended December 31, 2015 to $136.0 million for the year ended December 31, 2016. The decrease primarily related to lower acquisition costs of $99.3 million in the year ended December 31, 2016 compared to the year ended December 31, 2015. We completed two acquisitions in the year ended 2016 compared to six acquisitions in the year ended December 31, 2015. Refer to “Note 18: Business combinations” in Item 8 of this Annual Report on Form 10-K for additional information. In addition, there was reduced capital expenditures of $54.9 million in the year ended December 31, 2016 compared to the year ended December 31, 2015. The decrease in capital expenditures is primarily due to reduced spending on transportation equipment and information technology assets. The remaining decrease in cash used by investing activities of $4.2 million did not contain any significant activity.
Year Ended December 31, 2015 Compared to Year Ended December 31, 2014
Cash used by investing activities increased $146.2 million from $148.2 million for the year ended December 31, 2014 to $294.4 million for the year ended December 31, 2015. The increase primarily related to six acquisitions in the year ended 2015 compared to one acquisition in the year ended December 31, 2014. Refer to “Note 18: Business combinations” in Item 8 of this Annual Report on Form 10-K for additional information. In addition, there was higher spending on capital expenditures of $31.1 million in the year ended December 31, 2015 compared to the year ended December 31, 2014. The increases in capital expenditures primarily related to purchasing assets that replaced operating leases and increased information technology spend related to internal projects focused on improving operations.
Cash (Used) Provided by Financing Activities
Year Ended December 31, 2016 Compared to Year Ended December 31, 2015
Cash used by financing activities increased $146.3 million from $19.8 million for the year ended December 31, 2015 to $166.1 million for the year ended December 31, 2016. The increase in cash used by financing activities primarily relates to the net pay downs on debt of $182.8 million, offset by inflows from stock options exercised of $16.9 million for the year ended December 31, 2016. For the year ended December 31, 2015, in comparison, debt pay downs were largely offset by the June 2015 IPO and July 2015 debt refinancing activity.
Year Ended December 31, 2015 Compared to Year Ended December 31, 2014
Cash used by financing activities increased $103.9 million from cash provided of $84.1 million for the year ended December 31, 2014 to cash used of $19.8 million for the year ended December 31, 2015. The increase in cash used by financing activities was primarily due to the July 2015 refinancing. As part of the refinancing activity, the former senior term loan facilities were paid in full and replaced with the new Senior Term Loan Facility and the Senior Unsecured Notes. The pay-off amount related to the former facility was $80.9 million more than the new debt balance related to the new Senior Term Loan Facility and Senior Unsecured Notes. Furthermore, financing fees paid increased by $23.3 million due to the July 2015 debt refinancing activity in the year ended December 31, 2015 being more significant than the March 2014 debt refinancing activity.
61
Also contributing to the increase in cash used by financing activities was a $96.5 million smaller increase in our outstanding balances within our ABL facilities during the year ended December 31, 2015 compared to the year ended December 31, 2014. The reduced increase in the ABL balances during the year ended December 31, 2015 primarily related to improved cash flows from operations in the year ended December 31, 2015 compared to December 31, 2014.
The increase in cash used by financing activities was partially offset by closing our June 2015 IPO and a concurrent private placement of equity during the year ended December 31, 2015. The proceeds, net of fees, related to the IPO and concurrent private placement of equity were $763.6 million. Concurrent with the IPO and private placement of equity, we paid the remaining principal balance of $650.0 million related to the Senior Subordinated Notes. This resulted in a net cash inflow from financing activities of $113.6 million. The remaining increase of $16.8 million primarily related to increased payments on capital leases and several other insignificant components.
Contractual Obligations and Commitments
The following table summarizes our contractual obligations that require us to make future cash payments as of December 31, 2016. The future contractual requirements include payments required for our operating and capital leases, indebtedness and other long-term liabilities reflected on our balance sheet.
Payment Due by Period | |||||||||||||||||||
(in millions) | Total | 2017 | 2018 - 2019 | 2020 - 2021 | Thereafter | ||||||||||||||
Short-term financing(1) | $ | 25.3 | $ | 25.3 | $ | — | $ | — | $ | — | |||||||||
Capital leases(1) | 63.4 | 19.2 | 21.2 | 15.2 | 7.8 | ||||||||||||||
Long-term debt, including current maturities(1) | 2,919.1 | 89.8 | 63.0 | 198.2 | 2,568.1 | ||||||||||||||
Interest(2) | 768.1 | 145.9 | 282.7 | 250.5 | 89.0 | ||||||||||||||
Minimum operating lease payments | 246.1 | 56.9 | 84.0 | 55.6 | 49.6 | ||||||||||||||
Estimated environmental liability payments(3) | 101.4 | 30.2 | 25.5 | 15.5 | 30.2 | ||||||||||||||
Total(4)(5)(6) | $ | 4,123.4 | $ | 367.3 | $ | 476.4 | $ | 535.0 | $ | 2,744.7 | |||||||||
(1) | See “Note 15: Debt” in Item 8 of this Annual Report on Form 10-K for additional information. |
(2) | Interest payments on debt are calculated for future periods using interest rates in effect as of December 31, 2016. Projected interest payments include the related effects of interest rate swap agreements. Certain of these projected interest payments may differ in the future based on changes in floating interest rates, foreign currency fluctuations or other factors or events. The projected interest payments only pertain to obligations and agreements outstanding at December 31, 2016. See “Note 15: Debt” and “Note 17: Derivatives” in Item 8 of this Annual Report on Form 10-K for further discussion regarding our debt instruments and related interest rate agreements, respectively. On January 19, 2017, the Company amended the Senior Term B loan agreement which will result in reduction of future interest payments. Impact of 2017 amendment is not factored into the projected interest payments shown above. See "Note 23: Subsequent events" in Item 8 of this Annual Report on Form 10-K for further discussion regarding amendment of Senior Term B loan. |
(3) | Included in the less than one year category is $12.9 million related to environmental liabilities for which the timing is uncertain. The timing of payments is unknown and could differ based on future events. For more information see “Note 19: Commitments and contingencies” in Item 8 of this Annual Report on Form 10-K. |
(4) | Due to the high degree of uncertainty related to the timing of future cash outflows associated with unrecognized income tax benefits, we are unable to reasonably estimate beyond one year when settlement will occur with the respective taxing authorities and have excluded such liabilities from this table. At December 31, 2016, we reported a liability for unrecognized tax benefits of $4.3 million. For more information see “Note 7: Income taxes” in Item 8 of this Annual Report on Form 10-K. |
(5) | This table excludes our pension and postretirement medical benefit obligations. Based on current projections of minimum funding requirements, we expect to make cash contributions of $31.1 million to our defined benefit pension plans in the year ended December 31, 2017. The timing for any such requirement in future years is uncertain given the implicit uncertainty regarding the future developments of factors described in “Risk Factors” in Item 1A of this Annual Report on Form 10-K and “Note 8: Employee benefit plans” in Item 8 of this Annual Report on Form 10-K. |
(6) | Pursuant to the terms of the purchase agreements related to the Future/BlueStar, Arrow Chemical, WEG and Polymer Technologies acquisitions, we are conditionally obligated to make earn-out payments up to $7.6 million excluding Future/Bluestar, which has no fixed maximum payout. These earn-out payments are excluded from the table as there is a high degree of uncertainty regarding the future performance of the acquired companies and thus the payout amounts. Refer to “Note 18: Business combinations” in Item 8 of this Annual Report on Form 10-K for additional information. |
We expect that we will be able to fund our remaining obligations and commitments with cash flow from operations. To the extent we are unable to fund these obligations and commitments with cash flow from operations; we intend to fund these obligations and commitments with proceeds from available borrowing capacity under our Senior ABL Facility or under future financings.
Off-Balance Sheet Arrangements
We have few off-balance sheet arrangements. In recent years, our principal off-balance sheet arrangements have consisted primarily of operating leases for facility space, rail cars and some equipment leasing and we expect to continue these practices.
62
For additional information on these leases, see “Note 19: Commitments and contingencies” in Item 8 of this Annual Report on Form 10-K. We do not use special purpose entities that would create off-balance sheet financing.
Critical Accounting Estimates
General
Preparation of our financial statements in accordance with GAAP requires management to make a number of significant estimates and assumptions that form the basis for our determinations as to the carrying values of assets and liabilities and the reported amounts of revenues and expenses that are not readily apparent from other sources. Actual results may differ from these estimates under different assumptions or conditions.
We consider an accounting estimate to be critical if that estimate requires that we make assumptions about matters that are highly uncertain at the time we make that estimate and if different estimates that we could reasonably have used or changes in accounting estimates that are reasonably likely to occur could materially affect our consolidated financial statements. We believe that the following critical accounting estimates reflect our more significant estimates and assumptions used in the preparation of our consolidated financial statements. Our significant accounting policies are described in “Note 2: Significant accounting policies” in Item 8 of this Annual Report on Form 10-K.
Revenue Recognition
We recognize net sales when persuasive evidence of an arrangement exists, delivery of products has occurred or services are provided to customers, the sales price is fixed or determinable and collectability is reasonably assured. Net sales includes product sales, billings for freight and handling charges and fees earned for services provided, net of any discounts, returns, customer rebates and sales or other revenue-based tax. We recognize product sales and billings for freight and handling charges when products are considered delivered to the customer under the terms of the sale. Fee revenues are recognized when services are completed.
Our sales to customers in the agriculture end markets often provide for a form of inventory protection through credit and re-bill, as well as understandings pursuant to which price changes from producers may be passed through to the customer. These arrangements require us to make estimates of potential returns of unused product as well as revenue deferral to the extent the sales price is not considered determinable. The estimates used to determine the amount of revenue associated with product likely to be returned are based on past experience adjusted for any current market conditions.
Goodwill
Goodwill is tested for impairment annually, or between annual tests if an event occurs or circumstances change that would more likely than not reduce the fair value of a reporting unit below its carrying amount. Goodwill is tested for impairment at a reporting unit level using either a qualitative assessment, commonly referred to as a “step zero” test, or a quantitative assessment, commonly referred to as a “step one” test. For each of the reporting units, the Company has the option to perform either the step zero or the step one test.
The step zero goodwill impairment test utilizes qualitative factors to determine whether it is more likely than not that the fair value of the reporting units is less than its carrying value. Qualitative factors include: macroeconomic conditions; legal and regulatory environment; industry and market considerations; overall financial performance and cost factors to determine whether a reporting unit is at risk for goodwill impairment. In the event a reporting unit fails the step zero goodwill impairment test, it is necessary to perform the step one goodwill impairment test.
The step one goodwill impairment test compares the estimated fair value of each reporting unit with the reporting unit’s carrying value (including goodwill). If the fair value of the reporting unit is less than its carrying value, an indication of goodwill impairment exists for the reporting unit and we must perform step two of the impairment test (measurement). Step two of the impairment test, if necessary, requires the identification and estimation of the fair value of the reporting unit’s individual assets, including currently unrecognized intangible assets, and liabilities in order to calculate the implied fair value of the reporting unit’s goodwill. Under step two, an impairment loss is recognized to the extent the carrying amount of the reporting unit’s goodwill exceeds the implied fair value. The See “Note 12: Goodwill and intangible assets” in Item 8 of this Annual Report on Form 10-K for additional information related to goodwill.
At October 1, 2016, we performed our annual impairment review via step zero and concluded that the fair value exceeded the carrying value for all reporting units with goodwill balances. There were no events or circumstances from the date of assessment through December 31, 2016 that would affect this conclusion. Accordingly, further step one and step two testing was not required to be performed.
63
Determining the fair value of a reporting unit requires judgment and involves the use of significant estimates and assumptions by management. The inputs that create the most sensitivity in our goodwill valuation model are the discount rate, terminal growth rate, estimated cash flow projections and market multiples. We can provide no assurance that a material impairment charge will not occur in a future period. Our estimates of future cash flows may differ from actual cash flows that are subsequently realized due to many factors, including future worldwide economic conditions and the expected benefits of our initiatives. Any of these potential factors, or other unexpected factors, may cause us to re-evaluate the carrying value of goodwill.
Environmental Liabilities
As more fully described in “Note 2: Significant accounting policies” and “Note 19: Commitments and contingencies” in Item 8 of this Annual Report on Form 10-K, we recognize environmental contingency liabilities for probable and reasonably estimable losses associated with environmental remediation. The estimated environmental contingency liability includes incremental direct costs of investigations, remediation efforts and post-remediation monitoring. The total environmental reserve at December 31, 2016, and 2015 was $95.8 million and $113.2 million, respectively.
Our environmental reserves are subject to numerous uncertainties that affect our ability to accurately estimate our costs, or our share of costs if multiple parties are responsible. These uncertainties involve the legal, regulatory and enforcement parameters governing environmental assessment and remediation, the nature and extent of contamination at these sites, the extent and cost of assessment and remediation efforts required, the choice of remediation and, in the case of sites with multiple responsible parties, the number and financial strength of other potentially responsible parties. In addition, our determination as to whether a loss is probable may change, particularly as new facts emerge as to the nature or extent of any non-compliance with environmental laws and the costs of assessment and remediation. Our revisions to the environmental reserve estimates have ranged between $11.3 million to $1.9 million between 2016 and 2014.
Defined Benefit Pension and Other Postretirement Obligations
As described more fully in “Note 2: Significant accounting policies” and “Note 8: Employee benefit plans” in Item 8 of this Annual Report on Form 10-K, we sponsor defined benefit pension plans in the US and various other countries. We determine these pension costs and obligations using actuarial methodologies that use several statistical and judgmental factors. These assumptions include discount rates, rates for expected return on assets, mortality rates, retirement rates and for some plans rates for compensation increases, as determined by us within certain guidelines. Actual experience different from those estimated and changes in assumptions can result in the recognition of gains and losses in earnings as our accounting policy is to recognize changes in the fair value of plan assets or each plan’s projected benefit obligation in the fourth quarter of each year (the “mark to market” adjustment), unless an earlier remeasurement is required.
For the year ended December 31, 2015, our average pension discount rate increased by 32 basis points, resulting in a decrease in our pension plan benefit obligation of $46.2 million. For the year ended December 31, 2016, we decreased our average pension discount rate by 54 basis points, resulting in an increase in our pension plan benefit obligation of $114.0 million. Our expected long-term rate of return on pension plan assets is 6.85% and 6.79% for 2016 and 2015, respectively. Actual returns can vary from the expected long-term rate each year. Actual returns (losses) for 2016 and 2015 were $106.4 million, or 10.9%, and $(1.3) million or (0.1%), respectively. Our expected return on plan assets is calculated using the actual fair value of plan assets. Due to the phasing out of benefits under our postretirement benefit plan, changes in assumptions have an immaterial effect on that obligation.
A 25 basis point reduction in the average pension discount rate would result in an increase of $50.0 million in pension plan benefit obligation as of the year ended December 31, 2016. The following table demonstrates the impact of a 25 basis point decrease in our assumed discount rate and separately a 100 basis point decrease in our expected return on plan assets on our 2017 defined benefit pension cost (credit).
(in millions) | 2017 Net Benefit Cost (Income) | ||
Assumed discount rate | $ | (1.3 | ) |
Expected return on plan assets | 9.4 | ||
Income Taxes
We are subject to income taxes in the jurisdictions in which we sell products and earn revenues, including the United States, Canada and various Latin American, Asian-Pacific and European jurisdictions. By their nature, a number of our tax positions require us to apply significant judgment in order to properly evaluate and quantify our tax positions and to determine our provision for income taxes. GAAP sets forth a two-step approach to recognizing and measuring uncertain tax positions. The first step is to evaluate the tax position for recognition by determining if the weight of available evidence indicates that it is more likely than not
64
that the position will be sustained upon examination, including resolution of related appeals or litigation processes, if any. The second step is to measure the tax benefit as the largest amount that is more than 50% likely of being realized upon settlement. GAAP specifically prohibits the use of a valuation allowance as a substitute for derecognition of tax positions and also requires expanded disclosures. See “Note 7: Income taxes” in Item 8 of this Annual Report on Form 10-K.
Although we believe we have adequately reserved for our uncertain tax positions, the final outcome of these tax matters may be different than our provision. We adjust our reserves for tax positions in light of changing facts and circumstances, such as the closing of a tax audit, the refinement of an estimate or changes in tax laws. To the extent that the final tax outcome of these matters is different than the amounts recorded, the differences are recorded as adjustments to the provision for income taxes in the period in which such determination is made. The provision for income taxes includes the impact of reserve provisions and changes to reserves that are considered appropriate. The interest and penalties related to these reserves are recorded as a component of interest expense and warehousing, selling and administrative expenses, respectively.
Our future effective tax rates could be adversely affected by changes in the valuation of our deferred tax assets or liabilities, or changes in tax laws, regulations, accounting principles or interpretations thereof. In addition, we are subject to examination of our income tax returns by various tax authorities. We regularly assess the likelihood of adverse outcomes resulting from these examinations to determine the adequacy of our provisions for income taxes.
We recognize deferred tax assets and liabilities for the expected tax consequences of temporary differences between the tax bases of assets and liabilities and their reported amounts using enacted tax rates in effect for the year the differences are expected to reverse. Significant judgment in the forecasting of taxable income using historical and projected future operating results is required in determining our provision for income tax and the related asset and liabilities.
In the event that the actual outcome of future tax consequences differs from our estimates and assumptions due to changes or future events such as tax legislation, geographic mix of the earnings, completion of tax audits or earnings repatriation plans, the resulting change to the provision for income taxes could have a material effect on the consolidated statements of operations and consolidated balance sheets.
We have placed a valuation allowance on certain deferred tax assets, including certain of our foreign net operating loss carry forwards. We intend to maintain the valuation allowances until sufficient positive evidence exists to support the reversal of the valuation allowances.
In evaluating our ability to realize our deferred tax assets, in full or in part, we consider all available positive and negative evidence, including our past operating results, our forecast of future market growth, forecasted earnings, future taxable income and prudent and feasible tax planning strategies.
The assumptions utilized in determining future taxable income require significant judgment and are consistent with the plans and estimates we are using to manage the underlying businesses. We believe it is more likely than not that the remaining deferred tax assets recorded on our balance sheet will ultimately be realized. In the event we were to determine that we would not be able to realize all or part of our net deferred tax assets in the future, an adjustment to the deferred tax assets would be charged to earnings in the period in which we make such determination.
Recently Issued and Adopted Accounting Pronouncements
See “Note 2: Significant accounting policies” in Item 8 of this Annual Report on Form 10-K.
Accounting Pronouncements Issued But Not Yet Adopted
See “Note 2: Significant accounting policies” in Item 8 of this Annual Report on Form 10-K.
ITEM 7A. QUANTITATIVE AND QUALITATIVE DISCLOSURES ABOUT MARKET RISK
Financial Risk Management Objectives and Policies
Our principal financial instruments, other than derivatives, comprise credit facilities and other long-term debt as well as cash and cash equivalents. We have various other financial instruments, such as accounts receivable and accounts payable, which arise directly from our operations. We make use of various financial instruments under a financial policy. We use derivative financial instruments to reduce exposure to fluctuations in foreign exchange rates and interest rates in certain limited circumstances described below. While these derivative financial instruments are subject to market risk, principally based on changes in currency exchange and interest rates, the impact of these changes on our financial position and results of operations is generally offset by a corresponding change in the financial or operating items we are seeking to hedge. We follow a strict policy that prohibits trading in financial instruments other than to acquire and manage these hedging positions. We do not hold or issue derivative or other financial instruments for speculative purposes, or to hedge translation risk.
65
The principal risks arising from our financial instruments are interest rate risk, product price risk, foreign currency risk and credit risk. Our board of directors reviews and approves policies designed to manage each of these risks, which are summarized below. We also monitor the market-price risk arising from all financial instruments. The interest rate risk to which we are subject at year end is discussed below. Our accounting policies for derivative financial instruments are set out in our summary of significant accounting policies at “Note 2: Significant accounting policies” in Item 8 of this Annual Report on Form 10-K.
Interest Rate Risk
Our exposure to market risk for changes in interest rates relates primarily to our long-term debt obligations. Under our hedging policy, we seek to maintain an appropriate amount of fixed-rate debt obligations, either directly or effectively through interest rate derivative contracts that fix the interest rate payable on all or a portion of our floating rate debt obligations. We assess the anticipated mix of the fixed versus floating amount of debt once a year, in connection with our annual budgeting process, with the purpose of hedging variability of interest expense and interest payments on our variable rate bank debt and maintaining a mix of both fixed and floating rate debt. As of December 31, 2016, approximately 75% of our debt was fixed rate after consideration of interest rate swap contracts.
The interest rates related to our long-term debt decreased since December 31, 2014 due to the July 2015 debt refinancing. Refer to “Note 15: Debt” in Item 8 of this Annual Report on Form 10-K for additional information. As a result, the impact on our earnings before taxes has materially changed when considering a change in variable interest rates.
Below is a chart showing the sensitivity of both a 100 basis point and 200 basis point increase in interest rates (including the impact of derivatives), with other variables held constant on our earnings before tax.
(in millions) | Year Ended December 31, 2016 | ||
100 basis point increase in variable interest rates | $ | 6.8 | |
200 basis point increase in variable interest rates | 13.5 | ||
Foreign Currency Risk
Because we conduct our business on an international basis in multiple currencies, we may be adversely affected by foreign exchange rate fluctuations. Although we report financial results in US dollars, a substantial portion of our net sales and expenses are denominated in currencies other than the US dollar, particularly the euro, the Canadian dollar and European currencies other than the euro, including the British pound sterling. Fluctuations in exchange rates could therefore significantly affect our reported results from period to period as we translate results in local currencies into US dollars. We have not used derivative instruments to hedge the translation risk related to earnings of foreign subsidiaries.
Additionally, our investments in EMEA, Canada and Rest of World are subject to foreign currency risk. Currency fluctuations result in non-cash gains and losses that do not impact income before income taxes, but instead are recorded as accumulated other comprehensive loss in equity in our consolidated balance sheet. We do not hedge our investment in non-US entities because those investments are viewed as long-term in nature.
There are also situations where we invoice sales and incur costs in currencies other than those currencies in which we record the financial results for a business operation. These exposures are typically of short duration and not material to our overall results. We tend to hedge this transaction risk either through specific hedges for significant transactions or through hedging on a portfolio basis to address currency transaction mismatches embedded in the large number of smaller transactions. Our sensitivity to net transactional currency movements are shown in the table below.
In 2015, we issued a euro-denominated Term B Loan under our Senior Term Loan Facility in the amount of €250.0 million which is held by Univar USA, a US dollar denominated entity. The issuance of this loan increased our exposure to changes in the value of the euro against the US dollar. The Euro Term B Loan has a variable interest rate based on short-term Eurodollar LIBOR interest rates. In January 2017, we transferred approximately 70% of the outstanding balance of the Euro Term B Loan to the US dollar tranche of the Term B Loan, significantly reducing our currency exposure on this loan. In addition, our subsidiaries may advance or accept intercompany loans in currencies other than the business unit’s currency for financial reporting purposes. Our policy is not to hedge these balance sheet revaluations due to the long-term nature of the underlying obligations. Our sensitivity to currency movements on both of these types of loans are also shown in the table below.
The majority of our currency risk arising on cash, accounts receivable, accounts payable and loan balances denominated in currencies other than those which we record the financial results for a business operation stem from exposures to the US dollar, euro or British pound sterling. The following table illustrates the sensitivity of our 2016 consolidated earnings before income
66
taxes, net of foreign currency derivative instruments, to a 10% increase in the value of the US dollar, euro, and, British pound sterling with all other variables held constant.
Year ended December 31, 2016 | |||||||
(in millions) | Effect on income | Effect on Income due to euro loan | |||||
10% strengthening of US dollar | $ | (5.6 | ) | $ | 24.0 | ||
10% strengthening of Euro | (3.7 | ) | (26.4 | ) | |||
10% strengthening of British pound | 0.3 | — | |||||
Product Price Risk
Our business model is to buy and sell at “spot” prices in quantities approximately equal to estimated customer demand. We do not take significant “long” or “short” positions in the products we sell in an attempt to speculate on changes in product prices. As a result, we are not significantly exposed to changes in product selling prices or costs and our exposure to product price risk is not material. Because we maintain inventories in order to serve the needs of our customers, we are subject to the risk of reductions in market prices for chemicals we hold in inventory, but we actively manage this risk and have reduced our exposure by improving sales forecasting and reducing the period of projected sales for which inventories are held, as well as incorporating low working capital targets within employee incentive plans.
Credit Risk
We have a credit policy in place and monitor exposure to credit risk on an ongoing basis. We perform credit evaluations on all customers requesting credit above a specified exposure level. In the normal course of business, we provide credit to our customers, perform ongoing credit evaluations of these customers and maintain reserves for potential credit losses. In certain situations, we will require upfront cash payment, collateral and/or personal guarantees based on the credit worthiness of the customers. We typically have limited risk from a concentration of credit risk as no individual customer represents greater than 10% of the outstanding accounts receivable balance.
Investments, if any, are only in liquid securities and only with counterparties with appropriate credit ratings. Transactions involving derivative financial instruments are with counterparties with which we have a signed netting agreement and which have appropriate credit ratings. We do not expect any counterparty to fail to meet its obligations.
67
ITEM 8. FINANCIAL STATEMENTS AND SUPPLEMENTARY DATA
Page | |
68
REPORT OF INDEPENDENT REGISTERED PUBLIC ACCOUNTING FIRM
The Board of Directors and Stockholders of Univar Inc.
We have audited the accompanying consolidated balance sheets of Univar Inc. as of December 31, 2016 and 2015, and the related consolidated statements of operations, comprehensive loss, changes in stockholders' equity, and cash flows for each of the three years in the period ended December 31, 2016. These financial statements are the responsibility of the Company's management. Our responsibility is to express an opinion on these financial statements based on our audits.
We conducted our audits in accordance with the standards of the Public Company Accounting Oversight Board (United States). Those standards require that we plan and perform the audit to obtain reasonable assurance about whether the financial statements are free of material misstatement. An audit includes examining, on a test basis, evidence supporting the amounts and disclosures in the financial statements. An audit also includes assessing the accounting principles used and significant estimates made by management, as well as evaluating the overall financial statement presentation. We believe that our audits provide a reasonable basis for our opinion.
In our opinion, the financial statements referred to above present fairly, in all material respects, the consolidated financial position of Univar Inc. at December 31, 2016 and 2015, and the consolidated results of its operations and its cash flows for each of the three years in the period ended December 31, 2016, in conformity with U.S. generally accepted accounting principles.
We also have audited, in accordance with the standards of the Public Company Accounting Oversight Board (United States), Univar Inc.’s internal control over financial reporting as of December 31, 2016, based on criteria established in Internal Control-Integrated Framework issued by the Committee of Sponsoring Organizations of the Treadway Commission (2013 framework), and our report dated February 28, 2017 expressed an unqualified opinion thereon.
/s/ Ernst & Young LLP
Chicago, Illinois
February 28, 2017
69
REPORT OF INDEPENDENT REGISTERED PUBLIC ACCOUNTING FIRM
The Board of Directors and Stockholders of Univar Inc.
We have audited Univar Inc.’s internal control over financial reporting as of December 31, 2016, based on criteria established in Internal Control-Integrated Framework issued by the Committee of Sponsoring Organizations of the Treadway Commission (2013 framework) (the COSO criteria). Univar Inc. management is responsible for maintaining effective internal control over financial reporting, and for its assessment of the effectiveness of internal control over financial reporting included in the accompanying Management’s Assessment of Internal Control over Financial Reporting. Our responsibility is to express an opinion on the company’s internal control over financial reporting based on our audit.
We conducted our audit in accordance with the standards of the Public Company Accounting Oversight Board (United States). Those standards require that we plan and perform the audit to obtain reasonable assurance about whether effective internal control over financial reporting was maintained in all material respects. Our audit included obtaining an understanding of internal control over financial reporting, assessing the risk that a material weakness exists, testing and evaluating the design and operating effectiveness of internal control based on the assessed risk, and performing such other procedures as we considered necessary in the circumstances. We believe that our audit provides a reasonable basis for our opinion.
A company’s internal control over financial reporting is a process designed to provide reasonable assurance regarding the reliability of financial reporting and the preparation of financial statements for external purposes in accordance with generally accepted accounting principles. A company’s internal control over financial reporting includes those policies and procedures that (1) pertain to the maintenance of records that, in reasonable detail, accurately and fairly reflect the transactions and dispositions of the assets of the company; (2) provide reasonable assurance that transactions are recorded as necessary to permit preparation of financial statements in accordance with generally accepted accounting principles, and that receipts and expenditures of the company are being made only in accordance with authorizations of management and directors of the company; and (3) provide reasonable assurance regarding prevention or timely detection of unauthorized acquisition, use, or disposition of the company’s assets that could have a material effect on the financial statements.
Because of its inherent limitations, internal control over financial reporting may not prevent or detect misstatements. Also, projections of any evaluation of effectiveness to future periods are subject to the risk that controls may become inadequate because of changes in conditions, or that the degree of compliance with the policies or procedures may deteriorate.
In our opinion, Univar Inc. maintained, in all material respects, effective internal control over financial reporting as of December 31, 2016, based on the COSO criteria.
We also have audited, in accordance with the standards of the Public Company Accounting Oversight Board (United States), the consolidated financial statements of Univar Inc. as of December 31, 2016 and 2015 and for each of the three years in the period ended December 31, 2016, and our report dated February 28, 2017, expressed an unqualified opinion thereon.
/s/ Ernst & Young LLP
Chicago, Illinois
February 28, 2017
70
UNIVAR INC.
CONSOLIDATED STATEMENTS OF OPERATIONS
Year ended December 31, | |||||||||||||
(in millions, except per share data) | Note | 2016 | 2015 | 2014 | |||||||||
Net sales | $ | 8,073.7 | $ | 8,981.8 | $ | 10,373.9 | |||||||
Cost of goods sold (exclusive of depreciation) | 6,346.6 | 7,182.7 | 8,443.2 | ||||||||||
Gross profit | 1,727.1 | 1,799.1 | 1,930.7 | ||||||||||
Operating expenses: | |||||||||||||
Outbound freight and handling | 286.6 | 324.6 | 365.5 | ||||||||||
Warehousing, selling and administrative | 877.8 | 874.4 | 923.5 | ||||||||||
Other operating expenses, net | 4 | 104.5 | 106.1 | 197.1 | |||||||||
Depreciation | 152.3 | 136.5 | 133.5 | ||||||||||
Amortization | 85.6 | 88.5 | 96.0 | ||||||||||
Impairment charges | 13 | 133.9 | — | 0.3 | |||||||||
Total operating expenses | 1,640.7 | 1,530.1 | 1,715.9 | ||||||||||
Operating income | 86.4 | 269.0 | 214.8 | ||||||||||
Other (expense) income: | |||||||||||||
Interest income | 3.9 | 4.3 | 8.2 | ||||||||||
Interest expense | (163.8 | ) | (211.3 | ) | (258.8 | ) | |||||||
Loss on extinguishment of debt | 15 | — | (12.1 | ) | (1.2 | ) | |||||||
Other (expense) income, net | 6 | (6.1 | ) | (23.2 | ) | 1.1 | |||||||
Total other expense | (166.0 | ) | (242.3 | ) | (250.7 | ) | |||||||
(Loss) income before income taxes | (79.6 | ) | 26.7 | (35.9 | ) | ||||||||
Income tax (benefit) expense | 7 | (11.2 | ) | 10.2 | (15.8 | ) | |||||||
Net (loss) income | $ | (68.4 | ) | $ | 16.5 | $ | (20.1 | ) | |||||
(Loss) income per common share: | |||||||||||||
Basic | 3 | $ | (0.50 | ) | $ | 0.14 | $ | (0.20 | ) | ||||
Diluted | 3 | (0.50 | ) | 0.14 | (0.20 | ) | |||||||
Weighted average common shares outstanding: | |||||||||||||
Basic | 3 | 137.8 | 119.6 | 99.7 | |||||||||
Diluted | 3 | 137.8 | 120.1 | 99.7 | |||||||||
The accompanying notes are an integral part of these consolidated financial statements.
71
UNIVAR INC.
CONSOLIDATED STATEMENTS OF COMPREHENSIVE LOSS
Year ended December 31, | |||||||||||||
(in millions) | Note | 2016 | 2015 | 2014 | |||||||||
Net (loss) income | $ | (68.4 | ) | $ | 16.5 | $ | (20.1 | ) | |||||
Other comprehensive income (loss), net of tax: | |||||||||||||
Foreign currency translation | 10 | 36.3 | (212.6 | ) | (118.3 | ) | |||||||
Pension and other postretirement benefits adjustment | 10 | (1.8 | ) | (7.3 | ) | (7.3 | ) | ||||||
Derivative financial instruments | 10 | — | 3.7 | (0.9 | ) | ||||||||
Total other comprehensive income (loss), net of tax | 34.5 | (216.2 | ) | (126.5 | ) | ||||||||
Comprehensive loss | $ | (33.9 | ) | $ | (199.7 | ) | $ | (146.6 | ) | ||||
The accompanying notes are an integral part of these consolidated financial statements.
72
UNIVAR INC.
CONSOLIDATED BALANCE SHEETS
December 31, | |||||||||
(in millions, except per share data) | Note | 2016 | 2015 | ||||||
Assets | |||||||||
Current assets: | |||||||||
Cash and cash equivalents | $ | 336.4 | $ | 188.1 | |||||
Trade accounts receivable, net | 950.3 | 1,026.2 | |||||||
Inventories | 756.6 | 803.4 | |||||||
Prepaid expenses and other current assets | 134.8 | 178.6 | |||||||
Total current assets | 2,178.1 | 2,196.3 | |||||||
Property, plant and equipment, net | 11 | 1,019.5 | 1,082.5 | ||||||
Goodwill | 12 | 1,784.4 | 1,745.1 | ||||||
Intangible assets, net | 12 | 339.2 | 518.9 | ||||||
Deferred tax assets | 7 | 18.2 | 3.5 | ||||||
Other assets | 50.5 | 66.1 | |||||||
Total assets | $ | 5,389.9 | $ | 5,612.4 | |||||
Liabilities and stockholders’ equity | |||||||||
Current liabilities: | |||||||||
Short-term financing | 15 | $ | 25.3 | $ | 33.5 | ||||
Trade accounts payable | 852.3 | 836.0 | |||||||
Current portion of long-term debt | 15 | 109.0 | 59.9 | ||||||
Accrued compensation | 65.6 | 62.8 | |||||||
Other accrued expenses | 14 | 287.3 | 301.3 | ||||||
Total current liabilities | 1,339.5 | 1,293.5 | |||||||
Long-term debt | 15 | 2,845.0 | 3,057.4 | ||||||
Pension and other postretirement benefit liabilities | 8 | 268.6 | 251.8 | ||||||
Deferred tax liabilities | 7 | 17.2 | 58.0 | ||||||
Other long-term liabilities | 109.7 | 135.0 | |||||||
Total liabilities | 4,580.0 | 4,795.7 | |||||||
Stockholders’ equity: | |||||||||
Preferred stock, 200.0 million shares authorized at $0.01 par value with no shares issued or outstanding as of December 31, 2016 and 2015 | — | — | |||||||
Common stock, 2.0 billion shares authorized at $0.01 par value with 138.8 million and 138.0 million shares issued and outstanding at December 31, 2016 and December 31, 2015, respectively | 1.4 | 1.4 | |||||||
Additional paid-in capital | 2,251.8 | 2,224.7 | |||||||
Accumulated deficit | (1,053.4 | ) | (985.0 | ) | |||||
Accumulated other comprehensive loss | 10 | (389.9 | ) | (424.4 | ) | ||||
Total stockholders’ equity | 809.9 | 816.7 | |||||||
Total liabilities and stockholders’ equity | $ | 5,389.9 | $ | 5,612.4 | |||||
The accompanying notes are an integral part of these consolidated financial statements.
73
UNIVAR INC.
CONSOLIDATED STATEMENTS OF CASH FLOWS
The accompanying notes are an integral part of these consolidated financial statements.
Year ended December 31, | |||||||||||||
(in millions) | Note | 2016 | 2015 | 2014 | |||||||||
Operating activities: | |||||||||||||
Net (loss) income | $ | (68.4 | ) | $ | 16.5 | $ | (20.1 | ) | |||||
Adjustments to reconcile net (loss) income to net cash provided by operating activities: | |||||||||||||
Depreciation and amortization | 237.9 | 225.0 | 229.5 | ||||||||||
Impairment charges | 13 | 133.9 | — | 0.3 | |||||||||
Amortization of deferred financing fees and debt discount | 7.9 | 12.2 | 16.5 | ||||||||||
Amortization of pension credit from accumulated other comprehensive loss | 8 | (4.5 | ) | (11.9 | ) | (11.9 | ) | ||||||
Loss on extinguishment of debt | 15 | — | 12.1 | 1.2 | |||||||||
Contingent consideration fair value adjustment | 19 | — | — | (1.0 | ) | ||||||||
Deferred income taxes | 7 | (31.6 | ) | (7.4 | ) | (19.6 | ) | ||||||
Recognition of previously uncertain tax benefits | — | — | (18.4 | ) | |||||||||
Stock-based compensation expense | 9 | 10.4 | 7.5 | 12.1 | |||||||||
Other | (0.9 | ) | (2.0 | ) | 3.3 | ||||||||
Changes in operating assets and liabilities: | |||||||||||||
Trade accounts receivable, net | 70.2 | 198.7 | (63.2 | ) | |||||||||
Inventories | 42.0 | 82.3 | (90.9 | ) | |||||||||
Prepaid expenses and other current assets | 40.1 | (29.6 | ) | (8.2 | ) | ||||||||
Trade accounts payable | 12.0 | (104.1 | ) | 12.7 | |||||||||
Pensions and other postretirement benefit liabilities | 26.9 | (52.0 | ) | 72.8 | |||||||||
Other, net | (26.3 | ) | 8.7 | 11.2 | |||||||||
Net cash provided by operating activities | 449.6 | 356.0 | 126.3 | ||||||||||
Investing activities: | |||||||||||||
Purchases of property, plant and equipment | (90.1 | ) | (145.0 | ) | (113.9 | ) | |||||||
Proceeds from sale of property, plant and equipment | 9.4 | 9.5 | 8.9 | ||||||||||
Purchases of businesses, net of cash acquired | 18 | (53.6 | ) | (153.4 | ) | (42.2 | ) | ||||||
Other | (1.7 | ) | (5.5 | ) | (1.0 | ) | |||||||
Net cash used by investing activities | (136.0 | ) | (294.4 | ) | (148.2 | ) | |||||||
Financing activities: | |||||||||||||
Proceeds from sale of common stock | — | 765.3 | 3.0 | ||||||||||
Proceeds from the issuance of long-term debt | 15 | — | 2,806.6 | 177.5 | |||||||||
Payments on long-term debt and capital lease obligations | 15 | (178.2 | ) | (3,547.8 | ) | (79.2 | ) | ||||||
Short-term financing, net | 15 | (4.6 | ) | (11.5 | ) | (8.2 | ) | ||||||
Financing fees paid | 15 | — | (28.7 | ) | (5.4 | ) | |||||||
Shares repurchased | — | (3.6 | ) | (8.0 | ) | ||||||||
Stock option exercises | 9 | 16.9 | 3.0 | 6.2 | |||||||||
Other | (0.2 | ) | (3.1 | ) | (1.8 | ) | |||||||
Net cash (used) provided by financing activities | (166.1 | ) | (19.8 | ) | 84.1 | ||||||||
Effect of exchange rate changes on cash and cash equivalents | 0.8 | (59.7 | ) | (36.6 | ) | ||||||||
Net increase (decrease) in cash and cash equivalents | 148.3 | (17.9 | ) | 25.6 | |||||||||
Cash and cash equivalents at beginning of period | 188.1 | 206.0 | 180.4 | ||||||||||
Cash and cash equivalents at end of period | $ | 336.4 | $ | 188.1 | $ | 206.0 | |||||||
Supplemental disclosure of cash flow information | |||||||||||||
Cash paid during the period for: | |||||||||||||
Income taxes | $ | 14.9 | $ | 38.2 | $ | 23.7 | |||||||
Interest, net of capitalized interest | 148.9 | 169.7 | 238.5 | ||||||||||
Non-cash activities: | |||||||||||||
Additions of property, plant and equipment included in trade accounts payable and other accrued expenses | 11.5 | 10.1 | 9.3 | ||||||||||
Additions of property, plant and equipment under a capital lease obligation | 29.6 | 67.7 | 2.6 | ||||||||||
74
UNIVAR INC.
CONSOLIDATED STATEMENTS OF CHANGES IN STOCKHOLDERS’ EQUITY
(in millions, except per share data) | Common stock (shares) | Common stock | Additional paid-in capital | Accumulated deficit | Accumulated other comprehensive income (loss) | Total | ||||||||||||||||
Balance, January 1, 2014 | 100.0 | $ | — | $ | 1,444.0 | $ | (981.0 | ) | $ | (81.7 | ) | $ | 381.3 | |||||||||
Net loss | — | — | — | (20.1 | ) | — | (20.1 | ) | ||||||||||||||
Foreign currency translation adjustment, net of tax $9.3 | — | — | — | — | (118.3 | ) | (118.3 | ) | ||||||||||||||
Pension and other postretirement benefits adjustment, net of tax $4.6 | — | — | — | — | (7.3 | ) | (7.3 | ) | ||||||||||||||
Derivative financial instruments, net of tax $0.5 | — | — | — | — | (0.9 | ) | (0.9 | ) | ||||||||||||||
Share issuances | 0.2 | — | 3.0 | — | — | 3.0 | ||||||||||||||||
Share repurchases | (0.4 | ) | — | (7.8 | ) | (0.2 | ) | — | (8.0 | ) | ||||||||||||
Stock option exercises | 0.3 | — | 6.2 | — | — | 6.2 | ||||||||||||||||
Stock-based compensation | 0.1 | — | 12.1 | — | — | 12.1 | ||||||||||||||||
Excess tax benefit from stock-based compensation | — | — | 0.1 | — | — | 0.1 | ||||||||||||||||
Balance, December 31, 2014 | 100.2 | $ | — | $ | 1,457.6 | $ | (1,001.3 | ) | $ | (208.2 | ) | $ | 248.1 | |||||||||
Net income | — | — | — | 16.5 | — | 16.5 | ||||||||||||||||
Foreign currency translation adjustment, net of tax $7.4 | — | — | — | — | (212.6 | ) | (212.6 | ) | ||||||||||||||
Pension and other postretirement benefits adjustment, net of tax $4.6 | — | — | — | — | (7.3 | ) | (7.3 | ) | ||||||||||||||
Derivative financial instruments, net of tax $(2.1) | — | — | — | — | 3.7 | 3.7 | ||||||||||||||||
Share issuances | 37.7 | — | 761.5 | — | — | 761.5 | ||||||||||||||||
Change in par value of common stock to $0.01 | — | 1.4 | (1.4 | ) | — | — | — | |||||||||||||||
Share repurchases | (0.2 | ) | — | (3.4 | ) | (0.2 | ) | — | (3.6 | ) | ||||||||||||
Stock option exercises | 0.2 | — | 3.0 | — | — | 3.0 | ||||||||||||||||
Stock-based compensation | 0.1 | — | 7.5 | — | — | 7.5 | ||||||||||||||||
Usage of excess tax benefit from stock-based compensation | — | — | (0.1 | ) | — | — | (0.1 | ) | ||||||||||||||
Balance, December 31, 2015 | 138.0 | $ | 1.4 | $ | 2,224.7 | $ | (985.0 | ) | $ | (424.4 | ) | $ | 816.7 | |||||||||
Net loss | — | — | — | (68.4 | ) | — | (68.4 | ) | ||||||||||||||
Foreign currency translation adjustment, net of tax $23.9 | — | — | — | — | 36.3 | 36.3 | ||||||||||||||||
Pension and other postretirement benefits adjustment, net of tax $1.5 | — | — | — | — | (1.8 | ) | (1.8 | ) | ||||||||||||||
Stock option exercises | 0.8 | — | 16.9 | — | — | 16.9 | ||||||||||||||||
Stock-based compensation | — | — | 10.4 | — | — | 10.4 | ||||||||||||||||
Other | — | — | (0.2 | ) | — | — | (0.2 | ) | ||||||||||||||
Balance, December 31, 2016 | 138.8 | $ | 1.4 | $ | 2,251.8 | $ | (1,053.4 | ) | $ | (389.9 | ) | $ | 809.9 | |||||||||
The accompanying notes are an integral part of these consolidated financial statements.
75
UNIVAR INC.
NOTES TO CONSOLIDATED FINANCIAL STATEMENTS
AS OF DECEMBER 31, 2016 AND 2015 AND
FOR THE YEARS ENDED DECEMBER 31, 2016, 2015 AND 2014
1. Nature of operations
Headquartered in Downers Grove, Illinois, Univar Inc. (“Company” or “Univar”) is a leading global chemical and ingredients distributor and provider of specialty services. The Company’s operations are structured into four operating segments that represent the geographic areas under which the Company manages its business:
• | Univar USA (“USA”) |
• | Univar Canada (“Canada”) |
• | Univar Europe, the Middle East and Africa (“EMEA”) |
• | Rest of the World (“Rest of World”) |
Rest of World includes certain developing businesses in Latin America (including Brazil and Mexico) and the Asia-Pacific region.
Initial public offering
On June 23, 2015, the Company closed its initial public offering (“IPO”) in which the Company issued and sold 20.0 million shares of common stock at a public offering price of $22.00 per share. In addition, the Company completed a concurrent private placement of $350.0 million for shares of common stock (17.6 million shares) to Dahlia Investments Pte. Ltd., an indirect wholly owned subsidiary of Temasek Holdings (Private) Limited (“Temasek”). The Company received total net proceeds of approximately $760.0 million after deducting underwriting discounts and commissions and other offering expenses of approximately $30.0 million. These expenses were recorded against the proceeds received from the IPO.
Certain selling stockholders sold an additional 25.3 million shares of common stock in the IPO and concurrent private placement. The Company did not receive any proceeds from the sale of these shares.
In connection with the IPO and pursuant to Rule 424(b), the Company filed its final prospectus with the Securities and Exchange Commission on June 19, 2015.
2. Significant accounting policies
Basis of presentation
The consolidated financial statements of the Company have been prepared in accordance with accounting principles generally accepted in the United States of America (“US GAAP”). Unless otherwise indicated, all financial data presented in these consolidated financial statements are expressed in US dollars.
Basis of consolidation
The consolidated financial statements include the financial statements of the Company and its subsidiaries. Subsidiaries are consolidated if the Company has a controlling financial interest, which may exist based on ownership of a majority of the voting interest, or based on the Company’s determination that it is the primary beneficiary of a variable interest entity. The Company did not have any material interests in variable interest entities (“VIEs”) during the years presented in these consolidated financial statements. All intercompany balances and transactions are eliminated in consolidation.
Use of estimates
The preparation of consolidated financial statements in conformity with US GAAP requires management to make estimates and assumptions that affect the amounts reported and disclosed in the financial statements and accompanying notes. Actual results could differ materially from these estimates.
Recently issued and adopted accounting pronouncements
In August 2014, the FASB issued ASU 2014-15 “Disclosure of Uncertainties about an Entity’s Ability to Continue as a Going Concern.” The core principle of the guidance is that an entity’s management should evaluate whether there are conditions
76
or events, considered in the aggregate, that raise substantial doubt about the entity’s ability to continue as a going concern within one year after the date that the financial statements are available to be issued. When management identifies conditions or events that raise substantial doubt about an entity’s ability to continue as a going concern, management should consider whether its plans that are intended to mitigate those relevant conditions or events that will alleviate the substantial doubt are adequately disclosed in the footnotes to the financial statements. This guidance is effective for the annual period ending after December 15, 2016, and for annual periods and interim periods thereafter. Early adoption is permitted and the Company has elected to adopt the ASU as of January 1, 2016. The adoption of this ASU did not have a material impact on the Company’s consolidated financial statements.
In February 2015, the FASB issued ASU 2015-02 “Amendments to the Consolidation Analysis” (Topic 810). The core principle of the guidance is to provide amendments to the current consolidation guidance. The revised consolidation guidance, among other things, modifies the evaluation of whether limited partnerships and similar legal entities are VIEs or voting interest entities, eliminates the presumption that a general partner should consolidate a limited partnership and modifies the consolidation analysis of reporting entities that are involved with VIEs through fee arrangements and related party relationships. This guidance is effective for fiscal years, and interim periods within those years, beginning after December 15, 2015. The Company has elected to adopt the ASU as of January 1, 2016 and the adoption of this ASU did not have a material impact on the Company’s consolidated financial statements.
In April 2015, the FASB issued ASU 2015-04 “Compensation-Retirement Benefits (Practical Expedient for the Measurement Date of an Employer’s Defined Benefit Obligation and Plan Assets)” (Topic 715). The core principle of the guidance is that it provides a practical expedient for companies to measure interim remeasurements for significant events that occur on other than a month-end date. The guidance permits entities to remeasure defined benefit plan assets and obligations using the month-end date that is closest to the date of the significant event. The decision to apply the practical expedient to interim remeasurements for significant events can be made for each significant event. This guidance is effective prospectively for fiscal years, and interim periods within those years, beginning after December 15, 2015. The Company has elected to adopt the ASU as of January 1, 2016 and the adoption of this ASU did not have a material impact on the Company’s consolidated financial statements.
In April 2015, the FASB issued ASU 2015-05 “Intangibles-Goodwill and Other-Internal-use software (Customer’s Accounting for Fees Paid in a Cloud Computing Arrangement” (Subtopic 350-40). The ASU provides customers with guidance on determining whether a cloud computing arrangement contains a software license that should be accounted for as internal-use software. If a cloud computing arrangement includes a software license, then the customer should account for the software license element of the arrangement consistent with the acquisition of other software licenses. If a cloud computing arrangement does not include a software license, the customer should account for the arrangement as a service contract. This guidance is effective for fiscal years, and interim periods within those years, beginning after December 15, 2015. The Company has elected to adopt the ASU as of January 1, 2016 and the ASU is applied prospectively to all arrangements entered that occur after the effective date. The adoption of this ASU did not have a material impact on the Company’s consolidated financial statements.
In July 2015, the FASB issued ASU 2015-11 "Simplifying the Measurement of Inventory" (Topic 330). The core principle of the guidance is that an entity should measure inventory at the "lower of cost and net realizable value" and options that currently exist for "market value" will be eliminated. The ASU defines net realizable value as the "estimated selling prices in the ordinary course of business, less reasonably predictable cost of completion, disposal, and transportation." This guidance is effective for the fiscal years beginning after December 15, 2016, including interim periods within those financial years. Early adoption is permitted and the Company has elected to adopt the ASU as of June 30, 2016. The ASU is applied prospectively and the adoption of the ASU did not have a significant impact on the Company's consolidated financial statements.
Accounting pronouncements issued but not yet adopted
In May 2014, the FASB issued ASU 2014-09 “Revenue from Contracts with Customers” (Topic 606), which supersedes the revenue recognition requirements in Accounting Standards Codification (“ASC”) 605, “Revenue Recognition.” This new revenue standard creates a single source of revenue guidance for all companies in all industries and is more principles-based than the current revenue guidance. The standard will be effective for public entities for interim and annual reporting periods beginning after December 15, 2017. The new guidance must be adopted using either a full retrospective approach, under which all years included in the financial statements will be presented under the revised guidance, or a modified retrospective approach, under which financial statements will be prepared under the revised guidance for the year of adoption, but not for prior years. Under the modified retrospective method, entities will recognize a cumulative catch-up adjustment to the opening balance of retained earnings at the effective date for contracts that still require performance by the entity, and disclose all line items in the year of adoption as if they were prepared under the old revenue guidance. The core principle of the guidance is that "an entity should recognize revenue to depict the transfer of promised goods or services to customers in an amount that reflects the consideration to which the entity expects to be entitled in exchange for those goods or services." In achieving this objective, an entity must perform five steps: (1) identify the contract(s) with a customer, (2) identify the performance obligations of the contract, (3) determine the transaction price, (4) allocate the transaction price to the performance obligations in the contract, and (5) recognize revenue when (or as) the
77
entity satisfies a performance obligation. In addition, the standard requires additional new disclosures of the nature, amount, timing, and uncertainty of revenue and cash flows arising from contracts with customers.
The Company anticipates using the modified retrospective approach in implementing the new revenue standard. The Company has established a project team who are currently scoping revenue streams and reviewing customer contracts to identify and evaluate the potential impacts of the provisions of ASC 606. Based on an early assessment, the Company expects to make changes to estimation processes related to arrangements that may involve, among other items, potential returns of unused products, as well as revenue deferral to the extent the sales price is not considered determinable. These changes may likely impact the timing of revenue recognition during the year for sales to customers in the agriculture end market, principally in Canada. At this time, the Company is continuing to work in accordance with its project plan to assess all potential impacts of the new guidance but expects to complete the implementation of the new standard by January 1, 2018.
In January 2016, the FASB issued ASU 2016-01 “Financial Instrument – Recognition and Measurement of Financial Assets and Financial Liabilities” (Subtopic 825-10). The core principle of the guidance is that an entity should classify equity securities with readily determinable fair values as “trading” or “available-for-sale” and requires equity securities to be measured at fair value with changes in the fair value recognized through net income. For equity investments that do not have readily determinable fair values, remeasurement is required at fair value either upon the occurrence of an observable price change or upon identification of impairment. The ASU defines an equity investment as “investments in partnerships, unincorporated joint ventures and limited liability companies that do not result in consolidation and are not accounted for under the equity method”. This guidance is applied as a cumulative-effect adjustment to the balance sheet as of the beginning of the fiscal year of adoption and is effective for fiscal years beginning after December 15, 2017, including interim periods within those fiscal years. Early adoption is permitted. The Company is currently evaluating the impact of the adoption of this accounting standard update on its internal processes, operating results and financial reporting. The impact is currently not known or reasonably estimable.
In February 2016, the FASB issued ASU 2016-02 “Leases” (Topic 842), which supersedes the lease recognition requirements in ASC Topic 840, “Leases.” The core principal of the guidance is that an entity should recognize assets and liabilities arising from a lease for both financing and operating leases, along with additional qualitative and quantitative disclosures. The standard will be effective for fiscal years beginning after December 15, 2018, including interim periods within such fiscal years. Early adoption is permitted. The guidance is to be applied using a modified retrospective transition method with the option to elect a package of practical expedients. The Company is currently evaluating the impact of the adoption of this accounting standard update on its internal processes, operating results and financial reporting. The impact is currently not known or reasonably estimable.
In March 2016, the FASB issued ASU 2016-09 “Compensation – Stock Compensation” (Topic 718) – “Improvement to Employee Share-Based Payment Accounting.” The core principal of the guidance is to simplify several aspects of the accounting for employee share-based payment transactions including the accounting for income taxes, forfeitures, and statutory tax withholding requirements, as well as classification of related amounts within the statement of cash flows. The standard will be effective for fiscal years beginning after December 15, 2016, including interim periods within such fiscal years. Early adoption is permitted. The guidance is to be applied using a modified retrospective method by means of a cumulative-effect adjustment to equity as of the beginning of the period in which the guidance is adopted. The Company does not expect a significant impact to its consolidated financial statements when it adopts this ASU.
In June 2016, the FASB issued ASU 2016-13 "Financial Instruments - Credit Losses" (Topic 326) - "Measurement of Credit Losses on Financial Instruments." The ASU requires entities to use a Current Expected Credit Loss model which is a new impairment model based on expected losses rather than incurred losses. Under the model, an entity would recognize an impairment allowance equal to its current estimate of all contractual cash flows that the entity does not expect to collect from financial assets measured at amortized cost. The entity's estimate would consider relevant information about past events, current conditions and reasonable and supportable forecasts, which will result in recognition of lifetime expected credit losses upon initial recognition of the related assets. This guidance will be effective for fiscal years beginning after December 15, 2019, including interim periods within such fiscal years. The Company is currently evaluating the impact of the adoption of this ASU on its internal processes, operating results and financial reporting. The impact is currently not known or reasonably estimable.
In August 2016, the FASB issued ASU 2016-15 “Statement of Cash Flows” (Topic 230) - “Classification of Certain Cash Receipts and Cash Payments.” The ASU clarifies and provides specific guidance on eight cash flow classification issues that are not currently addressed by current guidance; and therefore, reduces the current diversity in practice. The standard will be effective for fiscal years beginning after December 15, 2017, including interim periods within such fiscal years. Early adoption is permitted. The guidance is to be applied using a retrospective transition method to each period presented. The Company does not expect any impact to its consolidated statement of operations or consolidated balance sheet since the ASU only addresses classification items within the statement of cash flows.
In October 2016, the FASB issued ASU 2016-16 "Income Taxes" (Topic 740) - "Intra-Entity Transfers of Assets Other Than Inventory." The ASU eliminates the exception that prohibits the recognition of current and deferred income taxes for an intra-entity asset transfer until the asset has been sold to an outside party for assets other than inventory. The standard will be effective
78
for fiscal years beginning after December 15, 2017, including interim periods within such fiscal years. Early adoption is permitted as of the beginning of an annual reporting period for which financial statements (interim or annual) have not yet been issued. The Company does not expect a significant impact to its consolidated financial statements when it adopts this ASU.
In October 2016, the FASB issued ASU 2016-17 "Consolidation" (Topic 810) - "Interest Held through Related Parties That Are under Common Control." The core principle of the guidance is to provide amendments to the current consolidation guidance. The revised consolidation guidance modifies how a reporting entity that is a single decision maker of a VIE should treat indirect interests in the entity held through related parties that are under common control with the reporting entity when determining whether it is the primary beneficiary of that VIE. This guidance is effective for fiscal years, and interim periods within those years, beginning after December 15, 2016. Early adoption is permitted. This guidance is to be applied retrospectively to all relevant prior periods beginning with the fiscal year in which the amendments in ASU 2015-02 were applied. The Company does not expect a significant impact to its consolidated financial statements when it adopts this ASU.
In November 2016, the FASB issued ASU 2016-18 “Statement of Cash Flows” (Topic 230) - “Restricted Cash.” The ASU clarifies and provides specific guidance on restricted cash classification issues that are not currently addressed by current guidance; and therefore, reduces the current diversity in practice. The standard will be effective for fiscal years beginning after December 15, 2017, including interim periods within such fiscal years. Early adoption is permitted. The guidance is to be applied using a retrospective transition method to each period presented. The Company does not expect any impact to its consolidated statement of operations or consolidated balance sheet since the ASU only addresses classification items within the statement of cash flows.
In January 2017, the FASB issued ASU 2017-01 "Business Combinations" (Topic 805) - "Clarifying the Definition of a Business." The core principle of the guidance is to clarify the definition of a business with the objective of adding guidance to assist entities with evaluating whether transactions should be accounted for as acquisitions (or disposals) of assets or businesses. The standard will be effective for fiscal years beginning after December 15, 2017, including interim periods within such fiscal years. Early adoption is permitted immediately, pending nonrecognition of the business transaction in previously issued or made available financial statements. The Company does not expect a significant impact to its consolidated financial statements when it adopts this ASU.
In January 2017, the FASB issued ASU 2017-04 "Intangibles - Goodwill and Other" (Topic 350) - "Simplifying the Test for Goodwill Impairment." The core principle of the guidance is to simplify the accounting for goodwill impairments by eliminating step 2 from the goodwill impairment test. The new standard allows an entity to calculate goodwill impairment as the excess of a reporting unit's carrying amount in comparison to the reporting unit's fair value. The standard will be effective for fiscal years beginning after December 15, 2019, including interim periods within such fiscal years. Early adoption is permitted, including adoption in an interim period, for goodwill impairment tests performed on dates after January 1, 2017. The Company does not expect a significant impact to its consolidated financial statements when it adopts this ASU.
Cash and cash equivalents
Cash and cash equivalents include all highly-liquid investments with an original maturity at the time of purchase of three months or less that are readily convertible into known amounts of cash. Cash at banks earn interest at floating rates based on daily bank deposit rates.
Trade accounts receivable, net
Trade accounts receivable are stated at the invoiced amount, net of an allowance for doubtful accounts.
In the normal course of business, the Company provides credit to its customers, performs ongoing credit evaluations of these customers and maintains reserves for potential credit losses. In certain situations, the Company will require up-front cash payment, collateral and/or personal guarantees based on the credit worthiness of the customer.
The allowance for doubtful accounts was $13.4 million and $14.4 million at December 31, 2016 and 2015, respectively. The allowance for doubtful accounts is estimated based on prior experience, as well as an individual assessment of collectability based on factors that include current ability to pay, bankruptcy and payment history.
Inventories
Inventories consist primarily of products purchased for resale and are stated at the lower of cost or net realizable value. Inventory cost is determined by the weighted average cost method. Inventory cost includes purchase price from producers net of any rebates received, inbound freight and handling, and direct labor and other costs incurred to blend and repackage product and excludes depreciation expense. The Company recognized $6.6 million, $0.8 million and $0.8 million of lower of cost or net realizable value adjustments to certain of its inventories in the year ended December 31, 2016, 2015 and 2014, respectively. The expense related to these adjustments is included in cost of goods sold (exclusive of depreciation) in the consolidated statements of operations.
79
Producer incentives
The Company has arrangements with certain producers that provide discounts when certain measures are achieved, generally related to purchasing volume. Volume rebates are generally earned and realized when the related products are purchased during the year. The reduction in cost of goods sold (exclusive of depreciation) is recorded when the related products, on which the rebate was earned, are sold. Discretionary rebates are recorded when received. The unpaid portion of rebates from producers is recorded in prepaid expenses and other current assets in the consolidated balance sheets.
Property, plant and equipment, net
Property, plant and equipment are carried at historical cost, net of accumulated depreciation. Expenditures for improvements that add functionality and/or extend useful life are capitalized. The Company capitalizes interest costs on significant capital projects, as an increase to property, plant and equipment. Repair and maintenance costs are expensed as incurred. Depreciation is recorded on a straight-line basis over the estimated useful life of each asset from the time the asset is ready for its intended purpose, with consideration of any expected residual value.
The estimated useful lives of plant, property and equipment are as follows:
Buildings | 10-50 years |
Main components of tank farms | 5-40 years |
Containers | 2-15 years |
Machinery and equipment | 5-20 years |
Furniture, fixtures and others | 5-20 years |
Information technology | 3-10 years |
The Company evaluates the useful life and carrying value of property, plant and equipment for impairment if an event occurs or circumstances change that would indicate the carrying value may not be recoverable. If an asset is tested for possible impairment, the Company compares the carrying amount of the related asset group to future undiscounted net cash flows expected to be generated by that asset group. If the carrying amount of the asset group is not recoverable on an undiscounted cash flow basis, an impairment loss is recognized to the extent that the carrying amount exceeds its estimated fair value.
Leasehold improvements are capitalized and amortized over the lesser of the term of the applicable lease, including renewable periods if reasonably assured, or the useful life of the improvement.
Assets under capital leases where ownership transfers to the Company at the end of the lease term or the lease agreement contains a bargain purchase option are depreciated over the useful life of the asset. For remaining assets under capital leases, the assets are depreciated over the lesser of the term of the applicable lease, including renewable periods if reasonably assured, or the useful life of the asset with consideration of any expected residual value.
Refer to “Note 11: Property, plant and equipment, net” for further information.
Goodwill and intangible assets
Goodwill represents the excess of the aggregate purchase price over the fair value of the net assets acquired in business combinations.
Goodwill is tested for impairment annually on October 1, or between annual tests if an event occurs or circumstances change that would more likely than not reduce the fair value of a reporting unit below its carrying amount. Goodwill is tested for impairment at a reporting unit level using either a qualitative assessment, commonly referred to as a “step zero” test, or a quantitative assessment, commonly referred to as a “step one” test. For each of the reporting units, the Company has the option to perform either the step zero or the step one test.
We elected the step zero test to evaluate goodwill for impairment for each of the reporting units during 2016. The step zero goodwill impairment test utilizes qualitative factors to determine whether it is more likely than not that the fair value of the reporting units is less than its carrying value. Qualitative factors include: macroeconomic conditions; legal and regulatory environment; industry and market considerations; overall financial performance and cost factors to determine whether a reporting unit is at risk for goodwill impairment. In the event a reporting unit fails the step zero goodwill impairment test, it is necessary to perform the step one goodwill impairment test.
In prior years, the Company tested for goodwill impairment at a reporting level using a two-step test. The step one goodwill impairment test compares the estimated fair value of each reporting unit with the reporting unit’s carrying value (including goodwill). If the fair value of the reporting unit is less than its carrying value, an indication of goodwill impairment exists for the reporting unit and the Company must perform step two of the impairment test (measurement). Step two of the impairment test, if
80
necessary, would require the identification and estimation of the fair value of the reporting unit’s individual assets, including currently unrecognized intangible assets and liabilities in order to calculate the implied fair value of the reporting unit’s goodwill. Under step two, an impairment loss is recognized to the extent the carrying amount of the reporting unit’s goodwill exceeds the implied fair value.
Intangible assets consist of customer and producer relationships and contracts, intellectual property trademarks, trade names, non-compete agreements and exclusive distribution rights. Intangible assets have finite lives and are amortized over their respective useful lives of 2 to 20 years. Amortization of intangible assets is based on the pattern in which the economic benefits of the intangible assets are consumed or otherwise used up which is based on the undiscounted cash flows, or when not reliably determined, on a straight-line basis. Intangible assets are tested for impairment if an event occurs or circumstances change that indicates the carrying value may not be recoverable. Refer to “Note 13: Impairment charges” for further information.
Customer relationship intangible assets represent the fair value allocated in purchase price accounting for the ongoing relationships with an existing customer base acquired in a business combination. The fair value of customer relationships is determined using the excess earnings methodology, an income based approach. The excess earnings methodology provides an estimate of the fair value of customer relationship assets by deducting economic costs, including operating expenses and contributory asset charges from revenue expected to be generated by the asset. These estimated cash flows are then discounted to the present value equivalent.
Refer to “Note 12: Goodwill and intangible assets” for further information.
Short-term financing
Short-term financing includes bank overdrafts and short-term lines of credit. Refer to “Note 15: Debt” for further information.
Long-term debt
Long-term debt consists of loans with original maturities greater than one year. Fees paid in connection with the execution of line-of-credit arrangements are included in other assets and fees paid in connection with the execution of a recognized debt liability as a direct deduction from the carrying amount of that debt liability. These fees are amortized using the effective interest method over the term of the related debt or expiration of the line-of-credit arrangement. Refer to “Note 15: Debt” for further information.
Income taxes
The Company is subject to income taxes in the US and numerous foreign jurisdictions. Significant judgment in the forecasting of taxable income using historical and projected future operating results is required in determining the Company’s provision for income taxes and the related assets and liabilities. The provision for income taxes includes income taxes paid, currently payable or receivable and those deferred.
In the event that the actual outcome of future tax consequences differs from the Company’s estimates and assumptions due to changes or future events such as tax legislation, geographic mix of the earnings, completion of tax audits or earnings repatriation plans, the resulting change to the provision for income taxes could have a material effect on the consolidated statement of operations and consolidated balance sheet.
Deferred tax assets and liabilities are determined based on differences between financial reporting and tax basis of assets and liabilities and are measured using enacted tax rates and laws that are expected to be in effect when the differences reverse. Deferred tax assets are also recognized for the estimated future effects of tax loss carryforwards. The effect on deferred taxes of changes in tax rates is recognized in the period in which the revised tax rate is enacted.
The Company records valuation allowances to reduce deferred tax assets to the extent it believes it is more likely than not that a portion of such assets will not be realized. In making such determinations, the Company considers all available positive and negative evidence, including scheduled reversals of deferred tax liabilities, projected future taxable income, tax planning strategies, and the ability to carry back losses to prior years. Realization is dependent upon generating sufficient taxable income prior to expiration of tax attribute carryforwards. Although realization is not assured, management believes it is more likely than not that all of the deferred tax assets will be realized, or if not, a valuation allowance has been recorded. The Company continues to monitor the value of its deferred tax assets, as the amount of the deferred tax assets considered realizable, could be reduced in the near term if estimates of future taxable income during the carryforward periods are reduced, or current tax planning strategies are not implemented.
US GAAP prescribes a recognition threshold and measurement attribute for the accounting and financial statement disclosure of tax positions taken or expected to be taken in a tax return. The evaluation of a tax position is a two-step process. The first step requires the Company to determine whether it is more likely than not that a tax position will be sustained upon examination based on the technical merits of the position. The second step requires the Company to recognize in the financial statements each tax
81
position that meets the more likely than not criteria, measured at the amount of benefit that has a greater than fifty percent likelihood of being realized.
The Company recognizes interest and penalties related to unrecognized tax benefits within interest expense and warehousing, selling and administrative, respectively, in the accompanying consolidated statements of operations. Accrued interest and penalties are included within either other accrued expenses or other long-term liabilities in the consolidated balance sheets.
Refer to “Note 7: Income taxes” for further information.
Pension and other postretirement benefit plans
The Company sponsors several defined benefit and defined contribution plans. The Company’s contributions to defined contribution plans are charged to income during the period of the employee’s service.
The benefit obligation and cost of defined benefit pension plans and other postretirement benefits are calculated based upon actuarial valuations, which involves making assumptions about discount rates, expected rates of return on assets, future salary increases, future health care costs, mortality rates and future pension increases. Due to the long-term nature of these plans, such estimates are subject to significant uncertainty.
The projected benefit obligation is calculated separately for each plan based on the estimated future benefit employees have earned in return for their service based on the employee’s expected date of retirement. Those benefits are discounted to determine the present value of the benefit obligations using the projected unit-credit method. A liability is recognized on the balance sheet for each plan with a projected benefit obligation in excess of plan assets at fair value. An asset is recorded for each plan with plan assets at fair value in excess of the projected benefit obligation.
The Company recognizes the actuarial gains or losses that arise during the period within other operating expenses, net in the consolidated statement of operations. This “mark to market” adjustment is recognized at each December 31. This adjustment primarily includes gains and losses resulting from changes in discount rates and the difference between the expected rate of return on plan assets and actual plan asset returns. Curtailment and settlement gains and losses are recognized in other operating expenses, net in the statement of operations. Curtailment losses must be recognized in the statement of operations when it is probable that a curtailment will occur and its effects are reasonably estimable. However, a curtailment gain is recognized in the statement of operations when the related employees terminate or the plan suspension or amendment is adopted, whichever is applicable. Settlement gains and losses are recognized in the period in which the settlement occurs, regardless of how probable it is at an earlier date that the settlement will occur and despite the fact that the probable gain or loss may be reasonably estimable before the settlement actually takes place. All other components of net periodic benefit cost are classified as warehousing, selling and administrative expenses in the consolidated statements of operations. The Company recognizes prior service costs or credits that arise during the period in other comprehensive loss, and amortizes these items in subsequent periods as components of net periodic benefit cost.
The fair value of plan assets is used to calculate the expected return on assets component of the net periodic benefit cost.
Refer to “Note 8: Employee benefit plans” for further information.
Leases
All leases that are determined not to meet any of the capital lease criteria are classified as operating leases. Operating lease payments are recognized as an expense in the statement of operations on a straight-line basis over the lease term.
The Company leases certain vehicles and equipment that qualify for capital lease classification. Assets under capital leases are carried at historical cost, net of accumulated depreciation and are included in property, plant and equipment, net in the consolidated balance sheet. Depreciation expense related to the capital lease assets is included in depreciation expense in the consolidated statement of operations. Refer to “Note 11: Property, plant and equipment, net” for further information.
The present value of minimum lease payments under a capital lease is included in current portion of long-term debt and long-term debt in the consolidated balance sheet. The capital lease obligation is amortized utilizing the effective interest method and interest expense related to the capital lease obligation is included in interest expense in the consolidated statement of operations. Refer to “Note 19: Commitments and contingencies” for further information.
Contingencies
A loss contingency is recorded if it is probable that an asset has been impaired or a liability has been incurred and the amount of the loss can be reasonably estimated. The Company evaluates, among other factors, the degree of probability of an unfavorable outcome and the ability to make a reasonable estimate of the amount of the ultimate loss. Changes in these factors and related estimates could materially affect the Company’s financial position and results of operations. Legal expenses are recorded as legal services are provided. Refer to “Note 19: Commitments and contingencies” for further information.
82
Environmental liabilities
Environmental contingencies are recognized for probable and reasonably estimable losses associated with environmental remediation. Incremental direct costs of the investigation, remediation effort and post-remediation monitoring are included in the estimated environmental contingencies. Expected cash outflows related to environmental remediation for the next 12 months and amounts for which the timing is uncertain are reported as current within other accrued expenses in the consolidated balance sheets. The long-term portion of environmental liabilities is reported within other long-term liabilities in the consolidated balance sheets on an undiscounted basis, except for sites for which the amount and timing of future cash payments are fixed or reliably determinable. Environmental remediation expenses are included within warehousing, selling and administrative expenses in the consolidated statements of operations, unless associated with disposed operations, in which case such expenses are included in other operating expenses, net.
Environmental costs are capitalized if the costs extend the life of the property, increase its capacity and/or mitigate or prevent contamination from future operations.
Refer to “Note 19: Commitments and contingencies” for further information.
Revenue recognition
The Company recognizes net sales when persuasive evidence of an arrangement exists, delivery of products has occurred or services are provided to customers, the sales price is fixed or determinable and collectability is reasonably assured. Net sales includes product sales, billings for freight and handling charges and fees earned for services provided, net of any discounts, returns, customer rebates and sales or other revenue-based tax. The Company recognizes product sales and billings for freight and handling charges when products are considered delivered to the customer under the terms of the sale. Fee revenues are recognized when services are completed.
The Company’s sales to customers in the agriculture end market, principally in Canada, often provide for a form of inventory protection through credit and re-bill as well as understandings pursuant to which certain price changes from chemical producers may be passed through to the customer. These arrangements require us to make estimates of potential returns of unused chemicals as well as revenue deferral to the extent the sales price is not considered determinable. The estimates used to determine the amount of revenue associated with product likely to be returned are based on past experience adjusted for any current market conditions.
Foreign currency translation
The functional currency of the Company’s subsidiaries is the local currency, unless the primary economic environment requires the use of another currency. Transactions denominated in foreign currencies are translated into the functional currency of each subsidiary at the rate of exchange on the date of transaction. Monetary assets and liabilities denominated in foreign currencies are translated into the functional currency of each subsidiary at period-end exchange rates. These foreign currency transaction gains and losses are recognized in other (expense) income, net in the consolidated statements of operations.
Foreign currency gains and losses relating to intercompany borrowings that are considered a part of the Company’s investment in a foreign subsidiary are reflected as a component of currency translation within accumulated other comprehensive loss in stockholders’ equity. In the years ended December 31, 2016, 2015 and 2014, total foreign currency losses related to such intercompany borrowings were $34.8 million, $11.2 million and $7.1 million, respectively.
Assets and liabilities of foreign subsidiaries are translated into US dollars at period-end exchange rates. Income and expense accounts of foreign subsidiaries are translated at the average exchange rates for the period. The net exchange gains and losses arising on this translation are reflected as a component of currency translation within accumulated other comprehensive loss in stockholders’ equity.
Stock-based compensation plans
The Company measures the total amount of employee stock-based compensation expense for a grant based on the grant date fair value of each award and recognizes the stock-based compensation expense on a straight-line basis over the requisite service period for each separately vesting tranche of an award. Stock-based compensation is based on awards expected to vest and, therefore, has been reduced by estimated forfeitures. Stock-based compensation expense is classified within other operating expenses, net in the consolidated statements of operations. Refer to “Note 9: Stock-based compensation” for further information.
Share repurchases
The Company does not hold any treasury shares as all shares of common stock are retired upon repurchase. Furthermore, when share repurchases occur and the common stock is retired, the excess of repurchase price over par is allocated between additional paid-in capital and accumulated deficit such that the portion allocated to additional paid-in-capital being limited to the additional paid-in-capital created from that particular share issuance (i.e. the book value of those shares) plus any resulting leftover
83
additional paid-in-capital from previous share repurchases in instances where the repurchase price was lower than the original issuance price.
Fair value
Fair value is defined as the price that would be received to sell an asset or paid to transfer a liability in an orderly transaction between market participants at the measurement date. US GAAP specifies a hierarchy of valuation techniques based on whether the inputs to those valuation techniques are observable or unobservable. Observable inputs reflect market data obtained from independent sources, while unobservable inputs reflect the Company’s market assumptions. These two types of inputs have created the following fair-value hierarchy:
Level 1 | Quoted prices for identical instruments in active markets. | |
Level 2 | Quoted prices for similar instruments in active markets; quoted prices for identical or similar instruments in markets that are not active; and model-derived valuation in which all significant inputs and significant value drivers are observable in active markets. | |
Level 3 | Valuations derived from valuation techniques in which one or more significant inputs or significant value drivers are unobservable. | |
When available, the Company uses quoted market prices to determine fair value and classifies such items as Level 1. In cases where a market price is not available, the Company will make use of observable market-based inputs to calculate fair value, in which case the items are classified as Level 2. If quoted or observable market prices are not available, fair value is based upon internally developed valuation techniques that use, where possible, current market-based or independently sourced market information. Items valued using internally generated valuation techniques are classified according to the lowest level input that is significant to the valuation, and may be classified as Level 3 even though there may be significant inputs that are readily observable. Refer to “Note 16: Fair value measurements” for further information.
Certain financial instruments, such as derivative financial instruments, are required to be measured at fair value on a recurring basis. Other financial instruments, such as the Company’s own debt, are not required to be measured at fair value on a recurring basis. The Company elected to not make an irrevocable election to measure financial instruments and certain other items at fair value.
Derivatives
The Company uses derivative financial instruments, such as foreign currency contracts, interest rate swaps and interest rate caps to manage its risks associated with foreign currency and interest rate fluctuations. Derivative financial instruments are recorded in either prepaids and other current assets, other assets, other accrued expenses or other long-term liabilities in the condensed consolidated balance sheets at fair value. The fair value of forward currency contracts is calculated by reference to current forward exchange rates for contracts with similar maturity profiles. The fair value of interest rate swaps is determined by estimating the net present value of amounts to be paid under the agreement offset by the net present value of the expected cash inflows based on market rates and associated yield curves. For derivative contracts with the same counterparty where the Company has a master netting arrangement with the counterparty, the fair value of the asset/liability is presented on a net basis within the consolidated balance sheets. Refer to “Note 16: Fair value measurements” for additional information relating to the gross and net balances of derivative contracts. Changes in the fair value of derivative financial instruments are recognized in the consolidated statements of operations unless specific hedge accounting criteria are met. Cash flows associated with derivative financial instruments are recognized in the operating section of the consolidated statements of cash flows.
For the purpose of hedge accounting, derivatives are classified as either fair value hedges, where the instrument hedges the exposure to changes in the fair value of a recognized asset or liability, or cash flow hedges, where the instrument hedges the exposure to variability in cash flows that are either attributable to a particular risk associated with a recognized asset or liability or a highly probable forecasted transaction. Gains and losses on derivatives that meet the conditions for fair value hedge accounting are recognized immediately in the consolidated statements of operations, along with the offsetting gain or loss on the related hedged item. For derivatives that meet the conditions for cash flow hedge accounting, the effective portion of the gain or loss on the derivative is recognized in accumulated other comprehensive loss on the consolidated balance sheet and the ineffective portion is recognized immediately in other (expense) income, net within the consolidated statement of operations. Amounts in accumulated other comprehensive loss are reclassified to the consolidated statement of operations in the same period in which the hedged transactions affect earnings.
For derivative instruments designated as hedges, the Company formally documents the hedging relationship to the hedged item and its risk management strategy. The Company assesses the effectiveness of its hedging instruments at inception and on an
84
ongoing basis. Hedge accounting is discontinued when the hedging instrument is sold, expired, terminated or exercised, or no longer qualifies for hedge accounting.
Refer to “Note 17: Derivatives” for further information.
Earnings per share
Basic earnings per share is based on the weighted average number of common shares outstanding during each period, which excludes nonvested restricted stock units, nonvested restricted stock, and stock options. Diluted earnings per share is based on the weighted average number of common shares and dilutive common share equivalents outstanding during each period. The Company reflects common share equivalents relating to stock options, nonvested restricted stock, and nonvested restricted stock units in its computation of diluted weighted average shares outstanding unless the effect of inclusion is anti-dilutive. The effect of dilutive securities is calculated using the treasury stock method. Refer to “Note 3: Earnings per share” for further information.
3. Earnings per share
The following table presents the basic and diluted earnings per share computations:
Year ended December 31, | |||||||||||
(in millions, except per share data) | 2016 | 2015 | 2014 | ||||||||
Basic: | |||||||||||
Net (loss) income | $ | (68.4 | ) | $ | 16.5 | $ | (20.1 | ) | |||
Weighted average common shares outstanding | 137.8 | 119.6 | 99.7 | ||||||||
Basic (loss) income per common share | $ | (0.50 | ) | $ | 0.14 | $ | (0.20 | ) | |||
Diluted: | |||||||||||
Net (loss) income | $ | (68.4 | ) | $ | 16.5 | $ | (20.1 | ) | |||
Weighted average common shares outstanding | 137.8 | 119.6 | 99.7 | ||||||||
Effect of dilutive securities: | |||||||||||
Stock compensation plans(1) | — | 0.5 | — | ||||||||
Weighted average common shares outstanding – diluted | 137.8 | 120.1 | 99.7 | ||||||||
Diluted (loss) income per common share | $ | (0.50 | ) | $ | 0.14 | $ | (0.20 | ) | |||
(1) | Stock options to purchase approximately 3.3 million, 2.0 million, and 5.0 million shares of common stock and restricted stock of 0.0 million, 0.0 million, and 0.4 million were outstanding during the years ended December 31, 2016, 2015 and 2014, respectively, but were not included in the calculation of diluted income (loss) per share as the impact of these stock options and restricted stock would have been anti-dilutive. |
4. Other operating expenses, net
Other operating expenses, net consisted of the following items:
Year ended December 31, | |||||||||||
(in millions) | 2016 | 2015 | 2014 | ||||||||
Pension mark to market loss | $ | 68.6 | $ | 21.1 | $ | 117.8 | |||||
Pension curtailment and settlement gains | (1.3 | ) | (4.0 | ) | — | ||||||
Acquisition and integration related expenses | 5.5 | 7.1 | 3.7 | ||||||||
Stock-based compensation expense | 10.4 | 7.5 | 12.1 | ||||||||
Restructuring charges | 8.0 | 33.8 | 46.2 | ||||||||
Advisory fees to CVC and CD&R(1) | — | 2.8 | 5.9 | ||||||||
Contract termination fee to CVC and CD&R | — | 26.2 | — | ||||||||
Other | 13.3 | 11.6 | 11.4 | ||||||||
Total other operating expenses, net | $ | 104.5 | $ | 106.1 | $ | 197.1 | |||||
(1) | Significant stockholders are CVC Capital Partners (“CVC”) and Clayton, Dubilier & Rice, LLC (“CD&R”). |
85
5. Restructuring charges
Restructuring charges relate to the implementation of several regional strategic initiatives aimed at streamlining the Company’s cost structure and improving its operations. These actions primarily resulted in workforce reductions, lease termination costs and other facility rationalization costs. The following table presents cost information related to restructuring plans that have not been completed as of December 31, 2016 and does not contain any estimates for plans that may be developed and implemented in future periods.
(in millions) | USA | Canada | EMEA | ROW | Other | Total | |||||||||||||||||
Anticipated total costs | |||||||||||||||||||||||
Employee termination costs | $ | 16.8 | $ | 5.2 | $ | 21.6 | $ | 4.4 | $ | 5.8 | $ | 53.8 | |||||||||||
Facility exit costs | 22.8 | — | 3.5 | 0.2 | — | 26.5 | |||||||||||||||||
Other exit costs | 1.7 | — | 6.8 | — | 0.8 | 9.3 | |||||||||||||||||
Total | $ | 41.3 | $ | 5.2 | $ | 31.9 | $ | 4.6 | $ | 6.6 | $ | 89.6 | |||||||||||
Incurred to date costs | |||||||||||||||||||||||
Inception of plans through December 31, 2016 | |||||||||||||||||||||||
Employee termination costs | $ | 16.8 | $ | 5.2 | $ | 21.6 | $ | 4.4 | $ | 5.8 | $ | 53.8 | |||||||||||
Facility exit costs | 19.6 | — | 3.5 | 0.2 | — | 23.3 | |||||||||||||||||
Other exit costs | 1.7 | — | 6.8 | — | 0.8 | 9.3 | |||||||||||||||||
Total | $ | 38.1 | $ | 5.2 | $ | 31.9 | $ | 4.6 | $ | 6.6 | $ | 86.4 | |||||||||||
Inception of plans through December 31, 2015 | |||||||||||||||||||||||
Employee termination costs | $ | 16.4 | $ | 4.1 | $ | 25.6 | $ | 2.0 | $ | 5.3 | $ | 53.4 | |||||||||||
Facility exit costs | 14.0 | — | 3.1 | 0.2 | — | 17.3 | |||||||||||||||||
Other exit costs | 1.7 | — | 6.7 | — | 0.8 | 9.2 | |||||||||||||||||
Total | $ | 32.1 | $ | 4.1 | $ | 35.4 | $ | 2.2 | $ | 6.1 | $ | 79.9 | |||||||||||
The following tables summarize activity related to accrued liabilities associated with redundancy and restructuring:
(in millions) | January 1, 2016 | Charge to earnings | Cash paid | Non-cash and other | December 31, 2016 | ||||||||||||||
Employee termination costs | $ | 31.0 | $ | 0.4 | $ | (24.5 | ) | $ | — | $ | 6.9 | ||||||||
Facility exit costs | 15.5 | 6.0 | (8.3 | ) | — | 13.2 | |||||||||||||
Other exit costs | 0.1 | 0.1 | (0.2 | ) | — | — | |||||||||||||
Total | $ | 46.6 | $ | 6.5 | $ | (33.0 | ) | $ | — | $ | 20.1 | ||||||||
(in millions) | January 1, 2015 | Charge to earnings | Cash paid | Non-cash and other | December 31, 2015 | ||||||||||||||
Employee termination costs | $ | 27.8 | $ | 28.3 | $ | (22.9 | ) | $ | (2.2 | ) | $ | 31.0 | |||||||
Facility exit costs | 20.4 | 2.4 | (7.2 | ) | (0.1 | ) | 15.5 | ||||||||||||
Other exit costs | 0.3 | 3.0 | (3.2 | ) | — | 0.1 | |||||||||||||
Total | $ | 48.5 | $ | 33.7 | $ | (33.3 | ) | $ | (2.3 | ) | $ | 46.6 | |||||||
Restructuring liabilities of $10.1 million and $34.5 million were classified as current in other accrued expenses in the consolidated balance sheets as of December 31, 2016 and 2015, respectively. The long-term portion of restructuring liabilities of $10.0 million and $12.1 million were recorded in other long-term liabilities in the consolidated balance sheets as of December 31, 2016 and 2015, respectively and primarily consists of facility exit costs that are expected to be paid within the next five years.
While the Company believes the recorded restructuring liabilities are adequate, revisions to current estimates may be recorded in future periods based on new information as it becomes available.
86
6. Other (expense) income, net
Other (expense) income, net consisted of the following gains (losses):
Year ended December 31, | |||||||||||
(in millions) | 2016 | 2015 | 2014 | ||||||||
Foreign currency transactions | $ | (0.6 | ) | $ | (0.8 | ) | $ | (0.6 | ) | ||
Foreign currency denominated loans revaluation | (13.7 | ) | 8.9 | 8.3 | |||||||
Undesignated foreign currency derivative instruments(1) | (1.8 | ) | (4.8 | ) | (3.9 | ) | |||||
Undesignated interest rate swap contracts(1) | 10.1 | 2.0 | — | ||||||||
Ineffective portion of cash flow hedges(1) | — | (0.4 | ) | 0.2 | |||||||
Loss due to discontinuance of cash flow hedges(1) | — | (7.5 | ) | — | |||||||
Debt refinancing costs(2) | — | (16.5 | ) | — | |||||||
Other | (0.1 | ) | (4.1 | ) | (2.9 | ) | |||||
Total other (expense) income, net | $ | (6.1 | ) | $ | (23.2 | ) | $ | 1.1 | |||
(1) | Refer to “Note 17: Derivatives” for more information. |
(2) | Refer to “Note 15: Debt” for more information. |
7. Income taxes
For financial reporting purposes, income (loss) before income taxes includes the following components:
Year ended December 31, | |||||||||||
(in millions) | 2016 | 2015 | 2014 | ||||||||
Income (loss) before income taxes | |||||||||||
United States | $ | (131.3 | ) | $ | (13.0 | ) | $ | (6.4 | ) | ||
Foreign | 51.7 | 39.7 | (29.5 | ) | |||||||
Total income (loss) before income taxes | $ | (79.6 | ) | $ | 26.7 | $ | (35.9 | ) | |||
The expense (benefit) for income taxes is summarized as follows:
Year ended December 31, | |||||||||||
(in millions) | 2016 | 2015 | 2014 | ||||||||
Current: | |||||||||||
Federal | $ | (0.1 | ) | $ | 0.6 | $ | (18.6 | ) | |||
State | 0.1 | 2.5 | 5.4 | ||||||||
Foreign | 20.4 | 14.5 | 17.0 | ||||||||
Total current | 20.4 | 17.6 | 3.8 | ||||||||
Deferred: | |||||||||||
Federal | (15.1 | ) | (12.3 | ) | (11.3 | ) | |||||
State | (3.0 | ) | 1.7 | (1.0 | ) | ||||||
Foreign | (13.5 | ) | 3.2 | (7.3 | ) | ||||||
Total deferred | (31.6 | ) | (7.4 | ) | (19.6 | ) | |||||
Total income tax expense (benefit) | $ | (11.2 | ) | $ | 10.2 | $ | (15.8 | ) | |||
87
The reconciliation between the US statutory tax rate and the Company’s effective tax rate is presented as follows:
Year ended December 31, | |||||||||||
(in millions) | 2016 | 2015 | 2014 | ||||||||
US federal statutory income tax expense (benefit) applied to income (loss) before income taxes | $ | (27.8 | ) | $ | 9.3 | $ | (12.6 | ) | |||
State income taxes, net of federal benefit | (2.9 | ) | 3.3 | 1.8 | |||||||
Foreign tax rate differential | (5.8 | ) | (6.5 | ) | (4.2 | ) | |||||
Non-taxable interest income | (10.8 | ) | (14.1 | ) | (13.8 | ) | |||||
Valuation allowance release on expired or utilized tax attributes | (24.7 | ) | (9.0 | ) | (0.2 | ) | |||||
Expiration of tax attributes | 4.4 | 8.1 | 0.2 | ||||||||
Foreign losses not benefited | 8.0 | 7.5 | 21.7 | ||||||||
Effect of flow-through entities | (9.0 | ) | 4.2 | 3.6 | |||||||
Non-deductible stock-based compensation | 1.7 | 3.5 | 0.3 | ||||||||
Non-deductible expense | 3.4 | 3.5 | 2.9 | ||||||||
Recognition of previously uncertain tax benefits | (1.4 | ) | (2.5 | ) | (18.4 | ) | |||||
Adjustment to prior year tax due to changes in estimates | 0.3 | 1.6 | 0.2 | ||||||||
Change in statutory income tax rates | 2.7 | 1.1 | 0.4 | ||||||||
Deemed dividends from foreign subsidiaries | 1.4 | 0.6 | 0.4 | ||||||||
Non-deductible interest expense | 2.6 | 0.5 | 1.1 | ||||||||
Withholding and other taxes based on income | 0.5 | 0.5 | 0.9 | ||||||||
Foreign exchange rate remeasurement | (1.0 | ) | (0.4 | ) | 0.7 | ||||||
Revaluation due to Section 987 tax law change | 45.0 | — | — | ||||||||
Other | 2.2 | (1.0 | ) | (0.8 | ) | ||||||
Total income tax expense (benefit) | $ | (11.2 | ) | $ | 10.2 | $ | (15.8 | ) | |||
88
The consolidated deferred tax assets and liabilities are detailed as follows:
December 31, | |||||||
(in millions) | 2016 | 2015 | |||||
Deferred tax assets: | |||||||
Net operating loss carryforwards | $ | 124.1 | $ | 122.1 | |||
Environmental reserves | 40.2 | 46.4 | |||||
Interest | 93.8 | 95.1 | |||||
Tax credit and capital loss carryforwards | 4.5 | 10.1 | |||||
Pension | 105.4 | 95.9 | |||||
Flow-through entities | 15.6 | 39.4 | |||||
Stock options | 11.4 | 11.7 | |||||
Inventory | 8.7 | 5.0 | |||||
Other temporary differences | 17.8 | 33.8 | |||||
Gross deferred tax assets | 421.5 | 459.5 | |||||
Valuation allowance | (167.9 | ) | (193.0 | ) | |||
Deferred tax assets, net of valuation allowance | 253.6 | 266.5 | |||||
Deferred tax liabilities: | |||||||
Property, plant and equipment, net | (165.2 | ) | (179.0 | ) | |||
Intangible assets | (85.3 | ) | (138.1 | ) | |||
Other temporary differences | (2.1 | ) | (3.9 | ) | |||
Deferred tax liabilities | (252.6 | ) | (321.0 | ) | |||
Net deferred tax asset (liability) | $ | 1.0 | $ | (54.5 | ) | ||
The changes in the valuation allowance were as follows:
December 31, | |||||||
(in millions) | 2016 | 2015 | |||||
Beginning balance | $ | 193.0 | $ | 204.1 | |||
Increase related to current foreign net operating losses | 5.3 | 9.2 | |||||
Decrease related to utilization of net operating loss carryforwards | (20.6 | ) | (2.5 | ) | |||
Decrease related to expiration of tax attributes | (4.5 | ) | (7.6 | ) | |||
Foreign currency | (4.6 | ) | (9.8 | ) | |||
Decrease related to other items | (0.7 | ) | (0.4 | ) | |||
Ending balance | $ | 167.9 | $ | 193.0 | |||
As of December 31, 2016, the total remaining tax benefit of available federal, state and foreign net operating loss carryforwards recognized on the balance sheet amounted to $55.5 million (tax benefit of operating losses of $124.1 million reduced by a valuation allowance of $68.5 million). Total net operating losses at December 31, 2016 and 2015 amounted to $415.1 million and $428.3 million, respectively. If not utilized, $92.7 million of the available loss carryforwards will expire between 2017 and 2021; subsequent to 2021, $127.8 million will expire. The remaining losses of $194.6 million have an unlimited life.
The U.S. federal and certain state net operating loss carryforwards are subject to limitations under Section 382 of the Internal Revenue Code (“the Code”) and applicable state tax law. Under Section 382, the Company is required to track whether it experiences an ownership change within the meaning of Section 382 of the Code. Generally, an ownership change occurs if a loss corporation experiences a cumulative owner shift of more than 50% over a three year period. On August 18, 2016, Univar’s majority shareholder, Univar, N.V., sold a portion of its interest in Univar. This disposition by Univar, N.V., in combination with various ownership shifts occurring during the three year testing period (including Univar’s initial public offering on June 23, 2015) caused an ownership change within the meaning of Section 382. The ownership change subjects the Company's U.S. federal and certain state net operating loss carryforwards to an annual limitation. It has been determined that the annual Section 382 limitation is large enough that it should not limit the Company’s ability to offset future taxable income. Accordingly, the Company believes there is no impact on the consolidated financial statements.
89
As the result of intercompany dividend payments from Canada to the US in prior years, the Company had unused carryforward foreign tax credits as of December 31, 2015 of $3.9 million. These unused foreign tax credits were subject to a ten-year carryforward life. As of December 31, 2016, all carryforward foreign tax credits have expired.
Except as required under US tax law, the Company does not provide for US taxes on approximately $676.0 million of cumulative undistributed earnings of foreign subsidiaries that have not been previously taxed since the Company intends to invest such undistributed earnings indefinitely outside of the US. Determination of the unrecognized deferred tax liability that would be incurred if such amounts were not indefinitely reinvested is not practicable.
The changes in unrecognized tax benefits included in other long-term liabilities, excluding interest and penalties, are as follows:
Year ended December 31, | |||||||
(in millions) | 2016 | 2015 | |||||
Beginning balance | $ | 5.2 | $ | 8.5 | |||
Increase for tax positions of prior years | 0.4 | — | |||||
Reductions due to the statute of limitations expiration | (1.3 | ) | (2.3 | ) | |||
Foreign exchange | — | (1.0 | ) | ||||
Ending balance | $ | 4.3 | $ | 5.2 | |||
The Company’s unrecognized tax benefit consists largely of foreign interest expense liabilities as of December 31, 2016. The Company believes that it is reasonably possible that approximately $1.5 million of its currently remaining unrecognized tax benefits may be recognized by the end of 2017 as a result of an audit or a lapse of the statute of limitations.
The Company has net $4.3 million and $5.2 million of unrecognized tax benefits at December 31, 2016 and 2015, respectively. As of December 31, 2016, the total amount of unrecognized tax benefits that, if recognized, would affect the effective tax rate for continuing and discontinued operations was $4.3 million. No remaining unrecognized tax benefits relate to tax positions for which ultimate deductibility is highly certain, but for which there is uncertainty as to the timing of such deductibility. Recognition of these tax benefits, if any, would not have an impact on the effective tax rate.
The total liability included in other long-term liabilities associated with the interest and penalties was $0.3 million and $0.0 million at December 31, 2016 and 2015, respectively. The Company recorded $0.3 million, $(0.6) million and $0.1 million in interest expense related to unrecognized tax benefits in the consolidated statements of operations for the years ended December 31, 2016, 2015 and 2014, respectively.
The Company files income tax returns in the US and various state and foreign jurisdictions. As of December 31, 2016, the Company’s tax years for 2013 through 2015 are subject to examination by the tax authorities. With limited exceptions or limitations on adjustment due to net operating loss carrybacks or utilization, as of December 31, 2016, the Company generally is no longer subject to US federal, state, local or foreign examinations by tax authorities for years before 2013.
In 2007, the outstanding shares of Univar N.V., the ultimate public company parent of the Univar group at that time, were acquired by investment funds advised by CVC. To facilitate the acquisition and leveraged financing of Univar N.V. by CVC, a restructuring of some of the companies in the Univar group, including its Canadian operating company, was completed (the “Restructuring”). In February 2013, the Canada Revenue Agency (“CRA”) issued a Notice of Assessment, asserting the General Anti-Avoidance Rule (“GAAR”) against the Company’s subsidiary Univar Holdco Canada ULC (“Univar Holdco”) for withholding tax of $29.4 million (Canadian), relating to this Restructuring. Univar Holdco appealed the assessment, and the matter was litigated in the Tax Court of Canada in June 2015. On June 22, 2016, the Tax Court of Canada issued its judgment in favor of the CRA. The Company strongly disagrees with the decision of the Tax Court of Canada and filed its appeal to the Canadian Federal Court of Appeal on June 30, 2016. The Company filed its Memorandum of Fact and Law with the Canadian Court of Appeal on October 6, 2016 and the Respondent's Memorandum of Fact and Law was filed on November 21, 2016. A $44.7 million (Canadian) Letter of Credit, covering the initial assessment of $29.4 million (Canadian) and interest of $15.3 million (Canadian), has been issued with respect to this assessment. The Letter of Credit amount was amended in December 2016 to $52.1 million (Canadian) to include $7.4 million (Canadian) in accrued interest.
In September 2014, also relating to the Restructuring, the CRA issued the 2008 and 2009 Notice of Reassessments for federal corporate income tax liabilities of $11.9 million (Canadian) and $11.0 million (Canadian), respectively, and a departure tax liability of $9.0 million (Canadian). Likewise, in April 2015, the Company’s subsidiary received the 2008 and 2009 Alberta Notice of Reassessments of $6.0 million (Canadian) and $5.8 million (Canadian), respectively. These Reassessments reflect the additional tax liability and interest relating to those tax years should the CRA be successful in its assertion of the GAAR relating to the Restructuring described above.
90
In September 2016, the CRA notified the Company that it agreed to accept security on the above reassessed federal amounts in the form of a Letter of Credit and subsequently the Company requested that it refrain from further collection efforts related to this assessment until the outcome of the appeal of the GAAR matter is concluded. The CRA denied the Company's request, and the Company initiated a review of the matter at the Canada Federal Court in January 2017. The Company expects a decision on the matter in mid-2017.
At December 31, 2016, the total Canadian federal and provincial tax liability assessed related to these matters, inclusive of interest of $38.7 million (Canadian), is $111.8 million (Canadian). The Company has not recorded any liabilities for these matters in its financial statements, as it believes it is more likely than not that the ruling will be reversed on appeal and the Company’s position will be sustained.
8. Employee benefit plans
Defined benefit pension plans
The Company sponsors defined benefit plans that provide pension benefits for employees upon retirement in certain jurisdictions including the US, Canada, United Kingdom and several other European countries.
On July 1, 2015, the defined benefit plan in Canada was amended, such that the remaining members accruing benefits under the defined benefit provisions ceased future accrual of credited service under the defined benefit provision. These members commenced participation under a defined contribution benefit plan for service as of July 1, 2015. Future salary increases will continue to be reflected in their legacy defined pension benefits for the foreseeable future.
The US, Canada and United Kingdom defined benefit pension plans are closed to new entrants. Benefits accrued by participants in the United Kingdom plan were frozen as of December 1, 2010. Benefits accrued by participants in the US plans were frozen as of December 31, 2009. These amendments to freeze benefits were made in conjunction with a benefit plan review which provides for enhanced benefits under defined contribution plans available to all employees in the United Kingdom and the US.
91
The following summarizes the Company’s defined benefit pension plans’ projected benefit obligations, plan assets and funded status:
Domestic | Foreign | Total | |||||||||||||||||||||
Year ended December 31, | Year ended December 31, | Year ended December 31, | |||||||||||||||||||||
(in millions) | 2016 | 2015 | 2016 | 2015 | 2016 | 2015 | |||||||||||||||||
Change in projected benefit obligations: | |||||||||||||||||||||||
Actuarial present value of benefit obligations at beginning of year | $ | 691.9 | $ | 728.8 | $ | 531.7 | $ | 614.1 | $ | 1,223.6 | $ | 1,342.9 | |||||||||||
Service cost | — | — | 2.5 | 5.4 | 2.5 | 5.4 | |||||||||||||||||
Interest cost | 32.0 | 30.8 | 18.3 | 20.1 | 50.3 | 50.9 | |||||||||||||||||
Benefits paid | (32.1 | ) | (30.1 | ) | (23.9 | ) | (29.6 | ) | (56.0 | ) | (59.7 | ) | |||||||||||
Plan amendments | — | — | (1.6 | ) | — | (1.6 | ) | — | |||||||||||||||
Settlement | — | — | — | (19.0 | ) | — | (19.0 | ) | |||||||||||||||
Curtailment | — | — | (1.3 | ) | (2.6 | ) | (1.3 | ) | (2.6 | ) | |||||||||||||
Actuarial loss (gain) | 27.9 | (37.6 | ) | 86.1 | (5.1 | ) | 114.0 | (42.7 | ) | ||||||||||||||
Foreign exchange and other | — | — | (56.3 | ) | (51.6 | ) | (56.3 | ) | (51.6 | ) | |||||||||||||
Actuarial present value of benefit obligations at end of year | $ | 719.7 | $ | 691.9 | $ | 555.5 | $ | 531.7 | $ | 1,275.2 | $ | 1,223.6 | |||||||||||
Change in the fair value of plan assets: | |||||||||||||||||||||||
Plan assets at beginning of year | $ | 497.6 | $ | 522.1 | $ | 481.5 | $ | 516.6 | $ | 979.1 | $ | 1,038.7 | |||||||||||
Actual return on plan assets | 40.1 | (13.9 | ) | 66.3 | 12.6 | 106.4 | (1.3 | ) | |||||||||||||||
Contributions by employer | 3.5 | 19.5 | 28.1 | 40.1 | 31.6 | 59.6 | |||||||||||||||||
Benefits paid | (32.1 | ) | (30.1 | ) | (23.9 | ) | (29.6 | ) | (56.0 | ) | (59.7 | ) | |||||||||||
Settlement | — | — | — | (17.6 | ) | — | (17.6 | ) | |||||||||||||||
Foreign exchange and other | — | — | (57.7 | ) | (40.6 | ) | (57.7 | ) | (40.6 | ) | |||||||||||||
Plan assets at end of year | 509.1 | 497.6 | 494.3 | 481.5 | 1,003.4 | 979.1 | |||||||||||||||||
Funded status at end of year | $ | (210.6 | ) | $ | (194.3 | ) | $ | (61.2 | ) | $ | (50.2 | ) | $ | (271.8 | ) | $ | (244.5 | ) | |||||
Net amounts related to the Company’s defined benefit pension plans recognized in the consolidated balance sheets consist of:
Domestic | Foreign | Total | |||||||||||||||||||||
December 31, | December 31, | December 31, | |||||||||||||||||||||
(in millions) | 2016 | 2015 | 2016 | 2015 | 2016 | 2015 | |||||||||||||||||
Overfunded net benefit obligation in other assets | $ | — | $ | — | $ | — | $ | 9.5 | $ | — | $ | 9.5 | |||||||||||
Current portion of net benefit obligation in other accrued expenses | (3.6 | ) | (3.3 | ) | (1.9 | ) | (1.9 | ) | (5.5 | ) | (5.2 | ) | |||||||||||
Long-term portion of net benefit obligation in pension and other postretirement benefit liabilities | (207.0 | ) | (191.0 | ) | (59.3 | ) | (57.8 | ) | (266.3 | ) | (248.8 | ) | |||||||||||
Net liability recognized at end of year | $ | (210.6 | ) | $ | (194.3 | ) | $ | (61.2 | ) | $ | (50.2 | ) | $ | (271.8 | ) | $ | (244.5 | ) | |||||
The following table summarizes defined benefit pension plans with accumulated benefit obligations in excess of plan assets:
Domestic | Foreign | Total | |||||||||||||||||||||
December 31, | December 31, | December 31, | |||||||||||||||||||||
(in millions) | 2016 | 2015 | 2016 | 2015 | 2016 | 2015 | |||||||||||||||||
Accumulated benefit obligation | $ | 719.7 | $ | 691.9 | $ | 412.5 | $ | 71.4 | $ | 1,132.2 | $ | 763.3 | |||||||||||
Fair value of plan assets | 509.1 | 497.6 | 379.5 | 36.3 | 888.6 | 533.9 | |||||||||||||||||
92
The following table summarizes defined benefit pension plans with projected benefit obligations in excess of plan assets:
Domestic | Foreign | Total | |||||||||||||||||||||
December 31, | December 31, | December 31, | |||||||||||||||||||||
(in millions) | 2016 | 2015 | 2016 | 2015 | 2016 | 2015 | |||||||||||||||||
Projected benefit obligation | $ | 719.7 | $ | 691.9 | $ | 555.5 | $ | 207.7 | $ | 1,275.2 | $ | 899.6 | |||||||||||
Fair value of plan assets | 509.1 | 497.6 | 494.3 | 148.0 | 1,003.4 | 645.6 | |||||||||||||||||
The total accumulated benefit obligation for domestic defined benefit pension plans as of December 31, 2016 and 2015 was $719.7 million and $691.9 million, respectively, and for foreign defined benefit pension benefit plans as of December 31, 2016 and 2015 was $524.4 million and $505.2 million, respectively.
The following table summarizes the components of net periodic benefit cost (credit) recognized in the consolidated statements of operations related to defined benefit pension plans:
Domestic | Foreign | Total | |||||||||||||||||||||||||||||||||
Year ended December 31, | Year ended December 31, | Year ended December 31, | |||||||||||||||||||||||||||||||||
(in millions) | 2016 | 2015 | 2014 | 2016 | 2015 | 2014 | 2016 | 2015 | 2014 | ||||||||||||||||||||||||||
Service cost | $ | — | $ | — | $ | — | $ | 2.5 | $ | 5.4 | $ | 7.0 | $ | 2.5 | $ | 5.4 | $ | 7.0 | |||||||||||||||||
Interest cost | 32.0 | 30.8 | 31.6 | 18.3 | 20.1 | 23.2 | 50.3 | 50.9 | 54.8 | ||||||||||||||||||||||||||
Expected return on plan assets | (32.5 | ) | (35.8 | ) | (32.1 | ) | (28.7 | ) | (30.2 | ) | (28.1 | ) | (61.2 | ) | (66.0 | ) | (60.2 | ) | |||||||||||||||||
Settlement(1) | — | — | (1.4 | ) | — | — | (1.4 | ) | — | ||||||||||||||||||||||||||
Curtailment(1) | — | — | — | (1.3 | ) | (2.6 | ) | — | (1.3 | ) | (2.6 | ) | — | ||||||||||||||||||||||
Actuarial loss | 20.3 | 12.1 | 84.3 | 48.5 | 12.5 | 35.2 | 68.8 | 24.6 | 119.5 | ||||||||||||||||||||||||||
Net periodic benefit cost | $ | 19.8 | $ | 7.1 | $ | 83.8 | $ | 39.3 | $ | 3.8 | $ | 37.3 | $ | 59.1 | $ | 10.9 | $ | 121.1 | |||||||||||||||||
(1) | The settlement and curtailment gains are a result of the restructuring activities in the EMEA segment. |
The following summarizes pre-tax amounts included in accumulated other comprehensive loss at December 31, 2016 related to pension plan amendments:
(in millions) | Defined benefit pension plans | ||
Net prior service credit | $ | 1.6 | |
The following table summarizes the amounts in accumulated other comprehensive loss at December 31, 2016 that are expected to be amortized as components of net periodic benefit credit during the next fiscal year related to pension amendments:
(in millions) | Defined benefit pension plans | ||
Prior service credit | $ | 0.2 | |
Other postretirement benefit plan
Other postretirement benefits relate to a health care plan for retired employees in the US. In 2009, the Company approved a plan to phase out the benefits provided under this plan by 2020. As a result of this change, the benefit obligation was reduced by $76.8 million and a curtailment gain of $73.1 million was recognized in accumulated other comprehensive loss and was being amortized to the consolidated statements of operations over the average future service period, which is fully amortized as of December 31, 2016.
93
The following summarizes the Company’s other postretirement benefit plan’s accumulated postretirement benefit obligation, plan assets and funded status:
Other postretirement benefits | |||||||
Year ended December 31, | |||||||
(in millions) | 2016 | 2015 | |||||
Change in accumulated postretirement benefit obligations: | |||||||
Actuarial present value of benefit obligations at beginning of year | $ | 3.4 | $ | 6.7 | |||
Service cost | — | 0.1 | |||||
Interest cost | 0.1 | 0.2 | |||||
Contributions by participants | 0.3 | 0.5 | |||||
Benefits paid | (0.8 | ) | (0.6 | ) | |||
Actuarial gain | (0.2 | ) | (3.5 | ) | |||
Actuarial present value of benefit obligations at end of year | $ | 2.8 | $ | 3.4 | |||
Change in the fair value of plan assets: | |||||||
Plan assets at beginning of year | $ | — | $ | — | |||
Contributions by employer | 0.5 | 0.1 | |||||
Contributions by participants | 0.3 | 0.5 | |||||
Benefits paid | (0.8 | ) | (0.6 | ) | |||
Plan assets at end of year | — | — | |||||
Funded status at end of year | $ | (2.8 | ) | $ | (3.4 | ) | |
Net amounts related to the Company’s other postretirement benefit plan recognized in the consolidated balance sheets consist of:
Other postretirement benefits | |||||||
December 31, | |||||||
(in millions) | 2016 | 2015 | |||||
Current portion of net benefit obligation in other accrued expenses | $ | (0.5 | ) | $ | (0.4 | ) | |
Long-term portion of net benefit obligation in pension and other postretirement benefit liabilities | (2.3 | ) | (3.0 | ) | |||
Net liability recognized at end of year | $ | (2.8 | ) | $ | (3.4 | ) | |
The following table summarizes the components of net periodic benefit credit recognized in the consolidated statements of operations related to other postretirement benefit plans:
Other postretirement benefits | |||||||||||
Year ended December 31, | |||||||||||
(in millions) | 2016 | 2015 | 2014 | ||||||||
Service cost | $ | — | $ | (0.1 | ) | $ | (0.1 | ) | |||
Interest cost | (0.1 | ) | (0.2 | ) | (0.4 | ) | |||||
Amortization of unrecognized prior service credits | 4.5 | 11.9 | 11.9 | ||||||||
Actuarial gain | 0.2 | 3.5 | 1.7 | ||||||||
Net periodic benefit credit | $ | 4.6 | $ | 15.1 | $ | 13.1 | |||||
The following summarizes pre-tax amounts included in accumulated other comprehensive loss related to other postretirement benefit plans:
Other postretirement benefits | |||||||
December 31, | |||||||
(in millions) | 2016 | 2015 | |||||
Net prior service credit | $ | — | $ | 4.5 | |||
94
Actuarial assumptions
Defined benefit pension plans
The significant weighted average actuarial assumptions used in determining the benefit obligations and net periodic benefit cost (credit) for the Company’s defined benefit plans are as follows:
Domestic | Foreign | ||||||||||
December 31, | December 31, | ||||||||||
2016 | 2015 | 2016 | 2015 | ||||||||
Actuarial assumptions used to determine benefit obligations at end of period: | |||||||||||
Discount rate | 4.39 | % | 4.74 | % | 2.84 | % | 4.25 | % | |||
Expected annual rate of compensation increase | N/A | N/A | 2.87 | % | 2.86 | % | |||||
Domestic | Foreign | ||||||||||||||||
Year ended December 31, | Year ended December 31, | ||||||||||||||||
2016 | 2015 | 2014 | 2016 | 2015 | 2014 | ||||||||||||
Actuarial assumptions used to determine net periodic benefit cost (credit) for the period: | |||||||||||||||||
Discount rate | 4.74 | % | 4.31 | % | 5.25 | % | 3.65 | % | 3.51 | % | 4.29 | % | |||||
Expected rate of return on plan assets | 7.50 | % | 7.50 | % | 7.50 | % | 6.18 | % | 6.07 | % | 6.06 | % | |||||
Expected annual rate of compensation increase | N/A | N/A | N/A | 2.86 | % | 2.80 | % | 2.82 | % | ||||||||
Discount rates are used to measure benefit obligations and the interest cost component of net periodic benefit cost (credit). The Company selects its discount rates based on the consideration of equivalent yields on high-quality fixed income investments at each measurement date. Discount rates are based on a benefit cash flow-matching approach and represent the rates at which the Company’s benefit obligations could effectively be settled as of the measurement date.
For domestic defined benefit plans, the discount rates are based on a hypothetical bond portfolio approach. The hypothetical bond portfolio is constructed to comprise AA-rated corporate bonds whose cash flow from coupons and maturities match the expected future plan benefit payments.
The discount rate for the foreign defined benefit plans are based on a yield curve approach. For plans in countries with a sufficient corporate bond market, the expected future benefit payments are matched with a yield curve derived from AA-rated corporate bonds, subject to minimum amounts outstanding and meeting other selection criteria. For plans in countries without a sufficient corporate bond market, the yield curve is constructed based on prevailing government yields and an estimated credit spread to reflect a corporate risk premium.
The expected long-term rate of return on plan assets reflects management’s expectations on long-term average rates of return on funds invested to provide for benefits included in the benefit obligations. The long-term rate of return assumptions are based on the outlook for equity and fixed income returns, with consideration of historical returns, asset allocations, investment strategies and premiums for active management when appropriate. Assumptions reflect the expected rates of return at the beginning of the year.
The Company adopted new US mortality tables in the year ended December 31, 2014 for purposes of determining the Company’s mortality assumption used in the US defined benefit plans’ liability calculation. The new assumptions considered the Society of Actuary’s recent mortality experience study and reflect a version of the table and future improvements produced. The updated mortality assumption resulted in an increase of approximately $32.0 million or 4.5% to the benefit obligation as of December 31, 2014 after reflecting the discount rate change.
Other postretirement benefit plan
For the other postretirement benefit plan, the discount rate used to determine the benefit obligation at December 31, 2016 and 2015 was 4.37% and 4.54%, respectively. The discount rate used to determine net periodic benefit credit for the year ended December 31, 2016, 2015 and 2014 was 4.54%, 3.80% and 4.02%, respectively. Health care cost increases did not have a significant impact on the Company’s postretirement benefit obligations in the years presented as a result of the 2009 plan to phase out the health care benefits provided under the US plan.
95
Plan assets
Plan assets for defined benefit plans are invested in global equity and debt securities through professional investment managers with the objective to achieve targeted risk adjusted returns and to maintain liquidity sufficient to fund current benefit payments. Each funded defined benefit plan has an investment policy that is administered by plan trustees with the objective of meeting targeted asset allocations based on the circumstances of that particular plan. The investment strategy followed by the Company varies by country depending on the circumstances of the underlying plan. Less mature plan benefit obligations are funded by using more equity securities as they are expected to achieve long-term growth while exceeding inflation. More mature plan benefit obligations are funded using a higher allocation of fixed income securities as they are expected to produce current income with limited volatility. The Company has adopted a dynamic investment strategy whereby as the plan funded status improves, the investment strategy is migrated to more liability matching assets, and return seeking assets are reduced. Risk management practices include the use of multiple asset classes for diversification purposes. Specific guidelines for each asset class and investment manager are implemented and monitored.
The weighted average target asset allocation for defined benefit pension plans in the year ended December 31, 2016 is as follows:
Domestic | Foreign | ||||
Asset category: | |||||
Equity securities | 50.0 | % | 35.9 | % | |
Debt securities | 45.0 | % | 52.9 | % | |
Other | 5.0 | % | 11.2 | % | |
Total | 100.0 | % | 100.0 | % | |
Plan asset valuation methodologies are described below:
Fair value methodology | Description |
Cash | This represents cash at banks. The amount of cash in the bank account represents the fair value. |
Investment funds | Values are based on the net asset value of the units held at year end. The net asset values are based on the fair value of the underlying assets of the funds, minus their liabilities, and then divided by the number of units outstanding at the valuation date. The funds are traded on private markets that are not active; however, the unit price is based primarily on observable market data of the fund’s underlying assets. |
Insurance contracts | The fair value is based on the present value of the accrued benefit. |
Domestic defined benefit plan assets
The Company classified its domestic plan assets according to the fair value hierarchy described in “Note 2: Significant accounting policies.” The following summarizes the fair value of domestic plan assets by asset category and level within the fair value hierarchy.
December 31, 2016 | |||||||||||
(in millions) | Total | Level 1 | Level 2 | ||||||||
Cash | $ | 2.4 | $ | 2.4 | $ | — | |||||
Investments funds(1) | 506.7 | — | 506.7 | ||||||||
Total | $ | 509.1 | $ | 2.4 | $ | 506.7 | |||||
(1) | This category includes investments in 30.0% in US equities, 20.0% in non-US equities, 44.9% in US corporate bonds and 5.1% in other investments. |
December 31, 2015 | |||||||||||
(in millions) | Total | Level 1 | Level 2 | ||||||||
Cash | $ | 2.3 | $ | 2.3 | $ | — | |||||
Investments funds(1) | 495.3 | — | 495.3 | ||||||||
Total | $ | 497.6 | $ | 2.3 | $ | 495.3 | |||||
(1) | This category includes investments in 30.3% in US equities, 19.6% in non-US equities, 45.1% in US corporate bonds and 5.0% in other investments. |
96
Foreign defined benefit plan assets
The Company classified its foreign plan assets according to the fair value hierarchy described in “Note 2: Significant accounting policies.” The following summarizes the fair value of foreign plan assets by asset category and level within the fair value hierarchy:
December 31, 2016 | |||||||||||||||
(in millions) | Total | Level 1 | Level 2 | Level 3 | |||||||||||
Cash | $ | 4.6 | $ | 4.6 | $ | — | $ | — | |||||||
Investments: | |||||||||||||||
Investment funds(1) | 474.1 | — | 474.1 | — | |||||||||||
Insurance contracts | 15.6 | — | — | 15.6 | |||||||||||
Total investments | 489.7 | — | 474.1 | 15.6 | |||||||||||
Total | $ | 494.3 | $ | 4.6 | $ | 474.1 | $ | 15.6 | |||||||
(1) | This category includes investments in 8.4% in US equities, 30.2% in non-US equities, 2.8% in US corporate bonds, 24.0% in non-US corporate bonds, 0.3% in US government bonds, 25.9% in non-US government bonds and 8.4% in other investments. |
The following table presents changes in the foreign plan assets valued using significant unobservable inputs (Level 3):
(in millions) | Insurance contracts | ||
Balance at January 1, 2016 | $ | 13.8 | |
Actual return to plan assets: | |||
Related to assets still held at year end | 2.2 | ||
Purchases, sales and settlements, net | 0.1 | ||
Foreign exchange | (0.5 | ) | |
Balance at December 31, 2016 | $ | 15.6 | |
The following summarizes the fair value of foreign plan assets by asset category and level within the fair value hierarchy:
December 31, 2015 | |||||||||||||||
(in millions) | Total | Level 1 | Level 2 | Level 3 | |||||||||||
Cash | $ | 7.6 | $ | 7.6 | $ | — | $ | — | |||||||
Investments: | |||||||||||||||
Investment funds(1) | 460.1 | — | 460.1 | — | |||||||||||
Insurance contracts | 13.8 | — | — | 13.8 | |||||||||||
Total investments | 473.9 | — | 460.1 | 13.8 | |||||||||||
Total | $ | 481.5 | $ | 7.6 | $ | 460.1 | $ | 13.8 | |||||||
(1) | This category includes investments in 11.6% in US equities, 29.7% in non-US equities, 4.1% in US corporate bonds, 24.2% in non-US corporate bonds, 0.3% in US government bonds, 17.7% in non-US government bonds and 12.4% in other investments. |
97
The following table presents changes in the foreign plan assets valued using significant unobservable inputs (Level 3):
(in millions) | Insurance contracts | ||
Balance at January 1, 2015 | $ | 14.8 | |
Actual return on plan assets: | |||
Related to assets still held at year end | 0.6 | ||
Purchases, sales and settlements, net | (0.1 | ) | |
Foreign exchange | (1.5 | ) | |
Balance at December 31, 2015 | $ | 13.8 | |
Contributions
The Company expects to contribute approximately $8.4 million and $22.7 million to its domestic and foreign defined benefit pension plan funds in 2017, respectively, including direct payments to plan participants in unfunded plans. The Company does not plan on making any discretionary contributions in 2017. In many countries, local pension protection laws have been put in place, which have introduced minimum funding requirements for qualified pension plans. As a result, the Company’s required funding of contributions to its pension plans may vary in the future.
Benefit payments
The following table shows benefit payments that are projected to be paid from plan assets in each of the next five years and in aggregate for five years thereafter:
Defined benefit pension plans | Other postretirement benefits | ||||||||||||||
(in millions) | Domestic | Foreign | Total | ||||||||||||
2017 | $ | 34.7 | $ | 15.5 | $ | 50.2 | $ | 0.4 | |||||||
2018 | 36.1 | 16.1 | 52.2 | 0.5 | |||||||||||
2019 | 37.6 | 18.9 | 56.5 | 0.6 | |||||||||||
2020 | 38.8 | 17.6 | 56.4 | 0.1 | |||||||||||
2021 | 40.0 | 18.9 | 58.9 | 0.1 | |||||||||||
2022 through 2026 | 215.7 | 108.2 | 323.9 | 0.3 | |||||||||||
Defined contribution plans
The Company provides defined contribution plans to assist eligible employees in providing for retirement or other future needs. Under such plans, company contribution expense amounted to $33.4 million, $31.4 million and $30.8 million in the years ended December 31, 2016, 2015 and 2014, respectively.
Multi-employer plans
The Company has 18 union bargaining agreements in the US that stipulate contributions to one of three union pension trusts. These bargaining agreements are generally negotiated on three-year cycles and cover employees in driver and material handler positions at 16 represented locations.
The risks of participating in these multi-employer plans are different from single-employer plans in the following aspects:
• | Assets contributed to the multi-employer plan by the Company may be used to provide benefits to employees of other participating employers. |
• | If the Company stops contributing to the plan, the unfunded obligations of the plan may be borne by the remaining participating employers. |
• | If the Company chooses to stop participating in some of its multi-employer plans, it may be required to pay those plans an amount based on the underfunded status of the plan, referred to as a withdrawal liability. |
The Company’s participation in these plans for the annual period ended December 31, 2016 is outlined in the table below. The “EIN/Pension Plan Number” column provides the Employee Identification Number (EIN) and the three-digit plan number. Unless otherwise noted, the most recent Pension Protection Act (PPA) zone status available in 2016 and 2015 is for the plan’s year end at December 31, 2015 and December 31, 2014, respectively. The zone status is based on information that the Company received from the plan and is certified by the plan’s actuary. Among other factors, plans in the “red zone” are less than 65 percent funded, plans in
98
the “yellow zone” are less than 80 percent funded and plans in the “green zone” are at least 80 percent funded. The “FIP/RP Status Pending/Implemented” column indicates plans for which a financial improvement plan (FIP) or a rehabilitation plan (RP) is either pending or has been implemented. The last column lists the expiration dates of the collective-bargaining agreement(s) to which the plans are subject. There are no minimum contributions required for future periods by the collective-bargaining agreements, statutory obligations or other contractual obligations.
Pension fund | EIN/Pension plan number | PPA zone status | FIP/RP status pending/ implemented | Contributions(1) | Surcharge imposed | Expiration dates of collective bargaining agreement(s) | |||||||||||||||||
Year ended December 31, | |||||||||||||||||||||||
2016 | 2015 | 2016 | 2015 | 2014 | |||||||||||||||||||
Western Conference of Teamsters Pension Plan | 91-6145047/001 | Green | Green | No | $ | 1.7 | $ | 1.4 | $ | 1.4 | No | April 30, 2017 to July 31, 2019 | |||||||||||
Central States, Southeast and Southwest Areas Pension Plan | 36-6044243/001 | Red as of January 1, 2015 | Red as of January 1, 2014 | Implemented | 1.1 | 1.1 | 1.1 | No | January 31, 2017 to October 31, 2019 | ||||||||||||||
New England Teamsters and Trucking Industry Pension Fund | 4/1/6372430 | Red as of October 1, 2014 | Red as of October 1, 2014 | Implemented | 0.1 | 0.1 | 0.1 | No | June 30, 2017 | ||||||||||||||
Total contributions: | $ | 2.9 | $ | 2.6 | $ | 2.6 | |||||||||||||||||
(1) | The plan contributions by the Company did not represent more than five percent of total contributions to the plans as indicated in the plans’ most recently available annual report. |
9. Stock-based compensation
In June 2015, the Company replaced and succeeded the Univar Inc. 2011 Stock Incentive Plan (the “2011 Plan”) with the Univar Inc. 2015 Omnibus Equity Incentive Plan (the “2015 Plan”). The 2011 Plan will have no further awards granted and any available reserves under the 2011 Plan were terminated and not transferred to the 2015 Plan. There were no changes to the outstanding awards related to the 2011 Plan.
The 2015 Plan allows the Company to issue awards to employees, consultants, and directors of the Company and its subsidiaries. Awards may be made in the form of stock options, stock purchase rights, restricted stock, restricted stock units, performance shares, performance units, stock appreciation rights, dividend equivalents, deferred share units or other stock-based awards.
As of December 31, 2016, under the 2011 Plan there were 3.4 million shares authorized related to outstanding stock options and under the 2015 plan there were 3.8 million shares authorized.
For the years ended December 31, 2016, 2015 and 2014, respectively, the Company recognized total stock-based compensation expense within other operating expenses, net of $10.4 million, $7.5 million and $12.1 million, and a net tax expense (benefit) relating to stock-based compensation expense of $0.1 million, $(2.6) million and $(4.2) million.
Stock options
Stock options granted under the 2011 and 2015 Plans expire ten years after the grant date and generally become exercisable over a four-year period or less, based on continued employment, with annual vesting. The exercise price of a stock option is determined at the time of each grant and in no case will the exercise price be less than the fair value of the underlying common stock on the date of grant. Participants have no stockholder rights until the time of exercise. The Company will issue new shares upon exercise of stock options granted under the Plan.
99
The following reflects stock option activity under the 2011 and 2015 Plans:
Number of stock options | Weighted- average exercise price | Weighted- average remaining contractual term (in years) | Aggregate intrinsic value (in millions) | |||||||||
Outstanding at January 1, 2016 | 5,088,026 | $ | 19.81 | |||||||||
Granted | — | — | ||||||||||
Exercised | (891,715 | ) | 18.99 | |||||||||
Forfeited | (561,578 | ) | 19.65 | |||||||||
Outstanding at December 31, 2016 | 3,634,733 | 20.03 | ||||||||||
Exercisable at December 31, 2016 | 2,902,260 | 19.92 | 4.1 | $ | 24.5 | |||||||
Expected to vest after December 31, 2016(1) | 659,226 | 20.47 | 7.7 | 5.2 | ||||||||
(1) | The expected to vest stock options are the result of applying the pre-vesting forfeiture rate assumptions to nonvested stock options outstanding. |
As of December 31, 2016, the Company has unrecognized stock-based compensation expense related to nonvested stock options of approximately $1.3 million, which will be recognized over a weighted-average period of 1.1 years.
Restricted stock
Non-vested restricted stock primarily relates to awards for members of the Company’s Board of Directors which vest over 12 months. The price of restricted stock is determined at the time of each grant and in no case will be less than the fair value of the underlying common stock on the date of grant. Nonvested shares of restricted stock may not be sold or transferred and are subject to forfeiture until vesting. Both vested and nonvested shares of restricted stock are included in the Company’s shares outstanding. Dividend equivalents are available for nonvested shares of restricted stock if dividends are declared by the Company during the vesting period.
The following table reflects restricted stock activity under the 2015 Plan:
Restricted stock | Weighted average grant-date fair value | |||||
Nonvested at January 1, 2016 | 237,219 | $ | 21.83 | |||
Granted | 78,145 | 18.15 | ||||
Vested | (68,904 | ) | 23.82 | |||
Forfeited | (160,263 | ) | 21.02 | |||
Nonvested at December 31, 2016 | 86,197 | 18.43 | ||||
As of December 31, 2016, the Company has unrecognized stock-based compensation expense related to nonvested restricted stock awards of approximately $0.7 million, which will be recognized over a weighted-average period of 0.4 years.
The weighted-average grant-date fair value of restricted stock was $27.00 and $18.54 in 2015 and 2014, respectively.
Restricted stock units (RSUs)
RSUs awarded to employees generally vest in three or four equal annual installments, subject to continued employment. Each RSU converts into one share of Univar common stock on the applicable vesting date. RSUs may not be sold, pledged or otherwise transferred until they vest and are subject to forfeiture. The grant date fair value is based on the market price of Univar stock on that date.
The Company also awarded RSUs to the Chief Executive Officer that include both a time-based vesting condition and a performance-based vesting condition. The RSUs that only consist of time-based vesting condition vest over 12 months with monthly vesting. The RSUs that consists of both performance and time-based vesting condition are based on two different tranches. The number of units that vest in the first tranche depends on the Company's closing stock price of $25 or higher for twenty consecutive trading days during a three year period and continued employment for a year after the grant date. As for the second tranche, the number of units that vest depends on the Company's closing stock price of $30 or higher for twenty consecutive trading days during a four year period and continued employment for a year after the grant date. Only vested shares of RSUs are included in the Company’s shares outstanding.
100
The following table reflects RSUs activity under the 2015 Plans:
Number of Restricted Stock Unit | Weighted- average grant-date fair value | |||||
Nonvested at January 1, 2016 | — | $ | — | |||
Granted | 1,380,802 | 13.35 | ||||
Vested | (72,915 | ) | 18.66 | |||
Forfeited | (298,000 | ) | 12.88 | |||
Nonvested at December 31, 2016 | 1,009,887 | 13.10 | ||||
As of December 31, 2016, the Company has unrecognized stock-based compensation expense related to nonvested RSUs awards of approximately $5.0 million, which will be recognized over a weighted-average period of 1.1 years.
Employee stock purchase plan
During November 2016, our Board of Directors approved the Univar Employee Stock Purchase Plan, or ESPP, authorizing the issuances of up to 2.0 million shares of the Company's common stock effective January 1, 2017. The ESPP allows qualified participants to purchase the Company's common stock at 95% of its market price during the last day of two offering periods in each calendar year. The first offering period is January through June, and the second from July through December. Our stock purchase plan is designed to attract and retain employees while also aligning employees’ interests with the interests of our stockholders.
Stock-based compensation fair value assumptions
The fair value of the Company’s common stock was used to establish the exercise price of stock options granted, grant date fair value of restricted stock and RSUs awards and as an input in the valuation of stock option awards and performance-based RSUs at each grant date. Prior to the Company’s June 2015 IPO, as discussed in Note 1, the Company obtained contemporaneous quarterly valuations performed by an unrelated valuation specialist in support of each award. The fair value of the Company’s common stock was determined utilizing both income and market approaches, discounted for the lack of marketability. A discounted cash flow analysis was used to estimate fair value under the income approach. The market approach consisted of an analysis of multiples of comparable companies whose securities are traded publicly as well as other indicated market values of the Company by third parties. After the IPO, the fair value of the Company’s stock that is factored into the fair value of stock options and utilized for restricted stock and RSUs is based on the grant date closing price on the New York Stock Exchange.
The Monte Carlo simulation was used to calculate the fair value of performance-based RSUs. The length of each performance period was used as the expected term in the simulation for each respective tranche. The weighted average grant-date fair value of performance-based RSUs was $10.49 for the year ended December 31, 2016. The weighted-average assumptions under the Monte Carlo simulation model were as follows:
Year ended December 31, 2016 | ||
Risk-free interest rate(1) | 1.0 | % |
Expected dividend yield(2) | — | |
Expected volatility(3) | 45.0 | % |
(1) | The risk-free interest rate is based on the US Treasury yield for a period in years over which performance condition is satisfied. |
(2) | The Company currently has no expectation of paying cash dividends on its common stock. |
(3) | As the Company does not have sufficient historical volatility data, the expected volatility is based on the average historical data of a peer group of public companies over a period equal to the expected term of the performance-based RSUs. |
101
The Black-Scholes-Merton option valuation model was used to calculate the fair value of stock options. The weighted average grant-date fair value of stock options was $6.78 and $7.21 for the years ended December 31, 2015 and 2014, respectively. The weighted average grant-date fair value is not provided for the year ended December 31, 2016, as there were no stock options granted during the period. The weighted-average assumptions used under the Black-Scholes-Merton option valuation model were as follows:
Year ended December 31, | |||||
2015 | 2014 | ||||
Risk-free interest rate(1) | 1.7 | % | 1.8 | % | |
Expected dividend yield(2) | — | — | |||
Expected volatility(3) | 28.3 | % | 34.5 | % | |
Expected term (years)(4) | 6.2 | 6.0 | |||
(1) | The risk-free interest rate is based on the US Treasury yield for a term consistent with the expected term of the stock options at the time of grant. |
(2) | The Company currently has no expectation of paying cash dividends on its common stock. |
(3) | As the Company does not have sufficient historical volatility data, the expected volatility is based on the average historical data of a peer group of public companies over a period equal to the expected term of the stock options. |
(4) | As the Company does not have sufficient historical exercise data under the 2011 and 2015 Plans, the expected term is based on the average of the vesting period of each tranche and the original contract term of 10 years. |
Additional stock-based compensation information
The following table provides additional stock-based compensation information:
Year ended December 31, | |||||||||||
(in millions) | 2016 | 2015 | 2014 | ||||||||
Total intrinsic value of stock options exercised | $ | 4.0 | $ | 0.4 | $ | 1.1 | |||||
Fair value of restricted stock and RSUs vested | 2.7 | 2.9 | 3.0 | ||||||||
10. Accumulated other comprehensive loss
The following table presents the changes in accumulated other comprehensive loss by component, net of tax.
(in millions) | Losses on cash flow hedges | Defined benefit pension items | Currency translation items | Total | |||||||||||
Balance as of December 31, 2014 | $ | (3.7 | ) | $ | 10.3 | $ | (214.8 | ) | $ | (208.2 | ) | ||||
Other comprehensive loss before reclassifications | (3.0 | ) | — | (212.6 | ) | (215.6 | ) | ||||||||
Amounts reclassified from accumulated other comprehensive loss | 6.7 | (7.3 | ) | — | (0.6 | ) | |||||||||
Net current period other comprehensive income (loss) | 3.7 | (7.3 | ) | (212.6 | ) | (216.2 | ) | ||||||||
Balance as of December 31, 2015 | $ | — | $ | 3.0 | $ | (427.4 | ) | $ | (424.4 | ) | |||||
Other comprehensive income before reclassifications | — | 1.2 | 36.3 | 37.5 | |||||||||||
Amounts reclassified from accumulated other comprehensive loss | — | (3.0 | ) | — | (3.0 | ) | |||||||||
Net current period other comprehensive (loss) income | — | (1.8 | ) | 36.3 | 34.5 | ||||||||||
Balance as of December 31, 2016 | $ | — | $ | 1.2 | $ | (391.1 | ) | $ | (389.9 | ) | |||||
102
The following is a summary of the amounts reclassified from accumulated other comprehensive loss to net income (loss).
(in millions) | Year ended December 31, 2016(1) | Year ended December 31, 2015(1) | Location of impact on statement of operations | ||||||
Amortization of defined benefit pension items: | |||||||||
Prior service credits | $ | (4.5 | ) | $ | (11.9 | ) | Warehousing, selling and administrative | ||
Tax expense | 1.5 | 4.6 | Income tax expense (benefit) | ||||||
Net of tax | (3.0 | ) | (7.3 | ) | |||||
Cash flow hedges: | |||||||||
Interest rate swap contracts | — | 3.1 | Interest expense | ||||||
Interest rate swap contracts – loss due to discontinuance of hedge accounting | — | 7.5 | Other (expense) income, net | ||||||
Tax benefit | — | (3.9 | ) | Income tax expense (benefit) | |||||
Net of tax | — | 6.7 | |||||||
Total reclassifications for the period | $ | (3.0 | ) | $ | (0.6 | ) | |||
(1) | Amounts in parentheses indicate credits to net income in the consolidated statement of operations. |
Refer to “Note 8: Employee benefit plans” for additional information regarding the amortization of defined benefit pension items, “Note 17: Derivatives” for cash flow hedging activity and “Note 2: Significant accounting policies” for foreign currency gains and losses relating to intercompany borrowings of a long-term nature that are reflected in currency translation items.
11. Property, plant and equipment, net
Property, plant and equipment, net consisted of the following:
December 31, | |||||||
(in millions) | 2016 | 2015 | |||||
Land and buildings | $ | 781.1 | $ | 778.0 | |||
Tank farms | 272.5 | 239.9 | |||||
Machinery, equipment and other | 747.6 | 716.1 | |||||
Less: Accumulated depreciation | (811.5 | ) | (723.5 | ) | |||
Subtotal | 989.7 | 1,010.5 | |||||
Work in progress | 29.8 | 72.0 | |||||
Property, plant and equipment, net(1) | $ | 1,019.5 | $ | 1,082.5 | |||
(1) | As of December 31, 2016, property, plant and equipment amounts are net of impairment losses of $16.5 million. Refer to "Note 13: Impairment charges" for further information. |
Included within property, plant and equipment, net are assets related to capital leases where the Company is the lessee. The below table summarizes the cost and accumulated depreciation related to these assets:
December 31, | |||||||
(in millions) | 2016 | 2015 | |||||
Capital lease assets, at cost | $ | 76.5 | $ | 63.5 | |||
Less: accumulated depreciation | (14.5 | ) | (7.5 | ) | |||
Capital lease assets, net | $ | 62.0 | $ | 56.0 | |||
Capitalized interest on capital projects was $0.2 million, $0.9 million and $0.5 million in the years ended December 31, 2016, 2015 and 2014, respectively.
103
12. Goodwill and intangible assets
Goodwill
The following is a summary of the activity in goodwill by segment.
(in millions) | USA | Canada | EMEA | Rest of World | Total | ||||||||||||||
Balance, January 1, 2015 | $ | 1,254.0 | $ | 488.7 | $ | — | $ | 24.9 | $ | 1,767.6 | |||||||||
Additions | 52.1 | 10.9 | 2.2 | — | 65.2 | ||||||||||||||
Purchase price adjustments | — | — | — | (0.6 | ) | (0.6 | ) | ||||||||||||
Foreign exchange | — | (78.9 | ) | (0.1 | ) | (8.1 | ) | (87.1 | ) | ||||||||||
Balance, December 31, 2015 | 1,306.1 | 420.7 | 2.1 | 16.2 | 1,745.1 | ||||||||||||||
Additions | 17.7 | 5.2 | — | — | 22.9 | ||||||||||||||
Purchase price adjustments | 1.4 | — | (0.9 | ) | — | 0.5 | |||||||||||||
Foreign exchange | — | 12.5 | (0.1 | ) | 3.5 | 15.9 | |||||||||||||
Balance, December 31, 2016 | $ | 1,325.2 | $ | 438.4 | $ | 1.1 | $ | 19.7 | $ | 1,784.4 | |||||||||
Additions to goodwill in 2016 related to the acquisition of Bodine Services and Nexus Ag. Additions to goodwill in 2015 related to various acquisitions. The purchase price adjustments in 2016 relate to the Weavertown Environmental Group and Arrow Chemical acquisitions. Refer to “Note 18: Business Combinations” for further information. Accumulated impairment losses on goodwill were $296.6 million at January 1, 2015. Accumulated impairment losses on goodwill were $246.3 million and $261.4 million at December 31, 2016 and 2015, respectively.
As of October 1, 2016, the Company performed its annual impairment review and concluded the fair value exceeded the carrying value for all reporting units with goodwill balances. There were no events or circumstances from the date of the assessment through December 31, 2016 that would affect this conclusion.
Determining the fair value of a reporting unit requires judgment and involves the use of significant estimates and assumptions by management. The Company can provide no assurance that a material impairment charge will not occur in a future period. The Company’s estimates of future cash flows may differ from actual cash flows that are subsequently realized due to many factors, including future worldwide economic conditions and the expected benefits of the Company’s initiatives. Any of these potential factors, or other unexpected factors, may cause the Company to re-evaluate the carrying value of goodwill.
Intangible assets, net
The gross carrying amounts and accumulated amortization of the Company’s intangible assets were as follows:
December 31, 2016 | December 31, 2015 | ||||||||||||||||||||||
(in millions) | Gross | Accumulated amortization | Net | Gross | Accumulated amortization | Net | |||||||||||||||||
Intangible assets (subject to amortization): | |||||||||||||||||||||||
Customer relationships(1) | $ | 826.2 | $ | (514.3 | ) | $ | 311.9 | $ | 930.1 | $ | (446.6 | ) | $ | 483.5 | |||||||||
Other(2) | 178.2 | (150.9 | ) | 27.3 | 170.5 | (135.1 | ) | 35.4 | |||||||||||||||
Total intangible assets | $ | 1,004.4 | $ | (665.2 | ) | $ | 339.2 | $ | 1,100.6 | $ | (581.7 | ) | $ | 518.9 | |||||||||
(1) | Net of impairment losses of $110.2 million recorded during the year ended December 31, 2016. Refer to "Note 13: Impairment charges" for further information. |
(2) | Net of impairment losses of $3.5 million recorded during the year ended December 31, 2016. Refer to "Note 13: Impairment charges" for further information. |
Other intangible assets consist of intellectual property trademarks, trade names, producer relationships and contracts, non-compete agreements and exclusive distribution rights.
104
The estimated annual amortization expense in each of the next five years is as follows:
(in millions) | |||
2017 | $ | 56.4 | |
2018 | 49.3 | ||
2019 | 44.2 | ||
2020 | 40.2 | ||
2021 | 31.9 | ||
13. Impairment charges
During the year ended December 31, 2016, the Company revised its business operating plan for servicing upstream oil and gas customers in its USA operating segment. In light of the current prolonged drop in oil prices, and consequential decrease in demand for certain products including high-value specialized blended products used in hydraulic fracking operations, the Company has narrowed its product line and service offering by curtailing certain highly specialized products and services that were being produced and sold to oil and gas customers. As a result, the Company has ceased operations at three production facilities. The Company determined that these decisions have resulted in a triggering event with respect to long lived assets in an asset group, resulting in the assessment of recoverability of these long lived assets. The Company performed step one of the impairment test and determined the carrying amount of the asset group exceeded the sum of the expected undiscounted future cash flows. Thus, the Company proceeded to step two of the impairment test where it was required to determine the fair value of the asset group and recognize an impairment loss if the carrying value exceeded the fair value. As a result of the impairment test, the Company recorded a non-cash, long-lived asset impairment charge of $113.7 million related to intangible assets and $16.5 million related to property, plant and equipment within its consolidated statements of operations. The Company also recorded a non-cash, long-lived asset impairment charge of $0.3 million related to assets held-for-sale.
The fair value of the asset group was determined using an income approach, which was comprised of multiple significant unobservable inputs including: (1) the estimate of future cash flows; (2) the amount of capital expenditures required to maintain the existing cash flows; and (3) a terminal period growth rate equal to the expected rate of inflation. Accordingly, estimated fair value of the asset group is considered to be a Level 3 measurement in the fair value hierarchy.
In addition to the charges discussed above, the Company also impaired $3.4 million of inventory deemed to be unsaleable in connection with the facility closures.
14. Other accrued expenses
Other accrued expenses that were greater than five percent of total current liabilities consisted of customer prepayments and deposits, which were $84.6 million and $60.1 million as of December 31, 2016 and 2015, respectively.
15. Debt
Short-term financing
Short-term financing consisted of the following:
December 31, | |||||||
(in millions) | 2016 | 2015 | |||||
Amounts drawn under credit facilities | $ | 12.1 | $ | 13.4 | |||
Bank overdrafts | 13.2 | 20.1 | |||||
Total | $ | 25.3 | $ | 33.5 | |||
The weighted average interest rate on short-term financing was 2.1% and 2.4% as of December 31, 2016 and 2015, respectively.
As of December 31, 2016 and 2015, the Company had $175.3 million and $172.4 million, respectively, in outstanding letters of credit and guarantees.
105
Long-term debt
Long-term debt consisted of the following:
December 31, | |||||||
(in millions) | 2016 | 2015 | |||||
Senior Term Loan Facilities: | |||||||
Term B Loan due 2022, variable interest rate of 4.25% at December 31, 2016 and December 31, 2015 | $ | 2,024.4 | $ | 2,044.9 | |||
Euro Tranche Term Loan due 2022, variable interest rate of 4.25% at December 31, 2016 and December 31, 2015 | 259.9 | 270.8 | |||||
Asset Backed Loan (ABL) Facilities: | |||||||
North American ABL Facility due 2020, variable interest rate of 4.25% and 2.13% at December 31, 2016 and December 31, 2015, respectively | 152.0 | 278.0 | |||||
North American ABL Term Loan due 2018, variable interest rate of 3.75% and 3.36% at December 31, 2016 and December 31, 2015, respectively | 83.3 | 100.0 | |||||
Senior Unsecured Notes: | |||||||
Senior Unsecured Notes due 2023, fixed interest rate of 6.75% at December 31, 2016 and December 31, 2015 | 399.5 | 400.0 | |||||
Capital lease obligations | 63.4 | 57.3 | |||||
Total long-term debt before discount | 2,982.5 | 3,151.0 | |||||
Less: unamortized debt issuance costs and discount on debt | (28.5 | ) | (33.7 | ) | |||
Total long-term debt | 2,954.0 | 3,117.3 | |||||
Less: current maturities | (109.0 | ) | (59.9 | ) | |||
Total long-term debt, excluding current maturities | $ | 2,845.0 | $ | 3,057.4 | |||
As of December 31, 2016, future contractual maturities of long-term debt including capital lease obligations are as follows:
(in millions) | |||
2017 | $ | 109.0 | |
2018 | 51.2 | ||
2019 | 33.0 | ||
2020 | 182.9 | ||
2021 | 30.5 | ||
Thereafter | 2,575.9 | ||
Total | $ | 2,982.5 | |
Long-term debt restructurings
On July 28, 2015, the Company entered into a new five year $1.4 billion North American Asset Backed Loan Facility (“new NA ABL Facility”) and terminated its existing $1.4 billion North American ABL Facility including the repayment of the existing North American ABL Term Loan. The new NA ABL Facility has a $1.0 billion revolving loan tranche available to certain US subsidiaries, a $300.0 million revolving loan tranche for certain Canadian subsidiaries and a $100.0 million ABL Term Loan (“new ABL Term Loan”). The Company may elect to allocate the total $1.3 billion in revolving tranches between the US and Canadian borrowers. Under the two revolving tranches, the borrowers may request loan advances and make loan repayments until the maturity date of July 28, 2020. The new ABL Term Loan and each revolving loan advance under the facility have a variable interest rate based on the current benchmark rate elected by the borrower plus a credit spread. The credit spread is determined by the elected benchmark rate and the average availability of the facility. The unused line fee for the revolver tranches under the new NA ABL Facility ranges from 0.25% to 0.375% per annum for the US and Canadian borrowers depending on the average daily outstanding amount. The new NA ABL Term Loan is payable in installments of $16.7 million per quarter commencing December 31, 2016 with a final amortization payment on March 31, 2018, with the loan commitment expiring on July 28, 2018.
On July 1, 2015, the Company entered into a new Senior Term B loan agreement with a US dollar denominated tranche of $2,050.0 million and a new euro denominated tranche of €250.0 million. In addition, on July 1, 2015, the Company issued $400.0 million in Senior Unsecured Notes (“Unsecured Notes”). The proceeds from the new Senior Term B loan agreement and Senior Unsecured Notes as well as additional borrowings under the Company’s North American ABL Facility were used to repay in full
106
the existing $2,669.2 million US dollar denominated Term B Loan and €126.8 million ($141.2 million) euro denominated Term B Loan.
The new Senior Term B loan agreement has a $2,050.0 million US dollar loan tranche and a €250.0 million euro loan tranche. Both tranches have a variable interest rate based on LIBOR with a LIBOR floor of 1.00% and a credit spread of 3.25%. The US dollar tranche and euro tranche are payable in installments of $5.1 million and €0.6 million per quarter, respectively, commencing December 31, 2015 with the remaining balances due on the maturity date of July 1, 2022. The Company can prepay either loan tranche in whole or part without penalty after January 1, 2016.
The new $400.0 million issuance of Senior Unsecured Notes has a fixed interest rate of 6.75% payable semi-annually. Principal is due upon the maturity date of July 15, 2023. The Company can prepay the Senior Unsecured Notes in whole or part at a premium above par on or after July 15, 2018 and without a premium on or after July 15, 2020.
As a result of the July 2015 debt refinancing activity, the Company recognized debt refinancing costs of $16.5 million in other (expense) income, net in the consolidated statements of operations during the year ended December 31, 2015. Refer to “Note 6: Other (expense) income, net” for further information. In addition, the Company recognized a loss on extinguishment of debt of $4.8 million in the year ended December 31, 2015.
On June 23, 2015, as part of the use of proceeds from the IPO and concurrent private placement discussed in Note 1, the Company paid the remaining principal balance of $650.0 million related to the Senior Subordinated Notes. As a result, the Company recognized a loss on extinguishment of debt of $7.3 million related to the unamortized debt discount and debt issuance costs in the consolidated statements of operations in the year ended December 31 2015.
On March 24, 2014, certain of the Company’s European subsidiaries (the “Borrowers”) entered into a five year €200 million Euro ABL Credit facility. The Euro ABL is a revolving credit facility pursuant to which the Borrowers may request loan advances and make loan repayments until the maturity date of March 22, 2019. Loan advances may be made in multiple currencies. Each loan advance under this facility has a variable interest rate based on the current benchmark rate (IBOR) for that currency plus a credit spread. The credit spread is determined by a pricing grid that is based on average availability of the facility. The unused line fee ranges from 0.25% to 0.50% per annum depending on the average unused commitment as a percentage of the total commitment.
Simultaneously with the execution of the Euro ABL due 2019, certain of the Company’s European subsidiaries terminated a €68 million secured asset-based lending credit facility maturing December 31, 2016. As a result of this termination, the Company recognized a loss on extinguishment of $1.2 million in the consolidated statement of operations in the year ended December 31, 2014.
Borrowing availability and assets pledged as collateral
As of December 31, 2016, availability of the entire $1.3 billion in North American ABL Facility credit commitments is determined based on the periodic reporting of available qualifying collateral, as defined in the North American ABL Facility credit agreement. At December 31, 2016 and 2015, $411.4 million and $375.0 million were available under the North American ABL Facility, respectively. An unused line fee of 0.375% was in effect at December 31, 2016 and 2015.
As of December 31, 2016, availability of the entire €200 million Euro ABL due 2019 is determined based on the periodic reporting of available qualifying collateral, as defined in the Euro ABL credit agreement. The Euro ABL due 2019 is secured by the accounts receivable and inventory of the Borrowers and certain additional collateral. At December 31, 2016 and 2015, $109.9 million and $114.0 million were available under the Euro ABL, respectively. An unused line fee of 0.50% was in effect at December 31, 2016 and 2015.
The North American ABL Facility and North American ABL Term Loan are secured by substantially all of the assets of the US and Canadian operating subsidiaries of the Company. The Senior Term Loan Facilities are also secured by substantially all of the assets of the US operating and management subsidiaries. With respect to shared collateral, the North American ABL Facility, North American ABL Term Loan and the Senior Term Loan Facilities are secured by accounts receivable and inventories of the US operating subsidiaries of the Company. The obligations under the North American ABL Facility and North American ABL Term Loan are secured by a first priority lien on such accounts receivable and inventory, and the obligations under the Senior Term Loan Facilities are secured by a second priority lien on such accounts receivable and inventory. Under the North American ABL Facility, Canadian entities secure the obligations of the Canadian borrower. In addition, 65% of the shares of all first-tier foreign subsidiaries owned by the US subsidiaries have been pledged as security to the lenders in respect of all obligations. The Euro ABL is primarily secured by accounts receivable and inventories of the Company’s subsidiaries in Belgium, France, Germany, the Netherlands, Switzerland and United Kingdom.
107
Assets pledged under the North American ABL Facility, North American ABL Term Loan, Senior Term Loan Facilities and the Euro ABL are as follows:
December 31, | |||||||
(in millions) | 2016 | 2015 | |||||
Cash | $ | 237.4 | $ | 68.1 | |||
Trade accounts receivable, net | 790.6 | 857.8 | |||||
Inventories | 655.5 | 691.9 | |||||
Prepaids and other current assets | 128.2 | 105.0 | |||||
Property, plant and equipment, net | 856.4 | 894.6 | |||||
Total | $ | 2,668.1 | $ | 2,617.4 | |||
Debt covenants
Under certain limited circumstances, the Company’s subsidiaries noted as borrowers and guarantors under the new NA ABL Facility and NA ABL Term Loan are subject to comply with a fixed charge coverage ratio maintenance covenant. Such covenant is calculated based on the consolidated financial results of the Company. As of December 31, 2016 and 2015, such covenant was not in effect but the Company would have been in compliance if it was then in effect. The Company and its subsidiaries are also subject to a significant number of non-financial covenants in each of the credit facilities and the Senior Unsecured Notes that restrict the operations of the Company and its subsidiaries, including, without limitation, requiring that the net proceeds from certain dispositions and capital market debt issuances must be used as mandatory prepayments and restrictions on the incurrence of financial indebtedness outside of these facilities (including restrictions on secured indebtedness), prepaying subordinated debt, making dividend payments, making certain investments, making certain asset dispositions, certain transactions with affiliates and certain mergers and acquisitions.
16. Fair value measurements
The Company classifies its financial instruments according to the fair value hierarchy described in “Note 2: Significant accounting policies.”
Items measured at fair value on a recurring basis
The following table presents the Company’s assets and liabilities measured on a recurring basis on a gross basis:
Level 2 | Level 3 | ||||||||||||||
December 31, | December 31, | ||||||||||||||
(in millions) | 2016 | 2015 | 2016 | 2015 | |||||||||||
Financial current assets: | |||||||||||||||
Forward currency contracts | $ | 0.5 | $ | 0.2 | $ | — | $ | — | |||||||
Financial noncurrent assets: | |||||||||||||||
Interest rate swap contracts | 9.8 | — | — | — | |||||||||||
Financial current liabilities: | |||||||||||||||
Forward currency contracts | 0.3 | 0.2 | — | — | |||||||||||
Interest rate swap contracts | 5.6 | 5.3 | — | — | |||||||||||
Contingent consideration | — | — | 1.6 | — | |||||||||||
Financial noncurrent liabilities: | |||||||||||||||
Interest rate swap contracts | — | 0.5 | — | — | |||||||||||
Contingent consideration | — | — | 5.9 | 8.7 | |||||||||||
The net amounts related to foreign currency contracts included in prepaid and other current assets were $0.5 million and $0.2 million as of December 31, 2016 and 2015, respectively. The net amounts related to foreign currency contracts included in other accrued expenses were $0.3 million and $0.2 million as of December 31, 2016 and 2015, respectively.
The following table is a reconciliation of the fair value measurements that use significant unobservable inputs (Level 3), which are contingent consideration liabilities (i.e. earn-outs) related to prior acquisitions. Refer to “Note 18: Business Combinations” for further information discussing the business acquisitions resulting in contingent consideration liabilities, the
108
terms of the earn-outs, the unobservable inputs factored into the fair value determination and the estimated impact on the consolidated financial statements related to changes in the unobservable inputs.
(in millions) | 2016 | 2015 | |||||
Fair value as of January 1 | $ | 8.7 | $ | — | |||
Additions | — | 8.8 | |||||
Fair value adjustments | (0.7 | ) | — | ||||
Foreign currency | (0.1 | ) | (0.1 | ) | |||
Payments | (0.4 | ) | — | ||||
Fair value as of December 31 | $ | 7.5 | $ | 8.7 | |||
The fair value adjustment in 2016 related to various 2015 acquisitions. The 2016 fair value reduction was primarily due to actual financial performance and payouts. The fair value adjustment is recorded within other operating expenses, net in the consolidated statement of operations.
Financial instruments not carried at fair value
The estimated fair value of financial instruments not carried at fair value in the consolidated balance sheets were as follows:
December 31, 2016 | December 31, 2015 | ||||||||||||||
(in millions) | Carrying amount | Fair value | Carrying amount | Fair value | |||||||||||
Financial liabilities: | |||||||||||||||
Long-term debt including current portion (Level 2) | $ | 2,954.0 | $ | 3,019.1 | $ | 3,117.3 | $ | 3,056.5 | |||||||
The fair values of the long-term debt, including the current portions, were based on current market quotes for similar borrowings and credit risk adjusted for liquidity, margins, and amortization, as necessary.
Fair value of other financial instruments
The carrying value of cash and cash equivalents, trade accounts receivable, trade accounts payable and short-term financing included in the consolidated balance sheets approximates fair value due to their short-term nature.
17. Derivatives
Interest rate swaps
At December 31, 2016 and 2015, the Company had interest rate swap contracts in place with a total notional amount of $1.0 billion and $2.0 billion, respectively, whereby a fixed rate of interest (weighted average of 1.64%) is paid and a variable rate of interest (greater of 1.25% or three-month LIBOR) is received on the notional amount.
The objective of the interest rate swap contracts was to offset the variability of cash flows in three-month LIBOR indexed debt interest payments, subject to a 1.50% floor, attributable to changes in the aforementioned benchmark interest rate related to the Term B Loan due 2017. The Company entered into the swap contracts in 2013, at that time the three-month LIBOR indexed debt interest payments were subject to a 1.50% LIBOR floor. The interest rate floor related to the Term B Loan due 2017 (1.50%) was not identical to the interest rate floor of the interest rate swap contracts (1.25%), which resulted in hedge ineffectiveness.
Upon initiation of the interest rate swap contracts, changes in the cash flows of each interest rate swap were expected to be highly effective in offsetting the changes in interest payments on a principal balance equal to the notional amount of the derivative, attributable to the hedged risk. The effective portion of the gains and losses related to the interest rate swap contracts were initially recorded in accumulated other comprehensive loss and then reclassified into earnings consistent with the underlying hedged item (interest payments). As of December 31, 2015, the interest rate swap contracts no longer qualified for hedge accounting because the forecasted transactions as originally contemplated was no longer probable of occurring due to the July 1, 2015 Senior Term Loan Facility refinancing transactions. The forecasted transactions represented debt with interest payments with a variable interest rate based on three-month LIBOR and a credit spread of 3.50%, with a LIBOR floor of 1.50% whereas the new debt has interest payments with a variable interest rate based on LIBOR and a credit spread of 3.25% with a LIBOR floor of 1.00%. Refer to “Note 15: Debt” for more information related to the refinancing transactions.
As a result of discontinuing hedge accounting, a net loss of $4.7 million, net of tax of $2.8 million, related to the interest rate swaps included in accumulated other comprehensive loss was recognized in other (expense) income, net and income tax expense (benefit) in the consolidated statements of operations for the year ended December 31, 2015. Future changes in fair value
109
of the interest rate swap contracts are recognized directly in other (expense) income, net in the consolidated statement of operations. Refer to “Note 6: Other (expense) income, net” for additional information. The fair value of interest rate swaps is recorded in prepaids and other current assets, other assets, other accrued expenses or other long-term liabilities in the consolidated balance sheets. Refer to “Note 16: Fair value measurements” for further information.
On November 16, 2016, the Company executed interest rate swap contracts with a total notional amount of $2.0 billion effective June 2017 upon the expiration of both the existing interest rate swap contracts and interest rate caps, whereby a fixed rate of interest (weighted-average of 1.70%) is paid and a variable rate of interest (greater of 1.00% or three-month LIBOR) is received on the notional amount. The Company does not apply hedge accounting for the interest rate swap contracts, which will expire on June 30, 2020. Changes in fair value of the interest rate swap contracts are recognized directly in other (expense) income, net in the consolidated statement of operations. Refer to "Note 6: Other (expense) income, net" for additional information.
Interest rate caps
At December 31, 2016, the Company had interest rate caps with a notional amount of $800 million, to the extent the quarterly LIBOR exceeded 1.00%; the Company would receive payment based on the notional amount and the spread of three-month LIBOR above the strike price of 1.00%. The Company does not apply hedge accounting for the interest rate caps, which expire on June 30, 2017.
As of December 31, 2016, upfront premium paid for these interest rate caps of $0.1 million are recorded in prepaids and other current assets within the consolidated balance sheets. The interest rate cap premiums will be amortized through interest expense over the life of the contracts within the consolidated statements of operations.
Foreign currency derivatives
The Company uses forward currency contracts to hedge earnings from the effects of foreign exchange relating to certain of the Company’s intercompany and third-party receivables and payables denominated in a foreign currency. These derivative instruments are not formally designated as hedges by the Company and the terms of these instruments range from one to three months. Forward currency contracts are recorded at fair value in either prepaid expenses and other current assets or other accrued expenses in the consolidated balance sheets, reflecting their short-term nature. Refer to “Note 16: Fair value measurements” for additional information. The fair value adjustments and gains and losses are included in other (expense) income, net within the consolidated statements of operations. Refer to “Note 6: Other (expense) income, net” for more information. The total notional amount of undesignated forward currency contracts were $111.0 million and $107.5 million as of December 31, 2016 and 2015, respectively.
18. Business combinations
Year ended December 31, 2016
In the year ended December 31, 2016, the Company completed two acquisitions.
On March 2, 2016, the Company completed an acquisition of 100% of the equity interest in Bodine Services of Decatur, Inc.; Bodine Environmental Services, Inc.; and affiliated entities, operating as Bodine Services of the Midwest (“Bodine”), a regional provider of environmental and facilities maintenance services. This acquisition expands the Company’s footprint with additional service centers in key geographic markets since Bodine has expertise that is critical to helping customers effectively manage compliance with their operations by preventing waste and environmental concerns.
On March 22, 2016, the Company completed a definitive asset purchase agreement with Nexus Ag Business Inc. (“Nexus Ag”), a wholesale fertilizer distributor to the Western Canada agriculture market that offers a broad range of products, including micronutrients, specialty fertilizers, potash, phosphates, and liquid and soluble nutrients from leading North American producers.
The preliminary purchase price of these acquisitions was $53.3 million. The preliminary purchase price allocation includes goodwill of $22.9 million and intangibles $19.4 million. The operating results subsequent to the acquisition dates did not have a significant impact on the consolidated financial statement of the Company. The initial accounting for these acquisitions has only been preliminarily determined subject to final working capital adjustments and valuations of intangible assets and property, plant and equipment.
The purchase price allocation for the Key Chemical, Inc., Chemical Associates, Inc., Arrow Chemical, Inc., Polymer Technologies Ltd., Weavertown Environmental Group, and Future/Blue Star 2015 acquisitions are now final. Purchase price adjustments on prior acquisitions resulted in additional cash payments of $0.3 million during the year ended December 31, 2016. The fair value of contingent consideration liabilities relating to 2015 acquisitions is included within the Consolidated Balance Sheets. Refer to "Note 16: Fair value measurements" for further information discussing the changes in fair value of contingent consideration liabilities.
110
Year ended December 31, 2015
In the year ended December 31, 2015, the Company completed six acquisitions for a total purchase price of $171.1 million.
On April 10, 2015, the Company completed an acquisition of 100% of the equity interest in Key Chemical, Inc., (“Key”), one of the largest distributors of fluoride to municipalities in the US, which the Company expects to help expand the Company’s offerings into municipal and other industrial markets.
On July 16, 2015, the Company entered into a definitive asset purchase agreement with Chemical Associates, Inc. (“Chemical Associates”) to sell the Chemical Associates business to the Company. Chemical Associates specializes in blending, mixing, and packaging of formulated oleochemical products and serves customers throughout the US and can supply packaged and bulk quantities.
On October 2, 2015, the Company completed an acquisition of 100% of the equity interest in Future Transfer Co., Inc.; BlueStar Distribution Inc.; and BDI Distribution West Inc. (“Future/BlueStar”). Future/BlueStar specializes in logistics, warehousing, packaging, and formulation services to the agriculture industry in Canada.
On November 3, 2015, the Company completed an acquisition of 100% of the equity interest in Arrow Chemical, Inc. (“Arrow Chemical”), an importer and distributor of active pharmaceutical ingredients (API) and other specialty chemistries in the US market.
On December 1, 2015, the Company completed an acquisition of 100% of the equity interest in Weaver Town Oil Services, Inc., and Weavertown Transport Leasing, Inc., operating as the Weavertown Environmental Group (“WEG”), a premier provider of environmental and facilities maintenance services in the US. The Company plans to integrate the WEG business with its ChemCare waste management service.
On December 16, 2015, the Company completed an acquisition of 100% of the equity interest in Polymer Technologies Ltd. (“Polymer”), a UK-based distributor of specialty chemicals for use in the radiation cured coatings industry. Polymer develops and markets chemicals which are used to formulate environmentally friendly paints, inks and adhesives.
Summarized financial information
As of December 31, 2015, the purchase price allocation for the acquisitions is as follows:
(in millions) | WEG | Other | Total | ||||||||
Purchase price: | |||||||||||
Cash consideration | $ | 66.5 | $ | 95.0 | $ | 161.5 | |||||
Contingent consideration | 3.0 | 5.8 | 8.8 | ||||||||
Other liability consideration | — | 0.8 | 0.8 | ||||||||
69.5 | 101.6 | 171.1 | |||||||||
Allocation: | |||||||||||
Cash and cash equivalents | 1.1 | 7.0 | 8.1 | ||||||||
Trade accounts receivable, net | 7.7 | 12.1 | 19.8 | ||||||||
Inventories | 0.5 | 6.3 | 6.8 | ||||||||
Prepaid expenses and other current assets | 0.4 | 1.4 | 1.8 | ||||||||
Property, plant and equipment, net | 13.3 | 14.1 | 27.4 | ||||||||
Goodwill | 23.4 | 41.8 | 65.2 | ||||||||
Definite-lived intangible assets | 25.1 | 31.1 | 56.2 | ||||||||
Deferred tax assets, net | — | 0.2 | 0.2 | ||||||||
Trade accounts payable | (1.5 | ) | (7.6 | ) | (9.1 | ) | |||||
Other accrued expenses | (0.5 | ) | (1.7 | ) | (2.2 | ) | |||||
Deferred tax liabilities | — | (3.1 | ) | (3.1 | ) | ||||||
$ | 69.5 | $ | 101.6 | $ | 171.1 | ||||||
The consolidated financial statements include the results of acquired companies from the acquisition date. Net sales and net income of acquired companies included in the consolidated statement of operations for the year ended December 31, 2015, were $38.3 million and $1.9 million, respectively.
111
Transaction costs
Costs of approximately $2.0 million directly attributable to the acquisitions, consisting primarily of legal and consultancy fees, were expensed as incurred in other operating expenses, net in the consolidated statements of operations.
Goodwill and intangible assets
Substantially all of the goodwill recognized above was attributed to the expected synergies from combining the assets and activities of the acquisitions with those of the Company’s USA, Canada and EMEA segments. The goodwill arising on the Future/BlueStar and Polymer acquisitions is not tax-deductible and the goodwill arising on the Key, Chemical Associates, Arrow Chemical and WEG acquisitions is tax-deductible.
The intangible assets subject to amortization recognized consisted of the following:
(in millions) | Fair value | Weighted average amortization period in years | |||
WEG | |||||
Customer relationships | $ | 24.2 | 12.0 | ||
Other | 0.9 | 3.0 | |||
Other acquisitions | |||||
Customer relationships | 17.8 | 10.2 | |||
Other | 13.3 | 8.9 | |||
Total | $ | 56.2 | |||
Contingent consideration liabilities
Pursuant to the terms of the purchase agreements related to the Future/BlueStar, Arrow Chemical, WEG and Polymer acquisitions, the Company is conditionally obligated to make earn-out payments based on the acquired companies’ performance in fiscal years subsequent to the acquisition year (earn-out period). The earn-out period for these acquisitions ranges from 2 to 3 years. As part of the allocation of the purchase price, the Company recognized $3.0 million and $5.8 million for WEG and the remaining acquisitions, respectively, in other long-term liabilities related to the fair value of the contingent considerations on the date of acquisition.
With the exception of Polymer, the earn-out payment formulas are based on measures of gross profit. Polymer’s earn-out formula is based on a measure of sales. The maximum amount that the Company is contractually obligated to pay under these earn-out arrangements is $5.0 million for WEG and $2.6 million for Arrow Chemical and Polymer. There is no maximum for the earn-out payable to Future/BlueStar, which was deemed to have a fair value of $3.3 million as of December 31, 2016
The contingent consideration arrangements were recognized at their fair value based on a real options approach, which took into account management’s best estimate of the acquired companies’ performance during the earn-out periods, as well as achievement risk.
Since the acquisitions, the changes in the fair value adjustment is recorded within other operating expenses, net in the consolidated statement of operations. As of December 31, 2016, the fair value of contingent consideration was $7.5 million. Refer to "Note 16: Fair value measurements" for further information.
Supplemental pro forma information (unaudited)
The following table presents summarized pro forma results of the Company and the acquired entities had the acquisition dates of all 2015 business combinations been January 1, 2014:
(in millions, except per share data) | 2015 | 2014 | |||||
Net sales | $ | 9,078.3 | $ | 10,524.4 | |||
Net income (loss) | 23.6 | (7.7 | ) | ||||
Income (loss) per common share – diluted | $ | 0.20 | $ | (0.08 | ) | ||
The supplemental pro forma information presents the combined operating results of the Company and the businesses acquired, adjusted to exclude acquisition-related costs, to include the additional depreciation and amortization expense associated with the effect of fair value adjustments recognized, and to include interest expense and amortization of debt issuance costs related to the Company’s borrowings used to fund the acquisitions.
112
Year ended December 31, 2014
Acquisition of D’Altomare Quimica Ltda.
On November 3, 2014, the Company completed an acquisition of 100% of the equity interest in D’Altomare, a Brazilian distributor of specialty chemicals and ingredients. This acquisition expands the Company’s geographic footprint and market presence in Brazil and across Latin America. The acquisition purchase price and operating results subsequent to the acquisition date did not have a significant impact on the consolidated financial statements of the Company.
19. Commitments and contingencies
Lease commitments
Rental and lease commitments primarily relate to land, buildings and fleet. Operating lease expense for the years ended December 31, 2016, 2015 and 2014 were $83.3 million, $93.7 million and $107.4 million, respectively.
As of December 31, 2016, minimum rental commitments under non-cancelable operating leases with lease terms in excess of one year are as follows:
(in millions) | Minimum rental commitments | ||
2017 | $ | 56.9 | |
2018 | 44.0 | ||
2019 | 40.0 | ||
2020 | 31.5 | ||
2021 | 24.1 | ||
Thereafter | 49.6 | ||
Total | $ | 246.1 | |
Litigation
In the ordinary course of business the Company is subject to pending or threatened claims, lawsuits, regulatory matters and administrative proceedings from time to time. Where appropriate the Company has recorded provisions in the consolidated financial statements for these matters. The liabilities for injuries to persons or property are in some instances covered by liability insurance, subject to various deductibles and self-insured retentions.
The Company is not aware of any claims, lawsuits, regulatory matters or administrative proceedings, pending or threatened, that are likely to have a material effect on its overall financial position, results of operations, or cash flows. However, the Company cannot predict the outcome of any claims or litigation or the potential for future claims or litigation.
The Company is subject to liabilities from claims alleging personal injury from exposure to asbestos. The claims result primarily from an indemnification obligation related to Univar USA Inc.’s 1986 purchase of McKesson Chemical Company from McKesson Corporation (“McKesson”). Univar USA’s obligation to indemnify McKesson for settlements and judgments arising from asbestos claims is the amount which is in excess of applicable insurance coverage, if any, which may be available under McKesson’s historical insurance coverage. Univar USA is also a defendant in a small number of asbestos claims. As of December 31, 2016, there were fewer than 290 asbestos-related claims for which the Company has liability for defense and indemnity pursuant to the indemnification obligation. Historically, the vast majority of the claims against both McKesson and Univar USA have been dismissed without payment. While the Company is unable to predict the outcome of these matters, it does not believe, based upon current available facts, that the ultimate resolution of any of these matters will have a material effect on its overall financial position, results of operations, or cash flows. However, the Company cannot predict the outcome of any present or future claims or litigation and adverse developments could negatively impact earnings or cash flows in a particular future period.
Environmental
The Company is subject to various federal, state and local environmental laws and regulations that require environmental assessment or remediation efforts (collectively “environmental remediation work”) at approximately 129 locations, some that are now or were previously Company-owned/occupied and some that were never Company-owned/occupied (“non-owned sites”).
The Company’s environmental remediation work at some sites is being conducted pursuant to governmental proceedings or investigations, while the Company, with appropriate state or federal agency oversight and approval, is conducting the
113
environmental remediation work at other sites voluntarily. The Company is currently undergoing remediation efforts or is in the process of active review of the need for potential remediation efforts at approximately 103 current or formerly Company-owned/occupied sites. In addition, the Company may be liable for a share of the clean-up of approximately 26 non-owned sites. These non-owned sites are typically (a) locations of independent waste disposal or recycling operations with alleged or confirmed contaminated soil and/or groundwater to which the Company may have shipped waste products or drums for re-conditioning, or (b) contaminated non-owned sites near historical sites owned or operated by the Company or its predecessors from which contamination is alleged to have arisen.
In determining the appropriate level of environmental reserves, the Company considers several factors such as information obtained from investigatory studies; changes in the scope of remediation; the interpretation, application and enforcement of laws and regulations; changes in the costs of remediation programs; the development of alternative cleanup technologies and methods; and the relative level of the Company’s involvement at various sites for which the Company is allegedly associated. The level of annual expenditures for remedial, monitoring and investigatory activities will change in the future as major components of planned remediation activities are completed and the scope, timing and costs of existing activities are changed. Project lives, and therefore cash flows, range from 2 to 30 years, depending on the specific site and type of remediation project.
On December 9, 2014, the Company was issued a violation notice from the Pollution Control Services Department of Harris County, Texas (“PCS”). The notice relates to claims that the Company’s facility on Luthe Road in Houston, Texas operated with inadequate air emissions controls and improperly discharged certain waste without authorization. On March 6, 2015, PCS notified the Company that the matter was forwarded to the Harris County District Attorney’s Office with a request for an enforcement action. No such action was ever commenced, and, rather than litigate, the Company recently made a payment to PCS in settlement of this matter with no admission of a violation.
Although the Company believes that its reserves are adequate for environmental contingencies, it is possible, due to the uncertainties noted above, that additional reserves could be required in the future that could have a material effect on the overall financial position, results of operations, or cash flows in a particular period. This additional loss or range of losses cannot be recorded at this time, as it is not reasonably estimable.
Changes in total environmental liabilities are as follows:
(in millions) | 2016 | 2015 | |||||
Environmental liabilities at January 1 | $ | 113.2 | $ | 120.3 | |||
Revised obligation estimates | 5.5 | 11.3 | |||||
Environmental payments | (22.5 | ) | (17.8 | ) | |||
Foreign exchange | (0.4 | ) | (0.6 | ) | |||
Environmental liabilities at December 31 | $ | 95.8 | $ | 113.2 | |||
Environmental liabilities of $30.2 million and $35.5 million were classified as current in other accrued expenses in the consolidated balance sheets as of December 31, 2016 and 2015, respectively. The long-term portion of environmental liabilities is recorded in other long-term liabilities in the consolidated balance sheets. The total discount on environmental liabilities was $5.6 million and $2.3 million at December 31, 2016 and 2015, respectively. The discount rate used in the present value calculation was 2.5% and 2.3% as of December 31, 2016 and 2015, respectively, which represent risk-free rates.
The Company manages estimated cash flows by project. These estimates are subject to change if there are modifications to the scope of the remediation plan or if other factors, both external and internal, change the timing of the remediation activities. The Company periodically reviews the status of all existing or potential environmental liabilities and adjusts its accruals based on all available, relevant information. Based on current estimates, the expected payments for environmental remediation for the next five years and thereafter at December 31, 2016 are as follows, with projects for which timing is uncertain included in the 2017 estimated amount of $12.9 million:
(in millions) | |||
2017 | $ | 30.2 | |
2018 | 15.2 | ||
2019 | 10.3 | ||
2020 | 7.9 | ||
2021 | 7.6 | ||
Thereafter | 30.2 | ||
Total | $ | 101.4 | |
114
Customs and International Trade Laws
In April 2012, the US Department of Justice (“DOJ”) issued a civil investigative demand to the Company in connection with an investigation into the Company’s compliance with applicable customs and international trade laws and regulations relating to the importation of saccharin from 2002 through 2012. The Company also became aware in 2010 of an investigation being conducted by US Customs and Border Patrol (“CBP”) into the Company’s importation of saccharin. Finally, the Company learned that a civil plaintiff had sued the Company and two other defendants in a Qui Tam proceeding, such filing having been made under seal in 2012, and this plaintiff had requested that the DOJ intervene in its lawsuit.
The US government, through the DOJ, declined to intervene in the Qui Tam proceeding in November 2013 and, as a result, the DOJ’s inquiry related to the Qui Tam lawsuit and its initial investigation demand are now finished. On February 26, 2014, the Qui Tam plaintiff also voluntarily dismissed its lawsuit against the Company. CBP, however, continued its investigation on the importation of saccharin by the Company’s subsidiary, Univar USA Inc. On July 21, 2014, CBP sent the Company a “Pre-Penalty Notice” indicating the imposition of a penalty against Univar USA Inc. in the amount of approximately $84.0 million. Univar USA Inc. responded to CBP that the proposed penalty was not justified. On October 1, 2014, the CBP issued a penalty notice to Univar USA Inc. for $84.0 million and has reaffirmed this penalty notice. On August 6, 2015, the DOJ filed a complaint on CBP’s behalf against Univar USA Inc. in the Court of International Trade seeking approximately $84.0 million in allegedly unpaid duties, penalties, interest, costs and attorneys’ fees. The Company continues to defend this matter vigorously. Univar USA Inc. has not recorded a liability related to this investigation as the Company believes a loss is not probable.
20. Related party transactions
During year ended December 31, 2016, CVC divested its entire investment in the Company in conjunction with secondary public offering.
CD&R and CVC charged the Company a total of $2.8 million and $5.9 million in the years ended December 31, 2015 and 2014, respectively, for advisory services provided to the Company pertaining strategic consulting. In addition, during the year ended December 31, 2015, there was a contract termination fee of $26.2 million related to terminating consulting agreements between the Company and CVC and CD&R as a result of the June 2015 IPO. Refer to Note 1 for additional information. These amounts were recorded in other operating expenses, net. Refer to “Note 4: Other operating expenses, net” for additional information.
The following table summarizes the Company’s sales and purchases with related parties within the ordinary course of business:
Year ended December 31, | |||||||||||
(in millions) | 2016 | 2015 | 2014 | ||||||||
CVC(1): | |||||||||||
Sales to affiliate companies | $ | 0.5 | $ | 1.9 | $ | 9.1 | |||||
Purchases from affiliate companies | — | 8.8 | 10.2 | ||||||||
CD&R: | |||||||||||
Sales to affiliate companies | 7.7 | 29.7 | 20.9 | ||||||||
Purchases from affiliate companies | 16.5 | 19.9 | 21.6 | ||||||||
Temasek: | |||||||||||
Sales to affiliate companies | 14.4 | 19.8 | — | ||||||||
Purchases from affiliate companies | 10.1 | 0.1 | — | ||||||||
(1) | Sales and purchases related information for CVC is disclosed until August 31, 2016. |
The following table summarizes the Company’s receivables due from and payables due to related parties:
December 31, | |||||||
(in millions) | 2016 | 2015 | |||||
Due from affiliates | $ | 2.3 | $ | 4.1 | |||
Due to affiliates | 2.1 | 6.6 | |||||
115
21. Segments
Management monitors the operating results of its operating segments separately for the purpose of making decisions about resource allocation and performance assessment. Management evaluates performance on the basis of Adjusted EBITDA. Adjusted EBITDA is defined as consolidated net income (loss), plus the sum of: interest expense, net of interest income; income tax expense (benefit); depreciation; amortization; other operating expenses, net; impairment charges; loss on extinguishment of debt; and other (expense) income, net.
Transfer prices between operating segments are set on an arms-length basis in a similar manner to transactions with third parties. Corporate operating expenses that directly benefit segments have been allocated to the operating segments. Allocable operating expenses are identified through a review process by management. These costs are allocated to the operating segments on a basis that reasonably approximates the use of services. This is typically measured on a weighted distribution of margin, asset, headcount or time spent.
Other/Eliminations represents the elimination of inter-segment transactions as well as unallocated corporate costs consisting of costs specifically related to parent company operations that do not directly benefit segments, either individually or collectively.
116
Financial information for the Company’s segments is as follows:
(in millions) | USA | Canada | EMEA | Rest of World | Other/ Eliminations | Consolidated | |||||||||||||||||
Year ended December 31, 2016 | |||||||||||||||||||||||
Net sales: | |||||||||||||||||||||||
External customers | $ | 4,706.7 | $ | 1,261.0 | $ | 1,704.2 | $ | 401.8 | $ | — | $ | 8,073.7 | |||||||||||
Inter-segment | 104.4 | 8.3 | 4.5 | — | (117.2 | ) | — | ||||||||||||||||
Total net sales | 4,811.1 | 1,269.3 | 1,708.7 | 401.8 | (117.2 | ) | 8,073.7 | ||||||||||||||||
Cost of goods sold (exclusive of depreciation) | 3,769.7 | 1,047.4 | 1,324.6 | 322.1 | (117.2 | ) | 6,346.6 | ||||||||||||||||
Gross profit | 1,041.4 | 221.9 | 384.1 | 79.7 | — | 1,727.1 | |||||||||||||||||
Outbound freight and handling | 191.5 | 34.1 | 54.9 | 6.1 | — | 286.6 | |||||||||||||||||
Warehousing, selling and administrative | 517.5 | 83.8 | 210.5 | 46.8 | 19.2 | 877.8 | |||||||||||||||||
Adjusted EBITDA | $ | 332.4 | $ | 104.0 | $ | 118.7 | $ | 26.8 | $ | (19.2 | ) | $ | 562.7 | ||||||||||
Other operating expenses, net | 104.5 | ||||||||||||||||||||||
Depreciation | 152.3 | ||||||||||||||||||||||
Amortization | 85.6 | ||||||||||||||||||||||
Impairment charges | 133.9 | ||||||||||||||||||||||
Interest expense, net | 159.9 | ||||||||||||||||||||||
Other expense, net | 6.1 | ||||||||||||||||||||||
Income tax benefit | (11.2 | ) | |||||||||||||||||||||
Net loss | $ | (68.4 | ) | ||||||||||||||||||||
Total assets | $ | 3,676.8 | $ | 1,856.2 | $ | 857.4 | $ | 211.3 | $ | (1,211.8 | ) | $ | 5,389.9 | ||||||||||
Property, plant and equipment, net | 671.1 | 148.3 | 144.8 | 18.2 | 37.1 | 1,019.5 | |||||||||||||||||
Capital expenditures | 56.5 | 17.4 | 12.2 | 2.8 | 1.2 | 90.1 | |||||||||||||||||
117
(in millions) | USA | Canada | EMEA | Rest of World | Other/ Eliminations | Consolidated | |||||||||||||||||
Year ended December 31, 2015 | |||||||||||||||||||||||
Net sales: | |||||||||||||||||||||||
External customers | $ | 5,351.5 | $ | 1,376.6 | $ | 1,780.1 | $ | 473.6 | $ | — | $ | 8,981.8 | |||||||||||
Inter-segment | 112.7 | 8.6 | 4.0 | 0.1 | (125.4 | ) | — | ||||||||||||||||
Total net sales | 5,464.2 | 1,385.2 | 1,784.1 | 473.7 | (125.4 | ) | 8,981.8 | ||||||||||||||||
Cost of goods sold (exclusive of depreciation) | 4,365.9 | 1,161.0 | 1,398.6 | 382.6 | (125.4 | ) | 7,182.7 | ||||||||||||||||
Gross profit | 1,098.3 | 224.2 | 385.5 | 91.1 | — | 1,799.1 | |||||||||||||||||
Outbound freight and handling | 216.9 | 39.3 | 59.6 | 8.8 | — | 324.6 | |||||||||||||||||
Warehousing, selling and administrative | 492.6 | 87.8 | 226.0 | 54.1 | 13.9 | 874.4 | |||||||||||||||||
Adjusted EBITDA | $ | 388.8 | $ | 97.1 | $ | 99.9 | $ | 28.2 | $ | (13.9 | ) | $ | 600.1 | ||||||||||
Other operating expenses, net | 106.1 | ||||||||||||||||||||||
Depreciation | 136.5 | ||||||||||||||||||||||
Amortization | 88.5 | ||||||||||||||||||||||
Interest expense, net | 207.0 | ||||||||||||||||||||||
Loss on extinguishment of debt | 12.1 | ||||||||||||||||||||||
Other expense, net | 23.2 | ||||||||||||||||||||||
Income tax expense | 10.2 | ||||||||||||||||||||||
Net income | $ | 16.5 | |||||||||||||||||||||
Total assets | $ | 3,962.0 | $ | 1,709.7 | $ | 947.2 | $ | 233.6 | $ | (1,240.1 | ) | $ | 5,612.4 | ||||||||||
Property, plant and equipment, net | 714.9 | 133.3 | 167.7 | 20.3 | 46.3 | 1,082.5 | |||||||||||||||||
Capital expenditures | 106.8 | 16.1 | 17.2 | 3.4 | 1.5 | 145.0 | |||||||||||||||||
118
(in millions) | USA | Canada | EMEA | Rest of World | Other/ Eliminations | Consolidated | |||||||||||||||||
Year ended December 31, 2014 | |||||||||||||||||||||||
Net sales: | |||||||||||||||||||||||
External customers | $ | 6,081.4 | $ | 1,512.1 | $ | 2,230.1 | $ | 550.3 | $ | — | $ | 10,373.9 | |||||||||||
Inter-segment | 121.8 | 10.0 | 4.5 | — | (136.3 | ) | — | ||||||||||||||||
Total net sales | 6,203.2 | 1,522.1 | 2,234.6 | 550.3 | (136.3 | ) | 10,373.9 | ||||||||||||||||
Cost of goods sold (exclusive of depreciation) | 5,041.0 | 1,271.5 | 1,797.9 | 469.1 | (136.3 | ) | 8,443.2 | ||||||||||||||||
Gross profit | 1,162.2 | 250.6 | 436.7 | 81.2 | — | 1,930.7 | |||||||||||||||||
Outbound freight and handling | 233.3 | 46.4 | 75.5 | 10.3 | — | 365.5 | |||||||||||||||||
Warehousing, selling and administrative | 490.9 | 97.4 | 276.2 | 53.3 | 5.7 | 923.5 | |||||||||||||||||
Adjusted EBITDA | $ | 438.0 | $ | 106.8 | $ | 85.0 | $ | 17.6 | $ | (5.7 | ) | $ | 641.7 | ||||||||||
Other operating expenses, net | 197.1 | ||||||||||||||||||||||
Depreciation | 133.5 | ||||||||||||||||||||||
Amortization | 96.0 | ||||||||||||||||||||||
Impairment charges | 0.3 | ||||||||||||||||||||||
Interest expense, net | 250.6 | ||||||||||||||||||||||
Loss on extinguishment of debt | 1.2 | ||||||||||||||||||||||
Other income, net | (1.1 | ) | |||||||||||||||||||||
Income tax benefit | (15.8 | ) | |||||||||||||||||||||
Net loss | $ | (20.1 | ) | ||||||||||||||||||||
Total assets (as adjusted*) | $ | 4,130.4 | $ | 1,986.5 | $ | 1,059.2 | $ | 310.8 | $ | (1,419.2 | ) | $ | 6,067.7 | ||||||||||
Property, plant and equipment, net | 621.6 | 135.8 | 189.4 | 25.1 | 60.4 | 1,032.3 | |||||||||||||||||
Capital expenditures | 73.1 | 9.3 | 24.9 | 5.1 | 1.5 | 113.9 | |||||||||||||||||
* | Adjusted due to the adoption of ASU 2015-03 and ASU 2015-15. |
Business line information
Over 95% of the Company’s net sales from external customers relate to its industrial chemical business. Other sales to external customers relate to pest control products and equipment related to the pest management industry and services for collecting and arranging for the transportation of hazardous and nonhazardous waste.
Risks and concentrations
No single customer accounted for more than 10% of net sales in any of the years presented.
The Company is exposed to credit loss and loss of liquidity availability if the financial institutions or counterparties issuing us debt securities fail to perform. We minimize exposure to these credit risks by dealing with a diversified group of investment grade financial institutions. We manage credit risk by monitoring the credit ratings and market indicators of credit risk of our lending counterparties. We do not anticipate any nonperformance by any of the counterparties.
The Company has portions of its labor force that are a part of collective bargaining agreements. A work stoppage or other limitation on operations could occur as a result of disputes under existing collective bargaining agreements with labor unions or government based work counsels or in connection with negotiation of new collective bargaining agreements. As of December 31, 2016 and 2015, approximately 25 percent of the Company’s labor force is covered by a collective bargaining agreement. As of December 31, 2016, approximately 3 percent of the Company’s labor force is covered by a collective bargaining agreement that will expire within one year.
119
22. Quarterly financial information (unaudited)
The following tables contain selected unaudited statement of operations information for each quarter of the year ended December 31, 2016 and 2015. The tables include all adjustments, consisting only of normal recurring adjustments, that is necessary for fair presentation of the consolidated financial position and operating results for the quarters presented. Our business is affected by seasonality, which historically has resulted in higher sales volume during our second and third quarter.
Unaudited quarterly results for the year ended December 31, 2016 are as follows:
(in millions, except per share data) | March 31 | June 30 | September 301 | December 312 | |||||||||||
Net sales | $ | 1,999.0 | $ | 2,262.5 | $ | 1,999.7 | $ | 1,812.5 | |||||||
Gross profit | 430.3 | 445.4 | 438.1 | 413.3 | |||||||||||
Net income (loss) | 14.0 | 39.8 | (63.0 | ) | (59.2 | ) | |||||||||
Income (loss) per share: | |||||||||||||||
Basic and diluted | $ | 0.10 | $ | 0.29 | $ | (0.46 | ) | $ | (0.43 | ) | |||||
Shares used in computation of income (loss) per share: | |||||||||||||||
Basic | 137.6 | 137.6 | 137.7 | 138.1 | |||||||||||
Diluted. | 137.8 | 138.1 | 137.7 | 138.1 | |||||||||||
(1) | Included in the third quarter of 2016 was an impairment charge of $133.9 million. Refer to “Note 13: Impairment charges” for further information. |
(2) | Included in the fourth quarter of 2016 was a loss of $68.6 million relating to the annual mark to market adjustment on the defined benefit pension and postretirement plans. Refer to “Note 8: Employee benefit plans” for further information. |
Unaudited quarterly results for the year ended December 31, 2015 are as follows:
(in millions, except share and per share data) | March 31 | June 301 | September 302 | December 313 | |||||||||||
Net sales | $ | 2,299.1 | $ | 2,510.1 | $ | 2,206.3 | $ | 1,966.3 | |||||||
Gross profit | 461.6 | 467.2 | 450.5 | 419.8 | |||||||||||
Net income (loss) | 19.7 | (12.4 | ) | 12.1 | (2.9 | ) | |||||||||
Income (loss) per share: | |||||||||||||||
Basic and diluted | $ | 0.19 | $ | (0.12 | ) | $ | 0.09 | $ | (0.02 | ) | |||||
Shares used in computation of income (loss) per share: | |||||||||||||||
Basic | 99.9 | 102.8 | 137.6 | 137.6 | |||||||||||
Diluted | 100.4 | 102.8 | 138.4 | 137.6 | |||||||||||
(1) | Included in the second quarter of 2015 was a contract termination fee of $26.2 million related to terminating consulting agreements between the Company and CVC and CD&R as a result of the IPO. In addition, there was a loss on extinguishment of debt of $7.3 million related to the write-off of unamortized debt issuance costs and debt discount related to the Company paying the remaining principal balance related to the Senior Subordinated Notes. Refer to “Note 15: Debt” for further information. Also, there was a loss due to discontinuance of cash flow hedges of $7.5 million related to the interest rate swap contracts. Refer to “Note 17: Derivatives” for further information. |
(2) | Included in the third quarter of 2015 was a loss on extinguishment of $4.8 million and debt refinancing expenses of $16.5 million related to the July 2015 debt refinancing transactions. Refer to “Note 15: Debt” for further information. |
(3) | Included in the fourth quarter of 2015 was a loss of $21.1 million relating to the annual mark to market adjustment on the defined benefit pension and postretirement plans. Refer to “Note 8: Employee benefit plans” for further information. |
23. Subsequent events
On January 19, 2017, the Senior Term B loan agreement was amended to lower the interest rate by 0.50% from 3.25% to 2.75% and remove the 1.00% LIBOR floor. Annualized, interest savings is over $11.0 million. There is no change to total outstanding debt, maturities or covenants as a result of this amendment. Total fees and expenses associated with the amendment are expected to be less than $5.0 million.
On January 30, 2017, the compensation committee of the Company’s Board of Directors has approved a special equity award to be granted to Stephen D. Newlin, Chairman and Chief Executive Officer of the Company, consisting of 300,000 restricted stock units, to be granted on January 30, 2017, and 300,000 stock options, to be granted on February 2, 2017, in each case under the Univar Inc. 2015 Omnibus Equity Incentive Plan.
On January 31, 2017, certain of the Company’s stockholders, including investment funds affiliated with Clayton, Dubilier & Rice LLC and Dahlia Investments Pte. Ltd. and Temasek Holdings Limited entered into an underwriting agreement to sell
120
15,000,000 shares of the Company’s common stock. After the transaction, Clayton, Dubilier & Rice LLC and Dahlia Investments Pte. Ltd. and Temasek Holdings Limited, ownership in the Company was 15.4% and 10.1%, respectively.
ITEM 9. | CHANGES IN AND DISAGREEMENTS WITH ACCOUNTANTS ON ACCOUNTING AND FINANCIAL DICLOSURE |
None.
ITEM 9A. CONTROLS AND PROCEDURES
Evaluation of Disclosure Controls and Procedures
As of December 31, 2016, we carried out an evaluation, under the supervision and with the participation of our management, including our Chief Executive Officer and our Chief Financial Officer, of the effectiveness of the design and operation of our disclosure controls and procedures (as such term is defined in Rule 13a-15(e) under the Securities Exchange Act of 1934 as amended). Based upon that evaluation, our Chief Executive Officer and our Chief Financial Officer concluded that our disclosure controls and procedures are designed at a reasonable assurance level and are effective to provide reasonable assurance that information we are required to disclose in reports that we file or submit under the Exchange Act is recorded, processed, summarized, and reported within the time periods specified in the rules and forms of the Securities and Exchange Commission ("SEC"), and that such information is accumulated and communicated to our management, including our CEO and CFO, as appropriate, to allow timely decisions regarding required disclosure.
Changes in Internal Control
There were no changes in our internal control over financial reporting identified in management’s evaluation pursuant to Rules 13a-15(d) of the Exchange Act during the period covered by this Annual Report on Form 10-K that materially affected, or are reasonably likely to materially affect, our internal control over financial reporting.
Management’s Report on Internal Control over Financial Reporting
Our management is responsible for establishing and maintaining adequate internal control over financial reporting for the company. Internal control over financial reporting is a process to provide reasonable assurance regarding the reliability of our financial reporting for external purposes in accordance with accounting principles generally accepted in the United States of America. Internal control over financial reporting includes maintaining records that in reasonable detail accurately and fairly reflect our transactions; providing reasonable assurance that transactions are recorded as necessary for preparation of our financial statements; providing reasonable assurance that receipts and expenditures of company assets are made in accordance with management authorization; and providing reasonable assurance that unauthorized acquisition, use, or disposition of company assets that could have a material effect on our financial statements would be prevented or detected on a timely basis. Because of its inherent limitations, internal control over financial reporting is not intended to provide absolute assurance that a misstatement of our financial statements would be prevented or detected.
Management conducted an assessment of the effectiveness of the Company’s internal control over financial reporting based on the criteria set forth in Internal Control – Integrated Framework issued by the Committee of Sponsoring Organizations of the Treadway Commission (2013 framework). Based on the Company’s assessment, management has concluded that its internal control over financial reporting was effective as of December 31, 2016 to provide reasonable assurance regarding the reliability of financial reporting and the preparation of financial statements in accordance with GAAP. The Company’s independent registered public accounting firm, Ernst & Young LLP, has issued an audit report on the Company’s internal control over financial reporting, which appears in Part II, Item 8 of this Form 10-K.
ITEM 9B. OTHER INFORMATION
None.
PART III
ITEM 10. DIRECTORS, EXECUTIVE OFFICERS AND CORPORATE GOVERANCE
Information about our directors is incorporated by reference from the discussion under the heading “Proposal 1: Election of Directors” to be included in the Proxy Statement. Information about compliance with Section 16(a) of the Securities Exchange Act of 1934, as amended, is incorporated by reference from the discussion under the heading “Section 16(a) Beneficial Ownership
121
Reporting Compliance” to be included in the Proxy Statement. Information about our Audit Committee, including the members of the Committee, and our Audit Committee financial experts, is incorporated by reference from the discussion under the heading “Governance of the Company,” and headings “What is the composition of the Board of Directors and how often are members elected?,” “What is the Board’s Leadership Structure?,” “Who are this year’s nominees?”, “What are the committees of the Board?,” “Class II Directors Term Expiring in 2017”, and “Class III Directors Term Expiring in 2018, “ to be included in the Proxy Statement. Information about our Code of Conduct is incorporated by reference from the discussion under the heading “What are the Company’s Corporate Governance Guidelines and Ethics Policies?” to be included in the Proxy Statement. Information regarding our executive officers is presented under the heading “Executive Officers of the Registrant pursuant to Instruction 3 to Regulation S-K, Item 401(b)” to be included in the Proxy Statement and is incorporated herein by reference.
ITEM 11. EXECUTIVE COMPENSATION
Information appearing under the headings entitled “Executive Compensation” and “Compensation, Discussion and Analysis” to be included in the Proxy Statement is incorporated herein by reference. However, pursuant to Instructions to Item 407(e)(5) of Securities and Exchange Commission Regulation S-K, the material appearing under the heading “Compensation Committee Report” shall not be deemed to be “filed” with the Commission.
ITEM 12. | SECURITY OWNERSHIP OF CERTAIN BENEFICIAL OWNERS AND MANAGEMENT AND RELATED STOCKHOLDER MATTERS |
Information appearing under the heading entitled “Stock Ownership Information” to be included in the Proxy Statement is incorporated herein by reference.
A total of approximately 97.2 million shares of Common Stock held by the Equity Investors, who are deemed to be “affiliates” of the Company, have been excluded from the computation of market value of our common stock on the cover page of this Form 10-K. This total represents that portion of the shares reported as beneficially owned by our directors and executive officers as of June 30, 2016 which are actually issued and outstanding.
ITEM 13. | CERTAIN RELATIONSHIPS AND RELATED PARTY TRANSACTIONS, AND DIRECTOR INDEPENDENCE |
Refer to the information under the captions entitled “How does the Board determine which directors are considered independent?” and “What relationships and policies does the Company have with respect to transactions with related persons?,” to be included in the Proxy Statement, all of which information is incorporated herein by reference.
ITEM 14. PRINCIPAL ACCOUNTANT FEES AND SERVICES
Refer to the information under the caption entitled “What fees did the Company pay to Ernst & Young LLP for audit and other services for the fiscal years ended December 31, 2016 and to Ernst & Young LLP for audit and other services for the fiscal year 2015?” to be included in the Proxy Statement, all of which information is incorporated herein by reference.
122
PART IV
ITEM 15. EXHIBITS AND FINANCIAL STATEMENT SCHEDULES
(a)(1) Financial Statements
Reference is made to the information set forth in Part II, Item 8 of this Annual Report on Form 10-K, which information is incorporated herein by reference.
(a)(2) Financial Statement Schedules
These schedules are omitted because they are not required or because the information is set forth in the financial statements or the notes thereto.
(a)(3) Exhibits
Exhibit Number | Exhibit Description | |
3.1 | Third Amended and Restated Certificate of Incorporation of Univar Inc., incorporated by reference to Exhibit 3.1 to the Registration Statement on Form S-8 of Univar Inc., filed June 23, 2015. | |
3.2 | Second Amended and Restated Bylaws of Univar Inc., incorporated by reference to Exhibit 3.1 to the Registration Statement on Form S-8 of Univar Inc., filed June 23, 2015. | |
4.1 | Form of Common Stock Certificate, incorporated by reference to Exhibit 4.1 to the Registration Statement on Form S-1 of Univar Inc., filed on June 8, 2015. | |
4.2 | Fourth Amended and Restated Stockholders’ Agreement, incorporated by reference to Exhibit 4.2 to the Form 10-K of Univar Inc., filed on March 3, 2016 | |
4.3 | Indenture, dated as of July 1, 2015, between Univar USA Inc., the guarantors listed on the signature pages thereto and Wilmington Trust, National Association, incorporated by reference to Exhibit 4.1 to the Current Report on Form 8-K of Univar Inc., filed on July 7, 2015. | |
4.4 | First Supplemental Indenture, dated as of July 1, 2015, between Univar USA Inc., the guarantors listed on the signature pages thereto and Wilmington Trust, National Association, incorporated by reference to Exhibit 4.2 to the Current Report on Form 8-K of Univar Inc., filed on July 7, 2015. | |
4.5 | Form of 6.75% Senior Note due 2023 (included in Exhibit 4.3 hereto), incorporated by reference to Exhibit 4.3 to the Current Report on Form 8-K of Univar Inc., filed on July 7, 2015. | |
10.1 | European ABL Facility Agreement, dated as of March 24, 2014, by and among Univar B.V., the other borrowers from time to time party thereto, Univar Inc., as guarantor, J.P. Morgan Securities LLC, as sole lead arranger and joint bookrunner, Bank of America, N.A., as joint bookrunner and syndication agent, and J.P. Morgan Europe Limited, as administrative agent and collateral agent, incorporated by reference to Exhibit 10.16 to the Registration Statement on Form S-1 of Univar Inc., filed on August 14, 2014. | |
10.2 | Agreement in Relation to Technical Correction Amendment to the European ABL Facility Agreement, dated as of May 27, 2015, among Univar B.V. and J.P. Morgan Europe Limited, in its capacity as administrative agent, incorporated by reference to Exhibit 10.64 to the Registration Statement on Form S-1 of Univar Inc., filed on June 8, 2015. | |
10.3 | ABL Credit Agreement, dated as of July 28, 2015 between Univar Inc. and certain of its subsidiaries, the several banks and financial institutions from time to time party thereto and Bank of America, N.A., incorporated by reference to Exhibit 10.1 to the Current Report on Form 8-K of Univar Inc., filed on July 30, 2015. | |
10.4 | ABL Collateral Agreement, dated as of July 28, 2015, made by Univar Inc., Univar USA Inc. and the guarantors listed on the signature pages thereto in favor of Bank of America, N.A, as collateral agent for the banks and other financial institutions that are parties to the Credit Agreement, incorporated by reference to Exhibit 10.2 to the Current Report on Form 8-K of Univar Inc., filed on July 30, 2015. | |
10.5 | Notice and Confirmation of Grant of Security Interest in Copyrights, dated July 28, 2015, made by Univar USA Inc. in favor of Bank of America, N.A., as collateral agent for the banks and other financial institutions that are parties to the Credit Agreement, incorporated by reference to Exhibit 10.3 to the Current Report on Form 8-K of Univar Inc., filed on July 30, 2015. | |
123
10.6 | Notice and Confirmation of Grant of Security Interest in Trademarks, dated July 28, 2015, made by Univar USA Inc., Magnablend, Inc. and ChemPoint.com Inc. in favor of Bank of America, N.A., as collateral agent for the banks and other financial institutions that are parties to the Credit Agreement, incorporated by reference to Exhibit 10.4 to the Current Report on Form 8-K of Univar Inc., filed on July 30, 2015. | |
10.7 | Notice and Confirmation of Grant of Security Interest in Patents, dated July 28, 2015, made by Magnablend, Inc. in favor of Bank of America, N.A., as collateral agent for the banks and other financial institutions that are parties to the Credit Agreement, incorporated by reference to Exhibit 10.5 to the Current Report on Form 8-K of Univar Inc., filed on July 30, 2015. | |
10.8 | First Amendment to Credit Agreement and Amended Credit Agreement, dated as of January 19, 2017 between Univar USA Inc., Univar Inc., the several banks and financial institutions from time to time party thereto and Bank of America, N.A., incorporated by reference to Exhibit 10.1 to the Current Report on Form 8-K of Univar Inc., filed on January 20, 2017. | |
10.9 | Credit Agreement, dated as of July 1, 2015 between Univar USA Inc., Univar Inc., the several banks and financial institutions from time to time party thereto and Bank of America, N.A., incorporated by reference to Exhibit 10.1 to the Current Report on Form 8-K of Univar Inc., filed on July 7, 2015. | |
10.10 | Term Loan Guarantee and Collateral Agreement, dated as of July 1, 2015, made by Univar Inc., Univar USA Inc. and the guarantors listed on the signature pages thereto in favor of Bank of America, N.A, as collateral agent for the banks and other financial institutions that are parties to the Credit Agreement, incorporated by reference to Exhibit 10.2 to the Current Report on Form 8-K of Univar Inc., filed on July 7, 2015. | |
10.11 | Notice and Confirmation of Grant of Security Interest in Copyrights, dated July 1, 2015, made by Univar USA Inc. in favor of Bank of America, N.A., as collateral agent for the banks and other financial institutions that are parties to the Credit Agreement, incorporated by reference to Exhibit 10.3 to the Current Report on Form 8-K of Univar Inc., filed on July 7, 2015. | |
10.12 | Notice and Confirmation of Grant of Security Interest in Trademarks, dated July 1, 2015, made by Univar USA Inc., Magnablend, Inc. and ChemPoint.com Inc. in favor of Bank of America, N.A., as collateral agent for the banks and other financial institutions that are parties to the Credit Agreement, incorporated by reference to Exhibit 10.4 to the Current Report on Form 8-K of Univar Inc., filed on July 7, 2015. | |
10.13 | Notice and Confirmation of Grant of Security Interest in Patents, dated July 1, 2015, made by Magnablend, Inc. in favor of Bank of America, N.A., as collateral agent for the banks and other financial institutions that are parties to the Credit Agreement, incorporated by reference to Exhibit 10.5 to the Current Report on Form 8-K of Univar Inc., filed on July 7, 2015. | |
10.14† | Letter Agreement, dated January 31, 2013, by and among Univar N.V., CD&R Univar Holdings, L.P. and Mark J. Byrne, incorporated by reference to Exhibit 10.22 to the Registration Statement on Form S-1 of Univar Inc., filed on August 14, 2014. | |
10.15† | Employment Agreement, dated as of April 19, 2012, by and between Univar Inc. and J. Erik Fyrwald, incorporated by reference to Exhibit 10.23 to the Registration Statement on Form S-1 of Univar Inc., filed on August 14, 2014. | |
10.16† | Resignation Agreement and Release, dated as of May 3, 2016, by and between Univar Inc. and Mr. Fyrwald incorporated by reference to Exhibit 10.1 to the Current Report on Form 8-K of Univar Inc., filed on May 3, 2016. | |
10.17† | Employment Agreement, dated as of December 17, 2013, by and between Univar Inc. and Stephen N. Landsman, incorporated by reference to Exhibit 10.17 to the Form 10-K of Univar Inc., filed on March 3, 2016. | |
10.18†* | 2016 Univar Inc. Management Incentive Plan. | |
10.19† | Univar Inc. 2011 Stock Incentive Plan, effective as of March 28, 2011, incorporated by reference to Exhibit 10.32 to the Registration Statement on Form S-1 of Univar Inc., filed on August 14, 2014. | |
10.20† | Amendment No. 1 to the Univar Inc. 2011 Stock Incentive Plan, dated as of November 30, 2012, incorporated by reference to Exhibit 10.33 to the Registration Statement on Form S-1 of Univar Inc., filed on August 14, 2014. | |
10.21† | Form of Employee Stock Option Agreement, incorporated by reference to Exhibit 10.34 to the Registration Statement on Form S-1 of Univar Inc., filed on August 14, 2014. | |
124
10.22† | Employee Restricted Stock Agreement, dated as of November 30, 2012, by and between Univar Inc. and J. Erik Fyrwald, incorporated by reference to Exhibit 10.11 to the Registration Statement on Form S-1 of Univar Inc., filed on August 14, 2014. | |
10.23† | Univar USA Inc. Supplemental Valued Investment Plan, dated as of May 29, 2014, incorporated by reference to Exhibit 10.27 to the Form 10-K of Univar Inc., filed on March 3, 2016 | |
10.24†* | First Amendment to the Univar USA Inc. Supplemental Valued Investment Plan, dated as of May 31, 2016. | |
10.25†* | Second Amendment to the Univar USA Inc. Supplemental Valued Investment Plan, dated as of June 27, 2016. | |
10.26† | Univar Canada Ltd. Supplemental Benefits Plan, dated as of June 12, 2007, incorporated by reference to Exhibit 10.28 to the Form 10-K of Univar Inc., filed on March 3, 2016. | |
10.27† | Univar USA Inc. Supplemental Benefits Retirement Plan, dated as of July 1, 2004, incorporated by reference to Exhibit 10.45 to the Registration Statement on Form S-1 of Univar Inc., filed on August 14, 2014. | |
10.28† | First Amendment to the Univar USA Inc. Supplemental Retirement Plan, dated as of May 17, 2005, incorporated by reference to Exhibit 10.30 to the Form 10-K of Univar Inc., filed on March 3, 2016. | |
10.29† | Second Amendment to the Univar USA Inc. Supplemental Retirement Plan, dated as of August 24, 2006, incorporated by reference to Exhibit 10.31 to the Form 10-K of Univar Inc., filed on March 3, 2016. | |
10.30† | Third Amendment to the Univar USA Inc. Supplemental Retirement Plan, dated as of June 11, 2007, incorporated by reference to Exhibit 10.32 to the Form 10-K of Univar Inc., filed on March 3, 2016. | |
10.31† | Fourth Amendment to the Univar USA Inc. Supplemental Retirement Plan, dated as of December 6, 2007, incorporated by reference to Exhibit 10.46 to the Registration Statement on Form S-1 of Univar Inc., filed on August 14, 2014. | |
10.32† | Fifth Amendment to the Univar USA Inc. Supplemental Retirement Plan, dated as of December 6, 2007, incorporated by reference to Exhibit 10.34 to the Form 10-K of Univar Inc., filed on March 3, 2016. | |
10.33† | Sixth Amendment to the Univar USA Inc. Supplemental Retirement Plan, dated as of December 19, 2007, incorporated by reference to Exhibit 10.35 to the Form 10-K of Univar Inc., filed on March 3, 2016. | |
10.34† | Seventh Amendment to the Univar USA Inc. Supplemental Retirement Plan, dated as of June 19, 2008, incorporated by reference to Exhibit 10.36 to the Form 10-K of Univar Inc., filed on March 3, 2016. | |
10.35† | Eighth Amendment to the Univar USA Inc. Supplemental Retirement Plan, dated as of December 23, 2008, incorporated by reference to Exhibit 10.37 to the Form 10-K of Univar Inc., filed on March 3, 2016. | |
10.36† | Ninth Amendment to the Univar USA Inc. Supplemental Retirement Plan, dated as of December 21, 2009, incorporated by reference to Exhibit 10.38 to the Form 10-K of Univar Inc., filed on March 3, 2016. | |
10.37† | Univar Inc. 2015 Omnibus Equity Incentive Plan is incorporated by reference to Exhibit 10.3 to the Registration Statement on Form S-8 of Univar Inc., filed June 23, 2015. | |
10.38† | Employment Agreement, dated as of December 8, 2014, by and between Univar Inc. and Carl J. Lukach, incorporated by reference to Exhibit 10.48 to the Registration Statement on Form S-1 of Univar Inc., filed on May 26, 2015. | |
10.39† | Amended and Restated Employment Agreement, dated as of February 1, 2014, by and between Univar Inc. and Mark J. Byrne, incorporated by reference to Exhibit 10.51 to the Registration Statement on Form S-1 of Univar Inc., filed on May 26, 2015. | |
10.40† | Consulting Agreement, dated as of February 1, 2015, by and between Univar Inc. and Mark J. Byrne, incorporated by reference to Exhibit 10.52 to the Registration Statement on Form S-1 of Univar Inc., filed on May 26, 2015. | |
10.41† | Employment Agreement, dated as of January 10, 2011, by and between Univar Europe Limited and David Jukes, incorporated by reference to Exhibit 10.53 to the Registration Statement on Form S-1 of Univar Inc., filed on May 26, 2015. | |
125
10.42† | Offer Letter, dated April 19, by and between Univar Europe Limited and David Jukes, incorporated by reference to Exhibit 10.1 to the Current Report on Form 8-K of Univar Inc., filed on April 19, 2016. | |
10.43† | Amendment Agreement, dated as of April 18, 2016, by and between Univar Europe Limited and David Jukes, incorporated by reference to Exhibit 10.1 to the Current Report on Form 8-K of Univar Inc., filed on April 19, 2016. | |
10.44 | Indemnification Agreement, dated as of November 30, 2010, by and among CVC European Equity Partners IV (A) L.P., CVC European Equity Partners IV (B) L.P., CVC European Equity Partners IV (C) L.P., CVC European Equity Partners IV (D) L.P., CVC European Equity Partners IV (E) L.P., CVC European Equity Partners Tandem Fund (A) L.P., CVC European Equity Partners Tandem Fund (B) L.P., CVC European Equity Partners Tandem Fund (C) L.P., CVC European Equity IV (AB) Limited, CVC European Equity IV (CDE) Limited, CVC European Equity Tandem GP Limited, CVC Capital Partners Advisory Company (Luxembourg) S.à.r.l, Univar Inc. and Univar USA Inc., incorporated by reference to Exhibit 10.54 to the Registration Statement on Form S-1 of Univar Inc., filed on May 26, 2015. | |
10.45 | Indemnification Agreement, dated as of November 30, 2010, by and among CD&R Univar Holdings, L.P., Clayton, Dubilier & Rice Fund VIII, L.P., CD&R Friends & Family Fund VIII, L.P., CD&R Advisor Univar Co-Investor, L.P., CD&R Univar Co-Investor, L.P., CD&R Univar Co-Investor II, L.P., CD&R Univar NEP VIII Co-Investor, LLC, CD&R Univar NEP IX Co-Investor, LLC, Clayton, Dubilier & Rice, LLC, Univar Inc. and Univar USA Inc., incorporated by reference to Exhibit 10.55 to the Registration Statement on Form S-1 of Univar Inc., filed on May 26, 2015. | |
10.46 | Form of Director Indemnification Agreement, incorporated by reference to Exhibit 10.56 to the Registration Statement on Form S-1 of Univar Inc., filed on June 8, 2015. | |
10.47 | Termination Agreement by and among Univar Inc., Univar USA Inc. and Clayton, Dubilier & Rice, LLC, incorporated by reference to Exhibit 10.47 to the Form 10-K of Univar Inc., filed on March 3, 2016. | |
10.48 | Termination Agreement by and among Univar, Inc., Univar USA, Inc., CVC European Equity IV (AB) Limited, CVC European Equity IV (CDE) Limited and CVC Europe Equity Tandem GP Limited, incorporated by reference to Exhibit 10.48 to the Form 10-K of Univar Inc., filed on March 3, 2016. | |
10.49 | Termination Agreement by and among Univar, Inc., Univar USA, Inc., and CVC Capital Partners Advisory Company (Luxembourg) S.à.r.l, incorporated by reference to Exhibit 10.49 to the Form 10-K of Univar Inc., filed on March 3, 2016. | |
10.50† | 2014 Form of Employee Stock Option Agreement, incorporated by reference to Exhibit 10.62 to the Registration Statement on Form S-1 of Univar Inc., filed on May 26, 2015. | |
10.51† | 2014 Form of Employee Restricted Stock Agreement, incorporated by reference to Exhibit 10.63 to the Registration Statement on Form S-1 of Univar Inc., filed on May 26, 2015. | |
10.52 | Stock Purchase Agreement dated June 1, 2015, among Univar Inc., Dahlia Investments Pte. Ltd., and Univar N.V., incorporated by reference to Exhibit 10.65 to the Registration Statement on Form S-1 of Univar Inc., filed on June 8, 2015. | |
10.53† | Univar Inc. Employee Stock Purchase Plan is incorporated by reference to Exhibit 10.4 to the Registration Statement on Form S-8 of Univar Inc., filed June 23, 2015. | |
10.54† | Form of Employee Stock Option Agreement for awards granted between June 23, 2015 and February 1, 2017, 2015 Omnibus Equity Incentive Plan, incorporated by reference to Exhibit 10.5 to the Registration Statement on Form S-8 of Univar Inc., filed June 23, 2015. | |
10.55† | Form of Employee Restricted Stock Unit Agreement for awards granted between June 23, 2015 and February 1, 2017, 2015 Omnibus Equity Incentive Plan, incorporated by reference to Exhibit 10.6 to the Registration Statement on Form S-8 of Univar Inc., filed June 23, 2015. | |
10.56† | Form of Director Restricted Stock Agreement, 2015 Omnibus Equity Incentive Plan, incorporated by reference to Exhibit 10.7 to the Registration Statement on Form S-8 of Univar Inc., filed June 23, 2015. | |
10.57† | Employment Agreement, dated as of October 15, 2010, by and between Univar Canada Ltd. and Michael Hildebrand, incorporated by reference to Exhibit 10.57 to the Form 10-K of Univar Inc., filed on March 3, 2016. | |
10.58† | Employment Agreement, dated May 3, 2016, by and between Univar Inc. and Mr. Newlin incorporated by reference to Exhibit 10.1 to the Current Report on Form 8-K of Univar Inc., filed on May 3, 2016. | |
126
10.59† | Employee Restricted Stock Unit Agreement, dated as of May 3, 2016, by and between Univar Inc. and Mr. Newlin, incorporated by reference to Exhibit 10.1 to the Current Report on Form 8-K of Univar Inc. filed on May 3, 2016. | |
10.60† | Amendment to Employee Restricted Stock Unit Agreement, dated December 23, 2016, by and between Univar Inc. and Mr. Newlin, incorporated by reference to Exhibit 10.1 to the Current Report on Form 8-K of Univar Inc. filed on May 3, 2016. | |
10.61† | Employee Restricted Stock Unit Agreement, dated as of January 30, 2016, by and between Univar Inc. and Mr. Newlin, incorporated by reference to Exhibit 10.1 to the Current Report on Form 8-K of Univar Inc. filed on January 30, 2016. | |
10.62† | Employee Stock Option Agreement, dated as of January 30, 2016, by and between Univar Inc. and Mr. Newlin, incorporated by reference to Exhibit 10.2 to the Current Report on Form 8-K of Univar Inc. filed on January 30, 2016. | |
10.63† | Employment Agreement, dated as of November 19, 2012, by and between Univar Inc. and Christopher Oversby, incorporated by reference to Exhibit 10.60 to the Registration Statement on Form S-1 of Univar Inc., filed on May 26, 2015. | |
10.64† | First Amendment to Employment Agreement, dated as of August 8, 2013, by and between Univar Inc. and Christopher Oversby, incorporated by reference to Exhibit 10.61 to the Registration Statement on Form S-1 of Univar Inc., filed on May 26, 2015. | |
10.65†* | Release, dated as of January 16, 2017, by and between Univar Inc. and Christopher Oversby. | |
10.66†* | Offer Letter Offer Letter, dated April 24, 2016, by and between Univar Inc. and Christopher Oversby. | |
10.67†* | Form of Employee Stock Option Agreement for awards granted after February 1, 2017, 2015 Omnibus Equity Incentive Plan. | |
10.68†* | Form of Employee Restricted Stock Unit Agreement for awards granted after February 1, 2017, 2015 Omnibus Equity Incentive Plan. | |
21.1* | List of Subsidiaries | |
23.1* | Consent of Ernst & Young LLP, Independent Registered Public Accounting Firm | |
31.1* | Certification of Chief Executive Officer Pursuant to Section 302 of the Sarbanes-Oxley Act of 2002 | |
31.2* | Certification of Chief Financial Officer Pursuant to Section 302 of the Sarbanes-Oxley Act of 2002 | |
32.1** | Certification of Chief Executive Officer Pursuant to Section 906 of the Sarbanes-Oxley Act of 2002 | |
32.2** | Certification of Chief Financial Officer Pursuant to Section 906 of the Sarbanes-Oxley Act of 2002 | |
101.1 | XBRL Instance Document | |
† | Identifies each management compensation plan or arrangement. |
* | Filed herewith. |
** | Furnished herewith. |
127
Signatures
Pursuant to the requirements of Section 13 or 15(d) of the Securities Exchange Act of 1934, the registrant has duly caused this report to be signed on its behalf by the undersigned, thereunto duly authorized.
Univar Inc.
By: /s/ CARL J. LUKACH |
Carl J. Lukach, Executive Vice President and Chief Financial Officer |
Dated February 28, 2017
Pursuant to the requirements of the Securities Exchange Act of 1934, this report has been signed below by the following persons on behalf of the registrant and in the capacities and on the date indicated.
By: /s/ STEPHEN D. NEWLIN | By: /s/ WILLIAM S. STAVROPOULOS | |
Stephen D. Newlin, President, Chief Executive Officer and Chairman of the Board (Principal Executive Officer) | William S. Stavropoulos, Lead Director | |
By: /s/ CARL J. LUKACH | By: /s/ MARK J. BYRNE | |
Carl J. Lukach, Executive Vice President and Chief Financial Officer (Principal Financial Officer and Principal Accounting Officer) | Mark J. Byrne, Director | |
By: /s/ RICHARD P. FOX | By: /s/ STEPHEN W. SHAPIRO | |
Richard P. Fox, Director | Stephen W. Shapiro, Director | |
By: /s/ ROBERT L. WOOD | By: /s/ EDWARD J. MOONEY | |
Robert L. Wood, Director | Edward J. Mooney, Director | |
By: /s/ DANIEL P. DOHENY | By: /s/ CHRISTOPHER D. PAPPAS | |
Daniel P. Doheny, Director | Christopher D. Pappas, Director | |
By: /s/ DAVID H. WASSERMAN | By: /s/ JULIET TEO | |
David H. Wasserman, Director | Juliet Teo, Director | |
128