Attached files
| file | filename |
|---|---|
| EX-23.2 - EXHIBIT 23.2 CONSENT OF INDEPENDENT REGISTERED PUBLIC ACCOUNTING FIRM - Syneos Health, Inc. | exhibit232auditorconsent_d.htm |
| EX-32.2 - EXHIBIT 32.2 SECTION 906 CFO CERTIFICATION - Syneos Health, Inc. | exhibit322section906cfo_20.htm |
| EX-32.1 - EXHIBIT 32.1 SECTION 906 CEO CERTIFICATION - Syneos Health, Inc. | exhibit321section906ceo_20.htm |
| EX-31.2 - EXHIBIT 31.2 SECTION 302 CFO CERTIFICATION - Syneos Health, Inc. | exhibit312section302cfo_20.htm |
| EX-31.1 - EXHIBIT 31.1 SECTION 302 CEO CERTIFICATION - Syneos Health, Inc. | exhibit311section302ceo_20.htm |
| EX-23.1 - EXHIBIT 23.1 CONSENT OF INDEPENDENT REGISTERED PUBLIC ACCOUNTING FIRM - Syneos Health, Inc. | exhibit231auditorconsent_e.htm |
| EX-21.1 - EXHIBIT 21.1 SIGNIFICANT SUBSIDIARIES OF REGISTRANT - Syneos Health, Inc. | exhibit211subsidiaries_2016.htm |
UNITED STATES
SECURITIES AND EXCHANGE COMMISSION
Washington, D.C. 20549
FORM 10-K
(Mark One)
ý | ANNUAL REPORT PURSUANT TO SECTION 13 OR 15(d) OF THE SECURITIES EXCHANGE ACT OF 1934 |
For the fiscal year ended December 31, 2016
or
¨ | TRANSITION REPORT PURSUANT TO SECTION 13 OR 15(d) OF THE SECURITIES EXCHANGE ACT OF 1934 |
For the transition period from _______ to ______
Commission File Number: 001-36730
INC RESEARCH HOLDINGS, INC.
(Exact name of registrant as specified in its charter)
Delaware | 27-3403111 | |
(State or other jurisdiction of incorporation or organization) | (I.R.S. Employer Identification No.) | |
3201 Beechleaf Court, Suite 600 Raleigh, North Carolina | 27604-1547 | |
(Address of principal executive offices) | (Zip Code) | |
Registrant’s telephone number, including area code: (919) 876-9300
Securities registered pursuant to Section 12(b) of the Act:
Title of each class | Name of each exchange on which registered | |
Class A Common Stock, par value $0.01 per share | The NASDAQ Stock Market LLC | |
Securities registered pursuant to Section 12(g) of the Act: None
Indicate by check mark if the registrant is a well-known seasoned issuer, as defined in Rule 405 of the Securities Act. Yes ý No ¨
Indicate by check mark if the registrant is not required to file reports pursuant to Section 13 or section 15(d) of the Exchange Act. Yes ¨ No ý
Indicate by check mark whether the registrant (1) has filed all reports required to be filed by Section 13 or 15(d) of the Securities Exchange Act of 1934 during the preceding 12 months (or for such shorter period that the registrant was required to file such reports), and (2) has been subject to such filing requirements for the past 90 days. Yes ý No ¨
Indicate by check mark whether the registrant has submitted electronically and posted on its corporate Web site, if any, every Interactive Data File required to be submitted and posted pursuant to Rule 405 of Regulation S-T during the preceding 12 months (or for such shorter period that the registrant was required to submit and post such files). Yes ý No ¨
Indicate by check mark if disclosure of delinquent filers pursuant to Item 405 of Regulation S-K is not contained herein, and will not be contained, to the best of registrant’s knowledge, in definitive proxy or information statements incorporated by reference in Part III of this Form 10-K or any amendment to this Form 10-K. ¨
Indicate by check mark whether the registrant is a large accelerated filer, an accelerated filer, a non-accelerated filer, or a smaller reporting company. See definition of “large accelerated filer,” “accelerated filer” and “smaller reporting company” in Rule 12b-2 of the Exchange Act. (Check one):
Large accelerated filer x | Accelerated filer ¨ | |
Non-accelerated filer ¨ (Do not check if a smaller reporting company) | Smaller reporting company ¨ | |
Indicate by check mark whether the registrant is a shell company (as defined in Rule 12b-2 of the Exchange Act). Yes ¨ No ý
The aggregate market value of the registrant’s common stock held by non-affiliates of the registrant, based on the closing sale price of $38.13 on June 30, 2016, was approximately $1,580,252,895. Common stock held by each officer and director and by each person known to the registrant who owned 10% or more of the outstanding common stock have been excluded in that such persons may be deemed to be affiliates. This determination of affiliate status is not necessarily a conclusive determination for other purposes.
As of February 21, 2017, there were approximately 54,001,001 shares of the registrant's common stock outstanding.
Portions of the registrant’s Proxy Statement for its 2017 Annual Meeting of Stockholders are incorporated by reference into Part III hereof.
1
INC RESEARCH HOLDINGS, INC.
FORM 10-K
For the Fiscal Year Ended December 31, 2016
TABLE OF CONTENTS
Page | ||
Item 1. | ||
Item 1A. | ||
Item 1B. | ||
Item 2. | ||
Item 3. | ||
Item 4. | ||
Item 5. | ||
Item 6 | ||
Item 7. | ||
Item 7A. | ||
Item 8. | ||
Item 9. | ||
Item 9A. | ||
Item 9B. | ||
Item 10. | ||
Item 11. | ||
Item 12. | ||
Item 13. | ||
Item 14. | ||
Item 15. | ||
1
PART I
FORWARD-LOOKING STATEMENTS
This Annual Report on Form 10-K contains forward-looking statements within the meaning of Section 27A of the Securities Act of 1933, as amended, or the Securities Act, and Section 21E of the Securities Exchange Act of 1934, as amended, or the Exchange Act. Such forward-looking statements reflect, among other things, our current expectations and anticipated results of operations, all of which are subject to known and unknown risks, uncertainties and other factors that may cause our actual results, performance or achievements, market trends, or industry results to differ materially from those expressed or implied by such forward-looking statements. Therefore, any statements contained herein that are not statements of historical fact may be forward-looking statements and should be evaluated as such. Without limiting the foregoing, the words “anticipates,” “believes,” "can," "continue," "could," “estimates,” “expects,” “intends,” “may,” "might," “plans,” “projects,” “should,” "would," “targets,” “will” and the negative thereof and similar words and expressions are intended to identify forward-looking statements. These forward-looking statements are subject to a number of risks, uncertainties and assumptions, including those described in “Risk Factors” in Part I, Item 1A of this report. Unless legally required, we assume no obligation to update any such forward-looking information to reflect actual results or changes in the factors affecting such forward-looking information.
As used in this report, the terms "INC Research Holdings, Inc.," "Company," "we," "us," and "our" mean INC Research Holdings, Inc. and its subsidiaries unless the context indicates otherwise.
Item 1. Business.
Overview
We are a leading global contract research organization ("CRO") based on revenues, focused primarily on Phase I to Phase IV clinical development services for the biopharmaceutical and medical device industries. We provide our customers with highly differentiated services across their development portfolios using either our therapeutic expertise as a full service provider or utilizing our global scale and systems as a functional service provider. We consistently and predictably deliver clinical development services, consulting, and real world evidence support in a complex environment and offer a proprietary, operational approach to the delivery of our projects through our Trusted Process® methodology. Our service offerings focus on optimizing the development of, and therefore, the commercial potential for, our customers' new biopharmaceutical compounds, enhancing returns on their research and development ("R&D") investments, and reducing their overhead costs by offering an attractive variable cost alternative to fixed cost, in-house resources.
Founded more than three decades ago as an academic organization dedicated to central nervous system research, we have translated that expertise into a global organization with a number of therapeutic specialties, as well as full data services and regulatory advisory and implementation support capabilities. Over the past decade, we have built our scale and capabilities to become a leading global provider of Phase I to Phase IV clinical development services, with approximately 6,800 employees in 50 countries across six continents as of December 31, 2016. Our broad global presence has enabled us to deliver clinical development services in more than 110 countries, providing our customers with access to diverse markets and patient populations, local regulatory expertise and local market knowledge.
We provide clinical development services through specialized therapeutic teams that have deep scientific expertise across the development portfolios of our customers. We believe our therapeutic focus and proprietary project management methodology have set us apart within our industry. We have particular strengths in the complex therapeutic areas such as CNS and Oncology which represent the largest and fastest growing therapeutic areas. Demonstrating our innovation and commitment to customer satisfaction, we were awarded the 2016 Frost & Sullivan Asia Pacific Contract Research Outsourcing Services Customer Value Leadership Award. Specifically, we were recognized for successfully expanding our customer base in the Asia Pacific region and driving significant repeat business while demonstrating a consistent focus on helping to accelerate the delivery of high quality, innovative products to market. Held annually in Singapore, the Frost & Sullivan Asia Pacific Best Practices Awards program recognizes best-in-class companies in the Asia Pacific region for demonstrating outstanding achievement and superior performance in areas such as
2
leadership, technological innovation, customer service and strategic product development. Industry analysts compare market participants and measure performance through interviews, analysis and secondary research in order to identify best practices in the industry.
We have also developed industry-leading relationships with principal investigators and clinical research sites, as demonstrated by being named the "Top CRO to Work With" among large global CROs in the 2015 CenterWatch Global Investigative Site Relationship Survey (the "2015 CenterWatch Survey") conducted by CenterWatch, a third-party leading publisher in the clinical trials industry. This survey, which is held every two years, covered responses from over 1,900 sites globally that evaluated 11 CROs, including the top five by revenue, across 38 specific relationship attributes. We ranked in the top three on 33 out of the 38 specific relationship attributes. We believe our ranking as “Top CRO to Work With” for a second straight time demonstrates the effectiveness of our business model and our ability to deliver high-quality clinical trial results on time and on budget for our customers.
Our extensive range of services supports the entire drug development process from Phase I to Phase IV and allows us to offer our customers an integrated suite of investigative site support and clinical development services. We offer these services across a wide variety of therapeutic areas, bringing deep clinical expertise with a primary focus on Phase I to Phase IV clinical trials delivered in both a turnkey full service clinical model, as well as large scale functional service models. We provide total biopharmaceutical program development while also providing discrete services for any part of a clinical trial. Our combination of service area experts and depth of clinical capability allows for enhanced protocol design and actionable trial data.
We have two reportable segments: Clinical Development Services and Phase I Services. The Clinical Development Services segment offers a variety of clinical development services, including full-service global studies, as well as ancillary services such as clinical monitoring, investigator recruitment, patient recruitment, data management, study reports to assist customers with their drug development process, quality assurance audits and specialized consulting services. The Phase I Services segment focuses on clinical development services for Phase I trials, which include scientific exploratory medicine, first-in-human studies through proof-of-concept stages and support for Phase I studies in established compounds. For further information about the Company's reportable segments, please see "Note 13 - Segment Information" in our consolidated financial statements included in Part II, Item 8 of this Annual Report on Form 10-K. For financial information about our revenue and long-lived assets by geographic area, please see "Note 14 - Operations by Geographic Location" in our consolidated financial statements included in Part II, Item 8 of this Annual Report on Form 10-K. International operations expose us to risks that differ from those applicable to operating in the United States, including foreign currency translation and transaction risks, risks of changes in tax laws and other risks described further in Part I, Item 1A "Risk Factors" of this Annual Report on Form 10-K.
For the year ended December 31, 2016, we had total net service revenue of $1,030.3 million, net income of $112.6 million, Adjusted Net Income of $139.0 million, and Adjusted EBITDA of $244.5 million. For important disclosures about our non-GAAP measures and a reconciliation of Adjusted Net Income and Adjusted EBITDA to our GAAP net income (loss), see Part II, Item 6, "Selected Financial Data" of this Annual Report on Form 10-K. For further information about our consolidated revenues and earnings, see our consolidated financial statements included in Part II, Item 8, "Financial Statements and Supplementary Data" and Part II, Item 7, "Management's Discussion and Analysis of Financial Condition and Results of Operations" of this Annual Report on Form 10-K.
Our diversified customer base includes a mix of many of the world's largest biopharmaceutical companies as well as high-growth, small and mid-sized biopharmaceutical companies. We deliver high quality service through our internally developed, metrics-driven Trusted Process®, which is our proprietary methodology designed to reduce operational risk and variability by standardizing clinical development services and implement quality controls throughout the clinical development process. We believe our Trusted Process® leads our customers to faster, better-informed drug development decisions.
We were established as INC Research in 1998, and our corporate headquarters is located in Raleigh, North Carolina. As a result of a corporate reorganization in connection with a business combination transaction, INC Research Holdings, Inc., was incorporated in Delaware in August 2010.
3
Our Market
The market for our services includes biopharmaceutical companies that outsource clinical development services. We believe we are well-positioned to benefit from the following market trends:
Trends in late-stage clinical development outsourcing. Within the clinical development market, we primarily focus on Phase II to Phase IV clinical trials. Biopharmaceutical companies continue to prioritize the outsourcing of Phase II to Phase IV clinical trials, particularly in complex, high-growth therapeutic areas such as CNS, oncology and other complex diseases. Additionally, small and mid-sized biopharmaceutical companies typically have limited infrastructure and therefore have a particular proclivity to outsource their clinical development to CROs. We estimate, based on industry sources, including analyst reports, and management's knowledge, that the market for CRO services for Phase II to Phase IV clinical development services will grow at an average annual rate of 5% to 7% through 2020, driven by a combination of increased development spend and further outsourcing penetration. In addition, we estimate that total biopharmaceutical spending on drug development in 2016 was approximately $81.4 billion, of which the clinical development market, which is the market for drug development following pre-clinical research, was approximately $70.4 billion. Of the $70.4 billion, we estimate our total addressable market to be $56.8 billion, after excluding $13.6 billion of indirect fees paid to principal investigators and clinical research sites, which are not a part of the CRO market. We estimate that total biopharmaceutical spending on clinical development will grow at a rate of 2% to 4% annually through 2020. In 2016, we estimate biopharmaceutical companies outsourced approximately $28.6 billion of clinical development spend to CROs, representing a 9% increase compared to 2015 and a penetration rate of 50% of our total addressable market. We estimate that this penetration rate will increase to approximately 59% of our total addressable market by 2020. In particular, within the overall Phase II to Phase IV market segment, the Phase IV/post-approval/real world evidence sub-segment represents a large area of spending where outsourcing penetration is lower than traditional clinical development and pharmaceutical industry trends are creating increasing demand. We believe that CROs with deep therapeutic expertise, global reach and capabilities, the ability to conduct increasingly complex clinical trials and maintain strong principal investigator and clinical research site relationships will be well-positioned to benefit from these industry trends.
Optimization of biopharmaceutical R&D efficiency. Market forces and healthcare reform, including the Patient Protection and Affordable Care Act, as amended by the Health Care and Education Reconciliation Act, the 21st Century Cures Act, and other governmental initiatives, place significant pressure on biopharmaceutical companies to improve cost efficiency. Companies need to demonstrate the relative improvement in quality, safety, and effectiveness of new therapies as compared to existing approved therapies as early as possible in the development process. CROs can help biopharmaceutical companies deploy capital more efficiently, especially because many biopharmaceutical companies do not have adequate in-house development resources. In response to high clinical trial costs, particularly in therapeutic areas such as CNS and oncology, which we believe present the highest mean cost per patient across all clinical trials, biopharmaceutical companies are streamlining operations and shifting development to external providers in order to lower their fixed costs. Based on efficiencies gained through experience, we estimate that CROs have shortened clinical testing timelines by as much as 30%. Full service CROs can deliver operational efficiencies, provide high visibility into trial conduct, and allow biopharmaceutical companies to focus internal resources on their core competencies related to drug discovery and commercialization.
Globalization of clinical trials. Clinical trials have become increasingly global as biopharmaceutical companies seek to accelerate patient recruitment, particularly within protocol-eligible, treatment-naïve patient populations without co-morbidities that could skew clinical outcomes. Additionally, biopharmaceutical companies increasingly seek to expand the commercial potential of their products by applying for regulatory approvals in multiple countries, including in areas of the world with fast-growing economies and middle classes that are spending more on healthcare. As part of the approval process for biopharmaceutical products in newer markets, especially in certain Asian and emerging markets, regulators often require trials to include specific percentages or numbers of people from local populations. Thus, clinical studies to support marketing approval applications frequently include a combination of multinational and domestic trials. These trends emphasize the importance of global experience and geographic coverage, local market knowledge and coordination throughout the development process.
4
Management of increasingly complex trials. The biopharmaceutical industry operates in an increasingly sophisticated and highly regulated environment and has responded to the demands of novel therapeutics by adapting efficient drug development processes. Complex trial design expertise has emerged as a significant competitive advantage for select CROs that have a track record of successfully navigating country-specific regulatory, trial protocol and patient enrollment barriers, including sometimes subjective, evolving clinical endpoints. In addition, the therapeutic areas where we have significant experience and expertise, including CNS, oncology and other complex diseases, often require more complicated testing protocols than other disease indications. For example, studies related to complex therapeutic areas often require treatment-naïve patients, and sometimes have subjective endpoints, which can be difficult to measure. In addition, many of these studies have longer periods of duration due to these factors and have been increasing in duration over the last 36 months. For example, our average study duration has increased from approximately 30 months as of December 31, 2013 to approximately 42 months as of December 31, 2016. As a result of these factors, these therapeutic areas demand greater clinical trial proficiency and therapeutic expertise, particularly in light of new methods of testing, such as the use of biomarkers and gene therapy.
Our Competitive Strengths
We believe that we are well positioned to capitalize on positive trends in the CRO industry and provide differentiated solutions to our customers across their development portfolios based on our key competitive strengths set forth below:
Deep and long-standing therapeutic expertise. Since our inception in 1998, we have focused on building world-class therapeutic expertise to better serve our customers. We provide a broad offering of therapeutic expertise across all major therapeutic areas. We also have particular strengths in the largest and fastest growing therapeutic areas (including our complex therapeutic areas) which collectively constituted approximately 74% of our backlog as of December 31, 2016. Based on industry data, we estimate that these complex therapeutic areas together represent approximately 70% of total Phase III drugs under development. We believe we have been growing faster than the market, resulting in market share gains in our key therapeutic areas. In 2016, our net service revenue grew by 13% and our net service revenue for our complex therapeutic areas grew by 22%. Our therapeutic expertise is managed by our senior leadership and delivered by our senior scientific and medical staff and our clinical research associates ("CRAs") within our various therapeutic areas. Industry analysts have reported that therapeutic expertise is the most influential factor for sponsors of clinical trials in selecting a CRO. We believe that our expertise in managing complex clinical trials differentiates us from our competitors and has played a key role in our revenue growth, our ability to win new clinical trials and our successful relationship development with principal investigators and clinical research sites.
Clinical development focus and innovative operating model. We derive approximately 99% of our net service revenue from clinical development services without distraction from lower growth, lower margin non-clinical business. Since 2006, we have conducted our clinical trials using our innovative Trusted Process® operating model, which standardizes methodologies, increases the predictability of the delivery of our services and reduces operational risk. Since initiation of the Trusted Process®, we have reduced median study start-up time (defined as the period from finalized protocol to first patient enrolled) on new projects. Based on industry sources for the median study start-up time for the biopharmaceutical industry, we believe we achieve this milestone for our customers at a faster pace than industry medians, due in part to our proprietary Trusted Process® operating model. In addition to the absolute reduction of cycle times in critical path milestones, we provide greater operating efficiency, more predictable project schedules and a reduction in overall project timelines.
Unmatched, industry-leading principal investigator and clinical research site relationships. We have extensive relationships with principal investigators and clinical research sites. We believe these quality relationships are critical for delivering clinical trial results on time and on budget for our customers. Motivated and engaged investigative sites can facilitate faster patient recruitment, increase retention, maintain safety, ensure compliance with protocols as well as with local and international regulations, and streamline reporting. The ability to recruit and retain principal investigators and patients is an integral part of the clinical trial process. We have dedicated personnel focused on enhancing clinical research site relationships; we work with these sites in collaborative partnerships to improve cycle times and standardize start-up activities to drive
5
efficiency. Our focus on principal investigator and clinical research site relationships is unmatched in the industry, as demonstrated by our ranking as the "Top CRO to Work With" among large global CROs in the 2015 CenterWatch Survey. In the 2015 CenterWatch Survey, we ranked in the top three on 33 out of 38 attributes and received an average of 83% of "excellent" or "good" ratings across all attributes, up from approximately 80% in 2013. In addition, we are a top-three ranked CRO on four of the five attributes rated by sites as most important to study conduct success and the number one-ranked CRO for providing professional medical staff in clinical operations. We also participate at the highest level of membership within the Society for Clinical Research Sites ("SCRS") as a Global Impact Partner ("GIP").
Broad global reach with in-depth local market knowledge. We believe that we are one of a few CROs with the scale, expertise, systems and agility necessary to conduct global clinical trials. We offer our services through a highly skilled staff of approximately 6,800 employees in 50 countries as of December 31, 2016 and have conducted work in more than 110 countries. We continue to have a presence in high-growth international markets such as Asia-Pacific, Latin America, the Middle East and North Africa. Our comprehensive regulatory expertise and extensive local knowledge facilitate timely patient recruitment for complex clinical trials and improved access to treatment-naïve patients and to emerging markets, thereby reducing the time and cost of these trials for our customers while also optimizing the commercialization potential for new therapies.
Diversified, loyal and growing customer base. We have a well-diversified, loyal customer base of over 350 customers that includes many of the world's largest biopharmaceutical companies as well as high-growth, small and mid-sized biopharmaceutical companies. We have several customers with whom we have achieved "preferred provider" or strategic alliance relationships. We define these customer relationships to include ones where we have executed master service agreements in addition to regularly scheduled strategy meetings to discuss the status of our relationship, and for which we serve as a preferred supplier of services. We believe these relationships provide us enhanced opportunities for more business, although they are not a guarantee of future business. In addition, many of our customers are diversified across multiple projects and compounds. Our top five customers represented approximately 94 compounds in 73 indications across 244 active projects and accounted for approximately 33% of our net service revenue in 2016. Our customer base is geographically diverse with well-established relationships in the United States, Europe and Asia. We believe the breadth of our footprint reduces our exposure to potential U.S. and European biopharmaceutical industry consolidation. We believe that the tenure of our customer relationships as well as the depth of penetration of our services reflect our strong reputation and track record. While 80% of our new business awards in 2016 were from repeat customers and our top ten customers have worked with us for an average of approximately 11 years, we were also awarded clinical trials from 108 new customers in 2016, with particularly strong growth among small to mid-sized biopharmaceutical companies. We have also increased our penetration in the large biopharmaceutical market, which we define as the top 50 biopharmaceutical companies measured by annual drug revenue, with 52% of our net service revenue in 2016 coming from large biopharmaceutical companies. We believe we have increased our market share in recent years and are well positioned to continue growing our customer base.
Outstanding financial performance. We have completed our second consecutive year with net income over $100 million, earning $112.6 million and $117.0 million for the years ended December 31, 2016 and 2015, respectively. In addition, we have achieved significant revenue, adjusted EBITDA and adjusted net income growth over the past several years. For example, during 2016, we increased our net service revenue, adjusted EBITDA and adjusted net income by 13%, 10%, and 16%, respectively, as compared to 2015. The momentum in our business is also reflected in the growth in our backlog which grew by 9.6% from December 31, 2015 to December 31, 2016. Backlog is the value of future net service revenue supported by contracts or pre-contract written communications from customers for projects that have received appropriate internal funding approval, are not contingent upon completion of another trial or event and are expected to commence within the next 12 months, minus the value of cancellations in the same period). Backlog and new business awards are not necessarily predictive of future financial performance because they will likely be impacted by a number of factors, including the size and duration of projects (which can be performed over several years), project change orders resulting in increases or decreases in project scope, and cancellations. We believe our outstanding financial profile and strong momentum demonstrate the quality of the platform we have built to position ourselves for continued future growth.
6
Highly experienced management team with a deep-rooted culture of quality and innovation. We are led by a dedicated and experienced senior management team with significant industry experience and knowledge focused on clinical development. Each of the members of our senior management has 20 years or more of relevant experience, including significant experience across the CRO and biopharmaceutical industries. Our management team has successfully grown our company into a leading CRO through a combination of organic growth and acquisitions and believes we are well positioned to further capitalize on industry growth trends.
Business Strategy
The key elements of our business strategy include:
Focus on attractive, high-growth late-stage clinical development services market. We believe outsourcing late-stage clinical development services to CROs optimizes returns on invested R&D for biopharmaceutical companies. As development spend and outsourcing penetration rates continue to increase, we estimate that the late-stage clinical development services market will grow at an average annual rate of 5% to 7% through 2020 and is poised to realize incremental growth relative to the overall CRO market. In addition to the traditional clinical development services required for regulatory approval of a compound, biopharmaceutical companies are trying to navigate increased scrutiny on drug pricing, formulary placement, and new data required for optimal real world use of their products to deliver the commercial value needed for their return on investment. This presents an opportunity for more outsourcing to CROs with broad capabilities. We believe that our core focus on the late-stage clinical development services market ideally positions us to benefit from these growth trends. Additionally, we believe that our differentiated approach of investing in highly experienced people, making better use of enabling technology and improving the process of clinical development, will allow our customers to generate superior returns.
Leverage our expertise in delivering complex clinical trials and deepen our therapeutic expertise in fast-growing areas. We intend to continue to develop and leverage our therapeutic and operational expertise in delivering complex clinical trials. We believe that our experience and deep expertise in complex therapeutic areas such as CNS and oncology better position us to win new clinical trials in these large therapeutic areas and others where trial complexity can create delivery challenges. Our extensive use of insights gained from fit-for-purpose data sources and our relationships with principal investigators and clinical research sites with longstanding patient relationships are especially critical in delivering complex clinical trials. This is enhanced by the use of our proprietary Trusted Process® methodology that reduces operational risk and variability by standardizing processes and minimizing delays, instills quality throughout the clinical development process and leads customers to more confident, better-informed drug development decisions.
Capitalize on our geographic scale. We intend to leverage our global breadth and scale to drive continued growth. We have built our presence across key markets over time, developing strong relationships with principal investigators and clinical research sites around the world. We have expanded our patient recruitment capabilities, principal investigator relationships and local regulatory knowledge, which should continue to position us well for new customer wins in a wide array of markets. We have added geographic reach through both acquisitions and organic growth in areas such as Asia-Pacific, Latin America and the Middle East and North Africa, which we believe is critical to obtaining larger new business awards from large and mid-sized biopharmaceutical companies. Our long-term growth opportunities are enhanced by our strong reputation in emerging markets and our track record of efficiently managing trials in accordance with regional regulatory requirements.
Continue to enhance our Trusted Process® methodology to deliver superior outcomes. We intend to continue the development and enhancement of our Trusted Process® methodology, which has delivered measurable, beneficial results for our customers and improved drug development decisions. We believe our Trusted Process® will continue to lead to high levels of customer satisfaction. Our Trusted Process® is subject to continual refinement based on feedback from therapeutic leadership, staff and customers as well as the market factors of an evolving regulatory environment and technology innovation. Our Trusted Process® uses best-in-class and industry-leading third-party technology solutions. We expect that through continuous enhancement of our Trusted Process® methodology, including a client-focused Trusted Process® dashboard, we will achieve better alignment of best-in-class technology to enable increased visibility into critical processes, management and controls in the drug development process. We intend to continue to position
7
ourselves to quickly adopt best-in-class technology through effective third-party collaborations without the need for high capital investments and maintenance costs, driving attractive returns on capital.
Continue proven track record of identifying and successfully integrating selective acquisitions to augment our organic growth. Over the past decade, we have developed a systematic approach for integrating acquisitions. We have successfully acquired and integrated ten companies, including both strategic and tuck-in acquisitions. These strategic acquisitions have increased our size, scale and reach, complementing our organic growth profile as we have become a leading provider of CRO services. Our acquisitions have enabled us to expand our global service offerings across all four phases of biopharmaceutical clinical development while also allowing us to achieve significant synergies and cost reductions. We will continue to evaluate opportunities to acquire and integrate selective acquisitions within the CRO sector, maintaining our discipline in areas such as valuation and cultural fit, in order to strengthen our competitive position and realize attractive returns on our investments.
Drive our human capital asset base to grow existing relationships. As a clinical service provider, our employees are critical to our ability to deliver our innovative operational model by engaging with customers, delivering clinical development services in a complex environment, and supporting and executing our growth strategy. All employees undergo comprehensive initial orientation and ongoing training, including a focus on our Trusted Process® methodology. Our recruiting and retention efforts are geared toward maintaining and growing a stable work force focused on delivering results for customers. We have a successful track record of integrating talent from prior acquisitions and believe we have a best-in-class pool of highly experienced project management professionals and CRAs.
Our Services
Our extensive range of services supports the entire clinical development process from Phase I to Phase IV and allows us to offer our customers an integrated suite of investigative site support and clinical development services. We offer these services across a wide variety of therapeutic areas with deep clinical expertise with a primary focus on Phase II to Phase IV clinical trials. We provide total biopharmaceutical program development while also providing discrete services for any part of a trial. The combination of service area experts and the depth of clinical capability allows for enhanced protocol design and actionable trial data. Our comprehensive suite of clinical development services includes, but is not limited to:
Clinical Trial Management | Data Services | Strategic and Regulatory Services | Real World and Late Stage Services | Functional Services | ||||
• Patient recruitment and retention • Project management • Clinical monitoring • Drug safety / pharmacovigilance • Medical affairs • Quality assurance • Regulatory and medical writing | • Clinical data management • Electronic data capture • Biostatistics | • Strategic development services • Regulatory consulting and submissions • Clinical operations optimization • Pricing and reimbursement planning | • Specialized support for patient registries • Safety surveillance studies, prospective observational studies • Health outcome research • Patient-reported outcomes • Phase IV effectiveness trials • Health economics studies and retrospective chart reviews | • Data management • Medical writing • Safety / pharmacovigilance • Site contracts • Investigator payments | ||||
8
Clinical Trial Management
We offer a variety of select and stand-alone clinical trial services as well as full-service, global studies through our clinical development services. Our key clinical trial management services include the following:
• | Patient Recruitment and Retention. Our patient recruitment services group helps identify and manage appropriate vendors, focuses on patient recruitment and retention strategies and acts as a liaison to media outlets and other vendors that we have validated; |
• | Project Management. Our project managers provide customer-focused leadership in managing clinical trials and are accountable for the successful execution of all assigned projects, where success includes on-time, on-budget, and high quality results that lead to satisfied customers. Project managers have the skills, education, experience and training to support the successful conduct of clinical studies; |
• | Clinical Monitoring. Our clinical monitors oversee the conduct of a clinical trial by working with and monitoring clinical research sites to assure the quality of the data. The clinical monitor ensures the trial is conducted according to Good Clinical Practice ("GCP"), International Conference on Harmonisation ("ICH") guidelines and local regulations, to meet the customers' and regulatory authorities' requirements according to the study protocol. CRAs engage with clinical research sites in site initiation, training and patient recruitment. We deploy and manage clinical monitoring staff in all regions of the globe. By maintaining a therapeutic focus, we attract CRAs who have a strong desire to dedicate themselves to working within a specific therapeutic area, providing an environment where they can further develop their expertise in their chosen area of interest; |
• | Drug Safety/Pharmacovigilance. Our drug safety teams are strategically located across the United States, Europe, Latin America and Asia-Pacific. We provide global drug safety expertise in all phases of clinical research for serious adverse event/adverse event collection, evaluation, classification, reporting, reconciliation, post-marketing safety and pharmacovigilance; |
• | Medical Affairs. We have in-house physicians who provide 24/7 medical monitoring, scientific and medical support for project management teams and clinical research sites. These in-house physicians consist of senior clinicians and former clinical researchers with patient care and trial management expertise; |
• | Quality Assurance. Quality control steps are built into all of our processes. We have an independent quality assurance department that, in addition to conducting independent audits of all ongoing projects and processes as part of our internal quality assurance program, offers contracted quality assurance services to customers, including audits of clinical research sites and of various vendors to the clinical research industry; 'mock' regulatory inspections and clinical research site inspection-readiness training; standard operating procedure development; and quality assurance program development/consultation. Our customers also engage us to conduct third-party audits on behalf of their studies; and |
• | Regulatory and Medical Writing. We also offer regulatory and medical writing expertise across the entire biopharmaceutical product lifecycle. Our team has hands-on regulatory and medical writing knowledge gained through experience from working in large biopharmaceutical companies, as well as high-growth, small and mid-sized biopharmaceutical companies, CROs and the United States Food and Drug Administration ("FDA"). Additionally, each member is trained in FDA regulations, including GCP/standard operating practice compliance guidelines and guidelines established by the ICH. |
Data Services
Our data services include the following:
• | Clinical Data Management. Our clinical data management services allow us to confirm that the clinical trial database is ready, accurately populated and locked in an expeditious manner, with verification and validation procedures throughout every phase of a clinical trial. This processing is done in synchronization with the clinical team, utilizing the information provided from the trial to help ensure efficient processes are employed, regardless of the data collection method used; |
9
• | Electronic Data Capture. To compete in today's changing global drug and device development environment, companies must collect and distribute data faster than ever before. We have the ability to manage electronic data capture ("EDC") to help our customers take advantage of the efficiencies available through EDC, which include improved access to data, reduced cycle time, increased productivity and improved relationships with customers, vendors and other parties. We utilize three leading EDC platforms: Medidata Rave, Oracle Clinical Remote Data Capture and Oracle Health Sciences InForm products. Our ability to design, build and deliver high quality databases in all three platforms enables our team to deliver effective EDC solutions; and |
• | Biostatistics. Our biostatistics team has a depth of experience with the FDA and European Medicines Agency ("EMA") which allows our teams to provide customers with guidance on building a statistical plan to meet regulatory and safety requirements as well as a careful analysis of the resulting study data. In addition, we provide support for independent drug safety monitoring boards and a full range of related services. Our biostatisticians are also heavily involved in our Trusted Process® methodology, so that protocol and project development can be grounded in advanced statistical methodology. As part of a project team, our biostatisticians can provide data oversight throughout a clinical trial and address any data or data handling issues that may arise. |
Strategic and Regulatory Services
Strategic Services. Our strategic consulting group focuses on maximizing the value of scientific knowledge, intellectual property and portfolio content. The key areas of advisory services include strategic drug development, clinical development plans, registration strategies, exit strategies, transitional clarity, good clinical practice compliance strategies, clinical operations optimization, pricing and reimbursement, and due diligence. Strategic consultants include senior personnel from medical and regulatory affairs, clinical research, biostatistics and data management. These individuals provide expertise gained through hands-on experience as former executives from biopharmaceutical companies, CROs and regulatory agencies; and
Regulatory Services. We offer regulatory expertise across the entire biopharmaceutical product lifecycle. Our regulatory affairs practice has a global presence with offices in North America, Europe and Asia-Pacific. In addition, subject matter experts are located worldwide to provide global regulatory coverage. Global regulatory services include worldwide regulatory submissions, regulatory strategy and agency meetings, early development consultancy, data safety monitoring board and data review committee management, chemistry manufacturing and controls, contemporary regulatory interpretation, investigational new drug ("IND"), applications and clinical trial authorizations.
Real World and Late Phase Services
Our real world and late phase group conducts “real world” studies to understand how a treatment, service or method of delivering care works when applied in real world, clinical practice environments. We provide both consultative and operational expertise to our customers in real world data generation, from concept through core development, launch and commercialization. By utilizing our successful drug life cycle management, we ensure we partner with clients to gain the right outcome for them, patients, physicians, payers and regulators in order to maximize our customers' return on investment. These services allow our customers to make timely and cost effective advances in clinical treatment by providing data about actual experience of doctors and patients outside of the regulated environment of clinical development. Our services include patient registries, surveillance and observational studies, patient/health outcomes research and economic studies.
Functional Services
Our functional service provider ("FSP") offering is a tool to help sponsors review their approach to key functional areas of clinical research, specifically those areas not core to their clinical development business. Our FSP offering provides our customers with a flexible service offering to meet their development needs in a flexible service approach. We currently provide services related to data management, medical writing, safety/pharmacovigilance, site contracts and investigator payments. We believe our FSP service offering provides greater predictability and more consistent delivery of services across all protocols. We currently operate FSP hubs in North America, South America, Europe and Asia.
10
Our Trusted Process® Methodology
We perform each of these service offerings through our proprietary, operational approach to clinical trials. Our Trusted Process® is a metrics-driven methodology that we employ to deliver superior results to our customers. We developed this process to improve reliability and predictability of clinical trial project management. Our Trusted Process® methodology has allowed us to reduce operational risk and variability as well as provide faster cycle times. This has resulted in greater operating efficiency, highly predictable project timelines and enhanced customer satisfaction and retention rates.
The Trusted Process® methodology is divided into four sub-processes which correlate with the key phases of a clinical project:
• | PlanActivation® — the design phase, where a project is analyzed and a strategy developed utilizing our therapeutic and clinical experience, forming the basis of a customized project proposal. The strategy continues to be refined based on discussions with the customer through new business award; |
• | QuickStart® — the initiating phase, which serves to align the customer's and our project teams to a single set of objectives, create shared expectations and develop a joint plan for project implementation; |
• | ProgramAccelerate® — the execution and control phase, which includes the processes of patient recruitment, clinical monitoring and data management. In this phase, we proactively process and review data to ensure quality and project timelines are actively managed, while maintaining strong relationships with investigative sites; and |
• | QualityFinish® — the closing phase, which is triggered by the first enrolled patient completing the clinical trial. This phase focuses on assuring high quality, actionable data is used to develop the final deliverables which make up the basis of the documentation necessary for filing with regulatory agencies. |
Since 2006, we have conducted studies using the tools and discipline of the Trusted Process®. We accomplish standardized delivery through support from a company-wide Project Management Office, which defines, maintains and improves procedures relating to the Trusted Process® and ensures consistent application globally. Using this innovative operating model, we have reduced median study start-up time (defined as the period from finalized protocol to first patient enrolled) on new projects. Based on industry sources for the median study start-up time for the pharmaceutical industry, we believe we achieve this milestone for our customers at a faster pace than industry medians, as a result of our proprietary Trusted Process® operating model.
Customers
We have a well-diversified, loyal customer base that includes many of the world's largest biopharmaceutical companies, which we define as the top 50 biopharmaceutical companies measured by annual drug revenue. In addition, we have strong relationships with small and mid-sized biopharmaceutical customers that seek our services for our therapeutic expertise and full-service offering.
Since December 31, 2010, we have significantly increased our exposure to large biopharmaceutical customers through both acquisitions and organic growth, providing us the opportunity to compete for large, global late-stage clinical development trials, preferred provider lists and strategic multi-year relationships. For the year ended December 31, 2016, our net service revenue attributable to large biopharmaceutical companies represented approximately 52% of our total net service revenue and net service revenue attributable to small and mid-sized biopharmaceutical companies represented approximately 48%. Additionally, we serve customers in a variety of locations throughout the world, with approximately 47% of our workforce based in the United States and Canada, 33% in Europe, 13% in Asia-Pacific, 7% in Latin America and 1% in the Middle East and Africa as of December 31, 2016. This diversification allows us to grow our business in multiple customer segments and geographies.
11
For the year ended December 31, 2016, our top five customers accounted for approximately 33% of our net service revenue which was diversified across approximately 94 compounds in 73 indications across 244 active projects. No customer accounted for 10% or more of net service revenue for the year ended December 31, 2016.
Our top ten customers have worked with us for an average of approximately 11 years as of December 31, 2016. We also have a growing list of "preferred provider" and/or strategic alliance relationships. Further, among the majority of our customers, revenue is diversified by multiple projects for a variety of compounds. For example, 32 of our customers have active projects in more than one therapeutic area, making up 55% of our net service revenue for the year ended December 31, 2016. We believe that the tenure of our customer relationships as well as the depth of penetration of our services reflects our strong reputation and track record.
New Business Awards and Backlog
We add new business awards to backlog when we enter into a contract or letter of intent or when we receive a written commitment from the customer selecting us as its service provider. Contracts generally have terms ranging from several months to several years. We recognize revenue on these awards as services are performed, provided we have entered into a contractual commitment with the customer. Our new business awards, net of cancellations of prior awards, for the years ended December 31, 2016, 2015 and 2014 were approximately $1.22 billion, $1.18 billion and $0.95 billion, respectively.
Backlog consists of anticipated future net service revenue from contracts, letters of intent and other written forms of commitments that either have not started but are anticipated to begin in the near future, or are in process and have not been completed. The majority of our contracts can be terminated by our customers with 30 days' notice. Our backlog also reflects any related cancellation or adjustment activity. Our backlog as of December 31, 2016, 2015 and 2014 was approximately $1.99 billion, $1.81 billion and $1.59 billion, respectively. Included within backlog at December 31, 2016 is approximately $0.87 billion that we expect to translate into revenue in 2017. Backlog is not necessarily indicative of future financial performance because it will likely be impacted by a number of factors, including the size and duration of projects (which can be performed over several years), project change orders resulting in increases or decreases in project scope and cancellations.
No assurance can be given that we will be able to realize the net service revenue that is included in the backlog. See Part I, Item 1A, "Risk Factors - Risk Relating to Our Business - Our backlog might not be indicative of our future revenues, and we might not realize all the anticipated future revenue reflected in our backlog," and Part II, Item 7, "Management's Discussion and Analysis of Financial Condition and Results of Operations - New Business Awards and Backlog" for more information.
Sales and Marketing
We employ a team of business development sales representatives and support staff that promote, market and sell our services to biopharmaceutical companies primarily in North America, Europe, Latin America and Asia-Pacific. In addition to significant selling experience, many of these individuals have technical and/or scientific backgrounds.
Our business development team works with our senior executives, therapeutic leaders and project team leaders to maintain key customer relationships and engage in business development activities. For many of our largest customer relationships, we have dedicated strategic account management teams to provide customers with a single point of contact to support delivery, cultural and process integration and to facilitate cross-selling opportunities.
We use integrated and customer-focused business development teams to develop joint sales plans for key accounts. We also place our business development personnel with strong operational experience around the globe to help ensure project demands are fulfilled. Each business development employee is generally responsible for a specific group of customers and for strengthening and expanding an effective relationship with that customer. Each individual is responsible for developing his or her customer base on our behalf,
12
responding to customer requests for information, developing and defending proposals, and making presentations to customers.
As part of each customer proposal, our business development personnel consult with potential biopharmaceutical customers early in the project consideration stage in order to determine their requirements. We involve our therapeutic, operational, technical and/or scientific personnel early in each proposal and, accordingly, these individuals along with our business development representatives invest significant time to determine the optimal means to design and execute the potential customer's program requirements. As an example, recommendations we make to a potential customer with respect to a drug development study design and implementation are an integral part of our bid proposal process and an important aspect of the integrated services we offer. Our preliminary efforts relating to the evaluation of a proposed clinical protocol and implementation plan, along with the therapeutic expertise and advice we provide during this process, enhance the opportunity for accelerated initiation and overall success of the trial.
Our marketing team supports our business development organization through various marketing activities to drive brand awareness and positioning, consisting primarily of market and competitive analysis, brand management, market information and collateral development, participation in industry conferences, advertising, e-marketing, publications, and website development and maintenance.
Competition
We compete primarily against other full-service CROs and services provided by in-house R&D departments of biopharmaceutical companies, universities and teaching hospitals. Although the CRO industry has experienced increased consolidation over the past three years, the landscape remains fragmented. Our major competitors include ICON plc, inVentiv Health, Inc., Laboratory Corporation of America Holdings (formerly Covance, Inc.), Medpace Holdings, Inc., PAREXEL International Corporation, Pharmaceutical Product Development, LLC, PRA Health Sciences, Inc., Quintiles IMS Holdings, Inc. and numerous specialty and regional players. We generally compete on the basis of the following factors:
• | experience within specific therapeutic areas; |
• | the quality of staff and services; |
• | the range of services provided; |
• | the ability to recruit principal investigators and patients into studies expeditiously; |
• | the ability to organize and manage large-scale, global clinical trials; |
• | an international presence with strategically located facilities; |
• | medical database management capabilities; |
• | the ability to deploy and integrate IT systems to improve the efficiency of contract research; |
• | experience with a particular customer; |
• | the ability to form strategic partnerships; |
• | speed to completion; |
• | financial strength and stability; |
• | price; and |
• | overall value. |
Notwithstanding these competitive factors, we believe that our deep therapeutic expertise, global reach and operational strength differentiate us from our competitors.
13
Government Regulation
Regardless of the country or region in which approval is being sought, before a marketing application for a drug is ready for submission to regulatory authorities, the candidate drug must undergo rigorous testing in clinical trials. The clinical trial process must be conducted in accordance with the Federal Food, Drug and Cosmetic Act in the United States and similar laws and regulations in the relevant foreign jurisdictions. These laws and regulations require the drug to be tested and studied in certain ways prior to submission for approval.
In the United States, the FDA regulates the conduct of clinical trials of drug products in human subjects, and the form and content of regulatory applications. The FDA also regulates the development, approval, manufacture, safety, labeling, storage, record keeping, and marketing of drug products. The FDA has similar authority and similar requirements with respect to the clinical testing of biological products and medical devices. In the European Union ("EU") and other jurisdictions where our customers intend to apply for marketing authorization, similar laws and regulations apply. Within the EU, these requirements are enforced by the EMA, and requirements vary slightly from one member state to another. In Canada, clinical trials are regulated by the Health Products Food Branch of Health Canada as well as provincial regulations. Similar requirements also apply in other jurisdictions, including Australia, Japan, and other Asian countries, where we operate or where our customers intend to apply for marketing authorization. Sponsors of clinical trials also follow the International Council on Harmonisation (“ICH”) Good Clinical Practice ("GCP") guidelines. An addendum to the ICH GCP Guidelines was adopted by the ICH committee in November 2016 and will now be implemented through national and regional guidance in ICH member states. The changes aim to encourage sponsors to implement improved oversight and management of clinical trials, utilizing a Quality Risk Management approach while continuing to ensure protection of human subjects participating in trials and clinical trial data integrity.
Our services are subject to various regulatory requirements designed to ensure the quality and integrity of the clinical trial process. In the United States, we must perform our clinical development services in compliance with applicable laws, rules and regulations, including GCP, which govern, among other things, the design, conduct, performance, monitoring, auditing, recording, analysis, and reporting of clinical trials. Before a human clinical trial may begin, the manufacturer or sponsor of the clinical product candidate must file an IND with the FDA, which contains, among other things, the results of preclinical tests, manufacturer information, and other analytical data. A separate submission to an existing IND must also be made for each successive clinical trial conducted during product development. Each clinical trial must be conducted pursuant to, and in accordance with, an effective IND. In addition, under GCP, each human clinical trial we conduct is subject to the oversight of an independent institutional review board ("IRB") which is an independent committee that has the regulatory authority to review, approve and monitor a clinical trial. The FDA, the IRB, or the sponsor may suspend or terminate a clinical trial at any time on various grounds, including a finding that the study subjects are being exposed to an unacceptable health risk.
Clinical trials conducted outside the United States are subject to the laws and regulations of the country where the trials are conducted. These laws and regulations might not be similar to the laws and regulations administered by the FDA and other laws and regulations regarding the protection of patient safety and privacy and the control of study pharmaceuticals, medical devices or other study materials. Studies conducted outside the United States can also be subject to regulation by the FDA if the studies are conducted pursuant to an IND or an investigational device exemption for a product candidate that will seek FDA approval or clearance. It is the responsibility of the study sponsor or the parties conducting the studies to ensure that all applicable legal and regulatory requirements are fulfilled.
In order to comply with GCP and other regulations, we must, among other things:
• | comply with specific requirements governing the selection of qualified principal investigators and clinical research sites; |
• | obtain specific written commitments from principal investigators; |
• | obtain review, approval and supervision of the clinical trials by an IRB or ethics committee; |
• | obtain favorable opinion from regulatory agencies to commence a clinical trial; |
14
• | verify that appropriate patient informed consents are obtained before the patient participates in a clinical trial; |
• | ensure that adverse drug reactions resulting from the administration of a drug or biologic during a clinical trial are medically evaluated and reported in a timely manner; |
• | monitor the validity and accuracy of data; |
• | monitor drug or biologic accountability at clinical research sites; and |
• | verify that principal investigators and study staff maintain records and reports and permit appropriate governmental authorities access to data for review. |
Similar guidelines exist in various states and in other countries. We may be subject to regulatory action if we fail to comply with applicable rules and regulations. Failure to comply with certain regulations can also result in the termination of ongoing research and disqualification of data collected during the clinical trials. For example, violations of GCP could result, depending on the nature of the violation and the type of product involved, in the issuance of a warning letter, suspension or termination of a clinical study, refusal of the FDA to approve clinical trial or marketing applications or withdrawal of such applications, injunction, seizure of investigational products, civil penalties, criminal prosecutions, or debarment from assisting in the submission of new drug applications. See "Risk Factors—Risks Related to Our Business—If we fail to perform our services in accordance with contractual requirements, regulatory standards and ethical considerations, we could be subject to significant costs or liability and our reputation could be harmed."
We monitor our clinical trials to test for compliance with applicable laws and regulations in the United States and the foreign jurisdictions in which we operate. We have adopted standard operating procedures that are designed to satisfy regulatory requirements and serve as a mechanism for controlling and enhancing the quality of our clinical trials. In the United States, our procedures were developed to ensure compliance with GCP and associated guidelines.
In addition to its comprehensive regulation of safety in the workplace, the U.S. Occupational Safety and Health Administration has established extensive requirements relating to workplace safety for healthcare employers whose workers might be exposed to blood-borne pathogens such as HIV and the hepatitis B virus. Furthermore, certain employees might have to receive initial and periodic training to ensure compliance with applicable hazardous materials regulations and health and safety guidelines. We are subject to similar regulations in Canada and Spain.
The U.S. Department of Health and Human Services has promulgated rules under the Health Information Technology for Economic and Clinical Health Act in connection with the application of security and privacy provisions under the Health Information Portability and Accountability Act (collectively, "HIPAA"). These regulations govern the use, handling and disclosure of personally identifiable medical information. Although we do not consider that our business activities generally cause us to be subject to HIPAA as a covered entity, we endeavor to embrace sound identity protection practices. These regulations also establish procedures for the exercise of an individual's rights and the methods permissible for de-identification of health information. We are also subject to privacy legislation in Canada under the federal Personal Information and Electronic Documents Act, the Act Respecting the Protection of Personal Information in the Private Sector and the Personal Health Information Protection Act, and privacy legislation in the EU under the 95/46/EC Privacy Directive on the protection and free movement of personal data.
Intellectual Property
We develop and use a number of proprietary methodologies, analytics, systems, technologies and other intellectual property in the conduct of our business. We rely upon a combination of confidentiality policies, nondisclosure agreements and other contractual arrangements to protect our trade secrets, and copyright and trademark laws to protect other intellectual property rights. We have obtained or applied for trademarks and copyright protection in the United States and in a number of foreign countries. Our material trademarks include Trusted Process®, PlanActivation®, QuickStart®, ProgramAccelerate®, QualityFinish®, and INC Research and other corporate emblems. Although the duration of trademark registrations varies from country to country, trademarks generally may be renewed indefinitely so long as they are in use and/or their
15
registrations are properly maintained, and so long as they have not been found to have become generic. Although we believe the ownership of trademarks is an important factor in our business and that our success does depend in part on the ownership thereof, we rely primarily on the innovative skills, technical competence and marketing abilities of our employees. We do not have any material licenses, franchises or concessions.
Employees
As of December 31, 2016, we had approximately 6,800 employees worldwide, with approximately 47% in the United States and Canada, 33% in Europe, 13% in Asia-Pacific, 7% in Latin America and 1% in the Middle East and Africa. None of our employees are covered by a collective bargaining agreement and we believe our overall relations with our employees are good. Employees in certain of our non-U.S. locations are represented by workers' councils as required by local laws.
The level of competition among employers in the United States and overseas for skilled personnel is high. We believe that our brand recognition and our multinational presence are advantages in attracting qualified candidates. In addition, we believe that the wide range of clinical trials in which we participate allows us to offer broad experience to clinical researchers.
Indemnification and Insurance
In conjunction with our clinical development services, we employ or contract with research institutions and in some jurisdictions principal investigators and pharmacies on behalf of biopharmaceutical companies to serve as research centers and principal investigators in conducting clinical trials to test new drugs on human volunteers. Such testing creates the risk of liability for personal injury or death of volunteers, particularly to volunteers with life-threatening illnesses, resulting from adverse reactions to the drugs administered. It is possible that we could be held liable for claims and expenses arising from any professional malpractice of the principal investigators with whom we contract or engage, or in the event of personal injury to or death of persons participating in clinical trials. In addition, as a result of our operation of Phase I clinical trial facilities, we could be liable for the general risks associated with clinical trials including, but not limited to, adverse events resulting from the administration of drugs to clinical trial participants or the professional malpractice of medical care providers. We also could be held liable for errors or omissions in connection with the services we perform through each of our service groups. For example, we could be held liable for errors or omissions, or breach of contract, if monitoring obligations have been transferred to us and one of our CRA's inaccurately reports from source documents or fails to adequately monitor a human clinical trial resulting in inaccurately recorded results.
We have sought to reduce our risks by implementing the following where practicable:
• | securing contractual assurances such as indemnification provisions and provisions seeking to limit or exclude liability contained in our contracts with customers, institutions, pharmacies, vendors and principal investigators; |
• | securing contractual and other assurances that adequate insurance will be maintained to the extent applicable by customers, institutions, pharmacies, vendors, principal investigators and by us; and |
• | complying with various regulatory requirements, including monitoring that the oversight of independent review boards and ethics committees are intact where obligations are transferred to us and monitoring the oversight of the procurement by the principal investigator of each participant's informed consent to participate in the study. |
The contractual indemnifications we have generally do not fully protect us against certain of our own actions, such as negligence. Contractual arrangements are subject to negotiation with customers, and the terms and scope of any indemnification, limitation of liability or exclusion of liability varies from customer to customer and from trial to trial. Additionally, financial performance of these indemnities is not secured. Therefore, we bear the risk that any indemnifying party against which we have claims may not have the financial ability to fulfill its indemnification obligations to us.
While we maintain professional liability insurance that covers the locations in which we currently do business and that covers drug safety issues as well as data processing and other errors and omissions, it is possible
16
that we could become subject to claims not covered by insurance or that exceed our coverage limits. We could be materially and adversely affected if we were required to pay damages or bear the costs of defending any claim that is outside the scope of, or in excess of, a contractual indemnification provision, beyond the level of insurance coverage or not covered by insurance, or in the event that an indemnifying party does not fulfill its indemnification obligations.
Executive Officers
The following table sets forth information concerning our executive officers as of December 31, 2016:
Name | Age | Position | ||
Alistair Macdonald | 46 | Chief Executive Officer and Director | ||
Gregory S. Rush | 49 | Executive Vice President and Chief Financial Officer | ||
Michael Gibertini, PhD | 59 | Chief Operating Officer | ||
Christopher L. Gaenzle | 50 | Chief Administrative Officer, General Counsel and Secretary | ||
The following is a biographical summary of the experience of our executive officers:
Alistair Macdonald - Chief Executive Officer and Director
Alistair Macdonald has been our Chief Executive Officer ("CEO") and a member of our Company's Board of Directors (the "Board") since October 2016. He joined our Company in May 2002 and has served in various senior leadership roles during that time. Prior to his current role, Mr. Macdonald most recently served as President and Chief Operating Officer from January 2015 to September 2016 and Chief Operating Officer from January 2013 to January 2015. He also served as our President, Clinical Development Services from March 2012 to January 2013, Executive Vice President of our Global Oncology Unit from February 2011 to March 2012, Executive Vice President, Strategic Development from October 2009 to February 2011, and Senior Vice President, Biometrics from May 2002 to September 2009. He received his Master of Science in Environmental Diagnostics from Cranfield University.
Gregory S. Rush - Executive Vice President and Chief Financial Officer
Greg Rush joined our Company in August 2013 as Executive Vice President and Chief Financial Officer ("CFO"), and has continued to serve in that role. From April 2010 to August 2013, Mr. Rush served as Senior Vice President and Chief Financial Officer of Tekelec, Inc., which was acquired by Oracle Corporation in June 2013, after serving as Interim Chief Financial Officer in March 2010. Mr. Rush joined Tekelec as Vice President and Corporate Controller in May 2005 and served as Vice President, Corporate Controller and Chief Accounting Officer from May 2006 to March 2010. His previous experience also includes roles in various senior financial positions with Siebel Systems, Inc., Quintiles, PricewaterhouseCoopers and Ernst & Young. Mr. Rush received his Bachelor of Science in Business and Master of Accounting degrees from the University of North Carolina at Chapel Hill, graduating with honors, and is a Certified Public Accountant.
Michael Gibertini, PhD - Chief Operating Officer
Michael Gibertini has been our Chief Operating Officer since October 2016. Dr. Gibertini joined the Company in April 2005 and has provided global leadership for the Company's clinical development programs through his previous roles as President, Clinical Development from January 2015 to October 2016 and President and General Manager, CNS Clinical Development from April 2005 to January 2015. Prior to joining the Company, Dr. Gibertini led teams in antidepressant and antipsychotic drug development for a major CNS pharmaceutical company. Dr. Gibertini has over 30 years of experience in the pharmaceutical and CRO industries as well as academic and private/hospital practice settings. Dr. Gibertini received his PhD in clinical psychology from the University of Houston.
17
Christopher L. Gaenzle - Chief Administrative Officer, General Counsel and Secretary
Chris Gaenzle joined our Company in April 2012 as General Counsel and Secretary and has continued to serve in that role. Since August 2013, he has also served as our Chief Administrative Officer. Prior to joining our Company, Mr. Gaenzle served for five years in various senior legal positions at Pfizer Inc., where he was most recently Assistant General Counsel from 2010 to 2012. Prior to Pfizer, Mr. Gaenzle was a partner at Hunton and Williams LLP, where he was a practicing attorney from 1998 to 2007. Mr. Gaenzle has 20 years of private practice and corporate legal experience, the majority of which is in the pharmaceutical, medical and clinical research industries. Mr. Gaenzle received his Bachelor of Arts from Colgate University and his J.D. from Syracuse University.
Available Information
Our website address is www.incresearch.com. Information on our website is not incorporated by reference herein. Copies of our annual reports on Form 10-K, quarterly reports on Form 10-Q, current reports on Form 8-K and our proxy statements for our annual stockholders meetings, and any amendments to those reports, as well as Section 16 reports filed by our insiders, are available free of charge on our website as soon as reasonably practicable after we file the reports with, or furnish the reports to, the Securities and Exchange Commission (the "SEC"). Our SEC filings are also available for reading and copying at the SEC’s Public Reference Room at 100 F Street, NE, Washington, D.C. 20549. Information on the operation of the Public Reference Room may be obtained by calling the SEC at 1-800-SEC-0330. In addition, the SEC maintains an Internet site (http://www.sec.gov) containing reports, proxy and information statements, and other information regarding issuers that file electronically with the SEC.
18
Item 1A. Risk Factors.
We operate in a rapidly changing environment that involves a number of risks, some of which are beyond our control. In evaluating our company, you should consider carefully the risks and uncertainties described below together with the other information included in this Annual Report on Form 10-K, including our consolidated financial statements and related notes included in Part II, Item 8, in this Annual Report on Form 10-K. The occurrence of any of the following risks may materially and adversely affect our business, financial condition, results of operations and future prospects.
Risks Related to Our Business
If we do not generate a large number of new business awards, or if new business awards are delayed, terminated, reduced in scope or fail to go to contract, our business, financial condition, results of operations or cash flows may be materially adversely affected.
Our business is dependent on our ability to generate new business awards from new and existing customers and maintain existing customer contracts for clinical development services and other services. Our inability to generate new business awards on a timely basis and subsequently enter into contracts for such awards could have a material adverse effect on our business, financial condition, results of operations or cash flows.
The time between when a study is awarded and when it goes to contract is typically several months, and prior to a new business award going to contract, our customers can cancel the award without notice. Once an award goes to contract, the majority of our customers can terminate the contract with 30 days' notice. Our contracts may be delayed or terminated by our customers or reduced in scope for a variety of reasons beyond our control, including but not limited to:
• | decisions to forego or terminate a particular trial; |
• | budgetary limits or changing priorities; |
• | actions by regulatory authorities; |
• | production problems resulting in shortages of the drug being tested; |
• | failure of products being tested to satisfy safety requirements or efficacy criteria; |
• | unexpected or undesired clinical results for products; |
• | insufficient patient enrollment in a trial; |
• | insufficient principal investigator recruitment; |
• | shift of business to a competitor or internal resources; or |
• | product withdrawal following market launch. |
As a result, contract terminations, delays and modifications are a regular part of our business. In the event of termination, our contracts often provide for fees for winding down the project, which include both fees incurred and actual and non-cancellable expenditures and may include a fee to cover a percentage of the remaining professional fees on the project. These fees may not be sufficient for us to maintain our margins, and termination may result in lower resource utilization rates and therefore lower operating margins. In addition, cancellation of a clinical trial for the reasons noted above may result in the unwillingness or inability of our customer to satisfy certain associated accounts receivable, which may in turn result in a material impact to our results of operations and cash flow. Historically, cancellations and delays have negatively impacted our operating results. In addition, we might not realize the full benefits of our backlog if our customers cancel, delay or reduce their commitments to us, which may occur if, among other things, a customer decides to shift its business to a competitor or revoke our status as a preferred provider. Thus, the loss or delay of a large business award or the loss or delay of multiple awards could adversely affect our service revenues and profitability. Additionally, a change in the timing of a new business award could affect the period over which we recognize revenue and reduce our revenue in any one quarter.
19
Our backlog might not be indicative of our future revenues, and we might not realize all of the anticipated future revenue reflected in our backlog.
Backlog consists of anticipated net service revenue awarded from contract and pre-contract commitments that are supported by written communications. Once work begins on a project, revenue is recognized over the duration of the project, provided the award has gone to contract. Projects may be canceled or delayed by the customer or delayed by regulatory authorities for reasons beyond our control. To the extent projects are delayed, the timing of our revenue could be adversely affected. In addition, if a customer terminates a contract, we typically would be entitled to receive payment for all services performed up to the termination date and subsequent customer-authorized services related to terminating the canceled project. Typically, however, we have no contractual right to the full amount of the future revenue reflected in our backlog in the event of a contract termination or subsequent changes in scope that reduce the value of the contract. The duration of the projects included in our backlog, and the related revenue recognition, typically range from a few months to several years. Our backlog might not be indicative of our future revenues, and we might not realize all the anticipated future revenue reflected in our backlog. A number of factors may affect backlog, including:
• | the size, complexity and duration of projects or strategic relationships; |
• | the cancellation or delay of projects; |
• | the failure of one or more business awards to go to contract; and |
• | changes in the scope of work during the course of projects. |
The rate at which our backlog converts to revenue may vary over time. The revenue recognition on larger, more global projects could be slower than on smaller, more regional projects for a variety of reasons, including, but not limited to, an extended period of negotiation between the time the project is awarded to us and the actual execution of the contract, as well as an increased time frame for obtaining the necessary regulatory approvals.
Our backlog at December 31, 2016 was $1.99 billion. Although an increase in backlog will generally result in an increase in revenues over time, an increase in backlog at a particular point in time does not necessarily correspond directly to an increase in revenues during any particular period, or at all. The extent to which contracts in backlog will result in revenue depends on many factors, including, but not limited to, delivery against project schedules, scope changes, contract terminations and the nature, duration and complexity of the contracts, and can vary significantly over time.
Our operating results have historically fluctuated between fiscal quarters and may continue to fluctuate in the future, which may adversely affect the market price of our stock.
Our operating results have fluctuated in previous quarters and years and may continue to vary significantly from quarter to quarter and are influenced by a variety of factors, such as:
• | timing of contract amendments for changes in scope that could affect the value of a contract and potentially impact the amount of net new business awards and net service revenues from quarter to quarter; |
• | commencement, completion, execution, postponement or termination of large contracts; |
• | contract terms for the recognition of revenue milestones; |
• | progress of ongoing contracts and retention of customers; |
• | timing of and charges associated with completion of acquisitions and other events; |
• | changes in the mix of services delivered, both in terms of geography and type of services; |
• | potential customer disputes, penalties or other issues that may impact the revenue we are able to recognize or the collectability of our related accounts receivable; and |
• | exchange rate fluctuations. |
20
Our operating results for any particular quarter are not necessarily a meaningful indicator of future results and fluctuations in our quarterly operating results could negatively affect the market price and liquidity of our stock.
If we underprice our contracts, overrun our cost estimates or fail to receive approval for or experience delays in documentation of change orders, our business, financial condition, results of operations or cash flows may be materially adversely affected.
We price our contracts based on assumptions regarding the scope of work required and cost to complete the work. We bear the financial risk if we initially underprice our contracts or otherwise overrun our cost estimates, which could adversely affect our cash flows and financial performance. In addition, contracts with our customers are subject to change orders, which occur when the scope of work we perform needs to be modified from that originally contemplated in our contract with the customers. This can occur, for example, when there is a change in a key study assumption or parameter or a significant change in timing. We may be unable to successfully negotiate changes in scope or change orders on a timely basis or at all, which could require us to incur cost outlays ahead of the receipt of any additional revenue. In addition, under generally accepted accounting principles in the United States of America ("GAAP") we cannot recognize additional revenue anticipated from change orders until appropriate documentation is received by us from the customer authorizing the change. However, if we incur additional expense in anticipation of receipt of that documentation, we must recognize the expense as incurred. Any of the foregoing could have a material adverse effect on our business, financial condition, results of operations or cash flows.
Our business depends on the continued effectiveness and availability of our information systems, including the information systems we use to provide services to our customers and to store employee data, and failures of these systems, including cyber-attacks, may materially limit our operations or have an adverse effect on our reputation.
Our information systems are comprised of systems we have purchased or developed, legacy information systems from organizations we have acquired and, increasingly, web-enabled and other integrated information systems. In using these information systems, we frequently rely on third-party vendors to provide hosting services, where our infrastructure is dependent upon the reliability of their underlying platforms, facilities and communications systems. We also utilize integrated information systems that we provide customers access to or install for our customers in conjunction with our delivery of services.
As the breadth and complexity of our information systems continue to grow, we will increasingly be exposed to the risks inherent in maintaining the stability of our legacy systems due to prior customization, attrition of employees or vendors involved in their development, and obsolescence of the underlying technology as well as risks from the increasing number and scope of external data breaches on multi-national companies. Because certain customers and clinical trials may be dependent upon these legacy systems, we also face an increased level of embedded risk in maintaining the legacy systems and limited options to mitigate such risk. We are also exposed to risks associated with the availability of all our information systems, including:
• | disruption, impairment or failure of data centers, telecommunications facilities or other key infrastructure platforms, including those maintained by our third-party vendors; |
• | security breaches of, cyber-attacks on and other failures or malfunctions in our internal systems, including our employee data and communications, critical application systems or their associated hardware; and |
• | excessive costs, excessive delays or other deficiencies in systems development and deployment. |
The materialization of any of these risks may impede the processing of data, the delivery of databases and services, and the day-to-day management of our business and could result in the corruption, loss or unauthorized disclosure of proprietary, confidential or other data. While we have disaster recovery plans in place, they might not adequately protect us in the event of a system failure. Despite any precautions we take, damage from fire, floods, hurricanes, power loss, telecommunications failures, computer viruses, break-ins and similar events at our various computer facilities or those of our third-party vendors could result in interruptions in the flow of data to us and from us to our customers. Corruption or loss of data may result in the need to repeat a trial at no cost to the customer, but at significant cost to us, the termination of a contract or damage to our reputation. Additionally, significant delays in system enhancements or inadequate performance of new or upgraded systems once completed could damage our reputation and harm our
21
business. Finally, long-term disruptions in the infrastructure caused by events such as natural disasters, the outbreak of war, the escalation of hostilities and acts of terrorism, particularly involving cities in which we have offices, and cyber-attacks such as those recently faced by other multi-national companies could adversely affect our businesses. As our business continues to expand globally, these types of risks may be further increased by instability in the geopolitical climate of certain regions, underdeveloped and less stable utilities and communications infrastructure, and other local and regional factors. Although we carry property and business interruption insurance which we believe is customary for our industry, our coverage might not be adequate to compensate us for all losses that may occur.
Unauthorized disclosure of sensitive or confidential data, whether through systems failure or employee negligence, cyber-attacks, fraud or misappropriation, could damage our reputation and cause us to lose customers. Similarly, we have been and expect that we will continue to be subject to attempts to gain unauthorized access to or through our information systems or those we internally or externally develop for our customers, including a cyber-attack by computer programmers and hackers who may develop and deploy viruses, worms or other malicious software programs, process breakdowns, denial-of-service attacks, malicious social engineering or other malicious activities, or any combination of the foregoing. In addition, we may be susceptible to physical or computer-based attacks by terrorists or hackers due to our role in the CRO industry. These concerns about security are increased when information is transmitted over the Internet. Threats include cyber-attacks such as computer viruses, worms or other destructive or disruptive software, and any of these could result in a degradation or disruption of our services or damage to our properties, equipment and data. They could also compromise data security. If such attacks are not detected immediately, their effect could be compounded. To date these attacks have not had a material impact on our operations or financial results. Nonetheless, successful attacks in the future could result in negative publicity, significant remediation and recovery costs, legal liability and damage to our reputation and could have a material adverse effect on our financial condition, results of operations and cash flows. In addition, our liability insurance might not be sufficient in type or amount to cover us against claims related to security breaches, cyber-attacks and other related breaches.
Additionally, we rely on service providers for the timely transmission of information across our global data network. If a service provider fails to provide the communications capacity or services we require for similar reasons, the failure could interrupt our services. Because of the centrality of our processing systems to our business, any interruption or degradation could adversely affect the perception of our brands' reliability and harm our business.
We are subject to regulation in the areas of consumer privacy and data use and security.
Privacy, data use and security continue to receive heightened legislative and regulatory focus in the United States, Europe and elsewhere. For example, in many jurisdictions victims must be notified in the event of a data breach and those jurisdictions that have these laws are continuing to increase the circumstances and the breadth of these notices. Our failure or the failure of our clients to comply with these laws and regulations could result in fines, sanctions, litigation, damages, cost for mitigation activities and damage to our global reputation and our brands.
Our customer or therapeutic area concentration may have a material adverse effect on our business, financial condition, results of operations or cash flows.
If any large customer decreases or terminates its relationship with us, our business, financial condition, results of operations or cash flows could be materially adversely affected. For the year ended December 31, 2016, our top ten customers based on revenue accounted for approximately 47% of our net service revenue and our top ten customers based on backlog accounted for approximately 32% of our total backlog. Although no customer accounted for 10% or more of total net service revenue for the years ended December 31, 2016, and 2015, various subsidiaries of customers A and B, accounted for approximately 14% and 12%, respectively, of net service revenue for the year ended December 31, 2014. It is possible that an even greater portion of our revenues will be attributable to a smaller number of customers in the future, including as a result of our entering into strategic provider relationships with customers. Also, consolidation in our potential customer base results in increased competition for important market segments and fewer available customer accounts.
22
Additionally, conducting multiple clinical trials for different sponsors in a single therapeutic class involving drugs with the same or similar chemical action may adversely affect our business if some or all of the trials are canceled because of new scientific information or regulatory judgments that affect the drugs as a class. Similarly, marketing and selling products for different sponsors with similar drug action subjects us to risk if new scientific information or regulatory judgment prejudices the products as a class, leading to compelled or voluntary prescription limitations or withdrawal of some or all of the products from the market.
Our business is subject to international economic, political and other risks that could have a material adverse effect on our business, financial condition, results of operations, cash flows or reputation.
We have operations in many foreign countries, including, but not limited to, countries in the Asia-Pacific region, Europe, Latin America and the Middle East and Africa. As of December 31, 2016, approximately 57% of our workforce was located outside of the United States, and for the fiscal year ended December 31, 2016, approximately 25% of our net service revenue was billed to locations outside the United States. Our international operations are subject to risks and uncertainties inherent in operating in these regions, including:
• | conducting a single trial across multiple countries is complex, and issues in one country, such as a failure to comply with or unanticipated changes to local regulations or restrictions such as restrictions on import or export of clinical trial material or availability of clinical trial data may affect the progress of the trial in the other countries, resulting in delays or potential termination of contracts, which in turn may result in loss of revenue; |
• | the United States or other countries could enact legislation or impose regulations or other restrictions, including unfavorable labor regulations, tax policies, data protection regulations or economic sanctions, which could have an adverse effect on our ability to conduct business in or expatriate profits from the countries in which we operate; |
• | foreign countries are expanding or may expand their banking regulations that govern international currency transactions, particularly cross-border transfers, which may inhibit our ability to transfer funds into or within a jurisdiction, impeding our ability to pay our principal investigators, vendors and employees, thereby impacting our ability to conduct trials in such jurisdictions; |
• | foreign countries are expanding or may expand their regulatory framework with respect to patient informed consent, protection and compensation in clinical trials, transparency reporting requirements (similar to the Physician Payments Sunshine Act in the United States), which could delay, inhibit or prohibit our ability to conduct trials in such jurisdictions; |
• | the regulatory or judicial authorities of foreign countries might not enforce legal rights and recognize business procedures in a manner in which we are accustomed or would reasonably expect; |
• | changes in political and economic conditions, including the June 2016 vote by the U.K. to exit from the European Union and the results of the U.S. presidential election, may lead to changes in the business environment in which we operate, as well as changes in inflation and foreign currency exchange rates; |
• | potential violations of applicable anti-bribery/anti-corruption laws, including the United States Foreign Corrupt Practices Act ("FCPA") and the UK Bribery Act of 2010, may cause a material adverse effect on our business, financial condition, results of operations, cash flows or reputation; |
• | customers in foreign jurisdictions may have longer payment cycles, and it may be more difficult to collect receivables in those jurisdictions; |
• | natural disasters, pandemics or international conflict, including terrorist acts, could interrupt our services, endanger our personnel or cause project delays or loss of trial materials or results; |
• | political unrest, such as the current situations in Ukraine and the Middle East, could delay or disrupt the ability to conduct clinical trials; and |
• | foreign governments may enact currency exchange controls that may limit the ability to fund our operations or significantly increase the cost of maintaining operations. |
23
These risks and uncertainties could negatively impact our ability to, among other things, perform large, global projects for our customers. Furthermore, our ability to deal with these issues could be affected by applicable U.S. laws. Any such risks could have an adverse impact on our business, financial condition, results of operations, cash flows or reputation.
Governmental authorities may question our intercompany transfer pricing policies or change their laws in a manner that could increase our effective tax rate or otherwise harm our business.
As a U.S. company doing business in international markets through subsidiaries, we are subject to foreign tax and intercompany pricing laws, including those relating to the flow of funds between legal entities in various international jurisdictions. Tax authorities in the United States and in international markets have the right to examine our corporate structure and how we account for intercompany fund transfers. If such authorities challenge our corporate structure, transfer pricing mechanisms or intercompany transfers and the resulting assessments are upheld, our operations may be negatively impacted and our effective tax rate may increase. Tax rates vary from country to country and if a tax authority determines that our profits in one jurisdiction should be increased, we might not be able to realize the full tax benefits in the event (i) we cannot utilize all foreign tax credits that are generated, or (ii) we do not realize a compensating offsetting adjustment in another taxing jurisdiction. The effects of either would increase our effective tax rate. Additionally, the Organization for Economic Cooperation and Development, has issued certain guidelines regarding base erosion and profit shifting. As these guidelines continue to be formally adopted by separate taxing jurisdictions, we may need to change our approach to intercompany transfer pricing in order to maintain compliance under the new rules. Our effective tax rate may increase or decrease depending on the current location of global operations at the time of the change. Finally, we might not always be in compliance with all applicable customs, exchange control, Value Added Tax and transfer pricing laws despite our efforts to be aware of and to comply with such laws. If these laws change we may need to adjust our operating procedures and our business could be adversely affected.
If we are unable to successfully increase our market share, our ability to grow our business and execute our growth strategies could be materially adversely affected.
A key element of our growth strategy is increasing our market share both within the clinical development market and in the geographic markets in which we operate. In addition, we continue to invest in expanding new services such as our functional service provider and late phase offerings, along with solutions for our medical device customers. As we grow our market share within the clinical development market and make investments in growing our newer service offerings, we might not have or adequately build the competencies necessary to perform our services satisfactorily or may face increased competition. If we are unable to succeed in increasing our market share or realize the benefits of our investments in our new service offerings, we may be unable to implement this element of our growth strategy, and our ability to grow our business or maintain our operating margins could be adversely affected.
Upgrading the information systems that support our operating processes and evolving the technology platform for our services pose risks to our business.
Continued efficient operation of our business requires that we implement standardized global business processes and evolve our information systems to enable this implementation. We have continued to undertake significant programs to optimize business processes with respect to our services. Our inability to effectively manage the implementation of new information systems or upgrades and adapt to new processes designed into these new or upgraded systems in a timely and cost-effective manner may result in disruption to our business and negatively affect our operations.
We have entered into agreements with certain vendors to provide systems development, integration and hosting services that develop or license to us the information technology ("IT") platforms and capacity for programs to optimize our business processes. If such vendors or their products fail to perform as required or if there are substantial delays in developing, implementing and updating our IT platforms, our customer delivery may be impaired, and we may have to make substantial further investments, internally or with third parties, to achieve our objectives. For example, we rely on an external vendor to provide the clinical trial management software used in managing the completion of our customer clinical trials. If that externally provided system is not properly maintained we might not be able to meet the obligations of our contracts or may need to incur significant costs to replace the system or capability. Additionally, our progress may be limited by parties with
24
existing or claimed patents who seek to enjoin us from using preferred technology or seek license payments from us.
Meeting our objectives is dependent on a number of factors which might not take place as we anticipate, including obtaining adequate technology-enabled services, depending upon our third-party vendors to develop and enhance existing applications to adequately support our business, creating IT-enabled services that our customers will find desirable and implementing our business model with respect to these services. Also, increased IT-related expenditures and our potential inability to anticipate increases in service costs may negatively impact our business, financial condition, results of operations or cash flows.
If we fail to perform our services in accordance with contractual requirements, regulatory standards and ethical considerations, we could be subject to significant costs or liability and our reputation could be harmed.
We contract with biopharmaceutical companies to perform a wide range of services to assist them in bringing new drugs to market. Our services include monitoring clinical trials, data and laboratory analysis, EDC, patient recruitment and other related services. Such services are complex and subject to contractual requirements, regulatory standards and ethical considerations. For example, we must adhere to applicable regulatory requirements such as the FDA, current GCP regulations, which govern, among other things, the design, conduct, performance, monitoring, auditing, recording, analysis, and reporting of clinical trials. If we fail to perform our services in accordance with these requirements, regulatory agencies may take action against us or our customers. Such actions may include sanctions such as injunctions or failure of such regulatory authorities to grant marketing approval of products, imposition of clinical holds or delays, suspension or withdrawal of approvals, rejection of data collected in our studies, license revocation, product seizures or recalls, operational restrictions, civil or criminal penalties or prosecutions, damages or fines. Additionally, there is a risk that actions by regulatory authorities, if they result in significant inspectional observations or other measures, could harm our reputation and cause customers not to award us future contracts or to cancel existing contracts. Any such action could have a material adverse effect on our business, financial condition, results of operations, cash flows or reputation.
Such consequences could arise if, among other things, the following occur:
Improper performance of our services. The performance of clinical development services is complex and time-consuming. For example, we may make mistakes in conducting a clinical trial that could negatively impact or obviate the usefulness of the trial or cause the results of the trial to be reported improperly. If the trial results are compromised, we could be subject to significant costs or liability, which could have an adverse impact on our ability to perform our services and our reputation could be harmed. For example:
• | non-compliance generally could result in the termination of ongoing clinical trials or the disqualification of data for submission to regulatory authorities; |
• | compromise of data from a particular trial, such as failure to verify that adequate informed consent was obtained from subjects or improper monitoring of data, could require us to repeat the trial under the terms of our contract at no further cost to our customer, but at a substantial cost to us; and |
• | breach of a contractual term could result in liability for damages or termination of the contract. |
Large clinical trials can cost hundreds of millions of dollars and improper performance of our services could have a material adverse effect on our financial condition, damage our reputation and result in the termination of current contracts by or failure to obtain future contracts from the affected customer or other customers.
Interactive Voice/Web Response Technology malfunction. We develop, maintain and use third-party computer run interactive voice/web response systems to automatically manage the randomization of patients in a given clinical trial to different treatment arms and regulate the supply of investigational drugs, all by means of interactive voice/web response systems. An error in the design, programming or validation of these systems could lead to inappropriate assignment or dosing of patients which could give rise to patient safety issues, invalidation of the trial or liability claims against us. Furthermore, negative publicity associated with such a malfunction could have an adverse effect on our business and reputation. Additionally, errors in randomization may require us to repeat the trial at no further cost to our customer, but at a substantial cost to us.
25
Investigation of customers. From time to time, one or more of our customers are audited or investigated by regulatory authorities or enforcement agencies with respect to regulatory compliance of their clinical trials, programs or the marketing and sale of their drugs. In these situations, we have often provided services to our customers with respect to the clinical trials, programs or activities being audited or investigated, and we are called upon to respond to requests for information by the authorities and agencies. There is a risk that either our customers or regulatory authorities could claim that we performed our services improperly or that we are responsible for clinical trial or program compliance. If our customers or regulatory authorities make such claims against us and prove them, we could be subject to damages, fines or penalties. In addition, negative publicity regarding regulatory compliance of our customers' clinical trials, programs or drugs could have an adverse effect on our business and reputation.
Insufficient customer funding to complete a clinical trial. As noted above, clinical trials can cost hundreds of millions of dollars. There is a risk that we may initiate a clinical trial for a customer, and then the customer becomes unwilling or unable to fund the completion of the trial. In such a situation, notwithstanding the customer's ability or willingness to pay for or otherwise facilitate the completion of the trial, we may be ethically bound to complete or wind down the trial at our own expense.
In addition to the above U.S. laws and regulations, we must comply with the laws of all countries where we do business, including laws governing clinical trials in the jurisdiction where the trials are performed. Failure to comply with applicable requirements could subject us to regulatory risk, liability and potential costs associated with redoing the trials, which could damage our reputation and adversely affect our operating results.
Any future litigation against us could be costly and time-consuming to defend.
We may become subject, from time to time, to legal proceedings and claims that arise in the ordinary course of business or pursuant to governmental or regulatory enforcement activity. While we do not believe that the resolution of any currently pending lawsuits against us will, individually or in the aggregate, have a material adverse effect on our business, financial condition, results of operations or cash flows, litigation to which we subsequently become a party might result in substantial costs and divert management's attention and resources, which might seriously harm our business, financial condition, results of operations and cash flows. Insurance might not cover such claims, might not provide sufficient payments to cover all of the costs to resolve one or more such claims, and might not continue to be available on terms acceptable to us. In particular, any claim could result in potential liability for us if the claim is outside the scope of the indemnification agreement we have with our customers, our customers do not abide by the indemnification agreement as required or the liability exceeds the amount of any applicable indemnification limits or available insurance coverage. A claim brought against us that is uninsured or underinsured could result in unanticipated costs and could have a material adverse effect on our financial condition, results of operations, cash flows or reputation.
Our business exposes us to potential liability for personal injury or claims that could materially adversely affect our business, financial condition, results of operations, cash flows or reputation.
Our business involves clinical trial management, which is one of our clinical development service offerings and includes the testing of new drugs on human volunteers. This business exposes us to the risk of liability for personal injury or death to patients resulting from, among other things, possible unforeseen adverse side effects or improper administration of a drug or device. Many of these volunteers and patients are already seriously ill and are at risk of further illness or death. Although we attempt to negotiate indemnification arrangements with our customers or vendors, we might not be able to collect under these arrangements and our exposure could exceed any contractual limits on indemnification. Any claim or liability could have a material adverse effect on our business, financial condition, results of operations, cash flows or reputation.
If our insurance does not cover all of our indemnification obligations and other liabilities associated with our operations, our business, financial condition, results of operations or cash flows may be materially adversely affected.
We maintain insurance designed to provide coverage for ordinary risks associated with our operations and our ordinary indemnification obligations which we believe to be customary for our industry. The coverage provided by such insurance might not be adequate for all claims we may make or may be contested by our insurance carriers. If our insurance is not adequate or available to pay all claims or exposures associated with
26
our operations, or if we are unable to purchase adequate insurance at reasonable rates in the future, our business, financial condition, results of operations or cash flows may be materially adversely affected.
If we are unable to attract suitable principal investigators and recruit and enroll patients for clinical trials, our clinical development business might suffer.
The recruitment of principal investigators and patients for clinical trials is essential to our business. Principal investigators are typically located at hospitals, clinics or other sites and supervise the administration of the investigational drug to patients during the course of a clinical trial. Patients generally include people from the communities in which the clinical trials are conducted. Several of our competitors are purchasing site networks or site management organizations as a strategy for priority access to a specific site, which could put us at a competitive disadvantage. Our clinical development business could be adversely affected if we are unable to attract suitable and willing principal investigators or recruit and enroll patients for clinical trials on a consistent basis. The expanding global nature of clinical trials increases the risk associated with attracting suitable principal investigators and patients, especially if these trials are conducted in regions where our resources or experience may be more limited. For example, if we are unable to engage principal investigators to conduct clinical trials as planned or enroll sufficient patients in clinical trials, we might need to expend additional funds to obtain access to more principal investigators and patients than planned or else be compelled to delay or modify the clinical trial plans, which may result in additional costs to us or cancellation of the trial by our customer. If realized, these risks may also inhibit our ability to attract new business, particularly in certain regions.
Many of the costs for our Phase I Services segment are fixed in nature, which could adversely affect our business, financial condition, results of operations and cash flows.
Since a large portion of the operating costs for our Phase I Services segment is relatively fixed while revenue is subject to fluctuation, moderate variations in the commencement, progress or completion of the Phase I studies in our Phase I Services segment may cause variations in our financial condition, results of operations and cash flows. Expenses must be recognized when incurred and the delay of a contract could adversely affect our service revenues and profitability. Net service revenue from our Phase I Services segment for the year ended December 31, 2016 represented approximately 1% of our total net service revenue for that period.
If we lose the services of key personnel or are unable to recruit experienced personnel, our business, financial condition, results of operations, cash flows or reputation could be materially adversely affected.
Our success substantially depends on the collective performance, contributions and expertise of our senior management team and other key personnel including qualified management, professional, scientific and technical operating staff and business development personnel. There is significant competition for qualified personnel, particularly those with higher educational degrees, in the biopharmaceutical and related services industries. In addition, the close proximity of some of our facilities to offices of our major competitors could adversely impact our ability to successfully recruit and retain key personnel. The departure of any key executive, or our inability to continue to identify, attract and retain qualified personnel or replace any departed personnel in a timely fashion, might impact our ability to grow our business and compete effectively in our industry and might negatively affect our business, financial condition, results of operations, cash flows or reputation.
Foreign currency exchange rate fluctuations may have a material adverse effect on our financial condition, results of operations and cash flows.
Approximately 21% of our fiscal year 2016 net service revenues were contracted in currencies other than U.S. dollars and 38% of our direct and operating costs are incurred in countries with functional currencies other than the U.S. dollar. Our financial statements are reported in U.S. dollars and changes in foreign currency exchange rates could significantly affect our financial condition, results of operations or cash flows. Our primary exposure to fluctuations in foreign currency exchange rates is related to the following risks:
Foreign Currency Risk from Differences in Customer Contract Currency and Operating Costs Currency. The majority of our global contracts are denominated in U.S. dollars or Euros while our operating costs in foreign countries are denominated in various local currencies. Fluctuations in the exchange rates of the currencies
27
we use to contract with our customers and the currencies in which we incur cost to fulfill those contracts can have a significant impact on our results of operations.
Foreign Currency Translation Risk. The revenue and expenses of our international operations are generally denominated in local currencies and translated into U.S. dollars for financial reporting purposes. Accordingly, exchange rate fluctuations between the value of the U.S. dollar versus local currencies will affect the U.S. dollar value of our foreign currency denominated revenue, costs and results of operations.
Foreign Currency Transaction Risk. We earn revenue from our service contracts over a period of several months and, in many cases, over several years, resulting in timing differences between the consummation and cash settlement of a transaction. Accordingly, profitability of the transactions denominated in foreign currencies is subject to effects of fluctuations in foreign currency exchange rates during the period of time between the consummation and cash settlement of a transaction.
We may seek to limit our exposure to these risks through inclusion of foreign currency exchange rate provisions in our service contracts, and/or by hedging certain exposures with foreign exchange derivative instruments. These measures, however, might not offset or mitigate any, or all of the adverse financial effects of unfavorable movements in foreign currency exchange rates.
Unfavorable economic conditions could have a material adverse effect on our business, financial condition, results of operations or cash flows.
Unfavorable economic conditions and other adverse macroeconomic factors on global and domestic markets might result, among other matters, in tightening in the credit and capital markets, low liquidity, and volatility in fixed income, credit, currency and equity matters. Such conditions could have a negative effect on our business, financial condition, results of operations or cash flows. For example, our customers might not be able to raise money to conduct existing clinical trials, or to fund new drug development and related future clinical trials. In addition, economic or market disruptions could negatively impact our vendors, contractors, or principal investigators which might have a negative effect on our business.
Our effective income tax rate may fluctuate, which may adversely affect our results of operations.
Our effective income tax rate is influenced by our projected profitability in the various taxing jurisdictions in which we operate. Changes in the distribution of profits and losses among taxing jurisdictions may have a significant impact on our effective income tax rate, which in turn could have an adverse effect on our results of operations. Factors that may affect our effective income tax rate include, but are not limited to:
• | the requirement to exclude from our quarterly worldwide effective income tax calculations the benefit for losses in jurisdictions where no income tax benefit can be recognized; |
• | actual and projected full year pre-tax income; |
• | the repatriation of foreign earnings to the United States; |
• | uncertain tax positions; |
• | changes in tax laws in various taxing jurisdictions; |
• | audits by taxing authorities; |
• | the establishment of valuation allowances against deferred income tax assets if we determine that it is more likely than not that future income tax benefits will not be realized; |
• | the release of a previously established valuation allowances against deferred income tax assets if we determine that it is more likely than not that future income tax benefits will be realized; |
• | changes in the relative mix and size of clinical studies in various tax jurisdictions; and |
• | the timing and amount of the vesting and exercising of share-based compensation. |
These changes may cause fluctuations in our effective income tax rate that could adversely affect our results of operations and cause fluctuations in our earnings and earnings per share.
28
We have only a limited ability to protect our intellectual property rights, and these rights are important to our success.
We develop, use and protect our proprietary methodologies, analytics, systems, technologies and other intellectual property. Existing laws of the various countries in which we provide services or solutions offer only limited protection of our intellectual property rights, and the protection in some countries may be very limited. We rely upon a combination of trade secrets, confidentiality policies, nondisclosure agreements, and other contractual arrangements, and copyright and trademark laws, to protect our intellectual property rights. These laws are subject to change at any time and certain agreements might not be fully enforceable, which could further restrict our ability to protect our innovations. Our intellectual property rights might not prevent competitors from independently developing services similar to or duplicative of ours or alleging infringement by us of their intellectual property rights in certain jurisdictions. The steps we take in this regard might not be adequate to prevent or deter infringement or misappropriation of our intellectual property or claims against us for alleged infringement or misappropriation by competitors, former employees or other third parties. Furthermore, we might not be able to detect unauthorized use of, or take appropriate and timely steps to enforce, our intellectual property rights. Enforcing our rights might also require considerable time, money and oversight, and we might not be successful in enforcing our rights.
If we are unable to successfully integrate potential future acquisitions, our business, financial condition, results of operations and cash flows could be materially adversely affected.
We have completed a number of acquisitions in the past and anticipate that a portion of our future growth may come from strategic or tuck-in acquisitions. The success of any acquisition will depend upon, among other things, our ability to effectively integrate acquired personnel, operations, products and technologies into our business and to retain the key personnel and customers of our acquired businesses. In addition, we may be unable to identify suitable acquisition opportunities or obtain any necessary financing on commercially acceptable terms. We may also spend time and money investigating and negotiating with potential acquisition targets but not complete the transaction. Any acquisition could involve other risks, including, among others, the assumption of additional liabilities and expenses, difficulties and expenses in connection with integrating the acquired companies and achieving the expected benefits, issuances of potentially dilutive securities or interest-bearing debt, loss of key employees of the acquired companies, transaction expenses, diversion of management's attention from other business concerns and, with respect to the acquisition of international companies, the inability to overcome differences in international business practices, language and customs. Our failure to successfully integrate potential future acquisitions could have a material adverse effect on our business, financial condition, results of operations and cash flows.
Potential future investments in our customers' businesses or drugs could have a negative impact on our financial results.
Although we historically have not engaged in business transactions with our customers other than to provide our services, we may in the future enter into arrangements with our customers or other drug companies in which we take on some of the risk of the potential success or failure of their businesses or drugs, including making strategic investments in our customers or other drug companies, providing financing to customers or other drug companies or acquiring an interest in the revenues from customers' drugs or in entities developing a limited number of drugs. Our financial results would be adversely affected if any such investments or the underlying drugs result in losses or do not achieve the level of success that we anticipate and/or our return or payment from any such drug investment or financing is less than our direct and indirect costs with respect to these arrangements.
Our relationships with existing or potential customers who are in competition with each other may adversely impact the degree to which other customers or potential customers use our services, which may adversely affect our business, financial condition, results of operations or cash flows.
The biopharmaceutical industry is highly competitive, with biopharmaceutical companies each seeking to persuade payers, providers and patients that their drug therapies are better and more cost-effective than competing therapies marketed or being developed by competing firms. In addition to the adverse competitive interests that biopharmaceutical companies have with each other, biopharmaceutical companies also have adverse interests with respect to drug selection and reimbursement with other participants in the healthcare industry, including payers and providers. Biopharmaceutical companies also compete to be first to market with
29
new drug therapies. We regularly provide services to biopharmaceutical companies who compete with each other, and we sometimes provide services to such customers regarding competing drugs in development. Our existing or future relationships, particularly broader strategic provider relationships, with our biopharmaceutical customers may therefore deter other biopharmaceutical customers from using our services or may result in our customers seeking to place limits on our ability to serve other biopharmaceutical industry participants. In addition, our further expansion into the broader healthcare market may adversely impact our relationships with biopharmaceutical customers, and such customers may elect not to use our services, reduce the scope of services that we provide to them or seek to place restrictions on our ability to serve customers in the broader healthcare market with interests that are adverse to theirs. Any loss of customers or reductions in the level of revenues from a customer could have a material adverse effect on our business, financial condition, results of operations or cash flows.
Our results of operations may be adversely affected if we fail to realize the full value of our goodwill and intangible assets.
As of December 31, 2016, our goodwill and net intangible assets were valued at $667.0 million, which constituted approximately 52% of our total assets. We periodically (at least annually unless triggering events occur that cause an interim evaluation) evaluate goodwill and other acquired intangible assets for impairment. If we are not able to realize the value of goodwill and indefinite-lived intangible assets, we may be required to incur material charges relating to the impairment of those assets.
While we did not record any impairment charges during 2016, during the year ended December 31, 2014, we recorded intangible asset and goodwill impairments of $8.0 million and $9.2 million, respectively. These impairments were associated with our Global Consulting (a component of the Clinical Development segment) and Phase I Services reporting units. Additionally, during the year ended December 31, 2015, we recorded a total asset impairment charge in our Phase I Services reporting unit of $3.9 million, consisting of a long-lived assets impairment charge of $1.0 million and a goodwill impairment charge of $2.9 million. As of December 31, 2015, there were no intangible assets associated with Phase I Services. Similar impairment charges in the future could materially and adversely affect our business, financial condition, results of operations and cash flows.
We face risks arising from the restructuring of our operations which could adversely affect our financial condition, results of operations, cash flows or business reputation.
From time to time, we have adopted cost savings initiatives to improve our operating efficiency through various means such as (i) the reduction of overcapacity, primarily in our costs of services (billable) function, and (ii) the consolidation or other realignment of our resources. For example, in 2016, we approved a global plan to eliminate certain positions worldwide in an effort to ensure that our organizational focus and resources were properly aligned with our strategic goals and to continue strengthening the delivery of our growing backlog to customers. Accordingly, we made changes to our therapeutic unit structure designed to realign with management focus and optimize the efficiency of our resourcing to achieve our strategic plan. Under this plan, we eliminated approximately 200 positions worldwide and closed one of our facilities. In total, during the years ended December 31, 2016, 2015 and 2014 we incurred total pre-tax charges of $8.5 million, $1.8 million and $6.2 million, respectively, associated with restructuring our operations.
Restructuring actions present significant risks that could have a material adverse effect on our operations, financial condition, results of operations, cash flows or business reputation. Such risks include a decrease in employee morale, a greater number of employment claims, the failure to achieve targeted cost savings and the failure to meet operational targets and customer requirements due to the loss of employees and any work stoppages that might occur.
We operate in many different jurisdictions and we could be adversely affected by violations of the FCPA, UK Bribery Act of 2010 and/or similar worldwide anti-corruption laws.
The FCPA, UK Bribery Act of 2010 and similar worldwide anti-corruption laws prohibit companies and their intermediaries from making improper payments for the purpose of obtaining or retaining business. Our internal policies mandate compliance with these anti-corruption laws. We operate in many parts of the world that have experienced corruption to some degree and, in certain circumstances, anti-corruption laws have appeared to conflict with local customs and practices. Despite our training and compliance programs, we
30
cannot assure that our internal control policies and procedures will protect us from acts in violation of anti-corruption laws committed by persons associated with us, and our continued expansion outside the United States, including in developing countries, could increase such risk in the future. Violations of the FCPA or other non-U.S. anti-corruption laws, or even allegations of such violations, could disrupt our business and result in a material adverse effect on our financial condition, results of operations, cash flows and reputation. For example, violations of anti-corruption laws can result in restatements of, or irregularities in, our financial statements as well as severe criminal or civil sanctions. In some cases, companies that violate the FCPA might be debarred by the U.S. government and/or lose their U.S. export privileges. In addition, U.S. or other governments might seek to hold us liable for successor liability FCPA violations or violations of other anti-corruption laws committed by companies that we acquire or in which we invest. Changes in anti-corruption laws or enforcement priorities could also result in increased compliance requirements and related costs which could adversely affect our business, financial condition, results of operations and cash flows.
The failure of third parties to provide us critical support services could adversely affect our business, financial condition, results of operations, cash flows or reputation.
We depend on third parties for support services vital to our business. Such support services include, but are not limited to, laboratory services, third-party transportation and travel providers, freight forwarders and customs brokers, drug depots and distribution centers, suppliers or contract manufacturers of drugs for patients participating in clinical trials, and providers of licensing agreements, maintenance contracts or other services. In addition, we also rely on third-party CROs and other contract clinical personnel for clinical services either in regions where we have limited resources, or in cases where demand cannot be met by our internal staff. The failure of any of these third parties to adequately provide us critical support services could have a material adverse effect on our business, financial condition, results of operations, cash flows or reputation.
The operation of our Phase I clinical facility and the services we provide there including direct interaction with clinical trial patients or volunteers could create potential liability that may adversely affect our business, financial condition, results of operations, cash flows and reputation.
We operate one facility where Phase I clinical trials are conducted. Phase I clinical trials ordinarily involve testing an investigational drug on a limited number of healthy individuals, typically 20 to 120 persons, to evaluate its safety, determine a safe dosage range and identify side effects. Some of these trials involve the administration of investigational drugs to known substance abusers. Failure to operate such a facility in accordance with applicable regulations could result in that facility being shut down, which could disrupt our operations and adversely affect our business, financial condition, results of operations, cash flows and reputation. Additionally, we face risks resulting from the administration of drugs to volunteers, including adverse events, and the professional malpractice of medical care providers. We also directly employ nurses and other trained employees who assist in implementing the testing involved in our clinical trials, such as drawing blood from healthy volunteers. Any professional malpractice or negligence by such principal investigators, nurses or other employees could potentially result in liability to us in the event of personal injury to or death of a volunteer in clinical trials. This liability, particularly if it were to exceed the limits of any indemnification agreements and insurance coverage we may have, may adversely affect our business and financial condition, results of operations, cash flows and reputation.
Risks Related to Our Industry
We face intense competition in many areas of our business and, if we do not compete effectively, our business may be harmed.
The CRO industry is highly competitive. We often compete for business with other CROs and internal development departments, some of which could be considered large CROs in their own right. We also compete with universities and teaching hospitals. Some of these competitors have greater financial resources and a wider range of service offerings over a greater geographic area than we do. If we do not compete successfully, our business will suffer. The industry is highly fragmented, with numerous smaller specialized companies and a handful of full-service companies with global capabilities similar to ours. Increased competition has led to price and other forms of competition, such as acceptance of less favorable contract terms, which could adversely affect our operating results. In recent years, our industry has experienced
31
increased consolidation and might continue to, which might put us at risk of growing more slowly than our competitors that make acquisitions. This trend is likely to produce more competition from the resulting larger companies, and ones without the cost pressures of being public, for both customers and acquisition candidates. One specific aspect of this consolidation competition involves CROs entering into transactions to attempt to control more access to clinical trial participants, like acquisition of site networks and data. These trends could make it harder for us to compete successfully.
In addition, there are few barriers to entry for smaller specialized companies considering entering the industry. Because of their size and focus, small CROs might compete effectively against larger companies such as us, especially in lower cost geographic areas, which could have a material adverse effect on our business.
Outsourcing trends in the biopharmaceutical industry and changes in aggregate spending and research and development budgets could adversely affect our operating results and growth rate.
Our revenues depend on the level of R&D expenditures, size of the drug-development pipelines and outsourcing trends of the biopharmaceutical industry, including the amount of such R&D spend that is outsourced and subject to competitive bidding among CROs. Accordingly, economic factors and industry trends that affect biopharmaceutical companies affect our business. Biopharmaceutical companies continue to seek long-term strategic collaborations with global CROs with favorable pricing terms. Competition for these collaborations is intense and we might not be selected, in which case a competitor may enter into the collaboration and our business with the customer, if any, may be limited. Our success depends in part on our ability to establish and maintain preferred provider relationships with large biopharmaceutical companies. Our failure to develop or maintain these preferred provider relationships could have a material adverse effect on our business and results of operations. Furthermore, in order to obtain preferred provider relationships, we may have to reduce the prices for our services, which could negatively impact our gross margin for these services.
In addition, if the biopharmaceutical industry reduces its outsourcing of clinical trials or such outsourcing fails to grow at projected rates, our business, financial condition, results of operations and cash flows could be materially and adversely affected. We may also be negatively impacted by consolidation and other factors in the biopharmaceutical industry, which may slow decision making by our customers, result in the delay or cancellation of existing projects, cause reductions in overall R&D expenditures, or lead to increased pricing pressures. Further, in the event that one of our customers combines with a company that is using the services of one of our competitors, the combined company could decide to use the services of that competitor or another provider. All of these events could adversely affect our business, financial condition, cash flows or results of operations.
If we fail to comply with federal, state, and foreign healthcare laws, including fraud and abuse laws, we could face substantial penalties and our business, financial condition, results of operations, cash flows and prospects could be adversely affected.
Even though we do not and will not order healthcare services or bill directly to Medicare, Medicaid or other third-party payers, certain federal and state healthcare laws and regulations pertaining to fraud and abuse are and will be applicable to our business. We could be subject to healthcare fraud and abuse laws of both the federal government and the states in which we conduct our business. Because of the breadth of these laws and the narrowness of available statutory and regulatory exceptions, it is possible that some of our business activities could be subject to challenge under one or more of such laws. If we or our operations are found to be in violation of any of the laws described above or any other governmental regulations that apply to us, we may be subject to penalties, including civil and criminal penalties, damages, fines, imprisonment, and the curtailment or restructuring of our operations, any of which could materially adversely affect our ability to operate our business and our financial results.
We may be affected by healthcare reform and potential additional reforms which may adversely impact the biopharmaceutical industry and reduce the need for our services or negatively impact our profitability.
Numerous government bodies are considering or have adopted healthcare reforms and may undertake, or are in the process of undertaking, efforts to control healthcare costs through legislation, regulation and agreements with healthcare providers and biopharmaceutical companies, including many of our customers.
32
As governmental administrations change and reforms take place, we are unable to predict what legislative proposals, if any, will be adopted in the future. If regulatory cost-containment efforts limit the profitability of new drugs by, for example, continuing to place downward pressure on pharmaceutical pricing and/or increasing regulatory burdens and operating costs of the biopharmaceutical industry, our customers may reduce their R&D spending, which could reduce the business they outsource to us. In addition, if regulatory requirements are relaxed or simplified drug approval procedures are adopted, the demand for our services could decrease.
Government bodies have adopted and may continue to adopt new healthcare legislation or regulations that are more burdensome than existing regulations. For example, product safety concerns and recommendations by the Drug Safety Oversight Board could change the regulatory environment for drug products, and new or heightened regulatory requirements may increase our expenses or limit our ability to offer some of our services. We might have to incur additional costs to comply with these or other new regulations, and failure to comply could harm our financial condition, results or operations, cash flows, and reputation. Additionally, new or heightened regulatory requirements may have a negative impact on the ability of our customers to conduct industry-sponsored clinical trials, which could reduce the need for our post-approval development services.
Current and proposed laws and regulations regarding the protection of personal data could result in increased risks of liability or increased cost to us or could limit our service offerings.
The confidentiality, collection, use and disclosure of personal data, including clinical trial patient-specific information, are subject to governmental regulation generally in the country in which the personal data was collected or used. For example, U.S. federal regulations under the Health Insurance Portability and Accountability Act of 1996, as amended, ("HIPAA") generally require individuals' written authorization, in addition to any required informed consent, before protected health information ("PHI") may be used for research and such regulations specify standards for de-identification and for limited data sets. We may also be subject to applicable state privacy and security laws and regulations in states in which we operate. We are indirectly affected by the privacy provisions surrounding individual authorizations because many principal investigators with whom we are involved in clinical trials are directly subject to them as a HIPAA "covered entity." In addition, we obtain identifiable health information from third parties that are subject to such regulations. While we do not believe we are a "business associate" under HIPPA, regulatory agencies may disagree. Because of amendments to the HIPAA data security and privacy rules that were promulgated on January 25, 2013, some of which went into effect on March 26, 2013, there are some instances where HIPAA "business associates" of a "covered entity" may be directly liable for breaches of PHI and other HIPAA violations. These amendments may subject "business associates" to HIPAA's enforcement scheme, which, as amended, can yield up to $1.5 million in annual civil penalties for each HIPAA violation.
In the EU personal data includes any information that relates to an identified or identifiable natural person, with health information carrying additional obligations, including obtaining the explicit consent from the individual for collection, use or disclosure of the information. In addition, we are subject to EU rules with respect to cross-border transfers of such data out of the EU. The United States, the EU and its member states, and other countries where we have operations, such as Japan, South Korea, Malaysia, the Philippines, Russia and Singapore, continue to issue new privacy and data protection laws, rules and regulations that relate to personal data and health information. Failure to comply with certain certification/registration and annual re-certification/registration provisions associated with these data protection and privacy laws, rules and regulations in various jurisdictions, or to resolve any serious privacy or security complaints, could subject us to regulatory sanctions, delays in clinical trials, criminal prosecution or civil liability. Federal, state and foreign governments may propose or have adopted additional legislation governing the collection, possession, use or dissemination of personal data, such as personal health information, and personal financial data as well as security breach notification rules for loss or theft of such data. Additional legislation or regulation of this type might, among other things, require us to implement new security measures and processes or bring within the legislation or regulation de-identified health or other personal data, each of which may require substantial expenditures or limit our ability to offer some of our services. Additionally, if we violate applicable laws, rules or regulations relating to the use, privacy or security of personal data, we could be subject to civil liability or criminal prosecution, be forced to alter our business practices and suffer reputational harm. The European General Data Protection Regulation ("GDPR") was adopted in April 2016 and will go into effect in May 2018, replacing the existing EU data protection framework.
33
The GDPR contains new provisions specifically directed at the processing of health information, higher sanctions and extra-territoriality measures intended to bring non-EU companies under the regulation.
Actions by regulatory authorities or customers to limit the scope of or withdraw an approved drug from the market could result in a loss of revenue.
Government regulators have the authority, after approving a drug or device, to limit its indication for use by requiring additional labeled warnings or to withdraw the drug or device's approval for its approved indication based on safety concerns. Similarly, customers may act to voluntarily limit the availability of approved drugs or devices or withdraw them from the market after we begin our work. If we are providing services to customers for drugs or devices that are limited or withdrawn, we may be required to narrow the scope of or terminate our services with respect to such drugs or devices, which would prevent us from earning the full amount of service revenue anticipated under the related service contracts.
If we do not keep pace with rapid technological change, our services may become less competitive or obsolete.
The biopharmaceutical industry generally, and drug development and clinical research more specifically, are subject to rapid technological change. Our current competitors or other businesses might develop technologies or services that are more effective or commercially attractive than, or render obsolete, our current or future technologies and services. If our competitors introduce superior technologies or services and if we cannot make enhancements to remain competitive, our competitive position would be harmed. If we are unable to compete successfully, we may lose customers or be unable to attract new customers, which could lead to a decrease in our revenue and have an adverse impact on our financial condition.
In addition, the operation of our business relies on IT infrastructure and systems delivered across multiple platforms. The failure of our systems to perform could severely disrupt our business and adversely affect our results of operations. Our systems are also vulnerable to demise from natural or man-made disasters, terrorist attacks, computer viruses or hackers, power loss or other technology system failures. These events could adversely affect our business or results of operations.
The biopharmaceutical industry has a history of patent and other intellectual property litigation and we might be involved in costly intellectual property lawsuits.
The biopharmaceutical industry has a history of intellectual property litigation and these lawsuits will likely continue in the future. Accordingly, we may face patent infringement suits or be called upon to provide documentation by companies that have patents for similar business processes or other suits alleging infringement of their intellectual property rights. Legal proceedings relating to intellectual property could be expensive, take significant time and divert management's attention from other business concerns, regardless of the outcome of the litigation. In the event an infringement lawsuit was brought against us and we did not prevail, we might have to pay substantial damages and we could be required to stop infringing activity or obtain a license to use technology on unfavorable terms.
Risks Related to Our Indebtedness
Our substantial debt could adversely affect our financial condition.
As of December 31, 2016, our total principal amount of indebtedness was $500.0 million, which was comprised of a $475.0 million Term Loan and $25.0 million outstanding under our $200.0 million Revolving credit facility. Our substantial indebtedness could adversely affect our financial condition and thus make it more difficult for us to satisfy our obligations with respect to our senior secured facilities. If our cash flow is not sufficient to service our debt and adequately fund our business, we may be required to seek further additional financing or refinancing or dispose of assets. We might not be able to influence any of these alternatives on satisfactory terms or at all. Our substantial indebtedness could also:
• | increase our vulnerability to adverse general economic, industry or competitive developments; |
• | require us to dedicate a more substantial portion of our cash flows from operations to payments on our indebtedness, thereby reducing the availability of our cash flows to fund working capital, investments, acquisitions, capital expenditures, and other general corporate purposes; |
34
• | limit our ability to make required payments under our existing contractual commitments, including our existing long-term indebtedness; |
• | limit our ability to fund a change of control offer; |
• | require us to sell certain assets; |
• | restricting us from making strategic investments, including acquisitions or causing us to make non-strategic divestitures; |
• | limit our flexibility in planning for, or reacting to, changes in our business and the industry in which we operate; |
• | place us at a competitive disadvantage compared to our competitors that have less debt; |
• | cause us to incur substantial fees from time to time in connection with debt amendments or refinancings; |
• | increase our exposure to rising interest rates because a substantial portion of our borrowings is at variable interest rates; and |
• | limit our ability to borrow additional funds or to borrow on terms that are satisfactory to us. |
Despite our level of indebtedness, we are able to incur more debt and undertake additional obligations. Incurring such debt or undertaking such additional obligations could further exacerbate the risks to our financial condition.
We may be able to incur substantial additional indebtedness in the future. Although covenants under our five-year $675.0 million credit agreement ("Credit Agreement") entered into on May 14, 2015 (as amended on August 31, 2016), which is comprised of a $475.0 million term loan and a $200.0 million revolving line of credit, limit our ability to incur certain additional indebtedness, these restrictions are subject to a number of qualifications and exceptions, and the indebtedness incurred in compliance with these restrictions could be substantial. To the extent we incur additional indebtedness, the risks associated with our leverage described above, including our possible inability to service our debt obligations, would increase.
Servicing our debt will require a significant amount of cash, and our ability to generate sufficient cash depends on many factors, some of which are beyond our control.
Our ability to make payments on and refinance our debt, make strategic acquisitions and to fund capital expenditures depends on our ability to generate cash flow in the future. To some extent, our ability to generate future cash flow is subject to general economic, financial, competitive and other factors that are beyond our control. We cannot assure you that:
• | our business will generate sufficient cash flow from operations; |
• | we will continue to realize the cost savings, revenue growth and operating improvements that resulted from the execution of our long-term strategic plan; or |
• | future sources of funding will be available to us in amounts sufficient to enable us to fund our liquidity needs. |
We also may experience difficulties repatriating cash from foreign subsidiaries and accounts due to law, regulation or contracts which could further constrain our liquidity. If we cannot fund our liquidity needs, we will have to take actions such as reducing or delaying capital expenditures, marketing efforts, strategic acquisitions, investments and alliances, selling assets, restructuring or refinancing our debt or seeking additional equity capital. We cannot assure you that any of these remedies could, if necessary, be effected on commercially reasonable or favorable terms, or at all, or that they would permit us to meet our scheduled debt service obligations. Any inability to generate sufficient cash flow or refinance our debt on favorable terms could have a material adverse effect on our financial condition. In addition, if we incur additional debt, the risks associated with our substantial leverage, including the risk that we will be unable to service our debt or generate enough cash flow to fund our liquidity needs, could intensify.
35
Covenant restrictions under our Credit Agreement may limit our ability to operate our business.
Our Credit Agreement contains covenants that may restrict our ability to, among other things, borrow money, pay dividends, make capital expenditures, make strategic acquisitions and effect a consolidation, merger or disposal of all or substantially all of our assets. Although the covenants in our Credit Agreement are subject to various exceptions, we cannot assure you that these covenants will not adversely affect our ability to finance future operations or capital needs or to engage in other activities that may be in our best interest. In addition, in certain circumstances, our long-term debt requires us to maintain a specified financial ratio and satisfy certain financial condition tests, which may require that we take action to reduce our debt or to act in a manner contrary to our business objectives. A breach of any of these covenants could result in a default under our senior secured facilities. If an event of default under our Credit Agreement occurs, the lenders thereunder could elect to declare all amounts outstanding, together with accrued interest, to be immediately due and payable. In such case, we might not have sufficient funds to repay all the outstanding amounts. In addition, our Credit Agreement is secured by first priority security interests on substantially all of our real and personal property, including the capital stock of certain of our subsidiaries. If an event of default under our Credit Agreement occurs, the lenders thereunder could exercise their rights under the related security documents. Any acceleration of amounts due under our Credit Agreement or the substantial exercise by the lenders of their rights under the security documents would likely have a material adverse effect on us.
Interest rate fluctuations may have a material adverse effect on our business, financial condition, results of operations or cash flows.
Because we have substantial variable rate debt, fluctuations in interest rates may affect our business, financial condition, results of operations or cash flows. We currently utilize interest rate swaps to limit our exposure to interest rate fluctuations, however, such instruments may not be effective. As of December 31, 2016, we had approximately $500.0 million of total principal indebtedness, comprised of $475.0 million in Term Loan debt and $25.0 million in borrowings under our Revolving credit facility, of which $241.7 million was not covered by an interest rate swap and therefore subject to variable interest rates.
Risks Related to Ownership of Our Common Stock
Our stock price is subject to volatility, which could have a material adverse impact on investors and employee retention.
Since our initial public offering in November 2014 (the "IPO"), the price of our stock, as reported by NASDAQ, has ranged from a low of $19.61 on November 7, 2014 to a high of $57.11 on April 18, 2016. In addition, securities markets worldwide have experienced, and are likely to continue to experience, significant price and volume fluctuations. This market volatility, as well as general economic, market or political conditions, could affect stock price in ways that may be unrelated to our operating performance. The trading price of our stock is subject to significant price fluctuations in response to many factors, including:
• | market conditions or trends in our industry, including with respect to the regulatory environment, or the economy as a whole; |
• | fluctuations in quarterly operating results, as well as differences between our actual financial and operating results and those expected by investors; |
• | future performance guidance, if any, that we provide to the public, any changes in this guidance or our failure to meet this guidance; |
• | changes in financial estimates or ratings by any securities analysts who follow our stock, our failure to meet those estimates or the failure of those analysts to initiate or maintain coverage of our stock; |
• | changes in key personnel; |
• | entry into new markets; |
• | announcements by us or our competitors of new service offerings or significant acquisitions, divestitures, strategic partnerships, joint ventures or capital commitments; |
• | actions by competitors; |
36
• | changes in operating performance and market valuations of other companies in the industry; |
• | investors' perceptions of our prospects and the prospects of the industry; |
• | investors' perceptions of the investment opportunity associated with our stock relative to other investment alternatives; |
• | the public's reaction to press releases or other public announcements by us or third parties, including our filings with the SEC; |
• | announcements related to litigation; |
• | changes in the credit ratings of our debt; |
• | the sustainability of an active trading market for our stock; |
• | future sales of our stock by our significant shareholders, officers and directors; |
• | other events or factors, including those resulting from system failures and disruptions, cyber-attacks, earthquakes, hurricanes, war, acts of terrorism, other natural disasters or responses to these events; and |
• | changes in accounting principles. |
These and other factors may cause the market price and demand for shares of our stock to fluctuate substantially, which could result in reduced liquidity and a decline in the price of our stock. When the market price of a stock is volatile, security holders often institute class action litigation against the company that issued the stock. If we become involved in this type of litigation, regardless of the outcome, we could incur substantial legal costs and our management's attention could be diverted from the operation of our business, which could have a material adverse effect on our business, financial condition, results of operations and cash flows.
We do not expect to pay any cash dividends for the foreseeable future.
We do not anticipate that we will pay any dividends to holders of our stock for the foreseeable future. Any payment of cash dividends will be at the discretion of the Board and will depend on our financial condition, capital requirements, legal requirements, earnings and other factors. Our ability to pay dividends is restricted by the terms of our Credit Agreement and might be restricted by the terms of any indebtedness that we incur in the future. Consequently, you should not rely on dividends in order to receive a return on your investment. For additional information on our dividend policy, see Part II, Item 5 "Market for Registrant's Common Equity, Related Stockholder Matters and Issuer Purchases of Equity Securities" in this Annual Report on Form 10-K.
Future sales of our stock in the public market could cause the market price of our stock to decrease significantly.
Sales or issuances of substantial amounts of our stock in the public market by the Company or our shareholders may cause the market price of our stock to decrease significantly. The perception that such sales or issuances could occur could also depress the market price of our stock. Any such sales or issuances could also create public perception of difficulties or problems with our business and might also make it more difficult for us to raise capital through the sale of equity securities in the future at a time and price that we deem appropriate.
As of December 31, 2016, we had 53,762,786 outstanding shares of Class A common stock, of which 2,878,930 shares are shares of outstanding options and restricted stock units that, if exercised or sold, would result in these additional shares becoming available for sale subject in some cases to Rule 144 and Rule 701 under the Securities Act.
If we are unable to regain compliance with NASDAQ’s continued listing requirements, our common stock could be delisted, which would make our common stock significantly less liquid.
As previously announced, on November 1, 2016, Charles C. Harwood, Jr. retired from the Board. Mr. Harwood also served on our audit committee and, accordingly, Mr. Harwood’s retirement caused our audit
37
committee to have only two members. As a result, we are currently noncompliant with the NASDAQ Listing Rule 5605 (c)(2)(A), which requires listed companies to have at least three audit committee members. We notified the NASDAQ that we intend to rely on the cure provision of Rule 5605(c)(4)(B), which states that we have until the earlier of the date of our next annual shareholders meeting or November 1, 2017 to comply with this requirement. The Board expects to appoint a new independent director to become a member of the audit committee prior to the expiration of the cure period. However, if we are not able to regain compliance with this listing requirement by the end of the cure period, we could face delisting from the NASDAQ. This circumstance could have an adverse effect on the ability of an investor to sell any shares of our common stock as well as on the selling price for such shares.
As a result of their previous rights as holders of additional shares of our common stock, our former Sponsors have significant influence over our company, and their interests may be different from or conflict with those of our other shareholders.
Although our former Sponsors, Avista Capital Partners, L.P. ("Avista") and Ontario Teachers' Pension Plan Board ("OTPP"), no longer have direct holdings in the company, as a result of their previous rights as holders of shares of our stock, the former Sponsors nominated two current members of the Board. Since the former Sponsors could invest in entities that directly or indirectly compete with us, when conflicts arise between the interests of the former Sponsors and the interest of our shareholders, these directors might not be disinterested.
Provisions of our corporate governance documents and Delaware law could make an acquisition of our company more difficult and may prevent attempts by our shareholders to replace or remove our current management, even if beneficial to our shareholders.
Provisions of our amended and restated certificate of incorporation and our amended and restated bylaws contain provisions that delay, defer or discourage transactions involving an actual or potential change in control of us or change in our management that shareholders may consider favorable, including transactions in which you might otherwise receive a premium for your shares. These provisions could also limit the price that investors might be willing to pay in the future for shares of our stock, thereby depressing the market price of our stock. In addition, these provisions may frustrate or prevent any attempts by our shareholders to replace or remove our current management by making it more difficult for shareholders to replace members of the Board. Because the Board is responsible for appointing the members of our management team, these provisions could in turn affect any attempt to replace current members of our management team. Among others, these provisions include, (i) our ability to issue preferred stock without shareholder approval, (ii) the requirement that our shareholders may not act without a meeting, (iii) requirements for advance notification of shareholder nominations and proposals contained in our bylaws, (iv) the absence of cumulative voting for our directors, (v) requirements for shareholder approval of certain business combinations and (vi) the limitations on director nominations contained in our Stockholders Agreement.
Additionally, Section 203 of the Delaware General Corporation Law (the "DGCL") prohibits a publicly held Delaware corporation from engaging in a business combination with an interested shareholder, generally a person which together with its affiliates owns, or within the last three years has owned, 15% of our voting stock, for a period of three years after the date of the transaction in which the person became an interested shareholder, unless the business combination is approved in a prescribed manner. The existence of the foregoing provision could also limit the price that investors might be willing to pay in the future for shares of our stock, thereby depressing the market price of our stock.
If securities analysts or industry analysts downgrade our shares, publish negative research or reports, or do not publish reports about our business, our stock price and trading volume could decline.
The trading market for our stock is to some extent influenced by the research and reports that industry or securities analysts publish about us, our business and our industry. If one or more analysts adversely change their recommendation regarding our shares or our competitors' stock, our share price would likely decline. If one or more analysts cease coverage of us or fail to regularly publish reports on us, we might lose visibility in the financial markets, which in turn could cause our share price or trading volume to decline.
38
We are incurring increased costs and obligations as a result of being a public company.
As a public company, we are required to comply with certain additional corporate governance and financial reporting practices and policies. As a result, due to compliance requirements of the Exchange Act, the Sarbanes-Oxley Act of 2002 ("Sarbanes-Oxley"), the Dodd-Frank Act, the listing requirements of the NASDAQ, and other applicable securities rules and regulations, we have and will continue to incur significant legal, accounting and other expenses. The Exchange Act requires, among other things, that we file annual, quarterly, and current reports with respect to our business and operating results with the SEC. We are also required to ensure that we have the ability to prepare financial statements and other disclosures that are fully compliant with all SEC reporting requirements on a timely basis. Compliance with these rules and regulations has increased and may continue to increase our legal and financial compliance costs, and might make some activities more difficult, time-consuming or costly and increase demand on our systems and resources.
We might not be successful in complying with these requirements and the significant amount of resources required to ensure compliance could have a material adverse effect on our business, financial condition, results of operations and cash flows.
Our internal controls over financial reporting are required to meet all the standards of Section 404 of Sarbanes-Oxley, and failure to achieve and maintain effective internal controls over financial reporting could have a material adverse effect on our stock price, reputation, business, financial condition, results of operations and cash flows.
Section 404 of Sarbanes-Oxley requires management and our independent registered public accounting firm to assess and attest to the effectiveness of internal control over financial reporting on an annual basis. The rules governing the standards that must be met to assess our internal control over financial reporting are complex and require significant documentation, testing and possible remediation of our existing controls and could result in incurring significant additional expenditures. We are required to design, implement and test our internal controls over financial reporting in order to comply with this obligation. The effort necessary to meet these requirements is time consuming, costly, and complicated, and we must continually evaluate and refine these processes on an ongoing basis. We might encounter problems or delays in completing the implementation of any required improvements and therefore fail to receive a favorable attestation provided by our independent registered public accounting firm. Further, material weaknesses or significant deficiencies in our internal control over financial reporting may exist or otherwise be discovered in the future. If we fail to maintain an effective internal control environment, such failure could limit our ability to report our financial results accurately and timely, resulting in misstatements and/or restatements of our consolidated financial statements, which may cause investors to lose confidence and have a material adverse effect on our stock price, reputation, business, financial condition, results of operations and cash flows.
We are a holding company and rely on dividends and other payments, advances and transfers of funds from our subsidiaries to meet our obligations and pay any dividends.
We have no direct operations and no significant assets other than ownership of 100% of the capital stock of our subsidiaries. Because we conduct our operations through our subsidiaries, we depend on those entities for dividends and other payments to generate the funds necessary to meet our financial obligations, and to pay any dividends with respect to our stock. Legal and contractual restrictions in our Credit Agreement and other agreements which may govern future indebtedness of our subsidiaries, as well as the financial condition and operating requirements of our subsidiaries, may limit our ability to obtain cash from our subsidiaries. The earnings from, or other available assets of, our subsidiaries might not be sufficient to pay dividends or make distributions or loans to enable us to pay any dividends on our stock or other obligations. Any of the foregoing could materially and adversely affect our business, financial condition, results of operations and cash flows.
Item 1B. Unresolved Staff Comments.
None.
39
Item 2. Properties.
As of December 31, 2016, we had 73 facilities located in 45 countries. During the year ended December 31, 2016, we utilized approximately 86% of our available facility space; however, as we continue to expand in new locations, the utilization of our facilities may decline in the short term. Most of our facilities consist solely of office space. We lease all of our facilities, with the exception of office space owned in Madrid, Spain. Our headquarters and principal executive offices are located in Raleigh, North Carolina, where we lease space in two locations totaling approximately 187,700 square feet. The leases for both of our Raleigh locations expire in February 2019.
In January 2017, we entered into a 12-year lease for a new corporate headquarters in Morrisville, North Carolina, where we intend to relocate all employees currently housed in our two existing Raleigh locations. We expect the new building to be completed in mid-2018 to accommodate a phased move coinciding with the expiration of our existing leases. Additionally, in February 2017, the Company entered into a new 11-year lease agreement for new space in a nearby location as the lease for our Camberley, United Kingdom location expires in 2018.
In addition, we lease substantial facilities in Austin, Texas; Beijing, China; Camberley, United Kingdom; Gurgaon, India; Mexico City, Mexico; Munich, Germany; Paris, France; Toronto, Canada and Wilmington, North Carolina. We also maintain offices in various other Asian-Pacific, European, Latin American and North American locations, including Australia, the Middle East and Africa. None of our leases is individually material to our business model and all either have options to renew or are located in major markets where we believe there are adequate opportunities to continue business operations at terms satisfactory to us.
Item 3. Legal Proceedings.
We are party to legal proceedings incidental to our business. While our management currently believes the ultimate outcome of these proceedings, individually and in the aggregate, will not have a material adverse effect on our consolidated financial statements, litigation is subject to inherent uncertainties. Were an unfavorable ruling to occur, there exists the possibility of a material adverse impact on our financial condition and results of operations.
Item 4. Mine Safety Disclosures.
Not applicable.
40
PART II
Item 5. Market for Registrant’s Common Equity, Related Stockholder Matters and Issuer Purchases of Equity Securities.
Market Information for Common Stock
The following table sets forth the high and low sales prices per share of our common stock as reported by the NASDAQ for the periods indicated:
High | Low | |||||||
Fiscal Year 2016: | ||||||||
Fourth Quarter | $ | 52.75 | $ | 41.10 | ||||
Third Quarter | $ | 47.39 | $ | 37.27 | ||||
Second Quarter | $ | 57.11 | $ | 36.70 | ||||
First Quarter | $ | 48.13 | $ | 34.19 | ||||
High | Low | |||||||
Fiscal Year 2015: | ||||||||
Fourth Quarter | $ | 50.40 | $ | 37.51 | ||||
Third Quarter | $ | 51.69 | $ | 37.53 | ||||
Second Quarter | $ | 42.45 | $ | 29.03 | ||||
First Quarter | $ | 34.54 | $ | 22.17 | ||||
Holders of Record
On February 21, 2017, there were approximately 16 shareholders of record of our common stock. This number does not include shareholders for whom shares are held in "nominee" or "street" name.
Dividend Policy
Since becoming a public company, we have not declared or paid cash dividends on our common stock, nor do we intend to pay cash dividends on our common stock in the foreseeable future. However, in the future, subject to the factors described below and our future liquidity and capitalization, we may change this policy and choose to pay dividends.
We are a holding company that does not conduct any business operations of our own. As a result, our ability to pay cash dividends on our common stock is dependent upon cash dividends and distributions and other transfers from our subsidiaries. Our ability to pay dividends is currently restricted by the terms of our Credit Agreement, and may be further restricted by any future indebtedness we or they incur. In addition, under Delaware law, the Board may declare dividends only to the extent of our surplus (which is defined as total assets at fair market value minus total liabilities, minus statutory capital) or, if there is no surplus, out of our net profits for the then current and/or immediately preceding fiscal year.
Any future determination to pay dividends will be at the discretion of the Board and will take into account restrictions in our debt instruments, including our Credit Agreement, general economic business conditions, our financial condition, results of operations and cash flows, our capital requirements, our business prospects, the ability of our operating subsidiaries to pay dividends and make distributions to us, legal restrictions, and such other factors as the Board may deem relevant. For additional information on these restrictive covenants, see Part II, Item 7 "Management's Discussion and Analysis of Financial Condition and Results of Operations—Liquidity and Capital Resources" and "Note 4 - Debt and Leases" to our audited consolidated financial statements included in Part II, Item 8, in this Annual Report on Form 10-K.
Recent Sales of Unregistered Securities
We did not have any sales of unregistered securities during 2016.
41
Purchases of Equity Securities by the Issuer
In July 2016, the Board approved a $150.0 million repurchase program for shares of our common stock in open market transactions effected through a broker-dealer at prevailing market prices, in block trades, or in privately negotiated transactions. We may also repurchase shares of our common stock pursuant to a trading plan meeting the requirements of Rule 10b5-1 under the Securities Exchange Act of 1934, as amended, which would permit shares of our common stock to be repurchased when we might otherwise be precluded from doing so by law. The stock repurchase program commenced on August 1, 2016 and will end no later than December 31, 2017. The stock repurchase program does not obligate us to repurchase any particular amount of common stock, and it could be modified, suspended or discontinued at any time. The timing and amount of repurchases will be determined by our management based on a variety of factors such as the market price of our common stock, our liquidity requirements, and overall market conditions. The stock repurchase program will be subject to applicable legal requirements, including federal and state securities laws.
In August 2016, our former private equity sponsors, Avista and OTPP, completed a secondary stock offering for 4,500,000 shares. In conjunction with the secondary stock offering, we repurchased 1,500,000 shares of our common stock under the stock repurchase program from Avista and OTPP in a private transaction at a price of $43.00 per share, resulting in a total purchase price of approximately $64.5 million.
During the three months ended December 31, 2016, there were no repurchases under the repurchase program. As of December 31, 2016, we had remaining authorization to repurchase up to $85.5 million of shares of our common stock under the stock repurchase program.
42
Stock Performance Graph
The information included under the heading “Stock Performance Graph” is “furnished” and not “filed” for purposes of Section 18 of the Exchange Act, or otherwise subject to the liabilities of that section, nor shall it be deemed to be “soliciting material” subject to Regulation 14A or incorporated by reference in any filing under the Securities Act of 1933, as amended, or the Exchange Act of 1934, as amended.
Our common stock is listed for trading on the NASDAQ under the symbol “INCR.” The Stock Price Performance Graph set forth below compares the cumulative total shareholder return on our common stock for the period from November 7, 2014 through December 31, 2016, with the cumulative total return of the Nasdaq Composite Index and the Nasdaq Health Care Index over the same period. The comparison assumes $100 was invested on November 7, 2014 in the common stock of INC Research Holdings, Inc., in the Nasdaq Composite Index, and in the Nasdaq Health Care Index and assumes reinvestment of dividends, if any.
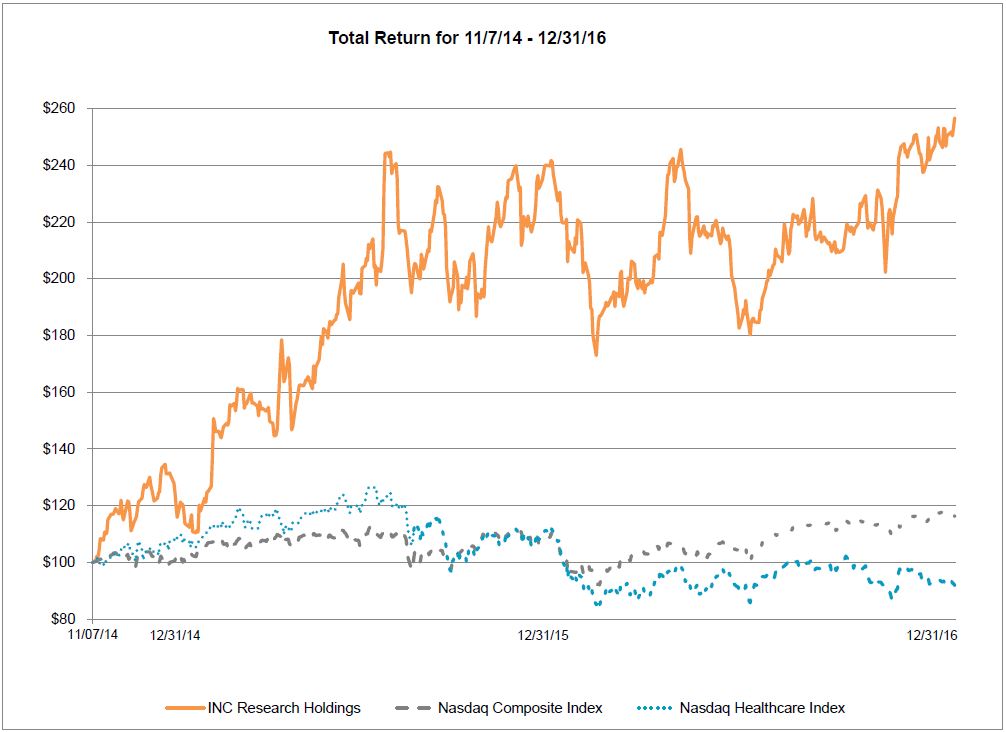
The stock price performance shown on the graph above is not necessarily indicative of future price performance. Information used in the graph was obtained from the Nasdaq Stock Market, a source believed to be reliable, but we are not responsible for any errors or omissions in such information.
Equity Compensation Plans
The information required by Part II, Item 5 of Form 10-K regarding equity compensation plans is incorporated herein by reference to “Part III, Item 12. Security Ownership of Certain Beneficial Owners and Management and Related Stockholder Matters.”
43
Item 6. Selected Financial Data.
The following tables set forth our selected consolidated financial data for the periods ending on and as of the dates indicated. We derived the consolidated statements of operations data for the years ended December 31, 2016, 2015 and 2014 and the consolidated balance sheet data as of December 31, 2016 and 2015 from our audited consolidated financial statements included in Part II, Item 8, in this Annual Report on Form 10-K. We derived the consolidated statements of operations data for the years ended December 31, 2013 and 2012 and the consolidated balance sheet data as of December 31, 2014, 2013 and 2012 from our audited consolidated financial statements not included in this Annual Report on Form 10-K. You should read the consolidated financial data set forth below together with our consolidated financial statements and the related notes thereto included in Part II, Item 8, and Part II, Item 7 "Management's Discussion and Analysis of Financial Condition and Results of Operations" in this Annual Report on Form 10-K. Our historical results are not necessarily indicative of future results of operations.
Year Ended December 31, | |||||||||||||||||||
2016 | 2015 | 2014 | 2013 | 2012 | |||||||||||||||
(in thousands, except per share amounts) | |||||||||||||||||||
Statement of Operations Data: | |||||||||||||||||||
Net service revenue(1) | $ | 1,030,337 | $ | 914,740 | $ | 809,728 | $ | 652,418 | $ | 579,145 | |||||||||
Reimbursable out-of-pocket expenses | 580,259 | 484,499 | 369,071 | 342,672 | 289,455 | ||||||||||||||
Total revenue | 1,610,596 | 1,399,239 | 1,178,799 | 995,090 | 868,600 | ||||||||||||||
Costs and operating expenses: | |||||||||||||||||||
Direct costs | 626,633 | 542,404 | 515,059 | 432,261 | 389,056 | ||||||||||||||
Reimbursable out-of-pocket expenses | 580,259 | 484,499 | 369,071 | 342,672 | 289,455 | ||||||||||||||
Selling, general, and administrative | 172,386 | 156,609 | 145,143 | 117,890 | 109,428 | ||||||||||||||
Restructuring, CEO transition and other costs(2) | 13,612 | 1,785 | 6,192 | 11,828 | 35,380 | ||||||||||||||
Transaction expenses(3) | 3,143 | 1,637 | 7,902 | 508 | — | ||||||||||||||
Asset impairment charges(4) | — | 3,931 | 17,245 | — | 4,000 | ||||||||||||||
Depreciation | 21,353 | 18,140 | 21,619 | 19,175 | 19,915 | ||||||||||||||
Amortization | 37,851 | 37,874 | 32,924 | 39,298 | 58,896 | ||||||||||||||
Income (loss) from operations | 155,359 | 152,360 | 63,644 | 31,458 | (37,530 | ) | |||||||||||||
Other (expense) income, net: | |||||||||||||||||||
Interest expense, net | (11,800 | ) | (15,448 | ) | (52,787 | ) | (60,489 | ) | (62,007 | ) | |||||||||
Loss on extinguishment of debt | (439 | ) | (9,795 | ) | (46,750 | ) | — | — | |||||||||||
Other (expense) income, net | (9,002 | ) | 3,857 | 7,689 | (1,649 | ) | 4,679 | ||||||||||||
Income (loss) before provision for income taxes | 134,118 | 130,974 | (28,204 | ) | (30,680 | ) | (94,858 | ) | |||||||||||
Income tax (expense) benefit | (21,488 | ) | (13,927 | ) | 4,734 | (10,849 | ) | 35,744 | |||||||||||
Net income (loss) | 112,630 | 117,047 | (23,470 | ) | (41,529 | ) | (59,114 | ) | |||||||||||
Class C common stock dividends | — | — | (375 | ) | (500 | ) | (500 | ) | |||||||||||
Redemption of New Class C common stock | — | — | (3,375 | ) | — | — | |||||||||||||
Net income (loss) attributable to common shareholders | $ | 112,630 | $ | 117,047 | $ | (27,220 | ) | $ | (42,029 | ) | $ | (59,614 | ) | ||||||
Earnings per share attributable to common shareholders: | |||||||||||||||||||
Basic | $ | 2.08 | $ | 2.02 | $ | (0.51 | ) | $ | (0.81 | ) | $ | (1.14 | ) | ||||||
Diluted | $ | 2.03 | $ | 1.95 | $ | (0.51 | ) | $ | (0.81 | ) | $ | (1.14 | ) | ||||||
Weighted average common shares outstanding: | |||||||||||||||||||
Basic | 54,031 | 57,888 | 53,301 | 52,009 | 52,203 | ||||||||||||||
Diluted | 55,610 | 60,146 | 53,301 | 52,009 | 52,203 | ||||||||||||||
44
As of December 31, | |||||||||||||||||||
2016 | 2015 | 2014 | 2013 | 2012 | |||||||||||||||
(in thousands) | |||||||||||||||||||
Balance Sheet Data: | |||||||||||||||||||
Cash and cash equivalents | $ | 102,471 | $ | 85,011 | $ | 126,453 | $ | 96,972 | $ | 81,363 | |||||||||
Total assets(5) | 1,288,507 | 1,211,219 | 1,241,365 | 1,227,455 | 1,250,985 | ||||||||||||||
Total debt and capital leases(5)(6) | 497,724 | 501,839 | 416,257 | 588,823 | 587,517 | ||||||||||||||
Total shareholders' equity | 301,473 | 217,434 | 392,209 | 276,207 | 316,830 | ||||||||||||||
Other Financial Data: | |||||||||||||||||||
Backlog(7) | $ | 1,987,729 | $ | 1,813,178 | $ | 1,589,386 | $ | 1,490,787 | $ | 1,320,548 | |||||||||
Net Book-to-Bill ratio(8) | 1.2x | 1.3x | 1.2x | 1.2x | 1.2x | ||||||||||||||
Year Ended December 31, | |||||||||||||||||||
2016 | 2015 | 2014 | 2013 | 2012 | |||||||||||||||
(in thousands) | |||||||||||||||||||
Statement of Cash Flow Data: | |||||||||||||||||||
Net cash provided by (used in): | |||||||||||||||||||
Operating activities | $ | 109,332 | $ | 204,740 | $ | 131,447 | $ | 37,270 | $ | 42,999 | |||||||||
Investing activities | (31,353 | ) | (21,111 | ) | (27,853 | ) | (17,714 | ) | (12,974 | ) | |||||||||
Financing activities | (53,316 | ) | (211,399 | ) | (67,698 | ) | (6,841 | ) | (18,932 | ) | |||||||||
Other Financial Data: | |||||||||||||||||||
Capital expenditures | $ | (31,353 | ) | $ | (21,111 | ) | $ | (25,551 | ) | $ | (17,714 | ) | $ | (9,591 | ) | ||||
Dividends paid | — | — | (375 | ) | (500 | ) | (500 | ) | |||||||||||
Redemption of New Class C common stock | — | — | (3,375 | ) | — | — | |||||||||||||
Net new business awards(8) | 1,224,061 | 1,176,533 | 949,790 | 814,177 | 676,250 | ||||||||||||||
Non-GAAP Financial Measures: | |||||||||||||||||||
EBITDA(9) | $ | 205,122 | $ | 202,436 | $ | 79,126 | $ | 88,282 | $ | 45,960 | |||||||||
Adjusted EBITDA(9) | 244,506 | 221,360 | 145,276 | 105,521 | 84,366 | ||||||||||||||
Adjusted Net Income(9) | 139,007 | 120,174 | 44,647 | 16,290 | 1,539 | ||||||||||||||
Adjusted Diluted Earnings per share(9) | $ | 2.50 | $ | 2.00 | $ | 0.83 | $ | 0.31 | $ | 0.03 | |||||||||
(1) | During the second and third quarters of 2014, we experienced higher-than-normal change order activity estimated to be between $6 million and $12 million. Net service revenue for 2014 after adjusting for the estimated impact of $9.0 million in higher-than-normal change order activity was $800.7 million. |
(2) | Restructuring, CEO transition and other costs consist of: (i) severance costs associated with the reduction of our workforce in line with our expectations of future business operations, (ii) transition costs associated with the transition to our new CEO, (iii) legal and consulting costs incurred for the continued consolidation of legal entities and restructuring of our contract financial process to meet the requirements of upcoming accounting regulation changes, and (iv) lease obligation and termination costs in connection with the abandonment and closure of redundant facilities. Other costs consist primarily of information technology and other consulting and legal fees attributable to our integration of Kendle. |
(3) | Transaction expenses for the year ended December 31, 2016 were $3.1 million and represented fees associated with secondary stock offerings and the August 2016 stock repurchase, debt refinancing costs and legal fees associated with other corporate transactions. Transaction expenses for the year ended December 31, 2015 were $1.6 million and primarily consisted of fees associated with the Company's secondary stock offerings, debt placement and refinancing and other corporate transactions. Transaction expenses for the year ended December 31, 2014 were $7.9 million and primarily consisted of $4.2 million in debt issuance costs and third-party fees associated with the debt refinancings in February and November 2014, $3.4 million of fees associated with the termination of the Avista Capital Partners, L.P. consulting agreement, and $0.3 million of legal fees associated with the MEK Consulting acquisition. Transaction expenses of $0.5 million for the year ended December 31, 2013 related to third-party fees associated with debt refinancing and the legal fees associated with our acquisition of MEK Consulting which was completed in March 2014. |
45
(4) | During the year ended December 31, 2015, we recorded a $3.9 million impairment charge related to goodwill and long-lived assets associated with our Phase I Services reporting unit. During the year ended December 31, 2014, we recorded a $17.2 million impairment charge related to intangible assets and goodwill associated with our Global Consulting, a component of the Clinical Development segment, and Phase I Services reporting units. During the year ended December 31, 2012, we recorded a $4.0 million impairment charge related to the goodwill associated with our Phase I Services reporting unit. |
(5) | During 2015, we adopted ASU 2015-03, Interest - Imputation of Interest (Subtopic 835-30): Simplifying the Presentation of Debt Issuance Costs. As a result, total assets, total debt and capital leases have been reduced by $2.3 million, $3.2 million, $3.7 million, $5.7 million, and $6.7 million of debt issuance costs associated with the Term Loan and Revolver as of December 31, 2016, 2015, 2014, 2013 and 2012, respectively, with periods prior to 2015 being retroactively adjusted. |
(6) | Total debt and capital leases include $5.5 million, $4.6 million, and $6.7 million of unamortized discounts as of December 31, 2014, 2013, and 2012, respectively. |
(7) | Backlog consists of anticipated future net service revenue from contract and pre-contract commitments that are supported by written communications. The dollar amount of our backlog consists of anticipated future net service revenue from business awards that either have not started but are anticipated to begin in the next 12 months, or are in process and have not been completed. The majority of our contracts can be terminated by our customers with 30 days' notice. Backlog has been adjusted to reflect any cancellations or adjustments to the related contracts and changes in the foreign currency exchange rates of awards not denominated in U.S. dollars. Included within backlog at December 31, 2016 is approximately $0.87 billion that we expect to generate revenue in 2017, with the remainder expected to translate into revenue beyond 2017. Backlog is not necessarily indicative of future financial performance because it will likely be impacted by a number of factors, including the size and duration of projects, which can be performed over several years, project change orders resulting in increases or decreases in project scope, and cancellations. |
(8) | Net new business awards represent the value of future net service revenue awarded during the period supported by contracts or written pre-contract communications from our customers for projects that have received appropriate internal funding approval, are not contingent upon completion of another trial or event, and are expected to commence within the next 12 months, minus the value of cancellations in the same period. Net book-to-bill ratio represents "net new business awards" divided by net service revenue. We believe net book-to-bill ratio is commonly used in our industry and represents a useful indicator of our potential future revenue growth rate in that it measures the rate at which we are generating net new business awards compared to our current revenues. Net book-to-bill is better viewed on a trailing twelve month basis due to the variability within any particular quarter that can be caused by a very large award or cancellation. However, we cannot assure you that the net book-to-bill rate is predictive of future financial performance because it will likely be impacted by a number of factors, including the size and duration of projects, which can be performed over several years, project change orders resulting in increases or decreases in project scope, and cancellations. |
(9) | We report our financial results in accordance with GAAP. To supplement this information, we also use the following non-GAAP financial measures in this report: EBITDA, Adjusted EBITDA, and Adjusted Net Income and Adjusted Diluted Earnings per share. For a discussion of the non-GAAP financial measures in this Annual Report on Form 10-K, see "Non-GAAP Financial Measures" below. Investors are encouraged to review the following reconciliations of these non-GAAP measures to our closest reported GAAP measures. |
46
Reconciliation of GAAP Measures to Non-GAAP Measures
Year Ended December 31, | |||||||||||||||||||
2016 | 2015 | 2014 | 2013 | 2012 | |||||||||||||||
(in thousands, except per share amounts) | |||||||||||||||||||
EBITDA and Adjusted EBITDA: | |||||||||||||||||||
Net income (loss) | $ | 112,630 | $ | 117,047 | $ | (23,470 | ) | $ | (41,529 | ) | $ | (59,114 | ) | ||||||
Interest expense, net | 11,800 | 15,448 | 52,787 | 60,489 | 62,007 | ||||||||||||||
Income tax expense (benefit) | 21,488 | 13,927 | (4,734 | ) | 10,849 | (35,744 | ) | ||||||||||||
Depreciation | 21,353 | 18,140 | 21,619 | 19,175 | 19,915 | ||||||||||||||
Amortization | 37,851 | 37,874 | 32,924 | 39,298 | 58,896 | ||||||||||||||
EBITDA | 205,122 | 202,436 | 79,126 | 88,282 | 45,960 | ||||||||||||||
Restructuring, CEO transition and other costs(a) | 13,612 | 1,785 | 6,192 | 11,828 | 35,380 | ||||||||||||||
Transaction expenses(b) | 3,143 | 1,637 | 7,902 | 508 | — | ||||||||||||||
Asset impairment charges(c) | — | 3,931 | 17,245 | — | 4,000 | ||||||||||||||
Share-based compensation(d) | 14,020 | 5,074 | 3,370 | 2,419 | 1,248 | ||||||||||||||
Contingent consideration and other expense(e) | 1,696 | 559 | 918 | 253 | 1,867 | ||||||||||||||
Monitoring and advisory fees(f) | — | — | 462 | 582 | 590 | ||||||||||||||
R&D tax credit adjustment(g) | (2,528 | ) | — | — | — | — | |||||||||||||
Other expense (income)(h) | 9,002 | (3,857 | ) | (7,689 | ) | 1,453 | (1,944 | ) | |||||||||||
Loss (gain) on unconsolidated affiliates(i) | — | — | — | 196 | (2,735 | ) | |||||||||||||
Loss on extinguishment of debt(j) | 439 | 9,795 | 46,750 | — | — | ||||||||||||||
Change order adjustment(k) | — | — | (9,000 | ) | — | — | |||||||||||||
Adjusted EBITDA | $ | 244,506 | $ | 221,360 | $ | 145,276 | $ | 105,521 | $ | 84,366 | |||||||||
Adjusted Net Income: | |||||||||||||||||||
Net income (loss) | $ | 112,630 | $ | 117,047 | $ | (23,470 | ) | $ | (41,529 | ) | $ | (59,114 | ) | ||||||
Amortization | 37,851 | 37,874 | 32,924 | 39,298 | 58,896 | ||||||||||||||
Restructuring, CEO transition and other costs(a) | 13,612 | 1,785 | 6,192 | 11,828 | 35,380 | ||||||||||||||
Transaction expenses(b) | 3,143 | 1,637 | 7,902 | 508 | — | ||||||||||||||
Asset impairment charges(c) | — | 3,931 | 17,245 | — | 4,000 | ||||||||||||||
Share-based compensation(d) | 14,020 | 5,074 | 3,370 | 2,419 | 1,248 | ||||||||||||||
Contingent consideration and other expense(e) | 1,696 | 559 | 918 | 253 | 1,867 | ||||||||||||||
Monitoring and advisory fees(f) | — | — | 462 | 582 | 590 | ||||||||||||||
R&D tax credit adjustment(g) | (2,528 | ) | — | — | — | — | |||||||||||||
Other expense (income)(h) | 9,002 | (3,857 | ) | (7,689 | ) | 1,453 | (1,944 | ) | |||||||||||
Loss (gain) on unconsolidated affiliates(i) | — | — | — | 196 | (2,735 | ) | |||||||||||||
Loss on extinguishment of debt(j) | 439 | 9,795 | 46,750 | — | — | ||||||||||||||
Change order adjustment(k) | — | — | (9,000 | ) | — | — | |||||||||||||
Adjust income tax to normalized rate(l) | (50,858 | ) | (53,671 | ) | (30,957 | ) | 1,282 | (36,649 | ) | ||||||||||
Adjusted Net Income | $ | 139,007 | $ | 120,174 | $ | 44,647 | $ | 16,290 | $ | 1,539 | |||||||||
Adjusted Diluted Earnings Per Share: | |||||||||||||||||||
Adjusted diluted earnings per share | $ | 2.50 | $ | 2.00 | $ | 0.83 | $ | 0.31 | $ | 0.03 | |||||||||
Diluted weighted average common shares outstanding(m) | 55,610 | 60,146 | 53,858 | 52,033 | 52,236 | ||||||||||||||
(a) | Restructuring, CEO transition and other costs consist of: (i) severance costs associated with a reduction of workforce in line with our expectations of future business operations, (ii) transition costs associated with the transition to our new CEO, (iii) legal and consulting costs incurred for the continued consolidation of legal entities and restructuring of our contract financial process to meet the requirements of upcoming accounting regulation |
47
changes, and (iv) lease obligation and termination costs in connection with abandonment and closure of redundant facilities.
(b) | Represents fees associated with stock repurchases and secondary stock offerings, debt placement and refinancings, IPO costs, and other corporate transactions. |
(c) | Represents impairment of goodwill, intangible assets and long-lived assets associated with our Global Consulting, a component of the Clinical Development segment, and Phase I Services reporting units. |
(d) | Represents share-based compensation expense related to awards granted under equity incentive plans. |
(e) | Consists of contingent consideration expense incurred as a result of acquisitions and other expenses accounted for as compensation expense under GAAP. |
(f) | Represents monitoring and advisory fees paid to affiliates of Avista Capital Partners, L.P in the periods prior to the initial public offering in November 2014, as well as reimbursements of expenses paid to affiliates of Avista Capital Partners, L.P. and affiliates of Teachers' Private Capital pursuant to the Expense Reimbursement Agreement. These arrangements were terminated upon completion of our initial public offering. |
(g) | Represents research and development tax credits in certain international locations for expenses incurred during 2016 and recorded as a reduction of direct costs. We have not received similar level of research and development credits in prior years as the associated costs did not qualify. Accordingly, we have excluded these expenses for 2016. |
(h) | Represents other expense (income) comprised primarily of foreign exchange gains and losses. |
(i) | Represents losses (gains) associated with unconsolidated affiliates. |
(j) | Represents loss on extinguishment of debt associated with the Company's debt refinancing activities in November 2014, May 2015, and August 2016. |
(k) | During the second and third quarters of 2014, we experienced higher-than-normal change order activity estimated to be between $6 million and $12 million. Adjusted EBITDA, Adjusted Net Income, and Adjusted diluted earnings per share for 2014 have been adjusted by $9.0 million to remove the impact of this higher-than-normal change order activity. |
(l) | Our effective tax rate has been adjusted to an overall effective rate of 34% in 2016, 36% in 2015 and 37% in 2014, 2013, and 2012, in order to reflect the removal of the tax impact of our valuation allowances recorded against our deferred tax assets and changes in the assertion to indefinitely reinvest the undistributed earnings of foreign subsidiaries. Historically, we recorded a valuation allowance against some of our deferred tax assets, but we believe that these valuation allowances cause significant fluctuations in our financial results that are not indicative of our underlying financial performance. Specifically, the majority of our revenue is generated in jurisdictions in which we recognized no tax expense or benefit due to changes in this valuation allowance. |
(m) | Diluted weighted average common shares outstanding has been adjusted to give effect to dilutive securities for purposes of calculating adjusted diluted earnings per share by 557, 24, and 33 shares for the years ended December 31, 2014, 2013 and 2012, respectively. These shares were excluded from the calculation of GAAP earnings per share as we reported a net loss for the period. |
Non-GAAP Financial Measures
We report our financial results in accordance with GAAP. To supplement this information, we also use the following non-GAAP financial measures in this Annual Report on Form 10-K: EBITDA, Adjusted EBITDA, Adjusted Net Income and Adjusted Diluted Earnings per share. Management believes that these non-GAAP measures provide useful supplemental information to management and investors regarding the underlying performance of our business operations. We use these non-GAAP measures to, among other things, evaluate our operating performance on a consistent basis, calculate incentive compensation for our employees and assess compliance with various metrics associated with our Credit Agreement.
48
EBITDA represents earnings before interest, taxes, depreciation and amortization. Adjusted EBITDA represents EBITDA, further adjusted to exclude the impact of higher-than-normal revenue change order activity and certain expenses and transactions that we believe are not representative of our core operating results, including management fees that terminated upon our IPO, restructuring and CEO transition costs, transaction expenses, non-cash share-based compensation expense, contingent consideration related to acquisitions, asset impairment charges, loss on extinguishment of debt, R&D tax credit adjustment, results of and gains or losses from the sale of unconsolidated affiliates, and other income (expense).
Adjusted Net Income and Adjusted Diluted Earnings per share represent net income (loss) adjusted to exclude the impact of higher-than-normal revenue change order activity and certain expenses and transactions that we believe are not representative of our core operating results, including management fees that terminated upon our IPO, acquisition-related amortization, restructuring and CEO transition costs, transaction expenses, non-cash share-based compensation expense, contingent consideration related to acquisitions, asset impairment charges, loss on extinguishment of debt, R&D tax credit adjustment, results of and gains or losses from the sale of unconsolidated affiliates, other income (expense) and an adjustment to our tax rate to reflect an expected long-term tax rate that excludes the impact of our valuation allowances and historical NOLs.
We believe that EBITDA is a useful metric for investors as it is a common metric used by investors, analysts and debt holders to measure our ability to service our debt obligations, fund capital expenditures and meet working capital requirements.
Each of the non-GAAP measures are used by management and the Board to evaluate our core operating results as it excludes certain items whose fluctuations from period-to-period do not necessarily correspond to changes in the core operations of the business. Adjusted Net Income (including Adjusted Diluted Earnings per Share) are used by management and the Board to assess our business, as well as by investors and analysts, to measure our performance.
These non-GAAP measures are performance measures only and are not measures of our cash flows or liquidity. EBITDA, Adjusted EBITDA, Adjusted Net Income and Adjusted Diluted Earnings per share are non-GAAP financial measures that are not in accordance with, or an alternative for, measures of financial performance prepared in accordance with GAAP and may be different from similarly titled non-GAAP measures used by other companies. Non-GAAP measures have limitations in that they do not reflect all of the amounts associated with our results of operations as determined in accordance with GAAP. Some of the limitations are:
• | EBITDA and Adjusted EBITDA do not reflect the significant interest expense, or the cash requirements necessary to service interest or principal payments, on our debt; |
• | although depreciation and amortization are non-cash charges, the assets being depreciated and amortized may have to be replaced in the future, and EBITDA, Adjusted EBITDA and Adjusted Net Income do not reflect the cash requirements for such replacements; and |
• | EBITDA, Adjusted EBITDA, and Adjusted Net Income do not reflect our actual tax expense or, in the case of EBITDA and Adjusted EBITDA, the cash requirements to pay our taxes. |
See the consolidated financial statements included in Part II, Item 8, in this Annual Report on Form 10-K for our GAAP results. Additionally, for reconciliations of EBITDA, Adjusted EBITDA, Adjusted Net Income and Adjusted Diluted Earnings per share to our closest reported GAAP measures see "Selected Financial Data - Reconciliation of GAAP Measures to Non-GAAP Measures" above.
49
Item 7. Management's Discussion and Analysis of Financial Condition and Results of Operations.
The following discussion and analysis of our financial condition and results of operations should be read together with Part II, Item 6, "Selected Financial Data" and the consolidated financial statements and the related notes included in Part II, Item 8, in this Annual Report on Form 10-K. This discussion contains forward-looking statements related to future events and our future financial performance that are based on current expectations and subject to risks and uncertainties. Our actual results may differ materially from those anticipated in these forward-looking statements as a result of many factors, including those described in "Risk Factors" in Part I, Item 1A of, and elsewhere in, this Annual Report on Form 10-K.
Overview of Our Business and Services
We are a leading global CRO based on revenues, focused primarily on Phase I to Phase IV clinical development services for the biopharmaceutical and medical device industries. We provide our customers with highly differentiated services across their development portfolios using either our therapeutic expertise as a full service provider or utilizing our global scale and systems as a functional service provider. We consistently and predictably deliver clinical development services, consulting, and real world evidence support in a complex environment and offer a proprietary, operational approach to the delivery of our projects through our Trusted Process® methodology. Our service offerings focus on optimizing the development of and, therefore, the commercial potential for, our customers' new biopharmaceutical compounds, enhancing returns on their R&D investments, and reducing their overhead costs by offering an attractive variable cost alternative to fixed cost, in-house resources.
Our extensive range of services supports the entire drug development process from Phase I to Phase IV and allows us to offer our customers an integrated suite of investigative site support and clinical development services. We offer these services across a wide variety of therapeutic areas, bringing deep clinical expertise with a primary focus on Phase I to Phase IV clinical trials delivered in both a turnkey full service clinical model, as well as large scale functional service models. We provide total biopharmaceutical program development while also providing discrete services for any part of a clinical trial. Our combination of service area experts and depth of clinical capability allows for enhanced protocol design and actionable trial data.
We have two reportable segments: Clinical Development Services and Phase I Services. Clinical Development Services offers a variety of clinical development services, including full-service global studies, as well as ancillary services such as clinical monitoring, investigator recruitment, patient recruitment, data management, study reports to assist customers with their drug development process, and specialized consulting services. Phase I Services focuses on clinical development services for Phase I trials that include scientific exploratory medicine, first-in-human studies through proof-of-concept stages and support for Phase I studies in established compounds. For financial information regarding revenue and long-lived assets by geographic areas, please see "Note 14 - Operations by Geographic Location" to our consolidated financial statements included in Part II, Item 8, in this Annual Report on Form 10-K.
The discussion and analysis of our financial condition and results of operations herein is presented on a consolidated basis. Because our Clinical Development Services segment accounts for substantially all of our business operations and approximately 99% of our net service revenue for the year ended December 31, 2016, we believe that a discussion of our reportable segments' operations would not be meaningful disclosure for investors. See further discussion in "Note 13 - Segment Information" to our consolidated financial statements included in Part II, Item 8, in this Annual Report on Form 10-K.
We earn net service revenue primarily for services performed under contracts for global clinical drug trials, based upon a combination of milestones and output measures that are specific to the services performed and defined by the contract. Engagements for Phase II to Phase IV clinical trials, which represent the majority of our revenue, are typically long duration contracts ranging from several months to several years. The contracts for these engagements typically cover the detailed scope of work, phases, milestones, billing schedules and processes for review of work and clinical results. Contracts are individually priced and negotiated based on the anticipated level of effort required to complete the project, the complexity and performance risks, and the level of competition in the market.
50
Direct costs associated with these contracts consist principally of compensation expense and benefits associated with our employees and other employee-related costs. While we can manage the majority of these costs relative to the amount of contracted services we have during any given period, direct costs as a percentage of net service revenue can vary from period to period. Such fluctuations are due to a variety of factors, including, among others: (i) the level of staff utilization created by our ability to effectively manage our workforce, (ii) adjustments to the timing of work on specific customer contracts, (iii) the experience mix of personnel assigned to projects, and (iv) the service mix and pricing of our contracts. In addition, as global projects wind down or as delays and cancellations occur, staffing levels in certain countries or functional areas can become misaligned with the current business volume.
New Business Awards and Backlog
We add new business awards to backlog when we enter into a contract or when we receive a written commitment from the customer selecting us as its service provider, provided that (i) the customer has received appropriate internal funding approval, (ii) the project or projects are not contingent upon completion of another trial or event, (iii) the project or projects are expected to commence within the next 12 months and (iv) the customer has entered or intends to enter into a comprehensive contract as soon as practicable. Contracts generally have terms ranging from several months to several years. We recognize revenue on these awards as services are performed, provided we have entered into a contractual commitment with the customer.
Our new business awards, net of cancellations of prior awards, for the years ended December 31, 2016, 2015 and 2014 were $1.22 billion, $1.18 billion and $0.95 billion, respectively, representing a 4.0% increase from 2015 to 2016 and a 23.9% increase from 2014 to 2015. Net new business awards were higher for the year ended December 31, 2016, due to a lower cancellation rate across our therapeutic service offerings. The growth in net awards was principally in our CNS therapeutic area. New business awards have varied and will continue to vary significantly from quarter to quarter.
The dollar amount of our backlog consists of anticipated future net service revenue from business awards that either (1) have not started but are anticipated to begin in the future, or (2) are in process and have not been completed. Our backlog also reflects any cancellation or adjustment activity related to these contracts. The average duration of our contracts will fluctuate from period to period in the future based on the contracts comprising our backlog at any given time. The majority of our contracts can be terminated by our customers with 30 days' notice. The dollar amount of our backlog is adjusted each quarter for foreign currency fluctuations. During the year ended December 31, 2016, fluctuations in foreign currency exchange rates resulted in an unfavorable impact on our December 31, 2016 backlog in the amount of approximately $19.2 million, primarily due to the weakening of the Euro and British Pound against the U.S. dollar. Our backlog as of December 31, 2016, 2015 and 2014 was $1.99 billion, $1.81 billion and $1.59 billion, respectively, representing a 9.6% increase from 2015 to 2016 and a 14.1% increase from 2014 to 2015. Included within backlog at December 31, 2016 is approximately $0.87 billion that we expect to translate into revenue in 2017, with the remainder expected to generate revenue beyond 2017.
We believe that backlog and net new business awards might not be consistent indicators of future revenue because they have been, and likely will be, affected by a number of factors, including the variable size and duration of projects, many of which are performed over several years, and cancellations and changes to the scope of work during the course of projects. Additionally, projects may be canceled or delayed by the customer or delayed by regulatory authorities. Projects that have been delayed for less than 12 months remain in backlog, but the anticipated timing of the recognition of revenue is uncertain. We generally do not have a contractual right to the full amount of the revenue reflected in our backlog. If a customer cancels an award, we might be reimbursed for the costs we have incurred.
Fluctuations in our reported backlog and net new business award levels also result from the fact that we may receive a small number of relatively large orders in any given reporting period. Because of these large orders, our backlog and net new business awards in that reporting period might reach levels that are not sustained in subsequent reporting periods. As we increasingly compete for and enter into large contracts that are more global in nature, we expect the rate at which our backlog and net new business awards convert into revenue to decrease, or lengthen. See Part I, Item 1A "Risk Factors—Risks Related to Our Business—Our backlog
51
might not be indicative of our future revenues, and we might not realize all of the anticipated future revenue reflected in our backlog" for more information.
Results of Operations
Year Ended December 31, 2016 Compared to the Years Ended December 31, 2015 and 2014
The following table sets forth amounts from our consolidated financial statements along with the percentage change for years ended December 31, 2016, 2015 and 2014 (dollars in thousands):
For the Years Ended December 31, | Change | ||||||||||||||||||||||||
2016 | 2015 | 2014 | 2016 to 2015 | 2015 to 2014 | |||||||||||||||||||||
Net service revenue | $ | 1,030,337 | $ | 914,740 | $ | 809,728 | $ | 115,597 | 12.6 | % | $ | 105,012 | 13.0 | % | |||||||||||
Reimbursable out-of-pocket expenses | 580,259 | 484,499 | 369,071 | 95,760 | 19.8 | % | 115,428 | 31.3 | % | ||||||||||||||||
Total revenue | 1,610,596 | 1,399,239 | 1,178,799 | 211,357 | 15.1 | % | 220,440 | 18.7 | % | ||||||||||||||||
Costs and operating expenses: | |||||||||||||||||||||||||
Direct costs | 626,633 | 542,404 | 515,059 | 84,229 | 15.5 | % | 27,345 | 5.3 | % | ||||||||||||||||
Reimbursable out-of-pocket expenses | 580,259 | 484,499 | 369,071 | 95,760 | 19.8 | % | 115,428 | 31.3 | % | ||||||||||||||||
Selling, general, and administrative | 172,386 | 156,609 | 145,143 | 15,777 | 10.1 | % | 11,466 | 7.9 | % | ||||||||||||||||
Restructuring, CEO transition and other costs | 13,612 | 1,785 | 6,192 | 11,827 | 662.6 | % | (4,407 | ) | (71.2 | )% | |||||||||||||||
Transaction expenses | 3,143 | 1,637 | 7,902 | 1,506 | 92.0 | % | (6,265 | ) | (79.3 | )% | |||||||||||||||
Asset impairment charges | — | 3,931 | 17,245 | (3,931 | ) | (100.0 | )% | (13,314 | ) | (77.2 | )% | ||||||||||||||
Depreciation and amortization | 59,204 | 56,014 | 54,543 | 3,190 | 5.7 | % | 1,471 | 2.7 | % | ||||||||||||||||
Total operating expenses | 1,455,237 | 1,246,879 | 1,115,155 | 208,358 | 16.7 | % | 131,724 | 11.8 | % | ||||||||||||||||
Income from operations | 155,359 | 152,360 | 63,644 | 2,999 | 2.0 | % | 88,716 | 139.4 | % | ||||||||||||||||
Total other (expense) income, net | (21,241 | ) | (21,386 | ) | (91,848 | ) | 145 | 0.7 | % | 70,462 | 76.7 | % | |||||||||||||
Income (loss) before provision for income taxes | 134,118 | 130,974 | (28,204 | ) | 3,144 | 2.4 | % | 159,178 | 564.4 | % | |||||||||||||||
Income tax (expense) benefit | (21,488 | ) | (13,927 | ) | 4,734 | (7,561 | ) | (54.3 | )% | (18,661 | ) | (394.2 | )% | ||||||||||||
Net income (loss) | $ | 112,630 | $ | 117,047 | $ | (23,470 | ) | $ | (4,417 | ) | (3.8 | )% | $ | 140,517 | 598.7 | % | |||||||||
52
Net Service Revenue and Reimbursable Out-of-Pocket Expenses
For the years ended December 31, 2016, 2015 and 2014, total revenue was comprised of the following (dollars in thousands):
For the Years Ended December 31, | Change | ||||||||||||||||||||||||
2016 | 2015 | 2014 | 2016 to 2015 | 2015 to 2014 | |||||||||||||||||||||
Net service revenue | $ | 1,030,337 | $ | 914,740 | $ | 809,728 | $ | 115,597 | 12.6 | % | $ | 105,012 | 13.0 | % | |||||||||||
Reimbursable out-of-pocket expenses | 580,259 | 484,499 | 369,071 | 95,760 | 19.8 | % | 115,428 | 31.3 | % | ||||||||||||||||
Total revenue | $ | 1,610,596 | $ | 1,399,239 | $ | 1,178,799 | $ | 211,357 | 15.1 | % | $ | 220,440 | 18.7 | % | |||||||||||
Net service revenue increased $115.6 million, or 12.6%, to $1,030.3 million for the year ended December 31, 2016 from $914.7 million for the year ended December 31, 2015. In 2016, our revenue grew across all therapeutic areas and has been particularly strong in the central nervous system, oncology and other complex therapeutic areas. The growth in revenue during 2016 was primarily due to our strong backlog at the beginning of the year, the acceleration of a group of projects with one of our sponsors, revenue mix, and the growth of our functional service provider business. Our net service revenue for the year ended December 31, 2016 was negatively impacted by fluctuations in foreign exchange rates and contractual currency adjustment provisions of $11.7 million, as the U.S. dollar has strengthened compared to the prior year.
Net service revenue increased $105.0 million, or 13.0%, to $914.7 million for the year ended December 31, 2015 from $809.7 million for the year ended December 31, 2014. The increase in 2015 is primarily driven by the growth in awards, a lower cancellation rate of previously awarded business and a positive revenue mix. The growth in our revenue in 2015 was across all therapeutic areas and was particularly strong in the complex therapeutic areas. Our net service revenue for the year ended December 31, 2015, was negatively impacted by fluctuations in foreign exchange rates and contractual currency adjustment provisions of $45.4 million, as the U.S. dollar strengthened compared to the prior year.
Net service revenue from our top five customers accounted for approximately 33%, 34% and 37% of net service revenue for the years ended December 31, 2016, 2015 and 2014, respectively. No customer accounted for 10% or more of total net service revenue for the years ended December 31, 2016 or 2015. Various subsidiaries of customers A and B accounted for approximately 14% and 12%, respectively, of net service revenue for the year ended December 31, 2014.
Reimbursable out-of-pocket expenses increased 19.8%, or $95.8 million, to $580.3 million for the year ended December 31, 2016 from $484.5 million for the year ended December 31, 2015. Reimbursable out-of-pocket expenses increased 31.3%, or $115.4 million, to $484.5 million for the year ended December 31, 2015 from $369.1 million for the year ended December 31, 2014. These increases were principally due to overall increases in net service revenue during both periods, as well as an increase in the number of studies in which we procured principal investigator services. These reimbursements are offset by an equal amount reported under the same caption in the "Costs and operating expenses" section of the consolidated statements of operations in our consolidated financial statements included in Part II, Item 8, in this Annual Report on Form 10-K and, accordingly, have no impact on gross margin. Reimbursable out-of-pocket expenses fluctuate significantly from period to period based on the timing of program initiation or closeout and the mix of program complexity and do not necessarily change in direct correlation to net service revenues.
53
Direct Costs and Reimbursable Out-of-Pocket Expenses
For the years ended December 31, 2016, 2015 and 2014, direct costs and reimbursable out-of-pocket expenses were as follows (dollars in thousands):
For the Years Ended December 31, | Change | ||||||||||||||||||||||||
2016 | 2015 | 2014 | 2016 to 2015 | 2015 to 2014 | |||||||||||||||||||||
Direct costs | $ | 626,633 | $ | 542,404 | $ | 515,059 | $ | 84,229 | 15.5 | % | $ | 27,345 | 5.3 | % | |||||||||||
Reimbursable out-of-pocket expenses | 580,259 | 484,499 | 369,071 | 95,760 | 19.8 | % | 115,428 | 31.3 | % | ||||||||||||||||
Total Direct costs and Reimbursable out-of-pocket expenses | $ | 1,206,892 | $ | 1,026,903 | $ | 884,130 | $ | 179,989 | 17.5 | % | $ | 142,773 | 16.1 | % | |||||||||||
The following is a summary of the year-over-year fluctuation in components of direct costs during the year ended December 31, 2016 as compared to the year ended December 31, 2015 and the year ended December 31, 2015 as compared to the year ended December 31, 2014 (in thousands):
Year Ended December 31, 2016 to 2015 | Year Ended December 31, 2015 to 2014 | ||||||
Change in: | |||||||
Salaries, benefits, and incentive compensation | $ | 46,112 | $ | 33,093 | |||
Contract Labor | 17,961 | 12,248 | |||||
Other | 20,156 | (17,996 | ) | ||||
Total | $ | 84,229 | $ | 27,345 | |||
Direct costs increased by $84.2 million, or 15.5%, to $626.6 million for the year ended December 31, 2016 from $542.4 million for the year ended December 31, 2015. These increases were primarily driven by (i) the growth in our revenues and the resulting need for additional resources, (ii) our need to utilize a higher percentage of third party contractors during 2016 compared to 2015 as the result of our commitment to a customer to accelerate work originally planned for 2017 into 2016, and (iii) the one-time benefits received in 2015, as discussed further below. The increases were partially offset by a reduction in direct costs of $15.5 million related to fluctuations in foreign currency exchange rates during the year ended December 31, 2016 compared to the prior year.
The salaries, benefits and incentive compensation portion of direct costs increased by $46.1 million for the year ended December 31, 2016 compared to the prior year, primarily driven by additional personnel to support the growth of our business, partially offset by lower costs due to fluctuations in foreign currency exchange rates and a benefit of $2.5 million newly qualifying expenses that provided us certain R&D tax credits.
Contract labor cost increased by $18.0 million for the year ended December 31, 2016, compared to the prior year due to the need to hire temporary labor in order to accelerate the timeline on a significant set of studies for the benefit of our customer. We use temporary contract labor or third-party contractors, which is more expensive than our own employees, to supplement our workforce for short-term demand needs such as these. We anticipate that we will reduce the mix of contract labor as these studies wind down.
Other direct costs increased by $20.2 million for the year ended December 31, 2016, compared to the prior year primarily due to (i) increases in travel, information technology and facilities costs from increased headcount, (ii) an increase in non-labor project related costs and (iii) the one-time benefits included in 2015, as discussed below.
Direct costs increased by $27.3 million, or 5.3%, to $542.4 million for the year ended December 31, 2015 from $515.1 million for the year ended December 31, 2014, primarily due to increased salaries, benefits and incentive compensation. This increase in employee-related expenses was partially offset by a reduction in direct costs of $37.8 million related to fluctuations in foreign currency exchange rates during the year ended
54
December 31, 2015 compared to the prior year. Other direct costs decreased by $5.7 million for the year ended December 31, 2015, compared to the prior year primarily due to (i) 2014 including a provision for non-recoverable Value Added Tax ("VAT") expenses, as compared to 2015, including a release of a portion of these liabilities, (ii) certain other one-time benefits primarily due to the favorable resolution of disputed pass-through costs realized in the first and third quarters of 2015, (iii) decreases in subcontract services, (iv) a reduction in certain non-labor project related costs, and (v) an increase in vendor contract rebates. Partially offsetting these decreases was an increase in expenses related to contract labor, travel, facilities, and information technology costs to support revenue growth.
As discussed above, direct costs for the year ended December 31, 2015 included certain one-time benefits that we do not believe are representative of ongoing operations, which we estimate to be approximately $6.6 million. Specifically, in the first quarter of 2015 we realized benefits of $5.1 million related to (i) a favorable resolution of several VAT and other tax items, (ii) a change in estimate related to 2014 employee incentive compensation, and (iii) a favorable settlement of disputed pass-through costs. During the third quarter of 2015, we realized a benefit of $4.9 million from the favorable resolution of additional disputed pass-through costs; however, we had initially recorded approximately $3.4 million of these obligations in the first half of 2015, resulting in the net favorable impact on the full year ended December 31, 2015 of approximately $1.5 million.
As we continue to expand our business, initiate new studies and invest in resources to support new customer proposals, the increase in headcount-related expenses will outpace our revenue growth, resulting in gross margins remaining flat or declining slightly in the short term. Partially offsetting this anticipated decrease in gross margin, we expect to continue to see the benefits from a number of our cost-saving initiatives including (i) leveraging our therapeutic management overhead infrastructure over the expanded revenue base, (ii) improving the utilization of our facilities, and (iii) the consolidation of our clinical trial management systems resulting in our achieving better efficiencies due to standardization.
As noted above, reimbursable out-of-pocket expenses increased by 19.8%, or $95.8 million, to $580.3 million for the year ended December 31, 2016 from $484.5 million for the year ended December 31, 2015. Reimbursable out-of-pocket expenses increased by 31.3%, or $115.4 million, to $484.5 million for the year ended December 31, 2015 from $369.1 million for the year ended December 31, 2014. Reimbursable out-of-pocket expenses fluctuate significantly from period to period based on the timing of program initiation or closeout and the mix of program complexity and do not necessarily change in direct correlation to net service revenues.
Selling, General and Administrative Expenses
For the years ended December 31, 2016, 2015 and 2014, selling, general and administrative expenses were as follows (dollars in thousands):
For the Years Ended December 31, | Change | ||||||||||||||||||||||||
2016 | 2015 | 2014 | 2016 to 2015 | 2015 to 2014 | |||||||||||||||||||||
Selling, general and administrative | $ | 172,386 | $ | 156,609 | $ | 145,143 | $ | 15,777 | 10.1 | % | $ | 11,466 | 7.9 | % | |||||||||||
Percentage of net service revenue | 16.7 | % | 17.1 | % | 17.9 | % | |||||||||||||||||||
55
The following is a summary of the year-over-year fluctuation in components of our selling, general and administrative expenses during the year ended December 31, 2016 as compared to the year ended December 31, 2015 and the year ended December 31, 2015 as compared to the year ended December 31, 2014 (in thousands):
Year Ended December 31, 2016 to 2015 | Year Ended December 31, 2015 to 2014 | ||||||
Change in: | |||||||
Salaries, benefits, and incentive compensation | $ | 16,711 | $ | 8,507 | |||
Professional services fees | (3,830 | ) | 830 | ||||
Allowance for doubtful accounts | 2,715 | (2,579 | ) | ||||
Facilities and IT related costs | (873 | ) | 1,867 | ||||
Marketing | (206 | ) | 3,191 | ||||
Travel | 650 | 513 | |||||
Other | 610 | (863 | ) | ||||
Total | $ | 15,777 | $ | 11,466 | |||
Selling, general and administrative expenses increased by $15.8 million, or 10.1%, to $172.4 million for the year ended December 31, 2016 from $156.6 million for the year ended December 31, 2015, including a $4.0 million benefit from favorable fluctuations in foreign currency exchange rates compared to the prior year. The increase was primarily driven by (i) an increase in salaries, benefits and incentive compensation, principally as a result of the additions in personnel to support the growth of our business and the one-time benefit from settlement of certain employee related liabilities in 2015, (ii) an increase in bad debt expense resulting from an increase in billed and unbilled receivables exposure, and (iii) an increase in travel costs primarily driven by increased headcount. These cost increases were offset by reductions in (i) professional fees for legal and accounting fees associated with implementing Sarbanes-Oxley and tax planning that occurred in 2015, and (ii) facilities and IT related costs through improved utilization of our existing infrastructure.
Selling, general and administrative expenses increased by $11.5 million, or 7.9%, to $156.6 million for the year ended December 31, 2015 from $145.1 million for the year ended December 31, 2014. The increase was primarily driven by (i) an increase in salaries, benefits and incentive compensation, principally as a result of the additions in personnel to support the growth of our business and the newly established public company infrastructure, (ii) an increase in facilities and information technology related costs, professional fees, and travel costs, primarily driven by increased headcount, as discussed above, and (iii) an increase in marketing expenses primarily driven by the higher level of advertising and trade show activities in 2015. These costs were partially offset by a positive change in bad debt expense as a result of the collection of previously reserved amounts receivable.
During the year ended December 31, 2015, our selling, general and administrative expenses were positively impacted by settlement of certain employee related liabilities totaling approximately $1.1 million. In addition, included within the net increase in selling, general and administrative expenses during 2015 is a net reduction from fluctuations in foreign currency exchange rates of $5.6 million compared to the prior year.
Selling, general and administrative expense as a percentage of net service revenue has declined to 16.7% from 17.1% and 17.9% for years ended December 31, 2016, 2015 and 2014, respectively. These decreases were attributable to (i) our ability to leverage selling, general and administrative functions as we grow revenue, (ii) our cost-savings initiatives, and (iii) the favorable impact of foreign currency exchange rates. While we have successfully leveraged our selling, general and administrative costs during the past three years, we anticipate a slight increase in this percentage in the near term as we invest in our infrastructure to grow our business. Additionally, fluctuations in foreign currency exchange rates could significantly impact our selling, general and administrative expenses as a percentage of net service revenue in the future.
56
Restructuring, CEO transition and Other Costs
Restructuring, CEO transition and other costs were $13.6 million for the year ended December 31, 2016. In March 2016, management approved a global plan to eliminate certain positions worldwide in an effort to ensure that our organizational focus and resources were properly aligned with our strategic goals and to continue strengthening the delivery of our growing backlog to customers. Accordingly, we made changes to our therapeutic unit structure designed to realign with management focus and optimize the efficiency of our resourcing to achieve our strategic plan. As a result, we eliminated approximately 200 positions and incurred $7.0 million related to employee severance costs during the year ended December 31, 2016. We have completed substantially all actions, and anticipate making all remaining payments to affected employees during 2017. During the third quarter of 2016, we also announced the closure of one of our facilities associated with this restructuring and incurred facility closure costs of $1.5 million, which were partially offset by unamortized deferred rent of $0.5 million during the year ended December 31, 2016.
On July 27, 2016, we entered into a transition agreement with our former CEO related to the transition to a new CEO as of October 1, 2016. The CEO transition agreement is effective through February 28, 2017. In addition, in mid-September 2016, we entered into retention agreements with certain key employees for various dates through September 2017. For the year ended December 31, 2016, we recognized $4.8 million of costs associated with the CEO transition and retention agreements, which will be paid through August 2018.
Restructuring, CEO transition and other costs were $1.8 million for the year ended December 31, 2015, primarily consisting of employee severance costs of $2.7 million, partially offset by a net reduction in facility closure costs of $0.9 million. During the year, we reversed previously accrued liabilities as a result of completing negotiations with respect to exiting certain facilities and reduced our exit cost estimates related to certain lease agreements as a result of subleasing a portion of facilities. These adjustments were partially offset by expenses related to early lease termination fees and accruals for closure of smaller locations as we continue to optimize our facilities portfolio.
Restructuring, CEO transition and other costs were $6.2 million for the year ended December 31, 2014, primarily consisting of facilities closure expenses totaling $3.4 million and severance costs totaling $2.7 million. Our restructuring activities consisted primarily of the closure of our Glasgow facility and partial closure of our Cincinnati facility initiated in the second quarter of 2014.
Transaction Expenses
During the year ended December 31, 2016, we incurred transaction expenses of $3.1 million, primarily consisting of third-party fees associated with (i) our secondary stock offerings in May and August 2016, (ii) our stock repurchase and debt amendment in August 2016, and (iii) other corporate projects.
During the year ended December 31, 2015, we incurred transaction expenses of $1.6 million, primarily consisting of third-party fees associated with our stock repurchases in May and December of 2015 and our secondary common stock offerings in May, August and December of 2015.
Transaction expenses were $7.9 million for the year ended December 31, 2014 and primarily consisted of (i) $4.2 million of debt issuance costs and third-party fees associated with the debt refinancing transactions in February and November 2014, (ii) a $3.4 million payment to Avista to terminate our consulting services agreement, and (iii) $0.3 million of legal fees associated with our March 2014 acquisition of MEK Consulting, a full service CRO with operations in the Middle East.
Goodwill and Intangible Asset Impairment Charges
We evaluate goodwill for impairment annually, or more frequently if events or changes in circumstances indicate that goodwill might be impaired. We perform our annual impairment test by estimating the fair value of each reporting unit using a combination of the income and market approaches for purposes of estimating our total fair value of the reporting unit.
During the second quarter of 2014, we determined that the Global Consulting (a component of the Clinical Development segment) and Phase I Services reporting units were not performing according to management's expectations, requiring an evaluation to determine if the associated goodwill and intangible assets were
57
impaired. As a result of this evaluation, we recorded a $9.2 million impairment of goodwill and an $8.0 million impairment of intangible assets for the year ended December 31, 2014.
During the first quarter of 2015, we continued to observe deteriorating performance within our Phase I Services reporting unit due to reduced revenue resulting from cancellations and lower than expected new business awards. This resulted in a triggering event, requiring an evaluation of both long-lived assets and goodwill for potential impairment. As a result of this evaluation, we recorded a total asset impairment charge of $3.9 million, comprised of a long-lived assets impairment charge of $1.0 million and a goodwill impairment charge of $2.9 million, which was the total remaining goodwill balance of our Phase I Services reporting unit as of the evaluation date. There were no asset impairment charges during 2016.
Depreciation and Amortization Expense
Total depreciation and amortization expense increased to $59.2 million for the year ended December 31, 2016 from $56.0 million for the year ended December 31, 2015. This increase was a result of an increase in depreciation expense of $3.2 million for the year ended December 31, 2016 as compared to the year ended December 31, 2015, principally due to higher capital expenditures in 2016.
Total depreciation and amortization expense increased to $56.0 million for the year ended December 31, 2015 from $54.5 million for the year ended December 31, 2014. Amortization expense increased by $5.0 million for the year ended December 31, 2015 as compared to the year ended December 31, 2014, primarily due to the reduction in estimated useful lives of certain intangible assets during the second quarter of 2014. These increases were partially offset by a $3.5 million decrease in depreciation expense for the year ended December 31, 2015 as compared to the year ended December 31, 2014, principally due to (i) lower capital expenditures in 2015 and (ii) the write-off of long-lived assets in the Phase I Services reporting unit during the first quarter of 2015.
Other (Expense) Income, Net
For the years ended December 31, 2016, 2015 and 2014, the components of total other (expenses) income, net were as follows (dollars in thousands):
For the Years Ended December 31, | Change | ||||||||||||||||||||||||
2016 | 2015 | 2014 | 2016 to 2015 | 2015 to 2014 | |||||||||||||||||||||
Interest income | $ | 216 | $ | 192 | $ | 249 | $ | 24 | 12.5 | % | $ | (57 | ) | (22.9 | )% | ||||||||||
Interest expense | (12,016 | ) | (15,640 | ) | (53,036 | ) | 3,624 | 23.2 | % | 37,396 | 70.5 | % | |||||||||||||
Loss on extinguishment of debt | (439 | ) | (9,795 | ) | (46,750 | ) | 9,356 | 95.5 | % | 36,955 | 79.0 | % | |||||||||||||
Other (expense) income, net | (9,002 | ) | 3,857 | 7,689 | (12,859 | ) | (333.4 | )% | (3,832 | ) | (49.8 | )% | |||||||||||||
Total other (expense) income, net | $ | (21,241 | ) | $ | (21,386 | ) | $ | (91,848 | ) | $ | 145 | 0.7 | % | $ | 70,462 | 76.7 | % | ||||||||
Interest expense decreased by $3.6 million for the year ended December 31, 2016 compared to the year ended December 31, 2015 and by $37.4 million for the year ended December 31, 2015 compared to the year ended December 31, 2014. The decreases in interest expense during the last two years are primarily due to the decreased interest rates as a result of our debt repayment and refinancing activities during the fourth quarter of 2014, second quarter of 2015 and third quarter of 2016.
The loss on extinguishment of debt was $0.4 million, $9.8 million and $46.8 million for the years ended December 31, 2016, 2015 and 2014, respectively, as a result of the August 2016, May 2015 and November 2014 debt refinancing transactions.
Other (expense) income, net, decreased by $12.9 million for the year ended December 31, 2016 compared to the year ended December 31, 2015 and by $3.8 million for the year ended December 31, 2015 compared to the year ended December 31, 2014. Other (expense) income, net is primarily comprised of foreign currency gains and losses and the changes are principally driven by fluctuations in foreign exchange rates. In particular, the June 2016 referendum by British voters to exit the European Union impacted global markets, including currencies, and resulted in a sharp decline in the value of the British pound as compared to the U.S.
58
dollar and other currencies. In addition, the U.S. presidential election results and resulting foreign policy activities have caused foreign currency exchange rate fluctuations. Volatility in exchange rates is expected to continue in the short term as a result of the uncertainties surrounding these activities, which could continue to drive significant fluctuations in foreign currency gains or losses in future periods.
Income Tax (Expense) Benefit
Income tax expense was $21.5 million for the year ended December 31, 2016, compared to $13.9 million for the year ended December 31, 2015, as we achieved our second consecutive year of profitability. For the year ended December 31, 2016, variances from the statutory rate of 35% were due to (i) an income tax benefit of $12.9 million related to excess tax benefits for share-based compensation, (ii) the release of reserves for uncertain tax positions and valuation allowances on net operating loss carryforwards related to certain international jurisdictions in aggregate totaling $6.6 million, and (iii) the geographical split of pre-tax income, net of deemed dividends from foreign subsidiaries.
Income tax (expense) benefit was an expense of $13.9 million for the year ended December 31, 2015, compared to a benefit of $4.7 million for the year ended December 31, 2014, as a result of becoming profitable in 2015. Income taxes for the year ended December 31, 2015 were positively impacted by an income tax benefit of $31.9 million recognized as a result of the release of the valuation allowance on certain deferred tax assets, primarily U.S. operating loss carryforwards during the fourth quarter of 2015. The release of the valuation allowance was due to management's conclusion that it was more likely than not that a portion of our deferred tax assets will be realized through future U.S. taxable income. This conclusion was based, in part, on our achieving sustained profitability in 2015 in the United States coupled with the reliability on our projections of ongoing positive future earnings. Therefore, we released a significant portion of the valuation allowances related to these deferred tax assets. Other variances from the statutory rate of 35% were due to (i) the release of reserves for uncertain tax provisions totaling $4.4 million, and (ii) the geographical split of pre-tax income, net of deemed dividends from foreign subsidiaries.
Net Income (Loss)
Net income was $112.6 million for the year ended December 31, 2016 compared to $117.0 million for the year ended December 31, 2015. The year-over-year decrease was primarily due to increases in (i) our direct costs as a percentage of net service revenue, (ii) restructuring and CEO transition costs, (iii) transaction costs, (iv) depreciation expense, (v) foreign exchange losses in 2016 compared to gains in 2015, and (vi) income tax expense. These increases in expenses were offset by (i) the impact of increased net service revenue, (ii) a decrease in our selling, general and administrative costs as a percentage of net service revenue, (iii) a decrease in asset impairment charges compared to the prior year, (iv) a decrease in loss on extinguishment of debt, and (v) a decrease in interest expense as a result of our 2015 and 2016 debt refinancing activities.
Net income was $117.0 million for the year ended December 31, 2015 compared to a net loss of $23.5 million for the year ended December 31, 2014. The year-over-year change in our financial results from a net loss to that of net income was primarily due to (i) the impact of increased net service revenue, (ii) the overall decrease of operating expenses as a percentage of net service revenue, (iii) the decrease in asset impairment charges compared to the prior year, and (iv) the decrease in interest expense as a result of our 2014 and 2015 debt refinancing activities. Partially offsetting these improvements to our financial results for the current year was the $9.8 million loss on extinguishment of debt associated with the 2015 debt refinancing recognized in the second quarter of 2015 and a change in income tax expense of $18.7 million.
59
Liquidity and Capital Resources
Key measures of our liquidity are as follows (in thousands):
December 31, 2016 | December 31, 2015 | ||||||
Balance sheet statistics: | |||||||
Cash and cash equivalents (1) | $ | 102,471 | $ | 85,011 | |||
Working capital (excluding restricted cash) | 55,295 | (52,998 | ) | ||||
(1) | As of December 31, 2016, the amount of cash and cash equivalents held outside the United States by our foreign subsidiaries was $86.4 million. Cash and cash equivalent balances outside the United States may be subject to foreign withholding and United States taxation, if repatriated. We intend to reinvest cash outside the U.S. except in instances where repatriating such earnings would result in no additional income tax. |
We fund our operations and growth, including acquisitions, primarily with our working capital, cash flow from operations as well as funds available for borrowing under our $200.0 million revolving credit facility. Our principal liquidity requirements are to fund our debt service obligations, capital expenditures, expansion of services, possible acquisitions, integration and restructuring costs, geographic expansion, working capital and other general corporate purposes. Based on past performance and current expectations, we believe our cash and cash equivalents, cash generated from operations and funds available under our revolving credit facility will be sufficient to meet our working capital needs, capital expenditures, scheduled debt and interest payments, income tax obligations and other currently anticipated liquidity requirements for at least the next 12 months.
In August 2016, we entered into the First Amendment to Credit Agreement and Increase Revolving Joinder (the “First Amendment”), which amended the Credit Agreement dated as of May 14, 2015 (as amended, the "Credit Agreement"). The First Amendment (i) extended the maturity date of the term and revolving loans under the Credit Agreement to August 31, 2021, (ii) increased the available borrowing capacity under the revolving line of credit from $150.0 million to $200.0 million, and (iii) reduced the interest rate margins on all term and revolving loans, as well as reduced certain fees. The five-year $675.0 million Credit Agreement is comprised of a $475.0 million term loan ("Term Loan") and a $200.0 million revolving line of credit ("Revolver"). See "Note 4 - Debt and Leases" to our consolidated financial statements included in Part II, Item 8, in this Annual Report on Form 10-K for further information on the terms and conditions of our Credit Agreement.
As of December 31, 2016, we had total principal indebtedness of $500.0 million, comprised of $475.0 million in borrowings under the Term Loan and $25.0 million in borrowings under the Revolver. Further, we had undrawn commitments available for additional borrowings under the Revolver of $174.3 million (net of $25.0 million in Revolver borrowings and $0.7 million in outstanding letters of credit) which we may use for working capital and other purposes. The potential issuance of additional debt and the related incremental interest expense could adversely affect our operations and financial condition or limit our ability to secure additional capital and other resources.
In July 2016, we announced a $150.0 million stock repurchase program, which will end no later than December 31, 2017. As of December 31, 2016, we had remaining authorization to repurchase up to $85.5 million of shares of our common stock under this program.
Our ability to make payments on our indebtedness and to fund planned capital expenditures and necessary working capital will depend on our ability to generate cash in the future. However, the ability to meet our cash needs through cash flows from operations will depend on the demand for our services, as well as general economic, financial, competitive and other factors, many of which are beyond our control. Our business might not generate cash flow in an amount sufficient to enable us to pay the principal of, or interest on, our indebtedness, or to fund our other liquidity needs, including working capital, capital expenditures, acquisitions, investments and other general corporate requirements. If we cannot fund our liquidity needs, we will have to take actions such as reducing or delaying capital expenditures, acquisitions or investments, selling assets, restructuring or refinancing our debt, reducing the scope of our operations and growth plans, or seeking additional equity capital. There can be no assurances that any of these remedies could, if necessary, be affected on commercially reasonable terms, or at all, or that they would permit us to meet our scheduled debt
60
service obligations. Our Credit Agreement limits the use of proceeds from any disposition of assets and, as a result, we may not be allowed, under this agreement, to use the proceeds from any such dispositions to satisfy all current debt service obligations.
Year Ended December 31, 2016 Compared to the Years Ended December 31, 2015 and 2014
For the years ended December 31, 2016, 2015 and 2014, our cash flows from operating, investing and financing activities were as follows (in thousands):
For the Years Ended December 31, | Change | ||||||||||||||||||||||||
2016 | 2015 | 2014 | 2016 to 2015 | 2015 to 2014 | |||||||||||||||||||||
Net cash provided by operating activities | $ | 109,332 | $ | 204,740 | $ | 131,447 | $ | (95,408 | ) | (46.6 | )% | $ | 73,293 | 55.8 | % | ||||||||||
Net cash used in investing activities | (31,353 | ) | (21,111 | ) | (27,853 | ) | (10,242 | ) | (48.5 | )% | 6,742 | 24.2 | % | ||||||||||||
Net cash used in financing activities | (53,316 | ) | (211,399 | ) | (67,698 | ) | 158,083 | 74.8 | % | (143,701 | ) | (212.3 | )% | ||||||||||||
Cash Flows from Operating Activities
For the year ended December 31, 2016, our operating activities provided $109.3 million in cash flow, consisting of a net income of $112.6 million, adjusted for net non-operating and non-cash items of $75.9 million primarily related to depreciation and amortization of intangible assets, changes in deferred income taxes, foreign currency adjustments, share-based compensation expense, and changes to the provision for doubtful accounts. Offsetting these increases was $79.2 million of cash used by changes in operating assets and liabilities, consisting primarily of an increase in billed and unbilled accounts receivable.
For the year ended December 31, 2015, our operating activities provided $204.7 million in cash flow, consisting of a net income of $117.0 million, adjusted for net non-operating and non-cash items of $79.9 million primarily related to depreciation and amortization of intangible assets, loss on extinguishment of debt, share-based compensation and related tax benefits, changes in deferred income taxes, asset impairment charges, stock repurchase costs, amortization of capitalized loan fees, and foreign currency adjustments. In addition, $7.8 million of cash was provided by changes in operating assets and liabilities, consisting primarily of an increase in deferred revenue and accounts payables and accrued expenses, partially offset by the increase in billed and unbilled accounts receivable and other assets and liabilities.
For the year ended December 31, 2014, our operating activities provided $131.4 million in cash flow, consisting of a net loss of $23.5 million, adjusted for net non-operating and non-cash items of $109.4 million primarily related to depreciation and amortization of intangible assets, amortization of capitalized loan fees, share-based compensation, allowance for doubtful accounts, impairment of goodwill and intangible assets, and loss on extinguishment of debt and other debt refinancing cost, partially offset by foreign currency adjustments and deferred income taxes. In addition, $45.5 million of cash was provided by changes in operating assets and liabilities, consisting primarily of an increase in accounts payable and accrued expenses and an increase in deferred revenue, partially offset by an increase in billed and unbilled accounts receivable.
Cash flows from operations decreased by $95.4 million during the year ended December 31, 2016 compared to the year ended December 31, 2015, primarily due to the decline in cash received from working capital of $87.0 million and the decrease in net income of $4.4 million.
Cash flows from operations increased by $73.3 million during the year ended December 31, 2015 compared to the year ended December 31, 2014, primarily due to the $140.5 million increase in net income (loss) net of the $29.5 million change in adjustments for non-operating and non-cash items principally associated with a loss on the extinguishment of debt and debt refinancing costs. This increase was partially offset by a decline in cash received from working capital of $37.7 million.
The changes in operating assets and liabilities result primarily from the net movement in accounts receivable, unbilled revenue, and deferred revenue, coupled with changes in accrued expenses. Fluctuations in billed and unbilled receivables and unearned revenue occur on a regular basis as we perform services, achieve milestones or other billing criteria, send invoices to customers and collect outstanding accounts receivable.
61
This activity varies by individual customer and contract. We attempt to negotiate payment terms that provide for payment of services prior to or soon after the provision of services, but the levels of unbilled services and unearned revenue can vary significantly from period to period.
Cash Flows from Investing Activities
For the years ended December 31, 2016, 2015 and 2014 we used $31.4 million, $21.1 million, and $27.9 million, respectively, in cash for investing activities, comprised of the purchases of property and equipment primarily related to our ongoing headcount growth and investments to improve the efficiency of our operations and utilization of our facilities. Additionally, in 2014 our cash used in investing activities also included a cash payment of $2.3 million toward the purchase of MEK Consulting.
We continue to closely monitor our capital expenditures while making strategic investments in the development of our information technology infrastructure to meet the needs of our workforce. For 2017, we expect our total capital expenditures to be between approximately $45.0 million to $50.0 million. The expected increase is primarily due to expected expenditures associated with the consolidation of our Raleigh facilities and providing for future expansion in Raleigh and Camberley coinciding with the near-term expiration of our existing leases.
Cash Flows from Financing Activities
For the year ended December 31, 2016, financing activities used $53.3 million in cash, primarily driven by payments of $64.5 million related to the stock repurchase in August of 2016, net revolver repayments of $5.0 million, debt refinancing costs of $0.9 million and $0.8 million related to payments for tax withholdings related to employee stock option exercises. These cash outflows were partially offset by proceeds of $17.9 million from the exercise of stock options.
For the year ended December 31, 2015, financing activities used $211.4 million in cash, primarily driven by payments of $285.0 million related to the stock repurchases in May and December of 2015, $3.2 million related to payments for tax withholdings related to employee stock option activity, stock repurchase costs of $1.4 million and payments of $1.0 million related to the 2014 MEK Consulting acquisition. These cash outflows were partially offset by net inflows of $79.6 million, consisting primarily of (i) the proceeds of $95.0 million from the 2015 debt refinancing and $30.0 million under our revolver and (ii) proceeds of $3.7 million from the exercise of stock options, partially offset by the June 2015 prepayment of $50.0 million of debt principal under the Credit Agreement.
For the year ended December 31, 2014, financing activities used $67.7 million in cash, primarily driven by $217.5 million in net repayments of long-term debt, principally in conjunction with the 2014 debt refinancing and repayment of our 2011 senior notes, $3.4 million in payments related to the redemption of our Class C and Class D common stock, and $2.7 million in repayments on capital lease obligations. Partially offsetting these outflows were $156.1 million in net proceeds received from the issuance of common stock related to our IPO.
Inflation
Our long-term contracts, those in excess of one year, generally include inflation or cost of living adjustments for the portion of the services to be performed beyond one year from the contract date. In the event actual inflation rates are greater than our contractual inflation rates or cost of living adjustments, inflation could have a material adverse effect on our operations or financial condition.
62
Contractual Obligations and Commitments
The following table summarizes our expected material contractual payment obligations as of December 31, 2016 (in thousands):
Payment Due by Period | |||||||||||||||||||
Total | Less than 1 Year | 1 - 3 Years | 3 - 5 Years | More than 5 Years | |||||||||||||||
Long-term debt | $ | 500,000 | $ | 11,875 | $ | 65,313 | $ | 422,812 | $ | — | |||||||||
Interest on long-term debt | 46,584 | 11,118 | 20,662 | 14,804 | — | ||||||||||||||
Noncancellable purchase commitments | 66,766 | 24,409 | 41,186 | 1,171 | — | ||||||||||||||
Operating leases | 55,373 | 19,506 | 24,490 | 9,506 | 1,871 | ||||||||||||||
Executive transition costs | 5,213 | 4,982 | 231 | — | — | ||||||||||||||
Total | $ | 673,936 | $ | 71,890 | $ | 151,882 | $ | 448,293 | $ | 1,871 | |||||||||
The interest payments on long-term debt in the above table are based on interest rates in effect as of December 31, 2016. See "Note 4 - Debt and Leases" to our consolidated financial statements included in Part II, Item 8, in this Annual Report on Form 10-K for further information on the terms and conditions of our Credit Agreement.
In July 2016, the Board approved a $150.0 million repurchase program for shares of our common stock. The stock repurchase program will end no later than December 31, 2017. We are not obligated to repurchase any particular amount of common stock, and the program could be modified, suspended or discontinued at any time. The timing and amount of repurchases will be determined by our management based on a variety of factors such as the market price of our common stock, our liquidity requirements, and overall market conditions. As of December 31, 2016, we had remaining authorization to repurchase up to $85.5 million under the stock repurchase program.
We have recorded a tax liability for unrecognized tax benefits for uncertain tax positions of $14.8 million which has not been included in the above table due to the uncertainties in the timing of the settlement of the income tax positions.
On July 27, 2016, we entered into a transition agreement with our former CEO related to the transition to our new CEO on October 1, 2016. In addition, in mid-September 2016, we entered into retention agreements with certain key employees for various dates through September 2017. As a result of the CEO transition and retention agreements, we incurred additional costs that will be paid through August 2018.
We are a party to supplier contracts related to clinical services that if canceled would require payment for services performed and potentially additional services required to protect the safety of subjects. The value of these potential wind-down provisions is not practical to estimate.
We have a lease agreement for our corporate headquarters in Raleigh, North Carolina, that extends through February of 2019, which is accounted for as an operating lease. We can exit the lease in February 2018, with payment of a $0.8 million termination fee. In January 2017, we entered into a 12-year lease for a new corporate headquarters in Morrisville, North Carolina, where we intend to relocate all employees currently housed in our two existing Raleigh locations. We expect the new building to be completed in mid-2018 to accommodate a phased move coinciding with the expiration of our existing leases. Additionally, in February 2017, we entered into a new 11-year lease agreement for new space in a nearby location as the lease for our Camberley, United Kingdom location expires in 2018. In total, we expect to incur lease payments of $85.0 million over the lives of these agreements beginning in July 2018.
Off-balance Sheet Arrangements
We do not have any off-balance sheet arrangements except for operating leases entered into in the normal course of business.
63
Critical Accounting Policies and Estimates
The preparation of financial statements in conformity with GAAP requires management to make estimates, judgments and assumptions that affect the reported amounts of assets and liabilities, revenues and expenses during the period, as well as disclosures of contingent assets and liabilities at the date of the financial statements. We evaluate our estimates on an ongoing basis, including those related to revenue recognition, share-based compensation, valuation of goodwill and identifiable intangibles, tax-related contingencies and valuation allowances, allowance for doubtful accounts, and litigation contingencies, among others. These estimates are based on the information available to management at the time these estimates, judgments and assumptions are made. Actual results may differ materially from these estimates.
Revenue Recognition
We recognize revenue when all of the following conditions are satisfied: (1) there is persuasive evidence of an arrangement; (2) the service offering has been delivered to the customer; (3) the collection of the fees is reasonably assured; and (4) the arrangement consideration is fixed or determinable. We record revenues net of any tax assessments by governmental authorities, such as value added taxes, that are imposed on and concurrent with specific revenue generating transactions. In some cases, contracts provide for consideration that is contingent upon the occurrence of uncertain future events. We recognize contingent revenue when the contingency has been resolved and all other criteria for revenue recognition have been met.
Our arrangements are primarily service contracts and historically, a majority of the net service revenue has been earned under contracts which range in duration from several months to several years. Most of our contracts can be terminated by the customer with a 30 day notice. In the event of termination, our contracts often provide for fees for winding down the project, which include both fees incurred and actual expenses and non-cancellable expenditures and may include a fee to cover a percentage of the remaining professional fees on the project. We do not recognize revenue with respect to start-up activities including contract and scope negotiation, feasibility analysis and conflict of interest review associated with contracts. The costs for these activities are expensed as incurred.
The majority of our contracts are for clinical research services and, to a lesser extent, consulting services. These contracts represent a single unit of accounting. Clinical research service contracts generally take the form of fee-for-service, fixed-fee-per-unit and fixed-price contracts, with the majority of the contracts being fixed-fee-per-unit. For fee-for-service contracts, fees are billed based on a contractual rate basis and the Company recognizes revenue on these arrangements as services are performed, primarily on a time and materials basis. For fixed-price contracts (including fixed-fee and fixed-price-per-unit arrangements), revenue is recognized as services are performed based upon a proportional performance basis, which we assess using output measures specific to the service provided.
Examples of output measures include, among others, study management months, number of sites activated, number of site initiation visits, and number of monitoring visits completed. Revenue is determined by dividing the actual units of work completed by the total units of work required under the contract and multiplying that ratio by the total contract value. The total contract value, or total contractual payments, represents the aggregate contracted price for each of the agreed upon services to be provided.
Changes in the scope of work are common, especially under long-term contracts, and generally result in a renegotiation of future contract pricing terms and change in contract value. If the customer does not agree to contract modification, we could bear the risk of cost overruns. Renegotiated amounts are not included in net revenues until written authorization is received, the amount is earned and realization is assured.
We offer volume rebates to our large customers based on annual volume thresholds. We record an estimate of the annual volume rebate as a reduction of revenue throughout the period based on the estimated total rebate to be earned for the period.
Billed and Unbilled Accounts Receivable and Deferred Revenues
Accounts receivable are recorded at net realizable value. Unbilled accounts receivable arise when services have been rendered for which revenue has been recognized but the customers have not been billed. In general, prerequisites for billings and payments are established by contractual provisions, including
64
predetermined payment schedules, which may or may not correspond to the timing of the performance of services under the contract.
In some cases, payments received are in excess of revenue recognized. Deferred revenues represent receipts of payments from customers in advance of services being provided and the related revenue being earned or reimbursable expenses being incurred. As the contracted services are subsequently performed and the associated revenue is recognized, the deferred revenues balance is reduced by the amount of the revenue recognized during the period.
Allowance for Doubtful Accounts
We maintain a credit approval process and make judgments in connection with assessing our customers' ability to pay throughout the contractual obligation. Despite this assessment, from time to time, customers are unable to meet their payment obligations. We monitor customers' credit worthiness and apply judgment in establishing a provision for estimated credit losses based on historical experience, current receivables aging, and identified customer-specific circumstances that would affect the customers' ability to meet their obligations.
Goodwill, Intangible Assets and Long-Lived Assets
Goodwill represents the excess of purchase price over the fair value of net assets acquired in business combinations. We evaluate goodwill for impairment on an annual basis, or more frequently if events or changes in circumstances indicate that goodwill might be impaired.
Intangible assets consist of trademarks and customer relationships. Customer relationships are being amortized at the greater of actual customer attrition or a straight-line basis over the estimated useful lives. Certain trademarks have an indefinite life and are not amortized but instead are evaluated for impairment annually or more frequently if events or changes in circumstances indicate that they might be impaired. Finite-lived intangible assets are tested for impairment upon the occurrence of certain triggering events.
Long-lived assets, including fixed assets and intangible assets, are regularly reviewed to determine if facts and circumstances indicate that the useful life is shorter than we originally estimated or that the carrying amount of the assets may not be recoverable. If such facts and circumstances exist, we assess the recoverability of identified assets by comparing the projected undiscounted net cash flows associated with the related asset or group of assets over their remaining lives against their respective carrying amounts. Impairments, if any, are based on the excess of the carrying amount over the fair value of those assets and occur in the period in which the impairment determination was made.
Share-Based Compensation
We recognize share-based compensation expense for stock option awards provided to our employees and non-employee directors. We measure share-based compensation cost at grant date, based on the estimated fair value of the award and recognize the service-based cost on a straight-line basis over the vesting period. Share-based compensation expense has been reported in direct costs and selling, general and administrative expenses in our consolidated statements of operations based upon the classification of the individuals who were granted share-based awards.
We calculate the fair value of each option award and Employee Stock Purchase Plan awards on the grant date using the Black-Scholes option-pricing model. The model requires the use of subjective assumptions, including the fair value of the underlying common shares on the date of grant, the expected life of the award, share price volatility and risk-free interest rate. In developing our assumptions, we take into account the following:
• | Fair value of our common stock. Due to the absence of an active market for our common stock prior to our IPO, the pre-IPO fair value of our common stock on the date of the grant was determined in good faith by the Board with the assistance of management, based on a number of objective and subjective factors consistent with the methodologies outlined in the American Institute of Certified Public Accountants Practice Aid, Valuation of Privately-Held-Company Equity Securities Issued as |
65
Compensation, or the AICPA Practice Aid. Each quarter a contemporaneous valuation of our common stock was performed by a related party. For all contemporaneous valuations performed, two commonly accepted valuation approaches were applied to estimate our enterprise value: the guideline public company method and the guideline transactions method. These methods both select a valuation multiple from comparable public companies or transactions, making adjustments for our strengths and weaknesses relative to the selected companies and transactions and applied it to our operating data to determine enterprise value. Subsequent to the IPO, the fair value of our common stock is based upon the market price of our common stock on the date of the grant as listed on the NASDAQ.
• | Expected Term. The expected term represents the period that our option awards are expected to be outstanding. As we do not have sufficient historical experience for determining the expected term, we have based our expected term on the simplified method available under GAAP, which utilizes the midpoint between the vesting date and the end of the contractual term. |
• | Expected Volatility. We use the historical volatilities of a selected peer group because we do not have sufficient trading history to determine the volatility of our common stock. We intend to continue to rely on this information until a sufficient amount of historical information regarding the volatility of our own stock becomes available, or unless the circumstances change such that the identified companies are no longer similar to us. |
• | Risk-Free Interest Rate. We use the implied yield available on U.S. Treasury zero-coupon bonds with an equivalent remaining term of the options for each option group to represent the risk-free interest rate. |
• | Expected Dividend Yield. We have not paid and do not expect to pay dividends on our common stock, therefore, we use a zero-percent dividend rate. |
In March 2016, the Financial Accounting Standards Board ("FASB") issued ASU No. 2016-09, Compensation - Stock Compensation: Improvements to Employee Share-Based Payment Accounting. In accordance with the guidance, the Company elected to early adopt this ASU effective in the first quarter of 2016. The following summarizes the changes made as a result of this adoption:
• | Income taxes - All excess tax benefits and tax deficiencies (including tax benefits of dividends on share-based payment awards) are recognized as income tax expense or benefit in the statement of operations. The tax effects of exercised or vested awards are treated as discrete items in the reporting period in which they occur. We also recognize excess tax benefits regardless of whether the benefit reduces taxes payable in the current period. |
• | Forfeitures - Prior to adoption, share-based compensation expense was recognized on a straight line basis, net of estimated forfeitures, such that expense was recognized only for share-based awards that are expected to vest. A forfeiture rate was estimated annually and revised, if necessary, in subsequent periods if actual forfeitures differed from initial estimates. Upon adoption, we no longer apply a forfeiture rate and instead account for forfeitures as they occur. |
• | Statements of Cash Flows - We historically accounted for excess tax benefits on the consolidated statement of cash flows as a financing activity. Upon adoption of this standard, excess tax benefits are classified along with other income tax cash flows as an operating activity. |
• | Earnings Per Share - We use the treasury stock method to compute diluted earnings per share, unless the effect would be anti-dilutive. Under this method, we are no longer required to estimate the tax rate and apply it to the dilutive share calculation for determining the dilutive earnings per share. |
See "Note 1 - Basis of Presentation and Summary of Significant Accounting Policies" to our consolidated financial statements included in Part II, Item 8, in this Annual Report on Form 10-K for further information on the impact of this adoption.
66
Income Taxes
We and our U.S. subsidiaries file a consolidated U.S. federal income tax return. Our other subsidiaries file tax returns in their local jurisdictions.
We provide for income taxes on all transactions that have been recognized in the consolidated financial statements. Specifically, we estimate our tax liability based on current tax laws in the statutory jurisdictions in which we operate. Accordingly, the impact of changes in income tax laws on deferred tax assets and deferred tax liabilities are recognized in net earnings in the period during which such changes are enacted. We record deferred tax assets and liabilities based on temporary differences between the financial statement and tax bases of assets and liabilities and for tax benefit carryforwards using enacted tax rates in effect in the year in which the differences are expected to reverse.
We provide valuation allowances against deferred tax assets for amounts that are not considered more likely than not to be realized. The valuation of the deferred tax asset is dependent on, among other things, our ability to generate a sufficient level of future taxable income. In estimating future taxable income, we have considered both positive and negative evidence, such as historical and forecasted results of operations, and have considered the implementation of prudent and feasible tax planning strategies.
We recognize a tax benefit from an uncertain tax position only if we believe it is more likely than not to be sustained upon examination based on the technical merits of the position. Judgment is required in determining what constitutes an individual tax position, as well as the assessment of the outcome of each tax position. We consider many factors when evaluating and estimating tax positions and tax benefits. In addition, the calculation of tax liabilities involves dealing with uncertainties in the application of complex tax regulations in domestic and foreign jurisdictions. The amount of the accrual for which an exposure exists is measured as the largest amount of benefit determined on a cumulative probability basis that we believe is more likely than not to be realized upon ultimate settlement of the position. If the calculation of liability related to uncertain tax positions proves to be more or less than the ultimate assessment, a tax expense or benefit, respectively, would result. Unrecognized tax benefits, or a portion of unrecognized tax benefits, are presented as a reduction to a deferred tax asset for a NOL carryforward, a similar tax loss, or a tax credit carryforward. We do not foresee any reasonably possible change in the unrecognized tax benefits in the next 12 months, but circumstances can change due to unexpected changes in the tax laws.
Our policy has been to provide U.S. income taxes on earnings of foreign subsidiaries only to the extent those earnings are expected to be repatriated. Beginning in 2014, we considered the undistributed earnings of our foreign subsidiaries to be indefinitely reinvested outside of the United States to support future growth in foreign markets and to maintain current operating needs of foreign locations. Accordingly, we have not provided a deferred income tax liability related to those undistributed earnings.
Recently Issued Accounting Standards
For a description of recently issued accounting pronouncements, including the expected dates of adoption and the estimated effects, if any, on our consolidated financial statements, see "Note 1 - Basis of Presentation and Changes in Significant Accounting Policies" to our consolidated financial statements in Part II, Item 8 of this Annual Report on Form 10-K.
67
Item 7A. Quantitative and Qualitative Disclosure About Market Risk.
Market risk is the potential loss arising from adverse changes in market rates and prices, such as foreign currency exchange rates, interest rates and other relevant market rate or price changes. In the ordinary course of business, we are exposed to various market risks, including changes in foreign currency exchange rates and interest rates, and we regularly evaluate our exposure to such changes. Our overall risk management strategy seeks to balance the magnitude of the exposure and the cost and availability of appropriate financial instruments. From time to time, we have utilized forward exchange contracts to manage our foreign currency exchange rate and interest rate risk.
Foreign Currency Exchange Rates
Approximately 21%, 25% and 28% of our net service revenues for the years ended December 31, 2016, 2015 and 2014, respectively, were denominated in currencies other than the U.S. dollar. Our financial statements are reported in U.S. dollars and, accordingly, fluctuations in exchange rates will affect the translation of our revenues and expenses denominated in foreign currencies into U.S. dollars for purposes of reporting our consolidated financial results. During 2016, 2015 and 2014, the most significant currency exchange rate exposures were the Euro and British pound. A hypothetical change of 10% in average exchange rates used to translate all foreign currencies to U.S. dollars would have impacted income before income taxes for 2016 by approximately $12.0 million. The impact of this could be partially offset by exchange rate fluctuation provisions stated in some of our contracts with customers designed to mitigate our exposure to fluctuations in currency exchange rates over the life of the contract. For example during the year ended December 31, 2016, our revenue was reduced by $8.9 million to reflect the reduced operating costs required to fulfill the contracts as a result of the fluctuations in foreign currency exchange rates. We do not have significant operations in countries in which the economy is considered to be highly inflationary.
We are subject to foreign currency transaction risk for fluctuations in exchange rates during the period of time between the consummation and cash settlement of a transaction. Accordingly, exchange rate fluctuations during this period may affect our profitability with respect to such contracts. We are able to partially offset our foreign currency transaction risk through exchange rate fluctuation adjustment provisions stated in our contracts with customers, or we may hedge our transaction risk with foreign currency exchange contracts.
Interest Rates
We are subject to market risk associated with changes in interest rates. In May 2016, we entered into interest rate swaps with a combined notional value of $300.0 million in an effort to limit our exposure to variable interest rates on our Term Loan. At December 31, 2016 and 2015, we had $241.7 million and $505.0 million, respectively, outstanding under our Credit Agreement which were not covered by an interest rate swap and therefore subject to variable interest rates. Each quarter-point increase or decrease in the applicable interest rate at December 31, 2016 and 2015 would change our interest expense by approximately $0.6 million and $1.3 million, respectively, per year.
68
Item 8. Financial Statements and Supplementary Data.
Index to Consolidated Financial Statements
Page | |
69
REPORT OF INDEPENDENT REGISTERED PUBLIC ACCOUNTING FIRM
The Board of Directors and Shareholders of INC Research Holdings, Inc.
Raleigh, North Carolina
We have audited the accompanying consolidated balance sheet of INC Research Holdings, Inc. and its subsidiaries (the "Company") as of December 31, 2016, and the related consolidated statements of operations, comprehensive income (loss), shareholders' equity, and cash flows for the year ended December 31, 2016. These financial statements are the responsibility of the Company's management. Our responsibility is to express an opinion on these financial statements based on our audit.
We conducted our audit in accordance with the standards of the Public Company Accounting Oversight Board (United States). Those standards require that we plan and perform the audit to obtain reasonable assurance about whether the financial statements are free of material misstatement. An audit includes examining, on a test basis, evidence supporting the amounts and disclosures in the financial statements. An audit also includes assessing the accounting principles used and significant estimates made by management, as well as evaluating the overall financial statement presentation. We believe that our audit provides a reasonable basis for our opinion.
In our opinion, such consolidated financial statements present fairly, in all material respects, the financial position of INC Research Holdings, Inc. and its subsidiaries as of December 31, 2016, and the results of their operations and their cash flows for the year ended December 31, 2016, in conformity with accounting principles generally accepted in the United States of America.
We have also audited, in accordance with the standards of the Public Company Accounting Oversight Board (United States), the Company's internal control over financial reporting as of December 31, 2016, based on the criteria established in Internal Control - Integrated Framework (2013) issued by the Committee of Sponsoring Organizations of the Treadway Commission, and our report dated February 27, 2017, expressed an unqualified opinion on the Company's internal control over financial reporting.
/s/ Deloitte & Touche LLP
Raleigh, North Carolina
February 27, 2017
70
REPORT OF INDEPENDENT REGISTERED PUBLIC ACCOUNTING FIRM
The Board of Directors and Shareholders of INC Research Holdings, Inc.
Raleigh, North Carolina
We have audited the internal control over financial reporting of INC Research Holdings, Inc. and its subsidiaries (the "Company") as of December 31, 2016, based on criteria established in Internal Control - Integrated Framework (2013) issued by the Committee of Sponsoring Organizations of the Treadway Commission. The Company's management is responsible for maintaining effective internal control over financial reporting and for its assessment of the effectiveness of internal control over financial reporting, included in the accompanying Management’s Annual Report on Internal Control Over Financial Reporting. Our responsibility is to express an opinion on the Company's internal control over financial reporting based on our audit.
We conducted our audit in accordance with the standards of the Public Company Accounting Oversight Board (United States). Those standards require that we plan and perform the audit to obtain reasonable assurance about whether effective internal control over financial reporting was maintained in all material respects. Our audit included obtaining an understanding of internal control over financial reporting, assessing the risk that a material weakness exists, testing and evaluating the design and operating effectiveness of internal control based on the assessed risk, and performing such other procedures as we considered necessary in the circumstances. We believe that our audit provides a reasonable basis for our opinion.
A company's internal control over financial reporting is a process designed by, or under the supervision of, the company's principal executive and principal financial officers, or persons performing similar functions, and effected by the company's board of directors, management, and other personnel to provide reasonable assurance regarding the reliability of financial reporting and the preparation of financial statements for external purposes in accordance with generally accepted accounting principles. A company's internal control over financial reporting includes those policies and procedures that (1) pertain to the maintenance of records that, in reasonable detail, accurately and fairly reflect the transactions and dispositions of the assets of the company; (2) provide reasonable assurance that transactions are recorded as necessary to permit preparation of financial statements in accordance with generally accepted accounting principles, and that receipts and expenditures of the company are being made only in accordance with authorizations of management and directors of the company; and (3) provide reasonable assurance regarding prevention or timely detection of unauthorized acquisition, use, or disposition of the company's assets that could have a material effect on the financial statements.
Because of the inherent limitations of internal control over financial reporting, including the possibility of collusion or improper management override of controls, material misstatements due to error or fraud may not be prevented or detected on a timely basis. Also, projections of any evaluation of the effectiveness of the internal control over financial reporting to future periods are subject to the risk that the controls may become inadequate because of changes in conditions, or that the degree of compliance with the policies or procedures may deteriorate.
In our opinion, the Company maintained, in all material respects, effective internal control over financial reporting as of December 31, 2016, based on the criteria established in Internal Control - Integrated Framework (2013) issued by the Committee of Sponsoring Organizations of the Treadway Commission.
We have also audited, in accordance with the standards of the Public Company Accounting Oversight Board (United States), the consolidated financial statements of the Company as of and for the year ended December 31, 2016, and our report dated February 27, 2017, expressed an unqualified opinion on those financial statements.
/s/ Deloitte & Touche LLP
Raleigh, North Carolina
February 27, 2017
71
Report of Independent Registered Public Accounting Firm
The Board of Directors and Shareholders of INC Research Holdings, Inc.
We have audited the accompanying consolidated balance sheet of INC Research Holdings, Inc. and its subsidiaries as of December 31, 2015, and the related consolidated statements of operations, comprehensive income (loss), shareholders' equity, and cash flows for each of the two years in the period ended December 31, 2015. These financial statements are the responsibility of the Company's management. Our responsibility is to express an opinion on these financial statements based on our audits.
We conducted our audits in accordance with the standards of the Public Company Accounting Oversight Board (United States). Those standards require that we plan and perform the audit to obtain reasonable assurance about whether the financial statements are free of material misstatement. An audit includes examining, on a test basis, evidence supporting the amounts and disclosures in the financial statements. An audit also includes assessing the accounting principles used and significant estimates made by management, as well as evaluating the overall financial statement presentation. We believe that our audits provide a reasonable basis for our opinion.
In our opinion, the financial statements referred to above present fairly, in all material respects, the consolidated financial position of INC Research Holdings, Inc. and subsidiaries at December 31, 2015, and the consolidated results of their operations and their cash flows for each of the two years in the period ended December 31, 2015, in conformity with U.S. generally accepted accounting principles.
/s/ Ernst & Young LLP
Raleigh, North Carolina
February 24, 2016
72
INC RESEARCH HOLDINGS, INC. AND SUBSIDIARIES
CONSOLIDATED STATEMENTS OF OPERATIONS
Year Ended December 31, | |||||||||||
2016 | 2015 | 2014 | |||||||||
(in thousands, except per share data) | |||||||||||
Net service revenue | $ | 1,030,337 | $ | 914,740 | $ | 809,728 | |||||
Reimbursable out-of-pocket expenses | 580,259 | 484,499 | 369,071 | ||||||||
Total revenue | 1,610,596 | 1,399,239 | 1,178,799 | ||||||||
Costs and operating expenses: | |||||||||||
Direct costs | 626,633 | 542,404 | 515,059 | ||||||||
Reimbursable out-of-pocket expenses | 580,259 | 484,499 | 369,071 | ||||||||
Selling, general, and administrative | 172,386 | 156,609 | 145,143 | ||||||||
Restructuring, CEO transition and other costs | 13,612 | 1,785 | 6,192 | ||||||||
Transaction expenses | 3,143 | 1,637 | 7,902 | ||||||||
Asset impairment charges | — | 3,931 | 17,245 | ||||||||
Depreciation | 21,353 | 18,140 | 21,619 | ||||||||
Amortization | 37,851 | 37,874 | 32,924 | ||||||||
Total operating expenses | 1,455,237 | 1,246,879 | 1,115,155 | ||||||||
Income from operations | 155,359 | 152,360 | 63,644 | ||||||||
Other (expense) income, net: | |||||||||||
Interest income | 216 | 192 | 249 | ||||||||
Interest expense | (12,016 | ) | (15,640 | ) | (53,036 | ) | |||||
Loss on extinguishment of debt | (439 | ) | (9,795 | ) | (46,750 | ) | |||||
Other (expense) income, net | (9,002 | ) | 3,857 | 7,689 | |||||||
Total other (expense) income, net | (21,241 | ) | (21,386 | ) | (91,848 | ) | |||||
Income (loss) before provision for income taxes | 134,118 | 130,974 | (28,204 | ) | |||||||
Income tax (expense) benefit | (21,488 | ) | (13,927 | ) | 4,734 | ||||||
Net income (loss) | 112,630 | 117,047 | (23,470 | ) | |||||||
Class C common stock dividends | — | — | (375 | ) | |||||||
Redemption of New Class C common stock | — | — | (3,375 | ) | |||||||
Net income (loss) attributable to common shareholders | $ | 112,630 | $ | 117,047 | $ | (27,220 | ) | ||||
Earnings per share attributable to common shareholders: | |||||||||||
Basic | $ | 2.08 | $ | 2.02 | $ | (0.51 | ) | ||||
Diluted | $ | 2.03 | $ | 1.95 | $ | (0.51 | ) | ||||
Weighted average common shares outstanding: | |||||||||||
Basic | 54,031 | 57,888 | 53,301 | ||||||||
Diluted | 55,610 | 60,146 | 53,301 | ||||||||
The accompanying notes are an integral part of these consolidated financial statements.
73
INC RESEARCH HOLDINGS, INC. AND SUBSIDIARIES
CONSOLIDATED STATEMENTS OF COMPREHENSIVE INCOME (LOSS)
Year Ended December 31, | |||||||||||
2016 | 2015 | 2014 | |||||||||
(in thousands) | |||||||||||
Net income (loss) | $ | 112,630 | $ | 117,047 | $ | (23,470 | ) | ||||
Unrealized gain on derivative instruments, net of tax expense of ($707), $0, and $0, respectively | 1,106 | — | — | ||||||||
Foreign currency translation adjustments, net of tax benefit of $0, $0, and $44, respectively | (1,813 | ) | (15,343 | ) | (16,359 | ) | |||||
Comprehensive income (loss) | $ | 111,923 | $ | 101,704 | $ | (39,829 | ) | ||||
The accompanying notes are an integral part of these consolidated financial statements.
74
INC RESEARCH HOLDINGS, INC. AND SUBSIDIARIES
CONSOLIDATED BALANCE SHEETS
December 31, | |||||||
2016 | 2015 | ||||||
(in thousands, except share data) | |||||||
ASSETS | |||||||
Current assets: | |||||||
Cash and cash equivalents | $ | 102,471 | $ | 85,011 | |||
Restricted cash | 607 | 452 | |||||
Accounts receivable: | |||||||
Billed, net | 211,476 | 158,315 | |||||
Unbilled | 173,873 | 139,697 | |||||
Prepaid expenses and other current assets | 34,202 | 38,571 | |||||
Total current assets | 522,629 | 422,046 | |||||
Property and equipment, net | 58,306 | 44,813 | |||||
Goodwill | 552,502 | 553,008 | |||||
Intangible assets, net | 114,486 | 152,340 | |||||
Deferred income taxes | 14,726 | 12,073 | |||||
Other long-term assets | 25,858 | 26,939 | |||||
Total assets | $ | 1,288,507 | $ | 1,211,219 | |||
LIABILITIES AND SHAREHOLDERS' EQUITY | |||||||
Current liabilities: | |||||||
Accounts payable | $ | 23,693 | $ | 22,497 | |||
Accrued liabilities | 153,559 | 111,262 | |||||
Deferred revenue | 277,600 | 311,029 | |||||
Current portion of long-term debt | 11,875 | 29,804 | |||||
Total current liabilities | 466,727 | 474,592 | |||||
Long-term debt, less current portion | 485,849 | 472,035 | |||||
Deferred income taxes | 8,295 | 28,066 | |||||
Other long-term liabilities | 26,163 | 19,092 | |||||
Total liabilities | 987,034 | 993,785 | |||||
Commitments and contingencies (Note 17) | |||||||
Shareholders' equity: | |||||||
Preferred stock, $0.01 par value; 30,000,000 shares authorized, 0 shares issued and outstanding at December 31, 2016 and 2015, respectively | — | — | |||||
Common stock, $0.01 par value; 600,000,000 shares authorized, 53,762,786 and 53,871,484 shares issued and outstanding at December 31, 2016 and 2015, respectively | 538 | 539 | |||||
Additional paid-in capital | 573,176 | 559,910 | |||||
Accumulated other comprehensive loss, net of taxes | (42,250 | ) | (41,543 | ) | |||
Accumulated deficit | (229,991 | ) | (301,472 | ) | |||
Total shareholders' equity | 301,473 | 217,434 | |||||
Total liabilities and shareholders' equity | $ | 1,288,507 | $ | 1,211,219 | |||
The accompanying notes are an integral part of these consolidated financial statements.
75
INC RESEARCH HOLDINGS, INC. AND SUBSIDIARIES
CONSOLIDATED STATEMENTS OF CASH FLOWS
Year Ended December 31, | |||||||||||
2016 | 2015 | 2014 | |||||||||
(in thousands) | |||||||||||
Operating activities | |||||||||||
Net income (loss) | $ | 112,630 | $ | 117,047 | $ | (23,470 | ) | ||||
Adjustments to reconcile net income (loss) to net cash provided by operating activities: | |||||||||||
Depreciation and amortization | 59,204 | 56,014 | 54,543 | ||||||||
Stock repurchase costs | — | 1,637 | — | ||||||||
Amortization of capitalized loan fees | 972 | 1,346 | 5,700 | ||||||||
Share-based compensation | 14,020 | 5,074 | 3,370 | ||||||||
Provision for (recovery of) doubtful accounts | 2,570 | (144 | ) | 2,435 | |||||||
Deferred income taxes | (22,260 | ) | 4,134 | (14,837 | ) | ||||||
Foreign currency adjustments | 20,681 | (795 | ) | (7,390 | ) | ||||||
Asset impairment charges | — | 3,931 | 17,245 | ||||||||
Loss on extinguishment of debt and other debt refinancing costs | 439 | 9,795 | 49,227 | ||||||||
Excess income tax benefits from share-based awards | — | (975 | ) | — | |||||||
Other adjustments | 286 | (82 | ) | (853 | ) | ||||||
Changes in operating assets and liabilities: | |||||||||||
Accounts receivable billed and unbilled | (103,748 | ) | (54,073 | ) | (24,259 | ) | |||||
Accounts payable and accrued expenses | 6,658 | 8,186 | 25,743 | ||||||||
Deferred revenue | 4,060 | 68,500 | 42,742 | ||||||||
Other assets and liabilities | 13,820 | (14,855 | ) | 1,251 | |||||||
Net cash provided by operating activities | 109,332 | 204,740 | 131,447 | ||||||||
Investing activities | |||||||||||
Acquisition of business, net of cash acquired | — | — | (2,302 | ) | |||||||
Purchases of property and equipment | (31,353 | ) | (21,111 | ) | (25,551 | ) | |||||
Net cash used in investing activities | $ | (31,353 | ) | $ | (21,111 | ) | $ | (27,853 | ) | ||
The accompanying notes are an integral part of these consolidated financial statements.
76
INC RESEARCH HOLDINGS, INC. AND SUBSIDIARIES
CONSOLIDATED STATEMENTS OF CASH FLOWS
(Continued)
Year Ended December 31, | |||||||||||
2016 | 2015 | 2014 | |||||||||
(in thousands) | |||||||||||
Financing activities | |||||||||||
Proceeds from issuance of long-term debt | $ | — | $ | 525,000 | $ | 288,365 | |||||
Payments of debt financing costs | (868 | ) | (4,987 | ) | (5,364 | ) | |||||
Payments on long-term debt | — | (475,001 | ) | (164,095 | ) | ||||||
Proceeds from revolving credit facility | 100,000 | 45,000 | — | ||||||||
Repayment of revolving credit facility | (105,000 | ) | (15,000 | ) | — | ||||||
Payment of notes payable and breakage fees | — | — | (336,385 | ) | |||||||
Payments related to business combinations | — | (973 | ) | — | |||||||
Principal payments toward capital lease obligations | — | (452 | ) | (2,680 | ) | ||||||
Payments of stock repurchase costs | — | (1,423 | ) | — | |||||||
Payments for repurchase of common stock | (64,500 | ) | (285,000 | ) | (38 | ) | |||||
Proceeds from the issuance of common stock | — | — | 156,113 | ||||||||
Proceeds from the exercise of stock options | 17,891 | 3,656 | 145 | ||||||||
Payments related to tax withholding for share-based compensation | (839 | ) | (3,194 | ) | — | ||||||
Excess income tax benefits from share-based awards | — | 975 | — | ||||||||
Dividends paid | — | — | (375 | ) | |||||||
Redemption of New Class C and D common stock | — | — | (3,384 | ) | |||||||
Net cash used in financing activities | (53,316 | ) | (211,399 | ) | (67,698 | ) | |||||
Effect of exchange rate changes on cash and cash equivalents | (7,203 | ) | (13,672 | ) | (6,415 | ) | |||||
Net change in cash and cash equivalents | 17,460 | (41,442 | ) | 29,481 | |||||||
Cash and cash equivalents at the beginning of the year | 85,011 | 126,453 | 96,972 | ||||||||
Cash and cash equivalents at the end of the year | $ | 102,471 | $ | 85,011 | $ | 126,453 | |||||
Supplemental disclosure of cash flow information | |||||||||||
Cash paid for income taxes | $ | 24,337 | $ | 8,251 | $ | 6,304 | |||||
Cash paid for interest | 11,627 | 17,533 | 64,347 | ||||||||
The accompanying notes are an integral part of these consolidated financial statements.
77
INC RESEARCH HOLDINGS, INC. AND SUBSIDIARIES
CONSOLIDATED STATEMENTS OF SHAREHOLDERS' EQUITY
Common Stock | Additional Paid-in Capital | Treasury Stock | Accumulated Other Comprehensive (Loss) Income | Accumulated Deficit | Total Shareholders' Equity | |||||||||||||||||||||
Shares | Amount | |||||||||||||||||||||||||
(in thousands) | ||||||||||||||||||||||||||
Balance at December 31, 2013 | 103,795 | $ | 1,051 | $ | 480,579 | $ | (6,751 | ) | $ | (9,841 | ) | $ | (188,831 | ) | $ | 276,207 | ||||||||||
Issuance of common stock | 9,324 | 93 | 156,020 | — | — | — | 156,113 | |||||||||||||||||||
Redemption of New Class D common stock | (51,910 | ) | (519 | ) | 510 | — | — | — | (9 | ) | ||||||||||||||||
Treasury stock acquired | (4 | ) | — | — | (38 | ) | — | — | (38 | ) | ||||||||||||||||
Treasury stock retired | — | (14 | ) | (5,677 | ) | 6,789 | — | (1,098 | ) | — | ||||||||||||||||
Stock option exercises | 29 | 1 | 144 | — | — | — | 145 | |||||||||||||||||||
Share-based compensation | — | — | 3,370 | — | — | — | 3,370 | |||||||||||||||||||
Dividends paid | — | — | — | — | — | (375 | ) | (375 | ) | |||||||||||||||||
Redemption of New Class C common stock | — | — | — | — | — | (3,375 | ) | (3,375 | ) | |||||||||||||||||
Net loss | — | — | — | — | — | (23,470 | ) | (23,470 | ) | |||||||||||||||||
Foreign currency translation adjustment, net of tax benefit, $44 | — | — | — | — | (16,359 | ) | — | (16,359 | ) | |||||||||||||||||
Balance at December 31, 2014 | 61,234 | 612 | 634,946 | — | (26,200 | ) | (217,149 | ) | 392,209 | |||||||||||||||||
Stock repurchase | (8,054 | ) | (80 | ) | (83,550 | ) | — | — | (201,370 | ) | (285,000 | ) | ||||||||||||||
Net stock option exercise and payment for tax withholding | 156 | 2 | (3,196 | ) | — | — | — | (3,194 | ) | |||||||||||||||||
Stock option exercises | 535 | 5 | 5,661 | — | — | — | 5,666 | |||||||||||||||||||
Share-based compensation | — | — | 5,074 | — | — | — | 5,074 | |||||||||||||||||||
Income tax benefit from share-based award activities | — | — | 975 | — | — | — | 975 | |||||||||||||||||||
Net income | — | — | — | — | — | 117,047 | 117,047 | |||||||||||||||||||
Foreign currency translation adjustment | — | — | — | — | (15,343 | ) | — | (15,343 | ) | |||||||||||||||||
Balance at December 31, 2015 | 53,871 | 539 | 559,910 | — | (41,543 | ) | (301,472 | ) | 217,434 | |||||||||||||||||
Impact to Retained Earnings from adoption of ASU 2016-09 | — | — | — | — | — | 7,554 | 7,554 | |||||||||||||||||||
Balance at January 1, 2016 | 53,871 | 539 | 559,910 | — | (41,543 | ) | (293,918 | ) | 224,988 | |||||||||||||||||
Stock repurchase | (1,500 | ) | (15 | ) | (15,782 | ) | — | — | (48,703 | ) | (64,500 | ) | ||||||||||||||
Net stock option exercise/RSU distributions and payment for tax withholding | 33 | — | (839 | ) | — | — | — | (839 | ) | |||||||||||||||||
Stock option exercises and RSU distributions | 1,359 | 14 | 15,867 | — | — | — | 15,881 | |||||||||||||||||||
Share-based compensation | — | — | 14,020 | — | — | — | 14,020 | |||||||||||||||||||
Net income | — | — | — | — | — | 112,630 | 112,630 | |||||||||||||||||||
Unrealized gain on derivative instruments, net of tax expense of ($707) | — | — | — | — | 1,106 | — | 1,106 | |||||||||||||||||||
Foreign currency translation adjustment | — | — | — | — | (1,813 | ) | — | (1,813 | ) | |||||||||||||||||
Balance at December 31, 2016 | 53,763 | $ | 538 | $ | 573,176 | $ | — | $ | (42,250 | ) | $ | (229,991 | ) | $ | 301,473 | |||||||||||
The accompanying notes are an integral part of these consolidated financial statements.
78
INC Research Holdings, Inc. and Subsidiaries
Notes to Consolidated Financial Statements
1. Basis of Presentation and Summary of Significant Accounting Policies
Principal Business
INC Research Holdings, Inc. (the Company, Parent or Holdings) is a Contract Research Organization (CRO) providing a comprehensive range of clinical development services for the biopharmaceutical and medical device industries to its customers across various therapeutic areas. The international infrastructure of the Company's development business enables it to conduct Phase I to Phase IV clinical trials globally for pharmaceutical and biotechnology companies.
Organization
On August 13, 2010, the Company was incorporated in the State of Delaware for the purpose of acquiring the outstanding equity of INC Research, Inc. through INC Research Intermediate, LLC, ("INC Intermediate") a wholly-owned subsidiary of the Company. On November 7, 2014, in conjunction with the initial public offering (IPO), the Company effected a corporate reorganization, whereby INC Intermediate was merged with and into the Company.
Principles of Consolidation
The accompanying consolidated financial statements have been prepared in accordance with accounting principles generally accepted in the United States of America (U.S. GAAP), and include the accounts and results of operations of the Company and its controlled subsidiaries. All intercompany balances and transactions are eliminated.
Use of Estimates
The preparation of the consolidated financial statements in conformity with U.S. GAAP requires management to make estimates, judgments and assumptions that affect the reported amounts of assets and liabilities, revenues and expenses during the periods, as well as disclosures of contingent assets and liabilities at the date of the financial statements. The Company evaluates its estimates on an ongoing basis, including those related to revenue recognition, share-based compensation, valuation of goodwill and identifiable intangibles, tax related contingencies and valuation allowances, allowance for doubtful accounts, and litigation contingencies, among others. These estimates are based on the information available to management at the time these estimates, judgments, and assumptions are made. Actual results may differ materially from these estimates.
Foreign Currency Translation and Transactions
The majority of the Company's foreign subsidiaries maintain their accounting records in their local currency. All of the assets and liabilities of these subsidiaries are converted to U.S. dollars, at the exchange rate in effect at the balance sheet date, and equity accounts are carried at historical exchange rates. Income and expense items are translated at average exchange rates in effect during each reporting period for the results of operations. The net effect of foreign currency translation adjustments is included in shareholder's equity as a component of accumulated other comprehensive loss in the accompanying consolidated balance sheets.
The Company is subject to foreign currency transaction risk for fluctuations in exchange rates during the period of time between the consummation and cash settlement of a transaction. Foreign currency transaction gains or losses are credited or charged to income as incurred and are included in other income (expense), net in the accompanying consolidated statements of operations.
Other Comprehensive Income (Loss)
The Company has elected to present comprehensive income (loss) and its components as a separate statement. Other comprehensive income (loss) refers to revenue, expenses, gains, and losses that under U.S. GAAP are recorded as an element of shareholders' equity but are excluded from net income (loss). The Company's other comprehensive income (loss) consists of foreign currency translation adjustments, net of
79
applicable taxes, resulting from the translation of foreign subsidiaries not using the U.S. dollar as their functional currency and the effective portions of the unrealized gains or losses associated with derivative instruments designated and accounted for as hedging instruments.
Cash and Cash Equivalents
Cash and cash equivalents consist of highly liquid investments with an original maturity of three months or less at the date of purchase and consist principally of bank deposits. Cash and cash equivalents are carried at cost, which approximates fair value.
Restricted Cash
Restricted cash represents cash and term deposits held as security over bank and lease guarantees. Restricted cash is classified as a current or long-term asset based on the timing and nature of when and how the cash is expected to be used or when the restrictions are expected to lapse. The Company includes changes in restricted cash balances as part of operating activities in the consolidated statements of cash flows.
Fair Value
The Company records certain assets and liabilities at fair value (see "Note 6 - Fair Value Measurements"). Fair value is defined as the price that would be received to sell an asset or paid to transfer a liability in the principal or most advantageous market for the asset or liability in an orderly transaction between market participants at the measurement date. A three-level fair value hierarchy that prioritizes the inputs used to measure fair value is described below. This hierarchy requires entities to maximize the use of observable inputs and minimize the use of unobservable inputs. The three levels of inputs used to measure fair value are as follows:
Level 1 — Unadjusted quoted prices in active markets for identical assets or liabilities;
Level 2 — Inputs other than quoted prices included within Level 1 that are either directly or indirectly observable through correlation with market data; and
Level 3 — Unobservable inputs that are supported by little or no market data, which require the reporting entity to develop its own assumptions.
Derivative Financial Instruments
The Company uses interest rate swaps designated as cash flow hedges to manage exposure to variable interest rates on its debt obligations. The Company designates its interest rate swaps as cash flow hedges because they are executed to hedge the Company's exposure to the variability in expected future cash flows that are attributable to changes in interest rates.
Derivative financial instruments are recognized on the balance sheet as assets and liabilities and are measured at fair value. Changes in the fair value of derivative instruments designated as hedging instruments are recorded each period according to the determination of the derivative's effectiveness. The effective portion of changes in the fair value of derivatives designated as cash flow hedges is recorded in accumulated other comprehensive loss and subsequently reclassified into earnings in the period during which the hedged transaction is recognized in earnings. The ineffective portion of the change in fair value of the derivatives is recognized as non-operating income or expense immediately when incurred and included in the "Interest expense" line item in the accompanying consolidated statements of operations.
Billed and Unbilled Accounts Receivable and Deferred Revenues
Accounts receivable are recorded at net realizable value. Unbilled accounts receivable arise when services have been rendered for which revenue has been recognized but the customers have not been billed. In general, prerequisites for billings and payments are established by contractual provisions, including predetermined payment schedules, which may or may not correspond to the timing of the performance of services under the contract.
80
In some cases, payments received are in excess of revenue recognized. Deferred revenue represents receipts of payments from customers in advance of services being provided and the related revenue being earned or reimbursable expenses being incurred. As the contracted services are subsequently performed and the associated revenue is recognized, the deferred revenue balance is reduced by the amount of the revenue recognized during the period.
Allowance for Doubtful Accounts
The Company maintains a credit approval process and makes judgments in connection with assessing its customers' ability to pay throughout the contractual obligation period. Despite this assessment, from time to time, customers are unable to meet their payment obligations. The Company monitors customers' credit worthiness and applies judgment in establishing a provision for estimated credit losses based on historical experience, current receivables aging, and identified customer-specific circumstances that would affect the customers' ability to meet their obligation.
Property and Equipment
Property and equipment is primarily comprised of furniture, software, office and computer equipment. These assets are depreciated using the straight-line method. The Company uses the estimated useful lives of up to:
Buildings | 39 years |
Furniture and equipment | 5 years |
Computer equipment and software | 3 years |
Leasehold improvements | Lesser of remaining life of lease or the useful life of the asset |
Repairs and maintenance are charged to operations as incurred and expenditures for additions and improvements that extend the useful life of the asset are capitalized.
The Company capitalizes costs of computer software obtained for internal use and amortizes these costs on a straight-line basis over the estimated useful life of the product, not to exceed three years. Beginning in 2016, software cloud computing arrangements containing a software license are accounted for consistently with the acquisition of other software licenses. In the event such an arrangement does not contain a software license, the Company accounts for the arrangement as a service contract. The impact of adopting this standard was immaterial.
Goodwill, Intangible Assets, and Long-Lived Assets
Goodwill represents the excess of purchase price over the fair value of net assets acquired in business combinations. The Company evaluates goodwill for impairment annually or more frequently if events or changes in circumstances indicate that goodwill might be impaired.
Intangible assets consist primarily of trademarks and customer relationships. Customer relationships are being amortized at the greater of actual customer attrition or a straight-line basis over the estimated useful lives. Certain trademarks have an indefinite life and are not amortized but instead are evaluated for impairment annually or more frequently if events or changes in circumstances indicate that they might be impaired. The Company tests finite-lived intangible assets for impairment upon the occurrence of certain triggering events. The finite-lived intangible assets are amortized over their estimated useful lives. As of December 31, 2016 and 2015, the estimated useful lives of the Company's intangible assets were as follows:
Useful Life (Years) | |
Customer relationships | 6 – 10 |
Trademarks — INC | Indefinite |
Long-lived assets, including fixed assets and definite-lived intangibles, are regularly reviewed to determine if facts and circumstances indicate that the useful life is shorter than the Company originally estimated or that the carrying amount of the assets may not be recoverable. If such facts and circumstances exist, the Company assesses the recoverability of identified assets by comparing the projected undiscounted net cash
81
flows associated with the related asset or group of assets over their remaining lives against their respective carrying amounts. Impairments, if any, are based on the excess of the carrying amount over the fair value of those assets and occur in the period in which the impairment determination was made.
Revenue Recognition
The Company recognizes revenue when all of the following conditions are satisfied: (1) there is persuasive evidence of an arrangement; (2) the service offering has been delivered to the customer; (3) the collection of the fees is reasonably assured; and (4) the arrangement consideration is fixed or determinable. The Company records revenues net of any tax assessments by governmental authorities, such as value added taxes, that are imposed on and concurrent with specific revenue generating transactions. In some cases, contracts provide for consideration that is contingent upon the occurrence of uncertain future events. The Company recognizes contingent revenue when the contingency has been resolved and all other criteria for revenue recognition have been met.
The Company's arrangements are principally service contracts and historically, a majority of the net service revenue has been earned under contracts which range in duration from a few months to several years. Most of the Company's contracts can be terminated by the customer with a 30 day notice. In the event of termination, the Company's contracts often provide for fees for winding down the project, which include both fees incurred and actual expenses and non-cancellable expenditures and may include a fee to cover a percentage of the remaining professional fees on the project. The Company does not recognize revenue with respect to start-up activities including contract and scope negotiation, feasibility analysis and conflict of interest review associated with contracts. The costs for these activities are expensed as incurred.
The majority of the Company's contracts are for clinical research services and, to a lesser extent, consulting services. These contracts represent a single unit of accounting. Clinical research service contracts generally take the form of fee-for-service, fixed-fee-per-unit and fixed price contracts, with the majority of the contracts being fixed-fee-per-unit. For fee-for-service contracts, fees are billed based on a contractual rate basis and the Company recognizes revenue on these arrangements as services are performed, primarily on a time and materials basis. For fixed-price contracts (including fixed-fee and fixed-price per unit arrangements), revenue is recognized as services are performed based upon a proportional performance basis, which the Company assesses using output measures specific to the service provided.
Examples of output measures include, among others, study management months, number of sites activated, number of site initiation visits, and number of monitoring visits completed. Revenue is determined by dividing the actual units of work completed by the total units of work required under the contract and multiplying that ratio by the total contract value. The total contract value, or total contractual payments, represents the aggregate contracted price for each of the agreed upon services to be provided.
Changes in the scope of work are common, especially under long-term contracts, and generally result in a renegotiation of future contract pricing terms and change in contract value. If the customer does not agree to contract modification, the Company could bear the risk of cost overruns. Renegotiated amounts are not included in net revenues until written authorization is received, the amount is earned and realization is assured.
The Company offers volume rebates to its large customers based on annual volume thresholds. The Company records an estimate of the annual volume rebate as a reduction of revenue throughout the period based on the estimated total rebate to be earned for the period.
Reimbursable Out-of-Pocket Expenses
In connection with management of multi-site clinical trials, the Company is reimbursed by its customers for fees paid to principal investigators and for other out-of-pocket costs (such as travel expenses for the Company's clinical monitors). The Company includes these costs in total operating expenses, and the related reimbursements are reflected in total revenue, as the Company is deemed to be the primary obligor in the applicable arrangements.
82
Share-Based Compensation
The Company recognizes compensation expense for all share-based awards granted based on the fair value of the shares on the grant date. The Company estimates the fair value of option awards and Employee Stock Purchase Plan ("ESPP") awards using the Black-Scholes option-pricing model, as further discussed below. For restricted stock and stock unit awards, the grant date fair value is based upon the market price of the Company's common stock on the date of the grant. This fair value is then amortized to compensation expense over the requisite service period or vesting term.
The Company uses the Black-Scholes option-pricing model to determine the fair value of options granted. The model requires the Company to use subjective assumptions. The following addresses each of these assumptions and describes the methodology for determining each assumption:
Fair value of our common stock - Subsequent to the IPO, the pre-IPO fair value of our common stock is based upon the market price of our common stock on the date of the grant as listed on the NASDAQ Global Select Market (the "NASDAQ"). Due to the absence of an active market for our common stock prior to the Company's IPO, the fair value of our common stock on the date of the grant was determined in good faith by the Company's Board of Directors (the "Board") with the assistance of management, based on a number of objective and subjective factors consistent with the methodologies outlined in the AICPA Practice Aid. Each quarter, a contemporaneous valuation of our common stock was performed by a related party. For all contemporaneous valuations performed, two commonly accepted valuation approaches were applied to estimate our enterprise value: the guideline public company method and the guideline transactions method. These methods both select a valuation multiple from comparable public companies or transactions, making adjustments for our strengths and weaknesses relative to the selected companies and transactions and applied it to our operating data to determine enterprise value.
Expected Life - The expected life of options granted by the Company has been determined based upon the "simplified" method as allowed by authoritative literature and represents the period of time that options granted are expected to be outstanding. The estimated length of life of an option is based on the midpoint between the vesting date and the end of the contractual term. The Company uses this estimate because it has not accumulated sufficient historical data to make a reasonable estimate of the expected life.
Expected Volatility - Expected volatility is estimated based on the historical volatility of a peer group of publicly traded companies for a period equal to the expected term of the award, as the Company does not have adequate history to calculate its own historical or implied volatility.
Risk-Free Interest Rate - The risk-free interest rate is based on U.S. Treasury zero-coupon bonds whose term is consistent with the expected life of stock options.
Expected Dividend Yield - The Company has not paid and does not anticipate paying cash dividends on its shares of Class A common stock; therefore, the expected dividend yield is assumed to be zero.
Due to the inherent limitations of option valuation models, future events that are unpredictable and the estimation process utilized in determining the valuation of the share-based awards, the ultimate value realized by award holders may vary significantly from the amounts expensed in the Company's financial statements.
In March 2016, the Financial Accounting Standards Board ("FASB") issued ASU No. 2016-09, Compensation - Stock Compensation: Improvements to Employee Share-Based Payment Accounting. In accordance with the guidance, the Company elected to early adopt this ASU effective in the first quarter of 2016. The following summarizes the effects of the adoption on the Company's consolidated financial statements:
Income taxes - Upon adoption of this standard, all excess tax benefits and tax deficiencies (including tax benefits of dividends on share-based payment awards) are recognized as income tax expense or benefit in the statement of operations. The tax effects of exercised or vested awards are treated as discrete items in the reporting period in which they occur. The Company also recognizes excess tax
83
benefits regardless of whether the benefit reduces taxes payable in the current period. As a result, the Company recognized discrete adjustments to income tax expense for the year ended December 31, 2016 of $12.9 million related to excess tax benefits. The Company applied the modified retrospective adoption approach beginning in 2016 and recorded a cumulative-effect adjustment to retained earnings and reduced its deferred tax liability by $7.6 million. This adjustment related to tax assets that had previously arisen from tax deductions for equity compensation expenses that were greater than the compensation recognized for financial reporting. These assets had been excluded from the deferred tax assets and liabilities totals on the balance sheet as a result of realization requirements previously included in ASC 718, Stock Compensation. Prior periods have not been adjusted.
Forfeitures - Prior to adoption, share-based compensation expense was recognized on a straight line basis, net of estimated forfeitures, such that expense was recognized only for share-based awards that were expected to vest. A forfeiture rate was estimated annually and revised, if necessary, in subsequent periods if actual forfeitures differed from initial estimates. Upon adoption, the Company no longer applies a forfeiture rate and instead accounts for forfeitures as they occur. The Company applied the modified retrospective adoption approach beginning in 2016 and booked an immaterial cumulative-effect adjustment to additional paid-in-capital and share-based compensation expense. Prior periods have not been adjusted.
Statements of Cash Flows - The Company historically accounted for excess tax benefits on the Statement of Cash Flows as a financing activity. Upon adoption of this standard, excess tax benefits are classified along with other income tax cash flows as an operating activity. The Company elected to adopt this portion of the standard on a prospective basis beginning in 2016. Prior periods have not been adjusted.
Earnings Per Share - The Company uses the treasury stock method to compute diluted earnings per share, unless the effect would be anti-dilutive. Under this method, the Company is no longer required to estimate the tax rate and apply it to the dilutive share calculation for determining the dilutive earnings per share. The Company utilized the modified retrospective adoption approach and applied this methodology beginning in 2016. Prior periods have not been adjusted.
Upon adoption, no other aspects of ASU 2016-09 had an effect on the Company's consolidated financial statements or related footnote disclosures.
Income Taxes
The Company and its United States (U.S.) subsidiaries file a consolidated U.S. federal income tax return. Other subsidiaries of the Company file tax returns in their local jurisdictions.
The Company estimates its tax liability based on current tax laws in the statutory jurisdictions in which it operates. Accordingly, the impact of changes in income tax laws on deferred tax assets and deferred tax liabilities are recognized in net earnings in the period during which such changes are enacted. The Company records deferred tax assets and liabilities based on temporary differences between the financial statement and tax bases of assets and liabilities and for tax benefit carryforwards using enacted tax rates in effect in the year in which the differences are expected to reverse.
Valuation allowances are provided to reduce the related deferred income tax assets to an amount which will, more likely than not, be realized. In estimating future taxable income, the Company has considered both positive and negative evidence, such as historical and forecasted results of operations, and has considered the implementation of prudent and feasible tax planning strategies. If a valuation allowance is deemed to be unnecessary, such allowance is released and any related benefit is recognized in the period of the change.
Judgment is required in determining what constitutes an uncertain tax position, as well as the assessment of the outcome of each tax position. The Company considers many factors when evaluating and estimating tax positions and tax benefits. In addition, the calculation of tax liabilities involves dealing with uncertainties in the application of complex tax regulations in domestic and foreign jurisdictions. If the calculation of the liability related to uncertain tax positions proves to be more or less than the ultimate assessment, a tax expense or benefit to expense, respectively, would result. Unrecognized tax benefits, or a portion of unrecognized tax
84
benefits, are presented as a reduction to a deferred tax asset for a net operating loss ("NOL") carryforward, a similar tax loss, or a tax credit carryforward.
Advertising Costs
Advertising costs include costs incurred to promote the Company's business and are expensed as incurred. Advertising costs were $5.0 million, $4.4 million and $3.4 million for the years ended December 31, 2016, 2015 and 2014, respectively.
Restructuring, CEO Transition and Other Costs
Restructuring costs primarily consist of one-time employee termination benefits, contract termination costs and other costs associated with an exit or disposal activity. The Company accounts for restructuring costs in accordance with the authoritative guidance in ASC 420, Exit or Disposal Cost Obligations. This guidance requires that a liability for a cost associated with an exit or disposal activity be recognized in the period in which the liability is incurred, as opposed to the period in which management commits to a plan of action for termination. The guidance also requires that the liabilities associated with an exit or disposal activity be measured at the fair value in the period in which the liability is incurred, except for (i) liabilities related to one-time employee termination benefits, which shall be measured and recognized at the date the entity notifies employees of termination, unless employees are required to render services beyond minimum retention period, in which case the liability is recognized ratably over the future service period; and (ii) liabilities related to an operating lease contract, which shall be measured and recognized when the contract does not have any future economic benefit to the entity (i.e., the entity ceases to utilize the rights conveyed by the contract).
The guidance requires that the fair value of the restructuring liabilities is determined using best available representation of fair value or using other appropriate technique. In determining the fair value of the liabilities associated with contract terminations, the Company considers terms and conditions of the contractual obligations to be terminated, including the type and amount of payments and their anticipated timing. In determining the fair value of the liabilities associated with employee terminations, the Company considers termination notification date and associated legal notification requirements and minimum retention period as stipulated by the applicable laws and regulations, the type and amount of benefits employees will receive upon involuntary termination, as well as the timing of employees' departure.
CEO transition costs consist of CEO separation benefits and retention bonuses granted to key employees. The Company accounts for CEO transition costs in accordance with the authoritative guidance in ASC 712, Compensation - Nonretirement Postemployment Benefits. This guidance requires that (i) a liability for benefits offered as special termination benefits to an employee is recognized when the employee accepts the offer and the amount can be reasonably estimated, (ii) a liability for other contractual termination benefits is recognized when it is probable that employees will be entitled to benefits and the amount can be reasonably estimated, and (iii) a liability for other postemployment benefits are recognized and accounted for in accordance with guidance in ASC 710, Compensation - General.
Restructuring liabilities are included in "Accrued liabilities" and "Other long-term liabilities" in the accompanying consolidated balance sheets.
Earnings Per Share
The Company determines earnings per share in accordance with the authoritative guidance in ASC 260, Earnings Per Share. Subsequent to the IPO, the Company has one class of common stock for purposes of the earnings per share calculation and therefore computes basic earnings per share by dividing net income (loss) by the weighted average number of common shares outstanding for the applicable period. Diluted earnings per share are computed in the same manner as basic earnings per share, except that the number of shares is increased to assume exercise of potentially dilutive stock options using the treasury stock method, unless the effect of such increase would be anti-dilutive. Under the treasury stock method, the amount the employee must pay for exercising stock options and the amount of compensation cost for future service that the Company has not yet recognized are assumed to be used to repurchase shares.
Prior to the IPO, the Company calculated the number of common shares outstanding using the two-class method. Class B common shares had no right to receive dividends and Class C shares had the right to
85
receive a preferred dividend of $0.5 million per year. Both Class B and Class C common shares were excluded from the calculations of earnings per share as they did not participate in the earnings of the Company. The Company computed basic earnings per share attributable to Class A common shares based on the weighted average number of Class A common shares outstanding during the period.
Segment Information
The Company discloses information concerning operating segments in accordance with the authoritative guidance in ASC 280, Segment Reporting, which requires segmentation based on the Company's internal organization and reporting of revenues and operating income based upon internal accounting methods commonly referred to as the "management approach." Operating segments are defined as components of an enterprise about which separate financial information is available. This information is evaluated regularly by the Chief Operating Decision Maker (CODM) or decision-making group, in deciding how to allocate resources and in assessing performance. The Company's CODM is its CEO. The Company has determined that it currently has two operating and reportable segments: Clinical Development Services and Phase I Services.
Subsequent Events
The Company considers events or transactions that occur after the balance sheet date but before the financial statements are issued to provide additional evidence relative to certain estimates or to identify matters that require additional disclosure. The Company evaluated all events and transactions through the date that these financial statements were issued.
Recently Issued Accounting Pronouncements
In May 2014, FASB issued ASU No. 2014-09, Revenue from Contracts with Customers. ASU 2014-09 will eliminate transaction- and industry-specific revenue recognition guidance under current U.S. GAAP and replace it with a principle based approach for determining revenue recognition. ASU 2014-09 will require that companies recognize revenue based on the value of transferred goods or services as they occur in the contract. The ASU also will require additional disclosure about the nature, amount, timing and uncertainty of revenue and cash flows arising from customer contracts, including significant judgments and changes in judgments and assets recognized from costs incurred to obtain or fulfill a contract. In July 2015, FASB issued ASU 2015-14, Revenue from Contracts with Customers: Deferral of the Effective Date, which delayed the effective date of ASU 2014-09 by one year and modified the standard to allow early adoption. For public entities, the standard is now effective for reporting periods beginning after December 15, 2017. Earlier application is permitted only as of annual reporting periods beginning after December 15, 2016, including interim reporting periods within that reporting period. Entities can transition to the standard either retrospectively or as a cumulative-effect adjustment as of the date of adoption. In March 2016, FASB issued ASU No. 2016-08, Revenue from Contracts with Customers: Principal versus Agent Considerations (Reporting Revenue Gross versus Net), to clarify principal versus agent considerations in order to improve the operability and understandability of the implementation guidance related to this topic. In April 2016, FASB issued ASU No. 2016-10, Revenue from Contracts with Customers (Topic 606): Identifying Performance Obligations and Licensing. ASU 2016-10 clarifies the implementation guidance on identifying performance obligations. In May 2016, FASB issued ASU No. 2016-12, Revenue from Contracts with Customers (Topic 606): Narrow-Scope Improvements and Practical Expedients. ASU 2016-12 does not change the core principle of the guidance in Topic 606, but rather narrows aspects of Topic 606 by reducing the potential for diversity in practice at initial application and by reducing the cost and complexity of applying Topic 606 both at transition and on an ongoing basis. These ASUs apply to all companies that enter into contracts with customers to transfer goods or services. ASU 2016-08, ASU 2016-10 and ASU 2016-12 did not change the core principles of the previously issued guidance and did not change its effective date. The Company has made progress toward completing its evaluation of the potential changes from adopting this new standard on its financial reporting and disclosures, drafting accounting policies, and designing changes to business processes, controls and systems. The Company expects to complete this process in the second half of 2017 and will adopt the new standard effective January 1, 2018, using the modified retrospective approach.
In January 2016, FASB issued ASU No. 2016-01, Financial Instruments – Recognition and Measurement of Financial Assets and Liabilities. ASU 2016-01 requires public companies to use exit prices to measure the fair value of financial instruments. Specifically the guidance will require separate presentation of financial assets and financial liabilities by measurement category and form of financial asset on the balance sheet or
86
the accompanying notes to the financial statements and will eliminate the disclosure requirements related to measurement assumptions for the fair value of instruments measured at amortized cost. In addition, for liabilities measured under the fair value option, ASU 2016-01 requires companies to present in other comprehensive income changes in fair value due to changes in instrument specific credit risk. ASU 2016-01 is effective for fiscal years beginning after December 15, 2017 and interim periods within those fiscal years. Early adoption of the amendments is not permitted for public companies. The Company is currently evaluating the impact of adopting this standard on its consolidated financial statements.
In February 2016, FASB issued ASU No. 2016-02, Leases. ASU 2016-02 will require organizations to recognize lease assets and lease liabilities on the balance sheet, including leases that were previously classified as operating leases. The ASU will also require additional disclosures about leasing arrangements related to the amount, timing, and uncertainty of cash flows arising from leases. The amendments in this ASU are effective for financial statements issued for fiscal years beginning after December 15, 2018, and interim periods within those fiscal years. Early adoption of the amendments is permitted and the new guidance will be applied using a modified retrospective approach. The Company has begun its assessment of impact of this standard and plans to complete the assessment during the second half of 2017. The Company plans to early adopt the standard as of January 1, 2018.
In March 2016, FASB issued ASU No. 2016-05, Derivatives and Hedging (Topic 815): Effect of Derivative Contract Novations on Existing Hedge Accounting Relationships. ASU 2016-05 clarifies that a change in the counterparty to a derivative instrument that has been designated as a hedging instrument under Topic 815 does not, in and of itself, require de-designation of that hedging relationship provided that all other hedge accounting criteria continue to be met. ASU 2016-05 is effective for reporting periods beginning after December 15, 2016, and early adoption is permitted. The Company is currently evaluating the impact of adopting this standard on its consolidated financial statements.
In June 2016, FASB issued ASU No. 2016-13, Credit Losses, Measurement of Credit Losses on Financial Instruments. ASU 2016-13 introduces a new forward-looking “expected loss” approach, to estimate credit losses on most financial assets and certain other instruments, including trade receivables. The estimate of expected credit losses will require entities to incorporate considerations of historical information, current information, and reasonable and supportable forecasts. This ASU also expands the disclosure requirements regarding the entity’s assumptions, models and methods for estimating expected credit losses. Entities will apply the standard’s provisions as a cumulative-effect adjustment to retained earnings as of the beginning of the first reporting period in which the guidance is effective. ASU 2016-13 is effective for public entities for annual and interim periods beginning after December 15, 2019. Early adoption is permitted for all entities for annual periods beginning after December 15, 2018, and interim periods therein. The Company is currently evaluating the impact of adopting this standard on its consolidated financial statements.
In August 2016, FASB issued ASU No. 2016-15, Statement of Cash Flows (Topic 230) Classification of Certain Cash Receipts and Cash Payments, which provides guidance on reducing the diversity in how certain cash receipts and cash payments are presented and classified in the statement of cash flows. In addition to other specific cash flow issues, ASU 2016-15 provides clarification on when an entity should separate cash receipts and cash payments into more than one class of cash flows and when an entity should classify those cash receipts and payments into one class of cash flows on the basis of predominance. The new guidance is effective for the fiscal years beginning after December 15, 2017, and interim periods within those fiscal years. Early adoption is permitted including adoption in an interim period. The Company is currently evaluating the impact of adopting this standard on its consolidated financial statements.
In October 2016, FASB issued ASU No. 2016-16, Income Taxes (Topic 740) Intra-Entity Transfers of Assets Other Than Inventory, in an effort to reduce the cost and complexity, as well as improve the accounting for income tax consequences of intra-entity transfers of assets. Under current U.S. GAAP the recognition of current and deferred income taxes for an intra-entity asset transfer is prohibited until the asset has been sold to an outside party. ASU 2016-16 eliminates the requirement to delay recognition and allows an entity to recognize the income tax consequences when the transfer of an intra-entity asset other than inventory occurs. The new guidance is effective for the fiscal years beginning after December 15, 2017, and interim periods within those fiscal years. Early adoption is permitted as of the beginning of an annual reporting period for
87
which financial statements have not been issued. The Company will early adopt this guidance as of January 1, 2017.
In November 2016, FASB issued ASU No. 2016-18, Statement of Cash Flows (Topic 230) Restricted Cash, which will require that the statement of cash flows explain the change during the period in the total of cash, cash equivalents, and amounts generally described as restricted cash or restricted cash equivalents. Therefore, amounts generally described as restricted cash and restricted cash equivalents will be required to be included with cash and cash equivalents when reconciling the beginning-of-period and end-of-period total amounts shown on the statement of cash flows. ASU 2016-18 is effective for public business entities for fiscal years beginning after December 15, 2017, and interim periods within those fiscal years. Early adoption is permitted including adoption in an interim period. The Company is currently evaluating the impact of adopting this standard on its consolidated financial statements.
In January 2017, FASB issued ASU No. 2017-04, Intangibles - Goodwill and Other (Topic 350): Simplifying the Test for Goodwill Impairment, which eliminates the second step of the previous FASB guidance for testing goodwill for impairment and is intended to reduce cost and complexity of goodwill impairment testing. The amendments in this ASU modify the concept of impairment from the condition that exists when the carrying amount of goodwill exceeds its implied fair value to the condition that exists when the carrying amount of a reporting unit exceeds its fair value. After determining if the carrying amount of a reporting unit exceeds its fair value, the entity should take an impairment charge of the same amount to the goodwill for that reporting unit, not to exceed the total goodwill amount for that reporting unit. This eliminates the second step of calculating the implied fair value of goodwill by assigning the fair value of a reporting unit to all of its assets and liabilities as if that reporting unit had been acquired in a business combination. ASU 2017-04 is effective for annual periods beginning after December 15, 2019, including interim periods within those annual periods. Early adoption is permitted for interim or annual goodwill impairment tests performed on testing dates after January 1, 2017. The Company is currently evaluating the impact of adopting this standard on its consolidated financial statements.
2. Financial Statement Details
Accounts Receivable Billed, net
Accounts receivable, net of allowance for doubtful accounts, consisted of the following (in thousands):
December 31, 2016 | December 31, 2015 | ||||||
Accounts receivable, billed | $ | 217,360 | $ | 161,872 | |||
Less allowance for doubtful accounts | (5,884 | ) | (3,557 | ) | |||
Accounts receivable, billed, net | $ | 211,476 | $ | 158,315 | |||
The following table summarizes the changes in the allowance for doubtful accounts (in thousands):
Years Ended December 31, | |||||||||||
2016 | 2015 | 2014 | |||||||||
Balance at the beginning of the period | $ | (3,557 | ) | $ | (3,727 | ) | $ | (1,384 | ) | ||
Current year (provision) recovery | (2,570 | ) | 144 | (2,435 | ) | ||||||
Write-offs, net of recoveries | 243 | 26 | 92 | ||||||||
Balance at the end of the period | $ | (5,884 | ) | $ | (3,557 | ) | $ | (3,727 | ) | ||
88
Property and Equipment, net
Property and equipment, net of accumulated depreciation, consisted of the following (in thousands):
December 31, 2016 | December 31, 2015 | ||||||
Software | $ | 52,531 | $ | 33,087 | |||
Computer equipment | 26,311 | 23,764 | |||||
Leasehold improvements | 14,814 | 13,920 | |||||
Office furniture, fixtures, and equipment | 10,894 | 9,173 | |||||
Buildings and improvements | 4,004 | 4,597 | |||||
Assets not yet placed in service | 13,396 | 7,491 | |||||
121,950 | 92,032 | ||||||
Less accumulated depreciation | (63,644 | ) | (47,219 | ) | |||
Property and equipment, net | $ | 58,306 | $ | 44,813 | |||
During the first quarter of 2015, the Company observed deteriorating performance in its Phase I Services asset group and reporting unit due to reduced revenue resulting from cancellations and lower than expected new business awards, which triggered an evaluation of both long-lived assets and goodwill for potential impairment. In accordance with the authoritative guidance in ASC 360, Property, Plant and Equipment, impairment exists if the sum of the undiscounted expected future cash flows is less than the carrying amount of its related group of assets. If impairment exists, the impairment loss is measured and recorded based on the amount by which the carrying amount of the long-lived asset (asset group) exceeds its fair value. The indirect cost valuation approach was used to estimate the fair value. Under this valuation approach, the Company estimated the fair value by applying an index or trend factor to the historical cost. As a result of this evaluation, the Company recorded a long-lived asset impairment charge of $1.0 million associated with the Phase I Services reporting unit.
For the year ended December 31, 2016, the Company had property and equipment additions of $7.2 million that had not been paid and were included in the "Accounts payable" and "Accrued liabilities" line items on the consolidated balance sheet.
89
Goodwill and Intangible Assets
The changes in carrying amount of goodwill were as follows (in thousands):
Total | Clinical Development Services | Phase I Services | |||||||||
Balance at December 31, 2014: | |||||||||||
Gross goodwill | $ | 570,106 | $ | 561,964 | $ | 8,142 | |||||
Accumulated impairment losses | (13,243 | ) | (8,024 | ) | (5,219 | ) | |||||
Total goodwill and accumulated impairment losses | 556,863 | 553,940 | 2,923 | ||||||||
2015 Activity: | |||||||||||
Impairment of goodwill | (2,923 | ) | — | (2,923 | ) | ||||||
Impact of foreign currency translation and other | (932 | ) | (932 | ) | — | ||||||
Balance at December 31, 2015: | |||||||||||
Gross goodwill | 569,174 | 561,032 | 8,142 | ||||||||
Accumulated impairment losses | (16,166 | ) | (8,024 | ) | (8,142 | ) | |||||
Total goodwill and accumulated impairment losses | 553,008 | 553,008 | — | ||||||||
2016 Activity: | |||||||||||
Impact of foreign currency translation and other | (506 | ) | (506 | ) | — | ||||||
Balance at December 31, 2016: | |||||||||||
Gross goodwill | 568,668 | 560,526 | 8,142 | ||||||||
Accumulated impairment losses | (16,166 | ) | (8,024 | ) | (8,142 | ) | |||||
Total goodwill and accumulated impairment losses | $ | 552,502 | $ | 552,502 | $ | — | |||||
As discussed above, the deteriorating performance in the Company's Phase I Services asset group and reporting unit resulted in a triggering event requiring an evaluation of both long-lived assets and goodwill for potential impairment during 2015. There were no remaining intangible assets associated with Phase I Services, as of the date of this evaluation. As a result of this evaluation, the Company recorded a $2.9 million impairment of goodwill. In total, the Company recorded asset impairment charges of $3.9 million associated with the Phase I Services reporting unit related to long-lived assets and goodwill for the year ended December 31, 2015.
No goodwill or intangible asset impairment was recorded for the year ended December 31, 2016, as the fair value of the Clinical Development Services reporting unit was in excess of the carrying value. Accumulated impairment losses associated with the Clinical Development Services segment in the table above were recorded in prior periods and related specifically to Global Consulting, a component of the Clinical Development segment, prior to Global Consulting being included within the Clinical Development Services segment.
Intangible assets, net consisted of the following (in thousands):
December 31, 2016 | December 31, 2015 | ||||||||||||||||||||||
Gross | Accumulated Amortization | Net | Gross | Accumulated Amortization | Net | ||||||||||||||||||
Customer relationships — finite-lived | $ | 267,703 | $ | (188,217 | ) | $ | 79,486 | $ | 267,720 | $ | (150,380 | ) | $ | 117,340 | |||||||||
Trademarks — INC — indefinite-lived | 35,000 | — | 35,000 | 35,000 | — | 35,000 | |||||||||||||||||
Intangible assets, net | $ | 302,703 | $ | (188,217 | ) | $ | 114,486 | $ | 302,720 | $ | (150,380 | ) | $ | 152,340 | |||||||||
90
The identifiable intangible assets are amortized over their estimated useful lives. The future estimated amortization expense for intangible assets is expected to be as follows (in thousands):
Fiscal Year Ending: | |||
2017 | $ | 28,442 | |
2018 | 19,059 | ||
2019 | 19,059 | ||
2020 | 12,765 | ||
2021 | 161 | ||
2022 and thereafter | — | ||
Total | $ | 79,486 | |
Accrued Liabilities and Other Long-Term Liabilities
Accrued liabilities consisted of the following (in thousands):
December 31, 2016 | December 31, 2015 | ||||||
Compensation, including bonuses, fringe benefits, and payroll taxes | $ | 77,049 | $ | 71,013 | |||
Accrued interest | 72 | 368 | |||||
Accrued taxes | 1,072 | 4,202 | |||||
Accrued rebates to customers | 13,580 | 11,370 | |||||
Accrued professional and investigator fees | 26,518 | 5,190 | |||||
Accrued restructuring costs, CEO transition and other costs, current portion | 6,084 | 2,230 | |||||
Other liabilities | 29,184 | 16,889 | |||||
Total accrued liabilities | $ | 153,559 | $ | 111,262 | |||
Other long-term liabilities consisted of the following (in thousands):
December 31, 2016 | December 31, 2015 | ||||||
Uncertain tax positions | $ | 14,813 | $ | 9,354 | |||
Accrued restructuring costs, CEO transition and other costs, less current portion | 2,508 | 2,496 | |||||
Other liabilities | 8,842 | 7,242 | |||||
Total other long-term liabilities | $ | 26,163 | $ | 19,092 | |||
Accumulated other comprehensive loss, net of taxes
Accumulated other comprehensive loss, net of taxes consisted of the following (in thousands):
December 31, 2016 | December 31, 2015 | ||||||
Foreign currency translation loss | $ | (43,356 | ) | $ | (41,543 | ) | |
Unrealized gain on derivative instruments, net of taxes | 1,106 | — | |||||
Accumulated other comprehensive loss, net of taxes | $ | (42,250 | ) | $ | (41,543 | ) | |
91
The following table summarizes the changes in accumulated other comprehensive loss, net of taxes by component for the year ended December 31, 2016:
Unrealized gain on derivative instruments, net of taxes | Foreign currency translation adjustments, net of taxes | Total | |||||||||
Balance at December 31, 2015 | $ | — | $ | (41,543 | ) | $ | (41,543 | ) | |||
Other comprehensive gain (loss), net of taxes before reclassifications | 901 | (1,813 | ) | (912 | ) | ||||||
Amount of gain reclassified from accumulated other comprehensive loss into the Statement of Operations | 205 | — | 205 | ||||||||
Net current-period other comprehensive gain (loss), net of taxes | 1,106 | (1,813 | ) | (707 | ) | ||||||
Balance at December 31, 2016 | $ | 1,106 | $ | (43,356 | ) | $ | (42,250 | ) | |||
Amounts reported in accumulated other comprehensive loss related to derivatives will be reclassified to interest expense as interest payments are made on the Company’s term loan. Amounts to be reclassified as an increase to interest expense in the next 12 months are immaterial.
Other (Expense) Income, Net
Other (expense) income, net consisted of the following (in thousands):
December 31, 2016 | December 31, 2015 | December 31, 2014 | |||||||||
Net realized foreign currency gain | $ | 12,357 | $ | 2,237 | $ | 124 | |||||
Net unrealized foreign currency (loss) gain | (20,681 | ) | 795 | 7,390 | |||||||
Other, net | (678 | ) | 825 | 175 | |||||||
Total other (expense) income, net | $ | (9,002 | ) | $ | 3,857 | $ | 7,689 | ||||
3. Business Combinations
Acquisition of MEK Consulting
On March 5, 2014, the Company acquired stock and assets of MEK Consulting, consisting of MEK Consulting Egypt Ltd., MEK Consulting Danismanlik Ltd. Sti., MEK Consulting Hellas EPE and MEK Consulting SARL (MEK Consulting), collectively referred to as MEK. MEK is a full service CRO with operations in Egypt, Greece, Jordan, Lebanon and Turkey. The aggregate purchase price for the acquisition totaled $4.0 million, which consisted of (i) $3.0 million cash, of which $0.5 million was placed in escrow for the one-year period following the closing date for the satisfaction of potential indemnification claims, and (ii) $1.0 million contingent consideration, payable, if earned, during the one-year period following the closing date. In addition, the purchase agreement included provisions of $2.0 million for retention payments to certain key employees that will be accounted for as compensation expense and expensed as earned during the three-year period following the closing date. As a result of this transaction, the Company acquired net identifiable assets of $1.6 million and goodwill of $2.3 million.
During the second quarter of 2015, the Company finalized the amount of the contingent consideration based on the achievement of the pre-agreed targets. The final contingent consideration totaled $0.8 million and, as a result, the Company released $0.2 million of accrued liabilities. The reduction in the contingent consideration was recorded in the "Other (expense) income, net" line item in the consolidated statements of operations. Additionally, the Company paid the former owners of MEK the $0.5 million of cash previously withheld to cover potential indemnification claims.
As of December 31, 2016, the Company recognized all of the contingent compensation expense for the successful retention of operational staff and certain key employees associated with the MEK acquisition,
92
including $0.5 million and $0.6 million in the years ended December 31, 2016 and 2015, respectively. This contingent consideration is included as compensation expense within "Direct costs" line item in the consolidated statements of operations.
4. Debt and Leases
Credit Agreement
In May 2015, the Company entered into a five-year $675.0 million credit agreement ("2015 Credit Agreement") which was comprised of a $525.0 million term loan A and a $150.0 million revolving line of credit. As of December 31, 2015, $475.0 million was outstanding on the Term Loan ("Term Loan"), bearing interest at 2.16%, and $30.0 million was outstanding on the revolving line of credit ("Revolver"), bearing interest at 4.25%.
In August 2016, the Company entered into the First Amendment to Credit Agreement and Increase Revolving Joinder (the “First Amendment”), which amended the 2015 Credit Agreement (as amended, the "Credit Agreement").The First Amendment, (i) extended the maturity date of the Term Loan and Revolver under the Credit Agreement to August 31, 2021, (ii) increased the available borrowing capacity under the Revolver from $150.0 million to $200.0 million, and (iii) reduced the interest rate margins on the Term Loan and the Revolver, as well as certain fees. The five-year $675.0 million Credit Agreement is comprised of a $475.0 million Term Loan and a $200.0 million Revolver. All obligations under the Credit Agreement are guaranteed by the Company and certain of the Company's direct and indirect wholly-owned domestic subsidiaries. The obligations under the Credit Agreement are secured by substantially all of the assets of the Company and the guarantors.
As of December 31, 2016, $475.0 million was outstanding on the Term Loan. The Company is not required to make principal payments on the Term Loan until September 30, 2017. From September 30, 2017 through June 30, 2021, the Term Loan has scheduled quarterly principal payments of the initial principal borrowed of 1.25%, or $5.9 million per quarter in year 2; 1.875%, or $8.9 million per quarter in years 3 and 4; and 2.50%, or $11.9 million per quarter in year 5; with the remaining outstanding principal due on August 31, 2021.
The Credit Agreement provides Eurodollar Rate and Base Rate term loans. Eurodollar Rate term loans are one-, two-, three-, or six-month loans (or, with permission, twelve-month) and interest is due on the last day of each three-month period of the loans. Base Rate term loans have interest due the last day of each calendar quarter-end. In advance of the last day of the then-current type of loan, the Company may select a new type of loan, so long as it does not extend beyond August 31, 2021.
The Revolver includes letters of credit ("LOCs") and swingline loans available in an amount not to exceed $15.0 million each. Fees are charged on all outstanding LOCs at an annual rate equal to the margin in effect on Eurodollar Rate revolving loans plus fronting fees. The fee is payable quarterly in arrears on the last day of the calendar quarter after the issuance date until the underlying LOC expires. As of December 31, 2016, there were $25.0 million in revolver borrowings, $0.7 million of LOCs, and no swingline loans outstanding, leaving $174.3 million in available borrowings under the Revolver.
The Term Loan and the Revolver bear interest at a rate per annum equal to an applicable margin plus, at the Borrower's option, either: (i) a base rate determined by reference to the highest of: (a) the Prime Rate in effect on such date, (b) the Federal Funds Effective Rate in effect on such day plus 1/2 of 1.00%; and (c) the sum of (1) the Eurodollar Rate that would be payable on such day for the Eurodollar Rate Loan with a one-month interest period, and (2) 1.00%; or (ii) a LIBOR rate determined by reference to the costs of funds for Eurodollar deposits for the interest period relevant to such borrowing adjusted for certain reserve requirements (Eurodollar Rate).
The applicable margin with respect to Base Rate is between 0.25% and 1.00% and the applicable margin with respect to the Eurodollar Rate borrowings is between 1.25% and 2.00% depending on the "Secured Net Leverage Ratio" (as defined in the Credit Agreement). The Company also pays a quarterly Commitment Fee between 0.20% and 0.35% on the average daily unused balance of the Revolver depending on the Secured Net Leverage Ratio at the adjustment date. As of December 31, 2016, the interest rate on the Term Loan and the Revolver was 2.11%.
93
The Credit Agreement permits the Borrower to increase Term Loan or Revolver commitments under the term loan facility and/or revolving credit facility and/or to request the establishment of one or more new term loan facilities and/or revolving facilities in an aggregate amount not to exceed $175.0 million if certain net leverage requirements are met. The availability of such additional capacity is subject to, among other things, receipt of commitments from existing lenders or other financial institutions.
The Company's maturities of obligations under the Credit Agreement for the years following December 31, 2016, are as follows (in thousands):
2017 | $ | 11,875 | |
2018 | 29,688 | ||
2019 | 35,625 | ||
2020 | 41,562 | ||
2021 | 381,250 | ||
Deferred issuance costs | (2,276 | ) | |
Total long-term debt | 497,724 | ||
Less current portion | (11,875 | ) | |
Total long-term debt, less current portion | $ | 485,849 | |
Debt Covenants
The Credit Agreement contains usual and customary restrictive covenants that, among other things, place limitations on the Company's ability to pay dividends or make other restricted payments; prepay, redeem or purchase debt; incur liens; make loans and investments; incur additional indebtedness; amend or otherwise alter debt and other material documents; make acquisitions and dispose of assets; transact with affiliates; and engage in businesses that are not related to the Company's existing business.
In addition, the Credit Agreement contains financial covenants that require the Company to maintain a minimum Secured Net Leverage Ratio and Interest Coverage Ratio as of the last day of any four consecutive fiscal quarters. The Secured Net Leverage ratio is calculated as a relationship between the level of secured outstanding borrowings and Consolidated EBITDA. The Interest Coverage ratio is calculated as a relationship between consolidated EBITDA and consolidated interest expense paid or payable. These covenants require the Company to maintain a Secured Leverage Ratio of no more than 4 to 1 and an Interest Coverage Ratio of no less than 3 to 1. The Company was in compliance with its debt covenants during the years ended December 2016, 2015 and 2014.
Debt extinguishment costs
In August 2016, the Company entered into the First Amendment which amended the 2015 Credit Agreement, as discussed above. In conjunction with this amendment, the Company recognized a loss on extinguishment of debt of $0.4 million.
In May 2015, the Company entered into the 2015 Credit Agreement and used the proceeds to repay all of its outstanding obligations under the 2014 Credit Agreement and to pay transaction costs associated with the Credit Agreement. As a result, the Company recognized a $9.4 million loss on extinguishment of debt related to the 2014 Credit Agreement, which was comprised of $5.1 million of unamortized discount and $4.3 million of unamortized debt issuance costs. In addition, in June 2015 the Company made a prepayment of $50.0 million under the 2015 Credit Agreement and as a result recognized an additional loss on extinguishment of debt of $0.4 million.
The 2014 Credit Agreement was comprised of a $425.0 million term loan B, a $100.0 million revolving line of credit, and a letter of credit and swingline facilities. The 2014 Credit Agreement bore interest at approximately 4.5% during 2015 prior to repayment.
94
Debt Issuance Costs
The Company recorded debt issuance costs related to its Term Loan of approximately $2.3 million and $2.9 million as of December 31, 2016 and 2015, respectively. These costs were recorded as a reduction of the principal balance of the associated debt and are being amortized as a component of interest expense using the effective interest method over the term of the Term Loan.
The Company recorded total debt issuance costs related to its revolving line of credit of approximately $1.0 million as of December 31, 2016 and 2015, respectively. Debt issuance costs associated with the revolver are included in other assets in the consolidated balance sheets. The debt issuance costs are amortized as a component of interest expense using the effective interest method over the term of the Revolver.
Leases
The Company leases its office facilities under operating lease agreements that expire in various years through 2022 and records rent expense related to the leases on a straight-line basis over the term of the lease. Facilities rent expense was $20.7 million, $18.3 million and $21.2 million, for the years ended December 31, 2016, 2015 and 2014, respectively.
Lease payments are subject to increases as specified in the lease agreements. Future minimum lease payments, by year and in the aggregate, under noncancellable operating leases as of December 31, 2016, were as follows (in thousands):
Operating Leases | |||
2017 | $ | 19,506 | |
2018 | 15,714 | ||
2019 | 8,776 | ||
2020 | 5,406 | ||
2021 | 4,100 | ||
2022 and thereafter | 1,871 | ||
Total minimum payments | $ | 55,373 | |
No particular lease obligations rank senior in right of payment to any other. There were no capital lease obligations as of December 31, 2016 or 2015.
The Company has a lease agreement for its corporate headquarters in Raleigh, North Carolina, that extends through February of 2019. The Company can exit the lease in February 2018, with payment of a $0.8 million termination fee. In January 2017, the Company entered into a 12-year lease for a new corporate headquarters in Morrisville, North Carolina, where it intends to relocate all employees currently housed in its two existing Raleigh locations. The Company expects the new building to be completed in mid-2018 to accommodate a phased move coinciding with the expiration of its existing leases. Additionally, in February 2017, the Company entered into a new 11-year lease agreement for new space in a nearby location as the lease for its Camberley, United Kingdom location expires in 2018. In total, the Company expects to incur lease payments of $85.0 million over the lives of these agreements, beginning in July 2018.
95
5. Derivatives
In May 2016, the Company entered into interest rate swaps with a combined notional value of $300.0 million in an effort to limit its exposure to variable interest rates on its Term Loan. Interest began accruing on the swaps on June 30, 2016 and the interest rate swaps will expire on June 30, 2018 and May 14, 2020. The material terms of these derivatives are substantially the same as those contained within the Credit Agreement, including monthly settlements with the swap counterparty.
The fair values of the Company’s interest rate swaps designated as hedging instruments and the line items on the accompanying consolidated balance sheets to which they were recorded are as follows (in thousands):
Balance Sheet Classification | December 31, 2016 | December 31, 2015 | |||||||
Interest rate swaps - current | Prepaid expenses and other current assets | $ | 461 | $ | — | ||||
Interest rate swaps - non-current | Other long-term assets | $ | 1,717 | $ | — | ||||
During the year ended December 31, 2016, the Company recorded $0.4 million of pre-tax losses associated with the ineffective portion of the derivative instruments in the "Interest expense" line item of the accompanying consolidated statements of operations. The hedge ineffectiveness is attributable to inconsistencies in certain terms between the interest rate swaps and its Credit Agreement.
6. Fair Value Measurements
At December 31, 2016 and 2015, the Company's financial instruments included cash and cash equivalents, restricted cash, accounts receivable, account payable, accrued liabilities, debt and interest rate swaps. The fair value of the Company's cash and cash equivalents, restricted cash, accounts receivable, accounts payable and accrued liabilities approximate their respective carrying amounts based on the liquidity and short-term nature of these instruments.
The fair value of the Company's debt is determined based on market prices for identical or similar financial instruments or model-derived valuations based on observable inputs and falls under Level 2 of the fair value hierarchy as defined in the authoritative guidance in ASC 820, Fair Value Measurement. The estimated fair value of the Company's long-term debt and revolver was $500.0 million and $505.0 million at December 31, 2016 and 2015, respectively.
Recurring Fair Value Measurements
Currently, the Company uses interest rate swaps to manage its risk related to variable interest rates on its Term Loan. The fair value of interest rate swaps is determined using the market standard methodology of discounted future variable cash receipts. The variable cash receipts are determined by discounting the future expected cash receipts that would occur if variable interest rates rise above the fixed rate of the swaps. The variable interest rates used in the calculation of projected receipts on the swap are based on an expectation of future interest rates derived from observable market interest rate curves and volatilities. At December 31, 2016, the fair value of the interest rate swaps was approximately $2.2 million. These derivatives were identified as Level 2 assets and recorded in "Prepaid expenses and other current assets" and "Other long-term assets" on the accompanying consolidated balance sheets. The Company did not have any recurring assets or liabilities requiring fair value measurements at December 31, 2015.
The Company did not have any recurring fair value measurements using significant unobservable inputs (Level 3) as of December 31, 2016 or 2015. There were no transfers between Level 1, Level 2 or Level 3 during the year ended December 31, 2016.
96
Non-Recurring Fair Value Measurements
Certain assets, including goodwill and identifiable intangibles, are carried on the accompanying consolidated balance sheets at cost and are not remeasured to fair value on a recurring basis. These assets are tested for impairment annually and when a triggering event occurs. During 2015, the Company recognized approximately $2.9 million of impairment related to goodwill, as discussed in "Note 2 - Financial Statement Details". As of December 31, 2016 and 2015, assets carried on the balance sheet and not remeasured to fair value on a recurring basis totaled $667.0 million and $705.3 million, respectively.
7. Restructuring, CEO Transition and Other Costs
2014 Realignment Plan
During 2014, the Company initiated restructuring activities worldwide, primarily related to the closure of its Glasgow facility and partial closure of its Cincinnati facility, which was initiated during the second quarter of 2014. The Company incurred $2.7 million of severance costs and $3.4 million in facility closure expenses related to these restructuring activities. Actions under this plan were completed by December 31, 2014.
2015 Realignment Plan
During the second and fourth quarters of 2015, the Company initiated restructuring activities to better align its resources worldwide. Specifically, the Company initiated a plan to reduce its workforce by approximately 70 employees, primarily in the United States and certain countries in Europe primarily within clinical operations, principally within the Clinical Development Services operations group and several corporate administrative functions. The Company completed the majority of these actions by December 31, 2015. Under this plan, the Company incurred $2.7 million of severance costs related to these activities during 2015.
For the year ended December 31, 2015, the Company recorded a net reduction in facility closure expenses of $0.9 million. During the year, the Company reversed previously accrued liabilities as a result of completing negotiations with respect to exiting certain facilities and reduced its exit cost estimates related to certain lease agreements as a result of subleasing a portion of facilities previously exited along with the return of a tenant improvement allowance. These adjustments were partially offset by expenses related to early lease termination fees and accruals for closure of smaller locations as the Company continues to optimize its facilities portfolio.
2016 Realignment Plan and CEO Transition
In March 2016, management approved a global plan to eliminate certain positions worldwide in an effort to ensure that the Company's organizational focus and resources were properly aligned with its strategic goals and to continue strengthening the delivery of its growing backlog to customers. Accordingly, the Company made changes to its therapeutic unit structure designed to realign with management focus and optimize the efficiency of its resourcing to achieve its strategic plan. As a result, the Company eliminated approximately 200 positions and incurred $7.0 million related to employee severance costs during the year ended December 31, 2016. The Company has completed substantially all actions, and anticipates making all remaining payments to affected employees during 2017. During the third quarter of 2016, the Company also announced the closure of one of its facilities associated with this restructuring and incurred facility closure costs of $1.5 million, which were partially offset by unamortized deferred rent of $0.5 million during the year ended December 31, 2016.
In July 2016, the Company entered into a transition agreement with its former Chief Executive Officer ("CEO") related to the transition to a new CEO as of October 1, 2016. The CEO transition agreement is effective through February 28, 2017. In addition, in mid-September 2016, the Company entered into retention agreements with certain key employees for various dates through September 2017. For the year ended December 31, 2016, the Company recognized $4.8 million of costs associated with the CEO transition and retention agreements, which will be paid through August 2018.
The costs related to all plans are included in "Restructuring, CEO transition and other costs" line item in the consolidated statements of operations. Restructuring costs are not allocated to the Company’s reportable
97
segments because they are not part of the segment performance measures regularly reviewed by management. During the years ended December 31, 2016, 2015 and 2014 the Company made payments and provision adjustments for all plans as presented below (in thousands):
Employee Severance Costs, Including Executive Transition Costs | Facility Closure Charges | Other Charges | Total | ||||||||||||
Balance at December 31, 2013 | $ | — | $ | 5,537 | $ | 485 | $ | 6,022 | |||||||
Expenses incurred | 2,716 | 3,445 | 31 | 6,192 | |||||||||||
Payments made | (2,716 | ) | (2,838 | ) | (516 | ) | (6,070 | ) | |||||||
Balance at December 31, 2014 | — | 6,144 | — | 6,144 | |||||||||||
Expenses incurred | 2,666 | (881 | ) | — | 1,785 | ||||||||||
Payments made | (1,601 | ) | (1,602 | ) | — | (3,203 | ) | ||||||||
Balance at December 31, 2015 | 1,065 | 3,661 | — | 4,726 | |||||||||||
Expenses incurred | 11,765 | 987 | 860 | 13,612 | |||||||||||
Reclassification of deferred rent | — | 507 | — | 507 | |||||||||||
Payments made | (8,135 | ) | (1,338 | ) | (780 | ) | (10,253 | ) | |||||||
Balance at December 31, 2016 | $ | 4,695 | $ | 3,817 | $ | 80 | $ | 8,592 | |||||||
8. Shareholders' Equity
Initial Public Offering
On November 7, 2014, the Company completed its IPO of its common stock at a price to the public of $18.50 per share and the Company’s common stock began trading on the NASDAQ under the symbol “INCR”. The Company issued and sold 9,324,324 shares of common stock in the IPO, including 1,216,216 shares that were offered and sold pursuant to the underwriters’ exercise in full of its option to purchase additional shares. The IPO raised proceeds to the Company of approximately $156.1 million, after deducting underwriting discounts, commissions and related expenses.
Stock Repurchases and Secondary Offerings
In May 2015, the Company repurchased 5,053,482 shares of its Class A common stock pursuant to an agreement with investment funds affiliated with its former private equity Sponsors, Avista Capital Partners, L.P. ("Avista") and Ontario Teachers' Pension Plan Board ("OTPP"), in a private transaction at a price of approximately $29.68 per share, resulting in a total purchase price of approximately $150.0 million. In conjunction with this transaction, the Company's former Sponsors and certain other shareholders sold at the same price in a registered secondary common stock offering 8,050,000 shares of the Company's common stock, including 1,050,000 shares that were offered and sold pursuant to the underwriters' exercise in full of its option to purchase additional shares. Immediately following this transaction, OTPP, which was the only holder of Class B common stock, elected to convert 6,866,555 Class B shares into Class A shares on the pre-established one-for-one basis. The Company immediately retired all of the repurchased common stock and charged the par value of the shares to common stock. The excess of the repurchase price over par was applied on a pro rata basis against additional paid-in-capital, with the remainder applied to accumulated deficit.
In August 2015, the Company's former Sponsors and certain other shareholders sold 8,000,000 shares of the Company's Class A common stock in a registered secondary common stock offering. Immediately following this transaction, OTPP elected to convert all outstanding Class B shares into Class A shares on the pre-established one-for-one basis.
98
In December 2015, the Company repurchased 3,000,000 shares of its Class A common stock pursuant to an agreement with investment funds affiliated with its former Sponsors, Avista and OTPP, in a private transaction at a price of $45.00 per share, resulting in a total purchase price of approximately $135.0 million. In conjunction with this transaction, the Company's former Sponsors sold at the same price in a registered secondary common stock offering 6,000,000 shares of the Company's common stock. The Company immediately retired all of the repurchased common stock and charged the par value of the shares to common stock. The excess of the repurchase price over par was applied on a pro rata basis against additional paid-in-capital, with the remainder applied to accumulated deficit.
In May 2016, the Company's former Sponsors sold 8,000,000 shares of the Company's Class A common stock in a registered secondary common stock offering.
In July 2016, the Board approved a $150.0 million repurchase program for shares of the Company’s common stock in open market transactions effected through a broker-dealer at prevailing market prices, in block trades, or in privately negotiated transactions. Under this program, the Company may repurchase shares of its common stock pursuant to a trading plan meeting the requirements of Rule 10b5-1 under the Securities Exchange Act of 1934, as amended, which would permit shares of the Company’s common stock to be repurchased when the Company might otherwise be precluded from doing so by law. The program will end no later than December 31, 2017. The stock repurchase program does not obligate the Company to repurchase any particular amount of common stock, and it could be modified, suspended or discontinued at any time. The timing and amount of repurchases will be determined by the Company’s management based on a variety of factors such as the market price of the Company’s common stock, the Company’s liquidity requirements, and overall market conditions. The stock repurchase program will be subject to applicable legal requirements, including federal and state securities laws.
In August 2016, the Company's former Sponsors completed a secondary stock offering for 4,500,000 shares of the Company's common stock. In conjunction with this secondary stock offering, the Company repurchased 1,500,000 shares of its common stock from Avista and OTPP in a private transaction at a price of $43.00 per share, resulting in a total purchase price of approximately $64.5 million. The Company immediately retired all of the repurchased common stock and charged the par value of the shares to common stock. The excess of the repurchase price over par was applied on a pro rata basis against additional paid-in-capital, with the remainder applied to accumulated deficit.
As of December 31, 2016, the Company had remaining authorization to repurchase up to $85.5 million of shares of the Company's common stock under the stock repurchase program.
The following is a summary of the Company's authorized, issued and outstanding shares:
As of December 31, | |||||
2016 | 2015 | ||||
Shares Authorized: | |||||
Class A common stock | 300,000,000 | 300,000,000 | |||
Class B common stock | 300,000,000 | 300,000,000 | |||
Preferred stock | 30,000,000 | 30,000,000 | |||
Total shares authorized | 630,000,000 | 630,000,000 | |||
Shares Issued and Outstanding: | |||||
Class A common stock | 53,762,786 | 53,871,484 | |||
Class B common stock | — | — | |||
Preferred stock | — | — | |||
Total shares issued and outstanding | 53,762,786 | 53,871,484 | |||
Voting Rights and Conversion Rights of the Common Stock
Each share of Class A common stock is entitled to one vote on all matters to be voted on by the shareholders of the Company, including the election of directors. Each share of Class B common stock is entitled to one
99
vote on all matters to be voted on by the shareholders of the Company, except for the right to vote in the election of directors. Additionally, each share of Class B common stock is convertible (on a one-for-one basis) into Class A common stock at any time at the election of the holder.
Dividend Rights and Preferences of the Common Stock
The holders of Class A and Class B common stock are entitled to dividends on a pro rata basis at such time and in such amounts as, if and when declared by the Board.
There were no dividends paid during either of the years ended December 31, 2016 and 2015. Special dividends of $0.4 million were paid to the shareholder of the one share of Class C common stock issued and outstanding during the year ended December 31, 2014.
Liquidation Rights and Preferences of the Common Stock
The holders of Class A and Class B common stock are entitled to participate on a pro rata basis in all distributions made in connection with a voluntary or involuntary liquidation, dissolution or winding up of the affairs of the Company.
9. Share-Based Compensation
Overview of Employee Share-Based Compensation Plans
The Company currently has two equity-based compensation plans, the INC Research Holdings, Inc. 2014 Equity Incentive Plan ("2014 Plan") and the INC Research Holdings, Inc. 2016 Employee Stock Purchase Plan ("ESPP"), from which share-based awards are currently granted. In addition, the Company had the INC Research Holdings, Inc. 2010 Equity Incentive Plan ("2010 Plan") that was terminated effective October 30, 2014, except as to outstanding awards. No further awards can be issued under the 2010 Plan. The 2014 Plan was established on November 3, 2014 and permits granting of stock options, stock appreciation rights, restricted stock awards, restricted stock units ("RSUs"), cash performance awards or stock awards to employees, as well as non-employee directors and consultants. The terms of equity-based instruments granted are determined at the time of grant and are typically subject to such conditions as continued employment, passage of time and/or satisfaction of performance criteria. Stock options and RSUs typically vest ratably over three-year to five-year periods from the grant date. The Board and the Compensation Committee have the discretion to determine different vesting schedules. Stock options have a maximum term of ten years. The exercise price per share of stock options may not be less than the fair market value of a share of the Company's common stock on the date of grant. Upon the exercise of stock options or vesting of RSUs, the Company issues new shares of common stock.
As of December 31, 2016, the Company had equity grants outstanding under both the 2010 Plan and 2014 Plan. The maximum number of shares reserved for issuance under the Plans was 8,437,325, of which 3,158,308 shares were available for future grants as of December 31, 2016. In addition, under the 2014 Plan outstanding stock award or stock option grants forfeited prior to vesting or exercise become available for future grants.
In March 2016, the Board approved the ESPP, which was also approved by the Company’s shareholders in May 2016. The ESPP allows eligible employees to authorize payroll deductions of up to 10% of their base salary or wages to be applied toward the purchase of full shares of the Company’s common stock on the last trading day of the offering period. Participating employees will purchase shares of the Company's common stock at a 15% discount to the lesser of the closing price of the Company's common stock on the NASDAQ (i) on the first day of the period or (ii) the last trading day of each offering period. Offering periods under the ESPP are six months in duration, and the first offering period began on September 1, 2016. Under this plan, the Company recognized share-based compensation expense of $0.5 million for the year ended December 31, 2016. As of December 31, 2016, there were 1,000,000 shares reserved for future issuance under the ESPP.
100
Stock Option Awards
The following table sets forth the summary of option activity under our Plans for the year ended December 31, 2016:
Number of Options | Weighted Average Exercise Price | Weighted Average Remaining Contractual Life (in years) | Aggregate Intrinsic Value (in thousands) | |||||||||
Outstanding at December 31, 2015 | 3,421,425 | $ | 15.75 | |||||||||
Granted | 395,548 | 42.90 | ||||||||||
Exercised | (1,357,156 | ) | 11.78 | |||||||||
Forfeited | (288,492 | ) | 23.44 | |||||||||
Expired | (1,090 | ) | 43.16 | |||||||||
Outstanding at December 31, 2016 | 2,170,235 | $ | 22.15 | 7.00 | $ | 66,079 | ||||||
Vested and expected to vest at December 31, 2016 | 2,170,235 | $ | 22.15 | 7.00 | $ | 66,079 | ||||||
Exercisable at December 31, 2016 | 741,874 | $ | 14.61 | 5.94 | $ | 28,185 | ||||||
The aggregate intrinsic value in the table above represents the total pretax intrinsic value (i.e., the aggregate difference between the closing price of our common stock on December 31, 2016 of $52.60 and the exercise price for in-the-money options) that would have been received by the holders if all instruments had been exercised on December 31, 2016. As of December 31, 2016, there was $10.9 million of unrecognized compensation expense related to non-vested stock options, which is expected to be recognized over a weighted average period of 2.4 years.
Other information pertaining to the Company's stock option awards is as follows (in thousands, except per share data):
Years Ended December 31, | |||||||||||
2016 | 2015 | 2014 | |||||||||
Weighted average grant date fair value of options granted | $ | 14.26 | $ | 13.80 | $ | 5.59 | |||||
Total intrinsic value of options exercised | $ | 45,126 | $ | 27,560 | $ | 133 | |||||
The Company recorded a receivable of $2.0 million from the Company's brokerage services provider associated with certain stock option exercises, which was included in the "Prepaid expenses and other current assets" line item on the accompanying consolidated balance sheet as of December 31, 2015. The full amount was received in January 2016.
2014 Options Modification
On October 3, 2014, the Board unanimously adopted a resolution to modify all performance-based options granted and still outstanding under the 2010 Plan and Nonqualified Stock Option Award Agreements, contingent on a successful IPO. The terms of all options with performance-based conditions were revised such that the options would continue to vest over the same five-year period and would maintain their original terms, except for the performance criteria, which was removed as a vesting condition. This modification in terms of the awards resulted in Type I Probable-to-Probable modification, where the expectation that the award will ultimately vest remains as probable. In total, stock option awards held by 53 employees to purchase in aggregate 1,543,525 shares of common stock were modified. Because all of the options from the original unvested awards were expected to vest and no terms affecting valuation of options were modified, fair value of these options did not change and no incremental compensation expense was recognized as a result of this modification.
101
Restricted Stock Units Awards
The following table sets forth a summary of RSUs outstanding under the 2014 Plan as of December 31, 2016 and changes during the year then ended:
Number of RSUs | Weighted Average Grant Date Fair Value | |||||
Non-vested at December 31, 2015 | 225,110 | $ | 41.67 | |||
Granted | 681,973 | 42.95 | ||||
Vested | (59,537 | ) | 41.52 | |||
Forfeited | (138,851 | ) | 42.51 | |||
Non-vested at December 31, 2016 | 708,695 | $ | 42.76 | |||
At December 31, 2016, there was $22.6 million of unrecognized compensation expense related to unvested RSUs, which is expected to be recognized over a weighted average period of 2.5 years.
Performance Based Awards
In January 2016, the Board and Compensation Committee granted the executive officers performance-based RSUs (“PRSUs”) for up to a maximum of 144,900 shares of common stock. These performance-based grants are subject to the Company's performance in fiscal years 2016, 2017 and 2018 and will not be distributed until after the 2018 Annual Report on Form 10-K is filed. These awards are included in the table above. Vesting is contingent upon continued employment and the Company meeting adjusted earnings per share performance goals in each of the three years. The related share-based compensation expense is determined based on the value of the underlying shares on the date of grant and is recognized over the vesting term, with a maximum of one-third of the potential awards earned in each year the targets are met. During the interim financial periods, management estimates the number of PRSUs that are probable to vest until the achievement of the performance goals is known. Based on the 2016 target achievement, 18,868 shares are eligible to vest contingent upon the employment conditions discussed above.
Share-based Compensation Expense
Total share-based compensation expense recognized was as follows (in thousands):
Years Ended December 31, | |||||||||||
2016 | 2015 | 2014 | |||||||||
Direct Costs | $ | 6,551 | $ | 2,282 | $ | 1,371 | |||||
Selling, general, and administrative | 7,469 | 2,792 | 1,999 | ||||||||
Total share-based compensation expense | $ | 14,020 | $ | 5,074 | $ | 3,370 | |||||
The total income tax benefit recognized in the consolidated statements of operations for share-based compensation arrangements was approximately $4.7 million and $1.6 million for the years ended December 31, 2016 and 2015, respectively. There was no income tax benefit recognized in the consolidated statements of operations for share-based compensation for the year ended December 31, 2014.
102
Assumptions used in Valuation Model
The fair value of options was determined using the Black-Scholes valuation model and used the following assumptions:
Years Ended December 31, | |||||
2016 | 2015 | 2014 | |||
Expected volatility of the Company's stock | 29.4% - 30.9% | 30.5% - 32.8% | 30.0% - 34.8% | ||
Risk-free interest rate | 1.17% - 1.88% | 1.38% - 1.88% | 1.7% - 2.5% | ||
Expected life of option (in years) | 6.25 | 6 | 5 - 7.6 | ||
Expected dividend yield on the Company's stock | —% | —% | —% | ||
10. Income Taxes
The components of income (loss) before provision for income taxes were as follows (in thousands):
Years Ended December 31, | |||||||||||
2016 | 2015 | 2014 | |||||||||
Domestic | $ | 53,613 | $ | 61,392 | $ | (75,000 | ) | ||||
Foreign | 80,505 | 69,582 | 46,796 | ||||||||
Income (loss) before provision for income taxes | $ | 134,118 | $ | 130,974 | $ | (28,204 | ) | ||||
The components of income tax (expense) benefit were as follows (in thousands):
Years Ended December 31, | |||||||||||
2016 | 2015 | 2014 | |||||||||
Federal income taxes: | |||||||||||
Current | $ | (30,247 | ) | $ | (3,563 | ) | $ | (400 | ) | ||
Deferred | 16,936 | (3,600 | ) | 1,059 | |||||||
Foreign income taxes: | |||||||||||
Current | (10,347 | ) | (5,805 | ) | (9,060 | ) | |||||
Deferred | 5,178 | (4,314 | ) | 13,892 | |||||||
State income taxes: | |||||||||||
Current | (3,154 | ) | (425 | ) | (643 | ) | |||||
Deferred | 146 | 3,780 | (114 | ) | |||||||
Income tax (expense) benefit | $ | (21,488 | ) | $ | (13,927 | ) | $ | 4,734 | |||
103
Actual income tax (expense) benefit differed from the amount computed by applying the U.S. federal tax rate of 35% to pre-tax income (loss) as a result of the following (in thousands):
Years Ended December 31, | |||||||||||
2016 | 2015 | 2014 | |||||||||
U.S. federal income tax (expense) benefit at statutory rate | $ | (46,941 | ) | $ | (45,844 | ) | $ | 9,871 | |||
Increase (decrease) in income tax benefit (expense) resulting from: | |||||||||||
Foreign income inclusion | (8,868 | ) | (7,056 | ) | (11,794 | ) | |||||
U.S. taxes recorded on previous foreign earnings | — | — | 10,043 | ||||||||
Decrease (increase) in valuation allowance | 3,419 | 31,929 | (1,527 | ) | |||||||
Foreign branch earnings | — | — | (1,976 | ) | |||||||
Share-based compensation | 12,940 | — | — | ||||||||
Tax credits | 4,063 | 1,879 | 1,080 | ||||||||
Income not subject to taxation | — | 254 | 931 | ||||||||
State and local taxes, net of federal benefit | (745 | ) | (4,184 | ) | 2,124 | ||||||
Capitalized transaction costs | — | — | (1,256 | ) | |||||||
Impact of foreign rate differential | 12,200 | 11,490 | 4,536 | ||||||||
Decrease (increase) in reserve for uncertain tax positions | 3,136 | 4,375 | (783 | ) | |||||||
Provision to tax return and other deferred tax adjustments | (1,524 | ) | (5,322 | ) | (2,718 | ) | |||||
Goodwill impairment | — | (1,023 | ) | (3,235 | ) | ||||||
Other, net | 832 | (425 | ) | (562 | ) | ||||||
Income tax (expense) benefit | $ | (21,488 | ) | $ | (13,927 | ) | $ | 4,734 | |||
Prior to December 2014, the Company concluded that the indefinite reversal exception under ASC 740-30-25-17 did not apply for the 2013 undistributed earnings of its foreign subsidiaries, due to potential plans to repatriate the earnings as part of an initiative to reduce the Company's overall level of long-term debt. At December 31, 2014, management reevaluated this assertion following the IPO and significant pay down of its debt held in the United States. With the reduction in debt and related interest expense, the Company expects to be able to support its U.S. domestic operating cash needs without repatriating undistributed earnings of its foreign subsidiaries. The earnings of the Company's non-U.S. subsidiaries are expected to be used to support the growth and working capital needs of its foreign operations. As a result of this change in assertion, the Company reversed the full balance of the deferred tax liability of $10.0 million related to the United States and withholding taxes provided on its 2013 undistributed foreign earnings. No tax benefit was recorded as a result of the release of the deferred tax liability as there was a full valuation allowance on the net deferred tax assets in the United States during 2014. If the earnings that remain indefinitely reinvested were distributed, it would create additional U.S. taxable income in the form of dividends, or otherwise. Withholding taxes may also apply to the repatriated earnings.
At December 31, 2016, approximately $271.9 million in foreign subsidiaries' undistributed earnings are considered indefinitely reinvested outside the United States. The earnings of these subsidiaries are not required as a source of funding for U.S. operations, and such earnings are not planned to be distributed to the United States in the foreseeable future. Further, these earnings will be used to support the growth and working capital needs of the Company's foreign subsidiaries. Determination of the amount of unrecognized income tax liability related to these indefinitely reinvested and undistributed foreign subsidiary earnings is currently not practicable.
104
For the years ended December 31, 2016 and 2015, the valuation allowance on deferred tax assets decreased by $11.5 million and $31.9 million, respectively. The changes in the valuation allowance for deferred tax assets were as follows (in thousands):
Years Ended December 31, | |||||||||||
2016 | 2015 | 2014 | |||||||||
Balance at the beginning of the period | $ | 16,731 | $ | 48,660 | $ | 46,461 | |||||
(Credited) charged to income tax expense | (3,419 | ) | (31,929 | ) | 1,527 | ||||||
Foreign tax credit conversion | (6,707 | ) | — | — | |||||||
Foreign currency exchange | (890 | ) | — | — | |||||||
Other adjustments(a) | (477 | ) | — | 672 | |||||||
Balance at the end of the period | $ | 5,238 | $ | 16,731 | $ | 48,660 | |||||
(a) | Other adjustments denote the effects of write-offs and recoveries in various jurisdictions with no net tax impact. |
As of December 31, 2016, the Company released a portion of the valuation allowance primarily related to foreign deferred tax assets based on the Company's current and anticipated future earnings in certain foreign operations. The release of these valuation allowances resulted in an income tax benefit of $3.4 million during the year ended December 31, 2016.
As of December 31, 2015, the Company assessed both positive and negative evidence available to estimate whether future taxable income would be available to permit the use of the existing deferred tax assets. Accordingly, based on the Company achieving sustained profitability in 2015, the Company reevaluated its ability to consider other subjective evidence, such as the reliability of the Company's projections for future growth. The Company expected it would no longer need a significant portion of the valuation allowance related to these deferred tax assets. As a result of this change in assertion, the valuation allowance was released on the net deferred tax assets in the U.S. The release of the valuation allowance resulted in an income tax benefit of $31.9 million during the year ended December 31, 2015.
As of December 31, 2014, the Company released a significant portion of the valuation allowances primarily related to foreign loss carryforwards in 2014 based on the Company's current and anticipated future earnings in certain foreign operations. The release of these valuation allowances resulted in an income tax benefit of $18.2 million which was offset by an increase in the valuation allowance in the U.S. and other foreign jurisdictions, resulting in a net decrease in an income tax benefit of approximately $1.5 million during the year ended December 31, 2014.
105
The tax effects of temporary differences that give rise to significant portions of the deferred tax assets and liabilities are as follows (in thousands):
December 31, 2016 | December 31, 2015 | ||||||
Deferred tax assets: | |||||||
Net operating losses | $ | 12,607 | $ | 18,381 | |||
Tax credits | 4,690 | 13,166 | |||||
Deferred revenue | 4,630 | 2,857 | |||||
Foreign exchange | 10,430 | 2,865 | |||||
Employee compensation and other benefits | 18,382 | 15,130 | |||||
Allowance for doubtful accounts | 1,660 | 2,162 | |||||
Deferred rent | 729 | 702 | |||||
Accrued liabilities | 5,280 | 4,963 | |||||
Other | 68 | 292 | |||||
Total deferred tax assets | 58,476 | 60,518 | |||||
Less valuation allowance | (5,238 | ) | (16,731 | ) | |||
Net deferred tax assets | 53,238 | 43,787 | |||||
Deferred tax liabilities: | |||||||
Undistributed foreign earnings | — | (411 | ) | ||||
Foreign branch operations | (2,564 | ) | (3,327 | ) | |||
Depreciation and amortization | (42,272 | ) | (56,042 | ) | |||
Other | (1,971 | ) | — | ||||
Total deferred tax liabilities | (46,807 | ) | (59,780 | ) | |||
Net deferred tax assets (liabilities) | $ | 6,431 | $ | (15,993 | ) | ||
As of December 31, 2016 and 2015, the Company had U.S. Federal NOL carryforwards of approximately $5.4 million and $39.0 million, respectively. Based on current estimates, approximately $5.0 million of U.S. Federal NOL carryforwards are subject to limitation under Internal Revenue Code of 1986, as amended ("IRC"), §382 and will expire unused beginning in 2018.
As of December 31, 2016 and 2015, the Company had state NOL carryforwards of approximately $52.0 million and $121.9 million, respectively, a portion of which will expire annually beginning in 2018.
The Company also had foreign NOL carryforwards of $54.3 million and $70.4 million as of December 31, 2016 and 2015, respectively. A valuation allowance has been established for jurisdictions where the future benefit is uncertain. At December 31, 2016 and 2015, the valuation allowance for these foreign jurisdictions totaled $3.5 million and $5.5 million, respectively.
As a result of certain realization requirements of ASC 718, the table of deferred tax assets and liabilities does not include certain deferred tax assets as of December 31, 2015. These assets arose directly from (or the use of which was postponed by) tax deductions related to equity compensation that are greater than the compensation recognized for financial reporting. If and when such deferred tax assets are realized, equity will be increased by approximately $7.6 million.
As discussed in "Note 1 - Basis of Presentation and Changes in Significant Accounting Policies", the Company early adopted ASU No. 2016-09, Compensation - Stock Compensation: Improvements to Employee Share-Based Payment Accounting, effective January 1, 2016. The Company applied the modified retrospective adoption approach and recorded a cumulative-effect adjustment to retained earnings and reduced its deferred tax liability by $7.6 million. This adjustment related to tax assets that had previously arisen from tax deductions for equity compensation expenses that were greater than the compensation recognized for financial reporting.
The Company recognizes a tax benefit from any uncertain tax positions only if they are more likely than not to be sustained upon examination based on the technical merits of the position. The amount of the accrual for
106
which an exposure exists is measured as the largest amount of benefit determined on a cumulative probability basis that the Company believes is more likely than not to be realized upon ultimate settlement of the position. Components of the reserve are classified as either a current or a long-term liability in the accompanying consolidated balance sheets based on when the Company expects each of the items to be settled.
The Company had gross unrecognized tax benefits, exclusive of associated interest and penalties, of approximately $15.7 million and $19.0 million as of December 31, 2016 and 2015, respectively. The Company recognizes accrued interest and penalties related to uncertain tax positions in income tax expense. As of December 31, 2016 and 2015, the Company had accrued interest and penalties related to uncertain tax positions of $0.1 million and $2.1 million, respectively. For the year ended December 31, 2016, the Company recorded in the accompanying consolidated statements of operations a tax benefit of $2.0 million related to interest and penalties associated with uncertain tax positions. For the years ended December 31, 2015 and 2014, the Company recorded in the accompanying consolidated statements of operations a tax expense of $0.3 million, and $0.8 million, respectively, related to interest and penalties associated with uncertain tax positions. If recognized, the total amount of unrecognized tax benefits that would impact the effective tax rate is $15.8 million.
The Company does not anticipate a significant change in the unrecognized tax benefits during the next 12 months. A reconciliation of the beginning and ending balances of unrecognized tax benefits, excluding accrued interest and penalties, is as follows (in thousands):
Unrecognized tax benefits balance at December 31, 2013 | $ | 23,690 | |
Lapse of statute of limitations | (952 | ) | |
Gross increases for tax positions of prior years | 286 | ||
Gross decreases for tax positions of prior years | (485 | ) | |
Impact of foreign currency translation | (774 | ) | |
Settlements with tax authorities | (199 | ) | |
Unrecognized tax benefits balance at December 31, 2014 | 21,566 | ||
Lapse of statute of limitations | (2,106 | ) | |
Increases for tax positions of prior years | 2,001 | ||
Decreases for tax positions of prior years | (1,594 | ) | |
Impact of foreign currency translation | (837 | ) | |
Unrecognized tax benefits balance at December 31, 2015 | 19,030 | ||
Lapse of statute of limitations | (1,446 | ) | |
Increases for tax positions of prior years | 308 | ||
Decreases for tax positions of prior years | (2,275 | ) | |
Impact of foreign currency translation | 121 | ||
Unrecognized tax benefits at December 31, 2016 | $ | 15,738 | |
Due to the geographic breadth of the Company's operations, numerous tax audits may be ongoing throughout the world at any point in time. Income tax liabilities are recorded based on estimates of additional income taxes which will be due upon the conclusion of these audits. Estimates of these income tax liabilities are made based upon prior experience and are updated in light of changes in facts and circumstances. However, due to the uncertain and complex application of tax regulations, it is possible that the ultimate resolution of audits may result in liabilities which could be materially different from these estimates. In such an event, the Company will record additional income tax expense or benefit in the period in which such resolution occurs.
The Company remains subject to audit by the IRS and various state taxing jurisdictions back to 1998 due to NOL carryforwards. The Company's tax filings are open to investigation from 2013 forward in the United Kingdom, which is the jurisdiction of the Company's largest foreign operation.
107
11. Employee Benefit Plan
The Company offers employees a defined contribution retirement benefit plan (the 401(k) Plan) that complies with Section 401(k) of the IRC. Substantially all U.S. employees that meet minimum age requirements are eligible to participate in the 401(k) Plan. The Company matches 100% of the first 3% of each participant's voluntary contributions and 50% of the next 3% of the participant's contributions. Participants become vested in the Company's matching contributions after three years of service, with vesting of the Company's contributions occurring ratably over this period. The Company's contributions for the years ended December 31, 2016, 2015 and 2014 to the 401(k) Plan were $9.6 million, $5.5 million and $4.6 million, respectively. The Company's contributions are recorded in "Direct costs" and "Selling, general and administrative" expenses line items in the accompanying consolidated statements of operations.
12. Earnings Per Share
The following table provides a reconciliation of the numerators and denominators of the basic and diluted earnings per share computations for the years ended December 31, 2016, 2015 and 2014 (in thousands, except per share data):
Net Income (Loss) (Numerator) | Number of Shares (Denominator) | Per Share Amount | ||||||||
For the year ended December 31, 2016 | ||||||||||
Basic earnings per share | $ | 112,630 | 54,031 | $ | 2.08 | |||||
Effect of dilutive securities | — | 1,579 | ||||||||
Diluted earnings per share | $ | 112,630 | 55,610 | $ | 2.03 | |||||
For the year ended December 31, 2015 | ||||||||||
Basic earnings per share | $ | 117,047 | 57,888 | $ | 2.02 | |||||
Effect of dilutive securities | — | 2,258 | ||||||||
Diluted earnings per share | $ | 117,047 | 60,146 | $ | 1.95 | |||||
For the year ended December 31, 2014 | ||||||||||
Basic earnings per share | $ | (27,220 | ) | 53,301 | $ | (0.51 | ) | |||
Effect of dilutive securities | — | — | ||||||||
Diluted earnings per share | $ | (27,220 | ) | 53,301 | $ | (0.51 | ) | |||
The computation of diluted earnings per share excludes unexercised stock options, unvested RSUs, and ESPP purchase rights that are anti-dilutive. The following common stock equivalents were excluded from the earnings per share computation, as their inclusion would have been anti-dilutive (in thousands):
For the Years Ended December 31, | ||||||||
2016 | 2015 | 2014 | ||||||
Weighted average number of stock options, RSUs and ESPP purchase rights calculated using the treasury stock method that were excluded due to the assumed exercise/threshold price exceeding the average market price of the Company's common stock during the period | 788 | 268 | 709 | |||||
Weighted average number of stock options calculated using the treasury stock method that were excluded due to the reporting of a net loss for the period | — | — | 558 | |||||
Total common stock equivalents excluded from diluted earnings per share computation | 788 | 268 | 1,267 | |||||
13. Segment Information
The Company is managed through two reportable segments: Clinical Development Services and Phase I Services, with the former Global Consulting operating segment included in the Clinical Development Services segment.
108
Clinical Development Services offers a variety of clinical development services, including full-service global studies, as well as with ancillary services such as clinical monitoring, investigator recruitment, patient recruitment, data management, study reports to assist customers with their drug development process, and specialized consulting services. Phase I Services focuses on clinical development services for Phase I trials that include scientific exploratory medicine, first-in-human studies through proof-of-concept stages and support for Phase I studies in established compounds.
The Company's CODM reviews segment performance and allocates resources based upon segment revenue and segment contribution margin. Inter-segment revenue is eliminated from the segment reporting presented to the CODM and is not included in the segment revenues presented in the table below. Revenue, direct costs and contribution margin for each of our segments are as follows (in thousands):
Years Ended December 31, | |||||||||||
2016 | 2015 | 2014 | |||||||||
Revenue: | |||||||||||
Clinical Development Services | $ | 1,015,150 | $ | 899,024 | $ | 798,731 | |||||
Phase I Services | 15,187 | 15,716 | 10,997 | ||||||||
Segment revenue | 1,030,337 | 914,740 | 809,728 | ||||||||
Reimbursable out-of-pocket expenses not allocated to segments | 580,259 | 484,499 | 369,071 | ||||||||
Total revenue | $ | 1,610,596 | $ | 1,399,239 | $ | 1,178,799 | |||||
Direct costs: | |||||||||||
Clinical Development Services | $ | 615,090 | $ | 531,265 | $ | 505,101 | |||||
Phase I Services | 11,543 | 11,139 | 9,958 | ||||||||
Segment direct costs | 626,633 | 542,404 | 515,059 | ||||||||
Reimbursable out-of-pocket expenses not allocated to segments | 580,259 | 484,499 | 369,071 | ||||||||
Direct costs and reimbursable out-of-pocket expenses | $ | 1,206,892 | $ | 1,026,903 | $ | 884,130 | |||||
Segment contribution margin: | |||||||||||
Clinical Development Services | $ | 400,060 | $ | 367,759 | $ | 293,630 | |||||
Phase I Services | 3,644 | 4,577 | 1,039 | ||||||||
Segment contribution margin | 403,704 | 372,336 | 294,669 | ||||||||
Less expenses not allocated to segments: | |||||||||||
Selling, general, and administrative | 172,386 | 156,609 | 145,143 | ||||||||
Restructuring, CEO transition and other costs | 13,612 | 1,785 | 6,192 | ||||||||
Transaction expenses | 3,143 | 1,637 | 7,902 | ||||||||
Goodwill and intangible assets impairment | — | 3,931 | 17,245 | ||||||||
Depreciation and amortization | 59,204 | 56,014 | 54,543 | ||||||||
Consolidated income from operations | $ | 155,359 | $ | 152,360 | $ | 63,644 | |||||
The Company's CODM reviews the Company's assets on a consolidated basis. The Company does not allocate assets to its reportable segments as they are not included in the review performed by the CODM for purposes of assessing segment performance and allocating resources.
109
14. Operations by Geographic Location
The Company conducts operations in North America, Europe, Middle East and Africa, Asia-Pacific and Latin America through wholly-owned subsidiaries and representative sales offices. The Company attributes net service revenues to geographical locations based upon the location of the customer (i.e., the location of where the Company invoices the end customer). The following table summarizes total revenue by geographic area (in thousands and all intercompany transactions have been eliminated):
December 31, 2016 | December 31, 2015 | December 31, 2014 | |||||||||
Net service revenues: | |||||||||||
North America(1) | $ | 801,809 | $ | 671,528 | $ | 570,463 | |||||
Europe, Middle East and Africa | 200,799 | 223,268 | 215,836 | ||||||||
Asia-Pacific | 27,718 | 19,744 | 23,406 | ||||||||
Latin America | 11 | 200 | 23 | ||||||||
Total net service revenue | 1,030,337 | 914,740 | 809,728 | ||||||||
Reimbursable-out-of-pocket expenses | 580,259 | 484,499 | 369,071 | ||||||||
Total revenue | $ | 1,610,596 | $ | 1,399,239 | $ | 1,178,799 | |||||
(1) | Net service revenue for the North America region include revenue attributable to the U.S. of $777.8 million, $650.1 million and $567.3 million, or 75%, 71% and 70% of net service revenues, for the years ended December 31, 2016, 2015 and 2014, respectively. No other countries represented more than 10% of net service revenue for any period. |
The following table summarizes long-lived assets by geographic area (in thousands and all intercompany transactions have been eliminated):
December 31, 2016 | December 31, 2015 | ||||||
Property and equipment, net: | |||||||
North America(1) | $ | 41,057 | $ | 28,992 | |||
Europe, Middle East and Africa | 11,235 | 9,891 | |||||
Asia-Pacific | 5,101 | 5,491 | |||||
Latin America | 913 | 439 | |||||
Total property and equipment, net | $ | 58,306 | $ | 44,813 | |||
(1) | Long-lived assets for the North America region include property and equipment, net attributable to the U.S. of $40.6 million and $28.7 million as of December 31, 2016 and 2015, respectively. |
15. Concentration of Credit Risk
Financial assets that subject the Company to credit risk primarily consist of cash and cash equivalents and billed and unbilled accounts receivable. The Company's cash and cash equivalents consist principally of cash and are maintained at several financial institutions with reputable credit ratings. The Company believes these instruments bear minimal credit risk.
Substantially all of the Company's net service revenue is earned by performing services under contracts with pharmaceutical and biotechnology companies. The concentration of credit risk is equal to the outstanding billed and unbilled accounts receivable, less deferred revenue related thereto. The Company does not require collateral or other securities to support customer receivables. The Company maintains a credit approval process and makes significant judgments in connection with assessing customers' ability to pay throughout the contractual obligation. Despite this assessment, from time to time, customers are unable to meet their payment obligations. The Company continuously monitors customers' credit worthiness and applies judgment in establishing a provision for estimated credit losses based on historical experience and any specific customer collection issues that have been identified.
110
No customer accounted for 10% or more of net service revenue for the years ended December 31, 2016 and 2015. Various subsidiaries of customers A and B accounted for approximately 14% and 12%, respectively, of total net service revenue for the year ended December 31, 2014.
At December 31, 2016 and 2015, no customer accounted for more than 10% of billed and unbilled accounts receivable.
16. Related-Party Transactions
Through November 7, 2014, the Company had an agreement with a significant shareholder for the shareholder to perform certain consulting services. In conjunction with the IPO and subsequent corporate reorganization, the Company paid cash of approximately $3.4 million to terminate this agreement. Under the agreement, the Company recognized $0.4 million of consulting service expense for the year ended December 31, 2014. There were no material related party expenses for the years ended December 31, 2016 and 2015.
The Company recorded net service revenue of $0.5 million and $0.1 million during the years ended December 31, 2016 and 2015, respectively, from a customer who has a significant shareholder who was also a significant shareholder of the Company through August 2016. There was no related-party revenue recorded for the year ended December 31, 2014.
17. Commitments and Contingencies
The Company records accruals for claims, suits, investigations and proceedings when it is probable that a liability has been incurred and the amount of the loss can be reasonably estimated. The Company reviews claims, suits, investigations and proceedings at least quarterly and records or adjusts accruals related to such matters to reflect the impact and status of any settlements, rulings, advice of counsel or other information pertinent to a particular matter.
In the normal course of business, the Company periodically becomes involved in various claims and lawsuits that are incidental to its business. While the outcome of these matters could differ from management's expectations, the Company does not believe the resolution of these matters will have a material effect upon the Company's financial statements.
The Company currently maintains insurance for risks associated with the operation of its business, provision of professional services and ownership of property. These policies provide coverage for a variety of potential losses, including loss or damage to property, bodily injury, general commercial liability, professional errors and omissions, and medical malpractice.
The Company is self-insured for certain losses relating to health insurance claims for the majority of its employees located within the United States. The Company purchases stop-loss coverage from third party insurance carriers to limit individual or aggregate loss exposure with respect to the Company's health insurance claims.
Accrued insurance liabilities and related expenses are based on estimates of claims incurred but not reported. Incurred but not reported claims are generally determined by taking into account historical claims payments and known trends such as claim frequency and severity. The Company makes estimated judgments and assumptions with respect to these calculations, including but not limited to, estimated healthcare cost trends, estimated lag time to report any paid claims, average cost per claim and other factors. The Company believes the estimates of future liability are reasonable based on its methodology; however, changes in claims activity (volume and amount per claim) could materially affect the estimate for these liabilities. The Company continually monitors claim activity and incidents and makes necessary adjustments based on these evaluations. As of December 31, 2016 and 2015, the Company had accrued self-insurance reserves of $3.6 million and $2.9 million.
111
18. Quarterly Results of Operations — Unaudited
The following is a summary of the Company's consolidated quarterly results of operations for each of the fiscal years ended December 31, 2016 and 2015 (in thousands, except per share data):
Three Months Ended | |||||||||||||||
March 31, 2016 | June 30, 2016 | September 30, 2016 | December 31, 2016 | ||||||||||||
Net service revenue | $ | 248,997 | $ | 258,804 | $ | 259,557 | $ | 262,979 | |||||||
Income from operations(1)(2)(5) | 32,508 | 39,655 | 39,396 | 43,800 | |||||||||||
Net income(4)(5)(6) | 17,405 | 30,403 | 27,331 | 37,491 | |||||||||||
Basic earnings per share | $ | 0.32 | $ | 0.56 | $ | 0.50 | $ | 0.70 | |||||||
Diluted earnings per share | $ | 0.31 | $ | 0.54 | $ | 0.49 | $ | 0.68 | |||||||
Three Months Ended | |||||||||||||||
March 31, 2015 | June 30, 2015 | September 30, 2015 | December 31, 2015 | ||||||||||||
Net service revenue | $ | 211,514 | $ | 227,376 | $ | 234,494 | $ | 241,356 | |||||||
Income from operations(1)(2)(3) | 32,387 | 35,939 | 44,341 | 39,693 | |||||||||||
Net income(4)(6) | 25,256 | 23,321 | 37,814 | 30,656 | |||||||||||
Basic earnings per share | $ | 0.41 | $ | 0.40 | $ | 0.67 | $ | 0.55 | |||||||
Diluted earnings per share | $ | 0.40 | $ | 0.39 | $ | 0.64 | $ | 0.53 | |||||||
(1) | Transaction expenses for the three months ended March 31, 2016, June 30, 2016, September 30, 2016 and December 31, 2016 were $0.6 million, $1.2 million, $1.1 million and $0.3 million, respectively. Transaction expenses for the three months ended March 31, 2015, June 30, 2015, September 30, 2015 and December 31, 2015 were $0.1 million, $0.4 million, $0.4 million and $0.7 million, respectively. Transaction expenses include legal fees associated with (i) secondary stock offerings and stock repurchase activities, (ii) the 2016 and 2015 debt amendments, and (iii) other corporate projects. |
(2) | Restructuring and CEO transition costs for the three months ended March 31, 2016, June 30, 2016, September 30, 2016 and December 31, 2016 were $6.0 million, $1.4 million, $2.9 million and $3.3 million, respectively. Restructuring (reductions) charges for the three months ended March 31, 2015, June 30, 2015 and December 31, 2015 were $(0.4) million, $2.0 million and $0.2 million, respectively. There were no material restructuring charges for the three months ended September 30, 2015. |
(3) | Asset impairment charges were $3.9 million for the three months ended March 31, 2015 related to the Phase I Services reporting unit. |
(4) | During the three months ended September 30, 2016, the Company recorded a loss on extinguishment of debt of $0.4 million associated with the 2016 debt refinancing. During the three months ended June 30, 2015, the Company recorded a loss on extinguishment of debt of $9.8 million associated with the 2015 debt refinancing. |
(5) | During the three months ended December 31, 2016, the Company determined that it qualified for additional research and development tax credits in certain international locations for expenses incurred during 2016 and recorded a $2.5 million reduction of direct costs. |
(6) | During the three months ended December 31, 2016 and 2015, the Company determined that certain valuation allowances were no longer required and recorded a benefit related to the release of valuation allowances totaling $3.4 million and $31.9 million, respectively. See "Note 10 - Income Taxes" for additional information. |
Item 9. Changes in and Disagreements with Accountants on Accounting and Financial Disclosure.
None.
112
Item 9A. Controls and Procedures.
Evaluation of Disclosure Controls and Procedures
As required by Rule 13a-15(b) under the Exchange Act, we carried out an evaluation under the supervision and with the participation of our management, including our CEO and CFO, of the effectiveness of the design and operation of our disclosure controls and procedures (as defined in Rules 13a-15(e) and 15d-15(e) under the Exchange Act). There are inherent limitations to the effectiveness of any system of disclosure controls and procedures, including the possibility of human error and the circumvention or overriding of the controls and procedures. Accordingly, even effective disclosure controls and procedures can only provide reasonable assurance of achieving their control objectives. Based upon their evaluation, our CEO and CFO concluded that our disclosure controls and procedures were effective to provide reasonable assurance that information required to be disclosed by us in the reports that we file or submit under the Exchange Act is recorded, processed, summarized and reported within the time periods specified in the applicable rules and forms, and that it is accumulated and communicated to our management, including our CEO and CFO, as appropriate, to allow timely decisions regarding required disclosure.
Changes in Internal Control Over Financial Reporting
There has been no change in our internal control over financial reporting (as defined in Rules 13a-15(f) and 15d-15(f) under the Exchange Act) during the quarter ended December 31, 2016 that has materially affected, or is reasonably likely to materially affect, our internal control over financial reporting.
Management's Annual Report on Internal Control Over Financial Reporting
The management of INC Research Holdings, Inc. (the “Company”) is responsible for establishing and maintaining adequate internal control over financial reporting. Internal control over financial reporting is a process designed to provide reasonable assurance regarding the reliability of financial reporting and the preparation of financial statements for external purposes in accordance with generally accepted accounting principles. A company’s internal control over financial reporting includes those policies and procedures that pertain to the maintenance of records that, in reasonable detail, accurately and fairly reflect the transactions and dispositions of the assets of the company; provide reasonable assurance that transactions are recorded as necessary to permit preparation of financial statements in accordance with generally accepted accounting principles in the United States of America, and that receipts and expenditures of the company are being made only in accordance with authorizations of management and directors of the company; and provide reasonable assurance regarding prevention or timely detection of unauthorized acquisition, use, or disposition of the company’s assets that could have a material effect on the financial statements.
Because of its inherent limitations, internal control over financial reporting might not prevent or detect misstatements. Also, projections of any evaluation of effectiveness to future periods are subject to the risk that controls may become inadequate because of changes in conditions, or that the degree of compliance with the policies or procedures may deteriorate.
Management assessed the effectiveness of the Company’s internal control over financial reporting as of December 31, 2016. In making this assessment, management used the framework established in the Internal Control-Integrated Framework issued in 2013 by the Committee of Sponsoring Organizations of the Treadway Commission (“COSO”). As a result of this assessment and based on the criteria in the COSO framework, management has concluded that, as of December 31, 2016, the Company’s internal control over financial reporting was effective.
The effectiveness of the Company’s internal control over financial reporting as of December 31, 2016 has been audited by Deloitte & Touche LLP, an independent registered public accounting firm, as stated in their report which appears herein.
Item 9B. Other Information.
None.
113
PART III
Item 10. Directors, Executive Officers and Corporate Governance.
Pursuant to General Instruction G(3) on Form 10-K, information required by this Item concerning our directors and corporate governance is incorporated by reference from the sections captioned “Election of Directors” and “Corporate Governance Matters” contained in our 2017 Proxy Statement related to Our Annual Meeting of Stockholders which we intend to file with the SEC within 120 days of the end of our fiscal year.
We have adopted a code of business conduct and ethics relating to the conduct of our business by all of our employees, officers, and directors, as well as a code of ethics specifically for our principal executive officer and senior financial officers. Each of these policies is posted on our website: www.incresearch.com.
The information required by this Item concerning our executive officers is set forth at the end of Part I "Business" of this Annual Report on Form 10-K.
The information required by this Item concerning compliance with Section 16(a) of the United States Securities Exchange Act of 1934, as amended, is incorporated by reference from the section of the 2017 Proxy Statement captioned “Section 16(a) Beneficial Ownership Reporting Compliance.”
Item 11. Executive Compensation.
The information required by this Item is incorporated by reference to the information under the sections captioned “Executive Compensation and Other Matters” and “Director Compensation for Fiscal year 2016” in the 2017 Proxy Statement.
Item 12. Security Ownership of Certain Beneficial Owners and Management and Related Stockholder Matters.
The following table sets forth the indicated information as of December 31, 2016 with respect to our equity compensation plans approved by security holders:
Plan Description | Number of securities to be issued upon exercise of outstanding options, warrants and rights | Weighted-average exercise price of outstanding options, warrants and rights | Number of securities remaining available for future issuance under equity compensation plans | |||||||
2016 Employee Stock Purchase Plan | — | $ | — | 1,000,000 | ||||||
2014 Equity Incentive Plan | 730,392 | $ | 41.35 | 3,158,308 | ||||||
2010 Equity Incentive Plan | 1,439,843 | $ | 12.42 | — | ||||||
Total | 2,170,235 | 4,158,308 | ||||||||
Our equity compensation plans consist of the 2016 Employee Stock Purchase Plan, the 2014 Equity Incentive Plan and the 2010 Equity Incentive Plan, which were approved by our shareholders. We do not have any equity compensation plans or arrangements that have not been approved by our shareholders.
Information regarding security ownership and securities authorized for issuance under equity compensation plans required by this Item is incorporated by reference to the information under the section captioned “Security Ownership of Certain Beneficial Owners and Management” in the 2017 Proxy Statement.
114
Item 13. Certain Relationships and Related Transactions and Director Independence.
The information required by this Item is incorporated by reference to the information under the section captioned “Transactions With Related Persons” and “Corporate Governance Matters” in the 2017 Proxy Statement.
Item 14. Principal Accountant Fees and Services.
The information required by this Item is incorporated by reference to the information under the section captioned “Audit Committee Report” in the 2017 Proxy Statement.
115
PART IV
Item 15. Exhibits and Financial Statement Schedules.
(a) The following documents are filed as part of this report:
(1) Financial Statements
The financial statements and report of the independent registered public accounting firm are filed as part of this Annual Report (see "Index to Consolidated Financial Statements" at Item 8).
(2) Financial Statement Schedules
The financial statements schedules are omitted because they are not applicable or the required information is shown in the consolidated financial statements or notes thereto.
116
(b) Exhibits
Incorporated by Reference (Unless Otherwise Indicated) | ||||||
Exhibit Number | Exhibit Description | Form | File No. | Exhibit | Filing Date | |
3.1 | Amended and Restated Certificate of Incorporation of INC Research Holdings, Inc. | 8-K | 001-36730 | 3.1 | November 13, 2014 | |
3.2 | Amended and Restated Bylaws of INC Research Holdings, Inc. | 8-K | 001-36730 | 3.3 | December 16, 2016 | |
4.1 | Specimen Certificate for Class A Common Stock. | S-1/A | 333-199178 | 4.1 | October 27, 2014 | |
4.2 | Second Amended and Restated Stockholders Agreement, by and among INC Research Holdings, Inc. and certain stockholders named therein. | 8-K | 001-36730 | 4.2 | November 13, 2014 | |
10.3.1# | Triangle Acquisition Holdings, Inc. 2010 Equity Incentive Plan. | S-1 | 333-199178 | 10.3.1 | October 6, 2014 | |
10.3.2# | Amendment No. 1 to INC Research Holdings, Inc. 2010 Equity Incentive Plan. | S-1 | 333-199178 | 10.3.2 | October 6, 2014 | |
10.3.3# | Amendment No. 2 to INC Research Holdings, Inc. 2010 Equity Incentive Plan. | S-1 | 333-199178 | 10.3.3 | October 6, 2014 | |
10.4# | Form of Nonqualified Stock Option Award Agreement under INC Research Holdings, Inc. 2010 Equity Incentive Plan. | S-1 | 333-199178 | 10.4 | October 6, 2014 | |
10.5# | INC Research Holdings, Inc. 2014 Equity Incentive Plan. | S-1/A | 333-199178 | 10.5 | October 17, 2014 | |
10.6# | Form of Nonqualified Stock Option Award Agreement under INC Research Holdings, Inc. 2014 Equity Incentive Plan. | S-1/A | 333-199178 | 10.6 | October 17, 2014 | |
10.7# | 2013 Management Incentive Plan. | S-1 | 333-199178 | 10.7 | October 6, 2014 | |
10.8# | Form of Management Incentive Plan. | S-1 | 333-199178 | 10.8 | October 6, 2014 | |
10.9.1 | Lease, dated May 6, 2010, by and between INC Research, Inc. and Highwoods Realty Limited Partnership. | S-1 | 333-199178 | 10.9.1 | October 6, 2014 | |
10.9.2 | Lease Amendment No. 1, dated August 26, 2010, by and between INC Research, Inc. and Highwoods Realty Limited Partnership. | S-1 | 333-199178 | 10.9.2 | October 6, 2014 | |
10.9.3 | Lease Amendment No. 2, dated August 23, 2011, by and between INC Research, Inc. and Highwoods Realty Limited Partnership. | S-1 | 333-199178 | 10.9.3 | October 6, 2014 | |
10.9.4 | Lease Amendment No. 3, dated January 4, 2013, by and between INC Research, Inc. and Highwoods Realty Limited Partnership. | S-1 | 333-199178 | 10.9.4 | October 6, 2014 | |
10.10# | Executive Employment Agreement, effective as of July 31, 2014, by and between INC Research, LLC and D. Jamie Macdonald. | S-1 | 333-199178 | 10.10 | October 6, 2014 | |
10.11# | Executive Employment Agreement, effective as of August 5, 2013, by and between INC Research, LLC and Gregory S. Rush. | S-1 | 333-199178 | 10.11 | October 6, 2014 | |
10.12.1# | Executive Service Agreement, effective as of July 31, 2014, by and between INC Research Holdings Limited and Alistair Macdonald. | S-1 | 333-199178 | 10.12 | October 6, 2014 | |
10.12.2# | Amendment Two to the Executive Service Agreement, effective as of January 1, 2015, by and between INC Research Holdings Limited and Alistair Macdonald. | 10-Q | 001-36730 | 10.1 | April 27, 2015 | |
10.13# | Executive Employment Agreement, effective as of July 31, 2014, by and between INC Research, LLC and Christopher L. Gaenzle. | S-1 | 333-199178 | 10.13 | October 6, 2014 | |
117
10.14# | Form of Restricted Stock Award Agreement under INC Research Holdings, Inc. 2014 Equity Incentive Plan. | S-1/A | 333-199178 | 10.14 | October 17, 2014 | |
10.15# | Form of Nonqualified Stock Option Award Agreement for Non-U.S. Participant under INC Research Holdings, Inc. 2014 Equity Incentive Plan. | S-1/A | 333-199178 | 10.15 | October 17, 2014 | |
10.16# | Form of 2010 Equity Incentive Plan Stock Adjustment Letter. | S-1/A | 333-199178 | 10.16 | October 27, 2014 | |
10.17# | Form of 2010 Equity Incentive Plan Stock Option Performance Award Amendment Letter. | S-1/A | 333-199178 | 10.17 | October 17, 2014 | |
10.18 | Credit Agreement, dated November 13, 2014, among INC Research, LLC, as the Borrower, INC Research Holdings, Inc., the several banks and other financial institutions or entities from time to time parties thereto, and Goldman Sachs Bank USA, as Administrative Agent and Collateral Agent, Goldman Sachs Bank, USA, Credit Suisse Securities (USA) LLC, ING Capital LLC, RBC Capital Markets and Wells Fargo Securities LLC, as Joint Lead Arrangers and Joint Bookrunners, and Natixis, as Documentation Agent. | 10-K | 001-36730 | 10.18 | February 24, 2015 | |
10.19 | Guarantee and Collateral Agreement, dated November 13, 2014, made by INC Research, LLC, INC Research Holdings, Inc. and the other signatories thereto, in favor of Goldman Sachs Bank USA, as Collateral Agent and Administrative Agent. | 10-K | 001-36730 | 10.19 | February 24, 2015 | |
10.20 | Form of Stock Repurchase Agreement, by and among INC Research Holdings, Inc. and certain stockholders named therein. | S-1/A | 333-203640 | 10.21 | May 4, 2015 | |
10.21 | Credit Agreement, dated May 14, 2015, among INC Research, LLC, as the Borrower, INC Research Holdings, Inc., the several banks and other financial institutions or entities from time to time parties thereto, and Wells Fargo Bank, National Association, as Administrative Agent and Collateral Agent, PNC Bank, National Association, ING Capital LLC, Keybank National Association and Bank of America N.A. as Co-Syndication Agents; and Fifth Third Bank, as Documentation Agent, Wells Fargo Securities, LLC, PNC Capital Markets LLC, ING Capital LLC and Keybanc Capital Markets, Inc., as Joint Lead Arrangers and Joint Bookrunners. | 8-K | 001-36730 | 10.1 | May 15, 2015 | |
10.22# | Form of Nonqualified Option Award Agreement for U.S. Executives under INC Research Holdings, Inc. 2014 Equity Incentive Plan. | 10-Q | 001-36730 | 10.1 | October 29, 2015 | |
10.23# | Form of Nonqualified Option Award Agreement for Non-U.S. Executives under INC Research Holdings, Inc. 2014 Equity Incentive Plan. | 10-Q | 001-36730 | 10.2 | October 29, 2015 | |
10.24# | Form of Nonqualified Option Award Agreement for U.S. Participants under INC Research Holdings, Inc. 2014 Equity Incentive Plan. | 10-Q | 001-36730 | 10.3 | October 29, 2015 | |
10.25# | Form of Restricted Stock Award Agreement for U.S. Executives under INC Research Holdings, Inc. 2014 Equity Incentive Plan. | 10-Q | 001-36730 | 10.4 | October 29, 2015 | |
10.26# | Form of Restricted Stock Award Agreement for Non-U.S. Executives under INC Research Holdings, Inc. 2014 Equity Incentive Plan. | 10-Q | 001-36730 | 10.5 | October 29, 2015 | |
10.27# | Form of Restricted Stock Award Agreement for U.S. Participants under INC Research Holdings, Inc. 2014 Equity Incentive Plan. | 10-Q | 001-36730 | 10.6 | October 29, 2015 | |
10.28 | Stock Repurchase Agreement, dated November 30, 2015, by and among INC Research Holdings, Inc. and certain stockholders named therein. | 8-K | 001-36730 | 10.23 | December 4, 2015 | |
10.29# | Executive Employment Agreement, effective as of July 31, 2014, by and between INC Research, LLC and Michael Gibertini, PhD. | 10-K | 001-36730 | 10.29 | February 25, 2016 | |
118
10.30# | Form of Performance Restricted Stock Unit Award Agreement for U.S. Participants under INC Research Holdings, Inc. 2014 Equity Incentive Plan. | 10-Q | 001-36730 | 10.1 | May 2, 2016 | |
10.31# | Form of Performance Restricted Stock Unit Award Agreement for Non-U.S. Participants under INC Research Holdings, Inc. 2014 Equity Incentive Plan. | 10-Q | 001-36730 | 10.2 | May 2, 2016 | |
10.32# | 2016 Employee Stock Purchase Plan. | S-8 | 333-212154 | 4.3 | June 21, 2016 | |
10.33# | INC Research Holdings, Inc. 2014 Equity Incentive Plan, as Amended and Restated. | S-8 | 333-212154 | 4.4 | June 21, 2016 | |
10.34# | Transition Agreement, by and among Duncan Jamie Macdonald, INC Research, LLC and INC Research Holdings, Inc. entered into as of July 27, 2016. | 8-K | 001-36730 | 10.1 | July 28, 2016 | |
10.35# | Executive Service Agreement, by and between INC Research Holding Limited and Alistair Macdonald. | 8-K | 001-36730 | 10.2 | July 28, 2016 | |
10.36# | Letter Agreement, by and between INC Research Holdings Limited and Alistair Macdonald, dated July 27, 2016. | 8-K | 001-36730 | 10.3 | July 28, 2016 | |
10.37# | Letter Agreement, by and between INC Research Holdings, Inc. and Alistair Macdonald, dated July 27, 2016. | 8-K | 001-36730 | 10.4 | July 28, 2016 | |
10.38 | Stock Repurchase Agreement, dated August 12, 2016, by and among INC Research Holdings, Inc. and certain stockholders named therein. | 8-K | 001-36730 | 10.1 | August 18, 2016 | |
10.39 | First Amendment to Credit Agreement and Increase Revolving Joinder, dated August 31, 2016, among INC Research, LLC, as the Borrower, INC Research Holdings, Inc., Subsidiary Guarantors, lenders party to the Credit Agreement, dated May 14, 2015, and Wells Fargo Bank, National Association, as Administrative Agent. | 8-K | 001-36730 | 10.1 | August 31, 2016 | |
10.40# | Form of Retention Agreement for Participants. | 8-K | 001-36730 | 10.1 | September 15, 2016 | |
10.41# | INC Research Holdings, Inc. Executive Severance Plan adopted September 15, 2016. | 8-K | 001-36730 | 10.2 | September 15, 2016 | |
10.42# | Form of Restricted Stock Unit Award Agreement for U.S. Executives 2014 Equity Incentive Plan. | 10-Q | 001-36730 | 10.8 | October 31, 2016 | |
21.1 | List of Significant Subsidiaries of the Registrant. | — | — | — | Filed herewith | |
23.1 | Consent of Ernst & Young LLP. | — | — | — | Filed herewith | |
23.2 | Consent of Deloitte & Touche LLP. | — | — | — | Filed herewith | |
31.1 | Certification of Chief Executive Officer pursuant to Section 302 of the Sarbanes-Oxley Act of 2002. | — | — | — | Filed herewith | |
31.2 | Certification of Executive Vice President and Chief Financial Officer pursuant to Section 302 of the Sarbanes-Oxley Act of 2002. | — | — | — | Filed herewith | |
32.1 | Certification of Chief Executive Officer pursuant to Section 906 of the Sarbanes-Oxley Act of 2002. | — | — | — | Furnished herewith | |
32.2 | Certification of Executive Vice President and Chief Financial Officer pursuant to Section 906 of the Sarbanes-Oxley Act of 2002. | — | — | — | Furnished herewith | |
101.INS | XBRL Instance Document. | — | — | — | Furnished herewith | |
101.SCH | XBRL Taxonomy Extension Schema Document. | — | — | — | Furnished herewith | |
101.CAL | XBRL Taxonomy Extension Calculation Linkbase Document. | — | — | — | Furnished herewith | |
101.DEF | XBRL Taxonomy Extension Definition Linkbase Document. | — | — | — | Furnished herewith | |
101.LAB | XBRL Taxonomy Extension Label Linkbase Document. | — | — | — | Furnished herewith | |
119
101.PRE | Taxonomy Extension Presentation Linkbase Document. | — | — | — | Furnished herewith | |
# Management contract or compensatory plan.
120
SIGNATURES
Pursuant to the requirements of Section 13 or 15(d) of the Securities Exchange Act of 1934, the registrant has duly caused this report to be signed on its behalf by the undersigned, thereunto duly authorized.
INC Research Holdings, Inc. | ||||||
By: | /s/ Alistair Macdonald | |||||
Name: | Alistair Macdonald | |||||
Title: | Chief Executive Officer (Principal Executive Officer) and Director | |||||
Date: | February 27, 2017 | |||||
Pursuant to the requirements of the Securities Exchange Act of 1934, this report has been signed below by the following persons on behalf of the registrant in the capacities and on the dates indicated.
Signature | Title | Date | ||||
/s/ Alistair Macdonald | Chief Executive Officer (Principal Executive Officer) and Director | February 27, 2017 | ||||
Alistair Macdonald | ||||||
/s/ Gregory S. Rush | Executive Vice President and Chief Financial Officer (Principal Financial and Accounting Officer) | February 27, 2017 | ||||
Gregory S. Rush | ||||||
/s/ David Y. Norton | Chairman and Director | February 27, 2017 | ||||
David Y. Norton | ||||||
/s/ Robert W. Breckon | Director | February 27, 2017 | ||||
Robert W. Breckon | ||||||
/s/ David F. Burgstahler | Director | February 27, 2017 | ||||
David F. Burgstahler | ||||||
/s/ Richard N. Kender | Director | February 27, 2017 | ||||
Richard N. Kender | ||||||
/s/ Kenneth F. Meyers | Director | February 27, 2017 | ||||
Kenneth F. Meyers | ||||||
/s/ Matthew E. Monaghan | Director | February 27, 2017 | ||||
Matthew E. Monaghan | ||||||
/s/ Eric P. Pâques | Director | February 27, 2017 | ||||
Eric P. Pâques | ||||||
121
EXHIBIT INDEX
Incorporated by Reference (Unless Otherwise Indicated) | ||||||
Exhibit Number | Exhibit Description | Form | File No. | Exhibit | Filing Date | |
3.1 | Amended and Restated Certificate of Incorporation of INC Research Holdings, Inc. | 8-K | 001-36730 | 3.1 | November 13, 2014 | |
3.2 | Amended and Restated Bylaws of INC Research Holdings, Inc. | 8-K | 001-36730 | 3.3 | December 16, 2016 | |
4.1 | Specimen Certificate for Class A Common Stock. | S-1/A | 333-199178 | 4.1 | October 27, 2014 | |
4.2 | Second Amended and Restated Stockholders Agreement, by and among INC Research Holdings, Inc. and certain stockholders named therein. | 8-K | 001-36730 | 4.2 | November 13, 2014 | |
10.3.1# | Triangle Acquisition Holdings, Inc. 2010 Equity Incentive Plan. | S-1 | 333-199178 | 10.3.1 | October 6, 2014 | |
10.3.2# | Amendment No. 1 to INC Research Holdings, Inc. 2010 Equity Incentive Plan. | S-1 | 333-199178 | 10.3.2 | October 6, 2014 | |
10.3.3# | Amendment No. 2 to INC Research Holdings, Inc. 2010 Equity Incentive Plan. | S-1 | 333-199178 | 10.3.3 | October 6, 2014 | |
10.4# | Form of Nonqualified Stock Option Award Agreement under INC Research Holdings, Inc. 2010 Equity Incentive Plan. | S-1 | 333-199178 | 10.4 | October 6, 2014 | |
10.5# | INC Research Holdings, Inc. 2014 Equity Incentive Plan. | S-1/A | 333-199178 | 10.5 | October 17, 2014 | |
10.6# | Form of Nonqualified Stock Option Award Agreement under INC Research Holdings, Inc. 2014 Equity Incentive Plan. | S-1/A | 333-199178 | 10.6 | October 17, 2014 | |
10.7# | 2013 Management Incentive Plan. | S-1 | 333-199178 | 10.7 | October 6, 2014 | |
10.8# | Form of Management Incentive Plan. | S-1 | 333-199178 | 10.8 | October 6, 2014 | |
10.9.1 | Lease, dated May 6, 2010, by and between INC Research, Inc. and Highwoods Realty Limited Partnership. | S-1 | 333-199178 | 10.9.1 | October 6, 2014 | |
10.9.2 | Lease Amendment No. 1, dated August 26, 2010, by and between INC Research, Inc. and Highwoods Realty Limited Partnership. | S-1 | 333-199178 | 10.9.2 | October 6, 2014 | |
10.9.3 | Lease Amendment No. 2, dated August 23, 2011, by and between INC Research, Inc. and Highwoods Realty Limited Partnership. | S-1 | 333-199178 | 10.9.3 | October 6, 2014 | |
10.9.4 | Lease Amendment No. 3, dated January 4, 2013, by and between INC Research, Inc. and Highwoods Realty Limited Partnership. | S-1 | 333-199178 | 10.9.4 | October 6, 2014 | |
10.10# | Executive Employment Agreement, effective as of July 31, 2014, by and between INC Research, LLC and D. Jamie Macdonald. | S-1 | 333-199178 | 10.10 | October 6, 2014 | |
10.11# | Executive Employment Agreement, effective as of August 5, 2013, by and between INC Research, LLC and Gregory S. Rush. | S-1 | 333-199178 | 10.11 | October 6, 2014 | |
10.12.1# | Executive Service Agreement, effective as of July 31, 2014, by and between INC Research Holdings Limited and Alistair Macdonald. | S-1 | 333-199178 | 10.12 | October 6, 2014 | |
10.12.2# | Amendment Two to the Executive Service Agreement, effective as of January 1, 2015, by and between INC Research Holdings Limited and Alistair Macdonald. | 10-Q | 001-36730 | 10.1 | April 27, 2015 | |
10.13# | Executive Employment Agreement, effective as of July 31, 2014, by and between INC Research, LLC and Christopher L. Gaenzle. | S-1 | 333-199178 | 10.13 | October 6, 2014 | |
10.14# | Form of Restricted Stock Award Agreement under INC Research Holdings, Inc. 2014 Equity Incentive Plan. | S-1/A | 333-199178 | 10.14 | October 17, 2014 | |
10.15# | Form of Nonqualified Stock Option Award Agreement for Non-U.S. Participant under INC Research Holdings, Inc. 2014 Equity Incentive Plan. | S-1/A | 333-199178 | 10.15 | October 17, 2014 | |
10.16# | Form of 2010 Equity Incentive Plan Stock Adjustment Letter. | S-1/A | 333-199178 | 10.16 | October 27, 2014 | |
122
10.17# | Form of 2010 Equity Incentive Plan Stock Option Performance Award Amendment Letter. | S-1/A | 333-199178 | 10.17 | October 17, 2014 | |
10.18 | Credit Agreement, dated November 13, 2014, among INC Research, LLC, as the Borrower, INC Research Holdings, Inc., the several banks and other financial institutions or entities from time to time parties thereto, and Goldman Sachs Bank USA, as Administrative Agent and Collateral Agent, Goldman Sachs Bank, USA, Credit Suisse Securities (USA) LLC, ING Capital LLC, RBC Capital Markets and Wells Fargo Securities LLC, as Joint Lead Arrangers and Joint Bookrunners, and Natixis, as Documentation Agent. | 10-K | 001-36730 | 10.18 | February 24, 2015 | |
10.19 | Guarantee and Collateral Agreement, dated November 13, 2014, made by INC Research, LLC, INC Research Holdings, Inc. and the other signatories thereto, in favor of Goldman Sachs Bank USA, as Collateral Agent and Administrative Agent. | 10-K | 001-36730 | 10.19 | February 24, 2015 | |
10.20 | Form of Stock Repurchase Agreement, by and among INC Research Holdings, Inc. and certain stockholders named therein. | S-1/A | 333-203640 | 10.21 | May 4, 2015 | |
10.21 | Credit Agreement, dated May 14, 2015, among INC Research, LLC, as the Borrower, INC Research Holdings, Inc., the several banks and other financial institutions or entities from time to time parties thereto, and Wells Fargo Bank, National Association, as Administrative Agent and Collateral Agent, PNC Bank, National Association, ING Capital LLC, Keybank National Association and Bank of America N.A. as Co-Syndication Agents; and Fifth Third Bank, as Documentation Agent, Wells Fargo Securities, LLC, PNC Capital Markets LLC, ING Capital LLC and Keybanc Capital Markets, Inc., as Joint Lead Arrangers and Joint Bookrunners. | 8-K | 001-36730 | 10.1 | May 15, 2015 | |
10.22# | Form of Nonqualified Option Award Agreement for U.S. Executives under INC Research Holdings, Inc. 2014 Equity Incentive Plan. | 10-Q | 001-36730 | 10.1 | October 29, 2015 | |
10.23# | Form of Nonqualified Option Award Agreement for Non-U.S. Executives under INC Research Holdings, Inc. 2014 Equity Incentive Plan. | 10-Q | 001-36730 | 10.2 | October 29, 2015 | |
10.24# | Form of Nonqualified Option Award Agreement for U.S. Participants under INC Research Holdings, Inc. 2014 Equity Incentive Plan. | 10-Q | 001-36730 | 10.3 | October 29, 2015 | |
10.25# | Form of Restricted Stock Award Agreement for U.S. Executives under INC Research Holdings, Inc. 2014 Equity Incentive Plan. | 10-Q | 001-36730 | 10.4 | October 29, 2015 | |
10.26# | Form of Restricted Stock Award Agreement for Non-U.S. Executives under INC Research Holdings, Inc. 2014 Equity Incentive Plan. | 10-Q | 001-36730 | 10.5 | October 29, 2015 | |
10.27# | Form of Restricted Stock Award Agreement for U.S. Participants under INC Research Holdings, Inc. 2014 Equity Incentive Plan. | 10-Q | 001-36730 | 10.6 | October 29, 2015 | |
10.28 | Stock Repurchase Agreement, dated November 30, 2015, by and among INC Research Holdings, Inc. and certain stockholders named therein. | 8-K | 001-36730 | 10.23 | December 4, 2015 | |
10.29# | Executive Employment Agreement, effective as of July 31, 2014, by and between INC Research, LLC and Michael Gibertini, PhD. | 10-K | 001-36730 | 10.29 | February 25, 2016 | |
10.30# | Form of Performance Restricted Stock Unit Award Agreement for U.S. Participants under INC Research Holdings, Inc. 2014 Equity Incentive Plan. | 10-Q | 001-36730 | 10.1 | May 2, 2016 | |
10.31# | Form of Performance Restricted Stock Unit Award Agreement for Non-U.S. Participants under INC Research Holdings, Inc. 2014 Equity Incentive Plan. | 10-Q | 001-36730 | 10.2 | May 2, 2016 | |
10.32# | 2016 Employee Stock Purchase Plan. | S-8 | 333-212154 | 4.3 | June 21, 2016 | |
10.33# | INC Research Holdings, Inc. 2014 Equity Incentive Plan, as Amended and Restated. | S-8 | 333-212154 | 4.4 | June 21, 2016 | |
10.34# | Transition Agreement, by and among Duncan Jamie Macdonald, INC Research, LLC and INC Research Holdings, Inc. entered into as of July 27, 2016. | 8-K | 001-36730 | 10.1 | July 28, 2016 | |
123
10.35# | Executive Service Agreement, by and between INC Research Holding Limited and Alistair Macdonald. | 8-K | 001-36730 | 10.2 | July 28, 2016 | |
10.36# | Letter Agreement, by and between INC Research Holdings Limited and Alistair Macdonald, dated July 27, 2016. | 8-K | 001-36730 | 10.3 | July 28, 2016 | |
10.37# | Letter Agreement, by and between INC Research Holdings, Inc. and Alistair Macdonald, dated July 27, 2016. | 8-K | 001-36730 | 10.4 | July 28, 2016 | |
10.38 | Stock Repurchase Agreement, dated August 12, 2016, by and among INC Research Holdings, Inc. and certain stockholders named therein. | 8-K | 001-36730 | 10.1 | August 18, 2016 | |
10.39 | First Amendment to Credit Agreement and Increase Revolving Joinder, dated August 31, 2016, among INC Research, LLC, as the Borrower, INC Research Holdings, Inc., Subsidiary Guarantors, lenders party to the Credit Agreement, dated May 14, 2015, and Wells Fargo Bank, National Association, as Administrative Agent. | 8-K | 001-36730 | 10.1 | August 31, 2016 | |
10.40# | Form of Retention Agreement for Participants. | 8-K | 001-36730 | 10.1 | September 15, 2016 | |
10.41# | INC Research Holdings, Inc. Executive Severance Plan adopted September 15, 2016. | 8-K | 001-36730 | 10.2 | September 15, 2016 | |
10.42# | Form of Restricted Stock Unit Award Agreement for U.S. Executives 2014 Equity Incentive Plan. | 10-Q | 001-36730 | 10.8 | October 31, 2016 | |
21.1 | List of Significant Subsidiaries of the Registrant. | — | — | — | Filed herewith | |
23.1 | Consent of Ernst & Young LLP. | — | — | — | Filed herewith | |
23.2 | Consent of Deloitte & Touche LLP. | — | — | — | Filed herewith | |
31.1 | Certification of Chief Executive Officer pursuant to Section 302 of the Sarbanes-Oxley Act of 2002. | — | — | — | Filed herewith | |
31.2 | Certification of Executive Vice President and Chief Financial Officer pursuant to Section 302 of the Sarbanes-Oxley Act of 2002. | — | — | — | Filed herewith | |
32.1 | Certification of Chief Executive Officer pursuant to Section 906 of the Sarbanes-Oxley Act of 2002. | — | — | — | Furnished herewith | |
32.2 | Certification of Executive Vice President and Chief Financial Officer pursuant to Section 906 of the Sarbanes-Oxley Act of 2002. | — | — | — | Furnished herewith | |
101.INS | XBRL Instance Document. | — | — | — | Furnished herewith | |
101.SCH | XBRL Taxonomy Extension Schema Document. | — | — | — | Furnished herewith | |
101.CAL | XBRL Taxonomy Extension Calculation Linkbase Document. | — | — | — | Furnished herewith | |
101.DEF | XBRL Taxonomy Extension Definition Linkbase Document. | — | — | — | Furnished herewith | |
101.LAB | XBRL Taxonomy Extension Label Linkbase Document. | — | — | — | Furnished herewith | |
101.PRE | Taxonomy Extension Presentation Linkbase Document. | — | — | — | Furnished herewith | |
# Management contract or compensatory plan.
124