Attached files
| file | filename |
|---|---|
| EX-32.2 - EXHIBIT 32.2 - FORUM ENERGY TECHNOLOGIES, INC. | fetex322201610-k.htm |
| EX-32.1 - EXHIBIT 32.1 - FORUM ENERGY TECHNOLOGIES, INC. | fetex321201610-k.htm |
| EX-31.2 - EXHIBIT 31.2 - FORUM ENERGY TECHNOLOGIES, INC. | fetex312201610-k.htm |
| EX-31.1 - EXHIBIT 31.1 - FORUM ENERGY TECHNOLOGIES, INC. | fetex311201610-k.htm |
| EX-23.1 - CONSENT OF PRICEWATERHOUSECOOPERS LLP - FORUM ENERGY TECHNOLOGIES, INC. | exhibit231pwcconsent201610.htm |
| EX-21.1 - LIST OF SUBSIDIARIES - FORUM ENERGY TECHNOLOGIES, INC. | exhibit211subsidiaries2016.htm |
UNITED STATES SECURITIES AND EXCHANGE COMMISSION
WASHINGTON, D.C. 20549
___________________________________
FORM 10-K
____________________________________
þ | ANNUAL REPORT PURSUANT TO SECTION 13 OR 15(d) OF THE SECURITIES EXCHANGE ACT OF 1934 | |
For the Fiscal Year Ended December 31, 2016 | ||
OR
o | TRANSITION REPORT PURSUANT TO SECTION 13 OR 15(d) OF THE SECURITIES EXCHANGE ACT OF 1934 | |
For the transition period from __________ to __________
Commission File Number 001-35504
FORUM ENERGY TECHNOLOGIES, INC.
(Exact name of registrant as specified in its charter)
Delaware | 61-1488595 | |
(State or other jurisdiction of incorporation or organization) | (I.R.S. Employer Identification No.) | |
920 Memorial City Way, Suite 1000
Houston, Texas 77024
(Address of principal executive offices)
Registrant’s telephone number, including area code: (281) 949-2500
Securities registered pursuant to Section 12(b) of the Act:
Common stock, $0.01 par value | New York Stock Exchange | |
(Title of Each Class) | (Name of Each Exchange on Which Registered) | |
Securities registered pursuant to Section 12(g) of the Act: None
Indicate by check mark if the registrant is a well-known seasoned issuer, as defined in Rule 405 of the Securities Act. Yes þ No o
Indicate by check mark if the registrant is not required to file reports pursuant to Section 13 or Section 15(d) of the Act. Yes o No þ
Indicate by check mark whether the registrant (1) has filed all reports required to be filed by Section 13 or 15(d) of the Securities Exchange Act of 1934 during the preceding 12 months (or for such shorter period that the registrant was required to file such reports), and (2) has been subject to such filing requirements for the past 90 days. Yes þ No o
Indicate by check mark whether the registrant has submitted electronically and posted on its corporate Web site, if any, every Interactive Data File required to be submitted and posted pursuant to Rule 405 of Regulation S-T during the preceding 12 months (or for such shorter period that the registrant was required to submit and post such files). Yes þ No o
Indicate by check mark if disclosure of delinquent filers pursuant to Item 405 of Regulation S-K is not contained herein, and will not be contained, to the best of registrant’s knowledge, in definitive proxy or information statements incorporated by reference in Part III of this Form 10-K or any amendment to this Form 10-K. o
Indicate by check mark whether the registrant is a large accelerated filer, an accelerated filer, a non-accelerated filer, or a smaller reporting company. See the definitions of "large accelerated filer," "accelerated filer" and "smaller reporting company" in Rule 12b-2 of the Exchange Act. (Check one):
Large accelerated filer þ | Accelerated filer o | Non-accelerated filer o | Smaller reporting company o | |||
(Do not check if a smaller reporting company) | ||||||
Indicate by check mark whether the registrant is a shell company (as defined in Rule 12b-2 of the Exchange Act). Yes o No þ
The aggregate market value of Common Stock held by non-affiliates on June 30, 2016, determined using the per share closing price on the New York Stock Exchange Composite tape of $17.31 on June 30, 2016, was approximately $1.2 billion. For this purpose, our executive officers and directors and SCF Partners L.P. and its affiliates are considered affiliates.
As of February 24, 2017, there were 96,081,493 common shares outstanding.
DOCUMENTS INCORPORATED BY REFERENCE
Portions of our Proxy Statement for the 2017 Annual Meeting of Stockholders are incorporated by reference into Part III of this report.
1
Forum Energy Technologies, Inc.
Index to Form 10-K
PART I | ||
PART II | ||
PART III | ||
PART IV | ||
2
PART I
Item 1. Business
Forum Energy Technologies, Inc., (“Forum,” the “Company,” “we” or “us”) a Delaware corporation, is a global oilfield products company, serving the drilling, subsea, completion, production and infrastructure sectors of the oil and natural gas industry. Our common shares are listed on the New York Stock Exchange ("NYSE") under the symbol "FET." Our principal executive offices are located at 920 Memorial City Way, Suite 1000, Houston, Texas 77024, our telephone number is (281) 949-2500, and our website is www.f-e-t.com. Our Annual Reports on Form 10-K, quarterly reports on Form 10-Q and current reports on Form 8-K, and all amendments thereto, are available free of charge on our Internet website as soon as reasonably practicable after such reports are electronically filed with or furnished to the Securities and Exchange Commission ("SEC"). These reports are also available at the SEC's Internet website at www.sec.gov. Information contained on or accessible from our website is not incorporated by reference into this Annual Report on Form 10-K and should not be considered part of this report or any other filing that we make with the SEC.
Overview
We design, manufacture and distribute products and engage in aftermarket services, parts supply and related services that complement our product offering. Our product offering includes a mix of highly engineered capital products and frequently replaced items that are used in the exploration, development, production and transportation of oil and natural gas. Our capital products are targeted at: drilling rig equipment for new rigs, upgrades and refurbishment projects; subsea construction and development projects; the placement of production equipment on new producing wells; pressure pumping equipment; and downstream capital projects. Our engineered systems are critical components used on drilling rigs, for well completions or in the course of subsea operations, while our consumable products are used to maintain efficient and safe operations at well sites in the well construction process, within the supporting infrastructure and at processing centers and refineries. Historically, over 60% of our revenue is derived from activity-based consumable products, while the balance is derived from capital products and a small amount from rental and other services.
We seek to design, manufacture and supply reliable products that create value for our diverse customer base, which includes, among others, oil and natural gas operators, land and offshore drilling contractors, oilfield service companies, subsea construction and service companies in both oil and natural gas and non-oil and natural gas industries, and pipeline and refinery operators.
We operate three business segments, Drilling & Subsea, Completions, and Production & Infrastructure. The table below provides a summary of proportional revenue contributions from our three business segments and our primary geographic markets over the last three years:
Percentage of revenue | ||||||||
Year ended December 31, | ||||||||
2016 | 2015 | 2014 | ||||||
Drilling & Subsea | 38 | % | 45 | % | 50 | % | ||
Completions | 22 | % | 25 | % | 25 | % | ||
Production & Infrastructure | 40 | % | 30 | % | 25 | % | ||
Total | 100 | % | 100 | % | 100 | % | ||
United States | 62 | % | 60 | % | 60 | % | ||
Canada | 7 | % | 5 | % | 6 | % | ||
Other International | 31 | % | 35 | % | 34 | % | ||
Total | 100 | % | 100 | % | 100 | % | ||
We incorporate by reference in response to this item the segment and geographic information for the last three years set forth in "Management's Discussion and Analysis of Financial Condition and Results of Operations – Results of operations" in Item 7 of this Annual Report on Form 10-K and Note 15 of the Notes to consolidated financial statements included in Item 8 of this Annual Report on Form 10-K. We also incorporate by reference in response to this item the information with respect to acquisitions set forth in "Management's Discussion and Analysis of Financial Condition and
3
Results of Operations – Acquisitions" in Item 7 and in Note 3 of our Notes to consolidated financial statements included in Item 8 of this Annual Report on Form 10-K.
Drilling & Subsea segment
In our Drilling & Subsea segment, we design, manufacture and supply products and provide related services to the drilling and subsea construction markets. Through this segment, we offer drilling technologies, including capital equipment and a broad line of products consumed in the drilling process; and subsea technologies, including robotic vehicles and other capital equipment, specialty components and tooling, a broad suite of complementary subsea technical services and rental items, and products used in pipeline infrastructure.
There are several factors that drive demand for our Drilling & Subsea segment. Our Drilling Technologies product line is influenced by global drilling activity, the level of capital investment in drilling rigs, rig upgrades and equipment replacement as drilling contractors modify their existing rigs to improve efficiency and safety, and the number of rigs and well service equipment in use and the severity of the conditions under which they operate. Demand for our subsea products is impacted by global offshore activity, subsea equipment and pipeline installation, repair and maintenance spending, and growth in offshore resource development.
Drilling Technologies. We provide both drilling capital equipment and consumables, with a focus on products that enhance our customers' handling of tubulars and drilling fluids on the drilling rig. Our product offering includes powered and manual tubular handling equipment; specialized torque equipment; customized offline crane systems; drilling data acquisition management systems; pumps, pump parts, valves, and manifolds; drilling, well servicing and hydraulic fracturing fluid end components, and a broad line of items consumed in the drilling process.
Drilling capital equipment. We design and manufacture a range of powered and manual tubular handling tools used on onshore and offshore drilling rigs. Our Forum B+V Oil Tools and Wrangler™ branded tools reduce direct human involvement in the handling of pipe during drilling operations, improving safety, speed and efficiency of operations. Our tubular handling tools include elevators, clamps, slip handles, tong handles, powered slips, spiders and kelly spinners. Our hydraulic catwalks mechanize the lifting and lowering of tubulars to and from the drill floor, eliminating or reducing the need for traditional drill pipe and casing "pick-up and lay-down" operations with associated personnel. In addition, our make-up and break-out tools, called Forum B+V Oil Tools Floorhand™ and Wrangler Roughneck™, automate a potentially dangerous rig floor task and improve rig drilling speed and safety. We also design and manufacture specialized torque equipment and related control systems for tubular connections, including high torque stroking, or bucking units, fully rotational torque units, portable torque units for field deployment, and provide aftermarket service. In addition, we design and manufacture a range of rig-based offline activity cranes, multi-purpose cranes and personnel transfer solutions. Many of these cranes are fit-for-purpose multi-axis cranes that provide access to hard-to-reach places and eliminate the need for manual interface.
In addition to powered tubular handling equipment, materials handling and personnel transfer equipment, we design and manufacture drilling manifold systems and high pressure piping packages. We also manufacture drill floor instrumentation and monitoring systems. These systems provide real-time monitoring and logging of drilling data to drilling contractors, and oil and natural gas producers on the rig and at remote locations.
Finally, we repair and service drilling equipment for both land and offshore rigs. Many of our service employees work in the field to address problems at the rig site.
Consumable products. We manufacture a range of consumable products used on drilling rigs, well servicing rigs, pressure pumping units, and hydraulic fracturing systems. Our consumable products include valves, centrifugal pumps, mud pump parts, rig sensors, inserts, and dies. We are also a supplier of oilfield bearings to original equipment manufacturers and repair businesses for use on drilling and well stimulation equipment.
Subsea Technologies. We design and manufacture capital equipment and specialty components used in the subsea sector and provide a broad suite of complementary subsea technical services and rental items. We have a core focus on the design and manufacture of remotely operated vehicle ("ROV") systems and other specialty subsea vehicles, as well as critical components of these vehicles. Many of our related technical services complement our vehicle offerings.
Subsea vehicles. We are a leading designer and manufacturer of a wide range of ROVs that we supply to the offshore subsea construction, observation and related service markets. The market for subsea ROVs can be segmented into three broad classes of vehicles based on size and category of operations: (1) large work-class vehicles and trenchers for subsea construction and installation activities, (2) drilling-class vehicles deployed from and for use around an
4
offshore rig and (3) observation-class vehicles for inspection and light manipulation. We are a leading provider of work-class and observation-class vehicles.
We design and manufacture large work-class ROVs through our Perry brand. These vehicles are principally used in deepwater construction applications with the largest vehicles providing up to 200 horsepower, exceeding 1,200 pounds of payload capacity and having the capability to work in depths up to 4,000 meters. In addition to work-class ROVs, we design and manufacture large subsea trenchers that travel along the sea floor for digging, installation and burial operations. The largest of these subsea trenchers provides up to 1,500 horsepower and is able to cut over three meters deep into the seafloor to lay pipelines, power cables or communications cables.
Our Sub-Atlantic branded observation-class vehicles are electrically powered and are principally used for inspection, survey and light manipulation, and serve a wide range of industries.
Our subsea vehicle customers are primarily large offshore construction companies, but also include non-oil and natural gas industry entities, such as a range of governmental organizations including navies, maritime science and geoscience research organizations, offshore wind power companies and other industries operating in marine environments.
Subsea products. In addition to subsea vehicles, we are a leading manufacturer of subsea products and components. We design and manufacture a group of products that are used in and around the ROV. For example, we manufacture Dynacon™ branded ROV launch and recovery systems, Syntech™ branded syntactic foam buoyancy components, Sub-Atlantic branded ROV thrusters, and a wide range of hydraulic power units and valve packs. We design and manufacture these ROV components for incorporation into our own vehicles as well as for sale to other ROV manufacturers. We also provide a broad suite of subsea tooling, both industry standard and custom designed.
In addition to vehicle-related subsea products, we provide products used in subsea infrastructure, including subsea pipeline inspection gauge launching and receiving systems, and subsea connectors. Our primary customers in this product line are offshore pipeline construction companies.
Subsea technical services and rental. We maintain a fleet of subsea rental items, primarily subsea positioning equipment. Our customers for rental items are primarily subsea construction and offshore service companies. In addition, we offer a system that offers a complete solution for digital video capture, playback, processing and reporting of subsea inspection survey data. We also maintain a geophysical and geotechnical engineering group that provides consulting services to the oil and natural gas, and marine industries, typically to interpret and analyze third party subsea data provided by clients.
Completions segment
In our Completions segment, we design, manufacture and supply products and provide related services to the well construction, completion, stimulation and intervention markets. Through this segment, we offer downhole technologies, including cementing and casing tools, completion products, and a range of downhole cable protection solutions; and stimulation and intervention technologies, including pumps and well stimulation consumable products and related recertification and refurbishment services.
There are several factors driving demand for our Completions segment. Our Downhole Technologies product line is impacted by the level of well completion activity, and complexity of well construction and completion. Our Stimulation and Intervention product line is impacted by the use of hydraulic fracturing to develop oil and natural gas reserves in shale or tight sand basins across North America and the level of workover and intervention activity.
Downhole Technologies. We manufacture a broad line of downhole products that are consumed during the well construction, completion and production enhancement processes.
Casing and cementing tools. Through our Davis-Lynch™ branded downhole well construction and completion tools business, we design and manufacture products used in the construction of oil and natural gas wells. We design and manufacture a full range of centralizers, float equipment, stage cementing tools, inflatable packers, flotation collars, cementing plugs, fill and circulation tools for running casing, casing hangers and surge reduction equipment. Our products are used in the construction of onshore and offshore wells.
5
Completion products. We manufacture a line of downhole completion tools, including composite plugs, wireline flow-control products and packers. Our composite plugs are primarily used for zonal isolation during multi-stage hydraulic fracturing in horizontal and vertical wells. The composite construction with metal slips allows the plugs to be drilled out quickly to improve service efficiency. We offer a variety of plug sizes to fit various casings as well as a range of temperature and pressure ratings to accommodate different well environments. Our wireline flow-control products include a number of components included in most completions such as landing nipples, circulating sleeves, blanking plugs and separation tools. Our packers include retrievable and permanent packers, bridge plugs, and accessories to oilfield service providers and packer repair companies.
Downhole protection systems. We offer a full range of downhole protection solutions through our Cannon Services™ brand. The clamp and protection system is used to shield downhole control lines, cables and gauges during installation and to provide protection during production enhancement operations. We design and manufacture a full range of downhole protection solutions for electrical submersible pump ("ESP") cabling, encapsulated control lines, sub-surface safety valves and permanent downhole gauges. We provide both standard and customized protection systems, and we utilize a range of materials in our products for various downhole environments.
Our primary customers in this product line are oil and natural gas producers, and service companies providing completion, ESP and other intervention services to producers.
Stimulation and Intervention. We provide a broad range of high pressure pumps and flow equipment used by well stimulation, or pressure pumping, companies during stimulation, intervention and flowback processes. We design and manufacture pressure control plug, choke and relief valves, swivel joints, pup joints and integral fittings, manifolds and manifold trailers, as well as triplex and quintuplex fluid-end assemblies. Frequent refurbishment and recertification of flow equipment is critical to ensuring the reliable and safe operation of a pressure pumping company's fleet. We perform these services at various locations and operate a fleet of mobile refurbishment and recertification tractor trailers, which can be deployed to the customer's yard. We serve many of the unconventional basins across North America and seek to position our stocking and service locations in proximity to our customers' operations.
We manufacture pressure control products that are used for well intervention operations and are sold directly to oilfield service companies and equipment rental companies. These products include both coiled tubing and wireline blowout preventers and their accessories. We also conduct aftermarket refurbishment and recertification services for pressure control equipment. In addition to blowout preventers for wireline units, we manufacture electro-mechanical wireline cables.
Our primary customers in the Stimulation and Intervention product line are pressure pumping and flowback service companies, although we also generate sales to original equipment manufacturers of pressure pumping units.
Global Tubing, LLC ("Global Tubing"), a joint venture among us and an equal partner (with Global Tubing's management retaining a small interest) is a manufacturer of coiled tubing strings and related services. Global Tubing® coiled tubing strings are consumable components of coiled tubing units that perform well completion and intervention activities. Our investment in Global Tubing is reported in the Completions segment using the equity method of accounting.
Production & Infrastructure segment
In our Production & Infrastructure segment, we design, manufacture and supply products and provide related equipment and services to production and infrastructure markets. Through this segment, we supply production equipment, including well site production equipment and process equipment; and valve solutions, including a broad range of industrial and process valves.
The level of spending to bring new wells on production, including the related infrastructure is the primary driver for our Production & Infrastructure segment. Our Production Equipment product line also has exposure to the amount of spending on midstream and downstream projects as it offers products that go from the well site to inside the refinery fence. Our Valve Solutions product line is impacted by the level of infrastructure additions, upgrades and maintenance activities across the oil and natural gas industry, including the upstream, midstream and downstream sectors. This includes heavy oil development in Canada and investments in new petrochemical facilities. In addition, our valves are used in the power, process and mining industries.
Production Equipment. Our surface Production Equipment product line provides engineered process systems and field services for capital equipment used at the wellsite and, for production processing, in the United States. Once a well has been drilled, completed and brought on stream, we provide the well operator-producer with the process equipment necessary to make the oil or natural gas ready for transmission. We engineer, fabricate and install tanks,
6
separators, packaged production systems and American Society of Mechanical Engineers ("ASME") and American Petroleum Institute ("API") coded and non-coded pressure vessels, skidded vessels with gas measurement, modular process plants, header and manifold skids, process and flow control equipment and separators to help clean and process oil or natural gas as it travels from the wellhead and along the transmission line to the refinery. Our customers are principally oil and natural gas operators/producers, and our manufacturing and staging locations are positioned across North America to best serve the key emerging shale and unconventional resource plays.
A key to our competiveness is manufacturing tanks and pressure vessels in relatively close proximity to their location of use to reduce freight costs, as well as helping our customers manage their production equipment needs as their drilling programs progress. We have five North American manufacturing locations and two service centers. To ensure smooth delivery of equipment, we maintain a fleet of specialized trucks and crews that can deliver and install the production equipment on the well site.
We also design and provide process oil and produced water treatment equipment, including desalters and dehydrators, used in refineries worldwide. We have a team of technicians and field service engineers for repair and installation, and we supply a broad range of replacement parts for our equipment and other manufacturers. This equipment removes sand, water and suspended solids from hydrocarbons prior to their refining.
Valve Solutions. We design, manufacture and provide a wide range of industrial valves that principally serve the upstream, midstream and downstream markets of the oil and natural gas industry. To a lesser extent, our valves serve general industrial, power and process industry customers as well as the mining industry. We provide ball, gate, globe, check and butterfly valves across a range of sizes and applications.
We market our valves to our customers and end users through our recognized brands: PBV™, DSI®, Quadrant®, Accuseal® and ABZ™. Much of our production is sold through distribution supply companies, with our marketing efforts targeting end users for pull through of our products. Our global sales force and representatives cover approximately 30 countries, with local sales and distribution in Australia and Canada. Our Canadian company provides significant exposure to the heavy oil projects.
Our manufacturing and supply chain systems enable us to design and produce high-quality engineered valves, as well as provide standardized products, while maintaining competitive pricing and minimizing capital requirements. We also utilize our international manufacturing partners to produce components and completed products for a number of our other valve brands.
Depending on the product, we manufacture our valves to conform to the standards of one or more of the API, American National Standards Institute, American Bureau of Shipping, and International Organization for Standardization and/or other relevant standards governing the design and manufacture of industrial valves. Through our Valve Solutions product line, we participate in the API's standard-setting process.
Business history
Forum was incorporated in 2005 and formed through a series of acquisitions. In August 2010, Forum Oilfield Technologies, Inc. (“FOT”), was renamed Forum Energy Technologies, Inc. On April 17, 2012, we completed our initial public offering.
Backlog
As we provide a mix of capital goods, consumable products, repair parts, and rental services, a majority of our business does not require lengthy lead times. A majority of the orders and commitments included in our backlog as of December 31, 2016 were scheduled to be delivered within six months. Our backlog, net of cancellations, was approximately $165 million at December 31, 2016 and approximately $183 million at December 31, 2015.
Substantially all of the projects currently included in our backlog are subject to change and/or termination at the option of the customer. In the case of a change or termination, the customer is generally required to pay us for work performed and other costs necessarily incurred as a result of the change or termination. Prior to 2015, terminations and cancellations had not been material to our overall operating results. Since 2015, we have observed an increase in terminations and cancellations. Going forward, it is difficult to predict how much of our current backlog will be delayed or terminated, or subject to changes, as well as our ability to collect termination or change fees.
7
Our consumable and repair products are predominantly off-the-shelf items requiring short lead-times, generally less than six months, and our related refurbishment or other services are also not contracted with significant lead time. The composition of our backlog is reflective of our mix of capital equipment, consumable products, aftermarket and other related items. Our bookings, which consist of written orders or commitments for our products or related services, during the years ended December 31, 2016 and 2015 were approximately $597 million and $870 million, respectively.
Customers
No customer represented more than 10% of consolidated revenue in any of the last three years.
Seasonality
A substantial portion of our business is not significantly impacted by seasonality. We do, however, generally experience lower sales and profitability in the fourth quarter due to a decrease in working days caused by calendar year-end holidays, and manufacturing and shipping delays caused by weather. A small portion of the revenue we generate from selected Canadian operations often benefits from higher first quarter activity levels, as operators take advantage of the winter freeze to gain access to remote drilling and production areas. We also experience some exposure to seasonality through the portion of our subsea rental business that serves the North Sea. Due to the harsh winter environment, it is customary for North Sea activity to slow down between the months of November and February. Revenue exposed to this type of seasonality, however, comprised less than 5% of our overall revenue in 2016.
Competition
The markets in which we operate are highly competitive. We compete with a number of companies, some of which have greater financial and other resources than we do. The principal competitive factors in our markets are product quality and performance, price, breadth of product offering, availability of products and services, distribution capabilities, responsiveness to customer needs and reputation for service. We believe our products and services in each segment are at least comparable in price, quality, performance and dependability with our competitors' offerings. We seek to differentiate ourselves from our competitors by providing a rapid response to the needs of our customers, a high level of customer service, and innovative product development initiatives. Some of our competitors expend greater amounts of money on formal research and engineering efforts than we do. We believe, however, that our product development efforts are enhanced by the investment of management time we make to improve our customer service and to work with our customers on their specific product needs and challenges.
Although we have no single competitor across all of our product lines, the companies we compete with across the greatest number of our product lines include Cameron International Corporation (a subsidiary of Schlumberger), Exterran Corp., National Oilwell Varco, Inc., TechnipFMC plc, Weatherford International, Ltd., and Weir SPM, a subsidiary of The Weir Group.
Patents, trademarks and other intellectual property
We currently hold multiple U.S. and international patents and trademarks and have a number of pending patent and trademark applications. Although in the aggregate our patents, trademarks and licenses are important to us, we do not regard any single patent, trademark or license as critical or essential to our business as a whole.
Raw materials
We acquire component parts, products and raw materials from suppliers, including foundries, forge shops, and original equipment manufacturers. The prices we pay for our raw materials may be affected by, among other things, energy, steel and other commodity prices, tariffs and duties on imported materials and foreign currency exchange rates. Certain of our component parts, products or raw materials, such as bearings, are only available from a limited number of suppliers. Please see "Risk factors—Risks related to our business—We are subject to the risk of supplier concentration."
We cannot assure you that we will be able to continue to purchase raw materials on a timely basis or at acceptable prices. We generally try to purchase our raw materials from multiple suppliers so we are not dependent on any one supplier, but this is not always possible.
8
Working capital
We fund our business operations through a combination of available cash and equivalents, short-term investments, and cash flow generated from operations. In addition, the revolving portion of our senior secured credit facility is available for working capital needs. For a summary of our credit facility, please read "Management's Discussion and Analysis of Financial Condition and Results of Operations – Liquidity and capital resources."
Inventory
An important consideration for many of our customers in selecting a vendor is timely availability of the product. Customers may pay a premium for earlier or immediate availability because of the cost of delays in critical operations. We stock our consumable products in regional warehouses around the world so that we can have these products available for our customers when needed. This availability is especially critical for certain consumable products, causing us to carry substantial inventories for these products. For critical capital items in which demand is expected to be strong, we often build certain items before we have a firm order. Our having such goods available on short notice can be of great value to our customers. We also stockpile raw materials and components in order to be in a position to build products in response to market demand.
We typically offer our customers payment terms of net 30 days, although during downturns in activity such as our industry experienced beginning in the second half of 2014, customers often take 60 days or more to settle accounts. For sales into certain countries or for select customers, we might require payment upfront or credit support through a letter of credit. For longer term projects, we typically require progress payments as important milestones are reached. On average we collect our receivables in about 60 days from shipment resulting in a substantial investment in accounts receivable. Likewise, standard terms with our vendors are net 60 days. For critical items sourced from significant vendors we have settled accounts more quickly, sometimes in exchange for early payment discounts.
Environmental, transportation, health and safety regulation
Our operations are subject to numerous stringent and complex laws and regulations governing the discharge of materials into the environment, health and safety aspects of our operations, or otherwise relating to human health and environmental protection. We also operate vehicles that are subject to federal and state transportation regulations. Failure to comply with these laws or regulations or to obtain or comply with permits may result in the assessment of administrative, civil and criminal penalties, imposition of remedial or corrective action requirements, and the imposition of injunctions to prohibit certain activities or force future compliance.
The trend in environmental regulation has been to impose increasingly stringent restrictions and limitations on activities that may impact the environment, and thus, any changes in environmental laws and regulations or in enforcement policies that result in more stringent and costly waste handling, storage, transport, disposal, or remediation requirements could have a material adverse effect on our operations and financial position. Moreover, accidental releases or spills of regulated substances may occur in the course of our operations, and we cannot assure you that we will not incur significant costs and liabilities as a result of such releases or spills, including any third party claims for damage to property, natural resources or persons.
The following is a summary of the more significant existing environmental, health and safety laws and regulations to which our business operations are subject and for which compliance may have a material adverse impact on our capital expenditures, results of operations or financial position.
Hazardous substances and waste
The Resource Conservation and Recovery Act (the "RCRA") and comparable state statutes, regulate the generation, transportation, treatment, storage, disposal and cleanup of hazardous and non-hazardous wastes. Under the auspices of the Environmental Protection Agency (the "EPA"), the individual states administer some or all of the provisions of the RCRA, sometimes in conjunction with their own, more stringent requirements. We are required to manage the transportation, storage and disposal of hazardous and non-hazardous wastes in compliance with the RCRA.
9
The Comprehensive Environmental Response, Compensation, and Liability Act (the "CERCLA"), also known as the Superfund law, imposes joint and several liability, without regard to fault or legality of conduct, on classes of persons who are considered to be responsible for the release of a hazardous substance into the environment. These persons include the owner or operator of the site where the release occurred, and anyone who disposed or arranged for the disposal of a hazardous substance released at the site. We currently own, lease, or operate numerous properties that have been used for manufacturing and other operations for many years. We also contract with waste removal services and landfills. These properties and the substances disposed or released on them may be subject to the CERCLA, RCRA and analogous state laws. Under such laws, we could be required to remove previously disposed substances and wastes, remediate contaminated property, or perform remedial operations to prevent future contamination. In addition, it is not uncommon for neighboring landowners and other third-parties to file claims for personal injury and property damage allegedly caused by hazardous substances released into the environment.
Water discharges
The Federal Water Pollution Control Act (the "Clean Water Act") and analogous state laws impose restrictions and strict controls with respect to the discharge of pollutants, including spills and leaks of oil and other substances, into waters of the United States. The discharge of pollutants into regulated waters is prohibited, except in accordance with the terms of a permit issued by the EPA or an analogous state agency. A responsible party includes the owner or operator of a facility from which a discharge occurs. The Clean Water Act and analogous state laws provide for administrative, civil and criminal penalties for unauthorized discharges and, together with the Oil Pollution Act of 1990, impose rigorous requirements for spill prevention and response planning, as well as substantial potential liability for the costs of removal, remediation, and damages in connection with any unauthorized discharges.
Air emissions
The Federal Clean Air Act (the "Clean Air Act") and comparable state laws regulate emissions of various air pollutants through air emissions permitting programs and the imposition of other emission control requirements. In addition, the EPA has developed, and continues to develop, stringent regulations governing emissions of toxic air pollutants at specified sources. Non-compliance with air permits or other requirements of the Clean Air Act and associated state laws and regulations can result in the imposition of administrative, civil and criminal penalties, as well as the issuance of orders or injunctions limiting or prohibiting non-compliant operations.
Climate change
In December 2009, the EPA determined that emissions of carbon dioxide, methane and other "greenhouse gases" (“GHGs”) present an endangerment to public health and the environment because emissions of such gases are, according to the EPA, contributing to warming of the earth's atmosphere and other climatic changes. Based on these findings, the EPA has begun adopting and implementing regulations to restrict emissions of greenhouse gases under existing provisions of the Clean Air Act.
In addition, the U.S. Congress has from time to time considered adopting legislation to reduce emissions of greenhouse gases and almost one-half of the states have already taken legal measures to reduce emissions of greenhouse gases primarily through the planned development of greenhouse gas emission inventories and/or regional greenhouse gas cap and trade programs. Most of these cap and trade programs work by requiring major sources of emissions, such as electric power plants, or major producers of fuels, such as refineries and gas processing plants, to acquire and surrender emission allowances. The number of allowances available for purchase is reduced each year in an effort to achieve the overall greenhouse gas emission reduction goal. Finally, in April 2016, the United States signed the Paris Agreement, which requires member countries to review and “represent a progression” in their nationally determined contributions, which set GHG emission reduction goals, every five years.
The adoption of legislation or regulatory programs to reduce emissions of greenhouse gases could require us to incur increased operating costs, such as costs to purchase and operate emissions control systems, to acquire emissions allowances or comply with new regulatory or reporting requirements. Any such legislation or regulatory programs could also increase the cost of consuming, and thereby reduce demand for, the oil and natural gas produced by our customers. Consequently, legislation and regulatory programs to reduce emissions of greenhouse gases could have an adverse effect on our business, financial condition and results of operations. Finally, it should be noted that some scientists have concluded that increasing concentrations of greenhouse gases in the earth's atmosphere may produce climate changes that have significant physical effects, such as increased frequency and severity of storms, droughts, and floods and other climatic events. If any such effects were to occur, they could have an adverse effect on our business, financial condition, results of operations and cash flow. For more information, please read “Risk Factors-Climate change
10
legislation or regulations restricting emissions of greenhouse gases could increase our operating costs or reduce demand for our products.”
Hydraulic fracturing
A significant percentage of our customers' oil and natural gas production is being developed from unconventional sources, such as hydrocarbon shales. These formations require hydraulic fracturing completion processes to release the oil or natural gas from the rock so that it can flow through the formations. Hydraulic fracturing involves the injection of water, sand and chemicals under pressure into the formation to stimulate production. A number of federal agencies, including the EPA and the U.S. Department of Energy, are analyzing, or have been requested to review, a variety of environmental issues associated with shale development, including hydraulic fracturing. For instance, the EPA released the final results of its comprehensive research study on the potential adverse impacts that hydraulic fracturing may have on drinking water resources in December 2016. The EPA concluded that hydraulic fracturing activities can impact drinking water resources under some circumstances, including large volume spills and inadequate mechanical integrity of wells. In addition, some states have adopted, and other states are considering adopting, regulations that could impose more stringent disclosure and/or well construction requirements on hydraulic fracturing operations. Local governments may also seek to adopt ordinances within their jurisdictions regulating the time, place and manner of drilling activities in general or hydraulic fracturing activities in particular, in some cases banning hydraulic fracturing entirely.We cannot predict whether any such legislation will ever be enacted and if so, what its provisions would be. If additional levels of regulation and permits were required through the adoption of new laws and regulations at the federal or state level, that could lead to delays, increased operating costs and process prohibitions for our customers that could reduce demand for our products and services, which would materially adversely affect our revenues, results of operations and cash flows.
Employee health and safety
We are subject to a number of federal and state laws and regulations, including the federal Occupational Safety and Health Act ("OSHA") and comparable state statutes, establishing requirements to protect the health and safety of workers. In addition, the OSHA hazard communication standard, the EPA community right-to-know regulations under Title III of the federal Superfund Amendment and Reauthorization Act and comparable state statutes require that information be maintained concerning hazardous materials used or produced in our operations and that this information be provided to employees, state and local government authorities and the public. Substantial fines and penalties can be imposed and orders or injunctions limiting or prohibiting certain operations may be issued in connection with any failure to comply with laws and regulations relating to worker health and safety. For more information, please read “Risk Factors-Potential legislation or regulations restricting the use of hydraulic fracturing could reduce demand for our products.”
Offshore regulation
Events in recent years have heightened environmental and regulatory concerns about the offshore oil and natural gas industry. From time to time, governing bodies may propose and have enacted legislation or regulations that may materially limit or prohibit offshore drilling in certain areas. If laws are enacted or other governmental action is taken that delay, restrict or prohibit offshore operations in our customers' expected areas of operation, our business could be materially adversely affected. New or newly interpreted regulations and other regulatory initiatives by U.S. governmental agencies have created significant uncertainty regarding the outlook for offshore activity in the U.S. Gulf of Mexico and possible implications for regions outside of the U.S. Gulf of Mexico. Third party challenges to industry operations in the U.S. Gulf of Mexico may also serve to further delay or restrict activities. If the new regulations, operating procedures and possibility of increased legal liability are viewed by our current or future customers as a significant impairment to expected profitability on projects, then they could discontinue or curtail their offshore operations thereby reducing demand for our offshore products and services.
We also operate in non-U.S. jurisdictions, which may impose similar regulations, prohibitions or liabilities.
Operating risk and insurance
We maintain insurance coverage of types and amounts that we believe to be customary and reasonable for companies of our size and with similar operations. In accordance with industry practice, however, we do not maintain insurance coverage against all of the operating risks to which our business is exposed. Therefore, there is a risk our insurance program may not be sufficient to cover any particular loss or all losses. Currently, our insurance program includes coverage for, among other things, general liability, umbrella liability, sudden and accidental pollution, personal property, vehicle, workers' compensation, and employer's liability coverage.
11
Employees
As of December 31, 2016, we had approximately 2,050 employees. Of our total employees, approximately 1,400 were in the United States, 330 were in the United Kingdom, 100 were in Germany, 80 were in Canada and 140 were in other locations. We are not a party to any collective bargaining agreements, other than in our Hamburg, Germany and Monterrey, Mexico facilities, and we consider our relations with our employees to be satisfactory.
Item 1A. Risk Factors
Risks related to our business
We derive a substantial portion of our revenues from companies in or affiliated with the oil and natural gas industry, a historically cyclical industry, with levels of activity that are significantly affected by the levels and volatility of oil and natural gas prices. As a result, this cyclicality has caused, and will continue to cause fluctuations in our revenues and results of our operations.
We have experienced, and will continue to experience, fluctuations in revenues and operating results due to economic and business cycles. The willingness of oil and natural gas operators to make capital expenditures to explore for and produce oil and natural gas, the willingness of oilfield service companies to invest in capital equipment and the need of these customers to replenish consumable parts depends largely upon prevailing industry conditions that are influenced by numerous factors over which we have no control. Such factors include:
• | supply of and demand for oil and natural gas; |
• | level of prices, and expectations about future prices, of oil and natural gas; |
• | cost of exploring for, developing, producing and delivering oil and natural gas; |
• | level of drilling activity and drilling day rates; |
• | expected decline in rates of current and future production; |
• | discovery rates of new oil and natural gas reserves; |
• | ability of our customers to access new markets or areas of production or to continue to access current markets; |
• | weather conditions, including hurricanes, that can affect oil and natural gas operations over a wide area; |
• | more stringent restrictions in environmental regulation on activities that may impact the environment; |
• | moratoriums on drilling activity resulting in a cessation or disruption of operations; |
• | domestic and worldwide economic conditions; |
• | financial stability of our customers and other industry participants; |
• | political instability in oil and natural gas producing countries; |
• | conservation measures and technological advances affecting energy consumption; |
• | price and availability of alternative fuels; and |
• | merger and divestiture activity among oil and natural gas producers, drilling contractors and oilfield service companies. |
In the second half of 2014 the oil and natural gas industry began to experience a prolonged reduction in the overall level of exploration and development activities as a result of the decline in commodity prices that continued into late 2016. As a result, many of our customers reduced or delayed their oil and natural gas exploration and production spending, reducing the demand for our products and services and exerting downward pressure on the prices that we charge. These conditions have adversely impacted our business over the course of the last two years. Although crude oil prices increased from a low of $26 per barrel in February 2016 to a high of $54 per barrel in December 2016, market reports indicate that prices are not expected to increase materially in 2017. There can be no assurance that the demand or pricing for oil and natural gas will follow historic patterns or recover meaningfully in the near term. The prolonged reduction in oil and natural gas prices and depressed levels of exploration, development, and production activity may continue to negatively affect:
• | revenues, cash flows, and profitability; |
• | the ability to maintain or increase borrowing capacity; |
• | the ability to obtain additional capital to finance our business and the cost of that capital; |
• | the ability to collect outstanding amounts from our customers; and |
12
• | the ability to attract and retain skilled personnel to maintain our business or that will be needed in the event of an upturn in the demand for our products. |
Our inability to control the inherent risks of acquiring and integrating businesses could disrupt our business and adversely affect our operating results going forward.
We continuously evaluate acquisitions and dispositions and may elect to acquire or dispose of assets in the future. These activities may distract management from day-to-day tasks. Acquisitions involve numerous risks, including:
• | unanticipated costs and exposure to unforeseen liabilities; |
• | difficulty in integrating the operations and assets of the acquired businesses; |
• | potential loss of key employees and customers of the acquired company; |
• | potential inability to properly establish and maintain effective internal controls over an acquired company; |
• | risk of entering markets in which we have limited prior experience; and |
• | failure to realize the full range of synergies that were expected when assessing the value to be paid for the acquisition. |
Achieving the anticipated or desired benefits of our past or future acquisitions will depend, in part, upon whether the integration of the various businesses, products, services, technology and employees is accomplished in an efficient and effective manner. There can be no assurance that we will obtain these anticipated or desired benefits of our past or future acquisitions, and if we fail to manage these risks successfully, our results of operations could be adversely affected.
Our failure to achieve consolidation savings, to integrate the acquired businesses and assets into our existing operations successfully or to minimize any unforeseen operational difficulties could have a material adverse effect on our business. In addition, we may incur liabilities arising from events prior to the acquisition or prior to our establishment of adequate compliance oversight. While we generally seek to obtain indemnities for liabilities for events occurring before such acquisitions, these are limited in amount and duration, may be held to be unenforceable or the seller may not be able to indemnify us. We may also incur indebtedness or issue additional equity securities to finance future acquisitions. Debt service requirements could represent a burden on our results of operations and financial condition, and the issuance of additional equity securities could be dilutive to our existing stockholders. In addition, we may dispose of assets or products that investors may consider beneficial to us.
Our operating history may not be sufficient for investors to evaluate our business and prospects.
We have a relatively short operating history as a public company. In addition, we have completed a number of acquisitions since our formation. These factors may make it more difficult for investors to evaluate our business and prospects, and to forecast our future operating results. As a result, historical financial data may not give you an accurate indication of what our actual results would have been if subsequent acquisitions had been completed at the beginning of the periods presented or of what our future results of operations are likely to be. Our future results will depend on our ability to efficiently manage our combined operations and execute our business strategy.
Facility consolidations and expansions may subject us to risks of construction delays, cost overruns and operating inefficiencies.
We have consolidated and plan to continue to consolidate facilities to achieve operating efficiencies and reduce costs. These facility consolidations may be delayed and cause us to incur increased costs, product or service delivery delays, decreased responsiveness to customer needs, liabilities under terms and conditions of sale or other operational inefficiencies, or may not provide the benefits we anticipate. We may lose key personnel and operational knowledge that might lead to quality issues or delays in production.
In the future, we may grow our businesses through the construction of new facilities and expansions of our existing facilities. These projects, and any other capital asset construction projects which we may commence, are subject to similar risks of delay or cost overrun inherent in any construction project resulting from numerous factors, including the following:
• | difficulties or delays in obtaining land; |
• | shortages of key equipment, materials or skilled labor; |
13
• | unscheduled delays in the delivery of ordered materials and equipment; |
• | unanticipated cost increases; |
• | weather interferences; and |
• | difficulties in obtaining necessary permits or in meeting permit conditions. |
Our common stock price has been volatile, and we expect it to continue to remain volatile in the future.
The market price of common stock of companies engaged in the oil and natural gas equipment manufacturing and services industry has been volatile. Likewise, the market price of our common stock has varied significantly in the past, reaching a high of $23.55 per share on December 12, 2016 and a low of $8.54 per share on February 12, 2016, and we expect it to continue to remain volatile given the cyclical nature of our industry.
The downturn in the oil and natural gas industry has negatively affected and will likely continue to affect our ability to accurately predict customer demand, causing us to hold excess or obsolete inventory and experience a reduction in gross margins and financial results.
We cannot accurately predict what or how many products our customers will need in the future. Orders are placed with our suppliers based on forecasts of customer demand and, in some instances, we may establish buffer inventories to accommodate anticipated demand. For example, at certain times, we have built capital equipment before receiving customer orders, and we have kept our standardized downhole protection systems and certain of our flow iron products in stock and readily available for delivery on short notice from customers. Our forecasts of customer demand are based on multiple assumptions, each of which may introduce errors into the estimates. In addition, many of our suppliers, such as those for certain of our standardized valves, require a longer lead time to provide products than our customers demand for delivery of our finished products. If we overestimate customer demand, we may allocate resources to the purchase of material or manufactured products that we may not be able to sell when we expect to, if at all. As a result, we would hold excess or obsolete inventory, which would reduce gross margin and adversely affect financial results, or write down the value of inventory. Conversely, if we underestimate customer demand or if insufficient manufacturing capacity is available, we would miss revenue opportunities and potentially lose market share and damage our customer relationships. In addition, any future significant cancellations or deferrals of product orders or the return of previously sold products could materially and adversely affect profit margins, increase product obsolescence and restrict our ability to fund our operations.
A substantial portion of our business is driven by our customers’ spending on capital equipment such as drilling rigs. As a result of the substantial decrease in commodity prices, we expect much of our customer base to maintain capital spending at their current low levels, or to decrease their spending even further.
In various segments of the energy industry there have been high levels of demand for construction of capital intensive equipment in recent years, some of which has a long life once introduced into the industry. High levels of investment can produce excess supply of equipment for many years, reducing day rates and undermining the economics for new capital equipment orders. In addition, decreases in commodity prices resulted in a significant reduction in the North America rig count since June 2014, which has only recently begun to recover. As a result, many of our customers reduced capital expenditures beginning in 2015, and, if commodity prices remain at current levels, our customers may continue to curtail spending, may fail to resume spending at prior levels. When spending levels by our customers fall, we experience decreased demand for our capital equipment products. For example, starting in the second half of 2014 we saw spending levels on drilling rigs decrease relative to the pace of investment in the previous two years due to lower drilling activity. This resulted in lower revenues for us from capital equipment orders and consumables in 2014, 2015 and 2016. This reduction in capital spending is spread across most energy sectors that we supply. Our financial results have been negatively impacted by the recent and ongoing reduction in capital equipment spending in the oilfield services industry, and we expect that this will continue until oil prices increase substantially.
Our indebtedness could restrict our operations and make us more vulnerable to adverse economic conditions.
We currently have a substantial amount of indebtedness. In addition to our $400.0 million of 6.25% senior unsecured notes due October 2021, we may borrow under our $140.0 million senior secured revolving credit facility. Our level of indebtedness may adversely affect our operations and limit our growth, and we may have difficulty making debt service payments on our indebtedness as such payments become due. Our level of indebtedness may affect our operations in several ways, including the following:
• | our indebtedness may increase our vulnerability to general adverse economic and industry conditions; |
14
• | the covenants contained in the agreements that govern our indebtedness limit our ability to borrow funds, dispose of assets, pay dividends and make certain investments; |
• | our debt covenants also affect our flexibility in planning for, and reacting to, changes in the economy and in its industry; |
• | any failure to comply with the financial or other covenants of our indebtedness could result in an event of default, which could result in some or all of our indebtedness becoming immediately due and payable; |
• | our indebtedness could impair our ability to obtain additional financing in the future for working capital, capital expenditures, acquisitions or other general corporate purposes; and |
• | our business may not generate sufficient cash flow from operations to enable us to meet our debt obligations. |
The indenture governing our notes and our credit facility contains operating and financial restrictions that may restrict our business and financing activities.
Our indenture and credit facility contain, and any future indebtedness we incur may contain, a number of restrictive covenants that will impose significant operating and financial restrictions on us, including restrictions on our ability to, among other things:
• | pay dividends on, purchase or redeem our common stock; |
• | make certain investments; |
• | incur or guarantee additional indebtedness or issue certain types of equity securities; |
• | create certain liens; |
• | sell assets, including equity interests in our restricted subsidiaries; |
• | redeem or prepay subordinated debt; |
• | restrict dividends or other payments of our restricted subsidiaries; |
• | consolidate, merge or transfer all or substantially all of our assets; |
• | engage in transactions with affiliates; or |
• | create unrestricted subsidiaries. |
Our credit facility also contains covenants, which, among other things, require us, on a consolidated basis, to maintain specified financial ratios or conditions. As a result of these covenants, we may be limited in the manner in which we conduct our business, and we may be unable to engage in favorable business activities or finance future operations or capital needs. Our ability to borrow under the credit facility and comply with some of the covenants, ratios or tests contained in our indenture and credit facility may be affected by events beyond our control. If market or other economic conditions continue or deteriorate, and our financial performance does not improve, our ability to borrow under our credit facility will be reduced and our ability to comply with these covenants, ratios or tests may be impaired. A failure to comply with the covenants, ratios or tests or any future indebtedness could result in an event of default, which, if not cured or waived, could have a material adverse effect on our business, financial condition and results of operations.
We are subject to the risk of supplier concentration.
Certain of our product lines depend on a limited number of third party suppliers and vendors. In some cases the vendors own the intellectual property rights to the products we sell, or possess the technology or specialized tooling required to manufacture them. As a result of this concentration in some of our supply chains, our business and operations could be negatively affected if our key suppliers were to experience significant disruptions affecting the price, quality, availability or timely delivery of their products, or if they were to decide to terminate their relationships with us. For example, we have a limited number of vendors for our bearings product lines. The partial or complete loss of any one of our key suppliers, or a significant adverse change in the relationship with any of these suppliers, through consolidation or otherwise, would limit our ability to manufacture and sell certain of our products.
We may not realize revenue on our current backlog due to customer order reductions, cancellations and acceptance delays, which may negatively impact our financial results and relationships with our customers.
In the current environment of decreased oil and natural gas prices, and the resulting uncertainty regarding demand for our customers’ services, we have experienced order reductions, cancellations and acceptance delays, and may
15
experience more of these in the future, as projects have become uneconomical for our customers. We may be unable to collect revenue for all of the orders reflected in our backlog, or we may be unable to collect cancellation penalties, to the extent we have the right to impose them, or the revenues may be pushed into future periods. In addition, customers who are more highly leveraged or otherwise unable to pay their creditors in the ordinary course of business may become insolvent or be unable to operate as a going concern. We may be unable to collect amounts due or damages we are awarded from these customers, and our efforts to collect such amounts may damage our customer relationships. Our results of operations and overall financial condition may be negatively impacted by a reduction in revenue as a result of these circumstances.
The markets in which we operate are highly competitive, and some of our competitors hold substantial market share and have substantially greater resources than we do. We may not be able to compete successfully in this environment and, in particular, against a much larger competitor.
The markets in which we operate are highly competitive and our products and services are subject to competition from significantly larger businesses. One competitor in particular holds substantial market share in our largest product line's market and has substantially greater resources than we do. We also have several other competitors that are large national and multinational companies that have longer operating histories, greater financial, technical and other resources and greater name recognition than we do. Some of our competitors may be able to respond more quickly to new or emerging technologies and services and changes in customer requirements. In addition, several of our competitors provide a much broader array of services, and have a stronger presence in more geographic markets. Our larger competitors may be able to use their size and purchasing power to seek economies of scale and pricing concessions. Furthermore, some of our customers are also our competitors and they may cease buying from us. We also have competitors outside of the United States with lower structural costs due to labor and raw material cost in and around their manufacturing centers. Moreover, our competitors may utilize available capacity during a period of depressed energy prices, similar to that which we are currently experiencing, to gain market share.
New competitors could also enter the markets in which we compete. We consider product quality, price, breadth of product offering, availability of products and services, performance, distribution capabilities, responsiveness to customer needs and reputation for service to be the primary competitive factors. Competitors may be able to offer more attractive pricing, duplicate strategies, or develop enhancements to products that could offer performance features that are superior to our products. In addition, we may not be able to retain key employees of entities that we acquire in the future and those employees may choose to compete against us. Competitive pressures, including those described above, and other factors could adversely affect our competitive position, resulting in a loss of market share or decreases in prices. In addition, some competitors are based in foreign countries and have cost structures and prices based on foreign currencies. Accordingly, currency fluctuations could cause U.S. dollar-priced products to be less competitive than our competitors' products that are priced in other currencies. For more information about our competitors, please read "Business-Competition."
We may be unable to employ a sufficient number of skilled and qualified workers.
The delivery of our products and services requires personnel with specialized skills and experience. Our ability to be productive and profitable depends upon our ability to employ and retain skilled workers. During periods of low activity in our industry, such as we are now experiencing, we reduce the size of our labor force to match declining revenue levels, and other employees may choose to leave in order to find more stable employment. This may cause us to lose skilled personnel, the absence of which could cause us to incur quality, efficiency and deliverability issues in our operations, or delay our response to an upturn in the market. During periods of high activity in our industry, our ability to expand our operations depends in part on our ability to increase the size of our skilled labor force. In addition, during those periods the demand for skilled workers is high, the supply is limited and the cost to attract and retain qualified personnel increases. For example, during the last upturn we experienced shortages of engineers, mechanical assemblers, machinists and code welders, which in some instances slowed the productivity of certain of our operations. Furthermore, a significant increase in the wages paid by competing employers could result in a reduction of our skilled labor force, increases in the wage rates that we must pay, or both. If any of these events were to occur our ability to respond quickly to customer demands or strong market conditions may be inhibited and our growth potential could be impaired.
Our business depends upon our ability to obtain key raw materials and specialized equipment from suppliers. Increased costs of raw materials and other components may result in increased operating expenses.
Should our suppliers be unable to provide the necessary raw materials or finished products or otherwise fail to deliver such materials and products timely and in the quantities required, resulting delays in the provision of products or
16
services to customers could have a material adverse effect on our business. In particular, because many of our products are manufactured out of steel, we are particularly susceptible to fluctuations in steel prices. Our results of operations may be adversely affected by our inability to manage the rising costs and availability of raw materials and components used in our products.
If suppliers cannot provide adequate quantities of materials to meet customers' demands on a timely basis or if the quality of the materials provided does not meet established standards, we may lose customers or experience lower profitability.
Some of our customer contracts require us to compensate customers if we do not meet specified delivery obligations. We rely on suppliers to provide required materials and in many instances these materials must meet certain specifications. Managing a geographically diverse supply base poses inherently significant logistical challenges. Furthermore, the ability of third party suppliers to deliver materials to our specifications may be affected by events beyond our control. As a result, there is a risk that we could experience diminished supplier performance resulting in longer than expected lead times and/or product quality issues. For example, in the past, we have experienced issues with the quality of certain forgings used to produce materials utilized in our products. As a result, we were required to seek alternative suppliers for those forgings, which resulted in increased costs and a disruption in our supply chain. We have also been required in certain circumstances to provide better economic terms to some of our suppliers in exchange for their agreement to increase their capacity to satisfy our supply needs. The occurrence of any of the foregoing factors could have a negative impact on our ability to deliver products to customers within committed time frames.
Our products are used in operations that are subject to potential hazards inherent in the oil and natural gas industry and, as a result, we are exposed to potential liabilities that may affect our financial condition and reputation.
Our products are used in potentially hazardous drilling, completion and production applications in the oil and natural gas industry where an accident or a failure of a product can potentially have catastrophic consequences. Risks inherent to these applications, such as equipment malfunctions and failures, equipment misuse and defects, explosions, blowouts and uncontrollable flows of oil, natural gas or well fluids and natural disasters, on land or in deepwater or shallow-water environments, can cause personal injury, loss of life, suspension of operations, damage to formations, damage to facilities, business interruption and damage to or destruction of property, surface water and drinking water resources, equipment and the environment. In addition, we provide certain services that could cause, contribute to or be implicated in these events. If our products or services fail to meet specifications or are involved in accidents or failures, we could face warranty, contract or other litigation claims, which could expose us to substantial liability for personal injury, wrongful death, property damage, loss of oil and natural gas production, and pollution and other environmental damages. Our insurance policies may not be adequate to cover all liabilities. Further, insurance may not be generally available in the future or, if available, insurance premiums may make such insurance commercially unjustifiable. Moreover, even if we are successful in defending a claim, it could be time-consuming and costly to defend.
In addition, the frequency and severity of such incidents could affect operating costs, insurability and relationships with customers, employees and regulators. In particular, our customers may elect not to purchase our products or services if they view our safety record as unacceptable, which could cause us to lose customers and substantial revenues. In addition, these risks may be greater for us because we may acquire companies that have not allocated significant resources and management focus to quality, or safety requiring rehabilitative efforts during the integration process. We may incur liabilities for losses associated with these newly acquired companies before we are able to rehabilitate such companies' quality, safety and environmental programs.
Our success depends on our ability to implement new technologies and services.
Our success depends on the ongoing development and implementation of new product designs and improvements, and on our ability to protect and maintain critical intellectual property assets related to these developments. If we are not able to obtain patent or other intellectual property protection of our technology, we may not be able to recoup development costs or fully exploit systems, services and technologies in a manner that allows us to meet evolving industry requirements at prices acceptable to our customers. In addition, some of our competitors are large national and multinational companies that may be able to devote greater financial, technical, manufacturing and marketing resources to research and development of new systems, services and technologies than we are able to do. We have not spent material amounts on research and development activities during the three most recent fiscal years.
17
Our success will be affected by the use and protection of our proprietary technology. There are limitations to our intellectual property rights in our proprietary technology, and thus our right to exclude others from the use of such proprietary technology.
Our success will be affected by our development and implementation of new product designs and improvements and by our ability to protect and maintain critical intellectual property assets related to these developments. Although in many cases our products are not protected by any registered intellectual property rights, in other cases we rely on a combination of patents and trade secret laws to establish and protect this proprietary technology.
We currently hold multiple U.S. and international patents and have multiple pending patent applications for products and processes in the U.S. and certain non-U.S. countries. Patent rights give the owner of a patent the right to exclude third parties from making, using, selling, and offering for sale the inventions claimed in the patents in the applicable country. Patent rights do not necessarily grant the owner of a patent the right to practice the invention claimed in a patent, but merely the right to exclude others from practicing the invention claimed in the patent. It may also be possible for a third party to design around our patents. Furthermore, patent rights have strict territorial limits. Some of our work will be conducted in international waters and may, therefore, not fall within the scope of any country's patent jurisdiction. We may not be able to enforce our patents against infringement occurring in international waters and other "non-covered" territories. Also, we do not have patents in every jurisdiction in which we conduct business and our patent portfolio will not protect all aspects of our business and may relate to obsolete or unusual methods, which would not prevent third parties from entering the same market.
In addition, by customarily entering into confidentiality and/or license agreements with our employees, customers and potential customers and suppliers, we attempt to limit access to and distribution of our technology. Our rights in our confidential information, trade secrets, and confidential know-how will not prevent third parties from independently developing similar information. Publicly available information (e.g. information in expired issued patents, published patent applications, and scientific literature) can also be used by third parties to independently develop technology. We cannot provide assurance that this independently developed technology will not be equivalent or superior to our proprietary technology.
Our competitors may infringe upon, misappropriate, violate or challenge the validity or enforceability of our intellectual property and we may not able to adequately protect or enforce our intellectual property rights in the future.
During periods of high market activity, if we cannot continue operating our manufacturing facilities at adequate levels, our results of operations could be adversely affected.
We operate a number of manufacturing facilities. The equipment and management systems necessary for such operations may break down, perform poorly or fail, resulting in fluctuations in manufacturing efficiencies. Such fluctuations may affect our ability to deliver quality products to our customers on a timely basis.
During the year ended December 31, 2015, we incurred impairment charges and we may incur additional impairment charges in the future.
For goodwill and intangible assets with indefinite lives, an assessment for impairment is performed annually or when there is an indication an impairment may have occurred. Goodwill is reviewed for impairment by comparing the carrying value of each reporting unit's net assets, including allocated goodwill, to the estimated fair value of the reporting unit. We determine the fair value of each of our six reporting units using a discounted cash flow approach. Determining the fair value of a reporting unit requires the use of estimates and assumptions. If the reporting unit's carrying value is greater than its fair value, a second step is performed whereby the implied fair value of goodwill is estimated by allocating the fair value of the reporting unit in a hypothetical purchase price allocation analysis. We recognize a goodwill impairment charge for the amount by which the carrying value of goodwill exceeds its reassessed fair value. Due to the further deterioration of market conditions for our products, we recorded a $123.2 million of impairment loss for our Subsea reporting unit for the year ended December 31, 2015. No impairment loss was recorded for the year ended December 31, 2016. The cost of exploring for or producing oil and natural gas in offshore areas is generally much higher than it is for onshore fields; as such significantly higher oil and natural gas prices may be required in order to stimulate an increase in activity. A further decline of offshore activity or failure for that activity to increase could require further impairment charges for our Subsea product line in the future.
We evaluate our long-lived assets, including property and equipment and intangible assets with definite lives, for potential impairment whenever events or changes in circumstances indicate that the carrying amount of a long-lived asset may not be recoverable. In performing our review for impairment, future cash flows expected to result from the
18
use of the asset and its eventual value upon disposal are estimated. If the undiscounted future cash flows are less than the carrying amount of the assets, there is an indication that the asset may be impaired. The amount of the impairment is measured as the difference between the carrying value and the estimated fair value of the asset. The fair value is determined either through the use of an external valuation, or by means of an analysis of discounted future cash flows based on expected utilization. Following the impairment charge, at December 31, 2015, our Subsea reporting unit has a remaining balance of $73 million in goodwill. No impairment loss was recorded for the year ended December 31, 2016. The impairment loss recognized represents the excess of the asset's carrying value as compared to its estimated fair value. Further declines in commodity prices or sustained lower valuation for the Company's common stock could indicate a reduction in the estimate of reporting unit fair value which, in turn, could lead to additional impairment charges associated with goodwill. The impairment loss recognized represents the excess of the asset's carrying value as compared to its estimated fair value.
Intangible assets with definite lives are tested for impairment whenever events or changes in circumstances indicate that their carrying amount may not be recoverable. In the fourth quarter of 2015, an impairment loss of $1.9 million related to certain trade names that were no longer in use was recorded. No impairment loss was recorded for the year ended December 31, 2016.
If we determine that the carrying value of our long-lived assets, goodwill or intangible assets is less than their fair value, we may be required to record additional charges in the future, which could adversely affect our financial condition and results of operations.
Our operations and our customers' operations are subject to a variety of governmental laws and regulations that may increase our and our customers' costs, prohibit or curtail our customers' operations in certain areas, limit the demand for our products and services or restrict our operations.
Our business and our customers' businesses may be significantly affected by:
• | federal, state and local U.S. and non-U.S. laws and other regulations relating to oilfield operations, worker safety and protection of the environment; |
• | changes in these laws and regulations; and |
• | the level of enforcement of these laws and regulations. |
In addition, we depend on the demand for our products and services from the oil and natural gas industry. This demand is affected by changing taxes, price controls and other laws and regulations relating to the oil and natural gas industry in general. For example, the adoption of laws and regulations curtailing exploration and development drilling for oil and natural gas for economic or other policy reasons could adversely affect our operations by limiting demand for our products. In addition, some non-U.S. countries may adopt regulations or practices that provide an advantage to indigenous oil companies in bidding for oil leases, or require indigenous companies to perform oilfield services currently supplied by international service companies. To the extent that such companies are not our customers, or we are unable to develop relationships with them, our business may suffer. We cannot determine the extent to which our future operations and earnings may be affected by new legislation, new regulations or changes in existing regulations.
Because of our non-U.S. operations and sales, we are also subject to changes in non-U.S. laws and regulations that may encourage or require hiring of local contractors or require non-U.S. contractors to employ citizens of, or purchase supplies from, a particular jurisdiction. If we fail to comply with any applicable law or regulation, our business, results of operations or financial condition may be adversely affected.
Our tax position may be adversely affected by changes in tax law relating to multinational corporations, or increased scrutiny by tax authorities.
Recent legislative proposals have aimed to make changes in the taxation of U.S. and multinational corporations, including proposal to limit the ability of corporations to deduct interest expense. The U.S. Congress and government agencies in non-U.S. jurisdictions where we, and our affiliates, do business, have recently focused on issues related to the taxation of multinational corporations. Moreover, the Trump Administration and members of the U.S. Congress have called for substantial change to fiscal and tax policies, which may include comprehensive tax reform or the imposition of taxes on the imports of goods into the United States. As a result, the lax laws in the United States and other countries in which we and our affiliates do business could change on a prospective or retroactive basis. Until we know what changes are enacted, we cannot predict whether these changes could materially adversely affect us.
19
If the United States were to withdraw from or modify the North American Free Trade Agreement our financial performance and results of operations may be negatively affected.
We utilize our facility located in Mexico to manufacture products and export them to the United States under the North American Free Trade Agreement (“NAFTA”). The Trump Administration has made comments suggesting that it is not supportive of NAFTA. As a result, it is unclear what may or may not be done with respect to this trade agreement. Withdrawal from or modifications to NAFTA could impose additional tariffs or duties on imports from our facility. Additionally, taxes may be imposed generally on imports to the United States by virtue of the corporate tax reform efforts currently being discussed. Under either of these scenarios the use of our facility in Mexico may be rendered uneconomical for our operations. This may cause us to lose the value of our investment in this facility, interrupt our operations and may negatively impact our financial performance and results of operations.
Our operations are subject to environmental and operational safety laws and regulations that may expose us to significant costs and liabilities.
Our operations are subject to numerous stringent and complex laws and regulations governing the discharge of materials into the environment, health and safety aspects of our operations, or otherwise relating to human health and environmental protection. These laws and regulations may, among other things, regulate the management and disposal of hazardous and nonhazardous wastes; require acquisition of environmental permits related to our operations; restrict the types, quantities, and concentrations of various materials that can be released into the environment; limit or prohibit operational activities in certain ecologically sensitive and other protected areas; regulate specific health and safety criteria addressing worker protection; require compliance with operational and equipment standards; impose testing, reporting and recordkeeping requirements; and require remedial measures to mitigate pollution from former and ongoing operations. Failure to comply with these laws and regulations or to obtain or comply with permits may result in the assessment of administrative, civil and criminal penalties, imposition of remedial or corrective action requirements and the imposition of injunctions to prohibit certain activities or force future compliance. Certain environmental laws may impose joint and several liability, without regard to fault or legality of conduct, on classes of persons who are considered to be responsible for the release of a hazardous substance into the environment. In addition, these risks may be greater for us because the companies we acquire or have acquired may not have allocated sufficient resources and management focus to environmental compliance, potentially requiring rehabilitative efforts during the integration process or exposing us to liability before such rehabilitation occurs.
The trend in environmental regulation has been to impose increasingly stringent restrictions and limitations on activities that may impact the environment. The implementation of new laws and regulations could result in materially increased costs, stricter standards and enforcement, larger fines and liability and increased capital expenditures and operating costs, particularly for our customers.
We may incur liabilities, fines, penalties or additional costs, or we may be unable to sell to certain customers if we do not maintain safe operations.
If we fail to comply with safety regulations or maintain an acceptable level of safety at our facilities we may incur fines, penalties or other liabilities, or may be held criminally liable. We may incur additional costs to upgrade equipment or conduct additional training, or otherwise incur costs in connection with compliance with safety regulations. Failure to maintain safe operations or achieve certain safety performance metrics could disqualify us from doing business with certain customers, particularly major oil companies.
Our executive officers and certain key personnel are critical to our business and these officers and key personnel may not remain with us in the future.
Our future success depends in substantial part on our ability to hire and retain our executive officers and other key personnel. In particular, we are highly dependent on certain of our executive officers. These individuals possess extensive expertise, talent and leadership, and they are critical to our success. The diminution or loss of the services of these individuals, or other integral key personnel affiliated with entities that we acquire in the future, could have a material adverse effect on our business. Furthermore, we may not be able to enforce all of the provisions in any employment agreement we have entered into with certain of our executive officers and such employment agreements may not otherwise be effective in retaining such individuals. In addition, we may not be able to retain key employees of entities that we acquire in the future. This may impact our ability to successfully integrate or operate the assets we acquire.
20
The industry in which we operate is undergoing continuing consolidation that may impact results of operations.
Some of our largest customers have consolidated and are using their size and purchasing power to achieve economies of scale and pricing concessions. This consolidation may result in reduced capital spending by such customers or the acquisition of one or more of our primary customers, which may lead to decreased demand for our products and services. If we cannot maintain sales levels for customers that have consolidated or replace such revenues with increased business activities from other customers, this consolidation activity could have a significant negative impact on results of operations or financial condition. We are unable to predict what effect consolidations in the industries may have on prices, capital spending by customers, selling strategies, competitive position, ability to retain customers or ability to negotiate favorable agreements with customers.
If we are unable to continue operating successfully overseas or to successfully expand into new international markets, our revenues may decrease.
For the year ended December 31, 2016, we derived approximately 38% of our revenue from sales outside the United States (based on product destination). In addition, one of our key growth strategies is to market products in international markets. We may not succeed in marketing, developing a recognized brand, selling, distributing products and generating revenues in these new international markets.
Our non-U.S. operations will subject us to special risks.
We are subject to various risks inherent in conducting business operations in locations outside of the United States. These risks may include changes in regional, political or economic conditions, local laws and policies, including taxes, trade protection measures, and unexpected changes in regulatory requirements governing the operations of companies that operate outside of the United States. In addition, if a dispute arises from international operations, courts outside of the United States may have exclusive jurisdiction over the dispute, or we may not be able to subject persons outside of the United States to the jurisdiction of U.S. courts.
Our exposure to currency exchange rate fluctuations may result in fluctuations in our cash flows and could have an adverse effect on our results of operations.
From time to time, fluctuations in currency exchange rates could be material to us depending upon, among other things, our manufacturing locations and the sourcing for our raw materials and components. In particular, we are sensitive to fluctuations in currency exchange rates between the United States dollar and each of the Canadian dollar, the British pound sterling, the Euro, and, to a lesser degree, the Mexican Peso, the Chinese Yuan and the Singapore dollar. There may be instances in which costs and revenue will not be matched with respect to currency denomination. As a result, to the extent that we continue our expansion on a global basis, management expects that increasing portions of revenue, costs, assets and liabilities will be subject to fluctuations in foreign currency valuations. We may experience economic loss and a negative impact on earnings or net assets solely as a result of foreign currency exchange rate fluctuations. Further, the markets in which we operate could restrict the removal or conversion of the local or foreign currency, resulting in our inability to hedge against these risks.
Our business operations in countries outside of the United States are subject to a number of U.S. federal laws and regulations, including restrictions imposed by the United States Foreign Corrupt Practices Act as well as trade sanctions administered by the Office of Foreign Assets Control and the Commerce Department.
We rely on a large number of agents in non-U.S. countries that pose a high risk of corrupt activities and whose local laws and customs differ significantly from those in the United States. In many countries, particularly in those with developing economies, it is common to engage in business practices that are prohibited by the regulations applicable to us. The United States Foreign Corrupt Practices Act and similar anti-bribery laws in other jurisdictions, including the UK Bribery Act 2010, ("anti-corruption laws") prohibit corporations and individuals, including us and our employees, from engaging in certain activities to obtain or retain business or to influence a person working in an official capacity. We may be held responsible for violations by our employees, contractors and agents, for violations of anti-corruption laws. We may also be held responsible for any violations by an acquired company that occurs prior to an acquisition, or subsequent to the acquisition but before we are able to institute our compliance procedures. In addition, our non-U.S. competitors that are not subject to the FCPA or similar laws may be able to secure business or other preferential treatment in such countries by means that such laws prohibit with respect to us. The UK Bribery Act 2010 is broader in scope than the FCPA and applies to public and private sector corruption and contains no facilitating payments exception. A violation of any of these laws, even if prohibited by our policies, could have a material adverse effect on
21
our business. Actual or alleged violations could damage our reputation, be expensive to defend, impair our ability to do business, and cause us to incur civil and criminal fines, penalties and sanctions.
Compliance with regulations relating to export controls, trade sanctions and embargoes administered by the countries in which we operate, including the United States Department of the Treasury's Office of Foreign Assets Control ("OFAC") also poses a risk to us. We cannot provide products or services to certain countries, companies or individuals subject to trade sanctions of the U.S. and other countries. Furthermore, the laws and regulations concerning import activity, export recordkeeping and reporting, export control and economic sanctions are complex and constantly changing. Any failure to comply with applicable legal and regulatory trading obligations could result in criminal and civil penalties and sanctions, such as fines, imprisonment, debarment from governmental contracts, seizure of shipments and loss of import and export privileges.
Unionization efforts and labor regulations in certain areas in which we operate could materially increase our costs or limit our flexibility.
We are not a party to any collective bargaining agreements, other than in our Monterrey, Mexico and Hamburg, Germany facilities. We operate in certain states within the United States and in international areas that have a history of unionization and we may become the subject of a unionization campaign. If some or all of our workforce were to become unionized and collective bargaining agreement terms, including any renegotiation of our Monterrey, Mexico and Hamburg, Germany collective bargaining agreements, were significantly different from our current compensation arrangements or work practices, our costs could be increased, our flexibility in terms of work schedules and reductions in force could be limited, and we could be subject to strikes or work slowdowns, among other things.
We may incur liabilities to customers as a result of warranty claims.
We provide warranties as to the proper operation and conformance to specifications of the products we manufacture or install. Failure of our products to operate properly or to meet specifications may increase costs by requiring additional engineering resources and services, replacement of parts and equipment or monetary reimbursement to a customer. We have in the past received warranty claims, and we expect to continue to receive them in the future. To the extent that we incur substantial warranty claims in any period, our reputation, ability to obtain future business and earnings could be adversely affected.
We are subject to litigation risks that may not be covered by insurance.
In the ordinary course of business, we become the subject of various claims, lawsuits and administrative proceedings seeking damages or other remedies concerning our commercial operations, products, employees and other matters, including occasional claims by individuals alleging exposure to hazardous materials as a result of our products or operations. Some of these claims relate to the activities of businesses that we have acquired, even though these activities may have occurred prior to our acquisition of such businesses. Our insurance does not cover all of our potential losses, and we are subject to various self-insured retentions and deductibles under our insurance. A judgment may be rendered against us in cases in which we could be uninsured or beyond the amounts that we currently have reserved or anticipate incurring for such matters.
The number and cost of our current and future asbestos claims could be substantially higher than we have estimated and the timing of payment of claims could be sooner than we have estimated.
One of our subsidiaries has been and continues to be named as a defendant in asbestos related product liability actions. The actual amounts expended on asbestos-related claims in any year may be impacted by the number of claims filed, the nature of the allegations asserted in the claims, the jurisdictions in which claims are filed, and the number of settlements. As of December 31, 2016, our subsidiary has a net liability of $0.3 million for the estimated indemnity cost associated with the resolution of its current open claims and future claims anticipated to be filed during the next five years.
Due to a number of uncertainties that may result in significant changes in the current estimate, the actual costs of resolving these pending claims could be substantially higher than the current estimate. Among these are uncertainties as to the ultimate number and type of claims filed, the amounts of claim costs, the impact of bankruptcies of other companies with asbestos claims or of our insurers, and potential legislative changes and uncertainties surrounding the litigation process from jurisdiction to jurisdiction and from case to case. In addition, future claims beyond the five-year forecast period are possible, but the accrual does not cover losses that may arise from such additional future claims. Therefore, any such future claims could result in a loss.
22
Significant costs are incurred in defending asbestos claims and these costs are recorded at the time incurred. Receipt of reimbursement from our insurers may be delayed for a variety of reasons. In particular, if our primary insurers claim that certain policy limits have been exhausted, we may be delayed in receiving reimbursement as a result of the transition from one set of insurers to another. Our excess insurers may also dispute the claims of exhaustion, or may rely on certain policy requirements to delay or deny claims. Furthermore, the various per occurrence and aggregate limits in different insurance policies may result in extended negotiations or the denial of reimbursement for particular claims. For more information on the cost sharing agreements related to this risk, please read "Business—Legal proceedings."
If we fail to maintain an effective system of internal controls, we may not be able to accurately report our financial results or prevent fraud.
Effective internal control over financial processes and reporting are necessary for us to provide reliable financial reports effectively prevent fraud and operate successfully. Our efforts to maintain internal control systems may not be successful. In addition, the entities that we acquire in the future may not maintain effective systems of internal control or we may encounter difficulties integrating our system of internal control with those of acquired entities. If we are unable to maintain effective internal control and, as a result, fail to provide reliable financial reports and effectively prevent fraud, our reputation and operating results would be harmed.
We may be impacted by disruptions in the political, regulatory, economic and social conditions of the foreign countries in which we are expected to conduct business.
Instability and unforeseen changes in the international markets in which we conduct business, including economically and politically volatile areas such as North Africa, the Middle East, Latin America and the Asia Pacific region, could cause or contribute to factors that could have an adverse effect on the demand for the products and services we provide. For example, we have previously transferred management and operations from certain Latin American countries, due to the presence of political turmoil, to other countries in the region that are more politically stable.
In addition, worldwide political, economic, and military events have contributed to oil and natural gas price volatility and are likely to continue to do so in the future. Depending on the market prices of oil and natural gas, oil and natural gas exploration and development companies may cancel or curtail their drilling programs, thereby reducing demand for our products and services.
Climate change legislation or regulations restricting emissions of greenhouse gases could increase our operating costs or reduce demand for our products.
Environmental advocacy groups and regulatory agencies in the United States and other countries have focused considerable attention on the emissions of carbon dioxide, methane and other greenhouse gases and their potential role in climate change. In response to scientific studies suggesting that emissions of GHGs, including carbon dioxide and methane, are contributing to the warming of the Earth's atmosphere and other climatic conditions, the U.S. Congress has considered adopting comprehensive legislation to reduce emissions of GHGs, and almost half of the states have already taken legal measures to reduce emissions of GHGs, primarily through measures to promote the use of renewable energy and/or regional GHG cap-and-trade programs. The Environmental Protection Agency (the "EPA") has already begun to regulate greenhouse gas emissions under the federal Clean Air Act. In December 2009, the EPA determined that emissions of carbon dioxide, methane and certain other GHGs endanger public health and the environment because emissions of such gases are, according to the EPA, contributing to warming of the Earth's atmosphere and other climatic changes. Accordingly, the EPA has begun adopting rules under the Clean Air Act that, among other things, cover reductions in GHG emissions from motor vehicles, permits for certain large stationary sources of GHGs, and monitoring and annual reporting of GHG emissions from specified GHG emission sources, including oil and natural gas exploration and production operations. Additionally, in May 2016, the EPA issued final new source performance standards governing methane emissions that impose more stringent controls on methane and volatile organic compounds emissions at new and modified oil and natural gas production, processing, storage and transmission facilities. The EPA has also announced that it intends to impose methane emission standards for existing sources and has issued information collection requests to companies with production, gathering and boosting, gas processing, storage and transmission facilities. The EPA has also adopted rules requiring the reporting of greenhouse gas emissions from specified large greenhouse gas emission sources in the United States, including oil and gas systems. Similarly, the Department of the Interior’s Bureau of Land Management (“BLM”) issued final rules in November 2016 relating to the venting, flaring and leaking of natural gas by oil and natural gas producers who operate on federal and Indian lands.
23
Finally, efforts have also been made and continue to be made in the international community toward the adoption of international treaties or protocols that would address global climate change issues. In 2015, the United States participated in the United Nations Conference on Climate Change, which led to the creation of the Paris Agreement. In April 2016, the United States signed the Paris Agreement, which requires member countries to review and “represent a progression” in their nationally determined contributions, which set GHG emission reduction goals, every five years.
The adoption of additional legislation or regulatory programs to reduce emissions of greenhouse gases could require us to incur increased operating costs to comply with new emissions-reduction or reporting requirements. Any such legislation or regulatory programs could also increase the cost of consuming, and thereby reduce demand for, hydrocarbons that our customers produce. Consequently, legislation and regulatory programs to reduce emissions of greenhouse gases could have an adverse effect on our business, financial condition and results of operations. Finally, some scientists have concluded that increasing concentrations of greenhouse gases in the Earth's atmosphere may produce climate changes that have significant physical effects, such as increased frequency and severity of storms, droughts, and floods and other climatic events.
Adverse weather conditions adversely affect demand for services and operations.
Adverse weather conditions, such as hurricanes, tornadoes, ice or snow may damage or destroy our facilities, interrupt or curtail our operations, or our customers' operations, cause supply disruptions and result in a loss of revenue, which may or may not be insured. For example, certain of our facilities located in Oklahoma and Pennsylvania have experienced suspensions in operations due to tornado activity or extreme cold weather conditions.
A natural disaster, catastrophe or other event could result in severe property damage, which could curtail our operations.
Some of our operations involve risks of, among other things, property damage, which could curtail our operations. For example, disruptions in operations or damage to a manufacturing plant could reduce our ability to produce products and satisfy customer demand. In particular, we have offices and manufacturing facilities in Houston, Texas, and in various places throughout the U.S. Gulf Coast region. These offices and facilities are particularly susceptible to severe tropical storms and hurricanes, which may disrupt our operations. If one or more of our manufacturing facilities are damaged by severe weather or any other disaster, accident, catastrophe or event, our operations could be significantly interrupted. Similar interruptions could result from damage to production or other facilities that provide supplies or other raw materials to our plants or other stoppages arising from factors beyond our control. These interruptions might involve significant damage to, among other things, property and repairs might take from a week or less for a minor incident to many months or more for a major interruption.
Potential legislation or regulations restricting the use of hydraulic fracturing could reduce demand for our products.
Hydraulic fracturing is an important and common practice in the oil and natural gas industry, which involves the injection of water, sand and chemicals under pressure into a formation to fracture the surrounding rock and stimulate production of hydrocarbons. Certain environmental advocacy groups have suggested that additional federal, state and local laws and regulations may be needed to more closely regulate the hydraulic fracturing process, and have made claims that hydraulic fracturing techniques are harmful to surface water and drinking water resources. Various governmental entities (within and outside the United States) are in the process of studying, restricting, regulating or preparing to regulate hydraulic fracturing, directly or indirectly
For example, the EPA also released the final results of its comprehensive research study on the potential adverse impacts that hydraulic fracturing may have on drinking water resources in December 2016. The EPA concluded that hydraulic fracturing activities can impact drinking water resources under some circumstances, including large volume spills and inadequate mechanical integrity of wells. In May 2016, the EPA issued final new source performance standard requirements that impose more stringent controls on methane and volatile organic compounds emissions from oil and natural gas development and production operations, including hydraulic fracturing and other well completion activity. The EPA has also issued federal Safe Drinking Water Act (“SDWA”) permitting guidance for hydraulic fracturing operations involving the use of diesel fuel in fracturing fluids in those states where the EPA is the permitting authority. Additionally, the BLM issued final rules to regulate hydraulic fracturing on federal lands in March 2015. Although these rules were struck down by a federal court in Wyoming in June 2016, an appeal of the decision is still pending.
In past sessions, Congress has considered, but not passed, the adoption of legislation to provide for federal regulation of hydraulic fracturing under the SDWA and to require disclosure of the chemicals used in the hydraulic fracturing
24
process. Some states have adopted, and other states are considering adopting, legal requirements that could impose more stringent permitting, public disclosure or well construction requirements on hydraulic fracturing activities. Local government also may seek to adopt ordinances within their jurisdictions regulating the time, place and manner of drilling activities in general or hydraulic fracturing activities in particular, in some cases banning hydraulic fracturing entirely.
If new or more stringent federal, state or local legal restrictions relating to the hydraulic fracturing process are adopted in areas where our oil and natural gas exploration and production customers operate, they could incur potentially significant added costs to comply with such requirements, experience delays or curtailment in the pursuit of exploration, development, or production activities, and perhaps even be precluded from drilling wells, some or all of which activities could adversely affect demand for our services to those customers.
Compliance with government regulations regarding the use of "conflict minerals" may result in increased costs and risks to us.
As part of the Dodd-Frank Wall Street Reform and Consumer Protection Act of 2010 ("Dodd-Frank"), the SEC has promulgated disclosure requirements regarding the use of certain minerals, which are mined from the Democratic Republic of Congo and adjoining countries, known as conflict minerals. We are required to publicly disclose our determination as to whether the products we sell contain conflict minerals and could incur significant costs related to implementing a process that will meet the mandates of Dodd-Frank. Additionally, customers may rely on us to provide critical data regarding the parts they purchase and will likely request conflict mineral information. We have many suppliers and each will provide conflict mineral information in a different manner, if at all. Accordingly, because the supply chain is complex, we may face reputational challenges if we are unable to sufficiently verify the origins of certain minerals used in our products. Additionally, customers may demand that the products they purchase be free of conflict minerals. The implementation of this requirement could affect the sourcing and availability of products we purchase from our suppliers. This may reduce the number of suppliers that may be able to provide conflict free products, and may affect our ability to obtain products in sufficient quantities to meet customer demand or at competitive prices. In addition, there may be material costs associated with complying with the disclosure requirements, such as costs related to determining the source of any relevant minerals used in our products, as well as costs arising from any changes as a consequence of such verification activities.
Our financial results could be adversely impacted by changes in regulation of oil and natural gas exploration and development activity, in response to significant environmental incidents.
The U.S. Department of the Interior implemented additional safety and certification requirements applicable to drilling activities in the U.S. Gulf of Mexico, imposed additional requirements with respect to exploration, development and production activities in U.S. waters and imposed a moratorium that delayed the approval of drilling plans and well permits in both deepwater and shallow-water areas due to the Macondo well incident. Although neither we nor our products were involved in the incident, the delays caused by the new regulations and requirements had an overall negative effect on drilling activity in U.S. waters, and to a certain extent, our financial results. Another similar environmental incident could result in similar drilling moratoria, and could result in increased state, international and additional federal regulation of our and our customers' operations that could negatively impact our earnings, prospects and the availability and cost of insurance coverage. Any additional regulation of the exploration and production industry as a whole could result in fewer companies being financially qualified to operate offshore or onshore in the U.S. or in non-U.S. jurisdictions, result in higher operating costs for our customers and reduce demand for our products and services.
We may not be able to satisfy technical requirements, testing requirements, code requirements or other specifications under contracts and contract tenders.
Many of our products are used in harsh environments and severe service applications. Our contracts with customers and customer requests for bids often set forth detailed specifications or technical requirements (including that they meet certain industrial code requirements, such as API, ASME or similar codes, or that our processes and facilities maintain ISO or similar certifications) for our products and services, which may also include extensive testing requirements. We anticipate that such code testing requirements will become more common in our contracts. We cannot assure you that our products or facilities will be able to satisfy the specifications or requirements, or that we will be able to perform the full-scale testing necessary to prove that the product specifications are satisfied in future contract bids or under existing contracts, or that the costs of modifications to our products or facilities to satisfy the specifications and testing will not adversely affect our results of operations. If our products or facilities are unable to satisfy such requirements, or we are unable to perform or satisfy any required full-scale testing, we may suffer
25
reputational harm and our customers may cancel their contracts and/or seek new suppliers, and our business, results of operations or financial position may be adversely affected.
We may be adversely affected by disputes regarding intellectual property rights and the value of our intellectual property rights is uncertain.
As discussed above, we may become involved in legal proceedings from time to time to protect and enforce our intellectual property rights. Third parties from time to time may initiate litigation against us by asserting that the conduct of our business infringes, misappropriates or otherwise violates intellectual property rights. We may not prevail in any such legal proceedings related to such claims, and our products and services may be found to infringe, impair, misappropriate, dilute or otherwise violate the intellectual property rights of others. Any legal proceeding concerning intellectual property could be protracted and costly and is inherently unpredictable and could have a material adverse effect on our business, regardless of its outcome. Further, our intellectual property rights may not have the value that management believes them to have and such value may change over time as we and others develop new product designs and improvements.
A failure or breach of our information technology infrastructure, including as a result of cyber attacks, could adversely impact our business and results of operations.
The efficient operation of our business is dependent on our information technology ("IT") systems. Accordingly, we rely upon the capacity, reliability and security of our IT hardware and software infrastructure and our ability to expand and update this infrastructure in response to our changing needs. Despite our implementation of security measures, our IT systems are vulnerable to computer viruses, natural disasters, incursions by intruders or hackers, failures in hardware or software, power fluctuations, cyber terrorists and other similar disruptions. The failure of our IT systems to perform as anticipated for any reason or any significant breach of security could disrupt our business and result in numerous adverse consequences, including reduced effectiveness and efficiency of our operations and that of our customers, inappropriate disclosure of confidential information, increased overhead costs, and loss of intellectual property, which could lead to liability to third parties or otherwise and have a material adverse effect on our business and results of operations. In addition, we may be required to incur significant costs to prevent damage caused by these disruptions or security breaches in the future.
Provisions in our organizational documents and under Delaware law could delay or prevent a change in control of our company, which could adversely affect the price of our common stock.
The existence of some provisions in our organizational documents and under Delaware law could delay or prevent a change in control of our company that a stockholder may consider favorable, which could adversely affect the price of our common stock. Certain provisions of our amended and restated certificate of incorporation and amended and restated bylaws could make it more difficult for a third party to acquire control of our company, even if the change of control would be beneficial to our stockholders. These provisions include:
• | a classified board of directors, so that only approximately one-third of our directors are elected each year; |
• | the ability of our board of directors to issue preferred stock without stockholder approval; |
• | limitations on the removal of directors; and |
• | limitations on the ability of our stockholders to call special meetings. |
In addition, our amended and restated bylaws establish advance notice provisions for stockholder proposals and nominations for elections to the board of directors to be acted upon at meetings of stockholders.
L.E. Simmons & Associates, Incorporated ("LESA"), through SCF, may effectively control the outcome of stockholder voting and may exercise this voting power in a manner adverse to our other stockholders.
As of February 24, 2017, SCF held approximately 20.5 million shares of our common stock, equal to approximately 21% of the outstanding common stock at that date. LESA is the ultimate general partner of SCF and will exert significant control over us, including over the outcome of most matters requiring a stockholder vote, such as the election of directors, adoption of amendments to our charter and bylaws and approval of transactions involving a change of control. LESA's interests may differ from our other stockholders, and SCF may vote its common stock in a manner that may adversely affect those stockholders.
26
SCF is a party to a registration rights agreement with us which requires us to effect the registration of its shares in certain circumstances. SCF exercised such rights in 2013, 2014 and 2016 with respect to 6.0 million, 11.5 million and 3.7 million shares, respectively, which were offered and sold in November 2013, May 2014 and December 2016, respectively. Additional sales of substantial amounts of our common stock by SCF, or the perception that such sales could occur, may adversely affect prevailing market prices of our common stock.
Certain of our directors may have conflicts of interest because they are also directors or officers of SCF. The resolution of these conflicts of interest may not be in the best interests of our Company or our other stockholders.
Certain of our directors, namely David C. Baldwin and Andrew L. Waite, are currently officers of LESA. In addition, a trust in which the children of our Chief Executive Officer, C. Christopher Gaut, are primary beneficiaries holds an ownership interest in the general partner of each of SCF-VI, L.P. and SCF-VII, L.P. These positions may create conflicts of interest because these directors and Mr. Gaut have an ownership interest in SCF-VI, L.P. and SCF-VII, L.P. and/or responsibilities to SCF Partners and its owners. Duties as directors or officers of LESA may conflict with such individuals' duties as one of our directors or officers regarding business dealings and other matters between SCF Partners and us. The resolution of these conflicts may not always be in the best interest of our Company or our other stockholders. Please read "We have renounced any interest in specified business opportunities, and SCF Partners and its director nominees on our board of directors generally have no obligation to offer us those opportunities."
We have renounced any interest in specified business opportunities, and SCF Partners and its director nominees on our board of directors generally have no obligation to offer us those opportunities.
Our certificate of incorporation provides that, so long as we have a director or officer who is affiliated with SCF Partners (an "SCF Nominee") and for a continuous period of one year thereafter, we renounce any interest or expectancy in any business opportunity in which any member of the SCF group participates or desires or seeks to participate in and that involves any aspect of the energy equipment or services business or industry, other than (i) any business opportunity that is brought to the attention of an SCF Nominee solely in such person’s capacity as a director or officer of our Company and with respect to which no other member of the SCF group independently receives notice or otherwise identifies such opportunity and (ii) any business opportunity that is identified by the SCF group solely through the disclosure of information by or on behalf of our Company. We refer to SCF Partners and its other affiliates and its portfolio companies as the SCF group. We are not prohibited from pursuing any business opportunity with respect to which we have renounced any interest.
SCF Partners has investments in other oilfield service companies that may compete with us, and SCF Partners and its affiliates, other than our Company, may invest in other such companies in the future. LESA, the ultimate general partner of SCF Partners, has an internal policy that discourages it from investing in two or more portfolio companies with substantially overlapping industry segments and geographic areas. However, LESA’s internal policy does not restrict the management or operation of its other individual portfolio companies from competing with us. Pursuant to LESA’s policy, LESA may allocate any potential opportunities to the existing portfolio company where LESA determines, in its discretion, such opportunities are the most logical strategic and operational fit. As a result, LESA or its affiliates may become aware, from time to time, of certain business opportunities, such as acquisition opportunities, and may direct such opportunities to its other portfolio companies, in which case we may not become aware of or otherwise have the ability to pursue such opportunities. Furthermore, LESA does not have a specific policy with regard to allocation of financial professionals and they are under no obligation to provide us with financial professionals.
Item 1B. Unresolved Staff Comments
Not applicable.
27
Item 2. Properties
The following tables describe the material facilities owned or leased by us as of December 31, 2016:
Country | Location | Leased or Owned | ||
Canada | Alberta | Leased | ||
Calgary | Leased | |||
Edmonton | Leased | |||
Germany | Hamburg | Leased | ||
Mexico | Monterrey | Leased | ||
Singapore | Singapore | Leased | ||
UAE | Dubai | Leased | ||
United Kingdom | Aberdeen | Leased | ||
Kirkbymoorside | Leased | |||
Findon | Leased | |||
Newcastle | Leased | |||
United States | Bryan, TX | Owned | ||
Broussard, LA | Leased | |||
Broussard, LA | Owned | |||
Brownsville, PA | Leased | |||
Clearfield, PA | Owned | |||
Davis, OK | Owned | |||
Dayton, TX | Owned | |||
Elmore City, OK | Owned | |||
Fort Worth, TX | Leased | |||
Guthrie, OK | Leased | |||
Houston, TX | Leased | |||
Madison, KS | Leased | |||
Odessa, TX | Leased | |||
Pearland, TX | Owned | |||
Pearland, TX | Leased | |||
Plantersville, TX | Owned | |||
San Antonio, TX | Owned | |||
Stafford, TX | Leased | |||
Stafford, TX | Owned | |||
Tyler, TX | Leased | |||
Williston, ND | Leased | |||
We believe our facilities are suitable for their present and intended purposes, and are adequate for our current and anticipated level of operations.
We incorporate by reference in response to this item the information set forth in Item 1 and Item 7 of this Annual Report on Form 10-K and the information set forth in Note 6 and Note 11 of the Notes to Consolidated Financial Statements included in Item 8 of this Annual Report on Form 10-K.
Item 3. Legal Proceedings
Information related to Item 3. Legal Proceedings is included in Note 11 to the consolidated financial statements, which are incorporated herein by reference in Part II, Item 8 "Financial Statements and Supplementary Data" of this Annual Report on Form 10-K.
28
Item 4. Mine Safety Disclosures
Not applicable.
Executive officers of the registrant
The following table indicates the names, ages and positions of the executive officers of Forum as of February 24, 2017:
Name | Age | Position |
C. Christopher Gaut | 60 | Chief Executive Officer, Chairman of the Board |
Prady Iyyanki | 46 | President and Chief Operating Officer |
James W. Harris | 57 | Executive Vice President and Chief Financial Officer |
James L. McCulloch | 64 | Executive Vice President, General Counsel and Secretary |
Michael D. Danford | 54 | Senior Vice President-Human Resources |
C. Christopher Gaut. Mr. Gaut has served as our Chief Executive Officer and Chairman of the Board since May 2016. From August 2010 to May 2016 he also served as President, Chief Executive Officer and Chairman of the Board, and as one of our directors since December 2006. He served as a consultant to LESA, the ultimate general partner of SCF, our largest stockholder, from November 2009 to August 2010. Mr. Gaut served at Halliburton Company, a leading diversified oilfield services company, as President of the Drilling and Evaluation Division and prior to that as Chief Financial Officer, from March 2003 through April 2009. From April 2009 through November 2009, Mr. Gaut was a private investor. Prior to joining Halliburton Company in 2003, Mr. Gaut was the Co-Chief Operating Officer of Ensco International, a provider of offshore contract drilling services. He also served as Ensco's Chief Financial Officer from 1988 until 2003. Mr. Gaut is currently a member of the board of directors of Ensco plc, the successor to Ensco International, and Key Energy Services Inc., a well services provider to major oil companies. Mr. Gaut holds an A.B. in Engineering Sciences from Dartmouth College and an M.B.A. from The Wharton School at the University of Pennsylvania.
Prady Iyyanki. Mr. Iyyanki has served as our President and Chief Operating Officer since May 2016. From January 2014 to May 2016, he served as Executive Vice President and Chief Operating Officer. Mr. Iyyanki was a private investor from March 2013 to December 2013. From April 2011 to March 2013, Mr. Iyyanki served as Vice President of GE Oil and Gas, a manufacturer of capital equipment and service provider for the oil and natural gas industry, and from April 2011 to December 2012 he served as President & Chief Executive Officer of the GE Oil and Gas Turbo Machinery business. From June 2006 to April 2011, Mr. Iyyanki served as President and Chief Executive Officer of the GE Power and Water Gas Engines business. Mr. Iyyanki holds a B.S. in Mechanical Engineering from Jawaharlal Nehru Technology University and an M.S. in Engineering from South Dakota State University.
James W. Harris. Mr. Harris has served as our Executive Vice President and Chief Financial Officer since February 2015. From December 2005 to February 2015, Mr. Harris held various titles, the most recent of which was Senior Vice President and Chief Financial Officer. Mr. Harris was Vice President, Controller of VeriCenter, Inc., a provider of information technology services, and General Manager of its AppSite Hosting service line from January 2004 through November 2005. Prior to joining VeriCenter, from August 1999 through December 2001, Mr. Harris worked for Enron Energy Services, Inc., as a Vice President and thereafter served as a consultant to Enron through December 2003. Mr. Harris began his career at Price Waterhouse from January 1985 until February 1994, with his final position being a Senior Tax Manager, and at Baker Hughes Incorporated from February 1994 until May 1999 in various positions, including Vice President, Tax and Controller. Mr. Harris currently serves as a member of the board of directors of Oil Patch Group, a privately held company specializing in the rental of drill pipe, living quarters and other rental equipment for the oil and natural gas industry. Mr. Harris holds a B.S. and Masters of Accounting from Brigham Young University and an M.B.A. from Rice University. Mr. Harris is a certified public accountant.
James L. McCulloch. Mr. McCulloch has served as our Executive Vice President, General Counsel and Secretary since May 2016. From October 2010 to May 2016 he served as Senior Vice President, General Counsel and Secretary. Mr. McCulloch was a private investor from January 2008 until October 2010, and since February 2008 he has also served on the board of directors of Sunland Inc., a privately held pipeline construction and services company. In 1983, Mr. McCulloch joined Global Marine Inc., a leading international offshore drilling contractor, as Assistant General Counsel and served in a variety of capacities within the legal department until being named Senior Vice President and General Counsel in 1995. In 2001, Global Marine merged with Santa Fe International Corporation, an international land and offshore drilling contractor, to form GlobalSantaFe Corporation, where Mr. McCulloch continued to serve as
29
Senior Vice President and General Counsel until the company's merger with Transocean Inc. in December 2007. Mr. McCulloch holds a B.A. from Tulane University and a J.D. from Tulane University School of Law.
Michael D. Danford. Mr. Danford has served as our Senior Vice President - Human Resources since February 2015. Prior to that, Mr. Danford served as Vice President - Human Resources from November 2007 to February 2015. Prior to joining Forum and, from August 2007 through November 2007, he worked at Trico Marine Services Inc. as Vice President - Human Resources. From 1997 through July 2007, Mr. Danford served as Director of Human Resources and Vice President - Human Resources for Hydril Company. From 1991 to 1997, Mr. Danford served in various human resources roles for Baker Hughes Incorporated. Prior to joining Baker Hughes Incorporated, from 1990 to 1991, Mr. Danford served as a recruiter and as an employee relations representative in the human resources department for Compaq Computer. Mr. Danford holds a B.S. degree in Computer Science from the University of Louisiana at Monroe (formerly Northeast Louisiana University).
30
PART II
Item 5. Market for Registrant's Common Equity, Related Stockholder Matters and Issuer Purchases of Equity Securities
Our common stock trades on the NYSE under the trading symbol "FET." The following table sets forth, for each full quarterly period indicated, the high and low closing sales prices for our common stock as quoted on the NYSE:
Year Ended December 31, 2016 | High | Low | ||||||
First Quarter | $ | 13.52 | $ | 8.54 | ||||
Second Quarter | $ | 19.00 | $ | 12.54 | ||||
Third Quarter | $ | 19.86 | $ | 15.09 | ||||
Fourth Quarter | $ | 23.55 | $ | 17.10 | ||||
Year Ended December 31, 2015 | High | Low | ||||||
First Quarter | $ | 20.95 | $ | 15.31 | ||||
Second Quarter | $ | 23.26 | $ | 19.62 | ||||
Third Quarter | $ | 19.30 | $ | 12.21 | ||||
Fourth Quarter | $ | 15.66 | $ | 11.67 | ||||
As of February 24, 2017, there were approximately 67 shareholders of record of our common stock. In calculating the number of shareholders, we consider clearing agencies and security position listings as one shareholder for each agency or listing.
No dividends were declared or issued during 2016 or 2015, and we do not currently have any plans to pay cash dividends in the future. Our credit facility prohibits us from paying any cash dividends. Our future dividend policy is within the discretion of our Board of Directors and will depend upon various factors, including our results of operations, financial condition, capital requirements, investment opportunities, and other loan agreements. The indenture governing our senior notes also restricts the payment of dividends.
Purchase of Equity Securities
Our Board of Directors authorized on October 27, 2014, a share repurchase program for the repurchase of outstanding shares of our Common Stock having an aggregate purchase price of up to $150 million. Our credit facility prohibits us from repurchasing shares.
The shares of common stock purchased and placed in treasury during the three months ended December 31, 2016 is provided in the table below. 15,076 shares were purchased during the three months ended December 31, 2016 from employees in connection with the settlement of income tax and related benefit withholding obligations arising from the vesting of restricted stock grants.
Period | Total number of shares purchased (a) | Average price paid per share | Total number of shares purchased as part of publicly announced plan or programs | Maximum value of shares that may yet be purchased under the plan or program (in thousands) | ||||||||||
October 1, 2016 - October 31, 2016 | 2,008 | $ | 21.13 | — | $ | 49,752 | ||||||||
November 1, 2016 - November 30, 2016 | 41 | $ | 18.15 | — | — | |||||||||
December 1, 2016 - December 31, 2016 | 13,027 | $ | 22.05 | — | — | |||||||||
Total | 15,076 | $ | 21.92 | — | $ | 49,752 | ||||||||
Performance Graph
The following graph compares total shareholder return on our common stock with the Standard & Poor’s 500 Stock Index and the Philadelphia Oil Service Sector Index ("OSX"), an index of oil and natural gas related companies that represents an industry composite of our peers. This graph covers the period from April 13, 2012, using the closing price for the first day of trading immediately following the effectiveness of our initial public offering per SEC regulations (rather than the IPO offering price of $20.00 per share), through December 31, 2016. This comparison assumes the
31
investment of $100 on April 13, 2012, and the reinvestment of all dividends. The shareholder return set forth is not necessarily indicative of future performance.
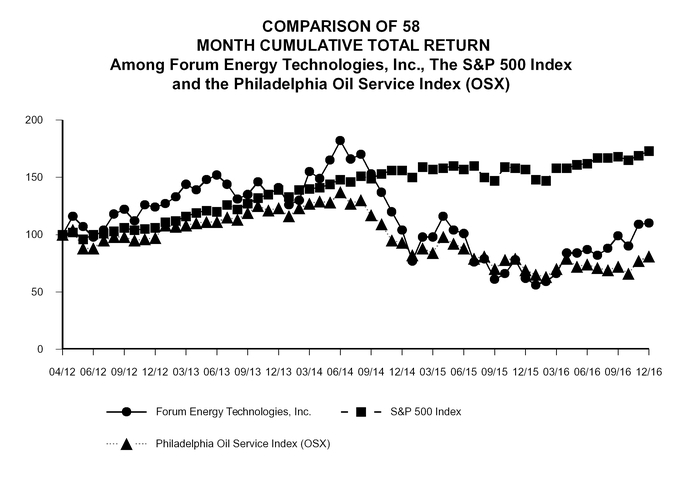
The performance graph above is furnished and not filed for purposes of Section 18 of the Exchange Act and will not be incorporated by reference into any registration statement filed under the Securities Act of 1933 (the "Securities Act") unless specifically identified therein as being incorporated therein by reference. The performance graph is not soliciting material subject to Regulation 14A.
Item 6. Selected Financial Data
The following selected historical consolidated financial data should be read in conjunction with Item 7, "Management's Discussion and Analysis of Financial Condition and Results of Operations" and our consolidated financial statements and related notes appearing in Item 8 "Financial Statements and Supplementary Data" of this Annual Report on Form 10-K to fully understand the factors that may affect the comparability of the information presented below.
The selected historical financial data as of December 31, 2016 and 2015, and for the years ended December 31, 2016, 2015 and 2014 are derived from our audited consolidated financial statements and related notes thereto included herein. The selected historical data as of December 31, 2014, 2013 and 2012 and for the years ended December 31, 2013 and 2012 have been derived from our audited consolidated financial statements, which are not included in this Annual Report on Form 10-K. Our historical results are not necessarily indicative of our results to be expected in any future period.
32
Year ended December 31, | |||||||||||||||||||
(in thousands, except per share information) | 2016 | 2015 | 2014 | 2013 | 2012 | ||||||||||||||
Income Statement Data: | |||||||||||||||||||
Net sales | $ | 587,635 | $ | 1,073,652 | $ | 1,739,717 | $ | 1,524,811 | $ | 1,414,933 | |||||||||
Total operating expenses | 718,411 | 1,202,199 | 1,496,843 | 1,322,569 | 1,174,053 | ||||||||||||||
Earnings from equity investment | 1,824 | 14,824 | 25,164 | 7,312 | — | ||||||||||||||
Operating income (loss) | (128,952 | ) | (113,723 | ) | 268,038 | 209,554 | 240,880 | ||||||||||||
Total other expenses | 9,047 | 20,600 | 25,516 | 23,472 | 18,085 | ||||||||||||||
Income (loss) from continuing operations before income taxes | (137,999 | ) | (134,323 | ) | 242,522 | 186,082 | 222,795 | ||||||||||||
Provision for income tax expense (benefit) | (56,051 | ) | (14,939 | ) | 68,145 | 56,478 | 71,265 | ||||||||||||
Net income (loss) | (81,948 | ) | (119,384 | ) | 174,377 | 129,604 | 151,530 | ||||||||||||
Less: Income (loss) attributable to noncontrolling interest | 30 | (31 | ) | 12 | 65 | 74 | |||||||||||||
Net income (loss) attributable to common stockholders | (81,978 | ) | (119,353 | ) | 174,365 | 129,539 | 151,456 | ||||||||||||
Weighted average shares outstanding | |||||||||||||||||||
Basic | 91,226 | 89,908 | 92,628 | 90,697 | 80,111 | ||||||||||||||
Diluted | 91,226 | 89,908 | 95,308 | 94,604 | 86,937 | ||||||||||||||
Earnings (loss) per share | |||||||||||||||||||
Basic | $ | (0.90 | ) | $ | (1.33 | ) | $ | 1.88 | $ | 1.43 | $ | 1.89 | |||||||
Diluted | $ | (0.90 | ) | $ | (1.33 | ) | $ | 1.83 | $ | 1.37 | $ | 1.74 | |||||||
As of December 31, | |||||||||||||||||||
(in thousands) | 2016 | 2015 | 2014 | 2013 | 2012 | ||||||||||||||
Balance Sheet Data: | |||||||||||||||||||
Cash and cash equivalents | $ | 234,422 | $ | 109,249 | $ | 76,579 | $ | 39,582 | $ | 41,063 | |||||||||
Net property, plant and equipment | 152,212 | 186,667 | 189,974 | 180,292 | 152,983 | ||||||||||||||
Total assets | 1,835,192 | 1,886,042 | 2,214,102 | 2,160,247 | 1,892,980 | ||||||||||||||
Long-term debt | 396,747 | 396,016 | 420,484 | 503,455 | 400,201 | ||||||||||||||
Total stockholders’ equity | 1,235,202 | 1,257,020 | 1,395,356 | 1,330,355 | 1,161,472 | ||||||||||||||
Year ended December 31, | |||||||||||||||||||
(in thousands) | 2016 | 2015 | 2014 | 2013 | 2012 | ||||||||||||||
Other financial data: | |||||||||||||||||||
Net cash provided by operating activities | $ | 64,742 | $ | 155,913 | $ | 269,966 | $ | 211,393 | $ | 137,941 | |||||||||
Capital expenditures for property and equipment | (16,828 | ) | (32,291 | ) | (53,792 | ) | (60,263 | ) | (49,685 | ) | |||||||||
Proceeds from sale of property and equipment | 9,763 | 1,821 | 2,718 | 964 | 5,051 | ||||||||||||||
Acquisition of businesses, net of cash acquired | (4,072 | ) | (60,836 | ) | (38,289 | ) | (181,718 | ) | (139,889 | ) | |||||||||
Net cash used in investing activities | (11,137 | ) | (91,306 | ) | (70,691 | ) | (289,030 | ) | (184,523 | ) | |||||||||
Net cash provided by / (used in) financing activities | 86,195 | (26,937 | ) | (162,018 | ) | 77,054 | 65,782 | ||||||||||||
33
Item 7. Management's Discussion and Analysis of Financial Condition and Results of Operations
The following discussion and analysis of our financial condition and results of operations should be read in conjunction with "Selected historical consolidated financial data" included under Item 6 of this Annual Report on Form 10-K and our financial statements and related notes included under Item 8 of this Annual Report on Form 10-K. This discussion contains forward-looking statements based on our current expectations, estimates and projections about our operations and the industry in which we operate. Our actual results may differ materially from those anticipated in these forward-looking statements as a result of a variety of risks and uncertainties, including those described in "Risk factors", "—Cautionary note regarding forward-looking statements" and elsewhere in this Annual Report on Form 10-K. We assume no obligation to update any of these forward-looking statements.
Overview
We are a global oilfield products company, serving the drilling, subsea, completion, production and infrastructure sectors of the oil and natural gas industry. We design, manufacture and distribute products, and engage in aftermarket services, parts supply and related services that complement our product offering. Our product offering includes a mix of highly engineered capital products and frequently replaced items that are used in the exploration, development, production and transportation of oil and natural gas. Our capital products are directed at: drilling rig equipment for new rigs, upgrades and refurbishment projects; subsea construction and development projects; the placement of production equipment on new producing wells; pressure pumping equipment; and downstream capital projects. Our engineered systems are critical components used on drilling rigs, for completions or in the course of subsea operations, while our consumable products are used to maintain efficient and safe operations at well sites in the well construction process, within the supporting infrastructure and at processing centers and refineries. Historically, over 60% of our revenue is derived from consumable products and activity-based equipment, while the balance is derived from capital products and a small amount from rental and other services.
We seek to design, manufacture and supply reliable products that create value for our diverse customer base, which includes, among others, oil and natural gas operators, land and offshore drilling contractors, oilfield service companies, subsea construction and service companies, and pipeline and refinery operators.
Beginning with the first quarter of 2016, we realigned our segments. Several product lines were combined into a new segment, designated as the Completions segment, in recognition of the expansion in these operations and their significant growth potential. We are reporting our results of operations in the following reportable segments: Drilling & Subsea, Completions, and Production & Infrastructure, instead of the original two reportable segments. Management’s change in the composition of our reportable segments was made in order to align with activity drivers and the customers of our product groups, and how management reviews and evaluates operating performance. This change is reflected on a retrospective basis in accordance with generally accepted accounting principles in the United States ("GAAP"), with prior years adjusted to reflect the change in reportable segments. The new segments are composed of the following:
• | Drilling & Subsea segment. This segment designs and manufactures products and provides related services to the drilling and subsea construction and services markets. The products and related services consist primarily of: (i) capital equipment and a broad line of expendable drilling products consumed in the drilling process; and (ii) subsea capital equipment, specialty components and tooling, products used in subsea pipeline infrastructure, and a broad suite of complementary subsea technical services and rental items. |
• | Completions segment. This segment designs, manufactures and supplies products and provides related services to the well construction, completion, stimulation and intervention markets. The products and related services consist primarily of: (i) well construction casing and cementing equipment, cable protectors used in completions, composite plugs used for zonal isolation in hydraulic fracturing and wireline flow-control products; and (ii) capital and consumable products sold to the pressure pumping, hydraulic fracturing and flowback services markets, including hydraulic fracturing pumps, pump consumables and flow iron as well as coiled tubing, wireline cable, and pressure control equipment used in the well completion and intervention service markets. |
• | Production & Infrastructure segment. This segment designs, manufactures and supplies products and provides related equipment and services for production and infrastructure markets. The products and related services consist primarily of: (i) engineered process systems, production equipment and related field services, as well as oil and produced water treatment equipment; and (ii) a wide range of industrial valves focused on serving upstream, midstream, and downstream oil and natural gas customers. |
34
Market Conditions
The level of demand for our products and services is directly related to activity levels and the capital and operating budgets of our customers, which in turn are influenced heavily by energy prices and the expectation as to future trends in those prices. Energy prices have historically been cyclical in nature, as exemplified by the significant decrease in oil prices beginning in the middle of 2014, and are affected by a wide range of factors. The low energy price environment caused a steep reduction in activity and spending by our customers beginning in 2014. Many exploration and production companies, especially those with operations in North America or offshore, curtailed operations, reduced the number of wells being drilled, or chose to defer the completion of wells that had been drilled. The low commodity prices also resulted in a substantial reduction in activity and revenue for energy service companies, resulting in both exploration and production and energy service companies significantly reducing their purchases of both capital and consumable equipment from the Company and other equipment manufacturers. This widespread reduction in spending had a negative impact on our financial results and new orders from the second half of 2014 through 2016.
Although the probability of any cyclical change in energy prices and the extent and duration of such a change are difficult to predict, there are signs that the market may be recovering from the recent downturn. The announcement by the Organization of Petroleum Exporting Countries ("OPEC") and other unaffiliated countries that their production levels would be capped or reduced has led to a modest increase in oil prices. As a result, a number of exploration and production companies have announced increases in their capital budgets for 2017 based on a more optimistic assessment of the direction of oil prices in the near to medium term. Should this additional spending materialize and continue, our customers, led by those active in North American land basins, should see increased activity and require additional consumable and capital equipment from the Company and other equipment manufacturers. Activity in high cost areas, however, especially offshore and in some international areas, is expected to lag any recovery. Influenced by the expectation of higher energy prices, our inbound orders increased in the fourth quarter. The pace and strength of a recovery in energy markets and in our results, however, remain uncertain as we enter 2017.
The table below shows average crude oil and natural gas prices for West Texas Intermediate crude oil (WTI), United Kingdom Brent crude oil (Brent), and Henry Hub natural gas:
2016 | 2015 | 2014 | ||||||||||
Average global oil, $/bbl | ||||||||||||
West Texas Intermediate | $ | 43.29 | $ | 48.66 | $ | 93.21 | ||||||
United Kingdom Brent | $ | 43.67 | $ | 52.32 | $ | 98.97 | ||||||
Average North American Natural Gas, $/Mcf | ||||||||||||
Henry Hub | $ | 2.52 | $ | 2.62 | $ | 4.37 | ||||||
Average WTI and Brent oil prices were 11% and 17% lower, respectively, in 2016 than 2015. The WTI oil price was $53.75 and $37.13 per barrel on December 31, 2016 and 2015, respectively. Average natural gas prices were 4% lower in 2016 than 2015. Primarily as a result of increasing supply and insufficient demand growth, crude oil prices began a significant decline in the second half of 2014 and have declined 50% from peak prices in June 2014 to the end of December 2016. The precipitous decline in oil and natural gas prices resulted in a significant decrease in exploration and production activity and spending by our customers, causing us to experience a significant adverse impact on our results of operation during that period.
35
The table below shows the average number of active drilling rigs, based on the weekly Baker Hughes Incorporated rig count, operating by geographic area and drilling for different purposes.
2016 | 2015 | 2014 | |||||||
Active Rigs by Location | |||||||||
United States | 509 | 978 | 1,862 | ||||||
Canada | 130 | 192 | 379 | ||||||
International | 955 | 1,167 | 1,337 | ||||||
Global Active Rigs | 1,594 | 2,337 | 3,578 | ||||||
Land vs. Offshore Rigs | |||||||||
Land | 1,348 | 2,016 | 3,193 | ||||||
Offshore | 246 | 321 | 385 | ||||||
Global Active Rigs | 1,594 | 2,337 | 3,578 | ||||||
U.S. Commodity Target, Land | |||||||||
Oil/Gas | 408 | 750 | 1,526 | ||||||
Gas | 100 | 227 | 333 | ||||||
Unclassified | 1 | 1 | 3 | ||||||
Total U.S. Land Rigs | 509 | 978 | 1,862 | ||||||
U.S. Well Path, Land | |||||||||
Horizontal | 400 | 744 | 1,273 | ||||||
Vertical | 60 | 139 | 377 | ||||||
Directional | 49 | 95 | 212 | ||||||
Total U.S. Active Land Rigs | 509 | 978 | 1,862 | ||||||
As a result of lower oil and natural gas prices, the average U.S. rig count decreased 48% from 2015, while the international rig count and the Canadian rig count decreased 18% and 32%, respectively, from 2015. The U.S. rig count declined 79% from the peak of 1,931 rigs in the third quarter of 2014 to the trough of 404 rigs in the second quarter of 2016. Since then the number of working rigs has increased steadily to 658 rigs at the end of December 2016. A substantial portion of our revenue is impacted by the level of rig activity and the number of wells completed. While the U.S. land rig count has started to recover, it remains low compared to historical norms.
The table below shows the amount of total inbound orders by segment for the years ended December 31, 2016, 2015 and 2014:
(in millions of dollars) | 2016 | 2015 | 2014 | |||||||||
Orders: | ||||||||||||
Drilling & Subsea | $ | 216.7 | $ | 363.5 | $ | 1,002.2 | ||||||
Completions | 129.3 | 209.2 | 373.9 | |||||||||
Production & Infrastructure | 250.8 | 297.3 | 470.1 | |||||||||
Total Orders | $ | 596.8 | $ | 870.0 | $ | 1,846.2 | ||||||
36
Acquisitions
Subsequent to December 31, 2016, we acquired substantially all of the assets of Cooper Valves, LLC (“Cooper”) as well as 100% of the general partnership interests of Innovative Valve Components for total aggregate consideration of $14.5 million. The acquired Cooper brands include the Accuseal® metal seated ball valves engineered to meet Class VI shut off standards for use in severe service applications, as well as a full line of cast and forged gate, globe, and check valves. Innovative Valve Components, in partnership with Cooper Valves, commercialized critical service valves and components for the power generation, mining and oil and natural gas industries. Cooper is included in the Production and Infrastructure segment.
On April 28, 2016, we completed the acquisition of the wholesale completion packers business of Team Oil Tools, Inc. The acquisition includes a wide variety of completion and service tools, including retrievable and permanent packers, bridge plugs and accessories which are sold to oilfield service providers, packer repair companies and distributors on a global basis, and is included in the Completions segment.
On February 2, 2015, we completed the acquisition of J-Mac Tool, Inc. (“J-Mac”) for aggregate consideration of approximately $61.9 million. J-Mac, located in Fort Worth, Texas, manufactures hydraulic fracturing pumps, power ends, fluid ends and other pump accessories. The acquired business also provides repair and refurbishment services at its main location in Fort Worth and at other service center locations. J-Mac is included in the Completions segment.
On May 1, 2014, we completed the acquisition of Quality Wireline & Cable, Inc. ("Quality") for consideration of $38.3 million. Quality is a Calgary, Alberta based manufacturer of high-performance cased-hole electro-mechanical wireline cables and specialty cables for the oil and natural gas industry. Quality is included in the Drilling & Subsea segment.
None of these transactions included potential future payments contingent on financial performance.
There are factors related to the businesses we have acquired that may result in lower net profit margins on a going-forward basis, primarily the federal income tax status of the legal entity and the level of depreciation and amortization charges arising out of the accounting for the purchase.
For additional information regarding our 2016, 2015, and 2014 acquisitions, please read Note 3 of the Notes to the Consolidated Financial Statements in Part II, Item 8 "Financial Statements and Supplementary Data" of this Annual Report on Form 10-K.
Evaluation of operations
We manage our operations through the three business segments described above. We have focused on implementing financial reporting and controls at all of our operations to accelerate the availability of critical information necessary to support informed decision making. We use a number of financial and non-financial measures to routinely analyze and evaluate, on a segment and corporate level, the performance of our business. As an example of a non-financial measure, we measure our safety by tracking the total recordable incident rate and we consider this as an indication of the quality of our products. Financial measures include the following:
Revenue growth. We compare actual revenue achieved each month to the most recent estimate for that month and to the annual plan for the month established at the beginning of the year. We monitor our revenue to analyze trends in the relative performance of each of our product lines as compared to standard revenue drivers or market metrics applicable to that product. We are particularly interested in identifying positive or negative trends and investigating to understand the root causes. In addition, we review these metrics on a quarterly basis. We also evaluate changes in the mix of products sold and the resultant impact on reported gross margins.
Gross margin percentage. We define gross margin percentage as our gross margin, or net sales minus cost of sales, divided by our net sales. Our management continually evaluates our consolidated gross margin percentage and our gross margin percentage by segment to determine how each segment is performing. This metric aids management in capital resource allocation and pricing decisions.
Selling, general and administrative expenses as a percentage of total revenue. Selling, general and administrative expenses include payroll related costs for sales, marketing, administrative, accounting, information technology, certain engineering and human resources functions; audit, legal and other professional fees; insurance; franchise taxes not based on income; travel and entertainment; advertising and promotions; depreciation and amortization expense; bad debt expense; and other office and administrative related costs. Our management continually evaluates the level of our selling, general and administrative expenses in relation to our revenue and makes appropriate changes in light of activity levels to preserve and improve our profitability while meeting the on-going support and regulatory requirements of the business.
37
Operating income and operating margin percentage. We define operating income as revenue less cost of goods sold less selling, general and administrative expenses. We define our operating margin percentage as operating income divided by revenue. These metrics assist management in evaluating the performance of each segment as a whole, especially to determine whether the amount of administrative burden is appropriate to support current business activity levels.
Earnings per share. We calculate fully-diluted earnings per share as prescribed under GAAP, that is net income divided by common shares outstanding, giving effect for the assumed exercise of all outstanding options and warrants with a strike price less than the average fair value of the shares over the period covered for the calculation. There is no dilutive effect for 2016 and 2015 since we are in a net loss position. We believe this measure is important as it reflects the sum total of operating results and all attendant capital decisions, showing in one number the amount earned for the stockholders of our Company.
Free cash flow. We define free cash flow as net cash provided by operating activities, less capital expenditures for property and equipment net of proceeds from sale of property and equipment and other. We believe that this measure is important because it encompasses both profitability and capital management in evaluating results. Free cash flow represents the business’ contribution in the generation of funds available to pay debt outstanding, invest in other areas, or return funds to our stockholders.
Free cash flow is a non-GAAP financial measure and should not be considered as an alternative to cash provided by operating activities as a cash flow measurement.
Factors affecting the comparability of our future results of operations to our historical results of operations
Our future results of operations may not be comparable to our historical results of operations for the periods presented, primarily for the following reasons:
• | Since our initial public offering in 2012, we have grown our business both organically and through strategic acquisitions. We have expanded and diversified our product portfolio and business lines with the acquisition of one business in each of 2016, 2015, and 2014. The historical financial data for periods prior to the acquisitions does not include the results of any of the acquired companies for the periods presented and, as such, does not provide an accurate indication of our future results. |
• | As we integrate acquired companies and further implement internal controls, processes and infrastructure to operate in compliance with the regulatory requirements applicable to companies with publicly traded shares, it is likely that we will incur incremental selling, general and administrative expenses relative to historical periods. |
Our future results will depend on our ability to efficiently manage our combined operations and execute our business strategy.
38
Results of operations
Year ended December 31, 2016 compared with year ended December 31, 2015
Year ended December 31, | Favorable / (Unfavorable) | |||||||||||||
2016 | 2015 | $ | % | |||||||||||
(in thousands of dollars, except per share information) | ||||||||||||||
Revenue: | ||||||||||||||
Drilling & Subsea | $ | 227,872 | $ | 487,299 | $ | (259,427 | ) | (53.2 | )% | |||||
Completions | 127,432 | 267,236 | (139,804 | ) | (52.3 | )% | ||||||||
Production & Infrastructure | 233,754 | 320,442 | (86,688 | ) | (27.1 | )% | ||||||||
Eliminations | (1,423 | ) | (1,325 | ) | (98 | ) | * | |||||||
Total revenue | $ | 587,635 | $ | 1,073,652 | (486,017 | ) | (45.3 | )% | ||||||
Cost of sales: | ||||||||||||||
Drilling & Subsea | $ | 189,132 | $ | 359,004 | $ | 169,872 | 47.3 | % | ||||||
Completions | 123,548 | 212,238 | 88,690 | 41.8 | % | |||||||||
Production & Infrastructure | 176,643 | 241,058 | 64,415 | 26.7 | % | |||||||||
Eliminations | (1,423 | ) | (1,325 | ) | 98 | * | ||||||||
Total cost of sales | $ | 487,900 | $ | 810,975 | $ | 323,075 | 39.8 | % | ||||||
Gross profit: | ||||||||||||||
Drilling & Subsea | $ | 38,740 | $ | 128,295 | $ | (89,555 | ) | (69.8 | )% | |||||
Completions | 3,884 | 54,998 | (51,114 | ) | (92.9 | )% | ||||||||
Production & Infrastructure | 57,111 | 79,384 | (22,273 | ) | (28.1 | )% | ||||||||
Total gross profit | $ | 99,735 | $ | 262,677 | $ | (162,942 | ) | (62.0 | )% | |||||
Selling, general and administrative expenses: | ||||||||||||||
Drilling & Subsea | $ | 92,329 | $ | 121,405 | $ | 29,076 | 23.9 | % | ||||||
Completions | 50,783 | 58,698 | 7,915 | 13.5 | % | |||||||||
Production & Infrastructure | 56,456 | 56,726 | 270 | 0.5 | % | |||||||||
Corporate | 27,440 | 28,077 | 637 | 2.3 | % | |||||||||
Total selling, general and administrative expenses | $ | 227,008 | $ | 264,906 | $ | 37,898 | 14.3 | % | ||||||
Operating income (loss): | ||||||||||||||
Drilling & Subsea | $ | (53,589 | ) | $ | 6,890 | $ | (60,479 | ) | * | |||||
Operating income margin % | (23.5 | )% | 1.4 | % | ||||||||||
Completions | (45,075 | ) | 11,124 | (56,199 | ) | * | ||||||||
Operating income margin % | (35.4 | )% | 4.2 | % | ||||||||||
Production & Infrastructure | 655 | 22,658 | (22,003 | ) | (97.1 | )% | ||||||||
Operating income margin % | 0.3 | % | 7.1 | % | ||||||||||
Corporate | (27,440 | ) | (28,077 | ) | 637 | 2.3 | % | |||||||
Total segment operating income (loss) | $ | (125,449 | ) | $ | 12,595 | $ | (138,044 | ) | * | |||||
Operating income margin % | (21.3 | )% | 1.2 | % | ||||||||||
Goodwill and Intangible asset impairment | — | 125,092 | 125,092 | * | ||||||||||
Transaction expenses | 865 | 480 | (385 | ) | * | |||||||||
Loss on sale of assets | 2,638 | 746 | (1,892 | ) | * | |||||||||
Loss from operations | (128,952 | ) | (113,723 | ) | (15,229 | ) | (13.4 | )% | ||||||
Interest expense, net | 27,410 | 29,945 | 2,535 | 8.5 | % | |||||||||
Other (income) expense, net | (21,341 | ) | (9,345 | ) | 11,996 | * | ||||||||
Deferred loan cost written off | 2,978 | — | (2,978 | ) | * | |||||||||
Other (income) expense, net | 9,047 | 20,600 | 11,553 | 56.1 | % | |||||||||
Loss before income taxes | (137,999 | ) | (134,323 | ) | (3,676 | ) | (2.7 | )% | ||||||
Income tax benefit | (56,051 | ) | (14,939 | ) | 41,112 | * | ||||||||
Net loss | (81,948 | ) | (119,384 | ) | 37,436 | 31.4 | % | |||||||
Less: Income (loss) attributable to non-controlling interest | 30 | (31 | ) | 61 | * | |||||||||
Loss attributable to common stockholders | $ | (81,978 | ) | $ | (119,353 | ) | $ | 37,375 | 31.3 | % | ||||
Weighted average shares outstanding | ||||||||||||||
Basic | 91,226 | 89,908 | ||||||||||||
Diluted | 91,226 | 89,908 | ||||||||||||
Earnings (loss) per share | ||||||||||||||
Basic | $ | (0.90 | ) | $ | (1.33 | ) | ||||||||
Diluted | $ | (0.90 | ) | $ | (1.33 | ) | ||||||||
* not meaningful | ||||||||||||||
39
Revenue
Our revenue for the year ended December 31, 2016 decreased $486.0 million, or 45.3%, to $587.6 million compared to the year ended December 31, 2015. For the year ended December 31, 2016, our Drilling & Subsea segment, Completions segment, and Production & Infrastructure segment comprised 38.5%, 21.7% and 39.8% of our total revenue, respectively, compared to 45.3%, 24.9% and 29.8%, respectively, for the year ended December 31, 2015. The revenue changes by operating segment consisted of the following:
Drilling & Subsea segment — Revenue decreased $259.4 million, or 53.2%, to $227.9 million during the year ended December 31, 2016 compared to the year ended December 31, 2015 as a result of decreased oil and natural gas drilling and well completions activity, both onshore and offshore, and pricing pressure. The U.S. average rig count decreased 48% compared to the prior year period resulting in decreased sales of our drilling equipment products. We also recognized lower revenue compared to the prior year period on our subsea products as demand for our remotely operated vehicles and associated systems and other offshore products decreased substantially due to reduced investment in offshore projects globally.
Completions segment — Revenue decreased $139.8 million, or 52.3%, to $127.4 million during the year ended December 31, 2016 compared to the year ended December 31, 2015. The decrease in revenue was attributable to lower well completions activity globally, including in North America, and pricing pressure, leading to lower revenue from our casing and cementing equipment, products sold to pressure pumping service providers and pressure control equipment.
Production & Infrastructure segment - Revenue decreased $86.7 million, or 27.1%, to $233.8 million during the year ended December 31, 2016 compared to the year ended December 31, 2015. The decrease in revenue was primarily attributable to a decrease in exploration and production budgets, which led to pricing pressure and lower sales of our surface production equipment, and, to a lesser extent, lower sales of our valves to the upstream sector. The demand for our midstream and downstream valves has continued to be more resilient than some of our other product lines.
Segment operating income (loss) and segment operating margin percentage
Segment operating income (loss) for the year ended December 31, 2016 decreased $138.0 million, to a loss of $125.4 million compared to the year ended December 31, 2015. The operating margin percentage decreased to (21.3)% for the year ended December 31, 2016 from 1.2% for the year ended December 31, 2015. The 2016 results include total charges of $38.3 million related to several facility consolidations and closures, inventory write-downs across all product lines attributable to expected continuing lower activity levels, and severance paid to employees under our policy for reductions in force. In 2015, similar charges totaled $63.7 million. The segment operating margin percentage is calculated by dividing segment operating income (loss) by revenue. For the year ended December 31, 2016, the adjusted segment operating margin percentage, excluding charges, decreased to (14.8)% from the 7.1% adjusted operating margin percentage for the year ended December 31, 2015. We believe that adjusted operating margins excluding the costs described above are useful for assessing operating performance, especially when comparing periods. The change in adjusted operating margin percentage for each segment, excluding charges, is explained as follows:
Drilling & Subsea segment — The operating margin percentage decreased to (23.5)% for the year ended December 31, 2016 from 1.4% for the year ended December 31, 2015. The year ended December 31, 2016 and 2015 included $12.6 million and $32.1 million, respectively, of inventory write-downs due to lower activity levels and reduced pricing of our products, and severance and facility closure costs incurred to further reduce our cost structure in line with current activity levels. Excluding these charges, the adjusted operating margin percentage decreased to (18.0)%, for the year ended December 31, 2016, from 8.0% for the year ended December 31, 2015. The main driver for this decrease in operating margin percentage is the lower activity levels, which have caused a loss of manufacturing scale efficiencies and more intense competition for fewer sales opportunities reducing our prices.
Completions segment — The operating margin percentage decreased to (35.4)% for the year ended December 31, 2016 from 4.2% for the year ended December 31, 2015. The year ended December 31, 2016 and 2015 included $21.2 million and $25.2 million, respectively, of inventory write-downs attributable to lower activity levels and reduced pricing of our products, and facility closure costs incurred to reduce our cost structure in line with current market activity levels. Excluding these charges, the adjusted operating margin percentage decreased to (18.8)%, for the year ended December 31, 2016, from 13.6% for the year ended December 31, 2015. The decrease in operating margin percentage is due to reduced operating leverage on lower volumes and pricing pressure especially on consumable flow equipment sold to pressure pumping service companies. Also impacting margins were lower earnings from our investment in Global Tubing.
40
Production & Infrastructure segment — The operating margin percentage decreased to 0.3% for the year ended December 31, 2016 from 7.1% for the year ended December 31, 2015. The year ended December 31, 2016 and 2015 included $3.9 million and $5.1 million, respectively, of costs related to facility consolidation and severance. Excluding these charges, adjusted operating margin percentage decreased to 1.9% for the year ended December 31, 2016, from 8.7% for the year ended December 31, 2015. The decrease in operating margin percentage was attributable to reduced operating leverage on lower volumes, and pricing pressure on our surface production equipment on lower activity levels. The operating margins for our valve products have been more resilient as demand for midstream and downstream valves remains steady.
Corporate — Selling, general and administrative expenses for Corporate decreased $0.6 million, or 2.3%, for the year ended December 31, 2016 compared to the year ended December 31, 2015, due to lower personnel costs and lower professional fees. Corporate costs include, among other items, payroll related costs for general management and management of finance and administration, legal, human resources and information technology, professional fees for legal, accounting and related services, and marketing costs.
Other items not included in segment operating income (loss)
Several items are not included in segment operating income (loss), but are included in total operating income (loss). These items include: transaction expenses, gains/losses from the sale of assets, and impairment losses of intangible assets and goodwill. Transaction expenses relate to legal and other advisory costs incurred in acquiring businesses, including fees to accomplish an internal legal entity restructuring, and are not considered to be part of segment operating income (loss). These costs were $0.9 million and $0.5 million for the years ended December 31, 2016 and 2015, respectively. In the year ended December 31, 2016, we recognized a net loss of $2.6 million on sales of assets, primarily including a gain of $1.7 million from the sale of a plant, a loss of $1.9 million related to an operation in South Africa expected to be sold, and a loss of $2.4 million related to one of our Texas facilities sold in fourth quarter of 2016.
The 2015 impairment losses for intangible assets and goodwill were $1.9 million and $123.2 million, respectively. The intangible assets that were written off related to certain trade names that were no longer in use. Due to the further deterioration of market conditions for our products, the goodwill impairment test showed that goodwill in our subsea product line was impaired, and based on a valuation of the applicable assets we recorded a charge in the fourth quarter 2015. No impairment losses were recorded on goodwill or indefinite-lived intangible assets for the year ended December 31, 2016.
Other income and expense
Other income and expense includes interest expense, and foreign exchange gains and losses. We incurred $27.4 million of interest expense during the year ended December 31, 2016, a decrease of $2.5 million from the year ended December 31, 2015 on lower outstanding indebtedness and lower commitment fees on the unused portion of our revolving credit line. The foreign exchange gain was $21.3 million for the year ended December 31, 2016, an increase of $12.0 million from the year ended December 31, 2015, and was primarily the result of movements in the British pound and the Euro relative to the U.S. dollar. In year ended December 31, 2016, we wrote off $3.0 million of deferred financing costs as a result of the amendments of our credit facility in the first and fourth quarter of 2016 which reduced the size of our undrawn revolving credit line.
Taxes
Tax expense includes current income taxes expected to be due based on taxable income to be reported during the periods in the various jurisdictions in which we conduct business, and deferred income taxes based on changes in the tax effect of temporary differences between the bases of assets and liabilities for financial reporting and tax purposes at the beginning and end of the respective periods. The effective tax rate, calculated by dividing total tax expense by income before income taxes, was a benefit of 40.6% and a benefit of 11.1% for the years ended December 31, 2016 and 2015, respectively. The effective tax rate for the year ended December 31, 2016 is significantly different than the comparable period in 2015 primarily due to net operating losses incurred in the United States offset by earnings generated outside the United States in jurisdictions subject to lower tax rates. In addition, the majority of the goodwill impairment loss in 2015 was not tax deductible. The effective tax rate can vary from period to period depending on our relative mix of U.S. and non-U.S. earnings. Excluding the goodwill and intangible asset impairment and the charges discussed above in the segment operating margin discussion, our effective tax rate would have been approximately 22% for the year ended December 31, 2015.
41
Year ended December 31, 2015 compared to year ended December 31, 2014
Year ended December 31, | Favorable / (Unfavorable) | |||||||||||||
2015 | 2014 | $ | % | |||||||||||
(in thousands of dollars, except per share information) | ||||||||||||||
Revenue: | ||||||||||||||
Drilling & Subsea | $ | 487,299 | $ | 864,320 | $ | (377,021 | ) | (43.6 | )% | |||||
Completions | 267,236 | 441,345 | (174,109 | ) | (39.4 | )% | ||||||||
Production & Infrastructure | 320,442 | 436,271 | (115,829 | ) | (26.5 | )% | ||||||||
Eliminations | (1,325 | ) | (2,219 | ) | 894 | * | ||||||||
Total revenue | $ | 1,073,652 | $ | 1,739,717 | (666,065 | ) | (38.3 | )% | ||||||
Cost of sales: | ||||||||||||||
Drilling & Subsea | $ | 359,004 | $ | 580,195 | $ | 221,191 | 38.1 | % | ||||||
Completions | 212,238 | 279,961 | 67,723 | 24.2 | % | |||||||||
Production & Infrastructure | 241,058 | 322,328 | 81,270 | 25.2 | % | |||||||||
Eliminations | (1,325 | ) | (2,219 | ) | (894 | ) | * | |||||||
Total cost of sales | $ | 810,975 | $ | 1,180,265 | $ | 369,290 | 31.3 | % | ||||||
Gross profit: | ||||||||||||||
Drilling & Subsea | $ | 128,295 | $ | 284,125 | $ | (155,830 | ) | (54.8 | )% | |||||
Completions | 54,998 | 161,384 | (106,386 | ) | (65.9 | )% | ||||||||
Production & Infrastructure | 79,384 | 113,943 | (34,559 | ) | (30.3 | )% | ||||||||
Total gross profit | $ | 262,677 | $ | 559,452 | $ | (296,775 | ) | (53.0 | )% | |||||
Selling, general and administrative expenses: | ||||||||||||||
Drilling & Subsea | $ | 121,405 | $ | 153,052 | $ | 31,647 | 20.7 | % | ||||||
Completions | 58,698 | 59,959 | 1,261 | 2.1 | % | |||||||||
Production & Infrastructure | 56,726 | 57,795 | 1,069 | 1.8 | % | |||||||||
Corporate | 28,077 | 42,015 | 13,938 | 33.2 | % | |||||||||
Total selling, general and administrative expenses | $ | 264,906 | $ | 312,821 | $ | 47,915 | 15.3 | % | ||||||
Operating income: | ||||||||||||||
Drilling & Subsea | $ | 6,890 | $ | 131,072 | $ | (124,182 | ) | (94.7 | )% | |||||
Operating income margin % | 1.4 | % | 15.2 | % | ||||||||||
Completions | 11,124 | 126,590 | (115,466 | ) | (91.2 | )% | ||||||||
Operating income margin % | 4.2 | % | 28.7 | % | ||||||||||
Production & Infrastructure | 22,658 | 56,148 | (33,490 | ) | (59.6 | )% | ||||||||
Operating income margin % | 7.1 | % | 12.9 | % | ||||||||||
Corporate | (28,077 | ) | (42,015 | ) | 13,938 | 33.2 | % | |||||||
Total segment operating income | $ | 12,595 | $ | 271,795 | (259,200 | ) | (95.4 | )% | ||||||
Operating income margin % | 1.2 | % | 15.6 | % | ||||||||||
Goodwill and Intangible asset impairment | 125,092 | — | (125,092 | ) | * | |||||||||
Transaction expenses | 480 | 2,326 | 1,846 | * | ||||||||||
Loss on sale of assets | 746 | 1,431 | 685 | * | ||||||||||
Income (loss) from operations | (113,723 | ) | 268,038 | (381,761 | ) | (142.4 | )% | |||||||
Interest expense, net | 29,945 | 29,847 | (98 | ) | (0.3 | )% | ||||||||
Other, net | (9,345 | ) | (4,331 | ) | 5,014 | * | ||||||||
Other (income) expense, net | 20,600 | 25,516 | 4,916 | 19.3 | % | |||||||||
Income (loss) before income taxes | (134,323 | ) | 242,522 | (376,845 | ) | (155.4 | )% | |||||||
Income tax expense (benefit) | (14,939 | ) | 68,145 | 83,084 | 121.9 | % | ||||||||
Net income (loss) | (119,384 | ) | 174,377 | (293,761 | ) | (168.5 | )% | |||||||
Less: Income (loss) attributable to non-controlling interest | (31 | ) | 12 | (43 | ) | * | ||||||||
Income (loss) attributable to common stockholders | $ | (119,353 | ) | $ | 174,365 | $ | (293,718 | ) | (168.5 | )% | ||||
Weighted average shares outstanding | ||||||||||||||
Basic | 89,908 | 92,628 | ||||||||||||
Diluted | 89,908 | 95,308 | ||||||||||||
Earnings (loss) per share | ||||||||||||||
Basic | $ | (1.33 | ) | $ | 1.88 | |||||||||
Diluted | $ | (1.33 | ) | $ | 1.83 | |||||||||
* not meaningful | ||||||||||||||
42
Revenue
Our revenue for the year ended December 31, 2015 decreased $666.1 million, or 38.3%, to $1,073.7 million compared to the year ended December 31, 2014. For the year ended December 31, 2015, our Drilling & Subsea segment, Completions segment, and Production & Infrastructure segment comprised 45.3%, 24.9%% and 29.8% of our total revenue, respectively, compared to 49.6%, 25.3% and 25.1%, respectively, for the year ended December 31, 2014. The revenue changes by operating segment consisted of the following:
Drilling & Subsea segment — Revenue decreased $377.0 million, or 43.6%, to $487.3 million during the year ended December 31, 2015 compared to the year ended December 31, 2014. The decrease is primarily attributable to decreased oil and natural gas drilling activity in North America and, to a lesser extent lower international activity. The U.S. average rig count decreased 48% compared to the prior year period, and the number of rigs working in the U.S. was down 62% from the beginning to the end of the year, resulting in decreased sales of our drilling equipment. We also recognized lower revenue compared to the prior year period on our subsea products , such as ROVs, as investment in offshore oil and natural gas projects declined.
Completions segment — Revenue decreased $174.1 million, or 39.4%, to $267.2 million during the year ended December 31, 2015 compared to the year ended December 31, 2014. The decrease is primarily attributable to decreased oil and natural gas drilling and well completions activity in North America, resulting in decreased sales of our completions products. The decrease in revenue was also due to lower sales of our consumable flow equipment products to pressure pumping service providers, offset by the addition of J-Mac sales from the first quarter 2015 acquisition.
Production & Infrastructure segment — Revenue decreased $115.8 million, or 26.5%, to $320.4 million during the year ended December 31, 2015 compared to the year ended December 31, 2014. The decrease in revenue was due to lower sales of our surface production equipment to exploration and production operators. Our customers, exploration and production operators, completed fewer wells in the current year resulting in lower spending with their suppliers, including us. Unlike our other product lines, Valve Solutions derives a significant portion of its revenue from the midstream, downstream and processing sectors, which have not suffered the same decline in activity experienced as the upstream sector. Revenue for the product line decreased, primarily due to reduced sales in the upstream sector including the slower Canadian market activity, and fewer large project orders in the downstream sector. However, the decrease was less than that experienced by our other product lines.
Segment operating income and segment operating margin percentage
Segment operating income for the year ended December 31, 2015 decreased $259.2 million, or 95.4%, to $12.6 million compared to the year ended December 31, 2014. The 2015 results include total charges of $63.7 million related to several facility consolidations and closures, inventory write-downs across all product lines attributable to expected continuing lower activity levels, and severance paid to employees under our policy for reductions in force. In 2014, similar charges totaled $3.8 million. The segment operating margin percentage is calculated by dividing segment operating income by revenue. For the year ended December 31, 2015, the adjusted segment operating margin percentage, excluding charges, decreased to 7.1% from 15.8% adjusted operating margin percentage for the year ended December 31, 2014. We believe that adjusted operating margins excluding the costs described above are useful for assessing operating performance, especially when comparing periods. The change in adjusted operating margin percentage for each segment, excluding charges, is explained as follows:
Drilling & Subsea segment — The operating margin percentage decreased to 1.4% for the year ended December 31, 2015 from 15.2% for the year ended December 31, 2014. The charges described above that were excluded from this segment’s adjusted operating margin for 2015 and 2014, respectively, were approximately $32.1 million and $1.6 million. Excluding these charges, the adjusted operating margin percentage decreased to 8.0%, for the year ended December 31, 2015, from 15.3% for the year ended December 31, 2014. The primary reasons for the decrease in adjusted operating margin percentage are lower activity levels, causing a loss of manufacturing scale efficiencies, and more intense competition for fewer sales opportunities which reduces prices charged to the customer.
Completions segment — The operating margin percentage decreased to 4.2% for the year ended December 31, 2015 from 28.7% for the year ended December 31, 2014. The charges described above that were excluded from this segment’s adjusted operating margin for 2015 and 2014 were approximately $25.2 million and $0.1 million, respectively. Excluding these charges, the adjusted operating margin percentage decreased to 13.6%, for the year ended December 31, 2015, from 28.7% for the year ended December 31, 2014. The overall decrease in operating margin percentage is due to reduced operating leverage on lower volumes and pricing pressure especially on consumable flow equipment sold to pressure pumping service companies. Also impacting margins were lower earnings from our investment in Global Tubing.
43
Production & Infrastructure segment — Operating margin percentage decreased to 7.1% for the year ended December 31, 2015, from 12.9% for the year ended December 31, 2014. The charges described above that were excluded from this segment’s adjusted operating margin for 2015 and 2014, respectively, were approximately $5.1 million and $0.4 million. Excluding these charges, adjusted operating margin percentage decreased to 8.7% for the year ended December 31, 2015, from 13.0% for the year ended December 31, 2014. The decrease in adjusted operating margin percentage was attributable to higher competition for fewer sales on lower activity levels, and reduced operating leverage on lower volumes.
Corporate — Selling, general and administrative expenses for Corporate decreased $13.9 million, or 33.2%, for the year ended December 31, 2015 compared to the year ended December 31, 2014 due to lower personnel costs, including reduced bonus accruals, and lower professional fees. Corporate costs include, among other items, payroll related costs for general management and management of finance and administration, legal, human resources and information technology; professional fees for legal, accounting and related services; and marketing costs.
Other items not included in segment operating income
Several items are not included in segment operating income, but are included in total operating income (loss). These items include: transaction expenses, gains/losses from the sale of assets, and impairment losses of intangible assets and goodwill. Transaction expenses relate to legal and other advisory costs incurred in acquiring businesses, including fees to accomplish an internal legal entity restructuring, and are not considered to be part of segment operating income. These costs were $0.5 million and $2.3 million for the years ended December 31, 2015 and 2014, respectively. In the year ended December 31, 2015, we recognized a net loss of $0.7 million on sales of assets, primarily related to plant consolidations.
The 2015 impairment losses for intangible assets and goodwill were $1.9 million and $123.2 million, respectively. The intangible assets that were written off related to certain trade names that were no longer in use. Due to the further deterioration of market conditions for our products, the goodwill impairment test showed that goodwill in our subsea product line was impaired, and based on a valuation of the applicable assets we recorded a charge in the fourth quarter 2015. No impairment losses were recorded on goodwill or indefinite-lived intangible assets for the year ended December 31, 2014.
Other income and expense
Other income and expense includes interest expense, and foreign exchange gains and losses. We incurred $29.9 million of interest expense during the year ended December 31, 2015, a increase of $0.1 million from the year ended December 31, 2014. The change in foreign exchange gains or losses is primarily the result of movements in the British pound and the Euro relative to the U.S. dollar.
Taxes
Tax expense includes current income taxes expected to be due based on taxable income to be reported during the periods in the various jurisdictions in which we conduct business, and deferred income taxes based on changes in the tax effect of temporary differences between the bases of assets and liabilities for financial reporting and tax purposes at the beginning and end of the respective periods. The effective tax rate, calculated by dividing total tax expense by income before income taxes, was a benefit of 11.1% and a provision of 28.1% for the years ended December 31, 2015 and 2014, respectively. The effective tax rate for the year ended December 31, 2015 is significantly different than the comparable period in 2014 primarily due to a higher proportion of our earnings being generated outside the United States in jurisdictions subject to lower tax rates and because the majority of the goodwill impairment loss was not tax deductible. The effective tax rate can vary from period to period depending on our relative mix of U.S. and non-U.S. earnings. Excluding the goodwill and intangible asset impairment and the charges discussed above in the segment operating margin discussion, our effective tax rate would have been approximately 22% for the year ended December 31, 2015.
Liquidity and capital resources
Sources and uses of liquidity
Our internal sources of liquidity are cash on hand and cash flows from operations, while our primary external sources have included our credit facility described below, trade credit, and the issuance of our senior notes described below. Our primary uses of capital have been for acquisitions, ongoing maintenance and growth capital expenditures,
44
inventories and sales on credit to our customers. We continually monitor potential capital sources, including equity and debt financing, to meet our investment and target liquidity requirements. Our future success and growth will be highly dependent on our ability to continue to access outside sources of capital.
At December 31, 2016, we had cash and cash equivalents of $234.4 million and total debt of $396.9 million. We believe that cash on hand and cash generated from operations will be sufficient to fund operations, working capital needs, capital expenditure requirements and financing obligations for the foreseeable future. We intend to elect to carry back our 2016 U.S. net operating loss to recover taxes paid in earlier periods, and we expect to receive a tax refund of approximately $33 million in the third quarter 2017.
Our total 2017 capital expenditure budget is approximately $30.0 million, which consists of, among other items, investments in maintaining certain manufacturing facilities, replacing end of life machinery and equipment, maintaining our rental fleet of subsea equipment, continuing the implementation of our enterprise resource planning solution globally, and general capital expenditures. This budget does not include expenditures for potential business acquisitions.
The amount of capital expenditures incurred in 2016 was $16.8 million. These expenditures were paid for from internally generated funds. We believe cash flows from operations should be sufficient to fund our capital requirements for 2017.
Although we do not budget for acquisitions, pursuing growth through acquisitions is a significant part of our business strategy. We expanded and diversified our product portfolio with the acquisition of one business in the second quarter 2016 for total consideration of $3.0 million, one business in the first quarter 2015 for total consideration (net of cash acquired) of $61.9 million, and one business in the second quarter 2014 for total consideration (net of cash acquired) of $38.3 million. Subsequent to December 31, 2016, we acquired one business for total consideration of $14.5 million. We used cash on hand and borrowings under our credit facility to finance these acquisitions. We continue to actively review acquisition opportunities on an ongoing basis, and we may fund future acquisitions with cash and/or equity. Our ability to make significant additional acquisitions for cash may require us to obtain additional equity or debt financing, which we may not be able to obtain on terms acceptable to us or at all.
In October 2014, our Board of Directors approved a share repurchase program for the repurchase of outstanding shares of our common stock with an aggregate purchase price of up to $150 million. We have purchased approximately 4.5 million shares of stock under this program for aggregate consideration of approximately $100.2 million. Remaining authorization under this program is $49.8 million. However, our credit facility prohibits us from repurchasing shares.
Our cash flows for the years ended December 31, 2016, 2015 and 2014 are presented below (in millions):
Year ended December 31, | |||||||||||
2016 | 2015 | 2014 | |||||||||
Net cash provided by operating activities | $ | 64.7 | $ | 155.9 | $ | 270.0 | |||||
Net cash used in investing activities | (11.1 | ) | (91.3 | ) | (70.7 | ) | |||||
Net cash provided by (used in) financing activities | 86.2 | (26.9 | ) | (162.0 | ) | ||||||
Net increase in cash and cash equivalents | 125.2 | 32.7 | 37.0 | ||||||||
Free cash flow, before acquisitions | $ | 57.7 | $ | 125.4 | $ | 218.9 | |||||
Free cash flow, a non-GAAP financial measure, is defined as net cash provided by operating activities, less capital expenditures for property and equipment net of proceeds from sale of property and equipment and other, plus the payment of contingent consideration included in operating activities. Management believes free cash flow is an important measure because it encompasses both profitability and capital management in evaluating results. Free cash flow should not be considered an alternative to net cash provided by operating activities as a cash flow measurement. A reconciliation of cash flow from operating activities to free cash flow, before acquisitions, is as follows (in millions):
Year ended December 31, | |||||||||||
2016 | 2015 | 2014 | |||||||||
Cash flow from operating activities | $ | 64.7 | $ | 155.9 | $ | 270.0 | |||||
Capital expenditures for property and equipment | (16.8 | ) | (32.3 | ) | (53.8 | ) | |||||
Proceeds from sale of property and equipment | 9.8 | 1.8 | 2.7 | ||||||||
Free cash flow, before acquisitions | $ | 57.7 | $ | 125.4 | $ | 218.9 | |||||
45
Cash flows provided by operating activities
Net cash provided by operating activities was $64.7 million and $155.9 million for the years ended December 31, 2016 and 2015, respectively. Cash provided by operations decreased primarily as a result of the change in earnings, slightly offset by the positive cash flow resulting from changes in working capital, such as inventory, compared to the year ended December 31, 2015.
Net cash provided by operating activities was $155.9 million and $270.0 million for the years ended December 31, 2015 and 2014, respectively. Cash provided by operations decreased primarily as a result of lower earnings, offset by the positive cash flow resulting from changes in working capital, such as accounts receivable, compared to the year ended December 31, 2014.
Our operating cash flows are sensitive to a number of variables, the most significant of which is the level of drilling and production activity for oil and natural gas reserves. These activity levels are in turn impacted by the volatility of oil and natural gas prices, regional and worldwide economic activity and its effect on demand for hydrocarbons, weather, infrastructure capacity to reach markets and other variable factors. These factors are beyond our control and are difficult to predict.
Cash flows used in investing activities
Net cash used in investing activities was $11.1 million and $91.3 million for the years ended December 31, 2016 and 2015, respectively, a $80.2 million decrease. The decrease was primarily due to consideration of $4.1 million paid primarily for an acquisition during the year ended December 31, 2016 compared to consideration of $60.8 million paid for an acquisition during the year ended December 31, 2015. A lower investment in property and equipment of $16.8 million was made during the year ended December 31, 2016 compared to an investment of $32.3 million during the year ended December 31, 2015. The proceeds from the sale of business and properties was $9.8 million during the year ended December 31, 2016, compared to $1.8 million during the year ended December 31, 2015.
Net cash used in investing activities was $91.3 million and $70.7 million for the years ended December 31, 2015 and 2014, respectively, a $20.6 million increase. The increase was primarily due to consideration of $60.8 million paid for an acquisition during the year ended December 31, 2015 compared to consideration of $38.3 million paid for an acquisition during the year ended December 31, 2014. A lower investment in property and equipment of $32.3 million was made during the year ended December 31, 2015 compared to an investment of $53.8 million during the year ended December 31, 2014. The proceeds from the sale of business and properties was $1.8 million during the year ended December 31, 2015, compared to $12.2 million during the year ended December 31, 2014. In addition, there was no return of investment in our unconsolidated subsidiary during the year ended December 31, 2015, compared to $9.2 million during the year ended December 31, 2014.
Other than capital required for acquisitions, we expect to fund all maintenance and other growth capital expenditures from our current cash on hand, and from internally generated funds.
Cash flows provided by (used in) financing activities
Net cash provided by financing activities was $86.2 million for the year ended December 31, 2016 and was primarily due to the equity offering proceeds of $85.5 million for the years ended December 31, 2016.
Net cash used in financing activities was $26.9 million for the year ended December 31, 2015 and was primarily due to the net pay down of debt of $25.8 million.
Net cash used in financing activities was $162.0 million for the year ended December 31, 2014 and was primarily due to the repurchase of our stock for $96.6 million and the net pay down of long-term debt of $84.2 million .
Senior Notes Due 2021
In October 2013, we issued $300.0 million of 6.25% senior unsecured notes due 2021 at par, and in November 2013 we issued an additional $100.0 million aggregate principal amount of the notes at 103.25% of par, plus accrued interest from October 2, 2013 (the "Senior Notes"). The Senior Notes bear interest at a rate of 6.25% per annum, payable on April 1 and October 1 of each year, and mature on October 1, 2021. Net proceeds from the issuances of approximately $394.0 million, after deducting initial purchasers' discounts and offering expenses and excluding accrued interest paid by the purchasers, were used for the repayment of the then-outstanding term loan balance and a portion of the revolving credit facility balance.
The terms of the Senior Notes are governed by the indenture, dated October 2, 2013 (the “Indenture”), by and among us, the guarantors named therein and Wells Fargo Bank, National Association, as trustee (the “Trustee”). The Senior Notes are senior unsecured obligations, are guaranteed on a senior unsecured basis by our subsidiaries that guarantee
46
our credit facility and rank junior to, among other indebtedness, the credit facility to the extent of the value of the collateral securing the credit facility. The Senior Notes contain customary covenants including some limitations and restrictions on our ability to pay dividends on, purchase or redeem our common stock or purchase or redeem our subordinated debt; make certain investments; incur or guarantee additional indebtedness or issue certain types of equity securities; create certain liens, sell assets, including equity interests in our restricted subsidiaries; redeem or prepay subordinated debt; restrict dividends or other payments of our restricted subsidiaries; consolidate, merge or transfer all or substantially all of our assets; engage in transactions with affiliates; and create unrestricted subsidiaries. Many of these restrictions will terminate if the Senior Notes become rated investment grade. The Indenture also contains customary events of default, including nonpayment, breach of covenants in the Indenture, payment defaults or acceleration of other indebtedness, failure to pay certain judgments and certain events of bankruptcy and insolvency. We are required to offer to repurchase the Senior Notes in connection with specified change in control events or with excess proceeds of asset sales not applied for permitted purposes.
We may redeem the Senior Notes due 2021:
• | beginning on October 1, 2016 at a redemption price of 104.688% of their principal amount plus accrued and unpaid interest and additional interest, if any; then |
• | at a redemption price of 103.125% of their principal amount plus accrued and unpaid interest and additional interest, if any, for the twelve-month period beginning October 1, 2017; then |
• | at a redemption price of 101.563% of their principal amount plus accrued and unpaid interest and additional interest, if any, for the twelve-month period beginning October 1, 2018; and then |
• | at a redemption price of 100.000% of their principal amount plus accrued interest and unpaid interest and additional interest, if any, beginning on October 1, 2019. |
Credit Facility
On February 25, 2016, we amended our credit facility with Wells Fargo Bank, National Association, as administrative agent, and several financial institutions as lenders (the “Credit Facility”) to reduce lender commitments to $200.0 million. On December 12, 2016, we further amended the Credit Facility (such further amendment, the “Amended Credit Facility”), to, among other things, reduce revolving credit line commitments from $200.0 million to $140.0 million, including the previously existing sublimits for up to $25.0 million available for letters of credit and up to $10.0 million in swingline loans. As of December 31, 2016, we had no borrowings outstanding under our Amended Credit Facility, $17.0 million of outstanding letters of credit, and the capacity to borrow an additional $103.7 million under the Amended Credit Facility. Our Amended Credit Facility matures in November 2018 and, subject to certain limitations, lender commitments may be increased by an additional $150.0 million. Our borrowing capacity under the Amended Credit Facility could be reduced or eliminated, depending on our future EBITDA. Weighted average interest rates under the Amended Credit Facility for the twelve months ended December 31, 2016 and 2015 were approximately 3.00% and 2.00%, respectively. Availability is subject to a borrowing base calculated by reference to eligible accounts receivable in the United States, United Kingdom and Canada, eligible inventory in the United States, and cash on hand.
The Amended Credit Facility contains various covenants that, among other things, limit our ability to incur additional indebtedness, grant certain liens, make certain loans and investments, make distributions, enter into mergers or acquisitions unless certain conditions are satisfied, enter into hedging transactions, change our lines of business, prepay certain indebtedness, enter into certain affiliate transactions or engage in certain asset dispositions. The Amended Credit Facility also limits our ability to incur additional indebtedness with certain exceptions, including the ability to incur up to $150.0 million of additional unsecured debt, $10.0 million of capital leases, $30.0 million of foreign overdraft lines, $10.0 million of letters of credit outside the facility, and $50.0 million of other debt.
The Amended Credit Facility’s financial covenants, among other things, require us, on a consolidated basis, to maintain specified financial ratios or conditions. We were in compliance with all financial covenants under the Amended Credit Facility at December 31, 2016. We anticipate that we will continue to be in compliance with the Amended Credit Facility for the next twelve months. The Amended Credit Facility’s financial covenants are summarized as follows:
• | Senior secured debt to adjusted EBITDA of not more than 4.50 to 1.0 for each fiscal quarter through December 31, 2017 and not more than 3.50 to 1.0 for each fiscal quarter ending thereafter through the termination of the Amended Credit Facility. For purposes of calculation of senior secured debt to adjusted EBITDA, the Amended Credit Facility provides for netting of certain cash and cash equivalents against senior secured debt for each fiscal quarter through December 31, 2017; and |
47
• | A fixed charge coverage ratio of not less than 1.25 to 1.0. This ratio is measured as EBITDA minus maintenance capital expenditures minus taxes paid in cash divided by scheduled principal and interest payments. The fixed charge coverage ratio is tested only if availability under the Amended Credit Facility falls below certain levels. |
Under the Amended Credit Facility, EBITDA is defined to generally exclude the effect of non-cash items, and to give pro forma effect to acquisitions and non-ordinary course asset sales (with adjustments to EBITDA of the acquired businesses or related to the sold assets to be made in accordance with the guidelines for pro forma presentations set forth by the SEC or in a manner otherwise reasonably acceptable to the Administrative Agent under the Amended Credit Facility). The EBITDA of Global Tubing is excluded until such time as it is distributed as cash to the Company.
We have the ability to elect the interest rate applicable to borrowings under the Amended Credit Facility. Interest under the Amended Credit Facility may be determined by reference to (1) the London interbank offered rate, or LIBOR, plus an applicable margin which ranges from 3.0% to 4.0% per annum or (2) the Adjusted Base Rate plus an applicable margin which ranges from 0.00% to 1.50% per annum, in each case with the applicable margin depending upon availability under the Amended Credit Facility. The Adjusted Base Rate is equal to the highest of (1) the Federal Funds Rate, as published by the Federal Reserve Bank of New York, plus one half of 1.0%, (2) the prime rate of Wells Fargo Bank, National Association, as established from time to time at its principal U.S. office and (3) daily LIBOR for an interest period of one-month plus 1.0%.
Interest is payable quarterly for base rate loans and at the end of each interest period for LIBOR loans, except that if the interest period for a LIBOR loan is longer than three months, interest is paid at the end of each three-month period.
All of the obligations under the Amended Credit Facility are secured by first priority liens (subject to permitted liens) on substantially all of the assets of the Company and its wholly-owned domestic restricted subsidiaries, with exceptions for real property and certain other assets. Additionally, all of the obligations under the Amended Credit Facility are guaranteed by the wholly-owned domestic restricted subsidiaries of the Company.
If an event of default exists under the Amended Credit Facility, lenders holding greater than 50% of the aggregate outstanding loans and letter of credit obligations and unfunded commitments have the right to accelerate the maturity of the obligations outstanding under the Amended Credit Facility and exercise other rights and remedies. Obligations outstanding under the Amended Credit Facility, however, will be automatically accelerated upon an event of default arising from a bankruptcy or insolvency event. Each of the following constitutes an event of default under the Amended Credit Facility:
• | Failure to pay any principal when due or any interest, fees or other amount within certain grace periods; |
• | Representations and warranties in the Amended Credit Facility or other loan documents being incorrect or misleading in any material respect; |
• | Failure to perform or otherwise comply with the covenants in the Amended Credit Facility or other loan documents, subject, in certain instances, to grace periods; |
• | Impairment of security under the loan documents affecting collateral having a fair market value in excess of $25 million; |
• | The actual or asserted invalidity of any material provisions of the guarantees of the indebtedness under the Amended Credit Facility; |
• | Default by us or our restricted subsidiaries in the payment of any other indebtedness with a principal amount in excess of $25 million, any default in the performance of any obligation or condition with respect to such indebtedness beyond the applicable grace period if the effect of the default is to permit or cause the acceleration of the indebtedness, or such indebtedness will be declared due and payable prior to its scheduled maturity; |
• | Bankruptcy or insolvency events involving us or our restricted subsidiaries; |
• | The entry, and failure to pay, of one or more adverse judgments in excess of $25 million, upon which enforcement proceedings are commenced or that are not stayed pending appeal; and |
• | The occurrence of a change in control (as defined in the Amended Credit Facility). |
The Amended Credit Facility also provides for a commitment fee in the amount of 0.375% per annum on the unused portion of commitments.
Off-balance sheet arrangements
As of December 31, 2016, we had no off-balance sheet instruments or financial arrangements, other than operating leases and letters of credit entered into in the ordinary course of business.
48
Contractual obligations
Our debt, lease and financial obligations as of December 31, 2016 will mature and become due and payable according to the following table (in thousands):
2017 | 2018 | 2019 | 2020 | 2021 | After 2021 | Total | ||||||||||||||||||||||
Senior notes due October 2021 (1) | $ | 25,000 | $ | 25,000 | $ | 25,000 | $ | 25,000 | $ | 418,750 | $ | — | $ | 518,750 | ||||||||||||||
Senior secured credit facility | — | — | — | — | — | — | — | |||||||||||||||||||||
Other debt | 124 | 82 | — | — | — | — | 206 | |||||||||||||||||||||
Operating leases | 15,455 | 12,526 | 10,939 | 8,988 | 7,858 | 10,253 | 66,019 | |||||||||||||||||||||
Letters of credit | 13,585 | 3,282 | 136 | — | — | — | 17,003 | |||||||||||||||||||||
Pension | 343 | 313 | 311 | 323 | 317 | 6,530 | 8,137 | |||||||||||||||||||||
Total | $ | 54,507 | $ | 41,203 | $ | 36,386 | $ | 34,311 | $ | 426,925 | $ | 16,783 | $ | 610,115 | ||||||||||||||
(1) Includes 5 years of interest on $400 million of senior notes at 6.25% that become due in 2021. | ||||||||||||||||||||||||||||
As discussed in Note 9 of the Consolidated Financial Statements, as of December 31, 2016 the Company has approximately $14.2 million of liabilities associated with uncertain tax positions in the various jurisdictions in which the Company conducts business. Due to the uncertain and complex application of the tax regulations, combined with the difficulty in predicting when tax audits throughout the world may be concluded, the Company cannot make precise estimates of the timing of cash outflows relating to these liabilities. Accordingly, liabilities associated with uncertain tax positions have been excluded from the contractual obligations table above.
Inflation
Global inflation has been relatively low in recent years and did not have a material impact on our results of operations during 2016, 2015 or 2014. Although the impact of inflation has been insignificant in recent years, it is still a factor in the global economy and we tend to experience inflationary pressure on the cost of raw materials and components used in our products.
Critical accounting policies and estimates
The discussion and analysis of our financial condition and results of operations are based upon our consolidated financial statements, which have been prepared in accordance with GAAP. The preparation of our financial statements requires us to make estimates and assumptions that affect the reported amounts of assets, liabilities, revenues and expenses and related disclosure of contingent assets and liabilities. Certain accounting policies involve judgments and uncertainties to such an extent that there is a reasonable likelihood that materially different amounts could have been reported under different conditions, or if different assumptions had been used. We evaluate our estimates and assumptions on a regular basis. We base our estimates on historical experience and various other assumptions that are believed to be reasonable under the circumstances, the results of which form the basis for making judgments about the carrying values of assets and liabilities that are not readily apparent from other sources. Actual results may differ from these estimates and assumptions used in preparation of our consolidated financial statements. We provide expanded discussion of our most critical accounting policies, estimates and judgments below. We believe that these accounting policies reflect our more significant estimates and assumptions used in preparation of our consolidated financial statements.
Revenue recognition
The substantial majority of our revenue is recognized when the associated goods are shipped and title passes to the customer or when services have been rendered, as long as all of the criteria for recognition described in Note 2 of the Notes to the Consolidated Financial Statements in Part II, Item 8 "Financial Statements and Supplementary Data" of this Annual Report on Form 10-K have been met. The only revenue recognition criteria requiring judgment on these sales is assurance of collectability. We carefully evaluate creditworthiness of our customers before extending payment terms other than cash upfront, and historically we have not incurred significant losses for bad debt.
Revenue generated from long-term contracts, typically longer than six months in duration, is recognized on the percentage-of-completion method of accounting. Approximately 9% of our 2016 revenue was accounted for on this basis. There are significant estimates and judgments involved in recognizing revenue over the term of the contract. For that portion of our business accounted for on the percentage-of-completion method, we generally recognize revenue and cost of goods sold each period based upon the advancement of the work-in-progress. The percentage complete
49
is determined based on the ratio of costs incurred to date to total estimated costs for the project. The percentage-of-completion method requires management to calculate reasonably dependable estimates of progress towards completion and total contract costs. Each period these long-term contracts are reevaluated and may result in upward or downward revisions in estimated total costs, which are accounted for in the period of the change to reflect a catch up adjustment for the cumulative impact from inception of the contract to date in the period of the revision. Whenever revisions of estimated contract costs and contract value indicates that the contract costs will exceed estimated revenue, thus creating a loss, a provision for the total estimated loss is recorded in that period.
Revenue from the rental of equipment or providing of services is recognized over the period when the asset is rented or services are rendered and collectability is reasonably assured. Rates for asset rental and service provision are priced on a per day, per man hour, or similar basis. There are typically delays in receiving some field tickets reporting utilization of equipment or personnel requiring us to make estimates for revenue recognition in the period. In the following period, these estimates are adjusted to actual field tickets received late.
Share-based compensation
We account for awards of share-based compensation at fair value on the date granted to employees and recognize the compensation expense in the financial statements over the requisite service period. Fair value of the share-based compensation was measured using the fair value of the common stock for restricted stock and restricted stock units, the Black-Scholes model for most of the outstanding options, and a lattice model for performance share units. These models require assumptions and estimates for inputs, especially the estimate of the volatility in the value of the underlying share price, that affect the resultant values and hence the amount of compensation expense recognized.
Inventories
Inventory, consisting of finished goods and materials and supplies held for resale, is carried at the lower of cost or market. We evaluate our inventories, based on an analysis of stocking levels, historical sales experience and future sales forecasts, to determine obsolete, slow-moving and excess inventory. While we have policies for calculating and recording reserves against inventory carrying values, we exercise judgment in establishing and applying these policies.
Business combinations, goodwill and other intangible assets
Goodwill acquired in connection with business combinations represents the excess of consideration over the fair value of net assets acquired. Certain assumptions and estimates are employed in evaluating the fair value of assets acquired and liabilities assumed. These estimates may be affected by factors such as changing market conditions, technological advances in the oil and natural gas industry or changes in regulations governing that industry. The most significant assumptions requiring judgment involve identifying and estimating the fair value of intangible assets and the associated useful lives for establishing amortization periods. To finalize purchase accounting for significant acquisitions, we utilize the services of independent valuation specialists to assist in the determination of the fair value of acquired intangible assets.
For goodwill and intangible assets with indefinite lives, an assessment for impairment is performed annually or when there is an indication an impairment may have occurred. We typically complete our annual impairment test for goodwill and other indefinite-lived intangibles using an assessment date of October 1. Goodwill is reviewed for impairment by comparing the carrying value of each of our six reporting unit’s net assets, including allocated goodwill, to the estimated fair value of the reporting unit. We determine the fair value of our reporting units using a discounted cash flow approach. We selected this valuation approach because we believe it, combined with our best judgment regarding underlying assumptions and estimates, provides the best estimate of fair value for each of our reporting units. Determining the fair value of a reporting unit requires the use of estimates and assumptions. Such estimates and assumptions include revenue growth rates, future operating margins, the weighted average cost of capital, a terminal growth value, and future market conditions, among others. We believe that the estimates and assumptions used in our impairment assessments are reasonable. If the reporting unit’s carrying value is greater than its calculated fair value, a second step is performed whereby the implied fair value of goodwill is estimated by allocating the fair value of the reporting unit in a hypothetical purchase price allocation analysis. We recognize a goodwill impairment charge for the amount by which the carrying value of goodwill exceeds its reassessed fair value.
At October 1, 2016, we performed our annual impairment test on each of our reporting units and concluded that there had been no impairment because the estimated fair value of each of those reporting units exceeded its carrying value. As such, no impairment losses were recorded on goodwill for the year ended December 31, 2016. If the market conditions do not improve further, however, we may have additional impairment charges in our Subsea reporting units in the future.
For the year ended December 31, 2015, we recorded $123.2 million of impairment losses for our Subsea reporting unit for the year ended December 31, 2015.
50
No impairment losses were recorded on goodwill for the year ended December 31, 2014.
Intangible assets with definite lives are tested for impairment whenever events or changes in circumstances indicate that their carrying amount may not be recoverable. In the fourth quarter of 2015, an impairment loss of $1.9 million related to certain trade names that were no longer in use was recorded. No impairments to intangible assets were recorded in 2016 and 2014.
Income taxes
We follow the liability method of accounting for income taxes. Under this method, deferred income tax assets and liabilities are determined based upon temporary differences between the carrying amounts and tax bases of our assets and liabilities at the balance sheet date, and are measured using enacted tax rates and laws that will be in effect when the differences are expected to reverse. We record a valuation allowance whenever management believes that it is more likely than not that any deferred tax asset will not be realized. We must apply judgment in assessing the realizability of deferred tax assets, including estimating our future taxable income, to predict whether a future cash tax reduction will be realized from the deferred tax asset. Any changes in the valuation allowance due to changes in circumstances and estimates are recognized in income tax expense in the period the change occurs.
The accounting guidance for income taxes requires that we recognize the financial statement benefit of a tax position only after determining that the relevant tax authority would more likely than not sustain the position following an audit. If a tax position meets the "more likely than not" recognition criteria, the accounting guidance requires the tax position be measured at the largest amount of benefit greater than 50% likely of being realized upon ultimate settlement. If management determines that likelihood of sustaining the realization of the tax benefit is less than or equal to 50%, then the tax benefit is not recognized in the financial statements.
We have operations in countries other than the United States. Consequently, we are subject to the jurisdiction of a number of taxing authorities. The final determination of tax liabilities involves the interpretation of local tax laws, tax treaties, and related authorities in each jurisdiction. Changes in the operating environment, including changes in tax law or interpretation of tax law and currency repatriation controls, could impact the determination of our tax liabilities for a given tax year.
Property and equipment
Property and equipment is stated at cost less accumulated depreciation. Depreciation is computed using the straight-line method based on the estimated useful lives of assets, generally 3 to 30 years. We have established standard lives for certain classes of assets.
We review long-lived assets for potential impairment whenever events or changes in circumstances indicate that the carrying amount of a long-lived asset may not be recoverable. In performing the review for impairment, future cash flows expected to result from the use of the asset and its eventual disposal are estimated. If the undiscounted future cash flows are less than the carrying amount of the assets, there is an indication that the asset may be impaired. The amount of the impairment is measured as the difference between the carrying value and the estimated fair value of the asset. The fair value is determined either through the use of an external valuation, or by means of an analysis of discounted future cash flows based on expected utilization. The impairment loss recognized represents the excess of the assets carrying value as compared to its estimated fair value.
Recognition of provisions for contingencies
In the ordinary course of business, we are subject to various claims, suits and complaints. We, in consultation with internal and external advisors, will provide for a contingent loss in the consolidated financial statements if it is probable that a liability has been incurred at the date of the consolidated financial statements and the amount can be reasonably estimated. If it is determined that the reasonable estimate of the loss is a range and that there is no best estimate within the range, provision will be made for the lower amount of the range. Legal costs are expensed as incurred.
An assessment is made of the areas where potential claims may arise under the contract warranty clauses. Where a specific risk is identified and the potential for a claim is assessed as probable and can be reasonably estimated, an appropriate warranty provision is recorded. Warranty provisions are eliminated at the end of the warranty period except where warranty claims are still outstanding. The liability for product warranty is included in other accrued liabilities on the consolidated balance sheets.
Recent accounting pronouncements
In November 2016, the Financial Accounting Standards Board (“FASB”) issued Accounting Standards Update (“ASU”) No. 2016-18 Statement of Cash Flows (Topic 230) - Restricted Cash a consensus of the FASB Emerging Issues Task Force. This new guidance requires that a statement of cash flows explain the change during the period in the total of
51
cash, cash equivalents, and amounts generally described as restricted cash or restricted cash equivalents. Therefore, amounts generally described as restricted cash and restricted cash equivalents should be included with cash and cash equivalents when reconciling the beginning-of-period and end-of-period total amounts shown on the statement of cash flows. ASU 2016-18 is effective for fiscal years beginning after December 15, 2018, and interim periods within fiscal years beginning after December 15, 2019 and is not expected to have a material impact on our consolidated financial statements.
In October 2016, the FASB issued ASU No. 2016-16 Income Tax (Topic 740) - Intra-Entity Transfers of Assets Other Than Inventory. Current GAAP prohibits the recognition of current and deferred income taxes for an intra-entity asset transfer until the asset has been sold to an outside party. This new guidance eliminates this exception and requires an entity to recognize the income tax consequences of an intra-entity transfer of an asset other than inventory when the transfer occurs. ASU 2016-16 is effective for annual reporting periods beginning after December 15, 2017, including interim reporting periods within those annual reporting periods, and should be applied on a modified retrospective basis through a cumulative-effect adjustment directly to retained earnings as of the beginning of the period of adoption. The ASU is not expected to have a material impact on our consolidated financial statements.
In August 2016, the FASB issued ASU No. 2016-15 Cash Flow Statement (Topic 230) - Classification of Certain Cash Receipts and Cash Payments. This new guidance addresses eight specific cash flow issues with the objective of reducing the existing diversity in practice, including: debt prepayment or debt extinguishment costs, settlement of zero-coupon debt instruments or other debt instruments, contingent consideration payments made after a business combination, proceeds from the settlement of insurance claims, proceeds from the settlement of corporate-owned life insurance policies, distributions received from equity method investees, beneficial interests in securitization transactions, and separately identifiable cash flows and application of the predominance principle. The only issue currently relevant to us is distributions received from equity method investees, where the new guidance allows an accounting policy election between the cumulative earnings approach and the nature of the distribution approach. We will continue to use the cumulative earnings approach, therefore the guidance is not expected to have a material impact on our consolidated financial statements. ASU 2016-15 is effective for public business entities for fiscal years beginning after December 15, 2017, and interim periods within those fiscal years.
In May 2016, the FASB issued ASU No. 2016-11 Revenue Recognition (Topic 605) and Derivatives and Hedging (Topic 815) - Rescission of SEC Guidance Because of Accounting Standards Updates No. 2014-09 and No. 2014-16 Pursuant to Staff Announcements at the March 3, 2016 EITF Meeting. This new guidance rescinded certain SEC staff observer comments in Topic 605 related to revenue and expense recognition for freight services in process and accounting for shipping and handling fees and costs, in Topic 932 related to gas-balancing arrangements, and in Topic 815 related to the nature of a host contract related to a hybrid instrument issued in the form of a share. ASU 2016-11 is effective upon adoption of Topic 606 and is not expected to have a material impact on our consolidated financial statements.
In March 2016, the FASB issued ASU No. 2016-09, Improvements to Employee Share-Based Payment Accounting. This new guidance includes provisions intended to simplify how share-based payments are accounted for and presented in the financial statements, including: a) all excess tax benefits and tax deficiencies should be recognized as income tax expense or benefit in the income statement; b) excess tax benefits should be classified along with other income tax cash flows as an operating activity; c) an entity can make an entity-wide accounting policy election to either estimate the number of awards that are expected to vest or account for forfeitures when they occur; d) the threshold to qualify for equity classification permits withholding up to the maximum statutory tax rates in the applicable jurisdictions; e) cash paid by an employer should be classified as a financing activity when shares are directly withheld for tax withholding purposes. There are also two additional provisions for non-public entities that do not apply to us. The element of the new standard that will have the most impact on our financial statements will be income tax consequences. Excess tax benefits and tax deficiencies on stock-based compensation awards will now be included in our tax provision within our consolidated statement of comprehensive income, rather than our current accounting of recording in additional paid-in capital on our consolidated balance sheet. The standard will take effect for public companies for annual periods beginning after December 15, 2016, and interim periods within those annual periods.
In February 2016, the FASB issued ASU No. 2016-02, Leases. Under this new guidance, lessees will be required to recognize assets and liabilities on the balance sheet for the rights and obligations created by all leases with terms of more than twelve months. The standard will take effect for public companies for fiscal years, and interim periods within those fiscal years, beginning after December 15, 2018. We are currently evaluating the impact of the adoption of this guidance.
In August 2014, the FASB issued ASU No. 2014-15, Presentation of Financial Statements - Going Concern. The new standard requires management to evaluate whether there are conditions or events that raise substantial doubt as to an entity's ability to continue as a going concern for both annual and interim reporting periods. The guidance was
52
effective for us for the annual period ending after December 15, 2016 and interim periods thereafter. The guidance did not have a material impact on our consolidated financial statements.
In May 2014, the FASB issued ASU No. 2014-09, Revenue from Contracts with Customers (Topic 606). The comprehensive new standard will supersede existing revenue recognition guidance and require revenue to be recognized when promised goods or services are transferred to customers in amounts that reflect the consideration to which the company expects to be entitled in exchange for those goods or services. Adoption of the new rules could affect the timing of revenue recognition for certain transactions. The guidance permits two implementation approaches, one requiring retrospective application of the new standard with restatement of prior years and one requiring prospective application of the new standard with disclosure of results under old standards. The FASB issued several subsequent standards in 2016 containing implementation guidance related to the new standard. These standards provide additional guidance related to principal versus agent considerations, licensing, and identifying performance obligations. Additionally, these standards provide narrow-scope improvements and practical expedients as well as technical corrections and improvements. Overall, the new guidance is to be effective for the fiscal year beginning after December 15, 2017. Companies are able to early adopt the pronouncement, however not before fiscal years beginning after December 15, 2016. We currently anticipate that we will adopt this standard using the modified retrospective method. We have put in place an implementation team to provide training and to review contracts to assess the impact, if any, the new revenue standard will have on our consolidated financial statements. Our approach includes performing a detailed review of key contracts representative of our different businesses and comparing historical accounting policies and practices to the new standard. We will also continue to monitor for any additional implementation or other guidance that may be issued in 2017 with respect to the new revenue standard and adjust its assessment and implementation plans accordingly.
Cautionary note regarding forward-looking statements
This Annual Report on Form 10-K contains forward-looking statements within the meaning of Section 27A of the Securities Act and Section 21E of the Exchange Act. These forward-looking statements are subject to a number of risks and uncertainties, many of which are beyond the Company's control. All statements, other than statements of historical fact, included in this Annual Report on Form 10-K regarding our strategy, future operations, financial position, estimated revenues and losses, projected costs, prospects, plans and objectives of management are forward-looking statements. When used in this Annual Report on Form 10-K, the words "will," "could," "believe," "anticipate," "intend," "estimate," "expect," "may," "continue," "predict," "potential," "project" and similar expressions are intended to identify forward-looking statements, although not all forward-looking statements contain such identifying words.
Forward-looking statements may include statements about:
•business strategy;
•cash flows and liquidity;
•the volatility and impact of recent significant declines in oil and natural gas prices;
•the availability of raw materials and specialized equipment;
•our ability to accurately predict customer demand;
•customer order cancellations or deferrals;
•competition in the oil and gas industry;
•governmental regulation and taxation of the oil and natural gas industry;
•environmental liabilities;
•political, social and economic issues affecting the countries in which we do business;
•our ability to deliver our backlog in a timely fashion;
•our ability to implement new technologies and services;
•availability and terms of capital;
•general economic conditions;
•our ability to successfully manage our growth, including risks and uncertainties associated with integrating and retaining key employees of the businesses we acquire;
53
•benefits of our acquisitions;
•availability of key management personnel;
•availability of skilled and qualified labor;
•operating hazards inherent in our industry;
•the continued influence of our largest shareholder;
•the ability to establish and maintain effective internal control over financial reporting;
•financial strategy, budget, projections and operating results;
•uncertainty regarding our future operating results; and
•plans, objectives, expectations and intentions contained in this report that are not historical.
All forward-looking statements speak only as of the date of this Annual Report on Form 10-K. We disclaim any obligation to update or revise these statements unless required by law, and you should not place undue reliance on these forward-looking statements. Although we believe that our plans, intentions and expectations reflected in or suggested by the forward-looking statements we make in this Annual Report on Form 10-K are reasonable, we can give no assurance that these plans, intentions or expectations will be achieved. We disclose important factors that could cause our actual results to differ materially from our expectations in "Risk Factors" and "Management's Discussion and Analysis of Financial Condition and Results of Operations" and elsewhere in this Annual Report on Form 10-K. These cautionary statements qualify all forward-looking statements attributable to us or persons acting on our behalf.
54
Item 7A. Quantitative and qualitative disclosures about market risk
We are currently exposed to market risk from changes in foreign currency and changes in interest rates. From time to time, we may enter into derivative financial instrument transactions to manage or reduce our market risk, but we do not enter into derivative transactions for speculative purposes. A discussion of our market risk exposure in financial instruments follows.
Non-U.S. currency exchange rates
In certain regions, we conduct our business in currencies other than the U.S. dollar and the functional currency is the applicable local currency. We operate primarily in the U.S., Canadian and UK markets, and as a result our primary exposure to fluctuations in currency exchange rates relates to fluctuations between the U.S. dollar and the Canadian dollar, the British pound sterling, the Euro, and, to a lesser degree, the Mexican Peso and the Singapore dollar. In countries in which we operate in the local currency, the effects of currency fluctuations are largely mitigated because local expenses of such operations are also generally denominated in the local currency. There may be instances, however, in which costs and revenue will not be matched with respect to currency denomination and we may experience economic loss and a negative impact on earnings or net assets solely as a result of foreign currency exchange rate fluctuations. To the extent that we continue our expansion on a global basis, management expects that increasing portions of revenue, costs, assets and liabilities will be subject to fluctuations in foreign currency valuations.
Assets and liabilities for which the functional currency is the local currency are translated using the exchange rates in effect at the balance sheet date, resulting in translation adjustments that are reflected as accumulated other comprehensive income in the stockholders’ equity section on our consolidated balance sheet. We recorded $45.9 million in net foreign currency translation loss, net of tax that is included in other comprehensive income for the year ended December 31, 2016 to reflect the net impact of the general weakening of other applicable currencies against the U.S. dollar. This translation loss was caused primarily by the relative weakening of the Euro and the British pound sterling, as the Euro and the British pound sterling depreciated 3% and 16%, respectively, relative to the U.S. dollar from December 31, 2015 to December 31, 2016.
Interest rates
At December 31, 2016, our long-term debt consisted of $402.0 million in 6.25% Senior Notes and no long-term borrowings under our Amended Credit Facility. At December 31, 2016, the fair value of the Senior Notes approximated $402.0 million. We are subject to interest rate risk on our floating interest rate borrowings. Floating rate debt, where the interest rate fluctuates periodically, exposes us to short-term changes in market interest rates. All of the long-term debt outstanding under our Amended Credit Facility is structured on floating interest rate terms.
55
Item 8. Financial Statements and Supplementary Data
Page | |
56
Report of Independent Registered Public Accounting Firm
To the Board of Directors and Stockholders of Forum Energy Technologies, Inc.:
In our opinion, the accompanying consolidated balance sheets and the related consolidated statements of comprehensive income (loss), of changes in stockholders’ equity and of cash flows present fairly, in all material respects, the financial position of Forum Energy Technologies, Inc. and its subsidiaries at December 31, 2016 and December 31, 2015, and the results of their operations and their cash flows for each of the three years in the period ended December 31, 2016 in conformity with accounting principles generally accepted in the United States of America. Also in our opinion, the Company maintained, in all material respects, effective internal control over financial reporting as of December 31, 2016, based on criteria established in Internal Control - Integrated Framework 2013 issued by the Committee of Sponsoring Organizations of the Treadway Commission (COSO). The Company's management is responsible for these financial statements, for maintaining effective internal control over financial reporting and for its assessment of the effectiveness of internal control over financial reporting, included in Management's Report on Internal Control over Financial Reporting appearing under Item 9A. Our responsibility is to express opinions on these financial statements and on the Company's internal control over financial reporting based on our integrated audits. We conducted our audits in accordance with the standards of the Public Company Accounting Oversight Board (United States). Those standards require that we plan and perform the audits to obtain reasonable assurance about whether the financial statements are free of material misstatement and whether effective internal control over financial reporting was maintained in all material respects. Our audits of the financial statements included examining, on a test basis, evidence supporting the amounts and disclosures in the financial statements, assessing the accounting principles used and significant estimates made by management, and evaluating the overall financial statement presentation. Our audit of internal control over financial reporting included obtaining an understanding of internal control over financial reporting, assessing the risk that a material weakness exists, and testing and evaluating the design and operating effectiveness of internal control based on the assessed risk. Our audits also included performing such other procedures as we considered necessary in the circumstances. We believe that our audits provide a reasonable basis for our opinions.
A company’s internal control over financial reporting is a process designed to provide reasonable assurance regarding the reliability of financial reporting and the preparation of financial statements for external purposes in accordance with generally accepted accounting principles. A company’s internal control over financial reporting includes those policies and procedures that (i) pertain to the maintenance of records that, in reasonable detail, accurately and fairly reflect the transactions and dispositions of the assets of the company; (ii) provide reasonable assurance that transactions are recorded as necessary to permit preparation of financial statements in accordance with generally accepted accounting principles, and that receipts and expenditures of the company are being made only in accordance with authorizations of management and directors of the company; and (iii) provide reasonable assurance regarding prevention or timely detection of unauthorized acquisition, use, or disposition of the company’s assets that could have a material effect on the financial statements.
Because of its inherent limitations, internal control over financial reporting may not prevent or detect misstatements. Also, projections of any evaluation of effectiveness to future periods are subject to the risk that controls may become inadequate because of changes in conditions, or that the degree of compliance with the policies or procedures may deteriorate.
/s/ PricewaterhouseCoopers LLP
Houston, Texas
February 27, 2017
57
Forum Energy Technologies, Inc. and subsidiaries
Consolidated statements of comprehensive income (loss)
Year ended December 31, | |||||||||||
(in thousands, except per share information) | 2016 | 2015 | 2014 | ||||||||
Net sales | $ | 587,635 | $ | 1,073,652 | $ | 1,739,717 | |||||
Cost of sales | 487,900 | 810,975 | 1,180,265 | ||||||||
Gross profit | 99,735 | 262,677 | 559,452 | ||||||||
Operating expenses | |||||||||||
Selling, general and administrative expenses | 227,008 | 264,906 | 312,821 | ||||||||
Goodwill and Intangible asset impairment | — | 125,092 | — | ||||||||
Transaction expenses | 865 | 480 | 2,326 | ||||||||
Loss on sale of assets | 2,638 | 746 | 1,431 | ||||||||
Total operating expenses | 230,511 | 391,224 | 316,578 | ||||||||
Earnings from equity investment | 1,824 | 14,824 | 25,164 | ||||||||
Operating income (loss) | (128,952 | ) | (113,723 | ) | 268,038 | ||||||
Other expense (income) | |||||||||||
Interest expense | 27,410 | 29,945 | 29,847 | ||||||||
Foreign exchange (gains) losses and other, net | (21,341 | ) | (9,345 | ) | (4,331 | ) | |||||
Deferred loan costs written off | 2,978 | — | — | ||||||||
Total other expense | 9,047 | 20,600 | 25,516 | ||||||||
Income (loss) before income taxes | (137,999 | ) | (134,323 | ) | 242,522 | ||||||
Provision for income tax expense (benefit) | (56,051 | ) | (14,939 | ) | 68,145 | ||||||
Net income (loss) | (81,948 | ) | (119,384 | ) | 174,377 | ||||||
Less: Income (loss) attributable to noncontrolling interest | 30 | (31 | ) | 12 | |||||||
Net income (loss) attributable to common stockholders | (81,978 | ) | (119,353 | ) | 174,365 | ||||||
Weighted average shares outstanding | |||||||||||
Basic | 91,226 | 89,908 | 92,628 | ||||||||
Diluted | 91,226 | 89,908 | 95,308 | ||||||||
Earnings (loss) per share | |||||||||||
Basic | $ | (0.90 | ) | $ | (1.33 | ) | $ | 1.88 | |||
Diluted | $ | (0.90 | ) | $ | (1.33 | ) | $ | 1.83 | |||
Other comprehensive income (loss), net of tax: | |||||||||||
Net income (loss) | (81,948 | ) | (119,384 | ) | 174,377 | ||||||
Change in foreign currency translation, net of tax of $0 | (45,722 | ) | (45,270 | ) | (43,694 | ) | |||||
Gain (loss) on pension liability | (335 | ) | 46 | (1,110 | ) | ||||||
Comprehensive income (loss) | (128,005 | ) | (164,608 | ) | 129,573 | ||||||
Less: comprehensive loss (income) attributable to noncontrolling interests | (162 | ) | 168 | 46 | |||||||
Comprehensive income (loss) attributable to common stockholders | $ | (128,167 | ) | $ | (164,440 | ) | $ | 129,619 | |||
The accompanying notes are an integral part of these consolidated financial statements.
58
Forum Energy Technologies, Inc. and subsidiaries
Consolidated balance sheets
(in thousands, except share information) | December 31, 2016 | December 31, 2015 | |||||
Assets | |||||||
Current assets | |||||||
Cash and cash equivalents | $ | 234,422 | $ | 109,249 | |||
Accounts receivable—trade, net | 105,268 | 138,597 | |||||
Inventories, net | 338,583 | 424,121 | |||||
Income tax receivable | 32,801 | — | |||||
Prepaid expenses and other current assets | 29,443 | 33,836 | |||||
Costs and estimated profits in excess of billings | 9,199 | 12,009 | |||||
Total current assets | 749,716 | 717,812 | |||||
Property and equipment, net of accumulated depreciation | 152,212 | 186,667 | |||||
Deferred financing costs, net | 1,112 | 4,125 | |||||
Intangibles, net | 216,418 | 246,650 | |||||
Goodwill | 652,743 | 669,036 | |||||
Investment in unconsolidated subsidiary | 59,140 | 57,719 | |||||
Deferred income taxes, net | 851 | 780 | |||||
Other long-term assets | 3,000 | 3,253 | |||||
Total assets | $ | 1,835,192 | $ | 1,886,042 | |||
Liabilities and equity | |||||||
Current liabilities | |||||||
Current portion of long-term debt | $ | 124 | $ | 253 | |||
Accounts payable—trade | 73,775 | 76,823 | |||||
Accrued liabilities | 55,604 | 58,563 | |||||
Deferred revenue | 8,338 | 7,283 | |||||
Billings in excess of costs and profits recognized | 4,004 | 8,631 | |||||
Total current liabilities | 141,845 | 151,553 | |||||
Long-term debt, net of current portion | 396,747 | 396,016 | |||||
Deferred income taxes, net | 26,185 | 51,100 | |||||
Other long-term liabilities | 34,654 | 29,956 | |||||
Total liabilities | 599,431 | 628,625 | |||||
Commitments and contingencies | |||||||
Equity | |||||||
Common stock, $0.01 par value, 296,000,000 shares authorized, 103,682,128 and 98,605,902 shares issued | 1,037 | 986 | |||||
Additional paid-in capital | 998,169 | 891,248 | |||||
Treasury stock at cost, 8,174,963 and 8,145,802 shares | (133,941 | ) | (133,318 | ) | |||
Retained earnings | 498,174 | 580,152 | |||||
Accumulated other comprehensive loss | (128,237 | ) | (82,048 | ) | |||
Total stockholders’ equity | 1,235,202 | 1,257,020 | |||||
Noncontrolling interest in subsidiary | 559 | 397 | |||||
Total equity | 1,235,761 | 1,257,417 | |||||
Total liabilities and equity | $ | 1,835,192 | $ | 1,886,042 | |||
59
Forum Energy Technologies, Inc. and subsidiaries
Consolidated statements of cash flows
Year ended December 31, | |||||||||||
(in thousands, except share information) | 2016 | 2015 | 2014 | ||||||||
Cash flows from operating activities | |||||||||||
Net income (loss) | $ | (81,948 | ) | $ | (119,384 | ) | $ | 174,377 | |||
Adjustments to reconcile net income (loss) to net cash provided by operating activities | |||||||||||
Depreciation expense | 35,636 | 38,388 | 37,414 | ||||||||
Amortization of intangible assets | 26,124 | 27,295 | 27,658 | ||||||||
Impairment of intangible assets and goodwill | — | 125,092 | — | ||||||||
Inventory reserves | 25,537 | 51,917 | 8,171 | ||||||||
Share-based compensation expense | 20,535 | 21,675 | 18,770 | ||||||||
Earnings from equity investment, net of distributions | (1,421 | ) | (8,044 | ) | 1,376 | ||||||
Deferred income taxes | (24,418 | ) | (23,246 | ) | (3,270 | ) | |||||
Deferred loan costs written off | 2,978 | — | — | ||||||||
Provision for doubtful accounts | 485 | 4,358 | 2,492 | ||||||||
Other | 4,389 | 3,867 | 4,109 | ||||||||
Changes in operating assets and liabilities | |||||||||||
Accounts receivable—trade | 29,450 | 145,753 | (44,727 | ) | |||||||
Inventories | 57,294 | 344 | (34,051 | ) | |||||||
Income tax receivable | (32,801 | ) | — | — | |||||||
Prepaid expenses and other current assets | 1,071 | 3,576 | (4,107 | ) | |||||||
Cost and estimated profit in excess of billings | 1,897 | 2,215 | 8,742 | ||||||||
Accounts payable, deferred revenue and other accrued liabilities | 3,799 | (111,264 | ) | 62,772 | |||||||
Billings in excess of costs and estimated profits earned | (3,865 | ) | (6,629 | ) | 10,240 | ||||||
Net cash provided by operating activities | $ | 64,742 | $ | 155,913 | $ | 269,966 | |||||
Cash flows from investing activities | |||||||||||
Acquisition of businesses, net of cash acquired | (4,072 | ) | (60,836 | ) | (38,289 | ) | |||||
Capital expenditures for property and equipment | (16,828 | ) | (32,291 | ) | (53,792 | ) | |||||
Return of investment in unconsolidated subsidiary | — | — | 9,240 | ||||||||
Proceeds from sale of business, property and equipment | 9,763 | 1,821 | 12,150 | ||||||||
Net cash used in investing activities | $ | (11,137 | ) | $ | (91,306 | ) | $ | (70,691 | ) | ||
Cash flows from financing activities | |||||||||||
Borrowings under credit facility | — | 94,984 | 15,423 | ||||||||
Repayment of long-term debt | — | (120,077 | ) | (98,415 | ) | ||||||
Repurchases of stock | (623 | ) | (6,438 | ) | (96,632 | ) | |||||
Excess tax benefits from stock based compensation | — | (8 | ) | 7,742 | |||||||
Proceeds from stock issuance | 87,676 | 5,275 | 11,101 | ||||||||
Payment of capital lease obligation | (92 | ) | (673 | ) | (1,231 | ) | |||||
Deferred financing costs | (766 | ) | — | (6 | ) | ||||||
Net cash provided by (used in) financing activities | $ | 86,195 | $ | (26,937 | ) | $ | (162,018 | ) | |||
Effect of exchange rate changes on cash | (14,627 | ) | (5,000 | ) | (260 | ) | |||||
Net increase in cash and cash equivalents | 125,173 | 32,670 | 36,997 | ||||||||
Cash and cash equivalents | |||||||||||
Beginning of period | 109,249 | 76,579 | 39,582 | ||||||||
End of period | $ | 234,422 | $ | 109,249 | $ | 76,579 | |||||
Supplemental cash flow disclosures | |||||||||||
Interest paid | 26,331 | 27,870 | 27,628 | ||||||||
Income taxes paid (refunded) | (6,273 | ) | 19,919 | 55,576 | |||||||
Noncash investing and financing activities | |||||||||||
Accrued purchases of property and equipment | 797 | 929 | 765 | ||||||||
Accrued consideration for acquisition | — | 1,070 | — | ||||||||
The accompanying notes are an integral part of these consolidated financial statements.
60
Forum Energy Technologies, Inc. and subsidiaries
Consolidated statements of changes in stockholders’ equity
Common Stock | Additional paid in capital | Treasury Shares | Warrants | Retained earnings | Accumulated other comprehensive income / (loss) | Total common Stockholders’ equity | Non controlling Interest | Total Equity | ||||||||||||||||||||||||||||||||||
Shares | Amount | Shares | Amount | |||||||||||||||||||||||||||||||||||||||
(in thousands of dollars, except share information) | ||||||||||||||||||||||||||||||||||||||||||
Balance at December 31, 2013 | 96,306,753 | $ | 964 | $ | 826,028 | (3,585,098 | ) | $ | (30,249 | ) | $ | 687 | $ | 525,140 | $ | 7,785 | $ | 1,330,355 | $ | 611 | $ | 1,330,966 | ||||||||||||||||||||
Restricted stock issuance, net of forfeitures | 70,179 | 1 | (680 | ) | — | — | — | — | — | (679 | ) | — | (679 | ) | ||||||||||||||||||||||||||||
Stock based compensation expense | — | — | 18,770 | — | — | — | — | — | 18,770 | — | 18,770 | |||||||||||||||||||||||||||||||
Exercised stock options | 1,108,045 | 11 | 9,174 | — | — | — | — | — | 9,185 | — | 9,185 | |||||||||||||||||||||||||||||||
Exercise of warrants | 248,189 | 2 | 685 | — | — | (687 | ) | — | — | — | — | — | ||||||||||||||||||||||||||||||
Issuance of performance shares | 21,603 | — | (70 | ) | — | — | — | — | — | (70 | ) | — | (70 | ) | ||||||||||||||||||||||||||||
Shares issued in employee stock purchase plan | 110,509 | 1 | 2,664 | — | — | — | — | — | 2,665 | — | 2,665 | |||||||||||||||||||||||||||||||
Treasury stock | — | — | — | (4,523,885 | ) | (102,231 | ) | — | — | — | (102,231 | ) | — | (102,231 | ) | |||||||||||||||||||||||||||
Excess tax benefits | — | — | 7,742 | — | — | — | — | — | 7,742 | — | 7,742 | |||||||||||||||||||||||||||||||
Change in pension liability | — | — | — | — | — | — | — | (1,110 | ) | (1,110 | ) | — | (1,110 | ) | ||||||||||||||||||||||||||||
Currency translation adjustment | — | — | — | — | — | — | — | (43,636 | ) | (43,636 | ) | (58 | ) | (43,694 | ) | |||||||||||||||||||||||||||
Net income | — | — | — | — | — | — | 174,365 | — | 174,365 | 12 | 174,377 | |||||||||||||||||||||||||||||||
Balance at December 31, 2014 | 97,865,278 | $ | 979 | $ | 864,313 | (8,108,983 | ) | $ | (132,480 | ) | $ | — | $ | 699,505 | $ | (36,961 | ) | $ | 1,395,356 | $ | 565 | $ | 1,395,921 | |||||||||||||||||||
Restricted stock issuance, net of forfeitures | 157,577 | 1 | (875 | ) | — | — | — | — | — | (874 | ) | — | (874 | ) | ||||||||||||||||||||||||||||
Stock based compensation expense | — | — | 21,675 | — | — | — | — | — | 21,675 | — | 21,675 | |||||||||||||||||||||||||||||||
Exercised stock options | 419,363 | 4 | 3,618 | — | — | — | — | — | 3,622 | — | 3,622 | |||||||||||||||||||||||||||||||
Issuance of performance shares | 17,282 | — | (22 | ) | — | — | — | — | — | (22 | ) | — | (22 | ) | ||||||||||||||||||||||||||||
Shares issued in employee stock purchase plan | 146,402 | 2 | 2,547 | — | — | — | — | — | 2,549 | — | 2,549 | |||||||||||||||||||||||||||||||
Treasury stock | — | — | — | (36,819 | ) | (838 | ) | — | — | — | (838 | ) | — | (838 | ) | |||||||||||||||||||||||||||
Excess tax benefits | — | — | (8 | ) | — | — | — | — | — | (8 | ) | — | (8 | ) | ||||||||||||||||||||||||||||
Change in pension liability | — | — | — | — | — | — | — | 46 | 46 | — | 46 | |||||||||||||||||||||||||||||||
Currency translation adjustment | — | — | — | — | — | — | — | (45,133 | ) | (45,133 | ) | (137 | ) | (45,270 | ) | |||||||||||||||||||||||||||
Net Loss | — | — | — | — | — | — | (119,353 | ) | — | (119,353 | ) | (31 | ) | (119,384 | ) | |||||||||||||||||||||||||||
Balance at December 31, 2015 | 98,605,902 | $ | 986 | $ | 891,248 | (8,145,802 | ) | $ | (133,318 | ) | $ | — | $ | 580,152 | $ | (82,048 | ) | $ | 1,257,020 | $ | 397 | $ | 1,257,417 | |||||||||||||||||||
Restricted stock issuance, net of forfeitures | 670,769 | 6 | (1,051 | ) | — | — | — | — | — | (1,045 | ) | — | (1,045 | ) | ||||||||||||||||||||||||||||
Stock based compensation expense | — | — | 20,535 | — | — | — | — | — | 20,535 | — | 20,535 | |||||||||||||||||||||||||||||||
Exercised stock options | 151,335 | 2 | 1,710 | — | — | — | — | — | 1,712 | — | 1,712 | |||||||||||||||||||||||||||||||
Issuance of performance shares | 42,443 | 1 | (48 | ) | — | — | — | — | — | (47 | ) | — | (47 | ) | ||||||||||||||||||||||||||||
Shares issued in employee stock purchase plan | 186,679 | 2 | 1,976 | — | — | — | — | — | 1,978 | — | 1,978 | |||||||||||||||||||||||||||||||
Equity offering | 4,025,000 | 40 | 85,038 | — | — | — | — | — | 85,078 | — | 85,078 | |||||||||||||||||||||||||||||||
Treasury stock | — | — | — | (29,161 | ) | (623 | ) | — | — | — | (623 | ) | — | (623 | ) | |||||||||||||||||||||||||||
Excess tax benefits | — | — | (1,239 | ) | — | — | — | — | — | (1,239 | ) | — | (1,239 | ) | ||||||||||||||||||||||||||||
Change in pension liability | — | — | — | — | — | — | — | (335 | ) | (335 | ) | — | (335 | ) | ||||||||||||||||||||||||||||
Currency translation adjustment | — | — | — | — | — | — | — | (45,854 | ) | (45,854 | ) | 132 | (45,722 | ) | ||||||||||||||||||||||||||||
Net Loss | — | — | — | — | — | — | (81,978 | ) | — | (81,978 | ) | 30 | (81,948 | ) | ||||||||||||||||||||||||||||
Balance at December 31, 2016 | 103,682,128 | $ | 1,037 | $ | 998,169 | (8,174,963 | ) | $ | (133,941 | ) | $ | — | $ | 498,174 | $ | (128,237 | ) | $ | 1,235,202 | $ | 559 | $ | 1,235,761 | |||||||||||||||||||
The accompanying notes are an integral part of these consolidated financial statements.
61
Forum Energy Technologies, Inc. and subsidiaries
Notes to consolidated financial statements
1. Nature of operations
Forum Energy Technologies, Inc. (the "Company"), a Delaware corporation, is a global oilfield products company, serving the drilling, subsea, completion, production and infrastructure sectors of the oil and natural gas industry. The Company designs, manufactures and distributes products, and engages in aftermarket services, parts supply and related services that complement the Company’s product offering.
2. Summary of significant accounting policies
Basis of presentation
The accompanying consolidated financial statements are prepared in accordance with accounting principles generally accepted in the United States of America ("GAAP").
Principles of consolidation
The consolidated financial statements include the accounts of the Company and its wholly and majority owned subsidiaries after elimination of intercompany balances and transactions. Noncontrolling interest principally represents ownership by others of the equity in our consolidated majority owned South African subsidiary.
The Company's investment in an operating entity where the Company has the ability to exert significant influence, but does not control operating and financial policies, is accounted for using the equity method. The Company's share of the net income of this entity is recorded as "Earnings from equity investment" in the consolidated statements of comprehensive income (loss). The investment in this entity is included in "Investment in unconsolidated subsidiary" in the consolidated balance sheets. The Company reports its share of equity earnings within operating income as the investee's operations are similar in nature to the operations of the Company.
Use of estimates
The preparation of financial statements in conformity with GAAP requires management to make estimates and assumptions that affect the reported amounts of assets and liabilities and disclosure of contingent assets and liabilities as of the date of the financial statements and the reported amounts of revenues and expenses during the reporting period.
In the preparation of these consolidated financial statements, estimates and assumptions have been made by management including, among others, costs to complete contracts, an assessment of percentage of completion of projects, the selection of useful lives of tangible and intangible assets, fair value of reporting units used for goodwill impairment testing, expected future cash flows from long lived assets to support impairment tests, provisions necessary for trade receivables, amounts of deferred taxes and income tax contingencies. Actual results could differ from these estimates.
The financial reporting of contracts depends on estimates, which are assessed continually during the term of those contracts. Recognized revenues and income are subject to revisions as the contract progresses to completion and changes in estimates are reflected in the period in which the facts that give rise to the revisions become known. Additional information that enhances and refines the estimating process that is obtained after the balance sheet date, but before issuance of the financial statements is reflected in the financial statements.
Cash and cash equivalents
Cash and cash equivalents consist of cash on deposit and high quality, short term money market instruments with an original maturity of three months or less. Cash equivalents are stated at cost plus accrued interest, which approximates fair value.
62
Forum Energy Technologies, Inc. and subsidiaries
Notes to consolidated financial statements (continued)
Accounts receivable-trade
Trade accounts receivables are carried at their estimated collectible amounts. Trade credit is generally extended on a short-term basis; thus receivables do not bear interest, although a finance charge may be applied to amounts past due. The Company maintains an allowance for doubtful accounts for estimated losses that may result from the inability of its customers to make required payments. Such allowances are based upon several factors including, but not limited to, credit approval practices, industry and customer historical experience as well as the current and projected financial condition of the specific customer. Accounts receivable outstanding longer than contractual terms are considered past due. The Company writes off accounts receivable to the allowance for doubtful accounts when they become uncollectible. Any payments subsequently received on receivables previously written off are credited to bad debt expense.
The change in amounts of the allowance for doubtful accounts during the three year period ended December 31, 2016 is as follows (in thousands):
Period ended | Balance at beginning of period | Charged to expense | Deductions or other | Balance at end of period | ||||||||||||
December 31, 2014 | $ | 5,725 | $ | 2,492 | $ | (2,571 | ) | $ | 5,646 | |||||||
December 31, 2015 | 5,646 | 4,358 | (1,885 | ) | 8,119 | |||||||||||
December 31, 2016 | 8,119 | 485 | (5,273 | ) | 3,331 | |||||||||||
Inventories
Inventory consisting of finished goods and materials and supplies held for resale is carried at the lower of cost or market. For certain operations, cost, which includes the cost of raw materials and labor for finished goods, is determined using standard cost which approximates a first-in first-out basis. For other operations, this cost is determined on an average cost, first-in first-out or specific identification basis. Market means current replacement cost except that (1) market should not exceed net realizable value and (2) market should not be less than net realizable value reduced by an allowance for a normal profit margin. The Company continuously evaluates inventories, based on an analysis of inventory levels, historical sales experience and future sales forecasts, to determine obsolete, slow-moving and excess inventory. Adjustments to reduce such inventory to its estimated recoverable value have been recorded by management.
Property and equipment
Property and equipment are stated at cost less accumulated depreciation. Equipment held under capital leases are stated at the present value of minimum lease payments. Expenditures for property and equipment and for items which substantially increase the useful lives of existing assets are capitalized at cost and depreciated over their estimated useful life utilizing the straight-line method. Routine expenditures for repairs and maintenance are expensed as incurred. Depreciation is computed using the straight-line method based on the estimated useful lives of assets, generally three to thirty years. Property and equipment held under capital leases are amortized straight-line over the shorter of the lease term or estimated useful life of the asset. Gains or losses resulting from the disposition of assets are recognized in income, and the related asset cost and accumulated depreciation are removed from the accounts. Assets acquired in connection with business combinations are recorded at fair value.
Rental equipment consists of equipment leased to customers under operating leases. Rental equipment is recorded at cost and depreciated using the straight-line method over the estimated useful life of three to ten years.
The Company reviews long-lived assets for potential impairment whenever events or changes in circumstances indicate that the carrying amount of a long-lived asset may not be recoverable. In performing the review for impairment, future cash flows expected to result from the use of the asset and its eventual disposal are estimated. If the undiscounted future cash flows are less than the carrying amount of the assets, there is an indication that the asset may be impaired. The amount of the impairment is measured as the difference between the carrying value and the estimated fair value of the asset. The fair value is determined either through the use of an external valuation, or by means of an analysis of discounted future cash flows based on expected utilization. The impairment loss recognized represents the excess of the assets carrying value as compared to its estimated fair value. For the year ended December 31, 2016, the Company recorded an impairment loss of $4.3 million related to an operation in South Africa and one of the Company's Texas facilities. For the years ended December 31, 2015 and 2014, no impairments were recorded.
To the extent that asset retirement obligations are incurred, the Company records the fair value of an asset retirement obligation as a liability in the period in which the associated legal obligation is incurred. The fair values of these
63
Forum Energy Technologies, Inc. and subsidiaries
Notes to consolidated financial statements (continued)
obligations are recorded as liabilities on a discounted basis. The costs associated with these liabilities are capitalized as part of the related assets and depreciated. Over time, the liabilities are accreted for any change in their present value. The current portion of the liability is included in other accrued liabilities and non-current portion is included in other long-term liabilities on the consolidated balance sheets.
Goodwill and intangible assets
For goodwill and intangible assets with indefinite lives, an assessment for impairment is performed annually or when there is an indication an impairment may have occurred. The Company completes its annual impairment test for goodwill and other indefinite-lived intangibles using an assessment date of October 1. Goodwill is reviewed for impairment by comparing the carrying value of each of our six reporting unit’s net assets (including allocated goodwill) to the fair value of the reporting unit. The fair value of the reporting units is determined using a discounted cash flow approach. Determining the fair value of a reporting unit requires the use of estimates and assumptions. Such estimates and assumptions include revenue growth rates, operating margins, weighted average costs of capital, a terminal growth rate, and future market conditions, among others. The Company believes that the estimates and assumptions used in impairment assessments are reasonable. If the reporting unit’s carrying value is greater than its fair value, a second step is performed whereby the implied fair value of goodwill is estimated by allocating the fair value of the reporting unit in a hypothetical purchase price allocation analysis. The Company recognizes a goodwill impairment charge for the amount by which the carrying value of goodwill exceeds its fair value. Any impairment losses are reflected in operating income.
At October 1, 2016, the Company performed the annual impairment test on each of its reporting units and concluded that there had been no impairment because the estimated fair value of each of those reporting units exceeded its carrying value. As such, no impairment losses were recorded on goodwill for the year ended December 31, 2016. If the market conditions do not improve further, however, we may have additional impairment charges in our Subsea reporting unit in the future.
For the year ended December 31, 2015, the Company performed the impairment test on all six reporting units, and recorded $123.2 million of impairment losses for its Subsea reporting unit. In 2014, no goodwill impairment losses were recorded.
Intangible assets with definite lives comprised of customer and distributor relationships, non-compete agreements, and patents are amortized on a straight-line basis over the life of the intangible asset, generally three to seventeen years. These assets are tested for impairment whenever events or changes in circumstances indicate that their carrying amount may not be recoverable. In the fourth quarter of 2015, $1.9 million of intangible assets were written off related to trade names no longer in use. No impairments to intangible assets were recorded in 2016 and 2014. Refer to Note 7, Goodwill and intangible assets, for further discussion.
Recognition of provisions for contingencies
In the ordinary course of business, the Company is subject to various claims, suits and complaints. The Company, in consultation with internal and external advisors, will provide for a contingent loss in the consolidated financial statements if it is probable that a liability has been incurred at the date of the consolidated financial statements and the amount can be reasonably estimated. If it is determined that the reasonable estimate of the loss is a range and that there is no best estimate within the range, provision will be made for the lower amount of the range. Legal costs are expensed as incurred.
An assessment is made of the areas where potential claims may arise under the contract warranty clauses. Where a specific risk is identified and the potential for a claim is assessed as probable and can be reasonably estimated, an appropriate warranty provision is recorded. Warranty provisions are eliminated at the end of the warranty period except where warranty claims are still outstanding. The liability for product warranty is included in other accrued liabilities on the consolidated balance sheets.
Changes in the Company’s warranty liability were as follows (in thousands):
Period ended | Balance at beginning of period | Charged to expense | Deductions or other | Balance at end of period | ||||||||||||
December 31, 2014 | $ | 5,280 | $ | 2,588 | $ | (2,554 | ) | $ | 5,314 | |||||||
December 31, 2015 | 5,314 | 5,539 | (5,156 | ) | 5,697 | |||||||||||
December 31, 2016 | 5,697 | 4,031 | (6,504 | ) | 3,224 | |||||||||||
64
Forum Energy Technologies, Inc. and subsidiaries
Notes to consolidated financial statements (continued)
Revenue recognition and deferred revenue
Revenue is recognized when all of the following criteria have been met: (a) persuasive evidence of an arrangement exists, (b) delivery of the equipment has occurred or services have been rendered, (c) the price of the product or service is fixed and determinable and (d) collectability is reasonably assured. Revenue from product sales, including shipping costs, is recognized as title passes to the customer, which generally occurs when items are shipped from the Company’s facilities. Revenue from services is recognized when the service is completed to the customer’s specifications.
Customers are sometimes billed in advance of services performed or products manufactured, and the Company recognizes the associated liability as deferred revenue.
Revenue generated from long-term contracts typically longer than six months in duration are recognized on the percentage-of-completion method of accounting. The Company recognizes revenue and cost of goods sold each period based upon the advancement of the work-in-progress unless the stage of completion is insufficient to enable a reasonably certain forecast of profit to be established. In such cases, no profit is recognized during the period. The percentage-of-completion is calculated based on the ratio of costs incurred to-date to total estimated costs, taking into account the level of completion. The percentage-of-completion method requires management to calculate reasonably dependable estimates of progress toward completion of contract revenues and contract costs. Whenever revisions of estimated contract costs and contract values indicate that the contract costs will exceed estimated revenues, thus creating a loss, a provision for the total estimated loss is recorded in that period.
Primarily related to the remotely operated vehicles ("ROVs"), which may take longer to manufacture, accounting estimates during the course of the project may change. The effect of such a change, which can be upward as well as downward, is accounted for in the period of change and the cumulative income recognized to date is adjusted to reflect the latest estimates. These revisions to estimates are accounted for on a prospective basis.
On a contract by contract basis, cost and profit in excess of billings represents the cumulative revenue recognized less the cumulative billings to the customer. Similarly, billings in excess of costs and profits represent the cumulative billings to the customer less the cumulative revenue recognized.
Revenue from the rental of equipment or providing of services is recognized over the period when the asset is rented or services are rendered and collectability is reasonably assured. Rates for asset rental and service provision are priced on a per day, per man hour, or similar basis.
Concentration of credit risk
Financial instruments which potentially subject the Company to credit risk include trade accounts receivable. Trade accounts receivable consist of uncollateralized receivables from domestic and internationally based customers. For the years ended December 31, 2016, 2015 and 2014, no one customer accounted for 10% or more of the total revenue or 10% more of the total accounts receivable balance at the end of the respective period.
Share-based compensation
The Company measures all share-based compensation awards at fair value on the date they are granted to employees and directors, and recognizes compensation cost, net of forfeitures, over the requisite service period for awards with only a service condition, and over a graded vesting period for awards with service and performance or market conditions.
The fair value of share-based compensation awards with market conditions is measured using a lattice model and in accordance with Accounting Standards Codification ("ASC") 718, is not adjusted based on actual achievement of the performance goals. The Black-Scholes option pricing model is used to measure the fair value of options. The following sections address the assumptions used related to the Black-Scholes option pricing model:
Expected life
The expected term of stock options represents the period the stock options are expected to remain outstanding and is based on the simplified method, which is the weighted average vesting term plus the original contractual term divided by two. The Company uses the simplified method due to a lack of sufficient historical share option exercise experience upon which to estimate an expected term.
Expected volatility
Expected volatility measures the amount that a stock price has fluctuated or is expected to fluctuate during a period and is estimated based on a weighted average of the Company's historical stock price.
Dividend yield
65
Forum Energy Technologies, Inc. and subsidiaries
Notes to consolidated financial statements (continued)
The Company has never declared or paid any cash dividends and does not plan to pay cash dividends in the foreseeable future. Therefore, a zero expected dividend yield was used in the valuation model.
Risk-free interest rate
The risk-free interest rate is based on United States Treasury zero-coupon issues with remaining terms similar to the expected term on the options.
Forfeitures
The Company estimates forfeitures at the time of grant and revises those estimates in subsequent periods if actual forfeitures differ from those estimates. The Company uses historical data to estimate pre-vesting option forfeitures and record stock-based compensation expense only for those awards that are expected to vest. If the Company’s actual forfeiture rate is materially different from its estimate, the stock-based compensation expense could be different from what the Company has recorded in the current period. Historically, estimated forfeitures have been in line with actual forfeitures.
Income taxes
The Company follows the liability method of accounting for income taxes. Under this method, deferred income tax assets and liabilities are determined based upon temporary differences between the carrying amounts and tax bases of the Company’s assets and liabilities at the balance sheet date, and are measured using enacted tax rates and laws that will be in effect when the differences are expected to reverse. The effect on deferred tax assets and liabilities of a change in the tax rates is recognized in income in the period in which the change occurs. The Company records a valuation allowance in each reporting period when management believes that it is more likely than not that any deferred tax asset created will not be realized.
Accounting guidance for income taxes requires that the Company recognize the financial statement benefit of a tax position only after determining that the relevant tax authority would more likely than not sustain the position following an audit. If a tax position meets the "more likely than not" recognition criteria, accounting guidance requires the tax position be measured at the largest amount of benefit greater than 50% likely of being realized upon ultimate settlement.
Earnings per share
Basic earnings per share for all periods presented equals net income divided by the weighted average number of the shares of the Company’s common stock outstanding during the period. Diluted earnings per share is computed by dividing net income by the weighted average number of shares of the Company’s common stock outstanding during the period as adjusted for the dilutive effect of the Company’s stock options, restricted share plans.
The exercise price of each option is based on the Company’s stock price at the date of grant. There is no dilutive effect for 2016 and 2015 since the Company is in a net loss position. The diluted earnings per share calculation excludes approximately 0.5 million stock options for the year ended December 31, 2014, because they were anti-dilutive as the option exercise price or warrant conversion price was greater than the average market price of the common stock.
The following is a reconciliation of the number of shares used for the basic and diluted earnings per share computations (shares in thousands):
December 31, | |||||||||
2016 | 2015 | 2014 | |||||||
Basic weighted average shares outstanding | 91,226 | 89,908 | 92,628 | ||||||
Dilutive effect of stock option, restricted share plan and warrants | — | — | 2,680 | ||||||
Diluted weighted average shares outstanding | 91,226 | 89,908 | 95,308 | ||||||
Non-U.S. local currency translation
The Company operates globally and its primary functional currency is the U.S. dollar ($). The majority of the Company’s non-U.S. operations have designated the local currency as their functional currency. Financial statements of these non-U.S. operations are translated into U.S. dollars using the current rate method whereby assets and liabilities are translated at the balance sheet rate and income and expenses are translated into U.S. dollars at the average exchange rates in effect during the period. The resultant translation adjustments are reported as a component of accumulated other comprehensive income (loss) within stockholders’ equity.
66
Forum Energy Technologies, Inc. and subsidiaries
Notes to consolidated financial statements (continued)
Noncontrolling interest
Noncontrolling interests are classified as equity in the consolidated balance sheets. Net earnings include the net earnings for both controlling and noncontrolling interests, with disclosure of both amounts on the consolidated statements of comprehensive income (loss).
Fair value
The carrying amounts for financial instruments classified as current assets and current liabilities approximate fair value, due to the short maturity of such instruments. The book values of other financial instruments, such as the Company’s debt related to the credit facility, approximates fair value because interest rates charged are similar to other financial instruments with similar terms and maturities and the rates vary in accordance with a market index.
For the financial assets and liabilities disclosed at fair value, fair value is determined as the exit price, or the price that would be received to sell an asset or paid to transfer a liability in an orderly transaction between market participants at the measurement date. The established fair value hierarchy divides fair value measurement into three broad levels:
• | Level 1 - inputs are quoted prices (unadjusted) in active markets for identical assets or liabilities that the reporting entity has the ability to access at the measurement date; |
• | Level 2 - inputs other than quoted prices included within Level 1 that are observable for the assets or liability, either directly or indirectly; and |
• | Level 3 - inputs are unobservable for the asset or liability, which reflect the best judgment of management. |
The financial assets and liabilities that are disclosed at fair value for disclosure purposes are categorized in one of the above three levels based on the lowest level input that is significant to the fair value measurement in its entirety. Level 1 provides the most reliable measure of fair value, whereas Level 3 generally requires significant management judgment.
Recent accounting pronouncements
From time to time, new accounting pronouncements are issued by the Financial Accounting Standards Board ("FASB"), which are adopted by the Company as of the specified effective date.
In November 2016, the FASB issued ASU No. 2016-18 Statement of Cash Flows (Topic 230) - Restricted Cash a consensus of the FASB Emerging Issues Task Force. This new guidance requires that a statement of cash flows explain the change during the period in the total of cash, cash equivalents, and amounts generally described as restricted cash or restricted cash equivalents. Therefore, amounts generally described as restricted cash and restricted cash equivalents should be included with cash and cash equivalents when reconciling the beginning-of-period and end-of-period total amounts shown on the statement of cash flows. ASU 2016-18 is effective for fiscal years beginning after December 15, 2018, and interim periods within fiscal years beginning after December 15, 2019 and is not expected to have a material impact on the Company's consolidated financial statements.
In October 2016, the FASB issued ASU No. 2016-16 Income Tax (Topic 740) - Intra-Entity Transfers of Assets Other Than Inventory. Current GAAP prohibits the recognition of current and deferred income taxes for an intra-entity asset transfer until the asset has been sold to an outside party. This new guidance eliminates this exception and requires an entity to recognize the income tax consequences of an intra-entity transfer of an asset other than inventory when the transfer occurs. ASU 2016-16 is effective for annual reporting periods beginning after December 15, 2017, including interim reporting periods within those annual reporting periods, and should be applied on a modified retrospective basis through a cumulative-effect adjustment directly to retained earnings as of the beginning of the period of adoption. The ASU is not expected to have a material impact on the Company's consolidated financial statements.
In August 2016, the FASB issued Accounting Standards Update ("ASU") No. 2016-15 Cash Flow Statement (Topic 230) - Classification of Certain Cash Receipts and Cash Payments. This new guidance addresses eight specific cash flow issues with the objective of reducing the existing diversity in practice, including: debt prepayment or debt extinguishment costs, settlement of zero-coupon debt instruments or other debt instruments, contingent consideration payments made after a business combination, proceeds from the settlement of insurance claims, proceeds from the settlement of corporate-owned life insurance policies, distributions received from equity method investees, beneficial interests in securitization transactions, and separately identifiable cash flows and application of the predominance principle. The only issue currently relevant to the Company is distributions received from equity method investees, where the new guidance allows an accounting policy election between the cumulative earnings approach and the nature of the distribution approach. The Company will continue to use the cumulative earnings approach, therefore the guidance is not expected to have a material impact on the Company's consolidated financial statements. ASU
67
Forum Energy Technologies, Inc. and subsidiaries
Notes to consolidated financial statements (continued)
2016-15 is effective for public business entities for fiscal years beginning after December 15, 2017, and interim periods within those fiscal years.
In May 2016, the FASB issued ASU No. 2016-11 Revenue Recognition (Topic 605) and Derivatives and Hedging (Topic 815) - Rescission of SEC Guidance Because of Accounting Standards Updates No. 2014-09 and No. 2014-16 Pursuant to Staff Announcements at the March 3, 2016 EITF Meeting. This new guidance rescinded certain SEC staff observer comments in Topic 605 related to revenue and expense recognition for freight services in process and accounting for shipping and handling fees and costs, in Topic 932 related to gas-balancing arrangements, and in Topic 815 related to the nature of a host contract related to a hybrid instrument issued in the form of a share. ASU 2016-11 is effective upon adoption of Topic 606 and is not expected to have a material impact on the Company's consolidated financial statements.
In March 2016, the FASB issued ASU No. 2016-09, Improvements to Employee Share-Based Payment Accounting. This new guidance includes provisions intended to simplify how share-based payments are accounted for and presented in the financial statements, including: a) all excess tax benefits and tax deficiencies should be recognized as income tax expense or benefit in the income statement; b) excess tax benefits should be classified along with other income tax cash flows as an operating activity; c) an entity can make an entity-wide accounting policy election to either estimate the number of awards that are expected to vest or account for forfeitures when they occur; d) the threshold to qualify for equity classification permits withholding up to the maximum statutory tax rates in the applicable jurisdictions; e) cash paid by an employer should be classified as a financing activity when shares are directly withheld for tax withholding purposes. There are also two additional provisions for non-public entities that do not apply to the Company. The element of the new standard that will have the most impact on Company's financial statements will be income tax consequences. Excess tax benefits and tax deficiencies on stock-based compensation awards will now be included in the tax provision within the consolidated statement of comprehensive income, rather than the Company's current accounting of recording in additional paid-in capital on the consolidated balance sheet. The standard will take effect for public companies for annual periods beginning after December 15, 2016, and interim periods within those annual periods.
In February 2016, the FASB issued ASU No. 2016-02, Leases. Under this new guidance, lessees will be required to recognize assets and liabilities on the balance sheet for the rights and obligations created by all leases with terms of greater than twelve months. The standard will take effect for public companies with fiscal years, and interim periods within those fiscal years, beginning after December 15, 2018. The Company is currently evaluating the impact of the adoption of this guidance.
In August 2014, the FASB issued ASU No. 2014-15, Presentation of Financial Statements - Going Concern. The new standard requires management to evaluate whether there are conditions or events that raise substantial doubt as to an entity's ability to continue as a going concern for both annual and interim reporting periods. The guidance was effective for the Company for the annual period ending after December 15, 2016 and interim periods thereafter. The guidance did not have a material impact on the Company's consolidated financial statements.
In May 2014, the FASB issued ASU No. 2014-09, Revenue from Contracts with Customers (Topic 606). The comprehensive new standard will supersede existing revenue recognition guidance and require revenue to be recognized when promised goods or services are transferred to customers in amounts that reflect the consideration to which the company expects to be entitled in exchange for those goods or services. Adoption of the new rules could affect the timing of revenue recognition for certain transactions. The guidance permits two implementation approaches, one requiring retrospective application of the new standard with restatement of prior years and one requiring prospective application of the new standard with disclosure of results under old standards. The FASB issued several subsequent standards in 2016 containing implementation guidance related to the new standard. These standards provide additional guidance related to principal versus agent considerations, licensing, and identifying performance obligations. Additionally, these standards provide narrow-scope improvements and practical expedients as well as technical corrections and improvements. Overall, the new guidance is to be effective for the fiscal year beginning after December 15, 2017. Companies are able to early adopt the pronouncement, however not before fiscal years beginning after December 15, 2016. The Company currently anticipates that it will adopt this standard using the modified retrospective method.
68
Forum Energy Technologies, Inc. and subsidiaries
Notes to consolidated financial statements (continued)
3. Acquisitions
2016 Acquisition
In April 2016, the Company completed the acquisition of the wholesale completion packers business of Team Oil Tools, Inc. The acquisition includes a wide variety of completion and service tools, including retrievable and permanent packers, bridge plugs and accessories which are sold to oilfield service providers, packer repair companies and distributors on a global basis, and is included in the Completions segment. The fair values of the assets acquired and liabilities assumed have not been presented because they are not material to the audited consolidated financial statements. Pro forma results of operations for the 2016 acquisition have not been presented because the effects were not material to the consolidated financial statements.
2015 Acquisition
Effectively February 2015, the Company completed the acquisition of J-Mac Tool, Inc. (“J-Mac”) for aggregate consideration of approximately $61.9 million. J-Mac is a Fort Worth, Texas based manufacturer of high quality hydraulic fracturing pumps, power ends, fluid ends and other pump accessories. J-Mac is included in the Completions segment. The following table summarizes the fair values of the assets acquired and liabilities assumed at the date of the acquisition (in thousands):
2015 Acquisition | ||||
Current assets, net of cash acquired | $ | 36,174 | ||
Property and equipment | 11,506 | |||
Intangible assets (primarily customer relationships) | 10,400 | |||
Tax-deductible goodwill | 13,977 | |||
Current liabilities | (10,129 | ) | ||
Long term liabilities | (22 | ) | ||
Net assets acquired | $ | 61,906 | ||
Revenue and net income related to the 2015 acquisition were not significant for the year ended December 31, 2015. Pro forma results of operations for the 2015 acquisition have not been presented because the effects were not material to the consolidated financial statements.
2014 Acquisition
Effective May 1, 2014, the Company completed the acquisition of Quality Wireline & Cable, Inc. ("Quality") for consideration of $38.3 million. Quality is a Calgary, Alberta based manufacturer of high-performance cased-hole electro-mechanical wireline cables and specialty cables for the oil and natural gas industry. Quality is included in the Drilling & Subsea segment. The following table summarizes the fair values of the assets acquired and liabilities assumed at the date of the acquisition (in thousands):
2014 Acquisition | ||||
Current assets, net of cash acquired | $ | 7,596 | ||
Property and equipment | 3,837 | |||
Intangible assets (primarily customer relationships) | 11,527 | |||
Non-tax-deductible goodwill | 20,573 | |||
Current liabilities | (1,615 | ) | ||
Deferred tax liabilities | (3,629 | ) | ||
Net assets acquired | $ | 38,289 | ||
Revenue and net income related to the 2014 acquisition were not significant for the year ended December 31, 2014. Pro forma results of operations for the 2014 acquisition have not been presented because the effects were not material to the consolidated financial statements.
69
Forum Energy Technologies, Inc. and subsidiaries
Notes to consolidated financial statements (continued)
4. Investment in unconsolidated subsidiary
Effective July 1, 2013, the Company jointly purchased Global Tubing, LLC ("Global Tubing") with an equal partner, with Global Tubing's management retaining a small interest. Global Tubing is a Dayton, Texas based provider of coiled tubing strings and related services. The Company's equity investment is reported in the Completions segment and is accounted for using the equity method of accounting. As Global Tubing's products are complementary to the Company’s well intervention and stimulation products and the investment's business is integral to the Company's operations, the earnings from the equity investment are included within operating income (loss).
Condensed financial data for the equity investment in the unconsolidated subsidiary is summarized as follows:
December 31, 2016 | December 31, 2015 | ||||||
Current assets | $ | 48,194 | $ | 56,160 | |||
Long-term assets | 142,682 | 145,965 | |||||
Current liabilities | 11,918 | 10,861 | |||||
Long-term liabilities | 80,500 | 95,000 | |||||
Year ended December 31, | |||||||
2016 | 2015 | ||||||
Net revenues | $ | 71,473 | $ | 103,532 | |||
Gross profit | 16,899 | 45,333 | |||||
Net income | 3,795 | 30,888 | |||||
The Company's earnings from equity investment | 1,824 | 14,824 | |||||
Subsequent to December 31, 2016, the Company contributed $1.0 million to Global Tubing, LLC.
5. Inventories
The Company's significant components of inventory at December 31, 2016 and 2015 were as follows (in thousands):
December 31, 2016 | December 31, 2015 | ||||||
Raw materials and parts | $ | 106,329 | $ | 148,372 | |||
Work in process | 23,303 | 38,381 | |||||
Finished goods | 277,303 | 315,256 | |||||
Gross inventories | 406,935 | 502,009 | |||||
Inventory reserve | (68,352 | ) | (77,888 | ) | |||
Inventories | $ | 338,583 | $ | 424,121 | |||
The change in the amounts of the inventory reserve during the three year period ended December 31, 2016 is as follows (in thousands):
Period ended | Balance at beginning of period | Charged to expense | Deductions or other | Balance at end of period | ||||||||||||
December 31, 2014 | $ | 26,419 | $ | 8,171 | $ | (5,134 | ) | $ | 29,456 | |||||||
December 31, 2015 | 29,456 | 51,917 | (3,485 | ) | $ | 77,888 | ||||||||||
December 31, 2016 | 77,888 | 25,537 | (35,073 | ) | $ | 68,352 | ||||||||||
70
Forum Energy Technologies, Inc. and subsidiaries
Notes to consolidated financial statements (continued)
6. Property and equipment
Property and equipment consists of the following (in thousands):
Estimated useful lives | December 31, | |||||||||
2016 | 2015 | |||||||||
Land | $ | 10,157 | $ | 11,467 | ||||||
Buildings and leasehold improvements | 5-30 | 75,947 | 83,983 | |||||||
Computer equipment | 3-5 | 42,248 | 39,986 | |||||||
Machinery & equipment | 5-10 | 131,860 | 128,879 | |||||||
Furniture & fixtures | 3-10 | 5,626 | 6,866 | |||||||
Vehicles | 3-5 | 8,660 | 10,090 | |||||||
Construction in progress | 4,545 | 5,841 | ||||||||
279,043 | 287,112 | |||||||||
Less: accumulated depreciation | (143,677 | ) | (121,713 | ) | ||||||
Property & equipment, net | 135,366 | 165,399 | ||||||||
Rental equipment | 3-10 | 69,475 | 76,908 | |||||||
Less: accumulated depreciation | (52,629 | ) | (55,640 | ) | ||||||
Rental equipment, net | 16,846 | 21,268 | ||||||||
Total property & equipment, net | $ | 152,212 | $ | 186,667 | ||||||
Depreciation expense was $35.6 million, $38.4 million and $37.4 million for the years ended December 31, 2016, 2015 and 2014.
7. Goodwill and intangible assets
Goodwill
The changes in the carrying amount of goodwill from January 1, 2015 to December 31, 2016, were as follows (in thousands):
Drilling & Subsea | Completions | Production & Infrastructure | Total | |||||||||||||||||||||
2016 | 2015 | 2016 | 2015 | 2016 | 2015 | 2016 | 2015 | |||||||||||||||||
Goodwill Balance at January 1, net | $ | 334,595 | $ | 472,891 | $ | 316,914 | $ | 307,448 | $ | 17,527 | $ | 18,142 | $ | 669,036 | $ | 798,481 | ||||||||
Acquisitions, net of dispositions | — | — | — | 13,977 | — | — | — | 13,977 | ||||||||||||||||
Impairment | — | (123,200 | ) | — | — | — | — | — | (123,200 | ) | ||||||||||||||
Impact of non-U.S. local currency translation | (17,189 | ) | (15,096 | ) | 779 | (4,511 | ) | 117 | (615 | ) | (16,293 | ) | (20,222 | ) | ||||||||||
Goodwill Balance at December 31, net | $ | 317,406 | $ | 334,595 | $ | 317,693 | $ | 316,914 | $ | 17,644 | $ | 17,527 | $ | 652,743 | $ | 669,036 | ||||||||
Goodwill and intangible assets with indefinite lives are assessed for impairment annually or whenever an event indicating impairment may have occurred. During the year ended December 31, 2015, the Company elected to change the date of the Company's annual assessments of goodwill and indefinite lived intangible assets impairment from December 31 to October 1. This was a change in method of applying an accounting principle, which management believed was a preferable alternative as it better aligned the timing of the assessment with our planning and forecasting process and alleviated constraints on accounting resources during our annual reporting process. The change in the assessment date did not delay, accelerate, or avoid a potential impairment charge.
71
Forum Energy Technologies, Inc. and subsidiaries
Notes to consolidated financial statements (continued)
At October 1, 2016, the Company performed its annual impairment test on each of the reporting units and concluded that there had been no impairment because the estimated fair values of each of those reporting units exceeded its carrying value. Relevant events and circumstances which could have a negative impact on goodwill include: macroeconomic conditions; industry and market conditions, such as commodity prices; operating cost factors; overall financial performance; the impact of dispositions and acquisitions; and other entity-specific events. Further declines in commodity prices or sustained lower valuation for the Company's common stock could indicate a reduction in the estimate of reporting unit fair value which, in turn, could lead to an impairment of reporting unit goodwill.
After October 1, 2015, the Company continued to monitor events and circumstances which could have a negative impact on estimates of reporting unit fair value. Commodity prices had remained at low levels and the active rig count had continued to decline resulting in a significant decline in the Company’s market capitalization. While the Company incorporated a downturn into its forecasts in this October 1 annual test, several factors occurred late in the fourth quarter of 2015 that indicated an occurrence of further declines in market activity. These factors included: 1) the OPEC confirmed that its members would not reduce production even in the face of low commodity prices and excess global oil supply; 2) oil prices declined further; 3) a consensus expectation developed that oil prices would stay lower for longer than previously expected; 4) exploration and production companies significantly decreased their budgets as the demand for oil and natural gas was lower and production was significantly less economical for them; and 5) macroeconomic concerns developed regarding a slowdown in the global economy. Due to this further deterioration of market conditions for our products, the Company performed an impairment test on all six reporting units. The Company identified and recorded an impairment charge of $123.2 million for its Subsea reporting unit for the year ended December 31, 2015. Following the impairment charge, at December 31, 2015, our Subsea reporting unit had a remaining balance of $73 million in goodwill.
The fair values were determined using the net present value of the expected future cash flows for each reporting unit. During the Company’s goodwill impairment analysis, the Company determines the fair value of each of its reporting units as a whole using a discounted cash flow analysis, which requires significant assumptions and estimates about the future operations of each reporting unit. The assumptions about future cash flows and growth rates are based on our current budget for 2017 and for future periods, as well as our strategic plans and management’s beliefs about future activity levels. The discount rate we used for future periods could change substantially if the cost of debt or equity were to significantly increase or decrease, or if we were to choose different comparable companies in determining the appropriate discount rate for our reporting units. Forecasted cash flows in future periods were estimated using a terminal value calculation, which considered long-term earnings growth rates. Accumulated impairment losses on goodwill were $168.8 million, $168.8 million and $45.6 million as of December 31, 2016, 2015, and 2014, respectively. There was no impairment of goodwill during the year ended December 31, 2016 and 2014, respectively.
72
Forum Energy Technologies, Inc. and subsidiaries
Notes to consolidated financial statements (continued)
Intangible assets
At December 31, 2016 and 2015, intangible assets consisted of the following, respectively (in thousands):
December 31, 2016 | |||||||||||||
Gross carrying amount | Accumulated amortization | Net amortizable intangibles | Amortization period (in years) | ||||||||||
Customer relationships | $ | 270,586 | $ | (115,381 | ) | $ | 155,205 | 4-15 | |||||
Patents and technology | 33,936 | (12,225 | ) | 21,711 | 5-17 | ||||||||
Non-compete agreements | 6,230 | (5,594 | ) | 636 | 3-6 | ||||||||
Trade names | 44,494 | (17,944 | ) | 26,550 | 10-15 | ||||||||
Distributor relationships | 22,160 | (15,074 | ) | 7,086 | 8-15 | ||||||||
Trademark | 5,230 | — | 5,230 | Indefinite | |||||||||
Intangible Assets Total | $ | 382,636 | $ | (166,218 | ) | $ | 216,418 | ||||||
December 31, 2015 | |||||||||||||
Gross carrying amount | Accumulated amortization | Net amortizable intangibles | Amortization period (in years) | ||||||||||
Customer relationships | $ | 280,297 | $ | (101,636 | ) | $ | 178,661 | 4-15 | |||||
Patents and technology | 34,140 | (10,264 | ) | 23,876 | 5-17 | ||||||||
Non-compete agreements | 7,269 | (6,292 | ) | 977 | 3-6 | ||||||||
Trade names | 45,446 | (15,890 | ) | 29,556 | 10-15 | ||||||||
Distributor relationships | 22,160 | (13,810 | ) | 8,350 | 8-15 | ||||||||
Trademark | 5,230 | — | 5,230 | Indefinite | |||||||||
Intangible Assets Total | $ | 394,542 | $ | (147,892 | ) | $ | 246,650 | ||||||
Intangible assets with definite lives are tested for impairment whenever events or changes in circumstances indicate that their carrying amount may not be recoverable. During the year ended December 31, 2015, an impairment loss of $1.9 million was recorded on certain intangible assets within the Drilling and Subsea segment. The impaired intangible assets included trade names that were no longer in use and is recorded under "Impairment of intangible assets and goodwill" in the consolidated statement of comprehensive income (loss). No indicators of intangible asset impairment occurred during the years ended December 31, 2016 and 2014.
Amortization expense was $26.1 million, $27.3 million and $27.7 million for the years ended December 31, 2016, 2015 and 2014, respectively. The total weighted average amortization period is 14 years and the estimated future amortization expense for the next five years is as follows (in thousands):
Year ending December 31, | ||||
2017 | $ | 26,647 | ||
2018 | 26,556 | |||
2019 | 26,207 | |||
2020 | 24,295 | |||
2021 | 23,730 | |||
73
Forum Energy Technologies, Inc. and subsidiaries
Notes to consolidated financial statements (continued)
8. Debt
Notes payable and lines of credit as of December 31, 2016 and 2015 consisted of the following (in thousands):
December 31, 2016 | December 31, 2015 | ||||||
6.25% Senior notes due October 2021 | $ | 400,000 | $ | 400,000 | |||
Unamortized debt premium | 1,989 | 2,395 | |||||
Debt issuance cost | (5,324 | ) | (6,425 | ) | |||
Senior secured revolving credit facility | — | — | |||||
Other debt | 206 | 299 | |||||
Total debt | 396,871 | 396,269 | |||||
Less: current maturities | (124 | ) | (253 | ) | |||
Long-term debt | $ | 396,747 | $ | 396,016 | |||
Senior Notes Due 2021
In October 2013, the Company issued $300.0 million of 6.25% senior unsecured notes due 2021 at par, and in November 2013, the Company issued an additional $100.0 million aggregate principal amount of the notes at a price of 103.25% of par, plus accrued interest from October 2, 2013 (the "Senior Notes"). The Senior Notes bear interest at a rate of 6.25% per annum, payable on April 1 and October 1 of each year, and mature on October 1, 2021. Net proceeds from the issuance of approximately $394.0 million, after deducting initial purchasers' discounts and offering expenses and excluding accrued interest paid by the purchasers, were used for the repayment of the then-outstanding term loan balance and a portion of the revolving credit facility balance.
The terms of the Senior Notes are governed by the indenture, dated October 2, 2013 (the “Indenture”), between the Company, the guarantors named therein and Wells Fargo Bank, National Association, as trustee (the “Trustee”). The Senior Notes are senior unsecured obligations, and are guaranteed on a senior unsecured basis by the Company’s subsidiaries that guarantee the credit facility and rank junior to, among other indebtedness, the credit facility to the extent of the value of the collateral securing the credit facility. The Senior Notes contain customary covenants including some limitations and restrictions on the Company’s ability to pay dividends on, purchase or redeem its common stock or purchase or redeem its subordinated debt; make certain investments; incur or guarantee additional indebtedness or issue certain types of equity securities; create certain liens, sell assets, including equity interests in its restricted subsidiaries; redeem or prepay subordinated debt; restrict dividends or other payments of its restricted subsidiaries; consolidate, merge or transfer all or substantially all of its assets; engage in transactions with affiliates; and create unrestricted subsidiaries. Many of these restrictions will terminate if the Senior Notes become rated investment grade. The Indenture also contains customary events of default, including nonpayment, breach of covenants in the Indenture, payment defaults or acceleration of other indebtedness, failure to pay certain judgments and certain events of bankruptcy and insolvency. The Company is required to offer to repurchase the Senior Notes in connection with specified change in control events or with excess proceeds of asset sales not applied for permitted purposes.
The Company may redeem the Senior Notes due 2021:
• | beginning on October 1, 2016 at a redemption price of 104.688% of their principal amount plus accrued and unpaid interest and additional interest, if any; then |
• | at a redemption price of 103.125% of their principal amount plus accrued and unpaid interest and additional interest, if any, for the twelve-month period beginning October 1, 2017; then |
• | at a redemption price of 101.563% of their principal amount plus accrued and unpaid interest and additional interest, if any, for the twelve-month period beginning October 1, 2018; and then |
• | at a redemption price of 100.000% of their principal amount plus accrued interest and unpaid interest and additional interest, if any, beginning on October 1, 2019. |
74
Forum Energy Technologies, Inc. and subsidiaries
Notes to consolidated financial statements (continued)
Credit Facility
On February 25, 2016, the Company amended the credit facility with Wells Fargo Bank, National Association, as administrative agent and several financial institutions as lenders to reduce lender commitments to $200.0 million. On December 12, 2016, the Company further amended the Credit Facility, to, among other things, reduce revolving credit line commitments from $200.0 million to $140.0 million, including the previously existing sublimits for up to $25.0 million available for letters of credit and up to $10.0 million in swingline loans. As of December 31, 2016, the Company had no borrowings outstanding under the Amended Credit Facility, $17.0 million of outstanding letters of credit and the capacity to borrow an additional $103.7 million under the Amended Credit Facility. The Amended Credit Facility matures in November 2018 and, subject to certain limitations, lender commitments may be increased by an additional $150.0 million. The Company's borrowing capacity under the Amended Credit Facility could be reduced or eliminated, depending on the future EBITDA. Weighted average interest rates under the Amended Credit Facility at December 31, 2016 and 2015 were approximately 3.00% and 2.00%, respectively. Availability under the Amended Credit Facility is subject to a borrowing base calculated by reference to eligible accounts receivable in the United States, United Kingdom and Canada, eligible inventory in the United States, and cash on hand.
The Amended Credit Facility’s financial covenants, among other things, require the Company, on a consolidated basis, to maintain specified financial ratios or conditions. The Company was in compliance with all financial covenants under the Amended Credit Facility at December 31, 2016. The Company anticipates that it will continue to be in compliance with the Amended Credit Facility for the next twelve months.
The Amended Credit Facility’s financial covenants are summarized as follows:
• | Senior secured debt to adjusted EBITDA of not more than 4.50 to 1.0 for each fiscal quarter through December 31, 2017, and not more than 3.50 to 1.0 for each fiscal quarter ending thereafter through the termination of the facility; For purposes of calculation of senior secured debt to adjusted EBITDA, the Amended Credit Facility provides for netting of certain cash and cash equivalents against senior secured debt for each fiscal quarter through December 31, 2017; and |
• | A fixed charge coverage ratio of not less than 1.25 to 1.0. This ratio is measured as EBITDA minus maintenance capital expenditures minus taxes paid in cash divided by scheduled principal and interest payments.The fixed charge coverage ratio is tested only if availability under the Amended Credit Facility falls below certain levels. |
Other debt
Other debt consists primarily of various capital leases of equipment.
Debt issue costs
The Company has incurred loan costs that have been capitalized and are amortized to interest expense over the term of the Senior Notes and the Amended Credit Facility. As a result, approximately $1.9 million, $2.6 million and $2.6 million were amortized to interest expense for the years ended December 31, 2016, 2015 and 2014, respectively. On February 25, 2016 and December 12, 2016, the Company amended its credit facility. In connection with such amendments, lender commitments were reduced from $600.0 million to $140.0 million. Accordingly, the Company has written off $3.0 million of the deferred financing costs related to the credit facility in 2016.
75
Forum Energy Technologies, Inc. and subsidiaries
Notes to consolidated financial statements (continued)
Future payments
Future principal payments under long-term debt for each of the years ending December 31 are as follows (in thousands):
2017 | $ | 124 | ||
2018 | 82 | |||
2019 | — | |||
2020 | — | |||
2021 | 400,000 | |||
Thereafter | — | |||
Total future payment | $ | 400,206 | ||
Add: Unamortized debt premium | 1,989 | |||
Less: Debt issuance cost | (5,324 | ) | ||
Total debt | $ | 396,871 | ||
9. Income taxes
The components of the Company's income before income taxes for the years ended December 31, 2016, 2015 and 2014 are as follows (in thousands):
2016 | 2015 | 2014 | |||||||||
U.S. | $ | (155,058 | ) | $ | (114,862 | ) | $ | 127,270 | |||
Non-U.S. | 17,059 | (19,461 | ) | 115,252 | |||||||
Income (loss) before income taxes | $ | (137,999 | ) | $ | (134,323 | ) | $ | 242,522 | |||
The Company’s provision (benefit) for income taxes from continuing operations for the years ended December 31, 2016, 2015 and 2014 are as follows (in thousands):
2016 | 2015 | 2014 | |||||||||
Current | |||||||||||
U.S. Federal and state | $ | (38,589 | ) | $ | 43 | $ | 47,100 | ||||
Non-U.S. | 6,956 | 8,264 | 24,315 | ||||||||
Total current | (31,633 | ) | 8,307 | 71,415 | |||||||
Deferred | |||||||||||
U.S. Federal and state | (18,290 | ) | (19,071 | ) | (2,080 | ) | |||||
Non-U.S. | (6,128 | ) | (4,175 | ) | (1,190 | ) | |||||
Total deferred | (24,418 | ) | (23,246 | ) | (3,270 | ) | |||||
Provision for income tax expense (benefit) | $ | (56,051 | ) | $ | (14,939 | ) | $ | 68,145 | |||
76
Forum Energy Technologies, Inc. and subsidiaries
Notes to consolidated financial statements (continued)
The reconciliation between the actual provision for income taxes from continuing operations and that computed by applying the U.S. statutory rate to income before income taxes and noncontrolling interests are outlined below (in thousands):
2016 | 2015 | 2014 | |||||||||||||||
Income tax expense (benefit) at the statutory rate | $ | (48,300 | ) | 35.0 | % | $ | (47,013 | ) | 35.0 | % | $ | 84,882 | 35.0 | % | |||
State taxes, net of federal tax benefit | (1,425 | ) | 1.0 | % | (1,157 | ) | 0.9 | % | 4,132 | 1.7 | % | ||||||
Non-U.S. operations | (5,791 | ) | 4.2 | % | 6,300 | (4.7 | )% | (15,060 | ) | (6.2 | )% | ||||||
Domestic incentives | (170 | ) | 0.1 | % | (250 | ) | 0.2 | % | (4,412 | ) | (1.8 | )% | |||||
Prior year federal, non-U.S. and state tax | (777 | ) | 0.6 | % | (518 | ) | 0.4 | % | (1,692 | ) | (0.7 | )% | |||||
Nondeductible expenses | 345 | (0.2 | )% | 279 | (0.2 | )% | 663 | 0.3 | % | ||||||||
Goodwill impairment | — | — | % | 27,210 | (20.3 | )% | — | — | % | ||||||||
Other | 67 | (0.1 | )% | 210 | (0.2 | )% | (368 | ) | (0.2 | )% | |||||||
Provision for income tax expense (benefit) | $ | (56,051 | ) | 40.6 | % | $ | (14,939 | ) | 11.1 | % | $ | 68,145 | 28.1 | % | |||
The primary components of deferred taxes include (in thousands):
2016 | 2015 | ||||||
Deferred tax assets | |||||||
Reserves and accruals | $ | 6,603 | $ | 7,174 | |||
Inventory | 24,677 | 29,154 | |||||
Stock awards | 10,984 | 9,350 | |||||
Other | 982 | 544 | |||||
Net operating loss and other tax credit carryforwards | 30,317 | 1,673 | |||||
Total deferred tax assets | 73,563 | 47,895 | |||||
Deferred tax liabilities | |||||||
Property and equipment | (13,593 | ) | (16,925 | ) | |||
Goodwill and intangible assets | (73,074 | ) | (68,635 | ) | |||
Investment in unconsolidated subsidiary | (10,000 | ) | (10,764 | ) | |||
Unremitted non-U.S. earnings | (740 | ) | (740 | ) | |||
Prepaid expenses and other | (1,490 | ) | (1,151 | ) | |||
Total deferred tax liabilities | (98,897 | ) | (98,215 | ) | |||
Net deferred tax liabilities | $ | (25,334 | ) | $ | (50,320 | ) | |
At December 31, 2016, the Company had $59.7 million U.S. net operating loss carryforwards and $3.6 million state net operating losses. The losses will expire no later than 2036 if they are not utilized prior to that date. The Company intends to elect to carry the current U.S. net operating loss back to recover taxes paid in earlier periods to the extent eligible. As a result, a tax benefit of $32.8 million was classified as a current income tax receivable, and is not included in the $59.7 million U.S. net operating carryforward. The Company also had $21.6 million of non-U.S. net operating loss carryforwards with indefinite expiration dates. The Company anticipates being able to fully utilize the losses prior to their expiration. Where the Company has unrecognized tax benefits in jurisdictions with existing net operating losses, the Company utilizes the unrecognized tax benefits as a source of income to offset such losses.
At December 31, 2016, the Company had $5.1 million of foreign tax credit carryforwards which will generally expire no later than 2025. The Company anticipates being able to fully utilize the foreign tax credits prior to their expiration.
Goodwill from certain acquisitions is tax deductible due to the acquisition structure as an asset purchase or due to tax elections made by the Company and the respective sellers at the time of acquisition.
The Company believes that it is more likely than not that deferred tax assets at December 31, 2016 and 2015 will be utilized to offset future taxable income and the reversal of taxable temporary differences. Consequently, no valuation allowance has been recorded in the financial statements.
77
Forum Energy Technologies, Inc. and subsidiaries
Notes to consolidated financial statements (continued)
Taxes are provided as necessary with respect to non-U.S. earnings that are not permanently reinvested. For all other non-U.S. earnings, no U.S. taxes are provided because such earnings are intended to be reinvested indefinitely to finance non-U.S. activities. The determination of the amount of the unrecognized deferred tax liability for temporary differences related to investments in non-US subsidiaries is not practicable.
The Company files income tax returns in the U.S. as well as in various states and non-U.S. jurisdictions. With few exceptions, the Company is no longer subject to income tax examination by tax authorities in these jurisdictions prior to 2010.
The Company accounts for uncertain tax positions in accordance with guidance in FASB ASC 740, which prescribes the minimum recognition threshold a tax position taken or expected to be taken in a tax return is required to meet before being recognized in the financial statements. A reconciliation of the beginning and ending amount of uncertain tax positions is as follows (in thousands):
Balance at January 1, 2016 | $ | 8,410 | ||
Additional based on tax positions related to prior years | 1,785 | |||
Additional based on tax positions related to current year | 6,103 | |||
Reduction based on tax positions related to prior years | — | |||
Lapse of statute of limitations | (2,078 | ) | ||
Balance at December 31, 2016 | 14,220 | |||
Deferred tax benefits on uncertain tax position related to U.S. and non-U.S. income tax | — | |||
Net balance at December 31, 2016 | $ | 14,220 | ||
The total amount of unrecognized tax benefits at December 31, 2016 was $14.2 million, of which it is reasonably possible that $1.3 million could be settled during the next twelve-month period as a result of the conclusion of various tax audits or due to the expiration of the applicable statute of limitations. Substantially all of the unrecognized tax benefits at December 31, 2016 would impact the Company’s future effective income tax rate, if recognized.
The Company recognizes interest and penalties related to uncertain tax positions within the provision for income taxes in the consolidated statement of income. As of December 31, 2016 and 2015, we had accrued approximately $0.5 million and $0.4 million, respectively, in interest and penalties. During the years ended December 31, 2016 and 2015, we recognized no material change in the interest and penalties related to uncertain tax positions.
10. Fair value measurements
At December 31, 2016, the Company had no debt outstanding under the Amended Credit Facility and all of the debt under this facility incurs interest at a variable interest rate and therefore, the carrying amount approximates fair value. The fair value of the debt is classified as a Level 2 measurement because interest rates charged are similar to other financial instruments with similar terms and maturities.
The fair value of the Company’s Senior Notes is estimated using Level 2 inputs in the fair value hierarchy and is based on quoted prices for those or similar instruments. At December 31, 2016, the fair value and the carrying value of the Company’s unsecured Senior Notes each approximated $402.0 million. At December 31, 2015, the fair value and the carrying value of the Company’s Senior Notes approximated $334.1 million and $402.5 million, respectively.
There were no other outstanding financial instruments as of December 31, 2016 and 2015 that required measuring the amounts at fair value on a recurring basis. The Company did not change its valuation techniques associated with recurring fair value measurements from prior periods and there were no transfers between levels of the fair value hierarchy during the year ended December 31, 2016.
78
Forum Energy Technologies, Inc. and subsidiaries
Notes to consolidated financial statements (continued)
11. Commitments and contingencies
Litigation
In the ordinary course of business, the Company is, and in the future, could be involved in various pending or threatened legal actions, some of which may or may not be covered by insurance. Management has reviewed such pending judicial and legal proceedings, the reasonably anticipated costs and expenses in connection with such proceedings, and the availability and limits of insurance coverage, and has established reserves that are believed to be appropriate in light of those outcomes that are believed to be probable and can be estimated. The reserves accrued at December 31, 2016 and 2015 are immaterial. In the opinion of management, the Company's ultimate liability, if any, with respect to these actions is not expected to have a material adverse effect on the Company’s financial position, results of operations or cash flows.
Asbestos litigation
One of our subsidiaries has been named as one of many defendants in a number of product liability claims for alleged exposure to asbestos. These lawsuits are typically filed on behalf of plaintiffs who allege exposure to asbestos, against numerous defendants, often 40 or more, who may have manufactured or distributed products containing asbestos. The injuries alleged by plaintiffs in these cases range from mesothelioma and other cancers to asbestosis. The earliest claims against our subsidiary were filed in New Jersey in 1998, and our subsidiary currently has active cases in Missouri, New Jersey, New York, and Illinois. These complaints do not typically include requests for a specific amount of damages. The trademark for the product line with asbestos exposure was acquired in 1985. Our subsidiary has been successful in obtaining dismissals in many lawsuits where the exposure is alleged to have occurred prior to our acquisition of the trademark. The law in some states does not find purchasers of product lines to have tort liability for incidents occurring prior to the acquisition date unless they assumed the responsibility or in certain other circumstances. The law in certain other states on so called “successor liability” may be different or ambiguous in this regard. Most claimants alleging illnesses due to asbestos sue on the basis of exposure prior to 1985, as by that date the hazards of asbestos exposure were well known and asbestos had begun to fall into disuse in industrial settings. To date, asbestos claims have not had a material adverse effect on our business, financial condition, results of operations, or cash flow, as our annual out-of-pocket costs over the last five years has been less than $200,000. There are typically fewer than 100 cases filed against our subsidiary each year, and a similar number of cases are dismissed, settled or otherwise disposed of each year. We currently have fewer than 200 lawsuits pending against this subsidiary. Our subsidiary has over $17 million in face amount of insurance per occurrence and over $23 million of aggregate primary insurance coverage; a portion of the coverage has been eroded by payments made by insurers. In addition, our subsidiary has over $950 million in face amount of excess coverage applicable to the claims. There can be no guarantee that all of this can be collected due to policy terms and conditions and insurer insolvencies in the past or in the future. In January 2011, we entered into an agreement with seven of our primary insurers under which they have agreed to pay 80% of the costs of handling and settling each asbestos claim against the affected subsidiary. After an initial period, and under certain circumstances, our subsidiary and the subscribing insurers may withdraw from this agreement.
Portland Harbor Superfund litigation
In May 2009, one of the Company's subsidiaries (which is presently a dormant company with nominal assets except for rights under insurance policies) was named along with many defendants in a suit filed by the Port of Portland, Oregon seeking reimbursement of costs related to a five-year study of contaminated sediments at the port. In March 2010, the subsidiary also received a notice letter from the Environmental Protection Agency indicating that it had been identified as a potentially responsible party with respect to environmental contamination in the "study area" for the Portland Harbor Superfund Site. Under a 1997 indemnity agreement, the subsidiary is indemnified by a third party with respect to losses relating to environmental contamination. As required under the indemnity agreement, the subsidiary provided notice of these claims, and the indemnitor has assumed responsibility and is providing a defense of the claims. Although the Company believes that it is unlikely that the subsidiary contributed to the contamination at the Portland Harbor Superfund Site, the potential liability of the subsidiary and the ability of the indemnitor to fulfill its indemnity obligations cannot be quantified at this time.
79
Forum Energy Technologies, Inc. and subsidiaries
Notes to consolidated financial statements (continued)
Operating leases
The Company has operating leases for warehouse, office space, manufacturing facilities and equipment. The leases generally require the Company to pay certain expenses including taxes, insurance, maintenance, and utilities. The minimum future lease commitments under noncancelable leases in effect at December 31, 2016 are as follows:
2017 | $ | 15,455 | |
2018 | 12,526 | ||
2019 | 10,939 | ||
2020 | 8,988 | ||
2021 | 7,858 | ||
Thereafter | 10,253 | ||
$ | 66,019 | ||
Total rent expense was $18.6 million, $20.9 million and $20.8 million under operating leases for the years ended December 31, 2016, 2015 and 2014, respectively.
Letters of credit and guarantees
The Company executes letters of credit in the normal course of business to secure the delivery of product from specific vendors and also to guarantee the Company fulfilling certain performance obligations relating to certain large contracts. At December 31, 2016, the Company had $17.0 million in letters of credit.
12. Stockholders' equity and employee benefit plans
Equity offering
In December 2016, the Company offered and sold 4.0 million shares of the Company's common stock and raised $85.1 million in cash (net of expenses) pursuant to a public equity offering.
Employee benefit plans
The Company sponsors a 401(k) savings plan for US employees and related savings plans for certain non-US employees. These plans benefit eligible employees by allowing them the opportunity to make contributions up to certain limits. The Company contributes by matching a percentage of each employee's contributions. In 2015 and 2016, for certain plans, the Company suspended the matching of contributions. Subsequent to the closing of all acquisitions, employees of those acquired entities will generally be eligible to participate in the Company's 401(k) savings plan. The Company also has the discretion to provide a profit sharing contribution to each participant depending on the Company’s performance for the applicable year. The expense under the Company's plan was $1.4 million, $2.2 million, and $10.8 million for the years ended December 31, 2016, 2015 and 2014, respectively.
The Company has an Employee Stock Purchase Plan, which allows eligible employees to purchase shares of the Company's common stock at six-month intervals through periodic payroll deductions at a price per share equal to 85% of the lower of the fair market value at the beginning and ending of the six-month intervals.
Stock repurchases
In October 2014, the Board of Directors approved a share repurchase program for the repurchase of outstanding shares of the Company's common stock with an aggregate purchase price of up to $150.0 million. The Company has purchased approximately 4.5 million shares primarily in 2014 under this program for aggregate consideration of approximately $100.2 million. However, we recently amended our credit facility in 2016 which prohibits us from repurchasing shares.
80
Forum Energy Technologies, Inc. and subsidiaries
Notes to consolidated financial statements (continued)
13. Stock based compensation
FET share-based compensation plan
In August 2010 , the Company created the 2010 Stock Incentive Plan (the " 2010 Plan") to allow for employees, directors and consultants of the Company and its subsidiaries to maintain stock ownership in the Company through the award of stock options, restricted stock, restricted stock units or any combination thereof. Under the terms of the 2010 Plan, a total of 18.5 million shares were authorized for awards.
In May 2016, the Company created a new 2016 Stock Incentive Plan (the " 2016 Plan"). Under the terms of the 2016 Plan, the aggregate number of shares that may be issued may not exceed the number of shares reserved but not issued under the 2010 Plan as of May 17, 2016, the effective date of the 2016 plan, a total of 5.7 million shares. No further awards shall be made under the 2010 Plan after such date, and outstanding awards granted under the 2010 Plan shall continue to be outstanding. Approximately 5.6 million shares remained available under the 2016 Plan for future grants as of December 31, 2016.
The total amount of share-based compensation expense recorded was approximately $20.5 million, $21.7 million and $18.8 million for the years ended December 31, 2016, 2015 and 2014, respectively. As of December 31, 2016, the Company expects to record share-based compensation expense of approximately $30.1 million over the remaining term of the restricted stock and options of approximately two years. Future stock option grants will result in additional compensation expense.
Stock options
The exercise price of each option is based on the fair market value of the Company’s stock at the date of grant. Options generally have a ten-year life and vest annually in equal increments over three or four years. The Company’s policy for issuing stock upon a stock option exercise is to issue new shares. Compensation expense is generally recognized on a straight line basis over the vesting period. The following tables provide additional information related to the options:
2016 Activity | Number of shares (in thousands) | Weighted average exercise price | Remaining weighted average contractual life in years | Intrinsic value (in millions) | ||||||||
Beginning balance | 5,250.4 | $ | 12.94 | 5.7 | $ | 15.1 | ||||||
Granted | 818.6 | $ | 9.39 | — | ||||||||
Exercised | (151.3 | ) | $ | 11.31 | — | |||||||
Forfeited/expired | (46.6 | ) | $ | 20.93 | — | |||||||
Total outstanding | 5,871.1 | $ | 12.42 | 5.3 | $ | 59.1 | ||||||
Options exercisable | 4,403.4 | $ | 11.74 | 4.2 | $ | 45.2 | ||||||
The assumptions used in the Black-Scholes pricing model to estimate the fair value of the options granted in 2016, 2015 and 2014 are as follows:
2016 | 2015 | 2014 | |||
Weighted average fair value | $3.85 | $6.36 | $8.47 | ||
Assumptions | |||||
Expected life (in years) | 6.25 | 6.30 | 6.25 | ||
Volatility | 40% | 33% | 27% | ||
Dividend yield | —% | —% | —% | ||
Risk free interest rate | 1.40% | 1.81% | 1.96% | ||
The intrinsic value of the options exercised was $1.3 million in 2016, $3.9 million in 2015 and $24.8 million 2014. The intrinsic value is the amount by which the fair value of the underlying share exceeds the exercise price of an option.
81
Forum Energy Technologies, Inc. and subsidiaries
Notes to consolidated financial statements (continued)
Restricted stock
Restricted stock generally vests over a three or four year period from the date of grant. Further information about the restricted stock follows (shares in thousands):
2016 Activity | ||
Nonvested at beginning of year | 204.2 | |
Granted | 397.2 | |
Vested | (174.1 | ) |
Forfeited | (9.5 | ) |
Nonvested at the end of year | 417.8 | |
The weighted average grant date fair value of the restricted stock was $10.28, $18.87 and $31.71 per share during the years ended December 31, 2016, 2015, and 2014, respectively. The total fair value of shares vested was $3.9 million during 2016, $5.1 million during 2015 and $10.9 million during 2014.
Restricted stock units
Restricted stock units generally vest over a four year period from the date of grant. Further information about the restricted stock units follows (shares in thousands):
Restricted stock units | ||
2016 Activity | ||
Nonvested at beginning of year | 1,212.2 | |
Granted | 1,075.8 | |
Vested | (363.8 | ) |
Forfeited | (159.1 | ) |
Nonvested at the end of year | 1,765.1 | |
The weighted average grant date fair value of the restricted stock units was $9.74, $18.06 and $27.81 per share during the years ended December 31, 2016, 2015, and 2014, respectively. The total fair value of units vested was $8.4 million, $6.7 million, and $3.0 million during 2016, 2015, and 2014 .
Performance share awards
During 2016, the Company granted 257,900 performance share awards with service-vesting and market-vesting conditions. These awards may settle between zero and two shares of the Company's common stock. The number of shares issued pursuant to the performance share awards will be determined based on the total shareholder return of the Company's common stock as compared to a group of peer companies, measured annually over a one year, two year, and three-year performance period.
14. Related party transactions
The Company has sold and purchased inventory, services and fixed assets to and from various affiliates of certain directors. The dollar amounts related to these related party activities are not significant to the Company’s consolidated financial statements.
82
Forum Energy Technologies, Inc. and subsidiaries
Notes to consolidated financial statements (continued)
15. Business segments
Beginning with the first quarter of 2016, the Company realigned its segments. Several product lines were combined into a new segment, designated as the Completions segment, in recognition of the expanded operations and their significant growth potential. The Company is reporting its results of operations in the following three reportable segments: Drilling & Subsea , Completions and Production & Infrastructure, instead of the original two reportable segments. Management’s change in the composition of the Company’s reporting segments was made in order to align with activity drivers and the customers of our product group, and how management reviews and evaluates operating performance. This change is reflected on a retrospective basis in accordance with GAAP.
The Drilling & Subsea segment designs, manufactures and supplies products and provides related services to the drilling and subsea construction and services markets. The Completions segment designs, manufactures and supplies products and provides related services to the well construction, completion, stimulation, and intervention markets. The Production & Infrastructure segment designs, manufactures and supplies products, and provides related equipment and services for production and infrastructure markets.
The Company’s reportable segments are strategic units that offer distinct products and services. They are managed separately since each business segment requires different marketing strategies. Operating segments have not been aggregated as part of a reportable segment. The Company evaluates the performance of its reportable segments based on operating income. This segmentation is representative of the manner in which our Chief Operating Decision Maker and our Board of Directors view the business. We consider the Chief Operating Decision Maker to be the Chief Executive Officer.
83
Forum Energy Technologies, Inc. and subsidiaries
Notes to consolidated financial statements (continued)
The amounts indicated below as "Corporate" relate to costs and assets not allocated to the reportable segments. Summary financial data by segment follows (in thousands):
Year ended December 31, | ||||||||||||
2016 | 2015 | 2014 | ||||||||||
Net sales: | ||||||||||||
Drilling & Subsea | $ | 227,872 | $ | 487,299 | $ | 864,320 | ||||||
Completions | 127,432 | 267,236 | 441,345 | |||||||||
Production & Infrastructure | 233,754 | 320,442 | 436,271 | |||||||||
Intersegment eliminations | (1,423 | ) | (1,325 | ) | (2,219 | ) | ||||||
Total net sales | $ | 587,635 | $ | 1,073,652 | $ | 1,739,717 | ||||||
Operating income (loss): | ||||||||||||
Drilling & Subsea | $ | (53,589 | ) | $ | 6,890 | $ | 131,072 | |||||
Completions | (45,075 | ) | 11,124 | 126,590 | ||||||||
Production & Infrastructure | 655 | 22,658 | 56,148 | |||||||||
Corporate | (27,440 | ) | (28,077 | ) | (42,015 | ) | ||||||
Total segment operating income (loss) | (125,449 | ) | 12,595 | 271,795 | ||||||||
Intangible asset and goodwill impairment | — | 125,092 | — | |||||||||
Transaction expenses | 865 | 480 | 2,326 | |||||||||
(Gain)/loss on sale of assets | 2,638 | 746 | 1,431 | |||||||||
Income (loss) from operations | $ | (128,952 | ) | $ | (113,723 | ) | $ | 268,038 | ||||
Depreciation and amortization | ||||||||||||
Drilling & Subsea | $ | 27,765 | $ | 33,348 | $ | 36,148 | ||||||
Completions | 23,405 | 24,317 | 20,135 | |||||||||
Production & Infrastructure | 4,935 | 7,377 | 7,856 | |||||||||
Corporate | 5,655 | 641 | 933 | |||||||||
Total depreciation and amortization | $ | 61,760 | $ | 65,683 | $ | 65,072 | ||||||
Capital expenditures | ||||||||||||
Drilling & Subsea | $ | 7,822 | $ | 13,803 | $ | 22,891 | ||||||
Completions | 2,509 | 8,401 | 19,942 | |||||||||
Production & Infrastructure | 1,953 | 3,102 | 4,569 | |||||||||
Corporate | 4,544 | 6,985 | 6,390 | |||||||||
Total capital expenditures | $ | 16,828 | $ | 32,291 | $ | 53,792 | ||||||
A summary of consolidated assets by reportable segment is as follows (in thousands):
As of December 31, | ||||||||||||
Assets | 2016 | 2015 | 2014 | |||||||||
Drilling & Subsea | $ | 786,455 | $ | 912,324 | $ | 1,204,416 | ||||||
Completions | 675,987 | 728,745 | 726,972 | |||||||||
Production & Infrastructure | 175,940 | 187,741 | 231,771 | |||||||||
Corporate | 196,810 | 57,232 | 50,943 | |||||||||
Total assets | $ | 1,835,192 | $ | 1,886,042 | $ | 2,214,102 | ||||||
Corporate assets include primarily deferred tax assets and deferred loan costs.
84
Forum Energy Technologies, Inc. and subsidiaries
Notes to consolidated financial statements (continued)
Net sales by shipping destination and long-lived assets by country were as follows (in thousands):
Year ended December 31, | ||||||||||||||||||
Net sales: | 2016 | 2015 | 2014 | |||||||||||||||
$ | % | $ | % | $ | % | |||||||||||||
United States | $ | 361,941 | 61.7 | % | $ | 646,928 | 60.3 | % | $ | 1,049,609 | 60.3 | % | ||||||
Europe & Africa | 77,847 | 13.2 | % | 188,414 | 17.5 | % | 305,376 | 17.6 | % | |||||||||
Asia-Pacific | 51,880 | 8.8 | % | 69,923 | 6.5 | % | 154,669 | 8.9 | % | |||||||||
Middle East | 25,975 | 4.4 | % | 59,680 | 5.6 | % | 65,498 | 3.8 | % | |||||||||
Canada | 42,520 | 7.2 | % | 57,837 | 5.4 | % | 103,077 | 5.9 | % | |||||||||
Latin America | 27,472 | 4.7 | % | 50,870 | 4.7 | % | 61,488 | 3.5 | % | |||||||||
Total net sales | $ | 587,635 | 100.0 | % | $ | 1,073,652 | 100.0 | % | $ | 1,739,717 | 100.0 | % | ||||||
As of December 31, | ||||||||||||
Long-lived assets: | 2016 | 2015 | 2014 | |||||||||
United States | $ | 809,545 | $ | 869,388 | $ | 932,173 | ||||||
Europe & Africa | 184,768 | 202,852 | 313,589 | |||||||||
Canada | 79,403 | 83,688 | 59,207 | |||||||||
Asia-Pacific | 7,855 | 8,192 | 9,132 | |||||||||
Middle East | 3,175 | 3,189 | 3,192 | |||||||||
Latin America | 730 | 921 | 1,650 | |||||||||
Total long-lived assets | $ | 1,085,476 | $ | 1,168,230 | $ | 1,318,943 | ||||||
Net sales by product lines were as follows (in thousands):
Year ended December 31, | ||||||||||||||||||
Net sales: | 2016 | 2015 | 2014 | |||||||||||||||
$ | % | $ | % | $ | % | |||||||||||||
Drilling Technologies | $ | 139,458 | 23.7 | % | $ | 298,209 | 27.7 | % | $ | 543,281 | 31.1 | % | ||||||
Subsea Technologies | 88,414 | 15.0 | % | 189,090 | 17.6 | % | 321,039 | 18.5 | % | |||||||||
Downhole Technologies | 55,191 | 9.4 | % | 106,532 | 9.9 | % | 190,771 | 11.0 | % | |||||||||
Stimulation and Intervention | 72,241 | 12.3 | % | 160,704 | 15.0 | % | 250,574 | 14.4 | % | |||||||||
Production Equipment | 77,166 | 13.1 | % | 145,927 | 13.6 | % | 228,815 | 13.2 | % | |||||||||
Valve Solutions | 156,588 | 26.6 | % | 174,515 | 16.3 | % | 207,456 | 11.9 | % | |||||||||
Eliminations | (1,423 | ) | (0.1 | )% | (1,325 | ) | (0.1 | )% | (2,219 | ) | (0.1 | )% | ||||||
Total net sales | $ | 587,635 | 100.0 | % | $ | 1,073,652 | 100.0 | % | $ | 1,739,717 | 100.0 | % | ||||||
85
Forum Energy Technologies, Inc. and subsidiaries
Notes to consolidated financial statements (continued)
16. Condensed consolidating financial statements
The Senior Notes are guaranteed by our domestic subsidiaries which are 100% owned, directly or indirectly, by the Company. The guarantees are full and unconditional, joint and several and on an unsecured basis.
Condensed consolidating statements of operations and comprehensive income (loss) | ||||||||||||||||||||
December 31, 2016 | ||||||||||||||||||||
FET (Parent) | Guarantor Subsidiaries | Non-Guarantor Subsidiaries | Eliminations | Consolidated | ||||||||||||||||
(in thousands) | ||||||||||||||||||||
Net sales | $ | — | $ | 436,785 | $ | 198,684 | $ | (47,834 | ) | $ | 587,635 | |||||||||
Cost of sales | — | 375,509 | 161,190 | (48,799 | ) | 487,900 | ||||||||||||||
Gross profit | — | 61,276 | 37,494 | 965 | 99,735 | |||||||||||||||
Operating expenses | ||||||||||||||||||||
Selling, general and administrative expenses | — | 187,974 | 39,034 | — | 227,008 | |||||||||||||||
Transaction expenses | — | 825 | 40 | — | 865 | |||||||||||||||
Loss on sale of assets | — | 2,616 | 22 | — | 2,638 | |||||||||||||||
Total operating expenses | — | 191,415 | 39,096 | — | 230,511 | |||||||||||||||
Earnings (loss) from equity investment | — | 1,824 | — | — | 1,824 | |||||||||||||||
Equity earnings from affiliate, net of tax | (62,180 | ) | 14,663 | — | 47,517 | — | ||||||||||||||
Operating income (loss) | (62,180 | ) | (113,652 | ) | (1,602 | ) | 48,482 | (128,952 | ) | |||||||||||
Other expense (income) | ||||||||||||||||||||
Interest expense | 27,480 | (110 | ) | 40 | — | 27,410 | ||||||||||||||
Foreign exchange (gains) losses and other, net | — | (5,264 | ) | (16,077 | ) | — | (21,341 | ) | ||||||||||||
Deferred loan costs written off | 2,978 | — | — | — | 2,978 | |||||||||||||||
Total other expense (income) | 30,458 | (5,374 | ) | (16,037 | ) | — | 9,047 | |||||||||||||
Income (loss) before income taxes | (92,638 | ) | (108,278 | ) | 14,435 | 48,482 | (137,999 | ) | ||||||||||||
Provision for income tax expense (benefit) | (10,660 | ) | (46,098 | ) | 707 | — | (56,051 | ) | ||||||||||||
Net income (loss) | (81,978 | ) | (62,180 | ) | 13,728 | 48,482 | (81,948 | ) | ||||||||||||
Less: Loss attributable to noncontrolling interest | — | — | 30 | — | 30 | |||||||||||||||
Net income (loss) attributable to common stockholders | (81,978 | ) | (62,180 | ) | 13,698 | 48,482 | (81,978 | ) | ||||||||||||
Other comprehensive income (loss), net of tax: | ||||||||||||||||||||
Net income (loss) | (81,978 | ) | (62,180 | ) | 13,728 | 48,482 | (81,948 | ) | ||||||||||||
Change in foreign currency translation, net of tax of $0 | (45,722 | ) | (45,722 | ) | (45,722 | ) | 91,444 | (45,722 | ) | |||||||||||
Change in pension liability | (335 | ) | (335 | ) | (335 | ) | 670 | (335 | ) | |||||||||||
Comprehensive income (loss) | (128,035 | ) | (108,237 | ) | (32,329 | ) | 140,596 | (128,005 | ) | |||||||||||
Less: comprehensive (income) loss attributable to noncontrolling interests | — | — | (162 | ) | — | (162 | ) | |||||||||||||
Comprehensive income (loss) attributable to common stockholders | $ | (128,035 | ) | $ | (108,237 | ) | $ | (32,491 | ) | $ | 140,596 | $ | (128,167 | ) | ||||||
86
Forum Energy Technologies, Inc. and subsidiaries
Notes to consolidated financial statements (continued)
Condensed consolidating statements of operations and comprehensive income (loss) | ||||||||||||||||||||
December 31, 2015 | ||||||||||||||||||||
FET (Parent) | Guarantor Subsidiaries | Non-Guarantor Subsidiaries | Eliminations | Consolidated | ||||||||||||||||
(in thousands) | ||||||||||||||||||||
Net sales | $ | — | $ | 810,890 | $ | 369,186 | $ | (106,424 | ) | $ | 1,073,652 | |||||||||
Cost of sales | — | 646,076 | 269,900 | (105,001 | ) | 810,975 | ||||||||||||||
Gross profit | — | 164,814 | 99,286 | (1,423 | ) | 262,677 | ||||||||||||||
Operating expenses | ||||||||||||||||||||
Selling, general and administrative expenses | — | 201,904 | 63,002 | — | 264,906 | |||||||||||||||
Goodwill and intangible assets impairment | — | 57,392 | 67,700 | — | 125,092 | |||||||||||||||
Transaction expenses | — | 480 | — | — | 480 | |||||||||||||||
(Gain) loss on sale of assets | — | 943 | (197 | ) | — | 746 | ||||||||||||||
Total operating expenses | — | 260,719 | 130,505 | — | 391,224 | |||||||||||||||
Earnings from equity investment | — | 14,824 | — | — | 14,824 | |||||||||||||||
Equity earnings from affiliate, net of tax | (99,908 | ) | (28,419 | ) | — | 128,327 | — | |||||||||||||
Operating income (loss) | (99,908 | ) | (109,500 | ) | (31,219 | ) | 126,904 | (113,723 | ) | |||||||||||
Other expense (income) | ||||||||||||||||||||
Interest expense | 29,914 | 10 | 21 | — | 29,945 | |||||||||||||||
Foreign exchange (gains) losses and other, net | — | (479 | ) | (8,866 | ) | — | (9,345 | ) | ||||||||||||
Total other expense (income) | 29,914 | (469 | ) | (8,845 | ) | — | 20,600 | |||||||||||||
Income (loss) before income taxes | (129,822 | ) | (109,031 | ) | (22,374 | ) | 126,904 | (134,323 | ) | |||||||||||
Provision (benefit) for income tax expense | (10,469 | ) | (9,123 | ) | 4,653 | — | (14,939 | ) | ||||||||||||
Net income (loss) | (119,353 | ) | (99,908 | ) | (27,027 | ) | 126,904 | (119,384 | ) | |||||||||||
Less: Loss attributable to noncontrolling interest | — | — | (31 | ) | — | (31 | ) | |||||||||||||
Net income (loss) attributable to common stockholders | (119,353 | ) | (99,908 | ) | (26,996 | ) | 126,904 | (119,353 | ) | |||||||||||
Other comprehensive income (loss), net of tax: | ||||||||||||||||||||
Net income (loss) | (119,353 | ) | (99,908 | ) | (27,027 | ) | 126,904 | (119,384 | ) | |||||||||||
Change in foreign currency translation, net of tax of $0 | (45,270 | ) | (45,270 | ) | (45,270 | ) | 90,540 | (45,270 | ) | |||||||||||
Change in pension liability | 46 | 46 | 46 | (92 | ) | 46 | ||||||||||||||
Comprehensive income (loss) | (164,577 | ) | (145,132 | ) | (72,251 | ) | 217,352 | (164,608 | ) | |||||||||||
Less: comprehensive (income) loss attributable to noncontrolling interests | — | — | 168 | — | 168 | |||||||||||||||
Comprehensive income (loss) attributable to common stockholders | $ | (164,577 | ) | $ | (145,132 | ) | $ | (72,083 | ) | $ | 217,352 | $ | (164,440 | ) | ||||||
87
Forum Energy Technologies, Inc. and subsidiaries
Notes to consolidated financial statements (continued)
Condensed consolidating statements of operations and comprehensive income | ||||||||||||||||||||
December 31, 2014 | ||||||||||||||||||||
FET (Parent) | Guarantor Subsidiaries | Non-Guarantor Subsidiaries | Eliminations | Consolidated | ||||||||||||||||
(in thousands) | ||||||||||||||||||||
Net sales | $ | — | $ | 1,266,376 | $ | 637,205 | $ | (163,864 | ) | $ | 1,739,717 | |||||||||
Cost of sales | — | 887,428 | 453,785 | (160,948 | ) | 1,180,265 | ||||||||||||||
Gross profit | — | 378,948 | 183,420 | (2,916 | ) | 559,452 | ||||||||||||||
Operating expenses | ||||||||||||||||||||
Selling, general and administrative expenses | — | 244,577 | 68,244 | — | 312,821 | |||||||||||||||
Other operating expense | — | 3,564 | 193 | — | 3,757 | |||||||||||||||
Total operating expenses | — | 248,141 | 68,437 | — | 316,578 | |||||||||||||||
Earnings (loss) from equity investment | — | 25,164 | — | — | 25,164 | |||||||||||||||
Equity earnings from affiliate, net of tax | 193,724 | 90,067 | — | (283,791 | ) | — | ||||||||||||||
Operating income | 193,724 | 246,038 | 114,983 | (286,707 | ) | 268,038 | ||||||||||||||
Other expense (income) | ||||||||||||||||||||
Interest expense | 29,783 | 78 | (14 | ) | — | 29,847 | ||||||||||||||
Interest income with affiliate | — | (5,770 | ) | — | 5,770 | — | ||||||||||||||
Interest expense with affiliate | — | — | 5,770 | (5,770 | ) | — | ||||||||||||||
Foreign exchange (gains) losses and other, net | — | 116 | (4,447 | ) | — | (4,331 | ) | |||||||||||||
Total other expense (income) | 29,783 | (5,576 | ) | 1,309 | — | 25,516 | ||||||||||||||
Income before income taxes | 163,941 | 251,614 | 113,674 | (286,707 | ) | 242,522 | ||||||||||||||
Provision for income tax expense | (10,424 | ) | 57,890 | 20,679 | — | 68,145 | ||||||||||||||
Net income | 174,365 | 193,724 | 92,995 | (286,707 | ) | 174,377 | ||||||||||||||
Less: Income attributable to noncontrolling interest | — | — | 12 | — | 12 | |||||||||||||||
Net income attributable to common stockholders | 174,365 | 193,724 | 92,983 | (286,707 | ) | 174,365 | ||||||||||||||
Other comprehensive income, net of tax: | ||||||||||||||||||||
Net income | 174,365 | 193,724 | 92,995 | (286,707 | ) | 174,377 | ||||||||||||||
Change in foreign currency translation, net of tax of $0 | (43,694 | ) | (43,694 | ) | (43,694 | ) | 87,388 | (43,694 | ) | |||||||||||
Change in pension liability | (1,110 | ) | (1,110 | ) | (1,110 | ) | 2,220 | (1,110 | ) | |||||||||||
Comprehensive income | 129,561 | 148,920 | 48,191 | (197,099 | ) | 129,573 | ||||||||||||||
Less: comprehensive (income) loss attributable to noncontrolling interests | — | — | 46 | — | 46 | |||||||||||||||
Comprehensive income attributable to common stockholders | $ | 129,561 | $ | 148,920 | $ | 48,237 | $ | (197,099 | ) | $ | 129,619 | |||||||||
88
Forum Energy Technologies, Inc. and subsidiaries
Notes to consolidated financial statements (continued)
Condensed consolidating balance sheets | ||||||||||||||||||||
December 31, 2016 | ||||||||||||||||||||
FET (Parent) | Guarantor Subsidiaries | Non-Guarantor Subsidiaries | Eliminations | Consolidated | ||||||||||||||||
(in thousands) | ||||||||||||||||||||
Assets | ||||||||||||||||||||
Current assets | ||||||||||||||||||||
Cash and cash equivalents | $ | 65 | $ | 143,275 | $ | 91,082 | $ | — | $ | 234,422 | ||||||||||
Accounts receivable—trade, net | — | 77,229 | 28,039 | — | 105,268 | |||||||||||||||
Inventories | — | 269,036 | 77,987 | (8,440 | ) | 338,583 | ||||||||||||||
Income tax receivable | — | 32,801 | — | — | 32,801 | |||||||||||||||
Cost and profits in excess of billings | — | 4,477 | 4,722 | — | 9,199 | |||||||||||||||
Other current assets | — | 21,013 | 8,430 | — | 29,443 | |||||||||||||||
Total current assets | 65 | 547,831 | 210,260 | (8,440 | ) | 749,716 | ||||||||||||||
Property and equipment, net of accumulated depreciation | — | 127,094 | 25,118 | — | 152,212 | |||||||||||||||
Deferred financing costs, net | 1,112 | — | — | — | 1,112 | |||||||||||||||
Deferred income taxes, net | — | — | 851 | — | 851 | |||||||||||||||
Intangibles | — | 166,437 | 49,981 | — | 216,418 | |||||||||||||||
Goodwill | — | 481,374 | 171,369 | — | 652,743 | |||||||||||||||
Investment in unconsolidated subsidiary | — | 59,140 | — | — | 59,140 | |||||||||||||||
Investment in affiliates | 1,080,337 | 460,166 | — | (1,540,503 | ) | — | ||||||||||||||
Long-term loan and advances to affiliates | 557,061 | — | 71,057 | (628,118 | ) | — | ||||||||||||||
Other long-term assets | — | 2,322 | 678 | — | 3,000 | |||||||||||||||
Total assets | $ | 1,638,575 | $ | 1,844,364 | $ | 529,314 | $ | (2,177,061 | ) | $ | 1,835,192 | |||||||||
Liabilities and equity | ||||||||||||||||||||
Current liabilities | ||||||||||||||||||||
Current portion of long-term debt | $ | — | $ | 23 | $ | 101 | $ | — | $ | 124 | ||||||||||
Accounts payable—trade | — | 59,261 | 14,514 | — | 73,775 | |||||||||||||||
Accrued liabilities | 6,708 | 40,630 | 8,266 | — | 55,604 | |||||||||||||||
Deferred revenue | — | 1,206 | 7,132 | — | 8,338 | |||||||||||||||
Billings in excess of costs and profits recognized | — | 1,799 | 2,205 | — | 4,004 | |||||||||||||||
Total current liabilities | 6,708 | 102,919 | 32,218 | — | 141,845 | |||||||||||||||
Long-term debt, net of current portion | 396,665 | — | 82 | — | 396,747 | |||||||||||||||
Long-term loans and payables to affiliates | — | 628,118 | — | (628,118 | ) | — | ||||||||||||||
Deferred income taxes, net | — | 17,650 | 8,535 | — | 26,185 | |||||||||||||||
Other long-term liabilities | — | 15,340 | 19,314 | — | 34,654 | |||||||||||||||
Total liabilities | 403,373 | 764,027 | 60,149 | (628,118 | ) | 599,431 | ||||||||||||||
Total stockholder's equity | 1,235,202 | 1,080,337 | 468,606 | (1,548,943 | ) | 1,235,202 | ||||||||||||||
Noncontrolling interest in subsidiary | — | — | 559 | — | 559 | |||||||||||||||
Equity | 1,235,202 | 1,080,337 | 469,165 | (1,548,943 | ) | 1,235,761 | ||||||||||||||
Total liabilities and equity | $ | 1,638,575 | $ | 1,844,364 | $ | 529,314 | $ | (2,177,061 | ) | $ | 1,835,192 | |||||||||
89
Forum Energy Technologies, Inc. and subsidiaries
Notes to consolidated financial statements (continued)
Condensed consolidating balance sheets | ||||||||||||||||||||
December 31, 2015 | ||||||||||||||||||||
FET (Parent) | Guarantor Subsidiaries | Non-Guarantor Subsidiaries | Eliminations | Consolidated | ||||||||||||||||
(in thousands) | ||||||||||||||||||||
Assets | ||||||||||||||||||||
Current assets | ||||||||||||||||||||
Cash and cash equivalents | $ | — | $ | 36,884 | $ | 72,365 | $ | — | $ | 109,249 | ||||||||||
Accounts receivable—trade, net | — | 85,537 | 53,060 | — | 138,597 | |||||||||||||||
Inventories | — | 318,360 | 115,165 | (9,404 | ) | 424,121 | ||||||||||||||
Cost and profits in excess of billings | — | 6,477 | 5,532 | — | 12,009 | |||||||||||||||
Other current assets | — | 25,447 | 8,389 | — | 33,836 | |||||||||||||||
Total current assets | — | 472,705 | 254,511 | (9,404 | ) | 717,812 | ||||||||||||||
Property and equipment, net of accumulated depreciation | — | 153,995 | 32,672 | — | 186,667 | |||||||||||||||
Deferred financing costs, net | 4,125 | — | — | — | 4,125 | |||||||||||||||
Deferred income taxes, net | — | — | 780 | — | 780 | |||||||||||||||
Intangibles | — | 186,234 | 60,416 | — | 246,650 | |||||||||||||||
Goodwill | — | 481,374 | 187,662 | — | 669,036 | |||||||||||||||
Investment in unconsolidated subsidiary | — | 57,719 | — | — | 57,719 | |||||||||||||||
Investment in affiliates | 1,188,707 | 514,893 | — | (1,703,600 | ) | — | ||||||||||||||
Long-term advances to affiliates | 467,184 | — | 60,221 | (527,405 | ) | — | ||||||||||||||
Other long-term assets | — | 2,549 | 704 | — | 3,253 | |||||||||||||||
Total assets | $ | 1,660,016 | $ | 1,869,469 | $ | 596,966 | $ | (2,240,409 | ) | $ | 1,886,042 | |||||||||
Liabilities and equity | ||||||||||||||||||||
Current liabilities | ||||||||||||||||||||
Current portion of long-term debt | $ | — | $ | 243 | $ | 10 | $ | — | $ | 253 | ||||||||||
Accounts payable—trade | — | 57,529 | 19,294 | — | 76,823 | |||||||||||||||
Accrued liabilities | 7,026 | 40,875 | 10,662 | — | 58,563 | |||||||||||||||
Deferred revenue | — | 1,334 | 5,949 | — | 7,283 | |||||||||||||||
Billings in excess of cost and profit recognized | — | 1,872 | 6,759 | — | $ | 8,631 | ||||||||||||||
Total current liabilities | 7,026 | 101,853 | 42,674 | — | 151,553 | |||||||||||||||
Long-term debt, net of current portion | 395,970 | 34 | 12 | — | 396,016 | |||||||||||||||
Long-term payables to affiliates | — | 527,406 | — | (527,406 | ) | — | ||||||||||||||
Deferred income tax, net | $ | — | $ | 36,937 | $ | 14,163 | $ | — | 51,100 | |||||||||||
Other long-term liabilities | — | 14,533 | 15,423 | — | 29,956 | |||||||||||||||
Total liabilities | 402,996 | 680,763 | 72,272 | (527,406 | ) | 628,625 | ||||||||||||||
Total stockholder's equity | 1,257,020 | 1,188,706 | 524,297 | (1,713,003 | ) | 1,257,020 | ||||||||||||||
Noncontrolling interest in subsidiary | — | — | 397 | — | 397 | |||||||||||||||
Equity | 1,257,020 | 1,188,706 | 524,694 | (1,713,003 | ) | 1,257,417 | ||||||||||||||
Total liabilities and equity | $ | 1,660,016 | $ | 1,869,469 | $ | 596,966 | $ | (2,240,409 | ) | $ | 1,886,042 | |||||||||
90
Forum Energy Technologies, Inc. and subsidiaries
Notes to consolidated financial statements (continued)
Condensed consolidating statements of cash flows | ||||||||||||||||||||
Year ended December 31, 2016 | ||||||||||||||||||||
FET (Parent) | Guarantor Subsidiaries | Non-Guarantor Subsidiaries | Eliminations | Consolidated | ||||||||||||||||
(in thousands) | ||||||||||||||||||||
Cash flows from (used in) operating activities | $ | (16,882 | ) | $ | 31,055 | $ | 73,772 | $ | (23,203 | ) | $ | 64,742 | ||||||||
Cash flows from investing activities | ||||||||||||||||||||
Acquisition of businesses, net of cash acquired | — | (4,072 | ) | — | — | (4,072 | ) | |||||||||||||
Capital expenditures for property and equipment | — | (12,033 | ) | (4,795 | ) | — | (16,828 | ) | ||||||||||||
Long-term loans and advances to affiliates | (69,340 | ) | 12,912 | — | 56,428 | — | ||||||||||||||
Other | — | 9,442 | 321 | — | 9,763 | |||||||||||||||
Net cash provided by (used in) investing activities | (69,340 | ) | 6,249 | (4,474 | ) | 56,428 | (11,137 | ) | ||||||||||||
Cash flows from financing activities | ||||||||||||||||||||
Borrowings under credit facility | — | — | — | — | — | |||||||||||||||
Repayment of long-term debt | — | — | — | — | — | |||||||||||||||
Long-term loans and advances to affiliates | — | 69,340 | (12,912 | ) | (56,428 | ) | — | |||||||||||||
Dividend paid to affiliates | — | — | (23,203 | ) | 23,203 | — | ||||||||||||||
Repurchases of stock | (623 | ) | — | — | — | (623 | ) | |||||||||||||
Proceeds from stock issuance | 87,676 | — | — | — | 87,676 | |||||||||||||||
Other | (766 | ) | (253 | ) | 161 | — | (858 | ) | ||||||||||||
Net cash provided by (used in) financing activities | 86,287 | 69,087 | (35,954 | ) | (33,225 | ) | 86,195 | |||||||||||||
Effect of exchange rate changes on cash | — | — | (14,627 | ) | — | (14,627 | ) | |||||||||||||
Net increase (decrease) in cash and cash equivalents | 65 | 106,391 | 18,717 | — | 125,173 | |||||||||||||||
Cash and cash equivalents | ||||||||||||||||||||
Beginning of period | — | 36,884 | 72,365 | — | 109,249 | |||||||||||||||
End of period | $ | 65 | $ | 143,275 | $ | 91,082 | $ | — | $ | 234,422 | ||||||||||
91
Forum Energy Technologies, Inc. and subsidiaries
Notes to consolidated financial statements (continued)
Condensed consolidating statements of cash flows | ||||||||||||||||||||
Year ended December 31, 2015 | ||||||||||||||||||||
FET (Parent) | Guarantor Subsidiaries | Non-Guarantor Subsidiaries | Eliminations | Consolidated | ||||||||||||||||
(in thousands) | ||||||||||||||||||||
Cash flows from (used in) operating activities | $ | (17,306 | ) | $ | 112,629 | $ | 60,590 | $ | — | $ | 155,913 | |||||||||
Cash flows from investing activities | ||||||||||||||||||||
Acquisition of businesses, net of cash acquired | — | (60,836 | ) | — | — | (60,836 | ) | |||||||||||||
Capital expenditures for property and equipment | — | (23,035 | ) | (9,256 | ) | — | (32,291 | ) | ||||||||||||
Long-term loans and advances to affiliates | 38,019 | 41,755 | — | (79,774 | ) | — | ||||||||||||||
Other | — | 1,057 | 764 | — | 1,821 | |||||||||||||||
Net cash provided by (used in) investing activities | 38,019 | (41,059 | ) | (8,492 | ) | (79,774 | ) | (91,306 | ) | |||||||||||
Cash flows from financing activities | ||||||||||||||||||||
Borrowings under credit facility | 94,984 | — | — | — | 94,984 | |||||||||||||||
Repayment of long-term debt | (120,077 | ) | — | — | — | (120,077 | ) | |||||||||||||
Long-term loans and advances to affiliates | — | (38,019 | ) | (41,755 | ) | 79,774 | — | |||||||||||||
Repurchases of stock | (6,438 | ) | — | — | — | (6,438 | ) | |||||||||||||
Proceeds from stock issuance | 5,275 | — | — | — | 5,275 | |||||||||||||||
Other | (8 | ) | (673 | ) | — | — | (681 | ) | ||||||||||||
Net cash provided by (used in) financing activities | (26,264 | ) | (38,692 | ) | (41,755 | ) | 79,774 | (26,937 | ) | |||||||||||
Effect of exchange rate changes on cash | — | — | (5,000 | ) | — | (5,000 | ) | |||||||||||||
Net increase (decrease) in cash and cash equivalents | (5,551 | ) | 32,878 | 5,343 | — | 32,670 | ||||||||||||||
Cash and cash equivalents | ||||||||||||||||||||
Beginning of period | 5,551 | 4,006 | 67,022 | — | 76,579 | |||||||||||||||
End of period | $ | — | $ | 36,884 | $ | 72,365 | $ | — | $ | 109,249 | ||||||||||
92
Forum Energy Technologies, Inc. and subsidiaries
Notes to consolidated financial statements (continued)
Condensed consolidating statements of cash flows | ||||||||||||||||||||
Year ended December 31, 2014 | ||||||||||||||||||||
FET (Parent) | Guarantor Subsidiaries | Non-Guarantor Subsidiaries | Eliminations | Consolidated | ||||||||||||||||
(in thousands) | ||||||||||||||||||||
Cash flows from (used in) operating activities | $ | (16,796 | ) | $ | 175,700 | $ | 111,062 | $ | — | $ | 269,966 | |||||||||
Cash flows from investing activities | ||||||||||||||||||||
Acquisition of businesses, net of cash acquired | — | — | (38,289 | ) | — | (38,289 | ) | |||||||||||||
Capital expenditures for property and equipment | — | (42,334 | ) | (11,458 | ) | — | (53,792 | ) | ||||||||||||
Long-term loans and advances to affiliates | 191,290 | 34,010 | — | (225,300 | ) | — | ||||||||||||||
Other | — | 20,862 | 528 | — | 21,390 | |||||||||||||||
Net cash provided by (used in) investing activities | 191,290 | 12,538 | (49,219 | ) | (225,300 | ) | (70,691 | ) | ||||||||||||
Cash flows from financing activities | ||||||||||||||||||||
Borrowings under credit facility | 15,000 | 423 | — | — | 15,423 | |||||||||||||||
Repayment of long-term debt | (98,406 | ) | 124 | (133 | ) | — | (98,415 | ) | ||||||||||||
Long-term loans and advances to affiliates | — | (191,290 | ) | (34,010 | ) | 225,300 | — | |||||||||||||
Repurchase of stock | (96,632 | ) | — | — | — | (96,632 | ) | |||||||||||||
Proceeds from stock issuance | 11,101 | — | — | — | 11,101 | |||||||||||||||
Other | (6 | ) | 6,511 | — | — | 6,505 | ||||||||||||||
Net cash provided by (used in) financing activities | (168,943 | ) | (184,232 | ) | (34,143 | ) | 225,300 | (162,018 | ) | |||||||||||
Effect of exchange rate changes on cash | — | — | (260 | ) | — | (260 | ) | |||||||||||||
Net increase (decrease) in cash and cash equivalents | 5,551 | 4,006 | 27,440 | — | 36,997 | |||||||||||||||
Cash and cash equivalents | ||||||||||||||||||||
Beginning of period | — | — | 39,582 | — | 39,582 | |||||||||||||||
End of period | $ | 5,551 | $ | 4,006 | $ | 67,022 | $ | — | $ | 76,579 | ||||||||||
93
Forum Energy Technologies, Inc. and subsidiaries
Notes to consolidated financial statements (continued)
17. Quarterly results of operations (unaudited)
The following tables summarize the Company's results by quarter for the years ended December 31, 2016 and 2015. The quarterly results may not be comparable primarily due to acquisitions in 2016, 2015 and 2014. Refer to Note 3, Acquisitions, for further information.
2016 | |||||||||||||||
(in thousands, except per share information) | Q1 | Q2 | Q3 | Q4 | |||||||||||
Net sales | $ | 159,441 | $ | 142,723 | $ | 138,268 | $ | 147,203 | |||||||
Cost of sales | 124,884 | 137,442 | 108,984 | 116,590 | |||||||||||
Gross profit | 34,557 | 5,281 | 29,284 | 30,613 | |||||||||||
Total operating expenses | 60,147 | 58,375 | 55,920 | 56,069 | |||||||||||
Earnings from equity investment | 577 | 216 | 414 | 617 | |||||||||||
Operating income (loss) | (25,013 | ) | (52,878 | ) | (26,222 | ) | (24,839 | ) | |||||||
Total other expense | 8,341 | (3,229 | ) | 3,594 | 341 | ||||||||||
Income (loss) before income taxes | (33,354 | ) | (49,649 | ) | (29,816 | ) | (25,180 | ) | |||||||
Provision for income tax expense (benefit) | (10,406 | ) | (21,147 | ) | (11,821 | ) | (12,677 | ) | |||||||
Net income (loss) | (22,948 | ) | (28,502 | ) | (17,995 | ) | (12,503 | ) | |||||||
Less: loss attributable to noncontrolling interest | (5 | ) | 35 | (6 | ) | 6 | |||||||||
Net income (loss) attributable to common stockholders | $ | (22,943 | ) | $ | (28,537 | ) | $ | (17,989 | ) | $ | (12,509 | ) | |||
Weighted average shares outstanding | |||||||||||||||
Basic | 90,477 | 90,707 | 90,860 | 91,923 | |||||||||||
Diluted | 90,477 | 90,707 | 90,860 | 91,923 | |||||||||||
Earnings (loss) per share | |||||||||||||||
Basic | $ | (0.25 | ) | $ | (0.31 | ) | $ | (0.20 | ) | $ | (0.14 | ) | |||
Diluted | $ | (0.25 | ) | $ | (0.31 | ) | $ | (0.20 | ) | $ | (0.14 | ) | |||
94
Forum Energy Technologies, Inc. and subsidiaries
Notes to consolidated financial statements (continued)
2015 | |||||||||||||||
(in thousands, except per share information) | Q1 | Q2 | Q3 | Q4 | |||||||||||
Net sales | $ | 348,096 | $ | 284,415 | $ | 244,993 | $ | 196,148 | |||||||
Cost of sales | 238,970 | 199,532 | 179,231 | 193,242 | |||||||||||
Gross profit | 109,126 | 84,883 | 65,762 | 2,906 | |||||||||||
Total operating expenses (1) | 73,465 | 66,285 | 57,439 | 194,035 | |||||||||||
Earnings from equity investment | 4,571 | 3,840 | 3,870 | 2,543 | |||||||||||
Operating income (loss) | 40,232 | 22,438 | 12,193 | (188,586 | ) | ||||||||||
Total other expense | 971 | 11,662 | 4,543 | 3,424 | |||||||||||
Income (loss) before income taxes | 39,261 | 10,776 | 7,650 | (192,010 | ) | ||||||||||
Provision (benefit) for income tax expense | 10,605 | 1,911 | 932 | (28,387 | ) | ||||||||||
Net income (loss) | 28,656 | 8,865 | 6,718 | (163,623 | ) | ||||||||||
Less: Income (loss) attributable to noncontrolling interest | (16 | ) | (9 | ) | (2 | ) | (4 | ) | |||||||
Net income (loss) attributable to common stockholders | $ | 28,672 | $ | 8,874 | $ | 6,720 | $ | (163,619 | ) | ||||||
Weighted average shares outstanding | |||||||||||||||
Basic | 89,482 | 89,767 | 90,058 | 90,175 | |||||||||||
Diluted | 91,469 | 91,884 | 91,687 | 90,175 | |||||||||||
Earnings (loss) per share | |||||||||||||||
Basic | $ | 0.32 | $ | 0.10 | $ | 0.07 | $ | (1.81 | ) | ||||||
Diluted | $ | 0.31 | $ | 0.10 | $ | 0.07 | $ | (1.81 | ) | ||||||
(1) Total Operating expenses in Q4 included $125,092 goodwill and intangible assets impairment.
18. Subsequent event
On January 9, 2017, the Company acquired substantially all of the assets of Cooper Valves, LLC (“Cooper”) as well as 100% of the general partnership interests of Innovative Valve Components for total aggregate consideration of $14.5 million. The acquired Cooper brands include the Accuseal® metal seated ball valves engineered to meet Class VI shut off standards for use in severe service applications, as well as a full line of cast and forged gate, globe, and check valves. Innovative Valve Components, in partnership with Cooper Valves, commercialized critical service valves and components for the power generation, mining and oil and natural gas industries. The fair values of the assets acquired and liabilities assumed have not been presented because they are not material to the audited consolidated financial statements. Pro forma results of operations for this acquisition have not been presented because the effects were not material to the consolidated financial statements.
95
Item 9. Changes in and Disagreements with Accountants on Accounting and Financial Disclosure
None.
Item 9A. Controls and Procedures
Evaluation of Disclosure Controls and Procedures
We maintain disclosure controls and procedures (as defined under Rules 13a-15(e) and 15d-15(e) of the Exchange Act). Our management, under the supervision and with the participation of our Chief Executive Officer and our Chief Financial Officer, evaluated the effectiveness of our disclosure controls and procedures pursuant to Exchange Act Rule 13a-15(b) as of December 31, 2016. Based on that evaluation, our Chief Executive Officer and Chief Financial Officer concluded that our disclosure controls and procedures were effective as of December 31, 2016 to provide reasonable assurance that information required to be disclosed in our reports filed or submitted under the Exchange Act is recorded, processed, summarized, and reported within the time periods specified in the SEC's rules and forms. Our disclosure controls and procedures include controls and procedures designed to ensure that information required to be disclosed in reports filed or submitted under the Exchange Act is accumulated and communicated to our management, including our Chief Executive Officer and Chief Financial Officer, as appropriate, to allow timely decisions regarding required disclosure.
Management’s Report on Internal Control Over Financial Reporting
Our management is responsible for establishing and maintaining adequate internal control over financial reporting. Management’s intent is to design a process to provide reasonable assurance regarding the reliability of financial reporting and the preparation of financial statements for external purposes in accordance with GAAP in the United States of America.
Our management performed an assessment of the effectiveness of our internal control over financial reporting as of December 31, 2016, utilizing the criteria described in the “Internal Control - Integrated Framework (2013)” issued by the Committee of Sponsoring Organizations of the Treadway Commission. Based on our assessment, management believes that, as of December 31, 2016, the Company’s internal control over financial reporting is effective.
Our independent registered public accounting firm, PricewaterhouseCoopers LLP, independently assessed the effectiveness of our internal control over financial reporting as of December 31, 2016, as stated in their report which appears herein.
Changes in Internal Control over Financial Reporting
There were no changes in our internal control over financial reporting during the quarter ended December 31, 2016 that have materially affected, or are reasonably likely to materially affect, our internal control over financial reporting.
Item 9B. Other information
None.
Item 10. Directors, executive officers and corporate governance
Information required by this item is incorporated herein by reference from our Proxy Statement for the 2016 Annual Meeting of Stockholders.
Code of Ethics
We have adopted a Financial Code of Ethics, which applies to our Chief Executive Officer, Chief Financial Officer (or other principal financial officer), Controller (or other principal accounting officer) and other senior financial officers. We have posted a copy of the code under "Corporate Governance" in the "Investors" section of our internet website at www.f-e-t.com. Copies of the code may be obtained free of charge on our website. Any waivers of the code must be approved by our Board of Directors or a designated committee of our Board of Directors. Any change to, or waiver from, the Code of Ethics will be promptly disclosed as required by applicable U.S. federal securities laws and the corporate governance rules of the NYSE.
96
Item 11. Executive compensation
Information required by this item is incorporated herein by reference from our Proxy Statement for the 2017 Annual Meeting of Stockholders.
Item 12. Security ownership of certain beneficial owners and management and related stockholder matters
Information required by this item is incorporated herein by reference from our Proxy Statement for the 2017 Annual Meeting of Stockholders.
Item 13. Certain Relationships and Related Transactions, and Director Independence
Information required by this item is incorporated herein by reference from our Proxy Statement for the 2017 Annual Meeting of Stockholders.
Item 14. Principal accountant fees and services
Information required by this item is incorporated herein by reference from our Proxy Statement for the 2017 Annual Meeting of Stockholders.
Item 15. Exhibits
(a) The following documents are filed as part of this Annual Report on Form 10-K:
1. Financial Statements filed as part of this report
Index to Consolidated Financial Statements | Page |
2. Financial Statement Schedules
All financial statement schedules have been omitted since the required information is not applicable or is not present in amounts sufficient to require submission of the schedule, or because the information required is included on the Consolidated Financial Statements and Notes thereto.
3. Exhibits
Index to Exhibits
Exhibit | ||
Number | DESCRIPTION | |
2.1* | — | Combination Agreement dated July 16, 2010 by and among Forum Oilfield Technologies, Inc., Allied Production Services, Inc., Allied Merger Sub, LLC, Global Flow Technologies, Inc., Global Flow Merger Sub, LLC, Subsea Services International, Inc., Subsea Merger Sub, LLC, Triton Group Holdings LLC, Triton Merger Sub, LLC and SCF-VII, L.P. (incorporated herein by reference to Exhibit 2.1 to the Company's Registration Statement on Form S-1 File No. 333-180676 (the "Registration Statement"), filed on August 31, 2011). |
3.1* | — | Third Amended and Restated Certificate of Incorporation of Forum Energy Technologies, Inc. dated March 28, 2011 (incorporated herein by reference to Exhibit 3.2 to Amendment No. 5 to the Registration Statement, filed on March 29, 2012). |
3.2* | — | Second Amended and Restated Bylaws of Forum Energy Technologies, Inc. dated April 17, 2012 (incorporated herein by reference to Exhibit 3.1 on the Company's Current Report on Form 8-K, filed on April 17, 2012). |
97
4.1* | — | Indenture, dated October 2, 2013, among Forum Energy Technologies, Inc., the guarantors named therein and Wells Fargo Bank, National Association, as Trustee (incorporated herein by reference to Exhibit 4.1 to the Company’s Current Report on Form 8-K, filed on October 4, 2013). |
4.2* | — | Registration Rights Agreement by and among Forum Energy Technologies and the other parties thereto (incorporated herein by reference to Exhibit B to Exhibit 4.2 to the Registration Statement, filed on August 31, 2011). |
4.3* | — | Form of Common Stock Certificate (incorporated herein by reference to Exhibit 4.1 to Amendment No. 3 to the Registration Statement, filed on December 29, 2011). |
4.4* | — | Form of Note (incorporated herein by reference to Exhibit 4.1 to the Company's Current Report on Form 8-K, filed on October 4, 2013). |
10.1* | — | Stock Purchase Agreement between Forum Energy Technologies, Inc. and Tinicum, L.P., dated as of March 28, 2012 (incorporated herein by reference to Exhibit 10.30 to Amendment No. 5 to the Registration Statement, filed on March 29, 2012). |
10.2* | — | Second Amended and Restated Credit Agreement, dated as of November 26, 2013, among Forum Energy Technologies, Inc., Wells Fargo Bank, National Association, as administrative agent, and the lenders party thereto (incorporated herein by reference to Exhibit 10.1 to the Company’s Current Report on Form 8-K, filed on November 29, 2013). |
10.3*# | — | Form of Restricted Stock Unit Agreement (Directors) (incorporated herein by reference to Exhibit 10.1 to the Company's Quarterly Report on Form 10-Q, filed on April 29, 2014). |
10.4*# | — | Form of Restricted Stock Agreement (Directors) (incorporated herein by reference to Exhibit 10.2 to the Company's Quarterly Report on Form 10-Q, filed on April 29, 2014). |
10.5*# | — | Form of Restricted Stock Unit Agreement (Employees and Consultants) (incorporated herein by reference to Exhibit 10.3 to the Company's Quarterly Report on Form 10-Q, filed April 29, 2014). |
10.6*# | — | Form of Nonstatutory Stock Option Agreement (Employees and Consultants) (incorporated herein by reference to Exhibit 10.4 to the Company's Quarterly Report on Form 10-Q, filed on April 29, 2014). |
10.7*# | — | Form of Performance Share Award Agreement (Employees and Consultants) (incorporated herein by reference to Exhibit 10.5 to the Company's Quarterly Report on Form 10-Q, filed on April 29, 2014). |
10.8*# | Form of Restricted Stock Unit Agreement (Directors) (incorporated herein by reference to Exhibit 10.1 to the Company's Quarterly Report on Form 10-Q, filed on May 1, 2015). | |
10.9*# | Form of Restricted Stock Agreement (Directors) (incorporated herein by reference to Exhibit 10.2 to the Company's Quarterly Report on Form 10-Q, filed on May 1, 2015). | |
10.10*# | Form of Restricted Stock Unit Agreement (Employees and Consultants) (incorporated herein by reference to Exhibit 10.3 to the Company's Quarterly Report on Form 10-Q, filed May 1, 2015). | |
10.11*# | Form of Nonstatutory Stock Option Agreement (Employees and Consultants) (incorporated herein by reference to Exhibit 10.4 to the Company's Quarterly Report on Form 10-Q, filed on May 1, 2015). | |
10.12*# | Form of Performance Share Award Agreement (Employees and Consultants) (incorporated herein by reference to Exhibit 10.5 to the Company's Quarterly Report on Form 10-Q, filed on May 1, 2015). | |
10.13*# | Form of Restricted Stock Unit Agreement - Three Year Cliff Vesting (Employees and Consultants) (incorporated herein by reference to Exhibit 10.4 to the Company's Quarterly Report on Form 10-Q, filed on October 30, 2015). | |
10.14*# | Form of Nonstatutory Stock Option Agreement - Three Year Cliff Vesting (Employees and Consultants) (incorporated herein by reference to Exhibit 10.4 to the Company's Quarterly Report on Form 10-Q, filed on October 30, 2015). | |
10.15*# | — | Employment Agreement dated as of August 2, 2010 between Forum Energy Technologies, Inc. and C. Christopher Gaut (incorporated herein by reference to Exhibit 10.2 to the Registration Statement, filed on August 31, 2011). |
98
10.16*# | — | Employment Agreement dated as of August 2, 2010 between Forum Energy Technologies, Inc. and James W. Harris (incorporated herein by reference to Exhibit 10.6 to the Registration Statement, filed on August 31, 2011). |
10.17*# | — | Employment Agreement dated as of October 25, 2010 between Forum Energy Technologies, Inc. and James L. McCulloch (incorporated herein by reference to Exhibit 10.7 to the Registration Statement, filed on August 31, 2011). |
10.18*# | — | Amendment to Employment Agreement dated as of April 12, 2012 between Forum Energy Technologies, Inc. and C. Christopher Gaut (incorporated herein by reference to Exhibit 10.2 on the Company's Current Report on Form 8-K, filed on April 17, 2012). |
10.19*# | — | Amendment to Employment Agreement dated as of April 12, 2012 between Forum Energy Technologies, Inc. and James W. Harris (incorporated herein by reference to Exhibit 10.4 on the Company's Current Report on Form 8-K, filed on April 17, 2012). |
10.20*# | — | Amendment to Employment Agreement dated as of April 12, 2012 between Forum Energy Technologies, Inc. and James L. McCulloch (incorporated herein by reference to Exhibit 10.5 on the Company's Current Report on Form 8-K, filed on April 17, 2012). |
10.21*# | — | Indemnification Agreement dated as of August 2, 2010 between Forum Energy Technologies and C. Christopher Gaut (incorporated herein by reference to Exhibit 10.9 to the Registration Statement, filed on August 31, 2011). |
10.22*# | — | Form of Indemnification Agreement between Forum Energy Technologies, Inc. and the executive officers identified on Annex A thereto (incorporated herein by reference to Exhibit 10.10 to the Registration Statement, filed on August 31, 2011). |
10.23*# | — | Form of Indemnification Agreement between Forum Energy Technologies and each of the non-SCF directors identified on Annex A thereto (incorporated herein by reference to Exhibit 10.11 to the Registration Statement, filed on August 31, 2011). |
10.24*# | — | Form of Indemnification Agreement between Forum Energy Technologies and each of the SCF directors identified on Annex A thereto (incorporated herein by reference to Exhibit 10.12 to the Registration Statement, filed on August 31, 2011). |
10.25*# | — | Forum Energy Technologies, Inc. Severance Plan (incorporated herein by reference to Exhibit 10.15 to the Registration Statement, filed on August 31, 2011). |
10.26*# | — | Forum Energy Technologies, Inc. Deferred Compensation and Restoration Plan (incorporated herein by reference to Exhibit 10.6 to the Company's Current Report on Form 10-Q, filed on May 3, 2013). |
10.27*# | — | Letter Agreement dated March 28, 2012 between Forum Energy Technologies, Inc. and Tinicum, L.P. (incorporated herein by reference to Exhibit 10.31 to Amendment No. 5 to the Registration Statement, filed on March 29, 2012). |
10.28*# | — | Forum Energy Technologies, Inc. 2010 Stock Incentive Plan (as amended and restated effective August 15, 2012). |
10.29*# | — | Employee Stock Purchase Plan (incorporated herein by reference to Exhibit 10.6 to the Company's Quarterly Report on Form 10-Q, filed on August 2, 2013). |
10.30*# | — | Subscription Agreement dated July 16, 2010 by and among Forum Oilfield Technologies, Inc., SCF-VII, L.P., Sunray Capital, LP, C. Christopher Gaut and W. Patrick Connelly, as amended (incorporated herein by reference to Exhibit 10.21 to the Registration Statement, filed on August 31, 2011). |
10.31*# | — | Retirement and Separation Agreement, effective as of December 18, 2014 (incorporated herein by reference to Exhibit 10.1 to the Company’s Current Report on Form 8-K, filed on December 18, 2014). |
10.32* | — | Amendment No.1 to the Second Amended and Restated Credit Agreement, dated as of February 25, 2016, among Forum Energy Technologies, Inc., Wells Fargo Bank, National Association, as administrative agent, the guarantors party thereto and the lenders party thereto (incorporated herein by reference to Exhibit 10.1 to the Company’s Current Report on Form 8-K, filed on February 26, 2016). |
10.33*# | — | Form of Restricted Stock Unit Agreement (Directors) (incorporated herein by reference to Exhibit 10.1 to the Company's Quarterly Report on Form 10-Q, filed on May 3, 2016). |
99
10.34*# | — | Form of Restricted Stock Agreement (Directors) (incorporated herein by reference to Exhibit 10.2 to the Company's Quarterly Report on Form 10-Q, filed on May 3, 2016). |
10.35*# | — | Form of Restricted Stock Unit Agreement (Employees and Consultants - Group 1) (incorporated herein by reference to Exhibit 10.3 to the Company's Quarterly Report on Form 10-Q, filed on May 3, 2016). |
10.36*# | — | Form of Restricted Stock Unit Agreement (Employees and Consultants - Group 2) (incorporated herein by reference to Exhibit 10.4 to the Company's Quarterly Report on Form 10-Q, filed on May 3, 2016). |
10.37*# | — | Form of Restricted Stock Agreement (Employees and Consultants) (incorporated herein by reference to Exhibit 10.5 to the Company's Quarterly Report on Form 10-Q, filed on May 3, 2016). |
10.38*# | — | Form of Nonstatutory Stock Option Agreement (Employees and Consultants) (incorporated herein by reference to Exhibit 10.6 to the Company's Quarterly Report on Form 10-Q, filed on May 3, 2016). |
10.39*# | — | Form of Performance Share Award Agreement (Employees and Consultants) (incorporated herein by reference to Exhibit 10.7 to the Company's Quarterly Report on Form 10-Q, filed on May 3, 2016). |
10.40*# | — | Forum Energy Technologies, Inc. 2016 Stock and Incentive Plan (incorporated herein by reference to Appendix A to the Company’s Proxy Statement on Schedule 14A filed on April 1, 2016). |
10.41*# | — | Form of Restricted Stock Unit Agreement (Employees and Consultants) (incorporated herein by reference to Exhibit 10.1 to the Company's Quarterly Report on Form 10-Q, filed on November 2, 2016). |
10.42* | Amendment No.2 to the Second Amended and Restated Credit Agreement, dated as of December 12, 2016, among Forum Energy Technologies, Inc., Wells Fargo Bank, National Association, as administrative agent, the guarantors party thereto and the lenders party thereto (incorporated herein by reference to Exhibit 10.1 to the Company’s Current Report on Form 8-K, filed on December 13, 2016). | |
21.1** | — | Subsidiaries of Forum Energy Technologies, Inc. |
23.1** | — | Consent of PricewaterhouseCoopers LLP |
31.1** | — | Certification of Chief Executive Officer pursuant to Section 302 of the Sarbanes-Oxley Act of 2002. |
31.2** | — | Certification of Chief Financial Officer pursuant to Section 302 of the Sarbanes-Oxley Act of 2002. |
32.1** | — | Certification of Chief Executive Officer pursuant to Section 906 of the Sarbanes-Oxley Act of 2002. |
32.2** | — | Certification of Chief Financial Officer pursuant to Section 906 of the Sarbanes-Oxley Act of 2002. |
101.INS** | — | XBRL Instance Document. |
101.SCH** | — | XBRL Taxonomy Extension Schema Document. |
101.CAL** | — | XBRL Taxonomy Extension Calculation Linkbase Document. |
101.LAB** | — | XBRL Taxonomy Extension Label Linkbase Document. |
101.PRE** | — | XBRL Taxonomy Extension Presentation Linkbase Document. |
101.DEF** | — | XBRL Taxonomy Extension Definition Linkbase Document. |
* Previously filed.
** Filed herewith.
# Identifies management contracts and compensatory plans or arrangements.
100
SIGNATURES
As required by Section 13 or 15(d) of the Securities Exchange Act of 1934, the registrant has authorized this report to be signed on its behalf by the undersigned authorized individuals.
FORUM ENERGY TECHNOLOGIES, INC. | |||||
By: | /s/ James W. Harris | ||||
James W. Harris | |||||
Executive Vice President and Chief Financial Officer | |||||
(As Duly Authorized Officer and Principal Financial Officer) | |||||
By: | /s/ Tylar K. Schmitt | ||||
Tylar K. Schmitt | |||||
Vice President and Chief Accounting Officer | |||||
(As Duly Authorized Officer and Principal Accounting Officer) | |||||
101
As required by the Securities Exchange Act of 1934, this report has been signed below by the following persons on behalf of the registrant and in the capacities an on the dates indicated.
Signature | Title | Date | ||
/s/ C. Christopher Gaut | Chief Executive Officer and Chairman of the Board | February 27, 2017 | ||
C. Christopher Gaut | ||||
/s/ James W. Harris | Executive Vice President and Chief Financial Officer (Principal Financial Officer) | February 27, 2017 | ||
James W. Harris | ||||
/s/ Tylar K. Schmitt | Vice President and Chief Accounting Officer (Principal Accounting Officer) | February 27, 2017 | ||
Tylar K. Schmitt | ||||
/s/ Evelyn M. Angelle | Director | February 27, 2017 | ||
Evelyn M. Angelle | ||||
/s/ David C. Baldwin | Director | February 27, 2017 | ||
David C. Baldwin | ||||
/s/ John A. Carrig | Director | February 27, 2017 | ||
John A. Carrig | ||||
/s/ Michael McShane | Director | February 27, 2017 | ||
Michael McShane | ||||
/s/ Terence O'Toole | Director | February 27, 2017 | ||
Terence O'Toole | ||||
/s/ Franklin Myers | Director | February 27, 2017 | ||
Franklin Myers | ||||
/s/ Louis A. Raspino | Director | February 27, 2017 | ||
Louis A. Raspino | ||||
/s/ John Schmitz | Director | February 27, 2017 | ||
John Schmitz | ||||
/s/ Andrew L. Waite | Director | February 27, 2017 | ||
Andrew L. Waite | ||||
102