Attached files
| file | filename |
|---|---|
| EX-32 - EXHIBIT 32 - DST SYSTEMS INC | dstex321231161.htm |
| EX-31.2 - EXHIBIT 31.2 - DST SYSTEMS INC | dstex3121231161.htm |
| EX-31.1 - EXHIBIT 31.1 - DST SYSTEMS INC | dstex3111231161.htm |
| EX-24 - EXHIBIT 24 - DST SYSTEMS INC | dstex241231161.htm |
| EX-23 - EXHIBIT 23 - DST SYSTEMS INC | dstex231231161.htm |
| EX-21 - EXHIBIT 21 - DST SYSTEMS INC | dstex211231161.htm |
| EX-12 - EXHIBIT 12 - DST SYSTEMS INC | dstex121231161.htm |
| EX-10.17.2 - EXHIBIT 10.17.2 - DST SYSTEMS INC | dstex10172123120161.htm |
| EX-10.17.1 - EXHIBIT 10.17.1 - DST SYSTEMS INC | dstex10171123121061.htm |
| EX-10.16.1 - EXHIBIT 10.16.1 - DST SYSTEMS INC | dstex10161123120161.htm |
Use these links to rapidly review the document
United States
Securities and Exchange Commission
Washington, D.C. 20549
FORM 10-K
x ANNUAL REPORT PURSUANT TO SECTION 13 OR 15(d) OF THE SECURITIES EXCHANGE ACT OF 1934
For the fiscal year ended December 31, 2016 | |
or | |
¨ TRANSITION REPORT PURSUANT TO SECTION 13 OR 15(d) OF THE SECURITIES EXCHANGE ACT OF 1934
For the transition period from | to |
Commission file number 1-14036

DST Systems, Inc.
(Exact name of Registrant as specified in its charter)
Delaware (State or other jurisdiction of incorporation or organization) | 43-1581814 (I.R.S. Employer identification no.) | |
333 West 11th Street, Kansas City, Missouri (Address of principal executive offices) | 64105 (Zip code) | |
(816) 435-1000
Registrant’s telephone number, including area code
Securities registered pursuant to Section 12(b) of the Act:
Title of each class | Name of each Exchange on which registered | |
Common Stock, $0.01 Per Share Par Value | New York Stock Exchange | |
Securities registered pursuant to Section 12(g) of the Act: None
Indicate by check mark if the registrant is a well-known seasoned issuer, as defined in Rule 405 of the Securities Act. YES x NO ¨
Indicate by check mark if the registrant is not required to file reports pursuant to Section 13 or Section 15(d) of the Act. YES ¨ NO x
Indicate by check mark whether the registrant: (1) has filed all reports required to be filed by Section 13 or 15(d) of the Securities Exchange Act of 1934 during the preceding 12 months (or for such shorter period that the registrant was required to file such reports), and (2) has been subject to such filing requirements for the past 90 days. YES x NO ¨
Indicate by check mark whether the registrant has submitted electronically and posted on its corporate Web-site, if any, every Interactive Data File required to be submitted and posted pursuant to Rule 405 of Regulation S-T (§232.405 of this chapter) during the preceding 12 months (or for such shorter period that the registrant was required to submit and post such files). YES x NO ¨
Indicate by check mark if disclosure of delinquent filers pursuant to Item 405 of Regulation S-K (§229.405 of this chapter) is not contained herein, and will not be contained, to the best of registrant’s knowledge, in definitive proxy or information statements incorporated by reference in Part III of this Form 10-K or any amendment to this Form 10-K. ¨
Indicate by check mark whether the registrant is a large accelerated filer, an accelerated filer, a non-accelerated filer, or a smaller reporting company. See definitions of “large accelerated filer,” “accelerated filer,” and “smaller reporting company” in Rule 12b-2 of the Exchange Act.
Large accelerated filer x | Accelerated filer ¨ | Non-accelerated filer ¨ (Do not check if a smaller reporting company) | Smaller reporting company ¨ | |||
Indicate by check mark whether the registrant is a shell company (as defined in Rule 12b-2 of the Exchange Act). YES ¨ NO x
Aggregate market value of the voting and non-voting stock held by non-affiliates of the Registrant as of June 30, 2016:
Common Stock, $0.01 par value—$3,824,656,457
Number of shares outstanding of the Registrant’s common stock as of January 31, 2017:
Common Stock, $0.01 par value—31,546,703
Documents incorporated by reference: Portions of our Proxy Statement to be filed on or about on March 28, 2017 are incorporated into Part III
DST Systems, Inc. 2016 Form 10-K Annual Report Table of Contents | ||
The brand, service or product names or marks referred to in this Annual Report are trademarks or services marks, registered or otherwise, of DST Systems, Inc. or its consolidated subsidiaries.
2
PART I
Item 1. Business
DST Systems, Inc. is a global provider of technology-based information processing and servicing solutions. References below to “DST,” “the Company,” “we,” “us” and “our” may refer to DST Systems, Inc. exclusively or to one or more of our consolidated subsidiaries. We provide business solutions through a unique blend of industry knowledge and experience, technological expertise and service excellence to clients in the asset management, brokerage, retirement, healthcare and other markets. The Company was formed in 1969. Through a reorganization in August 1995, we are a corporation organized in the State of Delaware.
NARRATIVE DESCRIPTION OF BUSINESS
DST uses our proprietary software applications to provide sophisticated information processing and servicing solutions through strategically unified data management and business processing solutions to clients globally within the asset management, brokerage, retirement, healthcare and other markets. Our wholly-owned data centers provide the secure technology infrastructure necessary to support our solutions.
We manage our business through two operating segments: Financial Services and Healthcare Services. Our investments in equity securities, private equity investments, real estate and certain financial interests have been aggregated into an Investments and Other segment.
In connection with the execution of our strategic plan, which includes focusing on the Financial Services and Healthcare markets, we sold our North American Customer Communications business on July 1, 2016. Additionally, during 2016, our Board of Directors approved a plan for management to divest of our United Kingdom (“U.K.”) Customer Communications business. As a result of this significant shift in the strategic direction of our operations, we have classified the results of the Customer Communications businesses sold and being sold as discontinued operations in our consolidated financial statements for all periods presented. The net after-tax proceeds from the sale are being used in accordance with the Company’s capital plan, including investments in the business, share repurchases, strategic acquisitions, debt repayments and other corporate purposes.
During 2016, we acquired all of the membership interests of Kaufman Rossin Fund Services LLC (“KRFS”), a full-service provider of specialized hedge fund administration services to the global financial community. KRFS’ hedge fund services include accounting and valuation, back-office outsourcing, investor services, treasury services, and customized reporting.
For the year ended December 31, 2016, DST’s operating revenues were $1,474.4 million. Segment operating revenues, as a percentage of consolidated operating revenues (excluding intersegment revenues), were 71.0%, 28.9%, and 0.1% contributed from the Financial Services, Healthcare Services, and Investments and Other segments, respectively.
FINANCIAL SERVICES SEGMENT
Through the Financial Services segment, we provide investor, investment, advisor/intermediary and asset distribution services to companies within the financial services industry. Utilizing our proprietary software applications, we offer our clients information processing solutions to support direct and intermediary sales of mutual funds, alternative investments, securities brokerage accounts and retirement plans. This includes transaction processing; account opening and maintenance; reconciliation of trades, positions and cash; corporate actions; regulatory reporting and compliance functions; and tax reporting. We also support full reporting to investors for confirmations, statements and tax forms, web access, and electronic delivery of documents.
Services are provided either under a remote processing (“Remote”) model or on a business process outsourcing (“BPO”) basis, either directly by DST or through Boston Financial Data Services, Inc. (“BFDS”), our domestic joint venture with State Street Corporation (“State Street”), utilizing our proprietary software applications, including our TA 2000® and TRAC® systems. Our BPO service offerings are enhanced by AWD®, our proprietary workflow software, which is also licensed separately to third parties.
In the United States (“U.S.”), we provide services to mutual funds, brokerage firms, retirement plans and alternative investment funds (such as real estate investment trusts “REITs”). In Australia and the U.K., we license our wealth management platform to provide solutions related to participant accounting and recordkeeping for wealth management, “wrap platforms” and retirement savings (“superannuation”) industries/markets. Our primary customers are funds and fund managers. We also offer investor services on a Remote and BPO basis internationally (U.K., Canada, Ireland and Luxembourg) solely through International
3
Financial Data Services, U.K. (“IFDS U.K.”) and International Financial Data Services, L.P. (“IFDS L.P.”), (collectively, “IFDS”), which are joint ventures with State Street.
Accounts serviced under shareowner recordkeeping arrangements with the mutual fund and alternative investment sponsors are referred to as “registered accounts.” Registered accounts include both tax-advantaged and non tax-advantaged accounts on the books of the transfer agent. We also contract directly with broker/dealers to manage brokerage subaccounts.
We deliver a comprehensive suite of asset servicing, distribution solutions and asset management for open-end mutual funds, closed-end funds, exchange-traded funds and alternative investment funds. Focusing on the needs of small- to medium-sized funds that require a broad set of customizable services, we provide compliance, creative services, medallion distribution, fund administration, fund accounting, legal, tax administration, transfer agency and asset management services.
Our distribution services range from consulting to active wholesaling and marketing, including closed-end funds IPO launch platform services. We also offer products designed to assist clients in meeting the expanding needs associated with distributing U.S. investment products through financial intermediaries.
We serve as the asset manager to proprietary open-end mutual funds, closed-end funds and exchange-traded funds through active management and through the utilization of sub-advisors and index providers. Additionally, we offer data analytics and consulting services in both the U.S. and U.K. to help our clients gain actionable insights into the needs and preferences of their customers.
We typically have multi-year agreements with our clients. Financial Services’ fees are primarily charged to the client based on the number of accounts, participants or transactions processed. For subaccounts, broker/dealers provide a portion of the services directly. As a result, our revenue per account is generally higher for registered accounts than for subaccounts. On a more limited basis, we also generate revenue through asset-based fee arrangements, subscriptions and/or seat licensing and from investment earnings related to cash balances maintained in our full service transfer agency bank accounts.
The Financial Services segment’s largest customer accounted for 10.5% of the segment’s operating revenues in 2016 and the five largest Financial Services customers collectively accounted for 28.0% of the segment’s operating revenues in 2016. Financial Services’ customers in 2016 included our joint ventures with State Street, BFDS (which was the segment’s second largest customer) and IFDS U.K. (which was the segment’s third largest customer). Collectively, these joint ventures accounted for approximately 12.4% of the segment’s operating revenues in 2016.
Sources of new business for the Financial Services segment include: (i) existing clients, particularly with respect to complementary and new products and services, (ii) companies relying on their own in-house capabilities and not using outside vendors, (iii) companies using competitors’ systems, and (iv) new entrants into the markets served by Financial Services. We consider our existing client base to be one of our best sources of new business. We believe that competition in the markets in which the Financial Services segment operates is based largely on price, quality of service, features offered, the ability to handle rapidly changing volumes, response to security and compliance needs, product innovation, and responsiveness. Our competitors are primarily financial institutions and in-house systems. Our financial institution competitors may have an advantage because they can take into consideration the value of their clients’ funds on deposit or under management when pricing their services. We believe there is significant competition in our markets and our ability to compete effectively is dependent in part on access to capital.
HEALTHCARE SERVICES SEGMENT
The Healthcare Services segment uses our proprietary software applications to provide healthcare organizations with pharmacy, healthcare administration, and health outcomes optimization solutions to satisfy their information processing, quality of care, cost management and payment integrity needs. Our healthcare solutions include claims adjudication, benefit management, care management, business intelligence and other ancillary services. The Healthcare Services segment’s five largest customers accounted for 51.4% of segment operating revenues in 2016, including 17.8% from its largest customer. Effective January 2017, two of our Healthcare Services customers began transitioning off of our systems, which is expected to result in lower overall segment revenue growth during 2017 as compared to 2016.
Our healthcare services are marketed to health insurance companies, health plans and benefits administrators. Customers primarily consist of managed care organizations, preferred provider organizations, third-party administrators, dental, vision, and behavioral health organizations operating commercial and government sponsored programs such as the Health Insurance Exchanges that operate under the Patient Protection and Affordable Care Act, Medicare Advantage, Medicare Part D and Medicaid.
4
We compete with other third-party providers and companies that perform their services in-house with licensed or internally developed systems and processes. We believe that we compete effectively in the market due to our ongoing investment in our products and the development of new products to meet the evolving business requirements of our customers.
Our competitors’ healthcare administration and health outcomes optimization solutions are primarily based on complete replacement of a payer’s core system. We believe that a component application approach shifts the focus away from core application replacement to one in which clients have more alternatives for modernization of the business operation. With a component approach, health payer clients can still choose core application replacement if warranted, or adopt component applications that address only those areas of the business that offer the most opportunity of improvement for the customer, resulting in protection of the client’s current IT investment and reduced disruption to its business operation.
Pharmacy Solutions
We use our proprietary software applications, supporting technology and enhanced clinical expertise to provide pharmacy health management solutions supporting commercial, Medicaid and Medicare Part D plans. These services include pharmacy claims administration, pharmacy network solutions, government programs administration, formulary and rebate management, trend control and quality compliance programs, member services, and discount drug card programs. RxNova, our proprietary claims processing system, is a highly scalable and comprehensive system for the administration of pharmacy benefits, prescription claims adjudication, eligibility, pharmacy management, and related activities. This benefit management solution provides substantial flexibility to accommodate varying provider requirements, allows point-of-sale monitoring, and provides control of pharmacy plan benefits with online benefit authorization.
We generally derive revenue from our pharmacy-solutions business on a transactional fee basis. Fees are earned on pharmacy claims processing and payments services, pharmacy and member call center services, formulary and rebate administration, administration or management of clinical programs, pharmacy network management, member and plan web services and management information and reporting.
Healthcare Administration
We use our proprietary software applications to provide medical claim administration services and health plan compliance and revenue integrity services for payers and providers in the domestic healthcare industry. Healthcare administration services are offered on a software license, Remote and BPO basis. Our solutions, combined with our health outcomes optimization solutions described below, are offered as stand-alone component solutions to complement health plans, existing operations or systems, or as an integrated core administration package of solutions.
Claims administration services include claims processing, benefit plan management, eligibility and enrollment management, provider contract administration, mail receipt and processing, imaging/data capture and retention, fulfillment, utilization management, and customer service. Health plan compliance and revenue integrity services include a retrospective review of medical records to accurately capture members’ health status through proper hierarchical condition categories.
Healthcare administration revenues are generally derived from fees charged on a per member/per month basis or transactional basis. We also realize revenue from fixed-fee license agreements that include provisions for ongoing support and maintenance and for additional license payments in the event that usage or members increase.
Health Outcomes Optimization
We also provide health outcomes optimization solutions through the use of our integrated care management and population health analytics applications and professional services for health plans and providers in the domestic healthcare industry. Our Integrated Care Management solution is a real-time, intuitive, workflow-driven solution suite that assists customers to improve member outcomes and manage costs. Our population health technology provides organizations with the ability to measure and manage federal and state required quality management initiatives, provider network quality and efficiency, member health programs, and risk adjustment on an integrated system. In addition to our proprietary systems, we are the exclusive distributor of Johns Hopkins’ Adjusted Clinical Groups (“ACG”), a patient classification system developed by Johns Hopkins University. The ACG System is a software tool that provides health plans the ability to easily identify their at-risk population and stratify them into the optimal care management program for both the member’s needs and the health plan’s goals for that member.
Professional services include business and industry consulting, risk adjustment, compliance and regulatory consulting, behaviorally based interventions, healthcare quality incentive management, medical management (disease, care, and utilization), HEDIS, managed information technology, software engineering, operations process engineering and management consulting.
Health outcomes optimization revenues are generally derived from fees charged based on a per member/per month basis. We also realize revenue from fixed-fee license agreements that include provisions for ongoing support and maintenance and for
5
additional license payments in the event that usage or members increase. Additionally, we derive professional service revenues from fees for implementation services, custom programming and data center operations.
INVESTMENTS AND OTHER SEGMENT
The Investments and Other segment is comprised of our investments in equity securities, private equity investments, real estate and other financial interests. The assets held are primarily passive in nature.
At December 31, 2016, the Investments and Other segment held investments in available-for-sale equity securities with a market value of approximately $180.1 million, including approximately 2.2 million shares of State Street with a market value of $169.6 million based on closing exchange values at December 31, 2016.
We also own partnership interests in certain real estate joint ventures that lease office space to us, certain of our unconsolidated affiliates and unrelated third parties. We also own various office and retail properties, undeveloped land and an underground storage facility.
SOFTWARE DEVELOPMENT AND MAINTENANCE
DST’s software development and maintenance efforts are focused on introducing new products and services, as well as enhancing our existing products and services. The software development, maintenance and enhancements costs, including capitalized software development costs, were $217.3 million, $205.5 million and $171.1 million for the years ended December 31, 2016, 2015 and 2014, respectively.
INTELLECTUAL PROPERTY
We hold U.S. patents, U.S. copyrights and trademarks covering various aspects of the information processing and computer software services and products provided by the Financial Services and Healthcare Services segments. The duration of the patent term is generally 20 years from its earliest application filing date. The patent term is not renewable. The durations of the copyrights depend on a number of factors, such as who created the work and whether he or she was employed by us at the time. The trademark rights generally will continue for as long as we maintain usage of the trademarks. We believe our copyrights are adequate to protect our original works of authorship. We believe that although the patents, trademarks and copyrights related to the segments are valuable, our success primarily depends upon our product and service quality, marketing and service skills. Despite patent, trademark and copyright protection, we may be vulnerable to competitors who attempt to imitate our systems or processes. In addition, other companies and inventors may receive patents that contain claims applicable to our systems and processes.
EMPLOYEES
We had approximately 5,700 employees in the U.S. and approximately 2,700 employees internationally within our continuing operations at December 31, 2016. Additionally, our joint ventures, BFDS, IFDS U.K. and IFDS L.P. had approximately 2,200 employees in the U.S. and 7,000 employees internationally at December 31, 2016. We also had approximately 1,400 employees internationally that are included within our discontinued operations. Except for certain employees of DST Output (Nottingham) Limited, a U.K. subsidiary included within our discontinued operations, none of our employees are represented by a labor union or covered by a collective bargaining agreement. We consider our employee relations to be good.
SEGMENT, GEOGRAPHIC AREA AND OTHER FINANCIAL INFORMATION
This discussion of the business of DST Systems, Inc. should be read in conjunction with, and is qualified by reference to, Management’s Discussion and Analysis of Financial Condition and Results of Operations (“MD&A”) under Item 7 herein. In addition, the information set forth in the first paragraph and under the headings “Introduction” and “Seasonality” in the MD&A and the segment and geographic information included in Item 8, Note 17 are incorporated herein by reference in partial response to this Item 1.
6
AVAILABLE INFORMATION
Our Annual Report on Form 10-K, Quarterly Reports on Form 10-Q, Current Reports on Form 8-K and all amendments to those reports will be made available free of charge on or through our Internet website (www.dstsystems.com) as soon as reasonably practicable after such material is electronically filed with, or furnished to, the Securities and Exchange Commission (“SEC”). In addition, our corporate governance guidelines and the charters of the Audit Committee, the Corporate Governance/Nominating Committee, and Compensation Committee of the DST Board of Directors are available at investors.dstsystems.com/govdocs. These guidelines and charters are available in print to any stockholder who requests them. Written requests may be made to the DST Corporate Secretary, 333 West 11th Street, Kansas City, Missouri 64105, and oral requests may be made by calling the DST Corporate Secretary’s Office at (816) 435-8655. An individual may read and copy any materials we file with the SEC at the SEC’s Public Reference Room at 100 F Street, N.E. Washington, D.C. 20549. The public may obtain information on the operation of the Public Reference Room by calling the SEC at 1-800-SEC-0330. The SEC maintains an internet site (http://www.sec.gov) that contains reports, proxy and information statements, and other information regarding issuers that file electronically with the SEC.
Item 1A. Risk Factors
In addition to the other information set forth in this report, you should carefully consider the following factors, which could materially affect our business, financial condition or results of operations in future periods. While we believe we have identified and discussed below the key risk factors affecting our business, there may be additional risks and uncertainties not currently known to us or that we currently deem to be immaterial that may adversely affect our business, financial condition, operating results or share price in the future.
Risks Related to Our Business
Trends or events affecting our clients or their industries could decrease the demand for our products and services and the loss of, reduction of business with, or less favorable terms with any of our significant customers could materially harm our business and results of operations.
We derive our revenues from the delivery of products and services to clients primarily in the mutual fund, brokerage, investment management, healthcare, and other financial service (e.g., insurance, banking and financial planning) industries. Demand for our products and services among companies in those industries could decline for many reasons. If demand for our products decreases or any of the industries we serve decline or fail or consolidate, reducing the number of potential clients, our business and our operating results could be adversely affected.
On a consolidated basis, for the year ended December 31, 2016, our five largest customers (excluding BFDS and IFDS, our 50%-owned joint ventures with State Street) accounted for approximately 22.0% of our consolidated operating revenues. For the same period, the Healthcare Services segment’s five largest customers accounted for approximately 51.4% of our revenue in that segment, including 17.8% from its largest customer. Because of our significant customer concentration, particularly in the Healthcare Services segment, our revenue could fluctuate significantly due to changes in economic conditions, the use of competitive products, or the loss of, reduction of business with, or less favorable terms with any of our significant customers, and a delay or default in payment by any significant customer could materially harm our business and results of operations.
Events that adversely affect our clients’ businesses, rates of growth or numbers of customers they serve could decrease demand for our products and services and the number of transactions we process. Events that could adversely affect our clients’ businesses include decreased demand for our customers’ products and services, adverse conditions in our customers’ markets or adverse economic conditions generally. We may be unsuccessful in predicting the needs of changing industries and whether potential customers will accept our products or services. We also may invest in technology or infrastructure for specific customers and not realize additional revenue from such investments. If trends or events do not occur as we expect, our business could be negatively impacted.
7
We depend on information technology, and any failures of or damage to, attack on or unauthorized access to our information technology systems could result in significant costs and reputational damage.
We have developed and maintained, and our businesses depend on, information technology, including elements both internal and external, to record and process a large volume of complex transactions and other data, including personally identifiable information regarding financial and health matters. In certain circumstances, vendors have access to such data in order to assist us with responsibilities, such as producing benefit plan identification cards, maintaining software we license on our own behalf or resell to others, or helping clients comply with anti-money laundering regulations. Any interruptions, delays, breakdowns, or breach, including as a result of cybersecurity breaches or breaches of our environments and procedures or those of our vendors, could result in significant data losses or theft of our or our customers’ intellectual property, proprietary business information or personally identifiable information. In recent years, several health care and financial services firms were victims of computer systems hacking attacks, resulting in the disruption of services to clients, loss or misappropriation of sensitive or private data, and reputational harm. Rapid advances in technology, and the limits and costs of technology, skills and manpower, may prevent us from anticipating, identifying, preventing or addressing all potential security threats and breaches. A cybersecurity breach could negatively affect our reputation as a trusted product and service provider by adversely affecting the market’s perception of the security or reliability of our products or services. In addition, a system breach could result in other negative consequences, including remediation costs, disruption of internal operations, increased cybersecurity protection costs, lost revenues, regulatory penalties, and litigation.
The demand for our products and services could decrease if we do not continually address our clients’ technology and capacity requirements.
Our clients use technology-based products and services in the complex and rapidly changing markets in which they operate. We may not have effective and efficient processes to support the design, set-up, quality assurance, and maintenance activities for the timely implementation of new client services, migration of existing clients onto new or different platforms, and ongoing servicing that meets the needs of the business and clients. We must substantially invest in technology and systems to meet customer requirements for technology and capacity. If we do not meet clients’ technology and capacity requirements in advance of our competitors or if the investments we make are not cost-effective or do not result in successful products or services, our business could be adversely affected.
The success of the information technology transformation initiative will depend on the timing, extent and cost of implementation; performance of third-parties; upgrade requirements; and availability and reliability of the various technologies required to provide such transformation.
We must continually invest in our information technology in order to continually meet our clients’ needs. We are implementing a multi-year information technology transformation initiative intended to reduce operating costs, increase information security, upgrade infrastructure, implement automation, provide access to emerging technologies and position us to take advantage of market opportunities. If we fail to provide an enhanced client experience, our ability to retain and attract clients and to maintain and grow revenues could be adversely affected. Using new and sophisticated technology on a very large scale entails risks. For example, deployment of new software may adversely affect the performance of existing services on our existing platforms and decrease the customer experience. If implementation of our information technology transformation initiative were delayed or costs exceed expected amounts, our margins could be adversely affected and such effects could be material. If the delivery of services expected to be deployed on modernized architecture were delayed due to technological constraints, performance of third-party suppliers, or other reasons, the cost of providing such services could become higher than expected, which could result in higher costs to clients, potentially resulting in decisions to purchase services from our competitors, which would adversely affect our revenues, profitability and cash flow from operations.
We have made and may continue to make acquisitions and divestitures that involve numerous risks and uncertainties.
Our business strategy anticipates that we will supplement internal growth by pursuing acquisitions of complementary businesses. We may be unable to identify suitable businesses to acquire. We compete with other potential buyers for the acquisition of other complementary businesses. Information we obtain about an acquisition target may be limited and there can be no assurance that an acquisition will perform as expected or positively impact our financial performance. Potential acquisitions involve risk, including the risk we would be unable to effectively integrate the acquired technologies, operations and personnel into our business, and the risk that management’s attention and our capital would be diverted from other areas of our business. The anticipated benefits of our acquisitions may not materialize. Future acquisitions or dispositions could result in the issuance of capital stock, incurrence of debt, contingent liabilities or expenses, or write-offs of goodwill and other intangible assets, any of which could harm our financial condition. If we cannot complete acquisitions, our growth may be limited and our financial condition may be adversely affected.
8
In addition, we have divested, and may in the future divest, businesses that are no longer a part of our ongoing strategic plan. These divestitures similarly require significant investment of time and resources, may disrupt our business, distract management from other responsibilities and may result in continued responsibility for the divested business, including through indemnification, for a period of time following the transaction, which could adversely affect our financial results.
If our new investments and business initiatives are not successful, our financial condition and prospects could be adversely affected.
We are investing heavily in our technology to improve existing products and services and add new products and services to address the needs of existing or new clients. Our investments may not lead to successful deployment or increases in the number of accounts or transactions. If we are not successful in creating value from our investments by increasing sales or reducing expenses, our financial condition and prospects could be harmed.
An increase in subaccounting services performed by brokerage firms has and will continue to adversely impact our revenues.
We service open-end and closed-end funds registered under the Investment Company Act of 1940, including mutual funds, exchange-traded funds, interval funds and exchange-listed closed-end funds, as well as private funds, collective investment trusts and other accounts under shareowner recordkeeping arrangements which we refer to as registered accounts. These arrangements are distinguished from broker subaccounts, which are serviced under contract with a broker/dealer. Our clients may adopt the broker subaccount structure. We offer subaccounting services to brokerage firms that perform shareowner subaccounting. As the recordkeeping functions in connection with subaccounting are more limited than traditional shareowner accounting, the fees charged are generally lower on a per unit basis. Brokerage firms that obtain agreements from our clients to use a broker subaccount structure cause accounts currently on our traditional recordkeeping system to convert to our subaccounting system, or to the subaccounting systems of other service providers, which generally results in lower revenues. While subaccounting conversions have generally been limited to our non tax-advantaged mutual fund accounts, such conversions have begun to extend to the tax-advantaged accounts (such as retirement and Section 529 accounts) we service, which could adversely affect our business and operating results.
Consolidation in or among our customers and potential customers could result in a reduction of customers or reduction in use of our services.
Mergers or acquisitions of or consolidations among our customers or between our customers and other entities could reduce the number of our customers and potential customers and result in the discontinuation or reduction in use of our services. This could adversely affect our revenues even if these events do not reduce the aggregate number of customers or the activities of the consolidated entities. Any of these developments could materially and adversely affect our business, financial condition, operating results and cash flows.
Our businesses are subject to substantial competition.
We are subject to intense competition from other established service providers in all industries we serve. Some of our competitors are able to bundle service offerings and offer more appealing pricing structures. Some of our clients, or the clients they serve, may develop, have developed or are developing the in-house capacity to perform the transaction processing and recordkeeping services they have paid us to perform. Additionally, some of our competitors and clients have greater financial and human resources and access to capital than we do.
In the financial and healthcare markets we serve, we compete based on a variety of factors, including investment performance, the range of products offered, brand recognition, business reputation, financial strength, stability and continuity of client and other intermediary relationships, quality of service, and level of fees charged for services. We continue to face market pressures regarding fee levels in certain products and services offered.
Our failure to successfully compete in any of our material operating businesses could have a material adverse effect on our operating results. Competition could also affect the revenue mix of services we provide, resulting in decreased revenues in lines of business with higher profit margins.
9
We may not be able to sustain critical operations and provide essential products and services during system failures or catastrophic events.
Damage to our facilities could impact our operations or financial condition. The performance of our services also depends upon facilities that house central computer operations or operating centers. Significant damage to any of our operating facilities could interrupt the operations at those facilities and interfere with our ability to serve customers. Moreover, in the event of a catastropic event we may not be able to execute our business resumption strategies for data processing and capabilities, and we may not have the ability to recover critical data, programs, applications, and data processing capabilities in a timely manner; any of these could impact our ability to serve our clients.
We operate internationally and are thus exposed to currency fluctuations and foreign political, economic and other conditions that could adversely affect our revenues from or support by foreign operations.
Inherent risks in our international business activities could decrease our international sales and also could adversely affect our ability to receive important support from our international operations, which could have a material adverse effect on our overall financial condition, operating results, and cash flow. These risks include potentially unfavorable foreign economic conditions, political conditions or national priorities, foreign government regulation, potential expropriation of assets by foreign governments, changes in intellectual property legal protections and remedies, the failure to bridge cultural differences, and limited or prohibited access to our foreign operations and the support they provide. We may also have difficulty repatriating any profits or be adversely affected by currency fluctuations in our international business.
Various events may cause our financial results to fluctuate from quarter-to-quarter or year-to-year. The nature of these events might inhibit our ability to anticipate and act in advance to counter them.
We may be unsuccessful in determining or controlling when and whether events occur that could cause varying financial results. Unfavorable results may occur that we did not anticipate or take advance action to address. We incur significant costs to develop products used to service our existing and potential client operations. The timing of these expenses may fluctuate as new client contracts are signed or existing client contracts are renewed, causing our results to vary accordingly. Factors contributing to the variability of our results include increased costs of supplies, increased costs relating to existing and potential client operations, and hiring staff to develop new and existing products. The timing of our fees associated with new and existing client contracts, including changes in recognition as a result of changes in accounting principles, may also cause results to vary from period to period.
Our revenues may decrease due to declines in the levels of participation and activity in the securities markets.
We generate significant revenues from the transaction processing fees we earn for our services. These revenue sources are substantially dependent on the levels of participation and activity in the securities markets. The number of unique securities positions held by investors through our clients and our clients’ customer trading volumes reflect the levels of participation and activity in the markets, which are impacted by market prices and the liquidity of the securities markets, among other factors. We could continue to be negatively impacted by the volatile markets as certain of our fees are tied to the asset bases of our clients. The occurrence of significant market volatility or decreased levels of participation would likely result in reduced revenues and decreased profitability from our business operations. Additionally, we may be exposed to operational or other risks in connection with any systematic failures in the markets, or the default due to market-related failures of one or more counterparties with whom we transact.
We also derive significant revenues from asset management, administration and distribution contracts with clients. Under these contracts, the fees paid to us are based on a variety of factors, including the market value of assets under management (“AUM”), assets under administration (“AUA”) and number of transactions processed. AUM, AUA or the number of transactions processed may decline for various reasons, causing results to vary. Factors that could decrease AUM and AUA (and therefore revenues) include declines in the market value of the assets in the funds (and accounts as applicable) managed, administered and distributed, redemptions and other withdrawals from, or shifts among, the funds (and accounts as applicable) managed, administered and distributed, as well as market conditions generally.
Our revenues may decrease due to changes in asset management, administration and distribution fees and industry trends
The asset management, administration and distribution business is highly competitive and we compete for investors and clients on the basis of factors such as performance, reputation, service, and cost. Underperformance of any of our proprietary and client products, damage to our reputation, or service-related issues could lead to redemptions or terminations. Additionally, the asset management industry has generally been subject to fee compression and asset flows to lower cost products. Such a trend may result in fee compression in asset management, administration and distribution related contracts. The asset management, administration and distribution contracts may be terminated by the parties thereto, and the board of directors or trustees of
10
certain funds may terminate investment management, administration and distribution agreements for any reason and without penalty. The factors and trends described above could have a material adverse effect on revenues.
Investment decisions with respect to cash balances, market returns or losses on investments, and limits on insurance applicable to cash balances held in bank and brokerage accounts, including those held by us and as agent on behalf of our clients, could expose us to losses of such cash balances and adversely affect revenues attributable to cash balance deposit investments.
As part of our transaction processing and other services, we maintain and manage large bank and investment accounts containing client funds, which we hold as agent, as well as operational funds. Our revenues include investment earnings related to client fund cash balances. Our choices in selecting investments, or market conditions that affect the rate of return on or the availability of investments, could have an adverse effect on the level of such revenues. The amounts held in our operational and client deposit accounts could exceed the limits of government insurance programs of organizations such as the Federal Deposit Insurance Corporation and the Securities Investors Protection Corporation, exposing us to the risk of loss. Any substantial loss would have an adverse impact on our business and our financial condition.
Operational errors in the performance of our services or contractual obligations, as well as unknown or undetected defects, could lead to liability for claims, client loss and result in reputational damage.
The failure to properly perform our services or contractual obligations could result in our clients and/or certain of our subsidiaries being subjected to losses including censures, fines, or other sanctions by applicable regulatory authorities, and we could be liable to parties who are financially harmed by those errors. Despite testing, defects or errors may occur in our existing or new services, which could cause us to compromise customer data, lose revenues, lose clients, divert development resources, or damage our reputation, any of which could harm our business.
Our revenues could decrease if client contracts are terminated or fail to renew or if clients renegotiate contracts or utilize our services at lower than anticipated levels.
We derive most of our revenue by selling products and services under long-term contracts, many of which contain terms and conditions based on anticipated levels of utilization of our services. We cannot unilaterally extend the terms of our client contracts when they expire. Contracts can terminate during the term of agreement for various reasons, including through “termination for convenience” clauses in some contracts that enable clients to cancel by written notice. Our revenues could decrease as a result of terminations or non-renewals of client contracts; extensions of client contracts under, or contract re-negotiations resulting in, less favorable terms; or utilization of services at less than anticipated levels.
We are substantially dependent on our intellectual property rights, and a claim for infringement or a requirement to indemnify a client for infringement could adversely affect us.
We have made substantial investments in software and other intellectual property on which our business is highly dependent. Businesses we acquire also often depend on intellectual property portfolios, which increase the challenges we face in protecting our strategic advantage. Any disclosure, loss, invalidity of, or failure to protect our intellectual property could negatively impact our competitive position and, ultimately, our business. Our protection of our intellectual property rights in the U.S. or abroad may not be adequate and others, including our competitors, may use our proprietary technology without our consent. Furthermore, litigation may be necessary to enforce our intellectual property rights, to protect our trade secrets, or to determine the validity and scope of the proprietary rights of others. Such litigation could result in substantial costs and diversion of resources and could harm our business, financial condition, results of operations and cash flows.
To the extent available, we rely on patent, trade secret and copyright laws; however, significant portions of our proprietary intellectual property is not protected by patents. We also utilize nondisclosure and other contractual agreements and security measures to protect our proprietary technology. We cannot guarantee these measures will be effective. Our products and services rely on technology developed by others, including open source software, and we have no control over possible infringement of someone else’s intellectual property rights by the provider of this technology. The owner of the rights could seek damages from us rather than or in addition to the persons who provide the technology to us. We could be subject at any time to intellectual property infringement claims that are costly to evaluate and defend. Our clients may also face infringement claims, allege that such claims relate to our products and services, and seek indemnification from us. Any loss of our intellectual property rights, or any significant claim of infringement or indemnity for violation of the intellectual property rights, or any significant claim of infringement or indemnity for violation of the intellectual property rights of others, could have a material adverse effect on our financial condition, operating results, and cash flows.
11
Our investments in funds and other companies could decline in value.
We hold significant investments in available-for-sale equity securities of other companies, primarily State Street Corporation, and other financial interests that are subject to fluctuations in market prices. A significant decline in the value of our equity investments could have a material adverse effect on our financial condition or operating results. We may not always be able to sell those investments at higher prices than we paid for them or than the value of the consideration used to acquire them.
From time to time we add new investment strategies to our investment product offerings by providing the initial cash investments as “seed capital.” The seed capital investments may decline in value. A significant decline in their value could have a material adverse effect on our financial condition or operating results.
We are a limited partner in various private equity funds and have future capital commitments related to certain private equity fund investments. These investments are illiquid. Generally, private equity fund securities are non-transferable or are subject to long holding periods, and withdrawals from the private equity firm partnerships are typically not permitted. Even when transfer restrictions do not apply, there is generally no public market for the securities. Therefore, we may not be able to sell the securities at a time when we desire to do so. We may not always be able to sell those investments at the same or higher prices than we paid for them. We also participate in joint ventures with other companies. These joint venture investments could require further capital contributions.
We have restrictive covenants in our debt agreements, which may restrict our flexibility to operate our business. If we do not comply with these restrictive covenants, our failure could result in material and adverse effects on our operating results and our financial condition.
Our debt agreements contain customary restrictive covenants, including limitations on consolidated indebtedness, liens, investments, subsidiary investments, and asset dispositions, and require us to maintain certain leverage and interest coverage ratios. Failure to comply with these covenants could result in an event of default that, if not cured or waived, could result in reduced liquidity for the Company and could have a material adverse effect on our operating results and financial condition. In addition, an event of default or declaration of acceleration under one of our debt agreements could result in a cross default under one or more of our other debt agreements, including our financing agreements. This would have a material adverse impact on our liquidity, financial position and results of operation.
Regulatory and Litigation Risks
We and our unconsolidated affiliates are subject to regulation. Any regulatory violations, changes or uncertainties could adversely affect our business.
A number of our businesses are subject to U.S. or foreign regulation, including privacy, licensing, processing, recordkeeping, investment adviser, broker/dealer, retirement, reporting and related regulations. New products and services we plan to offer may also be subject to regulation, either directly or as a downstream provider to customers or clients. Such regulations cover all aspects of our businesses including, but not limited to, sales and trading methods, trade practices among broker/dealers, use and safekeeping of customers’ funds and securities, capital structure of securities firms, net capital, anti-money laundering efforts, healthcare, recordkeeping and the conduct of directors, officers and employees. Any violation of applicable regulations could expose us or those businesses to civil or criminal liability, significant fines or sanctions, damage our reputation, the revocation of licenses, censures, or a temporary suspension or permanent bar from conducting business, which could adversely affect our business or our financial results. Governmental changes, changing interpretation of regulations, and uncertainties surrounding services we provide could increase our costs of business, result in penalties, or diminish business, which could materially and adversely affect our financial results.
The SEC or other regulatory agencies may issue regulations impacting mutual fund service providers, which could adversely affect our business. The Department of Labor (“DOL”) recently issued fiduciary regulations that, if not delayed, repealed or substantially altered in the near future, are likely to impact our business.
The SEC or other regulatory agencies may issue regulations impacting third-party service providers of mutual funds and other fund-types products, such as distributors, administrators, or custodians, (collectively referred to as “mutual funds”), which could adversely affect our business. The SEC may issue additional regulations under the Dodd-Frank Wall Street Reform and Consumer Protection Act of 2010 (“Dodd-Frank Act”) or other legislative authority that would require brokers and financial intermediaries that distribute mutual funds to make more detailed fee disclosures at the point-of-sale. Additionally, brokers and financial intermediaries may become, in some instances, subject to a new DOL-imposed fiduciary standard-of-care that, if applicable, could cause them to alter their methods of distribution, share class structure, and/or wholesaling activities. It is not yet clear what impact they may have on such activities. It is also unclear whether the regulations will be delayed, repealed or substantially altered in the near future. We cannot predict all of the requirements the SEC or FINRA may impose. Regulations that would cause current distribution channels or interest in mutual fund investing to change could decrease the number of
12
accounts on our systems as a result of changes in client offerings or the attractiveness of offerings to customers of our clients. The biggest impact of the fiduciary regulations is expected to fall on brokers and registered investment advisers who give individualized non-discretionary advice in the “retail” marketplace, but discretionary investment managers in the “institutional” space are also expected to be affected, primarily in connection with sales of investment products and services. To the extent that our business units, clients, unaffiliated intermediary partners and retirement plan service providers fit into these categories, this could adversely affect our business and operating results. Additionally, to the extent the Dodd- Frank Act and/or DOL regulations impact the operations, financial condition, liquidity and capital requirements of unaffiliated financial institutions with whom we transact business, those institutions may seek to pass on increased costs, reduce their capacity to transact, or otherwise present inefficiencies in their interactions with us.
Our clients are subject to regulation that could affect our business.
Our clients are subject to extensive regulation, including investment adviser, broker/dealer and privacy regulations applicable to services we provide to the financial services industry and insurance, privacy and other regulations applicable to services we provide to the healthcare industry. Changes in, and any violation by our clients of, applicable laws and regulations (whether related to the services we provide or otherwise) could diminish their business or financial condition and thus their demand for our products and services or could increase our cost of continuing to provide services to such industries. Demand could also decrease if we do not continue to offer products and services that help our clients comply with regulations. For example, our accounts in our Healthcare Services segment are impacted by the Affordable Care Act, including the Health Insurance Marketplace. Changes to the Affordable Care Act may be enacted by Congress in response to the new administration’s stated agenda, and we cannot predict the impact that will have on our customers and their demand for our services.
Our businesses expose us to risks of claims and losses that could be significant and damage our reputation and business prospects.
Our proprietary applications and related consulting and other services include the processing or clearing of financial and healthcare transactions for our clients and their customers and the design of benefit plans and compliance programs. The dollar amount of transactions processed or cleared is vastly higher than the revenues we derive from providing these services. In the event we make transaction processing or operational errors, or mismanage any process, we could be exposed to claims for any resulting processing delays, disclosure of protected information, miscalculations, mishandling of pass-through disbursements or other processes, and failure to follow a client’s instructions or meet specifications. Additionally, we may be subject to claims or liability resulting from a failure of third parties (including regulatory authorities) to recognize the limitations of our role as our clients’ agent or consultant, and we may be subject to claims or liability resulting from fraud committed by third parties. We may be exposed to the risk of counterparty breaches or failure to perform. We may be subject to claims, including class actions, for reimbursements, losses or damages arising from any transaction processing or operational error, or from process mismanagement. Because of the sensitive nature of the financial and healthcare transactions we process, our liability and any alleged damages may significantly exceed the fees we receive for performing the service at issue. Litigation could include class action claims based upon, among other theories, various regulatory requirements and consumer protection and privacy laws that class action plaintiffs may attempt to use to assert private rights of action. Any of these claims and related settlements or judgments could affect our operating results, damage our reputation, decrease demand for our services, or cause us to make costly operating changes.
Risks Related to Corporate Governance or our Equity Securities
We do not control certain businesses in which we have significant ownership.
We invest in joint ventures and other unconsolidated affiliates as part of our business strategy, and part of our net income is derived from our pro rata share of the earnings of those businesses. Despite owning significant equity interests in those companies and having directors on their boards, we do not control their operations, strategies or financial decisions. The other owners may have economic, business or legal interests or goals that are inconsistent with our goals or the goals of the businesses we co-own. Our pro rata share of any losses due to unfavorable performance of those companies could negatively impact our financial results.
13
Some of our joint venture investments are subject to buy-sell agreements, which could, among other things, restrict us from selling our interests even if we were to determine it would be prudent to do so.
We own interests in unconsolidated entities, including Boston Financial Data Services, International Financial Data Services Limited Partnership, International Financial Data Services Limited, and various real estate joint ventures. Our interests in such unconsolidated entities are subject to buy/sell arrangements, which could restrict our ability to sell our interests even if we were to determine it would be prudent to do so. These arrangements could also allow us to purchase the other owners’ interests to prevent someone else from acquiring them and we cannot control the timing of occasions to do so. The businesses or other owners may encourage us to increase our investment in or make contributions to the businesses at an inopportune time.
Various plans, agreements, laws and organizational documents may have anti-takeover effects.
Provisions in our Certificate of Incorporation, Bylaws, certain plans and agreements, and applicable laws could make it more difficult for a party to make a tender offer for our shares or complete a takeover that is not approved by our Board of Directors. The provisions include:
• | super-majority stockholder approval required for certain actions; |
• | specific procedures for stockholders to nominate new directors; |
• | the Board’s authority to issue and set the terms of preferred stock; |
• | various rights of joint venture co-owners, lenders and certain customers and executives in the event of a change in control; |
• | public reporting of ownership and of changes in ownership by stockholders with at least a 5% interest in us; and |
• | legal restrictions on business combinations with certain stockholders. |
Because of contractual commitments, a change in control could affect our operating results and weaken our management retention and incentive tools.
A change in control of the Company could trigger various rights and obligations in service agreements with certain customers and in agreements governing our joint ventures. A change in control could also allow some clients to terminate their agreements with us or to obtain rights to use our processing software. We are parties to joint venture agreements that allow other co-owners to buy our equity interests if we undergo a change in control. Under certain executive equity-based and other incentive compensation awards, benefit programs and employment agreements with our management, a change in control by itself, or an individual’s termination of employment without “cause” or resignation for “good reason” (each as defined in applicable agreements) after a change in control could accelerate funding, payment or vesting of equity grants, as applicable, under such agreements and programs. This accelerated funding, vesting or payment may decrease an employee’s incentive to continue employment with us. We have adopted an executive severance plan which, among other things, provides benefits to participating senior officers and executives who are terminated in connection with a change of control. Certain other executive officers have agreements with us that require us to continue to employ them for three years after a change in control or to pay certain amounts if we terminate their employment without cause or they resign for good reason following a change in control. The executives might not be incented to achieve desired results for the new owners of our business, and the cost of keeping the executives on the payroll might deter potential new owners from acquiring us or hinder new owners from hiring replacement management.
We may not pay cash dividends on our common stock in the future.
Future cash dividends will depend upon our financial condition, earnings and other factors deemed relevant by our Board of Directors. Payment of dividends is subject to applicable laws and to restrictions in applicable debt agreements.
Item 1B. Unresolved Staff Comments
None.
Item 2. Properties
Our main operating facilities, including our corporate headquarters, are located in Kansas City, Missouri and consist of 1.1 million square feet of office space, of which 54% is owned and 46% is leased, and 162,000 square feet of owned data center space. Additionally, we own an aggregate 222,000 square feet of space consisting primarily of a back-up data center in St. Louis, Missouri and office space in California and the United Kingdom. We lease an aggregate of 697,000 square feet of other office space and production space in North America, India, Thailand, Australia and Canada. Of the 2.2 million square feet of space identified above, the Company leases and subleases approximately 153,000 square feet to third-parties. Approximately 81%, 16% and 3% of the remaining square footage is utilized by the Financial Services, Healthcare Services and Investments and Other segments, respectively. In addition, we also lease approximately 556,000 square feet of other office space and
14
production space in the United Kingdom for operations that are included within our discontinued operations. We also own undeveloped land in Kansas City, Missouri and California and an underground facility with approximately 538,000 square feet in Kansas City, Missouri, of which 497,000 square feet is leased to third parties. Our real estate joint ventures own 2.7 million square feet of real estate, of which 2.2 million square feet is occupied by third parties or is vacant. We believe our facilities are currently adequate for their intended purposes and are adequately maintained.
The following table summarizes the square footage of U.S. real estate facilities wholly-owned by DST or owned through unconsolidated affiliates of DST as of December 31, 2016 (in millions):
DST wholly-owned (1) | Joint venture-owned (2) | ||||
Occupied by DST or unconsolidated affiliates | 0.5 | 0.5 | |||
Occupied by third parties or vacant | 0.2 | 2.2 | |||
Total | 0.7 | 2.7 | |||
_______________________________________________________________________
(1) | Amounts exclude square footage of wholly-owned data centers and an underground facility located below our Kansas City, Missouri data center |
(2) | Amounts exclude a joint venture-owned 1,000 room convention hotel and facilities owned and occupied by BFDS and IFDS |
Item 3. Legal Proceedings
We are involved in various legal proceedings arising in the normal course of our businesses. While the ultimate outcome of such legal proceedings cannot be predicted with certainty, management believes, after consultation with legal counsel, that the final outcome in such proceedings, in the aggregate, would not have a material adverse effect on our consolidated financial condition, results of operations or cash flows.
Item 4. Mine Safety Disclosures
None.
15
Executive Officers of the Registrant
The following list presents certain information with respect to each of our executive officers as of February 28, 2017.
Jonathan J. Boehm, age 56, is our Executive Vice President and Head of our Healthcare businesses. He re‑joined the Company in 1997 after prior service in the early 1980s. Prior to becoming an Executive Vice President managing our Healthcare businesses in 2009, he served as Group Vice President - Mutual Funds Full Service. He is responsible for our Healthcare Services segment, including DST HealthCare Holdings, Inc. and its subsidiaries DST Health Solutions and Argus Health Systems.
Edmund J. Burke, age 56, is our Executive Vice President and President of ALPS. ALPS includes the Corporation’s investment management and asset servicing businesses. ALPS Holdings, Inc. became a wholly‑owned subsidiary of the Company during 2011. Mr. Burke joined ALPS in 1991 and has served as President since 2000. As part of his responsibilities for the ALPS group of companies, Mr. Burke is President and Trustee of Clough Global Long/Short Fund, Clough Global Allocation Fund, Clough Global Equity Fund and Clough Global Opportunities Fund; Trustee of Liberty All‑Star Equity Fund; Director of Liberty All‑Star Growth Fund, Inc., and Chairman of the Board and President of Financial Investors Trust. Each of these funds operates as a registered investment company pursuant to the Investment Company Act of 1940.
Gregg Wm. Givens, age 56, is our Senior Vice President, Chief Financial Officer and Treasurer. He assumed the roles of Chief Financial Officer and Treasurer in January of 2014. He joined the Company in 1996 as an officer and served as Vice President and Chief Accounting Officer from 1999 through 2013.
Stephen C. Hooley, age 53, is our Chairman of the Board, Chief Executive Officer and President. He became Chief Executive Officer on September 12, 2012 and Chairman of the Board in July 2014. He joined the Company in mid‑2009 as President and Chief Operating Officer. He served from 2004 through mid‑2009 as President and Chief Executive Officer of BFDS. He served from 2009 through April 2013 as non‑executive Chairman of BFDS. From 2007 through March 2013, he served as Chief Executive Officer of IFDS L.P.
Vercie L. Lark, age 54, is our Executive Vice President and Head of our Financial Services businesses. He joined the Company as Vice President and Chief Information Officer in June 2010 and assumed his current title in April 2016. Mr. Lark previously served since July 2009 as Vice President and Chief Information Officer of CenturyLink, Inc., a provider of voice, broadband and video services. He had served since 2008 as the Chief Information Officer of Embarq Corporation, which was acquired in 2009 by CenturyLink.
Maria Mann, age 54, is Senior Vice President and Chief Information Officer. She joined the Company in April 2016. From 2011 through April 2016, she served as Chief Technology Officer at JP Morgan Chase and Co., a multinational banking and financial services holding company. She is responsible for our global information technology infrastructure and architecture functions, global information privacy and security, and global information technology sourcing as well as risk and corporate applications.
William Slattery, age 61, is Chief Executive Officer of DSTi Holdings Limited and Chairman of IFDS Ltd. He joined the Company in January 2017. Prior to joining DST, Mr. Slattery was Head of the Investment Servicing business for State Street Europe and held various executive positions at State Street since 2003. Before joining State Street, Mr. Slattery was Managing Director and Head of Global Risk Management at Deutsche Asset Management and Member of the Group Risk Board of Deutsche Bank AG. His earlier career included 23 years at the Central Bank of Ireland, including senior leadership roles with responsibility of Ireland’s International Financial Services Centre and as Deputy Head of Banking Supervision. Mr. Slattery, who has over 30 years in the financial services industry, was a former Chairman of Financial Services Ireland and was a member of the Public Expenditure Review Group.
Mary E. Sweetman, age 53, is Senior Vice President and Chief Human Resources Officer. She joined the Company in June 2013 as a vice president and assumed her current title in March 2014. Prior to joining the Company, she had served since 2007 as Senior Vice President, Human Resources for Furniture Brands International, a home furnishings designer and manufacturer that, following her departure from that company, filed for bankruptcy in September 2013.
Randall D. Young, age 60, became Senior Vice President, General Counsel and Secretary in mid‑2013. Since 2002, he had served as Vice President, General Counsel and Secretary. He joined the Company as a Vice President in 1995.
16
PART II
Item 5. Market for the Registrant’s Common Equity, Related Stockholder Matters and Issuer Purchases of Equity Securities
The Company’s common stock trades under the symbol “DST” on the New York Stock Exchange (“NYSE”). As of February 13, 2017, there were approximately 35,600 beneficial owners of our common stock.
The following table provides the quarterly prices of, and quarterly cash dividends paid on, the Company’s common stock for the two-year period ended December 31, 2016. Future cash dividends will depend upon financial condition, earnings and other factors deemed relevant by DST’s Board of Directors. Payment of dividends is subject to applicable laws and to restrictions in applicable debt agreements. On January 25, 2017, the DST Board of Directors declared a quarterly cash dividend of $0.35 per share on DST’s common stock. The dividend will be payable on March 10, 2017, to stockholders of record at the close of business on February 24, 2017.
Dividend | High | Low | |||||||||
2015 | |||||||||||
1st Quarter | $ | 0.30 | $ | 109.81 | $ | 91.95 | |||||
2nd Quarter | 0.30 | 125.70 | 109.68 | ||||||||
3rd Quarter | 0.30 | 133.42 | 95.03 | ||||||||
4th Quarter | 0.30 | 124.52 | 105.08 | ||||||||
2016 | |||||||||||
1st Quarter | $ | 0.33 | $ | 111.80 | $ | 97.92 | |||||
2nd Quarter | 0.33 | 120.79 | 106.15 | ||||||||
3rd Quarter | 0.33 | 125.07 | 115.73 | ||||||||
4th Quarter | 0.33 | 117.08 | 94.63 | ||||||||
The prices set forth above do not include commissions and do not necessarily represent actual transactions. The closing price of our common stock on the NYSE on December 31, 2016 was $107.15.
Stock Repurchases
The following table sets forth information with respect to shares of our common stock purchased by us during the quarter ended December 31, 2016.
Period | Total Number of Shares Purchased | Average Price Paid Per Share | Total $ Amount of Shares Purchased as Part of Publicly Announced Plans or Programs | Maximum Amount That May Yet Be Purchased Under the Plans or Programs | ||||||||||||
October 1 - October 31 | 675,677 | (1) | $ | 111.09 | $ | 74,999,936 | $ | 150,000,077 | ||||||||
November 1 - November 30 | 567 | (1) | 103.47 | — | 150,000,077 | |||||||||||
December 1 - December 31 | 234 | (1) | 107.65 | — | 150,000,077 | |||||||||||
Total | 676,478 | $ | 111.31 | $ | 74,999,936 | $ | 150,000,077 | (2) | ||||||||
_______________________________________________________________________
(1) | For the three months ended December 31, 2016, we purchased, in accordance with the 2015 Equity and Incentive Plan, 1,383 shares of our common stock for participant income tax withholding in conjunction with stock option exercises or from the vesting of restricted stock shares, as requested by the participants or from shares surrendered in satisfaction of option exercise price. These purchases were not made under the publicly-announced repurchase plans or programs, but were allowed by the rules of the Compensation Committee of our Board of Directors. Of these shares, 582 shares were purchased in October 2016, 567 shares were purchased in November 2016, and 234 shares were purchased in December 2016. |
(2) | On June 13, 2016 our Board of Directors authorized a new $300.0 million share repurchase plan. The plan allows, but does not require, the repurchase of common stock in open market and private transactions. The plan does not have an expiration date. We have entered and may enter into one or more plans with our brokers or banks for pre-authorized purchases within defined limits pursuant to Rule 10b5-1 to affect all or a portion of such share repurchases. |
17
Stock Performance Graph
The following graph shows the changes in value since December 31, 2011 of an assumed investment of $100 in: (i) DST Common Stock; (ii) the stocks that comprise the S&P 400 MidCap index(1); and (iii) the stocks that comprise the S&P 400 MidCap Index - Information Technology Sector(1) (“S&P MidCap IT Index”). The table following the graph shows the dollar value of those investments as of December 31, 2016 and as of December 31 for each of the five preceding years. The value for the assumed investments depicted on the graph and in the table has been calculated assuming that cash dividends, if any, are reinvested at the end of each quarter in which they are paid.
Comparison of Cumulative Five Year Total Return
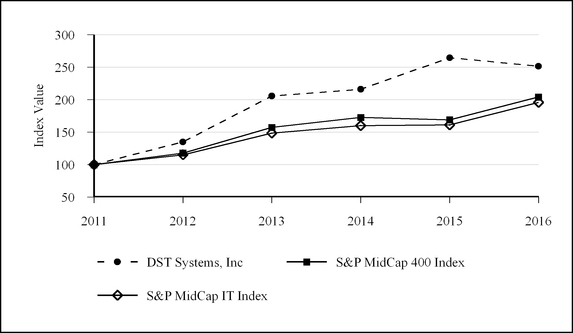
As of December 31, | |||||||||||||||||||||||
2011 | 2012 | 2013 | 2014 | 2015 | 2016 | ||||||||||||||||||
DST Systems, Inc | $ | 100.00 | $ | 135.05 | $ | 205.56 | $ | 216.01 | $ | 264.52 | $ | 251.44 | |||||||||||
S&P MidCap 400 Index | 100.00 | 117.88 | 157.37 | 172.74 | 168.98 | 204.03 | |||||||||||||||||
S&P MidCap IT Index | 100.00 | 115.21 | 148.38 | 160.13 | 161.11 | 195.70 | |||||||||||||||||
_______________________________________________________________________
(1) | Standard & Poor’s Corporation, an independent company, prepares the S&P 400 MidCap Index and the S&P Midcap IT Index. |
18
Item 6. Selected Financial Data
The following table sets forth selected consolidated financial data of the Company. The selected consolidated financial data should be read in conjunction with and are qualified by reference to “Management’s Discussion and Analysis of Financial Condition and Results of Operations” included in Item 7 of this Form 10-K and our audited consolidated financial statements, including the notes thereto, and the report of the independent registered public accounting firm thereon and the other financial information included in Item 8 of this Form 10-K. We completed the sale of our North American Customer Communications business in 2016 and our Board of Directors approved a plan for management to pursue the divestiture of our United Kingdom Customer Communications business. As a result, the Customer Communications segment, as well as certain business previously reported in the Financial Services segment that were part of the 2016 sale, have been reported as discontinued operations and excluded from the amounts in the table below. Prior period amounts have been adjusted to be consistent with the current period presentation.
Year Ended December 31, | |||||||||||||||||||
2016 (1) | 2015 (2) | 2014 (3) | 2013 (4) | 2012 (5) | |||||||||||||||
Income Statement Data: | (dollars in millions, except per share amounts) | ||||||||||||||||||
Operating revenues (excluding out-of-pockets) | $ | 1,474.4 | $ | 1,405.0 | $ | 1,445.5 | $ | 1,368.2 | $ | 1,277.8 | |||||||||
Operating income | 247.3 | 232.7 | 262.7 | 271.8 | 202.9 | ||||||||||||||
Other income, net | 22.7 | 204.5 | 373.1 | 242.8 | 373.3 | ||||||||||||||
Income from continuing operations before income taxes and non-controlling interest | 279.2 | 458.8 | 744.7 | 503.1 | 565.0 | ||||||||||||||
Income from continuing operations attributable to DST Systems, Inc. | 179.0 | 309.7 | 560.8 | 324.7 | 383.7 | ||||||||||||||
Basic earnings per share - Continuing operations attributable to DST Systems, Inc. (6) | 5.43 | 8.60 | 14.01 | 7.51 | 8.55 | ||||||||||||||
Diluted earnings per share - Continuing operations attributable to DST Systems, Inc. (6) | 5.37 | 8.50 | 13.86 | 7.37 | 8.38 | ||||||||||||||
Non-GAAP diluted earnings per share - Continuing operations attributable to DST Systems, Inc. (6) (7) | 5.73 | 4.93 | 4.97 | 4.22 | 3.98 | ||||||||||||||
Cash dividends per share of common stock | 1.32 | 1.20 | 1.20 | 1.20 | 0.80 | ||||||||||||||
December 31, | |||||||||||||||||||
2016 (1) | 2015 (2) | 2014 (3) | 2013 (4) | 2012 (5) | |||||||||||||||
Balance Sheet Data: | (dollars in millions) | ||||||||||||||||||
Total assets | $ | 2,771.8 | $ | 2,813.2 | $ | 2,942.9 | $ | 3,090.5 | $ | 3,392.5 | |||||||||
Total debt | 508.2 | 562.1 | 546.8 | 675.6 | 1,003.7 | ||||||||||||||
Stockholders’ equity | 1,115.2 | 1,046.0 | 1,236.4 | 1,183.8 | 1,079.7 | ||||||||||||||
_______________________________________________________________________
(1) | In 2016, we acquired Kaufman Rossin Fund Services LLC. Additionally, we recorded net gains on securities and other investments of $16.3 million, which is included in Other income, net, in the Consolidated Statement of Income. |
(2) | In 2015, we acquired the following businesses: kasina LLC, Red Rocks Capital LLC and Wealth Management Systems Inc. Additionally, we recorded net gains on securities and other investments of $199.3 million, which is included in Other income, net, in the Consolidated Statement of Income. |
(3) | In 2014, we recorded a pretax gain of $100.5 million on the sale of the wholly-owned subsidiary, DST Global Solutions, Ltd., which is included in Gain on sale of business in the Consolidated Statement of Income. In addition, we recorded net gains on securities and other investments of $343.5 million, which were included in Other income, net on the Consolidated Statement of Income. |
(4) | In 2013, we recorded net gains on securities and other investments of $222.8 million, which were included in Other income, net on the Consolidated Statement of Income |
(5) | In 2012, we recorded net gains on securities and other investments of $293.7 million and dividend income from a private company investment of $48.4 million, both of which are included in Other income, net, in the Consolidated Statement of Income. |
(6) | During the years ended December 31, 2016, 2015, 2014, 2013, and 2012, we repurchased 2.7 million, 3.6 million, 4.7 million, 3.8 million and 1.8 million shares of our common stock, respectively. |
19
(7) | Non-GAAP diluted earnings per share have been calculated by taking into account the impact of certain items that are not necessarily ongoing in nature, do not have a high level of predictability associated with them or are non-operational items. Management believes the exclusion of these items provides a useful basis for evaluating underlying business unit performance, but non-GAAP diluted earnings should not be considered in isolation and is not in accordance with, or a substitute for, evaluating business unit performance utilizing GAAP financial information. A description of the use of non-GAAP financial information and a reconciliation of diluted earnings per share from continuing operations attributable to DST Systems, Inc. and non-GAAP diluted earnings per share from continuing operations attributable to DST Systems, Inc. is below. |
Use of Non-GAAP Financial Information
In addition to reporting financial information in accordance with accounting principles generally accepted in the United States of America (“GAAP”), we have disclosed non-GAAP financial information which has been reconciled to the corresponding GAAP measures in the following financial schedules titled “Reconciliation of Reported Diluted Earnings per Share to Non-GAAP Diluted Earnings per Share - Continuing Operations Attributable to DST Systems, Inc.” In making these adjustments to determine the non-GAAP results, we take into account the impact of items that are not necessarily ongoing in nature, that do not have a high level of predictability associated with them or that are non-operational in nature. Generally, these items include net gains on dispositions of business units, net gains (losses) associated with securities and other investments, restructuring and impairment costs, and other similar items. Beginning in 2016, we have also included acquired intangible asset amortization for all periods presented. Management believes the exclusion of these items provides a useful basis for evaluating underlying business unit performance, but should not be considered in isolation and is not in accordance with, or a substitute for, evaluating business unit performance utilizing GAAP financial information. Management uses non-GAAP measures in its budgeting and forecasting processes and to further analyze our financial trends and “operational run-rate,” as well as in making financial comparisons to prior periods presented on a similar basis. We believe that providing such adjusted results allows investors and other users of our financial statements to better understand our comparative operating performance for the periods presented.
DST’s management uses each of these non-GAAP financial measures in its own evaluation of our performance, particularly when comparing performance to past periods. Our non-GAAP measures may differ from similar measures by other companies, even if similar terms are used to identify such measures. Although our management believes non-GAAP measures are useful in evaluating the performance of our business, we acknowledge that items excluded from such measures may have a material impact on our financial information calculated in accordance with GAAP. Therefore, management typically uses non-GAAP measures in conjunction with GAAP results. These factors should be considered when evaluating our results.
Reconciliation of Reported Diluted Earnings per Share to Non-GAAP Diluted Earnings per Share - Continuing Operations Attributable to DST Systems, Inc.
Year Ended December 31, | |||||||||||||||||||
2016 | 2015 | 2014 | 2013 | 2012 | |||||||||||||||
Reported GAAP Diluted Earnings per Share | $ | 5.37 | $ | 8.50 | $ | 13.86 | $ | 7.37 | $ | 8.38 | |||||||||
Adjusted to remove: | |||||||||||||||||||
Net gains on securities and other investments | (0.33 | ) | (3.42 | ) | (5.26 | ) | (3.14 | ) | (4.54 | ) | |||||||||
Amortization of intangible assets | 0.44 | 0.32 | 0.28 | 0.25 | 0.29 | ||||||||||||||
Restructuring charges | 0.30 | 0.06 | 0.20 | 0.06 | 0.25 | ||||||||||||||
Income tax items | 0.12 | (0.43 | ) | (0.91 | ) | (0.24 | ) | (0.40 | ) | ||||||||||
Net gain on sale of business | (0.16 | ) | — | (2.64 | ) | — | — | ||||||||||||
Software impairment | 0.11 | — | — | — | — | ||||||||||||||
Reversal of accrued contingent consideration | (0.12 | ) | — | — | — | — | |||||||||||||
Equity in earnings of unconsolidated affiliates items | — | (0.06 | ) | (0.09 | ) | (0.10 | ) | (0.20 | ) | ||||||||||
Business development/advisory expenses | — | 0.02 | 0.09 | — | 0.02 | ||||||||||||||
Net (gains) losses on real estate assets | — | (0.06 | ) | — | 0.04 | 0.09 | |||||||||||||
Gain on contract to repurchase common stock | — | — | (0.45 | ) | — | — | |||||||||||||
Loss accruals (loss accrual reversal) | — | — | (0.12 | ) | 0.06 | 0.04 | |||||||||||||
Charitable contribution of securities | — | — | 0.01 | — | (0.06 | ) | |||||||||||||
Contract termination payments received, net | — | — | — | (0.08 | ) | — | |||||||||||||
Insurance Solutions asset impairment and other costs | — | — | — | — | 0.11 | ||||||||||||||
Adjusted Non-GAAP Diluted Earnings per Share | $ | 5.73 | $ | 4.93 | $ | 4.97 | $ | 4.22 | $ | 3.98 | |||||||||
20
Item 7. Management’s Discussion and Analysis of Financial Condition and Results of Operations
FORWARD LOOKING STATEMENTS
This report contains “forward-looking statements” - that is, statements related to future, not past, events. In this context, forward-looking statements often address our expected future business and financial performance and financial condition, and often contain words such as “expect,” “anticipate,” “intend,” “plan,” “believe,” “seek,” “see,” “will,” “would,” or “target.” Forward-looking statements by their nature address matters that are, to different degrees, uncertain.
For us, particular risks and uncertainties that could cause our actual results to be materially different than those expressed in our forward-looking statements include:
• | the effects of competition in the businesses in which we operate; |
• | changes in customer demand and our ability to provide products and services on terms that are favorable to us; |
• | changes in law, economic and financial conditions; |
• | the impacts of breaches or potential breaches of network, information technology or data security, natural disasters, terrorist attacks or acts of war or significant litigation and any resulting financial impact not covered by insurance; |
• | our investments in joint ventures or other unconsolidated affiliates; for example, some of our joint venture investments are subject to contractual obligations which could restrict us from selling such interests; |
• | the effectiveness of our risk management framework; |
• | the impact of regulation and regulatory, investigative and legal proceedings and legal compliance risks, including the impact of financial services regulation and litigation and potential SEC or DOL regulations impacting third-party distributors of mutual funds; |
• | our investments in funds and other companies may decline; |
• | our ability to successfully complete acquisitions or integrate acquired businesses; and |
• | the other factors that are described in Item 1A, “Risk Factors” of this Form 10-K. |
These or other uncertainties may cause our actual future results to be materially different than those expressed in our forward-looking statements. We do not undertake to update our forward-looking statements. This document includes certain forward-looking projected financial information that is based on current estimates and forecasts. Actual results could differ materially.
Future economic and industry trends that could potentially impact our financial statements or results of operations are difficult to predict. These forward-looking statements are based on information as of the date of this report and we assume no obligation to publicly update or revise our forward-looking statements even if experience or future changes make it clear that any projected results expressed or implied therein will not be realized.
Introduction
DST Systems, Inc. and our consolidated subsidiaries (“we,” “our,” “us,” the “Company” or “DST”) use proprietary software applications to provide sophisticated information processing and servicing solutions through strategically unified data management and business processing solutions to clients globally within the asset management, brokerage, retirement, healthcare and other markets. Our wholly-owned data centers provide the secure technology infrastructure necessary to support our solutions.
We manage our business through two operating segments: Financial Services and Healthcare Services. Our investments in equity securities, private equity investments, real estate and certain financial interests have been aggregated into an Investments and Other segment.
In connection with the execution of our strategic plan, which includes focusing on the Financial Services and Healthcare markets, we sold our North American Customer Communications business for cash consideration of $410.7 million on July 1, 2016. We recorded a pretax gain of $341.5 million on the sale during 2016. Additionally, during the second quarter 2016, our Board of Directors approved a plan for management to divest of our U.K. Customer Communications business. As a result of this significant shift in the strategic direction of our operations, we have classified the results of the businesses sold and being sold as discontinued operations in our Consolidated Statement of Income for all periods presented. The net after-tax proceeds from the sale are being used in accordance with the Company’s capital plan, including investments in the business, share repurchases, strategic acquisitions, debt repayments and other corporate purposes.
21
Financial Services Segment
DST’s proprietary software applications enable us to offer our customers information processing solutions that enable them to capture, analyze and report their investors’ transactions. Examples of the services we provide include tracking of purchases, redemptions, exchanges and transfers of shares; maintaining investor identification and ownership records; reconciling cash and share activity; processing dividends; reporting sales; performing tax and other compliance functions; and providing information for printing of investor trade confirmations, statements and year-end tax forms.
Services are provided either under a remote processing model or on a BPO basis. Our BPO service offerings are enhanced by our proprietary workflow software, AWD, which is also licensed separately to third parties.
In the U.S. we provide services to mutual funds, brokerage firms, retirement plans and alternative investment funds (such as real estate investment trusts) either directly or through BFDS, our joint venture with State Street. In Australia and the U.K., we license software solutions to funds and fund managers, who perform participant accounting and recordkeeping for the wealth management and retirement savings market. We also provide investor services on a Remote and BPO basis internationally (U.K., Canada, Ireland and Luxembourg) solely through IFDS U.K. and IFDS L.P., which are joint ventures with State Street.
Financial Services fees are primarily charged to the client based on the number of accounts, participants or transactions processed. For subaccounts, a portion of the services we provide for registered accounts are provided directly by the broker/dealer. As a result, our revenue per account is generally higher for registered accounts than for subaccounts. On a more limited basis, we also generate revenue through asset-based fee arrangements and from investment earnings related to cash balances maintained in our full service transfer agency bank accounts. We typically have multi-year agreements with our clients. We receive revenues for processing services and products provided under various agreements with unconsolidated affiliates. We believe that the terms of our contracts with unconsolidated affiliates are fair to us and are no less favorable to us than those obtained from unaffiliated parties. Our operating revenues derived from sales to unconsolidated affiliates, primarily BFDS and IFDS, were $138.5 million, $134.9 million and $135.1 million for the years ended December 31, 2016, 2015, and 2014, respectively.
We continue to evaluate the products and services we offer within the Financial Services segment and have identified certain offerings in which the increased risk and required investment resulting from recent regulations outweighs the benefit we expect to receive. As a result of this evaluation, during 2016 we made the decision to exit certain non-core products and services. We expect the exit of these businesses will result in approximately $8.6 million less operating revenue and $3.8 million less operating income on an annual basis. Additionally, in November 2016, we sold a wholly-owned foreign subsidiary that provides water billing software and services solutions for cash consideration of approximately $6.1 million, subject to customary working capital post-closing adjustments. This business had approximately $5.4 million of operating revenue and $1.2 million of operating income on an annual basis. As these decisions were the result of a tactical review of our products and services, and not the result of a significant shift in strategic direction, the revenue and operating income from these products and services are included within our continuing operations. We are also continuing to monitor changes in the financial services industry, including the shift from direct products to fee-based platforms which could reduce the number of direct mutual fund registered accounts we service.
On February 24, 2016, we acquired all of the membership interests of KRFS, for $94.7 million in cash, after giving effect to a $0.3 million adjustment agreed upon in June 2016 to settle working capital under the terms of the agreement. KRFS is an independent, full-service provider of specialized hedge fund administration services to the global financial community. KRFS’ hedge fund services include accounting and valuation, back-office outsourcing, investor services, treasury services, and customized reporting. We expect the acquisition to provide us with additional opportunities within the alternative investment marketplace and expand our asset administration service offerings.
During 2015, we acquired all of the membership interests of kasina LLC, a strategic advisory firm to the asset management industry, and Red Rocks Capital LLC, an asset manager which focuses on listed private equity and other private asset investments. In 2015, we also acquired all of the outstanding common stock of Wealth Management Systems Inc., a provider of technology-based rollover services in the retirement marketplace.
In December 2015, we entered into a ten year contract with a new client to provide both subaccounting and mutual fund servicing solutions. The client converted approximately 10.0 million subaccounts onto our platform during 2016 and based on current volumes, is expected to convert approximately 2.3 million registered accounts onto our platform by the end of 2017. Implementation efforts have resulted in increased costs that are expected to continue through 2017 as we convert the client onto our platform.
During 2014, we sold our wholly-owned U.K. subsidiary, DST Global Solutions Limited and certain related affiliates (together, “Global Solutions”). Global Solutions provided post-trade, middle-, and back-office investment management software applications, implementation and other professional services.
22
Healthcare Services Segment
The Healthcare Services segment uses our proprietary software applications to provide healthcare organizations a variety of medical and pharmacy benefit solutions to satisfy their information processing, quality of care, cost management concerns and payment integrity programs, while achieving compliance and improving operational efficiencies. Our healthcare solutions include claims adjudication, benefit management, care management, business intelligence and other ancillary services. We also continue to expand and enhance our Healthcare Services’ offerings to ensure we are able to address the changing needs of our clients within the complex and highly regulated health industries which we serve. For example, our pharmacy management business continues to make investments to expand our clinical, network, and analytic capabilities to help our customers and prospective customers achieve the best possible outcomes for their members and to allow us to more effectively compete in the broader competitive pharmacy benefit manager (“PBM”) market. Historically, we have acted as an agent within our pharmacy-solutions business and, accordingly, recognized revenue on a net basis. As our enhanced products evolve and we expand our pharmacy-solutions service offerings, we will evaluate the provisions within our new pharmacy network and customer contracts to determine whether we are acting as a principal or an agent in the transactions. If we determine that we are acting as a principal in the transactions, we will report the transactions on a gross basis, resulting in significantly higher revenues and costs reflected within our consolidated financial statements.
We generally derive revenue from our pharmacy-solutions business on a transactional fee basis. Fees are earned on pharmacy claims processing and payments services, pharmacy and member call center services, pharmaceutical rebate administration, administration or management of clinical programs, pharmacy network management, member and plan web services and management information and reporting. Further, revenues include investment earnings related to client cash balances maintained in our bank accounts. Medical claim processing revenues are generally derived from fees charged on a per member/per month basis or transactional basis. We also realize revenue from fixed-fee license agreements that include provisions for ongoing support and maintenance and for additional license payments in the event that usage or members increase. Additionally, we derive professional service revenues from fees for implementation services, custom programming and data center operations.
During 2016, two of our Healthcare Services customers notified us that they would begin transitioning their services off our systems effective January 2017. We continue to expect our Healthcare Services segment to achieve strong revenue growth through a combination of new client wins and organic growth. However, we now expect this growth will derive from a smaller revenue base, which will result in lower overall segment revenue growth during 2017 as compared to 2016.
Investments and Other Segment
The Investments and Other segment is comprised of our real estate consolidated subsidiaries and joint ventures, investments in equity securities, private equity investments and other financial interests. The assets held by this segment are primarily passive in nature.
The Investments and Other segment’s revenues are derived from rental income from third-party real estate leases. Rental income is recorded as revenue when, based on lease terms, it is earned. The Investments and Other segment records investment income (dividends, interest and net gains or losses on investment securities) within Other income, net. The Investments and Other segment derives part of its income from its pro rata share in the earnings or losses of certain unconsolidated affiliates. We make lease payments to certain real estate joint ventures.
Seasonality
Generally, we do not have significant seasonal fluctuations in our business operations. Processing volumes for mutual fund customers within our Financial Services segment are usually highest during the quarter ended March 31 due primarily to processing year-end transactions during January. We have historically added operating equipment in the last half of the year in preparation for processing year-end transactions, which has the effect of increasing costs for the second half of the year. Revenues and operating results from individual license sales vary depending on the timing and size of the contracts.
New Authoritative Accounting Guidance
See Item 8, Financial Statements and Supplementary Data - Note 2, “Significant Accounting Policies - New authoritative accounting guidance.”
23
Critical Accounting Policies and Estimates
The following discussion and analysis of our financial condition, results of operations and cash flows are based upon our consolidated financial statements, which have been prepared in accordance with GAAP. The preparation of these consolidated financial statements requires us to make estimates and judgments that affect the reported amounts of assets, liabilities, revenues and expenses and related disclosures of contingent assets and liabilities. We base our estimates on historical experience and on various other assumptions that are believed to be reasonable under the circumstances, the results of which form the basis for making judgments about the carrying values of assets and liabilities that are not readily apparent from other sources. Actual results may differ from these estimates under different assumptions or conditions.
We believe the following critical accounting policies affect our more significant judgments and estimates used in the preparation of our consolidated financial statements: revenue recognition; software capitalization and amortization; depreciation of fixed assets; valuation of long-lived and intangible assets and goodwill; accounting for investments; and accounting for income taxes.
Revenue recognition
We recognize revenue when it is realized or realizable and it is earned. The majority of our revenues are derived from computer processing and services and are recognized upon completion of the services provided. Software license fees, maintenance fees and other ancillary fees are recognized as services are provided or delivered and all customer obligations have been met. We generally do not have payment terms from customers that extend beyond one year. Billing for services in advance of performance is recorded as deferred revenue.
We recognize revenue when the following criteria are met: 1) persuasive evidence of an arrangement exists; 2) delivery has occurred or services have been rendered; 3) the sales price is fixed or determinable; and 4) collectibility is reasonably assured. If there is a customer-specific acceptance provision in a contract or if there is uncertainty about customer acceptance, the associated revenue is deferred until we have evidence of customer acceptance.
Revenue arrangements with multiple deliverables are evaluated to determine if the deliverables (items) can be divided into more than one unit of accounting. An item can generally be considered a separate unit of accounting if both of the following criteria are met: 1) the delivered item(s) has value to the customer on a standalone basis and 2) if the arrangement includes a general right of return relative to the delivered item(s), delivery or performance of the undelivered item(s) is considered probable and substantially in our control. Once separate units of accounting are determined, the arrangement consideration should be allocated at the inception of the arrangement to all deliverables using the relative selling price method. Relative selling price is obtained from sources such as vendor-specific objective evidence, which is based on the separate selling price for that or a similar item or from third-party evidence such as how competitors have priced similar items. If such evidence is unavailable, we use our best estimate of the selling price, which includes various internal factors such as our pricing strategy and market factors.
We derive over 90% of our revenues as a result of providing processing and services under contracts. The majority of our fees are billed on a monthly basis, generally with thirty-day collection terms. Revenues are recognized for monthly processing and services upon performance of the services.
Our standard business practice is to bill monthly for development, consulting and training services on a time and materials basis. In some cases we bill a fixed fee for development and consulting services. For fixed fee arrangements, we recognize revenue on a “proportionate performance” basis.
We derive less than 10% of our revenues from licensing products. We license our wealth management products, AWD products and healthcare administration processing software solutions. Perpetual software license revenues are recognized at the time the contract is signed, the software is delivered and no future software obligations exist. Deferral of software license revenue billed results from delayed payment provisions, disproportionate discounts between the license and other services or the inability to unbundle certain services. Term software license revenues are recognized ratably over the term of the license agreement. While license fee revenues are not a significant percentage of our total operations, they can significantly impact earnings in the period in which they are recognized. Revenues from individual license sales depend heavily on the timing, size and nature of the contract. We recognize revenues for maintenance services ratably over the contract term, after collectibility has been reasonably assured.
We may enter into arrangements with broker/dealers or other third parties to sell or market closed-end fund shares. Depending on the arrangement, we may earn distribution fees for marketing and selling the underlying fund shares. Conversely, we may incur distribution expenses, including structuring fees, finders’ fees and referral fees paid to unaffiliated broker/dealers or introducing parties for marketing and selling underlying fund shares of a closed-end fund we sponsor. While distribution
24
revenues and expenses are not significant percentages of our operating revenues or costs and expenses, they can significantly impact operations and earnings in the period in which they are recognized.
We have entered into various agreements with related parties, principally unconsolidated affiliates, under which we provide data processing and software services. We believe that the terms of our contracts with related parties are fair to us and are no less favorable than those obtained from unaffiliated parties.
We assess collection based on a variety of factors, including past collection history with the customer and the credit-worthiness of the customer. We generally do not request collateral from our customers. If we determine that collection of revenues is not reasonably assured, revenue is deferred and is recognized at the time it becomes reasonably assured, which is generally upon receipt of cash. Allowances for billing adjustments and doubtful account expense are estimated as revenues are recognized. Allowances for billing adjustments are recorded as reductions in revenues and doubtful account expense is recorded within Costs and expenses. The annual amounts for these items are immaterial to our consolidated financial statements.
Software capitalization and amortization
We make substantial investments in software to enhance the functionality and facilitate the delivery of our processing services as well as our sale of licensed products. Purchased software is recorded at cost and is amortized on a straight-line basis over the estimated economic life, which is generally three to five years. We also develop a large portion of our software internally. We capitalize software development costs for computer software developed or obtained for internal use after the preliminary project phase has been completed and management has committed to funding the project. For computer software to be sold, leased or otherwise marketed to third parties, we capitalize software development costs which are incurred after the products reach technological feasibility but prior to the general release of the product to customers. The capitalized software development costs are generally amortized on a straight-line basis over the estimated economic life, which is generally three to five years.
Significant management judgment is required in determining what projects and costs associated with software development will be capitalized and in assigning estimated economic lives to the completed projects. Management specifically evaluates software development projects and analyzes the percentage of completion as compared to the initial plan and subsequent forecasts, milestones achieved and the commitment to continue funding the projects. Significant changes in any of these items may result in discontinuing capitalization of development costs, as well as immediately expensing previously capitalized costs. We review, on a quarterly basis, our capitalized software for possible impairment.
Depreciation of fixed assets
Our approach on personal property, specifically technology equipment is to own the property as opposed to leasing it where practicable. We believe this approach provides us with better flexibility for disposing or redeploying the asset as it nears the completion of its economic life. We depreciate technology equipment using accelerated depreciation methods over the following lives: (1) non-mainframe equipment—three years; (2) mainframe central processing unit—four years; and (3) mainframe direct access storage devices—five years. We depreciate furniture and fixtures over estimated useful lives, principally three to five years, using accelerated depreciation methods. We depreciate leasehold improvements using the straight-line method over the lesser of the term of the lease or life of the improvements. Management judgment is required in assigning economic lives to fixed assets. Management specifically analyzes fixed asset additions, remaining net book values and gain/loss upon disposition of fixed assets to determine the appropriateness of assigned economic lives. Significant changes in any of these items may result in changes in the economic life assigned and the resulting depreciation expense.
Valuation of long-lived and intangible assets and goodwill
Goodwill and indefinite-lived intangible assets are not amortized but are evaluated for impairment. We evaluate the impairment of goodwill at least annually (as of October 1) and evaluate identifiable intangibles, long-lived assets and related assets whenever events or changes in circumstances indicate that the carrying value may not be recoverable. Factors that could trigger an impairment review include the following: significant under-performance relative to expected historical or projected future operating results; significant changes in the manner of our use of the acquired assets or our strategy for the overall business; and significant negative industry or economic trends. When it is determined that the carrying value of intangibles, long-lived assets or goodwill may not be recoverable based upon the existence of one or more of the above indicators of impairment, we assess actual impairment based on gross cash flows.
Our assessment of goodwill for impairment may first include a qualitative assessment that considers various factors, including those described above as well as growth in operating revenues and income from operations of our reporting units since our last quantitative assessment. A quantitative assessment is performed if the qualitative assessment indicates that it is more likely than not that the fair value of a reporting unit is less than its carrying amount or if a qualitative assessment is not performed.
25
Our quantitative assessment of goodwill for impairment includes comparing the fair value to the net book value of our reporting units. We estimate fair value using a combination of discounted cash flow models and market approaches. If the fair value of a reporting unit exceeds its net book value, goodwill is not impaired and no further testing is necessary. If the net book value of a reporting unit exceeds its fair value, we perform a second test to measure the amount of impairment loss, if any. To measure the amount of any impairment loss, we determine the implied fair value of goodwill in the same manner as if the affected reporting unit was being acquired in a business combination. Specifically, we allocate the fair value of the affected reporting unit to all of the assets and liabilities of that unit, including any unrecognized intangible assets, in a hypothetical calculation that would yield the implied fair value of goodwill. If the implied fair value of goodwill is less than the goodwill recorded on our balance sheet, an impairment charge is recorded for the difference.
Our 2016, 2015 and 2014 annual goodwill impairment tests determined that goodwill was not impaired, except during 2016 for the goodwill held at the Customer Communications U.K. reporting unit, which is included as a component of discontinued operations, as further described in Item 8, Financial Statements and Supplemental Data - Note 4, “Discontinued Operations.”
Accounting for investments
We have three significant types of investments: 1) investments in available-for-sale securities, the largest of which is our investment in State Street common stock; 2) investments in unconsolidated affiliates, which is comprised principally of BFDS, IFDS U.K., IFDS L.P. and certain real estate joint ventures; and 3) investments in private equity funds and other investments accounted for under the cost method.
We account for investments in entities in which we own less than 20% and do not have significant influence in accordance with authoritative guidance related to accounting for certain investments in debt and equity securities, which requires us to designate our investments as trading or available-for-sale. Available-for-sale securities are reported at fair value with unrealized gains and losses excluded from earnings and recorded net of deferred taxes directly to Accumulated other comprehensive income within Stockholders’ equity.
We record an investment impairment charge for an investment with a gross unrealized holding loss resulting from a decline in value that is other than temporary. Future adverse changes in market conditions or poor operating results of underlying investments could result in losses or an inability to recover the carrying value of the investments that may not be reflected in an investment’s current carrying value, thereby possibly requiring an impairment charge in the future, which could have a material effect on our financial position.
The equity method of accounting is used for investments in entities, partnerships and similar interests (including investments in private equity funds where we are the limited partner) in which we have significant influence but do not control. We classify these investments as unconsolidated affiliates. Under the equity method, we recognize income or losses from our pro-rata share of these unconsolidated affiliates’ net income or loss, which changes the carrying value of the investment of the unconsolidated affiliate. In certain cases, pro-rata losses are recognized only to the extent of our investment and advances to the unconsolidated affiliate.
The cost method of accounting is used for these investments when we have a de minimis ownership percentage and do not have significant influence. Our cost method investments are held at the lower of cost or market.
Accounting for income taxes
We account for income taxes payable or refundable for the current year and deferred tax liabilities and assets for the future tax consequences of events that have been recognized in an entity’s financial statements or tax returns. Judgment is required in addressing the future tax consequences of events that have been recognized in our consolidated financial statements or tax returns (e.g., realization of deferred tax assets, changes in tax laws or interpretations thereof).
In addition, we are subject to examination of our income tax returns by the Internal Revenue Service (“IRS”) and other tax authorities. A change in the assessment of the outcomes of such matters could materially impact our consolidated financial statements. The calculation of tax liabilities involves dealing with uncertainties in the application of complex tax regulations. We recognize liabilities for potential tax exposures based on our estimate of whether, and the extent to which, additional taxes may be required. If we ultimately determine that payment of these amounts is unnecessary, then we reverse the liability and recognize a tax benefit during the period in which we determine that the liability is no longer necessary. We also recognize tax benefits to the extent that it is more likely than not that our positions will be sustained if challenged by the taxing authorities. To the extent we prevail in matters for which liabilities have been established, or are required to pay amounts in excess of our liabilities, our effective tax rate in a given period may be materially affected. An unfavorable tax settlement would require cash payments and may result in an increase in our effective tax rate in the year of resolution. A favorable tax settlement would be recognized as a reduction in our effective tax rate in the year of resolution. We report interest and penalties related to uncertain income tax positions within income tax expense.
26
Results of Operations
The following table summarizes our consolidated operating results (in millions). Additional information regarding our segments is included below under the caption, “Year to Year Business Segment Comparisons.”
Change | |||||||||||||||||||||||||
Year Ended December 31, | 2016 vs 2015 | 2015 vs 2014 | |||||||||||||||||||||||
2016 | 2015 | 2014 | $ | % | $ | % | |||||||||||||||||||
Operating revenues | $ | 1,474.4 | $ | 1,405.0 | $ | 1,445.5 | $ | 69.4 | 4.9 | % | $ | (40.5 | ) | (2.8 | )% | ||||||||||
Out-of-pocket reimbursements | 82.3 | 69.0 | 59.3 | 13.3 | 19.3 | % | 9.7 | 16.4 | % | ||||||||||||||||
Total revenues | 1,556.7 | 1,474.0 | 1,504.8 | 82.7 | 5.6 | % | (30.8 | ) | (2.0 | )% | |||||||||||||||
Costs and expenses | 1,213.4 | 1,150.2 | 1,149.1 | 63.2 | 5.5 | % | 1.1 | 0.1 | % | ||||||||||||||||
Depreciation and amortization | 96.0 | 91.1 | 93.0 | 4.9 | 5.4 | % | (1.9 | ) | (2.0 | )% | |||||||||||||||
Operating income | 247.3 | 232.7 | 262.7 | 14.6 | 6.3 | % | (30.0 | ) | (11.4 | )% | |||||||||||||||
Interest expense | (23.5 | ) | (23.8 | ) | (26.3 | ) | (0.3 | ) | (1.3 | )% | (2.5 | ) | (9.5 | )% | |||||||||||
Gain on sale of business | 5.5 | — | 100.5 | 5.5 | (100.0 | )% | (100.5 | ) | 100.0 | % | |||||||||||||||
Other income, net | 22.7 | 204.5 | 373.1 | (181.8 | ) | (88.9 | )% | (168.6 | ) | (45.2 | )% | ||||||||||||||
Equity in earnings of unconsolidated affiliates | 27.2 | 45.4 | 34.7 | (18.2 | ) | (40.1 | )% | 10.7 | 30.8 | % | |||||||||||||||
Income from continuing operations before income taxes and non-controlling interest | 279.2 | 458.8 | 744.7 | (179.6 | ) | (39.1 | )% | (285.9 | ) | (38.4 | )% | ||||||||||||||
Income taxes | 101.1 | 149.2 | 183.9 | (48.1 | ) | (32.2 | )% | (34.7 | ) | (18.9 | )% | ||||||||||||||
Net income from continuing operations before non-controlling interest | 178.1 | 309.6 | 560.8 | (131.5 | ) | (42.5 | )% | (251.2 | ) | (44.8 | )% | ||||||||||||||
Income from discontinued operations, net of tax | 248.3 | 48.5 | 32.5 | 199.8 | 412.0 | % | 16.0 | 49.2 | % | ||||||||||||||||
Net income | 426.4 | 358.1 | 593.3 | 68.3 | 19.1 | % | (235.2 | ) | (39.6 | )% | |||||||||||||||
Net loss attributable to non-controlling interest | 0.9 | 0.1 | — | 0.8 | 800.0 | % | 0.1 | 100.0 | % | ||||||||||||||||
Net income attributable to DST Systems, Inc. | $ | 427.3 | $ | 358.2 | $ | 593.3 | $ | 69.1 | 19.3 | % | $ | (235.1 | ) | (39.6 | )% | ||||||||||
Revenues
Consolidated total revenues (including out-of-pocket (“OOP”) reimbursements) increased $82.7 million or 5.6% during the year ended December 31, 2016 as compared to December 31, 2015 and decreased $30.8 million or 2.0% during the year ended December 31, 2015 as compared to December 31, 2014. Consolidated operating revenues increased $69.4 million or 4.9% in 2016 as compared to 2015 and decreased $40.5 million or 2.8% in 2015 as compared to 2014.
Consolidated OOP reimbursements increased $13.3 million or 19.3% in 2016 as compared to 2015 and increased $9.7 million or 16.4% in 2015 as compared to 2014. The increases in consolidated OOP reimbursements in 2016 and 2015 are primarily attributable to increased client volumes in the Financial Services segment.
Costs and expenses
Consolidated costs and expenses (including OOP reimbursements) increased $63.2 million or 5.5% during the year ended December 31, 2016 as compared to December 31, 2015 and increased $1.1 million or 0.1% during the year ended December 31, 2015 as compared to December 31, 2014. Reimbursable operating expenses included in costs and expenses were $82.3 million, $69.0 million and $59.3 million in 2016, 2015 and 2014, respectively. Excluding reimbursable operating expenses, costs and expenses increased $49.9 million in 2016 as compared to 2015 and decreased $8.6 million in 2015 as compared to 2014.
27
As a result of changes in our business environment, from time to time we will restructure one or more of our businesses to enhance operational efficiency. During the year ended December 31, 2016, we incurred $10.4 million of employee and lease termination costs as a result of a restructuring initiative within the Financial Services segment. During the year ended December 31, 2015, we incurred $3.4 million of pretax charges related to employee termination costs as a result of a restructuring initiative within the Healthcare Services segment which involved the closure of an operating location at the end of the existing lease term in mid-2016. During the year ended December 31, 2014, we incurred $8.5 million of pretax charges related to employee and lease termination costs related to a restructuring initiative within our Financial Services segment.
Depreciation and amortization
Consolidated depreciation and amortization increased $4.9 million or 5.4% during the year ended December 31, 2016 as compared to December 31, 2015 and decreased $1.9 million or 2.0% during the year ended December 31, 2015 as compared to December 31, 2014.
Operating income
Consolidated operating income increased $14.6 million or 6.3% to $247.3 million during the year ended December 31, 2016 as compared to 2015 and decreased $30.0 million or 11.4% to $232.7 million during the year ended December 31, 2015 as compared to 2014.
Interest expense
Interest expense was $23.5 million, $23.8 million and $26.3 million during the years ended December 31, 2016, 2015 and 2014, respectively. Interest expense decreased 1.3% during 2016 as compared to 2015 and 9.5% during 2015 as compared to 2014 primarily from lower weighted average debt balances outstanding.
Gain on sale of business
On November 1, 2016, we sold DST Billing Solutions Limited (“Billing Solutions”) for cash consideration of approximately $6.1 million, subject to customary working capital post-closing adjustments. Operating revenue and income generated for the Billing Solutions business sold was approximately $4.0 million and $0.7 million, respectively, for the year ended December 31, 2016. We recorded a pretax gain of $5.5 million on the sale of the business during 2016.
On November 30, 2014, we sold Global Solutions for cash consideration of $95.0 million, subject to customary working capital post-closing adjustments. Of the $95.0 million in proceeds received, $9.5 million was restricted for a period of eighteen months from the transaction, for purposes of payment of potential obligations under the terms and conditions of the sale agreement. The $9.5 million of restricted proceeds held in escrow was received by DST during 2016. During 2015, we received cash proceeds of $7.9 million in settlement of the working capital post-closing adjustment. We recorded a pretax gain of $100.5 million on the sale of the business during 2014. Our pretax gain exceeded our sale proceeds primarily from the reclassification of cumulative translation adjustments due to the substantial liquidation of certain foreign entities, partially offset by transaction costs. The carrying value of the entities sold was minimal.
Operating revenue generated from the Global Solutions businesses sold was approximately $61.4 million for the year ended December 31, 2014. Operating income generated from the Global Solutions businesses sold was approximately $6.9 million for the year ended December 31, 2014.
Other income, net
The components of other income, net are as follows (in millions):
Year Ended December 31, | |||||||||||
2016 | 2015 | 2014 | |||||||||
Net realized gains from the disposition of available-for-sale securities | $ | 2.3 | $ | 168.4 | $ | 181.4 | |||||
Net gains on private equity funds and other investments | 16.5 | 35.7 | 27.8 | ||||||||
Dividend income | 5.8 | 8.3 | 11.4 | ||||||||
Private company investment dividend | — | — | 33.2 | ||||||||
Gain on sale of private company investment | — | — | 103.6 | ||||||||
Gain on contract to repurchase shares of DST Common Stock | — | — | 18.1 | ||||||||
Miscellaneous items | (1.9 | ) | (7.9 | ) | (2.4 | ) | |||||
Other income, net | $ | 22.7 | $ | 204.5 | $ | 373.1 | |||||
28
Included in the net realized gains from the disposition of available-for-sale securities during 2015 and 2014 were gains of $157.3 million and $169.3 million, respectively, from the sale of approximately 2.3 million and 2.6 million shares of State Street during 2015 and 2014, respectively. There were no sales of State Street shares during 2016.
We recorded a net gain on private equity funds and other investments of $16.5 million, $35.7 million and $27.8 million during the years ended December 31, 2016, 2015 and 2014, respectively, primarily due to distributions received from certain of our private equity fund investments resulting in realized gains. Future adverse changes in market conditions or poor operating results of underlying investments could result in losses or an inability to recover the carrying value of the investments and may require an impairment charge in the future, which could have a material effect on our net income.
In 2014, we received cash dividends of $33.2 million from a cost method investment in a privately-held company. Following receipt of the dividend, we sold our remaining interest in the privately-held company, resulting in pre-tax cash proceeds and a related gain of $103.6 million.
We repurchased $200.0 million of our common stock from a group of stockholders including George L. Argyros, Julia A. Argyros, and certain of their affiliates (collectively, “the Argyros Group” or “Argyros”) during 2014. The price paid per share was determined in connection with the secondary offering of Argyros’ DST common stock in May 2014. In connection with this share repurchase, we recorded a non-cash gain of $18.1 million during the year ended December 31, 2014 resulting from the change in stock price between the date the share repurchase price became fixed and the settlement date.
We receive dividend income from certain investments held, of which State Street is the most significant. State Street’s quarterly dividend per common share was $0.38, $0.34 and $0.30 per share during 2016, 2015 and 2014, respectively. Dividends received from State Street common stock were $3.1 million, $3.2 million and $6.6 million for the years ended December 31, 2016, 2015 and 2014, respectively.
Equity in earnings of unconsolidated affiliates
Equity in earnings of unconsolidated affiliates is as follows (in millions):
Year Ended December 31, | |||||||||||
2016 | 2015 | 2014 | |||||||||
International Financial Data Services U.K. | $ | 10.0 | $ | 22.5 | $ | 12.6 | |||||
International Financial Data Services L.P. | 2.2 | 7.4 | 6.5 | ||||||||
Boston Financial Data Services, Inc. | 8.3 | 5.3 | 5.1 | ||||||||
Other unconsolidated affiliates | 6.7 | 10.2 | 10.5 | ||||||||
Total | $ | 27.2 | $ | 45.4 | $ | 34.7 | |||||
Additional condensed financial information of our significant operating unconsolidated affiliates, BFDS, IFDS U.K. and IFDS L.P., is presented below (in millions):
Year Ended December 31, | |||||||||||
2016 | 2015 | 2014 | |||||||||
Total revenues | $ | 1,097.7 | $ | 1,081.2 | $ | 1,111.0 | |||||
Costs and expenses | 994.6 | 947.8 | 1,009.7 | ||||||||
Depreciation and amortization | 41.0 | 38.9 | 39.1 | ||||||||
Operating income | 62.1 | 94.5 | 62.2 | ||||||||
Non-operating income (loss) | (2.8 | ) | 2.8 | 3.4 | |||||||
Income before income taxes | 59.3 | 97.3 | 65.6 | ||||||||
Income taxes | 18.3 | 27.0 | 17.0 | ||||||||
Net income | $ | 41.0 | $ | 70.3 | $ | 48.6 | |||||
Equity in earnings of IFDS decreased $17.7 million during the year ended December 31, 2016, as compared to 2015, primarily attributable to lower revenues recognized related to the ongoing client conversion activities and higher operating costs as IFDS expands its infrastructure to address increasing regulatory, compliance and security needs.
29
The multi-year implementation efforts for the previously announced two wealth management clients continue to progress, however the scope and timing continues to be adjusted as client requirements evolve. In 2014, IFDS began capitalizing a significant portion of the software development costs being incurred to develop the wealth management platform for the U.K. market resulting in approximately £146.2 million (£73.1 million at DST’s 50% ownership) of capitalized costs through December 31, 2016. These costs will continue to be incurred as the platform is completed.
Equity in earnings of IFDS increased $10.8 million during the year ended December 31, 2015, as compared to 2014, primarily attributable to higher revenues recognized related to the ongoing client conversion activities of the wealth management platform clients in the U.K., organic growth at existing customers and new client processing revenues. Partially offsetting the increased revenues are higher operating costs as IFDS expands its infrastructure to prepare for the addition of new clients and associated service offerings as well as negative foreign currency impacts in both the U.K. and Canada.
IFDS shareowner accounts serviced on their shareowner accounting platforms were 22.6 million at December 31, 2016, an increase of 0.5 million accounts or 2.3% as compared to December 31, 2015. The increase was primarily due to organic growth and new client conversions. IFDS shareowner accounts serviced were 22.1 million at December 31, 2015, a decrease of 1.7 million accounts or 7.1% as compared to December 31, 2014. The decline in accounts from 2014 to 2015 was driven by the transition of one of IFDS’ clients off of the FAST platform and onto the wealth management platform in 2015.
Equity in earnings of BFDS increased $3.0 million during the year ended December 31, 2016 as compared to 2015. The increase was primarily attributable to higher ancillary and non-operating revenues as well as a reduction in operating costs. Equity in earnings of BFDS increased $0.2 million during the year ended December 31, 2015 as compared to 2014. The increase was primarily attributable to a reduction in operating costs.
Our equity in earnings of other unconsolidated affiliates was $6.7 million during the year ended December 31, 2016, a decrease of $3.5 million as compared to 2015. The decrease was primarily due to a $3.6 million gain resulting from the sale of real estate by an unconsolidated affiliate during 2015. Our equity in earnings of other unconsolidated affiliates was $10.2 million during the year ended December 31, 2015, an decrease of $0.3 million as compared to 2014. The decrease was primarily due to a $5.7 million gain recognized upon the sale of an unconsolidated affiliate during 2014, partially offset by a $3.6 million gain resulting from the sale of real estate by an unconsolidated affiliate during 2015.
Income taxes
Our effective tax rate was 36.2%, 32.5% and 24.7% for the years ended December 31, 2016, 2015 and 2014, respectively. The effective tax rates in each of the three years ended December 31, 2016 were affected by tax benefits relating to certain international operations and recognition of state tax benefits associated with income apportionment rules. Our income tax rate for 2016 was higher than the statutory federal income tax rate of 35% primarily attributable to state income taxes, transaction related taxes, and a change in the proportional mix of domestic and international income, partially offset by federal income tax credits for foreign income taxes and research and development costs.
Our effective income tax rate for 2015 was favorably impacted by a $11.9 million benefit from the completion of the IRS examination of previously filed federal income tax refund claims for Domestic Manufacturing Deductions, research and experimentation credits and capital losses for the period 2010 as well as other remeasurements during the period.
Our effective income tax rate for 2014 was favorably impacted by the reversal of $30.8 million of uncertain tax position liabilities, net of additions, primarily related to statute expirations.
Excluding the effect of discrete period items, we expect our effective tax rate to be approximately 37% in 2017. The 2017 tax rate can be affected as a result of variances among the estimates and amounts of 2017 sources of taxable income (e.g., domestic consolidated, joint venture and/or international), the realization of tax credits, adjustments which may arise from the resolution of tax matters under review and our assessment of our liability for uncertain tax positions.
Income from discontinued operations, net of tax
Income from discontinued operations, net of tax increased $199.8 million during the year ended December 31, 2016 as compared to 2015 and increased $16.0 million or 49.2% during the year ended December 31, 2015 as compared to 2014. The increase is primarily attributable to the $234.7 million gain, net of tax, on the sale of our North American Customer Communications business partially offset by the goodwill and asset impairments in our U.K. Customer Communications business.
In February 2017, we updated our impairment analysis utilizing new information received regarding our U.K. Customer Communications business which indicated the carrying value exceeded the fair value of the business. As a result, we recorded an impairment charge of $17.0 million, which is included as a component of discontinued operations for the year ended December 31, 2016. The impairment resulted in the write-down of goodwill and long-lived assets based on the estimated fair
30
value of the business. No tax benefit was recognized for this impairment charge. These amounts reflect management’s preliminary estimates and subsequent negotiations and the closing on any sale of this business could result in further adjustments to this impairment.
YEAR TO YEAR BUSINESS SEGMENT COMPARISONS
FINANCIAL SERVICES SEGMENT
The following table presents the financial results of the Financial Services segment (in millions):
Change | |||||||||||||||||||||||||
Year Ended December 31, | 2016 vs 2015 | 2015 vs 2014 | |||||||||||||||||||||||
2016 | 2015 | 2014 | $ | % | $ | % | |||||||||||||||||||
Operating revenues | $ | 1,090.2 | $ | 1,063.8 | $ | 1,088.8 | $ | 26.4 | 2.5 | % | $ | (25.0 | ) | (2.3 | )% | ||||||||||
Out-of-pocket reimbursements | 73.9 | 61.7 | 52.6 | 12.2 | 19.8 | % | 9.1 | 17.3 | % | ||||||||||||||||
Total revenues | 1,164.1 | 1,125.5 | 1,141.4 | 38.6 | 3.4 | % | (15.9 | ) | (1.4 | )% | |||||||||||||||
Costs and expenses | 908.3 | 869.8 | 867.9 | 38.5 | 4.4 | % | 1.9 | 0.2 | % | ||||||||||||||||
Depreciation and amortization | 79.7 | 71.6 | 72.2 | 8.1 | 11.3 | % | (0.6 | ) | (0.8 | )% | |||||||||||||||
Operating income | $ | 176.1 | $ | 184.1 | $ | 201.3 | $ | (8.0 | ) | (4.3 | )% | $ | (17.2 | ) | (8.5 | )% | |||||||||
Operating margin | 16.2 | % | 17.3 | % | 18.5 | % | |||||||||||||||||||
31
The following table summarizes the Financial Services segment’s statistical metrics (in millions, except as noted):
December 31, | ||||||||||||
2016 | 2015 | 2014 | ||||||||||
U.S. shareowner accounts processed: | ||||||||||||
Registered accounts - non tax-advantaged | 25.3 | 27.0 | 29.6 | |||||||||
IRA mutual fund accounts | 21.1 | 21.8 | 22.3 | |||||||||
Other retirement accounts | 8.0 | 8.2 | 8.1 | |||||||||
Section 529 and Educational IRAs | 7.5 | 8.4 | 8.8 | |||||||||
Registered accounts - tax-advantaged | 36.6 | 38.4 | 39.2 | |||||||||
Total registered accounts | 61.9 | 65.4 | 68.8 | |||||||||
Subaccounts | 42.1 | 31.3 | 28.6 | |||||||||
Total U.S. shareowner accounts | 104.0 | 96.7 | 97.4 | |||||||||
International shareowner accounts processed: | ||||||||||||
IFDS U.K. | 8.9 | 8.8 | 11.3 | |||||||||
IFDS L.P. (Canada) | 13.7 | 13.3 | 12.5 | |||||||||
Total international shareowner accounts | 22.6 | 22.1 | 23.8 | |||||||||
Defined contribution participant accounts | 6.8 | 7.0 | 7.2 | |||||||||
ALPS (in billions of U.S. dollars): | ||||||||||||
Assets Under Management | $ | 17.2 | $ | 14.7 | $ | 15.3 | ||||||
Assets Under Administration | $ | 179.1 | $ | 140.4 | $ | 176.9 | ||||||
Automatic Work Distributor workstations (in thousands) | 212.7 | 211.4 | 212.5 | |||||||||
Year Ended December 31, | |||||||||
2016 | 2015 | 2014 | |||||||
Changes in registered accounts: | |||||||||
Beginning balance | 65.4 | 68.8 | 71.2 | ||||||
New client conversions | 0.1 | — | — | ||||||
Subaccounting conversions to DST platforms | (0.9 | ) | (1.8 | ) | (0.6 | ) | |||
Subaccounting conversions to non-DST platforms | (0.5 | ) | (1.1 | ) | (1.9 | ) | |||
Conversions to non-DST platforms | (0.7 | ) | (0.3 | ) | (1.0 | ) | |||
Organic growth (decline) | (1.5 | ) | (0.2 | ) | 1.1 | ||||
Ending balance | 61.9 | 65.4 | 68.8 | ||||||
Changes in subaccounts: | |||||||||
Beginning balance | 31.3 | 28.6 | 25.7 | ||||||
New client conversions | 10.7 | — | — | ||||||
Conversions from non-DST registered platforms | — | 1.1 | 0.7 | ||||||
Conversions from DST’s registered accounts | 0.9 | 1.8 | 0.6 | ||||||
Organic growth (decline) | (0.8 | ) | (0.2 | ) | 1.6 | ||||
Ending balance | 42.1 | 31.3 | 28.6 | ||||||
Changes in defined contribution participant accounts: | |||||||||
Beginning balance | 7.0 | 7.2 | 6.9 | ||||||
New client conversions | — | 0.1 | 0.3 | ||||||
Organic decline | (0.2 | ) | (0.3 | ) | — | ||||
Ending balance | 6.8 | 7.0 | 7.2 | ||||||
32
Comparison of 2016 versus 2015 results
Operating revenues
Financial Services segment operating revenues of $1,090.2 million reflect an increase of $26.4 million or 2.5% in 2016 as compared to 2015. The increase in operating revenues during the year ended December 31, 2016 was primarily driven from businesses acquired during 2015 and 2016, which contributed $31.8 million of incremental operating revenues as well as increased professional services revenues associated with our international wealth management platform business. During 2016, we also completed the conversion of approximately 10.0 million subaccounts associated with the previously announced new client, which resulted in incremental revenues. These increases were partly offset by a decline in mutual fund registered shareowner account processing revenue due to lower registered accounts, primarily as a result of subaccounting conversions, lower revenue due to extending certain long-term contracts with lower pricing, and approximately $6.1 million of negative foreign currency movements during 2016 as compared to the year ended December 31, 2015. Additionally, software license revenues were $31.2 million for the year ended December 31, 2016, a decrease of $2.3 million as compared to 2015.
Costs and expenses
Financial Services segment costs and expenses for the year ended December 31, 2016 were $908.3 million, an increase of $38.5 million as compared to 2015. Costs and expenses in the Financial Services segment are primarily comprised of compensation and benefit costs, but also include technology related expenditures and reimbursable operating expenses. Reimbursable operating expenses included in costs and expenses were $73.9 million in 2016, an increase of $12.2 million as compared to 2015.
Excluding reimbursable operating expenses, Financial Services costs and expenses increased $26.3 million or 3.3% for the year ended December 31, 2016 as compared to 2015. On this basis, the increase in costs and expenses during 2016 was primarily from acquisitions completed during 2015 and 2016, which included approximately $33.7 million of incremental expenses. Also, contributing to the increase in costs and expenses were the restructuring activities, which resulted in $10.4 million of employee and lease termination costs during the year ended December 31, 2016 to enhance operational efficiency within the Financial Services segment, increased costs incurred to enhance the network infrastructure utilized across all of our operating business and incremental costs to service new and existing clients. During the year ended December 31, 2016, we also recognized a $6.0 million software impairment. These costs and expenses were partially offset by the reversal of approximately $6.5 million of accrued performance-related contingent consideration, a $9.6 million reduction of stock compensation expense as certain performance-based stock units (“PSU”) are no longer expected to vest, savings realized from cost containment initiatives and $7.2 million of foreign currency movements.
Depreciation and amortization
Financial Services segment depreciation and amortization costs for the year ended December 31, 2016 were $79.7 million, an increase of $8.1 million or 11.3% as compared to 2015. The increase in 2016 was primarily attributable to incremental amortization associated with acquired intangibles from the acquisitions completed in 2015 and 2016 as well as increased depreciation from capitalized costs incurred to enhance our network infrastructure and increase security and regulatory compliance. The increase in 2016 was also attributable to the acceleration of depreciation on certain capitalized software during 2016.
Operating income
Financial Services segment operating income for 2016 was $176.1 million, a decrease of $8.0 million or 4.3% as compared to 2015. The decrease in Financial Services operating income was primarily due to restructuring costs incurred during 2016, a software impairment charge, and increased costs incurred to enhance our network infrastructure, maintain security and regulatory compliance. These decreases were partially offset by the reversal of accrued performance-related contingent consideration, higher operating revenues and cost containment efforts during 2016, as well as a reduction of stock compensation expense as certain PSUs are no longer expected to vest. The impacts on operating income from foreign currency movements were not significant.
33
Comparison of 2015 versus 2014 results
Operating revenues
Financial Services segment operating revenues of $1,063.8 million decreased $25.0 million or 2.3% in 2015 as compared to 2014. The decrease in operating revenues during the year ended December 31, 2015 as compared to December 31, 2014 was primarily due to the sale of Global Solutions in November of 2014 and foreign currency movements. Global Solutions contributed $61.4 million of operating revenue for the year ended December 31, 2014 and foreign currency movements reduced operating revenue by approximately $16.2 million during 2015 as compared to the year ended December 31, 2014. Excluding Global Solutions 2014 results and the foreign currency impacts, Financial Services operating revenues increased $52.6 million or 5.1% for the year ended December 31, 2015 as compared to 2014, primarily driven from year-over-year growth across a number of our service offerings. Specifically, operating revenues increased as a result of increased professional services revenue associated with our wealth management platform business as well as organic and new client growth within our Retirement and Brokerage Solutions businesses. Additionally, the businesses acquired during 2015 contributed $10.4 million of operating revenues during the year ended December 31, 2015. The increases were partially offset by decreased revenue from our U.S. registered shareowner account processing due to lower registered accounts primarily as a result of subaccounting conversions. Additionally, software license revenues (excluding Global Solutions) were $33.5 million for the year ended December 31, 2015, a decrease of $0.4 million as compared to 2014.
Costs and expenses
Financial Services segment costs and expenses for the year ended December 31, 2015 were $869.8 million, an increase of $1.9 million as compared to 2014. Reimbursable operating expenses included in costs and expenses were $61.7 million for the year ended December 31, 2015, an increase of $9.1 million as compared to 2014. Additionally, Global Solutions incurred $49.3 million of costs and expenses for the year ended December 31, 2014 and foreign currency movements reduced costs and expenses by $16.4 million for the year ended December 31, 2015.
Excluding reimbursable operating expenses, the Global Solutions 2014 results and foreign currency impacts, Financial Services costs and expenses increased $25.7 million or 3.4% for the year ended December 31, 2015 as compared to 2014. On this basis, the increase in costs and expenses during 2015 was primarily from acquisitions completed during 2015, which included approximately $4.7 million of incremental expenses related to performance-related contingent consideration. The increase in costs and expenses was also attributable to increased security, regulatory compliance and network infrastructure costs, as well as higher costs associated with new business initiatives as we expand our service offerings and expand our wealth management platform in the U.K. These costs and expenses were partially offset by lower transaction and advisory costs of $1.2 million in 2015 as compared to $5.6 million of advisory and transaction costs incurred during 2014 in connection with the Argyros transaction and $13.0 million of costs incurred in 2014 related to restructuring activities.
Depreciation and amortization
Financial Services segment depreciation and amortization costs for the year ended December 31, 2015 were $71.6 million, a decrease of $0.6 million or 0.8% as compared to 2014. The decrease in 2015 was primarily attributable to the sale of Global Solutions in 2014, partially offset by increased amortization costs associated with acquired intangibles from the acquisitions completed during 2015.
Operating income
Financial Services segment operating income for 2015 was $184.1 million, a decrease of $17.2 million or 8.5% as compared to 2014. Global Solutions contributed income from operations of $6.9 million in 2014. Excluding Global Solutions, operating income decreased $10.3 million or 5.3%. The decrease in Financial Services operating income was primarily from higher operating expenses due to investments in our systems and infrastructure and the development of new business initiatives. Operating income was also adversely impacted by approximately $6.2 million of incremental expense resulting from amortization of acquired intangibles and expense for performance-related contingent consideration associated with our 2015 acquisitions. These decreases were partially offset by lower costs incurred as a result of restructuring activities undertaken in 2014.
34
HEALTHCARE SERVICES SEGMENT
The following table presents the financial results of the Healthcare Services segment (in millions):
Change | |||||||||||||||||||||||||
Year Ended December 31, | 2016 vs 2015 | 2015 vs 2014 | |||||||||||||||||||||||
2016 | 2015 | 2014 | $ | % | $ | % | |||||||||||||||||||
Operating revenues | $ | 426.2 | $ | 376.4 | $ | 382.1 | $ | 49.8 | 13.2 | % | $ | (5.7 | ) | (1.5 | )% | ||||||||||
Out-of-pocket reimbursements | 8.5 | 8.2 | 6.9 | 0.3 | 3.7 | % | 1.3 | 18.8 | % | ||||||||||||||||
Total revenues | 434.7 | 384.6 | 389.0 | 50.1 | 13.0 | % | (4.4 | ) | (1.1 | )% | |||||||||||||||
Costs and expenses | 345.1 | 321.3 | 308.5 | 23.8 | 7.4 | % | 12.8 | 4.1 | % | ||||||||||||||||
Depreciation and amortization | 15.6 | 18.6 | 19.5 | (3.0 | ) | (16.1 | )% | (0.9 | ) | (4.6 | )% | ||||||||||||||
Operating income | $ | 74.0 | $ | 44.7 | $ | 61.0 | $ | 29.3 | 65.5 | % | $ | (16.3 | ) | (26.7 | )% | ||||||||||
Operating margin | 17.4 | % | 11.9 | % | 16.0 | % | |||||||||||||||||||
The following tables summarize the Healthcare Services segment’s statistical metrics (in millions):
December 31, | |||||||||
2016 | 2015 | 2014 | |||||||
DST Health Solutions covered lives | 22.8 | 26.0 | 24.2 | ||||||
Year Ended December 31, | |||||||||
2016 | 2015 | 2014 | |||||||
Argus pharmacy paid claims | 507.0 | 494.4 | 486.6 | ||||||
Comparison of 2016 versus 2015 results
Operating revenues
Healthcare Services segment operating revenues of $426.2 million increased $49.8 million or 13.2% in 2016 compared to 2015. The increase in operating revenue during the year ended December 31, 2016 was primarily from new medical claims processing clients implemented during 2016, organic growth and expansion of high-value services we are offering to existing clients in both the medical and pharmacy businesses. Operating revenues included approximately $8.0 million of software license fee revenues for the year ended December 31, 2016, a decrease of $1.1 million as compared to 2015.
Costs and expenses
Healthcare Services segment costs and expenses for the year ended December 31, 2016 were $345.1 million, an increase of $23.8 million as compared to 2015. Costs and expenses are primarily comprised of compensation and benefits costs but also include technology-related expenditures. Reimbursable operating expenses included in costs and expenses were $8.5 million in 2016, an increase of $0.3 million as compared to 2015. Excluding reimbursable operating expenses, costs and expenses were $336.6 million for 2016, an increase of $23.5 million as compared to 2015. On this basis, the increase in costs and expenses during 2016 was primarily attributable to increased staffing costs incurred to support the higher medical transaction volumes due to the growth in BPO services. These costs and expenses were partially offset by restructuring costs that occurred during 2015 that did not recur during 2016 and a $2.4 million reduction of stock compensation expense as certain PSUs are no longer expected to vest.
Depreciation and amortization
Healthcare Services segment depreciation and amortization costs for the year ended December 31, 2016 were $15.6 million, a decrease of $3.0 million or 16.1% as compared to 2015.
Operating income
Healthcare Services segment operating income for 2016 was $74.0 million, an increase of $29.3 million or 65.5% as compared to 2015. The increase in operating income was primarily attributable to higher revenues from organic growth and new medical claims processing clients implemented in 2016, resulting in enhanced economies of scale as clients were converted as well as a
35
reduction of stock compensation expense as certain PSUs are no longer expected to vest. These increases were partially offset by increased staffing costs incurred to support the higher medical transaction volumes due to the growth in BPO services.
Comparison of 2015 versus 2014 results
Operating revenues
Healthcare Services segment operating revenues of $376.4 million decreased $5.7 million or 1.5% in 2015 as compared to 2014. The decrease in operating revenues for the year ended December 31, 2015 was primarily from lower pharmacy claims processing revenues resulting from a partial client deconversion on January 1, 2015. This decrease was largely offset by increased pharmacy and medical claims transaction volumes due to organic growth and higher BPO revenues. Operating revenues included approximately $9.1 million of software license fee revenues for the year ended December 31, 2015, an increase of $0.5 million as compared to 2014.
Costs and expenses
Healthcare Services segment costs and expenses for the year ended December 31, 2015 were $321.3 million, an increase of $12.8 million as compared to 2014. Reimbursable operating expenses included in costs and expenses were $8.2 million in 2015, an increase of $1.3 million as compared to 2014. Excluding reimbursable operating expenses, costs and expenses were $313.1 million for 2015, an increase of $11.5 million as compared to 2014. On this basis, the increase in costs and expenses during 2015 was primarily from a $3.4 million restructuring charge and increased staffing costs to support the expansion of our clinical, network and analytic capabilities in order to more effectively compete in the broader competitive PBM market. Staffing costs also increased in order to service the higher medical transaction volumes due to growth in BPO services which generally require more support. Additionally, costs increased in 2015 in order to implement several new clients expected to transition onto our medical claims platform in 2016. Costs were also higher due to the resolution of a previously disclosed regulatory inquiry which resulted in the reversal of $4.0 million previously accrued in excess of the final settlement amount of $2.0 million during 2014. The increased costs and expenses were partially offset by an incremental $5.7 million liability recorded during 2014 related to processing errors involving certain pharmacy claim transactions which did not recur in 2015.
Depreciation and amortization
Healthcare Services segment depreciation and amortization costs for the year ended December 31, 2015 were $18.6 million, a decrease of $0.9 million or 4.6% as compared to 2014.
Operating income
Healthcare Services segment operating income for 2015 was $44.7 million, a decrease of $16.3 million or 26.7% as compared to 2014. The decrease in operating income was primarily attributable to decreased revenues from lower pharmacy claims processing revenues resulting from a partial client deconversion on January 1, 2015. Additionally, the decrease in operating income was due to a restructuring charge and increased staffing costs incurred to expand our capabilities and service offerings as well as service growth in our BPO services that generally require a higher level of support. Costs also increased as a result of the implementation efforts for several new clients which transitioned onto our medical claims platform in 2016. The increase in costs were also due to the resolution of a previously disclosed regulatory inquiry which resulted in the reversal of $4.0 million previously accrued in excess of the final settlement amount of $2.0 million during 2014. The increased costs and expenses were offset by an incremental $6.4 million liability recorded during 2014 related to processing errors involving certain pharmacy claim transactions which did not recur in 2015.
INVESTMENTS AND OTHER SEGMENT
Investments and Other segment had an operating loss of $2.8 million for the year ended December 31, 2016, and operating income of $3.9 million and $0.4 million during the years ended December 31, 2015 and 2014, respectively. Operating income decreased $6.7 million during 2016 as compared to 2015, primarily from the $3.7 million gain on sale of real estate during the year ended December 31, 2015 that did not recur in 2016, lower rental income from third-party real estate leases and incremental expense associated with the charitable contributions of marketable securities to a donor-advised fund during 2016. These were partially offset by lower occupancy costs during the year ended December 31, 2016 as compared to the same period in 2015. Operating income increased $3.5 million during 2015 as compared to 2014, primarily from the $3.7 million gain on sale of real estate, partially offset by lower operating revenues.
36
LIQUIDITY AND CAPITAL RESOURCES
Company’s Assessment of Short-term and Long-term Liquidity
We believe that our existing cash balances and other current assets, together with cash provided by operating activities and, as necessary, our revolving credit facilities, are sufficient to meet our operating and debt service requirements and other current liabilities for at least the next 12 months. Further, we believe that our longer term liquidity and capital requirements will also be met through cash provided by operating activities, bank credit facilities and other investments.
At December 31, 2016, total cash and cash equivalents were $195.5 million, of which $152.3 million was held outside of the U.S. Most of the amounts held outside the U.S. could be repatriated to the U.S. but, under current law, would be subject to U.S. federal and state income taxes, less foreign tax credits. We have accrued for U.S. federal and state tax liabilities on the earnings of our international subsidiaries except when the earnings are considered indefinitely reinvested outside of the U.S. The repatriation of these earnings could result in additional U.S. federal and state income tax payments in future years. We utilize a variety of funding strategies in an effort to ensure that our worldwide cash is available in the locations in which it is needed.
At December 31, 2016, we had approximately $794.8 million of availability under our domestic revolving credit facilities. There are no credit facilities with outstanding amounts as of December 31, 2016 that are scheduled to mature in 2017, except for $105.0 million of Series B Senior Notes that are scheduled to mature in August 2017.
Sources and Uses of Cash
We had $195.5 million, $79.5 million and $139.6 million of cash and cash equivalents at December 31, 2016, 2015 and 2014, respectively. Our primary source of liquidity has historically been cash provided by operations. In addition, we have used proceeds from the sale of investments to fund other investing and financing activities. Principal uses of cash are operations, reinvestment in our proprietary technologies, capital expenditures, investment purchases, seed money investments, business acquisitions, payments on debt, stock repurchases and dividend payments. Information on our consolidated cash flows for the years ended December 31, 2016, 2015 and 2014 is presented in the Statement of Cash Flows, categorized by operating activities, investing activities, and financing activities.
The sale of our North American Customer Communications business on July 1, 2016 resulted in cash consideration of approximately $341.5 million, net of tax. The after-tax proceeds from the sale are being used in accordance with the Company’s capital plan, including investments in the business, share repurchases, strategic acquisitions, debt repayments and other corporate purposes.
Operating Activities
Cash flows provided from continuing operating activities were $162.7 million during the year ended December 31, 2016. Operating cash flows from continuing operating activities during 2016 resulted principally from income from continuing operations of $178.1 million, adjusted for non-cash or non-operating items of $90.4 million, and a use of cash due to changes in operating assets and liabilities of $105.8 million. Significant changes in operating assets and liabilities include a $26.9 million use of cash related to accrued compensation and benefits, a $16.6 million source of cash resulting from accounts payable and accrued liabilities, a $16.0 million use of cash related to accounts receivable and a $67.9 million use of cash related to timing of tax payments.
Cash flows provided from continuing operating activities were $135.7 million for the year ended December 31, 2015. Operating cash flows from continuing operations during 2015 resulted principally from income from continuing operations of $309.6 million, adjusted for non-cash or non-operating items of $110.3 million, and a use of cash due to changes in operating assets and liabilities of $63.6 million. Significant changes in operating assets and liabilities include a $10.6 million use of cash related to accounts receivable, and a $31.6 million use of cash related to timing of tax payments.
Cash flows provided from continuing operating activities were $242.4 million for the year ended December 31, 2014. Operating cash flows from continuing operating activities during 2014 resulted principally from income from continuing operations of $560.8 million. The most significant operating assets and liabilities change during 2014 was a $23.2 million use of cash related to timing of tax payments.
We have had significant proceeds from the sale of investments which have been included within investing activities on the Statement of Cash Flows. The income taxes paid on the gains from these investment sales are required to be treated as an operating cash outflow. Income tax expense resulting from these investment sales will reduce operating cash flows in the period that taxes are paid. Income taxes paid related to gains on the sale of investments and other non-operating assets during the years ended December 31, 2016, 2015 and 2014 were $1.4 million, $87.1 million and $70.4 million, respectively.
37
Investing Activities
Cash flows used in continuing investing activities were $117.3 million for the year ended December 31, 2016. Sources of our cash inflows were net investment activities (proceeds from investment sales, net of investments in securities) of $59.5 million, offset by cash used to acquire KRFS of $93.5 million, capital expenditures of $60.4 million, as well as approximately $28.0 million of cash loaned to IFDS U.K. during 2016.
Cash flows used in continuing investing activities during 2015 of $102.4 million were primarily attributable to net investment activities (proceeds from investment sales, net of investments in securities) of $192.2 million, which includes $176.1 million of pretax proceeds from the sale of State Street stock. These sources of cash were offset by $117.4 million of cash used to acquire kasina LLC, Red Rocks Capital LLC and Wealth Management Systems Inc. during 2015 and $88.9 million used to purchase capital assets, as well as higher restricted cash balances for client fund obligations.
Cash flows provided from continuing investing activities were $335.1 million for the year ended December 31, 2014, primarily attributable to net investment activities (proceeds from investment sales, net of investments in securities) of $343.0 million, which includes $190.3 million of pretax proceeds from the sale of State Street stock. Additionally, in 2014 cash flows from investing activities increased due to proceeds received from sale of Global Solutions of $77.4 million and proceeds from sale of non-operating real estate of $32.2 million. These cash inflows were partially offset by capital expenditures of $82.6 million.
Capital Expenditures
The following table summarizes capital expenditures by segment (in millions):
Year Ended December 31, | |||||||||||
2016 | 2015 | 2014 | |||||||||
Financial Services segment | $ | 55.0 | $ | 82.3 | $ | 72.2 | |||||
Healthcare Services segment | 5.4 | 6.1 | 10.1 | ||||||||
Investments and Other segment | — | 0.5 | 0.3 | ||||||||
$ | 60.4 | $ | 88.9 | $ | 82.6 | ||||||
During 2016, 2015 and 2014, we capitalized software development costs of $21.5 million, $23.3 million and $28.8 million, respectively, which are included within the capital expenditures listed above. Capital expenditures using debt are treated as non-cash transactions and are not included in the annual capital expenditure amounts above. We anticipate our 2017 capital expenditures for continuing operations to total approximately $70.0 million. Future capital expenditures are expected to be funded primarily by cash flows from operating activities or through borrowings on our revolving credit facilities.
Financing Activities
Cash flows used in continuing financing activities totaled $374.8 million, $278.7 million and $526.8 million during the years ended December 31, 2016, 2015 and 2014, respectively.
Common Stock Issuances and Repurchases
We received cash proceeds of $5.3 million, $11.8 million and $13.0 million from the issuance of common stock from the exercise of employee stock options during the years ended December 31, 2016, 2015 and 2014, respectively. The value of shares received in exchange for satisfaction of the exercise price and for tax-withholding obligations arising from the exercise of options to purchase our stock or from the vesting of restricted shares are included in Common stock repurchased in the Consolidated Statement of Cash Flows.
On June 13, 2016, our Board of Directors authorized a new $300.0 million share repurchase plan, which allows, but does not require, the repurchase of common stock in open market and private transactions. The plan does not have an expiration date. We repurchased 2.7 million shares of our common stock for $300.0 million during the year ended December 31, 2016. Subsequently, during January and February 2017, we repurchased an additional 0.7 million shares of our common stock for $75.0 million resulting in approximately $75.0 million remaining under our existing share repurchase plan authorized in 2016. Under previous share repurchase plans, we expended $400.0 million for approximately 3.6 million shares and $200.0 million for approximately 2.2 million shares during the years ended December 31, 2015 and 2014, respectively.
As of March 23, 2014, Argyros beneficially owned 9.2 million shares or approximately 22% of DST common shares. During March 2014, we entered into an agreement under which we agreed to a two-step process to assist Argyros with the disposition of a substantial portion of its common stock ownership in DST. To implement Argyros’ disposition, we facilitated the May 2014 registered, secondary common stock offering of $450.0 million (before any overallotment option) of DST common stock beneficially owned by Argyros. Concurrent with the closing of the secondary offering and based upon a price determined in the
38
secondary offering, DST repurchased, and simultaneously retired, 2.4 million shares of our common stock from Argyros for $200.0 million. In connection with this share repurchase, we recorded a non-cash gain of $18.1 million during the year ended December 31, 2014 resulting from the change in stock price between the date the share repurchase price became fixed and the settlement date.
Dividends
We paid cash dividends of $1.32 per common share in 2016 and $1.20 per common share in both 2015 and 2014. The total cash paid for dividends in 2016, 2015 and 2014 was $43.4 million, $43.1 million and $47.6 million, respectively.
On January 25, 2017, our Board of Directors declared a quarterly cash dividend of $0.35 per share on our common stock, payable on March 10, 2017, to shareholders of record at the close of business on February 24, 2017. Future cash dividends will depend upon financial condition, earnings and other factors deemed relevant by our Board of Directors.
Client Funds Obligations
Client funds obligations represent our contractual obligations to remit funds to satisfy client pharmacy claim obligations and are recorded on the balance sheet when incurred, generally after a claim has been processed by us. In addition, client funds obligations include transfer agency client balances invested overnight. We had $564.6 million, $533.4 million and $399.6 million of client funds obligations at December 31, 2016, 2015 and 2014, respectively.
Debt Activity
During 2016, we had the following primary sources of debt financing: our syndicated revolving credit facility; accounts receivable securitization program; and privately placed senior notes (the “Senior Notes”). We had $508.2 million, $562.1 million and $552.9 million of debt outstanding at December 31, 2016, 2015 and 2014, respectively, a decrease of $53.9 million during 2016 and an increase of $9.2 million during 2015.
The decrease in debt outstanding during 2016 was primarily resulting from the utilization of the proceeds from the sale of our North American Customer Communications business to pay down outstanding balances, partially offset by borrowings to fund the KRFS business acquisition, share repurchases and working capital uses. The increase in debt outstanding during 2015 was primarily from higher borrowings on the syndicated revolving credit facility, partially offset by the repayment of the Series A Senior Notes and the pay down of the accounts receivable securitization line. In 2015, we renewed our accounts receivable securitization program for a three year term through May 2018.
Our debt agreements contain customary restrictive covenants, including limitations on consolidated indebtedness, liens, investments, subsidiary indebtedness, asset dispositions and require certain consolidated leverage and interest coverage ratios to be maintained. We are currently in compliance with these covenants. A default under certain of our borrowings could trigger defaults under certain of our other debt obligations, which in turn could result in their maturities being accelerated. Our debt arrangements are further described in Item 8, Financial Statements and Supplementary Data - Note 10, “Debt.”
Contractual Obligations and Commercial Commitments
The following table sets forth our contractual obligations and commercial commitments (in millions):
Payment Due by Period | |||||||||||||||||||
Total | Less than 1 Year | 1 - 3 Years | 3 - 5 Years | More than 5 Years | |||||||||||||||
Debt obligations | $ | 508.5 | $ | 208.5 | $ | 140.0 | $ | 160.0 | $ | — | |||||||||
Operating lease obligations | 80.5 | 18.8 | 30.3 | 19.1 | 12.3 | ||||||||||||||
Software license agreements | 63.5 | 50.1 | 11.8 | 1.6 | — | ||||||||||||||
Other | 30.7 | 13.8 | 15.8 | 0.9 | 0.2 | ||||||||||||||
$ | 683.2 | $ | 291.2 | $ | 197.9 | $ | 181.6 | $ | 12.5 | ||||||||||
Interest obligations on our outstanding debt are not included in the table above. The syndicated revolving credit facility contains grid schedules that adjust borrowing costs up or down based upon our consolidated leverage ratio. The grid schedules may result in fluctuations in borrowing costs ranging from 1.00% to 1.70% over Eurodollar and 0.00% to 0.70% over base rate, as defined. The Senior Notes have fixed interest rates and are comprised of $105.0 million of 4.86% Series B Senior Notes, $65.0 million of 5.06% Series C Senior Notes and $160.0 million of 5.42% Series D Senior Notes. In addition to the financial instruments listed above, the program fees incurred on proceeds from the sale of receivables under our accounts receivable securitization program are determined based on variable interest rates associated with LIBOR.
39
We have liabilities for income tax uncertainties of $69.8 million at December 31, 2016. These obligations are classified as non-current on our Consolidated Balance Sheet as resolution of these matters is expected to take more than a year; however, the ultimate timing of resolution is uncertain.
Other Commercial Commitments
In the normal course of business, to facilitate transactions of services and products and other business assets, we have agreed to indemnify certain parties with respect to certain matters. We have agreed to hold certain parties harmless against losses arising from a breach of representations or covenants, or out of intellectual property infringement or other claims made by third parties. These agreements may limit the time within which an indemnification claim can be made and the amount of the claim. At December 31, 2016, except for certain immaterial items, there were no liabilities for guarantees or indemnifications as it is not possible to determine either the maximum potential amount under these indemnification agreements or the timing of any such payments due to the limited history of prior indemnification claims and the unique facts and circumstances involved in each particular agreement. Historically, payments made under these agreements have not had a material impact on our consolidated financial position, results of operations or cash flows.
Off-Balance Sheet Arrangements
An off-balance sheet arrangement is any transaction, agreement or other contractual arrangement involving an unconsolidated entity under which a company has (1) made guarantees, (2) a retained or a contingent interest in transferred assets, (3) an obligation under derivative instruments classified as equity, or (4) any obligation arising out of a material variable interest in an unconsolidated entity that provides financing, liquidity, market risk or credit risk support to the company, or that engages in leasing, hedging or research and development arrangements with the company.
We believe that our guarantee arrangements will not have a material current or future effect on our financial condition, changes in financial condition, revenues or expenses, capital expenditures, capital resources, liquidity or results of operations. These arrangements are described above and in Item 8, Financial Statements and Supplementary Data - Note 16, “Commitments and Contingencies.”
40
Item 7A. Quantitative and Qualitative Disclosures About Market Risk
The operation of our businesses and our financial results can be affected by changes in equity pricing, interest rates and currency exchange rates. Changes in interest rates and exchange rates have not materially impacted our consolidated financial position, results of operations or cash flows.
Available-for-sale equity price risk
Our investments in available-for-sale equity securities are subject to price risk. The fair value of our available-for-sale investments as of December 31, 2016 was approximately $180.5 million. The impact of a 10% change in fair value of these investments would have been approximately $11.2 million to comprehensive income. Changes in equity values of our investments have had and could have a material effect on our comprehensive income (loss) and financial position.
Interest rate risk
We and certain of our joint ventures derive service revenues from investment earnings related to cash balances maintained in bank accounts on which we are the agent for clients. The balances maintained in the bank accounts will fluctuate. For the year ended December 31, 2016, DST and BFDS had average daily cash balances of approximately $2.0 billion maintained in such accounts, of which approximately $1.2 billion were maintained at BFDS. We estimate that a 100 basis point change in the short-term interest earnings rate would equal approximately $7.1 million of net income (loss).
At December 31, 2016, we had $508.2 million of debt, of which $178.2 million was subject to variable interest rates (Federal Funds rates, LIBOR rates, Prime rates). We estimate that a 10% increase in interest rates would not have a significant impact to our consolidated pretax earnings or to the fair value of our debt.
The effect of changes in interest rates on our variable rate debt is mitigated by changes in interest rates attributable to balance earnings.
Foreign currency exchange rate risk
The operation of our subsidiaries in international markets results in our exposure to movements in currency exchange rates. The principal currencies involved are the British pound, Canadian dollar, Australian dollar, Thai baht and Indian rupee. Our international subsidiaries use the local currency as the functional currency. We translate our assets and liabilities at year-end exchange rates and translate income and expense accounts at average rates during the year. Currency exchange rate fluctuations have not historically significantly affected our consolidated financial results.
At December 31, 2016, our international subsidiaries for our continuing operations had approximately $135.3 million in total assets and for the year ended December 31, 2016, these international subsidiaries recorded net income of approximately $25.4 million. We estimate that a 10% change in exchange rates would have changed total consolidated assets by approximately $13.5 million. Furthermore, a 10% change in exchange rates based upon historical earnings in international operations would have changed consolidated net income for 2016 by approximately $2.5 million.
We have entered into foreign currency cash flow and economic hedging programs to mitigate the impact of movements in foreign currency (principally British pound, Australian dollar and Thai baht) on our operations. The total notional value of our foreign currency derivatives is $105.9 million at December 31, 2016. The fair value of the contracts that qualify for hedge accounting resulted in a liability of $0.1 million at December 31, 2016. We estimate that a 10% change in exchange rates would result in a $0.4 million change in other comprehensive income. The fair value of the contracts that do not qualify for hedge accounting resulted in a liability of $0.3 million at December 31, 2016. We estimate a 10% change in exchange rates on these contracts would result in a $5.5 million change to consolidated net income. Gains and losses on the derivative instruments are largely offset by changes in the underlying hedged items, resulting in a minimal impact on earnings.
41
Item 8. Financial Statements and Supplementary Data
Report of Independent Registered Public Accounting Firm
To the Stockholders of DST Systems, Inc.:
In our opinion, the consolidated financial statements listed in the index appearing under Item 15(a)(1) present fairly, in all material respects, the financial position of DST Systems, Inc. and its subsidiaries at December 31, 2016 and December 31, 2015, and the results of their operations and their cash flows for each of the three years in the period ended December 31, 2016 in conformity with accounting principles generally accepted in the United States of America. Also in our opinion, the Company maintained, in all material respects, effective internal control over financial reporting as of December 31, 2016, based on criteria established in Internal Control - Integrated Framework (2013) issued by the Committee of Sponsoring Organizations of the Treadway Commission (COSO). The Company's management is responsible for these financial statements, for maintaining effective internal control over financial reporting and for its assessment of the effectiveness of internal control over financial reporting, included in the accompanying Report of Management on Internal Control over Financial Reporting appearing under Item 9A. Our responsibility is to express opinions on these financial statements and on the Company's internal control over financial reporting based on our integrated audits. We conducted our audits in accordance with the standards of the Public Company Accounting Oversight Board (United States). Those standards require that we plan and perform the audits to obtain reasonable assurance about whether the financial statements are free of material misstatement and whether effective internal control over financial reporting was maintained in all material respects. Our audits of the financial statements included examining, on a test basis, evidence supporting the amounts and disclosures in the financial statements, assessing the accounting principles used and significant estimates made by management, and evaluating the overall financial statement presentation. Our audit of internal control over financial reporting included obtaining an understanding of internal control over financial reporting, assessing the risk that a material weakness exists, and testing and evaluating the design and operating effectiveness of internal control based on the assessed risk. Our audits also included performing such other procedures as we considered necessary in the circumstances. We believe that our audits provide a reasonable basis for our opinions.
A company’s internal control over financial reporting is a process designed to provide reasonable assurance regarding the reliability of financial reporting and the preparation of financial statements for external purposes in accordance with generally accepted accounting principles. A company’s internal control over financial reporting includes those policies and procedures that (i) pertain to the maintenance of records that, in reasonable detail, accurately and fairly reflect the transactions and dispositions of the assets of the company; (ii) provide reasonable assurance that transactions are recorded as necessary to permit preparation of financial statements in accordance with generally accepted accounting principles, and that receipts and expenditures of the company are being made only in accordance with authorizations of management and directors of the company; and (iii) provide reasonable assurance regarding prevention or timely detection of unauthorized acquisition, use, or disposition of the company’s assets that could have a material effect on the financial statements.
Because of its inherent limitations, internal control over financial reporting may not prevent or detect misstatements. Also, projections of any evaluation of effectiveness to future periods are subject to the risk that controls may become inadequate because of changes in conditions, or that the degree of compliance with the policies or procedures may deteriorate.

Kansas City, Missouri
February 28, 2017
42
DST Systems, Inc. Consolidated Balance Sheet (dollars in millions, except per share amounts) | |||||||
December 31, | |||||||
2016 | 2015 | ||||||
Assets | |||||||
Current assets | |||||||
Cash and cash equivalents | $ | 195.5 | $ | 79.5 | |||
Funds held on behalf of clients | 500.5 | 480.2 | |||||
Client funding receivable | 64.1 | 53.2 | |||||
Accounts receivable (includes related party receivables of $19.7 and $20.8) | 215.5 | 214.8 | |||||
Other assets | 70.0 | 49.8 | |||||
Current assets held for sale | 72.6 | 178.0 | |||||
1,118.2 | 1,055.5 | ||||||
Investments | 377.4 | 418.2 | |||||
Unconsolidated affiliates | 331.2 | 312.2 | |||||
Properties, net | 235.7 | 256.7 | |||||
Intangible assets, net | 142.6 | 135.8 | |||||
Goodwill | 516.4 | 458.3 | |||||
Other assets | 50.3 | 57.0 | |||||
Noncurrent assets held for sale | — | 119.5 | |||||
Total assets | $ | 2,771.8 | $ | 2,813.2 | |||
Liabilities | |||||||
Current liabilities | |||||||
Current portion of debt | $ | 208.5 | $ | 5.6 | |||
Client funds obligations | 564.6 | 533.4 | |||||
Accounts payable | 62.9 | 51.2 | |||||
Accrued compensation and benefits | 101.7 | 126.5 | |||||
Deferred revenues and gains | 23.5 | 50.4 | |||||
Income taxes payable | 22.0 | — | |||||
Other liabilities | 78.1 | 66.2 | |||||
Current liabilities held for sale | 30.1 | 115.4 | |||||
1,091.4 | 948.7 | ||||||
Long-term debt | 299.7 | 556.5 | |||||
Income taxes payable | 69.8 | 73.8 | |||||
Deferred income taxes | 151.5 | 104.7 | |||||
Other liabilities | 22.9 | 23.9 | |||||
Noncurrent liabilities held for sale | — | 44.5 | |||||
Total liabilities | 1,635.3 | 1,752.1 | |||||
Commitments and contingencies (Note 16) | |||||||
Redeemable Non-controlling Interest | 21.3 | 15.1 | |||||
Stockholders’ Equity | |||||||
Preferred stock, $0.01 par, 10 million shares authorized and unissued | — | — | |||||
Common stock, $0.01 par, 400 million shares authorized, and 50.0 million shares issued | 0.5 | 0.5 | |||||
Additional paid-in capital | 129.5 | 136.7 | |||||
Retained earnings | 2,379.2 | 1,996.6 | |||||
Treasury stock, at cost | (1,410.6 | ) | (1,129.7 | ) | |||
Accumulated other comprehensive income | 16.6 | 41.9 | |||||
Total stockholders’ equity | 1,115.2 | 1,046.0 | |||||
Total liabilities, redeemable non-controlling interest and stockholders’ equity | $ | 2,771.8 | $ | 2,813.2 | |||
The accompanying notes are an integral part of these financial statements.
43
DST Systems, Inc. Consolidated Statement of Income (in millions, except per share amounts) | |||||||||||
Year Ended December 31, | |||||||||||
2016 | 2015 | 2014 | |||||||||
Operating revenues | $ | 1,474.4 | $ | 1,405.0 | $ | 1,445.5 | |||||
Out-of-pocket reimbursements | 82.3 | 69.0 | 59.3 | ||||||||
Total revenues (includes related party revenues of $150.7, $150.3 and $148.8) | 1,556.7 | 1,474.0 | 1,504.8 | ||||||||
Costs and expenses | 1,213.4 | 1,150.2 | 1,149.1 | ||||||||
Depreciation and amortization | 96.0 | 91.1 | 93.0 | ||||||||
Operating income | 247.3 | 232.7 | 262.7 | ||||||||
Interest expense | (23.5 | ) | (23.8 | ) | (26.3 | ) | |||||
Gain on sale of business | 5.5 | — | 100.5 | ||||||||
Other income, net | 22.7 | 204.5 | 373.1 | ||||||||
Equity in earnings of unconsolidated affiliates | 27.2 | 45.4 | 34.7 | ||||||||
Income from continuing operations before income taxes and non-controlling interest | 279.2 | 458.8 | 744.7 | ||||||||
Income taxes | 101.1 | 149.2 | 183.9 | ||||||||
Income from continuing operations before non-controlling interest | 178.1 | 309.6 | 560.8 | ||||||||
Income from discontinued operations, net of tax | 248.3 | 48.5 | 32.5 | ||||||||
Net income | 426.4 | 358.1 | 593.3 | ||||||||
Net loss attributable to non-controlling interest | 0.9 | 0.1 | — | ||||||||
Net income attributable to DST Systems, Inc. | $ | 427.3 | $ | 358.2 | $ | 593.3 | |||||
Weighted average common shares outstanding | 33.0 | 36.0 | 40.0 | ||||||||
Weighted average diluted shares outstanding | 33.3 | 36.4 | 40.5 | ||||||||
Basic earnings per share: | |||||||||||
Continuing operations attributable to DST Systems, Inc. | $ | 5.43 | $ | 8.60 | $ | 14.01 | |||||
Discontinued operations | 7.53 | 1.35 | 0.81 | ||||||||
Basic earnings per share | $ | 12.96 | $ | 9.95 | $ | 14.82 | |||||
Diluted earnings per share: | |||||||||||
Continuing operations attributable to DST Systems, Inc. | $ | 5.37 | $ | 8.50 | $ | 13.86 | |||||
Discontinued operations | 7.45 | 1.33 | 0.80 | ||||||||
Diluted earnings per share | $ | 12.82 | $ | 9.83 | $ | 14.66 | |||||
Cash dividends per share of common stock | $ | 1.32 | $ | 1.20 | $ | 1.20 | |||||
The accompanying notes are an integral part of these financial statements.
44
DST Systems, Inc. Consolidated Statement of Comprehensive Income (in millions) | |||||||||||
Year Ended December 31, | |||||||||||
2016 | 2015 | 2014 | |||||||||
Net income attributable to DST Systems, Inc. | $ | 427.3 | $ | 358.2 | $ | 593.3 | |||||
Other comprehensive loss, net of tax and reclassifications to earnings: | |||||||||||
Unrealized holding gains (losses) on available-for-sale securities | 10.1 | (123.2 | ) | (93.6 | ) | ||||||
Unrealized gains on cash flow hedges | — | 0.2 | 0.2 | ||||||||
Foreign currency translation adjustments | (35.4 | ) | (22.0 | ) | (27.9 | ) | |||||
Other comprehensive loss | (25.3 | ) | (145.0 | ) | (121.3 | ) | |||||
Comprehensive income | $ | 402.0 | $ | 213.2 | $ | 472.0 | |||||
The accompanying notes are an integral part of these financial statements.
45
DST Systems, Inc. Consolidated Statement of Changes in Stockholders’ Equity (in millions) | ||||||||||||||||||||||||||
Common Stock | Accumulated Other Comprehensive Income | |||||||||||||||||||||||||
Shares Outstanding | Par Value | Additional Paid-in Capital | Retained Earnings | Treasury Stock | Total Stockholders’ Equity | |||||||||||||||||||||
December 31, 2013 | 41.8 | $ | 1.0 | $ | 187.3 | $ | 3,777.7 | $ | (3,090.4 | ) | $ | 308.2 | $ | 1,183.8 | ||||||||||||
Comprehensive income: | ||||||||||||||||||||||||||
Net income attributable to DST Systems, Inc. | — | — | — | 593.3 | — | — | 593.3 | |||||||||||||||||||
Other comprehensive loss | — | — | — | — | — | (121.3 | ) | (121.3 | ) | |||||||||||||||||
Dividends | — | — | 0.7 | (48.3 | ) | — | — | (47.6 | ) | |||||||||||||||||
Amortization of share based compensation | — | — | 21.0 | — | — | — | 21.0 | |||||||||||||||||||
Issuance of common stock | 0.5 | — | (8.0 | ) | — | 28.0 | — | 20.0 | ||||||||||||||||||
Repurchase of common stock | (4.7 | ) | — | — | — | (424.5 | ) | — | (424.5 | ) | ||||||||||||||||
Retirement of treasury stock | — | (0.5 | ) | (98.3 | ) | (2,639.8 | ) | 2,738.6 | — | — | ||||||||||||||||
Other | — | — | 11.7 | — | — | — | 11.7 | |||||||||||||||||||
December 31, 2014 | 37.6 | 0.5 | 114.4 | 1,682.9 | (748.3 | ) | 186.9 | 1,236.4 | ||||||||||||||||||
Comprehensive income: | ||||||||||||||||||||||||||
Net income attributable to DST Systems, Inc. | — | — | — | 358.2 | — | — | 358.2 | |||||||||||||||||||
Other comprehensive loss | — | — | — | — | — | (145.0 | ) | (145.0 | ) | |||||||||||||||||
Dividends | — | — | 1.4 | (44.5 | ) | — | — | (43.1 | ) | |||||||||||||||||
Amortization of share based compensation | — | — | 27.9 | — | — | — | 27.9 | |||||||||||||||||||
Issuance of common stock | 0.3 | — | (5.2 | ) | — | 23.9 | — | 18.7 | ||||||||||||||||||
Repurchase of common stock | (3.6 | ) | — | — | — | (405.3 | ) | — | (405.3 | ) | ||||||||||||||||
Other | — | — | (1.8 | ) | — | — | — | (1.8 | ) | |||||||||||||||||
December 31, 2015 | 34.3 | 0.5 | 136.7 | 1,996.6 | (1,129.7 | ) | 41.9 | 1,046.0 | ||||||||||||||||||
Comprehensive income: | ||||||||||||||||||||||||||
Net income attributable to DST Systems, Inc. | — | — | — | 427.3 | — | — | 427.3 | |||||||||||||||||||
Other comprehensive loss | — | — | — | — | — | (25.3 | ) | (25.3 | ) | |||||||||||||||||
Dividends | — | — | 1.3 | (44.7 | ) | — | — | (43.4 | ) | |||||||||||||||||
Amortization of share based compensation | — | — | 16.3 | — | — | — | 16.3 | |||||||||||||||||||
Issuance of common stock | 0.4 | — | (24.5 | ) | — | 34.9 | — | 10.4 | ||||||||||||||||||
Repurchase of common stock | (2.7 | ) | — | — | — | (315.8 | ) | — | (315.8 | ) | ||||||||||||||||
Other | — | — | (0.3 | ) | — | — | — | (0.3 | ) | |||||||||||||||||
December 31, 2016 | 32.0 | $ | 0.5 | $ | 129.5 | $ | 2,379.2 | $ | (1,410.6 | ) | $ | 16.6 | $ | 1,115.2 | ||||||||||||
The accompanying notes are an integral part of these financial statements.
46
DST Systems, Inc. Consolidated Statement of Cash Flows (in millions) | |||||||||||
Year Ended December 31, | |||||||||||
2016 | 2015 | 2014 | |||||||||
Cash flows—operating activities: | |||||||||||
Net income | $ | 426.4 | $ | 358.1 | $ | 593.3 | |||||
Less: income from discontinued operations | 248.3 | 48.5 | 32.5 | ||||||||
Income from continuing operations | 178.1 | 309.6 | 560.8 | ||||||||
Depreciation and amortization | 96.0 | 91.1 | 93.0 | ||||||||
Net gains on investments | (2.4 | ) | (163.6 | ) | (281.8 | ) | |||||
Gains on sale of properties and businesses | (5.6 | ) | (4.5 | ) | (101.3 | ) | |||||
Amortization of share-based compensation | 12.2 | 24.1 | 17.7 | ||||||||
Equity in earnings of unconsolidated affiliates | (27.2 | ) | (45.4 | ) | (34.7 | ) | |||||
Cash dividends from unconsolidated affiliates | 0.4 | 3.5 | 1.8 | ||||||||
Gain on contract to repurchase common stock | — | — | (18.1 | ) | |||||||
Deferred income taxes | 17.0 | (15.5 | ) | 1.4 | |||||||
Changes in accounts receivable | (16.0 | ) | (10.6 | ) | (6.1 | ) | |||||
Changes in other assets | (0.8 | ) | (9.4 | ) | 1.1 | ||||||
Changes in client funds obligations | 10.9 | 9.9 | (6.9 | ) | |||||||
Changes in client funding receivable | (10.9 | ) | (9.9 | ) | 6.9 | ||||||
Changes in accounts payable and accrued liabilities | 16.6 | (1.8 | ) | 3.9 | |||||||
Changes in income taxes payable | (67.9 | ) | (31.6 | ) | (23.2 | ) | |||||
Changes in deferred revenues and gains | (4.6 | ) | (2.1 | ) | 0.4 | ||||||
Changes in accrued compensation and benefits | (26.9 | ) | (7.7 | ) | 8.0 | ||||||
Other, net | (6.2 | ) | (0.4 | ) | 19.5 | ||||||
Net cash provided from continuing operating activities | 162.7 | 135.7 | 242.4 | ||||||||
Net cash provided from discontinued operating activities | 26.4 | 84.5 | 70.1 | ||||||||
Net cash provided from operating activities | 189.1 | 220.2 | 312.5 | ||||||||
Cash flows—investing activities: | |||||||||||
Cash paid for capital expenditures | (60.4 | ) | (88.9 | ) | (82.6 | ) | |||||
Investments in securities | (258.3 | ) | (166.4 | ) | (76.4 | ) | |||||
Proceeds from (investments in and advances to) unconsolidated affiliates, net | (23.8 | ) | 11.1 | 10.0 | |||||||
Proceeds from sale / maturities of investments | 317.8 | 358.6 | 419.4 | ||||||||
Net increase in restricted cash and cash equivalents held to satisfy client funds obligations | (20.3 | ) | (113.5 | ) | (44.9 | ) | |||||
Proceeds from sale of properties | 5.7 | 6.1 | 32.2 | ||||||||
Acquisition of businesses, net of cash and cash equivalents acquired | (93.5 | ) | (117.4 | ) | — | ||||||
Proceeds from sale of businesses, net of cash and cash equivalents sold | 14.5 | 7.9 | 77.4 | ||||||||
Other, net | 1.0 | 0.1 | — | ||||||||
Net cash provided from (used in) continuing investing activities | (117.3 | ) | (102.4 | ) | 335.1 | ||||||
Net cash provided from (used in) discontinued investing activities | 412.9 | 104.9 | (30.4 | ) | |||||||
Net cash provided from investing activities | 295.6 | 2.5 | 304.7 | ||||||||
Cash flows—financing activities: | |||||||||||
Proceeds from issuance of common stock | 5.3 | 11.8 | 13.0 | ||||||||
Principal payments on debt | (5.1 | ) | (46.4 | ) | (132.3 | ) | |||||
Net proceeds (repayments) on accounts receivable securitization program | 103.2 | (120.0 | ) | (30.0 | ) | ||||||
Net borrowings (repayments) on revolving credit facilities | (151.1 | ) | 181.8 | 33.9 | |||||||
Net increase in client funds obligations | 20.3 | 124.0 | 39.9 | ||||||||
Receipt of third party capital in investment fund | 7.1 | 15.0 | — | ||||||||
Common stock repurchased | (315.8 | ) | (405.3 | ) | (406.4 | ) | |||||
Payment of cash dividends | (43.4 | ) | (43.1 | ) | (47.6 | ) | |||||
Excess tax benefits from share based compensation | 4.7 | 5.6 | 6.1 | ||||||||
Other, net | — | (2.1 | ) | (3.4 | ) | ||||||
47
DST Systems, Inc. Consolidated Statement of Cash Flows, continued (in millions) | |||||||||||
December 31, | |||||||||||
2016 | 2015 | 2014 | |||||||||
Net cash used for continuing financing activities | (374.8 | ) | (278.7 | ) | (526.8 | ) | |||||
Net cash used for discontinued financing activities | — | (6.1 | ) | (1.2 | ) | ||||||
Net cash used for financing activities | (374.8 | ) | (284.8 | ) | (528.0 | ) | |||||
Net increase (decrease) in cash and cash equivalents, including cash within assets held for sale | 109.9 | (62.1 | ) | 89.2 | |||||||
Cash and cash equivalents, beginning of year | 89.6 | 151.7 | 62.5 | ||||||||
Cash and cash equivalents, end of year | 199.5 | 89.6 | 151.7 | ||||||||
Less: cash and cash equivalents held for sale | 4.0 | 10.1 | 12.1 | ||||||||
Cash and cash equivalents of continuing operations, end of year | $ | 195.5 | $ | 79.5 | $ | 139.6 | |||||
The accompanying notes are an integral part of these financial statements.
48
1. Description of Business
DST Systems, Inc. and consolidated subsidiaries (“we,” “our,” “us,” the “Company” or “DST”) use proprietary software applications to provide sophisticated information processing and servicing solutions, through strategically unified business processing and data management, to clients globally within the asset management, brokerage, retirement, healthcare and other markets. Our wholly-owned data centers provide the secure technology infrastructure necessary to support our solutions.
We manage our business through our two operating segments, Financial Services and Healthcare Services. Investments in equity securities, private equity investments, real estate and certain financial interests have been aggregated into the Investments and Other segment.
On July 1, 2016, we completed the sale of our North American Customer Communications business. Additionally, during 2016, our Board of Directors approved a plan for management to pursue the divestiture of our United Kingdom Customer Communications business. As a result, beginning in 2016, the Customer Communications segment, as well as certain businesses previously reported within the Financial Services segment that were part of the July 1, 2016 sale, have been reported as discontinued operations. Prior period amounts have been adjusted to be consistent with the current discontinued operations presentation. See Note 4, Discontinued Operations, for additional information.
2. Significant Accounting Policies
Principles of consolidation
The consolidated financial statements include all majority-owned subsidiaries of the Company. Intercompany balances and transactions have been eliminated. Certain amounts in the 2015 and 2014 consolidated financial statements have been reclassified to conform to the 2016 presentation.
We consolidate any entity in which we have a controlling financial interest. Under the voting interest model, generally the investor that has voting control (usually more than 50% of an entity’s voting interests) consolidates the entity. Under the variable interest entity (“VIE”) model, the party that has the power to direct the entity’s most significant economic activities and the ability to participate in the entity’s economics consolidates the entity. An entity is considered a VIE if it possesses one of the following characteristics: 1) the entity is thinly capitalized; 2) residual equity holders do not control the entity; 3) equity holders are shielded from economic losses; 4) equity holders do not participate fully in an entity’s residual economics; and 5) the entity was established with non-substantive voting interests.
For consolidated subsidiaries that are less than wholly owned, the third-party holdings of equity interests are referred to as non-controlling interests. Non-controlling interests that are redeemable or convertible for cash or other assets at the option of the holder are classified separate from stockholders’ equity on the Consolidated Balance Sheet. The portion of net income (loss) attributable to the non-controlling interest for such subsidiaries is presented as net income (loss) attributable to non-controlling interest in the Consolidated Statement of Income.
We have the following significant operating joint ventures: BFDS; IFDS U.K.; and IFDS L.P. We do not have a controlling financial interest in these entities and therefore account for the financial results of these operating joint ventures using the equity method of accounting.
We are the lessee in a series of operating leases covering a large portion of our Kansas City, Missouri-based leased office facilities. The lessors are generally joint ventures (in which we have a 50% ownership) that have been established specifically to purchase, finance and engage in leasing activities with the joint venture partners and unrelated third parties. Our analysis of our real estate joint ventures for all periods presented indicate that none qualified as a VIE and, accordingly, they have not been consolidated.
We provide investment management services to, and have transactions with, various exchange traded funds, mutual funds and other investment products sponsored by the Company in the normal course of business. We generally are considered to have a controlling financial interest in a fund when we own a majority of the outstanding controlling shares, which may arise as a result of seed capital investments in newly launched investment products from the time of initial launch to the time that the fund becomes majority-held by third-party investors.
49
Use of estimates
The preparation of financial statements in conformity with accounting principles generally accepted in the United States of America requires management to make estimates and assumptions that affect the reported amounts of assets and liabilities, disclosure of contingent assets and liabilities and the reported amounts of revenues and expenses. Actual results could differ from those estimates.
Revenue recognition
We recognize revenue when it is realized or realizable and it is earned. The majority of our revenues are derived from computer processing and services and are recognized upon completion of the services provided. Software license fees, maintenance fees and other ancillary fees are recognized as services are provided or delivered and all customer obligations have been met. We generally do not have payment terms from customers that extend beyond one year. Revenue from operating leases is recognized monthly as the rent accrues. Billing for services in which cash is collected in advance of performance is recorded as deferred revenue. Allowances for billing adjustments and doubtful account expense are estimated as revenues are recognized. Allowances for billing adjustments are recorded as reductions in revenues and doubtful account expense is recorded within Costs and expenses. The annual amounts for these items are immaterial to our consolidated financial statements.
We recognize revenue when the following criteria are met: 1) persuasive evidence of an arrangement exists; 2) delivery has occurred or services have been rendered; 3) the sales price is fixed or determinable; and 4) collectibility is reasonably assured. If there is a customer-specific acceptance provision in a contract or if there is uncertainty about customer acceptance, the associated revenue is deferred until we have evidence of customer acceptance.
Revenue arrangements with multiple deliverables are evaluated to determine if the deliverables (items) can be divided into more than one unit of accounting. An item can generally be considered a separate unit of accounting if both of the following criteria are met: 1) the delivered item(s) has value to the customer on a standalone basis and 2) if the arrangement includes a general right of return relative to the delivered item(s), delivery or performance of the undelivered item(s) is considered probable and substantially in our control. Once separate units of accounting are determined, the arrangement consideration is allocated at the inception of the arrangement to all deliverables using the relative selling price method. Relative selling price is obtained from sources such as vendor-specific objective evidence, which is based on the separate selling price for that or a similar item or from third-party evidence such as how competitors have priced similar items. If such evidence is unavailable, we use our best estimate of the selling price, which includes various internal factors such as our pricing strategy and market factors.
Software license revenues are recognized at the time the contract is signed, the software is delivered and no future software obligations exist. Deferral of software license revenue results from delayed payment provisions, disproportionate discounts between the license and other services or the inability to unbundle certain services. We recognize revenues for maintenance services ratably over the contract term, after collectibility has been reasonably assured.
Reimbursements received for “out-of-pocket” (“OOP”) expenses, such as postage and telecommunications charges, are recorded as revenue on an accrual basis. Because these additional revenues are offset by the reimbursable expenses incurred, they have minimal impact on income from operations and net income. For each segment, total revenues are reported in two categories, operating revenues and OOP reimbursements. OOP expenses are included in costs and expenses.
Costs and expenses
Costs and expenses include all costs, excluding depreciation and amortization, incurred to produce revenues. We believe that the nature of our business as well as our organizational structure, in which virtually all officers and associates have operational responsibilities, does not allow for a meaningful segregation of selling, general and administrative costs. These costs, which we believe to be immaterial, are also included in costs and expenses. Substantially all depreciation and amortization is directly associated with the production of revenues.
Cash equivalents
Short-term liquid investments with original maturities of 90 days or less are considered cash equivalents. Due to the short-term nature of these investments, carrying value approximates market value.
50
Client funds/obligations
Funds held on behalf of clients
In connection with providing data processing services for our clients, we may hold client funds on behalf of transfer agency clients and pharmacy processing clients. End-of-day available client bank balances for full service mutual fund transfer agency clients are invested overnight. Invested balances are returned to the full service mutual fund transfer agency client accounts the following business day. Funds received from clients for the payment of pharmacy claims incurred by its members are invested until the claim payments are presented to the bank. These amounts are included in funds held on behalf of clients in the Consolidated Balance Sheet and represent assets that are restricted for use.
Client funding receivable
Client funding receivables represent amounts due to us for pharmacy claims paid in advance of receiving client funding and for pharmacy claims processed for which client funding requests have not been made.
Client funds obligations
Client funds obligations represent our contractual obligations to remit funds to satisfy client pharmacy claim obligations and are recorded on the balance sheet when incurred, generally after a claim has been processed by us. In addition, client funds obligations include transfer agency client balances invested overnight.
We have reported the cash flows related to the purchases of investment funds (available-for-sale securities) held on behalf of clients and the cash flows related to the proceeds from the sales/maturities of investment funds held on behalf of clients on a gross basis in the investing section of the Consolidated Statement of Cash Flows. We have reported the cash inflows and outflows related to client fund investments on a net basis within net (increase) decrease in restricted cash and cash equivalents held to satisfy client funds obligations in the investing section of the Consolidated Statement of Cash Flows. We have reported the cash flows related to client funds used in investing activities on a net basis within net increase (decrease) in client funds obligations in the financing section of the Consolidated Statement of Cash Flows.
Investments
The equity method of accounting is used for investments in entities, partnerships and similar interests (including investments in private equity funds where we are the limited partner) in which we have significant influence but do not control. Under the equity method, we recognize income or losses from our pro-rata share of these unconsolidated affiliates’ net income or loss, which changes the carrying value of the investment of the unconsolidated affiliate. In certain cases, pro-rata losses are recognized only to the extent of our investment in and advances to the unconsolidated affiliate.
The cost method of accounting is used for these investments when we have a de minimis ownership percentage and do not have significant influence. Our cost method investments are held at the lower of cost or market.
Investments classified as available-for-sale securities are reported at fair value with unrealized gains and losses excluded from earnings and recorded net of deferred taxes directly to stockholders’ equity as accumulated other comprehensive income. Investments in trading securities are reported at fair value with unrealized gains and losses included in earnings. Investments classified as held-to-maturity securities are recorded at amortized cost, which approximates fair value.
Investment funds which are consolidated as a result of our seed capital investment are considered investment companies and therefore we retain the specialized industry accounting principles of these investment products in our consolidated financial statements. Upon consolidation of a fund, the underlying securities of the fund are reflected at fair value with gains and losses included in Other income, net in the Consolidated Statement of Income.
Security transactions and investment income
Security transactions are accounted for on the trade date. Security gains and losses are calculated on the specific identification method. Dividend income is recorded on the ex-dividend date. Interest income, adjusted for discounts and premiums, is recorded on the accrual basis.
51
Property and equipment
Property and equipment are recorded at cost with major additions and improvements capitalized. Cost includes the amount of interest cost associated with significant capital additions. Depreciation of buildings is recorded using the straight-line method over 30 to 40 years. Technology equipment, furniture, fixtures and other equipment are depreciated using accelerated methods over the estimated useful lives, principally three to five years. Software is depreciated using the straight-line method over the estimated useful lives, generally three to five years. Leasehold improvements are depreciated using the straight-line method over the lesser of the term of the lease or life of the improvements. We review, on a quarterly basis, our property and equipment for possible impairment.
Purchased software is recorded at cost and is amortized over the estimated economic life, which is generally three to five years. We capitalize costs for the development of internal use software, including coding and software configuration costs and costs of upgrades and enhancements, after the preliminary project phase has been completed and management has committed to funding the project. These costs are amortized on a straight-line basis, depending on the nature of the project, generally over a three to five year period. We review, on a quarterly basis, our capitalized software for possible impairment.
Development costs for software that will be sold or licensed to third parties, prior to the achievement of technological feasibility, are expensed as incurred. We capitalize software development costs for software that will be sold or licensed to third parties which are incurred after the products reach technological feasibility but prior to the general release of the product to customers. These capitalized development costs are amortized on a product-by-product basis using the greater of the amount computed by taking the ratio of current year’s gross revenues to current and anticipated future gross revenues or the amount computed by the straight-line method over the estimated useful life of the product, which is generally three to five years. We evaluate the net realizable value of capitalized software development costs on a product-by-product basis.
Goodwill and intangible assets
We have recorded goodwill and intangible assets in connection with various acquisitions of businesses. Intangible assets at December 31, 2016 and 2015 primarily represent customer relationships and other definite lived intangible assets (trade names, non-compete agreements, etc.) acquired. The estimated useful life on these intangible assets ranges from 3 to 19 years. The weighted average amortization period at December 31, 2016 for customer relationships and other intangible assets is 14.7 and 8.7 years, respectively.
We assess the impairment of goodwill at least annually (as of October 1) and assess identifiable intangibles, long-lived assets and related assets whenever events or changes in circumstances indicate that the carrying value may not be recoverable. Intangible assets that have finite lives will continue to be amortized over their useful lives.
Our assessment of goodwill for impairment for 2016 included a quantitative assessment that compared the fair value to the net book value of our reporting units. The fair value of the reporting units was estimated using the present value of expected future cash flows and substantially exceeded the carrying value of the reporting units. For 2015, we performed a qualitative assessment that considered various factors, including growth in operating revenues and income from operations of our reporting units since our last quantitative assessment in 2014. Our 2016, 2015 and 2014 annual goodwill impairment tests determined that goodwill was not impaired, except during 2016 for the goodwill held at the Customer Communications U.K. reporting unit, which is included as a component of discontinued operations, as further described in Note 4, Discontinued Operations.
Income taxes
We recognize the amount of income taxes payable or refundable for the current year and deferred tax liabilities and assets for the future tax consequences of events that have been recognized in our financial statements or tax returns. Deferred income tax effects of transactions reported in different periods for financial reporting and income tax return purposes are recorded by the liability method. This method gives consideration to the future tax consequences of deferred income or expense items and differences between the income tax and financial accounting statement bases of assets and liabilities and immediately recognizes changes in income tax laws upon enactment. The income statement effect is generally derived from changes in deferred income taxes on the balance sheet.
From time to time, we enter into transactions for which the tax treatment under the Internal Revenue Code or applicable state tax laws is uncertain. We provide federal and/or state income taxes on such transactions, together with related interest, net of income tax benefit, and any applicable penalties in accordance with accounting guidance for income tax uncertainties. We record income tax uncertainties that are estimated to take more than 12 months to resolve as non-current. Interest and penalties related to unrecognized tax benefits, if any, are recorded in income tax expense.
52
Foreign currency translation
Our international subsidiaries use the local currency as the functional currency. We translate our assets and liabilities at period-end exchange rates. Income and expense accounts are translated at average rates during the period.
Earnings per share
Basic earnings per share are determined by dividing net income by the weighted average number of common shares outstanding during the year. Diluted earnings per share are determined by including the dilutive effect of all potential common shares outstanding during the year. See Note 13, Equity, for additional details regarding our earnings per share computation.
Derivative and hedging activities
We recognize all derivatives as either assets or liabilities in the balance sheet and measure those instruments at fair value and the changes in the fair value of derivatives are recorded each period in current earnings or other comprehensive income, depending on whether a derivative is designated as part of a hedge transaction and, if it is, the type of hedge transaction. From time to time, we utilize derivatives to manage interest rate and foreign currency risks. We do not enter into derivative arrangements for speculative purposes. At December 31, 2016 and 2015, we had derivative instruments outstanding as described in Note 11, Hedging Transactions and Derivative Financial Instruments.
Comprehensive income
Our comprehensive income consists of net income and unrealized gains or losses on available-for-sale securities, our proportional share of unconsolidated affiliates’ other comprehensive income (limited by the carrying value of the investment), unrealized gains or losses on our cash flow hedges and foreign currency translation adjustments, which are presented in the Consolidated Statement of Comprehensive Income, net of tax and reclassifications to earnings.
Share-based compensation
We have share-based compensation plans covering our employees and our non-employee directors and have outstanding share awards (primarily in the form of stock options, restricted stock, restricted stock units and performance stock units) under each of these plans. We recognize the cost of employee services received in exchange for awards of equity instruments based on the grant date fair value of those awards offset by estimates of compensation costs related to awards that are not expected to vest. For share-based awards granted, we expense the grant date fair value of these awards using the straight-line method over the service period. Amortization for the grant date fair value of share-based awards containing both service and performance features depends on our judgments on whether the performance conditions will be achieved.
New authoritative accounting guidance
In November 2016, the Financial Accounting Standards Board (“FASB”) issued guidance which requires the statement of cash flows to explain changes during the period in the total of cash, cash equivalents, and amounts generally described as restricted cash or restricted cash equivalents. The guidance is effective January 1, 2018 and requires retrospective application. Early adoption is permitted. We are currently evaluating the standard and the impact it will have on our consolidated financial statements.
In October 2016, the FASB issued guidance which requires the recognition of income tax consequences for intra-entity transfers of assets other than inventory. The guidance is effective January 1, 2018 and requires modified retrospective application. Early adoption is permitted. We are currently evaluating the standard and the impact it will have on our consolidated financial statements.
In August 2016, the FASB issued guidance to clarify how certain transactions are presented and classified in the statement of cash flows. The guidance is effective January 1, 2018 with early adoption permitted. We do not expect the adoption of this new standard to have a material impact on our consolidated financial statements.
In March 2016, the FASB issued guidance which simplifies several aspects of the accounting for employee share-based payment transactions, including the accounting for income taxes, forfeitures, and statutory tax withholding requirements, as well as classification of related amounts within the statement of cash flows. The guidance is effective January 1, 2017, with early adoption permitted. We expect increased volatility in earnings as the excess tax benefits driven by changes in our stock price will be recorded to the Consolidated Statement of Income upon adoption.
In February 2016, the FASB issued guidance which requires lessees to reflect most leases on their balance sheet as assets and obligations. The guidance is effective January 1, 2019 with early adoption permitted. The standard is to be applied under the
53
modified retrospective method, with elective reliefs, which requires application of the new guidance for all periods presented. We are currently evaluating the standard and the impact it will have on our consolidated financial statements and related disclosures.
In January 2016, the FASB issued guidance which updates the reporting model for certain financial instruments, including the requirement for equity investments (except those accounted for under the equity method of accounting or those that result in consolidation of the investee) to be measured at fair value with changes in fair value recognized in net income. The guidance is effective January 1, 2018 and requires a cumulative-effective adjustment as of the beginning of the fiscal year of adoption. Early adoption is permitted as of the beginning of the fiscal year of adoption. We are currently evaluating the standard and the impact it will have on our consolidated financial statements.
In September 2015, the FASB issued guidance which requires that an acquirer recognize adjustments to provisional amounts in a business combination that are identified during the measurement period in the reporting period in which the adjustment amounts are determined. Effects on earnings as a result of the change to the provisional amounts should be recorded in the same period’s financial statements and calculated as if the accounting had been completed at the acquisition date. The guidance was adopted on January 1, 2016 and did not have a material impact on our consolidated financial statements.
In February 2015, the FASB issued guidance which changes the way reporting enterprises evaluate whether (a) they should consolidate limited partnerships and similar entities, (b) fees paid to a decision maker or service provider are variable interests in a Variable Interest Entity (“VIE”), and (c) variable interests in a VIE held by related parties of the reporting enterprise require the reporting enterprise to consolidate the VIE. It also eliminates the VIE consolidation model based on majority exposure to variability that applied to certain investment companies and similar entities. In connection with the adoption of the guidance on January 1, 2016, the Company reevaluated all of its investment products for consolidation and determined that certain of its investments in private equity funds met the definition of a VIE as our equity interests lacked the characteristics of a controlling financial interest. The revised consolidation guidance did not result in consolidation of any of our investments. See Note 5, Investments, for additional details regarding our investments in variable interest entities.
In May 2014, the FASB issued guidance which requires companies to recognize revenue to depict the transfer of promised goods or services to customers in an amount that reflects the consideration it expects to be entitled in exchange for those goods or services. The new standard and subsequently issued amendments will become effective for us beginning with the first quarter 2018, and although permitted, we will not early adopt this guidance. We are in the process of selecting the method of adoption, either the full retrospective or modified retrospective transition approach, however we have not yet determined the method by which the standard will be adopted. In addition, we are currently evaluating the impacts of the application of the new standard to our existing portfolio of customer contracts and will continue to review new contracts entered into prior to the adoption of the new standard. While we expect the adoption of the standard will change the timing of when revenue is recognized for certain revenue streams, we anticipate that the majority of our contracts with customers will be accounted for under the series deliverable guidance in the new standard which will likely result in no change as compared to current revenue recognition. We expect to continue finalizing our assessment of the expected impact of adoption throughout 2017.
3. Significant Business Transactions and Events
Significant Business Acquisitions
Acquisition of Kaufman Rossin Fund Services LLC
On February 24, 2016, we acquired all of the membership interests of KRFS, for $94.7 million in cash, after giving effect to a $0.3 million adjustment agreed upon in June 2016 to settle working capital under the terms of the agreement. DST financed the acquisition through cash-on-hand and available lines of credit. KRFS is an independent, full-service provider of specialized hedge fund administration services to the global financial community. KRFS’ hedge fund services include accounting and valuation, back-office outsourcing, investor services, treasury services, and customized reporting. We expect the acquisition to provide us with additional opportunities within the alternative investment marketplace and expand our asset administration service offerings.
The factors described above, combined with the synergies expected from combining our operations with the acquired entity and the resulting expansion of the service offerings available to our clients, are the basis for the acquisition price paid resulting in $61.0 million of goodwill recorded, all of which is expected to be deductible for tax purposes. KRFS is included within the Financial Services segment. The transaction was accounted for using the acquisition method of accounting, and as such, assets acquired, liabilities assumed, and consideration transferred were recorded at their estimated fair values on the acquisition date.
54
The following table summarizes the aggregate acquisition-date fair value of the consideration transferred for the acquisition of KRFS and the amounts recognized as of the acquisition date for the assets acquired and liabilities assumed (in millions):
Consideration | |||
Cash paid | $ | 94.7 | |
Recognized amounts of identifiable assets acquired and liabilities assumed | |||
Cash and cash equivalents | $ | 1.0 | |
Accounts receivable | 2.9 | ||
Other current assets | 0.1 | ||
Investments | 0.5 | ||
Properties (1) | 6.8 | ||
Intangible assets | 23.4 | ||
Goodwill | 61.0 | ||
Total assets | 95.7 | ||
Deferred revenue | 0.6 | ||
Other current liabilities | 0.4 | ||
Total liabilities | 1.0 | ||
Net assets acquired | $ | 94.7 | |
______________________________________________
(1) Includes $6.5 million of acquired software with a weighted-average useful life of 6 years.
The following table summarizes the intangible assets acquired and estimated weighted-average useful lives as of the acquisition date (in millions):
Fair Value | Weighted-Average Useful Life | ||||
Customer relationships | $ | 22.5 | 10 years | ||
Other | 0.9 | 3 years | |||
$ | 23.4 | ||||
The operating results of KRFS were combined with our operating results subsequent to the acquisition date. Approximately $20.9 million of revenues and $1.1 million of pretax income of the acquired business are included in the Consolidated Statement of Income for the year ended December 31, 2016. Pro-forma results of operations, assuming this acquisition was made at the beginning of the earliest period presented, have not been presented as the effect of this acquisition is not material to our results.
The following acquisitions during 2015 are included within the Financial Services segment:
Acquisition of kasina LLC
On January 1, 2015, we acquired all of the membership interests of kasina LLC, a strategic advisory firm to the asset management industry for $9.0 million of upfront cash consideration and up to $2.1 million of performance-related contingent consideration, based on the terms of the agreement, which were amended during 2016. The contingent consideration requires, subject to certain exceptions, future employment over the course of the performance period. The acquisition provides us with additional opportunities to provide a combination of advisory, research, technology and analytics to asset managers.
55
Acquisition of Red Rocks Capital LLC
On July 31, 2015, we acquired all of the membership interests of asset manager Red Rocks Capital LLC, which focuses on listed private equity and other private asset investments, for $45.0 million of upfront cash consideration and up to $20.0 million of performance-related contingent consideration. The performance-related contingent consideration is based on the achievement of certain annual revenue targets of the acquired business over an approximate four year period from the closing date and requires, subject to certain exceptions, future employment over the course of the performance period. We expect the acquisition to provide us with additional opportunities within the alternative investment marketplace to enhance our ongoing asset management strategy.
Acquisition of Wealth Management Systems Inc.
On August 21, 2015, we acquired all of the outstanding common stock of Wealth Management Systems Inc., a provider of technology-based rollover services, for cash consideration of $65.1 million, which includes a $1.1 million adjustment agreed upon in December 2015 to settle working capital under the provisions of the purchase agreement. A post-closing settlement amount of $0.2 million was received in January 2016, and is included in Other Assets on the Consolidated Balance Sheet at December 31, 2015. Wealth Management Systems Inc. automates the migration of assets from retirement plans to investment management platforms. We expect the acquisition to provide us with additional opportunities to expand rollover service options to new and existing customers and enhance our ongoing retirement and asset management strategies.
The factors described above, combined with the synergies expected from combining our operations with each of the acquired entities and the resulting expansion of the service offerings available to our clients, are the basis for the acquisition prices paid resulting in $75.8 million of goodwill recorded, of which approximately $40.0 million is expected to be deductible for tax purposes. The transactions were accounted for using the acquisition method of accounting, with assets acquired, liabilities assumed, and consideration transferred recorded at their estimated fair values on the acquisition dates.
The following table summarizes the aggregate acquisition-date fair value of the consideration transferred for the acquisitions of kasina LLC, Red Rocks Capital LLC, and Wealth Management Systems Inc. and the amounts recognized as of the acquisition date for the assets acquired and liabilities assumed (in millions):
Consideration | |||
Cash paid | $ | 118.8 | |
Fair value of contingent consideration | 0.8 | ||
Fair value of total consideration transferred | $ | 119.6 | |
Recognized amounts of identifiable assets acquired and liabilities assumed | |||
Cash and cash equivalents | $ | 1.6 | |
Accounts receivable | 4.2 | ||
Other current assets | 0.2 | ||
Properties (1) | 3.3 | ||
Intangible assets | 49.5 | ||
Goodwill | 75.8 | ||
Total assets | 134.6 | ||
Accounts payable | 0.2 | ||
Accrued compensation and benefits | 0.4 | ||
Deferred revenue | 5.5 | ||
Other current liabilities | 0.7 | ||
Deferred income tax liabilities | 8.2 | ||
Total liabilities | 15.0 | ||
Net assets acquired | $ | 119.6 | |
____________________________________________________
(1) Includes $3.0 million of acquired software
56
The following table summarizes the intangible assets acquired and estimated weighted average useful lives as of acquisition dates (in millions):
Fair Value | Weighted Average Useful Life | ||||
Customer relationships | $ | 48.0 | 17 years | ||
Other | 1.5 | 7 years | |||
$ | 49.5 | ||||
The operating results of kasina LLC, Red Rocks Capital LLC, and Wealth Management Systems Inc. were combined with our operating results subsequent to the acquisition dates. Approximately $10.4 million of revenues and $9.3 million of pretax losses of the acquired businesses are included in the Consolidated Statement of Income for the year ended December 31, 2015. Pro-forma results of operations, assuming these acquisitions were made at the beginning of the earliest period presented, have not been presented as the effect of these acquisitions are not material to our results.
Sale of Business
On November 30, 2014, we sold Global Solutions for cash consideration of $95.0 million, subject to customary working capital post-closing adjustments. Of the $95.0 million in proceeds received, $9.5 million was restricted for a period of eighteen months from the transaction, for purposes of payment of potential obligations that may arise based upon the terms and conditions of the sale agreement. The $9.5 million of restricted proceeds held in escrow was received by us during 2016. In addition, during 2015, we received cash proceeds of $7.9 million in settlement of the working capital post-closing adjustments.
Operating revenue generated from the Global Solutions businesses sold was approximately $61.4 million for the year ended December 31, 2014. Operating income generated from the Global Solutions businesses sold was approximately $6.9 million for the year ended December 31, 2014. We recorded a pretax gain of $100.5 million on the sale of the business during 2014. Our pretax gain exceeded our sale proceeds primarily from the reclassification of cumulative translation adjustments due to the substantial liquidation of certain foreign entities, partially offset by transaction costs. The carrying value of the entities sold was minimal.
Restructuring Initiatives
As a result of changes in our business environment, from time to time we will restructure one or more of our businesses to enhance operational efficiency.
During the year ended December 31, 2016, we incurred pretax restructuring charges related to employee termination costs of $9.9 million and lease termination costs of $0.5 million within the Financial Services segment.
During the year ended December 31, 2015, we incurred $3.4 million of pretax charges related to employee termination costs as a result of a restructuring initiative within the Healthcare Services segment which includes the closure of an operating location at the end of the existing lease term in mid-2016.
During the year ended December 31, 2014, the Financial Services segment incurred $8.5 million of pretax charges related to employee and lease termination costs for restructuring initiatives. The costs were comprised of employee termination costs of $8.3 million and lease termination costs of $0.2 million. These expenses have been included in Costs and expenses in the Consolidated Statement of Income.
As of December 31, 2016, 2015 and 2014, we had a remaining liability of $0.6 million, $4.1 million and $6.4 million, respectively, associated with these restructuring activities.
4. Discontinued Operations
On July 1, 2016, pursuant to the Purchase Agreement dated June 14, 2016, we completed the sale of our North American Customer Communications business for cash consideration of $410.7 million, after giving effect to a $0.7 million adjustment agreed upon in December 2016 to settle working capital and other matters under the terms of the agreement. We recorded an estimated pretax gain of $341.5 million on the sale during 2016, which has been presented as a component of discontinued operations. Included within the pretax gain was the unamortized deferred gain of approximately $39.9 million related to the sale and leaseback of our four North American Customer Communications’ production facilities for pretax proceeds totaling
57
approximately $129.0 million in October 2015. Amortization expense, which was being recognized on a straight-line basis over the lease term, was approximately $1.5 million and $0.6 million for the years ended December 31, 2016 and 2015, respectively, and has been presented as a component of discontinued operations.
Pursuant to the terms of the transaction, we will continue to provide certain information technology and operations processing activities to the North American Customer Communications business for an estimated period of 12 to 18 months following the transaction. Additionally, we will continue to incur costs for certain print related services provided by the disposed business for an estimated period of 3 to 5 years following the transaction. The information technology and operations processing activities we performed after the sale of the business resulted in approximately $8.8 million of continuing cash inflows from the business sold and the costs incurred for certain print related services provided by the business sold resulted in continuing cash outflows of approximately $19.9 million for the period from July 1, 2016 through December 31, 2016. The revenues previously eliminated in consolidation that have continued post-transaction were approximately $19.3 million, $13.8 million and $15.9 million for the years ended December 31, 2016, 2015 and 2014, respectively. The expenses previously eliminated in consolidation that have continued post-transaction were approximately $34.8 million, $19.3 million and $36.8 million for the years ended December 31, 2016, 2015 and 2014, respectively. These revenues and expenses associated with these continued activities have been classified within continuing operations for all periods presented. The offsetting expenses and revenues previously recorded within Customer Communications and eliminated in consolidation have been reclassified to discontinued operations for all periods presented.
Additionally, during the second quarter 2016, our Board of Directors approved a plan for management to pursue the divestiture of our United Kingdom Customer Communications business, which we anticipate will be completed within the required one year period. As a result of this significant shift in the strategic direction of our operations, we have classified the results of the businesses sold or being sold as discontinued operations in our Consolidated Statement of Income and Statement of Cash Flows for all periods presented. Additionally, the related assets and liabilities associated with the discontinued operations are classified as held for sale in our Consolidated Balance Sheet.
The following table summarizes the assets and liabilities classified as held for sale in our Consolidated Balance Sheet (in millions):
December 31, | |||||||
2016 | 2015 | ||||||
Assets | |||||||
Cash and cash equivalents | $ | 4.0 | $ | 10.1 | |||
Accounts receivable | 38.9 | 140.1 | |||||
Investments | — | 0.3 | |||||
Unconsolidated affiliates | 0.2 | 0.3 | |||||
Properties, net | 9.9 | 64.6 | |||||
Intangible assets, net | 11.2 | 20.6 | |||||
Goodwill | — | 24.8 | |||||
Other assets | 8.4 | 36.7 | |||||
Total assets held for sale | $ | 72.6 | $ | 297.5 | |||
Liabilities | |||||||
Current portion of debt | $ | 0.4 | $ | — | |||
Accounts payable | 13.2 | 33.7 | |||||
Accrued compensation and benefits | 3.8 | 26.7 | |||||
Deferred revenues and gains | 0.8 | 5.5 | |||||
Long-term debt | 1.7 | — | |||||
Income taxes payable | 1.0 | — | |||||
Other liabilities | 9.2 | 94.0 | |||||
Total liabilities held for sale | $ | 30.1 | $ | 159.9 | |||
58
The following table summarizes the comparative financial results of discontinued operations which are presented as Income from discontinued operations, net of tax on our Consolidated Statement of Income (in millions):
Year Ended December 31, | |||||||||||
2016 | 2015 | 2014 | |||||||||
Operating revenues | $ | 389.0 | $ | 608.0 | $ | 596.5 | |||||
Out-of-pocket reimbursements | 409.0 | 743.1 | 648.0 | ||||||||
Total revenues | 798.0 | 1,351.1 | 1,244.5 | ||||||||
Costs and expenses | 747.6 | 1,247.3 | 1,160.3 | ||||||||
Depreciation and amortization (including goodwill impairment) | 28.9 | 30.9 | 38.0 | ||||||||
Operating income | 21.5 | 72.9 | 46.2 | ||||||||
Interest expense | — | (0.3 | ) | (0.3 | ) | ||||||
Other income, net | — | — | 0.4 | ||||||||
Equity in earnings of unconsolidated affiliates | 0.3 | 0.4 | 0.7 | ||||||||
Net gain on business disposition | 341.5 | — | — | ||||||||
Income before income taxes | 363.3 | 73.0 | 47.0 | ||||||||
Income taxes | 115.0 | 24.5 | 14.5 | ||||||||
Income from discontinued operations, net of tax | $ | 248.3 | $ | 48.5 | $ | 32.5 | |||||
In April 2016, we completed the sale of our U.K. Customer Communications’ Bristol production facilities for pretax proceeds totaling approximately $16.0 million. Concurrent with this sale, we leased back approximately two-thirds of the facilities under a 12-year lease. The rent payments and associated rent expense of the Bristol production facilities are approximately $0.7 million per year over the 12-year lease term.
In February 2017, we updated our impairment analysis utilizing new information received (level 3 in the fair value hierarchy) regarding our U.K. Customer Communications business which indicated the carrying value exceeded the fair value of the business. As a result, we recorded an impairment charge of $17.0 million, which is included as a component of discontinued operations for the year ended December 31, 2016. The impairment resulted in the write-down of goodwill and long-lived assets of the business based on the estimated fair value. There was no tax benefit recognized for this impairment charge as it is not expected to be deductible for tax purposes. These amounts reflect management’s preliminary estimates and subsequent negotiations and the closing on any sale of this business could result in further adjustments to this impairment.
59
5. Investments
Investments are as follows (in millions):
Carrying Value | |||||||
December 31, 2016 | December 31, 2015 | ||||||
Available-for-sale securities: | |||||||
State Street Corporation | $ | 169.6 | $ | 144.8 | |||
Other available-for-sale securities | 10.9 | 74.7 | |||||
180.5 | 219.5 | ||||||
Other: | |||||||
Trading securities | 7.9 | 14.8 | |||||
Seed capital investments, at fair value | 61.0 | 50.7 | |||||
Cost method, private equity and other investments | 128.0 | 133.2 | |||||
196.9 | 198.7 | ||||||
Total investments | $ | 377.4 | $ | 418.2 | |||
Certain information related to our available-for-sale securities is as follows (in millions):
December 31, | |||||||
2016 | 2015 | ||||||
Book cost basis | $ | 28.4 | $ | 83.4 | |||
Gross unrealized gains | 152.1 | 136.2 | |||||
Gross unrealized losses | — | (0.1 | ) | ||||
Market value | $ | 180.5 | $ | 219.5 | |||
At December 31, 2016 and 2015, our carrying value of available-for-sale investments was $180.5 million and $219.5 million, respectively, the majority of which was from the ownership of 2.2 million shares of State Street as of December 31, 2016. State Street is a financial services corporation that provides investment servicing and investment management services and products to institutional investors. The aggregate market value of our investments in available-for-sale securities, including State Street’s common stock, presented above was based on the closing price on the New York Stock Exchange at the respective year end. Deferred tax liabilities associated with the available-for-sale investments were approximately $62.2 million and $54.8 million at December 31, 2016 and 2015, respectively.
During the years ended December 31, 2016, 2015 and 2014, we received $61.2 million, $303.5 million and $278.9 million, respectively, from the sale of investments in available-for-sale securities. Gross realized gains of $6.1 million, $175.1 million and $184.0 million and gross realized losses of $3.8 million, $6.7 million and $2.6 million, were recorded in 2016, 2015 and 2014, respectively, from the sale of available-for-sale securities. In addition, we recorded losses on available-for-sale securities of $0.2 million, $4.8 million and $2.3 million related to other-than-temporary investment impairments for the years ended December 31, 2016, 2015 and 2014, respectively. These gains and losses are included as a component of Other income, net in the Consolidated Statement of Income. The fair value and gross unrealized losses of securities in a continuous loss position at December 31, 2016 and 2015 were not significant.
We consolidate the investments of open-end funds in which we own a controlling interest as a result of our seed capital investments. Seed capital investments of $61.0 million and $50.7 million at December 31, 2016 and 2015, respectively, are comprised primarily of equity securities as well as $8.4 million and $10.8 million of cash collateral deposited with a broker for securities sold short at December 31, 2016 and 2015, respectively.
We are a limited partner in various private equity funds which are primarily accounted for using the cost method. Our involvement in the financing operations of the private equity fund investments is generally limited to our investments in the entities. At December 31, 2016 and 2015, our carrying value of these private equity fund investments was approximately $111.2 million and $117.2 million, respectively. At December 31, 2016, we had future capital commitments related to these private equity fund investments of approximately $3.8 million. Additionally, we have other investments with a carrying value of $16.8 million and $16.0 million at December 31, 2016 and 2015, respectively.
60
In 2014, we received cash dividends of $33.2 million from a cost method investment in a privately-held company. Following receipt of the dividend, we sold our remaining interest in the privately-held company, resulting in pre-tax cash proceeds and a related gain of $103.6 million.
We record lower of cost or market valuation adjustments on private equity fund investments and other cost method investments when impairment conditions are present. During the year ended December 31, 2016, we recorded no impairments on cost method investments. During the years ended December 31, 2015 and 2014, we recorded $0.2 million and $2.2 million, respectively, of impairments on cost method investments related to adverse market conditions or poor performance of the underlying investment.
As a result of the revised consolidation guidance, we determined that our investments in private equity funds meet the definition of a VIE; however, the private equity fund investments were not consolidated as we do not have the power to direct the entities’ most significant economic activities. The maximum risk of loss related to our private equity fund investments is limited to the carrying value of our investments in the entities plus any future capital commitments. At December 31, 2016 and 2015, our maximum risk of loss associated with these VIE’s, which is comprised of our investment and required future capital commitments, was $115.0 million and $120.9 million, respectively.
6. Unconsolidated Affiliates
Unconsolidated affiliates are as follows (in millions):
Carrying Value | |||||||||
2016 Ownership Percentage | December 31, 2016 | December 31, 2015 | |||||||
Unconsolidated affiliates: | |||||||||
International Financial Data Services U.K. | 50% | $ | 133.3 | $ | 124.3 | ||||
International Financial Data Services L.P. | 50% | 73.2 | 75.2 | ||||||
Boston Financial Data Services, Inc. | 50% | 91.2 | 82.9 | ||||||
Other unconsolidated affiliates | 33.5 | 29.8 | |||||||
Total | $ | 331.2 | $ | 312.2 | |||||
IFDS U.K., IFDS L.P. and BFDS are joint ventures of the Company and State Street. IFDS U.K. provides processing for U.K. unit trusts and related products on a BPO, Remote and shared services basis. IFDS L.P., through its wholly-owned subsidiaries, provides shareowner accounting and recordkeeping to international markets, primarily Canada, Ireland and Luxembourg. In terms of operating revenues, IFDS U.K. was the third largest customer of the Financial Services Segment during the year ended December 31, 2016. BFDS combines the use of the Company’s shareholder recordkeeping services with the marketing and custodial capabilities of State Street to provide BPO and shared-service shareowner accounting and recordkeeping services to mutual fund companies. BFDS also offers settlement administration services, teleservicing and full-service support for defined contribution plans using DST’s proprietary software. In terms of operating revenues, BFDS was the second largest customer of the Financial Services segment during 2016, 2015 and 2014.
Our investments in other unconsolidated affiliates are primarily comprised of various joint ventures which own and lease real estate to our operating businesses as well as other third parties. One of these investments is a 50% ownership of Pershing Road Development Company, LLC, a limited special purpose real estate joint venture which leases approximately 1.1 million square feet of office space to the U.S. government. This investment has a zero carrying value at December 31, 2016 and 2015 as a result of losses incurred on an interest rate swap which is held by the joint venture.
61
Equity in earnings of unconsolidated affiliates, is as follows (in millions):
Year Ended December 31, | |||||||||||
2016 | 2015 | 2014 | |||||||||
International Financial Data Services U.K. | $ | 10.0 | $ | 22.5 | $ | 12.6 | |||||
International Financial Data Services L.P. | 2.2 | 7.4 | 6.5 | ||||||||
Boston Financial Data Services, Inc. | 8.3 | 5.3 | 5.1 | ||||||||
Other unconsolidated affiliates | 6.7 | 10.2 | 10.5 | ||||||||
Total | $ | 27.2 | $ | 45.4 | $ | 34.7 | |||||
Certain condensed financial information of our unconsolidated affiliates is presented below (in millions):
Year Ended December 31, | |||||||||||
Income Statement Data: | 2016 | 2015 | 2014 | ||||||||
Revenues | $ | 1,248.6 | $ | 1,225.7 | $ | 1,247.3 | |||||
Costs and expenses | 1,192.4 | 1,132.7 | 1,188.2 | ||||||||
Net income | 56.2 | 93.0 | 59.1 | ||||||||
December 31, | |||||||
Balance Sheet Data: | 2016 | 2015 | |||||
Current assets | $ | 570.2 | $ | 515.2 | |||
Noncurrent assets | 823.8 | 823.5 | |||||
Current liabilities | 423.0 | 313.0 | |||||
Noncurrent liabilities | 396.6 | 444.0 | |||||
Partners’ and stockholders’ equity | 574.4 | 581.7 | |||||
The following tables summarize related party transactions and balances outstanding with our unconsolidated affiliates (in millions):
Year Ended December 31, | |||||||||||
2016 | 2015 | 2014 | |||||||||
Operating revenues from unconsolidated affiliates | $ | 138.5 | $ | 134.9 | $ | 135.1 | |||||
Amounts paid to unconsolidated affiliates for products, services and leases* | 36.8 | 27.3 | 23.8 | ||||||||
Distributions received from unconsolidated affiliates | 3.5 | 15.3 | 12.6 | ||||||||
December 31, | |||||||
2016 | 2015 | ||||||
Advances/Loans to unconsolidated affiliates | $ | 31.4 | $ | 6.4 | |||
Trade accounts receivable from unconsolidated affiliates | 19.7 | 20.8 | |||||
Total amounts receivable from unconsolidated affiliates | $ | 51.1 | $ | 27.2 | |||
Amounts payable to unconsolidated affiliates* | $ | 3.4 | $ | 5.0 | |||
_______________________________________________________________________
* | Excludes amounts owed under or paid on the BFDS installment loan. See additional discussion of installment loan within Note 10, Debt. |
62
On March 29, 2016, we and State Street each provided a subordinate loan of approximately $15.0 million to IFDS U.K. in which the principal plus accrued and unpaid interest is payable in full at maturity in March 2021. Additionally, we and State Street each provided an additional subordinate loan of approximately $13.0 million to IFDS U.K. on September 30, 2016. The principal plus accrued and unpaid interest is payable in full at maturity in September 2021. Subsequently, on February 27, 2017, DST provided an additional subordinate loan of approximately $12.5 million to IFDS U.K. in which the principal plus accrued and unpaid interest is payable in full at maturity in February 2022.
7. Fair Value Measurements
Authoritative accounting guidance on fair value measurements establishes a three-tier fair value hierarchy, which prioritizes the inputs used in measuring fair value. These tiers include: Level 1, defined as observable inputs such as quoted prices in active markets; Level 2, defined as inputs other than quoted prices in active markets that are either directly or indirectly observable; and Level 3, defined as unobservable inputs for which little or no market data exists, therefore requiring an entity to develop its own assumptions.
As of December 31, 2016 and 2015, we held certain investment assets and liabilities that are required to be measured at fair value on a recurring basis. These investment assets include money market funds, available-for-sale equity securities and trading securities whereby fair value is determined using quoted prices in active markets. Accordingly, the fair value measurements of these investments have been classified as Level 1 in the table below. Fair value for deferred compensation liabilities that are credited with deemed gains or losses of the underlying hypothetical investments, primarily equity securities, has been classified as Level 1 in the tables below. In addition, we have interest rate and foreign currency derivative instruments that are required to be reported at fair value. Fair value for the derivative instruments was determined using inputs from quoted prices for similar assets and liabilities in active markets that are directly or indirectly observable. Accordingly, our derivative instruments have been classified as Level 2 in the tables below.
The following tables present assets and liabilities measured at fair value on a recurring basis (in millions):
Fair Value Measurements at Reporting Date Using | |||||||||||||||
December 31, 2016 | Quoted prices in Active Markets for Identical Assets (Level 1) | Significant Other Observable Inputs (Level 2) | Significant Unobservable Inputs (Level 3) | ||||||||||||
Money market funds (1) | $ | 437.0 | $ | 437.0 | $ | — | $ | — | |||||||
Equity securities (2) | 188.4 | 188.4 | — | — | |||||||||||
Seed capital investments (2) | 61.0 | 61.0 | — | — | |||||||||||
Deferred compensation liabilities (3) | (7.9 | ) | (7.9 | ) | — | — | |||||||||
Securities sold short (3) | (8.2 | ) | (8.2 | ) | — | — | |||||||||
Derivative instruments (3) | (0.4 | ) | — | (0.4 | ) | — | |||||||||
Total | $ | 669.9 | $ | 670.3 | $ | (0.4 | ) | $ | — | ||||||
63
Fair Value Measurements at Reporting Date Using | |||||||||||||||
December 31, 2015 | Quoted prices in Active Markets for Identical Assets (Level 1) | Significant Other Observable Inputs (Level 2) | Significant Unobservable Inputs (Level 3) | ||||||||||||
Money market funds (1) | $ | 210.1 | $ | 210.1 | $ | — | $ | — | |||||||
Equity securities (2) | 234.3 | 234.3 | — | — | |||||||||||
Seed capital investments (2) | 50.7 | 50.7 | — | — | |||||||||||
Deferred compensation liabilities (3) | (14.8 | ) | (14.8 | ) | — | — | |||||||||
Securities sold short (3) | (10.7 | ) | (10.7 | ) | — | — | |||||||||
Derivative instruments (3) | (0.3 | ) | — | (0.3 | ) | — | |||||||||
Total | $ | 469.3 | $ | 469.6 | $ | (0.3 | ) | $ | — | ||||||
_______________________________________________________________________
(1) Included in Cash and cash equivalents, Funds held on behalf of clients, and Other current assets on our Consolidated Balance Sheet.
(2) Included in Investments on our Consolidated Balance Sheet.
(3) Included in Other liabilities on our Consolidated Balance Sheet.
At December 31, 2016 and 2015, we held approximately $11.5 million and $6.1 million, respectively, of investments in pooled funds, which are measured using net asset value as a practical expedient for fair value and therefore excluded from the table above. The investments in pooled funds are included within the $128.0 million and $133.2 million of cost method, private equity and other investments at December 31, 2016 and 2015, respectively, disclosed within Note 5, Investments.
8. Property and Equipment
Property and equipment and related accumulated depreciation are as follows (in millions):
December 31, | |||||||
2016 | 2015 | ||||||
Land | $ | 34.2 | $ | 35.9 | |||
Buildings | 160.3 | 181.5 | |||||
Technology equipment | 213.0 | 200.5 | |||||
Software | 508.2 | 489.4 | |||||
Furniture, fixtures and other equipment | 122.1 | 138.0 | |||||
Leasehold improvements | 76.4 | 72.2 | |||||
Construction-in-progress | 18.3 | 13.6 | |||||
1,132.5 | 1,131.1 | ||||||
Less accumulated depreciation and amortization | 896.8 | 874.4 | |||||
Properties, net | $ | 235.7 | $ | 256.7 | |||
In December 2014, we entered into a transaction under which Industrial Revenue Bonds (“IRBs”) are issued by a municipality to finance the purchase and/or construction of certain real and personal property. Pursuant to the terms of the IRBs, we transferred title of certain fixed assets to the municipality. Tax benefits associated with the IRBs include a provision for a 10-year property tax abatement and sales tax exemption on the property financed with the proceeds of the IRBs. The municipality holds legal title to the bond financed assets and leases them to us subject to an option to purchase for nominal consideration, which we may exercise at any time. We are the bondholder as well as the lessee of the property purchased with the IRBs proceeds. We record the property on our Consolidated Balance Sheet as all risks and benefits remain with us, along with a capital lease obligation to repay the proceeds of the IRBs. Moreover, as holder of the bonds, we have the right to offset the amounts due under the leases with the amounts due to us from the bonds. Accordingly, no net debt associated with the IRBs is reflected in our Consolidated Balance Sheet. Upon maturity or redemption of the bonds, which is within our sole control, title to the leased property reverts back to us. At December 31, 2016 and 2015, we held IRBs with an aggregate principal amount of $87.6 million and $73.2 million, respectively.
64
At December 31, 2016 and 2015, there was approximately $2.5 million and $11.8 million, respectively, of assets under capital lease, net of accumulated depreciation of $2.2 million and $10.7 million, respectively, included in the above table. Depreciation expense for the years ended December 31, 2016, 2015 and 2014, was $78.2 million, $77.6 million and $80.7 million, respectively.
Included in software is $57.7 million of proprietary software acquired in business combinations. At both December 31, 2016 and 2015, the net book value of this acquired software was $14.5 million.
The following table summarizes software development costs for our proprietary systems and software products (in millions):
Year Ended December 31, | |||||||||||
2016 | 2015 | 2014 | |||||||||
Capitalized software development costs | $ | 21.5 | $ | 23.3 | $ | 28.8 | |||||
Amortization of capitalized software development costs | 22.9 | 25.5 | 25.3 | ||||||||
Non-capitalizable software development costs are included in costs and expenses and the amortization of capitalized software development costs are included in depreciation and amortization expense in the Consolidated Statement of Income.
9. Intangible Assets and Goodwill
Intangible Assets
The following table summarizes intangible assets (in millions):
December 31, 2016 | December 31, 2015 | ||||||||||||||
Carrying Amount | Accumulated Amortization | Carrying Amount | Accumulated Amortization | ||||||||||||
Amortizable intangible assets | |||||||||||||||
Customer relationships | $ | 203.6 | $ | 71.0 | $ | 181.1 | $ | 57.5 | |||||||
Other | 28.5 | 18.5 | 27.6 | 15.4 | |||||||||||
Total | $ | 232.1 | $ | 89.5 | $ | 208.7 | $ | 72.9 | |||||||
Amortization expense of intangible assets for the years ended December 31, 2016, 2015 and 2014 was $16.6 million, $12.5 million and $11.2 million, respectively. Annual amortization for intangible assets recorded as of December 31, 2016 is estimated to be (in millions):
2017 | $ | 16.8 | |
2018 | 16.6 | ||
2019 | 15.5 | ||
2020 | 13.1 | ||
2021 | 12.7 | ||
Thereafter | 67.9 | ||
Total | $ | 142.6 | |
Goodwill
The following tables summarize the changes in the carrying amount of goodwill for the years ended December 31, 2016 and 2015, by segment (in millions):
December 31, 2015 | Acquisitions | Impairments | Other | December 31, 2016 | |||||||||||||||
Financial Services | $ | 303.3 | $ | 61.0 | $ | — | $ | (2.9 | ) | $ | 361.4 | ||||||||
Healthcare Services | 155.0 | — | — | — | 155.0 | ||||||||||||||
Total | $ | 458.3 | $ | 61.0 | $ | — | $ | (2.9 | ) | $ | 516.4 | ||||||||
65
December 31, 2014 | Acquisitions | Impairments | Other | December 31, 2015 | |||||||||||||||
Financial Services | $ | 234.6 | $ | 75.8 | $ | — | $ | (7.1 | ) | $ | 303.3 | ||||||||
Healthcare Services | 155.0 | — | — | — | 155.0 | ||||||||||||||
Total | $ | 389.6 | $ | 75.8 | $ | — | $ | (7.1 | ) | $ | 458.3 | ||||||||
We test goodwill for impairment on an annual basis as of October 1 and at other times if a significant change in circumstances indicates it is more likely than not that the fair value of these assets has been reduced. The valuation of goodwill requires assumptions and estimates of many critical factors, including revenue and market growth, operating cash flows, market multiples and discount rates. Our 2016 annual goodwill impairment test determined that the estimated fair value of each of our reporting units substantially exceeds the carrying value of the reporting units.
Due to the new segment reporting effective as of January 1, 2015, goodwill of approximately $6.7 million was reallocated to the Financial Services segment from the former Customer Communications segment based on the relative fair values of the businesses transfered. As mentioned in Note 1, Description of Business, we completed the sale of our North American Customer Communications business and announced our intent to dispose of our United Kingdom Customer Communications business during 2016. As a result, the Customer Communications segment has been reported as discontinued operations. Prior period amounts above have been revised to reflect the reallocated goodwill.
10. Debt
The Company is obligated under notes and other indebtedness as follows (in millions):
December 31, | |||||||
2016 | 2015 | ||||||
Accounts receivable securitization program | $ | 103.2 | $ | — | |||
Revolving credit facilities | 75.0 | 226.1 | |||||
Senior notes | 330.0 | 330.0 | |||||
Related party credit agreements | — | 1.5 | |||||
Other indebtedness, net of unamortized debt issuance costs | — | 4.5 | |||||
508.2 | 562.1 | ||||||
Less current portion of debt | 208.5 | 5.6 | |||||
Long-term debt | $ | 299.7 | $ | 556.5 | |||
Accounts receivable securitization program
We securitize certain of our domestic accounts receivable through an accounts receivable securitization program with a third-party bank. The maximum amount that can be outstanding under this program is $150.0 million. The facility matures in May 2018, unless renewed. As a result of the sale of the North American Customer Communications business, it was removed from the accounts receivable securitization program resulting in a reduction in the receivables eligible to be borrowed against in 2016.
Under the terms of the accounts receivable securitization program, (a) we periodically acquire accounts receivable originated by certain of our domestic subsidiaries, including, but not limited to, DST Health Solutions, DST Technologies and Argus Health Systems (the “Subsidiary Originators”), (b) we transfer receivables originated by us and receivables acquired from the Subsidiary Originators, on a periodic basis, to a wholly-owned bankruptcy remote special purpose subsidiary of DST (the “SPE”), and (c) the SPE then sells undivided interests in the receivables to the bank. We retain servicing responsibility over the receivables. The program contains customary restrictive covenants as well as customary events of default.
We have continuing involvement with the transferred assets because we maintain servicing responsibilities for the accounts receivable assets included in the accounts receivable securitization program. Accounts receivable assets transferred from us to our wholly-owned, bankruptcy remote special purpose subsidiary contain restrictions because they are not available to satisfy the creditors of any other person, including DST or any of our subsidiaries or affiliates. Further, neither we nor the SPE guarantees collectibility of the receivables or the creditworthiness of obligors. The SPE retains an interest in the receivables in excess of the amount transferred to the conduit, and such receivables continue to be recognized on the Consolidated Balance Sheet. The carrying value of the retained interest approximates its estimated fair value at the balance sheet date. We believe
66
increases in the level of assumed interest rates and/or credit losses compared to assumptions in effect at the balance sheet date by 10% or 20% would not materially affect the fair value of the retained interest at the reporting date.
The outstanding amount under the program was $103.2 million at December 31, 2016. There was no outstanding amount under the program at December 31, 2015. During the years ended December 31, 2016, 2015 and 2014 total proceeds from the accounts receivable securitization program were approximately $895.5 million, $1,037.7 million and $1,024.7 million, respectively, and total repayments were approximately $792.3 million, $1,157.7 million and $1,054.7 million, respectively, which comprise the net cash flow in the financing section of the Consolidated Statement of Cash Flows.
Aggregate transfers of undivided interests in the receivables from the SPE to the bank were $1,459.9 million and $1,807.2 million for the years ended December 31, 2016 and 2015, respectively. The impact on net income stemming from these transfers was not material. Costs associated with the accounts receivable securitization program are included in interest expense on the Consolidated Statement of Income. The program costs applicable to the outstanding amount of undivided interests in the receivables are generally based on LIBOR plus an applicable margin.
Revolving credit facilities
On October 1, 2014, we entered into a new syndicated credit facility (“Credit Facility”). The Credit Facility provides for a revolving unsecured line in an aggregate principal amount of up to $850.0 million. The interest rates applicable to loans under the Credit Facility are generally based on Eurodollar, Federal Funds or prime rates plus applicable margins as defined in the agreement. The Credit Facility contains grid schedules that adjust borrowing costs up or down based upon our consolidated leverage ratio. The grid schedules may result in fluctuations in borrowing costs ranging from 1.00% to 1.70% over Eurodollar and 0.00% to 0.70% over base rate, as defined. Additionally, we pay an annual facility fee of 0.125% to 0.30%. Among other provisions, the Credit Facility requires certain leverage and interest coverage ratios to be maintained. If any event of default occurs and is continuing, all amounts payable under the credit agreement may be declared immediately due and payable. The Credit Facility also contains customary restrictive covenants and cross-default provisions. The maturity date for the Credit Facility is October 1, 2019. Amounts borrowed on the Credit Facility were $75.0 million and $226.1 million at December 31, 2016 and 2015, respectively.
We have various unsecured revolving lines of credit to support our consolidated subsidiaries’ operations that provide total borrowings of up to $25.0 million. Borrowings on these lines of credit are available at variable rates of interest based on the LIBOR or the bank’s Prime rate and mature during 2017. At December 31, 2016 and 2015, there were no borrowings under any of these lines of credit.
During the years ended December 31, 2016, 2015 and 2014, total proceeds from our revolving credit facilities were approximately $977.1 million, $1,053.6 million and $929.8 million, respectively, and total repayments were approximately $1,128.2 million, $871.8 million and $895.9 million respectively, which comprise the net cash flows presented within the financing section of the Consolidated Statement of Cash Flows.
Senior notes
During 2010, we issued $370.0 million of aggregate principal of privately placed senior notes (collectively, the “Senior Notes”) pursuant to a note purchase agreement dated August 9, 2010 (the “Agreement”). The Senior Notes are comprised of $40.0 million of 4.19% Series A Senior Notes due August 9, 2015, $105.0 million of 4.86% Series B Senior Notes due August 9, 2017, $65.0 million of 5.06% Series C Senior Notes due August 9, 2018 and $160.0 million of 5.42% Series D Senior Notes due August 9, 2020. We repaid the Series A Senior Notes at maturity during 2015.
Interest on the Senior Notes is payable semi-annually in February and August of each year. We may prepay the Senior Notes at any time, in an amount not less than 10% of the aggregate principal amount of the Senior Notes then outstanding, at a price equal to 100% of the principal amount being prepaid, plus accrued and unpaid interest and a “make-whole” prepayment premium.
Pursuant to the Agreement, any Company subsidiary required to become a party to or otherwise guarantee the syndicated line of credit facility or other indebtedness in excess of $100.0 million, must also guarantee our obligations under the Senior Notes. The Agreement contains customary restrictive covenants, as well as certain customary events of default, including cross-default provisions. Among other provisions, the Agreement limits our ability to incur or create liens, sell assets, issue priority indebtedness and change lines of business. The Agreement also requires certain leverage and interest coverage ratios to be maintained.
67
Related party credit agreements
We acquired certain intangible assets in 2011 from BFDS in exchange for an installment loan that was payable over five years. The loan was repaid during 2016. The amount outstanding at December 31, 2015 was $1.5 million.
Other indebtedness
We had other indebtedness, which was primarily comprised of debt assumed in a 2006 business acquisition. The debt assumed was repaid during 2016. The amount outstanding at December 31, 2015 was $3.4 million and was payable in monthly installments with a fixed interest rate of 5.6%.
Future principal payments of indebtedness at December 31, 2016 are as follows (in millions):
2017 | $ | 208.5 | |
2018 | 65.0 | ||
2019 | 75.0 | ||
2020 | 160.0 | ||
Total | $ | 508.5 | |
The weighted average interest rates on our short-term borrowings were 2.36% and 1.67% for the years ended December 31, 2016 and 2015, respectively. Based upon the borrowing rates currently available to us for indebtedness with similar terms and average maturities, the carrying value of long-term debt, with the exception of the Senior Notes, is considered to approximate fair value at December 31, 2016 and 2015. The estimated fair value of the Senior Notes was derived principally from quoted prices (level 2 in the fair value hierarchy).
The carrying and fair value of the Senior Notes were as follows (in millions):
December 31, | |||||||||||||||
2016 | 2015 | ||||||||||||||
Carrying Value | Estimated Fair Value | Carrying Value | Estimated Fair Value | ||||||||||||
Senior notes—Series B | 105.0 | 106.7 | 105.0 | 108.5 | |||||||||||
Senior notes—Series C | 65.0 | 67.5 | 65.0 | 68.2 | |||||||||||
Senior notes—Series D | 160.0 | 172.1 | 160.0 | 172.8 | |||||||||||
Total | $ | 330.0 | $ | 346.3 | $ | 330.0 | $ | 349.5 | |||||||
11. Hedging Transactions and Derivative Financial Instruments
We are directly and indirectly affected by changes in certain market conditions. When determined appropriate, we use derivative instruments as a risk management tool to mitigate the potential impact of certain market risks. The primary market risks managed by us through the use of derivative instruments are foreign currency exchange rate risk and interest rate risk. We may use various types of derivative instruments including, but not limited to, forward contracts, option contracts and swaps. We do not enter into derivative arrangements for speculative purposes.
We determine the fair values of our derivatives based on quoted market prices that are directly or indirectly observable as further described within Note 7, Fair Value Measurements. The fair value of our derivative instruments is reflected on a gross, rather than net, basis and is not significant to the consolidated financial statements as of December 31, 2016 or 2015.
Cash flow hedging strategy
We use cash flow hedges to minimize the variability in cash flows of assets or liabilities or forecasted transactions caused by fluctuations in foreign currency exchange rates or interest rates. The changes in the fair values of derivatives designated as cash flow hedges are recorded in Accumulated Other Comprehensive Income (“AOCI”) and are reclassified into the line item in the Consolidated Statement of Income in which the hedged items are recorded in the same period the hedged items affect earnings. The changes in fair values of hedges that are determined to be ineffective are immediately reclassified from AOCI into earnings. The length of time for which we hedge our exposure to future cash flows is typically one to two years.
68
We have entered into a foreign currency cash flow hedging program to reduce the risk that our net cash outflows from intercompany purchases of services from our international subsidiaries could be adversely affected by fluctuations in foreign currency exchange rates. We entered into forward foreign currency contracts (Thai baht) to hedge certain portions of forecasted cash flows denominated in foreign currencies. The total notional values of derivatives that were designated and qualified for our foreign currency cash flow hedging program were $14.3 million and $13.5 million as of December 31, 2016 and 2015, respectively.
We monitor the mix of short-term debt and long-term debt regularly. From time to time, we manage our risk to interest rate fluctuations through the use of derivative financial instruments. We have not entered into interest rate swap agreements during the years ended December 31, 2016 and 2015.
The pretax impact that changes in the fair values of derivatives designated as cash flow hedges had on AOCI and earnings was not significant during the years ended December 31, 2016, 2015, and 2014. There were no gains or losses recognized into income as a result of hedge ineffectiveness during the years ended December 31, 2016, 2015 or 2014. As of December 31, 2016, we estimate that amounts to be reclassified into earnings during the next 12 months are $0.1 million.
Economic (nondesignated) hedging strategy
In addition to derivative instruments that are designated and qualify for hedge accounting, we also use certain derivatives as economic hedges of foreign currency exposure. Although these derivatives were not designated for hedge accounting, they are effective economic hedges. The changes in fair values of economic hedges are immediately recognized into earnings.
We use foreign currency economic hedges to offset the earnings impact that fluctuations in foreign currency exchange rates have on certain intercompany loans denominated in nonfunctional currencies, primarily the British pound and Australian dollar. The foreign currency economic hedging program consists of rolling, monthly forward foreign currency contracts which settle on the last day of each month. As a result, there are minimal unrealized gains or losses at the end of the period related to these contracts. The total notional values of derivatives related to our foreign currency economic hedges were $91.6 million and $125.4 million as of December 31, 2016 and 2015, respectively.
12. Income Taxes
Deferred tax assets and liabilities are determined based on the differences between the financial statement and tax bases of assets and liabilities as measured by the enacted tax rates that are expected to be in effect when these differences reverse. Deferred tax expense (benefit) is generally the result of changes in the assets or liabilities for deferred taxes.
The following summarizes pretax income from continuing operations (in millions):
Year Ended December 31, | |||||||||||
2016 | 2015 | 2014 | |||||||||
U.S. | $ | 248.2 | $ | 451.9 | $ | 627.9 | |||||
International | 31.0 | 6.9 | 116.8 | ||||||||
Total | $ | 279.2 | $ | 458.8 | $ | 744.7 | |||||
69
Provision for income taxes (benefits) from continuing operations consists of the following components (in millions):
Year Ended December 31, | |||||||||||
2016 | 2015 | 2014 | |||||||||
Current | |||||||||||
Federal | $ | 57.7 | $ | 147.4 | $ | 207.8 | |||||
State and local | 11.4 | 10.2 | (23.8 | ) | |||||||
International | 15.0 | 7.1 | (1.5 | ) | |||||||
Total current | 84.1 | 164.7 | 182.5 | ||||||||
Deferred | |||||||||||
Federal | 19.9 | (13.5 | ) | 5.3 | |||||||
State and local | (1.9 | ) | 0.5 | (1.3 | ) | ||||||
International | (1.0 | ) | (2.5 | ) | (2.6 | ) | |||||
Total deferred | 17.0 | (15.5 | ) | 1.4 | |||||||
Total provision for income taxes | $ | 101.1 | $ | 149.2 | $ | 183.9 | |||||
Following are the reconciliations of our effective income tax rates and the U.S. federal income tax statutory rate (in millions):
Year Ended December 31, | |||||||||||
2016 | 2015 | 2014 | |||||||||
Provision for income taxes using the statutory rate in effect | $ | 97.7 | $ | 160.6 | $ | 260.7 | |||||
Tax effect of: | |||||||||||
State and local income taxes, net | 5.9 | 4.3 | 8.6 | ||||||||
International income taxes, net | 2.5 | (1.0 | ) | (1.9 | ) | ||||||
Gain on sale of DST Global Solutions Ltd. | — | — | (33.6 | ) | |||||||
Earnings of U.S. unconsolidated affiliates | (2.3 | ) | (1.5 | ) | (1.4 | ) | |||||
Valuation allowance (reversal), net | (0.9 | ) | 1.2 | 0.8 | |||||||
Tax credits | (5.0 | ) | (7.7 | ) | (7.9 | ) | |||||
Uncertain tax positions (reversal), net | 1.7 | (7.9 | ) | (30.8 | ) | ||||||
Dividend received deduction | (0.8 | ) | (1.2 | ) | (2.6 | ) | |||||
Domestic production activities deduction | (1.7 | ) | (0.1 | ) | (3.1 | ) | |||||
Repatriation | 1.0 | 1.9 | 0.7 | ||||||||
Gain on share repurchase | — | — | (6.3 | ) | |||||||
Other | 3.0 | 0.6 | 0.7 | ||||||||
Total provision for income taxes | $ | 101.1 | $ | 149.2 | $ | 183.9 | |||||
Effective tax rate | 36.2 | % | 32.5 | % | 24.7 | % | |||||
Statutory federal tax rate | 35.0 | % | 35.0 | % | 35.0 | % | |||||
70
The federal and state deferred tax assets (liabilities) recorded on the Consolidated Balance Sheet are as follows (in millions):
December 31, | |||||||
2016 | 2015 | ||||||
Liabilities: | |||||||
Deferred cancellation of debt income | $ | (36.4 | ) | $ | (55.4 | ) | |
Investments in available-for-sale securities | (62.2 | ) | (54.8 | ) | |||
Unconsolidated affiliates and investments | (27.9 | ) | (9.7 | ) | |||
Accumulated depreciation and amortization | (65.3 | ) | (41.8 | ) | |||
Prepaid expenses | (5.5 | ) | (8.1 | ) | |||
Total deferred tax liabilities | (197.3 | ) | (169.8 | ) | |||
Assets: | |||||||
Deferred compensation and other employee benefits | 23.2 | 36.4 | |||||
Net operating loss | 8.5 | 12.8 | |||||
Accrued liabilities | 26.9 | 30.8 | |||||
Other | 1.4 | 3.1 | |||||
Total deferred tax assets | 60.0 | 83.1 | |||||
Valuation allowance | (6.0 | ) | (10.5 | ) | |||
Net deferred tax liability | $ | (143.3 | ) | $ | (97.2 | ) | |
We have approximately $10.8 million of federal net operating losses as of December 31, 2016 as a result of prior year business combinations. These net operating losses begin to expire in 2028 and are available to reduce future income taxes. Since these net operating losses were generated by an entity prior to its acquisition by DST, our utilization is subject to certain limitations imposed by the Internal Revenue Code. We do not anticipate that such limitations will prohibit the utilization of the federal net operating loss carryforwards prior to their expiration. We have approximately $49.5 million of state net operating losses as of December 31, 2016. These net operating losses begin to expire in 2023.
We have approximately $0.7 million and $9.3 million of net operating loss carryforwards as of December 31, 2016 in Canada and the U.K., respectively. The Canada carryforwards begin to expire in 2032. The U.K. carryforwards do not expire but their utilization may be limited to offset only income with certain characteristics.
A valuation allowance is recorded against deferred tax assets if, based on the weight of available evidence, it is more likely than not that some or all of the deferred tax assets will not be realized. In evaluating the realizability of certain international net deferred tax assets, we also anticipate that limitations may result in the benefit of these amounts not being realized and have established corresponding valuation allowances as of December 31, 2016 and 2015 of $5.7 million and $10.5 million, respectively. In evaluating certain state net operating losses, we anticipate that limitations may result in the benefit of these amounts not being realized and have established a corresponding valuation allowance of $0.3 million as of December 31, 2016.
We provide deferred taxes for unremitted earnings of U.S. unconsolidated affiliates net of the 80% dividends received deduction provided for under current tax law. Through December 31, 2016, the cumulative amount of such unremitted earnings was $91.9 million. These amounts would become taxable to us if distributed by the affiliates as dividends, in which case we would be entitled to the dividends received deduction for 80% of the dividends; alternatively, these earnings could be realized by the sale of the affiliates’ stock, which would give rise to tax at federal capital gains rates and state ordinary income tax rates, to the extent the stock sale proceeds exceeded our tax basis. Deferred taxes provided on unremitted earnings through December 31, 2016 and 2015 were $6.5 million and $6.0 million, respectively.
We record U.S. tax on the undistributed earnings of foreign subsidiaries unless the subsidiaries’ earnings are considered indefinitely reinvested outside the U.S. Distributions in 2016, 2015, and 2014 resulted in incremental taxes of $1.0 million, $1.9 million and $0.7 million, respectively. We recorded approximately $2.6 million and $2.7 million of related income tax liability, net of credits, on unremitted earnings in 2016 and 2015, respectively.
We intend to indefinitely reinvest the earnings in the businesses of our other foreign subsidiaries. As a consequence, no federal or state income taxes or foreign withholding taxes have been provided for amounts which would become payable, if any, on the distribution of such earnings. In the event of such a distribution, we may be able to offset, at least in part, the U.S. federal income tax consequences of such a distribution with foreign income tax credits which would become creditable as a result of such a distribution. Due to the uncertainty of the manner in which the undistributed earnings would be brought back to the
71
U.S., the tax laws in effect at that time, as well as the ability of the Company to claim foreign tax credits, it is not practicable for us to determine the income tax we would incur, if any, if such earnings were distributed. As of December 31, 2016, accumulated undistributed earnings considered permanently reinvested were $113.6 million, which is inclusive of discontinued operations.
A reconciliation of the beginning and ending amount of gross unrecognized tax benefits is as follows (in millions):
Year Ended December 31, | |||||||||||
2016 | 2015 | 2014 | |||||||||
Balance at beginning of year | $ | 60.3 | $ | 69.8 | $ | 102.2 | |||||
Additions based on tax positions related to the current year | 3.5 | 9.0 | 15.1 | ||||||||
Additions for tax positions of prior years | 2.7 | 2.2 | 0.9 | ||||||||
Reductions for tax positions of prior years | (7.7 | ) | (19.5 | ) | (17.6 | ) | |||||
Settlements | (1.2 | ) | (0.4 | ) | — | ||||||
Statute expirations | — | (0.8 | ) | (30.8 | ) | ||||||
Balance at end of year | $ | 57.6 | $ | 60.3 | $ | 69.8 | |||||
Included in the net unrecognized tax benefit at December 31, 2016, 2015 and 2014 were $40.9 million, $42.0 million and $51.8 million, respectively, of tax positions which, if recognized, would affect the effective tax rate. We recognize interest and penalties accrued related to unrecognized tax benefits in income taxes, which is consistent with the recognition of these items in prior reporting periods. The liability for interest and penalties associated with unrecognized tax benefits decreased $1.1 million during the year ended December 31, 2016 to $10.4 million. The liability for interest and penalties increased $2.1 million during the year ended December 31, 2015.
Although it is difficult to predict when all uncertain tax positions will reverse due to the unknown timing of the completion of examination periods, it is possible that aggregate income tax amounts of approximately $10.0 million to $13.0 million may reverse during 2017.
We file income tax returns in the U.S. federal jurisdiction, and various state and foreign jurisdictions. An IRS examination for the tax year ended December 31, 2010 was completed in September 2015. Federal tax years 2011 through 2016 are subject to examination while various years from 2007 through 2016 are under or are subject to various state, local, and foreign income tax examinations by taxing authorities. We do not believe that the outcome of any examination will have a material impact on our financial statements.
During 2015, the IRS completed its examination of the previously filed federal income tax refund claims for Domestic Manufacturing Deductions, research and experimentation credits and capital losses for the period 2010. As a result, during 2015 we recognized income tax benefits of $11.9 million, resulting from the reversal of previously reserved tax positions related to these matters as well as other remeasurements during the period.
An IRS examination for the tax year ended December 31, 2014 is expected to begin during 2017.
72
13. Equity
Earnings per share
The computation of basic and diluted earnings per share is as follows (in millions, except per share amounts):
Year Ended December 31, | |||||||||||
2016 | 2015 | 2014 | |||||||||
Income from continuing operations attributable to DST Systems, Inc. | $ | 179.0 | $ | 309.7 | $ | 560.8 | |||||
Income from discontinued operations, net of tax | 248.3 | 48.5 | 32.5 | ||||||||
Net income attributable to DST Systems, Inc. | $ | 427.3 | $ | 358.2 | $ | 593.3 | |||||
Weighted average common shares outstanding | 33.0 | 36.0 | 40.0 | ||||||||
Incremental shares from restricted stock units and stock options | 0.3 | 0.4 | 0.5 | ||||||||
Weighted average diluted shares outstanding | 33.3 | 36.4 | 40.5 | ||||||||
Basic earnings per share | |||||||||||
Continuing operations attributable to DST Systems, Inc. | $ | 5.43 | $ | 8.60 | $ | 14.01 | |||||
Discontinued operations | 7.53 | 1.35 | 0.81 | ||||||||
Basic earnings per share | $ | 12.96 | $ | 9.95 | $ | 14.82 | |||||
Diluted earnings per share | |||||||||||
Continuing operations attributable to DST Systems, Inc. | $ | 5.37 | $ | 8.50 | $ | 13.86 | |||||
Discontinued operations | 7.45 | 1.33 | 0.80 | ||||||||
Diluted earnings per share | $ | 12.82 | $ | 9.83 | $ | 14.66 | |||||
We had approximately 32.0 million and 34.3 million shares outstanding at December 31, 2016 and 2015, respectively. There were no shares from options to purchase common stock excluded from the diluted earnings per share calculation because they were anti-dilutive for the years ended December 31, 2016 and 2015.
We have authorized 10.0 million shares of preferred stock, of which no shares are currently issued or outstanding.
Other comprehensive income (loss)
AOCI balances, net of tax consist of the following (in millions):
Unrealized Gains on Available-for-Sale Securities | Unrealized Loss on Cash Flow Hedges | Foreign Currency Translation Adjustments | Accumulated Other Comprehensive Income | ||||||||||||
Balance, December 31, 2014 | $ | 207.2 | $ | (0.3 | ) | $ | (20.0 | ) | $ | 186.9 | |||||
Net current period other comprehensive income (loss) | (123.2 | ) | 0.2 | (22.0 | ) | (145.0 | ) | ||||||||
Balance, December 31, 2015 | 84.0 | (0.1 | ) | (42.0 | ) | 41.9 | |||||||||
Net current period other comprehensive income (loss) | 10.1 | — | (35.4 | ) | (25.3 | ) | |||||||||
Balance, December 31, 2016 | $ | 94.1 | $ | (0.1 | ) | $ | (77.4 | ) | $ | 16.6 | |||||
73
Additions to and reclassifications out of AOCI attributable to the Company (in millions):
Year Ended December 31, | |||||||||||||||||||||||
2016 | 2015 | 2014 | |||||||||||||||||||||
Pretax | Net of Tax | Pretax | Net of Tax | Pretax | Net of Tax | ||||||||||||||||||
Available-for-sale securities: | |||||||||||||||||||||||
Unrealized gains (losses) on available-for-sale securities | $ | 18.1 | $ | 11.4 | $ | (35.6 | ) | $ | (21.8 | ) | $ | 28.1 | $ | 15.7 | |||||||||
Reclassification of gains into net earnings on available-for-sale securities (1) | (2.1 | ) | (1.3 | ) | (163.5 | ) | (101.4 | ) | (179.1 | ) | (109.3 | ) | |||||||||||
Net change in available-for-sale securities | 16.0 | 10.1 | (199.1 | ) | (123.2 | ) | (151.0 | ) | (93.6 | ) | |||||||||||||
Cash flow hedges: | |||||||||||||||||||||||
Unrealized gains (losses) on cash flow hedges | 0.1 | — | 0.4 | 0.4 | 0.2 | 0.1 | |||||||||||||||||
Reclassification of losses (gains) into net earnings on foreign currency cash flow hedges (2) | — | — | (0.5 | ) | (0.3 | ) | 0.2 | 0.1 | |||||||||||||||
Reclassification of losses into net earnings on interest rate cash flow hedges (3) | — | — | 0.2 | 0.1 | 0.1 | — | |||||||||||||||||
Net change in cash flow hedges | 0.1 | — | 0.1 | 0.2 | 0.5 | 0.2 | |||||||||||||||||
Cumulative translation adjustments: | |||||||||||||||||||||||
Reclassification into net earnings upon liquidation of foreign entities (4) | (0.5 | ) | (0.5 | ) | — | — | (41.9 | ) | (41.9 | ) | |||||||||||||
Current period translation adjustments | (34.9 | ) | (34.9 | ) | (22.0 | ) | (22.0 | ) | 14.0 | 14.0 | |||||||||||||
Net cumulative translation adjustments | (35.4 | ) | (35.4 | ) | (22.0 | ) | (22.0 | ) | (27.9 | ) | (27.9 | ) | |||||||||||
Total other comprehensive loss | $ | (19.3 | ) | $ | (25.3 | ) | $ | (221.0 | ) | $ | (145.0 | ) | $ | (178.4 | ) | $ | (121.3 | ) | |||||
_______________________________________________________________________
(1) Realized (gains)/losses on available-for-sale securities are recognized in Other income, net.
(2) Reclassification to net earnings of derivatives qualifying as effective foreign currency cash flow hedges are recognized in Costs and expenses.
(3) Reclassification to net earnings of derivatives qualifying as effective interest rate cash flow hedges are recognized in Interest expense.
(4) Reclassification upon liquidation of foreign entities are recognized in Gain on sale of business or Income from discontinued operations, net of tax.
One of our unconsolidated affiliates has an interest rate swap liability with a fair market value of $33.1 million, $44.7 million and $50.2 million at December 31, 2016, 2015 and 2014, respectively. The unconsolidated affiliate used inputs from quoted prices for similar assets and liabilities in active markets that are directly or indirectly observable relating to the measurement of the interest rate swap. Our 50% proportionate share of this interest rate swap liability was $16.5 million, $22.4 million and $25.1 million at December 31, 2016, 2015 and 2014, respectively. We record in investments and AOCI our proportionate share of this liability in an amount not to exceed the carrying value of our investment in this unconsolidated affiliate. Because the carrying value of this unconsolidated affiliate investment balance was zero at both December 31, 2016 and 2015, no interest rate swap liability or change in AOCI was recorded.
Stock repurchases and retirements
On June 13, 2016, our Board of Directors authorized a new $300.0 million share repurchase plan, which allows, but does not require, the repurchase of common stock in open market and private transactions. The plan does not have an expiration date. We repurchased 2.7 million shares of our common stock for $300.0 million during the year ended December 31, 2016, which exhausted our prior share repurchase plan. Subsequently, during January and February 2017, we repurchased an additional 0.7 million shares of our common stock for $75.0 million which left approximately $75.0 million remaining under our existing share repurchase plan authorized in 2016. Under previous share repurchase plans, we expended $400.0 million for approximately 3.6 million shares and $200.0 million for approximately 2.2 million shares during the years ended December 31, 2015 and 2014, respectively.
As of March 23, 2014, the Argyros Group beneficially owned 9.2 million shares or approximately 22% of DST common shares. During March 2014, we entered into an agreement under which we agreed to a two-step process to assist Argyros with the disposition of a substantial portion of their common stock ownership in DST. To implement Argyros’ disposition, we facilitated the May 2014 registered, secondary common stock offering of $450.0 million (before any overallotment option) of DST common stock beneficially owned by Argyros. Concurrent with the closing of the secondary offering and based upon a price
74
determined in the secondary offering, we repurchased, and simultaneously retired, 2.4 million shares of our common stock from Argyros for $200.0 million. In connection with this share repurchase, we recorded a non-cash gain of $18.1 million during 2014 resulting from the change in stock price between the date the share repurchase price became fixed and the settlement date. The retirement of the shares during 2014 reduced Common stock by $0.1 million, Additional paid-in capital by $4.8 million and Retained earnings by $213.2 million within the Consolidated Balance Sheet.
Additionally, we retired 42.9 million shares of treasury stock for $2,520.5 million on October 31, 2014. The retirement of the shares during 2014 reduced Common stock by $0.4 million, Additional paid-in capital by $93.5 million and Retained earnings by $2,426.6 million.
Shares received in exchange for tax withholding obligations and payment of the exercise price arising from the exercise of options to purchase our stock or from the vesting of equity awards are included in common stock repurchased in the Consolidated Statement of Cash Flows. The amounts of such share withholdings and exchanges were $15.8 million, $5.3 million and $6.4 million during the years ended December 31, 2016, 2015 and 2014, respectively.
We had 18.0 million and 15.7 million shares of common stock held in treasury at December 31, 2016 and 2015, respectively.
Dividends
In 2016, 2015 and 2014, we paid cash dividends per common share of $1.32, $1.20 and $1.20, respectively. The total dividends paid for the years ended December 31, 2016, 2015 and 2014 were $44.7 million, $44.5 million and $48.3 million, respectively. The cash paid for dividends in 2016, 2015 and 2014 was $43.4 million, $43.1 million, and $47.6 million, respectively. The remaining amount of the dividends represent dividend equivalent shares of restricted stock units in lieu of the cash dividend.
On January 25, 2017, our Board of Directors declared a quarterly cash dividend of $0.35 per share on our common stock, payable on March 10, 2017, to shareholders of record at the close of business on February 24, 2017.
Share-based compensation
The DST Systems, Inc. 2015 Equity and Incentive Plan (the “Employee Plan”) became effective on May 12, 2015. The Employee Plan amends, restates, and renames the DST Systems, Inc. 2005 Equity Incentive Plan in order to, among other things, combine (for all future grants) the DST Systems, Inc. 2005 Non-Employee Directors’ Award Plan (the “Directors’ Plan”) with the Employee Plan. The term of the Employee Plan, subject to the right of the Board of Directors to amend or terminate the Employee Plan at any time, is from May 12, 2015 until the earlier of May 11, 2025 or the date on which all shares subject to the Employee Plan have been delivered and the restrictions on all awards granted under the plan have lapsed, according to the Employee Plan’s provisions. All awards granted pursuant to the Directors’ Plan before May 9, 2015 remain subject to the terms and conditions of the Directors’ Plan. We have outstanding share awards (primarily in the form of stock options and restricted stock) under each of the plans. The Employee Plan has been approved by our Board of Directors and shareholders.
The number of shares of common stock reserved for delivery under the Employee Plan, subject to certain limitations and adjustments, is the sum of (a) 2.6 million shares, plus (b) any shares required to satisfy substitute awards, as defined by the Employee Plan. If any shares subject to an award granted after May 12, 2015 are forfeited or such awards terminate or lapse without the delivery of such shares, those shares shall become available for grant under the Employee Plan. As of December 31, 2016, approximately 2.1 million shares were available under the Employee Plan. The Employee Plan provides for the availability of shares of our common stock for the grant of awards to employees, consultants and non-employee directors of the Company, its consolidated subsidiaries, and its unconsolidated affiliates and joint ventures. Awards under the Employee Plan may take the form of shares, dividend equivalents, options, stock appreciation rights, performance units, restricted stock, restricted stock units, annual incentive awards, service awards and substitute awards (each as defined in the plan).
Options under the Employee Plan vest and generally become fully exercisable over three years of continued employment, depending upon the grant type. The fair value of each option grant is estimated on the date of grant using a Black-Scholes option pricing model. There were no stock options granted or canceled during 2016, 2015 or 2014. All outstanding options were fully vested at December 31, 2016 and 2015. The total aggregate intrinsic values of options exercised for all plans during the years ended December 31, 2016, 2015 and 2014 were $5.8 million, $15.4 million and $13.1 million, respectively.
75
A summary of stock option activity is presented in the table below (shares in millions):
Options | Shares | Weighted Average Exercise Price | Weighted Average Remaining Contractual Term (in years) | Aggregate Intrinsic Value (in millions) | |||||||||
Outstanding at December 31, 2015 | 0.4 | $ | 45.67 | ||||||||||
Exercised | (0.1 | ) | 46.73 | $ | 5.8 | ||||||||
Outstanding at December 31, 2016 | 0.3 | 45.41 | 3.9 | ||||||||||
Exercisable at December 31, 2016 | 0.3 | $ | 45.41 | 3.9 | |||||||||
Grants of restricted stock may consist of restricted stock awards (“RSAs”), restricted stock units (“RSUs”) or performance-based stock units (“PSUs”). Grants of restricted stock are valued at the date of grant based on the value of DST’s common stock and are expensed using the straight-line method over the service period or, in the case of performance based vesting awards, over the expected period to achieve the required performance criteria. Except for restrictions placed on the transferability of the restricted stock, holders of RSAs have full stockholders’ rights during the term of restriction, including voting rights and the right to receive cash dividends, if any. Grants of RSUs do not confer full stockholder rights such as voting rights and cash dividends, but provide for additional dividend equivalent RSU awards in lieu of cash dividends. Unvested shares of restricted stock may be forfeited upon termination of employment with the Company depending on the circumstances of the termination, or failure to achieve the required performance condition, if applicable.
Included in the non-vested outstanding restricted stock at December 31, 2016 are approximately 0.2 million of restricted stock that contain service features and 0.7 million that contain performance features. Management judgment is required to estimate amortization expense during the service period associated with awards containing performance features.
A summary of the status of non-vested restricted stock as of December 31, 2016, and changes during the year is presented in the table below (shares in millions):
Non-vested Restricted Stock | Shares | Weighted Average Grant Date Fair Value | |||||
Non-vested at December 31, 2015 | 0.9 | $ | 91.32 | ||||
Granted | 0.5 | 107.49 | |||||
Vested | (0.4 | ) | 81.54 | ||||
Forfeited | (0.1 | ) | 84.19 | ||||
Non-vested at December 31, 2016 | 0.9 | $ | 104.76 | ||||
The fair value of restricted stock which vested during the years ended December 31, 2016, 2015 and 2014 was $30.2 million, $9.6 million and $9.7 million, respectively.
At December 31, 2016, we had $66.6 million of total unrecognized compensation expense (included in Additional paid-in capital on the Consolidated Balance Sheet) related to share-based compensation arrangements, net of estimated forfeitures. Based on awards currently outstanding, we estimate that compensation expense attributable to the restricted stock grants will be approximately $11.4 million for 2017, $6.8 million for 2018, and $1.5 million for 2019. Future compensation expense is not projected on approximately $46.9 million of unrecognized compensation expense as the related awards are not currently expected to achieve their required performance features and therefore are not expected to vest.
The Consolidated Statement of Income for the years ended December 31, 2016, 2015 and 2014 reflects share-based compensation expense of $16.3 million, $27.9 million and $21.0 million, respectively. These amounts are inclusive of discontinued operations. The total tax benefits recognized in earnings from share-based compensation arrangements for the years ended December 31, 2016, 2015 and 2014, were approximately $6.4 million, $10.9 million and $8.2 million, respectively. Excess tax benefits of $4.7 million, $5.6 million and $6.1 million were classified as financing cash inflows during the years ended December 31, 2016, 2015 and 2014, respectively. Cash proceeds from options exercised for the years ended December 31, 2016, 2015 and 2014 were $5.3 million, $11.8 million and $13.0 million, respectively. We generally issue shares out of treasury to satisfy stock option exercises.
76
Stock purchase plans
The 2000 DST Systems, Inc. Employee Stock Purchase Plan (“ESPP”), which provided employees the right to purchase Company shares at a discount, was suspended effective January 1, 2006.
Redeemable non-controlling interest
As a result of our seed capital investment during 2015, there is a non-controlling investor group which owned approximately 47% and 37% of a consolidated open-end fund as of December 31, 2016 and 2015, respectively. The amount included on the Consolidated Balance Sheet at December 31, 2016 and 2015 associated with the redeemable non-controlling interest was $21.3 million and $15.1 million, respectively. During the years ended December 31, 2016 and 2015, the net loss attributable to the non-controlling interest was $0.9 million and $0.1 million, respectively.
14. Benefit Plans
We sponsor defined contribution plans that cover domestic and non-domestic employees following the completion of an eligibility period. Employer contribution expenses from continuing operations under these plans totaled $35.0 million, $33.9 million and $30.7 million during the years ended December 31, 2016, 2015 and 2014, respectively.
We have active and non-active non-qualified deferred compensation plans for senior management, certain highly compensated employees and directors. Certain of the active plans permit existing participants to defer a portion of their compensation until termination of their employment, at which time payment of amounts deferred is made in a lump sum or annual installments. Deferred amounts earn interest at a rate determined by the Board of Directors or are credited with deemed gains or losses of the underlying hypothetical investments. Amounts deferred under these plans were approximately $12.7 million and $20.4 million at December 31, 2016 and 2015, respectively. Changes in the liability are recorded as adjustments to compensation expense. The underlying investments, which are classified as trading securities, are recorded at fair market value with changes recorded as adjustments to other income, net.
15. Supplemental Cash Flow Information
Supplemental disclosure of cash flow information (in millions):
Year Ended December 31, | |||||||||||
2016 | 2015 | 2014 | |||||||||
Cash payments: | |||||||||||
Interest paid during the year | $ | 22.9 | $ | 24.3 | $ | 25.2 | |||||
Income taxes paid during the year | 164.5 | 217.4 | 205.4 | ||||||||
Non cash investing and financing activities: | |||||||||||
Changes in accrued capital expenditures | 2.0 | 4.0 | 3.3 | ||||||||
Gain on contract to repurchase common stock | — | — | 18.1 | ||||||||
Charitable contribution of marketable securities | 2.0 | — | 0.5 | ||||||||
Deposits with broker for securities sold short | 8.4 | 10.8 | — | ||||||||
Securities sold short | 8.2 | 10.7 | — | ||||||||
77
16. Commitments and Contingencies
The following table sets forth our contractual cash obligations for our continuing operations including debt obligations, minimum rentals for the non-cancelable term of all operating leases and obligations under software license and other agreements (in millions):
Debt | Operating Leases | Software License Agreements | Other | Total | |||||||||||||||
2017 | $ | 208.5 | $ | 18.8 | $ | 50.1 | $ | 13.8 | $ | 291.2 | |||||||||
2018 | 65.0 | 17.2 | 6.5 | 11.3 | 100.0 | ||||||||||||||
2019 | 75.0 | 13.1 | 5.3 | 4.5 | 97.9 | ||||||||||||||
2020 | 160.0 | 10.2 | 1.6 | 0.4 | 172.2 | ||||||||||||||
2021 | — | 8.9 | — | 0.5 | 9.4 | ||||||||||||||
Thereafter | — | 12.3 | — | 0.2 | 12.5 | ||||||||||||||
Total | $ | 508.5 | $ | 80.5 | $ | 63.5 | $ | 30.7 | $ | 683.2 | |||||||||
Debt includes the accounts receivable securitization program, Senior Notes, revolving credit facilities and other indebtedness as described in Note 10, Debt. We also have letters of credit of $5.9 million and $10.6 million outstanding for December 31, 2016 and 2015, respectively. Letters of credit are provided by our debt facility.
We have future obligations under certain operating leases. The operating leases, which include facilities, data processing and other equipment, have remaining lease terms ranging from 1 to 10 years excluding options to extend the leases for various lengths of time. Certain leases have clauses that call for the annual rents to be increased during the term of the lease. Such lease payments are expensed on a straight-line basis. We also lease certain facilities from unconsolidated real estate affiliates.
The following rental costs were incurred (in millions):
Year Ended December 31, | |||||||||||
2016 | 2015 | 2014 | |||||||||
Rent expense | $ | 22.2 | $ | 23.6 | $ | 26.8 | |||||
Occupancy expenses included in above amounts that were charged by unconsolidated real estate affiliates | 5.9 | 6.8 | 11.4 | ||||||||
Obligations under software license agreements generally relate to purchase obligations under maintenance agreements that support the software license.
We have entered into agreements with certain officers whereby upon defined circumstances constituting a change in control of the Company, certain benefit entitlements are automatically funded and such officers are entitled to specific cash payments upon termination of employment. Additionally, we have adopted the DST Systems, Inc. Executive Severance Plan which provides certain benefits to participants in the event of a qualifying termination under the plan.
We are involved in various legal proceedings arising in the normal course of our business. While the ultimate outcome of these legal proceedings cannot be predicted with certainty, it is the opinion of management, after consultation with legal counsel, that the final outcome in such proceedings, in the aggregate, would not have a material adverse effect on our consolidated financial condition, results of operations and cash flows.
Other contractual commitments
In the normal course of business, to facilitate transactions of services and products and other business assets, we have agreed to indemnify certain parties with respect to certain matters. We have agreed to hold certain parties harmless against losses arising from a breach of representations or covenants, data and confidentiality obligations, or out of intellectual property infringement or other claims made by third parties. These agreements may limit the time within which an indemnification claim can be made and the amount of the claim. At December 31, 2016, except for certain immaterial items, there were no liabilities for guarantees or indemnifications as it is not possible to determine either the maximum potential amount under these indemnification agreements or the timing of any such payments due to the limited history of prior indemnification claims and the unique facts and circumstances involved in each particular agreement. Historically, payments made under these agreements have not had a material impact on our consolidated financial position, results of operations or cash flows.
78
17. Segment and Geographic Information
Our operating business units offer sophisticated information processing and software services and products. We present these businesses as two operating segments, Financial Services and Healthcare Services. Investments in the Company’s equity securities, private equity investments, real estate and certain financial interests are included in the Investments and Other segment.
As mentioned in Note 1, Description of Business, we completed the sale of our North American Customer Communications business and announced our intent to dispose of our United Kingdom Customer Communications business during 2016. As a result, the Customer Communications segment, as well as certain businesses previously reported within the Financial Services segment that were part of the July 1, 2016 sale, have been reported as discontinued operations. Prior periods have been adjusted to be consistent with the current presentation.
We evaluate the performance of our segments based on income before interest expense, income taxes, and non-controlling interest. Intersegment revenues are reflected at rates prescribed by us and may not be reflective of market rates.
Summarized financial information concerning our segments is shown in the following tables (in millions):
Year Ended December 31, 2016 | |||||||||||||||||||
Financial Services | Healthcare Services | Investments/ Other | Elimination Adjustments | Consolidated Total | |||||||||||||||
Operating revenues | $ | 1,047.3 | $ | 426.2 | $ | 0.9 | $ | — | $ | 1,474.4 | |||||||||
Intersegment operating revenues | 42.9 | — | — | (42.9 | ) | — | |||||||||||||
Out-of-pocket reimbursements | 73.9 | 8.5 | — | (0.1 | ) | 82.3 | |||||||||||||
Total revenues | 1,164.1 | 434.7 | 0.9 | (43.0 | ) | 1,556.7 | |||||||||||||
Costs and expenses | 908.3 | 345.1 | 3.0 | (43.0 | ) | 1,213.4 | |||||||||||||
Depreciation and amortization | 79.7 | 15.6 | 0.7 | — | 96.0 | ||||||||||||||
Operating income (loss) | 176.1 | 74.0 | (2.8 | ) | — | 247.3 | |||||||||||||
Gain on sale of business | 5.5 | — | — | — | 5.5 | ||||||||||||||
Other income (loss), net | (2.2 | ) | 0.1 | 24.8 | — | 22.7 | |||||||||||||
Equity in earnings of unconsolidated affiliates | 21.2 | 0.5 | 5.5 | — | 27.2 | ||||||||||||||
Earnings from continuing operations before interest, income taxes and non-controlling interest | $ | 200.6 | $ | 74.6 | $ | 27.5 | $ | — | $ | 302.7 | |||||||||
Year Ended December 31, 2015 | |||||||||||||||||||
Financial Services | Healthcare Services | Investments/ Other | Elimination Adjustments | Consolidated Total | |||||||||||||||
Operating revenues | $ | 1,025.5 | $ | 376.4 | $ | 3.1 | $ | — | $ | 1,405.0 | |||||||||
Intersegment operating revenues | 38.3 | — | — | (38.3 | ) | — | |||||||||||||
Out-of-pocket reimbursements | 61.7 | 8.2 | — | (0.9 | ) | 69.0 | |||||||||||||
Total revenues | 1,125.5 | 384.6 | 3.1 | (39.2 | ) | 1,474.0 | |||||||||||||
Costs and expenses | 869.8 | 321.3 | (1.7 | ) | (39.2 | ) | 1,150.2 | ||||||||||||
Depreciation and amortization | 71.6 | 18.6 | 0.9 | — | 91.1 | ||||||||||||||
Operating income | 184.1 | 44.7 | 3.9 | — | 232.7 | ||||||||||||||
Other income (loss), net | (2.1 | ) | (0.1 | ) | 206.7 | — | 204.5 | ||||||||||||
Equity in earnings of unconsolidated affiliates | 35.3 | 0.3 | 9.8 | — | 45.4 | ||||||||||||||
Earnings from continuing operations before interest, income taxes and non-controlling interest | $ | 217.3 | $ | 44.9 | $ | 220.4 | $ | — | $ | 482.6 | |||||||||
79
Year Ended December 31, 2014 | |||||||||||||||||||
Financial Services | Healthcare Services | Investments/ Other | Elimination Adjustments | Consolidated Total | |||||||||||||||
Operating revenues | $ | 1,056.3 | $ | 382.1 | $ | 7.1 | $ | — | $ | 1,445.5 | |||||||||
Intersegment operating revenues | 32.5 | — | — | (32.5 | ) | — | |||||||||||||
Out-of-pocket reimbursements | 52.6 | 6.9 | — | (0.2 | ) | 59.3 | |||||||||||||
Total revenues | 1,141.4 | 389.0 | 7.1 | (32.7 | ) | 1,504.8 | |||||||||||||
Costs and expenses | 867.9 | 308.5 | 5.4 | (32.7 | ) | 1,149.1 | |||||||||||||
Depreciation and amortization | 72.2 | 19.5 | 1.3 | — | 93.0 | ||||||||||||||
Operating income | 201.3 | 61.0 | 0.4 | — | 262.7 | ||||||||||||||
Gain on sale of business | 100.5 | — | — | — | 100.5 | ||||||||||||||
Other income, net | 19.5 | 0.1 | 353.5 | — | 373.1 | ||||||||||||||
Equity in earnings of unconsolidated affiliates | 29.8 | 0.5 | 4.4 | — | 34.7 | ||||||||||||||
Earnings from continuing operations before interest, income taxes and non-controlling interest | $ | 351.1 | $ | 61.6 | $ | 358.3 | $ | — | $ | 771.0 | |||||||||
Earnings before interest, income taxes and non-controlling interest in the segment reporting information above less interest expense of $23.5 million, $23.8 million and $26.3 million for the years ended December 31, 2016, 2015 and 2014, respectively, are equal to income before income taxes and non-controlling interest on a consolidated basis for the corresponding year.
Information concerning the revenues of principal geographic areas is as follows (in millions):
Year Ended December 31, | |||||||||||
2016 | 2015 | 2014 | |||||||||
Revenues:(1) | |||||||||||
U.S. | $ | 1,417.2 | $ | 1,350.6 | $ | 1,323.7 | |||||
International | |||||||||||
U.K. | 78.1 | 65.6 | 58.5 | ||||||||
Canada | 19.3 | 21.7 | 64.9 | ||||||||
Australia | 25.4 | 20.5 | 25.8 | ||||||||
Others | 16.7 | 15.6 | 31.9 | ||||||||
Total international | 139.5 | 123.4 | 181.1 | ||||||||
Total revenues | $ | 1,556.7 | $ | 1,474.0 | $ | 1,504.8 | |||||
_______________________________________________________________________
(1) | Revenues are attributed to countries based on location of the client. |
Information concerning total assets by reporting segment is as follows (in millions):
December 31, | |||||||
2016 | 2015 | ||||||
Financial Services | $ | 1,717.1 | $ | 1,611.2 | |||
Healthcare Services | 552.2 | 405.3 | |||||
Investments and Other | 431.4 | 502.7 | |||||
Assets held for sale | 72.6 | 297.5 | |||||
Elimination Adjustments | (1.5 | ) | (3.5 | ) | |||
Total assets | $ | 2,771.8 | $ | 2,813.2 | |||
80
Information concerning the long-lived assets (properties and other non-current assets) of principal geographic areas is as follows (in millions):
December 31, | |||||||
2016 | 2015 | ||||||
Long-lived assets: | |||||||
U.S. | $ | 249.9 | $ | 274.7 | |||
International | |||||||
U.K. | 25.9 | 29.1 | |||||
Canada | 0.4 | 5.6 | |||||
Australia | 8.0 | 2.6 | |||||
Others | 1.8 | 1.7 | |||||
Total international | 36.1 | 39.0 | |||||
Total long-lived assets | $ | 286.0 | $ | 313.7 | |||
81
18. Quarterly Financial Data (Unaudited)
(in millions, except per share amounts):
________________________________________________________________
Year Ended December 31, 2016 | ||||||||||||||||||||
First Quarter | Second Quarter | Third Quarter | Fourth Quarter | Total | ||||||||||||||||
Operating revenues | $ | 361.3 | $ | 373.9 | $ | 365.5 | $ | 373.7 | $ | 1,474.4 | ||||||||||
Out-of-pocket reimbursements | 19.4 | 16.6 | 21.2 | 25.1 | 82.3 | |||||||||||||||
Total revenues | 380.7 | 390.5 | 386.7 | 398.8 | 1,556.7 | |||||||||||||||
Costs and expenses | 306.9 | 320.4 | 289.6 | 296.5 | 1,213.4 | |||||||||||||||
Depreciation and amortization | 22.1 | 24.2 | 22.8 | 26.9 | 96.0 | |||||||||||||||
Operating income | 51.7 | 45.9 | 74.3 | 75.4 | 247.3 | |||||||||||||||
Interest expense | (6.1 | ) | (6.5 | ) | (5.4 | ) | (5.5 | ) | (23.5 | ) | ||||||||||
Gain on sale of business | — | — | — | 5.5 | 5.5 | |||||||||||||||
Other income, net | 6.3 | 7.0 | 6.7 | 2.7 | 22.7 | |||||||||||||||
Equity in earnings of unconsolidated affiliates | 6.7 | 10.2 | 7.0 | 3.3 | 27.2 | |||||||||||||||
Income from continuing operations before income taxes and non-controlling interest | 58.6 | 56.6 | 82.6 | 81.4 | 279.2 | |||||||||||||||
Income taxes | 20.1 | 22.1 | 31.6 | 27.3 | 101.1 | |||||||||||||||
Income from continuing operations before non-controlling interest | 38.5 | 34.5 | 51.0 | 54.1 | 178.1 | |||||||||||||||
Income (loss) from discontinued operations, net of tax | 18.5 | 18.7 | 222.8 | (11.7 | ) | 248.3 | ||||||||||||||
Net income | 57.0 | 53.2 | 273.8 | 42.4 | 426.4 | |||||||||||||||
Net (income) loss attributable to non-controlling interest | 1.1 | (0.2 | ) | (0.5 | ) | 0.5 | 0.9 | |||||||||||||
Net income attributable to DST Systems, Inc. | $ | 58.1 | $ | 53.0 | $ | 273.3 | $ | 42.9 | $ | 427.3 | ||||||||||
Weighted average common shares outstanding | 33.8 | 33.3 | 32.7 | 32.1 | 33.0 | |||||||||||||||
Weighted average diluted shares outstanding | 34.3 | 33.6 | 33.0 | 32.5 | 33.3 | |||||||||||||||
Basic earnings per share: | ||||||||||||||||||||
Continuing operations attributable to DST Systems, Inc. | $ | 1.17 | $ | 1.03 | $ | 1.54 | $ | 1.70 | $ | 5.43 | (1) | |||||||||
Discontinued operations | 0.55 | 0.56 | 6.81 | (0.36 | ) | 7.53 | (1) | |||||||||||||
Basic earnings per share | $ | 1.72 | $ | 1.59 | $ | 8.35 | $ | 1.34 | $ | 12.96 | (1) | |||||||||
Diluted earnings per share: | ||||||||||||||||||||
Continuing operations attributable to DST Systems, Inc. | $ | 1.16 | $ | 1.03 | $ | 1.53 | $ | 1.68 | $ | 5.37 | (1) | |||||||||
Discontinued operations | 0.54 | 0.55 | 6.75 | (0.36 | ) | 7.45 | (1) | |||||||||||||
Diluted earnings per share | $ | 1.70 | $ | 1.58 | $ | 8.28 | $ | 1.32 | $ | 12.82 | (1) | |||||||||
Cash dividends per share of common stock | $ | 0.33 | $ | 0.33 | $ | 0.33 | $ | 0.33 | $ | 1.32 | ||||||||||
(1) | Earnings per share are computed independently for each of the quarters presented. Accordingly, the accumulation of quarterly earnings per share may not equal the total computed for the year. |
82
Year Ended December 31, 2015 | ||||||||||||||||||||
First Quarter | Second Quarter | Third Quarter | Fourth Quarter | Total | ||||||||||||||||
Operating revenues | $ | 340.0 | $ | 349.3 | $ | 353.4 | $ | 362.3 | $ | 1,405.0 | ||||||||||
Out-of-pocket reimbursements | 15.7 | 14.2 | 18.2 | 20.9 | 69.0 | |||||||||||||||
Total revenues | 355.7 | 363.5 | 371.6 | 383.2 | 1,474.0 | |||||||||||||||
Costs and expenses | 277.5 | 289.7 | 287.1 | 295.9 | 1,150.2 | |||||||||||||||
Depreciation and amortization | 21.4 | 21.7 | 22.9 | 25.1 | 91.1 | |||||||||||||||
Operating income | 56.8 | 52.1 | 61.6 | 62.2 | 232.7 | |||||||||||||||
Interest expense | (6.1 | ) | (5.8 | ) | (5.8 | ) | (6.1 | ) | (23.8 | ) | ||||||||||
Other income, net | 83.3 | 92.2 | 14.4 | 14.6 | 204.5 | |||||||||||||||
Equity in earnings of unconsolidated affiliates | 14.7 | 12.7 | 11.8 | 6.2 | 45.4 | |||||||||||||||
Income from continuing operations before income taxes and non-controlling interest | 148.7 | 151.2 | 82.0 | 76.9 | 458.8 | |||||||||||||||
Income taxes | 55.6 | 55.7 | 15.9 | 22.0 | 149.2 | |||||||||||||||
Income from continuing operations before non-controlling interest | 93.1 | 95.5 | 66.1 | 54.9 | 309.6 | |||||||||||||||
Income from discontinued operations, net of tax | 14.7 | 12.0 | 9.0 | 12.8 | 48.5 | |||||||||||||||
Net income | 107.8 | 107.5 | 75.1 | 67.7 | 358.1 | |||||||||||||||
Net loss attributable to non-controlling interest | — | — | — | 0.1 | 0.1 | |||||||||||||||
Net income attributable to DST Systems, Inc. | $ | 107.8 | $ | 107.5 | $ | 75.1 | $ | 67.8 | $ | 358.2 | ||||||||||
Weighted average common shares outstanding | 37.2 | 36.6 | 35.7 | 34.5 | 36.0 | |||||||||||||||
Weighted average diluted shares outstanding | 37.6 | 37.0 | 36.2 | 35.0 | 36.4 | |||||||||||||||
Basic earnings per share: | ||||||||||||||||||||
Continuing operations attributable to DST Systems, Inc. | $ | 2.50 | $ | 2.61 | $ | 1.85 | $ | 1.59 | $ | 8.60 | (1) | |||||||||
Discontinued operations | 0.40 | 0.33 | 0.25 | 0.37 | 1.35 | (1) | ||||||||||||||
Basic earnings per share | $ | 2.90 | $ | 2.94 | $ | 2.10 | $ | 1.96 | $ | 9.95 | (1) | |||||||||
Diluted earnings per share: | ||||||||||||||||||||
Continuing operations attributable to DST Systems, Inc. | $ | 2.48 | $ | 2.58 | $ | 1.83 | $ | 1.57 | $ | 8.50 | (1) | |||||||||
Discontinued operations | 0.39 | 0.33 | 0.25 | 0.37 | 1.33 | (1) | ||||||||||||||
Diluted earnings per share | $ | 2.87 | $ | 2.91 | $ | 2.08 | $ | 1.94 | $ | 9.83 | (1) | |||||||||
Cash dividends per share of common stock | $ | 0.30 | $ | 0.30 | $ | 0.30 | $ | 0.30 | $ | 1.20 | ||||||||||
_______________________________________________________________________
(1) | Earnings per share are computed independently for each of the quarters presented. Accordingly, the accumulation of quarterly earnings per share may not equal the total computed for the year. |
83
Item 9. Changes in and Disagreements with Accountants on Accounting and Financial Disclosure
None.
Item 9A. Controls and Procedures
Evaluation of Disclosure Controls and Procedures and Changes in Internal Control Over Financial Reporting
As of the end of the fiscal year for which this Annual Report on Form 10-K is filed, the Company’s Chief Executive Officer and Chief Financial Officer evaluated the effectiveness of the Company’s disclosure controls and procedures. Based upon that evaluation, the Chief Executive Officer and Chief Financial Officer have concluded that the Company’s disclosure controls and procedures (i) are effective for recording, processing, summarizing and reporting, within the time periods specified in the Securities and Exchange Commission’s rules and forms, the information required to be disclosed by the Company in reports that it files or submits under the Securities Exchange Act of 1934 (the “Exchange Act”), and (ii) include controls and procedures designed to ensure that information required to be disclosed by the Company in such reports is accumulated and communicated to the Company’s management, including the Chief Executive Officer and Chief Financial Officer, as appropriate to allow timely decisions regarding required disclosure. There has been no change in the Company’s internal control over financial reporting that occurred during the last fiscal quarter of the fiscal year for which this Annual Report on Form 10-K is filed that has materially affected, or is reasonably likely to materially affect, the Company’s internal control over financial reporting.
Report of Management on Internal Control over Financial Reporting
The Company’s management is responsible for establishing and maintaining adequate internal control over financial reporting, as such term is defined in Exchange Act Rule 13a-15(f). Under the supervision and with the participation of management, including the Chief Executive Officer and Chief Financial Officer, the Company conducted an evaluation of the effectiveness of our internal control over financial reporting based on the 2013 framework in Internal Control—Integrated Framework issued by the Committee of Sponsoring Organizations of the Treadway Commission. Based on our evaluation under the framework in Internal Control—Integrated Framework, management concluded that our internal control over financial reporting was effective as of December 31, 2016.
The effectiveness of the Company’s internal control over financial reporting as of December 31, 2016 has been audited by PricewaterhouseCoopers LLP, an independent registered public accounting firm, as stated in their report which appears herein.
Item 9B. Other Information
None.
PART III
Item 10. Directors, Executive Officers and Corporate Governance
The information required by this item is incorporated by reference to the information set forth under the captions “Board of Directors,” and “Beneficial Ownership - Section 16(a) Beneficial Ownership Reporting Compliance” in our Proxy Statement relating to our 2017 Annual Meeting of Stockholders (“Definitive Proxy Statement”). Information concerning executive officers is set forth under “Executive Officers of the Registrant” in Part I of this Annual Report on Form 10-K and incorporated herein by reference.
We have adopted the Code of Business Conduct, which applies to all of our directors, officers and employees. The Code of Business Conduct is publicly available on our website at www.dstsystems.com. If we make any amendment to our Code of Business Conduct, other than a technical, administrative or non-substantive amendment, or if we grant any waiver, including any implicit waiver, from a provision of the Code of Business Conduct that applies to our principal executive officer, principal financial officer, principal accounting officer or controller, we will disclose the nature of the amendment or waiver on our website at the same location. Also, we may elect to disclose the amendment or waiver in a current report on Form 8-K filed with the SEC.
Item 11. Executive Compensation
The information required by this item is incorporated by reference to the information set forth under the captions “Compensation Discussion and Analysis,” “Non-Employee Director Compensation,” “Committee Reports - Compensation Committee Report” and “Compensation Committee Matters” in the Definitive Proxy Statement.
84
Item 12. Security Ownership of Certain Beneficial Owners and Management and Related Stockholder Matters
The information set forth in response to Item 403 (a) and (b) of Regulation S-K under the heading “Beneficial Ownership” in our Definitive Proxy Statement is hereby incorporated herein by reference.
The Company has no knowledge of any arrangement the operation of which may at a subsequent date result in a change of control of the Company.
The following table provides information as of December 31, 2016 about DST stock that may be issued under the 2005 Equity Incentive Plan and the Employee Plan upon the exercise of options, warrants and rights, as well as other year-end information about our equity compensation plans.
Equity Compensation Plan Information
A | B | C | ||||||||||
Plan Category | Number of securities to be issued upon exercise of options, warrants and rights outstanding as of December 31, 2016(#) | Weighted average exercise price of outstanding options, warrants and rights shown in column A ($) | Number of securities remaining available for issuance as of December 31, 2016 under equity compensation plans (excluding securities reflected in column A)(#) | |||||||||
Equity compensation plans approved by stockholders | 1,261,208 | (1) | $ | 12.20 | 2,087,352 | (2) | ||||||
DST Systems, Inc. 2000 Employee Stock Purchase Plan (“ESPP”) | None | None | 589,844 | (3) | ||||||||
Equity compensation plans not approved by stockholders | None | None | None | |||||||||
_______________________________________________________________________
(1) | This column includes securities that have been granted and may be issued at a future date in connection with stock option grants, restricted stock units, and performance stock units under the 2005 Equity Incentive Plan and the Employee Plan. 806,254 shares were granted prior to May 2015 under the 2005 Equity Incentive Plan and 454,954 shares were granted under the Employee Plan, which was adopted and effective May 12, 2015. Column A does not include: |
• | Service awards of DST stock that were earned under the Employee Plan in recognition of years of service (five shares for five years of employment, ten shares for ten years, and so forth in five year increments) during the year ended December 31, 2016 is 14,205. The average grant date fair value of those shares granted as service awards during 2016 was $115.57. |
(2) | These are the shares available for issuance in connection with the granting of annual incentive awards, stock options, stock appreciation rights, restricted stock, stock awards, restricted stock units, performance stock units, deferred stock, dividend equivalents, service awards, substitute awards, or any other right, interest or option relating to shares of DST stock granted pursuant to the Employee Plan. |
(3) | The ESPP was suspended beginning for plan year 2006 and no shares have been issued for the 2006 through 2016 plan years. The suspension will continue until otherwise determined by the Committee. The number shown is the number available for issuance should the Committee lift the suspension. |
Item 13. Certain Relationships and Related Transactions, and Director Independence
The information required by this item is incorporated by reference to the information set forth under the captions “Certain Relationships and Related Transactions” and “Board of Directors - Director Independence” in our Definitive Proxy Statement.
Item 14. Principal Accountant Fees and Services
The information required by this item is incorporated by reference to the information set forth under the caption “Independent Registered Public Accounting Firm” in our Definitive Proxy Statement.
85
PART IV
Item 15. Exhibits and Financial Statement Schedules
(a) | List of documents filed as part of this report |
(1) | Consolidated Financial Statements |
The consolidated financial statements and related notes, together with the report of PricewaterhouseCoopers LLP, appear in Part II, Item 8, Financial Statements and Supplementary Data, of this Form 10-K.
The consolidated financial statements consist of the following:
1.Consolidated Balance Sheet as of December 31, 2016 and 2015;
2.Consolidated Statement of Income for the three years ended December 31, 2016;
3.Consolidated Statement of Comprehensive Income for the three years ended December 31, 2016;
4.Consolidated Statement of Changes in Stockholders’ Equity for the three years ended December 31, 2016;
5.Consolidated Statement of Cash Flows for the three years ended December 31, 2016; and
6.Notes to Consolidated Financial Statements.
(2) | Consolidated Financial Statement Schedules |
All schedules have been omitted because they are not applicable, are insignificant or the required information is shown in the consolidated financial statements or notes thereto.
(3) | List of Exhibits |
The exhibits filed as part of this report are listed in the Exhibit Index.
86
SIGNATURES
Pursuant to the requirements of Section 13 or 15(d) of the Securities Exchange Act of 1934, the Company has duly caused this report to be signed on its behalf by the undersigned, thereunto duly authorized.
DST SYSTEMS, INC. | |||
By: | /s/ STEPHEN C. HOOLEY | ||
Stephen C. Hooley Chairman, Chief Executive Officer, and President | |||
Dated: February 28, 2017
Pursuant to the requirements of the Securities Exchange Act of 1934, this report has been signed below by the following persons on behalf of the Company and in the capacities indicated on February 28, 2017.
* JOSEPH C. ANTONELLIS | * CHARLES E. HALDEMAN, JR. | |
Joseph C. Antonellis Director | Charles E. Haldeman, Jr. Director | |
* SAMUEL G. LISS | ||
Jerome H. Bailey Director | Samuel G. Liss Director | |
* LYNN DORSEY BLEIL | /s/ STEPHEN C. HOOLEY | |
Lynn Dorsey Bleil Director | Stephen C. Hooley Chairman, Chief Executive Officer, and President (Principal Executive Officer) | |
* LOWELL L. BRYAN | /s/ GREGG WM. GIVENS | |
Lowell L. Bryan Director | Gregg Wm. Givens Senior Vice President, Chief Financial Officer and Treasurer (Principal Financial Officer) | |
* GARY D. FORSEE | /s/ DOUGLAS W. FLEMING | |
Gary D. Forsee Director | Douglas W. Fleming Vice President, Chief Accounting Officer (Principal Accounting Officer) * Individually and as attorney in-fact | |
87
DST Systems, Inc.
Form 10-K Annual Report
for the Period Ended
December 31, 2016
Exhibit Index
Incorporated by Reference | Filed/Furnished Herewith | |||||||||||
Exhibit no. | Exhibit Description | Form | SEC File No. | Exhibit | Filing Date | |||||||
(2) Plan of acquisition, reorganization, arrangement, liquidation or succession | ||||||||||||
2.1 | Agreement of Limited Partnership for International Financial Data Services Limited Partnership, effective as of January 31, 2001, by and among the Company, State Street Corporation, and entities related to the Company and State Street Corporation | 10-K | 1-14036 | 2.1 | 2/28/2011 | |||||||
2.2 | Agreement, dated as of December 23, 1992 by and among State Street Boston Corporation, DST Systems International B.V., and Clarke & Tilley Limited (currently, International Financial Data Services Limited) Portions of this agreement have been redacted pursuant to a request for confidential treatment filed with the Securities and Exchange Commission pursuant to Rule 24b-2 under the Securities Exchange Act of 1934, as amended | 10-K | 1-14036 | 2.2 | 2/28/2011 | |||||||
2.3 | Share Transfer Restriction and Option Agreement, dated as of December 23, 1992, by and among the Company, State Street Boston Corporation, and Clarke & Tilley Limited (currently, International Financial Data Services Limited) | 10-K | 1-14036 | 2.3 | 2/28/2011 | |||||||
2.4 | Merger Agreement, dated as of July 19, 2011, by and among DST Systems, Inc., Kettle Holdings, Inc., ALPS Holdings, Inc. and LM ALPS SR LLC, on behalf of the Company Stockholders and Participating Optionholders | 8-K | 1-14036 | 2.1 | 7/21/2011 | |||||||
2.5 | Purchase Agreement, by and among DST Systems, Inc. and certain of its affiliates and Broadridge Financial Solutions, Inc. and certain of its affiliates, dated as of June 14, 2016 | 8-K | 1-14036 | 2.1 | 6/14/2016 | |||||||
(3) Articles of Incorporation and Bylaws | ||||||||||||
3.1 | Restated Certificate of Incorporation, dated May 12, 2015 | 8-K | 1-14036 | 3.3 | 5/14/2015 | |||||||
3.2 | Amended and Restated Bylaws, dated February 26, 2016 | 8-K | 1-14036 | 3.1 | 2/29/2016 | |||||||
(4) Instruments defining the rights of security holders, including indentures | ||||||||||||
4.1 | Paragraphs fourth, fifth, sixth, seventh, tenth, eleventh, and twelfth of Exhibit 3.1 | 1-14036 | ||||||||||
4.2 | Article I, Sections 1, 2, 3, 4 and 11 of Article II, Article V, Article VIII, Article IX, and Article X of Exhibit 3.2 | 1-14036 | ||||||||||
4.3 | Note Purchase Agreement, dated August 9, 2010, by and among the Company and the Purchasers named therein, and the forms of the Series A Notes, Series B Notes, Series C Notes and Series D Notes. | 8-K | 4.1 | 8/11/2010 | ||||||||
88
The Company agrees to furnish to the Commission a copy of any long-term debt agreements that do not exceed 10 percent of the total assets of the Company upon request. | ||||||||||||
Incorporated by Reference | Filed/Furnished Herewith | |||||||||||
Exhibit no. | Exhibit Description | Form | SEC File No. | Exhibit | Filing Date | |||||||
(10) Material Contracts | ||||||||||||
10.1 | Amended and Restated Joint Venture Agreement, effective October 31, 2006, between State Street Corporation and DST. Portions of this agreement have been redacted pursuant to a granted request for confidential treatment filed with the Securities and Exchange Commission pursuant to Rule 24b-2 under the Securities Exchange Act of 1934, as amended | 10-Q | 1-14036 | 10.1 | 11/9/2006 | |||||||
10.2 | Consent under Note Purchase Agreement, by and among the Company and Purchasers named therein, dated April 17, 2014 | 8-K | 1-14036 | 10.2 | 4/23/2014 | |||||||
10.3.1 | The Credit Agreement among the Company, Bank of America N.A., as Administrative Agent, Swing Line Lender and L/C Issuer, and other lenders, dated as of October 1, 2014 (“Syndicated Agreement”) | 8-K | 1-14036 | 10.1 | 10/2/2014 | |||||||
10.3.2 | First Amendment, dated June 5, 2015 to the Syndicated Agreement | 10-Q | 1-14036 | 10.4 | 8/4/2015 | |||||||
10.4 | Agreement, by and among the Company and the Argyros Group, dated January 22, 2013 | 8-K | 1-14036 | 99.2 | 1/23/2013 | |||||||
10.5 | Agreement, by and among the Company and the Argyros Group, dated March 23, 2014 | 8-K | 1-14036 | 99.2 | 3/24/2014 | |||||||
10.6 | Stock Repurchase and Offering Agreement, between the Company and the Argyros Group dated May 5, 2014 | 8-K | 1-14036 | 99.1 | 5/5/2014 | |||||||
10.7 | Governance and Standstill Agreement, between the Company and the Argyros Group dated May 5, 2014 | 8-K | 1-14036 | 99.2 | 5/5/2014 | |||||||
10.8 | Registration Rights Agreement, between the Company and the Argyros Group dated May 5, 2014 | 8-K | 1-14036 | 99.3 | 5/5/2014 | |||||||
10.9 | Amended and Restated Receivables Purchase Agreement, dated May 15, 2014, among Fountain City Finance, the Company, certain Subsidiary Originators and Wells Fargo Bank, National Association | 8-K | 1-14036 | 10.1 | 5/21/2014 | |||||||
10.10.1 | Originator Purchase Agreement, dated May 21, 2009, among the Company and certain of its subsidiaries ("Originator Purchase Agreement") | 8-K | 1-14036 | 10.2 | 5/21/2014 | |||||||
10.10.2 | First Amendment and Joinder Agreement to Originator Purchase Agreement, dated as of May 19, 2011 | 8-K | 1-14036 | 10.3 | 5/21/2014 | |||||||
10.10.3 | Second Amendment to Originator Purchase Agreement, dated as of May 17, 2012 | 8-K | 1-14036 | 10.4 | 5/21/2014 | |||||||
10.10.4 | Third Amendment and Joinder Agreement to Originator Purchase Agreement, dated as of May 16, 2013 | 8-K | 1-14036 | 10.5 | 5/21/2014 | |||||||
10.10.5 | Fourth Amendment to Originator Purchase Agreement dated as of November 26, 2014 | 10-K | 1-14036 | 10.2 | 2/26/2015 | |||||||
89
Incorporated by Reference | Filed/Furnished Herewith | |||||||||||
Exhibit no. | Exhibit Description | Form | SEC File No. | Exhibit | Filing Date | |||||||
10.11 | Purchase and Contribution Agreement, dated as of May 21, 2009, between the Company and Fountain City Finance, LLC | 8-K | 1-14036 | 10.6 | 5/21/2014 | |||||||
10.12 | First Omnibus Amendment to Transfer Documents, dated as of February 28, 2010, among Fountain City Finance, LLC, Enterprise Funding Company LLC, Bank of America, National Association, and the Company and certain of its subsidiaries | 8-K | 1-14036 | 10.7 | 5/21/2014 | |||||||
10.13.1 | Receivable Sale Agreement, dated as of November 26, 2014 by and among Wells Fargo Bank, National Association, Fountain City Finance, LLC, DST Systems, Inc. and DST Global Solutions North America Ltd. | 10-K | 1-14036 | 10.3 | 2/26/2015 | |||||||
10.13.2 | Amendment No. 1, dated May 14, 2015 to the Amended and Restated Receivable Purchase Agreement dated May 15, 2014 among Fountain City Finance, LLC, Wells Fargo Bank, N.A., DST and Certain DST subsidiaries | 8-K | 1-14036 | 10.1 | 5/15/2015 | |||||||
10.13.3 | Receivables Sale Agreement dated as of June 30, 2016, among Wells Fargo Bank, National Association; Fountain City Finance, LLC; the Company; and certain subsidiaries of the Company | 8-K | 1-14036 | 10.1 | 7/7/2016 | |||||||
Executive Compensation Plans or Arrangements | ||||||||||||
10.14 | Employment Agreement between the Company and Stephen C. Hooley, dated as of June 30, 2009 | 8-K | 1-14036 | 10.1 | 7/2/2009 | |||||||
10.15 | Employment Agreement between the Company and Randall D. Young, dated December 31, 2008 | 8-K | 1-14036 | 10.1 | 2/26/2015 | |||||||
10.16.1 | Employment Agreement, between Manoochehr Abbaei and DST Brokerage Solutions, LLC, dated April 29, 2011 | * | ||||||||||
10.16.2 | Retention Bonus Agreement, between Manoochehr Abbaei and DST Systems, Inc., dated June 14, 2016 | 8-K | 1-14036 | 10.1 | 6/24/2016 | |||||||
10.17.1 | Employment Offer, between DSTi Holdings Limited and William Slattery, dated December 23, 2016 | * | ||||||||||
10.17.2 | Terms and Conditions of Employment, between DSTi Holdings Limited and William Slattery, dated December 23, 2016 | * | ||||||||||
10.18 | Form of Indemnification Agreement for Executive Officers and Directors | 8-K | 1-14036 | 99.4 | 5/5/2014 | |||||||
10.19 | Executive Severance Plan | 10-K | 1-14036 | 10.2 | 2/27/2014 | |||||||
10.20 | DST Systems, Inc. 2015 Equity and Incentive Plan, adopted effective May 12, 2015 | 8-K | 1-14036 | 10.1 | 5/14/2015 | |||||||
10.21 | DST Systems, Inc. 2015 Directors’ Deferred Fee Plan, adopted effective May 12, 2015 | 8-K | 1-14036 | 10.2 | 8/4/2015 | |||||||
90
Incorporated by Reference | Filed/Furnished Herewith | |||||||||||
Exhibit no. | Exhibit Description | Form | SEC File No. | Exhibit | Filing Date | |||||||
10.22 | Form of Deferred Cash Award for performance year 2013 | 10-K | 1-14036 | 10.4 | 2/27/2014 | |||||||
10.23 | Form of Stock Option Award Agreement (time vesting) | 10-K | 1-14036 | 10.2 | 2/29/2012 | |||||||
10.24 | Form of Restricted Stock Unit Agreement (time vesting) for time RSU awards during 2013 | 10-K | 1-14036 | 10.2 | 3/1/2013 | |||||||
10.25 | Form of Restricted Stock Unit Agreement (time vesting) for time RSU awards after 2013 | 10-K | 1-14036 | 10.5 | 2/26/2015 | |||||||
10.26 | Form of Restricted Stock Unit Agreement (time vesting) for RSU awards after 2014 | 10-Q | 1-14036 | 10.2 | 3/31/2015 | |||||||
10.27 | Form of Performance Stock Unit Agreement for PSU awards during 2013 | 10-K | 1-14036 | 10.5 | 3/1/2013 | |||||||
10.28 | Form of Performance Stock Unit Agreement for PSU awards after 2013 | 10-K | 1-14036 | 10.6 | 2/27/2014 | |||||||
10.29 | Form of Performance Stock Unit Agreement for PSU awards after 2014 | 10-Q | 1-14036 | 10.1 | 3/31/2015 | |||||||
10.30 | Form of Performance Stock Unit Agreement for PSU awards after 2016 | 8-K | 1-14036 | 10.1 | 2/26/2016 | |||||||
(12) Statement re: Computation of Ratios | ||||||||||||
12 | Computation of Ratio of Earnings to Fixed Charges | * | ||||||||||
(21) Subsidiaries of the Company | ||||||||||||
21 | Subsidiaries of the Registrant | * | ||||||||||
(23) Consents of experts and counsel | ||||||||||||
23 | Consent of PwC | * | ||||||||||
(24) Power of Attorney | ||||||||||||
24 | Power of Attorney | * | ||||||||||
(31) and (32) Officer Certifications | ||||||||||||
31.1 | Certification of Chief Executive Officer Pursuant to Securities Exchange Act of 1934 Rule 13a-14(a) | * | ||||||||||
31.2 | Certification of Chief Financial Officer Pursuant to Securities Exchange Act of 1934 Rule 13a-14(a) | * | ||||||||||
32.0 | Certification of Chief Executive Officer and Chief Financial Officer Pursuant to 18 U.S.C. Section 1350, As Adopted Pursuant to Section 906 of the Sarbanes Oxley Act of 2002 | * | ||||||||||
91
(101) Formatted in XBRL (Extensible Business Reporting Language) | ||||||||||||
The following financial information from DST’s Annual Report on Form 10-K for the period ended December 31, 2016, filed with the SEC on February 28, 2017, formatted in Extensible Business Reporting Language (“XBRL”): (i) the Consolidated Statement of Income for the years ended December 31, 2016, 2015 and 2014, (ii) the Consolidated Balance Sheet at December 31, 2016 and 2015, (iii) the Consolidated Statement of Other Comprehensive Income for the years ended December 31, 2016, 2015 and 2014, (iv) the Consolidated Statement of Changes in Stockholders’ Equity for the years ended December 31, 2016, 2015 and 2014, (v) the Consolidated Statement of Cash Flows for the years ended December 31, 2016, 2015 and 2014, and (vi) Notes to Consolidated Financial Statements. | ||||||||||||
92