Attached files
UNITED STATES
SECURITIES AND EXCHANGE COMMISSION
WASHINGTON, D.C. 20549
FORM 10-K
(Mark One)
|
x
|
ANNUAL REPORT PURSUANT TO SECTION 13 OR 15(d) OF THE SECURITIES EXCHANGE ACT OF 1934
|
| For the fiscal year ended December 31, 2016 |
OR
|
¨
|
TRANSITION REPORT PURSUANT TO SECTION 13 OR 15(d) OF THE SECURITIES EXCHANGE ACT OF 1934
|
| For the transition period from N/A to |
Commission file number 1-10959
CALATLANTIC GROUP, INC.
(Exact name of registrant as specified in its charter)
|
Delaware
|
33-0475989
|
|
(State or other jurisdiction of
incorporation or organization)
|
(I.R.S. Employer
Identification No.)
|
1100 Wilson Boulevard, #2100, Arlington, Virginia 22209
(Address of principal executive offices, including zip code)
(240) 532-3806
(Registrant’s telephone number, including area code)
Securities registered pursuant to Section 12(b) of the Act:
|
Title of each class
|
Name of each exchange on which registered
|
|
|
Common Stock, $0.01 par value
(and accompanying Preferred Share Purchase Rights)
|
New York Stock Exchange
|
|
|
6¼% Senior Notes due 2021
(and related guarantees)
|
New York Stock Exchange
|
Securities registered pursuant to Section 12(g) of the Act:
None
Indicate by check mark if the registrant is a well-known seasoned issuer, as defined in Rule 405 of the Securities Act. Yes x No ¨
Indicate by check mark if the registrant is not required to file reports pursuant to Section 13 or Section 15(d) of the Act. Yes ¨ No x
Indicate by check mark whether the registrant (1) has filed all reports required to be filed by Section 13 or 15(d) of the Securities Exchange Act of 1934 during the preceding 12 months (or for such shorter period that the registrant was required to file such reports), and (2) has been subject to such filing requirements for the past 90 days. Yes x No ¨
Indicate by check mark whether the registrant has submitted electronically and posted on its corporate Website, if any, every Interactive Data File required to be submitted and posted pursuant to Rule 405 of Regulation S-T (§ 232.405 of this chapter) during the preceding 12 months (or for such shorter period that the registrant was required to submit and post such files). Yes x No o
Indicate by check mark if disclosure of delinquent filers pursuant to Item 405 of Regulation S-K (§229.405) is not contained herein, and will not be contained, to the best of the registrant’s knowledge, in definitive proxy or information statements incorporated by reference in Part III of this Form 10-K or any amendment to this Form 10-K. ¨
Indicate by check mark whether the registrant is a large accelerated filer, an accelerated filer, a non-accelerated filer, or a smaller reporting company. See the definitions of “large accelerated filer,” “accelerated filer” and “smaller reporting company” in Rule 12b-2 of the Exchange Act (check one):
|
Large accelerated filer x
|
Accelerated filer ¨
|
|
Non-accelerated filer ¨ (Do not check if a smaller reporting company)
|
Smaller reporting company ¨
|
Indicate by check mark whether the registrant is a shell company (as defined in Rule 12b-2 of the Act). Yes ¨ No x
The aggregate market value of the common equity held by non-affiliates computed by reference to the price at which the common equity was last sold as of the last business day of the registrant’s most recently completed second fiscal quarter was $2,721,565,562.
As of February 24, 2017, there were 114,472,916 shares of the registrant’s common stock outstanding.
Documents incorporated by reference:
Portions of the registrant’s Definitive Proxy Statement to be filed with the Securities and Exchange Commission in connection with the registrant’s 2017 Annual Meeting of Stockholders are incorporated by reference into Part III hereof.
CALATLANTIC GROUP, INC.
|
Page No.
|
||
|
PART I
|
||
|
Item 1.
|
1
|
|
|
Item 1A.
|
6
|
|
|
Item 1B.
|
14
|
|
|
Item 2.
|
14
|
|
|
Item 3.
|
15
|
|
|
Item 4.
|
15
|
|
|
PART II
|
||
|
Item 5.
|
16
|
|
|
Item 6.
|
18
|
|
|
Item 7.
|
19
|
|
|
Item 7A.
|
38
|
|
|
Item 8.
|
40
|
|
|
Item 9.
|
82
|
|
|
Item 9A.
|
82
|
|
|
Item 9B.
|
84
|
|
|
PART III
|
||
|
Item 10.
|
84
|
|
|
Item 11.
|
84
|
|
|
Item 12.
|
84
|
|
|
Item 13.
|
84
|
|
|
Item 14.
|
84
|
|
|
PART IV
|
||
|
Item 15.
|
85
|
|
| Item 16. | Form 10-K Summary | 85 |
i
FORWARD-LOOKING STATEMENTS
This report contains "forward-looking statements" within the meaning of the Private Securities Litigation Reform Act of 1995, Section 27A of the Securities Act of 1933, as amended, and Section 21E of the Securities Exchange Act of 1934, as amended. In addition, other statements we may make from time to time, such as press releases, oral statements made by Company officials and other reports we file with the Securities and Exchange Commission, may also contain such forward-looking statements. Forward-looking statements in this report include, but are not limited to, statements regarding:
|
·
|
our strategy;
|
|
·
|
our plans to continue to use significant portions of our cash resources to make substantial investments in land and the source of funds for such investments;
|
|
·
|
our plans to invest in larger land parcels;
|
|
·
|
the strength of our land pipeline;
|
|
·
|
our plans to maintain a supply of speculative homes in each community;
|
|
·
|
housing market conditions and trends in the geographic markets in which we operate;
|
|
·
|
the impact of future market rate risks on our financial assets and borrowings;
|
|
·
|
our expectation to convert year-end backlog in 2017;
|
|
·
|
the sufficiency of our warranty and other reserves;
|
|
·
|
trends in new home deliveries, orders, backlog, home pricing, leverage and gross margins;
|
|
·
|
the sufficiency of our liquidity to implement our strategy and our ability to access additional capital and refinance existing indebtedness;
|
|
·
|
litigation outcomes and related costs;
|
|
·
|
plans to purchase our notes prior to maturity and to engage in debt exchange transactions;
|
|
·
|
the effect of seasonal trends;
|
|
·
|
our ability to realize the value of our deferred tax assets and the timing relating thereto;
|
|
·
|
our plans to enhance revenue while maintaining an appropriate sales pace;
|
|
·
|
that we may acquire other homebuilders;
|
|
·
|
the market rate risks relating to our debt and investments;
|
|
·
|
our plans to concentrate operations and capital in growing markets;
|
|
·
|
amounts remaining to complete relating to existing surety bonds; and
|
|
·
|
the impact of recent accounting standards.
|
Forward-looking statements are based on our current expectations or beliefs regarding future events or circumstances, and you should not place undue reliance on these statements. Such statements involve known and unknown risks, uncertainties, assumptions and other factors—many of which are out of our control and difficult to forecast—that may cause actual results to differ materially from those that may be described or implied. Such factors include, but are not limited to, the risks described in this Annual Report under the heading "Risk Factors," which are incorporated by reference herein.
Except as required by law, we assume no, and hereby disclaim any, obligation to update any of the foregoing or any other forward-looking statements. We nonetheless reserve the right to make such updates from time to time by press release, periodic report or other method of public disclosure without the need for specific reference to this report. No such update shall be deemed to indicate that other statements not addressed by such update remain correct or create an obligation to provide any other updates.
ii
CALATLANTIC GROUP, INC.
PART I
CalAtlantic Group, Inc. builds well-crafted homes in thoughtfully designed communities that meet the desires of customers across the homebuilding spectrum, from entry level to luxury, in over 40 metropolitan statistical areas spanning 17 states. Also providing mortgage, title and escrow services, we are focused on providing an exceptional end-to-end homebuying experience for our customers. For the years ended December 31, 2016, 2015 and 2014 Homebuilding Revenue (consisting of home and land sales revenues) accounted for over 98% of our consolidated total revenue.
The Company's homebuilding operations are divided into four regions: North, Southeast, Southwest and West, consisting of the following metropolitan areas at December 31, 2016:
| North |
Atlanta, Baltimore, Chicago, Delaware, Indianapolis, Metro Washington D.C., Minneapolis/St. Paul, New Jersey, Northern Virginia and Philadelphia
|
| Southeast |
Charleston, Charlotte, Jacksonville, Orlando, Raleigh, South Florida, Tampa and Myrtle Beach
|
| Southwest |
Austin, Dallas, Denver, Houston, Las Vegas and San Antonio
|
| West |
Bay Area (Northern California), Inland Empire (Southern California), Phoenix, Sacramento, San Diego and Southern California Coastal
|
The percentage of our homes delivered by region and product mix for the year ended December 31, 2016 were as follows:
|
Region
|
Percentage of
Deliveries
|
|
|
North
|
21%
|
|
|
Southeast
|
28
|
|
|
Southwest
|
28
|
|
|
West
|
23
|
|
|
Total
|
100%
|
|
Product Mix
|
Percentage of
Deliveries
|
|
|
Move-up / Luxury / Active Adult
|
78%
|
|
|
Entry level
|
22
|
|
|
Total
|
100%
|
The average selling prices of our homes delivered by region for the year ended December 31, 2016 were as follows:
|
Region
|
Average
Selling
Price
|
|
|
(Dollars in thousands)
|
||
|
North
|
$335
|
|
|
Southeast
|
$386
|
|
|
Southwest
|
$426
|
|
|
West
|
$649
|
|
|
Total
|
$447
|
Dollar Value of Backlog
The dollar value of our backlog as of December 31, 2016 was $2.7 billion, or 5,817 homes. We expect all of our backlog at December 31, 2016 to be converted to deliveries and revenues during 2017, net of cancellations.
Homebuilding Operations
With a trusted reputation for quality craftsmanship, exceptional architectural design and an outstanding customer experience earned over our 51 year history, we utilize our five decades of land acquisition, development and homebuilding expertise to acquire and build desirable communities in locations that meet the high expectations of our homebuyers. Our homes sizes typically range from approximately 1,500 to 3,500 square feet, although we have built homes from 1,100 to over 6,000 square feet. The sales prices of our homes generally range from approximately $165,000 to over $2 million. At December 31, 2016, we owned or controlled 65,424 homesites (including joint ventures) and had 583 active selling communities. For the year ended December 31, 2016, approximately 85% of our deliveries were single-family detached homes. The remainder of our deliveries were single-family attached homes, generally townhomes and condominiums configured with eight or fewer units per building.
We customize our home designs to meet the specific needs of each particular market and its customers' preferences. These preferences are reflected in every aspect of our community sales and marketing, including community locations and amenities, exterior styles, and model home merchandising. We also offer structural and design options that allow customers to personalize their home to meet their needs and desires.
Financial Services Operations
We have a mortgage financing subsidiary that provided financing to 57% of our homebuyers who chose to finance their home purchases during 2016. We also have a title subsidiary that provides title examination and other title and escrow related services and an insurance subsidiary that provides homeowners' and other insurance products to homebuyers in certain of our markets. Staffed by a team of professionals experienced in the new home purchase process and our sales and escrow procedures, our financial services operations benefit our homebuyers by offering a dependable source of competitively priced financial services that are seamlessly integrated into our home sales and close process. Each of these businesses complement our homebuilding operations by making the timing of our new home deliveries more predictable. We sell substantially all of the loans we originate in the secondary mortgage market.
Strategy
Through the October 1, 2015 combination of Standard Pacific Homes and Ryland Homes to form CalAtlantic Group, Inc., we gained what we believe is important geographic and product diversification, expanding our reach and enhancing our growth prospects in the entry level, move-up and luxury market segments. While our homes span the price point spectrum, we intend to continue to focus the operations in most of our markets on serving the needs of the move-up homebuyers who we believe are more likely to value and pay for the quality construction and customer service experience that are the hallmarks of our legacy brands.
Our strategy includes the following elements:
|
·
|
acquire land in desirable locations at acceptable prices;
|
|
·
|
leverage our land acquisition and master plan development expertise and reputation to garner an advantage in the competitive market for highly sought after locations;
|
|
·
|
construct well built, innovatively designed, and energy efficient homes that cater to the way people live today and that are the preferred choice of homebuyers, from entry level through luxury;
|
|
·
|
provide an exceptional customer experience;
|
|
·
|
optimize the size of our business in each of our markets to appropriately leverage operating efficiencies;
|
|
·
|
maintain a cost structure that positions us for near and long-term profitability;
|
|
·
|
seek opportunities to enhance revenue while maintaining an appropriate sales pace; and
|
|
·
|
concentrate operations and invested capital in anticipated growth markets.
|
Marketing and Sales
Our homes are marketed through a variety of channels, including through individual communities where new homes are sold by local sales teams. At the community level, home shoppers have the opportunity to experience fully-furnished and landscaped model homes that demonstrate the livability of our floorplans. Our forward-thinking architectural philosophy is a key differentiator in marketing to the homebuyers we target. We closely examine buyer preferences communicated to our sales team and through buyer surveys. This research, coupled with the skilled expertise of architects who have both domestic and international experience, provides our homebuyer thoughtful solutions that cater to the way people live today through innovative ideas and practical conveniences.
Many buyers begin or supplement their buying process via online research, which allows us to engage and inform them through a robust website and a wide array of digital marketing initiatives. Brokers and real estate professionals are a viable extension of our sales team and we market to them directly.
Our homes are sold pursuant to written sales contracts that usually require the homebuyer to make a cash deposit. We sell both pre-built and to-be-built homes. The majority of our homebuyers have the opportunity to purchase various optional amenities and upgrades such as prewiring and electrical options, upgraded flooring, cabinets, finished carpentry and countertops, varied interior and exterior color schemes, additional and upgraded appliances, and some alternative room configurations. Purchasers are typically permitted for a limited time to cancel their contracts if they fail to qualify for financing. In some cases, purchasers are also permitted to cancel their contract if they are unable to sell their existing homes or if certain other conditions are not met. A buyer's liability to us for wrongfully terminating a sales contract is typically limited to the forfeiture of the buyer's cash deposit to the Company, although some states provide for more limited remedies.
Development and Construction
We customarily acquire unimproved or improved land zoned for residential use. To control larger land parcels or gain access to highly desirable parcels, we sometimes form land development joint ventures with third parties that provide us the right to acquire from the joint venture a portion of the lots when developed. If we purchase raw land or partially developed land, we will perform development work that may include negotiating with governmental agencies and local communities to obtain any necessary zoning, environmental and other regulatory approvals and permits, and constructing, as necessary, roads, water, sewer and drainage systems and recreational facilities like parks, community centers, pools, and hiking and biking trails. With our long California heritage of creating master planned communities, we have expertise and experience in handling complex development opportunities.
We act as a general contractor with our supervisory employees coordinating most of the development and construction work on a project. Independent architectural design, engineering and other consulting firms are generally engaged on a project-by-project basis to assist in project planning and community and home design, and subcontractors are engaged to perform all of the physical development and construction work. Although the construction time for our homes varies from project to project depending on geographic region, the time of year, the size and complexity of the homes, local labor situations, the governmental approval processes, availability of materials and supplies, and other factors, we typically complete the construction of a home in approximately four to six months, with a current average cycle time of approximately five months.
Sources and Availability of Raw Materials
We, either directly or indirectly through our subcontractors, purchase drywall, cement, steel, lumber, insulation and the other building materials necessary to construct a home. While these materials are generally widely available from a variety of sources, from time to time we experience serious material shortages on a localized basis, particularly during periods where the regions in which we operate experience natural disasters that have a significant impact on existing residential and commercial structures and during periods of robust sales activity when there is high demand for construction materials. During these periods, the prices for these materials can substantially increase and our construction process can be slowed.
Seasonality and Longer Term Cycles
Our homebuilding operations have historically experienced seasonal fluctuations. We typically experience the highest new home order activity in the spring and summer months, although new order activity is highly dependent on the number of active selling communities and the timing of new community openings as well as other market factors. Because it typically takes us four to six months to construct a new home, we typically deliver a greater number of homes in the second half of the calendar year as spring and early summer orders are converted to home deliveries. As a result, our revenues and cash flows
(exclusive of the amount and timing of land purchases) from homebuilding operations are generally higher in the second half of the calendar year, particularly in the fourth quarter.
Our homebuilding operations are also subject to longer term business cycles, the magnitude, duration, beginning and ending of which are difficult to predict. At the high point of this business cycle, the demand for new homes and new home prices are at their peak. Land prices also tend to be at their peak in this phase of the cycle. At the low point in the cycle, the demand for homes is weak and land prices tend to be more favorable. While difficult to accomplish, our goal is to deliver as many homes as possible near the top of the cycle and to make significant investments in land at the bottom of the cycle.
We believe we were at or near the bottom of the current cycle for the several years prior to 2012 and, as such, made substantial investments in land. We plan to continue to make substantial investments in land, which is likely to utilize a significant portion of our cash resources, so long as we believe that such investments will yield results that meet our investment criteria.
Competitive Conditions in the Business
The homebuilding industry is fragmented and highly competitive. We compete with numerous other residential construction companies, including large national and regional firms, for customers, land, financing, raw materials, skilled labor, and employees. We compete for customers primarily on the basis of home design and location, price, customer satisfaction, construction quality, reputation, and the availability of mortgage financing. While we compete with other residential construction companies for customers, we also compete with resales of existing homes and rental properties.
Financing
We typically use both our equity (including internally generated funds from operations and proceeds from equity offerings and the exercise of stock options) and debt financing in the form of bank debt and note offerings, to fund land acquisition and development and construction of our properties. To a lesser extent, we use seller financing to fund the acquisition of land and, in some markets, community facility district or other similar assessment district bond financing is used to fund community infrastructure such as roads, water and sewers.
We also utilize joint ventures and option arrangements with land sellers, other builders and developers as a means of accessing lot positions, expanding our market opportunities, establishing strategic alliances, leveraging our capital base and managing the financial and market risk associated with land holdings. In addition to equity contributions made by us and our partners, our joint ventures may obtain secured project specific financing to fund the acquisition of land and development and construction costs. For more detailed discussion of our current joint venture arrangements please see "Management's Discussion and Analysis of Financial Condition and Results of Operations—Off-Balance Sheet Arrangements".
Government Regulation
For a discussion of the impact of government regulations on our business, including the impact of environmental regulations, please see the risk factors included under the heading "Regulatory Risks" in the Risk Factors section.
Financial Services
Customer Financing
As part of our ongoing operations, we provide mortgage loans to many of our homebuyers through our mortgage financing subsidiary, CalAtlantic Mortgage. Our mortgage subsidiary's principal sources of revenue are fees generated from loan originations, net gains on the sale of loans and net interest income earned on loans during the period we hold them prior to sale. In addition to being a source of revenues, our mortgage operations benefit our homebuyers and complement our homebuilding operations by offering a dependable source of competitively priced financing, staffed by a team of professionals experienced in the new home purchase process and our sales and escrow procedures, all of which help to make our new home deliveries more predictable.
We sell substantially all of the loans we originate in the secondary mortgage market, with servicing rights released on a non-recourse basis. These sales are generally subject to our obligation to repay the gain on sale if the loan is prepaid by the borrower within a certain time period following such sale, or to repurchase the loan if, among other things, the loan
purchaser's underwriting guidelines are not met or there is fraud in connection with the loan. We record reserves for loan- related claims when we determine it is appropriate to do so.
For a portion of our loan originations, we manage the interest rate risk associated with making loan commitments to our customers and holding loans for sale by preselling loans. Preselling loans consists of obtaining commitments (subject to certain conditions) from third party investors to purchase the mortgage loans while concurrently extending interest rate locks to loan applicants. Before completing the sale to these investors, our mortgage subsidiary finances these loans under its mortgage credit facilities for a short period of time (typically for 30 to 45 days), while the investors complete their administrative review of the applicable loan documents.
We also originate a portion of our mortgage loans on a non-presold basis. When originating mortgage loans on a non-presold basis, we lock interest rates with our customers and fund loans prior to obtaining purchase commitments from third party investors, thereby creating interest rate risk. To hedge this interest rate risk, our mortgage subsidiary enters into forward sale commitments of mortgage-backed securities. Loans originated in this manner are typically held by our mortgage subsidiary and financed under its mortgage credit facilities for a short period of time (typically for 30 to 45 days) before the loans are sold to third party investors. Our mortgage subsidiary utilizes third party hedging software to assist with the execution of its hedging strategy for loans originated on a non-presold basis.
While preselling loans and our hedging strategy is designed to reduce our risk, our hedging strategy instruments involve elements of market risk related to fluctuations in interest rates that could result in losses on loans originated in this manner and we remain subject to risk relating to purchaser non-performance, particularly during periods of significant market turmoil.
Title, Escrow and Insurance Services
Our title, escrow and insurance subsidiaries provide title, escrow and insurance services to homebuyers in many of our markets. We are in the process of expanding this business and, consequently, the level of title, escrow and insurance services we currently provide in any particular market vary, ranging from full title, escrow and insurance services in certain geographies to limited title examination services in others.
Employees
At December 31, 2016, we had approximately 3,055 employees, up from approximately 2,850 employees at the prior year end. Of our employees at the end of 2016, approximately 650 were executive, administrative and clerical personnel, 1,100 were sales and marketing personnel, 815 were involved in construction and project management, 175 were involved in new home warranty, and 315 worked in the financial services operations. None of our employees are covered by collective bargaining agreements, although employees of some of the subcontractors that we use are represented by labor unions and may be subject to collective bargaining agreements. We believe that our relations with our employees and subcontractors are good.
Business Segment Financial Data
For business segment financial data, please see "Management's Discussion and Analysis of Financial Condition and Results of Operations", as well as Note 4 to our consolidated financial statements.
Availability of Reports
This annual report on Form 10-K and each of our quarterly reports on Form 10-Q and current reports on Form 8-K, including any amendments, are available free of charge on our website, www.calatlantichomes.com, as soon as reasonably practicable after such material is electronically filed with, or furnished to, the Securities and Exchange Commission ("SEC"). The information contained on our website is not incorporated by reference into this report and should not be considered part of this report. In addition, the SEC website contains reports, proxy and information statements, and other information about us at www.sec.gov.
Company Information
In connection with our October 1, 2015 merger with The Ryland Group, Inc. ("Ryland"), we changed our name from Standard Pacific Corp. to CalAtlantic Group, Inc. We were incorporated in the State of Delaware in 1991 and our common
stock is listed on the New York Stock Exchange (NYSE: CAA). Through our predecessors, we commenced our homebuilding operations in 1965. Our principal executive offices are located at 1100 Wilson Boulevard, #2100, Arlington, Virginia 22209. Unless the context otherwise requires, the terms "we," "us," "our" and "the Company" refer to CalAtlantic Group, Inc. and its predecessors and subsidiaries.
The discussion of our business and operations included in this annual report on Form 10-K should be read together with the risk factors set forth below. They describe various risks and uncertainties to which we are or may become subject. These risks and uncertainties, as well as other risks which we cannot foresee at this time, have the potential to affect our business, financial condition, results of operations, cash flows, strategies and prospects in a material and adverse manner.
Market and Economic Risks
Adverse economic conditions negatively impact the demand for homes. A negative change in economic conditions could have adverse effects on our operating results and financial condition.
The homebuilding industry is sensitive to changes in economic conditions such as the level of employment, consumer confidence, consumer income, availability of financing and interest rate levels. From approximately 2007 to 2011, the national recession, credit market disruption, high unemployment levels, absence of home price stability, and decreased availability of mortgage financing, among other factors, adversely impacted the homebuilding industry and our operations and financial condition. Although the housing market has recovered in most of the geographies in which we operate, if market conditions deteriorate, our results of operations and financial condition could be adversely impacted.
The market value and availability of land may fluctuate significantly, which could decrease the value of our developed and undeveloped land holdings and limit our ability to develop new communities.
The risk of owning developed and undeveloped land can be substantial for us. Our strategy calls for us to continue to invest a substantial portion of our cash in land. The market value of the undeveloped land, buildable lots and housing inventories we hold can fluctuate significantly as a result of changing economic and market conditions. During the national recession, we experienced negative economic and market conditions that resulted in the impairment of a significant number of our land positions and write-offs of some of our land option deposits. If economic or market conditions deteriorate in the future, we may have to impair our land holdings and projects, write down our investments in unconsolidated joint ventures, write off option deposits, sell homes or land at a loss, and/or hold land or homes in inventory longer than planned. In addition, inventory carrying costs (such as property taxes and interest) can be significant, particularly if inventory must be held for longer than planned, which can trigger asset impairments in poorly performing projects or markets. As we increase the amount of land we hold, we also increase our exposure to the risks associated with owning land, which means that if economic and market conditions were to deteriorate, it could have a significantly greater adverse impact on our financial condition.
Our long-term success also depends upon the continued availability of suitable land at acceptable prices. The availability of land for purchase at acceptable prices depends on a number of factors outside of our control, including the risk of competitive over-bidding of land prices and restrictive governmental regulation. If a sufficient amount of suitable land opportunities do not become available, it could limit our ability to develop new communities, increase our land costs and negatively impact our sales and earnings.
Customers may be unwilling or unable to purchase our homes at times when mortgage-financing costs are high or when credit is difficult to obtain.
The majority of our homebuyers finance their new home purchase. In general, housing demand is adversely affected by increases in interest rates and by decreases in the availability of mortgage financing. Interest rates have been at historic lows for the last 7 years and, Corelogic, an aggregator of mortgage data, estimates that 66% of homeowners have mortgages with rates at or below 4.5%. With mortgage rates widely anticipated to increase over the next several years, it is possible that homeowners with low interest rate mortgages may choose to remain in their current homes rather than purchase a new home in a higher interest rate environment. In addition, underwriting standards remain tight, with lenders requiring high credit scores, substantial down payments and cash reserves, and the availability of subprime and other alternative mortgage products, which are important to sales in many of our markets, remains limited. The availability of mortgage financing is also affected by changes in liquidity in the secondary mortgage market and the market for mortgage-backed securities, which are directly impacted by the federal government's decisions regarding its financial support of the Federal National Mortgage Association and the Federal Home Loan Mortgage Corporation, the entities that provide liquidity to the secondary market. If
the availability and cost of mortgage financing deteriorates, the ability and willingness of prospective buyers to finance home purchases or to sell their existing homes could be adversely affected, which could adversely affect our operating results and profitability.
The homebuilding industry is competitive and the business practices of homebuilders and other home sellers have the potential to negatively impact our sales and earnings.
The homebuilding industry is fragmented and highly competitive. We compete with numerous other residential construction companies, including large national and regional firms, for customers, land, financing, raw materials, skilled labor and employees. Several of our larger competitors, because of their scale, may have lower costs of capital, labor, materials and overhead. We compete for customers primarily on the basis of home design and location, price, customer satisfaction, construction quality, reputation, and the availability of mortgage financing. We also compete with resales of existing homes and rental properties. Decisions made by competitors to reduce home sales prices and/or increase the use of sales incentives (which may be easier to do for larger competitors with lower cost structures or necessary for distressed sellers) may require us to do the same to maintain our sales pace, which will harm our financial results.
Labor and material shortages and price fluctuations could delay or increase the cost of home construction and reduce our sales and earnings.
The residential construction industry experiences serious labor and material shortages from time to time, including shortages in qualified tradespeople, and supplies of insulation, drywall, cement, steel and lumber. These labor and material shortages can be more severe during periods of strong demand for housing or during periods where the regions in which we operate experience natural disasters that have a significant impact on existing residential and commercial structures. The cost of material may also be adversely affected during periods of shortage or high inflation. The cost of labor may be adversely affected by shortages of qualified tradespeople such as carpenters, roofers, electricians and plumbers, changes in laws relating to union activity and changes in immigration laws and trends in labor migration. During the national recession, a large number of qualified tradespeople went out of business or otherwise exited our markets. The reduction in available tradespeople is currently exacerbating labor shortages as demand for new housing has increased. From time to time, we have experienced volatile price swings in the cost of labor and materials, including in particular the cost of lumber, cement, steel and drywall. Shortages and price increases could cause delays in and increase our costs of home construction, which in turn could harm our operating results and profitability.
We may be unable to obtain suitable bonding for the development of our communities.
We are often required to provide bonds to governmental authorities and others to ensure the completion of our projects. If we are unable to obtain the required surety or performance bonds for our projects, our business operations and revenues could be adversely affected. From time to time, when market conditions become unfavorable, surety providers become reluctant to issue new bonds and some providers request credit enhancements (such as cash deposits or letters of credit) in order to maintain existing bonds or to issue new bonds. If we are unable to obtain required bonds in the future, or are required to provide credit enhancements with respect to our current or future bonds, our liquidity could be negatively impacted.
High cancellation rates may negatively impact our business.
In connection with the sale of a home we collect a deposit from the homebuyer that is a small percentage of the total purchase price. The deposit may, in certain circumstances, be fully or partially refundable to our homebuyer prior to closing, depending on, among other things, the laws of the state in which the home is located. If the prices for our homes in a given community decline, competitors increase sales incentives, interest rates increase, the availability of mortgage financing tightens or a buyer experiences a change in their personal finances, they may have an incentive to cancel their home purchase contracts with us, even where they might be entitled to no refund or only a partial refund of this deposit. Significant cancellations could have a material adverse effect on our business.
Operational Risks
Our longer-term land acquisition strategy poses significant risks.
From time-to-time, we purchase land parcels with longer-term time horizons when we believe market conditions provide an opportunity to purchase this land at acceptable prices. We plan to continue to invest a substantial portion of our cash in land, including in larger land parcels with longer holding periods that will require significant development activities. This strategy is subject to a number of risks. It is difficult to accurately forecast development costs and sales prices the longer the time horizon for a project and, with a longer time horizon, there is a greater chance that unanticipated
development cost increases, changes in general market conditions and other adverse unanticipated changes could negatively impact the profitability of a project. In addition, larger land parcels are generally undeveloped and typically do not have all (or sometimes any) of the governmental approvals necessary to develop and construct homes. If we are unable to obtain these approvals or obtain approvals that restrict our ability to use the land in ways we do not anticipate, the value of the parcel will be negatively impacted. In addition, the acquisition of land with a longer term development horizon historically has not been a significant focus of our business in many of our markets and may therefore be subject to greater execution risk.
Severe weather, other natural conditions or disasters and climate change may disrupt or delay construction.
Severe weather and other natural conditions or disasters, such as earthquakes, landslides, hurricanes, tornadoes, droughts, floods, heavy or prolonged rain or snow, and wildfires can negatively affect our operations by requiring us to delay or halt construction or to perform potentially costly repairs to our projects under construction and to unsold homes. Some conditions, like the severe drought California has experienced over the last several years, may cause state and local governments to take restrictive actions, including placing moratoriums on the issuance of building permits or the connection of new water meters, which may effectively halt new construction. Finally, many scientists believe that the rising level of carbon dioxide in the atmosphere is leading to climate change and that climate change is increasing the frequency and severity of weather related disasters. If true, we may experience increasing negative weather related impacts to our operations in the future.
We are subject to product liability and warranty claims arising in the ordinary course of business, which can be costly.
As a homebuilder, we are subject to construction defect and home warranty claims arising in the ordinary course of business. These claims are common in the homebuilding industry and can be costly. While we maintain product liability insurance and generally seek to require our subcontractors and design professionals to indemnify us for some portion of the liabilities arising from their work, there can be no assurance that these insurance rights and indemnities will be collectable or adequate to cover any or all construction defect and warranty claims for which we may be liable. For example, contractual indemnities can be difficult to enforce, we are often responsible for applicable self-insured retentions (particularly in markets where we include our subcontractors on our general liability insurance and as a result our ability to seek indemnity for insured claims is significantly limited or nonexistent), certain claims may not be covered by insurance or may exceed applicable coverage limits, and one or more of our insurance carriers could become insolvent. Additionally, the coverage offered by and availability of product liability insurance for construction defects is limited and costly. There can be no assurance that coverage will not be further restricted, become more costly or even unavailable.
In addition, we conduct a material portion of our business in California, one of the most highly regulated and litigious jurisdictions in the United States, which imposes a ten year, strict liability tail on most construction liability claims. As a result, our potential losses and expenses due to litigation, new laws and regulations may be greater than our competitors who have smaller California operations.
A major safety incident relating to our business could be costly in terms of potential liabilities and reputational damage.
Building sites are inherently dangerous, and operating in the homebuilding industry poses certain inherent health and safety risks. Due to health and safety regulatory requirements and the number of projects we own, health and safety performance is critical to the success of all areas of our business. Any failure in health and safety performance may result in penalties for non-compliance with relevant regulatory requirements, and a failure that results in a major or significant health and safety incident or injury could expose us to liability that could be costly. Such a failure could generate significant negative publicity and have a corresponding impact on our reputation, our relationships with relevant regulatory agencies or governmental authorities, and our ability to attract customers, which in turn could have a material adverse effect on our business, financial condition and operating results.
We rely on subcontractors to construct our homes and, in many cases, to obtain, building materials. The failure of our subcontractors to properly construct our homes, or to obtain suitable building materials, may be costly.
We engage subcontractors to perform the actual construction of our homes, and in many cases, to obtain the necessary building materials. Despite our quality control efforts, we may discover that our subcontractors were engaging in improper construction practices or installing defective materials in our homes. When we discover these issues we repair the homes in accordance with our new home warranty standards and as required by law. The cost of satisfying our warranty and other legal obligations in these instances may be significant and we may be unable to recover the cost of repair from subcontractors, suppliers and insurers.
Our mortgage subsidiary may become obligated to repurchase loans it has sold in the secondary mortgage market or may become subject to borrower lawsuits.
While our mortgage subsidiary generally sells the loans it originates within a short period of time in the secondary mortgage market on a non-recourse basis, this sale is subject to an obligation that we repurchase the loan or make a "make-whole" payment if, among other things, the purchaser's underwriting guidelines are not met or there is fraud in connection with the loan. It is possible that our mortgage subsidiary will be required to fund make-whole payments and/or repurchase loans as the holders of defaulted loans scrutinize loan files to seek reasons to require us to do so. Further, future make-whole payments could have a higher severity than those previously experienced. In such cases our current reserves might prove to be inadequate and we would be required to use additional cash and take additional charges to reflect the higher level of repurchase and make-whole activity, which could harm our financial condition and results of operations.
We are dependent on the services of key employees and the loss of any substantial number of these individuals or an inability to hire additional personnel could adversely affect us.
Our success is dependent upon our ability to attract and retain skilled employees, including personnel with significant management and leadership skills. Competition for the services of these individuals in many of our operating markets can be intense and has increased as market conditions have improved. If we are unable to attract and retain skilled employees, we may be unable to accomplish the objectives set forth in our business plan.
We may not be able to successfully identify, complete and integrate acquisitions, which could harm our profitability and divert management resources.
We may from time to time acquire other homebuilders or related businesses. Successful acquisitions require us to correctly identify appropriate acquisition candidates and to integrate acquired operations and management with our own. Should we make an error in judgment when identifying an acquisition candidate, should the acquired operations not perform as anticipated, or should we fail to successfully integrate acquired operations and management, we will likely fail to realize the benefits we intended to derive from the acquisition and may suffer other adverse consequences. Acquisitions involve a number of other risks, including the diversion of the attention of our management and corporate staff from operating our existing business, potential charges to earnings in the event of any write-down or write-off of goodwill and other assets recorded in connection with acquisitions and exposure to the acquired company's pre-existing liabilities. We can give no assurance that we will be able to successfully identify, complete and integrate acquisitions.
Our failure to maintain the security of our electronic and other confidential information could expose us to liability and materially adversely affect our financial condition and results of operations; Information technology failures could harm the Company's business
Privacy, security, and compliance concerns have continued to increase as technology has evolved. As part of our normal business activities, we collect and store certain confidential information, including personal information of homebuyers/borrowers and information about employees, vendors and suppliers. This information is entitled to protection under a number of regulatory regimes. We may share some of this information with vendors who assist us with certain aspects of our business, particularly our mortgage and title businesses. Our failure to maintain the security of the data which we are required to protect, including via the penetration of our network security and the misappropriation of confidential and personal information, could result in business disruption, damage to our reputation, financial obligations to third parties, fines, penalties, regulatory proceedings and private litigation with potentially large costs, and also result in deterioration in customers confidence in us and other competitive disadvantages, and thus could have a material adverse impact on our financial condition and results of operations.
In addition, our information technology systems are dependent upon global communications providers, Web browsers, telephone systems and other aspects of the Internet infrastructure that have experienced significant systems failures and electrical outages in the past. While we take measures to ensure our major systems have redundant capabilities, our systems are susceptible to outages from fire, floods, power loss, telecommunications failures, break-ins, cyber attacks and similar events. Despite our implementation of network security measures, our servers are vulnerable to computer viruses, break-ins and similar disruptions resulting from unauthorized tampering with our computer systems. The occurrence of any of these events could materially or even entirely disrupt or damage our information technology systems and hamper our internal operations, our ability to provide services to our customers and the ability of our customers to access our information technology systems. A material network breach in the security of our information technology systems could include the theft of our intellectual property or trade secrets. As a result, we may be required to incur significant costs to protect against damage caused by these disruptions or security breaches in the future.
Negative publicity could adversely affect our reputation and our business, financial results and stock price.
Unfavorable media related to our industry, company, brand, personnel, operations, business performance, or prospects may impact our stock price and the performance of our business, regardless of its accuracy or inaccuracy. The speed at which negative publicity is disseminated has increased dramatically through the use of electronic communication, including social media outlets, websites, and blogs. Our success in maintaining and expanding our brand image depends on our ability to adapt to this rapidly changing media environment. Adverse publicity or negative commentary from any media outlets could damage our reputation and reduce the demand for our homes, which would adversely affect our business.
Regulatory Risks
We are subject to extensive government regulation, which can increase costs and reduce profitability.
Our homebuilding operations, including land development activities, are subject to extensive federal, state and local regulation, including environmental, construction, employment and worker health and safety, zoning and land use regulation. This regulation affects all aspects of the homebuilding process and can substantially delay or increase the costs of homebuilding activities, even on land for which we already have approvals. During the development process, we must obtain the approval of numerous governmental authorities that regulate matters such as:
|
·
|
permitted land uses, levels of density and architectural designs;
|
|
·
|
the level of energy efficiency our homes are required to achieve;
|
|
·
|
the level of greenhouse emissions relating to our operations and the homes we build;
|
|
·
|
the installation of utility services, such as water and waste disposal;
|
|
·
|
the dedication of acreage for open space, parks, schools and other community services; and
|
|
·
|
the preservation of habitat for endangered species and wetlands, storm water control and other environmental matters.
|
The approval process can be lengthy, can be opposed by consumer or environmental groups, and can cause significant delays or permanently halt the development process. Delays or a permanent halt in the development process can cause substantial increases to development costs or cause us to abandon the project and to sell the affected land at a potential loss, which in turn could harm our operating results.
In addition, new housing developments are often subject to various assessments or impact fees for schools, parks, streets, highways and other public improvements. The costs of these assessments are subject to substantial change and can cause increases in the effective prices of our homes, which in turn could reduce our sales and/or profitability.
There continues to be a variety of energy related legislation being considered for enactment around the world. For instance, for the last several years, the federal congress has considered an array of energy related initiatives, from carbon "cap and trade" to a federal energy efficiency building code that would increase energy efficiency requirements for new homes between 30 and 50 percent. And in California, where we derive a significant portion of our profits, current regulations, if not altered or delayed, will require new homebuilders like us to build "net-zero" energy homes by 2020. These potential and actual laws, rules and regulations, if enacted or enforced, all have the potential to increase the cost of home construction significantly, which in turn could reduce our sales and/or profitability.
Much of the new and proposed energy related regulation is a response to concerns about climate change. As climate change concerns grow, legislation and regulatory activity of this nature is expected to continue and become more onerous. Similarly, energy related initiatives will impact a wide variety of companies throughout the world and because our operations are heavily dependent on significant amounts of raw materials, such as lumber, steel, and concrete, these initiatives could have an indirect adverse effect on our operations and profitability to the extent the suppliers of our materials are burdened with expensive cap and trade and similar energy related regulations.
Our mortgage operations are also subject to federal, state, and local regulation, including eligibility requirements for participation in federal loan programs and various consumer protection laws. Our title insurance agency operations are subject to state insurance and other laws and regulations. Failure to comply with these requirements can lead to administrative enforcement actions, fines and penalties, the loss of required licenses and other required approvals, claims for monetary damages or demands for loan repurchase from investors, and rescission or voiding of the loan by the consumer.
Increased regulation of the mortgage industry could harm our future sales and earnings.
The mortgage industry remains under intense scrutiny and continues to face increasing regulation at the federal, state and local level. Changes in regulation have negatively impacted the full spectrum of mortgage related activity. Potential changes to federal laws and regulations could have the effect of limiting the activities of the Federal National Mortgage Association and the Federal Home Loan Mortgage Corporation, the entities that provide liquidity to the secondary mortgage market, which could lead to increases in mortgage interest rates. At the same time, the Federal Housing Administration's rules regarding Borrower FICO scores, down payment standards, and limiting the amount of permitted seller concessions, lessen the number of buyers able to finance a new home. All of these regulatory activities reduce the number of potential buyers who qualify for the financing necessary to purchase our homes, which could harm our future sales and earnings.
Changes to tax laws could make homeownership more expensive.
Current tax laws generally permit significant expenses associated with owning a home, primarily mortgage interest expense and real estate taxes, to be deducted for the purpose of calculating an individual's federal, and in many cases, state, taxable income. If the federal or state governments were to change applicable tax law to eliminate or reduce these benefits for all or certain classes of taxpayers, the after-tax cost of owning a home could increase significantly. This could harm our future sales and earnings.
States, cities and counties in which we operate may adopt slow growth or no growth initiatives reducing our ability or increasing our costs to build in these areas, which could harm our future sales and earnings.
Several states, cities and counties in which we operate have in the past approved, or approved for inclusion on their ballot, various "slow growth" or "no growth" initiatives and other ballot measures that could negatively impact the land we own as well as the availability of additional land and building opportunities within those localities. Approval of slow or no growth measures would increase the cost of land and reduce our ability to open new home communities and to build and sell homes in the affected markets and would create additional costs and administrative requirements, which in turn could harm our future sales and earnings.
Financing Risks
We may need additional funds, and if we are unable to obtain these funds, we may not be able to operate our business as planned.
Our operations require significant amounts of cash. Our requirements for additional capital, whether to finance operations or to service or refinance our existing indebtedness, fluctuate as market conditions and our financial performance and operations change. We cannot assure you that we will maintain cash reserves and generate sufficient cash flow from operations in an amount to enable us to service our debt or to fund other liquidity needs or business opportunities. Additionally, while we have a $750 million unsecured revolving credit facility designed to provide us with an additional source of liquidity to meet short-term cash needs, our ability and capacity to borrow under the facility is limited by our ability to meet the covenants and borrowing conditions of the facility.
The availability of additional capital, whether from private capital sources (including banks) or the public capital markets, fluctuates as our financial condition and market conditions in general change. There may be times when the private capital sources and the public debt or equity markets lack sufficient liquidity or when our securities cannot be sold at attractive prices, in which case we would not be able to access capital from these sources. In addition, a weakening of our financial condition or deterioration in our credit ratings could adversely affect our ability to obtain necessary funds. Even if available, additional financing could be costly or have adverse consequences. If additional funds are raised through the issuance of stock, dilution to stockholders could result. If additional funds are raised through the incurrence of debt, we will incur increased debt servicing costs and may become subject to additional restrictive financial and other covenants. We can give no assurance as to the terms or availability of additional capital. If we are not successful in obtaining or refinancing capital when needed, it could adversely impact our ability to operate our business effectively, which could reduce our sales and earnings, and adversely impact our financial position.
We have substantial debt and may incur additional debt; leverage may impair our financial condition and restrict our operations and prevent us from fulfilling our obligations under our debt instruments.
We currently have a substantial amount of debt. As of December 31, 2016, the principal amount of our homebuilding senior and convertible senior notes outstanding was approximately $3,400.5 million, $230.0 million of which matures in 2017, $800.0 million of which matures in 2018, $567.5 million of which matures between 2019 and 2020 and
$1,803.0 million of which matures between 2021 and 2032. In addition, the instruments governing our debt permit us to incur additional debt. Our existing debt and any additional debt we incur could:
|
·
|
make it more difficult for us to satisfy our obligations under our existing debt instruments;
|
|
·
|
increase our vulnerability to general adverse economic and industry conditions;
|
|
·
|
limit our ability to obtain additional financing to fund land acquisitions and construction and development activities, particularly when the availability of financing in the capital markets is limited;
|
|
·
|
require a substantial portion of our cash flows from operations for the payment of interest on our debt, reducing our ability to use our cash flows to fund working capital, land acquisitions and land development, acquisitions of other homebuilders and related businesses and other general corporate requirements;
|
|
·
|
limit our flexibility in planning for, or reacting to, changes in our business and the industry in which we operate; and
|
|
·
|
place us at a competitive disadvantage to less leveraged competitors.
|
Servicing our debt will require a significant amount of cash, and our ability to generate sufficient cash depends on many factors, some of which are beyond our control.
Our ability to make payments on and refinance our debt and to fund planned capital expenditures depends on our ability to generate cash flow in the future. To some extent, this is subject to general economic, financial, competitive, legislative and regulatory factors and other factors that are beyond our control. We cannot assure you that our business will generate cash flow from operations in an amount sufficient to enable us to pay our debt or to fund other liquidity needs. As a result, we may need to refinance all or a portion of our debt on or before maturity. We cannot assure you that we will be able to refinance any of our debt on favorable terms, if at all. Any inability to generate sufficient cash flow or refinance our debt on favorable terms could have a material adverse effect on our financial condition.
In addition, our 1.25% Convertible Senior Notes due 2032 (the "Convertible Notes") entitle holders to require us to repurchase their notes at a price of 100% of the principal amount, plus accrued and unpaid interest, on August 1, 2017, 2022 or 2027, or in the event of a fundamental change (as defined in the indenture governing the Convertible Notes). If we do not have sufficient funds to repurchase notes when we are required to do so, or if instruments governing debt we have incurred prohibit us from using cash or other assets for that purpose, we might be unable to meet our obligations. Our failure to repurchase the Convertible Notes at a time when their repurchase is required by the indenture would constitute a default under the indenture. A default under the Convertible Notes indenture, or the fundamental change itself, could also lead to a default under our revolving credit facility or other debt securities we have issued or could cause borrowings we have incurred to become due. If the repayment of a substantial amount of indebtedness were to be accelerated after any applicable notice or grace period, we might not have sufficient funds to repay the indebtedness and repurchase the notes.
We currently have significant amounts invested in unconsolidated joint ventures with independent third parties in which we have less than a controlling interest. These investments are highly illiquid and have significant risks.
We participate in unconsolidated homebuilding and land development joint ventures with independent third parties in which we have less than a controlling interest. At December 31, 2016, we had an aggregate of $127.1 million invested in these joint ventures, of which two joint ventures had project specific debt outstanding, which totaled $31.0 million. This joint venture debt is non-recourse to us.
While these joint ventures provide us with a means of accessing larger and/or more desirable land parcels and lot positions, they are subject to a number of risks, including the following:
|
·
|
Restricted Payment Risk. Certain of our senior notes limit our ability to make investments in joint ventures. If we become unable to fund our joint venture obligations this could result in, among other things, defaults under our joint venture operating agreements, loan agreements, and credit enhancements. And, our failure to satisfy our joint venture obligations could also affect our joint venture's ability to carry out its operations or strategy which could impair the value of our investment in the joint venture.
|
|
·
|
Entitlement Risk. Certain of our joint ventures acquire parcels of unentitled raw land. If the joint venture is unable to timely obtain entitlements at a reasonable cost, project delay or even project termination may occur resulting in an impairment of the value of our investment.
|
|
·
|
Development Risk. The projects we build through joint ventures are often larger and have a longer time horizon than the typical project developed by our wholly-owned homebuilding operations. Time delays associated with
|
|
|
obtaining entitlements, unforeseen development issues, unanticipated labor and material cost increases, higher carrying costs, and general market deterioration and other changes are more likely to impact larger, long-term projects, all of which may negatively impact the profitability of these ventures and our proportionate share of income.
|
|
·
|
Financing Risk. There are generally a limited number of sources willing to provide acquisition, development and construction financing to land development and homebuilding joint ventures. During difficult market conditions, it may be difficult or impossible for our joint ventures to obtain financing on commercially reasonable terms, or for our joint ventures to refinance existing borrowings as such borrowings mature. As a result, we may be required to contribute our corporate funds to the joint venture to finance acquisition and development and/or construction costs following termination or step-down of joint venture financing that the joint venture is unable to restructure, extend, or refinance with another third party lender. In addition, our ability to contribute our funds to or for the joint venture may be limited as n discussed above.
|
|
·
|
Contribution Risk. Under credit enhancements that we typically provide with respect to joint venture borrowings, we and our partners could be required to make additional unanticipated investments in these joint ventures, either in the form of capital contributions or loan repayments, to reduce such outstanding borrowings. We may have to make additional contributions that exceed our proportional share of capital if our partners fail to contribute any or all of their share. While in most instances we would be able to exercise remedies available under the applicable joint venture documentation if a partner fails to contribute its proportional share of capital, our partner's financial condition may preclude any meaningful cash recovery on the obligation.
|
|
·
|
Completion Risk. We often sign a completion agreement in connection with obtaining financing for our joint ventures. Under such agreements, we may be compelled to complete a project even if we no longer have an economic interest in the property.
|
|
·
|
Illiquid Investment Risk. We lack a controlling interest in our joint ventures and therefore are generally unable to compel our joint ventures to sell assets, return invested capital, require additional capital contributions or take any other action without the vote of at least one or more of our venture partners. This means that, absent partner agreement, we may not be able to liquidate our joint venture investments to generate cash.
|
|
·
|
Partner Dispute. If we have a dispute with one of our joint venture partners and are unable to resolve it, a buy-sell provision in the applicable joint venture agreement could be triggered or we may otherwise pursue a negotiated settlement involving the unwinding of the venture and it is possible that litigation between us and our partner(s) could result. In such cases, we may sell our interest to our partner or purchase our partner's interest. If we sell our interest, we will forgo the profit we would have otherwise earned with respect to the joint venture project and may be required to forfeit our invested capital and/or pay our partner to release us from our joint venture obligations. If we are required to purchase our partner's interest, we would need to fund this purchase, as well as the completion of the project, with corporate level capital and to consolidate the joint venture project onto our balance sheet, which could, among other things, adversely impact our liquidity, our leverage and other financial conditions or covenants.
|
|
·
|
Consolidation Risk. The accounting rules for joint ventures are complex and the decision as to whether it is proper to consolidate a joint venture onto our balance sheet is fact intensive. If the facts concerning an unconsolidated joint venture were to change and a triggering event under applicable accounting rules were to occur, we might be required to consolidate previously unconsolidated joint ventures onto our balance sheet which could adversely impact our leverage and other financial conditions or covenants.
|
At times, such as now, when we are pursuing a longer-term land acquisition strategy, we become directly subject to some of these risks in varying degrees, including those discussed above related to entitlement, development, financing, completion and illiquid investment. Increasing our direct exposure to these types of risks could have a material adverse effect on our financial position or results or operations.
Other Risks
Our principal stockholder has the ability to exercise significant influence over the composition of our Board of Directors and matters requiring stockholder approval.
As of December 31, 2016, MP CA Homes LLC held 37% of the voting power of our voting stock. Pursuant to the amended stockholders' agreement that we entered into with MP CA Homes LLC, effective October 1, 2015, MP CA Homes LLC is entitled to designate up to two directors to serve on our Board of Directors so long as they hold at least 20% of our
voting power and one director so long as they hold at least 10% of our voting power, giving MP CA Homes LLC the ability to exercise significant influence on the composition and actions of our Board of Directors. In addition, this large voting block may have a significant or decisive effect on the approval or disapproval of matters requiring approval of our stockholders, including any amendment to our certificate of incorporation, any proposed merger, consolidation or sale of all or substantially all of our assets and other corporate transactions. The interests of MP CA Homes LLC in these other matters may not always coincide with the interests of our other stockholders. In addition, the ownership of such a large block of our voting power and the right to designate directors by MP CA Homes LLC may discourage someone from making a significant equity investment in us, even if we needed the investment to operate our business, or could be a significant factor in delaying or preventing a change of control transaction that other stockholders may deem to be in their best interests.
Our charter, bylaws, stockholders' rights agreement and debt covenants could prevent a third party from acquiring us or limit the price that investors might be willing to pay for shares of our common stock.
Provisions of the Delaware General Corporation Law, our certificate of incorporation and our bylaws could have the effect of making it more difficult for a third party to acquire, or of discouraging a third party from attempting to acquire, control of us. These provisions could delay or prevent a change in control of and could limit the price that investors might be willing to pay in the future for shares of our common stock.
Our certificate of incorporation also authorizes our Board of Directors to issue new series of common stock and preferred stock without stockholder approval. Depending on the rights and terms of any new series created, and the reaction of the market to the series, rights of existing stockholders could be negatively affected. For example, subject to applicable law, our Board of Directors could create a series of common stock or preferred stock with preferential rights to dividends or assets upon liquidation, or with superior voting rights to our existing common stock. The ability of our Board of Directors to issue these new series of common stock and preferred stock could also prevent or delay a third party from acquiring us, even if doing so would be beneficial to our stockholders.
We are also subject to the anti-takeover provisions of Section 203 of the Delaware General Corporation Law, which prohibits Delaware corporations from engaging in business combinations specified in the statute with an interested stockholder, as defined in the statute, for a period of three years after the date of the transaction in which the person first becomes an interested stockholder, unless the business combination is approved in advance by a majority of the independent directors or by the holders of at least two-thirds of the outstanding disinterested shares. The application of Section 203 of the Delaware General Corporation Law could also have the effect of delaying or preventing a change of control of us.
We also have a stockholders' rights agreement that could make it difficult to acquire us without the approval of our Board of Directors. Our stockholders' rights agreement has been filed with and is publicly available at or from the SEC; see Part IV, Item 15.
In addition, some of our debt covenants contained in the indentures for our outstanding public notes and our revolving credit facility may delay or prevent a change in control. Our outstanding notes contain change of control provisions that give the holders of our outstanding notes the right to require us to purchase the notes upon a change in control triggering event at a purchase price equal to 101% of the principal amount of the notes plus accrued and unpaid interest. In addition, a change of control is an event of default under our revolving credit facility.
None.
We lease office facilities for our homebuilding and mortgage operations. We also lease our East Coast corporate headquarters, which is located in Rosslyn, Virginia and our West Coast corporate headquarters, which is located in Irvine, California. The lease on the West Coast facility, which also includes offices for our Orange County division, consists of approximately 39,000 square feet and expires in August 2017. The lease on the East Coast facility, consists of approximately 11,000 square feet and expires in February 2027. We lease approximately 40 other properties for our other division offices, mortgage operations and design centers. For information about land owned or controlled by us for use in our homebuilding activities, please refer to Item 7, "Management's Discussion and Analysis of Financial Condition and Results of Operations".
Various claims and actions that we consider normal to our business have been asserted and are pending against us. We do not believe that any of such claims and actions will have a material adverse effect upon our results of operations or financial position.
None.
Executive Officers of the Registrant
Our executive officers' ages, positions and brief accounts of their business experience as of February 24, 2017, are set forth below.
|
Name
|
Age
|
Position
|
|
Scott D. Stowell
|
59
|
Executive Chairman
|
|
Larry T. Nicholson
|
59
|
Chief Executive Officer and President
|
|
Peter G. Skelly
|
53
|
Executive Vice President and Chief Operating Officer
|
|
Jeff J. McCall
|
45
|
Executive Vice President and Chief Financial Officer
|
|
Wendy L. Marlett
|
53
|
Executive Vice President and Chief Marketing Officer
|
|
John P. Babel
|
46
|
Executive Vice President, General Counsel and Secretary
|
Scott D. Stowell has served as Executive Chairman since October 2015. Prior to that, Mr. Stowell served as Chief Executive Officer of the Company from January 2012 to September 2015 and President of the Company from March 2011 to September 2015. From May 2007 to March 2011, Mr. Stowell served as the Company's Chief Operating Officer. Mr. Stowell joined the Company in 1986 as a project manager. Since March 2014, Mr. Stowell has also served as a member of the Board of Directors of Pacific Mutual Holding Company.
Larry T. Nicholson has served as Chief Executive Officer and President since October 2015. Prior to that Mr. Nicholson served as Chief Executive Officer of Ryland from June 2009 to September 2015 and President of Ryland from October 2008 to September 2015. From June 2007 to May 2009, Mr. Nicholson served as Chief Operating Officer of Ryland and Vice President of Ryland and President of their Southeast Region from 2004 to May 2007. Mr. Nicholson held various operational and leadership positions since joining Ryland in 1996.
Peter G. Skelly has served as Executive Vice President and Chief Operating Officer since October 2015. Prior to that, Mr. Skelly served as Executive Vice President and Chief Operating Officer of Ryland from 2013 to September 2015. Prior to that, Mr. Skelly served as Senior Vice President of Ryland and President of their Homebuilding Operations from 2011 to 2013 and Senior Vice President of Ryland and President of Ryland's North/West Region from 2008 to 2011. Mr. Skelly joined Ryland in 1998 as Assistant Controller.
Jeff J. McCall has served as Executive Vice President and Chief Financial Officer since June 2011. Prior to joining the Company, Mr. McCall was Chief Financial Officer – Americas at Regus plc, the world's largest provider of serviced offices, from August 2004 to May 2011. From December 2003 to August 2004 Mr. McCall served as Chief Financial Officer and Executive Vice President of HQ Global Workplaces, Inc., which was acquired by Regus plc in August 2004. From 1998 to 2003, Mr. McCall was Principal at Casas, Benjamin & White LLC, a leading boutique advisory services firm specializing in middle market mergers, acquisitions, divestitures, restructuring, and private equity investments.
Wendy L. Marlett has served as Executive Vice President and Chief Marketing Officer since September 2010. Ms. Marlett leads all of the Company's sales, marketing and communication functions across our operations. Prior to joining the Company, Ms. Marlett was Senior Vice President of sales, marketing and communications at KB Home, where she held progressive roles since 1995 and was a recognized innovator in marketing and brand management. From 1990 to 1995 she served in marketing and media relations positions for Rockwell International's automotive, printing and aerospace businesses.
John P. Babel has served as Executive Vice President, General Counsel and Secretary since February 2012. Prior to that Mr. Babel served as Senior Vice President, General Counsel and Secretary of the Company from February 2009 until February 2012. Mr. Babel joined the Company as Associate General Counsel in October 2002. Prior to joining the Company, Mr. Babel was a corporate lawyer with the international law firm of Gibson, Dunn & Crutcher LLP.
PART II
ITEM 5. MARKET FOR REGISTRANT'S COMMON EQUITY, RELATED STOCKHOLDER MATTERS AND ISSUER PURCHASES OF EQUITY SECURITIES
Our shares of common stock are listed on the New York Stock Exchange under the symbol "CAA." The following table sets forth, for the fiscal quarters indicated, the reported high and low intra-day sales prices per share of our common stock as reported on the New York Stock Exchange Composite Tape and the common dividends paid per share.
|
Year Ended December 31,
|
||||||||||||||||||||||||
|
2016
|
2015
|
|||||||||||||||||||||||
|
High
|
Low
|
Dividend
|
High
|
Low
|
Dividend
|
|||||||||||||||||||
|
Quarter Ended
|
||||||||||||||||||||||||
|
March 31
|
$
|
37.51
|
$
|
26.97
|
$
|
0.04
|
$
|
45.70
|
$
|
32.60
|
$
|
―
|
||||||||||||
|
June 30
|
38.41
|
31.03
|
0.04
|
45.95
|
38.95
|
―
|
||||||||||||||||||
|
September 30
|
40.94
|
32.86
|
0.04
|
46.75
|
38.95
|
―
|
||||||||||||||||||
|
December 31
|
43.24
|
30.18
|
0.04
|
43.24
|
36.23
|
0.04
|
||||||||||||||||||
For further information on our dividend policy, see "Management's Discussion and Analysis of Financial Condition and Results of Operations—Liquidity and Capital Resources—Dividends."
As of February 24, 2017, the number of record holders of our common stock was approximately 2,025.
Issuer Purchases of Equity Securities
During the three months ended December 31, 2016, we repurchased the following shares under our repurchase program:
|
Total Number
|
Approximate
|
|||||||||||||||
|
of Shares
|
Dollar Value
|
|||||||||||||||
|
Purchased as
|
of Shares that
|
|||||||||||||||
|
Part of
|
May Yet be
|
|||||||||||||||
|
Average
|
Publicly
|
Purchased
|
||||||||||||||
|
Total Number
|
Price
|
Announced
|
Under the
|
|||||||||||||
|
of Shares
|
Paid per
|
Plans or
|
Plans or
|
|||||||||||||
|
Period
|
Purchased (1)
|
Share
|
Programs (1)
|
Programs (1)
|
||||||||||||
|
October 1, 2016 to October 31, 2016
|
1,624,874
|
$
|
32.48
|
1,624,874
|
$
|
409,604,148
|
||||||||||
|
November 1, 2016 to November 30, 2016
|
1,327,900
|
$
|
31.64
|
1,327,900
|
$
|
367,593,090
|
||||||||||
|
December 1, 2016 to December 31, 2016
|
6,355
|
$
|
32.00
|
6,355
|
$
|
367,389,730
|
||||||||||
|
Total
|
2,959,129
|
$
|
32.10
|
2,959,129
|
||||||||||||
________________
|
(1)
|
On July 28, 2016, the Company announced a new $500 million common stock repurchase plan. The stock repurchase plan has no stated expiration date and replaces in its entirety the $200 million authorized by our Board of Directors on February 11, 2016.
|
The following graph shows a five-year comparison of cumulative total returns to stockholders of the Company, as compared with The Standard & Poor's 500 Composite Stock Index and the Dow Jones Industry Group-U.S. Home Construction Index. The graph assumes reinvestment of all dividends.
Comparison of Five-Year Cumulative Total Stockholders' Return
Among CalAtlantic Group, Inc., The Standard & Poor's 500 Composite Stock Index and
the Dow Jones Industry Group-U.S. Home Construction Index
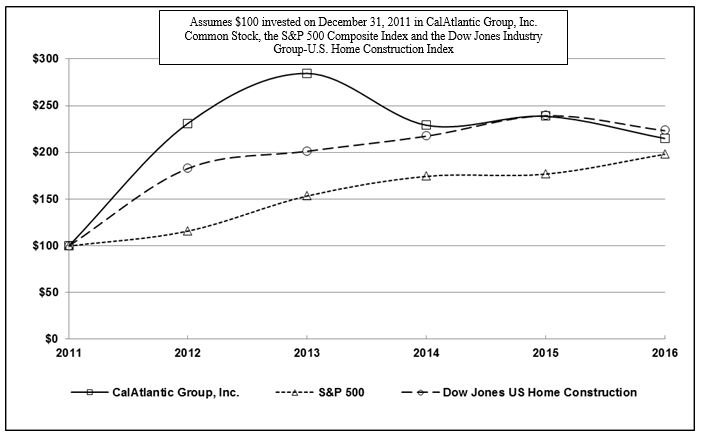
The above graph is based upon common stock and index prices calculated as of year-end for each of the last five calendar years. The Company's common stock closing price on December 30, 2016 was $34.01 per share. The stock price performance of the Company's common stock depicted in the graph above represents past performance only and is not necessarily indicative of future performance.
The following should be read in conjunction with our consolidated financial statements and related notes included elsewhere in this Form 10-K.
|
Year Ended December 31,
|
||||||||||||||||||||
|
2016
|
2015 (1)
|
2014
|
2013
|
2012
|
||||||||||||||||
| (Dollars in thousands, except per share amounts) | ||||||||||||||||||||
|
Revenues:
|
||||||||||||||||||||
|
Homebuilding
|
$
|
6,388,040
|
$
|
3,496,411
|
$
|
2,411,178
|
$
|
1,914,609
|
$
|
1,236,958
|
||||||||||
|
Financial Services
|
88,695
|
43,702
|
25,320
|
25,734
|
21,769
|
|||||||||||||||
|
Total revenues
|
$
|
6,476,735
|
$
|
3,540,113
|
$
|
2,436,498
|
$
|
1,940,343
|
$
|
1,258,727
|
||||||||||
|
Pretax income:
|
||||||||||||||||||||
|
Homebuilding
|
$
|
713,502
|
$
|
325,550
|
$
|
340,121
|
$
|
246,269
|
$
|
67,645
|
||||||||||
|
Financial Services
|
39,614
|
16,939
|
9,843
|
11,429
|
10,542
|
|||||||||||||||
|
Pretax income
|
$
|
753,116
|
$
|
342,489
|
$
|
349,964
|
$
|
257,698
|
$
|
78,187
|
||||||||||
|
Net income (2)
|
$
|
484,730
|
$
|
213,509
|
$
|
215,865
|
$
|
188,715
|
$
|
531,421
|
||||||||||
|
Basic income per common share
|
$
|
4.09
|
$
|
2.51
|
$
|
2.94
|
$
|
2.59
|
$
|
7.59
|
||||||||||
|
Diluted income per common share
|
$
|
3.60
|
$
|
2.26
|
$
|
2.68
|
$
|
2.36
|
$
|
7.21
|
||||||||||
|
Weighted average common shares outstanding:
|
||||||||||||||||||||
|
Basic
|
118,212,740
|
71,713,747
|
55,737,548
|
50,623,649
|
40,390,760
|
|||||||||||||||
|
Diluted
|
135,984,985
|
81,512,953
|
63,257,082
|
58,234,791
|
44,103,780
|
|||||||||||||||
|
Weighted average additional common shares outstanding
|
||||||||||||||||||||
|
if preferred shares converted to common shares:
|
―
|
13,135,814
|
17,562,557
|
22,165,311
|
29,562,557
|
|||||||||||||||
|
Total weighted average diluted common shares outstanding
|
||||||||||||||||||||
|
if preferred shares converted to common shares:
|
135,984,985
|
94,648,767
|
80,819,639
|
80,400,102
|
73,666,337
|
|||||||||||||||
|
Balance Sheet and Other Financial Data:
|
||||||||||||||||||||
|
Homebuilding cash (including restricted cash)
|
$
|
219,407
|
$
|
187,066
|
$
|
218,650
|
$
|
376,949
|
$
|
366,808
|
||||||||||
|
Inventories owned
|
$
|
6,438,792
|
$
|
6,069,959
|
$
|
3,255,204
|
$
|
2,536,102
|
$
|
1,971,418
|
||||||||||
|
Total assets
|
$
|
8,709,044
|
$
|
8,429,402
|
$
|
4,151,639
|
$
|
3,637,552
|
$
|
3,087,268
|
||||||||||
|
Homebuilding debt
|
$
|
3,419,787
|
$
|
3,487,699
|
$
|
2,113,301
|
$
|
1,815,042
|
$
|
1,516,212
|
||||||||||
|
Financial services debt
|
$
|
247,427
|
$
|
303,422
|
$
|
89,413
|
$
|
100,867
|
$
|
92,159
|
||||||||||
|
Stockholders' equity
|
$
|
4,207,586
|
$
|
3,861,436
|
$
|
1,676,688
|
$
|
1,468,960
|
$
|
1,255,816
|
||||||||||
|
Stockholders' equity per common share (3)
|
$
|
36.77
|
$
|
31.84
|
$
|
30.47
|
$
|
26.46
|
$
|
29.45
|
||||||||||
|
Pro forma stockholders' equity per common share (4)
|
$
|
36.77
|
$
|
31.84
|
$
|
23.10
|
$
|
20.10
|
$
|
17.39
|
||||||||||
|
Cash dividends declared per share
|
$
|
0.16
|
$
|
0.04
|
$
|
―
|
$
|
―
|
$
|
―
|
||||||||||
|
Operating Data (excluding unconsolidated joint ventures):
|
||||||||||||||||||||
|
Deliveries
|
14,229
|
7,237
|
4,956
|
4,602
|
3,291
|
|||||||||||||||
|
Average selling price
|
$
|
447
|
$
|
477
|
$
|
478
|
$
|
413
|
$
|
362
|
||||||||||
|
Net new orders (homes)
|
14,435
|
7,163
|
4,967
|
4,898
|
4,014
|
|||||||||||||||
|
Backlog (homes)
|
5,817
|
5,611
|
1,711
|
1,700
|
1,404
|
|||||||||||||||
|
Average active selling communities
|
570
|
299
|
182
|
166
|
155
|
|||||||||||||||
________________
|
(1)
|
2015 full year results include Ryland's operations since October 1, 2015. Please see Note 3 of our accompanying consolidated financial statements.
|
|
(2)
|
Net income for 2012 includes a $454 million income tax benefit resulting from the reversal of a portion of our deferred tax asset valuation allowance.
|
|
(3)
|
At December 31, 2012, common shares outstanding exclude 29.6 million common equivalent shares issued during the year ended December 31, 2008 in the form of preferred stock to MP CA Homes LLC, an affiliate of MatlinPatterson Global Advisers LLC ("MP CA Homes"). On May 20, 2013, MP CA Homes converted 36,600 shares of our preferred stock into 12 million shares of our common stock. As a result, at December 31, 2014 and 2013, common shares outstanding exclude 17.6 million common equivalent shares issuable upon conversion of preferred shares outstanding. In addition, on October 1, 2015, MP CA Homes converted its remaining 53,565 shares of our preferred stock into 17.6 million shares of our common stock in connection with our merger with The Ryland Group, Inc., and no common equivalent shares issuable upon conversion of preferred shares were outstanding at December 31, 2015 or 2016.
|
|
(4)
|
At December 31, 2012, pro forma common shares outstanding include 29.6 million common equivalent shares issuable upon conversion of preferred shares outstanding. As a result of the conversion of preferred shares by MP CA Homes described above, at December 31, 2014 and 2013, pro forma common shares outstanding include 17.6 million common equivalent shares issuable upon conversion of preferred shares outstanding.
|
The following discussion and analysis should be read in conjunction with the section "Selected Financial Data" and our consolidated financial statements and the related notes included elsewhere in this Form 10-K.
Results of Operations
Selected Financial Information
|
Year Ended December 31,
|
||||||||||||
|
2016
|
2015
|
2014
|
||||||||||
|
(Dollars in thousands, except per share amounts)
|
||||||||||||
|
Homebuilding:
|
||||||||||||
|
Home sale revenues
|
$
|
6,354,869
|
$
|
3,449,047
|
$
|
2,366,754
|
||||||
|
Land sale revenues
|
33,171
|
47,364
|
44,424
|
|||||||||
|
Total revenues
|
6,388,040
|
3,496,411
|
2,411,178
|
|||||||||
|
Cost of home sales
|
(4,967,278
|
)
|
(2,676,666
|
)
|
(1,748,954
|
)
|
||||||
|
Cost of land sales
|
(30,132
|
)
|
(43,274
|
)
|
(43,841
|
)
|
||||||
|
Total cost of sales
|
(4,997,410
|
)
|
(2,719,940
|
)
|
(1,792,795
|
)
|
||||||
|
Gross margin
|
1,390,630
|
776,471
|
618,383
|
|||||||||
|
Gross margin percentage
|
21.8
|
%
|
22.2
|
%
|
25.6
|
%
|
||||||
|
Selling, general and administrative expenses
|
(664,459
|
)
|
(390,710
|
)
|
(275,861
|
)
|
||||||
|
Income (loss) from unconsolidated joint ventures
|
4,057
|
1,966
|
(668
|
)
|
||||||||
|
Other income (expense)
|
(16,726
|
)
|
(62,177
|
)
|
(1,733
|
)
|
||||||
|
Homebuilding pretax income
|
713,502
|
325,550
|
340,121
|
|||||||||
|
Financial Services:
|
||||||||||||
|
Revenues
|
88,695
|
43,702
|
25,320
|
|||||||||
|
Expenses
|
(49,081
|
)
|
(26,763
|
)
|
(15,477
|
)
|
||||||
|
Financial services pretax income
|
39,614
|
16,939
|
9,843
|
|||||||||
|
Income before taxes
|
753,116
|
342,489
|
349,964
|
|||||||||
|
Provision for income taxes
|
(268,386
|
)
|
(128,980
|
)
|
(134,099
|
)
|
||||||
|
Net income
|
484,730
|
213,509
|
215,865
|
|||||||||
|
Less: Net income allocated to preferred shareholder
|
―
|
(32,997
|
)
|
(51,650
|
)
|
|||||||
|
Less: Net income allocated to unvested restricted stock
|
(1,168
|
)
|
(369
|
)
|
(297
|
)
|
||||||
|
Net income available to common stockholders
|
$
|
483,562
|
$
|
180,143
|
$
|
163,918
|
||||||
|
Income per common share:
|
||||||||||||
|
Basic
|
$
|
4.09
|
$
|
2.51
|
$
|
2.94
|
||||||
|
Diluted
|
$
|
3.60
|
$
|
2.26
|
$
|
2.68
|
||||||
|
Weighted average common shares outstanding:
|
||||||||||||
|
Basic
|
118,212,740
|
71,713,747
|
55,737,548
|
|||||||||
|
Diluted
|
135,984,985
|
81,512,953
|
63,257,082
|
|||||||||
|
Weighted average additional common shares outstanding
|
||||||||||||
|
if preferred shares converted to common shares:
|
―
|
13,135,814
|
17,562,557
|
|||||||||
|
Total weighted average diluted common shares outstanding
|
||||||||||||
|
if preferred shares converted to common shares:
|
135,984,985
|
94,648,767
|
80,819,639
|
|||||||||
|
Net cash provided by (used in) operating activities
|
$
|
322,314
|
$
|
(271,361
|
)
|
$
|
(362,397
|
)
|
||||
|
Net cash provided by (used in) investing activities
|
$
|
2,929
|
$
|
184,674
|
$
|
(31,020
|
)
|
|||||
|
Net cash provided by (used in) financing activities
|
$
|
(303,710
|
)
|
$
|
60,888
|
$
|
242,519
|
|||||
|
Adjusted Homebuilding EBITDA (1)
|
$
|
996,183
|
$
|
648,313
|
$
|
502,423
|
||||||
________________
|
(1)
|
Adjusted Homebuilding EBITDA means net income (plus cash distributions of income from unconsolidated joint ventures) before (a) income taxes, (b) homebuilding interest expense, (c) expensing of previously capitalized interest included in cost of sales, (d) impairment charges and deposit write-offs, (e) gain (loss) on early extinguishment of debt, (f) homebuilding depreciation and amortization, including amortization of capitalized model costs, (g) amortization of stock-based compensation, (h) income (loss) from unconsolidated joint ventures, (i) income (loss) from financial services subsidiary, (j) purchase accounting adjustments and (k) merger and other one-time transaction related costs. Other companies may calculate Adjusted Homebuilding EBITDA (or similarly titled measures) differently. We believe Adjusted Homebuilding EBITDA information is useful to management and investors as it provides perspective on the underlying performance of the business. However, it should be noted that Adjusted Homebuilding EBITDA is not a U.S. generally accepted accounting principles ("GAAP") financial measure. Due to the significance of the GAAP components excluded, Adjusted Homebuilding EBITDA should not be considered in isolation or as an alternative to net income or any other performance measure prescribed by GAAP.
|
Selected Financial Information (continued)
| (1) |
Continued
|
The table set forth below reconciles net income, calculated and presented in accordance with GAAP, to Adjusted Homebuilding EBITDA.
|
Year Ended December 31,
|
||||||||||||
|
2016
|
2015
|
2014
|
||||||||||
|
(Dollars in thousands)
|
||||||||||||
|
Net income
|
$
|
484,730
|
$
|
213,509
|
$
|
215,865
|
||||||
|
Provision for income taxes
|
268,386
|
128,980
|
134,099
|
|||||||||
|
Homebuilding interest amortized to cost of sales
|
171,701
|
139,381
|
123,112
|
|||||||||
|
Homebuilding depreciation and amortization
|
61,552
|
40,987
|
27,209
|
|||||||||
|
EBITDA
|
986,369
|
522,857
|
500,285
|
|||||||||
|
Add:
|
||||||||||||
|
Amortization of stock-based compensation
|
17,794
|
15,624
|
8,469
|
|||||||||
|
Cash distributions of income from unconsolidated joint ventures
|
671
|
2,830
|
1,875
|
|||||||||
|
Merger-related purchase accounting adjustments included in cost of home sales
|
18,535
|
64,170
|
―
|
|||||||||
|
Merger and other one-time costs
|
16,485
|
61,737
|
―
|
|||||||||
|
Less:
|
||||||||||||
|
Income (loss) from unconsolidated joint ventures
|
4,057
|
1,966
|
(668
|
)
|
||||||||
|
Income from financial services subsidiaries
|
39,614
|
16,939
|
8,874
|
|||||||||
|
Adjusted Homebuilding EBITDA
|
$
|
996,183
|
$
|
648,313
|
$
|
502,423
|
||||||
2016 CalAtlantic to Selected Pro Forma CalAtlantic 2015 and Pro Forma CalAtlantic 2014
On October 1, 2015, we completed our merger transaction with Ryland which essentially doubled the size of the Company. To aid readers with comparability for the entire merged business, we are providing the below limited supplemental pro forma information. The following unaudited selected condensed combined pro forma data combines the historical home sale revenues, homes delivered, net new orders and average active selling communities of Standard Pacific and Ryland, giving effect to the merger as if it had been consummated on January 1, 2014. The selected condensed combined pro forma financial data are presented for illustrative purposes only, and are not necessarily indicative of results that actually would have occurred or that may occur in the future had the merger with Ryland been completed on January 1, 2014. Accordingly this information should not be relied upon for purposes of making any investment or other decisions. Additional information regarding the merger may be found in the Company's current report on Form 8-K, filed with the SEC on October 5, 2015, which is incorporated herein by reference.
|
|
Year Ended December 31,
|
|||||||||||||||
|
|
Actual
2016 |
% Change
|
Pro Forma
2015 |
% Change
|
Pro Forma
2014 |
|||||||||||
|
|
(Dollars in thousands)
|
|||||||||||||||
|
Home sale revenues
|
||||||||||||||||
|
North
|
$
|
1,015,503
|
10%
|
$
|
923,541
|
3%
|
$
|
899,357
|
||||||||
|
Southeast
|
1,555,980
|
16%
|
1,345,025
|
16%
|
1,154,688
|
|||||||||||
|
Southwest
|
1,658,949
|
15%
|
1,442,100
|
9%
|
1,325,097
|
|||||||||||
|
West
|
2,124,437
|
35%
|
1,569,631
|
2%
|
1,543,579
|
|||||||||||
|
Consolidated total
|
$
|
6,354,869
|
20%
|
$
|
5,280,297
|
7%
|
$
|
4,922,721
|
||||||||
|
|
|
|
|
|
Year Ended December 31,
|
|||||||||||
|
|
|
|
|
|
Actual
2016 |
|
% Change
|
|
Pro Forma
2015 |
|
% Change
|
|
Pro Forma
2014 |
|||
|
|
|
|
|
|
|
|
|
|
|
|
|
|
|
|
|
|
|
New homes delivered:
|
|
|
|
|
|
|
|
|
|
|
|
|
|
|||
|
|
North
|
|
3,034
|
|
11%
|
|
|
2,727
|
|
1%
|
|
|
2,711
|
|||
|
|
Southeast
|
|
4,029
|
|
8%
|
|
|
3,732
|
|
2%
|
|
|
3,664
|
|||
|
|
Southwest
|
|
3,891
|
|
10%
|
|
|
3,552
|
|
(2%)
|
|
|
3,636
|
|||
|
|
West
|
|
3,275
|
|
28%
|
|
|
2,549
|
|
(3%)
|
|
|
2,622
|
|||
|
|
|
|
Consolidated total
|
|
14,229
|
|
13%
|
|
|
12,560
|
|
(1%)
|
|
|
12,633
|
|
|
|
|
|
|
|
Year Ended December 31,
|
|||||||||||
|
|
|
|
|
|
Actual
2016 |
|
% Change
|
|
Pro Forma
2015 |
|
% Change
|
|
Pro Forma
2014 |
|||
|
|
|
|
|
(Dollars in thousands)
|
||||||||||||
|
Average selling prices of homes delivered:
|
|
|
|
|
|
|
|
|
|
|
|
|
|
|||
|
|
North
|
$
|
335
|
|
(1%)
|
|
$
|
339
|
|
2%
|
|
$
|
332
|
|||
|
|
Southeast
|
|
386
|
|
7%
|
|
|
360
|
|
14%
|
|
|
315
|
|||
|
|
Southwest
|
|
426
|
|
5%
|
|
|
406
|
|
12%
|
|
|
364
|
|||
|
|
West
|
|
649
|
|
5%
|
|
|
616
|
|
5%
|
|
|
589
|
|||
|
|
|
|
Consolidated total
|
$
|
447
|
|
6%
|
|
$
|
420
|
|
8%
|
|
$
|
390
|
|
|
Year Ended December 31,
|
|||||||||||||||||
|
Actual
2016 |
% Change
|
% Absorption Change (1)
|
Pro Forma
2015 |
% Change
|
% Absorption Change (1)
|
Pro Forma
2014 |
|||||||||||
|
Net new orders (2):
|
|||||||||||||||||
|
North
|
3,329
|
21%
|
10%
|
2,757
|
3%
|
(4%)
|
2,664
|
||||||||||
|
Southeast
|
4,201
|
6%
|
(0%)
|
3,976
|
10%
|
(2%)
|
3,627
|
||||||||||
|
Southwest
|
3,603
|
(11%)
|
(3%)
|
4,029
|
6%
|
(10%)
|
3,784
|
||||||||||
|
West
|
3,302
|
7%
|
1%
|
3,089
|
21%
|
6%
|
2,560
|
||||||||||
|
Consolidated total
|
14,435
|
4%
|
2%
|
13,851
|
10%
|
(3%)
|
12,635
|
||||||||||
________________
|
(1)
|
Represents the percentage change of net new orders per average number of selling communities during the period.
|
|
(2)
|
Net new orders are new orders for the purchase of homes during the period, less cancellations during such period of existing contracts for the purchase of homes.
|
|
|
|
|
|
|
Year Ended December 31,
|
|||||||||||
|
|
|
|
|
|
Actual
2016 |
|
% Change
|
|
Pro Forma
2015 |
|
% Change
|
|
Pro Forma
2014 |
|||
|
|
|
|
|
(Dollars in thousands)
|
||||||||||||
|
Average selling prices of net new orders:
|
|
|
|
|
|
|
|
|
|
|
|
|
|
|||
|
|
North
|
$
|
337
|
|
(1%)
|
|
$
|
339
|
|
0%
|
|
$
|
338
|
|||
|
|
Southeast
|
|
378
|
|
2%
|
|
|
369
|
|
11%
|
|
|
331
|
|||
|
|
Southwest
|
|
430
|
|
4%
|
|
|
413
|
|
10%
|
|
|
377
|
|||
|
|
West
|
|
630
|
|
5%
|
|
|
602
|
|
3%
|
|
|
587
|
|||
|
|
|
|
Consolidated total
|
$
|
439
|
|
3%
|
|
$
|
428
|
|
8%
|
|
$
|
398
|
|
|
|
|
|
|
|
Year Ended December 31,
|
|||||||||||
|
|
|
|
|
|
Actual
2016 |
|
% Change
|
|
Pro Forma
2015 |
|
% Change
|
|
Pro Forma
2014 |
|||
|
|
|
|
|
|
|
|
|
|
|
|
|
|
|
|
|
|
|
Average number of selling communities during the year:
|
|
|
|
|
|
|
|
|
|
|
||||||
|
|
North
|
|
129
|
|
10%
|
|
|
117
|
|
7%
|
|
|
109
|
|||
|
|
Southeast
|
|
183
|
|
6%
|
|
|
173
|
|
12%
|
|
|
155
|
|||
|
|
Southwest
|
|
168
|
|
(8%)
|
|
|
183
|
|
18%
|
|
|
155
|
|||
|
|
West
|
|
90
|
|
6%
|
|
|
85
|
|
13%
|
|
|
75
|
|||
|
|
|
|
Consolidated total
|
|
570
|
|
2%
|
|
|
558
|
|
13%
|
|
|
494
|
|
In addition to the above supplemental pro forma information, the following presents limited unaudited supplemental pro forma operating results as if Ryland had been included in the Company's Consolidated Statements of Operations as of January 1, 2014.
|
|
|
|
|
Year Ended December 31,
|
|||||||||||
|
|
|
|
|
Actual
2016 |
|
% Change
|
|
Pro Forma
2015 |
|
% Change
|
|
Pro Forma
2014 |
|||
|
|
|
|
(Dollars in thousands)
|
||||||||||||
|
|
|
|
|
|
|
|
|
|
|
|
|
|
|
|
|
|
Home sale revenues
|
$
|
6,354,869
|
|
20%
|
|
$
|
5,280,297
|
|
7%
|
|
$
|
4,922,721
|
|||
|
Pretax income
|
$
|
753,116
|
|
46%
|
|
$
|
515,932
|
|
(19%)
|
|
$
|
634,428
|
|||
The supplemental pro forma operating results have been determined in accordance with ASC Topic 805, Business Combinations ("ASC 805") after adjusting the operating results of Ryland to reflect additional amortization that would have been recorded assuming the fair value adjustment to intangible assets had been applied beginning January 1, 2014. Certain
other adjustments, including those related to conforming accounting policies and adjusting acquired inventory to fair value, have not been reflected in the supplemental pro forma operating results due to the impracticability of estimating such impacts. The increase in home sale revenues and pretax income during 2016 was primarily attributable to the increase in deliveries and average selling prices compared to pro forma 2015. The increase in pro forma home sale revenues during 2015 was primarily attributable to the increase in average selling prices, as deliveries experienced a slight decrease compared to pro forma 2014. The decrease in pro forma pretax income during 2015 was primarily attributable to the pro forma 2015 results including $61.7 million of merger costs and a $64.2 million reduction in gross margin from home sales due to the application of purchase accounting related to homes in backlog and speculative homes under construction acquired in connection with the merger.
Discussion and Analysis of CalAtlantic's Actual Results in 2016, 2015 and 2014
Overview
The Company's 2016 results reflect both the continued housing market recovery and the significant impact of the merger, which essentially doubled the size of our Company. We delivered 14,229 homes during 2016, generating home sale revenues of $6,354.9 million, up 84% from the prior year. We reported net income of $484.7 million, or $3.60 per diluted share, as compared to $213.5 million, or $2.26 per diluted share, for 2015. Our 2016 results include $16.5 million of merger costs and an $18.5 million reduction in gross margin from home sales due to the application of purchase accounting related to homes in backlog and speculative homes under construction acquired in connection with the merger, compared to $61.7 million of merger and other one-time costs and a $64.2 million reduction in gross margin from home sales related to purchase accounting in 2015. Homebuilding pretax income for 2016 was $713.5 million, compared to $325.6 million in 2015 and $340.1 million in 2014. Our gross margin from home sales was 21.8% for 2016, compared to 22.4% for 2015, and our operating margin from home sales for 2016 was 11.4%, compared to 11.1% for 2015.
We ended 2016 with $219.4 million of homebuilding cash (including $28.3 million of restricted cash), compared to $187.1 million (including $36.0 million of restricted cash) at the end of the prior year. Net cash provided by operating activities during 2016 was $322.3 million compared to net cash used in operating activities of $271.4 million in 2015. The improvement in operating cash flows for 2016 as compared to the prior year was driven primarily by an 84% increase in homebuilding revenues, partially offset by a $555.2 million increase in cash land purchase and development costs. As of December 31, 2016, we had $637.9 million in remaining availability under our $750 million revolving credit facility.
Homebuilding
|
Year Ended December 31,
|
||||||||||||||||
|
2016
|
% Change
|
2015
|
% Change
|
2014
|
||||||||||||
| (Dollars in thousands) | ||||||||||||||||
|
Homebuilding revenues:
|
||||||||||||||||
|
North
|
$
|
1,017,063
|
287%
|
$
|
262,988
|
n/a
|
$
|
n/a
|
||||||||
|
Southeast
|
1,559,345
|
58%
|
988,773
|
47%
|
672,776
|
|||||||||||
|
Southwest
|
1,659,477
|
87%
|
889,496
|
80%
|
495,008
|
|||||||||||
|
West
|
|
2,152,155
|
59%
|
|
1,355,154
|
9%
|
|
1,243,394
|
||||||||
|
Total homebuilding revenues
|
$
|
6,388,040
|
83%
|
$
|
3,496,411
|
45%
|
$
|
2,411,178
|
||||||||
|
Homebuilding pretax income:
|
||||||||||||||||
|
North
|
$
|
80,498
|
1,349%
|
$
|
5,556
|
n/a
|
$
|
n/a
|
||||||||
|
Southeast
|
130,656
|
87%
|
69,726
|
5%
|
66,232
|
|||||||||||
|
Southwest
|
165,694
|
134%
|
70,851
|
45%
|
48,958
|
|||||||||||
|
West
|
|
336,654
|
88%
|
|
179,417
|
(20%)
|
|
224,931
|
||||||||
|
Total homebuilding pretax income
|
$
|
713,502
|
119%
|
$
|
325,550
|
(4%)
|
$
|
340,121
|
||||||||
|
Homebuilding pretax income as a percentage of homebuilding revenues:
|
||||||||||||||||
|
North
|
7.9%
|
5.8%
|
2.1%
|
n/a
|
n/a
|
|||||||||||
|
Southeast
|
8.4%
|
1.3%
|
7.1%
|
(2.7%)
|
9.8%
|
|||||||||||
|
Southwest
|
10.0%
|
2.0%
|
8.0%
|
(1.9%)
|
9.9%
|
|||||||||||
|
West
|
15.6%
|
2.4%
|
|
13.2%
|
(4.9%)
|
|
18.1%
|
|||||||||
|
Total homebuilding pretax income percentage
|
|
11.2%
|
1.9%
|
|
9.3%
|
(4.8%)
|
|
14.1%
|
||||||||
|
As of December 31,
|
||||||||||||||||
|
2016
|
|
% Change
|
2015
|
|
% Change
|
2014
|
||||||||||
| (Dollars in thousands) | ||||||||||||||||
|
Total Assets:
|
||||||||||||||||
|
North
|
$
|
1,181,544
|
57%
|
$
|
732,689
|
n/a
|
$
|
n/a
|
||||||||
|
Southeast
|
2,253,289
|
26%
|
1,766,241
|
67%
|
1,060,343
|
|||||||||||
|
Southwest
|
1,842,869
|
26%
|
1,470,654
|
135%
|
624,765
|
|||||||||||
|
West
|
2,500,163
|
8%
|
2,357,597
|
35%
|
1,744,308
|
|||||||||||
|
Corporate (1)
|
|
578,780
|
(66%)
|
|
1,678,072
|
239%
|
|
494,920
|
||||||||
|
Total homebuilding
|
8,356,645
|
4%
|
8,005,253
|
104%
|
3,924,336
|
|||||||||||
|
Financial services
|
352,399
|
(17%)
|
424,149
|
87%
|
227,303
|
|||||||||||
|
Total Assets
|
$
|
8,709,044
|
3%
|
$
|
8,429,402
|
103%
|
$
|
4,151,639
|
||||||||
________________
|
(1)
|
The assets in our Corporate Segment include cash and cash equivalents and our deferred tax asset, and at December 31, 2015 included $0.9 billion of goodwill recorded in connection with our merger with Ryland. During the 2016 second quarter, recorded goodwill was allocated to the Company's reporting units (as of December 31, 2016, approximately $0.3 billion was included in each of the North, Southeast and Southwest segments, and approximately $0.1 billion was included in the West segment).
|
For 2016, we generated homebuilding pretax income of $713.5 million compared to $325.6 million in 2015. This increase was primarily the result of an 84% increase in home sale revenues due to our October 1, 2015 merger with Ryland and a decrease in merger and other one-time costs of approximately $45 million, which was partially offset by a decrease in gross margin percentage from home sales. Homebuilding pretax income as a percentage of homebuilding revenues for 2016 increased 190 basis points compared to the prior year, with the North region generating the highest increase of 580 basis points. The North region pretax income as a percentage of home sales for 2015 was significantly and adversely impacted by the fair value accounting applied to homes under construction acquired in connection with the merger, with $20 million recognized as an increase to cost of sales in 2015, compared to $5 million in 2016. Homebuilding pretax income as a percentage of homebuilding revenues for 2016 was relatively consistent across our remaining Southeast, Southwest and West regions, with year over year increases ranging from 130 basis points in the Southeast to 240 basis points in the West.
For 2015, we generated homebuilding pretax income of $325.6 million compared to $340.1 million in 2014. This decrease was primarily the result of approximately $62 million in merger and other one-time costs associated with our October 1, 2015 merger with Ryland, which was partially offset by a 46% increase in home sale revenues. Homebuilding pretax income as a percentage of homebuilding revenues for 2015 decreased 480 basis points compared to 2014, with the West region reporting the highest decrease of 490 basis points. The larger decrease in our West region relative to our Southeast and Southwest regions was primarily the result of our West region being the least impacted by the merger with Ryland, with home sale revenues increasing only 9% during 2015 compared to 47% and 80% increases within our Southeast and Southwest regions, respectively.
Revenues
Homebuilding revenues for 2016 increased 83% from 2015 primarily as a result of an 84% increase in home sale revenues, driven by a 97% increase in new home deliveries. The increase in home sale revenues is primarily attributable to our October 1, 2015 merger with Ryland coupled with meaningful organic growth. On a pro forma basis, home sale revenues increased 20% for 2016 compared to 2015, led by strong increases in the West region, which increased by 35% on a pro forma basis primarily as a result of a 28% increase in deliveries.
The 287% increase in homebuilding revenues for 2016 in the North region was attributable to the merger with Ryland as 2015 only included revenues commencing on the October 1, 2015 merger date whereas 2016 included revenues for the full year. The increase in homebuilding revenues in the Southeast and Southwest regions of 58% and 87%, respectively, was primarily the result of the merger with Ryland and meaningful organic growth. Homebuilding revenues for 2016 increased 59% in the West primarily due to organic growth in the Company's California markets and the impact of the merger in the Company's Arizona market.
Homebuilding revenues for 2015 increased 45% from 2014 primarily as a result of a 46% increase in home sale revenues, driven by a 46% increase in new home deliveries. The increase in home sale revenues is primarily attributable to the merger with Ryland combined with moderate organic growth. On a pro forma basis, home sale revenues increased 7% for the 2015 compared to 2014.
The increase in homebuilding revenues for 2015 in the Southeast and Southwest regions was driven by an increase in new home deliveries of 32% and 79%, respectively, primarily attributable to the merger with Ryland combined with moderate organic growth. Homebuilding revenues in the West region for 2015 was less impacted by the merger with Ryland, and on a pro forma basis increased 2% compared to 2014, driven primarily by a 5% increase in our average home price.
|
Year Ended December 31,
|
||||||||||||||
|
2016
|
% Change
|
2015
|
% Change
|
2014
|
||||||||||
|
New homes delivered:
|
||||||||||||||
|
North
|
3,034
|
286%
|
787
|
n/a
|
n/a
|
|||||||||
|
Southeast
|
4,029
|
63%
|
2,471
|
32%
|
1,871
|
|||||||||
|
Southwest
|
3,891
|
106%
|
1,891
|
79%
|
1,059
|
|||||||||
|
West
|
3,275
|
57%
|
2,088
|
3%
|
2,026
|
|||||||||
|
Consolidated total
|
14,229
|
97%
|
7,237
|
46%
|
4,956
|
|||||||||
New home deliveries increased 97% in 2016 as compared to the prior year, resulting primarily from the new selling communities we acquired in connection with our October 1, 2015 merger with Ryland. New home deliveries increased 46% in 2015 as compared to the prior year, resulting primarily from the backlog and new selling communities we acquired in connection with the Ryland merger.
|
Year Ended December 31,
|
||||||||||||||||
|
2016
|
% Change
|
2015
|
% Change
|
2014
|
||||||||||||
| (Dollars in thousands) | ||||||||||||||||
|
Average selling prices of homes delivered:
|
||||||||||||||||
|
North
|
$
|
335
|
0%
|
$
|
334
|
n/a
|
$
|
n/a
|
||||||||
|
Southeast
|
386
|
(2%)
|
395
|
12%
|
354
|
|||||||||||
|
Southwest
|
426
|
(8%)
|
462
|
(1%)
|
465
|
|||||||||||
|
West
|
|
649
|
1%
|
|
640
|
7%
|
|
598
|
||||||||
|
Consolidated total
|
$
|
447
|
(6%)
|
$
|
477
|
(0%)
|
$
|
478
|
||||||||
During 2016, our consolidated average home price of $447 thousand decreased 6% when compared to $477 thousand for 2015, resulting primarily from a geographic mix shift to a higher proportion of deliveries from communities outside of California. During 2015, our consolidated average home price of $477 thousand was essentially flat when compared to $478 thousand for 2014, resulting primarily from the lower average home price of the homes in backlog we acquired in connection with our October 1, 2015 merger with Ryland.
Gross Margin
Our 2016 gross margin percentage from home sales was 21.8%, down 60 basis points from 22.4% in 2015. Our 2016 gross margins were adversely impacted by the fair value accounting applied to homes in backlog and speculative homes under construction acquired in connection with our October 1, 2015 merger with Ryland, with fair value accounting causing us to recognize approximately $19 million as an increase to cost of sales during 2016, as well as a mix shift from higher to lower margin communities.
Our 2015 gross margin percentage from home sales was 22.4%, down 370 basis points from 26.1% in 2014. Our 2015 gross margins were significantly and adversely impacted by the fair value accounting applied to homes under construction acquired in connection with the merger, with fair value accounting causing us to recognize approximately $64 million as an increase to cost of sales during the 2015 fourth quarter.
SG&A Expenses
Our 2016 SG&A expenses (including corporate G&A) were $664.5 million compared to $390.7 million for the prior year. Despite this increase in dollar amount, our 2016 SG&A rate from home sales was 10.5% versus 11.3% for 2015. This 80 basis point improvement was primarily the result of an 84% increase in home sale revenues and the operating leverage we gained in connection with our October 1, 2015 merger with Ryland. We continue to leverage our G&A expenses as our home sale revenues have increased year over year, with G&A expenses as a percentage of home sale revenues improving to 5.3% for 2016 compared to 6.3% for 2015. Our selling expenses as a percentage of home sale revenues increased slightly at 5.2% for 2016 compared to 5.0% for 2015.
Our 2015 SG&A expenses (including corporate G&A) were $390.7 million compared to $275.9 million for 2014, and our 2015 SG&A rate from home sales was 11.3% versus 11.7% for 2014. This 40 basis point improvement was primarily the result of a 46% increase in home sale revenues and the operating leverage we gained in connection with the merger, with G&A expenses as a percentage of home sale revenues improving to 6.3% for 2015 compared to 6.8% for 2014. Our selling expenses as a percentage of home sale revenues increased slightly at 5.0% for 2015 compared to 4.9% for 2014.
Interest Expense
During the years ended December 31, 2016, 2015 and 2014, our qualified assets exceeded our debt. As of December 31, 2016, 2015 and 2014, the amount of our qualified assets in excess of our debt was $1.3 billion, $1.6 billion and $827.7 million, respectively. As a result, all of our interest incurred during 2016, 2015 and 2014 was capitalized in accordance with ASC Topic 835, Interest.
Other Income (Expense)
Other expense for 2016 was primarily attributable to $16.5 million in transaction and other one-time costs incurred in connection with our October 1, 2015 merger with Ryland. Other expense for 2015 was primarily attributable to $61.7 million in transaction and other one-time costs incurred in connection with the merger, including $9.7 million in project abandonment costs.
Operating Data
|
Year Ended December 31,
|
|||||||||||||||||
|
2016
|
% Change
|
% Absorption Change (1)
|
2015
|
% Change
|
% Absorption Change (1)
|
2014
|
|||||||||||
|
Net new orders (2):
|
|||||||||||||||||
|
North
|
3,329
|
499%
|
39%
|
556
|
n/a
|
n/a
|
n/a
|
||||||||||
|
Southeast
|
4,201
|
79%
|
9%
|
2,342
|
27%
|
(15%)
|
1,841
|
||||||||||
|
Southwest
|
3,603
|
96%
|
2%
|
1,838
|
52%
|
(12%)
|
1,207
|
||||||||||
|
West
|
3,302
|
36%
|
7%
|
2,427
|
26%
|
3%
|
1,919
|
||||||||||
|
Consolidated total
|
14,435
|
102%
|
6%
|
7,163
|
44%
|
(12%)
|
4,967
|
||||||||||
________________
|
(1)
|
Represents the percentage change of net new orders per average number of selling communities during the period.
|
|
(2)
|
Net new orders are new orders for the purchase of homes during the period, less cancellations during such period of existing contracts for the purchase of homes.
|
|
|
|
|
|
|
Year Ended December 31,
|
||||||||
|
|
|
|
|
|
2016
|
|
% Change
|
|
2015
|
|
% Change
|
|
2014
|
|
|
|
|
|
|
|
|
|
|
|
|
|
|
|
|
Cancellation rates:
|
|
|
|
|
|
|
|
|
|
|
|||
|
|
North
|
15%
|
|
(7%)
|
|
22%
|
|
n/a
|
|
n/a
|
|||
|
|
Southeast
|
14%
|
|
(1%)
|
|
15%
|
|
1%
|
|
14%
|
|||
|
|
Southwest
|
16%
|
|
(1%)
|
|
17%
|
|
1%
|
|
16%
|
|||
|
|
West
|
18%
|
|
(2%)
|
|
20%
|
|
―
|
|
20%
|
|||
|
|
|
|
Consolidated total
|
16%
|
|
(2%)
|
|
18%
|
|
1%
|
|
17%
|
|
|
|
|
|
|
|
Year Ended December 31,
|
|||||||||||
|
|
|
|
|
|
2016
|
|
% Change
|
|
2015
|
|
% Change
|
|
2014
|
|||
|
|
|
|
|
(Dollars in thousands)
|
||||||||||||
|
Average selling prices of net new orders:
|
|
|
|
|
|
|
|
|
|
|
|
|
|
|||
|
|
North
|
$
|
337
|
|
(3%)
|
|
$
|
348
|
|
n/a
|
|
$
|
n/a
|
|||
|
|
Southeast
|
|
378
|
|
(10%)
|
|
|
422
|
|
13%
|
|
|
374
|
|||
|
|
Southwest
|
|
430
|
|
(11%)
|
|
|
481
|
|
2%
|
|
|
473
|
|||
|
|
West
|
|
630
|
|
(4%)
|
|
|
653
|
|
9%
|
|
|
600
|
|||
|
|
|
|
Consolidated total
|
$
|
439
|
|
(14%)
|
|
$
|
510
|
|
5%
|
|
$
|
485
|
|
|
Year Ended December 31,
|
|||||||||||||
|
2016
|
% Change
|
2015
|
% Change
|
2014
|
|||||||||
|
Average number of selling communities during the year:
|
|||||||||||||
|
North
|
129
|
330%
|
30
|
n/a
|
n/a
|
||||||||
|
Southeast
|
183
|
65%
|
111
|
50%
|
74
|
||||||||
|
Southwest
|
168
|
93%
|
87
|
74%
|
50
|
||||||||
|
West
|
90
|
27%
|
71
|
22%
|
58
|
||||||||
|
Consolidated total
|
570
|
91%
|
299
|
64%
|
182
|
||||||||
Net new orders for 2016 increased 102% from the prior year on a 91% increase in the number of average active selling communities. Our monthly sales absorption rate was 2.1 per community for 2016, up from 2.0 for 2015, and was 1.6 per community for the 2016 fourth quarter, which was flat compared to the 2015 fourth quarter. The 6% increase in our sales absorption rate during 2016 on a consolidated basis reflects positive increases across all regions, from up 2% in the Southwest, to up 39% in the North, where substantially all divisions within the region had strong double digit increases. Our consolidated cancellation rate for 2016 was 16% compared to 18% for 2015, and was 20% for the 2016 fourth quarter compared to 22% for the 2015 fourth quarter. Our 2016 fourth quarter cancellation rate was consistent with our average historical cancellation rate over the last 10 years.
Net new orders for 2015 increased 44% from the prior year on a 64% increase in the number of average active selling communities. Our monthly sales absorption rate was 2.0 per community for 2015, down from 2.3 for 2014. This decrease in our sales absorption reflected our emphasis on margin over sales pace. Our consolidated cancellation rate for 2015 was 18% compared to 17% for 2014.
At December 31, 2016 and 2015, we had 583 and 575 active selling communities, respectively.
|
As of December 31,
|
|||||||||||||||||
|
2016
|
2015
|
% Change
|
|||||||||||||||
|
Backlog ($ in thousands):
|
Homes
|
Dollar
Value |
Homes
|
Dollar
Value |
Homes
|
Dollar
Value |
|||||||||||
|
North
|
1,298
|
$
|
464,253
|
1,003
|
$
|
348,285
|
29%
|
33%
|
|||||||||
|
Southeast
|
1,793
|
776,402
|
1,621
|
702,388
|
11%
|
11%
|
|||||||||||
|
Southwest
|
1,614
|
764,583
|
1,902
|
845,499
|
(15%)
|
(10%)
|
|||||||||||
|
West
|
1,112
|
|
658,613
|
1,085
|
|
675,920
|
2%
|
(3%)
|
|||||||||
|
Consolidated total
|
5,817
|
$
|
2,663,851
|
5,611
|
$
|
2,572,092
|
4%
|
4%
|
|||||||||
The dollar value of our backlog as of December 31, 2016 increased 4% from 2015 to $2.7 billion. The increase in backlog value from 2015 was driven entirely by the 4% increase in units in backlog as our averages sales price in backlog was flat year over year.
|
At December 31,
|
|||||||||||||
|
2016
|
% Change
|
2015
|
% Change
|
2014
|
|||||||||
|
Homesites owned and controlled:
|
|||||||||||||
|
North
|
15,087
|
(1%)
|
15,222
|
n/a
|
n/a
|
||||||||
|
Southeast
|
22,358
|
(8%)
|
24,393
|
48%
|
16,458
|
||||||||
|
Southwest
|
14,151
|
(12%)
|
16,151
|
133%
|
6,944
|
||||||||
|
West
|
13,828
|
(6%)
|
14,728
|
22%
|
12,028
|
||||||||
|
Total (including joint ventures)
|
65,424
|
(7%)
|
70,494
|
99%
|
35,430
|
||||||||
|
Homesites owned
|
50,735
|
(4%)
|
52,583
|
81%
|
28,972
|
||||||||
|
Homesites optioned or subject to contract
|
13,142
|
(18%)
|
15,972
|
155%
|
6,260
|
||||||||
|
Joint venture homesites (1)
|
1,547
|
(20%)
|
1,939
|
879%
|
198
|
||||||||
|
Total (including joint ventures) (1)
|
65,424
|
(7%)
|
70,494
|
99%
|
35,430
|
||||||||
|
Homesites owned:
|
|||||||||||||
|
Raw lots
|
13,018
|
48%
|
8,814
|
8%
|
8,162
|
||||||||
|
Homesites under development
|
13,239
|
(43%)
|
23,395
|
188%
|
8,119
|
||||||||
|
Finished homesites
|
13,516
|
42%
|
9,488
|
32%
|
7,210
|
||||||||
|
Under construction or completed homes
|
8,567
|
(6%)
|
9,092
|
193%
|
3,104
|
||||||||
|
Held for sale
|
2,395
|
34%
|
1,794
|
(25%)
|
2,377
|
||||||||
|
Consolidated total
|
50,735
|
(4%)
|
52,583
|
81%
|
28,972
|
||||||||
________________
|
(1)
|
Joint venture homesites represent our expected share of land development joint venture homesites and all of the homesites of our homebuilding joint ventures.
|
Total homesites owned and controlled as of December 31, 2016 decreased 7% from 2015. We believe our land pipeline remains strong and we continue to find opportunities that meet our disciplined underwriting criteria. We purchased $960.8 million of land (13,566 homesites) during 2016. The homesites we purchased during 2016 were located as follows: 25% (based on homesites) in the North, 25% in the Southeast, 24% in the Southwest and 26% in the West. During 2015 we purchased $515.3 million of land (6,631 homesites) and acquired an additional 40,245 homesites as a result of our October 1, 2015 merger with Ryland. The homesites we purchased during 2015, other than through the merger, were located as follows 12% (based on homesites) in the North, 39% in the Southeast, 18% in the Southwest and 31% in the West. As of December 31, 2016, we owned or controlled 65,424 homesites, of which 45,699 are owned and actively selling or under development, 14,689 are controlled or under option, and the remaining 5,036 homesites are held for future development or for sale.
|
At December 31,
|
||||||||||||||
|
2016
|
% Change
|
2015
|
% Change
|
2014
|
||||||||||
|
Homes under construction and speculative homes:
|
||||||||||||||
|
Homes under construction (excluding specs)
|
3,598
|
(16%)
|
4,304
|
281%
|
1,131
|
|||||||||
|
Speculative homes under construction
|
2,194
|
23%
|
1,777
|
97%
|
901
|
|||||||||
|
Total homes under construction
|
5,792
|
(5%)
|
6,081
|
199%
|
2,032
|
|||||||||
|
Completed homes:
|
||||||||||||||
|
Completed and unsold homes (excluding models)
|
1,255
|
(5%)
|
1,325
|
157%
|
515
|
|||||||||
|
Completed and under contract (excluding models)
|
623
|
(17%)
|
754
|
266%
|
206
|
|||||||||
|
Model homes
|
897
|
(3%)
|
929
|
165%
|
351
|
|||||||||
|
Total completed homes
|
2,775
|
(8%)
|
3,008
|
181%
|
1,072
|
|||||||||
Total homes under construction (excluding speculative homes) as of December 31, 2016 were down 5% compared to December 31, 2015. Speculative homes under construction and completed and unsold homes (excluding models) as of December 31, 2016 increased 11% over the prior year period, resulting primarily from a year-over-year increase in our number of active selling communities and our strategy to maintain a supply of speculative homes in each community.
Financial Services
For 2016, our financial services segment generated pretax income of $39.6 million compared to $16.9 million in 2015. The increase in 2016 was driven by a 56% increase in the dollar volume of loans originated and sold, a $15.2 million increase in title service revenues and an increase in margins on loans closed and sold. These changes were partially offset by an increase in personnel expenses as a result of higher production levels in 2016 compared to 2015.
For 2015, our financial services segment generated pretax income of $16.9 million compared to $9.8 million in 2014. The increase in 2015 was driven by a 51% increase in the dollar volume of loans originated and sold and a $5.6 million increase in title service revenues. These changes were partially offset by lower margins on loans closed and sold.
The following table details information regarding loan originations and related credit statistics for our mortgage financing operations:
|
Year Ended December 31,
|
|||||||||
|
2016
|
2015
|
2014
|
|||||||
| (Dollars in thousands) | |||||||||
|
Total Originations:
|
|||||||||
|
Loans
|
7,191
|
4,356
|
2,936
|
||||||
|
Principal
|
$2,244,033
|
$1,478,196
|
$986,335
|
||||||
|
Capture rate
|
57%
|
71%
|
77%
|
||||||
|
Loans Sold to Third Parties:
|
|||||||||
|
Loans
|
7,327
|
4,259
|
2,806
|
||||||
|
Principal
|
$2,293,923
|
$1,423,576
|
$931,786
|
||||||
|
Mortgage Loan Origination Product Mix:
|
|||||||||
|
FHA loans
|
15%
|
13%
|
8%
|
||||||
|
Other government loans (VA & USDA)
|
11%
|
10%
|
10%
|
||||||
|
Total government loans
|
26%
|
23%
|
18%
|
||||||
|
Conforming loans
|
70%
|
69%
|
74%
|
||||||
|
Jumbo loans
|
4%
|
8%
|
8%
|
||||||
|
100%
|
100%
|
100%
|
|||||||
|
Loan Type:
|
|||||||||
|
Fixed
|
97%
|
93%
|
92%
|
||||||
|
ARM
|
3%
|
7%
|
8%
|
||||||
|
Credit Quality:
|
|||||||||
|
Avg. FICO score
|
739
|
746
|
752
|
||||||
|
Other Data:
|
|||||||||
|
Avg. combined LTV ratio
|
82%
|
82%
|
80%
|
||||||
|
Full documentation loans
|
100%
|
100%
|
100%
|
||||||
|
Non-Full documentation loans
|
―
|
―
|
―
|
||||||
Income Taxes
Our 2016 provision for income taxes was $268.4 million primarily related to our $753.1 million of pretax income. As of December 31, 2016, we had a $332.8 million deferred tax asset which was offset by a valuation allowance of $2.5 million related to state net operating loss carryforwards that are limited by shorter carryforward periods. As of such date, $103.9 million of our deferred tax asset related to net operating loss carryforwards is subject to the Internal Revenue Code Section 382 gross annual deduction limitation of $15.6 million for both federal and state purposes. Additionally, $21.7 million of our state deferred tax asset related to net operating losses is subject to 382 limitations resulting from our October 1, 2015 merger with Ryland, and $12.0 million related to state net operating loss carryfowards that are not limited by Section 382. The remaining deferred tax asset balance of $195.1 million represented deductible timing differences, primarily related to inventory impairment and financial accruals, which have no expiration date.
Each quarter we assess our deferred tax asset to determine whether all or any portion of the asset is more likely than not unrealizable in accordance with ASC Topic 740, Income Taxes ("ASC 740"). ASC 740 requires an assessment of available positive and negative evidence and, if the available positive evidence outweighs the available negative evidence, such that we are able to conclude that it is more likely than not (likelihood of more than 50%) that our deferred tax asset will be realized, we are required to reverse any corresponding deferred tax asset valuation allowance. We continue to evaluate our deferred tax asset on a quarterly basis and note that, if economic conditions were to change such that we earn less taxable income than the amount required to fully utilize our deferred tax asset, a portion of the asset may expire unused. See Note 13 to our accompanying consolidated financial statements for further discussion.
Liquidity and Capital Resources
Our principal uses of cash over the last several years have been for:
|
· land acquisition
· homebuilder acquisitions
· investments in joint ventures
|
· principal and interest payments on debt
· cash collateralization
· stock repurchases
|
|
· construction and development
· operating expenses
|
· the payment of dividends
|
Cash requirements over the last several years have been met by:
|
· internally generated funds
· bank revolving credit and term loans
· land option contracts and seller notes
· sales of our equity
· note offerings
|
· joint venture financings
· assessment district bond financings
· letters of credit and surety bonds
· mortgage credit facilities
|
For the year ended December 31, 2016, cash provided by operating activities was $322.3 million versus cash used in operating activities of $271.4 million in the year earlier period. The change in operating activities cash flow during 2016 as compared to the prior year was driven primarily by an 83% increase in homebuilding revenues, partially offset by a $555.2 million increase in cash land purchase and development costs. Cash flows from financing activities for 2016 included $297.3 million of net proceeds from the issuance of 5.25% Senior Notes due 2026 during the 2016 second quarter, offset by a $280 million repayment of our 10.75% Senior Notes upon maturity in September 2016 and $232.5 million of stock repurchases. As of December 31, 2016, our homebuilding cash balance was $219.4 million (including $28.3 million of restricted cash).
Revolving Credit Facility. As of December 31, 2016, we were party to a $750 million unsecured revolving credit facility (the "Revolving Facility"), $350 million of which is available for letters of credit, which matures in October 2019. The Revolving Facility has an accordion feature under which the Company may increase the total commitment up to a maximum aggregate amount of $1.2 billion, subject to certain conditions, including the availability of additional bank commitments. Interest rates, as defined in the credit agreement, approximate (i) LIBOR (approximately 0.77% at December 31, 2016) plus 1.75%, or (ii) Prime (3.75% at December 31, 2016) plus 0.75%.
In addition to customary representations and warranties, the facility contains financial and other covenants, including a minimum tangible net worth requirement of $1.65 billion (which amount is subject to increase over time based on subsequent earnings and proceeds from equity offerings), a net homebuilding leverage covenant that prohibits the leverage ratio (as defined therein) from exceeding 2.00 to 1.00 and a land covenant that limits land not under development to an amount not to exceed tangible net worth. The Company is also required to maintain either (a) a minimum liquidity level (unrestricted cash in excess of interest incurred for the previous four quarters) or (b) a minimum interest coverage ratio (EBITDA to interest expense, as defined therein) of at least 1.25 to 1.00. The Revolving Facility also limits, among other things, the Company's investments in joint ventures and the amount of the Company's common stock that the Company can repurchase. On December 31, 2016, no borrowings were outstanding under the facility and the Company had outstanding letters of credit issued under the facility totaling $112.1 million, leaving $637.9 million available under the facility to be drawn.
Our covenant compliance for the Revolving Facility is set forth in the table below:
|
Covenant and Other Requirements
|
Actual at
December 31, 2016
|
Covenant
Requirements at
December 31, 2016
|
||||
| (Dollars in millions) | ||||||
|
Consolidated Tangible Net Worth (1)
|
$3,237.4 | ≥ $1,933.3 | ||||
| Leverage Ratio: | ||||||
|
Net Homebuilding Debt to Adjusted Consolidated Tangible Net Worth Ratio (2)
|
1.03
|
≤ 2.00
|
||||
| Liquidity or Interest Coverage Ratio (3): | ||||||
| Liquidity | $143.5 | ≥ $224.0 | ||||
| EBITDA (as defined in the Revolving Facility) to Consolidated Interest Incurred (4) | 3.12 | ≥ 1.25 | ||||
| Investments in Homebuilding Joint Ventures or Consolidated Homebuilding Non-Guarantor Entities (5) | $841.2 | ≤ $1,213.1 | ||||
________________
|
(1)
|
The minimum covenant requirement amount is subject to increase over time based on subsequent earnings (without deductions for losses) and proceeds from equity offerings.
|
|
(2)
|
Net Homebuilding Debt represents Consolidated Homebuilding Debt reduced for certain cash balances in excess of $5 million.
|
|
(3)
|
Under the liquidity and interest coverage ratio covenant, we are required to either (i) maintain an unrestricted cash balance in excess of our consolidated interest incurred for the previous four fiscal quarters or (ii) satisfy a minimum interest coverage ratio.
|
|
(4)
|
Consolidated Interest Incurred excludes noncash interest expense.
|
|
(5)
|
Net investments in unconsolidated homebuilding joint ventures or consolidated homebuilding non-guarantor entities must not exceed 35% of consolidated tangible net worth plus $80 million.
|
Letter of Credit Facilities. As of December 31, 2016, in addition to our $350 million letter of credit sublimit under our revolving credit facility, we were party to four committed letter of credit facilities totaling $48 million, of which $26.7 million was outstanding. These facilities require cash collateralization and have maturity dates ranging from January 2017 to October 2017. As of December 31, 2016, these facilities were secured by cash collateral deposits of $27.1 million. Upon maturity, we may renew or enter into new letter of credit facilities with the same or other financial institutions.
As of the date of this filing, we are working with one financial institution to extend the letter of credit facility which matured in January 2017 with a commitment amount of $15 million, of which $7.2 million of letters of credit remain outstanding.
Senior and Convertible Senior Notes. As of December 31, 2016, the principal amount outstanding on our senior and convertible senior notes payable consisted of the following:
|
December 31, 2016
|
|||
| (Dollars in thousands) | |||
|
8.4 % Senior Notes due May 2017
|
$
|
230,000
|
|
|
8.375% Senior Notes due May 2018
|
575,000
|
||
|
1.625% Convertible Senior Notes due May 2018
|
225,000
|
||
|
0.25% Convertible Senior Notes due June 2019
|
267,500
|
||
|
6.625% Senior Notes due May 2020
|
300,000
|
||
|
8.375% Senior Notes due January 2021
|
400,000
|
||
|
6.25% Senior Notes due December 2021
|
300,000
|
||
|
5.375% Senior Notes due October 2022
|
250,000
|
||
|
5.875% Senior Notes due November 2024
|
300,000
|
||
|
5.25% Senior Notes due June 2026
|
300,000
|
||
|
1.25% Convertible Senior Notes due August 2032 (1)
|
253,000
|
||
|
$
|
3,400,500
|
||
________________
|
(1)
|
On each of August 1, 2017, August 1, 2022 and August 1, 2027, holders of the 1.25% Convertible Senior Notes may require the Company to purchase all or any portion of their 1.25% Convertible Senior Notes for cash at a price equal to 100% of the principal amount of the Convertible Notes to be repurchased.
|
As required by the applicable note indentures, certain Company subsidiaries guarantee the Company's obligations under the notes. The guarantees are unsecured obligations of each subsidiary, ranking equal in right of payment with all such subsidiary's existing and future unsecured and unsubordinated indebtedness. Interest on each series of notes is payable semi-annually. Each of the senior notes rank equally with all of the Company's other unsecured and unsubordinated indebtedness.
The Company's notes contain various restrictive covenants, including, but not limited to, a limitation on secured indebtedness and a restriction on sale leaseback transactions. As of December 31, 2016, we were in compliance with the covenants required by our senior notes.
During the 2016 second quarter, the Company issued $300 million in aggregate principal amount of 5.25% Senior Notes due 2026, which are senior unsecured obligations of the Company and are guaranteed by the guarantors of our other senior notes on a senior unsecured basis. A portion of the net proceeds of this issuance was used to repay the remaining $280 million principal balance of our 10.75% Senior Notes upon maturity in September 2016.
The Company's 1.625% Convertible Senior Notes due 2018 (the "1.625% Convertible Notes") are senior unsecured obligations of the Company and are guaranteed by the guarantors of our other senior notes on a senior unsecured basis. The 1.625% Convertible Notes will mature on May 15, 2018, unless earlier converted or repurchased. The holders may convert their 1.625% Convertible Notes at any time into shares of the Company's common stock at a conversion rate of 31.8576 shares of common stock per $1,000 of their principal amount (which is equal to a conversion price of approximately $31.39 per share), subject to adjustment. The Company may not redeem the 1.625% Convertible Notes prior to the stated maturity date.
The Company's 0.25% Convertible Senior Notes due 2019 (the "0.25% Convertible Notes") are senior unsecured obligations of the Company and are guaranteed by the guarantors of our other senior notes on a senior unsecured basis. The 0.25% Convertible Notes will mature on June 1, 2019, unless earlier converted, redeemed or repurchased. The holders may convert their 0.25% Convertible Notes at any time into shares of the Company's common stock at a conversion rate of 13.6043 shares of common stock per $1,000 of their principal amount (which is equal to a conversion price of approximately
$73.51 per share), subject to adjustment. The Company may not redeem the 0.25% Convertible Notes prior to June 6, 2017. On or after that date, the Company may redeem for cash any or all of the 0.25% Convertible Notes, at its option, if the closing sale price of its common stock for at least 20 trading days (whether or not consecutive) during any 30 consecutive trading day period ending within 5 trading days immediately preceding the date on which it provides notice of redemption, including the last trading day of such 30 day trading period, exceeds 130 percent of the applicable conversion price on each applicable trading day. The redemption price will equal 100 percent of the principal amount of the 0.25% Convertible Notes to be redeemed, plus accrued and unpaid interest to, but excluding, the redemption date.
The Company's 1.25% Convertible Senior Notes due 2032 (the "1.25% Convertible Notes") are senior unsecured obligations of the Company and are guaranteed by the guarantors of our other senior notes on a senior unsecured basis. The 1.25% Convertible Notes will mature on August 1, 2032, unless earlier converted, redeemed or repurchased. The holders may convert their 1.25% Convertible Notes at any time into shares of the Company's common stock at a conversion rate of 24.8941 shares of common stock per $1,000 of their principal amount (which is equal to a conversion price of approximately $40.17 per share), subject to adjustment. The Company may not redeem the 1.25% Convertible Notes prior to August 5, 2017. On or after August 5, 2017 and prior to the maturity date, the Company may redeem for cash all or part of the 1.25% Convertible Notes at a redemption price equal to 100% of the principal amount of the 1.25% Convertible Notes being redeemed. On each of August 1, 2017, August 1, 2022 and August 1, 2027, holders of the 1.25% Convertible Notes may require the Company to purchase all or any portion of their 1.25% Convertible Notes for cash at a price equal to 100% of the principal amount of the 1.25% Convertible Notes to be repurchased.
Potential Future Transactions. In the future, we may, from time to time, undertake negotiated or open market purchases of, or tender offers for, our notes prior to maturity when they can be purchased at prices that we believe are attractive. We may also, from time to time, engage in exchange transactions (including debt for equity and debt for debt transactions) for all or part of our notes. Such transactions, if any, will depend on market conditions, our liquidity requirements, contractual restrictions and other factors.
Joint Venture Loans. As described more particularly under the heading "Off-Balance Sheet Arrangements", our land development and homebuilding joint ventures have historically obtained secured acquisition, development and/or construction financing. This financing is designed to reduce the use of funds from our corporate financing sources. As of December 31, 2016, only two joint ventures had project specific debt outstanding, which totaled $31.0 million. This joint venture bank debt was non-recourse to us. At December 31, 2016, we had no joint venture surety bonds outstanding subject to indemnity arrangements by us.
Secured Project Debt and Other Notes Payable. At December 31, 2016, we had $27.6 million outstanding in secured project debt and other notes payable. Our secured project debt and other notes payable consist of seller non-recourse financing and community development district and similar assessment district bond financings used to finance land acquisition, development and infrastructure costs for which we are responsible.
Mortgage Credit Facility. At December 31, 2016, we had $247.4 million outstanding under our mortgage financing subsidiary's mortgage credit facility. This mortgage credit facility consisted of a $300 million uncommitted repurchase facility with one lender, maturing in April 2017. This facility requires our mortgage financing subsidiary to maintain cash collateral accounts, which totaled $3.0 million as of December 31, 2016, and also contains financial covenants which require CalAtlantic Mortgage to, among other things, maintain a minimum level of tangible net worth, not to exceed a debt to tangible net worth ratio, maintain a minimum liquidity amount based on a measure of total assets (inclusive of the cash collateral requirement), and satisfy pretax income (loss) requirements. As of December 31, 2016, CalAtlantic Mortgage was in compliance with the financial and other covenants contained in this facility.
Surety Bonds. Surety bonds serve as a source of liquidity for the Company because they are used in lieu of cash deposits and letters of credit that would otherwise be required by governmental entities and other third parties to ensure our completion of the infrastructure of our communities and other performance obligations. At December 31, 2016, we had approximately $892.1 million in surety bonds outstanding (exclusive of surety bonds related to our joint ventures), with respect to which we had an estimated $445.1 million remaining in cost to complete.
Availability of Additional Liquidity. Over the last several years we have focused on acquiring and developing strategically located and appropriately priced land and on designing and building highly desirable, amenity-rich communities and homes that appeal to the home buying segments we target. In the near term, so long as we are able to continue to find appropriately priced land opportunities, we plan to continue with this strategy. To that end, we may utilize cash generated from our operating activities, our $750 million revolving credit facility (including through the exercise of the accordion
feature which would allow the facility be increased up to $1.2 billion, subject to the availability of additional capital commitments and certain other conditions) and the debt and equity capital markets to finance these activities.
It is important to note, however, that the availability of additional capital, whether from private capital sources (including banks) or the public capital markets, fluctuates as market conditions change. There may be times when the private capital markets and the public debt or equity markets lack sufficient liquidity or when our securities cannot be sold at attractive prices, in which case we would not be able to access capital from these sources. A weakening of our financial condition, including in particular, a material increase in our leverage or a decrease in our profitability or cash flows, could adversely affect our ability to obtain necessary funds, result in a credit rating downgrade or change in outlook, or otherwise increase our cost of borrowing.
Dividends. For the year ended December 31, 2016, we paid a dividend of $0.04 per share on March 30, June 30, September 30 and December 30, 2016, respectively. We paid a dividend of $0.04 per share on December 30 during the year ended December 31, 2015. We did not pay dividends in 2014. On February 10, 2017 our Board of Directors declared a dividend of $0.04 per share to be paid on March 30, 2017 to holders of record on March 15, 2017.
Stock Repurchases. On October 28, 2014, we announced that our Board of Directors authorized a $100 million stock repurchase plan. During 2014, we repurchased 1.0 million shares of our common stock in open market transactions under the plan. During 2015, we repurchased 645 thousand shares of our common stock in open market transactions under the plan. On February 11, 2016 we announced a new $200 million share repurchase plan that replaces in its entirety the remaining authorization available on the October 28, 2014 plan. On July 27, 2016, our Board of Directors authorized a new $500 million stock repurchase plan that replaces in its entirety its previous $200 million authorization. During 2016, we repurchased 7.3 million shares of our common stock in open market transactions under the plan, and as of December 31, 2016, we had remaining authorization to repurchase $367.4 million of our common stock.
Leverage. Our homebuilding debt to total book capitalization as of December 31, 2016 was 44.8%. In addition, our homebuilding debt to adjusted homebuilding EBITDA for the trailing twelve month periods ended December 31, 2016 and 2015 was 3.4x and 5.4x, respectively, and our adjusted net homebuilding debt (homebuilding debt net of homebuilding cash and restricted cash) to adjusted homebuilding EBITDA was 3.2x and 5.1x, respectively (please see page 20 for the reconciliation of net income, calculated and presented in accordance with GAAP, to adjusted homebuilding EBITDA). We believe that these adjusted ratios are useful to investors as additional measures of our ability to service debt.
Contractual Obligations
The following table summarizes our future estimated cash payments under existing contractual obligations as of December 31, 2016, including estimated cash payments due by period.
|
Payments Due by Period
|
||||||||||||||||||||
|
Total
|
Less Than 1 Year
|
1-3 Years
|
4-5 Years
|
After
5 Years |
||||||||||||||||
| (Dollars in thousands) | ||||||||||||||||||||
|
Contractual Obligations
|
||||||||||||||||||||
|
Long-term debt principal payments (1)
|
$
|
3,428,079
|
$
|
246,958
|
$
|
1,077,673
|
$
|
1,000,448
|
$
|
1,103,000
|
||||||||||
|
Long-term debt interest payments
|
846,924
|
194,162
|
297,597
|
191,383
|
163,782
|
|||||||||||||||
|
Operating leases (2)
|
40,952
|
10,104
|
16,460
|
9,554
|
4,834
|
|||||||||||||||
|
Purchase obligations (3)
|
744,689
|
349,399
|
324,635
|
64,434
|
6,221
|
|||||||||||||||
|
Total
|
$
|
5,060,644
|
$
|
800,623
|
$
|
1,716,365
|
$
|
1,265,819
|
$
|
1,277,837
|
||||||||||
________________
|
(1)
|
Long-term debt represents principal amount of senior and convertible senior notes payable and secured project debt and other notes payable. For a more detailed description of our long-term debt, please see Note 8 in our accompanying consolidated financial statements.
|
|
(2)
|
For a more detailed description of our operating leases, please see Note 12.f. in our accompanying consolidated financial statements.
|
|
(3)
|
Purchase obligations represent commitments (net of deposits) for land purchase and option contracts with non-refundable deposits. For a more detailed description of our land purchase and option contracts, please see "Off-Balance Sheet Arrangements" below and Note 12.a. in our accompanying consolidated financial statements.
|
At December 31, 2016, we had a $300 million uncommitted repurchase facility with one lender, maturing in April 2017, and had $247.4 million outstanding under the facility.
Off-Balance Sheet Arrangements
Land Purchase and Option Agreements
We are subject to customary obligations associated with entering into contracts for the purchase of land and improved homesites. These purchase contracts typically require us to provide a cash deposit or deliver a letter of credit in favor of the seller, and our purchase of properties under these contracts is generally contingent upon satisfaction of certain requirements by the sellers, including obtaining applicable property and development entitlements. We also utilize option contracts with land sellers as a method of acquiring land in staged takedowns, to help us manage the financial and market risk associated with land holdings, and to reduce the near-term use of funds from our corporate financing sources. Option contracts generally require us to provide a non-refundable deposit for the right to acquire lots over a specified period of time at predetermined prices. We generally have the right at our discretion to terminate our obligations under both purchase contracts and option contracts by forfeiting our cash deposit or by repaying amounts drawn under our letter of credit with no further financial responsibility to the land seller, although in certain instances, the land seller has the right to compel us to purchase a specified number of lots at predetermined prices.
In some instances, we may also expend funds for due diligence, development and construction activities with respect to our land purchase and option contracts prior to purchase, which we would have to write off should we not purchase the land. At December 31, 2016, we had non-refundable cash deposits outstanding of approximately $59.9 million and capitalized pre-acquisition and other development and construction costs of approximately $13.1 million relating to land purchase and option contracts having a total remaining purchase price of approximately $744.7 million.
Our utilization of option contracts is dependent on, among other things, the availability of land sellers willing to enter into option takedown arrangements, the availability of capital to financial intermediaries, general housing market conditions, and geographic preferences. Options may be more difficult to procure from land sellers in strong housing markets and are more prevalent in certain geographic regions.
Land Development and Homebuilding Joint Ventures
Historically, we have entered into land development and homebuilding joint ventures from time to time as a means of:
|
· accessing larger or highly desirable lot positions
· establishing strategic alliances
· leveraging our capital base
|
· expanding our market opportunities
· managing the financial and market risk associated with land holdings
|
These joint ventures have historically obtained secured acquisition, development and/or construction financing designed to reduce the use of funds from our corporate financing sources. As of December 31, 2016, we held ownership interests in 27 homebuilding and land development joint ventures, of which 13 were active and 14 were inactive or winding down. As of such date, only two joint ventures had project specific debt outstanding, which totaled $31.0 million. This joint venture debt is non-recourse to us and is scheduled to mature in June 2017. At December 31, 2016, we had no joint venture surety bonds outstanding subject to indemnity arrangements by us.
Critical Accounting Policies
The preparation of our consolidated financial statements requires us to make estimates and judgments that affect the reported amounts of our assets, liabilities, revenues and expenses, and the related disclosure of contingent assets and liabilities. On an ongoing basis, we evaluate our estimates and judgments, including those that impact our most critical accounting policies. We base our estimates and judgments on historical experience and various other assumptions that are believed to be reasonable under the circumstances. Actual results may differ from these estimates under different assumptions or conditions. We believe that the accounting policies related to the following accounts or activities are those that are most critical to the portrayal of our financial condition and results of operations and require the more significant judgments and estimates:
Segment Reporting
The application of segment reporting requires significant judgment in determining our operating segments. Operating segments are defined as a component of an enterprise for which discrete financial information is available and is reviewed regularly by the chief operating decision-maker, or decision-making group, to evaluate performance and make operating
decisions. We operate two principal businesses: homebuilding and financial services. Our homebuilding operations acquire and develop land and construct and sell single-family attached and detached homes. In connection with our October 1, 2015 merger with Ryland, the Company experienced key personnel changes and significant growth in its operations, and as a result, the Company began to develop processes and reporting packages to manage and assess the Company's performance at a regional level. In light of the key personnel changes, growth in operations, and the focus on regional information provided to the Company's chief operating decision maker, during 2016, we performed an assessment of our operating segments in accordance with ASC Topic 280, Segment Reporting ("ASC 280"), and determined that each of our four homebuilding regions and financial services operations are our operating segments. Prior to this change, in accordance with the aggregation criteria defined in ASC 280, our homebuilding divisions were grouped into four reportable segments (which were our four homebuilding regions): North, consisting of our divisions in Georgia, Delaware, Illinois, Indiana, Maryland, Minnesota, New Jersey, Pennsylvania, Virginia and Washington D.C.; Southeast, consisting of our divisions in Florida and the Carolinas; Southwest, consisting of our divisions in Texas, Colorado and Nevada; and West, consisting of our divisions in California and Arizona. As such, current period segment information is presented consistent with prior periods.
Our mortgage financing operation provides mortgage financing to many of our homebuyers in substantially all of the markets in which we operate, and sells substantially all of the loans it originates in the secondary mortgage market. Our title, escrow and insurance subsidiaries provide title, escrow and insurance services to homebuyers in many of our markets. Our mortgage financing, title, escrow and insurance services operations are included in our financial services reportable segment, which is separately reported in our consolidated financial statements under "Financial Services."
Corporate is a non-operating segment that develops and implements strategic initiatives and supports our operating segments by centralizing key administrative functions such as accounting, finance and treasury, information technology, insurance and risk management, litigation, marketing and human resources. Corporate also provides the necessary administrative functions to support us as a publicly traded company. All of the expenses incurred by Corporate are allocated to each of our four homebuilding regions based on their respective percentage of revenues.
Inventories and Impairments
Inventories consist of land, land under development, homes under construction, completed homes and model homes and are stated at cost, net of any impairment losses. We capitalize direct carrying costs, including interest, property taxes and related development costs to inventories. Field construction supervision and related direct overhead are also included in the capitalized cost of inventories. Direct construction costs are specifically identified and allocated to homes while other common costs, such as land, land improvements and carrying costs, are allocated to homes within a community based upon their anticipated relative sales or fair value.
We assess the recoverability of real estate inventories in accordance with the provisions of ASC Topic 360, Property, Plant, and Equipment ("ASC 360"). ASC 360 requires long-lived assets, including inventories, that are expected to be held and used in operations to be carried at the lower of cost or, if impaired, the fair value of the asset. ASC 360 requires that companies evaluate long-lived assets for impairment based on undiscounted future cash flows of the assets at the lowest level for which there is identifiable cash flows. Long-lived assets to be disposed of are reported at the lower of carrying amount or fair value less cost to sell.
We evaluate real estate projects (including unconsolidated joint venture real estate projects) for inventory impairments when indicators of potential impairment are present. Indicators of impairment include, but are not limited to: significant decreases in local housing market values and selling prices of comparable homes; significant decreases in gross margins and sales absorption rates; accumulation of costs in excess of budget; actual or projected operating or cash flow losses; and current expectations that a real estate asset will more likely than not be sold before its previously estimated useful life.
We perform a detailed budget and cash flow review of all of our real estate communities (including actively selling communities, future communities and communities on hold/inactive) on a semi-annual basis throughout each fiscal year to, among other things, determine whether the community's estimated remaining undiscounted future cash flows are more or less than the carrying value of the inventory balance. If the undiscounted cash flows are more than the carrying value of the real estate project, then no impairment adjustment is required. However, if the undiscounted cash flows are less than the carrying amount, then the asset is deemed impaired and is written-down to its fair value. We evaluate the identifiable cash flows at the project level. When estimating undiscounted future cash flows of a project, we are required to make various assumptions, including the following: (i) the expected sales prices and sales incentives to be offered, including the number of homes available and pricing and incentives being offered in other communities by us or by other builders; (ii) the expected sales pace and cancellation rates based on local housing market conditions and competition; (iii) costs expended to date and expected to be incurred in the future, including, but not limited to, land and land development costs, home construction costs,
interest costs, indirect construction and overhead costs, and selling and marketing costs; (iv) alternative product offerings that may be offered that could have an impact on sales pace, sales price and/or building costs; and (v) alternative uses for the property such as the possibility of a sale of lots to a third party versus the sale of individual homes. Many of these assumptions are interdependent and changing one assumption generally requires a corresponding change to one or more of the other assumptions. For example, increasing or decreasing the sales absorption rate has a direct impact on the estimated per unit sales price of a home, the level of time sensitive costs (such as indirect construction, overhead and carrying costs), and selling and marketing costs (such as model maintenance costs and promotional and advertising campaign costs). Depending on what objective we are trying to accomplish with a community, it could have a significant impact on the project cash flow analysis. For example, if our business objective is to drive delivery levels our project cash flow analysis will be different than if the business objective is to preserve operating margins. These objectives may vary significantly from project to project, from division to division, and over time with respect to the same project.
Once we have determined a real estate project is impaired, we calculate the fair value of the project under a land residual value analysis and in certain cases in conjunction with a discounted cash flow analysis. Under the land residual value analysis, we estimate what a willing buyer (including us) would pay and what a willing seller would sell a parcel of land for (other than in a forced liquidation) in order to generate a market rate operating margin based on projected revenues, costs to develop land, and costs to construct and sell homes within a community. Under the discounted cash flow method, all estimated future cash inflows and outflows directly associated with the real estate project are discounted to calculate fair value. The net present value of these project cash flows are then compared to the carrying value of the asset to determine the amount of the impairment that is required. The land residual value analysis is the primary method that we use to calculate impairments as it is the principal method used by us and land sellers for determining the fair value of a residential parcel of land. In many cases, we also supplement our land residual value analysis with a discounted cash flow analysis in evaluating the fair value. In addition, for projects that require a longer time frame to develop and sell assets, in some instances we incorporate a certain level of inflation or deflation into our projected revenue and cost assumptions. This evaluation and the assumptions used by management to determine future estimated cash flows and fair value require a substantial degree of judgment, especially with respect to real estate projects that have a substantial amount of development to be completed, have not started selling or are in the early stages of sales, or are longer-term in duration. Due to the inherent uncertainty in the estimation process, significant volatility in the demand for new housing, and the availability of mortgage financing for potential homebuyers, actual results could differ significantly from our estimates.
From time to time, we write-off deposits related to land options that we decide not to exercise. The decision not to exercise a land option takes into consideration changes in market conditions, the timing of required land takedowns, the willingness of land sellers to modify terms of the land option contract (including the price and timing of land takedowns), the availability and best use of our capital, and other factors. The write-off of a deposit is charged to homebuilding other income (expense) in our consolidated statement of operations in the period that we determine it is probable that the optioned property will not be acquired. If we recover deposits which were previously written off, the recoveries are recorded to homebuilding other income (expense) in the period received.
Stock-Based Compensation
We account for share-based awards in accordance with ASC Topic 718, Compensation – Stock Compensation, which requires that compensation expense be measured and recognized at an amount equal to the fair value of share-based payments granted under compensation arrangements. Our outstanding share-based awards include stock options, stock appreciation rights, restricted and unrestricted stock, and performance share awards. The fair value of stock options and stock appreciation rights that vest based on time is calculated by using the Black-Scholes option-pricing model and the fair value of stock appreciation rights that vest based on market performance is calculated by using a lattice model. The fair value of restricted stock, unrestricted stock and performance share awards is based on the market value of our common stock as of the grant date. The determination of the fair value of share-based awards at the grant date requires judgment in developing assumptions and involves a number of variables. These variables include, but are not limited to: expected stock-price volatility over the term of the awards and expected stock option exercise behavior. Additionally, judgment is required in estimating the number of share-based awards that are expected to be forfeited and, in the case of performance share awards, the level of performance that will be achieved and the number of shares that will be earned. If actual results differ significantly from these estimates, stock-based compensation expense and our consolidated results of operations could be significantly impacted.
Homebuilding Revenue and Cost of Sales
Homebuilding revenue and cost of sales are recognized after construction is completed, a sufficient down payment has been received, title has transferred to the homebuyer, collection of the purchase price is reasonably assured and we have no
continuing involvement. Cost of sales is recorded based upon total estimated costs to be allocated to each home within a community. Any changes to the estimated costs are allocated to the remaining undelivered lots and homes within their respective community. The estimation and allocation of these costs requires a substantial degree of judgment by management.
The estimation process involved in determining relative sales or fair values is inherently uncertain because it involves estimating future sales values of homes before delivery. Additionally, in determining the allocation of costs to a particular land parcel or individual home, we rely on project budgets that are based on a variety of assumptions, including assumptions about construction schedules and future costs to be incurred. It is common that actual results differ from budgeted amounts for various reasons, including construction delays, increases in costs that have not been committed or unforeseen issues encountered during construction that fall outside the scope of existing contracts, or costs that come in less than originally anticipated. While the actual results for a particular construction project are accurately reported over time, a variance between the budget and actual costs could result in the understatement or overstatement of costs and have a related impact on gross margins between reporting periods. To reduce the potential for such variances, we have procedures that have been applied on a consistent basis, including assessing and revising project budgets on a semi-annual basis, obtaining commitments from subcontractors and vendors for future costs to be incurred, and utilizing the most recent information available to estimate costs. We believe that these policies and procedures provide for reasonably dependable estimates for purposes of calculating amounts to be relieved from inventories and expensed to cost of sales in connection with the sale of homes.
Variable Interest Entities
We account for variable interest entities in accordance with ASC Topic 810, Consolidation ("ASC 810"). Under ASC 810, a variable interest entity ("VIE") is created when: (a) the equity investment at risk in the entity is not sufficient to permit the entity to finance its activities without additional subordinated financial support provided by other parties, including the equity holders; (b) the entity's equity holders as a group either (i) lack the direct or indirect ability to make decisions about the entity, (ii) are not obligated to absorb expected losses of the entity or (iii) do not have the right to receive expected residual returns of the entity; or (c) the entity's equity holders have voting rights that are not proportionate to their economic interests, and the activities of the entity involve or are conducted on behalf of the equity holder with disproportionately few voting rights. If an entity is deemed to be a VIE pursuant to ASC 810, the enterprise that has both (i) the power to direct the activities of a VIE that most significantly impact the entity's economic performance and (ii) the obligation to absorb the expected losses of the entity or right to receive benefits from the entity that could be potentially significant to the VIE is considered the primary beneficiary and must consolidate the VIE. In accordance with ASC 810, we perform ongoing reassessments of whether we are the primary beneficiary of a VIE.
Unconsolidated Homebuilding and Land Development Joint Ventures
Investments in our unconsolidated homebuilding and land development joint ventures are accounted for under the equity method of accounting. Under the equity method, we recognize our proportionate share of earnings and losses earned by the joint venture upon the delivery of lots or homes to third parties. All joint venture profits generated from land sales to us are deferred and recorded as a reduction to our cost basis in the lots we purchase until we ultimately sell the homes to be constructed to third parties. Our share of joint venture losses from land sales to us are recorded in the period we acquire the property from the joint venture. Our ownership interests in our unconsolidated joint ventures vary but are generally less than or equal to 50%.
We review inventory projects within our unconsolidated joint ventures for impairments consistent with the critical accounting policy described above under "Inventories and Impairments." We also review our investments in unconsolidated joint ventures for evidence of an other than temporary decline in value. To the extent that we deem any portion of our investment in unconsolidated joint ventures not recoverable, we impair our investment accordingly.
In addition, we accrue for guarantees provided to unconsolidated joint ventures when it is determined that there is an obligation that is due from us. These obligations consist of various items, including but not limited to, surety indemnities, credit enhancements provided in connection with joint venture borrowings such as loan-to-value maintenance agreements, construction completion agreements, and environmental indemnities. In many cases we share these obligations with our joint venture partners, and in some cases, we are solely responsible for such obligations. For further discussion regarding these guarantees, please see "Management's Discussion and Analysis of Financial Condition and Results of Operations – Off-Balance Sheet Arrangements".
Warranty Accruals
In the normal course of business, we incur warranty-related costs associated with homes that have been delivered to homebuyers. Estimated future direct warranty costs are accrued and charged to cost of sales in the period when the related homebuilding revenues are recognized while indirect warranty overhead salaries and related costs are charged to cost of sales in the period incurred. Amounts accrued are based upon historical experience rates. We review the adequacy of the warranty accruals each reporting period by evaluating the historical warranty experience in each market in which we operate, and the warranty accruals are adjusted as appropriate for current quantitative and qualitative factors. Factors that affect the warranty accruals include the number of homes delivered, historical and anticipated rates of warranty claims, and cost per claim. Although we consider the warranty accruals reflected in our consolidated balance sheet to be adequate, actual future costs could differ significantly from our currently estimated amounts.
Insurance and Litigation Accruals
Insurance and litigation accruals are established with respect to estimated future claims cost. We maintain general liability insurance designed to protect us against a portion of our risk of loss from construction-related claims. We also generally require our subcontractors and design professionals to indemnify us for liabilities arising from their work, subject to various limitations. However, such indemnity is significantly limited with respect to certain subcontractors that are added to our general liability insurance policy. We record allowances to cover the estimated costs of our self-insurance liability based on an analysis that uses our historical claim and expense data, as well as industry data to estimate these overall costs. We utilize the services of an independent third party actuary to assist us with evaluating the level of our insurance and litigation accruals. Because of the high degree of judgment required in determining these estimated accrual amounts, actual future claim costs could differ significantly from our currently estimated amounts.
Income Taxes
We account for income taxes in accordance with ASC Topic 740, Income Taxes ("ASC 740"). This statement requires an asset and a liability approach for measuring deferred taxes based on temporary differences between the financial statement and tax bases of assets and liabilities existing at each balance sheet date using enacted tax rates for years in which taxes are expected to be paid or recovered.
We evaluate our deferred tax assets on a quarterly basis to determine whether a valuation allowance is required. In accordance with ASC 740, we assess whether a valuation allowance should be established based on our determination of whether it is more likely than not that some portion or all of the deferred tax assets will not be realized. The ultimate realization of our deferred tax assets depends primarily on our ability to generate future taxable income during the periods in which the related temporary differences become deductible. The assessment of a valuation allowance includes giving appropriate consideration to all positive and negative evidence related to the realization of the deferred tax asset. This assessment considers, among other things, the nature, frequency and severity of current and cumulative losses, forecasts of future profitability, the duration of statutory carryforward periods, our experience with operating loss and tax credit carryforwards not expiring unused, and tax planning alternatives. Significant judgment is required in determining the future tax consequences of events that have been recognized in our consolidated financial statements and/or tax returns. Differences between anticipated and actual outcomes of these future tax consequences could have a material impact on our consolidated financial position or results of operations. Changes in existing tax laws and tax rates also affect actual tax results and the valuation of deferred tax assets over time.
Based on such an analysis and on an evaluation of available positive and negative information and our projection of the income we expected to generate in future years, we concluded that it was more likely than not that most of our deferred tax asset would be realized. As of December 31, 2016, the deferred tax asset valuation allowance of $2.5 million related to state net operating loss carryforwards that are limited by shorter carryforward periods. To the extent that we conclude that it is more likely than not that the remaining valuation allowance will be utilized, we will be able to reduce our effective tax rate, by reducing the valuation allowance and offsetting a portion of taxable income. Conversely, any significant future operating losses generated by us in the near term may increase the deferred tax asset valuation allowance and adversely impact our income tax provision (benefit) to the extent we enter into a cumulative loss position as described in ASC 740.
Interest and penalties related to unrecognized tax benefits are recognized in the financial statements as a component of income tax expense. Significant judgment is required to evaluate uncertain tax positions. We evaluate our uncertain tax positions on a quarterly basis. Our evaluations are based upon a number of factors, including changes in facts or
circumstances, changes in tax law, correspondence with tax authorities during the course of audits and effective settlement of audit issues. Changes in the recognition or measurement of uncertain tax positions could result in material increases or decreases in our income tax expense in the period in which we make the change.
Goodwill
We have recorded a significant amount of goodwill in connection with our October 1, 2015 merger with Ryland. Goodwill has been allocated to the Company's four homebuilding regions that were expected to benefit from the synergies of the merger. The allocation was based on the relative fair value of each acquired reporting unit in accordance with ASC Topic 350, Intangibles–Goodwill and Other ("ASC 350"). The key drivers used in the fair value calculation included 10-year regional level cash flow projections that were reviewed by a third party valuation expert, terminal growth rate and the weighted average cost of capital calculated for each acquired reporting unit based on regional specific assumptions. In accordance with ASC 350, we evaluate goodwill for possible impairment annually or more frequently if events or changes in circumstances indicate that the carrying amount of such assets may not be recoverable. We evaluate the recoverability of goodwill by comparing the carrying value of each of our reporting units to their estimated fair value. We determine the fair value of each reporting unit using accepted valuation methods, including the use of discounted cash flows supplemented by market-based assessments of fair value, and measure impairment as the difference between the resulting implied fair value of goodwill and the recorded carrying value. Such fair values are significantly impacted by estimates related to current market valuations, current and future economic conditions in each of our geographical markets, and our strategic plans within each of our markets. Due to uncertainties in the estimation process and the significant volatility in demand for new housing, actual results could differ significantly from such estimates. If our expectations of future results and cash flows decrease significantly, goodwill may be impaired.
Recent Accounting Pronouncements
See Note 2.w. in our accompanying consolidated financial statements.
We are exposed to market risks related to fluctuations in interest rates on our rate-locked loan commitments, mortgage loans held for sale and outstanding variable rate debt. Other than forward sales commitments in connection with preselling loans to third party investors and forward sale commitments of mortgage-backed securities entered into by our financial services subsidiary for the purpose of hedging interest rate risk as described below, we did not utilize swaps, forward or option contracts on interest rates or commodities, or other types of derivative financial instruments as of or during the year ended December 31, 2016. We have not entered into and currently do not hold derivatives for trading or speculative purposes.
As part of our ongoing operations, we provide mortgage loans to our homebuyers through our mortgage financing subsidiary, CalAtlantic Mortgage. For a portion of its loan originations, CalAtlantic Mortgage manages the interest rate risk associated with making loan commitments to our customers and holding loans for sale by preselling loans. Preselling loans consists of obtaining commitments (subject to certain conditions) from third party investors to purchase the mortgage loans while concurrently extending interest rate locks to loan applicants. Before completing the sale to these investors, CalAtlantic Mortgage finances these loans under its mortgage credit facilities for a short period of time (typically for 30 to 45 days), while the investors complete their administrative review of the applicable loan documents. While preselling these loans reduces risk, we remain subject to risk relating to investor non-performance, particularly during periods of significant market turmoil. As of December 31, 2016, CalAtlantic Mortgage had approximately $261.8 million in closed mortgage loans held for sale and $26.9 million of mortgage loans that we were committed to sell to investors subject to our funding of the loans and the investors' completion of their administrative review of the applicable loan documents.
CalAtlantic Mortgage also originates a portion of its mortgage loans on a non-presold basis. When originating mortgage loans on a non-presold basis, CalAtlantic Mortgage locks interest rates with its customers and funds loans prior to obtaining purchase commitments from third party investors, thereby creating interest rate risk. To hedge this interest rate risk, CalAtlantic Mortgage enters into forward sale commitments of mortgage-backed securities. Loans originated in this manner are typically held by CalAtlantic Mortgage and financed under its mortgage credit facilities for a short period of time (typically for 30 to 45 days) before the loans are sold to third party investors. CalAtlantic Mortgage utilizes third party hedging software to assist with the execution of its hedging strategy for loans originated on a non-presold basis. While this hedging strategy is designed to assist CalAtlantic Mortgage in mitigating risk associated with originating loans on a non-presold basis, these instruments involve elements of market risk related to fluctuations in interest rates that could result in losses on loans originated in this manner. As of December 31, 2016, CalAtlantic Mortgage had approximately $249.0
million of mortgage loans in process that were or are expected to be originated on a non-presold basis, all of which were hedged by forward sale commitments of mortgage-backed securities prior to entering into loan sale transactions with third party investors.
The table below details the principal amount and the average interest rates for the mortgage loans held for sale, mortgage loans held for investment and outstanding debt for each category based upon the expected maturity or disposition dates. Certain mortgage loans held for sale require periodic principal payments prior to the expected sale date. The fair value estimates for these mortgage loans held for sale are based upon future discounted cash flows of similar type notes or quoted market prices for similar loans. The fair value of mortgage loans held for investment is based on the estimated market value of the underlying collateral based on market data and other factors for similar type properties as further adjusted to reflect their estimated net realizable value of carrying the loans through disposition. The fair value of our variable rate debt, which consists of our mortgage credit facilities, is based on quoted market prices for the same or similar instruments as of December 31, 2016. Our fixed rate debt consists of secured project debt and other notes payable, senior notes payable and convertible senior notes payable. The interest rates on our secured project debt and other notes payable approximate the current rates available for secured real estate financing with similar terms and maturities and, as a result, their carrying amounts approximate fair value. The fair values of our senior notes payable and convertible senior notes payable are based on their quoted market prices as of December 31, 2016.
|
Expected Maturity Date
|
||||||||||||||||||||||||||||
|
Estimated
|
||||||||||||||||||||||||||||
|
December 31,
|
2017
|
2018
|
2019
|
2020
|
2021
|
|
Thereafter
|
|
Total
|
Fair Value
|
||||||||||||||||||
|
(Dollars in thousands)
|
||||||||||||||||||||||||||||
|
Assets:
|
||||||||||||||||||||||||||||
|
Mortgage loans held for sale (1)
|
$
|
261,835
|
$
|
―
|
$
|
―
|
$
|
―
|
$
|
―
|
$
|
―
|
$
|
261,835
|
$
|
265,542
|
||||||||||||
|
Average interest rate
|
3.8%
|
|||||||||||||||||||||||||||
|
Mortgage loans held for
|
||||||||||||||||||||||||||||
|
investment, net
|
$
|
434
|
$
|
452
|
$
|
472
|
$
|
491
|
$
|
511
|
$
|
22,564
|
$
|
24,924
|
$
|
24,924
|
||||||||||||
|
Average interest rate
|
4.1%
|
4.1%
|
4.1%
|
4.1%
|
4.1%
|
4.1%
|
4.1%
|
|||||||||||||||||||||
|
Liabilities:
|
||||||||||||||||||||||||||||
|
Fixed rate debt
|
$
|
246,958
|
$
|
809,274
|
$
|
268,399
|
$
|
300,448
|
$
|
700,000
|
$
|
1,103,000
|
$
|
3,428,079
|
$
|
3,645,417
|
||||||||||||
|
Average interest rate
|
7.9%
|
6.4%
|
0.3%
|
6.6%
|
7.5%
|
4.5%
|
5.7%
|
|||||||||||||||||||||
|
Variable rate debt
|
$
|
247,427
|
$
|
―
|
$
|
―
|
$
|
―
|
$
|
―
|
$
|
―
|
$
|
247,427
|
$
|
247,427
|
||||||||||||
|
Average interest rate
|
2.9%
|
|||||||||||||||||||||||||||
|
Off-Balance Sheet Financial
|
||||||||||||||||||||||||||||
|
Instruments:
|
||||||||||||||||||||||||||||
|
Commitments to originate
|
||||||||||||||||||||||||||||
|
mortgage loans:
|
||||||||||||||||||||||||||||
|
Notional amount
|
$
|
275,897
|
$
|
―
|
$
|
―
|
$
|
―
|
$
|
―
|
$
|
―
|
$
|
275,897
|
$
|
282,796
|
||||||||||||
|
Average interest rate
|
3.7%
|
|||||||||||||||||||||||||||
|
Forward sale commitments
of mortgage- backed securities:
|
||||||||||||||||||||||||||||
|
Notional amount
|
$
|
244,000
|
$
|
―
|
$
|
―
|
$
|
―
|
$
|
―
|
$
|
―
|
$
|
244,000
|
$
|
243,763
|
||||||||||||
|
Average interest rate
|
3.5%
|
|||||||||||||||||||||||||||
________________
| (1) |
All of the amounts presented in this line item reflect the expected 2017 disposition of the loans rather than the actual scheduled maturity dates of these mortgages.
|
Based on the current interest rate management policies we have in place with respect to most of our mortgage loans held for sale, mortgage loans held for investment, commitments to originate rate-locked mortgage loans and outstanding debt, we do not believe that the future market rate risks related to the above securities will have a material adverse impact on our financial position, results of operations or liquidity.
The Board of Directors and Shareholders of CalAtlantic Group, Inc.:
We have audited the accompanying consolidated balance sheets of CalAtlantic Group, Inc. and subsidiaries as of December 31, 2016 and 2015, and the related consolidated statements of operations, comprehensive income, stockholders' equity, and cash flows for each of the three years in the period ended December 31, 2016. These financial statements are the responsibility of the Company's management. Our responsibility is to express an opinion on these financial statements based on our audits.
We conducted our audits in accordance with the standards of the Public Company Accounting Oversight Board (United States). Those standards require that we plan and perform the audit to obtain reasonable assurance about whether the financial statements are free of material misstatement. An audit includes examining, on a test basis, evidence supporting the amounts and disclosures in the financial statements. An audit also includes assessing the accounting principles used and significant estimates made by management, as well as evaluating the overall financial statement presentation. We believe that our audits provide a reasonable basis for our opinion.
In our opinion, the financial statements referred to above present fairly, in all material respects, the consolidated financial position of CalAtlantic Group, Inc. and subsidiaries at December 31, 2016 and 2015, and the consolidated results of their operations and their cash flows for each of the three years in the period ended December 31, 2016, in conformity with U.S. generally accepted accounting principles.
We also have audited, in accordance with the standards of the Public Company Accounting Oversight Board (United States), CalAtlantic Group, Inc. and subsidiaries' internal control over financial reporting as of December 31, 2016, based on criteria established in Internal Control-Integrated Framework issued by the Committee of Sponsoring Organizations of the Treadway Commission (2013 framework) and our report dated February 27, 2017 expressed an unqualified opinion thereon.
/s/ Ernst & Young LLP
Irvine, California
February 27, 2017
CALATLANTIC GROUP, INC. AND SUBSIDIARIES
|
Year Ended December 31,
|
||||||||||||
|
2016
|
2015
|
2014
|
||||||||||
|
(Dollars in thousands, except per share amounts)
|
||||||||||||
|
Homebuilding:
|
||||||||||||
|
Home sale revenues
|
$
|
6,354,869
|
$
|
3,449,047
|
$
|
2,366,754
|
||||||
|
Land sale revenues
|
33,171
|
47,364
|
44,424
|
|||||||||
|
Total revenues
|
6,388,040
|
3,496,411
|
2,411,178
|
|||||||||
|
Cost of home sales
|
(4,967,278
|
)
|
(2,676,666
|
)
|
(1,748,954
|
)
|
||||||
|
Cost of land sales
|
(30,132
|
)
|
(43,274
|
)
|
(43,841
|
)
|
||||||
|
Total cost of sales
|
(4,997,410
|
)
|
(2,719,940
|
)
|
(1,792,795
|
)
|
||||||
|
Gross margin
|
1,390,630
|
776,471
|
618,383
|
|||||||||
|
Selling, general and administrative expenses
|
(664,459
|
)
|
(390,710
|
)
|
(275,861
|
)
|
||||||
|
Income (loss) from unconsolidated joint ventures
|
4,057
|
1,966
|
(668
|
)
|
||||||||
|
Other income (expense)
|
(16,726
|
)
|
(62,177
|
)
|
(1,733
|
)
|
||||||
|
Homebuilding pretax income
|
713,502
|
325,550
|
340,121
|
|||||||||
|
Financial Services:
|
||||||||||||
|
Revenues
|
88,695
|
43,702
|
25,320
|
|||||||||
|
Expenses
|
(49,081
|
)
|
(26,763
|
)
|
(15,477
|
)
|
||||||
|
Financial services pretax income
|
39,614
|
16,939
|
9,843
|
|||||||||
|
Income before taxes
|
753,116
|
342,489
|
349,964
|
|||||||||
|
Provision for income taxes
|
(268,386
|
)
|
(128,980
|
)
|
(134,099
|
)
|
||||||
|
Net income
|
484,730
|
213,509
|
215,865
|
|||||||||
|
Less: Net income allocated to preferred shareholder
|
―
|
(32,997
|
)
|
(51,650
|
)
|
|||||||
|
Less: Net income allocated to unvested restricted stock
|
(1,168
|
)
|
(369
|
)
|
(297
|
)
|
||||||
|
Net income available to common stockholders
|
$
|
483,562
|
$
|
180,143
|
$
|
163,918
|
||||||
|
Income per common share:
|
||||||||||||
|
Basic
|
$
|
4.09
|
$
|
2.51
|
$
|
2.94
|
||||||
|
Diluted
|
$
|
3.60
|
$
|
2.26
|
$
|
2.68
|
||||||
|
Weighted average common shares outstanding:
|
||||||||||||
|
Basic
|
118,212,740
|
71,713,747
|
55,737,548
|
|||||||||
|
Diluted
|
135,984,985
|
81,512,953
|
63,257,082
|
|||||||||
|
Weighted average additional common shares outstanding
|
||||||||||||
|
if preferred shares converted to common shares
|
―
|
13,135,814
|
17,562,557
|
|||||||||
|
Total weighted average diluted common shares outstanding
|
||||||||||||
|
if preferred shares converted to common shares
|
135,984,985
|
94,648,767
|
80,819,639
|
|||||||||
The accompanying notes are an integral part of these consolidated statements.
CALATLANTIC GROUP, INC. AND SUBSIDIARIES
|
Year Ended December 31,
|
||||||||||||
|
2016
|
2015
|
2014
|
||||||||||
|
(Dollars in thousands)
|
||||||||||||
|
Net income
|
$
|
484,730
|
$
|
213,509
|
$
|
215,865
|
||||||
|
Other comprehensive income, net of tax:
|
||||||||||||
|
Unrealized gain (loss) on marketable securities, available for sale
|
(177
|
)
|
5
|
―
|
||||||||
|
Total comprehensive income
|
$
|
484,553
|
$
|
213,514
|
$
|
215,865
|
||||||
The accompanying notes are an integral part of these consolidated statements.
CALATLANTIC GROUP, INC. AND SUBSIDIARIES
|
December 31,
|
||||||||
|
2016
|
2015
|
|||||||
| (Dollars in thousands) | ||||||||
|
ASSETS
|
||||||||
|
Homebuilding:
|
||||||||
|
Cash and equivalents
|
$
|
191,086
|
$
|
151,076
|
||||
|
Restricted cash
|
28,321
|
35,990
|
||||||
|
Inventories:
|
||||||||
|
Owned
|
6,438,792
|
6,069,959
|
||||||
|
Not owned
|
66,267
|
83,246
|
||||||
|
Investments in unconsolidated joint ventures
|
127,127
|
132,763
|
||||||
|
Deferred income taxes, net of valuation allowance of $2,456 and $1,156 at
|
||||||||
|
December 31, 2016 and 2015, respectively
|
330,378
|
396,194
|
||||||
|
Goodwill
|
970,185
|
933,360
|
||||||
|
Other assets
|
204,489
|
202,665
|
||||||
|
Total Homebuilding Assets
|
8,356,645
|
8,005,253
|
||||||
|
Financial Services:
|
||||||||
|
Cash and equivalents
|
17,041
|
35,518
|
||||||
|
Restricted cash
|
21,710
|
22,914
|
||||||
|
Mortgage loans held for sale, net
|
262,058
|
325,770
|
||||||
|
Mortgage loans held for investment, net
|
24,924
|
22,704
|
||||||
|
Other assets
|
26,666
|
17,243
|
||||||
|
Total Financial Services Assets
|
352,399
|
424,149
|
||||||
|
Total Assets
|
$
|
8,709,044
|
$
|
8,429,402
|
||||
|
LIABILITIES AND EQUITY
|
||||||||
|
Homebuilding:
|
||||||||
|
Accounts payable
|
$
|
211,780
|
$
|
191,681
|
||||
|
Accrued liabilities
|
599,905
|
562,690
|
||||||
|
Secured project debt and other notes payable
|
27,579
|
25,683
|
||||||
|
Senior notes payable
|
3,392,208
|
3,462,016
|
||||||
|
Total Homebuilding Liabilities
|
4,231,472
|
4,242,070
|
||||||
|
Financial Services:
|
||||||||
|
Accounts payable and other liabilities
|
22,559
|
22,474
|
||||||
|
Mortgage credit facilities
|
247,427
|
303,422
|
||||||
|
Total Financial Services Liabilities
|
269,986
|
325,896
|
||||||
|
Total Liabilities
|
4,501,458
|
4,567,966
|
||||||
|
Equity:
|
||||||||
|
Stockholders' Equity:
|
||||||||
|
Preferred stock, $0.01 par value; 10,000,000 shares authorized; no shares
|
||||||||
|
issued and outstanding at December 31, 2016 and 2015
|
―
|
―
|
||||||
|
Common stock, $0.01 par value; 600,000,000 shares authorized; 114,429,297 and
|
||||||||
|
121,286,153 shares issued and outstanding at December 31, 2016 and 2015, respectively
|
1,144
|
1,213
|
||||||
|
Additional paid-in capital
|
3,204,835
|
3,324,328
|
||||||
|
Accumulated earnings
|
1,001,779
|
535,890
|
||||||
|
Accumulated other comprehensive income (loss), net of tax
|
(172
|
)
|
5
|
|||||
|
Total Equity
|
4,207,586
|
3,861,436
|
||||||
|
Total Liabilities and Equity
|
$
|
8,709,044
|
$
|
8,429,402
|
||||
The accompanying notes are an integral part of these consolidated statements.
CALATLANTIC GROUP, INC. AND SUBSIDIARIES
|
Years Ended December 31, 2013, 2014 and 2015
|
Number of Preferred
Shares |
Preferred
Stock
|
Number of
Common Shares |
Common
Stock
|
Additional
Paid-in Capital |
Accumulated
Earnings (Deficit) |
Accumulated Other Comprehensive Income (Loss)
|
Total
Stockholders' Equity |
|||||||||||||||||
|
(Dollars in thousands)
|
|||||||||||||||||||||||||
|
Balance, December 31, 2013
|
53,565
|
$
|
1
|
55,523,636
|
$
|
555
|
$
|
1,357,037
|
$
|
111,367
|
$
|
―
|
$
|
1,468,960
|
|||||||||||
|
Net income
|
―
|
―
|
―
|
―
|
―
|
215,865
|
―
|
215,865
|
|||||||||||||||||
|
Stock issuances under employee
|
|||||||||||||||||||||||||
|
plans, including income tax benefits
|
―
|
―
|
512,602
|
5
|
20,170
|
―
|
―
|
20,175
|
|||||||||||||||||
|
Repurchase and retirement of common
|
|||||||||||||||||||||||||
|
stock, net of expenses
|
―
|
―
|
(1,008,000)
|
(10)
|
(36,771)
|
―
|
―
|
(36,781)
|
|||||||||||||||||
|
Amortization of stock-based
|
|||||||||||||||||||||||||
|
compensation
|
―
|
―
|
―
|
―
|
8,469
|
―
|
―
|
8,469
|
|||||||||||||||||
|
Balance, December 31, 2014
|
53,565
|
|
1
|
55,028,238
|
|
550
|
|
1,348,905
|
|
327,232
|
|
―
|
|
1,676,688
|
|||||||||||
|
Net income
|
―
|
―
|
―
|
―
|
―
|
213,509
|
―
|
213,509
|
|||||||||||||||||
|
Other comprehensive income, net of tax
|
―
|
―
|
―
|
―
|
―
|
―
|
5
|
5
|
|||||||||||||||||
|
Stock issuances under employee
|
|||||||||||||||||||||||||
|
plans, including income tax benefits
|
―
|
―
|
1,350,984
|
13
|
10,237
|
―
|
―
|
10,250
|
|||||||||||||||||
|
Common stock dividends ($0.04 per share)
|
―
|
―
|
―
|
―
|
―
|
(4,851)
|
―
|
(4,851)
|
|||||||||||||||||
|
Repurchase and retirement of common
|
|||||||||||||||||||||||||
|
stock, net of expenses
|
―
|
―
|
(645,338)
|
(6)
|
(22,067)
|
―
|
―
|
(22,073)
|
|||||||||||||||||
|
Stock issuance in connection with merger,
|
|||||||||||||||||||||||||
|
net of preferred stock conversion
|
(53,565)
|
(1)
|
65,552,269
|
656
|
1,971,629
|
―
|
―
|
1,972,284
|
|||||||||||||||||
|
Amortization of stock-based
|
|||||||||||||||||||||||||
|
compensation
|
―
|
―
|
―
|
―
|
15,624
|
―
|
―
|
15,624
|
|||||||||||||||||
|
Balance, December 31, 2015
|
―
|
|
―
|
121,286,153
|
|
1,213
|
|
3,324,328
|
|
535,890
|
|
5
|
|
3,861,436
|
|||||||||||
|
Net income
|
―
|
―
|
―
|
―
|
―
|
484,730
|
―
|
484,730
|
|||||||||||||||||
|
Other comprehensive loss, net of tax
|
―
|
―
|
―
|
―
|
―
|
―
|
(177)
|
(177)
|
|||||||||||||||||
|
Stock issuances under employee
|
|||||||||||||||||||||||||
|
plans, including income tax benefits
|
―
|
―
|
396,489
|
4
|
1,326
|
―
|
―
|
1,330
|
|||||||||||||||||
|
Common stock dividends ($0.16 per share)
|
―
|
―
|
―
|
―
|
―
|
(18,841)
|
―
|
(18,841)
|
|||||||||||||||||
|
Repurchase and retirement of common
|
|||||||||||||||||||||||||
|
stock, net of expenses
|
―
|
―
|
(7,253,345)
|
(73)
|
(232,447)
|
―
|
―
|
(232,520)
|
|||||||||||||||||
|
1.625% convertible note conversion feature
|
|||||||||||||||||||||||||
|
purchase accounting adjustment
|
―
|
―
|
―
|
―
|
93,834
|
―
|
―
|
93,834
|
|||||||||||||||||
|
Amortization of stock-based
|
|||||||||||||||||||||||||
|
compensation
|
―
|
―
|
―
|
―
|
17,794
|
―
|
―
|
17,794
|
|||||||||||||||||
|
Balance, December 31, 2016
|
―
|
$
|
―
|
114,429,297
|
$
|
1,144
|
$
|
3,204,835
|
$
|
1,001,779
|
$
|
(172)
|
$
|
4,207,586
|
|||||||||||
The accompanying notes are an integral part of these consolidated statements.
CALATLANTIC GROUP, INC. AND SUBSIDIARIES
|
Year Ended December 31,
|
||||||||||||
|
2016
|
2015
|
2014
|
||||||||||
| (Dollars in thousands) | ||||||||||||
|
Cash Flows From Operating Activities:
|
||||||||||||
|
Net income
|
$
|
484,730
|
$
|
213,509
|
$
|
215,865
|
||||||
|
Adjustments to reconcile net income to net cash provided by (used in)
|
||||||||||||
|
operating activities:
|
||||||||||||
|
(Income) loss from unconsolidated joint ventures
|
(4,057
|
)
|
(1,966
|
)
|
668
|
|||||||
|
Depreciation and amortization
|
61,704
|
41,151
|
27,347
|
|||||||||
|
Amortization of stock-based compensation
|
17,794
|
15,624
|
8,469
|
|||||||||
|
Excess tax (benefit) provision from share-based payment arrangements
|
460
|
(9,250
|
)
|
(13,404
|
)
|
|||||||
|
Deferred income tax provision
|
(5,097
|
)
|
38,636
|
98,998
|
||||||||
|
Other operating activities
|
418
|
|
2,869
|
1,886
|
||||||||
|
Changes in cash and equivalents due to:
|
||||||||||||
|
Mortgage loans held for sale
|
63,649
|
(42,871
|
)
|
(52,838
|
)
|
|||||||
|
Inventories - owned
|
(306,896
|
)
|
(497,836
|
)
|
(664,427
|
)
|
||||||
|
Inventories - not owned
|
(37,728
|
)
|
34,770
|
(33,027
|
)
|
|||||||
|
Other assets
|
5,697
|
(2,998
|
)
|
4,529
|
||||||||
|
Accounts payable
|
20,099
|
|
(89,461
|
)
|
9,314
|
|||||||
|
Accrued liabilities
|
21,541
|
26,462
|
34,223
|
|||||||||
|
Net cash provided by (used in) operating activities
|
322,314
|
(271,361
|
)
|
(362,397
|
)
|
|||||||
|
Cash Flows From Investing Activities:
|
||||||||||||
|
Investments in unconsolidated homebuilding joint ventures
|
(29,118
|
)
|
(91,453
|
)
|
(10,506
|
)
|
||||||
|
Distributions of capital from unconsolidated homebuilding joint ventures
|
39,735
|
19,582
|
18,010
|
|||||||||
|
Cash acquired in connection with merger
|
―
|
268,517
|
―
|
|||||||||
|
Net cash paid for acquisitions
|
―
|
―
|
(33,770
|
)
|
||||||||
|
Other investing activities
|
(7,688
|
)
|
(11,972
|
)
|
(4,754
|
)
|
||||||
|
Net cash provided by (used in) investing activities
|
2,929
|
184,674
|
(31,020
|
)
|
||||||||
|
Cash Flows From Financing Activities:
|
||||||||||||
|
Change in restricted cash
|
8,873
|
652
|
(16,762
|
)
|
||||||||
|
Borrowing from revolving credit facility
|
1,433,200
|
852,700
|
―
|
|||||||||
|
Principal payments on revolving credit facility
|
(1,433,200
|
)
|
(852,700
|
)
|
―
|
|||||||
|
Principal payments on secured project debt and other notes payable
|
(23,228
|
)
|
(2,532
|
)
|
(1,458
|
)
|
||||||
|
Principal payments on senior notes payable
|
(280,000
|
)
|
(29,789
|
)
|
(4,971
|
)
|
||||||
|
Proceeds from the issuance of senior notes payable
|
300,000
|
―
|
300,000
|
|||||||||
|
Payment of debt issuance costs
|
(2,669
|
)
|
(1,016
|
)
|
(6,230
|
)
|
||||||
|
Net proceeds from (payments on) mortgage credit facilities
|
(55,995
|
)
|
110,469
|
(11,454
|
)
|
|||||||
|
Repurchases of common stock
|
(232,520
|
)
|
(22,073
|
)
|
(36,781
|
)
|
||||||
|
Common stock dividend payments
|
(18,841
|
)
|
(4,851
|
)
|
―
|
|||||||
|
Issuance of common stock under employee stock plans, net of withholdings
|
1,330
|
1,000
|
6,771
|
|||||||||
|
Excess tax benefit (provision) from share-based payment arrangements
|
(460
|
)
|
9,250
|
13,404
|
||||||||
|
Other financing activities
|
(200
|
)
|
(222
|
)
|
―
|
|||||||
|
Net cash provided by (used in) by financing activities
|
(303,710
|
)
|
60,888
|
242,519
|
||||||||
|
Net increase (decrease) in cash and equivalents
|
21,533
|
(25,799
|
)
|
(150,898
|
)
|
|||||||
|
Cash and equivalents at beginning of year
|
186,594
|
212,393
|
363,291
|
|||||||||
|
Cash and equivalents at end of year
|
$
|
208,127
|
$
|
186,594
|
$
|
212,393
|
||||||
|
Cash and equivalents at end of year
|
$
|
208,127
|
$
|
186,594
|
$
|
212,393
|
||||||
|
Homebuilding restricted cash at end of year
|
28,321
|
35,990
|
38,222
|
|||||||||
|
Financial services restricted cash at end of year
|
21,710
|
22,914
|
1,295
|
|||||||||
|
Cash and equivalents and restricted cash at end of year
|
$
|
258,158
|
$
|
245,498
|
$
|
251,910
|
||||||
The accompanying notes are an integral part of these consolidated statements.
1. Company Organization and Operations
Effective October 1, 2015, pursuant to the terms and conditions of the Amended and Restated Agreement and Plan of Merger (the "Merger Agreement"), dated as of June 14, 2015, between Standard Pacific Corp. ("Standard Pacific") and The Ryland Group, Inc. ("Ryland"), Ryland merged with and into Standard Pacific, with Standard Pacific continuing as the surviving corporation and changing its name to "CalAtlantic Group, Inc." ("the Company").
We are a geographically diversified builder of single-family attached and detached homes. We also provide mortgage, title and escrow services, and are focused on providing an exceptional end-to-end homebuying experience for our customers. Unless the context otherwise requires, the terms "we," "us," "our" and "the Company" refer to CalAtlantic Group, Inc. and its subsidiaries.
The percentages of our homes delivered by reportable segment for the years ended December 31, 2016, 2015 and 2014 were as follows:
|
Year Ended December 31,
|
||||||
|
Region
|
2016
|
2015
|
2014
|
|||
| (Unaudited) | ||||||
|
North
|
21%
|
11%
|
n/a%
|
|||
|
Southeast
|
28
|
34
|
38
|
|||
|
Southwest
|
28
|
26
|
21
|
|||
|
West
|
23
|
29
|
41
|
|||
|
Total
|
100%
|
100%
|
100%
|
|||
2. Summary of Significant Accounting Policies
a. Basis of Presentation
The consolidated financial statements include the accounts of CalAtlantic Group, Inc. and its wholly owned subsidiaries. All significant intercompany accounts and transactions have been eliminated. Certain reclassifications have been made to prior year amounts to conform to the current year presentation.
b. Use of Estimates
The preparation of financial statements in conformity with U.S. generally accepted accounting principles requires management to make estimates and assumptions that affect the reported amounts of assets and liabilities and disclosure of contingent assets and liabilities at the date of the financial statements and the reported amounts of revenues and expenses during the reporting period. Actual results could differ from those estimates.
c. Segment Reporting
Accounting Standards Codification ("ASC") Topic 280, Segment Reporting ("ASC 280") established standards for the manner in which public enterprises report information about operating segments. In accordance with ASC 280, we have determined that each of our four homebuilding regions and our financial services operations (consisting of our mortgage financing and title operations) are our operating segments. Corporate is a non-operating segment. Our four homebuilding reportable segments include: North, consisting of our operating divisions in Georgia, Delaware, Illinois, Indiana, Maryland, Minnesota, New Jersey, Pennsylvania, Virginia and Washington D.C.; Southeast, consisting of our operating divisions in Florida and the Carolinas; Southwest, consisting of our operating divisions in Texas, Colorado and Nevada; and West, consisting of our operating divisions in California and Arizona.
d. Variable Interest Entities
We account for variable interest entities in accordance with ASC Topic 810, Consolidation ("ASC 810"). Under ASC 810, a variable interest entity ("VIE") is created when: (a) the equity investment at risk in the entity is not sufficient to permit the entity to finance its activities without additional subordinated financial support provided by other parties, including the equity holders; (b) the entity's equity holders as a group either (i) lack the direct or indirect ability to make decisions about
CALATLANTIC GROUP, INC. AND SUBSIDIARIES
NOTES TO CONSOLIDATED FINANCIAL STATEMENTS
the entity, (ii) are not obligated to absorb expected losses of the entity or (iii) do not have the right to receive expected residual returns of the entity; or (c) the entity's equity holders have voting rights that are not proportionate to their economic interests, and the activities of the entity involve or are conducted on behalf of the equity holder with disproportionately few voting rights. If an entity is deemed to be a VIE pursuant to ASC 810, the enterprise that has both (i) the power to direct the activities of a VIE that most significantly impact the entity's economic performance and (ii) the obligation to absorb the expected losses of the entity or right to receive benefits from the entity that could be potentially significant to the VIE is considered the primary beneficiary and must consolidate the VIE. In accordance with ASC 810, we perform ongoing reassessments of whether we are the primary beneficiary of a VIE.
e. Limited Partnerships and Limited Liability Companies
We analyze our homebuilding and land development joint ventures under the provisions of ASC 810 (as discussed above) when determining whether the entity should be consolidated. In accordance with the provisions of ASC 810, limited partnerships or similar entities, such as limited liability companies, must be further evaluated under the presumption that the general partner, or the managing member in the case of a limited liability company, is deemed to have a controlling interest and therefore must consolidate the entity unless the limited partners or non-managing members have: (1) the ability, either by a single limited partner or through a simple majority vote, to dissolve or liquidate the entity, or kick-out the managing member/general partner without cause, or (2) substantive participatory rights that are exercised in the ordinary course of business. Under the provisions of ASC 810, we may be required to consolidate certain investments in which we hold a general partner or managing member interest.
f. Revenue Recognition
In accordance with ASC Topic 360-20, Property, Plant, and Equipment – Real Estate Sales ("ASC 360-20"), homebuilding revenues are recorded after construction is completed, a sufficient down payment has been received, title has passed to the homebuyer, collection of the purchase price is reasonably assured and we have no other continuing involvement. In instances where the homebuyer's financing is originated by our mortgage financing subsidiary and the buyer has not made an adequate initial or continuing investment as prescribed by ASC 360-20, the profit on such home sales is deferred until the sale of the related mortgage loan to a third-party investor has been completed.
In accordance with ASC Topic 825, Financial Instruments ("ASC 825"), loan origination fees and expenses are recognized upon origination of loans by our mortgage financing operation. Generally our policy is to sell all mortgage loans originated. These sales generally occur within a short period of time (typically 30-45 days of origination). Mortgage loan interest is accrued only so long as it is deemed collectible.
g. Cost of Sales
Homebuilding cost of sales is recognized in the period when the related homebuilding revenues are recognized. Cost of sales is recorded based upon total estimated costs to be allocated to each home within a community. Certain direct construction costs are specifically identified and allocated to homes while other common costs, such as land, land improvements and carrying costs, are allocated to homes within a community based upon their anticipated relative sales or fair value. Any changes to the estimated costs are allocated to the remaining undelivered lots and homes within their respective community. The estimation of these costs requires a substantial degree of judgment by management.
CALATLANTIC GROUP, INC. AND SUBSIDIARIES
NOTES TO CONSOLIDATED FINANCIAL STATEMENTS
h. Warranty Costs
Estimated future direct warranty costs are accrued and charged to cost of sales in the period when the related homebuilding revenues are recognized. Amounts accrued are based upon historical experience. Indirect warranty overhead salaries and related costs are charged to cost of sales in the period incurred. We assess the adequacy of our warranty accrual on a quarterly basis and adjust the amounts recorded if necessary. During the years ended December 31, 2016, 2015 and 2014, we did not record any warranty adjustments. Our warranty accrual is included in accrued liabilities in the accompanying consolidated balance sheets. Changes in our warranty accrual are detailed in the table set forth below:
|
Year Ended December 31,
|
||||||||||||
|
2016
|
2015
|
2014
|
||||||||||
| (Dollars in thousands) | ||||||||||||
|
Warranty accrual, beginning of the year
|
$
|
40,691
|
$
|
13,584
|
$
|
13,811
|
||||||
|
Warranty accrual assumed with merger
|
―
|
25,528
|
―
|
|||||||||
|
Warranty costs accrued during the year
|
24,092
|
13,803
|
7,550
|
|||||||||
|
Warranty costs paid during the year
|
(20,851
|
)
|
(12,224
|
)
|
(7,777
|
)
|
||||||
|
Warranty accrual, end of the year
|
$
|
43,932
|
$
|
40,691
|
$
|
13,584
|
||||||
i. Earnings Per Common Share
We compute earnings per share in accordance with ASC Topic 260, Earnings per Share ("ASC 260"), which requires earnings per share for each class of stock (common stock and participating preferred stock) to be calculated using the two-class method. The two-class method is an allocation of earnings between the holders of common stock and a company's participating security holders. Under the two-class method, earnings for the reporting period are allocated between common shareholders and other security holders based on their respective participation rights in undistributed earnings. Unvested share-based payment awards that contain non-forfeitable rights to dividends or dividend equivalents are participating securities and, therefore, are included in computing earnings per share pursuant to the two-class method.
Basic earnings per common share is computed by dividing income or loss available to common stockholders by the weighted average number of shares of basic common stock outstanding. Our Series B junior participating convertible preferred stock ("Series B Preferred Stock"), which was convertible into shares of our common stock at the holder's option, and our unvested restricted stock, are classified as participating securities in accordance with ASC 260. Net income allocated to the holders of our Series B Preferred Stock and unvested restricted stock is calculated based on the shareholders' proportionate share of weighted average shares of common stock outstanding on an if-converted basis.
For purposes of determining diluted earnings per common share, basic earnings per common share is further adjusted to include the effect of potential dilutive common shares outstanding, including stock options, stock appreciation rights, performance share awards and unvested restricted stock using the more dilutive of either the two-class method or the treasury stock method, and Series B Preferred Stock and convertible debt using the if-converted method. Under the two-class method of calculating diluted earnings per share, net income is reallocated to common stock, the Series B Preferred stock and all dilutive securities based on the contractual participating rights of the security to share in the current earnings as if all of the earnings for the period had been distributed. In the computation of diluted earnings per share, the two-class method and if-converted method for the Series B Preferred Stock resulted in the same earnings per share amounts as the holder of the Series B Preferred Stock had the same economic rights as the holders of the common stock.
CALATLANTIC GROUP, INC. AND SUBSIDIARIES
NOTES TO CONSOLIDATED FINANCIAL STATEMENTS
|
Year Ended December 31,
|
||||||||||||
|
2016
|
2015
|
2014
|
||||||||||
|
(Dollars in thousands, except per share amounts)
|
||||||||||||
|
Numerator:
|
||||||||||||
|
Net income
|
$
|
484,730
|
$
|
213,509
|
$
|
215,865
|
||||||
|
Less: Net income allocated to preferred shareholder
|
―
|
(32,997
|
)
|
(51,650
|
)
|
|||||||
|
Less: Net income allocated to unvested restricted stock
|
(1,168
|
)
|
(369
|
)
|
(297
|
)
|
||||||
|
Net income available to common stockholders for basic
|
||||||||||||
|
earnings per common share
|
483,562
|
180,143
|
163,918
|
|||||||||
|
Effect of dilutive securities:
|
||||||||||||
|
Net income allocated to preferred shareholder
|
―
|
32,997
|
51,650
|
|||||||||
|
Interest on 1.625% convertible senior notes due 2018
|
2,059
|
47
|
n/a
|
|||||||||
|
Interest on 0.25% convertible senior notes due 2019
|
1,862
|
9
|
n/a
|
|||||||||
|
Interest on 1.25% convertible senior notes due 2032
|
1,407
|
898
|
899
|
|||||||||
|
Net income available to common and preferred stock for diluted
|
||||||||||||
|
earnings per share
|
$
|
488,890
|
$
|
214,094
|
$
|
216,467
|
||||||
|
Denominator:
|
||||||||||||
|
Weighted average basic common shares outstanding
|
118,212,740
|
71,713,747
|
55,737,548
|
|||||||||
|
Weighted average additional common shares outstanding if preferred shares
|
||||||||||||
|
converted to common shares (if dilutive)
|
―
|
13,135,814
|
17,562,557
|
|||||||||
|
Total weighted average common shares outstanding if preferred shares
|
||||||||||||
|
converted to common shares
|
118,212,740
|
84,849,561
|
73,300,105
|
|||||||||
|
Effect of dilutive securities:
|
||||||||||||
|
Share-based awards
|
666,928
|
816,459
|
1,256,964
|
|||||||||
|
1.625% convertible senior notes due 2018
|
7,167,960
|
1,804,192
|
n/a
|
|||||||||
|
0.25% convertible senior notes due 2019
|
3,639,150
|
915,985
|
n/a
|
|||||||||
|
1.25% convertible senior notes due 2032
|
6,298,207
|
6,262,570
|
6,262,570
|
|||||||||
|
Weighted average diluted shares outstanding
|
135,984,985
|
94,648,767
|
80,819,639
|
|||||||||
|
Income per share:
|
||||||||||||
|
Basic
|
$
|
4.09
|
$
|
2.51
|
$
|
2.94
|
||||||
|
Diluted
|
$
|
3.60
|
$
|
2.26
|
$
|
2.68
|
||||||
j. Stock-Based Compensation
We account for share-based awards in accordance with ASC Topic 718, Compensation – Stock Compensation ("ASC 718"). ASC 718 requires that the cost resulting from all share-based payment transactions be recognized in the financial statements. ASC 718 requires all entities to apply a fair value-based measurement method in accounting for share-based payment transactions with employees except for equity instruments held by employee share ownership plans.
k. Accumulated Other Comprehensive Income (Loss)
Accumulated other comprehensive income (loss) consists of unrealized gains or losses on available-for-sale marketable securities, as reported within the accompanying consolidated statements of stockholders' equity and consolidated statements of comprehensive income. At December 31, 2016, accumulated other comprehensive income included unrealized gains of $523,000 on available-for-sale marketable securities, offset with reclassification adjustments, which represent realized gains or losses on the sales of available-for-sale marketable securities, in the amount of $695,000. Realized gains or losses were included in homebuilding other income (expense) in the accompanying consolidated statements of operations. Please see Note 2.u. for discussion of other comprehensive income (loss) related to derivative instruments and hedging activities.
l. Cash and Equivalents and Restricted Cash
Cash and equivalents include cash on hand, demand deposits and all highly liquid short-term investments, including interest-bearing securities purchased with a maturity of three months or less from the date of purchase. At December 31, 2016, cash and equivalents included $150.3 million of cash from home closings held in escrow for our benefit, typically for less than five days, which are considered deposits in-transit.
At December 31, 2016, homebuilding restricted cash represented $28.3 million of cash held in cash collateral accounts primarily related to certain letters of credit that have been issued. Financial services restricted cash as of December 31, 2016
CALATLANTIC GROUP, INC. AND SUBSIDIARIES
NOTES TO CONSOLIDATED FINANCIAL STATEMENTS
consisted of $17.7 million held in cash collateral accounts primarily related to certain letters of credit that have been issued, $3.0 million related to our financial services subsidiary mortgage credit facilities and $1.0 million related to funds held in trust for third parties.
m. Mortgage Loans Held for Sale
In accordance with ASC 825, mortgage loans held for sale are recorded at fair value and loan origination and related costs are recognized upon loan closing. In addition, we recognize net interest income on loans held for sale from the date of origination through the date of disposition. We sell substantially all of the loans we originate in the secondary mortgage market, with servicing rights released on a non-recourse basis. These sales are generally subject to our obligation to repay the gain on sale if the loan is prepaid by the borrower within a certain time period following such sale, or to repurchase loans or indemnify investors for losses from borrower defaults if, among other things, the loan purchaser's underwriting guidelines are not met or there is fraud in connection with the loan. We establish liabilities for such anticipated losses based upon, among other things, an analysis of indemnification and repurchase requests received, an estimate of potential indemnification or repurchase claims not yet received, our historical amount of indemnification payments and repurchases, and losses incurred through the disposition of affected loans.
n. Mortgage Loans Held for Investment
Certain mortgage loans are classified as held for investment based on our intent and ability to hold the loans for the foreseeable future or to maturity. Mortgage loans held for investment are recorded at their unpaid principal balance, net of discounts and premiums, unamortized net deferred loan origination costs and fees and allowance for loan losses. Discounts, premiums, and net deferred loan origination costs and fees are amortized into income over the contractual life of the loan. Mortgage loans held for investment are continually evaluated for collectability and, if appropriate, specific allowances are established based on estimates of collateral value. Loans are placed on non-accrual status for first trust deeds when the loan is 90 days past due and for second trust deeds when the loan is 30 days past due, and previously accrued interest is reversed from income if deemed uncollectible. We had allowances for loan losses for loans held for investment of $1.6 million as of December 31, 2016 and 2015.
o. Inventories
Inventories consist of land, land under development, homes under construction, completed homes and model homes and are stated at cost, net of any impairment charges. We capitalize direct carrying costs, including interest, property taxes and related development costs to inventories. Field construction supervision and related direct overhead are also included in the capitalized cost of inventories. Direct construction costs are specifically identified and allocated to homes while other common costs, such as land, land improvements and carrying costs, are allocated to homes within a community based upon their anticipated relative sales or fair value.
We assess the recoverability of real estate inventories in accordance with the provisions of ASC Topic 360, Property, Plant, and Equipment ("ASC 360"). ASC 360 requires long-lived assets, including inventories, that are expected to be held and used in operations to be carried at the lower of cost or, if impaired, the fair value of the asset. ASC 360 requires that companies evaluate long-lived assets for impairment based on undiscounted future cash flows of the assets at the lowest level for which there is identifiable cash flows. Long-lived assets to be disposed of are reported at the lower of carrying amount or fair value less cost to sell.
p. Capitalization of Interest
We follow the practice of capitalizing interest to inventories owned during the period of development and to investments in unconsolidated homebuilding and land development joint ventures in accordance with ASC Topic 835, Interest ("ASC 835"). Homebuilding interest capitalized as a cost of inventories owned is included in cost of sales as related units or lots are sold. Interest capitalized to investments in unconsolidated homebuilding and land development joint ventures is included as a reduction of income from unconsolidated joint ventures when the related homes or lots are sold to third parties. Interest capitalized to investments in unconsolidated land development joint ventures is transferred to inventories owned if the underlying lots are purchased by us. To the extent our homebuilding debt exceeds our qualified assets as defined in ASC 835, we expense a portion of the interest incurred by us. Qualified assets represent projects that are actively selling or under development as well as investments in unconsolidated joint ventures. During the years ended
CALATLANTIC GROUP, INC. AND SUBSIDIARIES
NOTES TO CONSOLIDATED FINANCIAL STATEMENTS
December 31, 2016, 2015 and 2014, our qualified assets exceeded our debt, and as a result, all of our homebuilding interest incurred during 2016, 2015 and 2014 was capitalized in accordance with ASC 835. The following is a summary of homebuilding interest capitalized to inventories owned and investments in unconsolidated joint ventures, amortized to cost of sales and income (loss) from unconsolidated joint ventures and expensed as interest expense, for the years ended December 31, 2016, 2015 and 2014:
|
Year Ended December 31,
|
||||||||||||
|
2016
|
2015
|
2014
|
||||||||||
|
(Dollars in thousands)
|
||||||||||||
|
Total interest incurred
|
$
|
233,225
|
$
|
171,509
|
$
|
153,695
|
||||||
|
Less: Interest capitalized to inventories owned
|
(229,200
|
)
|
(169,233
|
)
|
(151,962
|
)
|
||||||
|
Less: Interest capitalized to investments in unconsolidated joint ventures
|
(4,025
|
)
|
(2,276
|
)
|
(1,733
|
)
|
||||||
|
Interest expense
|
$
|
―
|
$
|
―
|
$
|
―
|
||||||
|
Interest previously capitalized to inventories owned, included in home cost of home sales
|
$
|
170,105
|
$
|
131,611
|
$
|
119,422
|
||||||
|
Interest previously capitalized to inventories owned, included in land cost of land sales
|
$
|
1,596
|
$
|
7,770
|
$
|
3,690
|
||||||
|
Interest previously capitalized to investments in unconsolidated joint ventures,
|
||||||||||||
|
included in income (loss) from unconsolidated joint ventures
|
$
|
861
|
$
|
―
|
$
|
30
|
||||||
|
Interest capitalized in ending inventories owned (1)
|
$
|
365,701
|
$
|
305,459
|
$
|
275,607
|
||||||
|
Interest capitalized as a percentage of inventories owned
|
5.7
|
%
|
5.0
|
%
|
8.5
|
%
|
||||||
|
Interest capitalized in ending investments in unconsolidated joint ventures (1)
|
$
|
3,362
|
$
|
2,941
|
$
|
665
|
||||||
|
Interest capitalized as a percentage of investments in unconsolidated joint ventures
|
2.6
|
%
|
2.2
|
%
|
1.3
|
%
|
||||||
________________
|
(1)
|
During the years ended December 31, 2016, 2015 and 2014, in connection with lot purchases from our joint ventures, $2.7 million, $0 and $6.0 million, respectively, of capitalized interest was transferred from investments in unconsolidated joint ventures to inventories owned.
|
q. Investments in Unconsolidated Land Development and Homebuilding Joint Ventures
Investments in our unconsolidated land development and homebuilding joint ventures are accounted for under the equity method of accounting. Under the equity method, we recognize our proportionate share of earnings and losses generated by the joint venture upon the delivery of lots or homes to third parties. All joint venture profits generated from land sales to us are deferred and recorded as a reduction to our cost basis in the lots purchased until the homes to be constructed are ultimately sold by us to third parties. Our ownership interests in our unconsolidated joint ventures vary, but are generally less than or equal to 50 percent.
We review inventory projects within our unconsolidated joint ventures for impairments consistent with our real estate inventories described in Note 2.o. We also review our investments in unconsolidated joint ventures for evidence of an other than temporary decline in value. To the extent we deem any portion of our investment in unconsolidated joint ventures as not recoverable, we impair our investment accordingly.
r. Goodwill
In accordance with ASC Topic 350, Intangibles, Goodwill and Other ("ASC 350"), we analyze goodwill on at least an annual basis through a qualitative assessment to determine whether it is necessary to perform a two-step goodwill impairment test. ASC 350 states that an entity may assess qualitative factors to determine whether it is more likely than not that the fair value of a reporting unit is less than its carrying amount, including goodwill. Such qualitative factors include: (1) macroeconomic conditions, such as a deterioration in general economic conditions, (2) industry and market considerations such as deterioration in the environment in which the entity operates, (3) cost factors such as increases in raw materials, labor costs, etc., and (4) overall financial performance such as negative or declining cash flows or a decline in actual or planned revenue or earnings. If the qualitative analysis determines that additional impairment testing is required, the two-step impairment testing in accordance with ASC 350 would be initiated. We continually evaluate our qualitative inputs to assess whether events and circumstances have occurred that indicate the goodwill balance may not be recoverable. During 2016, we performed an analysis of qualitative factors for potential impairment of goodwill carried and determined that no impairment existed. See Note 3 for additional information related to goodwill.
CALATLANTIC GROUP, INC. AND SUBSIDIARIES
NOTES TO CONSOLIDATED FINANCIAL STATEMENTS
s. Income Taxes
We account for income taxes in accordance with ASC Topic 740, Income Taxes ("ASC 740"). ASC 740 requires an asset and liability approach for measuring deferred taxes based on temporary differences between the financial statement and tax bases of assets and liabilities existing at each balance sheet date using enacted tax rates for years in which taxes are expected to be paid or recovered.
We evaluate our deferred tax assets on a quarterly basis to determine whether a valuation allowance is required. In accordance with ASC 740, we assess whether a valuation allowance should be established based on our determination of whether it is more likely than not that some portion or all of the deferred tax assets will not be realized. The ultimate realization of deferred tax assets depends primarily on: (i) our ability to carry back net operating losses to tax years where we have previously paid income taxes based on applicable federal law; and (ii) our ability to generate future taxable income during the periods in which the related temporary differences become deductible. The assessment of a valuation allowance includes giving appropriate consideration to all positive and negative evidence related to the realization of the deferred tax asset. This assessment considers, among other things, the nature, frequency and severity of current and cumulative losses, forecasts of future profitability, the duration of statutory carryforward periods, our experience with operating loss and tax credit carryforwards not expiring unused, and tax planning alternatives. Significant judgment is required in determining the future tax consequences of events that have been recognized in our consolidated financial statements and/or tax returns. Actual outcomes of these future tax consequences could differ materially from the outcomes we currently anticipate.
ASC 740 defines the methodology for recognizing the benefits of uncertain tax return positions as well as guidance regarding the measurement of the resulting tax benefits. These provisions require an enterprise to recognize the financial statement effects of a tax position when it is more likely than not (defined as a likelihood of more than 50%), based on the technical merits, that the position will be sustained upon examination. In addition, these provisions provide guidance on derecognition, classification, interest and penalties, accounting in interim periods, disclosure, and transition. The evaluation of whether a tax position meets the more-likely-than-not recognition threshold requires a substantial degree of judgment by management based on the individual facts and circumstances. Actual results could differ from estimates.
t. Insurance and Litigation Accruals
Insurance and litigation accruals are established with respect to estimated future claims cost. We maintain general liability insurance designed to protect us against a portion of our risk of loss from construction-related claims. We also generally require our subcontractors and design professionals to indemnify us for liabilities arising from their work, subject to various limitations. However, such indemnity is significantly limited with respect to certain subcontractors that are added to our general liability insurance policy. We record allowances to cover the estimated costs of our self-insurance liability based on an analysis performed by an independent third party actuary that uses our historical claim and expense data, as well as industry data to estimate these overall costs. As of December 31, 2016, we present our self-insurance liability on a gross basis within accrued liabilities in the accompanying consolidated balance sheets without consideration of insurance recoveries and amounts we have paid on behalf of and expect to recover from other parties, if any. Also effective December 31, 2016, estimated probable insurance and other recoveries are presented as receivables within other assets in the accompanying consolidated balance sheets. Previously, these insurance and recoverable amounts were presented on a net basis within our self-insurance liability. This change in presentation had no impact on our consolidated statements of operations or cash flows. As a result, we reclassified the December 31, 2015 balance sheet to increase other assets and accrued liabilities by $83.9 million, reflecting the balance of probable insurance and other recoveries as receivables. Our total insurance and litigation accruals on a gross basis as of December 31, 2016 and 2015 were $233.5 million and $209.2 million, respectively.
.u. Derivative Instruments and Hedging Activities
We account for derivatives and certain hedging activities in accordance with ASC Topic 815, Derivatives and Hedging ("ASC 815"). ASC 815 establishes the accounting and reporting standards requiring that every derivative instrument, including certain derivative instruments embedded in other contracts, be recorded as either assets or liabilities in the consolidated balance sheets and to measure these instruments at fair value. Gains and losses resulting from changes in the fair value of derivatives are recognized in the consolidated statement of operations or recorded in accumulated other comprehensive income (loss), net of tax, and recognized in the consolidated statement of operations when the hedged item
CALATLANTIC GROUP, INC. AND SUBSIDIARIES
NOTES TO CONSOLIDATED FINANCIAL STATEMENTS
affects earnings, depending on the purpose of the derivative and whether the derivative qualifies for hedge accounting treatment.
Our policy is to designate at a derivative's inception the specific assets, liabilities or future commitments being hedged and monitor the derivative to determine if the derivative remains an effective hedge. The effectiveness of a derivative as a hedge is based on a high correlation between changes in the derivative's value and changes in the value of the underlying hedged item. We recognize gains or losses for amounts received or paid when the underlying transaction settles. We do not enter into or hold derivatives for trading or speculative purposes.
v. Accounting for Guarantees
We account for guarantees in accordance with the provisions of ASC Topic 460, Guarantees ("ASC 460"). Under ASC 460, recognition of a liability is recorded at its estimated fair value based on the present value of the expected contingent payments under the guarantee arrangement. The types of guarantees that we generally provide that are subject to ASC 460 generally are made to third parties on behalf of our unconsolidated homebuilding and land development joint ventures. As of December 31, 2016, these guarantees included, but were not limited to, surety bond indemnities.
w. Recent Accounting Pronouncements
In May 2014, the Financial Accounting Standards Board ("FASB") issued Accounting Standards Update ("ASU") No. 2014-09, Revenue from Contracts with Customers ("ASU 2014-09"), which supersedes existing accounting literature relating to how and when a company recognizes revenue. Under ASU 2014-09, a company will recognize revenue when it transfers promised goods or services to customers in an amount that reflects the consideration to which the company expects to be entitled in exchange for those goods and services. In August 2015, the FASB issued ASU No. 2015-14, Revenue from Contracts with Customers (Topic 606): Deferral of the Effective Date, which delayed the effective date of ASU 2014-09 by one year. As a result, for public companies, ASU 2014-09 will be effective for annual reporting periods and interim periods within those annual periods beginning after December 15, 2017, and is to be applied either with a full retrospective or modified retrospective approach, with early application permitted. We do not plan to early adopt the guidance. We expect to adopt the new standard under the modified retrospective approach. Although we are still in the process of evaluating our contracts, we do not believe the adoption of ASU 2014-09 will have a material impact on the amount or timing of our homebuilding revenues. We are continuing to evaluate the impact the adoption of ASU 2014-09 may have on other aspects of our business and on our consolidated financial statements and disclosures.
In June 2014, the FASB issued ASU No. 2014-12, Accounting for Share-Based Payments When the Terms of an Award Provide That a Performance Target Could Be Achieved after the Requisite Service Period ("ASU 2014-12"), which requires that a performance target that affects vesting and that could be achieved after the requisite service period be treated as a performance condition. A reporting entity should apply existing guidance in ASC 718, Compensation — Stock Compensation, as it relates to awards with performance conditions that affect vesting to account for such awards. Our adoption of ASU 2014-12 on January 1, 2016 did not have an effect on our financial statements.
In August 2014, the FASB issued ASU No. 2014-15, Disclosure of Uncertainties About an Entity's Ability to Continue as a Going Concern ("ASU 2014-15"), which requires management to perform interim and annual assessments on whether there are conditions or events that raise substantial doubt about the entity's ability to continue as a going concern within one year of the date the financial statements are issued and to provide related disclosures, if required. The amendments in ASU 2014-15 are effective for the annual period ending after December 15, 2016, and for annual and interim periods thereafter. Our adoption of ASU 2014-15 did not have an effect on our financial statements and related disclosures.
In February 2015, the FASB issued ASU No. 2015-02, Amendments to the Consolidation Analysis ("ASU 2015-02"), which changes the analysis that a reporting entity must perform to determine whether it should consolidate certain types of legal entities. Our adoption of ASU 2015-02 on January 1, 2016 did not have a material effect on our financial statements and related disclosures.
In September 2015, the FASB issued ASU No. 2015-16, Simplifying the Accounting for Measurement-Period Adjustments ("ASU 2015-16"), which eliminates the requirement that an acquirer in a business combination account for measurement-period adjustments retrospectively. Instead, an acquirer will recognize a measurement-period adjustment
CALATLANTIC GROUP, INC. AND SUBSIDIARIES
NOTES TO CONSOLIDATED FINANCIAL STATEMENTS
during the period in which it determines the amount of the adjustment, including the effect on earnings of any amounts it would have recorded in previous periods as if the accounting had been completed at the acquisition date. Our adoption of ASU 2015-16 on January 1, 2016 did not have a material effect on our financial statements.
In January 2016, the FASB issued ASU 2016-01, Financial Instruments - Overall: Recognition and Measurement of Financial Assets and Financial Liabilities ("ASU 2016-01"), which modifies how entities measure equity investments and present changes in the fair value of financial liabilities. Under the new guidance, entities will have to measure equity investments that do not result in consolidation and are not accounted under the equity method at fair value and recognize any changes in fair value in net income unless the investments qualify for the new practicality exception. A practicality exception will apply to those equity investments that do not have a readily determinable fair value and do not qualify for the practical expedient to estimate fair value under ASC Topic 820, Fair Value Measurements, and as such these investments may be measured at cost. ASU 2016-01 is effective for annual periods and interim periods within those annual periods beginning after December 15, 2017. We are currently evaluating the impact adoption will have on our financial statements.
In March 2016, the FASB issued ASU 2016-02, Leases ("ASU 2016-02"), which provides guidance for accounting for leases. ASU 2016-02 requires lessees to classify leases as either finance or operating leases and to record a right-of-use asset and a lease liability for all leases with a term greater than 12 months regardless of the lease classification. The lease classification will determine whether the lease expense is recognized based on an effective interest rate method or on a straight line basis over the term of the lease. ASU 2016-02 is effective for annual periods and interim periods within those annual periods beginning after December 15, 2018. We are currently evaluating the impact adoption will have on our financial statements.
In March 2016, the FASB issued ASU 2016-07, Investments- Equity Method and Joint Ventures: Simplifying the Transition to the Equity Method of Accounting ("ASU 2016-07"), which eliminates the requirement to apply the equity method of accounting retrospectively when a reporting entity obtains significant influence over a previously held investment. ASU 2016-07 is effective for annual periods and interim periods within those annual periods beginning after December 15, 2016. Our adoption of ASU 2016-07 is not expected to have a material effect on our financial statements.
In March 2016, the FASB issued ASU No. 2016-09, Compensation — Stock Compensation: Improvements to Employee Share-Based Payment Accounting ("ASU 2016-09"), which simplifies several aspects of the accounting for share-based payment transactions, including the income tax consequences, classification of awards as either equity or liabilities, and classification on the statement of cash flows. ASU 2016-09 is effective for annual periods and interim periods within those annual periods beginning after December 15, 2016. Our adoption of ASU 2016-09 is not expected to have a material effect on our financial statements.
In August 2016, the FASB issued ASU No. 2016-15, Statement of Cash Flows (Topic 230): Classification of Certain Cash Receipts and Cash Payments ("ASU 2016-15"). ASU 2016-15 provides guidance on how certain cash receipts and cash payments are to be presented and classified in the statement of cash flows. ASU 2016-15 is effective for annual periods and interim periods within those annual periods beginning after December 15, 2017, and early adoption is permitted. We are currently evaluating the impact adoption will have on our financial statements.
In November 2016, the FASB issued ASU No. 2016-18, Statement of Cash Flows (Topic 230): Restricted Cash ("ASU 2016-18"). ASU 2016-18 provides guidance on the classification of restricted cash in the statement of cash flows. ASU 2016-18 is effective for annual periods and interim periods within those annual periods beginning after December 15, 2017, and early adoption is permitted. We are currently evaluating the impact adoption will have on our financial statements.
In January 2017, the FASB issued ASU No. 2017-01, Business Combinations: Clarifying the Definition of a Business ("ASU 2017-01"). ASU 2017-01 clarifies the definition of a business for determining whether transactions should be accounted for as acquisitions (or disposals) of assets or businesses. ASU 2017-01 is effective for annual periods and interim periods within those annual periods beginning after December 15, 2017, and early adoption is permitted. We are currently evaluating the impact adoption will have on our financial statements.
In January 2017, the FASB issued ASU No. 2017-04, Intangibles - Goodwill and Other (Topic 350): Simplifying the Accounting for Goodwill Impairment ("ASU 2017-04"). ASU 2017-04 removes the requirement to perform a hypothetical
CALATLANTIC GROUP, INC. AND SUBSIDIARIES
NOTES TO CONSOLIDATED FINANCIAL STATEMENTS
purchase price allocation to measure goodwill impairment. A goodwill impairment will now be the amount by which a reporting unit's carrying value exceeds its fair value, not to exceed the carrying amount of goodwill. ASU 2017-04 is effective for annual periods and interim periods within those annual periods beginning after December 15, 2019, and early adoption is permitted. We are currently evaluating the impact adoption will have on our financial statements.
3. Business Acquisitions
Effective October 1, 2015, pursuant to the terms and conditions of the Merger Agreement between Standard Pacific and Ryland, Ryland merged with and into Standard Pacific (the "Merger"), with Standard Pacific continuing as the surviving corporation. At the same time: (i) Standard Pacific changed its name to "CalAtlantic Group, Inc." (the "Company") and effected a reverse stock split such that each five shares of common stock of Standard Pacific issued and outstanding immediately prior to the closing of the Merger were combined and converted into one issued and outstanding share of common stock of the Company, (ii) MP CA Homes, LLC ("MatlinPatterson"), the sole owner of the Company's outstanding Series B Preferred Stock, converted all of its preferred stock to Common Stock, and (iii) each outstanding share of Ryland common stock, stock options and restricted stock units were converted into the right to receive, or the option to acquire, as applicable, 1.0191 shares of Company common stock. Cash was paid in lieu of all fractional shares. The primary purpose for our merger with Ryland was to gain both geographic and product diversification and expand our reach and enhance our growth prospects across the homebuilding spectrum, from entry level to luxury. In addition, the merger was intended to create production, purchasing and other synergies intended to result in cost savings and efficiencies.
The following table summarizes the components of common stock outstanding immediately following the Merger as of October 1, 2015:
|
As of
|
Split/Exchange
|
As Adjusted
|
||||
|
October 1, 2015
|
Ratio
|
October 1, 2015
|
||||
|
Common Stock - Standard Pacific
|
277,220,324
|
5
|
55,444,065
|
|||
|
Common Stock - Ryland
|
46,856,558
|
1.0191
|
47,751,518
|
|||
|
Accelerated Vesting of Ryland Equity Awards
|
234,751
|
1.0191
|
239,235
|
|||
|
Preferred Stock - Standard Pacific
|
87,812,786
|
5
|
17,562,557
|
|||
|
Fractional Shares Paid Out
|
―
|
(1,041)
|
||||
|
Total
|
412,124,419
|
120,996,334
|
Based on an evaluation of the provisions of ASC Topic 805, Business Combinations, ("ASC 805") Standard Pacific was determined to be the acquirer for accounting purposes. Under FASB ASC Topic 805, Standard Pacific is treated as having acquired Ryland in an all-stock transaction for a total purchase price of approximately $2.0 billion. The calculation of the total purchase price was based on the outstanding shares of Ryland common stock as of the acquisition date multiplied by the 1.0191 exchange ratio and multiplied by the Company's split-adjusted share price of $40.46 on the date of acquisition. The purchase price also included $30.6 million of consideration representing the fair value of replacement equity awards attributable to service prior to the closing of the Merger. The total purchase price was calculated as follows (dollars in thousands, except per share amounts):
|
Number of shares of CalAtlantic common stock issued to Ryland shareholders
|
47,989,812
|
|||
|
Opening price per share of CalAtlantic common stock
|
$
|
40.46
|
||
|
Consideration attributable to common stock
|
1,941,668
|
|||
|
Consideration attributable to CalAtlantic equity awards in exchange
|
||||
|
for Ryland equity awards
|
|
30,616
|
||
|
Total purchase price
|
$
|
1,972,284
|
||
CALATLANTIC GROUP, INC. AND SUBSIDIARIES
NOTES TO CONSOLIDATED FINANCIAL STATEMENTS
The total purchase price was allocated to Ryland's assets and liabilities based upon fair values as determined by the Company, as follows (in thousands):
|
Cash and cash equivalents
|
$
|
268,517
|
||
|
Inventories
|
2,404,765
|
|||
|
Investments in unconsolidated joint ventures
|
13,821
|
|||
|
Deferred income taxes
|
120,615
|
|||
|
Homebuilding other assets
|
77,124
|
|||
|
Financial services assets, excluding cash
|
144,889
|
|||
|
Goodwill
|
970,185
|
|||
|
Total assets
|
3,999,916
|
|||
|
Accounts payable and accrued liabilities
|
(495,425
|
)
|
||
|
Secured project debt and other notes payables
|
(22,213
|
)
|
||
|
Senior notes payable
|
(1,291,541
|
)
|
||
|
Financial services liabilities
|
(124,619
|
)
|
||
|
Additional paid-in capital
|
(93,834
|
)
|
||
|
Total purchase price
|
$
|
1,972,284
|
During 2016, the Company completed a valuation of the 1.625% convertible senior notes assumed in the merger with Ryland and determined that the value associated with the conversion feature was $93.8 million, which is included in additional paid-in capital in the accompanying condensed consolidated balance sheet as of December 31, 2016. In connection with the valuation of the conversion feature, the related deferred tax asset was reduced by approximately $35.9 million, with a corresponding increase in goodwill. The $970.2 million of goodwill represents the excess of the purchase price over the fair value of assets acquired and liabilities assumed, and it is not deductible for income tax purposes. As of the merger date, goodwill primarily consisted of the following: (i) expected production, purchasing and other synergies resulting from the merger, (ii) savings in corporate and divisional overhead costs, (iii) the benefit of the combination of the best components of the operating practices of both legacy companies, (iv) the benefit of the combination of the best employees of each legacy company, (v) expected expanded opportunities for growth through greater geographic and customer segment diversity. Goodwill has been allocated to the Company's four homebuilding regions that were expected to benefit from the synergies of the merger. The allocation was based on the relative fair value of each acquired reporting unit in accordance with ASC 350. The key drivers used in the fair value calculation included 10-year regional level cash flow projections that were reviewed by a third party valuation expert, terminal growth rate and the weighted average cost of capital calculated for each acquired reporting unit based on regional specific assumptions.
Ryland's 2015 results of operations, which include homebuilding revenues of $772.3 million and net income of $1.8 million, are included in the accompanying consolidated statements of operations for the period of October 1, 2015 through December 31, 2015. Net income includes adjustments for amortization expense of the acquired intangible assets, inventory step-up and restructuring expenses.
The following presents summarized unaudited supplemental pro forma operating results as if Ryland had been included in the Company's consolidated statements of operations as of the beginning of the fiscal years presented.
|
Year Ended December 31,
|
||||||||
|
2015
|
2014
|
|||||||
|
(Dollars in thousands, except per share amounts)
|
||||||||
|
Home sale revenues
|
$
|
5,280,297
|
$
|
4,922,721
|
||||
|
Net income
|
$
|
321,239
|
$
|
387,123
|
||||
|
Income per share:
|
||||||||
|
Basic
|
$
|
2.65
|
$
|
3.19
|
||||
|
Diluted
|
$
|
2.32
|
$
|
2.80
|
||||
The supplemental pro forma operating results have been determined after adjusting the operating results of Ryland to reflect additional amortization that would have been recorded assuming the fair value adjustment to intangible assets had been applied beginning January 1, 2014. Certain other adjustments, including those related to conforming accounting policies
CALATLANTIC GROUP, INC. AND SUBSIDIARIES
NOTES TO CONSOLIDATED FINANCIAL STATEMENTS
and adjusting acquired inventory to fair value, have not been reflected in the supplemental pro forma operating results due to the impracticability of estimating such impacts.
Acquisition and integration expenses related to the Merger comprised of the following:
|
Year Ended December 31,
|
||||||||
|
2016
|
2015
|
|||||||
|
(Dollars in thousands)
|
||||||||
|
Severance and personnel costs
|
$
|
2,444
|
$
|
38,970
|
||||
|
Professional service, real estate related, and other expenses
|
13,586
|
13,066
|
||||||
|
Total
|
$
|
16,030
|
$
|
52,036
|
||||
The acquisition and integration costs are expensed as incurred and are presented in other homebuilding income (expense) within the accompanying consolidated statements of operations.
4. Segment Reporting
We operate two principal businesses: homebuilding and financial services.
Our homebuilding operations acquire and develop land and construct and sell single-family attached and detached homes. In connection with the merger with Ryland, the Company experienced key personnel changes and significant growth in its operations, and as a result, the Company began to develop processes and reporting packages to manage and assess the Company's performance at a regional level. In light of the key personnel changes, growth in operations, and the focus on regional information provided to the Company's chief operating decision maker, during 2016, we performed an assessment of our operating segments in accordance with ASC 280 and determined that each of our four homebuilding regions and financial services operations are our operating segments. Prior to this change, in accordance with the aggregation criteria defined in ASC 280, our homebuilding divisions were grouped into four reportable segments (which were our four homebuilding regions): North, consisting of our divisions in Georgia, Delaware, Illinois, Indiana, Maryland, Minnesota, New Jersey, Pennsylvania, Virginia and Washington D.C.; Southeast, consisting of our divisions in Florida and the Carolinas; Southwest, consisting of our divisions in Texas, Colorado and Nevada; and West, consisting of our divisions in California and Arizona. As such, current period segment information is presented consistent with prior periods.
Our mortgage financing operation provides mortgage financing to many of our homebuyers in substantially all of the markets in which we operate, and sells substantially all of the loans it originates in the secondary mortgage market. Our title, escrow and insurance subsidiaries provide title, escrow and insurance services to homebuyers in many of our markets. Our mortgage financing, title, escrow and insurance services operations are included in our financial services reportable segment, which is separately reported in our consolidated financial statements under "Financial Services."
Corporate is a non-operating segment that develops and implements strategic initiatives and supports our operating segments by centralizing key administrative functions such as accounting, finance and treasury, information technology, insurance and risk management, litigation, marketing and human resources. Corporate also provides the necessary administrative functions to support us as a publicly traded company. All of the expenses incurred by Corporate are allocated to each of our four homebuilding regions based on their respective percentage of revenues.
CALATLANTIC GROUP, INC. AND SUBSIDIARIES
NOTES TO CONSOLIDATED FINANCIAL STATEMENTS
Segment financial information relating to the Company's homebuilding operations was as follows:
|
Year Ended December 31,
|
||||||||||||
|
2016
|
2015
|
2014
|
||||||||||
|
(Dollars in thousands)
|
||||||||||||
|
Homebuilding revenues:
|
||||||||||||
|
North
|
$
|
1,017,063
|
$
|
262,988
|
$
|
n/a
|
||||||
|
Southeast
|
1,559,345
|
988,773
|
672,776
|
|||||||||
|
Southwest
|
1,659,477
|
889,496
|
495,008
|
|||||||||
|
West
|
2,152,155
|
1,355,154
|
1,243,394
|
|||||||||
|
Total homebuilding revenues
|
$
|
6,388,040
|
$
|
3,496,411
|
$
|
2,411,178
|
||||||
|
Homebuilding pretax income (1):
|
||||||||||||
|
North
|
$
|
80,498
|
$
|
5,556
|
$
|
n/a
|
||||||
|
Southeast
|
130,656
|
69,726
|
66,232
|
|||||||||
|
Southwest
|
165,694
|
70,851
|
48,958
|
|||||||||
|
West
|
336,654
|
179,417
|
224,931
|
|||||||||
|
Total homebuilding pretax income
|
$
|
713,502
|
$
|
325,550
|
$
|
340,121
|
||||||
|
Homebuilding income (loss) from unconsolidated joint ventures:
|
||||||||||||
|
North
|
$
|
588
|
$
|
78
|
$
|
n/a
|
||||||
|
Southeast
|
435
|
219
|
119
|
|||||||||
|
Southwest
|
1,019
|
159
|
28
|
|||||||||
|
West
|
2,015
|
1,510
|
(815
|
)
|
||||||||
|
Total homebuilding income (loss) from unconsolidated joint ventures
|
$
|
4,057
|
$
|
1,966
|
$
|
(668
|
)
|
|||||
________________
|
(1)
|
Homebuilding pretax income includes depreciation and amortization expense of $6.5 million, $16.0 million, $12.1 million and $27.0 million in the North, Southeast, Southwest and West, respectively, for the year ended December 31, 2016; $1.5 million, $10.1 million, $6.6 million and $22.8 million in the North, Southeast, Southwest and West, respectively, for the year ended December 31, 2015; and $0 million, $6.5 million, $4.0 million and $16.7 million in the North, Southeast, Southwest and West, respectively, for the year ended December 31, 2014.
|
Segment financial information relating to the Company's homebuilding assets was as follows:
|
December 31,
|
||||||||
|
2016
|
2015
|
|||||||
|
(Dollars in thousands)
|
||||||||
|
Homebuilding assets:
|
||||||||
|
North
|
$
|
1,181,544
|
$
|
732,689
|
||||
|
Southeast
|
2,253,289
|
1,766,241
|
||||||
|
Southwest
|
1,842,869
|
1,470,654
|
||||||
|
West
|
2,500,163
|
2,357,597
|
||||||
|
Corporate (1)
|
578,780
|
1,678,072
|
||||||
|
Total homebuilding assets
|
$
|
8,356,645
|
$
|
8,005,253
|
||||
|
Homebuilding investments in unconsolidated joint ventures:
|
||||||||
|
North
|
$
|
5,691
|
$
|
5,634
|
||||
|
Southeast
|
334
|
313
|
||||||
|
Southwest
|
6,085
|
5,594
|
||||||
|
West
|
115,017
|
121,222
|
||||||
|
Total homebuilding investments in unconsolidated joint ventures
|
$
|
127,127
|
$
|
132,763
|
||||
________________
|
(1)
|
The assets in our Corporate Segment include cash and cash equivalents and our deferred tax asset, and at December 31, 2015 included $0.9 billion of goodwill recorded in connection with our merger with Ryland. During the 2016 second quarter, recorded goodwill was allocated to the Company's reporting units (as of December 31, 2016, approximately $0.3 billion was included in each of the North, Southeast and Southwest segments, and approximately $0.1 billion was included in the West segment).
|
CALATLANTIC GROUP, INC. AND SUBSIDIARIES
NOTES TO CONSOLIDATED FINANCIAL STATEMENTS
5. Marketable Securities, Available-for-sale
The Company's investment portfolio includes mainly municipal debt securities and metropolitan district bond securities, which are included in homebuilding other assets in the accompanying consolidated balance sheets. As defined in ASC Topic 320, Investments—Debt and Equity Securities ("ASC 320"), the Company considers its investment portfolio to be available-for-sale. Accordingly, these investments are recorded at their fair values. The cost of securities sold is based on an average-cost basis. Unrealized gains and losses on these investments are included in accumulated other comprehensive income (loss), net of tax within the accompanying consolidated balance sheet.
The Company periodically reviews its available-for-sale securities for other-than-temporary declines in fair values that are below their cost bases, as well as whenever events or changes in circumstances indicate that the carrying amount of an asset may not be recoverable. At December 31, 2016, the Company believed that the cost bases for its available-for-sale securities were recoverable in all material respects.
For the year ended December 31, 2016, net realized earnings associated with the Company's investment portfolio, which included interest, dividends and net realized gains on sales of marketable securities, totaled $695,000. These earnings were included in homebuilding other income (expense) within the accompanying consolidated statements of operations. Realized gains or losses on the sales of marketable securities were included as reclassification adjustments, which are a component of other comprehensive income. See Note 2.k. for further discussion.
The primary objectives of the Company's investment portfolio are safety of principal and liquidity. Investments are made with the purpose of achieving the highest rate of return consistent with these two objectives. The Company's investment policy limits investments to debt rated investment grade or better, as well as to bank and money market instruments and to issues by the U.S. government, U.S. government agencies and municipal or other institutions primarily with investment‑grade credit ratings. Our policy places restrictions on maturities, as well as on concentration by type and issuer.
The following table displays the fair values of marketable securities, available-for-sale, by type of security:
|
December 31, 2016
|
December 31, 2015
|
|||||||||||||||||||||||
|
Amortized
Cost
|
Gross Unrealized Losses
|
Estimated Fair Value
|
Amortized
Cost
|
Gross Unrealized Gains
|
Estimated Fair Value
|
|||||||||||||||||||
|
(Dollars in thousands)
|
||||||||||||||||||||||||
|
Type of security:
|
||||||||||||||||||||||||
|
Municipal bond and metropolitan district securities
|
$
|
18,563
|
$
|
(465
|
)
|
$
|
18,098
|
$
|
19,439
|
$
|
5
|
$
|
19,444
|
|||||||||||
The following table displays the fair values of marketable securities, available-for-sale, by contractual maturity:
|
December 31, 2016
|
||||
|
(Dollars in thousands)
|
||||
|
Contractual maturity:
|
||||
|
Maturing in one year or less
|
$
|
―
|
||
|
Maturing after three years
|
18,098
|
|||
|
Total marketable securities, available-for-sale
|
$
|
18,098
|
||
CALATLANTIC GROUP, INC. AND SUBSIDIARIES
NOTES TO CONSOLIDATED FINANCIAL STATEMENTS
6. Inventories
a. Inventories Owned
Inventories owned consisted of the following at:
|
December 31, 2016
|
||||||||||||||||||||
|
North
|
Southeast
|
Southwest
|
West
|
Total
|
||||||||||||||||
|
(Dollars in thousands)
|
||||||||||||||||||||
|
Land and land under development (1)
|
$
|
445,245
|
$
|
1,177,646
|
$
|
594,585
|
$
|
1,410,264
|
$
|
3,627,740
|
||||||||||
|
Homes completed and under construction
|
327,421
|
585,938
|
710,509
|
680,241
|
2,304,109
|
|||||||||||||||
|
Model homes
|
79,306
|
132,968
|
116,575
|
178,094
|
506,943
|
|||||||||||||||
|
Total inventories owned
|
$
|
851,972
|
$
|
1,896,552
|
$
|
1,421,669
|
$
|
2,268,599
|
$
|
6,438,792
|
||||||||||
|
December 31, 2015
|
||||||||||||||||||||
|
North
|
Southeast
|
Southwest
|
West
|
Total
|
||||||||||||||||
|
(Dollars in thousands)
|
||||||||||||||||||||
|
Land and land under development (1)
|
$
|
370,584
|
$
|
1,169,350
|
$
|
687,792
|
$
|
1,318,563
|
$
|
3,546,289
|
||||||||||
|
Homes completed and under construction
|
266,967
|
464,668
|
599,183
|
708,779
|
2,039,597
|
|||||||||||||||
|
Model homes
|
66,100
|
119,283
|
113,549
|
185,141
|
484,073
|
|||||||||||||||
|
Total inventories owned
|
$
|
703,651
|
$
|
1,753,301
|
$
|
1,400,524
|
$
|
2,212,483
|
$
|
6,069,959
|
||||||||||
________________
|
(1)
|
During the year ended December 31, 2016, we purchased $960.8 million of land (13,566 homesites), of which 25% (based on homesites) were located in the North, 25% in the Southeast, 24% in the Southwest, and 26% in the West. During the year ended December 31, 2015, we purchased $515.3 million of land (6,631 homesites) and acquired an additional 40,245 homesites as a result of the merger with Ryland. The homesites we purchased during 2015, other than through the merger, were located as follows: 12% (based on homesites) were located in the North, 39% in the Southeast, 18% in the Southwest, and 31% in the West. Disclosures of homesite count, including the percentage of homesites located within a specific region, included in these notes to consolidated financial statements are presented on an unaudited basis.
|
In accordance with ASC 360, we record impairment losses on inventories when events and circumstances indicate that they may be impaired, and the future undiscounted cash flows estimated to be generated by those assets are less than their carrying amounts. Inventories that are determined to be impaired are written down to their estimated fair value. We calculate the fair value of a community under a land residual value analysis and in certain cases in conjunction with a discounted cash flow analysis. As of December 31, 2016, 2015 and 2014, the total active and future projects that we owned were 797, 903 and 368, respectively. During the years ended December 31, 2016, 2015 and 2014, we reviewed all projects for indicators of impairment and based on our review, we did not record any inventory impairments during these periods.
During the 2014 second quarter, we acquired control of approximately 10 current and future communities from a homebuilder in Austin, Texas, which we accounted for as a business combination in accordance with ASC 805. As a result of this transaction, we recorded approximately $31.5 million of inventories owned, $4.9 million of inventories not owned, $1.2 million of other assets and $4.2 million of other accrued liabilities. In addition, we incurred approximately $0.3 million of transaction costs, which is included in homebuilding other income (expense) in the accompanying consolidated statements of operations.
b. Inventories Not Owned
Inventories not owned as of December 31, 2016 and December 31, 2015 consisted of land purchase and lot option deposits outstanding at the end of each period, and purchase price allocated to lot option contracts assumed in connection with business acquisitions. Under ASC 810, a non-refundable deposit paid to an entity is deemed to be a variable interest that will absorb some or all of the entity's expected losses if they occur. Our land purchase and lot option deposits generally represent our maximum exposure to the land seller if we elect not to purchase the optioned property. In some instances, we may also expend funds for due diligence, development and construction activities with respect to optioned land prior to takedown. Such costs are classified as inventories owned, which we would have to write-off should we not exercise the option. Therefore, whenever we enter into a land option or purchase contract with an entity and make a non-refundable deposit, a variable interest entity ("VIE") may have been created. In accordance with ASC 810, we perform ongoing reassessments of whether we are the primary beneficiary of a VIE.
CALATLANTIC GROUP, INC. AND SUBSIDIARIES
NOTES TO CONSOLIDATED FINANCIAL STATEMENTS
7. Investments in Unconsolidated Land Development and Homebuilding Joint Ventures
The table set forth below summarizes the combined statements of operations for our unconsolidated land development and homebuilding joint ventures that we accounted for under the equity method:
|
Year December 31,
|
||||||||||||
|
2016
|
2015
|
2014
|
||||||||||
|
(Dollars in thousands)
|
||||||||||||
|
(Unaudited)
|
||||||||||||
|
Revenues
|
$
|
32,422
|
$
|
43,806
|
$
|
39,898
|
||||||
|
Cost of sales and expenses
|
(3,173
|
)
|
(33,587
|
)
|
(47,519
|
)
|
||||||
|
Income (loss) of unconsolidated joint ventures
|
$
|
29,249
|
$
|
10,219
|
$
|
(7,621
|
)
|
|||||
|
Income (loss) from unconsolidated joint ventures reflected in the
|
||||||||||||
|
accompanying consolidated statements of operations
|
$
|
4,057
|
$
|
1,966
|
$
|
(668
|
)
|
|||||
Income (loss) from unconsolidated joint ventures reflected in the accompanying consolidated statements of operations represents our share of the income (loss) of our unconsolidated land development and homebuilding joint ventures, which is allocated based on the provisions of the underlying joint venture operating agreements less any additional impairments recorded against our investments in joint ventures which we do not deem recoverable. In addition, we defer recognition of our share of income that relates to lots purchased by us from land development joint ventures until we ultimately sell the homes to be constructed to third parties, at which time we account for these earnings as a reduction of the cost basis of the lots purchased from these joint ventures.
During the years ended December 31, 2016, 2015 and 2014, all of our unconsolidated joint ventures were reviewed for impairment. Based on the impairment review, during the year ended December 31, 2016, we recorded a $1.0 million impairment charge related to one joint venture in the West. No joint venture communities were determined to be impaired for the years ended December 31, 2015 or 2014.
The table set forth below summarizes the combined balance sheets for our unconsolidated land development and homebuilding joint ventures that we accounted for under the equity method:
|
December 31,
|
||||||||
|
2016
|
2015
|
|||||||
|
(Dollars in thousands)
|
||||||||
|
(Unaudited)
|
||||||||
|
Assets:
|
||||||||
|
Cash
|
$
|
23,785
|
$
|
34,893
|
||||
|
Inventories
|
541,191
|
510,502
|
||||||
|
Other assets
|
26,292
|
14,540
|
||||||
|
Total assets
|
$
|
591,268
|
$
|
559,935
|
||||
|
Liabilities and Equity:
|
||||||||
|
Accounts payable and accrued liabilities
|
$
|
28,947
|
$
|
26,571
|
||||
|
Bank debt
|
31,007
|
33,704
|
||||||
|
CalAtlantic equity
|
140,387
|
130,750
|
||||||
|
Other members' equity
|
390,927
|
368,910
|
||||||
|
Total liabilities and equity
|
$
|
591,268
|
$
|
559,935
|
||||
|
Investments in unconsolidated joint ventures reflected in
|
||||||||
|
the accompanying consolidated balance sheets
|
$
|
127,127
|
$
|
132,763
|
||||
In some cases our net investment in these unconsolidated joint ventures is not equal to our proportionate share of equity reflected in the table above primarily because of differences between asset impairments that we recorded in prior periods against our joint venture investments and the impairments recorded by the applicable joint venture. Our investments in unconsolidated joint ventures also included approximately $3.4 million and $2.9 million of homebuilding interest capitalized to investments in unconsolidated joint ventures as of December 31, 2016 and 2015, respectively, which capitalized interest is not included in the combined balance sheets above.
CALATLANTIC GROUP, INC. AND SUBSIDIARIES
NOTES TO CONSOLIDATED FINANCIAL STATEMENTS
Our investments in these unconsolidated joint ventures may represent a variable interest in a VIE depending on, among other things, the economic interests of the members of the entity and the contractual terms of the arrangement. We analyze all of our unconsolidated joint ventures under the provisions of ASC 810 to determine whether these entities are deemed to be VIEs, and if so, whether we are the primary beneficiary. As of December 31, 2016, all of our homebuilding and land development joint ventures with unrelated parties were determined under the provisions of ASC 810 to be unconsolidated joint ventures either because they were not deemed to be VIEs, or, if they were a VIE, we were not deemed to be the primary beneficiary.
8. Homebuilding Indebtedness
a. Letter of Credit Facilities
As of December 31, 2016, in addition to our $350 million letter of credit sublimit under our Revolving Facility, we were party to four committed letter of credit facilities totaling $48 million, of which $26.7 million was outstanding. These facilities require cash collateralization and have maturity dates ranging from January 2017 to October 2017. As of December 31, 2016, these facilities were secured by cash collateral deposits of $27.1 million. Upon maturity, we may renew or enter into new letter of credit facilities with the same or other financial institutions.
As of the date of this filing, we are working with one financial institution to extend the letter of credit facility which matured in January 2017 with a commitment amount of $15 million, of which $7.2 million of letters of credit remain outstanding.
b. Senior Notes Payable
Senior notes payable, consist of the following at:
|
December 31,
|
||||||||
|
2016
|
2015
|
|||||||
|
(Dollars in thousands)
|
||||||||
|
10.75% Senior Notes due September 2016
|
$
|
―
|
$
|
275,845
|
||||
|
8.4% Senior Notes due May 2017
|
235,175
|
248,975
|
||||||
|
8.375% Senior Notes due May 2018
|
574,501
|
574,058
|
||||||
|
1.625% Convertible Senior Notes due May 2018
|
220,236
|
301,754
|
||||||
|
0.25% Convertible Senior Notes due June 2019
|
253,777
|
248,098
|
||||||
|
6.625% Senior Notes due May 2020
|
319,909
|
325,882
|
||||||
|
8.375% Senior Notes due January 2021
|
395,246
|
394,152
|
||||||
|
6.25% Senior Notes due December 2021
|
297,623
|
297,148
|
||||||
|
5.375% Senior Notes due October 2022
|
249,230
|
249,096
|
||||||
|
5.875% Senior Notes due November 2024
|
296,982
|
296,598
|
||||||
|
5.25% Senior Notes due June 2026
|
297,483
|
―
|
||||||
|
1.25% Convertible Senior Notes due August 2032
|
252,046
|
250,410
|
||||||
|
$
|
3,392,208
|
$
|
3,462,016
|
|||||
The carrying amount of the senior notes listed above are net of any discounts, premiums and debt issuance costs that are amortized to interest costs over the respective terms of the notes.
The Company's 1.625% Convertible Senior Notes due 2018 (the "1.625% Convertible Notes") are senior unsecured obligations of the Company and are guaranteed by the guarantors of our other senior notes on a senior unsecured basis. The 1.625% Convertible Notes bear interest at a rate of 1.625% per year and will mature on May 15, 2018, unless earlier converted or repurchased. The holders may convert their 1.625% Convertible Notes at any time into shares of the Company's common stock at a conversion rate of 31.8576 shares of common stock per $1,000 of their principal amount (which is equal to a conversion price of approximately $31.39 per share), subject to adjustment. The Company may not redeem the 1.625% Convertible Notes prior to the stated maturity date.
The Company's 0.25% Convertible Senior Notes due 2019 (the "0.25% Convertible Notes") are senior unsecured obligations of the Company and are guaranteed by the guarantors of our other senior notes on a senior unsecured basis. The 0.25% Convertible Notes bear interest at a rate of 0.25% per year and will mature on June 1, 2019, unless earlier converted,
CALATLANTIC GROUP, INC. AND SUBSIDIARIES
NOTES TO CONSOLIDATED FINANCIAL STATEMENTS
redeemed or repurchased. The holders may convert their 0.25% Convertible Notes at any time into shares of the Company's common stock at a conversion rate of 13.6043 shares of common stock per $1,000 of their principal amount (which is equal to a conversion price of approximately $73.51 per share), subject to adjustment. The Company may not redeem the 0.25% Convertible Notes prior to June 6, 2017. On or after that date, the Company may redeem for cash any or all of the 0.25% Convertible Notes, at its option, if the closing sale price of its common stock for at least 20 trading days (whether or not consecutive) during any 30 consecutive trading day period ending within 5 trading days immediately preceding the date on which it provides notice of redemption, including the last trading day of such 30 day trading period, exceeds 130 percent of the applicable conversion price on each applicable trading day. The redemption price will equal 100 percent of the principal amount of the 0.25% Convertible Notes to be redeemed, plus accrued and unpaid interest to, but excluding, the redemption date.
The Company's 1.25% Convertible Senior Notes due 2032 (the "1.25% Convertible Notes") are senior unsecured obligations of the Company and are guaranteed by the guarantors of our other senior notes on a senior unsecured basis. The 1.25% Convertible Notes bear interest at a rate of 1.25% per year and will mature on August 1, 2032, unless earlier converted, redeemed or repurchased. The holders may convert their 1.25% Convertible Notes at any time into shares of the Company's common stock at a conversion rate of 24.8941 shares of common stock per $1,000 of their principal amount (which is equal to a conversion price of approximately $40.17 per share), subject to adjustment. The Company may not redeem the 1.25% Convertible Notes prior to August 5, 2017. On or after August 5, 2017 and prior to the maturity date, the Company may redeem for cash all or part of the 1.25% Convertible Notes at a redemption price equal to 100% of the principal amount of the 1.25% Convertible Notes being redeemed. On each of August 1, 2017, August 1, 2022 and August 1, 2027, holders of the 1.25% Convertible Notes may require the Company to purchase all or any portion of their 1.25% Convertible Notes for cash at a price equal to 100% of the principal amount of the 1.25% Convertible Notes to be repurchased.
Our senior notes payable are all senior obligations and rank equally with our other existing senior indebtedness and, with the exception of our Convertible Notes, are redeemable at our option, in whole or in part, pursuant to a "make whole" formula. These notes contain various restrictive covenants, including, but not limited to, a limitation on secured indebtedness and a restriction on sale leaseback transactions. As of December 31, 2016, we were in compliance with the covenants required by our senior notes.
Many of our 100% owned direct and indirect subsidiaries (collectively, the "Guarantor Subsidiaries") guarantee our outstanding senior notes. The guarantees are full and unconditional, and joint and several. Under our most restrictive indenture, a Guarantor Subsidiary will be released and relieved of any obligations under the applicable note guarantee in the event that i) such Guarantor Subsidiary ceases to be a restricted subsidiary in the homebuilding segment or ii) in the event of a sale or other disposition of such Guarantor Subsidiary, in compliance with the indenture, and such Guarantor Subsidiary ceases to guaranty any other debt of the Company. Please see Note 18 for supplemental financial statement information about our guarantor subsidiaries group and non-guarantor subsidiaries group.
During the 2016 second quarter, the Company issued $300 million in aggregate principal amount of 5.25% Senior Notes due 2026, which are senior unsecured obligations of the Company and are guaranteed by the guarantors of our other senior notes on a senior unsecured basis. A portion of the net proceeds of this issuance was used to repay the remaining $280 million principal balance of our 10.75% Senior Notes upon maturity in September 2016.
c. Secured Project Debt and Other Notes Payable
Our secured project debt and other notes payable consist of seller non-recourse financing and community development district and similar assessment district bond financings used to finance land acquisition, development and infrastructure costs for which we are responsible. At December 31, 2016, we had approximately $27.6 million outstanding in secured project debt and other notes payable.
CALATLANTIC GROUP, INC. AND SUBSIDIARIES
NOTES TO CONSOLIDATED FINANCIAL STATEMENTS
d. Borrowings and Maturities
The principal amount of maturities of senior and convertible senior notes payable, and secured project debt and other notes payable are as follows:
|
Year Ended
December 31, |
||||
|
(Dollars in thousands)
|
||||
|
2017
|
$
|
246,958
|
||
|
2018
|
809,274
|
|||
|
2019
|
268,399
|
|||
|
2020
|
300,448
|
|||
|
2021
|
700,000
|
|||
|
Thereafter
|
1,103,000
|
|||
|
Total principal amount
|
3,428,079
|
|||
|
Less: Net (discount) premium
|
5,525
|
|||
|
Less: Debt issuance costs
|
(13,817
|
)
|
||
|
Total homebuilding debt
|
$
|
3,419,787
|
||
The weighted average interest rate of our borrowings outstanding under our revolving credit facility, senior and convertible senior notes payable, secured project debt and other notes payable as of December 31, 2016, 2015 and 2014, was 5.7%, 6.1%, and 7.2%, respectively.
e. Revolving Credit Facility
As of December 31, 2016, we were party to a $750 million unsecured revolving credit facility (the "Revolving Facility"), $350 million of which is available for letters of credit, which matures in October 2019. The Revolving Facility has an accordion feature under which the Company may increase the total commitment up to a maximum aggregate amount of $1.2 billion, subject to certain conditions, including the availability of additional bank commitments. Interest rates, as defined in the credit agreement, approximate (i) LIBOR (approximately 0.77% at December 31, 2016) plus 1.75%, or (ii) Prime (3.75% at December 31, 2016) plus 0.75%.
In addition to customary representations and warranties, the facility contains financial and other covenants, including a minimum tangible net worth requirement of $1.65 billion (which amount is subject to increase over time based on subsequent earnings and proceeds from equity offerings), a net homebuilding leverage covenant that prohibits the leverage ratio (as defined therein) from exceeding 2.00 to 1.00 and a land covenant that limits land not under development to an amount not to exceed tangible net worth. The Company is also required to maintain either (a) a minimum liquidity level (unrestricted cash in excess of interest incurred for the previous four quarters) or (b) a minimum interest coverage ratio (EBITDA to interest expense, as defined therein) of at least 1.25 to 1.00. We were in compliance with all of the Revolving Facility covenants as of December 31, 2016. The Revolving Facility also limits, among other things, the Company's investments in joint ventures and the amount of the Company's common stock that the Company can repurchase. On December, 2016, we had no borrowings outstanding under the facility and had outstanding letters of credit issued under the facility totaling $112.1 million, leaving $637.9 million available under the facility to be drawn.
9. Preferred Stock
Prior to our merger with Ryland, MatlinPatterson held all of the outstanding shares of Company Series B Preferred Stock and 126.4 million shares of Company common stock, which, together, represented approximately 59% of the total number of shares of Company common stock issued and outstanding on an if-converted basis. Immediately following the merger, MatlinPatterson converted all of their shares of preferred stock into 17.6 million shares of Company common stock. As of December 31, 2016, MatlinPatterson held 42.8 million shares (approximately 37%) of the Company's outstanding common stock and no shares of preferred stock.
CALATLANTIC GROUP, INC. AND SUBSIDIARIES
NOTES TO CONSOLIDATED FINANCIAL STATEMENTS
10. Mortgage Credit Facility
At December 31, 2016, we had $247.4 million outstanding under our mortgage financing subsidiary's mortgage credit facility. This mortgage credit facility consisted of a $300 million uncommitted repurchase facility with one lender, maturing in April 2017. This facility requires our mortgage financing subsidiary to maintain cash collateral accounts, which totaled $3.0 million as of December 31, 2016, and also contains financial covenants which require CalAtlantic Mortgage to, among other things, maintain a minimum level of tangible net worth, not to exceed a debt to tangible net worth ratio, maintain a minimum liquidity amount based on a measure of total assets (inclusive of the cash collateral requirement), and satisfy pretax income (loss) requirements. As of December 31, 2016, CalAtlantic Mortgage was in compliance with the financial and other covenants contained in this facility.
11. Disclosures about Fair Value
ASC Topic 820, Fair Value Measurements and Disclosures ("ASC 820"), establishes a framework for measuring fair value, expands disclosures regarding fair value measurements and defines fair value as the price that would be received to sell an asset or paid to transfer a liability in an orderly transaction between market participants at the measurement date. Further, ASC 820 requires us to maximize the use of observable market inputs, minimize the use of unobservable market inputs and disclose in the form of an outlined hierarchy the details of such fair value measurements. ASC 820 specifies a hierarchy of valuation techniques based on whether the inputs to a fair value measurement are considered to be observable or unobservable in a marketplace. The three levels of the hierarchy are as follows:
• Level 1 – quoted prices for identical assets or liabilities in active markets;
• Level 2 – quoted prices for similar assets or liabilities in active markets; quoted prices for identical or similar assets or liabilities in markets that are not active; and model-derived valuations in which significant inputs and significant value drivers are observable in active markets; and
• Level 3 – valuations derived from valuation techniques in which one or more significant inputs or significant value drivers are unobservable.
Financial instruments measured at fair value on a recurring basis:
|
Fair Value at December 31,
|
||||||||||
|
Description
|
Fair Value Hierarchy
|
2016
|
2015
|
|||||||
| (Dollars in thousands) | ||||||||||
|
Marketable securities, available-for-sale
|
||||||||||
|
Municipal debt securities
|
Level 2
|
$
|
9,387
|
$
|
9,734
|
|||||
|
Metropolitan district bond securities
|
Level 3
|
$
|
8,711
|
$
|
9,710
|
|||||
|
Mortgage loans held for sale
|
Level 2
|
$
|
265,542
|
$
|
328,835
|
|||||
Marketable Securities, Available-for-sale
Marketable securities that are available-for-sale are comprised mainly of municipal debt securities and metropolitan district bond securities. The Company's municipal debt securities are valued based on quoted market prices of similar instruments and the metropolitan district bond securities are based on a discounted future cash flow model, which uses Level 3 inputs. The primary unobservable inputs used in our discounted cash flow model are (1) the forecasted number of homes to be closed, as homes drive increases to the taxpaying base for the metro district, (2) the forecasted assessed value of those closed homes and (3) the discount rate. As of December 31, 2016 and 2015, the unobservable inputs to the cash flow model used to determine the fair value of the metropolitan district bond securities included an average selling price of homes of approximately $400 thousand and discount rates ranging from 5% to 12%. An increase in the average selling price or decrease in the discount rate would result in an increase the fair value of these securities, while a decrease in the average selling price or increase in the discount rate would result in a decrease in the fair value.
CALATLANTIC GROUP, INC. AND SUBSIDIARIES
NOTES TO CONSOLIDATED FINANCIAL STATEMENTS
Mortgage loans held for sale
Mortgage loans held for sale consist of FHA, VA, USDA and agency first mortgages on single-family residences which are eligible for sale to FNMA/FHLMC, GNMA or other investors, as applicable. Fair values of these loans are based on quoted prices from third party investors when preselling loans.
Financial instruments for which we have not elected the fair value option in accordance with ASC 825:
|
December 31, 2016
|
December 31, 2015
|
||||||||||||||
|
Description
|
Fair Value Hierarchy
|
|
Carrying
Amount |
|
Fair Value
|
|
Carrying
Amount |
|
Fair Value
|
||||||
| (Dollars in thousands) | |||||||||||||||
|
Financial services assets:
|
|||||||||||||||
|
Mortgage loans held for investment, net
|
Level 2
|
$
|
24,924
|
$
|
24,924
|
$
|
22,704
|
$
|
22,704
|
||||||
|
Homebuilding liabilities:
|
|||||||||||||||
|
Senior and convertible senior notes payable, net
|
Level 2
|
$
|
3,392,208
|
$
|
3,617,838
|
$
|
3,462,016
|
$
|
3,675,276
|
||||||
Mortgage Loans Held for Investment – Fair value of these loans is based on the estimated market value of the underlying collateral based on market data and other factors for similar type properties as further adjusted to reflect the estimated net realizable value of carrying the loans through disposition.
Senior Notes Payable – The senior notes are traded over the counter and their fair values were estimated based upon the values of their last trade at the end of the period.
The fair value of our cash and equivalents, restricted cash, accounts payable and other liabilities, secured project debt and other notes payable, revolving credit facility, and mortgage credit facility approximate their carrying amounts due to the short-term nature of these assets and liabilities.
12. Commitments and Contingencies
a. Land Purchase and Option Agreements
We are subject to obligations associated with entering into contracts for the purchase of land and improved homesites. These purchase contracts typically require us to provide a cash deposit or deliver a letter of credit in favor of the seller, and our purchase of properties under these contracts is generally contingent upon satisfaction of certain requirements by the sellers, including obtaining applicable property and development entitlements. We also utilize option contracts with land sellers as a method of acquiring land in staged takedowns, to help us manage the financial and market risk associated with land holdings, and to reduce the near-term use of funds from our corporate financing sources. Option contracts generally require a non-refundable deposit for the right to acquire lots over a specified period of time at predetermined prices. We generally have the right at our discretion to terminate our obligations under both purchase contracts and option contracts by forfeiting our cash deposit or by repaying amounts drawn under our letter of credit with no further financial responsibility to the land seller, although in certain instances, the land seller has the right to compel us to purchase a specified number of lots at predetermined prices.
In some instances, we may also expend funds for due diligence, development and construction activities with respect to our land purchase and option contracts prior to purchase, which we would have to write off should we not purchase the land. At December 31, 2016, we had non-refundable cash deposits outstanding of approximately $59.9 million and capitalized pre-acquisition and other development and construction costs of approximately $13.1 million relating to land purchase and option contracts having a total remaining purchase price of approximately $744.7 million.
Our utilization of option contracts is dependent on, among other things, the availability of land sellers willing to enter into option takedown arrangements, the availability of capital to financial intermediaries, general housing market conditions, and geographic preferences. Options may be more difficult to procure from land sellers in strong housing markets and are more prevalent in certain geographic regions.
CALATLANTIC GROUP, INC. AND SUBSIDIARIES
NOTES TO CONSOLIDATED FINANCIAL STATEMENTS
b. Land Development and Homebuilding Joint Ventures
Our joint ventures have historically obtained secured acquisition, development and construction financing designed to reduce the use of funds from corporate financing sources. As of December 31, 2016, we held ownership interests in 27 homebuilding and land development joint ventures, of which 13 were active and 14 were inactive or winding down. As of such date, only two joint ventures had project specific debt outstanding, which totaled $31.0 million. This joint venture bank debt is non-recourse to us and is scheduled to mature in June 2017. At December 31, 2016, we had no joint venture surety bonds outstanding.
c. Surety Bonds
We obtain surety bonds in the normal course of business to ensure completion of the infrastructure of our communities. At December 31, 2016, we had approximately $892.1 million in surety bonds outstanding, with respect to which we had an estimated $445.1 million remaining in cost to complete.
d. Mortgage Loans and Commitments
We commit to making mortgage loans to our homebuyers through our mortgage financing subsidiary, CalAtlantic Mortgage. CalAtlantic Mortgage sells substantially all of the loans it originates in the secondary mortgage market and finances these loans under its mortgage credit facilities for a short period of time (typically for 30 to 45 days), as investors complete their administrative review of applicable loan documents. Mortgage loans in process for which interest rates were committed to borrowers totaled approximately $275.9 million at December 31, 2016 and carried a weighted average interest rate of approximately 3.7%. Interest rate risks related to these obligations are mitigated by CalAtlantic Mortgage through the preselling of loans to investors or through its interest rate hedging program. As of December 31, 2016, CalAtlantic Mortgage had approximately $261.8 million in closed mortgage loans held for sale and $26.9 million of mortgage loans that we were committed to sell to investors subject to our funding of the loans and the investors' completion of their administrative review of the applicable loan documents. In addition, as of December 31, 2016, CalAtlantic Mortgage had approximately $249.0 million of mortgage loans in process that were or are expected to be originated on a non-presold basis, substantially all of which were hedged by forward sale commitments of mortgage-backed securities prior to entering into loan sale transactions with third party investors.
Substantially all of the loans originated by CalAtlantic Mortgage are sold with servicing rights released on a non-recourse basis. These sales are generally subject to CalAtlantic Mortgage's obligation to repay its gain on sale if the loan is prepaid by the borrower within a certain time period following such sale, or to repurchase the loan if, among other things, the purchaser's underwriting guidelines are not met, or there is fraud in connection with the loan. During the years ended December 31, 2016, 2015 and 2014, CalAtlantic Mortgage recorded loan loss expense related to indemnification and repurchase allowances of $0.1 million, $0.3 million and $0.5 million, respectively. As of December 31, 2016 and 2015, CalAtlantic Mortgage had indemnity and repurchase allowances related to loans sold of approximately $3.6 million and $3.9 million, respectively. In addition, during the years ended December 31, 2016, 2015 and 2014, CalAtlantic Mortgage made make-whole payments totaling approximately $0.4 million, $0.1 million and $0.5 million, respectively.
e. Insurance and Litigation Accruals
We are involved in various litigation and legal claims arising in the ordinary course of business and have established insurance and litigation accruals for estimated future claim costs (please see Note 2.t. for further discussion).
CALATLANTIC GROUP, INC. AND SUBSIDIARIES
NOTES TO CONSOLIDATED FINANCIAL STATEMENTS
f. Operating Leases
We lease office facilities and certain equipment under noncancelable operating leases. Future minimum rental payments under these leases having an initial term in excess of one year as of December 31, 2016 are as follows:
|
Year Ended
December 31, |
||||
|
(Dollars in thousands)
|
||||
|
2017
|
$
|
10,104
|
||
|
2018
|
8,886
|
|||
|
2019
|
7,575
|
|||
|
2020
|
5,643
|
|||
|
2021
|
3,910
|
|||
|
Thereafter
|
4,834
|
|||
|
Total rental obligations
|
$
|
40,952
|
||
Rent expense under noncancelable operating leases, net of sublease income, for each of the years ended December 31, 2016, 2015 and 2014 was approximately $10.8 million, $6.5 million and $4.4 million, respectively.
13. Income Taxes
The (provision) benefit for income taxes includes the following components:
|
Year Ended December 31,
|
||||||||||||
|
2016
|
2015
|
2014
|
||||||||||
|
(Dollars in thousands)
|
||||||||||||
|
Current (provision) benefit for income taxes:
|
||||||||||||
|
Federal
|
$
|
(223,605
|
)
|
$
|
(83,541
|
)
|
$
|
(28,942
|
)
|
|||
|
State
|
(16,470
|
)
|
(6,803
|
)
|
(6,159
|
)
|
||||||
|
(240,075
|
)
|
(90,344
|
)
|
(35,101
|
)
|
|||||||
|
Deferred (provision) benefit for income taxes:
|
||||||||||||
|
Federal
|
(6,128
|
)
|
(24,395
|
)
|
(84,704
|
)
|
||||||
|
State
|
(22,183
|
)
|
(14,241
|
)
|
(14,294
|
)
|
||||||
|
(28,311
|
)
|
(38,636
|
)
|
(98,998
|
)
|
|||||||
|
(Provision) benefit for income taxes
|
$
|
(268,386
|
)
|
$
|
(128,980
|
)
|
$
|
(134,099
|
)
|
|||
The components of our net deferred income tax asset are as follows:
|
December 31,
|
||||||||
|
2016
|
2015
|
|||||||
|
(Dollars in thousands)
|
||||||||
|
Inventory valuation adjustments
|
$
|
73,353
|
$
|
98,141
|
||||
|
Financial accruals
|
106,862
|
129,120
|
||||||
|
Federal net operating loss carryforwards
|
92,043
|
97,507
|
||||||
|
State net operating loss carryforwards
|
45,607
|
60,739
|
||||||
|
Tax credit carryforwards
|
2,347
|
1,246
|
||||||
|
Goodwill impairment charges
|
3,396
|
4,287
|
||||||
|
Other, net
|
9,226
|
6,310
|
||||||
|
Total deferred tax asset
|
332,834
|
397,350
|
||||||
|
Less: Valuation allowance
|
(2,456
|
)
|
(1,156
|
)
|
||||
|
Net deferred tax asset
|
$
|
330,378
|
$
|
396,194
|
||||
CALATLANTIC GROUP, INC. AND SUBSIDIARIES
NOTES TO CONSOLIDATED FINANCIAL STATEMENTS
Each quarter we assess our deferred tax asset to determine whether all or any portion of the asset is more likely than not unrealizable under ASC 740. We are required to establish a valuation allowance for any portion of the asset we conclude is more likely than not to be unrealizable. Our assessment considers, among other things, the nature, frequency and severity of our prior and cumulative losses, forecasts of our future taxable income, the duration of statutory carryforward periods, our utilization experience with operating loss and tax credit carryforwards, and tax planning alternatives.
As of December 31, 2016, we had a $332.8 million deferred tax asset which was partially offset by a deferred tax asset valuation allowance of $2.5 million related to state net operating loss carryforwards that are not more likely than not to be realized. In addition, as of such date, $103.9 million (or approximately $263.0 million and $285.7 million, respectively, of federal and state net operating loss carryforwards on a gross basis) of our deferred tax asset related to net operating loss carryforwards is subject to the Internal Revenue Code Section 382 ("Section 382") gross annual deduction limitation of $15.6 million for both federal and state purposes. Additionally, $21.7 million, (or approximately $798.1 million of our state deferred tax assets on a gross basis) of our state deferred tax assets related to net operating losses is subject to Section 382 limitations resulting from our October 1, 2015 merger with Ryland. The remaining $12.0 million (or approximately $168.5 million of state net operating loss carryforwards on a gross basis) represents state net operating loss carryforwards that are not limited by Section 382. Our gross federal and state net operating loss carryforwards of approximately $263.0 million and $1.3 billion, respectively, if unused, will begin to expire in 2028 and 2020, respectively. The remaining deferred tax asset balance of $195.1 million represented deductible timing differences, primarily related to inventory impairments and financial accruals, which have no expiration date.
As of December 31, 2015, we had a $397.4 million deferred tax asset which was partially offset by a deferred tax asset valuation allowance of $1.2 million related to state net operating loss carryforwards that are limited by shorter carryforward periods. In addition, as of such date, $112.6 million (or approximately $278.6 million and $263.1 million, respectively, of federal and state net operating loss carryforwards on a gross basis) of our deferred tax asset related to net operating loss carryforwards is subject to the Internal Revenue Code Section 382 ("Section 382") gross annual deduction limitation of $15.6 million for both federal and state purposes. The remaining $45.6 million represents state net operating loss carryforwards that are not limited by Section 382. Our gross federal and state net operating loss carryforwards of approximately $278.6 million and $1.2 billion, respectively, if unused, will begin to expire in 2028 and 2016, respectively. The remaining deferred tax asset represented deductible timing differences, primarily related to inventory impairments and financial accruals, which have no expiration date.
Our 2016 provision for income taxes was $268.4 million related primarily to our $753.1 million of pretax income. The effective tax rate differs from the federal statutory rate of 35% due to the following items:
|
Year Ended December 31,
|
||||||||||||
|
2016
|
2015
|
2014
|
||||||||||
|
(Dollars in thousands)
|
||||||||||||
|
Income before taxes
|
$
|
753,116
|
$
|
342,489
|
$
|
349,964
|
||||||
|
(Provision) benefit for income taxes at federal statutory rate
|
$
|
(263,591
|
)
|
$
|
(119,871
|
)
|
$
|
(122,488
|
)
|
|||
|
(Increases) decreases in tax resulting from:
|
||||||||||||
|
State income taxes, net of federal benefit
|
(24,649
|
)
|
(11,680
|
)
|
(12,961
|
)
|
||||||
|
Net deferred tax asset valuation (allowance) benefit
|
(371
|
)
|
1,405
|
2,030
|
||||||||
|
(Increases) decreases in liability for unrecognized tax benefits
|
(466
|
)
|
(1,611
|
)
|
(1,605
|
)
|
||||||
|
Nondeductible expenses and credits
|
364
|
(2,164
|
)
|
―
|
||||||||
|
Domestic production activities deduction
|
18,324
|
6,150
|
1,562
|
|||||||||
|
Other, net
|
2,003
|
(1,209
|
)
|
(637
|
)
|
|||||||
|
(Provision) benefit for income taxes
|
$
|
(268,386
|
)
|
$
|
(128,980
|
)
|
$
|
(134,099
|
)
|
|||
|
Effective tax rate
|
35.6
|
%
|
37.7
|
%
|
38.3
|
%
|
||||||
CALATLANTIC GROUP, INC. AND SUBSIDIARIES
NOTES TO CONSOLIDATED FINANCIAL STATEMENTS
As of December 31, 2016, our liability for unrecognized tax benefits was $12.1 million, of which $7.9 million, if recognized, would affect our effective tax rate. Our liabilities for unrecognized tax benefits are included in accrued liabilities on the accompanying consolidated balance sheets. We classify estimated interest expense and penalties related to unrecognized tax benefits in our provision for income taxes. As of December 31, 2016 and 2015, accrued interest and penalties related to unrecognized benefits was $1.4 million and $1.3 million, respectively. During 2016, 2015, and 2014 we accrued interest and penalties of $0.1 million, $1.0 million and $0.3 million, respectively. A reconciliation of the beginning and ending amount of gross unrecognized tax benefits, excluding accrued interest, is as follows:
|
Year Ended December 31,
|
||||||||||
|
2016
|
2015
|
2014 | ||||||||
|
(Dollars in thousands)
|
||||||||||
|
Balance, beginning of the year
|
$
|
10,631
|
$
|
2,536
|
$ | 472 | ||||
|
Assumed with Ryland merger
|
―
|
6,182
|
― | |||||||
|
Changes based on tax positions related to the current year
|
2,256
|
2,060
|
1,567 | |||||||
|
Changes for tax position in prior years
|
―
|
―
|
497 | |||||||
|
Reductions due to lapse of statute of limitations
|
(761
|
)
|
(147
|
)
|
― | |||||
|
Settlements
|
―
|
―
|
― | |||||||
|
Balance, end of the year
|
$
|
12,126
|
$
|
10,631
|
$ | 2,536 | ||||
We do not expect a significant change in the liability for unrecognized tax benefits during the next twelve months. In addition, as of December 31, 2016, we remained subject to examination by various tax jurisdictions for the tax years ended December 31, 2011 through 2016.
14. Stock Incentive and Employee Benefit Plans
a. Stock Incentive Plans
The Company has share-based awards outstanding under three different plans, pursuant to which we have granted stock options, stock appreciation rights, restricted and unrestricted stock, and performance share awards to key officers, employees, and directors. The exercise price of our share-based awards may not be less than the market value of our common stock on the date of grant. Stock options and stock appreciation rights vest based on either time (generally over a one to four year period) or market performance (based on stock price appreciation) and generally expire between five and ten years after the date of grant. The fair value for stock options and stock appreciation rights is established at the date of grant using the Black-Scholes model for awards that vest based on time and a lattice model for awards that vest based on market performance. Restricted stock typically vests over a three year period and are valued at the closing price on the date of grant.
During the years ended December 31, 2015 and 2014, we granted 2.2 million and 1.3 million capped stock appreciation rights, respectively, to our officers and key employees. There were no grants of capped stock appreciation rights during 2016. The 2015 and 2014 capped stock appreciation rights have a grant price equal to the Company's common stock closing price on the issuance date, with the value per share of the award capped at $20.00 above the grant price.
CALATLANTIC GROUP, INC. AND SUBSIDIARIES
NOTES TO CONSOLIDATED FINANCIAL STATEMENTS
The following is a summary of stock option and stock appreciation rights activity relating to our three plans on a combined basis for the years ended December 31, 2016, 2015 and 2014:
|
2016
|
2015
|
2014
|
||||||||||||||||
|
Number of Shares
|
Weighted
Average Exercise Price |
Number of Shares
|
Weighted
Average Exercise Price |
Number of Shares
|
Weighted
Average Exercise Price |
|||||||||||||
|
Outstanding, beginning of year
|
4,900,617
|
$
|
33.83
|
4,418,308
|
$
|
29.19
|
3,956,373
|
$
|
27.70
|
|||||||||
|
Granted
|
―
|
―
|
2,167,150
|
34.32
|
1,303,054
|
39.50
|
||||||||||||
|
Exercised
|
(408,839)
|
18.61
|
(1,287,216)
|
14.17
|
(524,185)
|
18.20
|
||||||||||||
|
Canceled
|
(484,611)
|
41.34
|
(397,625)
|
48.61
|
(316,934)
|
71.20
|
||||||||||||
|
Outstanding, end of year
|
4,007,167
|
$
|
34.47
|
4,900,617
|
$
|
33.83
|
4,418,308
|
$
|
29.19
|
|||||||||
|
Exercisable at end of year
|
2,789,384
|
$
|
33.32
|
2,554,114
|
$
|
28.90
|
1,952,477
|
$
|
19.90
|
|||||||||
|
Available for future grant
|
8,650,219
|
9,061,407
|
10,246,013
|
|||||||||||||||
At December 31, 2016, 3,853,751 stock options and stock appreciation rights were vested or expected to vest in the future with a weighted average exercise price of $34.19 and a weighted average expected life of 1.93 years. During the years ended December 31, 2016, 2015 and 2014, the total fair value of stock options and stock appreciation rights vested was $3.2 million, $5.0 million and $2.5 million, respectively. The total intrinsic value of stock options and stock appreciation rights exercised during the years ended December 31, 2016, 2015 and 2014 was $5.7 million, $37.5 million and $12.6 million, respectively. The intrinsic value of options exercised is the difference between the fair market value of the Company's common stock on the date of exercise and the exercise price.
The following table summarizes information about stock options and stock appreciation rights outstanding and exercisable at December 31, 2016:
|
Outstanding
|
Exercisable
|
|||||||||||
|
Exercise Prices
|
Number
of Shares |
Weighted
Average Exercise Price |
Weighted
Average Remaining Contractual Life |
Number
of Shares |
Weighted
Average Exercise Price |
|||||||
|
Low
|
High
|
|||||||||||
|
$17.88
|
$21.45
|
1,284,466
|
$19.99
|
0.97
|
1,010,466
|
$19.99
|
||||||
|
$28.35
|
$41.16
|
1,032,006
|
$38.86
|
3.16
|
539,446
|
$38.86
|
||||||
|
$41.95
|
$46.45
|
1,690,695
|
$42.79
|
2.04
|
1,239,472
|
$42.79
|
||||||
As of December 31, 2016, the total intrinsic value of stock options and stock appreciation rights outstanding was $18.1 million, of which $14.6 million related to stock options and stock appreciation rights exercisable, and the total intrinsic value of stock options and stock appreciation rights vested and expected to vest in the future was $18.1 million. The intrinsic value of these stock options and stock appreciation rights outstanding, is the difference between the fair market value of the Company's common stock on the last trading day of fiscal 2016 and the exercise price.
The fair value of each stock appreciation right granted during December 31, 2015 and 2014 was estimated using the following weighted average assumptions:
|
2015
|
2014
|
||||
|
Dividend yield
|
0.00%
|
0.00%
|
|||
|
Expected volatility
|
40.89%
|
48.44%
|
|||
|
Risk-free interest rate
|
0.93%
|
0.95%
|
|||
|
Expected life
|
3.5 years
|
3.5 years
|
|||
Based on the above assumptions, the weighted average per share fair value of stock appreciation rights granted during the years ended December 31, 2015 and 2014, was $5.30 and $4.95, respectively.
CALATLANTIC GROUP, INC. AND SUBSIDIARIES
NOTES TO CONSOLIDATED FINANCIAL STATEMENTS
Restricted Stock Awards. During the years ended December 31, 2016, 2015 and 2014, we issued shares of restricted common stock to our officers and key employees which vest in three equal installments on each of the first three anniversaries of the issuance date. Compensation expense for these awards is being recognized using the straight-line method over the vesting period.
The following is a summary of unvested restricted stock activity for the years ended December 31, 2016, 2015 and 2014:
|
2016
|
2015
|
2014
|
|||||||||||
|
Number of
Shares |
Weighted Average
Grant Date Fair Value |
Number of
Shares |
Weighted Average
Grant Date Fair Value |
Number of
Shares |
Weighted Average
Grant Date Fair Value |
||||||||
|
Outstanding, beginning of year
|
195,027
|
$41.08
|
154,143
|
$37.55
|
107,706
|
$33.60
|
|||||||
|
Granted
|
329,198
|
33.16
|
133,616
|
41.89
|
94,590
|
39.20
|
|||||||
|
Vested
|
(84,044)
|
40.96
|
(82,293)
|
35.75
|
(42,310)
|
31.60
|
|||||||
|
Canceled
|
(9,363)
|
37.03
|
(10,439)
|
41.26
|
(5,843)
|
33.65
|
|||||||
|
Outstanding, end of year
|
430,818
|
$35.14
|
195,027
|
$41.08
|
154,143
|
$37.55
|
|||||||
Performance Share Awards. During the years ended December 31, 2016, 2015 and 2014, we granted performance share awards to our officers and key employees for which the number of performance share awards ultimately issued will be based on the Company's actual earnings per share or revenue growth. The 2016 awards ("2016 PSAs") include payouts at 1-2 times the target number of shares based on actual revenue growth for the years 2016-2018, subject to a minimum revenue growth threshold. The 2015 awards ("2015 PSAs") include payouts at 1-3 times the target number of shares based on actual revenue growth for the years 2016-2017, subject to a minimum revenue growth threshold. The 2014 awards ("2014 PSAs") include payouts at 1-4 times the target number of shares based on actual earnings per share for the year ended December 31, 2016, subject to a minimum earnings per share threshold. We evaluate the probability of achieving the performance targets established under each of the performance share awards quarterly and estimate the number of shares underlying the performance share awards that are probable of being issued. Compensation expense for these awards is being recognized using the straight-line method over the requisite service period, subject to cumulative catch-up adjustments required as a result of changes in the number shares probable of being issued. Additionally, during the years ended December 31, 2016, 2015 and 2014, we granted performance share awards to our officers and key employees for which the number of performance share awards ultimately issued will be based on the Company's relative total shareholder return ("TSR") performance over a three-year period from 2016-2018 ("2016 TSR PSAs"), 2015-2017 ("2015 TSR PSAs") and 2014-2016 ("2014 TSR PSAs"), in comparison to the TSR performance of a comparative peer group selected by our Compensation Committee. The 2016 TSR PSAs include payouts at 1-2 times the target number of shares based on actual TSR performance, the 2015 TSR PSAs include payouts at 1-3 times the target number of shares based on actual TSR performance, and the 2014 TSR PSAs include payouts at 1-4 times the target number of shares based on actual TSR performance, all subject to minimum TSR thresholds. Compensation expense for these awards is being recognized using the straight-line method over the requisite service period.
The following is a summary of performance share award activity for the years ended December 31, 2016, 2015 and 2014:
|
2016
|
2015
|
2014
|
|||||||||||
|
Number of
Shares |
Weighted Average
Grant Date Fair Value |
Number of
Shares |
Weighted Average
Grant Date Fair Value |
Number of
Shares |
Weighted Average
Grant Date Fair Value |
||||||||
|
Outstanding, beginning of year
|
198,759
|
$47.63
|
166,031
|
$36.20
|
120,448
|
$29.05
|
|||||||
|
Granted
|
319,798
|
30.36
|
348,756
|
30.46
|
45,583
|
55.05
|
|||||||
|
Vested
|
(50,429)
|
41.95
|
(316,028)
|
22.68
|
―
|
―
|
|||||||
|
Canceled
|
―
|
―
|
―
|
―
|
―
|
―
|
|||||||
|
Outstanding, end of year
|
468,128
|
$36.45
|
198,759
|
$47.63
|
166,031
|
$36.20
|
|||||||
CALATLANTIC GROUP, INC. AND SUBSIDIARIES
NOTES TO CONSOLIDATED FINANCIAL STATEMENTS
Other Stock-Based Awards. During the years ended December 31, 2016, 2015 and 2014, we issued 22,710 shares, 13,498 shares and 12,174 shares, respectively, of unrestricted common stock to our independent directors (excluding directors appointed by MatlinPatterson who did not receive any stock awards).
Total compensation expense recognized related to stock-based compensation was as follows:
|
Year Ended December 31,
|
||||||||||||
|
2016
|
2015
|
2014
|
||||||||||
|
(Dollars in thousands)
|
||||||||||||
|
Stock options and stock appreciation rights
|
$
|
3,309
|
$
|
8,709
|
$
|
3,618
|
||||||
|
Unrestricted stock grants
|
780
|
555
|
480
|
|||||||||
|
Restricted stock grants
|
4,359
|
3,261
|
1,842
|
|||||||||
|
Performance share awards
|
9,346
|
3,099
|
2,529
|
|||||||||
|
Total
|
$
|
17,794
|
$
|
15,624
|
$
|
8,469
|
||||||
Total unrecognized compensation expense related to stock-based compensation was as follows:
|
As of December 31,
|
|||||||||||||||
|
2016
|
2015
|
2014
|
|||||||||||||
|
Unrecognized
Expense |
Weighted Average
Period |
Unrecognized
Expense |
Weighted Average
Period |
Unrecognized
Expense |
Weighted Average
Period |
||||||||||
|
(Dollars in thousands)
|
|||||||||||||||
|
Unvested stock options and stock appreciation rights
|
$
|
3,255
|
1.3 years
|
$
|
7,216
|
2.1 years
|
$
|
6,777
|
2.1 years
|
||||||
|
Unvested restricted stock grants
|
11,146
|
2.2 years
|
5,850
|
2.1 years
|
4,090
|
2.1 years
|
|||||||||
|
Unvested performance share awards
|
13,409
|
2.0 years
|
5,117
|
2.0 years
|
3,267
|
1.7 years
|
|||||||||
|
Total unrecognized compensation expense
|
$
|
27,810
|
2.0 years
|
$
|
18,183
|
2.0 years
|
$
|
14,134
|
2.0 years
|
||||||
b. Employee Benefit Plan
We have a defined contribution plan pursuant to Section 401(k) of the Internal Revenue Code. Each employee may elect to make before-tax contributions up to the current tax limits. The Company matches employee contributions up to $7,000 per employee per year. The Company provides this plan to help its employees save a portion of their cash compensation for retirement in a tax efficient environment. Our contributions to the plan for the years ended December 31, 2016, 2015 and 2014, were $10.2 million, $4.7 million and $3.6 million, respectively.
15. Stockholder Rights Plan
On October 30, 2014, we entered into Amendment No. 1 to Amended and Restated Rights Agreement ("Amendment No. 1") with Computershare Inc. (as successor in interest to Mellon Investor Services LLC), as Rights Agent, which amended our Amended and Restated Rights Agreement, dated as of December 20, 2011, (the "Rights Agreement"). The Rights Agreement and the rights issued thereunder were scheduled to expire on December 31, 2016. Amendment No. 1 extended the expiration date of each right issued pursuant to the Rights Agreement to December 31, 2017, revised the definition of beneficial ownership to capture ownership through derivative contracts and contained certain other clarifying and technical amendments. The Rights Agreement amended and restated in its entirety the Company's rights agreement, which had been effective since December 31, 2001 (as in effect prior to December 20, 2011, the "Original Rights Agreement"). Under the Original Rights Agreement, one preferred stock purchase right was granted for each share of outstanding common stock of CalAtlantic payable to holders of record on December 31, 2001, and all subsequently issued shares of our common stock. Each right entitles the holder, in certain situations where a person acquires beneficial ownership of 15% or more of our common stock, as described in the Rights Agreement, and upon paying the exercise price (currently $100.00), to purchase common stock or other securities having a market value equal to two times the exercise price. Also, after any such acquisition of 15% of our common stock, if we merge with another corporation, or if 50% or more of our assets are sold, the rights holders may be entitled, upon payment of the exercise price, to buy common shares of the acquiring party at a 50% discount from the then-current market value. In either situation, the rights are not exercisable by the acquiring party. Until the occurrence of certain events described in the Rights Agreement, the rights may be terminated at any time or redeemed at the rate of $0.005 per right and the Rights Agreement amended by CalAtlantic's Board of Directors including, if it believes a
CALATLANTIC GROUP, INC. AND SUBSIDIARIES
NOTES TO CONSOLIDATED FINANCIAL STATEMENTS
proposed acquisition to be in the best interests of our stockholders. As provided in the Original Rights Agreement, under the Rights Agreement, MP CA Homes, LLC and its affiliates generally will not be deemed an acquiring party under the Rights Agreement. The rights will expire on December 31, 2017, unless earlier terminated, redeemed or exchanged. Initially the rights trade with our common stock and are not exercisable, however, if the rights are separated from the common shares, the rights expire three years from the date of such separation.
16. Results of Quarterly Operations (Unaudited)
|
First
Quarter |
Second
Quarter |
Third
Quarter |
Fourth
Quarter |
Total (1)
|
||||||||||||||||
|
(Dollars in thousands, except per share amounts)
|
||||||||||||||||||||
|
2016:
|
||||||||||||||||||||
|
Revenues
|
$
|
1,203,235
|
$
|
1,598,901
|
$
|
1,692,391
|
$
|
1,982,208
|
$
|
6,476,735
|
||||||||||
|
Homebuilding gross margin
|
$
|
247,188
|
$
|
341,357
|
$
|
374,692
|
$
|
427,393
|
$
|
1,390,630
|
||||||||||
|
Net income
|
$
|
72,661
|
$
|
112,760
|
$
|
132,348
|
$
|
166,961
|
$
|
484,730
|
||||||||||
|
Basic income per common share
|
$
|
0.60
|
$
|
0.95
|
$
|
1.12
|
$
|
1.44
|
$
|
4.09
|
||||||||||
|
Diluted income per common share
|
$
|
0.52
|
$
|
0.83
|
$
|
0.97
|
$
|
1.25
|
$
|
3.60
|
||||||||||
|
2015:
|
||||||||||||||||||||
|
Revenues
|
$
|
475,671
|
$
|
707,044
|
$
|
659,200
|
$
|
1,698,198
|
$
|
3,540,113
|
||||||||||
|
Homebuilding gross margin
|
$
|
114,105
|
$
|
171,941
|
$
|
159,756
|
$
|
330,669
|
$
|
776,471
|
||||||||||
|
Net income
|
$
|
31,605
|
$
|
57,198
|
$
|
47,177
|
$
|
77,529
|
$
|
213,509
|
||||||||||
|
Basic income per common share
|
$
|
0.45
|
$
|
0.80
|
$
|
0.65
|
$
|
0.64
|
$
|
2.51
|
||||||||||
|
Diluted income per common share
|
$
|
0.40
|
$
|
0.70
|
$
|
0.59
|
$
|
0.56
|
$
|
2.26
|
||||||||||
________________
| (1) |
Per share amounts do not add across due to rounding differences in quarterly amounts and due to the impact of differences between the quarterly and annual weighted average share calculations.
|
17. Supplemental Disclosure to Consolidated Statements of Cash Flows
The following are supplemental disclosures to the consolidated statements of cash flows:
|
Year Ended December 31,
|
||||||||||||
|
2016
|
2015
|
2014
|
||||||||||
| (Dollars in thousands) | ||||||||||||
|
Supplemental Disclosures of Cash Flow Information:
|
||||||||||||
|
Cash paid during the period for:
|
||||||||||||
|
Interest
|
$
|
220,198
|
$
|
180,536
|
$
|
141,527
|
||||||
|
Income taxes
|
$
|
226,959
|
$
|
81,949
|
$
|
7,297
|
||||||
|
Supplemental Disclosure of Noncash Activities:
|
||||||||||||
|
Increase in assets in connection with merger
|
$
|
―
|
$
|
2,798,739
|
$
|
―
|
||||||
|
Liabilities assumed in connection with business combinations
|
$
|
―
|
$
|
2,028,332
|
$
|
3,659
|
||||||
|
Increase in secured project debt related to seller financed inventory purchases
|
$
|
25,124
|
$
|
―
|
$
|
―
|
||||||
|
Changes in inventories not owned
|
$
|
18,550
|
$
|
34,589
|
$
|
14,074
|
||||||
|
Changes in liabilities from inventories not owned
|
$
|
18,550
|
$
|
17,099
|
$
|
14,074
|
||||||
CALATLANTIC GROUP, INC. AND SUBSIDIARIES
NOTES TO CONSOLIDATED FINANCIAL STATEMENTS
18. Supplemental Guarantor Information
Certain of our 100% owned direct and indirect subsidiaries guarantee our outstanding senior notes payable (please see Note 8.b. "Senior Notes Payable"). Presented below are the consolidated financial statements for our guarantor subsidiaries and non-guarantor subsidiaries.
CONDENSED CONSOLIDATING STATEMENTS OF OPERATIONS
|
Year Ended December 31, 2016
|
||||||||||||||||||||
|
CalAtlantic
Group, Inc. |
Guarantor Subsidiaries
|
Non-
Guarantor Subsidiaries |
Consolidating Adjustments
|
Consolidated CalAtlantic
Group, Inc. |
||||||||||||||||
|
(Dollars in thousands)
|
||||||||||||||||||||
|
Homebuilding:
|
||||||||||||||||||||
|
Revenues
|
$
|
2,674,122
|
$
|
2,629,329
|
$
|
1,084,589
|
$
|
―
|
$
|
6,388,040
|
||||||||||
|
Cost of sales
|
(2,131,342
|
)
|
(2,099,621
|
)
|
(766,447
|
)
|
―
|
(4,997,410
|
)
|
|||||||||||
|
Gross margin
|
542,780
|
529,708
|
318,142
|
―
|
1,390,630
|
|||||||||||||||
|
Selling, general and administrative expenses
|
(278,972
|
)
|
(310,492
|
)
|
(74,995
|
)
|
―
|
(664,459
|
)
|
|||||||||||
|
Income (loss) from unconsolidated joint ventures
|
355
|
594
|
3,108
|
―
|
4,057
|
|||||||||||||||
|
Equity income of subsidiaries
|
330,815
|
―
|
―
|
(330,815
|
)
|
―
|
||||||||||||||
|
Interest income (expense), net
|
4,708
|
(3,578
|
)
|
(1,130
|
)
|
―
|
―
|
|||||||||||||
|
Other income (expense)
|
(15,238
|
)
|
(2,064
|
)
|
576
|
―
|
(16,726
|
)
|
||||||||||||
|
Homebuilding pretax income
|
584,448
|
214,168
|
245,701
|
(330,815
|
)
|
713,502
|
||||||||||||||
|
Financial Services:
|
||||||||||||||||||||
|
Financial services pretax income
|
―
|
―
|
39,614
|
―
|
39,614
|
|||||||||||||||
|
Income before taxes
|
584,448
|
214,168
|
285,315
|
(330,815
|
)
|
753,116
|
||||||||||||||
|
Provision for income taxes
|
(99,718
|
)
|
(92,267
|
)
|
(76,401
|
)
|
―
|
(268,386
|
)
|
|||||||||||
|
Net income
|
$
|
484,730
|
$
|
121,901
|
$
|
208,914
|
$
|
(330,815
|
)
|
$
|
484,730
|
|||||||||
|
Year Ended December 31, 2015
|
||||||||||||||||||||
|
CalAtlantic
Group, Inc. |
Guarantor Subsidiaries
|
Non-
Guarantor Subsidiaries |
Consolidating Adjustments
|
Consolidated CalAtlantic
Group, Inc. |
||||||||||||||||
|
(Dollars in thousands)
|
||||||||||||||||||||
|
Homebuilding:
|
||||||||||||||||||||
|
Revenues
|
$
|
1,234,750
|
$
|
1,500,676
|
$
|
787,707
|
$
|
(26,722
|
)
|
$
|
3,496,411
|
|||||||||
|
Cost of sales
|
(989,834
|
)
|
(1,194,605
|
)
|
(562,223
|
)
|
26,722
|
(2,719,940
|
)
|
|||||||||||
|
Gross margin
|
244,916
|
306,071
|
225,484
|
―
|
776,471
|
|||||||||||||||
|
Selling, general and administrative expenses
|
(145,458
|
)
|
(185,779
|
)
|
(59,473
|
)
|
―
|
(390,710
|
)
|
|||||||||||
|
Income (loss) from unconsolidated joint ventures
|
540
|
269
|
1,157
|
―
|
1,966
|
|||||||||||||||
|
Equity income of subsidiaries
|
201,261
|
―
|
―
|
(201,261
|
)
|
―
|
||||||||||||||
|
Interest income (expense), net
|
12,388
|
(9,374
|
)
|
(3,014
|
)
|
―
|
―
|
|||||||||||||
|
Other income (expense)
|
(57,629
|
)
|
(2,678
|
)
|
(1,870
|
)
|
―
|
(62,177
|
)
|
|||||||||||
|
Homebuilding pretax income
|
256,018
|
108,509
|
162,284
|
(201,261
|
)
|
325,550
|
||||||||||||||
|
Financial Services:
|
||||||||||||||||||||
|
Financial services pretax income
|
―
|
―
|
16,939
|
―
|
16,939
|
|||||||||||||||
|
Income before taxes
|
256,018
|
108,509
|
179,223
|
(201,261
|
)
|
342,489
|
||||||||||||||
|
Provision for income taxes
|
(42,509
|
)
|
(49,512
|
)
|
(36,959
|
)
|
―
|
(128,980
|
)
|
|||||||||||
|
Net income
|
$
|
213,509
|
$
|
58,997
|
$
|
142,264
|
$
|
(201,261
|
)
|
$
|
213,509
|
|||||||||
CALATLANTIC GROUP, INC. AND SUBSIDIARIES
NOTES TO CONSOLIDATED FINANCIAL STATEMENTS
18. Supplemental Guarantor Information
CONDENSED CONSOLIDATING STATEMENT OF OPERATIONS
|
Year Ended December 31, 2014
|
||||||||||||||||||||
|
CalAtlantic
Group, Inc. |
Guarantor Subsidiaries
|
Non-
Guarantor Subsidiaries |
Consolidating Adjustments
|
Consolidated CalAtlantic
Group, Inc. |
||||||||||||||||
|
(Dollars in thousands)
|
||||||||||||||||||||
|
Homebuilding:
|
||||||||||||||||||||
|
Revenues
|
$
|
813,423
|
$
|
1,025,404
|
$
|
572,351
|
$
|
―
|
$
|
2,411,178
|
||||||||||
|
Cost of sales
|
(599,911
|
)
|
(779,578
|
)
|
(413,306
|
)
|
―
|
(1,792,795
|
)
|
|||||||||||
|
Gross margin
|
213,512
|
245,826
|
159,045
|
―
|
618,383
|
|||||||||||||||
|
Selling, general and administrative expenses
|
(101,020
|
)
|
(131,068
|
)
|
(43,773
|
)
|
―
|
(275,861
|
)
|
|||||||||||
|
Income (loss) from unconsolidated joint ventures
|
(71
|
)
|
88
|
(685
|
)
|
―
|
(668
|
)
|
||||||||||||
|
Equity income of subsidiaries
|
155,943
|
―
|
―
|
(155,943
|
)
|
―
|
||||||||||||||
|
Interest income (expense), net
|
13,718
|
(11,497
|
)
|
(2,221
|
)
|
―
|
―
|
|||||||||||||
|
Other income (expense)
|
(3,954
|
)
|
(469
|
)
|
2,690
|
―
|
(1,733
|
)
|
||||||||||||
|
Homebuilding pretax income
|
278,128
|
102,880
|
115,056
|
(155,943
|
)
|
340,121
|
||||||||||||||
|
Financial Services:
|
||||||||||||||||||||
|
Financial services pretax income
|
―
|
―
|
9,843
|
―
|
9,843
|
|||||||||||||||
|
Income before taxes
|
278,128
|
102,880
|
124,899
|
(155,943
|
)
|
349,964
|
||||||||||||||
|
Provision for income taxes
|
(62,263
|
)
|
(40,469
|
)
|
(31,367
|
)
|
―
|
(134,099
|
)
|
|||||||||||
|
Net income
|
$
|
215,865
|
$
|
62,411
|
$
|
93,532
|
$
|
(155,943
|
)
|
$
|
215,865
|
|||||||||
CALATLANTIC GROUP, INC. AND SUBSIDIARIES
NOTES TO CONSOLIDATED FINANCIAL STATEMENTS
18. Supplemental Guarantor Information
CONDENSED CONSOLIDATING BALANCE SHEET
|
December 31, 2016
|
||||||||||||||||||||
|
CalAtlantic
Group, Inc. |
Guarantor
Subsidiaries |
Non-Guarantor
Subsidiaries |
Consolidating
Adjustments |
Consolidated CalAtlantic
Group, Inc. |
||||||||||||||||
|
(Dollars in thousands)
|
||||||||||||||||||||
|
ASSETS
|
||||||||||||||||||||
|
Homebuilding:
|
||||||||||||||||||||
|
Cash and equivalents
|
$
|
105,261
|
$
|
38,211
|
$
|
47,614
|
$
|
―
|
$
|
191,086
|
||||||||||
|
Restricted cash
|
―
|
―
|
28,321
|
―
|
28,321
|
|||||||||||||||
|
Intercompany receivables
|
2,045,773
|
―
|
334,926
|
(2,380,699
|
)
|
―
|
||||||||||||||
|
Inventories:
|
||||||||||||||||||||
|
Owned
|
2,825,234
|
2,277,840
|
1,335,718
|
―
|
6,438,792
|
|||||||||||||||
|
Not owned
|
30,953
|
32,596
|
2,718
|
―
|
66,267
|
|||||||||||||||
|
Investments in unconsolidated joint ventures
|
4,469
|
4,923
|
117,735
|
―
|
127,127
|
|||||||||||||||
|
Investments in subsidiaries
|
1,954,418
|
―
|
―
|
(1,954,418
|
)
|
―
|
||||||||||||||
|
Deferred income taxes, net
|
337,021
|
―
|
―
|
(6,643
|
)
|
330,378
|
||||||||||||||
|
Goodwill
|
970,185
|
―
|
―
|
―
|
970,185
|
|||||||||||||||
|
Other assets
|
165,214
|
36,725
|
2,550
|
―
|
204,489
|
|||||||||||||||
|
Total Homebuilding Assets
|
8,438,528
|
2,390,295
|
1,869,582
|
(4,341,760
|
)
|
8,356,645
|
||||||||||||||
|
Financial Services:
|
||||||||||||||||||||
|
Cash and equivalents
|
―
|
―
|
17,041
|
―
|
17,041
|
|||||||||||||||
|
Restricted cash
|
―
|
―
|
21,710
|
―
|
21,710
|
|||||||||||||||
|
Mortgage loans held for sale, net
|
―
|
―
|
262,058
|
―
|
262,058
|
|||||||||||||||
|
Mortgage loans held for investment, net
|
―
|
―
|
24,924
|
―
|
24,924
|
|||||||||||||||
|
Other assets
|
―
|
―
|
28,467
|
(1,801
|
)
|
26,666
|
||||||||||||||
|
Total Financial Services Assets
|
―
|
―
|
354,200
|
(1,801
|
)
|
352,399
|
||||||||||||||
|
Total Assets
|
$
|
8,438,528
|
$
|
2,390,295
|
$
|
2,223,782
|
$
|
(4,343,561
|
)
|
$
|
8,709,044
|
|||||||||
|
LIABILITIES AND EQUITY
|
||||||||||||||||||||
|
Homebuilding:
|
||||||||||||||||||||
|
Accounts payable
|
$
|
92,611
|
$
|
78,729
|
$
|
40,440
|
$
|
―
|
$
|
211,780
|
||||||||||
|
Accrued liabilities and intercompany payables
|
387,098
|
1,302,228
|
964,796
|
(2,054,217
|
)
|
599,905
|
||||||||||||||
|
Secured project debt and other notes payable
|
359,025
|
―
|
3,480
|
(334,926
|
)
|
27,579
|
||||||||||||||
|
Senior notes payable
|
3,392,208
|
―
|
―
|
―
|
3,392,208
|
|||||||||||||||
|
Total Homebuilding Liabilities
|
4,230,942
|
1,380,957
|
1,008,716
|
(2,389,143
|
)
|
4,231,472
|
||||||||||||||
|
Financial Services:
|
||||||||||||||||||||
|
Accounts payable and other liabilities
|
―
|
―
|
22,559
|
―
|
22,559
|
|||||||||||||||
|
Mortgage credit facilities
|
―
|
―
|
247,427
|
―
|
247,427
|
|||||||||||||||
|
Total Financial Services Liabilities
|
―
|
―
|
269,986
|
―
|
269,986
|
|||||||||||||||
|
Total Liabilities
|
4,230,942
|
1,380,957
|
1,278,702
|
(2,389,143
|
)
|
4,501,458
|
||||||||||||||
|
Equity:
|
||||||||||||||||||||
|
Total Equity
|
4,207,586
|
1,009,338
|
945,080
|
(1,954,418
|
)
|
4,207,586
|
||||||||||||||
|
Total Liabilities and Equity
|
$
|
8,438,528
|
$
|
2,390,295
|
$
|
2,223,782
|
$
|
(4,343,561
|
)
|
$
|
8,709,044
|
|||||||||
CALATLANTIC GROUP, INC. AND SUBSIDIARIES
NOTES TO CONSOLIDATED FINANCIAL STATEMENTS
18. Supplemental Guarantor Information
CONDENSED CONSOLIDATING BALANCE SHEET
|
December 31, 2015
|
||||||||||||||||||||
|
CalAtlantic
Group, Inc. |
Guarantor
Subsidiaries |
Non-Guarantor
Subsidiaries |
Consolidating
Adjustments |
Consolidated CalAtlantic
Group, Inc. |
||||||||||||||||
|
(Dollars in thousands)
|
||||||||||||||||||||
|
ASSETS
|
||||||||||||||||||||
|
Homebuilding:
|
||||||||||||||||||||
|
Cash and equivalents
|
$
|
6,387
|
$
|
112,852
|
$
|
31,837
|
$
|
―
|
$
|
151,076
|
||||||||||
|
Restricted cash
|
―
|
―
|
35,990
|
―
|
35,990
|
|||||||||||||||
|
Intercompany receivables
|
2,380,899
|
―
|
152,505
|
(2,533,404
|
)
|
―
|
||||||||||||||
|
Inventories:
|
||||||||||||||||||||
|
Owned
|
2,524,927
|
2,304,305
|
1,240,727
|
―
|
6,069,959
|
|||||||||||||||
|
Not owned
|
32,393
|
38,925
|
11,928
|
―
|
83,246
|
|||||||||||||||
|
Investments in unconsolidated joint ventures
|
5,353
|
4,330
|
123,080
|
―
|
132,763
|
|||||||||||||||
|
Investments in subsidiaries
|
1,644,453
|
―
|
―
|
(1,644,453
|
)
|
―
|
||||||||||||||
|
Deferred income taxes, net
|
405,945
|
―
|
―
|
(9,751
|
)
|
396,194
|
||||||||||||||
|
Goodwill
|
933,360
|
―
|
―
|
―
|
933,360
|
|||||||||||||||
|
Other assets
|
151,475
|
48,027
|
3,163
|
―
|
202,665
|
|||||||||||||||
|
Total Homebuilding Assets
|
8,085,192
|
2,508,439
|
1,599,230
|
(4,187,608
|
)
|
8,005,253
|
||||||||||||||
|
Financial Services:
|
||||||||||||||||||||
|
Cash and equivalents
|
―
|
―
|
35,518
|
―
|
35,518
|
|||||||||||||||
|
Restricted cash
|
―
|
―
|
22,914
|
―
|
22,914
|
|||||||||||||||
|
Mortgage loans held for sale, net
|
―
|
―
|
325,770
|
―
|
325,770
|
|||||||||||||||
|
Mortgage loans held for investment, net
|
―
|
―
|
22,704
|
―
|
22,704
|
|||||||||||||||
|
Other assets
|
―
|
―
|
18,886
|
(1,643
|
)
|
17,243
|
||||||||||||||
|
Total Financial Services Assets
|
―
|
―
|
425,792
|
(1,643
|
)
|
424,149
|
||||||||||||||
|
Total Assets
|
$
|
8,085,192
|
$
|
2,508,439
|
$
|
2,025,022
|
$
|
(4,189,251
|
)
|
$
|
8,429,402
|
|||||||||
|
LIABILITIES AND EQUITY
|
||||||||||||||||||||
|
Homebuilding:
|
||||||||||||||||||||
|
Accounts payable
|
$
|
91,873
|
$
|
82,906
|
$
|
16,902
|
$
|
―
|
$
|
191,681
|
||||||||||
|
Accrued liabilities and intercompany payables
|
499,700
|
1,538,096
|
903,761
|
(2,378,867
|
)
|
562,690
|
||||||||||||||
|
Secured project debt and other notes payable
|
170,167
|
―
|
4,061
|
(148,545
|
)
|
25,683
|
||||||||||||||
|
Senior notes payable
|
3,462,016
|
―
|
―
|
―
|
3,462,016
|
|||||||||||||||
|
Total Homebuilding Liabilities
|
4,223,756
|
1,621,002
|
924,724
|
(2,527,412
|
)
|
4,242,070
|
||||||||||||||
|
Financial Services:
|
||||||||||||||||||||
|
Accounts payable and other liabilities
|
―
|
―
|
39,860
|
(17,386
|
)
|
22,474
|
||||||||||||||
|
Mortgage credit facilities
|
―
|
―
|
303,422
|
―
|
303,422
|
|||||||||||||||
|
Total Financial Services Liabilities
|
―
|
―
|
343,282
|
(17,386
|
)
|
325,896
|
||||||||||||||
|
Total Liabilities
|
4,223,756
|
1,621,002
|
1,268,006
|
(2,544,798
|
)
|
4,567,966
|
||||||||||||||
|
Equity:
|
||||||||||||||||||||
|
Total Equity
|
3,861,436
|
887,437
|
757,016
|
(1,644,453
|
)
|
3,861,436
|
||||||||||||||
|
Total Liabilities and Equity
|
$
|
8,085,192
|
$
|
2,508,439
|
$
|
2,025,022
|
$
|
(4,189,251
|
)
|
$
|
8,429,402
|
|||||||||
CALATLANTIC GROUP, INC. AND SUBSIDIARIES
NOTES TO CONSOLIDATED FINANCIAL STATEMENTS
18. Supplemental Guarantor Information
CONDENSED CONSOLIDATING STATEMENTS OF CASH FLOWS
|
Year Ended December 31, 2016
|
||||||||||||||||||||
|
CalAtlantic
Group, Inc. |
Guarantor
Subsidiaries |
Non-Guarantor
Subsidiaries |
Consolidating
Adjustments |
Consolidated CalAtlantic
Group, Inc. |
||||||||||||||||
|
(Dollars in thousands)
|
||||||||||||||||||||
|
Cash Flows From Operating Activities:
|
||||||||||||||||||||
|
Net cash provided by (used in) operating activities
|
$
|
35,434
|
$
|
120,540
|
$
|
166,340
|
$
|
―
|
$
|
322,314
|
||||||||||
|
Cash Flows From Investing Activities:
|
||||||||||||||||||||
|
Investments in unconsolidated homebuilding joint ventures
|
(276
|
)
|
(227
|
)
|
(28,615
|
)
|
―
|
(29,118
|
)
|
|||||||||||
|
Distributions of capital from unconsolidated homebuilding joint ventures
|
1,104
|
336
|
38,295
|
―
|
39,735
|
|||||||||||||||
|
Loan to parent and subsidiaries
|
―
|
―
|
(187,300
|
)
|
187,300
|
―
|
||||||||||||||
|
Other investing activities
|
(616
|
)
|
(3,496
|
)
|
(3,576
|
)
|
―
|
(7,688
|
)
|
|||||||||||
|
Net cash provided by (used in) investing activities
|
212
|
(3,387
|
)
|
(181,196
|
)
|
187,300
|
2,929
|
|||||||||||||
|
Cash Flows From Financing Activities:
|
||||||||||||||||||||
|
Change in restricted cash
|
―
|
―
|
8,873
|
―
|
8,873
|
|||||||||||||||
|
Borrowing from revolving credit facility
|
1,433,200
|
―
|
―
|
―
|
1,433,200
|
|||||||||||||||
|
Principal payments on revolving credit facility
|
(1,433,200
|
)
|
―
|
―
|
―
|
(1,433,200
|
)
|
|||||||||||||
|
Principal payments on secured project debt and other notes payable
|
(22,647
|
)
|
―
|
(581
|
)
|
―
|
(23,228
|
)
|
||||||||||||
|
Loan from subsidiary
|
187,300
|
―
|
―
|
(187,300
|
)
|
―
|
||||||||||||||
|
Principal payments on senior notes payable
|
(280,000
|
)
|
―
|
―
|
―
|
(280,000
|
)
|
|||||||||||||
|
Proceeds from the issuance of senior notes payable
|
300,000
|
―
|
―
|
―
|
300,000
|
|||||||||||||||
|
Payment of debt issuance costs
|
(2,669
|
)
|
―
|
―
|
―
|
(2,669
|
)
|
|||||||||||||
|
Net proceeds from (payments on) mortgage credit facilities
|
―
|
―
|
(55,995
|
)
|
―
|
(55,995
|
)
|
|||||||||||||
|
(Contributions to) distributions from Corporate and subsidiaries
|
20,850
|
―
|
(20,850
|
)
|
―
|
―
|
||||||||||||||
|
Repurchases of common stock
|
(232,520
|
)
|
―
|
―
|
―
|
(232,520
|
)
|
|||||||||||||
|
Common stock dividend payments
|
(18,841
|
)
|
―
|
―
|
―
|
(18,841
|
)
|
|||||||||||||
|
Issuance of common stock under employee stock plans, net of withholdings
|
1,330
|
―
|
―
|
―
|
1,330
|
|||||||||||||||
|
Excess tax benefit (provision) from share-based payment arrangements
|
(460
|
)
|
―
|
―
|
―
|
(460
|
)
|
|||||||||||||
|
Other financing activities
|
―
|
(200
|
)
|
―
|
―
|
(200
|
)
|
|||||||||||||
|
Intercompany advances, net
|
110,885
|
(191,594
|
)
|
80,709
|
―
|
―
|
||||||||||||||
|
Net cash provided by (used in) financing activities
|
63,228
|
(191,794
|
)
|
12,156
|
(187,300
|
)
|
(303,710
|
)
|
||||||||||||
|
Net increase (decrease) in cash and equivalents
|
98,874
|
(74,641
|
)
|
(2,700
|
)
|
―
|
21,533
|
|||||||||||||
|
Cash and equivalents at beginning of year
|
6,387
|
112,852
|
67,355
|
―
|
186,594
|
|||||||||||||||
|
Cash and equivalents at end of year
|
$
|
105,261
|
$
|
38,211
|
$
|
64,655
|
$
|
―
|
$
|
208,127
|
||||||||||
CALATLANTIC GROUP, INC. AND SUBSIDIARIES
NOTES TO CONSOLIDATED FINANCIAL STATEMENTS
18. Supplemental Guarantor Information
CONDENSED CONSOLIDATING STATEMENTS OF CASH FLOWS
|
Year Ended December 31, 2015
|
||||||||||||||||||||
|
CalAtlantic
Group, Inc. |
Guarantor
Subsidiaries |
Non-Guarantor
Subsidiaries |
Consolidating
Adjustments |
Consolidated CalAtlantic
Group, Inc. |
||||||||||||||||
|
(Dollars in thousands)
|
||||||||||||||||||||
|
Cash Flows From Operating Activities:
|
||||||||||||||||||||
|
Net cash provided by (used in) operating activities
|
$
|
(17,201
|
)
|
$
|
(107,470
|
)
|
$
|
(146,690
|
)
|
$
|
―
|
$
|
(271,361
|
)
|
||||||
|
Cash Flows From Investing Activities:
|
||||||||||||||||||||
|
Investments in unconsolidated homebuilding joint ventures
|
―
|
―
|
(91,453
|
)
|
―
|
(91,453
|
)
|
|||||||||||||
|
Distributions of capital from unconsolidated homebuilding joint ventures
|
641
|
75
|
18,866
|
―
|
19,582
|
|||||||||||||||
|
Cash acquired in connection with merger
|
20,345
|
238,034
|
10,138
|
―
|
268,517
|
|||||||||||||||
|
Loan to parent and subsidiaries
|
―
|
―
|
34,000
|
(34,000
|
)
|
―
|
||||||||||||||
|
Other investing activities
|
9
|
(4,310
|
)
|
(7,671
|
)
|
―
|
(11,972
|
)
|
||||||||||||
|
Net cash provided by (used in) investing activities
|
20,995
|
233,799
|
(36,120
|
)
|
(34,000
|
)
|
184,674
|
|||||||||||||
|
Cash Flows From Financing Activities:
|
||||||||||||||||||||
|
Change in restricted cash
|
―
|
―
|
652
|
―
|
652
|
|||||||||||||||
|
Borrowing from revolving credit facility
|
852,700
|
―
|
―
|
―
|
852,700
|
|||||||||||||||
|
Principal payments on revolving credit facility
|
(852,700
|
)
|
―
|
―
|
―
|
(852,700
|
)
|
|||||||||||||
|
Principal payments on secured project debt and other notes payable
|
(1,893
|
)
|
―
|
(639
|
)
|
―
|
(2,532
|
)
|
||||||||||||
|
Loan from subsidiary
|
46,000
|
―
|
―
|
(46,000
|
)
|
―
|
||||||||||||||
|
Principal payments on senior notes payable
|
(29,789
|
)
|
―
|
―
|
―
|
(29,789
|
)
|
|||||||||||||
|
(1,016
|
)
|
―
|
―
|
―
|
(1,016
|
)
|
||||||||||||||
|
Net proceeds from (payments on) mortgage credit facilities
|
―
|
―
|
30,469
|
80,000
|
110,469
|
|||||||||||||||
|
(Contributions to) distributions from Corporate and subsidiaries
|
13,873
|
(31,719
|
)
|
17,846
|
―
|
―
|
||||||||||||||
|
Repurchases of common stock
|
(22,073
|
)
|
―
|
―
|
―
|
(22,073
|
)
|
|||||||||||||
|
Common stock dividend payments
|
(4,851
|
)
|
―
|
―
|
―
|
(4,851
|
)
|
|||||||||||||
|
Issuance of common stock under employee stock plans, net of withholdings
|
1,000
|
―
|
―
|
―
|
1,000
|
|||||||||||||||
|
Excess tax benefit (provision) from share-based payment arrangements
|
9,250
|
―
|
―
|
―
|
9,250
|
|||||||||||||||
|
Other financing activities
|
―
|
(95
|
)
|
(127
|
)
|
―
|
(222
|
)
|
||||||||||||
|
Intercompany advances, net
|
(141,212
|
)
|
17,276
|
123,936
|
―
|
―
|
||||||||||||||
|
Net cash provided by (used in) financing activities
|
(130,711
|
)
|
(14,538
|
)
|
172,137
|
34,000
|
60,888
|
|||||||||||||
|
Net increase (decrease) in cash and equivalents
|
(126,917
|
)
|
111,791
|
(10,673
|
)
|
―
|
(25,799
|
)
|
||||||||||||
|
Cash and equivalents at beginning of year
|
133,304
|
1,061
|
78,028
|
―
|
212,393
|
|||||||||||||||
|
Cash and equivalents at end of year
|
$
|
6,387
|
$
|
112,852
|
$
|
67,355
|
$
|
―
|
$
|
186,594
|
||||||||||
CALATLANTIC GROUP, INC. AND SUBSIDIARIES
NOTES TO CONSOLIDATED FINANCIAL STATEMENTS
18. Supplemental Guarantor Information
CONDENSED CONSOLIDATING STATEMENTS OF CASH FLOWS
|
Year Ended December 31, 2014
|
||||||||||||||||||||
|
CalAtlantic
Group, Inc. |
Guarantor
Subsidiaries |
Non-Guarantor
Subsidiaries |
Consolidating
Adjustments |
Consolidated CalAtlantic
Group, Inc. |
||||||||||||||||
|
(Dollars in thousands)
|
||||||||||||||||||||
|
Cash Flows From Operating Activities:
|
||||||||||||||||||||
|
Net cash provided by (used in) operating activities
|
$
|
(56,158
|
)
|
$
|
(118,941
|
)
|
$
|
(187,298
|
)
|
$
|
―
|
$
|
(362,397
|
)
|
||||||
|
Cash Flows From Investing Activities:
|
||||||||||||||||||||
|
Investments in unconsolidated homebuilding joint ventures
|
―
|
―
|
(10,506
|
)
|
―
|
(10,506
|
)
|
|||||||||||||
|
Distributions of capital from unconsolidated homebuilding joint ventures
|
227
|
228
|
17,555
|
―
|
18,010
|
|||||||||||||||
|
Net cash paid for acquisitions
|
―
|
(36,047
|
)
|
2,277
|
―
|
(33,770
|
)
|
|||||||||||||
|
Loan to parent and subsidiaries
|
―
|
―
|
(180,000
|
)
|
180,000
|
―
|
||||||||||||||
|
Other investing activities
|
(1,571
|
)
|
(1,351
|
)
|
(1,832
|
)
|
―
|
(4,754
|
)
|
|||||||||||
|
Net cash provided by (used in) investing activities
|
(1,344
|
)
|
(37,170
|
)
|
(172,506
|
)
|
180,000
|
(31,020
|
)
|
|||||||||||
|
Cash Flows From Financing Activities:
|
||||||||||||||||||||
|
Change in restricted cash
|
―
|
―
|
(16,762
|
)
|
―
|
(16,762
|
)
|
|||||||||||||
|
Principal payments on secured project debt and other notes payable
|
―
|
―
|
(1,458
|
)
|
―
|
(1,458
|
)
|
|||||||||||||
|
Loan from subsidiary
|
100,000
|
―
|
―
|
(100,000
|
)
|
―
|
||||||||||||||
|
Principal payments on senior notes payable
|
(4,971
|
)
|
―
|
―
|
―
|
(4,971
|
)
|
|||||||||||||
|
Proceeds from the issuance of senior notes payable
|
300,000
|
―
|
―
|
―
|
300,000
|
|||||||||||||||
|
Payment of debt issuance costs
|
(6,230
|
)
|
―
|
―
|
―
|
(6,230
|
)
|
|||||||||||||
|
Net proceeds from (payments on) mortgage credit facilities
|
―
|
―
|
68,546
|
(80,000
|
)
|
(11,454
|
)
|
|||||||||||||
|
(Contributions to) distributions from Corporate and subsidiaries
|
8,350
|
―
|
(8,350
|
)
|
―
|
―
|
||||||||||||||
|
Repurchases of common stock
|
(36,781
|
)
|
―
|
―
|
―
|
(36,781
|
)
|
|||||||||||||
|
Issuance of common stock under employee stock plans, net of withholdings
|
6,771
|
―
|
―
|
―
|
6,771
|
|||||||||||||||
|
Excess tax benefit (provision) from share-based payment arrangements
|
13,404
|
―
|
―
|
―
|
13,404
|
|||||||||||||||
|
Intercompany advances, net
|
(365,026
|
)
|
156,678
|
208,348
|
―
|
―
|
||||||||||||||
|
Net cash provided by (used in) financing activities
|
15,517
|
156,678
|
250,324
|
(180,000
|
)
|
242,519
|
||||||||||||||
|
Net increase (decrease) in cash and equivalents
|
(41,985
|
)
|
567
|
(109,480
|
)
|
―
|
(150,898
|
)
|
||||||||||||
|
Cash and equivalents at beginning of year
|
175,289
|
494
|
187,508
|
―
|
363,291
|
|||||||||||||||
|
Cash and equivalents at end of year
|
$
|
133,304
|
$
|
1,061
|
$
|
78,028
|
$
|
―
|
$
|
212,393
|
||||||||||
Not applicable.
Conclusion Regarding the Effectiveness of Disclosure Controls and Procedures
As of the end of the period covered by this annual report on Form 10-K, we carried out an evaluation, under the supervision and with the participation of our management, including our Chief Executive Officer and Chief Financial Officer, of the effectiveness of the design and operation of our disclosure controls and procedures as such term is defined in Exchange Act Rules 13a-15(e) and 15d-15(e), including controls and procedures to timely alert management to material information relating to CalAtlantic Group, Inc. and subsidiaries required to be included in our periodic SEC filings. Based on that evaluation, our Chief Executive Officer and Chief Financial Officer have concluded that our disclosure controls and procedures were effective as of the end of the period covered by this report.
Changes in Internal Control Over Financial Reporting
Our management, including our Chief Executive Officer and Chief Financial Officer, has evaluated our internal control over financial reporting to determine whether any change occurred during the fourth quarter of the year ended December 31, 2016 that has materially affected, or is reasonably likely to materially affect, our internal control over financial reporting. Based on that evaluation, there has been no such change during the fourth quarter of the period covered by this report.
Management's Annual Report on Internal Control Over Financial Reporting
Our management is responsible for establishing and maintaining adequate internal control over financial reporting, as such term is defined in Exchange Act Rules 13a-15(f) and 15d-15(f). Our internal control over financial reporting is a process designed to provide reasonable assurance regarding the reliability of financial reporting and the preparation of our financial statements for external purposes in accordance with U.S. generally accepted accounting principles. Because of its inherent limitations, internal control over financial reporting may not prevent or detect misstatements. Also, projections of any evaluation of effectiveness to future periods are subject to the risk that controls may become inadequate because of changes in conditions, or that the degree of compliance with the policies or procedures may deteriorate.
Under the supervision and with the participation of our management, including our Chief Executive Officer and Chief Financial Officer, we conducted an evaluation of the effectiveness of our internal control over financial reporting based on the criteria in Internal Control—Integrated Framework (2013 framework) issued by the Committee of Sponsoring Organizations of the Treadway Commission. Based on our evaluation under the framework in Internal Control—Integrated Framework, our management concluded that our internal control over financial reporting was effective as of December 31, 2016.
The effectiveness of our internal control over financial reporting as of December 31, 2016 has been audited by Ernst & Young LLP, our independent registered public accounting firm, as stated in its attestation report which is included herein.
Report of Independent Registered Public Accounting Firm
The Board of Directors and Shareholders of CalAtlantic Group, Inc.:
We have audited CalAtlantic Group, Inc. and subsidiaries' internal control over financial reporting as of December 31, 2016, based on criteria established in Internal Control—Integrated Framework issued by the Committee of Sponsoring Organizations of the Treadway Commission (2013 framework) (the COSO criteria). CalAtlantic Group, Inc. and subsidiaries' management is responsible for maintaining effective internal control over financial reporting, and for its assessment of the effectiveness of internal control over financial reporting included in the accompanying Management's Annual Report on Internal Control Over Financial Reporting. Our responsibility is to express an opinion on the Company's internal control over financial reporting based on our audit.
We conducted our audit in accordance with the standards of the Public Company Accounting Oversight Board (United States). Those standards require that we plan and perform the audit to obtain reasonable assurance about whether effective internal control over financial reporting was maintained in all material respects. Our audit included obtaining an understanding of internal control over financial reporting, assessing the risk that a material weakness exists, testing and evaluating the design and operating effectiveness of internal control based on the assessed risk, and performing such other procedures as we considered necessary in the circumstances. We believe that our audit provides a reasonable basis for our opinion.
A company's internal control over financial reporting is a process designed to provide reasonable assurance regarding the reliability of financial reporting and the preparation of financial statements for external purposes in accordance with generally accepted accounting principles. A company's internal control over financial reporting includes those policies and procedures that (1) pertain to the maintenance of records that, in reasonable detail, accurately and fairly reflect the transactions and dispositions of the assets of the company; (2) provide reasonable assurance that transactions are recorded as necessary to permit preparation of financial statements in accordance with generally accepted accounting principles, and that receipts and expenditures of the company are being made only in accordance with authorizations of management and directors of the company; and (3) provide reasonable assurance regarding prevention or timely detection of unauthorized acquisition, use or disposition of the company's assets that could have a material effect on the financial statements.
Because of its inherent limitations, internal control over financial reporting may not prevent or detect misstatements. Also, projections of any evaluation of effectiveness to future periods are subject to the risk that controls may become inadequate because of changes in conditions, or that the degree of compliance with the policies or procedures may deteriorate.
In our opinion, CalAtlantic Group, Inc. and subsidiaries maintained, in all material respects, effective internal control over financial reporting as of December 31, 2016, based on the COSO criteria.
We also have audited, in accordance with the standards of the Public Company Accounting Oversight Board (United States), the consolidated balance sheets of CalAtlantic Group, Inc. and subsidiaries as of December 31, 2016 and 2015, and the related consolidated statements of operations, comprehensive income, stockholders' equity, and cash flows for each of the three years in the period ended December 31, 2016 of CalAtlantic Group, Inc. and subsidiaries and our report dated February 27, 2017 expressed an unqualified opinion thereon.
/s/ Ernst & Young LLP
Irvine, California
February 27, 2017
None.
PART III
The information required by this item will be set forth in the Company's 2017 Annual Meeting Proxy Statement, which will be filed with the Securities and Exchange Commission not later than 120 days after December 31, 2016 (the "2017 Proxy Statement"). For the limited purpose of providing the information necessary to comply with this Item 10, the 2017 Proxy Statement is incorporated herein by this reference. All references to the 2017 Proxy Statement in this Part III are exclusive of the information set forth under the captions "Compensation Committee Report" and "Audit Committee Report."
The information required by this item will be set forth in the 2017 Proxy Statement. For the limited purpose of providing the information necessary to comply with this Item 11, the 2017 Proxy Statement is incorporated herein by this reference.
ITEM 12. SECURITY OWNERSHIP OF CERTAIN BENEFICIAL OWNERS AND MANAGEMENT AND RELATED STOCKHOLDER MATTERS
The information required by this item will be set forth in the 2017 Proxy Statement. For the limited purpose of providing the information necessary to comply with this Item 12, the 2017 Proxy Statement is incorporated herein by this reference.
The information required by this item will be set forth in the 2017 Proxy Statement. For the limited purpose of providing the information necessary to comply with this Item 13, the 2017 Proxy Statement is incorporated herein by this reference.
This information required by this item will be set forth in the 2017 Proxy Statement. For the limited purpose of providing the information necessary to comply with this Item 14, the 2017 Proxy Statement is incorporated herein by this reference.
PART IV
|
|
|
Page
Reference |
|
(a)(1)
|
Financial Statements, included in Part II of this report:
|
|
|
|
40
|
|
|
|
41
|
|
|
|
42
|
|
|
|
43
|
|
|
|
44
|
|
|
|
45
|
|
|
|
46
|
|
|
(2)
|
Financial Statement Schedules:
|
|
|
|
Financial Statement Schedules are omitted since the required information is not present or is not present in the amounts sufficient to require submission of a schedule, or because the information required is included in the consolidated financial statements, including the notes thereto.
|
|
|
(3)
|
Index to Exhibits
|
|
|
|
See Index to Exhibits on pages 87-91 below.
|
|
|
(b)
|
Index to Exhibits. See Index to Exhibits on pages 87-91 below.
|
|
|
(c)
|
Financial Statements required by Regulation S-X excluded from the annual report to shareholders by Rule 14a-3(b). Not applicable.
|
|
Not applicable.
SIGNATURES
Pursuant to the requirements of Section 13 or 15(d) of the Securities Exchange Act of 1934, the Registrant has duly caused this report to be signed on its behalf by the undersigned, thereunto duly authorized.
|
CALATLANTIC GROUP, INC.
(Registrant)
|
|
|
By:
|
/s/ Larry T. Nicholson
|
|
Larry T. Nicholson
|
|
|
Chief Executive Officer
and President
|
|
|
February 27, 2017
|
|
POWER OF ATTORNEY
KNOW ALL MEN BY THESE PRESENTS, that the undersigned officers and/or directors of the Registrant, by virtue of their signatures to this report, appearing below, hereby constitute and appoint Larry T. Nicholson and Jeff J. McCall, or any one of them, with full power of substitution, as attorneys-in-fact in their names, places and steads to execute any and all amendments to this report in the capacities set forth opposite their names and hereby ratify all that said attorneys-in-fact do by virtue hereof.
Pursuant to the requirements of the Securities Exchange Act of 1934, this report has been signed below by the following persons on behalf of the Registrant in the capacities and on the dates indicated.
|
Signature
|
Title
|
Date
|
||
|
/s/ Larry T. Nicholson
|
Chief Executive Officer, President and Director
|
February 27, 2017
|
||
| (Larry T. Nicholson) | ||||
|
/s/ Jeff J. McCall
|
Executive Vice President and Chief Financial Officer
(Principal Financial and Accounting Officer)
|
February 27, 2017
|
||
| (Jeff J. McCall) | ||||
|
/s/ Scott D. Stowell
|
Director (Executive Chairman)
|
February 27, 2017
|
||
| (Scott D. Stowell) | ||||
|
/s/ Bruce A. Choate
|
Director
|
February 27, 2017
|
||
| (Bruce A. Choate) | ||||
|
/s/ Douglas C. Jacobs
|
Director
|
February 27, 2017
|
||
| (Douglas C. Jacobs) | ||||
|
/s/ William L. Jews
|
Director
|
February 27, 2017
|
||
| (William L. Jews) | ||||
|
/s/ David J. Matlin
|
Director
|
February 27, 2017
|
||
| (David J. Matlin) | ||||
|
/s/ Robert E. Mellor
|
Director
|
February 27, 2017
|
||
| (Robert E. Mellor) | ||||
|
/s/ Norman J. Metcalfe
|
Director
|
February 27, 2017
|
||
| (Norman J. Metcalfe) | ||||
|
/s/ Peter Schoels
|
Director
|
February 27, 2017
|
||
| (Peter Schoels) | ||||
|
/s/ Charlotte St. Martin
|
Director
|
February 27, 2017
|
||
| (Charlotte St. Martin) |
INDEX TO EXHIBITS
|
X*2.1
|
Amended and Restated Agreement and Plan of Merger among Standard Pacific Corp. and The Ryland Group, Inc., included as Annex A to the joint proxy statement/prospectus forming a part of the Registrant's Registration Statement on Form S-4 filed July 2, 2015 and incorporated herein by reference.
|
|
|
*3.1
|
Third Amended and Restated Certificate of Incorporation of CalAtlantic Group, Inc. dated as of October 1, 2015, incorporated by reference to Exhibit 3.1 to the Registrant's Current Report on Form 8-K filed on October 5, 2015.
|
|
|
*3.2
|
Certificate of Designations of CalAtlantic Group, Inc. dated as of October 1, 2015, incorporated by reference to Exhibit 3.3 to the Registrant's Current Report on Form 8-K filed on October 5, 2015.
|
|
|
*3.3
|
Certificate of Designations of Series A Junior Participating Cumulative Preferred Stock of CalAtlantic Group, Inc., incorporated by reference to Exhibit 3.2 to the Registrant's Current Report on Form 8-K filed on August 19, 2008.
|
|
|
*3.4
|
Certificate of Designations of Series B Junior Participating Convertible Preferred Stock of CalAtlantic Group, Inc., incorporated by reference to Exhibit 3.3 to the Registrant's Current Report on Form 8-K filed on August 19, 2008.
|
|
|
*3.5
|
Amended and Restated Bylaws of CalAtlantic Group, Inc. dated as of October 1, 2015, incorporated by reference to Exhibit 3.2 to the Registrant's Current Report on Form 8-K filed on October 5, 2015.
|
|
|
*4.1
|
Form of Specimen Common Stock Certificate, incorporated by reference to Exhibit 4.4 to the Registrant's Registration Statement on Form S-3 (file no. 333-207309) filed on October 6, 2015.
|
|
|
*4.2
|
Amended and Restated Rights Agreement, dated as of December 20, 2011, between CalAtlantic Group, Inc. and Mellon Investor Services LLC, as Rights Agent, incorporated by reference to Exhibit 4.1 to the Registrant's Current Report on Form 8-K filed on December 22, 2011.
|
|
|
*4.3
|
Amendment No. 1 to Amended and Restated Rights Agreement, dated as of October 30, 2014, by and between CalAtlantic Group, Inc. and Computershare Inc. (as successor in interest to Mellon Investor Services LLC), as Rights Agent, incorporated by reference to Exhibit 4.1 to the Registrant's Current Report on Form 8-K filed on October 31, 2014.
|
|
|
*4.4
|
Senior Debt Securities Indenture, dated as of April 1, 1999, by and between Standard Pacific Corp. and The First National Bank of Chicago, as Trustee, incorporated by reference to Exhibit 4.1 to the Registrant's Current Report on Form 8-K filed on April 16, 1999.
|
|
|
*4.5
|
Eleventh Supplemental Indenture relating to the addition of certain of the Registrant's wholly owned subsidiaries as guarantors of all of the Company's outstanding senior notes (including the form of guaranty), dated as of February 22, 2006, by and between Standard Pacific Corp. and J.P. Morgan Trust Company, National Association, as Trustee, incorporated by reference to Exhibit 4.11 to the Registrant's Annual Report on Form 10-K for the year ended December 31, 2005.
|
|
|
*4.6
|
Thirteenth Supplemental Indenture, dated as of October 8, 2009, between Standard Pacific Corp. and The Bank of New York Mellon Trust Company, N.A., incorporated by reference to Exhibit 4.3 to the Registrant's Current Report on Form 8-K filed on October 9, 2009.
|
|
|
*4.7
|
Fourteenth Supplemental Indenture relating to the Registrant's 8⅜% Senior Notes due 2018, dated as of May 3, 2010, by and between Standard Pacific Corp. and The Bank of New York Mellon Trust Company, N.A., incorporated by reference to Exhibit 4.1 to the Registrant's Current Report on Form 8-K filed on May 3, 2010.
|
|
|
*4.8
|
Fifteenth Supplemental Indenture relating to the Registrant's 8⅜% Senior Notes due 2018, dated as of December 22, 2010, by and among Standard Pacific Corp., the subsidiary guarantors party thereto and The Bank of New York Mellon Trust Company, N.A., as trustee, incorporated by reference to Exhibit 4.1 to the Registrant's Current Report on Form 8-K filed on December 23, 2010.
|
|
|
*4.9
|
Sixteenth Supplemental Indenture relating to the Registrant's 8⅜% Senior Notes due 2021, dated as of December 22, 2010, by and among Standard Pacific Corp., the subsidiary guarantors party thereto and The Bank of New York Mellon Trust Company, N.A., as trustee, incorporated by reference to Exhibit 4.2 to the Registrant's Current Report on Form 8-K filed on December 23, 2010.
|
|
|
*4.10
|
Eighteenth Supplemental Indenture, dated as of August 6, 2012, relating to the Registrant's 1¼% Convertible Senior Notes due 2032, by and among Standard Pacific Corp., the guarantors thereto and The Bank of New York Mellon Trust Company, N.A, incorporated by reference to Exhibit 4.1 to the Registrant's Current Report on Form 8-K filed on August 6, 2012.
|
|
|
*4.11
|
Nineteenth Supplemental Indenture, dated as of August 6, 2012, by and among Standard Pacific Corp., the guarantors thereto and The Bank of New York Mellon Trust Company, N.A, incorporated by reference to Exhibit 4.2 to the Registrant's Current Report on Form 8-K filed on August 6, 2012.
|
|
|
*4.12
|
Twentieth Supplemental Indenture, dated as of August 6, 2013, by and among Standard Pacific Corp., the guarantors thereto and The Bank of New York Mellon Trust Company, N.A., incorporated by reference to Exhibit 4.1 to the Registrant's Current Report on Form 8-K filed on August 6, 2013.
|
|
|
*4.13
|
Twenty-First Supplemental Indenture, dated as of November 6, 2014, by and among Standard Pacific Corp., the guarantors thereto and The Bank of New York Mellon Trust Company, N.A., incorporated by reference to Exhibit 4.1 to the Registrant's Current Report on Form 8-K filed on November 6, 2014.
|
|
|
*4.14
|
Indenture dated as of June 28, 1996, between The Ryland Group, Inc. and The Bank of New York Mellon Trust Company, N.A., as successor to JPMorgan Chase Bank, N.A., formerly known as The Chase Manhattan Bank, incorporated by reference to Exhibit 4.1 to the Post-Effective Amendment No. 1 to the Form S-3 Registration Statement filed by The Ryland Group, Inc. on May 15, 1996 (No. 33-50933).
|
|
|
*4.15
|
Fifth Supplemental Indenture dated as of May 5, 2009, by and among The Ryland Group, Inc. and The Bank of New York Mellon Trust Company, N.A., as trustee, incorporated by reference to Exhibit 4.2 to the Current Report on Form 8-K filed by The Ryland Group, Inc. on May 5, 2009 (File No. 001-08029).
|
|
|
*4.16
|
Sixth Supplemental Indenture dated as of April 29, 2010, by and among The Ryland Group, Inc. and The Bank of New York Mellon Trust Company, N.A., as trustee, incorporated by reference to Exhibit 4.2 to the Current Report on Form 8-K filed by The Ryland Group, Inc. on April 29, 2010 (File No. 001-08029).
|
|
|
*4.17
|
Seventh Supplemental Indenture dated as of May 16, 2012 by and among The Ryland Group, Inc. and The Bank of New York Mellon Trust Company, N.A., as trustee, incorporated by reference to Exhibit 4.2 to the Current Report on Form 8-K filed by The Ryland Group, Inc. on May 16, 2012 (File No. 001-08029).
|
|
|
*4.18
|
Eighth Supplemental Indenture dated as of September 21, 2012, by and among The Ryland Group, Inc. and The Bank of New York Mellon Trust Company, N.A., as trustee, incorporated by reference to Exhibit 4.2 to the Current Report on Form 8-K filed by The Ryland Group, Inc. on September 21, 2012 (File No. 001-08029).
|
|
|
*4.19
|
Ninth Supplemental Indenture dated as of May 20, 2013, by and among The Ryland Group, Inc. and The Bank of New York Mellon Trust Company, N.A., as trustee, incorporated by reference to Exhibit 4.2 to the Current Report on Form 8-K filed by The Ryland Group, Inc. on May 20, 2013 (File No. 001-08029).
|
|
|
*4.20
|
Tenth Supplemental Indenture to the Indenture, dated as of June 28, 1996, by and between The Ryland Group, Inc. and The Bank of New York Mellon Trust Company, N.A. as trustee, incorporated by reference to Exhibit 4.2 to the Registrant's Current Report on Form 8-K filed on October 5, 2015.
|
|
|
*4.21
|
Eleventh Supplemental Indenture to the Indenture, dated as of June 28, 1996, by and between The Ryland Group, Inc. and The Bank of New York Mellon Trust Company, N.A. as trustee, incorporated by reference to Exhibit 4.3 to the Registrant's Current Report on Form 8-K filed on October 5, 2015.
|
|
|
*4.22
|
Twelfth Supplemental Indenture to the Indenture, dated as of June 28, 1996, by and between The Ryland Group, Inc. and The Bank of New York Mellon Trust Company, N.A. as trustee, incorporated by reference to Exhibit 4.4 to the Registrant's Current Report on Form 8-K filed on October 5, 2015.
|
|
|
*4.23
|
Thirteenth Supplemental Indenture to the Indenture, dated as of June 28, 1996, by and between The Ryland Group, Inc. and The Bank of New York Mellon Trust Company, N.A. as trustee, incorporated by reference to Exhibit 4.5 to the Registrant's Current Report on Form 8-K filed on October 5, 2015.
|
|
|
*4.24
|
Fourteenth Supplemental Indenture to the Indenture, dated as of June 28, 1996, by and between The Ryland Group, Inc. and The Bank of New York Mellon Trust Company, N.A. as trustee, incorporated by reference to Exhibit 4.6 to the Registrant's Current Report on Form 8-K filed on October 5, 2015.
|
|
|
*4.25
|
Fifteenth Supplemental Indenture to the Indenture, dated as of June 28, 1996, by and between The Ryland Group, Inc. and The Bank of New York Mellon Trust Company, N.A. as trustee, incorporated by reference to Exhibit 4.7 to the Registrant's Current Report on Form 8-K filed on October 5, 2015.
|
|
|
*4.26
|
Twenty-Second Supplemental Indenture to the Indenture, dated as of April 1, 1999, by and between Standard Pacific Corp. and The Bank of New York Mellon Trust Company N.A., as trustee, incorporated by reference to Exhibit 4.9 to the Registrant's Current Report on Form 8-K filed on October 5, 2015.
|
|
|
*4.27
|
Twenty-Third Supplemental Indenture to the Indenture, dated as of April 1, 1999, by and between Standard Pacific Corp. and The Bank of New York Mellon Trust Company N.A., as trustee, incorporated by reference to Exhibit 4.10 to the Registrant's Current Report on Form 8-K filed on October 5, 2015.
|
|
|
*4.28
|
Twenty-Fourth Supplemental Indenture to the Indenture, dated as of April 1, 1999, by and between Standard Pacific Corp. and The Bank of New York Mellon Trust Company N.A., as trustee, incorporated by reference to Exhibit 4.11 to the Registrant's Current Report on Form 8-K filed on October 5, 2015.
|
|
|
*4.29
|
Twenty-Fifth Supplemental Indenture to the Indenture, dated as of April 1, 1999, by and between Standard Pacific Corp. and The Bank of New York Mellon Trust Company N.A., as trustee, incorporated by reference to Exhibit 4.12 to the Registrant's Current Report on Form 8-K filed on October 5, 2015.
|
|
|
*4.30
|
Twenty-Sixth Supplemental Indenture to the Indenture, dated as of April 1, 1999, by and between Standard Pacific Corp. and The Bank of New York Mellon Trust Company N.A., as trustee, incorporated by reference to Exhibit 4.13 to the Registrant's Current Report on Form 8-K filed on October 5, 2015.
|
|
|
*4.31
|
Twenty-Seventh Supplemental Indenture to the Indenture, dated as of April 1, 1999, by and among CalAtlantic Group, Inc. and The Bank of New York Mellon Trust Company, N.A., as trustee, incorporated by reference to Exhibit 4.1 to the Registrant's Current Report on Form 8-K filed on May 31, 2016.
|
|
|
*4.32
|
Guarantee of 8.4% Senior Notes due 2017 issued pursuant to the Indenture dated as of June 28, 1996, by and between The Ryland Group, Inc. and The Bank of New York Mellon Trust Company, N.A. as trustee, incorporated by reference to Exhibit 4.14 to the Registrant's Current Report on Form 8-K filed on October 5, 2015.
|
|
|
*4.33
|
Guarantee of 0.25% Convertible Senior Notes due 2019 issued pursuant to the Indenture dated as of June 28, 1996, by and between The Ryland Group, Inc. and The Bank of New York Mellon Trust Company, N.A. as trustee, incorporated by reference to Exhibit 4.15 to the Registrant's Current Report on Form 8-K filed on October 5, 2015.
|
|
|
*4.34
|
Guarantee of 1.625% Convertible Senior Notes due 2018 issued pursuant to the Indenture dated as of June 28, 1996, by and between The Ryland Group, Inc. and The Bank of New York Mellon Trust Company, N.A. as trustee, incorporated by reference to Exhibit 4.16 to the Registrant's Current Report on Form 8-K filed on October 5, 2015.
|
|
|
*4.35
|
Guarantee of 10.75% Senior Notes due 2016 issued pursuant to the Indenture dated as of September 17, 2009, by and between Standard Pacific Escrow LLC (obligations assumed by the Registrant pursuant to the First Supplemental Indenture) and The Bank of New York Mellon Trust Company, N.A., as trustee, incorporated by reference to Exhibit 4.17 to the Registrant's Current Report on Form 8-K filed on October 5, 2015.
|
|
|
*4.36
|
Guarantee of 5.37% Senior Notes due 2022 issued pursuant to the Indenture dated as of June 28, 1996, by and between The Ryland Group, Inc. and The Bank of New York Mellon Trust Company, N.A. as trustee, incorporated by reference to Exhibit 4.18 to the Registrant's Current Report on Form 8-K filed on October 5, 2015.
|
|
|
*4.37
|
Guarantee of 6.625% Senior Notes due 2020 issued pursuant to the Indenture dated as of June 28, 1996, by and between The Ryland Group, Inc. and The Bank of New York Mellon Trust Company, N.A. as trustee, incorporated by reference to Exhibit 4.19 to the Registrant's Current Report on Form 8-K filed on October 5, 2015.
|
|
|
+*10.1
|
Amended and Restated Stockholders Agreement, by and between MP CA Homes LLC and CalAtlantic Group, Inc., dated June 14, 2015, incorporated by reference to Exhibit 10.1 to the Registrant's Current Report on Form 8-K filed on June 15, 2015.
|
|
|
+*10.2
|
2000 Stock Incentive Plan of CalAtlantic Group, Inc., as amended and restated, effective May 12, 2004, incorporated by reference to Appendix A to the Registrant's Definitive Proxy Statement for the 2004 Annual Meeting of Stockholders.
|
|
|
+*10.3
|
CalAtlantic Group, Inc. 2005 Stock Incentive Plan, incorporated by reference to Exhibit 10.1 to the Registrant's Current Report on Form 8-K filed on May 11, 2005.
|
|
|
+*10.4
|
CalAtlantic Group, Inc. 2008 Equity Incentive Plan (as amended and restated May 18, 2011), incorporated by reference to Appendix A to the Registrant's Definitive Proxy Statement for the 2011 Annual Meeting of Stockholders.
|
|
|
+*10.5
|
Standard Terms and Conditions for Non-Qualified Stock Options to be used in connection with CalAtlantic Group, Inc.'s equity incentive plan, incorporated by reference to Exhibit 10.28 to the Registrant's Annual Report on Form 10-K for the year ended December 31, 2008.
|
|
|
+*10.6
|
Standard Terms and Conditions for Non-Qualified Stock Options to be used in connection with CalAtlantic Group, Inc.'s equity incentive plan, incorporated by reference to Exhibit 10.29 to the Registrant's Annual Report on Form 10-K for the year ended December 31, 2008.
|
|
|
+*10.7
|
Standard Terms and Conditions for Capped Stock Appreciation Rights, incorporated by reference to Exhibit 10.1 to the Registrant's Current Report on Form 8-K filed on March 14, 2012.
|
|
|
+*10.8
|
Standard Terms and Conditions for Restricted Stock Grants, incorporated by reference to Exhibit 10.2 to the Registrant's Current Report on Form 8-K filed on March 14, 2012.
|
|
|
+*10.9
|
Standard Terms and Conditions for Performance Share Awards, incorporated by reference to Exhibit 10.3 to the Registrant's Current Report on Form 8-K filed on March 14, 2012.
|
|
|
+*10.10
|
Form of Executive Officers Indemnification Agreement, incorporated by reference to Exhibit 10.34 to the Registrant's Annual Report on Form 10-K for the year ended December 31, 2007.
|
|
|
+*10.11
|
Form of Severance and Change in Control Protection Agreement, incorporated by reference to Exhibit 10.4 to the Registrant's Current Report on Form 8-K filed on March 14, 2012.
|
|
|
+*10.12
|
CalAtlantic Group, Inc. 2014 Omnibus Incentive Compensation Plan, incorporated by reference to Appendix A to the Registrant's Definitive Proxy Statement for the 2014 Annual Meeting of Stockholders.
|
|
|
+*10.13
|
Description of CEO compensation changes, incorporated by reference to the Registrant's Current Report on Form 8-K filed with the Securities and Exchange Commission on August 1, 2014.
|
|
|
*10.14
|
Credit Agreement, dated as of October 5, 2015, among CalAtlantic Group, Inc., the lenders or other financial institutions that are parties as lenders, and JPMorgan Chase Bank, N.A., as administrative agent , incorporated by reference to Exhibit 4.1 to the Registrant's Current Report on Form 8-K filed on October 5, 2015.
|
|
|
+*10.15
|
Amendment and Restatement of The Ryland Group, Inc. 2008 Equity Incentive Plan, incorporated by reference to Exhibit 10.11 of the Annual Report on Form 10-K for the year ended December 31, 2008 filed by The Ryland Group, Inc. (File No. 001-08029).
|
|
|
+*10.16
|
The Ryland Group, Inc. 2011 Equity and Incentive Plan, incorporated by reference to Exhibit 99 to the Current Report on Form 8-K filed by The Ryland Group, Inc. on March 24, 2011 (File No. 001-08029).
|
|
|
+*10.17
|
The Ryland Group, Inc. Executive and Director Deferred Compensation Plan II, incorporated by reference to Exhibit 10.30 of the Annual Report on Form 10-K for the year ended December 31, 2008 filed by The Ryland Group, Inc. (File No. 001-08029).
|
|
|
+*10.18
|
The Ryland Group, Inc. 2004 Non-Employee Director Equity Plan, incorporated by reference to Exhibit 10.15 of the Quarterly Report on Form 10-Q for the quarter ended March 31, 2004 filed by The Ryland Group, Inc. (File No. 001-08029).
|
|
|
+*10.19
|
Employment Agreement, dated as of June 14, 2015, by and between CalAtlantic Group, Inc. and Scott D. Stowell, incorporated by reference to Exhibit 10.2 to the Registrant's Current Report on Form 8-K filed on June 15, 2015.
|
|
|
+*10.20
|
Employment Agreement, dated as of June 14, 2015, by and between CalAtlantic Group, Inc. and Larry T. Nicholson, incorporated by reference to Exhibit 10.2 to the Registrant's Current Report on Form 8-K filed on June 15, 2015.
|
|
|
+*10.21
|
CalAtlantic Group, Inc. Deferred Compensation Plan, incorporated by reference to Exhibit 4.7 to the Form S-8 Registration Statement filed by the Registrant on May 25, 2016 (No. 333-2115826).
|
|
|
21.1
|
Subsidiaries of the Registrant.
|
|
|
23.1
|
Consent of Ernst & Young LLP, Independent Registered Public Accounting Firm.
|
|
|
24.1
|
Powers of Attorney. See Signatures page.
|
|
|
31.1
|
Certification of the CEO pursuant to Section 302 of the Sarbanes-Oxley Act of 2002.
|
|
|
31.2
|
Certification of the CFO pursuant to Section 302 of the Sarbanes-Oxley Act of 2002.
|
|
|
32.1
|
Certification of CEO and CFO pursuant to 18 U.S.C. Section 1350, as adopted pursuant to Section 906 of the
Sarbanes–Oxley Act of 2002.
|
|
|
101
|
The following materials from CalAtlantic Group, Inc.'s Annual Report on Form 10-K for the year ended December 31, 2016, formatted in eXtensible Business Reporting Language (XBRL): (i) Consolidated Statements of Operations, (ii) Consolidated Statements of Comprehensive Income, (iii) Consolidated Balance Sheets, (iv) Consolidated Statements of Stockholders' Equity, (v) Consolidated Statements of Cash Flows, and (vi) Notes to Consolidated Financial Statements.
|
________________
| (*) |
Previously filed.
|
| (+) |
Management contract, compensation plan or arrangement.
|
| (X) |
The annexes, schedules and certain exhibits have been omitted pursuant to Item 601(b)(2) of Regulation S-K. The Registrant will furnish copies of any such schedules to the U.S. Securities and Exchange Commission upon request.
|
91