Attached files
| file | filename |
|---|---|
| 8-K - 8-K - STORE CAPITAL Corp | a17-7075_28k.htm |
Exhibit 99.1
[LOGO]
Disclaimer This presentation contains forward-looking statements within the meaning of Section 27A of the Securities Act of 1933, as amended, or the Securities Act, and Section 21E of the Securities Exchange Act of 1934, as amended, or the Exchange Act. Such forward-looking statements include, without limitation, statements concerning our business and growth strategies, investment, financing and leasing activities and trends in our business, including trends in the market for long-term, triple-net leases of freestanding, single-tenant properties. Words such as “expects,” “anticipates,” “intends,” “plans,” “likely,” “will,” “believes,” “seeks,” “estimates,” and variations of such words and similar expressions are intended to identify such forward-looking statements. Such statements involve known and unknown risks, uncertainties and other factors which may cause our actual results, performance or achievements to be materially different from the results of operations or plans expressed or implied by such forward-looking statements. Although we believe that the assumptions underlying the forward-looking statements contained herein are reasonable, any of the assumptions could be inaccurate, and therefore such statements included in this presentation may not prove to be accurate. In light of the significant uncertainties inherent in the forward-looking statements included herein, the inclusion of such information should not be regarded as a representation by us or any other person that the results or conditions described in such statements or our objectives and plans will be achieved. Furthermore, actual results may differ materially from those described in the forward-looking statements and may be affected by a variety of risks and factors including, without limitation, the risks described in our Annual Report on Form 10-K for the fiscal year ended December 31, 2016 and subsequent quarterly reports on form 10-Q. Forward-looking statements set forth herein speak only as of the date hereof, and we expressly disclaim any obligation or undertaking to update or revise any forward-looking statement contained herein, to reflect any change in our expectations with regard thereto, or any other change in events, conditions or circumstances on which any such statement is based, except to the extent otherwise required by law. THIS PRESENTATION CONTAINS HISTORICAL PERFORMANCE INFORMATION REGARDING STORE CAPITAL, AS WELL AS OTHER COMPANIES PREVIOUSLY MANAGED BY OUR SENIOR EXECUTIVE TEAM. SUCH PAST PERFORMANCE IS NOT A GUARANTEE OF FUTURE RESULTS. This presentation contains references to our copyrights, trademarks and service marks and to those belonging to other entities. Solely for convenience, copyrights, trademarks, trade names and service marks referred to in this presentation may appear without the © or ® or TM or SM symbols, but such references are not intended to indicate, in any way, that we will not assert, to the fullest extent under applicable law, our rights or the rights of the applicable licensor to these copyrights, trademarks, trade names and service marks. We do not intend our use or display of other companies’ trade names, copyrights, trademarks or service marks to imply a relationship with, or endorsement or sponsorship of us by, any other companies. Definitions and footnotes for data provided herein are provided in the appendix section of this presentation. Unless otherwise indicated, data provided herein is dated as of December 31, 2016. 2
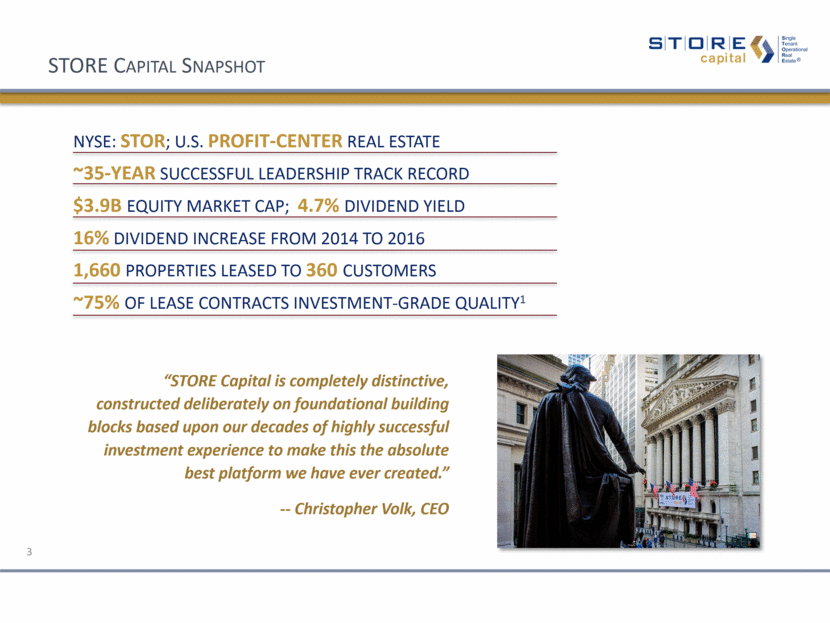
STORE Capital Snapshot NYSE: STOR; U.S. PROFIT-CENTER REAL ESTATE ~35-YEAR SUCCESSFUL LEADERSHIP TRACK RECORD $3.9B EQUITY MARKET CAP; 4.7% DIVIDEND YIELD 16% DIVIDEND INCREASE FROM 2014 TO 2016 1,660 PROPERTIES LEASED TO 360 CUSTOMERS ~75% OF LEASE CONTRACTS INVESTMENT-GRADE QUALITY1 “STORE Capital is completely distinctive, constructed deliberately on foundational building blocks based upon our decades of highly successful investment experience to make this the absolute best platform we have ever created.” -- Christopher Volk, CEO 3
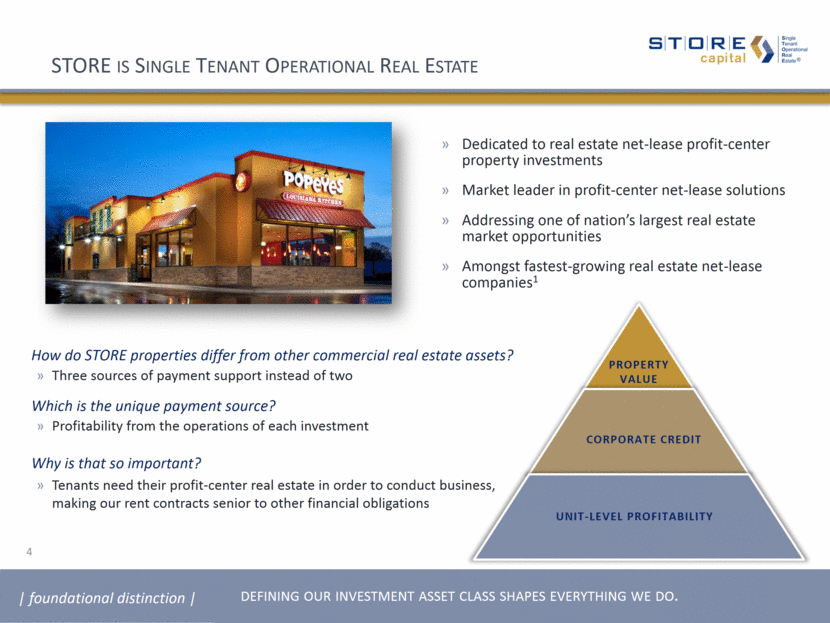
Dedicated to real estate net-lease profit-center property investments Market leader in profit-center net-lease solutions Addressing one of nation’s largest real estate market opportunities Amongst fastest-growing real estate net-lease companies1 Why is that so important? Tenants need their profit-center real estate in order to conduct business, making our rent contracts senior to other financial obligations Which is the unique payment source? Profitability from the operations of each investment How do STORE properties differ from other commercial real estate assets? Three sources of payment support instead of two PROPERTY VALUE CORPORATE CREDIT UNIT-LEVEL PROFITABILITY STORE is Single Tenant Operational Real Estate foundational distinction defining our investment asset class shapes everything we do. 4
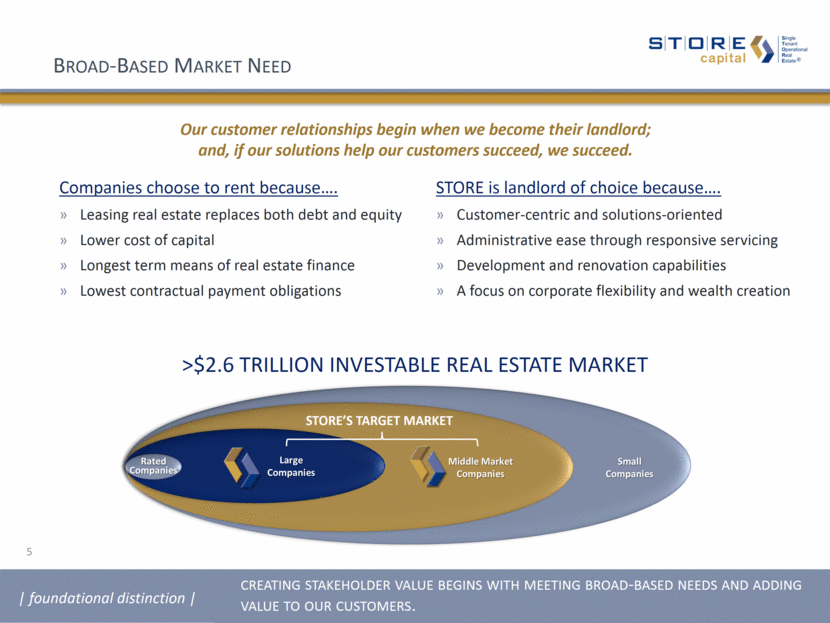
Broad-Based Market Need 5 Rated Large Middle Market >$2.6 TRILLION INVESTABLE REAL ESTATE MARKET Companies choose to rent because . Leasing real estate replaces both debt and equity Lower cost of capital Longest term means of real estate finance Lowest contractual payment obligations STORE is landlord of choice because . Customer-centric and solutions-oriented Administrative ease through responsive servicing Development and renovation capabilities A focus on corporate flexibility and wealth creation Our customer relationships begin when we become their landlord; and, if our solutions help our customers succeed, we succeed. foundational distinction creating stakeholder value begins with meeting broad-based needs and adding value to our customers. 5 Small Companies Middle Market Companies Large Companies Rated Companies STORE’s Target market
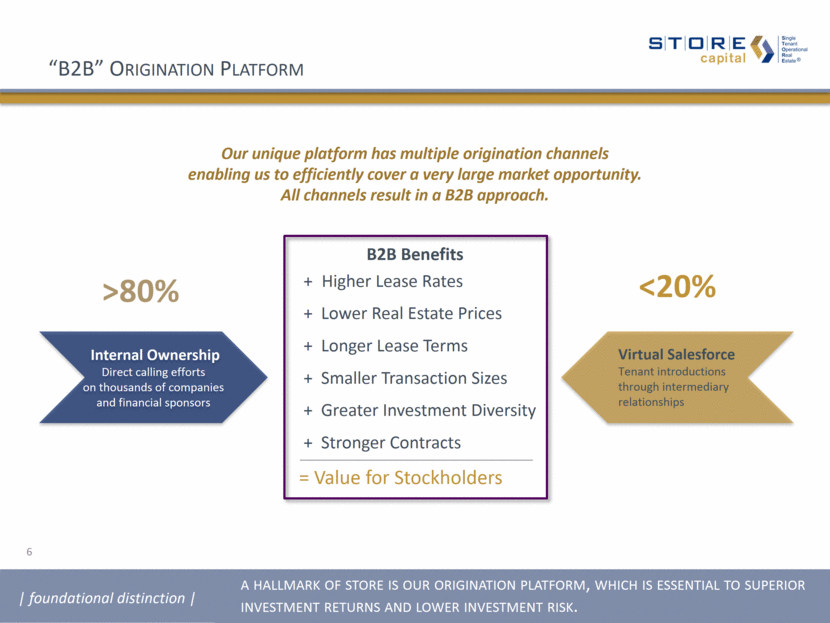
Internal Ownership Direct calling efforts on thousands of companies and financial sponsors >80% <20% B2B Benefits + Higher Lease Rates + Lower Real Estate Prices + Longer Lease Terms + Smaller Transaction Sizes + Greater Investment Diversity + Stronger Contracts Our unique platform has multiple origination channels enabling us to efficiently cover a very large market opportunity. All channels result in a B2B approach. foundational distinction a hallmark of store is our origination platform, which is essential to superior investment returns and lower investment risk. “B2B” Origination Platform Virtual Salesforce Tenant introductions through intermediary relationships = Value for Stockholders 6
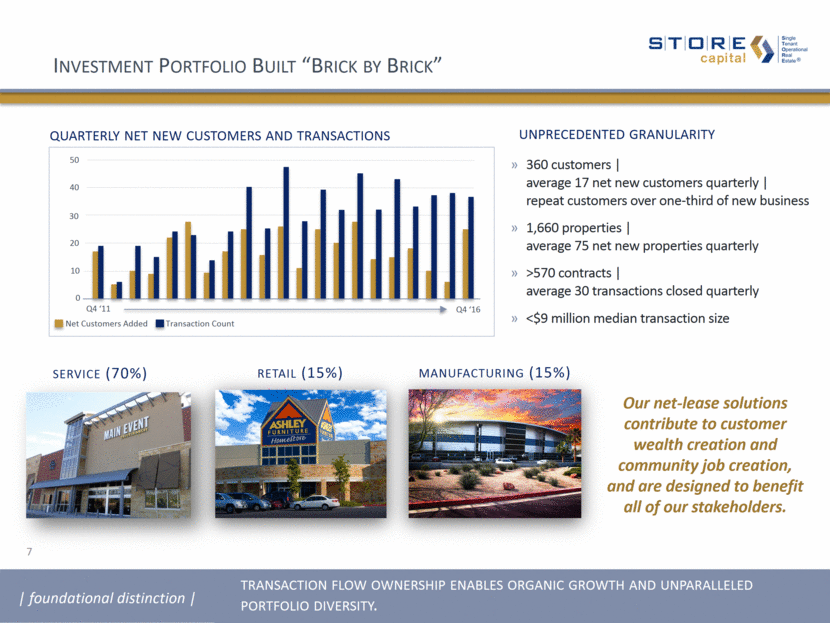
Investment Portfolio Built “Brick by Brick” 360 customers average 17 net new customers quarterly repeat customers over one-third of new business 1,660 properties average 75 net new properties quarterly >570 contracts average 30 transactions closed quarterly <$9 million median transaction size quarterly net new customers and transactions unprecedented granularity Our net-lease solutions contribute to customer wealth creation and community job creation, and are designed to benefit all of our stakeholders. service (70%) retail (15%) manufacturing (15%) foundational distinction transaction flow ownership enables organic growth and unparalleled portfolio diversity. Q4 ‘11 Q4 ‘16 50 40 30 20 10 0 Net Customers Added Transaction Count 7
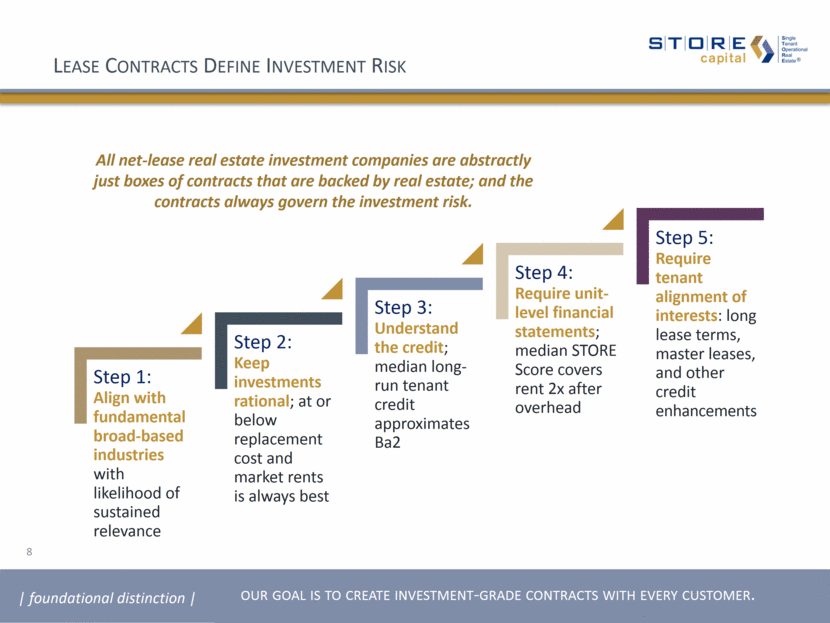
Lease Contracts Define Investment Risk All net-lease real estate investment companies are abstractly just boxes of contracts that are backed by real estate; and the contracts always govern the investment risk. foundational distinction our goal is to create investment-grade contracts with every customer. 8 Step 1: Align with fundamental broad-based industries with likelihood of sustained relevance Step 2: Keep investments rational; at or below replacement cost and market rents is always best Step 3: Understand the credit; median long-run tenant credit approximates Ba2 Step 4: Require unit-level financial statements; median STORE Score covers rent 2x after overhead Step 5: Require tenant alignment of interests: long lease terms, master leases, and other credit enhancements
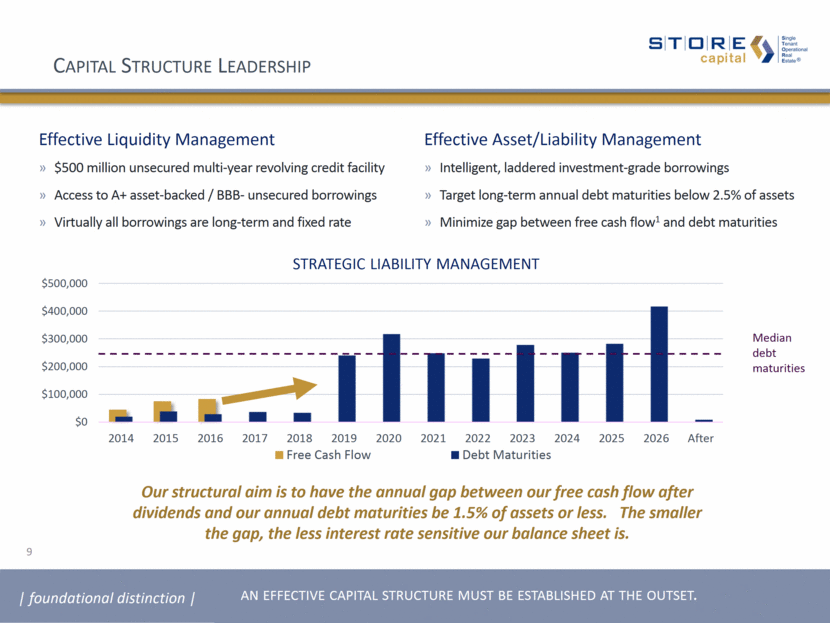
Capital Structure Leadership foundational distinction an effective capital structure must be established at the outset. 9 Effective Liquidity Management $500 million unsecured multi-year revolving credit facility Access to A+ asset-backed / BBB- unsecured borrowings Virtually all borrowings are long-term and fixed rate Effective Asset/Liability Management Intelligent, laddered investment-grade borrowings Target long-term annual debt maturities below 2.5% of assets Minimize gap between free cash flow1 and debt maturities Median debt maturities strategic liability management Our structural aim is to have the annual gap between our free cash flow after dividends and our annual debt maturities be 1.5% of assets or less. The smaller the gap, the less interest rate sensitive our balance sheet is. $0 $100,000 $200,000 $300,000 $400,000 $500,000 2014 2015 2016 2017 2018 2019 2020 2021 2022 2023 2024 2025 2026 After Free Cash Flow Debt Maturities
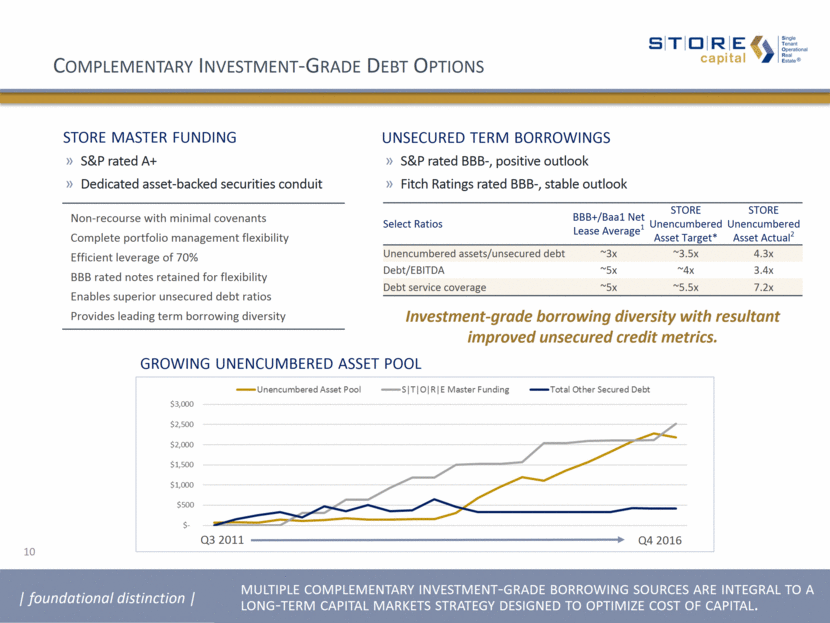
Complementary Investment-Grade Debt Options growing unencumbered asset pool store master funding S&P rated A+ Dedicated asset-backed securities conduit unsecured term borrowings foundational distinction multiple complementary investment-grade borrowing sources are integral to a long-term capital markets strategy designed to optimize cost of capital. S&P rated BBB-, positive outlook Fitch Ratings rated BBB-, stable outlook Q3 2011 Q4 2016 10 Non-recourse with minimal covenants Complete portfolio management flexibility Efficient leverage of 70% BBB rated notes retained for flexibility Enables superior unsecured debt ratios Provides leading term borrowing diversity Select Ratios BBB+/Baa1 Net Lease Average1 STORE Unencumbered Asset Target* STORE Unencumbered Asset Actual2 Unencumbered assets/unsecured debt ~3x ~3.5x 4.3x Debt/EBITDA ~5x ~4x 3.4x Debt service coverage ~5x ~5.5x 7.2x Investment-grade borrowing diversity with resultant improved unsecured credit metrics.
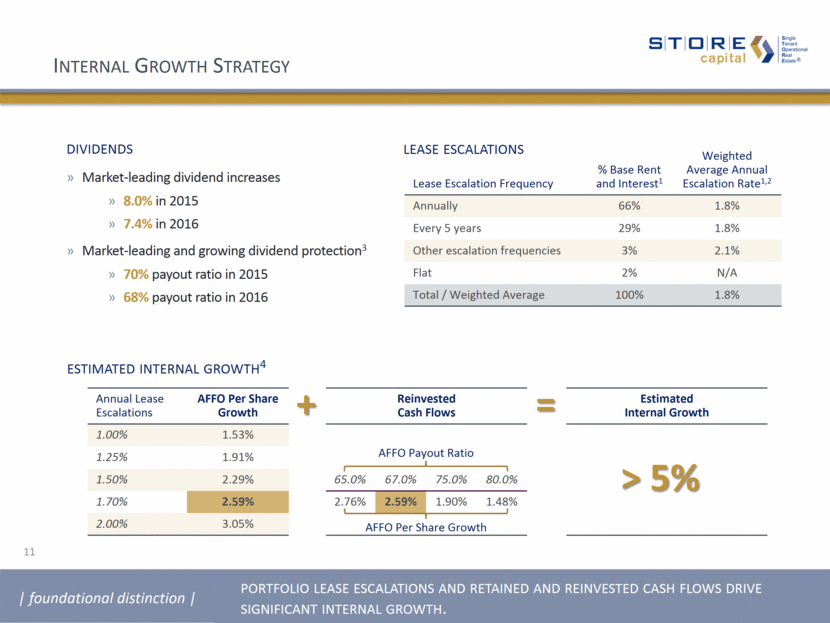
11 Internal Growth Strategy Lease Escalation Frequency % Base Rent and Interest1 Weighted Average Annual Escalation Rate1,2 Annually 66% 1.8% Every 5 years 29% 1.8% Other escalation frequencies 3% 2.1% Flat 2% N/A Total / Weighted Average 100% 1.8% lease escalations dividends Market-leading dividend increases 8.0% in 2015 7.4% in 2016 Market-leading and growing dividend protection3 70% payout ratio in 2015 68% payout ratio in 2016 Annual Lease Escalations AFFO Per Share Growth 1.00% 1.53% 1.25% 1.91% 1.50% 2.29% 1.70% 2.59% 2.00% 3.05% + Reinvested Cash Flows 65.0% 67.0% 75.0% 80.0% 2.76% 2.59% 1.90% 1.48% = Estimated Internal Growth > 5% foundational distinction portfolio lease escalations and retained and reinvested cash flows drive significant internal growth. 11 estimated internal growth4 AFFO Payout Ratio AFFO Per Share Growth
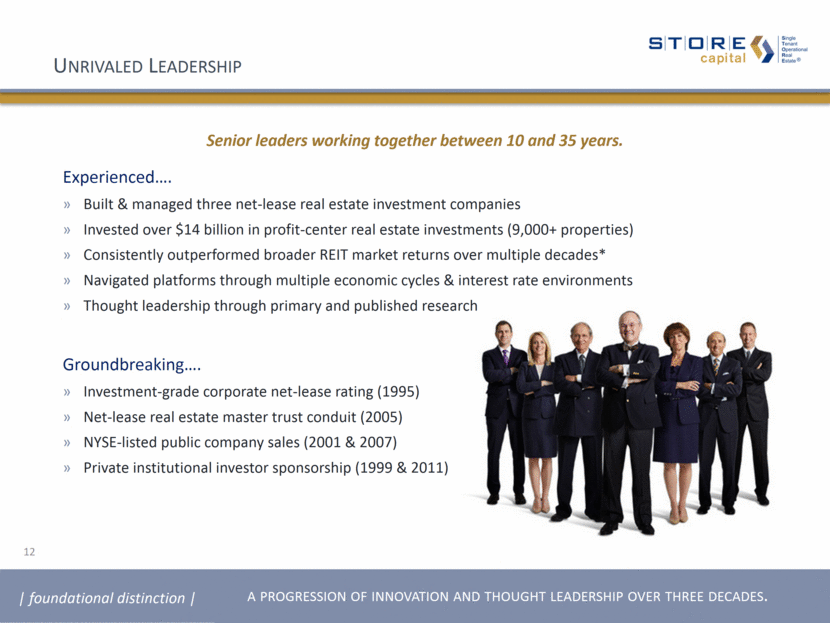
12 Unrivaled Leadership Experienced . Built & managed three net-lease real estate investment companies Invested over $14 billion in profit-center real estate investments (9,000+ properties) Consistently outperformed broader REIT market returns over multiple decades* Navigated platforms through multiple economic cycles & interest rate environments Thought leadership through primary and published research Groundbreaking . Investment-grade corporate net-lease rating (1995) Net-lease real estate master trust conduit (2005) NYSE-listed public company sales (2001 & 2007) Private institutional investor sponsorship (1999 & 2011) foundational distinction a progression of innovation and thought leadership over three decades. 12 Senior leaders working together between 10 and 35 years.
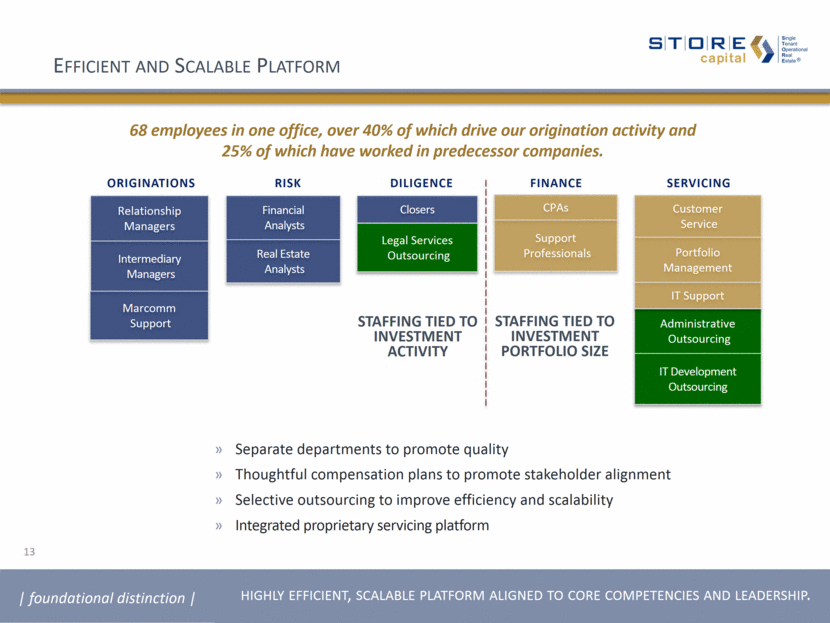
68 employees in one office, over 40% of which drive our origination activity and 25% of which have worked in predecessor companies. originations servicing diligence finance risk Relationship Managers Intermediary Managers Closers Financial Analysts Real Estate Analysts CPAs Support Professionals Customer Service Portfolio Management Administrative Outsourcing IT Development Outsourcing IT Support Legal Services Outsourcing Marcomm Support Separate departments to promote quality Thoughtful compensation plans to promote stakeholder alignment Selective outsourcing to improve efficiency and scalability Integrated proprietary servicing platform Efficient and Scalable Platform foundational distinction highly efficient, scalable platform aligned to core competencies and leadership. staffing tied to investment activity staffing tied to investment portfolio size 13
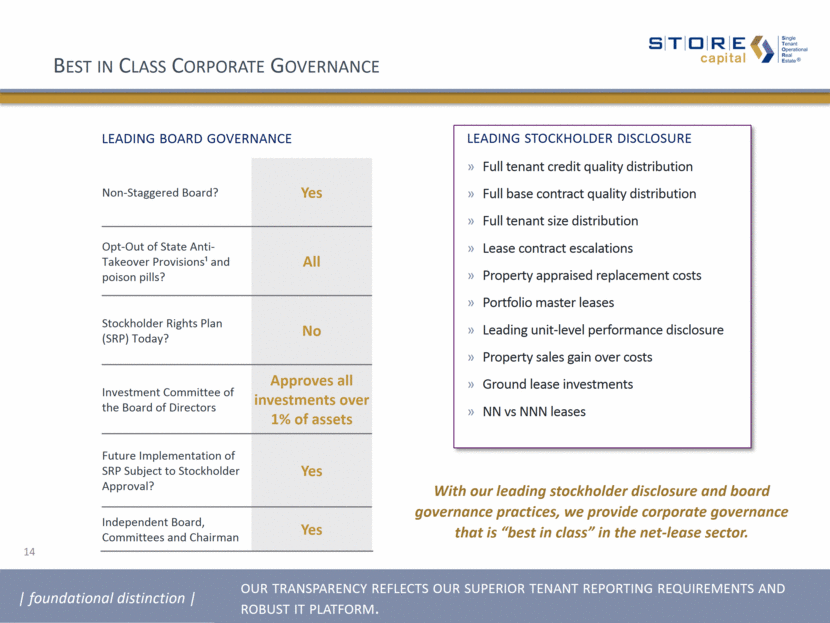
Best in Class Corporate Governance Non-Staggered Board? Yes Opt-Out of State Anti-Takeover Provisions¹ and poison pills? All Stockholder Rights Plan (SRP) Today? No Investment Committee of the Board of Directors Approves all investments over 1% of assets Future Implementation of SRP Subject to Stockholder Approval? Yes Independent Board, Committees and Chairman Yes leading board governance leading stockholder disclosure Full tenant credit quality distribution Full base contract quality distribution Full tenant size distribution Lease contract escalations Property appraised replacement costs Portfolio master leases Leading unit-level performance disclosure Property sales gain over costs Ground lease investments NN vs NNN leases With our leading stockholder disclosure and board governance practices, we provide corporate governance that is “best in class” in the net-lease sector. foundational distinction our transparency reflects our superior tenant reporting requirements and robust it platform. 14
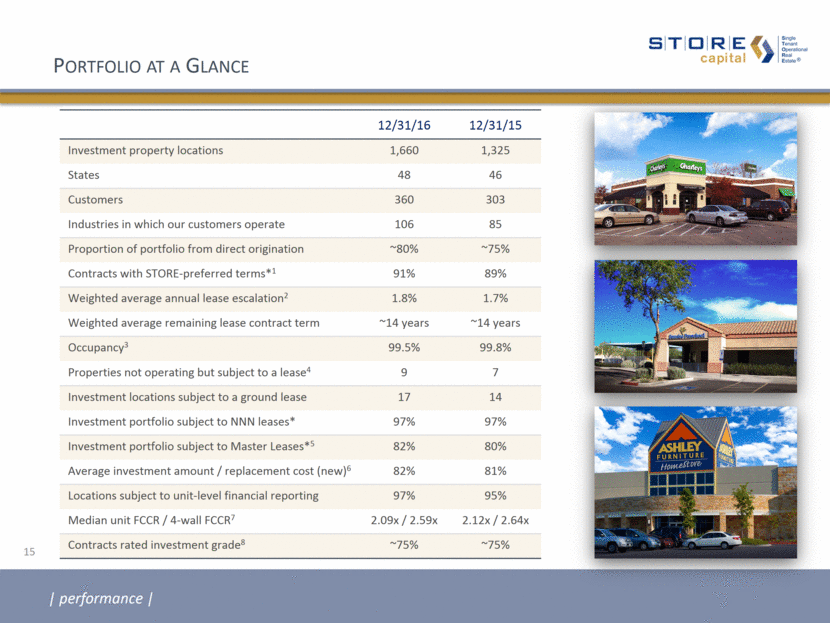
Portfolio at a Glance 12/31/16 12/31/15 Investment property locations 1,660 1,325 States 48 46 Customers 360 303 Industries in which our customers operate 106 85 Proportion of portfolio from direct origination ~80% ~75% Contracts with STORE-preferred terms*1 91% 89% Weighted average annual lease escalation2 1.8% 1.7% Weighted average remaining lease contract term ~14 years ~14 years Occupancy3 99.5% 99.8% Properties not operating but subject to a lease4 9 7 Investment locations subject to a ground lease 17 14 Investment portfolio subject to NNN leases* 97% 97% Investment portfolio subject to Master Leases*5 82% 80% Average investment amount / replacement cost (new)6 82% 81% Locations subject to unit-level financial reporting 97% 95% Median unit FCCR / 4-wall FCCR7 2.09x / 2.59x 2.12x / 2.64x Contracts rated investment grade8 ~75% ~75% performance 15
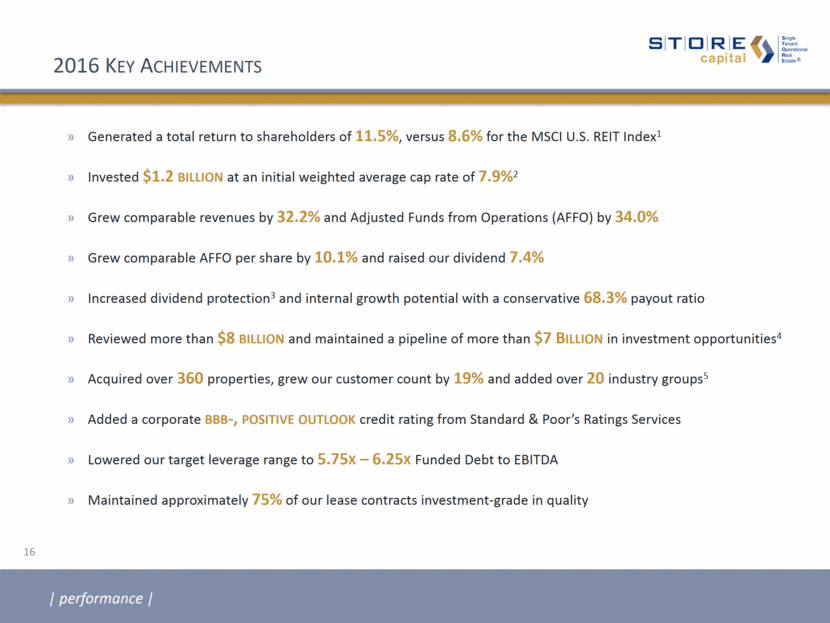
2016 Key Achievements Generated a total return to shareholders of 11.5%, versus 8.6% for the MSCI U.S. REIT Index1 Invested $1.2 billion at an initial weighted average cap rate of 7.9%2 Grew comparable revenues by 32.2% and Adjusted Funds from Operations (AFFO) by 34.0% Grew comparable AFFO per share by 10.1% and raised our dividend 7.4% Increased dividend protection3 and internal growth potential with a conservative 68.3% payout ratio Reviewed more than $8 billion and maintained a pipeline of more than $7 Billion in investment opportunities4 Acquired over 360 properties, grew our customer count by 19% and added over 20 industry groups5 Added a corporate bbb-, positive outlook credit rating from Standard & Poor’s Ratings Services Lowered our target leverage range to 5.75x – 6.25x Funded Debt to EBITDA Maintained approximately 75% of our lease contracts investment-grade in quality performance 16
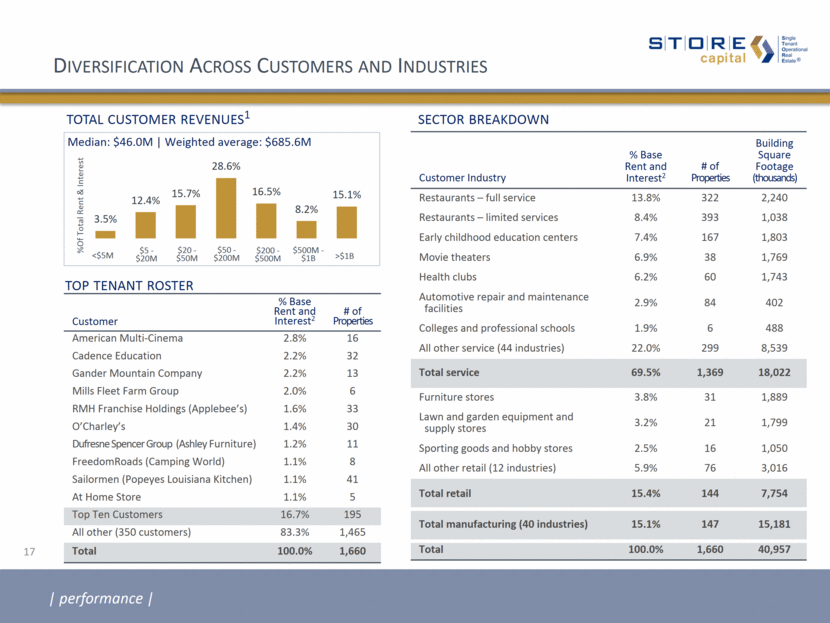
Diversification Across Customers and Industries Customer Industry % Base Rent and Interest2 # of Properties Building Square Footage (thousands) Restaurants – full service 13.8% 322 2,240 Restaurants – limited services 8.4% 393 1,038 Early childhood education centers 7.4% 167 1,803 Movie theaters 6.9% 38 1,769 Health clubs 6.2% 60 1,743 Automotive repair and maintenance facilities 2.9% 84 402 Colleges and professional schools 1.9% 6 488 All other service (44 industries) 22.0% 299 8,539 Total service 69.5% 1,369 18,022 Furniture stores 3.8% 31 1,889 Lawn and garden equipment and supply stores 3.2% 21 1,799 Sporting goods and hobby stores 2.5% 16 1,050 All other retail (12 industries) 5.9% 76 3,016 Total retail 15.4% 144 7,754 Total manufacturing (40 industries) 15.1% 147 15,181 Total 100.0% 1,660 40,957 total customer revenues1 Median: $46.0M Weighted average: $685.6M %Of Total Rent & Interest Customer % Base Rent and Interest2 # of Properties American Multi-Cinema 2.8% 16 Cadence Education 2.2% 32 Gander Mountain Company 2.2% 13 Mills Fleet Farm Group 2.0% 6 RMH Franchise Holdings (Applebee’s) 1.6% 33 O’Charley’s 1.4% 30 Dufresne Spencer Group (Ashley Furniture) 1.2% 11 FreedomRoads (Camping World) 1.1% 8 Sailormen (Popeyes Louisiana Kitchen) 1.1% 41 At Home Store 1.1% 5 Top Ten Customers 16.7% 195 All other (350 customers) 83.3% 1,465 Total 100.0% 1,660 top tenant roster sector breakdown performance 17 <$5M $5 - $20M $20 - $50M $50 - $200M $200 - $500M $500M - $1B >$1B 3.5% 12.4% 15.7% 28.6% 16.5% 8.2% 15.1% 0 0.2 0.4
Diversification Across Geographies* performance 18
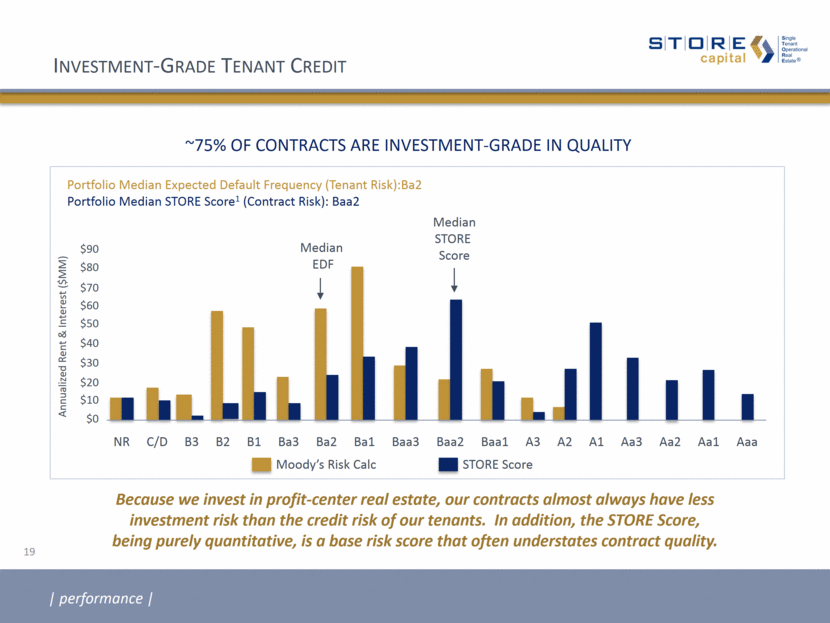
Investment-Grade Tenant Credit ~75% OF CONTRACTS ARE INVESTMENT-GRADE IN QUALITY Because we invest in profit-center real estate, our contracts almost always have less investment risk than the credit risk of our tenants. In addition, the STORE Score, being purely quantitative, is a base risk score that often understates contract quality. performance NR C/D B3 B2 B1 Ba3 Ba2 Ba1 Baa3 Baa2 Baa1 A3 A2 A1 Aa3 Aa2 Aa1 Aaa Median EDF Median STORE Score Annualized Rent & Interest ($MM) $90 $80 $70 $60 $50 $40 $30 $20 $10 $0 Portfolio Median Expected Default Frequency (Tenant Risk):Ba2 Portfolio Median STORE Score1 (Contract Risk): Baa2 Moody’s Risk Calc STORE Score 19
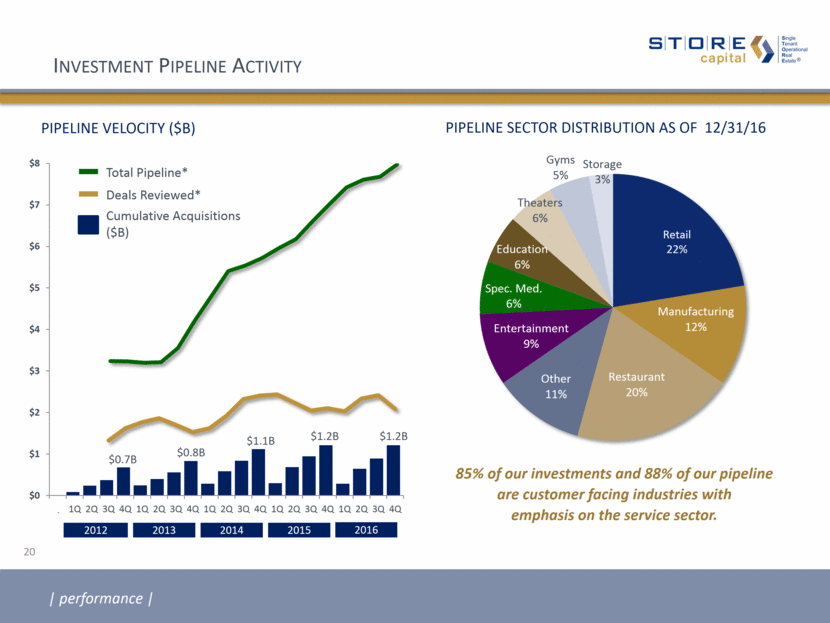
performance PIPELINE VELOCITY ($B) Total Pipeline* Deals Reviewed* Cumulative Acquisitions ($B) 2012 2013 2014 2015 2016 Storage 3% PIPELINE SECTOR DISTRIBUTION AS OF 12/31/16 Spec. Med. 6% Investment Pipeline Activity 20 performance Restaurant 20% Manufacturing 12% Theaters 6% Other 11% Retail 22% Entertainment 9% Gyms 5% Education 6% 85% of our investments and 88% of our pipeline are customer facing industries with emphasis on the service sector. $0 $1 $2 $3 $4 $5 $6 $7 $8 Q4 1Q 2Q 3Q 4Q 1Q 2Q 3Q 4Q 1Q 2Q 3Q 4Q 1Q 2Q 3Q 4Q 1Q 2Q 3Q 4Q $0.7B $0.8B $1.1B $1.2B $1.2B
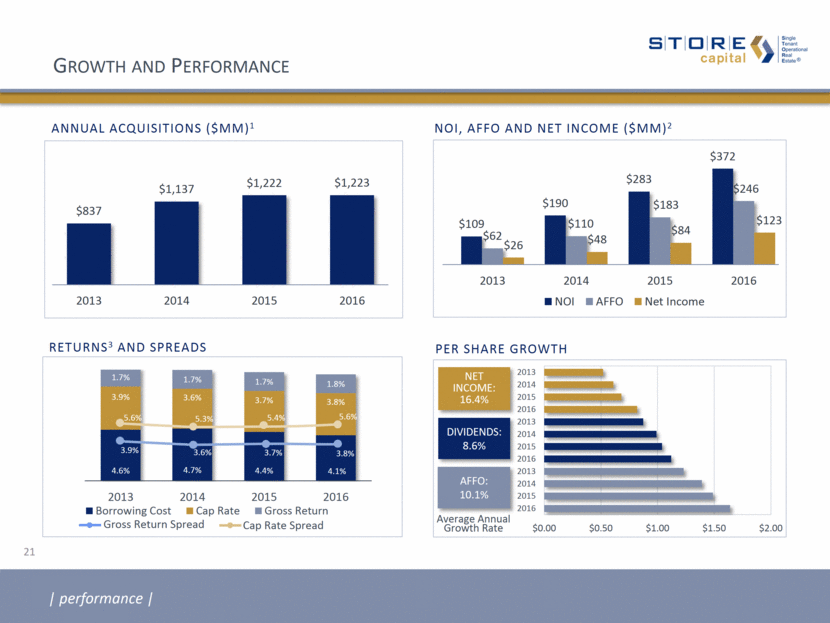
NOI, AFFO AND NET INCOME ($MM)2 Growth and Performance performance PER SHARE GROWTH 21 NET INCOME: 16.4% DIVIDENDS: 8.6% AFFO: 10.1% Average Annual Growth Rate ANNUAL ACQUISITIONS ($MM)1 RETURNS3 AND SPREADS Gross Return Spread Cap Rate Spread 5.6% 5.3% 5.4% 5.6% 3.9% 3.6% 3.7% 3.8% $837 $1,137 $1,222 $1,223 2013 2014 2015 2016 $109 $190 $283 $372 $62 $110 $183 $246 $26 $48 $84 $123 2013 2014 2015 2016 NOI AFFO Net Income 4.6% 4.7% 4.4% 4.1% 3.9% 3.6% 3.7% 3.8% 1.7% 1.7% 1.7% 1.8% 2013 2014 2015 2016 Borrowing Cost Cap Rate Gross Return $0.00 $0.50 $1.00 $1.50 $2.00 2016 2015 2014 2013 2016 2015 2014 2013 2016 2015 2014 2013
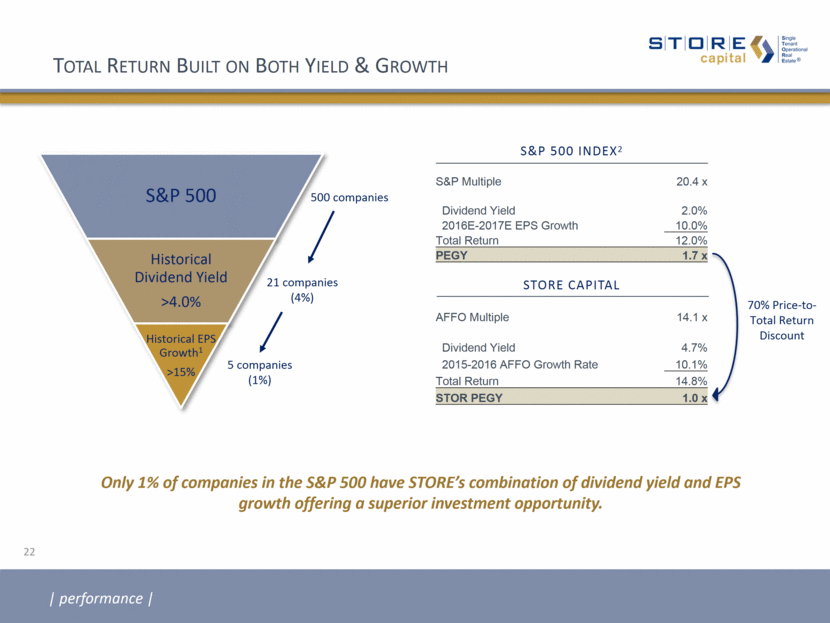
Total Return Built on Both Yield & Growth performance 22 500 companies 21 companies (4%) 5 companies (1%) Only 1% of companies in the S&P 500 have STORE’s combination of dividend yield and EPS growth offering a superior investment opportunity. 70% Price-to-Total Return Discount S&P 500 INDEX2 S&P Multiple 20.4 x Dividend Yield 2.0% 2016E-2017E EPS Growth 10.0% Total Return 12.0% PEGY 1.7 x STORE CAPITAL AFFO Multiple 14.1 x Dividend Yield 4.7% 2015-2016 AFFO Growth Rate 10.1% Total Return 14.8% STOR PEGY 1.0 x S&P 500 Historical Dividend Yield >4.0% Historical EPS Growth1 >15%
Margins of Safety Portfolio Quality Approximately 75% investment-grade Master leases 82% of the time 97% property-level financial statements Market-leading investment diversity Investments average 82% of replacement cost Investment yields above NAV auction yields Financial Strength A highly protected dividend Market-leading internal growth1 Multiple investment-grade borrowing options Conservative leverage and flexible balance sheet performance 23
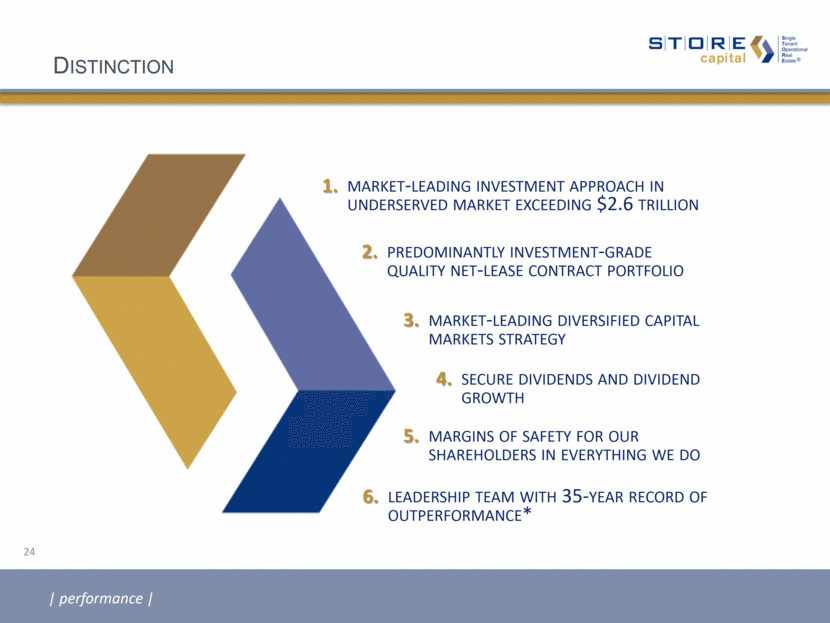
Distinction market-leading investment approach in underserved market exceeding $2.6 trillion 1. predominantly investment-grade quality net-lease contract portfolio 2. market-leading diversified capital markets strategy 3. secure dividends and dividend growth 4. margins of safety for our shareholders in everything we do 5. leadership team with 35-year record of outperformance* 6. performance 24
Appendix
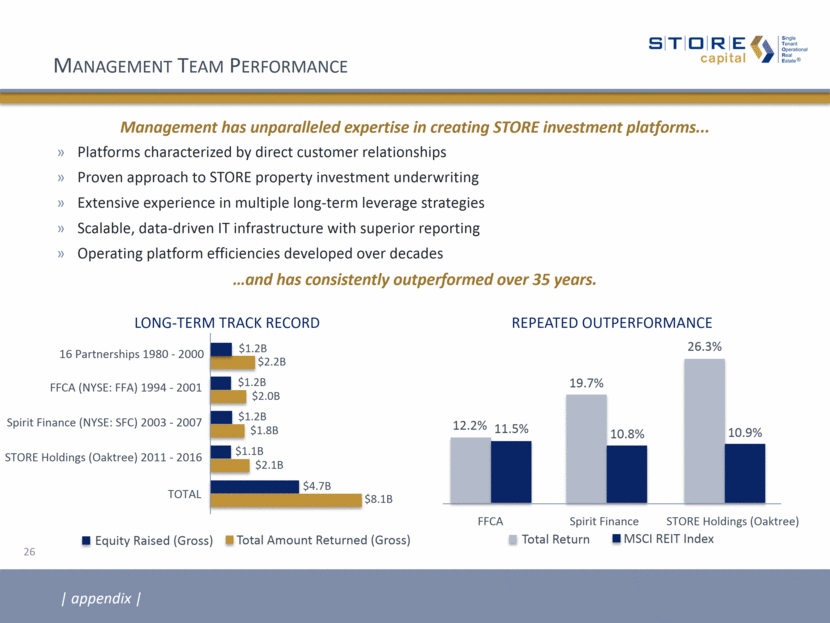
Repeated Outperformance LONG-TERM TRACK RECORD FFCA Spirit Finance STORE Holdings (Oaktree) 12.2% 11.5% 19.7% 10.8% 26.3% 10.9% Total Return MSCI REIT Index FFCA (NYSE: FFA) 1994 - 2001 Spirit Finance (NYSE: SFC) 2003 - 2007 STORE Holdings (Oaktree) 2011 - 2016 TOTAL Equity Raised (Gross) Total Amount Returned (Gross) 16 Partnerships 1980 - 2000 $2.2B $1.2B $2.0B $1.2B $1.8B $1.1B $2.1B $4.7B $8.1B Management Team Performance appendix Platforms characterized by direct customer relationships Proven approach to STORE property investment underwriting Extensive experience in multiple long-term leverage strategies Scalable, data-driven IT infrastructure with superior reporting Operating platform efficiencies developed over decades Management has unparalleled expertise in creating STORE investment platforms... and has consistently outperformed over 35 years. 26 $1.2B
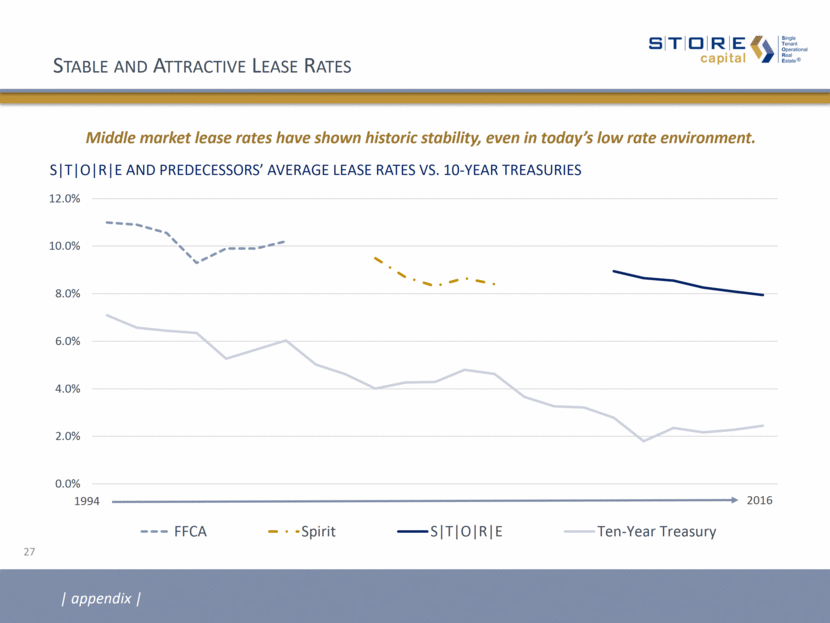
appendix 27 1994 2016 Stable and Attractive Lease Rates Middle market lease rates have shown historic stability, even in today’s low rate environment. S T O R E and predecessors’ average Lease Rates vs. 10-Year Treasuries 0.0% 2.0% 4.0% 6.0% 8.0% 10.0% 12.0% FFCA Spirit S T O R E Ten-Year Treasury
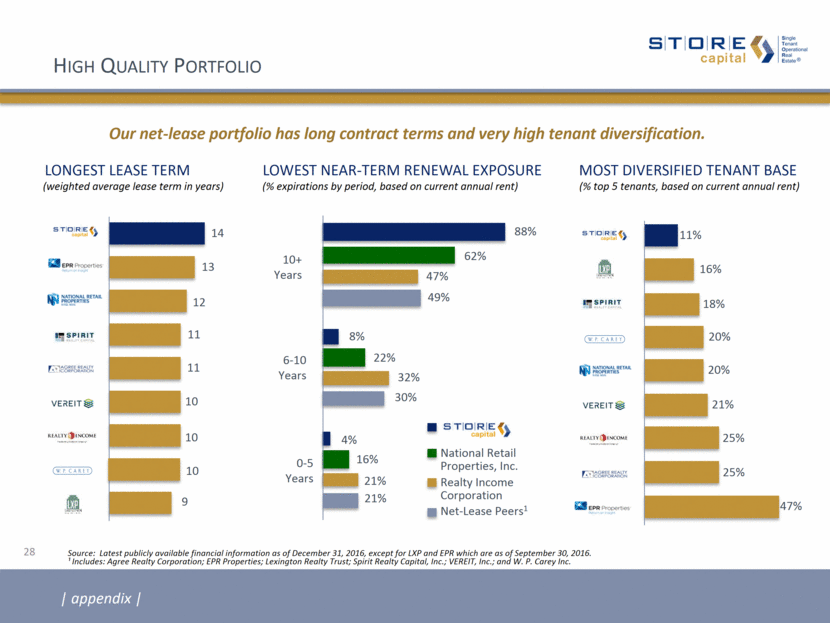
Most Diversified Tenant Base Source: Latest publicly available financial information as of December 31, 2016, except for LXP and EPR which are as of September 30, 2016. ¹ Includes: Agree Realty Corporation; EPR Properties; Lexington Realty Trust; Spirit Realty Capital, Inc.; VEREIT, Inc.; and W. P. Carey Inc. (weighted average lease term in years) Longest Lease Term Lowest Near-Term Renewal Exposure (% top 5 tenants, based on current annual rent) (% expirations by period, based on current annual rent) 14 13 12 11 11 10 10 9 88% 62% 47% 49% 8% 22% 32% 30% 4% 16% 21% 21% National Retail Properties, Inc. Realty Income Corporation Net-Lease Peers1 10+ Years 6-10 Years 0-5 Years 11% 16% 18% 20% 20% 21% 25% 25% 47% appendix Our net-lease portfolio has long contract terms and very high tenant diversification. High Quality Portfolio 28 10
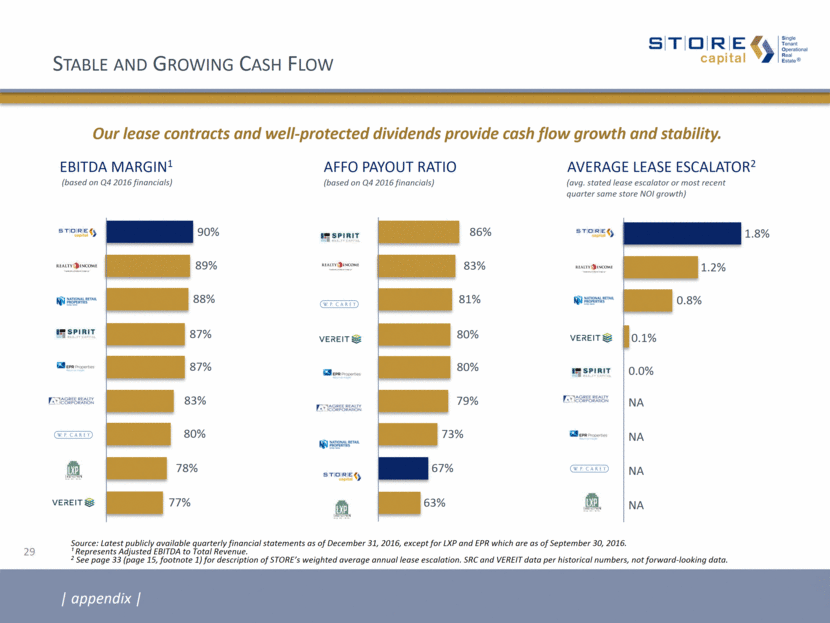
ebitda margin1 Average Lease escalator2 Source: Latest publicly available quarterly financial statements as of December 31, 2016, except for LXP and EPR which are as of September 30, 2016. ¹ Represents Adjusted EBITDA to Total Revenue. 2 See page 33 (page 15, footnote 1) for description of STORE’s weighted average annual lease escalation. SRC and VEREIT data per historical numbers, not forward-looking data. (based on Q4 2016 financials) affo payout ratio (avg. stated lease escalator or most recent quarter same store NOI growth) (based on Q4 2016 financials) Stable and Growing Cash Flow 89% 90% 88% 87% 87% 83% 80% 78% 77% 1.8% 1.2% 0.8% 0.1% NA NA NA NA Our lease contracts and well-protected dividends provide cash flow growth and stability. appendix 29 83% 86% 81% 80% 80% 79% 73% 67% 63% 0.0%
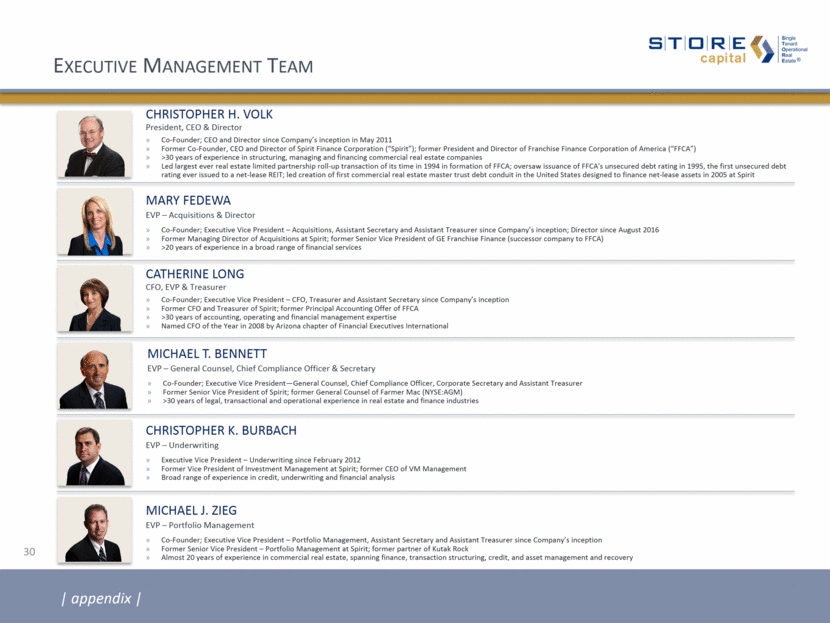
30 Executive Management Team appendix CHRISTOPHER H. VOLK President, CEO & Director Co-Founder; CEO and Director since Company’s inception in May 2011 Former Co-Founder, CEO and Director of Spirit Finance Corporation (“Spirit”); former President and Director of Franchise Finance Corporation of America (“FFCA”) >30 years of experience in structuring, managing and financing commercial real estate companies Led largest ever real estate limited partnership roll-up transaction of its time in 1994 in formation of FFCA; oversaw issuance of FFCA's unsecured debt rating in 1995, the first unsecured debt rating ever issued to a net-lease REIT; led creation of first commercial real estate master trust debt conduit in the United States designed to finance net-lease assets in 2005 at Spirit CATHERINE LONG CFO, EVP & Treasurer Co-Founder; Executive Vice President – CFO, Treasurer and Assistant Secretary since Company’s inception Former CFO and Treasurer of Spirit; former Principal Accounting Offer of FFCA >30 years of accounting, operating and financial management expertise Named CFO of the Year in 2008 by Arizona chapter of Financial Executives International MARY FEDEWA EVP – Acquisitions & Director Co-Founder; Executive Vice President – Acquisitions, Assistant Secretary and Assistant Treasurer since Company’s inception; Director since August 2016 Former Managing Director of Acquisitions at Spirit; former Senior Vice President of GE Franchise Finance (successor company to FFCA) >20 years of experience in a broad range of financial services CHRISTOPHER K. BURBACH EVP – Underwriting Executive Vice President – Underwriting since February 2012 Former Vice President of Investment Management at Spirit; former CEO of VM Management Broad range of experience in credit, underwriting and financial analysis MICHAEL J. ZIEG EVP – Portfolio Management Co-Founder; Executive Vice President – Portfolio Management, Assistant Secretary and Assistant Treasurer since Company’s inception Former Senior Vice President – Portfolio Management at Spirit; former partner of Kutak Rock Almost 20 years of experience in commercial real estate, spanning finance, transaction structuring, credit, and asset management and recovery MICHAEL T. BENNETT EVP – General Counsel, Chief Compliance Officer & Secretary Co-Founder; Executive Vice President—General Counsel, Chief Compliance Officer, Corporate Secretary and Assistant Treasurer Former Senior Vice President of Spirit; former General Counsel of Farmer Mac (NYSE:AGM) >30 years of legal, transactional and operational experience in real estate and finance industries
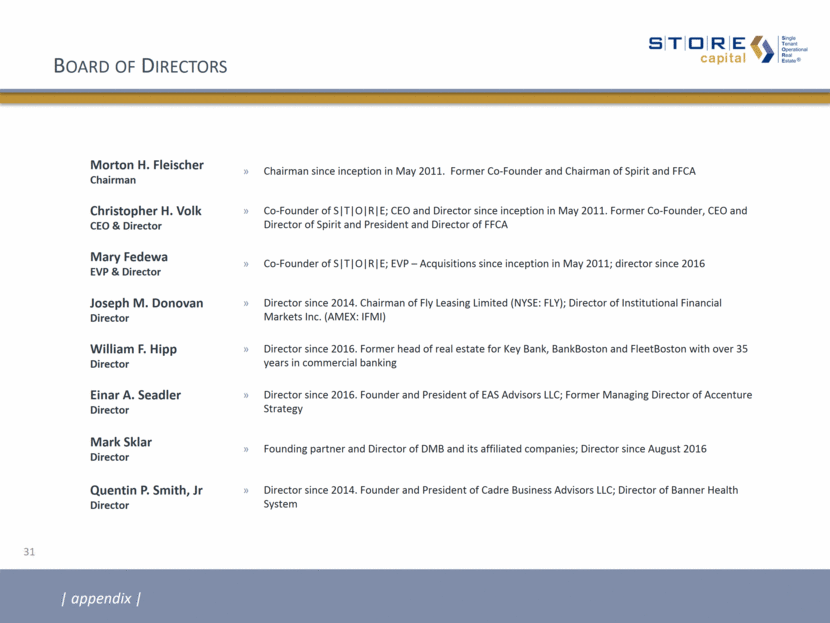
Board of Directors Morton H. Fleischer Chairman Chairman since inception in May 2011. Former Co-Founder and Chairman of Spirit and FFCA Christopher H. Volk CEO & Director Co-Founder of S T O R E; CEO and Director since inception in May 2011. Former Co-Founder, CEO and Director of Spirit and President and Director of FFCA Mary Fedewa EVP & Director Co-Founder of S T O R E; EVP – Acquisitions since inception in May 2011; director since 2016 Joseph M. Donovan Director Director since 2014. Chairman of Fly Leasing Limited (NYSE: FLY); Director of Institutional Financial Markets Inc. (AMEX: IFMI) William F. Hipp Director Director since 2016. Former head of real estate for Key Bank, BankBoston and FleetBoston with over 35 years in commercial banking Einar A. Seadler Director Director since 2016. Founder and President of EAS Advisors LLC; Former Managing Director of Accenture Strategy Mark Sklar Director Founding partner and Director of DMB and its affiliated companies; Director since August 2016 Quentin P. Smith, Jr Director Director since 2014. Founder and President of Cadre Business Advisors LLC; Director of Banner Health System appendix 31 appendix
32 Footnotes Page 3 1 Reflects the percentage of our contracts that have a STORE Score that is investment grade. We measure the credit quality of our portfolio on a contract-by-contract basis using the STORE Score, which is a risk measure reflective of both the credit risk of our tenants and the profitability of the operations at the properties. Page 4 1 Based on percentage growth of our investment portfolio for the year ended December 31, 2016. Page 9 1 Free cash flow approximates Adjusted Funds from Operations less dividends paid. Page 10: * In addition to improved unencumbered asset ratios, unsecured lenders additionally benefit from the support of significant cash flows after debt service from assets subject to secured borrowings as well as a growing pool of unencumbered BBB-rated Master Funding notes. 1 Based on average of ratios of Realty Income and National Retail Properties as of December 31, 2016. 2 Ratios as of December 31, 2016; Unencumbered EBITDA based on NOI from Unencumbered Assets less an allocation of general and administrative expenses based on assets. Page 11: 1 Shown as of December 31, 2016, by % of annualized base rent and interest (annualized based on rates in effect on December 31, 2016, for all leases, loans and direct financing receivables in place as of that date). Excludes contracts representing less than 0.3% of annualized base rent and interest where there are no further escalations remaining in the current lease term and there are no extension options. 2 Represents the weighted average annual escalation rate of the entire portfolio as if all escalations occurred annually. For escalations based on a formula including CPI, assumes the stated fixed percentage in the contract or assumes 1.5% if no fixed percentage is in the contract. For contracts with no escalations remaining in the current lease term, assumes the escalation in the extension term. 3 Dividend protection refers to the percentage difference between our AFFO per share and our dividend per share. The wider the relative gap between AFFO per share and dividends per share, the greater the implied dividend protection. All dividends are declared at the discretion of our Board of Directors and future dividends will depend upon our actual funds from operations, financial condition and capital requirements, the annual distribution requirements under the REIT provisions of the Code and other factors. 4 S T O R E defines internal growth as the combination of high average lease escalators and a low AFFO payout ratio, which allows us to reinvest a growing amount of free cash flow back into our business. Page 12: * See chart, page 26. appendix
Footnotes appendix 33 5 The percentage of investment portfolio subject to master leases represents the percentage of the investment portfolio in multiple properties with a single customer subject to master leases. Based on annualized base rent and interest, 81% of the investment portfolio involves multiple properties with a single customer, whether or not subject to a master lease. 6 The average investment amount/replacement cost (new) represents the ratio of purchase price to replacement cost (new) at acquisition. 7 S T O R E calculates unit fixed charge coverage ratio generally as the ratio of (i) the unit’s EBITDAR, less a standardized corporate overhead expense based on estimated industry standards, to (ii) the unit’s total fixed charges, which are its lease expense, interest expense and scheduled principal payments on indebtedness. The 4-Wall coverage ratio refers to a unit’s FCCR before taking into account standardized corporate overhead expense. 8 The proportion of investment contracts rated investment grade represents the percentage of our contracts that have a STORE Score that is investment grade. We measure the credit quality of our portfolio on a contract-by-contract basis using the STORE Score, which is a risk measure reflective of both the credit risk of our tenants and the profitability of the operations at the properties. Page 16: 1 Source: Bloomberg. Represents total return over period from January 1, 2016 through December 31, 2016. Past performance is not necessarily an indicator of future performance. 2 Represents acquisitions of real estate and investment in loans receivable between January 1, 2016 and December 31, 2016. 3 See footnote 3 to page 11 on page 32. Page 14: 1 Our Board of Directors has opted out of the control share acquisition statute and business combination provisions in the Maryland General Corporation Law (called the “Maryland Unsolicited Takeover Law” or “MUTA”) and we may not opt back in to these provisions without stockholder approval. Page 15: * Based on annualized base rent and interest. 1 Represents the percentage of our lease contracts that were created by S T O R E or contain preferred contact terms such as unit-level financing reporting, triple-net lease provisions and, when applicable, master lease provisions. 2 Weighted average annual lease escalation represents the weighted average annual escalation rate of the entire portfolio as if all escalations occurred annually. For escalations based on a formula including CPI, assumes the stated fixed percentage in the contract or assumes 1.5% if no fixed percentage is in the contract. For contracts with no escalations remaining in the current lease term, assumes the escalation in the extension term. Calculation excludes contracts representing less than 0.3% of annualized base rent and interest where there are no further escalations remaining in the current lease term and there are no extension options. 3 S T O R E defines occupancy as a property being subject to a lease or loan contract. 4 The number of properties not currently operating but subject to a lease represents the number of our investment locations that have been closed by the tenant but remain subject to a lease.
Footnotes appendix 34 4 S T O R E’s pipeline during the year ended December 31, 2016. See slide 20 for more information about S T O R E's pipeline, including its composition. S T O R E may never acquire properties in its pipeline for a variety of reasons as described in the Company’s Annual Report on Form 10-K for the fiscal year ended December 31, 2016. 5 For the year ended December 31, 2016. Page 17: 1 Excludes customers, representing approximately 3.2% of annualized base rent and interest, that do not report corporate revenues. 2 Shown as of December 31, 2016, by % of annualized base rent and interest (annualized based on rates in effect on December 31, 2016, for all leases, loans and direct financing receivables in place as of that date). Page 18: * Based on annualized base rent and interest. Page 19: 1 We measure the credit quality of our portfolio on a contract-by-contract basis using the STORE Score, which is a proprietary risk measure reflective of both the credit risk of our tenants and the profitability of the operations at our properties. The STORE Score is a quantitative measurement of contract risk computed by multiplying tenant default probabilities (using Moody’s RiskCalc) and estimated store closure probabilities (using a simple algorithm we developed that has closure probabilities ranging from 100% to 10%, depending on unit-level profitability). Qualitative features can also impact investment risk, such as low property investment amounts, favorable tenant debt capital stacks, the presence of third party guarantors, or other factors. Such qualitative factors may serve to further mitigate investment risk. Page 20: * Four period moving average. Page 21: 1 Represents acquisitions of real estate and investment in loan and direct financing receivables. 2 Refer to pages 35 through 40 for definitions of these non-GAAP financial measures and reconciliation to GAAP net income. 3 Gross Return represents initial cap rate plus weighted average annual lease escalators. Gross returns do not represent the actual returns we may earn on properties. Page 22: Source: IBES Thomson Reuters. Data as of February 3, 2017. 1 Represents 3-year historical normalized diluted EPS growth of five companies: CME Group Inc., Entergy Corporation, Host Hotels & Resorts, The Southern Company and Welltower Inc. 2 Market data as of February 10, 2017; P/E multiple based on Goldman Sachs Research and EPS growth based on Goldman Sachs Research estimates. Page 23: See footnote 4 to page 11 on page 32.
Footnotes appendix 35 Page 24: * Based on annualized total returns earned by management’s prior investment vehicles while operating as a public company, compared to annualized total returns on the MSCI US REIT Index during the same periods. The past performance of these investment vehicles is not an indicator of S T O R E’s future performance, and S T O R E’s performance may be significantly less favorable than the past performance data included in this presentation. Moreover, some of the past performance data covers periods with economic characteristics and cycles and interest rate environments that are significantly different from those S T O R E faces today and may face in the future.
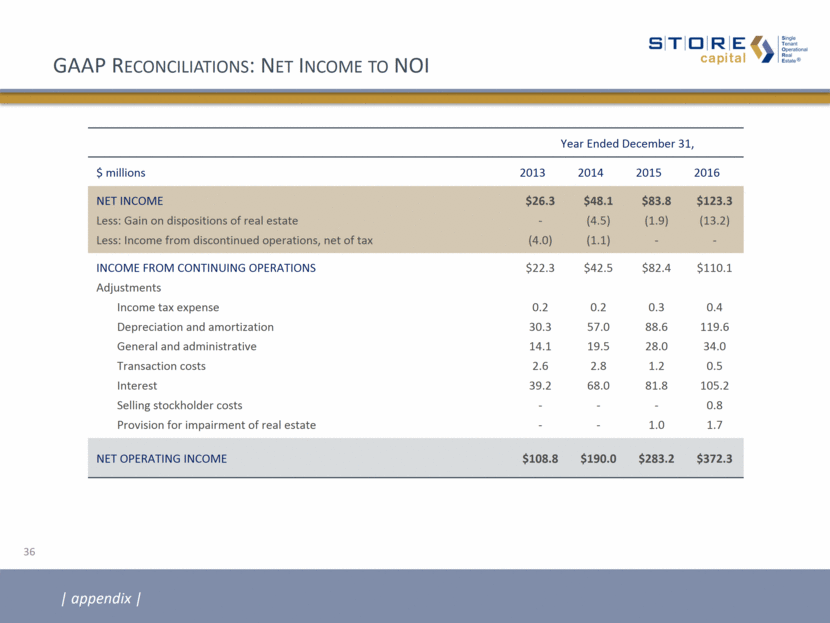
GAAP Reconciliations: Net Income to NOI Year Ended December 31, $ millions 2013 2014 2015 2016 NET INCOME Less: Gain on dispositions of real estate Less: Income from discontinued operations, net of tax $26.3 - (4.0) $48.1 (4.5) (1.1) $83.8 (1.9) - $123.3 (13.2) - INCOME FROM CONTINUING OPERATIONS Adjustments Income tax expense Depreciation and amortization General and administrative Transaction costs Interest Selling stockholder costs Provision for impairment of real estate $22.3 0.2 30.3 14.1 2.6 39.2 - - $42.5 0.2 57.0 19.5 2.8 68.0 - - $82.4 0.3 88.6 28.0 1.2 81.8 - 1.0 $110.1 0.4 119.6 34.0 0.5 105.2 0.8 1.7 NET OPERATING INCOME $108.8 $190.0 $283.2 $372.3 appendix 36
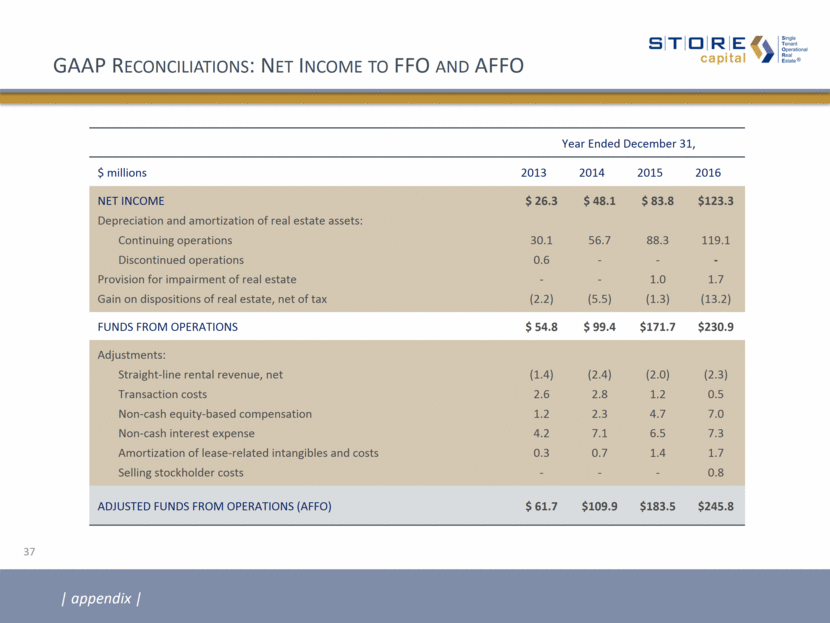
GAAP Reconciliations: Net Income to FFO and AFFO Year Ended December 31, $ millions 2013 2014 2015 2016 NET INCOME Depreciation and amortization of real estate assets: Continuing operations Discontinued operations Provision for impairment of real estate Gain on dispositions of real estate, net of tax $ 26.3 30.1 0.6 - (2.2) $ 48.1 56.7 - - (5.5) $ 83.8 88.3 - 1.0 (1.3) $123.3 119.1 - 1.7 (13.2) FUNDS FROM OPERATIONS $ 54.8 $ 99.4 $171.7 $230.9 Adjustments: Straight-line rental revenue, net Transaction costs Non-cash equity-based compensation Non-cash interest expense Amortization of lease-related intangibles and costs Selling stockholder costs (1.4) 2.6 1.2 4.2 0.3 - (2.4) 2.8 2.3 7.1 0.7 - (2.0) 1.2 4.7 6.5 1.4 - (2.3) 0.5 7.0 7.3 1.7 0.8 ADJUSTED FUNDS FROM OPERATIONS (AFFO) $ 61.7 $109.9 $183.5 $245.8 appendix 37
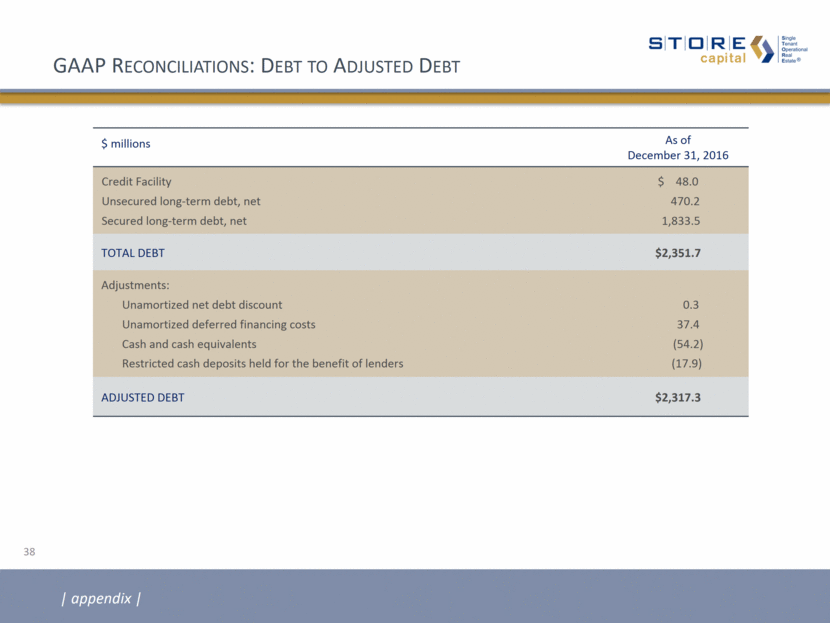
GAAP Reconciliations: Debt to Adjusted Debt $ millions As of December 31, 2016 Credit Facility Unsecured long-term debt, net Secured long-term debt, net $ 48.0 470.2 1,833.5 TOTAL DEBT $2,351.7 Adjustments: Unamortized net debt discount Unamortized deferred financing costs Cash and cash equivalents Restricted cash deposits held for the benefit of lenders 0.3 37.4 (54.2) (17.9) ADJUSTED DEBT $2,317.3 appendix 38
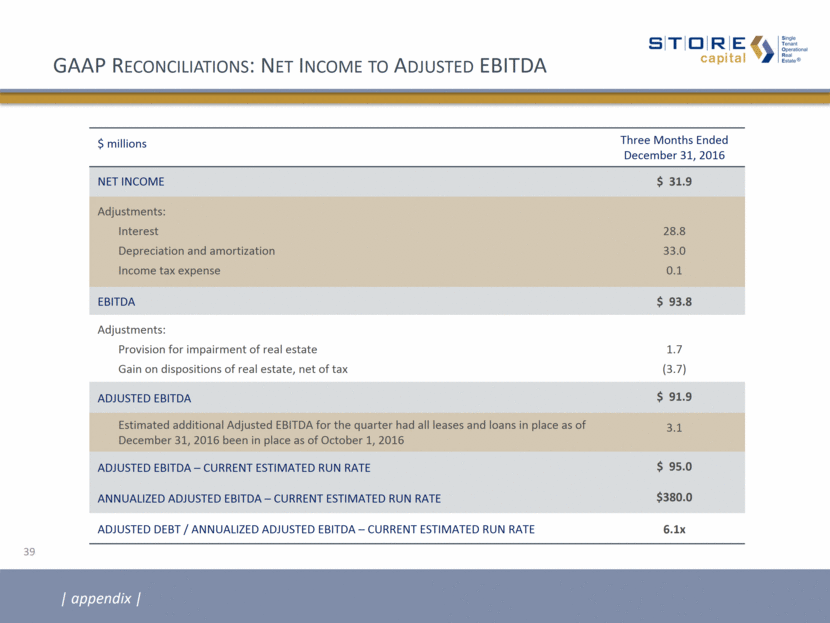
GAAP Reconciliations: Net Income to Adjusted EBITDA $ millions Three Months Ended December 31, 2016 NET INCOME $ 31.9 Adjustments: Interest Depreciation and amortization Income tax expense 28.8 33.0 0.1 EBITDA $ 93.8 Adjustments: Provision for impairment of real estate Gain on dispositions of real estate, net of tax 1.7 (3.7) ADJUSTED EBITDA $ 91.9 Estimated additional Adjusted EBITDA for the quarter had all leases and loans in place as of December 31, 2016 been in place as of October 1, 2016 3.1 ADJUSTED EBITDA – CURRENT ESTIMATED RUN RATE $ 95.0 ANNUALIZED ADJUSTED EBITDA – CURRENT ESTIMATED RUN RATE $380.0 ADJUSTED DEBT / ANNUALIZED ADJUSTED EBITDA – CURRENT ESTIMATED RUN RATE 6.1x appendix 39
Supplemental Reporting Measures Funds from Operations, or FFO, and Adjusted Funds from Operations, or AFFO Our reported results are presented in accordance with U.S. generally accepted accounting principles, or GAAP. We also disclose Funds from Operations, or FFO, and Adjusted Funds from Operations, or AFFO, both of which are non-GAAP measures. We believe these two non-GAAP financial measures are useful to investors because they are widely accepted industry measures used by analysts and investors to compare the operating performance of REITs. FFO and AFFO do not represent cash generated from operating activities and are not necessarily indicative of cash available to fund cash requirements; accordingly, they should not be considered alternatives to net income as a performance measure or to cash flows from operations as reported on a statement of cash flows as a liquidity measure and should be considered in addition to, and not in lieu of, GAAP financial measures. We compute FFO in accordance with the definition adopted by the Board of Governors of the National Association of Real Estate Investment Trusts, or NAREIT. NAREIT defines FFO as GAAP net income, excluding gains (or losses) from extraordinary items and sales of depreciable property, real estate impairment losses and depreciation and amortization expense from real estate assets, including the pro rata share of such adjustments of unconsolidated subsidiaries. To derive AFFO, we modify the NAREIT computation of FFO to include other adjustments to GAAP net income related to certain non-cash revenues and expenses that have no impact on our long-term operating performance such as straight-line rents, amortization of deferred financing costs and stock-based compensation. In addition, in deriving AFFO, we exclude transaction costs associated with acquiring real estate subject to existing leases and certain other expenses not related to our ongoing operations. FFO is used by management, investors and analysts to facilitate meaningful comparisons of operating performance between periods and among our peers primarily because it excludes the effect of real estate depreciation and amortization and net gains on sales, which are based on historical costs and implicitly assume that the value of real estate diminishes predictably over time, rather than fluctuating based on existing market conditions. Management believes that AFFO provides more useful information to investors and analysts because it modifies FFO to exclude certain additional non-cash revenues and expenses such as straight-line rents, amortization of deferred financing costs and stock-based compensation as such items may cause short-term fluctuations in net income but have no impact on long-term operating performance. Additionally, in deriving AFFO, we exclude transaction costs associated with acquiring real estate subject to existing leases. We view transaction costs to be a part of our investment in the real estate we acquire, similar to the treatment of acquisition and closing costs on our sale-leaseback transactions, which are capitalized as a part of the investment in the asset. We believe that transaction costs are not an ongoing cost of the portfolio in place at the end of each reporting period and, for these reasons, we add back the portion expensed when computing AFFO. Similarly, in 2016 we excluded the offering expenses incurred on behalf of our selling stockholder, STORE Holding, when it exited all of its holdings of STORE Capital common stock, as those costs are not related to our ongoing operations. As a result, we believe AFFO to be a more meaningful measurement of ongoing performance that allows for greater performance comparability. Therefore, we disclose both FFO and AFFO and reconcile them to the most appropriate GAAP performance metric, which is net income. STORE Capital’s FFO and AFFO may not be comparable to similarly titled measures employed by other companies. appendix 40
Supplemental Reporting Measures (Continued) EBITDA, Adjusted EBITDA, Annualized Adjusted EBITDA and Adjusted Debt EBITDA represents earnings before interest, taxes, depreciation and amortization. Adjusted EBITDA represents EBITDA modified to include other adjustments to GAAP net income for transaction costs, non-cash impairment charges and gains/losses on dispositions of real estate and certain other expenses not related to ongoing operations. Annualized Adjusted EBITDA is calculated by multiplying Adjusted EBITDA for the quarter by four. Annualized Adjusted EBITDA – Current Estimated Run Rate is calculated based on an estimated Adjusted EBITDA as if all leases and loans in place as of December 31, 2016 had been in place as of October 1, 2016; then annualizing the Adjusted EBITDA for the quarter by multiplying it by four. You should not unduly rely on this metric as it is based on several assumptions and estimates that may prove to be inaccurate. Our actual reported Adjusted EBITDA for future periods may be significantly less than that implied by our reported Annualized Adjusted EBITDA – Current Estimated Run Rate for a variety of reasons. Adjusted Debt represents our outstanding debt obligations excluding unamortized deferred financing costs and net debt premium, further reduced for cash and cash equivalents and restricted cash deposits held for the benefit of lenders. We believe excluding unamortized deferred financing costs and net debt premium, cash and cash equivalents and restricted cash deposits held for the benefit of lenders provides an estimate of the net contractual amount of borrowed capital to be repaid which we believe is a beneficial disclosure to investors and analysts. Adjusted Debt to Annualized Adjusted EBITDA Adjusted Debt to Annualized Adjusted EBITDA, or leverage, is a supplemental non-GAAP financial measure we use to evaluate the level of borrowed capital being used to increase the potential return of our real estate investments. We calculate leverage by dividing Adjusted Debt by Annualized Adjusted EBITDA. Because our portfolio growth level is significant to the overall size of the Company, we believe that presenting this leverage metric on a run rate basis is more meaningful than presenting the metric for the historical quarterly period, and we refer to this metric as Adjusted Debt to Annualized Adjusted EBITDA—Current Estimated Run Rate. Leverage should be considered as a supplemental measure of the level of risk to which stockholder value may be exposed. Our computation of leverage may differ from the methodology employed by other companies, and, therefore, may not be comparable to other measures. appendix 41