Attached files
| file | filename |
|---|---|
| EX-23.3 - EX-23.3 - ProShares Trust II | d343571dex233.htm |
| EX-8.1 - EX-8.1 - ProShares Trust II | d343571dex81.htm |
| EX-5.1 - EX-5.1 - ProShares Trust II | d343571dex51.htm |
Table of Contents
As filed with the Securities and Exchange Commission on February 27, 2017
Registration No. 333-215929
UNITED STATES
SECURITIES AND EXCHANGE COMMISSION
Washington, D.C. 20549
PRE-EFFECTIVE AMENDMENT NO. 1
TO
FORM S-1
REGISTRATION STATEMENT
UNDER
THE SECURITIES ACT OF 1933
PROSHARES TRUST II
(Exact name of registrant as specified in its charter)
| Delaware | 6221 | 87-6284802 | ||
| (State of Organization) | (Primary Standard Industrial Classification Code Number) |
(I.R.S. Employer Identification Number) |
Michael L. Sapir
c/o ProShare Capital Management LLC
7501 Wisconsin Avenue
East Tower, 10th Floor
Bethesda, Maryland 20814
(240) 497-6400
(Name, address, including zip code, and telephone number, including area code, of agent for service)
Copies to:
Michael J. Schmidtberger
James C. Munsell
c/o Sidley Austin LLP
787 Seventh Avenue
New York, New York 10019
and
Richard F. Morris
c/o ProShare Capital Management LLC
7501 Wisconsin Avenue
East Tower, 10th Floor
Bethesda, MD 20814
Approximate date of commencement of proposed sale to the public: As promptly as practicable after the effective date of this Registration Statement.
If any of the securities being registered on this Form are to be offered on a delayed or continuous basis pursuant to Rule 415 under the Securities Act of 1933 check the following box: ☒
If this Form is filed to register additional securities for an offering pursuant to Rule 462(b) under the Securities Act, please check the following box and list the Securities Act registration statement number of the earlier effective registration statement for the same offering. ☐
If this Form is a post-effective amendment filed pursuant to Rule 462(c) under the Securities Act, check the following box and list the Securities Act registration statement number of the earlier effective registration statement for the same offering. ☐
If this Form is a post-effective amendment filed pursuant to Rule 462(d) under the Securities Act, check the following box and list the Securities Act registration statement number of the earlier effective registration statement for the same offering. ☐
Indicate by check mark whether the registrant is a large accelerated filer, an accelerated filer, a non-accelerated filer, or a smaller reporting company. See the definitions of “large accelerated filer,” “accelerated filer” and “smaller reporting company” in Rule 12b- 2 of the Exchange Act. (Check one)
| Large accelerated filer | ☐ | Accelerated filer | ☐ | |||
| Non-accelerated filer | ☒ (Do not check if a smaller reporting company) | Smaller reporting company | ☐ | |||
CALCULATION OF REGISTRATION FEE
|
| ||||
| Title of Securities to be Registered | Proposed Maximum Aggregate Offering Price(1) |
Amount of Registration Fee | ||
| ProShares UltraShort Gold Common Units of Beneficial Interest |
$184,530,493 | $18,582 | ||
|
| ||||
|
| ||||
Pursuant to the provisions of Rule 415(a)(6) under the Securities Act of 1933, as amended, the issuer is including on this new Registration Statement on Form S-1 both the unsold amount securities and the filing fees paid in connection with such unsold securities that was covered by an earlier Registration Statement on Form S-3 (Registration No. 333-213918) as provided in the above table. The filing fees in the above table will continue to be applied to such unsold securities.
The registrant hereby amends this Registration Statement on such date or dates as may be necessary to delay its effective date until the registrant shall file a further amendment which specifically states that this Registration Statement shall thereafter become effective in accordance with Section 8(a) of the Securities Act of 1933 or until this Registration Statement shall become effective on such date as the Commission, acting pursuant to said Section 8(a), may determine.
EXPLANATORY NOTE
This Pre-Effective Amendment No. 1 to Registration Statement No. 333-215929, or the Registration Statement, is being filed to include the financial statements for ProShares Trust II, or the Trust, a Delaware statutory trust organized in separate series (each such series a “Fund”) and for each of the Funds.
ProShare Capital Management LLC, the Sponsor of the Trust and the Funds (the “Sponsor”), had previously offered the common units of beneficial interest, or Shares, of seven series of the Trust pursuant to a single Registration Statement and two separate Prospectuses. Upon effectiveness of the Registration Statement on Form S-3 (333-213918), the Sponsor offered the Shares of the following seven Funds through two separate Prospectuses: ProShares Ultra Bloomberg Crude Oil, ProShares UltraShort Bloomberg Crude Oil, ProShares Ultra Gold, ProShares UltraShort Gold, ProShares Ultra Silver, ProShares UltraShort Euro and ProShares UltraShort Yen, ProShares Ultra VIX Short-Term Futures ETF, ProShares Short VIX Short-Term Futures ETF and ProShares VIX Short-Term Futures ETF. This Registration Statement on Form S-1 is being filed because ProShares UltraShort Gold no longer qualifies to register its Shares on a Registration Statement on Form S-3. Upon effectiveness of this Registration Statement on Form S-1, the Shares of ProShares UltraShort Gold will be offered by the Sponsor pursuant to this Registration Statement and a standalone Prospectus. Upon effectiveness of a Registration Statement on Form S-3 being filed simultaneously, the Sponsor will then offer the Shares of the following six Funds through two separate Prospectuses: ProShares Ultra Bloomberg Crude Oil, ProShares UltraShort Bloomberg Crude Oil, ProShares Ultra Gold, ProShares Ultra Silver, ProShares UltraShort Euro and ProShares UltraShort Yen, ProShares Ultra VIX Short-Term Futures ETF, ProShares Short VIX Short-Term Futures ETF and ProShares VIX Short-Term Futures ETF.
Table of Contents

PROSHARES TRUST II
Common Units of Beneficial Interest
| Title of Securities to be Registered |
Benchmark |
Proposed Maximum Aggregate Offering Price of the Fund | ||
| ProShares UltraShort Gold (GLL) | The daily performance of gold bullion as measured by the U.S. dollar p.m. LBMA Gold Price | $184,530,493 |
ProShares Trust II (the “Trust”) is a Delaware statutory trust organized into separate series. The Trust may from time to time offer to sell common units of beneficial interest (“Shares”) of the series of the Trust listed above (the “Fund”) or other series of the Trust, which represent units of fractional undivided beneficial interest in and ownership of a series of the Trust. Please note that the Trust has series other than the Fund. The Shares will be offered on a continuous basis from time to time.
The Shares of ProShares UltraShort Gold are listed on the NYSE Arca Equities, Inc. (the “Exchange”) under the ticker symbol GLL.
The Fund is “geared” in the sense that it has an investment objective to correspond (before fees and expenses) to an inverse multiple (i.e., -2x) of the performance of a benchmark for a single day, not for any other period. A “single day” is measured from the time the Fund calculates its net asset value (“NAV”) to the time of the Fund’s next NAV calculation. Please see the section entitled “Summary—Creation and Redemption Transactions” on page 2 for additional details on the NAV calculation times for the Fund.
The Fund does not currently intend to invest directly in any commodities or currencies. Rather, the Fund will attempt to gain exposure to its gold benchmark through investments in Financial Instruments (i.e., instruments whose value is derived from the value of an underlying asset, rate or benchmark, including futures contracts, swap agreements, forward contracts and other instruments).
INVESTING IN THE SHARES INVOLVES SIGNIFICANT RISKS. PLEASE REFER TO “RISK FACTORS” BEGINNING ON PAGE 4.
The Fund will distribute to shareholders a Schedule K-1 that will contain information regarding the income and expenses of the Fund.
The Fund is not appropriate for all investors and presents different risks than other funds. The Fund’s use leverage and is riskier than similarly benchmarked exchange-traded funds that do not use leverage.
An investor should only consider an investment in the Fund if he or she understands the consequences of seeking daily inverse leveraged investment results. The Fund seeks to return (before fees and expenses) an inverse multiple (-2x) times of the performance of its benchmark for a single day, not for any other period. The return of the Fund for a period longer than a single day is the result of its return for each day compounded over the period and usually will differ from the Fund’s multiple times the return of the Fund’s benchmark for the same period. Daily compounding of the Fund’s investment returns can dramatically and adversely affect its longer-term performance during periods of high volatility. Volatility may be at least as important to the Fund’s return for a period as the return of the Fund’s underlying benchmark. The Fund uses leverage and should produce returns for a single day that are more volatile than that of its benchmark. For example, the return for a single day of the Fund with a -2x multiple is designed to return two times the inverse (-2x) of the return that would be expected of a fund with an objective of matching the same benchmark.
Shareholders who invest in the Fund should actively manage and monitor their investments, as frequently as daily.
Table of Contents
The Fund continuously offers and redeems its Shares in blocks of 50,000 Shares, (each such block, a “Creation Unit”). Only Authorized Participants may purchase and redeem Shares from the Fund and then only in Creation Units. An Authorized Participant is an entity that has entered into an Authorized Participant Agreement with the Trust and ProShare Capital Management LLC (the “Sponsor”). Shares of the Fund are offered to Authorized Participants in Creation Units at the Fund’s NAV. Authorized Participants may then offer to the public, from time to time, Shares from any Creation Unit they create at a per-Share market price. The form of Authorized Participant Agreement and the related Authorized Participant Handbook set forth the terms and conditions under which an Authorized Participant may purchase or redeem a Creation Unit. Authorized Participants will not receive from the Fund, the Sponsor, or any of their affiliates, any fee or other compensation in connection with their sale of Shares to the public. An Authorized Participant may receive commissions or fees from investors who purchase Shares through their commission or fee-based brokerage accounts.
These securities have not been approved or disapproved by the United States Securities and Exchange Commission (the “SEC”) or any state securities commission nor has the SEC or any state securities commission passed upon the accuracy or adequacy of this Prospectus. Any representation to the contrary is a criminal offense.
NEITHER THE TRUST NOR THE FUND IS A MUTUAL FUND OR ANY OTHER TYPE OF INVESTMENT COMPANY AS DEFINED IN THE INVESTMENT COMPANY ACT OF 1940, AS AMENDED (THE “1940 ACT”), AND NEITHER IS SUBJECT TO REGULATION THEREUNDER.
THE COMMODITY FUTURES TRADING COMMISSION HAS NOT PASSED UPON THE MERITS OF PARTICIPATING IN THIS POOL NOR HAS THE COMMISSION PASSED ON THE ADEQUACY OR ACCURACY OF THIS DISCLOSURE DOCUMENT.
March 1, 2017
Table of Contents
The Shares are neither interests in nor obligations of the Sponsor, Wilmington Trust Company (the “Trustee”), or any of their respective affiliates.
This Prospectus has two parts: the offered series disclosure and the general pool disclosure. These parts are bound together and are incomplete if not distributed together to prospective participants.
COMMODITY FUTURES TRADING COMMISSION
RISK DISCLOSURE STATEMENT
YOU SHOULD CAREFULLY CONSIDER WHETHER YOUR FINANCIAL CONDITION PERMITS YOU TO PARTICIPATE IN A COMMODITY POOL. IN SO DOING, YOU SHOULD BE AWARE THAT COMMODITY INTEREST TRADING CAN QUICKLY LEAD TO LARGE LOSSES AS WELL AS GAINS. SUCH TRADING LOSSES CAN SHARPLY REDUCE THE NET ASSET VALUE OF THE POOL AND CONSEQUENTLY THE VALUE OF YOUR INTEREST IN THE POOL. IN ADDITION, RESTRICTIONS ON REDEMPTIONS MAY AFFECT YOUR ABILITY TO WITHDRAW YOUR PARTICIPATION IN THE POOL.
FURTHER, COMMODITY POOLS MAY BE SUBJECT TO SUBSTANTIAL CHARGES FOR MANAGEMENT, AND ADVISORY AND BROKERAGE FEES. IT MAY BE NECESSARY FOR THOSE POOLS THAT ARE SUBJECT TO THESE CHARGES TO MAKE SUBSTANTIAL TRADING PROFITS TO AVOID DEPLETION OR EXHAUSTION OF THEIR ASSETS. THIS DISCLOSURE DOCUMENT CONTAINS A COMPLETE DESCRIPTION OF EACH EXPENSE TO BE CHARGED TO THIS POOL, AT PAGES 28 TO 29, AND A STATEMENT OF THE PERCENTAGE RETURN NECESSARY TO BREAK EVEN, THAT IS, TO RECOVER THE AMOUNT OF YOUR INITIAL INVESTMENT, AT PAGE 28.
THIS BRIEF STATEMENT CANNOT DISCLOSE ALL THE RISKS AND OTHER FACTORS NECESSARY TO EVALUATE YOUR PARTICIPATION IN THIS COMMODITY POOL. THEREFORE, BEFORE YOU DECIDE TO PARTICIPATE IN THIS COMMODITY POOL, YOU SHOULD CAREFULLY STUDY THIS DISCLOSURE DOCUMENT, INCLUDING A DESCRIPTION OF THE PRINCIPAL RISK FACTORS OF THIS INVESTMENT, AT PAGES 4 THROUGH 20.
YOU SHOULD ALSO BE AWARE THAT THIS COMMODITY POOL MAY TRADE FOREIGN FUTURES OR OPTIONS CONTRACTS. TRANSACTIONS ON MARKETS LOCATED OUTSIDE THE UNITED STATES, INCLUDING MARKETS FORMALLY LINKED TO A UNITED STATES MARKET, MAY BE SUBJECT TO REGULATIONS WHICH OFFER DIFFERENT OR DIMINISHED PROTECTION TO THE POOL AND ITS PARTICIPANTS. FURTHER, UNITED STATES REGULATORY AUTHORITIES MAY BE UNABLE TO COMPEL THE ENFORCEMENT OF THE RULES OF REGULATORY AUTHORITIES OR MARKETS IN NON-UNITED STATES JURISDICTIONS WHERE TRANSACTIONS FOR THE POOL MAY BE EFFECTED.
SWAPS TRANSACTIONS, LIKE OTHER FINANCIAL TRANSACTIONS, INVOLVE A VARIETY OF SIGNIFICANT RISKS. THE SPECIFIC RISKS PRESENTED BY A PARTICULAR SWAP TRANSACTION NECESSARILY DEPEND UPON THE TERMS OF THE TRANSACTION AND YOUR CIRCUMSTANCES. IN GENERAL, HOWEVER, ALL SWAPS TRANSACTIONS INVOLVE SOME COMBINATION OF MARKET RISK, CREDIT RISK, COUNTERPARTY CREDIT RISK, FUNDING RISK, LIQUIDITY RISK, AND OPERATIONAL RISK.
HIGHLY CUSTOMIZED SWAPS TRANSACTIONS IN PARTICULAR MAY INCREASE LIQUIDITY RISK, WHICH MAY RESULT IN A SUSPENSION OF REDEMPTIONS. HIGHLY LEVERAGED TRANSACTIONS MAY EXPERIENCE SUBSTANTIAL GAINS OR LOSSES IN VALUE AS A RESULT OF RELATIVELY SMALL CHANGES IN THE VALUE OR LEVEL OF AN UNDERLYING OR RELATED MARKET FACTOR. IN EVALUATING THE RISKS AND CONTRACTUAL OBLIGATIONS ASSOCIATED WITH A PARTICULAR SWAP TRANSACTION, IT IS IMPORTANT TO CONSIDER THAT A SWAP TRANSACTION MAY, IN CERTAIN INSTANCES, BE MODIFIED OR TERMINATED ONLY BY MUTUAL CONSENT OF THE ORIGINAL PARTIES AND SUBJECT TO AGREEMENT ON INDIVIDUALLY NEGOTIATED TERMS. THEREFORE, IT MAY NOT BE POSSIBLE FOR THE COMMODITY POOL OPERATOR TO MODIFY, TERMINATE, OR OFFSET THE POOL’S OBLIGATIONS OR THE POOL’S EXPOSURE TO THE RISKS ASSOCIATED WITH A TRANSACTION PRIOR TO ITS SCHEDULED TERMINATION DATE.
THIS PROSPECTUS DOES NOT INCLUDE ALL OF THE INFORMATION OR EXHIBITS IN THE REGISTRATION STATEMENT OF THE TRUST. INVESTORS CAN READ AND COPY THE ENTIRE REGISTRATION STATEMENT AT THE PUBLIC REFERENCE FACILITIES MAINTAINED BY THE SEC IN WASHINGTON, D.C.
- i -
Table of Contents
THE BOOKS AND RECORDS OF THE FUND ARE MAINTAINED AS FOLLOWS:
| • | All marketing materials are maintained at the offices of: |
SEI Investments Distribution Co. (“SEI” or the “Distributor”)
1 Freedom Valley Drive
Oaks, Pennsylvania 19456
| • | Creation Unit creation and redemption books and records, accounting and certain other financial books and records (including Fund accounting records, ledgers with respect to assets, liabilities, capital, income and expenses, the register, transfer journals and related details) and certain trading and related documents received from Futures Commission Merchants (“FCMs”) are maintained at the offices of: |
Brown Brothers Harriman & Co. (“BBH&Co.” or the “Custodian”)
50 Post Office Square
Boston, Massachusetts 02110
| • | All other books and records of the Fund (including minute books and other general corporate records, trading records and related reports) are maintained at the Fund’s principal office, c/o ProShare Capital Management LLC, 7501 Wisconsin Avenue, East Tower, 10th Floor, Bethesda, Maryland 20814. The main business telephone number of the Fund and the Sponsor is (240) 497-6400. |
SHAREHOLDERS HAVE THE RIGHT, DURING NORMAL BUSINESS HOURS, TO HAVE ACCESS TO AND COPY (UPON PAYMENT OF REASONABLE REPRODUCTION COSTS) SUCH BOOKS AND RECORDS IN PERSON OR BY THEIR AUTHORIZED ATTORNEY OR AGENT. MONTHLY ACCOUNT STATEMENTS CONFORMING TO THE COMMODITY FUTURES TRADING COMMISSION (“CFTC”) AND THE NATIONAL FUTURES ASSOCIATION (THE “NFA”) REQUIREMENTS ARE POSTED ON THE SPONSOR’S WEBSITE AT WWW.PROSHARES.COM. ADDITIONAL REPORTS MAY BE POSTED ON THE SPONSOR’S WEBSITE AT THE DISCRETION OF THE SPONSOR OR AS REQUIRED BY REGULATORY AUTHORITIES. THERE WILL SIMILARLY BE DISTRIBUTED TO SHAREHOLDERS, NOT MORE THAN 90 DAYS AFTER THE CLOSE OF THE FUND’S FISCAL YEAR, CERTIFIED AUDITED FINANCIAL STATEMENTS. THE TAX INFORMATION RELATING TO SHARES OF THE FUND NECESSARY FOR THE PREPARATION OF SHAREHOLDERS’ ANNUAL FEDERAL INCOME TAX RETURNS WILL ALSO BE DISTRIBUTED.
THE TRUST WILL FILE QUARTERLY AND ANNUAL REPORTS WITH THE SEC. INVESTORS CAN READ AND COPY THESE REPORTS AT THE SEC PUBLIC REFERENCE FACILITIES IN WASHINGTON, D.C. PLEASE CALL THE SEC AT 1–800–SEC–0330 FOR FURTHER INFORMATION.
THE FILINGS OF THE TRUST ARE POSTED AT THE SEC WEBSITE AT WWW.SEC.GOV.
REGULATORY NOTICES
NO DEALER, SALESMAN OR ANY OTHER PERSON HAS BEEN AUTHORIZED TO GIVE ANY INFORMATION OR TO MAKE ANY REPRESENTATION NOT CONTAINED IN THIS PROSPECTUS, AND, IF GIVEN OR MADE, SUCH OTHER INFORMATION OR REPRESENTATION MUST NOT BE RELIED UPON AS HAVING BEEN AUTHORIZED BY THE TRUST, ANY OF THE FUND, THE SPONSOR, THE AUTHORIZED PARTICIPANTS OR ANY OTHER PERSON.
THIS PROSPECTUS DOES NOT CONSTITUTE AN OFFER OR SOLICITATION TO SELL OR A SOLICITATION OF AN OFFER TO BUY, NOR SHALL THERE BE ANY OFFER, SOLICITATION, OR SALE OF THE SHARES IN ANY JURISDICTION IN WHICH SUCH OFFER, SOLICITATION, OR SALE IS NOT AUTHORIZED OR TO ANY PERSON TO WHOM IT IS UNLAWFUL TO MAKE ANY SUCH OFFER, SOLICITATION, OR SALE.
AUTHORIZED PARTICIPANTS MAY BE REQUIRED TO DELIVER A PROSPECTUS WHEN TRANSACTING IN SHARES. SEE “PLAN OF DISTRIBUTION” IN PART TWO OF THIS PROSPECTUS.
- ii -
Table of Contents
PROSHARES TRUST II
| Page | ||||
| 1 | ||||
| 1 | ||||
| 1 | ||||
| 2 | ||||
| 2 | ||||
| 3 | ||||
| 3 | ||||
| 4 | ||||
| 20 | ||||
| 20 | ||||
| Gold |
||||
| 21 | ||||
| 21 | ||||
| 21 | ||||
| Performance of the Offered Commodity Pool Operated by the Commodity Pool Operator |
26 | |||
| Management’s Discussion and Analysis of Financial Conditions and Results of Operations |
28 | |||
| 28 | ||||
| 28 | ||||
| 41 | ||||
| 42 | ||||
| 43 | ||||
| 43 | ||||
| Performance of the Other Commodity Pools Operated by the Commodity Pool Operator |
52 | |||
| 66 | ||||
| 67 | ||||
| 67 | ||||
| 68 | ||||
| 69 | ||||
| 71 | ||||
| 71 | ||||
| 71 | ||||
| Description of the Shares; the Fund; Certain Material Terms of the Trust Agreement |
71 | |||
| 71 | ||||
| 72 | ||||
| 72 | ||||
| 72 | ||||
| 73 | ||||
| 76 | ||||
| 76 | ||||
- iii -
Table of Contents
| Page | ||||
| 76 | ||||
| 76 | ||||
| Possible Repayment of Distributions Received by Shareholders |
77 | |||
| 77 | ||||
| 77 | ||||
| 77 | ||||
| 77 | ||||
| 78 | ||||
| 78 | ||||
| 78 | ||||
| 78 | ||||
| 79 | ||||
| 79 | ||||
| 79 | ||||
| 79 | ||||
| The Securities Depository; Book-Entry Only System; Global Security |
79 | |||
| 80 | ||||
| 80 | ||||
| 81 | ||||
| 82 | ||||
| 83 | ||||
| 83 | ||||
| 84 | ||||
| 84 | ||||
| 84 | ||||
| 84 | ||||
| 85 | ||||
| 85 | ||||
| 85 | ||||
| 85 | ||||
| 86 | ||||
| 86 | ||||
| 86 | ||||
| 86 | ||||
| 87 | ||||
| 88 | ||||
| 89 | ||||
| 89 | ||||
| 89 | ||||
| 89 | ||||
| 90 | ||||
| 90 | ||||
| A-1 | ||||
| Appendix B—Additional Financial and Other Information |
B-1 | |||
- iv -
Table of Contents
Investors should read the following summary together with the more detailed information in this Prospectus before investing in any Shares, including the information under the caption “Risk Factors,” the financial statements and notes to financial statements included herein and all exhibits to this Prospectus, as well as the information incorporated by reference in this Prospectus and current reports, if any, on Form 8-K. Please see the section entitled “Incorporation by Reference of Certain Documents” in Part Two of this Prospectus. For ease of reference, any references throughout this Prospectus to various actions taken by the Fund are actually actions that the Trust has taken on behalf of the Fund.
Definitions used in this Prospectus can be found in the Glossary in Appendix A.
Important Information About the Fund
The Fund is not appropriate for all investors and present different risks than other funds. The Fund uses leverage and is riskier than similarly benchmarked exchange-traded funds that do not use leverage.
An investor should only consider an investment in the Fund if he or she understands the consequences of seeking daily leveraged or daily inverse leveraged investment results. The Fund seeks to return (before fees and expenses) an inverse multiple (-2x) of the performance of its benchmark for a single day, not for any other period. The return of the Fund for a period longer than a single day is the result of its return for each day compounded over the period and usually will differ from the Fund’s multiple times the return of the Fund’s benchmark for the same period. Daily compounding of the Fund’s investment returns can dramatically and adversely affect its longer-term performance during periods of high volatility. Volatility may be at least as important to the Fund’s return for a period as the return of the Fund’s underlying benchmark. The Fund uses leverage and should produce returns for a single day that are more volatile than that of its benchmark. For example, the return for a single day of the Fund with a -2x multiple is designed to return two times the inverse (-2x) of the return for a single day that would be expected of a fund with an objective of matching the same benchmark.
Shareholders who invest in the Fund should actively manage and monitor their investments, as frequently as daily.
The Fund offers investors the opportunity to obtain inverse leveraged exposure to its benchmark. The Fund is linked to an individual commodity. The Fund targets an inverse multiple of the return of its benchmark for a single day, rather than targeting an inverse multiple of the benchmark returns over any other period. The Fund seeks results that correspond (before fees and expenses) to the inverse (-2x) of the performance of its benchmark for a single day. The Fund does not seek to achieve its stated objective over a period greater than a single day. A “single day” is measured from the time the Fund calculates its net asset value (NAV) to the time of the Fund’s next NAV calculation.
The Fund seeks to engage in daily rebalancing to position its portfolio so that its exposure to its benchmark is consistent with the Fund’s daily investment objective. The impact of the benchmark’s movements during the day will affect whether the Fund’s portfolio needs to be repositioned. For example, if the Fund’s benchmark has risen on a given day, net assets of the Fund should fall. As a result, inverse exposure will need to be decreased. Conversely, if the Fund’s benchmark has fallen on a given day, net assets of the Fund should rise. As a result, inverse exposure will need to be increased. Daily rebalancing and the compounding of each day’s return over time means that the return of the Fund for a period longer than a single day will be the result of each day’s returns compounded over the period, which will very likely differ from two times the inverse (-2x) of the return of the Fund’s benchmark for the same period. The Fund will lose money if its benchmark’s performance is flat over time, and it is possible for the Fund to lose money over time regardless of the performance of the benchmark, as a result of daily rebalancing, the benchmark’s volatility and compounding.
The Fund generally invests in Financial Instruments (i.e., instruments whose value is derived from the value of an underlying asset, rate or benchmark (such asset, rate or benchmark, a “Reference Asset”)), including futures contracts, swap agreements, forward contracts and other instruments in order to gain exposure to its benchmark. Financial Instruments also are used to produce economically “inverse leveraged” investment results for the Fund.
In seeking to achieve the Fund’s investment objectives, the Sponsor uses a mathematical approach to investing. Using this approach, the Sponsor determines the type, quantity and mix of investment positions that the Sponsor believes, in combination, should produce daily returns consistent with the Fund’s objectives. The Sponsor relies upon a pre-determined model to generate orders that result in repositioning the Fund’s investments in accordance with its investment objectives. The mathematical model is engineered during the product development phase prior to the Fund’s launch and is adjusted, when necessary, in order to help the Fund achieve its investment objective. Changes to the mathematical model may occur at any time without notice to shareholders.
- 1 -
Table of Contents
The Sponsor does not invest the assets of the Fund based on its view of the investment merit of a particular investment, other than for cash management purposes, nor does it conduct conventional commodity research or analysis, or forecast market movement or trends in managing the assets of the Fund. The Fund generally seeks to remain fully invested at all times in Financial Instruments and money market instruments that, in combination, provide exposure to its underlying benchmark consistent with its investment objective without regard to market conditions, trends or direction.
ProShare Capital Management LLC, a Maryland limited liability company, serves as the Trust’s Sponsor and commodity pool operator. The principal office of the Sponsor and the Fund is located at 7501 Wisconsin Avenue, East Tower, 10th Floor, Bethesda, Maryland 20814. The telephone number of the Sponsor and the Fund is (240) 497-6400.
The Fund is listed below along with its benchmark:
| Fund Name |
Benchmark | |
| ProShares UltraShort Gold | The daily performance of gold bullion as measured by the U.S. dollar p.m. LBMA Gold Price |
Purchases and Sales in the Secondary Market, on NYSE Arca
The Shares of the Fund are listed on NYSE Arca (the “Exchange”) under the ticker symbol GLL. Secondary market purchases and sales of Shares are subject to ordinary brokerage commissions and charges.
Creation and Redemption Transactions
Only an Authorized Participant may purchase (i.e., create) or redeem Creation Units in the Fund. Creation Units in the Fund are expected to be created when there is sufficient demand for Shares in the Fund that the market price per Share is at a premium to the NAV per Share. Authorized Participants will likely sell such Shares to the public at prices that are expected to reflect, among other factors, the trading price of the Shares of the Fund and the supply of and demand for the Shares at the time of sale and are expected to fall between the NAV and the trading price of the Shares at the time of sale. Similarly, it is expected that Creation Units in the Fund will be redeemed when the market price per Share of the Fund is at a discount to the NAV per Share. The Sponsor expects that the exploitation of such arbitrage opportunities by Authorized Participants and their clients and customers will tend to cause the public trading price of the Shares to track the NAV per Share of the Fund closely over time. Retail investors seeking to purchase or sell Shares on any day are expected to effect such transactions in the secondary market at the market price per Share, rather than in connection with the creation or redemption of Creation Units.
A creation transaction, which is subject to acceptance by SEI, generally takes place when an Authorized Participant deposits a specified amount of cash (unless as provided otherwise in this Prospectus) in exchange for a specified number of Creation Units. Similarly, Shares can be redeemed only in Creation Units, generally for cash (unless as provided otherwise in this Prospectus). Except when aggregated in Creation Units, Shares are not redeemable. The prices at which creations and redemptions occur are based on the next calculation of the NAV after an order is received in a form described in the Authorized Participant Agreement and the related Authorized Participant Handbook. The manner by which Creation Units are purchased and redeemed is dictated by the terms of the Authorized Participant Agreement and Authorized Participant Handbook. By placing a purchase order, an Authorized Participant agrees to deposit cash (unless as provided otherwise in this Prospectus) with BBH&Co., the custodian of the Fund.
Creation and redemption transactions must be placed each day with SEI by the create/redeem cut-off time (stated below), or earlier if the Exchange or other exchange material to the valuation or operation of the Fund closes before such cut-off time, to receive that day’s NAV. Because the primary trading session for gold has a different fixing time than U.S. Equity markets, the NAV calculation time is a follows:
| Underlying Benchmark |
Create/Redeem Cut-off |
NAV Calculation Time* | ||
| Gold | 9:30 a.m. (Eastern Time) | 10:00 a.m. (Eastern Time) |
| * | This time may vary due to differences in when daylight savings time is effective between London and New York. The actual times equate to 3:00 p.m. London time for gold. |
- 2 -
Table of Contents
The Fund will be profitable only if returns from its investments exceed its “breakeven amount.” The estimated breakeven amount is set forth in the table below. The estimated breakeven amount represents the estimated amount of trading income that the Fund would need to achieve during one year to offset the Fund’s estimated fees, costs and expenses, net of any interest income earned by the Fund on its investments. It is not possible to predict whether the Fund will break even at the end of the first twelve months of an investment or any other period. See “Charges—Breakeven Table,” beginning on page 28, for more detailed tables showing Breakeven Amounts.
| Fund Name |
Breakeven Amount (% Per Annum of Average Daily NAV)* |
Assumed Selling Price Per Share* |
Breakeven Amount ($ for the Assumed Selling Price Per Share)* |
|||||||||
| ProShares UltraShort Gold |
1.13 | $ | 25.00 | 0.29 | ||||||||
| * | The breakeven analysis set forth in this table assumes that the Shares have a constant month-end NAV, and assumes that the selling price per Share will equal the NAV. The analysis is based on an assumed NAV per Share of the Fund as listed in the table above under Assumed Selling Price Per Share. The actual NAV of the Fund differs and is likely to change on a daily basis. The numbers in this chart have been rounded to the nearest 0.01. |
Please note that the Fund will distribute to shareholders a Schedule K-1 that will contain information regarding the income and expense items of the Fund. The Schedule K-1 is a complex form and shareholders may find that preparing tax returns may require additional time or may require the assistance of an accountant or other tax preparer, at an additional expense to the shareholder.
- 3 -
Table of Contents
Before investors invest in the Shares, they should be aware that there are various risks. Investors should consider carefully the risks described below together with all of the other information included in this Prospectus, as well as information found in documents incorporated by reference in this Prospectus, before they decide to purchase any Shares. These risk factors may be amended, supplemented or superseded from time to time by risk factors contained in any periodic report, prospectus supplement, post-effective amendment or in other reports filed with the SEC in the future.
Key Risks Related to the Fund
Due to the compounding of daily returns, the Fund’s returns over periods longer than a single day will likely differ in amount and possibly even direction from the Fund multiple times the benchmark return for the period.
The Fund is “geared” in the sense that it has an investment objective to correspond (before fees and expenses) to an inverse multiple (i.e., -2x) of the performance of the benchmark for a given day. The Fund seeks investment results for a single day only, as measured from NAV calculation time to NAV calculation time, and not for any other period (see “Summary—Creation and Redemption Transactions” for the NAV calculation time of the Fund). The return of the Fund for a period longer than a single day is the result of its return for each day compounded over the period, and usually will differ from two times the inverse (-2x) of the return of the Fund’s benchmark for the same period. The Fund will lose money if its benchmark’s performance is flat over time, and it is possible for the Fund to lose money over time regardless of the performance of the benchmark, as a result of daily rebalancing, the benchmark’s volatility and compounding. Longer holding periods, higher benchmark volatility, inverse exposure and greater leverage each affect the impact of compounding on the Fund’s returns. Daily compounding of the Fund’s investment returns can dramatically and adversely affect its longer-term performance during periods of high volatility. Volatility may be at least as important to the Fund’s return for a period as the return of the Fund’s underlying benchmark.
The Fund uses leverage and should produce returns for a single day that are more volatile than that of its benchmark. For example, the return for a single day of the Fund with a -2x multiple should be approximately two times the inverse (-2x) of the return that would be expected of a fund with an objective of matching the same benchmark. The Fund is not appropriate for all investors and presents different risks than other funds. The Fund uses leverage and is riskier than similarly benchmarked exchange-traded funds that do not use leverage. An investor should only consider an investment in the Fund if he or she understands the consequences of seeking daily inverse leveraged investment results for a single day. Daily objective geared funds, if used properly and in conjunction with the investor’s view on the future direction and volatility of the markets, can be useful tools for investors who want to manage their exposure to various markets and market segments and who are willing to monitor and/or periodically rebalance their portfolios. Shareholders who invest in the Fund should actively manage and monitor their investments, as frequently as daily.
- 4 -
Table of Contents
The hypothetical examples below illustrate how daily geared fund returns can behave for periods longer than a single day. Each involves a hypothetical fund XYZ that seeks to double the inverse of the daily performance of benchmark XYZ. On each day, fund XYZ performs in line with its objective (two times the inverse (-2x) of the benchmark’s daily performance before fees and expenses). Notice that, in the first example (showing an overall benchmark loss for the period), over the entire seven-day period, the fund’s total return is less than two times the inverse of the loss of the period return of the benchmark. For the seven-day period, benchmark XYZ lost 3.26% while fund XYZ gained 4.86% (versus -6.52% (or 2 x -3.26%)).
| Benchmark XYZ | Fund XYZ | |||||||||||||||
| Level | Daily Performance |
Daily Performance |
Net Asset Value |
|||||||||||||
| Start |
100.00 | $ | 100.00 | |||||||||||||
| Day 1 |
97.00 | -3.00 | % | -6.00 | % | $ | 106.00 | |||||||||
| Day 2 |
99.91 | 3.00 | % | 6.00 | % | $ | 99.64 | |||||||||
| Day 3 |
96.91 | -3.00 | % | -6.00 | % | $ | 105.62 | |||||||||
| Day 4 |
99.82 | 3.00 | % | 6.00 | % | $ | 99.28 | |||||||||
| Day 5 |
96.83 | -3.00 | % | -6.00 | % | $ | 105.24 | |||||||||
| Day 6 |
99.73 | 3.00 | % | 6.00 | % | $ | 98.92 | |||||||||
| Day 7 |
96.74 | -3.00 | % | -6.00 | % | $ | 104.86 | |||||||||
| Total Return |
-3.26 | % | 4.86 | % | ||||||||||||
Similarly, in another example (showing an overall benchmark gain for the period), over the entire seven-day period, the fund’s total loss is considerably more than double the inverse of the period return of the benchmark. For the seven-day period, benchmark XYZ gained 2.72% while fund XYZ lost 7.01% (versus -5.44% (or -2 x 2.72%)).
| Benchmark XYZ | Fund XYZ | |||||||||||||||
| Level | Daily Performance |
Daily Performance |
Net Asset Value |
|||||||||||||
| Start |
100.00 | $ | 100.00 | |||||||||||||
| Day 1 |
103.00 | 3.00 | % | 6.00 | % | $ | 94.00 | |||||||||
| Day 2 |
99.91 | -3.00 | % | -6.00 | % | $ | 99.64 | |||||||||
| Day 3 |
102.91 | 3.00 | % | 6.00 | % | $ | 93.66 | |||||||||
| Day 4 |
99.82 | -3.00 | % | -6.00 | % | $ | 99.28 | |||||||||
| Day 5 |
102.81 | 3.00 | % | 6.00 | % | $ | 93.32 | |||||||||
| Day 6 |
99.73 | -3.00 | % | -6.00 | % | $ | 98.92 | |||||||||
| Day 7 |
102.72 | 3.00 | % | 6.00 | % | $ | 92.99 | |||||||||
| Total Return |
2.72 | % | -7.01 | % | ||||||||||||
These effects are caused by compounding, which exists in all investments, but has a more significant impact in geared funds. In general, during periods of higher benchmark volatility, compounding will cause the Ultra Short Fund’s results for periods longer than a single day to be higher than two times the inverse (-2x) of the return of the benchmark. This effect becomes more pronounced as volatility increases. Conversely, in periods of lower benchmark volatility (particularly when combined with higher benchmark returns), the Ultra Short Fund’s returns over longer periods can be lower than two times the inverse (-2x) of the return of the benchmark. Actual results for a particular period, before fees and expenses, are also dependent on the magnitude of the benchmark return in addition to the benchmark volatility.
The graphs that follow illustrate this point. Each of the graphs shows a simulated hypothetical one year performance of a benchmark compared with the performance of a geared fund that perfectly achieves its geared daily investment objective. The graphs demonstrate that, for periods greater than a single day, a geared fund is likely to underperform or overperform (but not match) the inverse of the benchmark performance times the multiple stated as the daily fund objective. Investors should understand the consequences of holding daily rebalanced funds for periods longer than a single day and should actively manage and monitor their investments, as frequently as daily. A one-year period is used solely for illustrative purposes. Deviations from the inverse of the benchmark return times the fund multiple can occur over periods as short as two days (each day as measured from NAV to NAV) and may also occur in periods shorter than a single day (when measured intraday as opposed to NAV to NAV). See “— Intraday Price/Performance Risk” below for additional details. To isolate the impact of daily inverse leveraged exposure, these graphs assume: a) no fund expenses or transaction costs; b) borrowing/lending rates (to obtain required inverse leveraged exposure) and cash reinvestment rates of zero percent; and c) the fund consistently maintaining perfect exposure (-2x) as of the fund’s NAV time each day. If these assumptions were different, the fund’s performance would be different than that shown. If fund expenses, transaction costs and financing expenses greater than zero percent were included, the fund’s performance would also be different than shown. Each of the graphs also assumes a volatility rate of 17%, which is an approximate average of the five-year historical volatility rate of the daily performance of gold bullion as measured by the U.S. dollar p.m. LBMA Gold Price as of December 31, 2016. The benchmark’s volatility rate is a statistical measure of the magnitude of fluctuations in its returns.
- 5 -
Table of Contents
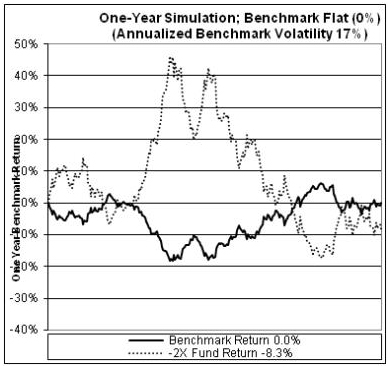
The graph above shows a scenario where the benchmark, which exhibits day-to-day volatility, is flat or trendless over the year (i.e., provides a return of 0% over the course of the year) and the Fund (-2x) is down.
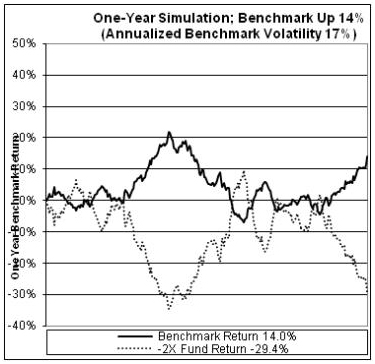
The graph above shows a scenario where the benchmark, which exhibits day-to-day volatility, is up over the year and the Fund (-2x) is down more than two times the inverse of the benchmark.
- 6 -
Table of Contents
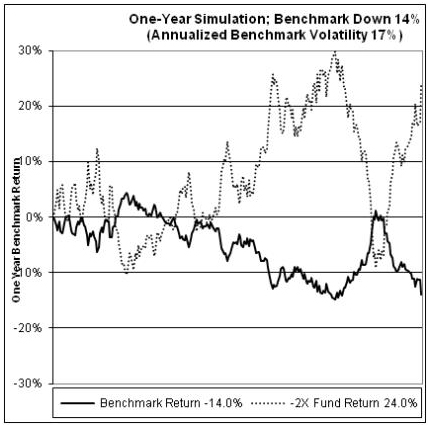
The graph above shows a scenario where the benchmark, which exhibits day-to-day volatility, is down over the year and the Fund (-2x) is up less than two times the inverse of the benchmark.
- 7 -
Table of Contents
The historical five-year average volatility of the Fund’s benchmark is as set forth in the table below.
| Benchmark |
Historical Five-Year Average Volatility Rate as of December 31, 2016 |
|||
| The daily performance of gold bullion as measured by the U.S. dollar LBMA Gold Price |
16.71 | % | ||
The table below illustrates the impact of two factors that affect a geared fund’s performance: benchmark volatility and benchmark return. Benchmark volatility is a statistical measure of the magnitude of fluctuations in the returns of a benchmark and is calculated as the standard deviation of the natural logarithms of one plus the benchmark return (calculated daily), multiplied by the square root of the number of trading days per year (assumed to be 252). The table shows estimated fund returns for a number of combinations of benchmark volatility and benchmark return over a one-year period. To isolate the impact of daily inverse leveraged exposure, the graph assumes: a) no Fund expenses or transaction costs; b) borrowing/lending rates of zero percent (to obtain required inverse leveraged exposure) and cash reinvestment rates of zero percent; and c) the Fund consistently maintaining perfect exposure (-2x) as of the Fund’s NAV calculation time each day. If these assumptions were different, the Fund’s performance would be different than that shown. If Fund expenses, transaction costs and financing expenses were included, the Fund’s performance would be different than shown. The table below shows an example in which the geared fund has an investment objective to correspond (before fees and expenses) to the inverse of two times (-2x) the daily performance of a benchmark. The geared fund could incorrectly be expected to achieve a -20% return on a yearly basis if the benchmark return was 10%, absent the effects of compounding. However, as the table shows, with a benchmark volatility of 40%, such a fund would return -48.9%. In the chart below, shaded areas represent those scenarios where a geared fund with the investment objective described will outperform (i.e., return more than) the benchmark performance times the stated multiple in the Fund’s investment objective; conversely areas not shaded represent those scenarios where the fund will underperform (i.e., return less than) the benchmark performance times the multiple stated as the daily fund objective.
- 8 -
Table of Contents
Estimated Fund Return Over One Year When the Fund Objective is to Seek Daily Investment Results, Before Fees and Expenses, that Correspond to Two Times the Inverse (-2x) of the Daily Performance of a Benchmark.
| One Year Benchmark Performance |
Two Times Inverse (-2x) of One Year Benchmark Performance |
Benchmark Volatility | ||||||||||||||||||||||||||||||||||||||||||||||||||||||||||||||||
| 0% | 5% | 10% | 15% | 20% | 25% | 30% | 35% | 40% | 45% | 50% | 55% | 60% | 65% | 70% | ||||||||||||||||||||||||||||||||||||||||||||||||||||
| -60 | % | 120 | % | 525.0 | % | 520.3 | % | 506.5 | % | 484.2 | % | 454.3 | % | 418.1 | % | 377.1 | % | 332.8 | % | 286.7 | % | 240.4 | % | 195.2 | % | 152.2 | % | 112.2 | % | 76.0 | % | 43.7 | % | |||||||||||||||||||||||||||||||||
| -55 | % | 110 | % | 393.8 | % | 390.1 | % | 379.2 | % | 361.6 | % | 338.0 | % | 309.4 | % | 277.0 | % | 242.0 | % | 205.6 | % | 169.0 | % | 133.3 | % | 99.3 | % | 67.7 | % | 39.0 | % | 13.5 | % | |||||||||||||||||||||||||||||||||
| -50 | % | 100 | % | 300.0 | % | 297.0 | % | 288.2 | % | 273.9 | % | 254.8 | % | 231.6 | % | 205.4 | % | 177.0 | % | 147.5 | % | 117.9 | % | 88.9 | % | 61.4 | % | 35.8 | % | 12.6 | % | -8.0 | % | |||||||||||||||||||||||||||||||||
| -45 | % | 90 | % | 230.6 | % | 228.1 | % | 220.8 | % | 209.0 | % | 193.2 | % | 174.1 | % | 152.4 | % | 128.9 | % | 104.6 | % | 80.1 | % | 56.2 | % | 33.4 | % | 12.3 | % | -6.9 | % | -24.0 | % | |||||||||||||||||||||||||||||||||
| -40 | % | 80 | % | 177.8 | % | 175.7 | % | 169.6 | % | 159.6 | % | 146.4 | % | 130.3 | % | 112.0 | % | 92.4 | % | 71.9 | % | 51.3 | % | 31.2 | % | 12.1 | % | -5.7 | % | -21.8 | % | -36.1 | % | |||||||||||||||||||||||||||||||||
| -35 | % | 70 | % | 136.7 | % | 134.9 | % | 129.7 | % | 121.2 | % | 109.9 | % | 96.2 | % | 80.7 | % | 63.9 | % | 46.5 | % | 28.9 | % | 11.8 | % | -4.5 | % | -19.6 | % | -33.4 | % | -45.6 | % | |||||||||||||||||||||||||||||||||
| -30 | % | 60 | % | 104.1 | % | 102.6 | % | 98.1 | % | 90.8 | % | 81.0 | % | 69.2 | % | 55.8 | % | 41.3 | % | 26.3 | % | 11.2 | % | -3.6 | % | -17.6 | % | -30.7 | % | -42.5 | % | -53.1 | % | |||||||||||||||||||||||||||||||||
| -25 | % | 50 | % | 77.8 | % | 76.4 | % | 72.5 | % | 66.2 | % | 57.7 | % | 47.4 | % | 35.7 | % | 23.1 | % | 10.0 | % | -3.2 | % | -16.0 | % | -28.3 | % | -39.6 | % | -49.9 | % | -59.1 | % | |||||||||||||||||||||||||||||||||
| -20 | % | 40 | % | 56.3 | % | 55.1 | % | 51.6 | % | 46.1 | % | 38.6 | % | 29.5 | % | 19.3 | % | 8.2 | % | -3.3 | % | -14.9 | % | -26.2 | % | -36.9 | % | -46.9 | % | -56.0 | % | -64.1 | % | |||||||||||||||||||||||||||||||||
| -15 | % | 30 | % | 38.4 | % | 37.4 | % | 34.3 | % | 29.4 | % | 22.8 | % | 14.7 | % | 5.7 | % | -4.2 | % | -14.4 | % | -24.6 | % | -34.6 | % | -44.1 | % | -53.0 | % | -61.0 | % | -68.2 | % | |||||||||||||||||||||||||||||||||
| -10 | % | 20 | % | 23.5 | % | 22.5 | % | 19.8 | % | 15.4 | % | 9.5 | % | 2.3 | % | -5.8 | % | -14.5 | % | -23.6 | % | -32.8 | % | -41.7 | % | -50.2 | % | -58.1 | % | -65.2 | % | -71.6 | % | |||||||||||||||||||||||||||||||||
| -5 | % | 10 | % | 10.8 | % | 10.0 | % | 7.5 | % | 3.6 | % | -1.7 | % | -8.1 | % | -15.4 | % | -23.3 | % | -31.4 | % | -39.6 | % | -47.7 | % | -55.3 | % | -62.4 | % | -68.8 | % | -74.5 | % | |||||||||||||||||||||||||||||||||
| 0 | % | 0 | % | 0.0 | % | -0.7 | % | -3.0 | % | -6.5 | % | -11.3 | % | -17.1 | % | -23.7 | % | -30.8 | % | -38.1 | % | -45.5 | % | -52.8 | % | -59.6 | % | -66.0 | % | -71.8 | % | -77.0 | % | |||||||||||||||||||||||||||||||||
| 5 | % | -10 | % | -9.3 | % | -10.0 | % | -12.0 | % | -15.2 | % | -19.6 | % | -24.8 | % | -30.8 | % | -37.2 | % | -43.9 | % | -50.6 | % | -57.2 | % | -63.4 | % | -69.2 | % | -74.5 | % | -79.1 | % | |||||||||||||||||||||||||||||||||
| 10 | % | -20 | % | -17.4 | % | -18.0 | % | -19.8 | % | -22.7 | % | -26.7 | % | -31.5 | % | -36.9 | % | -42.8 | % | -48.9 | % | -55.0 | % | -61.0 | % | -66.7 | % | -71.9 | % | -76.7 | % | -81.0 | % | |||||||||||||||||||||||||||||||||
| 15 | % | -30 | % | -24.4 | % | -25.0 | % | -26.6 | % | -29.3 | % | -32.9 | % | -37.3 | % | -42.3 | % | -47.6 | % | -53.2 | % | -58.8 | % | -64.3 | % | -69.5 | % | -74.3 | % | -78.7 | % | -82.6 | % | |||||||||||||||||||||||||||||||||
| 20 | % | -40 | % | -30.6 | % | -31.1 | % | -32.6 | % | -35.1 | % | -38.4 | % | -42.4 | % | -47.0 | % | -51.9 | % | -57.0 | % | -62.2 | % | -67.2 | % | -72.0 | % | -76.4 | % | -80.4 | % | -84.0 | % | |||||||||||||||||||||||||||||||||
| 25 | % | -50 | % | -36.0 | % | -36.5 | % | -37.9 | % | -40.2 | % | -43.2 | % | -46.9 | % | -51.1 | % | -55.7 | % | -60.4 | % | -65.1 | % | -69.8 | % | -74.2 | % | -78.3 | % | -82.0 | % | -85.3 | % | |||||||||||||||||||||||||||||||||
| 30 | % | -60 | % | -40.8 | % | -41.3 | % | -42.6 | % | -44.7 | % | -47.5 | % | -50.9 | % | -54.8 | % | -59.0 | % | -63.4 | % | -67.8 | % | -72.0 | % | -76.1 | % | -79.9 | % | -83.3 | % | -86.4 | % | |||||||||||||||||||||||||||||||||
| 35 | % | -70 | % | -45.1 | % | -45.5 | % | -46.8 | % | -48.7 | % | -51.3 | % | -54.5 | % | -58.1 | % | -62.0 | % | -66.0 | % | -70.1 | % | -74.1 | % | -77.9 | % | -81.4 | % | -84.6 | % | -87.4 | % | |||||||||||||||||||||||||||||||||
| 40 | % | -80 | % | -49.0 | % | -49.4 | % | -50.5 | % | -52.3 | % | -54.7 | % | -57.7 | % | -61.1 | % | -64.7 | % | -68.4 | % | -72.2 | % | -75.9 | % | -79.4 | % | -82.7 | % | -85.6 | % | -88.3 | % | |||||||||||||||||||||||||||||||||
| 45 | % | -90 | % | -52.4 | % | -52.8 | % | -53.8 | % | -55.5 | % | -57.8 | % | -60.6 | % | -63.7 | % | -67.1 | % | -70.6 | % | -74.1 | % | -77.5 | % | -80.8 | % | -83.8 | % | -86.6 | % | -89.1 | % | |||||||||||||||||||||||||||||||||
| 50 | % | -100 | % | -55.6 | % | -55.9 | % | -56.9 | % | -58.5 | % | -60.6 | % | -63.2 | % | -66.1 | % | -69.2 | % | -72.5 | % | -75.8 | % | -79.0 | % | -82.1 | % | -84.9 | % | -87.5 | % | -89.8 | % | |||||||||||||||||||||||||||||||||
| 55 | % | -110 | % | -58.4 | % | -58.7 | % | -59.6 | % | -61.1 | % | -63.1 | % | -65.5 | % | -68.2 | % | -71.2 | % | -74.2 | % | -77.3 | % | -80.3 | % | -83.2 | % | -85.9 | % | -88.3 | % | -90.4 | % | |||||||||||||||||||||||||||||||||
| 60 | % | -120 | % | -60.9 | % | -61.2 | % | -62.1 | % | -63.5 | % | -65.4 | % | -67.6 | % | -70.2 | % | -73.0 | % | -75.8 | % | -78.7 | % | -81.5 | % | -84.2 | % | -86.7 | % | -89.0 | % | -91.0 | % | |||||||||||||||||||||||||||||||||
The foregoing table is intended to isolate the effect of benchmark volatility and benchmark performance on the return of an inverse leveraged fund. The Fund’s actual returns may be significantly greater or less than the returns shown above as a result of any of the factors discussed above or under the below risk factor describing correlation risks.
- 9 -
Table of Contents
Correlation Risks
While the Fund seeks to meet its investment objectives, there is no guarantee it will do so. Factors that may affect the Fund’s ability to meet its investment objective include: (1) the Sponsor’s ability to purchase and sell Financial Instruments in a manner that correlates to the Fund’s objective; (2) an imperfect correlation between the performance of the Financial Instruments held by the Fund and the performance of the benchmark; (3) bid-ask spreads on such Financial Instruments; (4) fees, expenses, transaction costs, financing costs associated with the use of Financial Instruments and commission costs; (5) holding Financial Instruments traded in a market that has become illiquid or disrupted; (6) the Fund’s Share prices being rounded to the nearest cent and/or valuation methodologies; (7) changes to a benchmark that are not disseminated in advance; (8) the need to conform the Fund’s portfolio holdings to comply with investment restrictions or policies or regulatory or tax law requirements; (9) early and unanticipated closings of the markets on which the holdings of the Fund trade, resulting in the inability of the Fund to execute intended portfolio transactions; (10) accounting standards; and (11) differences caused by the Fund obtaining exposure to only a representative sample of the benchmark, overweighting or underweighting the benchmark or obtaining exposure to assets that are not included in a benchmark.
Further, in order to achieve a high degree of correlation with the underlying benchmark, the Fund seeks to rebalance its portfolio daily to keep exposure consistent with its investment objective. Being materially under- or overexposed to the benchmark may prevent the Fund from achieving a high degree of correlation with its benchmark. Market disruptions or closures, large amounts of assets into or out of the Fund, regulatory restrictions or extreme market volatility will adversely affect the Fund’s ability to adjust exposure to requisite levels. The target amount of portfolio exposure is impacted dynamically by the benchmark’s movements during each day. Because of this, it is unlikely that the Fund will be perfectly exposed (i.e., -2x) at the end of each day, and the likelihood of being materially under- or overexposed is higher on days when the benchmark levels are volatile near the close of the trading day.
In addition, unlike other funds that do not rebalance their portfolios as frequently, the Fund may be subject to increased trading costs associated with daily portfolio rebalancings in order to maintain appropriate exposure to the underlying benchmark. Such costs include commissions paid to the FCMs, and may vary by FCM. The effects of these trading costs have been estimated and included in the Breakeven Table. See “Charges—Breakeven Table” below.
Intraday Price/Performance Risk
The Fund is typically rebalanced at or about the time of its NAV calculation time (which may be other than at the close of the U.S. equity markets). As such, the intraday position of the Fund will generally be different from the Fund’s stated daily investment objective (i.e., -2x). When Shares are bought intraday, the performance of the Fund’s Shares until the Fund’s next NAV calculation will generally be greater than or less than the Fund’s stated daily inverse multiple.
The use of inverse leveraged positions could result in the total loss of an investor’s investment
The Fund utilizes leverage in seeking to achieve its investment objectives and will lose more money in market environments adverse to its daily investment objectives than funds that do not employ leverage. The use of inverse leveraged positions could result in the total loss of an investor’s investment.
For example, because the Fund offered hereby includes a two times the inverse (-2x) multiplier, a single-day movement in the benchmark approaching +50% at any point in the day could result in the total loss or almost total loss of an investor’s investment, even if the Fund’s benchmark subsequently moves in an opposite direction, eliminating all or a portion of the movement. This would be the case with upward single day or intraday movements in the benchmark of the Fund, even if the underlying benchmark maintains a level greater than zero at all times.
The Fund seeks to provide investment return results that correspond (before fees and expenses) to an inverse multiple of the daily performance of the benchmark at all times, even during periods when the applicable benchmark is flat as well as when the benchmark is moving in a manner which causes the Fund’s NAV to decline, thereby causing losses to the Fund.
Other than for cash management purposes, the Fund is not actively managed by traditional methods (e.g., by effecting changes in the composition of a portfolio on the basis of judgments relating to economic, financial and market considerations with a view toward obtaining positive results under all market conditions). Rather, the Sponsor seeks to cause the NAV to track the daily performance of a benchmark in accordance with the Fund’s investment objective, even during periods in which the benchmark is flat or moving in a manner which causes the NAV of the Fund to decline. It is possible to lose money over time regardless of the performance of the benchmark, due to the effects of daily rebalancing, volatility and compounding (see the risk factors above for additional details).
- 10 -
Table of Contents
Risks Specific to the Gold Markets
A number of factors may affect the price of gold generally and, in turn, the Financial Instruments and other assets, if any, owned by the Fund, including, but not limited to:
| • | Significant increases or decreases in the available supply of gold due to natural or technological factors. Natural factors would include depletion of known cost-effective sources for gold or the impact of severe weather on the ability to produce or distribute gold. Technological factors, such as increases in availability created by new or improved extraction and processing equipment and methods or decreases caused by failure or unavailability of major processing equipment also materially influence the supply of gold. |
| • | Significant increases or decreases in the demand for gold due to natural or technological factors. Natural factors would include such events as unusual geologic or climatological conditions impacting the demand for commodities. Technological factors may include such developments as substitutes for particular commodities. |
| • | A significant change in the attitude of speculators and investors towards gold. Should the speculative community take a negative or positive view towards gold, it could cause a change in world prices of gold. In such a case, the price of Shares based upon the benchmark related to the Fund will be affected. |
| • | Large purchases or sales of gold by the official sector. Governments and large institutions have large gold holdings or may establish major gold positions. For example, a significant portion of the aggregate world gold holdings is owned by governments, central banks and related institutions. If one or more of these institutions decides to buy or sell gold in amounts large enough to cause a change in world prices, the price of Shares based upon the benchmark related to the Fund will be affected. |
| • | Other political factors. In addition to the organized political and institutional trading-related activities described above, peaceful political activity such as imposition of regulations or entry into trade treaties, as well as political disruptions caused by societal breakdown, insurrection and/or war may greatly influence gold prices. |
| • | A significant increase or decrease in gold hedging activity by gold producers. Should there be an increase or decrease in the level of hedge activity of gold producing companies, countries and/or organizations, it could cause a change in world prices of gold, causing the price of Shares based upon the benchmark to be affected. |
| • | The recent proliferation of gold-linked, exchange-traded products and their unknown effect on the gold markets. |
These factors interrelate in complex ways, and the effect of one factor on the market value of the Fund may offset or enhance the effect of another factor. Daily increases in the value of a gold will negatively impact the daily performance of Shares of the Fund.
The Fund does not invest in gold bullion itself as certain other exchange-traded products do. Rather, the Fund uses Financial Instruments to gain exposure to gold bullion. Not investing directly in gold bullion may introduce additional tracking error and the Fund is subject to the effects of contango and backwardation as described below.
Using Financial Instruments such as swaps, forwards and futures in an effort to replicate the inverse performance of gold bullion may introduce additional tracking error to the performance of the Fund. While prices of Financial Instruments are, as a rule, related to the prices of an underlying cash market, they are not perfectly correlated. In addition, the use of Financial Instruments causes the need to roll futures or forward contracts as described above and the resulting possibility that contango or backwardation can occur. Gold historically exhibits contango markets during most periods. Although the existence of historically prevalent contango markets would be expected to be beneficial to the Fund, there can be no assurance that such contango markets will always exist. Alternatively, the existence of backwardated markets would be expected to adversely impact the Fund.
Potential negative impact from rolling futures positions.
The Fund invests in or has an exposure to futures contracts and is subject to risks related to rolling. The contractual obligations of a buyer or seller holding a futures contract to expiration may be satisfied by settling in cash as designated in the contract specifications. Alternatively, futures contracts may be closed out prior to expiration by making an offsetting sale or purchase of an identical futures contract on the same or linked exchange before the designated date of settlement. Once this date is reached, the futures contract “expires.” As the futures contracts held by the Fund near expiration, they are generally closed out and replaced by contracts with a later expiration. This process is referred to as “rolling.” The Fund does not intend to hold futures contracts through expiration, but instead to “roll” its positions. Accordingly, the Fund is subject to the risks of rolling.
When the market for these contracts is such that the prices are higher in the more distant delivery months than in the nearer delivery months, the sale during the course of the “rolling process” of the more nearby contract would take place at a price that is lower than the price of the more distant contract. This pattern of higher futures prices for longer expiration futures contracts is often referred to as “contango.” Alternatively, when the market for these contracts is such that the prices are higher in the nearer months
- 11 -
Table of Contents
than in the more distant months, the sale during the course of the “rolling process” of the more nearby contract would take place at a price that is higher than the price of the more distant contract. This pattern of higher futures prices for shorter expiration futures contracts is referred to as “backwardation.” The presence of contango in certain futures contracts at the time of rolling would be expected to positively affect the Fund. Similarly, the presence of backwardation in certain futures contracts at the time of rolling such contracts would be expected to adversely affect the Fund.
There have been extended periods in which contango or backwardation has existed in the futures contract markets for various types of futures contracts, and such periods can be expected to occur in the future. These extended periods have in the past and can in the future cause significant losses for the Fund, and these periods can have as much or more impact over time than movements in the level of the Fund’s benchmark.
The assets that the Fund invests in can be highly volatile and the Fund may experience large losses when buying, selling or holding such instruments.
Investments linked to commodity markets can be highly volatile compared to investments in traditional securities and the Fund may experience large losses. High volatility may have an adverse impact on the Fund beyond the impact of any performance-based losses of the underlying benchmark.
Because the underlying commodity of the Fund’s benchmark is limited to a single commodity, the Fund may be more volatile than other products, which could adversely affect an investment in the Shares.
The underlying benchmark of the Fund is solely concentrated in a single commodity. Investors should be aware that other benchmarks are more diversified in terms of both the number and variety of investments included. Concentration in a single commodity may result in a greater degree of volatility in a benchmark and the NAV of the Fund which corresponds to the benchmark under specific market conditions and over time.
Credit and liquidity risks associated with collateralized repurchase agreements.
A portion of the Fund’s assets may be held in cash and/or U.S. Treasury securities, agency securities, or other high credit quality, short-term fixed-income or similar securities (such as shares of money market funds and collateralized repurchase agreements). These securities may be used as collateral for the Fund’s trading in Financial Instruments and may include collateralized repurchase agreements or pending the Fund’s investment in Financial Instruments. Collateralized repurchase agreements involve an agreement to purchase a security and to sell that security back to the original seller at an agreed-upon price. The resale price reflects the purchase price plus an agreed-upon incremental amount which is unrelated to the coupon rate or maturity of the purchased security. As protection against the risk that the original seller will not fulfill its obligation, the buyer receives collateral marked-to-market daily, and maintained at a value at least equal to the sale price plus the accrued incremental amount. Although the collateralized repurchase agreements that the Fund enters into require that counterparties (which act as original sellers) overcollateralize the amount owed to the Fund with U.S. Treasury securities and/or agency securities, there is a risk that such collateral could decline in price at the same time that the counterparty defaults on its obligation to repurchase the security. If this occurs, the Fund may incur losses or delays in receiving proceeds. To minimize these risks, the Fund typically enters into transactions only with major, global financial institutions. As of the date of this prospectus, it is expected that the Fund will hold less than 1% of its assets in collateralized repurchase agreements, however, such amounts may change from time to time.
Possible illiquid markets may exacerbate losses.
Financial Instruments cannot always be liquidated at the desired price. It is difficult to execute a trade at a specific price when there is a relatively small volume of buy and sell orders in a market. A market disruption can also make it difficult to liquidate a position or find a swap or forward contract counterparty at a reasonable cost.
Market illiquidity may cause losses for the Fund. The large size of the positions which the Fund may acquire increases the risk of illiquidity by both making its positions more difficult to liquidate and increasing the losses incurred while trying to do so. Any type of disruption or illiquidity will potentially be exacerbated due to the fact that the Fund will typically invest in Financial Instruments related to one benchmark, which is highly concentrated in a single commodity.
It may not be possible to gain exposure to the benchmark using exchange-traded Financial Instruments in the future.
The Fund may utilize exchange-traded Financial Instruments. It may not be possible to gain exposure to the benchmark with these Financial Instruments in the future. If these Financial Instruments cease to be traded on regulated exchanges, they may be replaced with Financial Instruments traded on trading facilities that are subject to lesser degrees of regulation or, in some cases, no substantive regulation. As a result, trading in such Financial Instruments, and the manner in which prices and volumes are reported by
- 12 -
Table of Contents
the relevant trading facilities, may not be subject to the provisions of, and the protections afforded by, the Commodity Exchange Act, as amended (the “CEA”), or other applicable statutes and related regulations, that govern trading on regulated U.S. futures exchanges, or similar statutes and regulations that govern trading on regulated U.K. futures exchanges. In addition, many electronic trading facilities have only recently initiated trading and do not have significant trading histories. As a result, the trading of contracts on such facilities may be subject to certain risks not presented by U.S. or U.K. exchange-traded futures contracts, including risks related to the liquidity and price histories of the relevant contracts.
Fees are charged regardless of the Fund’s returns and may result in depletion of assets.
The Fund is subject to the fees and expenses described herein which are payable irrespective of the Fund’s returns, as well as the effects of commissions, trading spreads, and embedded financing, borrowing costs and fees associated with swaps, forwards, futures contracts, and costs relating to the purchase of U.S. Treasury securities or similar high credit quality, short-term fixed-income or similar securities. Additional charges may include other fees as applicable.
The Fund may be subject to counterparty risks.
The Fund may use swap agreements and/or forward contracts as a means to achieve its investment objectives. The Fund may use either swap agreements and/or forward contracts referencing its benchmark and may use other swap agreements or forward contracts if such instruments tend to exhibit trading prices or returns that correlate with the benchmark and will further the investment objective of the Fund.
Swap agreements and forward contracts are generally traded in over-the-counter (“OTC”) markets and have only recently become subject to regulation by the CFTC. CFTC rules, however, do not cover all types of swap agreements and forward contracts. Investors, therefore, may not receive the protection of CFTC regulation or the statutory scheme of the CEA in connection with the Fund’s swap agreements or forward contracts. The lack of regulation in these markets could expose investors to significant losses under certain circumstances, including in the event of trading abuses or financial failure by participants.
The Fund will be subject to credit risk with respect to the counterparties to the derivatives contracts (whether a clearing corporation in the case of cleared instruments or another third party in the case of OTC uncleared instruments). Unlike in futures contracts, the counterparty to uncleared swap agreements or forward contracts is generally a single bank or other financial institution, rather than a clearing organization backed by a group of financial institutions. As a result, the Fund is subject to increased credit risk with respect to the amount it expects to receive from counterparties to uncleared swaps and forward contracts entered into as part of the Fund’s principal investment strategy. If a counterparty becomes bankrupt or otherwise fails to perform its obligations due to financial difficulties, the Fund could suffer significant losses on these contracts and the value of an investor’s investment in the Fund may decline.
The Fund has sought to mitigate these risks by generally requiring that the counterparties for the Fund agree to post collateral for the benefit of the Fund, marked to market daily, subject to certain minimum thresholds; however there are no limitations on the percentage of its assets the Fund may invest in swap agreements or forward contracts with a particular counterparty. To the extent any such collateral is insufficient or there are delays in accessing the collateral, the Fund will be exposed to counterparty risk as described above, including possible delays in recovering amounts as a result of bankruptcy proceedings. The Fund typically enters into transactions only with major, global financial institutions.
OTC swaps and forward contracts of the type that may be utilized by the Fund are less liquid than futures contracts because they are not traded on an exchange, do not have uniform terms and conditions, and are generally entered into based upon the creditworthiness of the parties and the availability of credit support, such as collateral, and in general, are not transferable without the consent of the counterparty. These agreements contain various conditions, events of default, termination events, covenants and representations. The triggering of certain events or the default on certain terms of the agreement could allow a party to terminate a transaction under the agreement and request immediate payment in an amount equal to the net positions owed the party under the agreement. For example, if the level of the Fund’s benchmark has a dramatic intraday move that would cause a material decline in the Fund’s NAV, the terms of the swap may permit the counterparty to immediately close out the transaction with the Fund. In that event, it may not be possible for the Fund to enter into another swap agreement or to invest in other Financial Instruments necessary to achieve the desired exposure consistent with the Fund’s objective. This, in turn, may prevent the Fund from achieving its investment objective, particularly if the level of the Fund’s benchmark reverses all or part of its intraday move by the end of the day. In addition, cleared derivatives transactions benefit from daily marking-to-market and settlement, and segregation and minimum capital requirements applicable to intermediaries. Transactions entered into directly between two counterparties generally do not benefit from such protections. This exposes the Fund to the risk that a counterparty will not settle a transaction in accordance with its terms and conditions because of a dispute over the terms of the contract (whether or not bona fide) or because of a credit or liquidity problem, thus causing the Fund to suffer a loss.
- 13 -
Table of Contents
As of the date of this Prospectus, the Fund’s approved counterparties for OTC swap agreements and forward contracts are: Deutsche Bank AG, UBS AG, Goldman Sachs International, Citibank NA and Société Générale. The Sponsor regularly reviews the performance of its counterparties for, among other things, creditworthiness and execution quality. In addition, the Sponsor periodically considers the addition of new counterparties. Thus, the list of counterparties noted above may change at any time. See pages 22 through 23 for more information about the Fund’s swap agreements and forward contracts. Each day, the Fund discloses its portfolio holdings as of the prior Business Day (as such term is defined in “Creation and Redemption of Shares—Creation Procedures” below). The Fund’s portfolio holdings identifies its counterparties, as applicable. This portfolio holdings information may be accessed through the web on the Sponsor’s website at www.ProShares.com.
More information about Deutsche Bank AG, including its current financial statements, may be found on the SEC’s EDGAR website under Central Index Key No (“CIK No.”) 0001159508 (for Deutsche Bank AG). More information about UBS AG, including its current financial statements, may also be found on the SEC’s EDGAR website under CIK No. 0001114446 (for UBS AG). More information about Goldman Sachs International, a U.K. broker-dealer and subsidiary of The Goldman Sachs Group, Inc., may also be found on the SEC’s EDGAR website under CIK No. 0000886982 (for The Goldman Sachs Group, Inc.). The Goldman Sachs Group, Inc. consolidates the financial statements of each of its subsidiaries, including Goldman Sachs International, with its own. More information about Citibank NA, including its current financial statements, may be found on the SEC’s EDGAR website under CIK No. 0000036684. More information about Société Générale, a French public limited company, including its current financial statements as filed with the AMF (the French securities regulator), may be found on Société Générale’s website. Please note that the references to third-party websites have been provided solely for informational purposes. Neither the Fund nor the Sponsor endorses or is responsible for the content or information contained on any third-party website, including with respect to any financial statements. In addition, neither the Fund nor the Sponsor makes any warranty, express or implied or assumes any legal liability or responsibility for the accuracy, completeness or usefulness of any such information. Each counterparty and/or any of its affiliates may be an Authorized Participant or shareholder of the Fund, subject to applicable law.
The counterparty risk for cleared derivatives transactions is generally lower than for uncleared OTC derivatives since generally a clearing organization becomes substituted for each counterparty to a cleared derivatives contract and, in effect, guarantees the parties’ performance under the contract as each party to a trade looks only to the clearing house for performance of financial obligations. However, there can be no assurance that the clearing house, or its members, will satisfy its obligations to the Fund.
Historical correlation trends between the Fund’s benchmark and other asset classes may not continue or may reverse, limiting or eliminating any potential diversification or other benefit from owning the Fund.
To the extent that an investor purchases the Fund seeking diversification benefits based on the historic correlation (whether positive or negative) between the returns of the Fund or its underlying benchmark and other asset classes, such historic correlation may not continue or may reverse itself. In this circumstance, the diversification or other benefits sought may be limited or non-existent.
Investors cannot be assured of the Sponsor’s continued services, the discontinuance of which may be detrimental to the Fund.
Investors cannot be assured that the Sponsor will be able to continue to service the Fund for any length of time. If the Sponsor discontinues its activities on behalf of the Fund, the Fund may be adversely affected, as there may be no entity servicing the Fund for a period of time. If the Sponsor’s registrations with the CFTC or memberships in the NFA were revoked or suspended, the Sponsor would no longer be able to provide services and/or to render advice to the Fund. If the Sponsor were unable to provide services and/or advice to the Fund, the Fund would be unable to pursue their investment objectives unless and until the Sponsor’s ability to provide services and advice to the Fund was reinstated or a replacement for the Sponsor as commodity pool operator could be found. Such an event could result in termination of the Fund.
The lack of active trading markets for the Shares of the Fund may result in losses on investors’ investments at the time of disposition of Shares.
Although the Shares of the Fund are publicly listed and traded on the Exchange, there can be no guarantee that an active trading market for the Shares of the Fund will develop or be maintained. If investors need to sell their Shares at a time when no active market for them exists, the price investors receive for their Shares, assuming that investors are able to sell them, likely will be lower than the price that investors would receive if an active market did exist.
Investors may be adversely affected by redemption or creation orders that are subject to postponement, suspension or rejection under certain circumstances.
The Fund may, in its discretion, suspend the right of creation or redemption or may postpone the redemption or purchase settlement date, for (1) any period during which the Exchange or any other exchange, marketplace or trading center, deemed to affect
- 14 -
Table of Contents
the normal operations of the Fund, is closed, or when trading is restricted or suspended or restricted on such exchanges in any of the Fund’s futures contracts, (2) any period during which an emergency exists as a result of which the fulfillment of a purchase order or the redemption distribution is not reasonably practicable, or (3) such other period as the Sponsor determines to be necessary for the protection of the shareholders of the Fund. In addition, the Fund will reject a redemption order if the order is not in proper form as described in the Authorized Participant Agreement or if the fulfillment of the order might be unlawful. Any such postponement, suspension or rejection could adversely affect a redeeming Authorized Participant. For example, the resulting delay may adversely affect the value of the Authorized Participant’s redemption proceeds if the NAV of the Fund declines during the period of delay. The Fund disclaims any liability for any loss or damage that may result from any such suspension or postponement. Suspension of creation privileges may adversely impact how the Shares are traded and arbitraged on the secondary market, which could cause them to trade at levels materially different (premiums and discounts) from the fair value of their underlying holdings.
The NAV may not always correspond to market price and, as a result, investors may be adversely affected by the creation or redemption of Creation Units at a value that differs from the market price of the Shares.
The NAV per Share of the Fund changes as fluctuations occur in the market value of the Fund’s portfolio. Investors should be aware that the public trading price per Share of the Fund may be different from the NAV per Share of the Fund (i.e., the secondary market price may trade at a premium or discount to NAV). Consequently, an Authorized Participant may be able to create or redeem a Creation Unit of the Fund at a discount or a premium to the public trading price per Share of the Fund.
Authorized Participants or their clients or customers may have an opportunity to realize a profit if they can purchase a Creation Unit at a discount to the public trading price of the Shares of the Fund or can redeem a Creation Unit at a premium over the public trading price of the Shares of the Fund. The Sponsor expects that the exploitation of such arbitrage opportunities by Authorized Participants and their clients and customers will tend to cause the public trading price to track the NAV per Share of the Fund closely over time.
The value of a Share may be influenced by non-concurrent trading hours between the Exchange and the market in which the Financial Instruments (or related Reference Assets) held by the Fund are traded. The Shares of the Fund trade on the Exchange from 9:30 a.m. to 4:00 p.m. (Eastern Time). The Financial Instruments (and/or the related Reference Assets) held by the Fund, however, may have different fixing or settlement times. Consequently, liquidity in the Financial Instruments (and/or the Reference Assets) may be reduced after such fixing or settlement time. As a result, during the time when the Exchange is open but after the applicable fixing or settlement time of an underlying component, trading spreads and the resulting premium or discount on the Shares of the Fund may widen, and, therefore, may increase the difference between the price of the Shares of the Fund and the NAV of such Shares.
Trading on exchanges outside the United States is generally not subject to U.S. regulation and may result in different or diminished investor protections.
Some of the Fund’s trading may be conducted on exchanges outside the United States. Trading on such exchanges is generally not regulated by any U.S. governmental agency and may involve certain risks not applicable to trading on U.S. exchanges, including different or diminished investor protections. In trading contracts denominated in currencies other than U.S. dollars, the Shares are subject to the risk of adverse exchange rate movements between the dollar and the functional currencies of such contracts. Investors could incur substantial losses from trading on foreign exchanges which such investors would not have otherwise been subject had the Fund’s trading been limited to U.S. markets.
Competing claims of intellectual property rights may adversely affect the Fund and an investment in the Shares.
Although the Sponsor does not anticipate that such claims will adversely impact the Fund, it is impossible to provide definite assurances that no such negative impact will occur. The Sponsor believes that it has properly licensed or obtained the appropriate consent of all necessary parties with respect to intellectual property rights. However, other third parties could allege ownership as to such rights and may bring an action in asserting their claims. To the extent any action is brought by a third party asserting such rights, the expenses in litigating, negotiating, cross-licensing or otherwise settling such claims may adversely affect the Fund.
Investors may be adversely affected by an overstatement or understatement of the NAV calculation of the Fund due to the valuation method employed on the date of the NAV calculation.
Calculating the NAV of the Fund includes, in part, any unrealized profits or losses on open Financial Instrument positions. Under normal circumstances, the NAV of the Fund reflects the value of the Financial Instruments held by the Fund, as of the time the NAV is calculated. However, if any of the Financial Instruments held by the Fund could not be purchased or sold on a day when the Fund is accepting creation and redemption orders (due to the operation of daily limits or other rules of an exchange or otherwise), the Fund may be improperly exposed which could cause it to fail to meet its stated investment objective. Alternatively, the Fund may attempt to calculate the fair value of such Financial Instruments. In such a situation, there is a risk that the calculation of the benchmark, and therefore, the NAV of the Fund on such day, may not accurately reflect the realizable market value of the Financial Instruments underlying such benchmark.
- 15 -
Table of Contents
The liquidity of the Shares may also be affected by the withdrawal from participation of Authorized Participants, which could adversely affect the market price of the Shares.
In the event that one or more Authorized Participants which have substantial interests in the Shares withdraw from participation, the liquidity of the Shares will likely decrease, which could adversely affect the market price of the Shares and result in investors incurring a loss on their investment.
Shareholders that are not Authorized Participants may only purchase or sell their Shares in secondary trading markets, and the conditions associated with trading in secondary markets may adversely affect investors’ investment in the Shares.
Only Authorized Participants may create or redeem Creation Units. All other investors that desire to purchase or sell Shares must do so through the Exchange or in other markets, if any, in which the Shares may be traded. Shares may trade at a premium or discount to NAV per Share.
The Exchange may halt trading in the Shares of the Fund which would adversely impact investors’ ability to sell Shares.
Trading in Shares of the Fund may be halted due to market conditions or, in light of the applicable Exchange rules and procedures, for reasons that, in the view of the Exchange, make trading in Shares of the Fund inadvisable. In addition, trading is subject to trading halts caused by extraordinary market volatility pursuant to “circuit breaker” rules that require trading to be halted for a specified period based on a specified decline or rise in a market index (e.g., the Dow Jones Industrial Average) or in the price of the Fund’s Shares. Additionally, the ability to short sell the Fund’s Shares may be restricted when there is a 10% or greater change from the previous day’s official closing price. There can be no assurance that the requirements necessary to maintain the listing of the Shares of the Fund will continue to be met or will remain unchanged.
Shareholders do not have the protections associated with ownership of shares in an investment company registered under the 1940 Act.
The Fund is not subject to registration or regulation under the 1940 Act. Consequently, shareholders do not have the regulatory protections provided to investors in investment companies.
Shareholders do not have the rights enjoyed by investors in certain other vehicles and may be adversely affected by a lack of statutory rights and by limited voting and distribution rights.
The Shares have limited voting and distribution rights. For example, shareholders do not have the right to elect directors, the Fund may enact splits or reverse splits without shareholder approval and the Fund is not required to pay regular distributions, although the Fund may pay distributions at the discretion of the Sponsor.
The value of the Shares will be adversely affected if the Fund is required to indemnify the Trustee.
Under the Amended and Restated Trust Agreement of the Trust, as may be further amended and restated from time to time (the “Trust Agreement”), the Trustee has the right to be indemnified for any liability or expense incurred without gross negligence or willful misconduct. That means the Sponsor may require the assets of the Fund to be sold in order to cover losses or liability suffered by it or by the Trustee. Any sale of that kind would reduce the NAV of the Fund.
Although the Shares of the Fund are limited liability investments, certain circumstances such as bankruptcy of the Fund will increase a shareholder’s liability.
The Shares of the Fund are limited liability investments; investors may not lose more than the amount that they invest plus any profits recognized on their investment. However, shareholders could be required, as a matter of bankruptcy law, to return to the estate of the Fund any distribution they received at a time when the Fund was in fact insolvent or in violation of the Trust Agreement.
Failure of the FCMs to segregate assets may increase losses in the Fund.
The CEA requires a clearing broker to segregate all funds received from customers from such broker’s proprietary assets. There is a risk that assets deposited by the Sponsor on behalf of the Fund as margin with the FCMs may, in certain circumstances, be used to satisfy losses of other clients of the FCMs. If an FCM fails to segregate the funds received from the Sponsor, the assets of the Fund might not be fully protected in the event of the FCM’s bankruptcy. Furthermore, in the event of an FCM’s bankruptcy, Fund Shares could be limited to recovering only a pro rata share of all available funds segregated on behalf of the FCM’s combined customer
- 16 -
Table of Contents
accounts, even though certain property specifically traceable to a particular Fund was held by the FCM, and it is possible that the Fund may not be able to recover any funds in the event of the FCM’s bankruptcy. Each FCM may, from time to time, be the subject of certain regulatory and private causes of action.
Similarly, the CEA requires a clearing organization approved by the CFTC as a derivatives clearing organization to segregate all funds and other property received from a clearing member’s clients in connection with domestic futures and options contracts from any funds held at the clearing organization to support the clearing member’s proprietary trading. Nevertheless, customer funds held at a clearing organization in connection with any futures or options contracts may be held in a commingled omnibus account, which may not identify the name of the clearing member’s individual customers. With respect to futures and options contracts, a clearing organization may use assets of a non-defaulting customer held in an omnibus account at the clearing organization to satisfy payment obligations of a defaulting customer of the clearing member to the clearing organization. As a result, in the event of a default of the clearing FCM’s other clients or the clearing FCM’s failure to extend its own funds in connection with any such default, the Fund may not be able to recover the full amount of assets deposited by the clearing FCM on behalf of the Fund with the clearing organization.
In the event of a bankruptcy or insolvency of any exchange or a clearing house, the Fund could experience a loss of the funds deposited through its FCM as margin with the exchange or clearing house, a loss of any profits on its open positions on the exchange, and the loss of unrealized profits on its closed positions on the exchange.
A court could potentially conclude that the assets and liabilities of the Fund are not segregated from those of another series of the Trust and may thereby potentially expose assets in the Fund to the liabilities of another series of the Trust.
Each series of the Trust is a separate series of a Delaware statutory trust and not itself a separate legal entity. Section 3804(a) of the Delaware Statutory Trust Act, as amended (the “DSTA”), provides that if certain provisions are in the formation and governing documents of a statutory trust organized in series, and if separate and distinct records are maintained for any series and the assets associated with that series are held in separate and distinct records (directly or indirectly, including through a nominee or otherwise) and accounted for in such separate and distinct records separately from the other assets of the statutory trust, or any series thereof, then the debts, liabilities, obligations and expenses incurred, contracted for or otherwise existing with respect to a particular series are enforceable against the assets of such series only, and not against the assets of the statutory trust generally or any other series thereof, and none of the debts, liabilities, obligations and expenses incurred, contracted for or otherwise existing with respect to the statutory trust generally or any other series thereof shall be enforceable against the assets of such series. The Sponsor is not aware of any court case that has interpreted Section 3804(a) of the DSTA or provided any guidance as to what is required for compliance. The Sponsor maintains separate and distinct records for each series and accounts for them separately, but it is possible a court could conclude that the methods used did not satisfy Section 3804(a) of the DSTA and thus potentially expose assets of the Fund to the liabilities of another series of the Trust.
There may be circumstances that could prevent the Fund from being operated in a manner consistent with its investment objective and principal investment strategies.
There may be circumstances outside the control of the Sponsor and/or the Fund that make it, for all practical purposes, impossible to re-position the Fund and/or to process a purchase or redemption order. Examples of such circumstances include: natural disasters; public service disruptions or utility problems such as those caused by fires, floods, extreme weather conditions, and power outages resulting in telephone, telecopy, and computer failures; market conditions or activities causing trading halts; systems failures involving computer or other information systems affecting the aforementioned parties, as well as the Depository Trust Company (“DTC”), the National Securities Clearing Corporation (“NSCC”), or any other participant in the purchase process; and similar extraordinary events. Accordingly, while the Sponsor has implemented and tested a business continuity plan that transfers functions of any disrupted facility to another location and has effected a disaster recovery plan, circumstances, such as those above, may prevent the Fund from being operated in a manner consistent with its investment objective and/or principal investment strategies.
Due to the increased use of technologies, intentional and unintentional cyber attacks pose operational and information security risks.
With the increased use of technologies such as the Internet and the dependence on computer systems to perform necessary business functions, the Fund is susceptible to operational and information security risks. In general, cyber incidents can result from deliberate attacks or unintentional events. Cyber attacks include, but are not limited to gaining unauthorized access to digital systems for purposes of misappropriating assets or sensitive information, corrupting data, or causing operational disruption. Cyber attacks may also be carried out in a manner that does not require gaining unauthorized access, such as causing denial-of-service attacks on websites. Cyber security failures or breaches of the Fund’s third party service provider (including, but not limited to, index providers, the administrator and transfer agent) or the issuers of securities in which the Fund invests, have the ability to cause disruptions and impact business operations, potentially resulting in financial losses, the inability of Fund shareholders to transact business, violations of applicable privacy and other laws, regulatory fines, penalties, reputational damage, reimbursement or other compensation costs,
- 17 -
Table of Contents
and/or additional compliance costs. In addition, substantial costs may be incurred in order to prevent any cyber incidents in the future. The Fund and its shareholders could be negatively impacted as a result. While the Fund has established business continuity plans and systems to prevent such cyber attacks, there are inherent limitations in such plans and systems including the possibility that certain risks have not been identified. Furthermore, the Fund cannot control the cyber security plans and systems put in place by issuers in which the Fund invests.
Shareholders’ tax liability will exceed cash distributions on the Shares.
Shareholders of the Fund are subject to U.S. federal income taxation and, in some cases, state, local, or foreign income taxation on their share of the Fund’s taxable income, whether or not they receive cash distributions from the Fund. The Fund does not currently expect to make distributions with respect to capital gains or ordinary income. Accordingly, shareholders of the Fund will not receive cash distributions equal to its share of the Fund’s taxable income or the tax liability that results from such income. The Fund’s income, gains, losses and deductions are allocated to shareholders on a monthly basis. If you own Shares in the Fund at the beginning of a month and sell them during the month, you are generally still considered a shareholder through the end of that month.
The U.S. Internal Revenue Service (the “IRS”) could adjust or reallocate items of income, gain, deduction, loss and credit with respect to the Shares if the IRS does not accept the assumptions or conventions utilized by the Fund.
U.S. federal income tax rules applicable to partnerships, which the Fund is anticipated to be treated as under the Internal Revenue Code of 1986, as amended (the “Code”), are complex and their application is not always clear. Moreover, the rules generally were not written for, and in some respects are difficult to apply to, publicly traded interests in partnerships. The Fund applies certain assumptions and conventions intended to comply with the intent of the rules and to report income, gain, deduction, loss and credit to shareholders in a manner that reflects the shareholders’ economic gains and losses, but these assumptions and conventions may not comply with all aspects of the applicable Regulations (as defined below). It is possible therefore that the IRS will successfully assert that these assumptions or conventions do not satisfy the technical requirements of the Code or the Treasury regulations promulgated thereunder (the “Regulations”) and will require that items of income, gain, deduction, loss and credit be adjusted or reallocated in a manner that could be adverse to investors.
Shareholders will receive partner information tax returns on Schedule K-1, which could increase the complexity of tax returns.
The partner information tax returns on Schedule K-1, which the Fund will distribute to shareholders, will contain information regarding the income items and expense items of the Fund. If you have not received Schedule K-1s from other investments, you may find that preparing your tax return may require additional time, or it may be necessary for you to retain an accountant or other tax preparer, at an additional expense to you, to assist you in the preparation of your return.
Investors could be adversely affected if the current treatment of long-term capital gains under current U.S. federal income tax law is changed or repealed in the future.
Under current law, long-term capital gains are taxed to non-corporate investors at a maximum U.S. federal income tax rate of 20%. This tax treatment may be adversely affected, changed or repealed by future changes in tax laws at any time.
Shareholders of the Fund may recognize significant amounts of ordinary income and short-term capital gain.
Due to the investment strategy of the Fund, the Fund may realize and pass through to shareholders significant amounts of ordinary income and short-term capital gains as opposed to long-term capital gains, which generally are taxed at a preferential rate. The Fund’s income, gains, losses and deductions are allocated to shareholders on a monthly basis. If you own Shares in the Fund at the beginning of a month and sell them during the month, you are generally still considered a shareholder through the end of that month.
PROSPECTIVE INVESTORS ARE STRONGLY URGED TO CONSULT THEIR OWN TAX ADVISORS AND COUNSEL WITH RESPECT TO THE POSSIBLE TAX CONSEQUENCES TO THEM OF AN INVESTMENT IN THE SHARES OF THE FUND; SUCH TAX CONSEQUENCES MAY DIFFER IN RESPECT OF DIFFERENT INVESTORS.
Regulatory changes or actions, including the implementation of new legislation, may alter the operations and profitability of the Fund.
The U.S. derivatives markets and market participants have been subject to comprehensive regulation, not only by the CFTC but also by self-regulatory organizations, including the NFA and the exchanges on which the derivatives contracts are traded and/or cleared. As with any regulated activity, changes in regulations may have unexpected results. For example, changes in the amount or quality of the collateral that traders in derivatives contracts are required to provide to secure their open positions, or in the limits on number or size of positions that a trader may have open at a given time, may adversely affect the ability of the Fund to enter into
- 18 -
Table of Contents
certain transactions that could otherwise present lucrative opportunities. Considerable regulatory attention has been focused on non-traditional investment pools which are publicly distributed in the United States. There is a possibility of future regulatory changes altering, perhaps to a material extent, the nature of an investment in the Fund or the ability of the Fund to continue to implement its investment strategies.
In addition, the SEC, CFTC and the exchanges are authorized to take extraordinary actions in the event of a market emergency, including, for example, the retroactive implementation of speculative position limits or higher margin requirements, the establishment of daily price limits and the suspension of trading. The regulation of swaps, forwards and futures transactions in the United States is a rapidly changing area of law and is subject to modification by government and judicial action. The effect of any future regulatory change on the Fund is impossible to predict, but could be substantial and adverse.
In particular, the Dodd-Frank Wall Street Reform and Consumer Protection Act (the “Dodd-Frank Act”) was signed into law on July 21, 2010. The Dodd-Frank Act has made and will continue to make sweeping changes to the way in which the U.S. financial system is supervised and regulated. Title VII of the Dodd-Frank Act sets forth a new legislative framework for OTC derivatives, including certain Financial Instruments, such as swaps, in which the Fund may invest. Title VII of the Dodd-Frank Act makes broad changes to the OTC derivatives market, grants significant new authority to the SEC and the CFTC to regulate OTC derivatives and market participants, and, pursuant to regulations that have been and will continue to be adopted by the regulators, requires the clearing and exchange trading of many types of OTC derivatives transactions.
Provisions in the Dodd-Frank Act include the requirement that position limits on commodity futures contracts be established; new registration, recordkeeping, capital and margin requirements for “swap dealers” and “major swap participants” as determined by the Dodd-Frank Act and applicable regulations; and the mandatory use of clearinghouse mechanisms for many OTC derivatives transactions.
The CFTC, the SEC and other federal regulators have been tasked with developing the rules and regulations enacting the provisions of the Dodd-Frank Act. While certain regulations have been promulgated and are already in effect, the full impact of the Dodd-Frank Act on the Fund remains uncertain. The legislation and the related regulations that have been and may be promulgated in the future may negatively impact the Fund’s ability to meet its investment objective either through limits on its investments or requirements imposed on it or any of its counterparties. In particular, new requirements, including capital requirements and mandatory clearing of OTC derivatives transactions, which may increase derivative counterparties’ costs and are expected to generally be passed through to other market participants in the form of higher upfront and mark-to-market margin, less favorable trade pricing, and the imposition of new or increased fees, including clearinghouse account maintenance fees, may increase the cost of the Fund’s investments and the cost of doing business, which could adversely affect investors.
Regulatory and exchange accountability levels may restrict the creation of Creation Units and the operation of the Trust.
Many U.S. commodities exchanges and boards of trade limit the amount of fluctuation permitted in futures contract prices during a single trading day by regulations referred to as “daily price fluctuation limits” or “daily limits.” Once the daily limit has been reached in a particular contract, no trades may be made that day at a price beyond that limit or trading may be suspended for specified periods during the trading day. In addition, the CFTC, U.S. futures exchanges and certain non-U.S. exchanges have established limits referred to as “speculative position limits” or “accountability levels” on the maximum net long or short futures positions that any person may hold or control in derivatives traded on such exchanges.
In connection with these limits, the Dodd-Frank Act has required the CFTC to adopt regulations establishing speculative position limits applicable to regulated futures and OTC derivatives and impose aggregate speculative position limits across regulated U.S. futures, OTC positions and certain futures contracts traded on non-U.S. exchanges. In December 2016, the CFTC re-proposed rules on position limits with respect to the 25 physical delivery commodity futures and options contracts, as well as to swaps that are economically equivalent to such contracts. The re-proposed position limits would apply with respect to contracts traded on all U.S. and certain foreign exchanges on an aggregate basis. In addition, the CFTC proposed amendments to the requirement of U.S. commodities exchanges to establish corresponding speculative position limits (the “Position Limit Rules”). The re-proposed Position Limit Rules are based on the position limit rules previously proposed in 2013 by the CFTC. In December 2016, the CFTC also adopted final regulations requiring that all accounts owned or managed by an entity that is responsible for such accounts’ trading decisions, their principals and their affiliates would be aggregated for position limit purposes (the “Aggregation Rules”). The re-proposed Position Limit Rules were published in the Federal Register on December 30, 2016, and final Aggregation Rules were published in the Federal Register December 16, 2016 and became effective on February 14, 2017.
Although it is unclear what futures position limit rules will be, the Sponsor is subject to current position and accountability limits established by the CFTC and exchanges. Accordingly, it may be required to reduce the size of outstanding positions or not enter into new positions that would otherwise be taken for the Fund or not trade certain markets on behalf of the Fund in order to comply with those limits or any futures limits established by the CFTC and the relevant exchanges. Derivatives contract prices could move to
- 19 -
Table of Contents
a limit for several consecutive trading days with little or no trading, thereby preventing prompt liquidation of derivatives positions and potentially subjecting the Fund to substantial losses or periods in which the Fund does not create additional Creation Units. Modification of trades made by the Trust, if required, could adversely affect the Trust’s operations and profitability and significantly limit the Trust’s ability to reinvest income in additional contracts, create additional Creation Units, or add to existing positions in the desired amount.
In addition, the Sponsor may be required to liquidate certain open positions in order to ensure compliance with the speculative position limits at unfavorable prices, which may result in substantial losses for the relevant Funds. There also can be no assurance that the Sponsor will liquidate positions held on behalf of all the Sponsor’s accounts, including any proprietary accounts, in a proportionate manner. In the event the Sponsor chooses to liquidate a disproportionate number of positions held on behalf of any of the Funds at unfavorable prices, such Funds may incur substantial losses and the value of the Shares may be adversely affected.
Further, in October 2012, CFTC rules became effective, which require each registered FCM to establish risk-based limits on position and order size. As a result, the Trust’s FCMs may be required to reduce their internal limits on the size of the positions they will execute or clear for the Funds, and the Trust may seek to use additional FCMs, which may increase the costs for the Funds and adversely affect the value of the Shares.
The Trust may apply to the CFTC or to the relevant exchanges for relief from certain position limits. If the Trust is unable to obtain such relief, a Fund’s ability to issue new Creation Units, or the Fund’s ability to reinvest income in additional futures contracts, may be limited to the extent these activities cause the Trust to exceed applicable position limits. Limiting the size of a Fund may affect the correlation between the price of the Shares, as traded on an exchange, and the net asset value of the Fund. Accordingly, the inability to create additional Creation Units or add to existing positions in the desired amount could result in Shares trading at a premium or discount to NAV.
Margin for Non-cleared Swap and Forward Transactions
In 2015 and 2016, the CFTC and various federal bank regulators adopted new mandatory margin requirements for non-cleared swap and foreign currency forwards transactions and new requirements for the holding of collateral by derivatives dealers. These requirements, which are still pending final adoption, may increase the amount of collateral the Fund is required to provide to derivatives dealers for non-cleared swaps and foreign currency forwards.
CAUTIONARY NOTE REGARDING FORWARD-LOOKING STATEMENTS
This Prospectus and the documents incorporated by reference in this Prospectus contain forward-looking statements that are subject to risks and uncertainties. Investors can identify these forward-looking statements by the use of expressions such as “may,” “will,” “expect,” “anticipate,” “believe,” “intend,” “plan,” “project,” “should,” “estimate” or any negative or other variations on such expression. These forward-looking statements are based on information currently available to the Sponsor and are subject to a number of risks, uncertainties and other factors, both known, such as those described in “Risk Factors” and elsewhere in this Prospectus and the documents incorporated by reference in this Prospectus, and unknown, that could cause the actual results, performance, prospects or opportunities of the Fund to differ materially from those expressed in, or implied by, these forward-looking statements.
Except as expressly required by federal securities laws, the Trust assumes no obligation to update publicly any forward-looking statements, whether as a result of new information, future events or otherwise. Investors should not place undue reliance on any forward-looking statements.
ProShares UltraShort Gold is designed to correspond (before fees and expenses) to two times the inverse (-2x) of the daily performance of gold bullion as measured by the U.S. dollar p.m. LBMA Gold Price, which serves as the Fund’s benchmark. The Fund does not directly or physically hold the underlying gold to pursue its investment objectives, but instead, seeks exposure to gold through the use of Financial Instruments (primarily exchange-traded futures contracts and OTC forward contracts) whose value is based on the underlying LBMA Gold Price.
On March 19, 2015, the London Bullion Market Association (the LBMA), the company that ran the London gold fixing, ceased running the process and calculating the price of the London gold fix. The LBMA selected ICE Benchmark Administration to calculate the price beginning March 20, 2015, which was renamed the LBMA Gold Price and is based on an electronic, auction-based methodology. The gold market is a global marketplace consisting of both OTC transactions and exchange-traded products. The OTC market generally consists of transactions in spot, forwards, options and other derivatives, while exchange-traded transactions consist of futures and options.
- 20 -
Table of Contents
The LBMA Gold Price is determined each trading day at 3:00 p.m. London time, providing a reference gold price for that day’s trading. Many long-term contracts are priced on the basis of the LBMA Gold Price and market participants will usually refer to the LBMA Gold Price when looking for a basis for valuation.
ProShares UltraShort Gold (the “Fund”) is not sponsored, endorsed, sold or promoted by the LMBA, the ICE Benchmark Administration or any of their subsidiaries or affiliates. None of the LMBA, the ICE Benchmark Administration or any of their subsidiaries or affiliates makes any representation or warranty, express or implied, to the owners of the counterparties to the Fund or any member of the public regarding the advisability of investing in securities or commodities generally or in the Fund particularly.
INVESTMENT OBJECTIVES AND PRINCIPAL INVESTMENT STRATEGIES
Investment Objective of the Fund:
The “UltraShort” Fund seeks results for a single day that match (before fees and expenses) two times the inverse (-2x) of the daily performance of its benchmark. The Fund does not seek to achieve its stated objectives over a period greater than a single day. A “single day” is measured from the time the Fund calculates its NAV to the time of the Fund’s next NAV calculation. If the Fund is successful in meeting its objective, its value on a given day (before fees and expenses) should gain approximately two times as much on a percentage basis as the level of its benchmark when the benchmark declines. Conversely, its value on a given day (before fees and expenses) should lose approximately two times as much on a percentage basis as the level of its benchmark when the benchmark rises. The Fund acquires inverse exposure through any one of or combinations of Financial Instruments such that the Fund has exposure intended to approximate two times the inverse (-2x) of its benchmark at the time of its NAV calculation.
There can be no assurance that the Fund will achieve its investment objective or avoid substantial losses. The Fund does not seek to achieve its stated investment objective over a period of time greater than a single day because mathematical compounding prevents the Fund from achieving such results. Results for the Fund over periods of time greater than a single day should not be expected to be a simple inverse multiple (-2x) of the period return of the benchmark and will likely differ significantly from such multiple. The Fund will lose money if its benchmark’s performance is flat over time, and it is possible for the Fund to lose money over time regardless of the performance of the underlying benchmark, as a result of daily rebalancing, the benchmark’s volatility and compounding. Daily compounding of the Fund’s investment returns can dramatically and adversely affect its longer-term performance during periods of high volatility. Volatility may be at least as important to the Fund’s return for a period as the return of the Fund’s underlying benchmark.
The Fund is benchmarked to the daily performance of gold bullion as measured by the U.S. dollar p.m. LBMA Gold Price (Bloomberg Ticker: GOLDLNPM).
Principal Investment Strategies
In seeking to achieve the Fund’s investment objectives, the Sponsor uses a mathematical approach to investing. Using this approach, the Sponsor determines the type, quantity and mix of investment positions that the Sponsor believes, in combination should produce daily returns consistent with the Fund’s objectives. The Sponsor relies upon a pre-determined model to generate orders that result in repositioning the Fund’s investments in accordance with their respective investment objective.
The Fund invests principally in any one of or combinations of Financial Instruments, including swap agreements, futures contracts or forward contracts with respect to the Fund’s benchmark, to the extent determined appropriate by the Sponsor. The Fund does not currently intend to invest directly in gold bullion. The Fund will also hold cash or cash equivalents such as U.S. Treasury securities or other high credit quality, short-term fixed-income or similar securities (such as shares of money market funds and collateralized repurchase agreements) as collateral for Financial Instruments or pending the Fund’s investment in Financial Instruments. The Fund may invest up to 100% of its assets in any of these types of cash or cash equivalent securities.
The Sponsor does not invest the assets of the Fund based on its view of the investment merit of a particular investment, other than for cash management purposes, nor does it conduct conventional commodity research or analysis, or forecast market movement or trends, in managing the assets of the Fund. The Fund seeks to remain invested at all times in Financial Instruments and money market instruments that, in combination, provide exposure to its underlying benchmark consistent with its investment objective without regard to market conditions, trends or direction.
As of the NAV calculation time each trading day, the Fund will seek to position its portfolio so that its exposure to its benchmark is consistent with its investment objective. The impact of a benchmark’s movements during the day will affect whether the Fund’s portfolio needs to be rebalanced. For example, if the Fund’s benchmark has risen on a given day, net assets of the Fund should fall. As a result, inverse exposure will need to be decreased. Conversely, if the Fund’s benchmark has fallen on a given day, net assets
- 21 -
Table of Contents
of the Fund should rise. As a result, inverse exposure will need to be increased. Daily rebalancing and the compounding of each day’s return over time means that the return of the Fund for a period longer than a single day will be the result of each day’s returns compounded over the period, which will very likely differ from two times the inverse (-2x) of the return of the Fund’s benchmark for the period. The Fund will lose money if its benchmark’s performance is flat over time, and it is possible for the Fund to lose money over time regardless of the performance of the underlying benchmark, as a result of daily rebalancing, the benchmark’s volatility and compounding.
The amount of exposure that the Fund has to Financial Instruments may be changed without shareholder approval at any given time. Currently, the Fund anticipates that, in the normal course of business and absent any unforeseen circumstances, it will be exposed to the specific Financial Instruments below as follows:
| Swaps | Forwards | Futures | ||||||||||||||||||||||
| Low | High | Low | High | Low | High | |||||||||||||||||||
| ProShares UltraShort Gold |
0 | % | -190 | % | -200 | % | 0 | % | -10 | % | ||||||||||||||
Swap Agreements
Swap agreements are two-party contracts that have traditionally been entered into primarily by institutional investors in OTC markets for a specified period ranging from a day to more than a year. However, the Dodd-Frank Act provides for significant reforms of the OTC derivatives markets, including a requirement to execute certain swap transactions on a CFTC regulated market and/or to clear such transactions through a CFTC-regulated central clearing organization. In a standard swap transaction, the parties agree to exchange the returns on a particular predetermined investment, instrument or index for a fixed or floating rate of return (the “interest rate leg,” which will also include the cost of borrowing for short swaps) in respect of a predetermined notional amount. The notional amount of the agreement reflects the extent of the Fund’s total investment exposure under the swap agreement. In the case of futures contracts-based indexes, the reference interest rate is zero, although a financing spread or fee is normally still applied. Transaction or commission costs are reflected in the benchmark level at which the transaction is entered into. The gross returns to be exchanged are calculated with respect to the notional amount and the benchmark returns to which the swap is linked. Swaps are usually closed out on a net basis, i.e., the two payment streams are netted out in a cash settlement on the payment date specified in the agreement, with the parties receiving or paying, as the case may be, only the net amount of the two payments. Thus, while the notional amount reflects the Fund’s total investment exposure under the swap agreement (i.e., the entire face amount or principal of a swap agreement), the net amount is the Fund’s current obligations (or rights) under the swap agreement, which is the net amount to be paid or received under the agreement based on the relative values of the positions held by each party to the agreement on any given termination date.
Swap agreements involve, to varying degrees, elements of market risk and exposure to loss in excess of the amount which would be reflected on the Statement of Financial Condition. The primary risks associated with the use of swap agreements arise from the inability of counterparties to perform. Should the Fund invest in swaps, it would bear the risk of loss of the net amount, if any, expected to be received under a swap agreement in the event of the default or bankruptcy of a swap counterparty. The Fund enters or intends to enter into swap agreements only with major, global financial institutions; however, there are no limitations on the percentage of its assets the Fund may invest in swap agreements with a particular counterparty. The Fund may use various techniques to minimize credit risk associated with swaps.
It is expected that the Fund would generally collateralize its swap agreements with cash and/or certain securities. Collateral posted in connection with uncleared derivatives transactions is generally held for the benefit of the counterparty in a segregated tri-party account at the Custodian to protect the counterparty against non-payment by the Fund. The counterparty also may collateralize the uncleared swap agreements with cash and/or certain securities, which collateral is typically held for the benefit of the Fund in a segregated tri-party account at the Custodian. In the event of a default by the counterparty, and the Fund is owed money in the uncleared swap transaction, the Fund will seek withdrawal of this collateral from the segregated account and may incur certain costs exercising its right with respect to the collateral. The Fund remains subject to credit risk with respect to the amount it expects to receive from counterparties.
The Fund has sought to mitigate these risks in connection with the uncleared OTC swaps by generally requiring that the counterparties for the Fund to agree to post collateral for the benefit of the Fund, marked to market daily, subject to certain minimum thresholds; however there are no limitations on the percentage of its assets the Fund may invest in swap agreements with a particular counterparty. To the extent any such collateral is insufficient or there are delays in accessing the collateral, the Fund will be exposed to counterparty risk as described above, including possible delays in recovering amounts as a result of bankruptcy proceedings.
The counterparty risk for cleared derivatives transactions is generally lower than for uncleared OTC derivatives since generally a clearing organization becomes substituted for each counterparty to a cleared derivatives contract and, in effect, guarantees the parties’ performance under the contract as each party to a trade looks only to the clearing house for performance of financial obligations. In addition, cleared derivatives transactions benefit from daily marking-to-market and settlement, and segregation and minimum capital requirements applicable to intermediaries.
- 22 -
Table of Contents
Forward Contracts
A forward contract is a contractual obligation to purchase or sell a specified quantity of a particular underlying asset at or before a specified date in the future at a specified price and, therefore, is economically similar to a futures contract. Unlike futures contracts, however, forward contracts are typically traded in the OTC markets and are not standardized contracts. Forward contracts for a given commodity are generally available for various amounts and maturities and are subject to individual negotiation between the parties involved. Moreover, there is generally no direct means of offsetting or closing out a forward contract by taking an offsetting position as one would a futures contract on a U.S. exchange. If a trader desires to close out a forward contract position, he generally will establish an opposite position in the contract but will settle and recognize the profit or loss on both positions simultaneously on the delivery date. Thus, unlike in the futures contract market where a trader who has offset positions will recognize profit or loss immediately, in the forward market a trader with a position that has been offset at a profit will generally not receive such profit until the delivery date, and likewise a trader with a position that has been offset at a loss will generally not have to pay money until the delivery date. In recent years, however, the terms of forward contracts have become more standardized, and in some instances such contracts now provide a right of offset or cash settlement as an alternative to making or taking delivery of the underlying commodity. The primary risks associated with the use of forward contracts arise from the inability of the counterparty to perform.
It is expected that the Fund may generally collateralize the uncleared forward contracts with cash and/or certain securities. Such collateral is generally held for the benefit of the counterparty in a segregated tri-party account at the Custodian to protect the counterparty against non-payment by the Fund. The counterparty also may collateralize the uncleared forward contracts with cash and/or certain securities, which collateral is typically held for the benefit of the Fund in a segregated tri-party account at the Custodian. In the event of a default by the counterparty, and the Fund is owed money in the uncleared forward transaction, the Fund will seek withdrawal of this collateral from the segregated account and may incur certain costs exercising its right with respect to the collateral. The Fund remains subject to credit risk with respect to the amount it expects to receive from OTC counterparties.
The Fund has sought to mitigate these risks with respect to uncleared OTC forwards by generally requiring that the counterparties for the Fund to agree to post collateral for the benefit of the Fund, marked to market daily, subject to certain minimum thresholds; however, there are no limitations on the percentage of its assets that the Fund may invest in forward contracts with a particular counterparty. To the extent any such collateral is insufficient or there are delays in accessing the collateral, the Fund will be exposed to counterparty risk as described above, including possible delays in recovering amounts as a result of bankruptcy proceedings.
The forward markets provide what has typically been a highly liquid market for foreign exchange trading, and in certain cases the prices quoted for foreign exchange forward contracts may be more favorable than the prices for foreign exchange futures contracts traded on U.S. exchanges. Forward contracts have traditionally not been cleared or guaranteed by a third party. As a result of the Dodd-Frank Act, the CFTC now regulates non-deliverable forwards (including deliverable forwards where the parties do not take delivery). Certain non-deliverable forward contracts, such as non-deliverable foreign exchange forwards, may be subject to regulation as swap agreements, including mandatory clearing. Changes in the forward markets may entail increased costs and result in burdensome reporting requirements.
Commercial banks participating in trading OTC foreign exchange forward contracts often do not require margin deposits, but rely upon internal credit limitations and their judgments regarding the creditworthiness of their counterparties. In recent years, however, many OTC market participants in foreign exchange trading have begun to require that their counterparties post margin.
Futures Contracts
A futures contract is a standardized contract traded on, or subject to the rules of, an exchange that calls for the future delivery of a specified quantity and type of a particular underlying asset at a specified time and place or alternatively may call for cash settlement. Futures contracts are traded on a wide variety of underlying assets, including bonds, interest rates, agricultural products, stock indexes, currencies, energy, metals, economic indicators and statistical measures. The notional size and calendar term futures contracts on a particular underlying asset are identical and are not subject to any negotiation, other than with respect to price and the number of contracts traded between the buyer and seller. The Fund generally deposits cash and/or securities with an FCM for its open positions in futures contracts, which may, in turn, transfer such deposits to the clearing house to protect the clearing house against non-payment by the Fund. The clearing house becomes substituted for each counterparty to a futures contract, and, in effect, guarantees performance. In addition, the FCM may require the Fund to deposit collateral in excess of the clearing house’s margin requirements for the FCM’s own protection.
- 23 -
Table of Contents
Certain futures contracts settle in cash, reflecting the difference between the contract purchase/sale price and the contract settlement price. The cash settlement mechanism avoids the potential for either side to have to deliver the underlying asset. For other futures contracts, the contractual obligations of a buyer or seller may generally be satisfied by taking or making physical delivery of the underlying asset or by making an offsetting sale or purchase of an identical futures contract on the same or linked exchange before the designated date of delivery. The difference between the price at which the futures contract is purchased or sold and the price paid for the offsetting sale or purchase, after allowance for brokerage commissions, constitutes the profit or loss to the trader.
Futures contracts involve, to varying degrees, elements of market risk and exposure to loss in excess of the amounts of variation margin, which are the amounts of cash that the Fund agrees to pay to or receive from FCMs equal to the daily fluctuation in the value of a futures contract. Additional risks associated with the use of futures contracts are imperfect correlation between movements in the price of the futures contracts and the level of the underlying benchmark and the possibility of an illiquid market for a futures contract. With futures contracts, there is minimal but some counterparty risk to the Fund since futures contracts are exchange traded and the exchange’s clearinghouse, as counterparty to all exchange-traded futures contracts, effectively guarantees futures contracts against default. Many futures exchanges and boards of trade limit the amount of fluctuation permitted in futures contract prices during a single trading day. Once the daily limit has been reached in a particular contract, no trades may be made that day at a price beyond that limit or trading may be suspended for specified times during the trading day. Futures contracts prices could move to the limit for several consecutive trading days with little or no trading, thereby preventing prompt liquidation of futures positions and potentially subjecting the Fund to substantial losses. If trading is not possible or if the Fund determines not to close a futures position in anticipation of adverse price movements, the Fund may be required to make daily cash payments of variation margin.
Money Market Instruments
Money market instruments are short-term debt instruments that have a remaining maturity of 397 days or less and exhibit high quality credit profiles. Money market instruments may include U.S. government securities, securities issued by governments of other developed countries and repurchase agreements.
U.S. Derivatives Exchanges
Derivatives exchanges, including swap execution facilities that are required under the Dodd-Frank Act, provide centralized market facilities for trading derivatives in which multiple persons have the ability to execute or trade contracts by accepting bids and offers from multiple participants. Members of, and trades executed on, a particular exchange are subject to the rules of that exchange. Among the principal exchanges in the United States are the Chicago Board Options Exchange, Incorporated (“CBOE”) (which includes the CFE), the Chicago Mercantile Exchange (“CME”) (which includes, among others, the CBOT and the NYMEX) and the Intercontinental Exchange (“ICE”)).
Each derivatives exchange in the United States has an associated “clearing house.” Clearing houses provide services designed to transfer credit risk and ensure the integrity of trades. Once trades between members of an exchange have been confirmed and/or cleared, the clearing house becomes substituted for each buyer and each seller of contracts traded on the exchange and, in effect, becomes the other party to each trader’s open position in the market. Thereafter, each party to a trade looks only to the clearing house for performance. The clearing house generally establishes some sort of security or guarantee fund to which all clearing members of the exchange must contribute. This fund acts as an emergency buffer which is intended to enable the clearing house to meet its obligations with regard to the other side of an insolvent clearing member’s contracts. Furthermore, clearing houses require margin deposits and continuously mark positions to market to provide some assurance that their members will be able to fulfill their contractual obligations. Thus, members effecting derivatives transactions on an organized exchange or clearing an OTC derivatives transaction through a clearing house do not bear the risk of the insolvency of the party on the opposite side of the trade; their credit risk is limited to the respective solvencies of their commodity broker and the clearing house. The clearing house “guarantee” of performance on open positions does not run to customers. If a member firm goes bankrupt, customers could lose money.
If the Fund decides to execute derivatives transactions through such derivatives exchanges—and especially if it decides to become a direct member of one or more exchanges or swap execution facilities—the Fund would be subject to the rules of the exchange or swap executive facility, which would bring additional risks and liabilities, and potential additional regulatory requirements.
Regulations
Derivatives exchanges in the United States are subject to regulation under the CEA, by the CFTC, the governmental agency having responsibility for regulation of derivatives exchanges and trading on those exchanges. Following the adoption of the Dodd-Frank Act, the CFTC also has authority to regulate OTC derivatives markets, including certain OTC foreign exchange markets. The CFTC has exclusive authority to designate exchanges for the trading of specific futures contracts and options on futures contracts and to prescribe rules and regulations of the marketing of each. The CFTC also regulates the activities of “commodity pool operators” and
- 24 -
Table of Contents
the CFTC has adopted regulations with respect to certain of such persons’ activities. Pursuant to its authority, the CFTC requires a commodity pool operator, such as the Sponsor, to keep accurate, current and orderly records with respect to each pool it operates. The CFTC may suspend, modify or terminate the registration of any registrant for failure to comply with CFTC rules or regulations. Suspension, restriction or termination of the Sponsor’s registration as a commodity pool operator would prevent it, until such time (if any) as such registration were to be reinstated, from managing, and might result in the termination of, the Fund. If the Sponsor were unable to provide services and/or advice to the Fund, the Fund would be unable to pursue its investment objectives unless and until the Sponsor’s ability to provide services and advice to the Fund was reinstated or a replacement for the Sponsor as commodity pool operator could be found. Such an event could result in termination of the Fund.
The CEA requires all FCMs to meet and maintain specified fitness and financial requirements, segregate customer funds from proprietary funds and account separately for all customers’ funds and positions, and to maintain specified books and records open to inspection by the staff of the CFTC. See “Risk Factors—Failure of the FCMs to segregate assets may increase losses in the Fund.”
The CEA also gives the states certain powers to enforce its provisions and the regulations of the CFTC.
Under certain circumstances, the CEA grants shareholders the right to institute a reparations proceeding before the CFTC against the Sponsor (as a registered commodity pool operator), an FCM, as well as those of their respective employees who are required to be registered under the CEA. Shareholders may also be able to maintain a private right of action for certain violations of the CEA.
Pursuant to authority in the CEA, the NFA has been formed and registered with the CFTC as a registered futures association. At the present time, the NFA is the only self-regulatory organization for commodities professionals other than exchanges. As such, the NFA promulgates rules governing the conduct of commodity professionals and disciplines those professionals that do not comply with such standards. The CFTC has delegated to the NFA responsibility for the registration of commodity pool operators, FCMs, swap dealers, commodity trading advisors, introducing brokers and their respective associated persons and floor brokers. The Sponsor is a member of the NFA (the Fund is not required to become a member of the NFA). As an NFA member, the Sponsor is subject to NFA standards relating to fair trade practices, financial condition, and consumer protection. The CFTC is prohibited by statute from regulating trading on foreign commodity exchanges and markets.
The CEA and CFTC regulations prohibit market abuse and generally require that all futures exchange-based trading be conducted in compliance with rules designed to ensure the integrity of market prices and without any intent to manipulate prices. CFTC regulations and futures exchange rules also impose limits on the size of the positions that a person may hold or control as well as standards for aggregating certain positions. The rules of the CFTC and the futures exchanges also authorize special emergency actions to halt, suspend or limit trading overall or to restrict, halt, suspend or limit the trading of an individual trader or to otherwise impose special reporting or margin requirements.
The Fund’s investments in Financial Instruments will be subject to regulation under the CEA and traded pursuant to CFTC and applicable exchange regulations.
Non-U.S. Derivatives Exchanges
Foreign derivatives exchanges differ in certain respects from their U.S. counterparts. Non-U.S. derivatives exchanges are generally not subject to regulation by the CFTC. In contrast to U.S. exchanges, certain foreign exchanges are “principals’ markets,” where trades remain the liability of the traders involved, and the exchange or an affiliated clearing house, if any, does not become substituted for any party. Therefore, participants in such markets must often satisfy themselves as to the creditworthiness of their counterparty. Additionally, in the event of the insolvency or bankruptcy of a non-U.S. market or broker, the rights of market participants are likely to be more limited than the rights afforded by the U.S. derivatives exchanges. The Sponsor does not anticipate that the Fund will hold futures traded on foreign exchanges.
Daily Limits
Most U.S. futures exchanges (but generally not foreign exchanges or banks or dealers in the cases of forward contracts, swap agreements and options on forward contracts) limit the amount of fluctuation in some futures contract or options on futures contract prices during a single day by regulations. These regulations specify what are referred to as “daily price fluctuation limits” or more commonly “daily limits.” Once the daily limit has been reached in a particular futures contract, no trades may be made at a price beyond that limit.
As of December 31, 2016, the maximum daily price fluctuation limit for COMEX Gold futures contracts was $100.00 per ounce above or below the previous day’s settlement price. If a market for any of the contract months is bid or offered at the upper or lower price fluctuation limit, as applicable, on Globex it will be considered a triggering event which will halt trading for a five (5) minute period in all contract months of the Gold futures contract.
- 25 -
Table of Contents
Margin
“Initial” or “original” margin is the minimum amount of funds that a counterparty to a cleared derivatives contract must deposit with his commodity broker in order to establish an open position. Maintenance margin is the amount (generally less than initial margin) to which a trader’s account may decline before he must deliver additional margin so as to maintain open positions. A margin deposit is like a cash performance bond. It helps assure the futures trader’s performance of the futures contracts he purchases or sells. The minimum amount of margin required in connection with a particular futures contract is set by the exchange on which such contract is traded and is subject to change at any time during the term of the contract. Futures contracts are customarily bought and sold on margins that represent a very small percentage (ranging upward from less than 2%) of the aggregate purchase or sales price of the contract. Because of such low margins, price fluctuations occurring in the futures markets may create profits and losses that are greater, in relation to the amount invested, than are customary in other forms of investments.
Brokerage firms carrying accounts for traders in futures contracts may not accept lower, and may require higher, amounts of margin as a matter of policy in order to afford further protection for themselves.
Margin requirements are computed each day by a commodity broker and the relevant exchange. At the close of each trading day, each open futures contract is marked to market, that is, the gain or loss on the position is calculated from the prior day’s close. When the market value of a particular open futures contract position changes to a point where the margin on deposit does not satisfy maintenance margin requirements, a margin call is made by the commodity broker. If the margin call is not met within a reasonable time, the broker may close out the customer’s position.
PERFORMANCE OF THE OFFERED COMMODITY POOL OPERATED BY
THE COMMODITY POOL OPERATOR
The following performance information is presented in accordance with CFTC regulations. The performance of the Fund, which is presented herein, will differ materially from the performance of the other series of the Trust (the “Other Funds”), which is included in the section entitled “Performance of the Other Commodity Pools Operated by the Commodity Pool Operator” in Part Two of this Prospectus.
All summary performance information is as of December 31, 2016. Performance information is set forth, in accordance with CFTC regulations, since the Fund’s inception of trading.
| Name of Pool: |
ProShares UltraShort Gold | |
| Type of Pool: | Public, Exchange-listed Commodity Pool | |
| Date of Inception of Trading: | December 1, 2008 | |
| Aggregate Gross Capital Subscriptions1 as of December 31, 2016: | $803,251,816 | |
| Aggregate Net Capital Subscriptions2 as of December 31, 2016: | $124,033,657 | |
| Net Asset Value as of December 31, 2016: | $63,653,647 | |
| Net Asset Value per Share3 as of December 31, 2016: | $91.33 | |
| Worst Monthly Loss:4 | -24.37% (January 2012) | |
| Worst Peak-to-Valley Loss:5 | -88.74% (Inception—September 2012) |
- 26 -
Table of Contents
PAST PERFORMANCE IS NOT NECESSARILY INDICATIVE OF FUTURE RESULTS.
Rate of Return:6
| 2012 | 2013 | 2014 | 2015 | 2016 | ||||||||||||||||
| January |
-24.37 | % | -1.47 | % | -8.02 | % | -9.28 | % | -9.65 | % | ||||||||||
| February |
-3.48 | % | 9.42 | % | -11.43 | % | 7.27 | % | -20.47 | % | ||||||||||
| March |
12.18 | % | -1.44 | % | 4.69 | % | 4.01 | % | -1.45 | % | ||||||||||
| April |
0.60 | % | 14.63 | % | 0.00 | % | 0.59 | % | -8.04 | % | ||||||||||
| May |
11.02 | % | 9.24 | % | 5.61 | % | -2.32 | % | 11.92 | % | ||||||||||
| June |
-6.17 | % | 34.26 | % | -9.92 | % | 3.00 | % | -16.76 | % | ||||||||||
| July |
-3.57 | % | -19.13 | % | 4.17 | % | 12.87 | % | -3.43 | % | ||||||||||
| August |
-3.63 | % | -12.23 | % | -0.49 | % | -7.05 | % | 4.85 | % | ||||||||||
| September |
-14.63 | % | 8.79 | % | 11.32 | % | 3.00 | % | -2.22 | % | ||||||||||
| October |
6.40 | % | -1.16 | % | 8.36 | % | -5.55 | % | 7.78 | % | ||||||||||
| November |
-1.39 | % | 11.00 | % | -3.59 | % | 15.18 | % | 15.76 | % | ||||||||||
| December |
8.09 | % | 7.09 | % | -4.56 | % | -0.43 | % | 5.16 | % | ||||||||||
| Annual |
-22.78 | % | 62.07 | % | -6.64 | % | 19.90 | % | -21.19 | % | ||||||||||
| Year-to-Date |
N/A | N/A | N/A | N/A | -21.19 | % | ||||||||||||||
See accompanying Footnotes to Performance Information.
Footnotes to Performance Information
| 1. | “Aggregate Gross Capital Subscriptions” is the aggregate of all amounts ever contributed to the pool, including those of investors who subsequently redeemed their investments. |
| 2. | “Aggregate Net Capital Subscriptions” is the aggregate of all amounts ever contributed to the pool, excluding those of investors who subsequently redeemed their investments. |
| 3. | “Net Asset Value per Share” is the net asset value, based on the pricing policies of the Trust and determined in accordance with Generally Accepted Accounting Principles, of the pool divided by the total number of Shares outstanding as of December 31, 2016. Please see “Description of the Shares; The Fund; Certain Material Terms of the Trust Agreement—Net Asset Value (NAV)” for additional information regarding the pricing policies of the Trust. |
| 4. | “Worst Monthly Loss” is the largest single month loss sustained during the most recent five calendar years and year-to-date (or since inception of the Fund, if the Fund has had less than five calendar years of performance), expressed as a percentage. “Loss” as used in this section of the Prospectus means losses experienced by the relevant pool over the specified period and is calculated on a rate of return basis, i.e., dividing net performance by beginning equity. Loss is measured on the basis of monthly returns only, and does not reflect intra-month figures. |
| 5. | “Worst Peak-to-Valley Loss” is the largest percentage decline in Net Asset Value per Share over the most recent five calendar years and year-to-date (or since inception of the Fund, if the Fund has had less than five calendar years of performance). This need not be a continuous decline, but can be a series of positive and negative returns where the negative returns are larger than the positive returns. Worst Peak-to-Valley Loss represents the greatest percentage decline from any month-end Net Asset Value per Share that occurs without such month-end Net Asset Value per Share being equaled or exceeded as of a subsequent month-end. A Peak-to-Valley loss that begins prior to the beginning of the most recent five calendar years and ends within the most recent five calendar year period is deemed to have occurred during such five calendar year period. |
| 6. | Based on the latest calculated net asset value, as applicable to creations and redemptions of Creation Units, with respect to each period. |
- 27 -
Table of Contents
MANAGEMENT’S DISCUSSION AND ANALYSIS OF FINANCIAL
CONDITIONS AND RESULTS OF OPERATIONS
For additional information, see Appendix B – Additional Financial and Other Information.
The projected twelve month breakeven analysis for the Fund is set forth in the Breakeven Table below. For purposes of calculating the amounts in the Breakeven Table for the Fund, the analysis assumes that the average daily NAV per Fund is $25.00.
| Dollar Amount and Percentage of Expenses per Fund |
||||||||
|
Expenses(1) |
ProShares UltraShort Gold |
|||||||
| $ | % | |||||||
| Selling price per share |
25.00 | |||||||
| Management fee(2) |
0.24 | 0.95 | % | |||||
| Brokerage commissions and fees |
0.18 | 0.72 | % | |||||
| Variable create/redeem fees(3) |
(0.01 | ) | (0.05 | )% | ||||
| Other expenses |
0.00 | 0.00 | % | |||||
| Total fees and expenses |
0.41 | 1.62 | % | |||||
| Interest income(4) |
(0.12 | ) | (0.49 | )% | ||||
| Amount of trading income required for the NAV at the end of one year to equal the initial selling price per share (12-Month breakeven)(5) |
0.29 | 1.13 | % | |||||
| (1) | The breakeven analysis set forth in this table assumes that the Shares have a constant month end NAV and is based on $25.00 as the NAV per Share of the Fund. The actual NAV of the Fund differs and is likely to change on a daily basis. The numbers provided in this chart have been rounded to the nearest 0.01. The breakeven analysis reflects all fees and expenses that are anticipated to be incurred by the Fund during a year of an investor’s investment including estimated rebalancing expneses. |
| (2) | From the Management Fee, the Sponsor, though not contractually required, is responsible for paying the fees and expenses of the Administrator, Custodian, Distributor, ProFunds Distributors, Inc. (“PDI”), Transfer Agent and all routine operational, administrative and other ordinary expenses of the Fund, including fees payable to index providers. Please note that these fees and expenses are not included in the above Breakeven Table. |
| (3) | Authorized Participants are generally required to pay variable create and redeem fees of up to 0.10% of the value of each order they place with the Fund. These variable transaction fees offset transaction costs incurred by the Fund. Please see “Creation and Redemption of Shares—Creation and Redemption Transaction Fee.” |
| (4) | Based on the average three month Treasury Bill rate for the quarter ended December 31, 2016. |
| (5) | Investors may pay customary brokerage commissions in connection with purchases of the Shares. Because such brokerage commission rates will vary from investor to investor, such brokerage commissions have not been included in the Breakeven Table. Investors are encouraged to review the terms of their brokerage accounts for applicable charges. The breakeven amount reflected in the Breakeven Table reflects the breakeven amount for investors in the secondary market. The breakeven amount for each Authorized Participant is equal to the sum of the breakeven amount for each applicable Fund plus the amount of transaction fees paid by each Authorized Participant for each applicable Fund. |
Management Fee
The Fund pays the Sponsor a management fee (the “Management Fee”), monthly in arrears, in an amount equal to 0.95% per annum of its average daily net assets (calculated by summing the month-end assets of the Fund and dividing by the number of calendar days in the month).
No other Management Fee is paid by the Fund. The Management Fee is paid in consideration of the Sponsor’s trading advisory services and the other services provided to the Fund that the Sponsor pays directly.
Routine Operational, Administrative and Other Ordinary Expenses
The Sponsor pays all of the routine operational, administrative and other ordinary expenses of the Fund, generally, as determined by the Sponsor, including, but not limited to, fees and expenses of the Administrator, Custodian, Distributor, PDI and Transfer Agent, licensors, accounting and audit fees and expenses, tax preparation expenses, legal fees not in excess of $100,000 per annum, ongoing SEC registration fees not exceeding 0.021% per annum of the net assets of the Fund, individual Schedule K-1 preparation and mailing fees not exceeding 0.10% per annum of the net assets of the Fund, and report preparation and mailing expenses.
- 28 -
Table of Contents
Non-Recurring Fees and Expenses
The Fund pays all of their non-recurring and unusual fees and expenses, if any, as determined by the Sponsor. Non-recurring and unusual fees and expenses are fees and expenses which are unexpected or unusual in nature, such as legal claims and liabilities and litigation costs or indemnification or other unanticipated expenses. Extraordinary fees and expenses also include material expenses which are not currently anticipated obligations of the Fund. Routine operational, administrative and other ordinary expenses are not deemed extraordinary expenses.
Selling Commission
Retail investors may purchase and sell Shares through traditional brokerage accounts. Investors are expected to be charged a customary commission by their brokers in connection with purchases of Shares that will vary from investor to investor. Investors are encouraged to review the terms of their brokerage accounts for applicable charges. The price at which an Authorized Participant sells a Share may be higher or lower than the price paid by such Authorized Participant in connection with the creation of such Share in a Creation Unit.
Brokerage Commissions and Fees
The Fund pays all of its respective brokerage commissions, including applicable exchange fees, NFA fees and give-up fees, pit brokerage fees and other transaction related fees and expenses charged in connection with trading activities for the Fund’s investments in CFTC regulated investments. The Fund bears other transaction costs including the effects of trading spreads and financing costs/fees, if any, associated with the use of Financial Instruments, and costs relating to the purchase of U.S. Treasury securities or similar high credit quality short-term fixed-income or similar securities (such as shares of money market funds and collateralized repurchase agreements).
- 29 -
Table of Contents
FUTURES COMMISSION MERCHANTS
Both of Merrill Lynch, Pierce, Fenner & Smith Incorporated (“MLPF&S”) and RBC Capital Markets, LLC (“RBC”) (formerly RBC Capital Markets Corporation), in its capacity as a registered FCM, serves as the Fund’s clearing broker and as such arranges for the execution and clearing of the Fund’s futures transactions. Each of MLPF&S and RBC acts as clearing broker for many other funds and individuals. A variety of executing brokers may execute futures transactions on behalf of the Fund. The executing brokers will give up all such transactions to MLPF&S or RBC, as applicable.
Investors should be advised that neither MLPF&S nor RBC is affiliated with or acts as a supervisor of the Fund or the Fund’s commodity pool operators, commodity trading advisors, investment managers, trustees, general partners, administrators, transfer agents, registrars or organizers, as applicable. Additionally, neither MLPF&S nor RBC, in its capacity as FCM, is acting as an underwriter or sponsor of the offering of any Shares or interests in the Fund or has passed upon the merits of participating in this offering.
Neither MLPF&S nor RBC has passed upon the adequacy of this Prospectus or on the accuracy of the information contained herein. Additionally, neither MLPF&S nor RBC provides any commodity trading advice regarding the Fund’s trading activities. Investors should not rely upon MLPF&S or RBC in deciding whether to invest in the Fund or retain their interests in the Fund. Investors should also note that the Fund may select additional clearing brokers or replace MLPF&S and/or RBC as the Fund’s clearing broker.
Litigation and Regulatory Disclosure Relating to FCMs
Merrill Lynch, Pierce, Fenner & Smith Incorporated (MLPF&S)
Merrill Lynch, Pierce, Fenner & Smith Incorporated (the “Company” or “MLPF&S”), a Delaware corporation, is registered with the U.S. Commodity Futures Trading Commission (“CFTC”) as a Futures Commission Merchant (“FCM”). The Company is a clearing member of the Chicago Board of Trade, and the Chicago Mercantile Exchange, and is either a clearing member or member of all other principal U.S. futures and futures options exchanges. With regard to those domestic futures and futures options exchanges of which it is not a clearing member, the Company has entered into third party brokerage relationships with FCMs that are clearing members of those exchanges. The Company maintains its principal place of business at One Bryant Park, New York, NY10036.
Bank of America Corporation (the “Corporation” or “Bank of America”), the Company’s ultimate parent (the “Parent”) makes all required disclosures in its Annual Reports on Form 10-K and Quarterly Reports on Form 10-Q, which may be updated by Current Reports on Form 8-K, all of which are filed with the Securities and Exchange Commission (“SEC”) (“Regulatory Filings”). The Company makes all required disclosures in its Form BD and ADV filings (“Form BD and ADV Filings”) with the Financial Industry Regulatory Authority (“FINRA”). Those Regulatory Filings and Form BD and ADV Filings include disclosures of Regulatory Inquiries as required by federal law and applicable regulations. The Regulatory Filings are publicly available on the SEC’s website at www.sec.gov. The Form BD Filings are publicly available on the FINRA BrokerCheck system at http://brokercheck.finra.org/. The Form ADV filings are publicly available on the SEC’s Investment Adviser Search website at: http://www.adviserinfo.sec.gov/IAPD/default.aspx.
In the ordinary course of business, the Company is routinely a defendant in or party to many pending and threatened legal, regulatory and governmental actions and proceedings. In view of the inherent difficulty of predicting the outcome of such matters, particularly where the claimants seek very large or indeterminate damages or where the matters present novel legal theories or involve a large number of parties, the Company generally cannot predict what the eventual outcome of the pending matters will be, what the timing of the ultimate resolution of these matters will be, or what the eventual loss, fines or penalties related to each pending matter may be.
In accordance with applicable accounting guidance, the Company establishes an accrued liability for matters when those matters present loss contingencies that is both probable and estimable. In such cases, there may be an exposure to loss in excess of any amounts accrued. As a matter develops, the Company, in conjunction with any outside counsel handling the matter, evaluates on an ongoing basis whether such matter presents a loss contingency that is probable and estimable. Once the loss contingency related to a matter is deemed to be both probable and estimable, the Company will establish an accrued liability. The Company continues to monitor the matter for further developments that could affect the amount of the accrued liability that has been previously established.
In some of the matters described below, loss contingencies are not both probable and estimable in the view of management, and accordingly, an accrued liability has not been established for those matters. Information is provided below regarding the nature of all these contingencies and, where specified, the amount of the claim associated with these loss contingencies. Based on current knowledge, management does not believe that loss contingencies arising from pending matters, including the matters described herein, will have a material adverse effect on the Company’s consolidated financial position or liquidity. However, in light of the inherent uncertainties involved in these matters, some of which are beyond the Company’s control, and the very large or indeterminate damages sought in some of these matters, an adverse outcome in one or more of these matters could be material to the Company’s results of operations or cash flows for any particular reporting period.
- 30 -
Table of Contents
The actions against the Company include, but are not limited to, the following:
LITIGATION
Ambac Litigation
On April 16, 2012, Ambac Assurance Corp. and the Segregated Account of Ambac Assurance Corp. (together, “Ambac”) sued MLPF&S, First Franklin Financial Corp., Merrill Lynch Mortgage Lending, Inc.(“MLML”), Merrill Lynch Mortgage Investors, Inc. and a Bank of America entity in New York Supreme Court, New York County. Plaintiffs’ claims relate to guaranty insurance Ambac provided on a First Franklin securitization (Franklin Mortgage Loan Trust, Series 2007-FFC). The securitization was sponsored by MLML, and certain certificates in the securitization were insured by Ambac. The complaint alleges that defendants breached representations and warranties concerning the origination of the underlying mortgage loans and asserts claims for fraudulent inducement, breach of contract and indemnification. The complaint does not specify the amount of damages sought.
On July 19, 2013, the court denied defendants’ motion to dismiss Ambac’s contract and fraud causes of action but granted dismissal of Ambac’s indemnification cause of action. In addition, the court denied defendants’ motion to dismiss Ambac’s claims for attorneys’ fees and punitive damages.
On September 17, 2015, the court denied Ambac’s motion to dismiss defendants’ affirmative defense of in pari delicto and granted Ambac’s motion to dismiss defendants’ affirmative defense of unclean hands.
Auction Rate Securities Litigation
Beginning in October 2007, the Company and certain affiliates were named as defendants in a variety of lawsuits and other proceedings brought by customers, both individual and institutional investors, and issuers regarding auction rate securities (“ARS”). These actions generally alleged that defendants: (i) misled plaintiffs into believing that there was a deeply liquid market for ARS, and (ii) failed to adequately disclose their or their affiliates’ practice of placing their own bids to support ARS auctions. Plaintiffs asserted that ARS auctions started failing from August 2007 through February 2008 when defendants and other broker-dealers stopped placing those “support bids.” In addition to the matters described in more detail below, arbitrations and individual lawsuits were filed against the Company and certain affiliates by parties who purchased ARS and sought relief that included compensatory and punitive damages and rescission, among other relief.
Securities Actions
The Company and its former parent, Merrill Lynch & Co., Inc. (“ML&Co”), faced civil actions relating to the sales of ARS and management of ARS auctions, including two putative class action lawsuits in which the plaintiffs sought to recover the alleged losses in market value of ARS purportedly caused by the defendants’ actions. Plaintiffs also sought unspecified damages, including rescission, other compensatory and consequential damages, costs, fees and interest. The first action, In Re Merrill Lynch Auction Rate Securities Litigation, was the result of the consolidation of two class action suits in the U.S. District Court for the Southern District of New York. These suits were brought by two Company customers on behalf of all persons who purchased ARS in auctions managed by the Company and other affiliates, against ML&Co and the Company. On March 31, 2010, the U.S. District Court for the Southern District of New York granted defendants’ motion to dismiss. Plaintiffs appealed and on November 14, 2011, the U.S. Court of Appeals for the Second Circuit affirmed the district court’s dismissal. Plaintiffs’ time to seek a writ of certiorari to the U.S. Supreme Court expired on February 13, 2012 and, as a result, this action is now concluded.
The second action, Bondar v. Bank of America Corporation, was brought by a putative class of ARS purchasers against the Corporation and Banc of America Securities, LLC (“BAS,” which was merged into MLPF&S in 2009). On February 24, 2011, the U.S. District Court for the Northern District of California dismissed the amended complaint and directed plaintiffs to state whether they would file a further amended complaint or appeal the court’s dismissal. Following the Second Circuit’s decision in In Re Merrill Lynch Auction Rate Securities Litigation, plaintiffs voluntarily dismissed their action on January 4, 2012.
Benistar Litigation
In Gail A. Cahaly, et al. v. Benistar Property Exchange Trust Company, Inc, et al. a matter filed on August 1, 2001, in Massachusetts Superior Court, Suffolk County, plaintiffs alleged that the Company aided and abetted a fraud and breach of fiduciary duty allegedly perpetrated by Benistar, a former client of the Company. On June 25, 2009, the jury in the second trial in this matter found in favor of plaintiffs on all counts. Plaintiffs filed discovery-related sanctions motions, as well as a petition seeking attorneys’ fees and costs. On January 11, 2011, the court issued rulings denying plaintiffs’ request for sanctions and punitive damages but awarding consequential
- 31 -
Table of Contents
damages and attorneys’ fees to plaintiffs in an amount not material to the Company’s results of operations. Plaintiffs and the Company appealed the court’s January 11, 2011 rulings on damages and sanctions. On December 26, 2012, plaintiffs and the Company agreed to settle for an amount not material to the Company’s results of operations.
European Commission - Credit Default Swaps Antitrust Investigation
On July 1, 2013, the European Commission (“Commission”) announced that it had addressed a Statement of Objections (“SO”) to BAS, Bank of America and a related entity (together, the “Bank of America Entities”); a number of other financial institutions; Markit Group Limited; and the International Swaps and Derivatives Association (together, the “Parties”). The SO sets forth the Commission’s preliminary conclusion that the Parties infringed EU competition law by participating in alleged collusion to prevent exchange trading of credit default swaps and futures. According to the SO, the conduct of the Bank of America Entities took place between August 2007 and April 2009. As part of the Commission’s procedures, the Parties have been given the opportunity to review the evidence in the investigative file, respond to the Commission’s preliminary conclusions, and request a hearing before the Commission. If the Commission is satisfied that its preliminary conclusions are proved, the Commission has stated that it intends to impose a fine and require appropriate remedial measures. On December 4, 2015, the Commission announced that it was closing its investigation against the Bank of America Entities and the other financial institutions involved in the investigation.
“Good Reason” Litigation
Beginning in 2009, the Company and certain affiliates were named as defendants in lawsuits and arbitrations brought by former employees of the Company, primarily financial advisors, who participated in certain Merrill Lynch equity and contingent long term incentive compensation plans (the “Plans”). These actions generally alleged that the former employees had “good reason” to resign as that term is defined under the change in control provisions of the applicable Plans and, as such, were entitled to immediate vesting and payment of forfeited awards and/or monetary sums under those Plans.
In addition, a putative class action was filed in October 2009, entitled Chambers, et al. v. Merrill Lynch & Co., et al. in the U.S. District Court for the Southern District of New York, seeking certification of a putative class of financial advisors and seeking damages and other payments under the good reason provisions of certain contingent incentive compensation plans. On November 26, 2012, the parties entered into an agreement to settle Chambers, the amount of which was fully accrued. On April 26, 2013, the court granted final approval to the settlement.
Illinois Funeral Directors Association Matters
Commencing in 1979, the Illinois Funeral Directors Association (“IFDA”), an Illinois not-for-profit corporation that serves as a trade association representative for the Illinois funeral industry, began providing trust services to Illinois consumers for the deposit of payments for pre-paid funeral services. Illinois law regulates the sale of pre-paid funeral goods and services and requires that proceeds of those sales be held in trust. In 1986, the IFDA began offering a tax-advantaged pre-need trust administered by its subsidiary, IFDA Services, Inc. (“IFDA Services”). The tax-advantaged pre-need trust invested primarily in variable universal life insurance (“VUL”) policies written against the lives of “keymen” of IFDA, its members and its affiliates. In response to the stated investment objectives of IFDA’s executive director and its board of directors, the Company recommended the purchase of the VUL policies to IFDA for the tax-advantaged pre-need trust, and Merrill Lynch Life Agency, Inc. (“MLLA”), sold the pre-need trust approximately 270 VUL policies as investment vehicles.
During IFDA Services’ operation of the pre-need trust, it credited IFDA members with earnings on deposits into the pre-need trust based on a rate of return set by IFDA Services, even though the crediting rate sometimes exceeded the actual earnings on the trust investments. As a result, a deficit developed between the amounts that the IFDA credited to IFDA members and the actual earnings of the trust. The Illinois Office of the Comptroller, the trust’s regulator, removed IFDA Services as trustee of the trust in 2008, and asked Merrill Lynch Bank & Trust Company, FSB (“MLBTC”), to serve as successor trustee.
On February 10, 2012, the State of Illinois Office of the Secretary of State, Securities Department (“ISD”) entered into a consent order with the Company to resolve the ISD’s investigation of the sale of life insurance policies to the pre-need trust. The consent order provided for payment by the Company of an amount not material to the Company’s results of operations as restitution to the tax-advantaged pre-need trust and its beneficiaries to mitigate any potential loss or injuries that Illinois pre-need patrons or funeral homes might otherwise suffer and fund the anticipated funeral costs of Illinois pre-need patrons. In addition, the consent order provided for payment by the Company of the costs of the ISD’s investigation and of administration and distribution of the ISD settlement funds.
On June 16, 2009, a purported class action on behalf of a proposed class of pre-need contract holders, David Tipsword as Trustee of Mildred E. Tipsword Trust, individually and on behalf of all others similarly situated v. I.F.D.A. Services Inc., et al., was filed in the U.S. District Court for the Southern District of Illinois against the Company, among other defendants. The complaint alleged that the Company breached purported fiduciary duties and committed negligence and seeks compensatory and punitive damages, reasonable attorneys’ fees, and costs. The court denied the Company’s motion to dismiss.
- 32 -
Table of Contents
On June 30, 2009, a purported class action on behalf of a proposed class of funeral directors, Clancy-Gernon Funeral Home, Inc., et al. v. MLPF&S, et al., was filed in the Illinois Circuit Court, Cook County, Illinois, alleging that the Company and MLLA, among other defendants, committed consumer fraud, civil conspiracy, unjust enrichment, and conversion. The Company and MLLA removed the complaint to the U.S. District Court for the Northern District of Illinois, and the case was ultimately transferred to the U.S. District Court for the Southern District of Illinois. On November 9, 2010, plaintiff filed a third amended complaint, which added new parties, including MLBTC, and additional claims for fraud, breach of fiduciary duty, negligence and aiding and abetting fiduciary duty against the Company and MLLA, and breach of fiduciary duty and negligence against MLBTC. The third amended complaint sought disgorgement and remittance of all commissions, premiums, fees and compensation; an accounting; compensatory damages; pre-judgment and post-judgment interest; and reasonable attorneys’ and experts’ fees and costs. The court denied MLBTC’s motion to dismiss and permitted the Company and MLLA to withdraw their motions to dismiss.
On December 9, 2010, a purported class action on behalf of a proposed class of funeral directors, Pettett Funeral Home, Ltd., et al. v. MLPF&S, et al., was filed in the U.S. District Court for the Southern District of Illinois. The allegations and relief sought in the Pettett matter were virtually identical to the claims in Clancy-Gernon.
On July 28, 2010, Charles G. Kurrus, III, P.C., a funeral director and owner of a funeral home, filed an action in the Illinois Circuit Court, St. Clair County, against the Company, MLLA and MLBTC, among others, including present and former employees. The complaint, entitled Charles F. Kurrus, III, P.C. v. Merrill Lynch, Pierce, Fenner & Smith, Inc., et al., asserted causes of action for breach of the Illinois Consumer Fraud and Deceptive Business Practices Act and civil conspiracy against all defendants; breach of fiduciary duty against the Company and MLBTC; and negligence and aiding and abetting breach of fiduciary duty against the Company. The complaint sought declaratory relief; disgorgement of all commissions, fees and revenues received by the Company, MLLA and MLBTC; pre-judgment and post-judgment interest; an accounting; and attorneys’ fees.
On February 15, 2012, the parties to the above-referenced litigations executed a settlement agreement to fully resolve the claims asserted in the class action litigations and the Kurrus litigation, and fully release and bar any civil claims against the Company, its employees or affiliates with respect to the IFDA pre-need trust. The settlement agreement provided for a payment by the Company in an amount not material to its results of operations (which amount was fully accrued as of December 31, 2011). On June 12, 2012, the court entered a final order approving the class action settlement and entered judgments dismissing the three class action lawsuits (Tipsword, Clancy-Vernon and Pettett) with prejudice. On August 2, 2012, the court in Kurrus dismissed the matter with prejudice.
In re Initial Public Offering Securities Litigation
ML&Co, the Company, including BAS, and certain of their subsidiaries, along with other underwriters, and various issuers and others, were named as defendants in a number of putative class action lawsuits that were consolidated in the U.S. District Court for the Southern District of New York as In re Initial Public Offering Securities Litigation. Plaintiffs contended, among other things, that defendants failed to make certain required disclosures in the registration statements and prospectuses for applicable offerings regarding alleged agreements with institutional investors that tied allocations in certain offerings to the purchase orders by those investors in the aftermarket. Plaintiffs alleged that such agreements allowed defendants to manipulate the price of the securities sold in these offerings in violation of Section 11 of the Securities Act of 1933 (the “Securities Act”) and Section 10(b) of the Securities Exchange Act of 1934 (the “Exchange Act”), and SEC rules promulgated thereunder. The parties agreed to settle the matter, for which the court granted final approval, in an amount that was not material to the Company’s results of operations. Certain putative class members filed an appeal in the U.S. Court of Appeals for the Second Circuit seeking reversal of the final approval. On August 25, 2011, the district court, on remand from the U.S. Court of Appeals for the Second Circuit, dismissed the objection by the last remaining putative class member, concluding that he was not a class member. On January 9, 2012, that objector dismissed with prejudice an appeal of the court’s dismissal pursuant to a settlement agreement. On November 28, 2011, an objector whose appeals were dismissed by the Second Circuit filed a petition for a writ of certiorari with the U.S. Supreme Court that was rejected as procedurally defective. On January 17, 2012, the Supreme Court advised the objector that the petition was untimely and should not be resubmitted to the Supreme Court.
Lehman Brothers Holdings, Inc. Litigation
Beginning in September 2008, the Company, including BAS, along with other underwriters and individuals, were named as defendants in several putative class action lawsuits filed in federal and state courts. All of these cases were transferred or conditionally transferred to the U.S. District Court for the Southern District of New York under the caption In re Lehman Brothers Securities and ERISA Litigation. Plaintiffs alleged that the underwriter defendants violated Section 11 of the Securities Act, as well as various state laws, by making false or misleading disclosures about the real estate-related investments and mortgage lending practices of Lehman Brothers Holdings, Inc. (“LBHI”) in connection with various debt and convertible stock offerings of LBHI. Plaintiffs sought
- 33 -
Table of Contents
unspecified damages. On June 4, 2010, defendants filed a motion to dismiss the complaint. On July 27, 2011, the court granted in part and denied in part the motion. Certain of the allegations in the complaint that purported to support the Section 11 claim against the underwriter defendants were dismissed; others were not dismissed relating to alleged misstatements regarding LBHI’s leverage and financial condition, risk management and risk concentrations.
On September 23, 2011, the majority of the underwriter defendants, including BAS, the Company and approximately 40 others, reached an agreement in principle with the lead plaintiffs to settle the securities class action as to the settling underwriters. On May 2, 2012, the court gave final approval to the settlement. The Company’s portion of the settlement was not material to its results of operations or financial condition.
MBIA Insurance Corporation CDO Litigation
On April 30, 2009, MBIA Insurance Corporation (“MBIA”) and LaCrosse Financial Products, LLC filed a complaint in New York State Supreme Court, New York County, against the Company and Merrill Lynch International (“MLI”) under the caption MBIA Insurance Corporation and LaCrosse Financial Products, LLC v. Merrill Lynch Pierce Fenner and Smith Inc., and Merrill Lynch International. The complaint related to certain credit default swap and insurance agreements by which plaintiffs provided credit protection to the Company and MLI and other parties on CDO securities. Plaintiffs claimed that the Company and MLI did not adequately disclose the credit quality and other risks of the CDO securities and underlying collateral. The complaint alleged claims for fraud, negligent misrepresentation, breach of the implied covenant of good faith and fair dealing and breach of contract and seeks rescission and unspecified compensatory and punitive damages, among other relief. On April 9, 2010, the court granted defendants’ motion to dismiss as to the fraud, negligent misrepresentation, and breach of the implied covenant of good faith and fair dealing and rescission claims, as well as a portion of the breach of contract claim. Plaintiffs appealed the dismissal of their claims and MLI cross-appealed the denial of its motion to dismiss the breach of contract claim in its entirety. On February 1, 2011, the appellate court dismissed the case against MLI in its entirety. On July 11, 2011, the parties reached an agreement to settle the litigation. The settlement did not require any payment by the Company.
Mortgage-Backed Securities (“MBS”) Litigation
The Company and certain of its affiliates have been named as defendants in a number of cases relating to their various roles as issuer, originator, seller, depositor, sponsor, and/or underwriter in MBS offerings, pursuant to which the MBS investors were entitled to a portion of the cash flow from the underlying pools of mortgages. These cases generally include actions by individual MBS purchasers and governmental actions. Although the allegations vary by lawsuit, these cases generally allege that the registration statements, prospectuses and prospectus supplements for securities issued by securitization trusts contained material misrepresentations and omissions, in violation of the Securities Act and/or state securities laws and other state statutory and common laws.
These cases generally involve allegations of false and misleading statements regarding: (i) the process by which the properties that served as collateral for the mortgage loans underlying the MBS were appraised; (ii) the percentage of equity that mortgage borrowers had in their homes; (iii) the borrowers’ ability to repay their mortgage loans; (iv) the underwriting practices by which those mortgage loans were originated; (v) the ratings given to the different tranches of MBS by rating agencies; and (vi) the validity of each issuing trust’s title to the mortgage loans comprising the pool for the securitization (collectively, “MBS Claims”). Plaintiffs in these cases generally seek unspecified compensatory damages, unspecified costs and legal fees and, in some instances, seek rescission. A number of other entities threatened legal actions against the Company concerning MBS offerings.
On March 29, 2013, the Company and the National Credit Union Administration (the “NCUA”) agreed to resolve claims concerning certain MBS offerings that the NCUA had threatened to bring against the Company and certain of its affiliates. The settlement amount was covered by existing reserves.
AIG Litigation
On August 8, 2011, American International Group, Inc. and certain of its affiliates (collectively, “AIG”) filed a complaint in New York Supreme Court, New York County, in a case entitled American International Group, Inc. et al. v. Bank of America Corporation et al. AIG has named, among others, the Company and certain related entities as defendants. AIG’s complaint asserts certain MBS Claims pertaining to 142 MBS offerings and two MBS private placements relating to Merrill Lynch entities, in which AIG alleges that it purchased securities between 2005 and 2007. AIG seeks rescission of its purchases or a rescissory measure of damages or, in the alternative, compensatory damages of no less than $10 billion as to all defendants; punitive damages; and other unspecified relief. Defendants removed the case to the U.S. District Court for the Southern District of New York and the district court denied AIG’s motion to remand. On April 19, 2013, the U.S. Court of Appeals for the Second Circuit issued a decision vacating the order denying AIG’s motion to remand and remanded the case to district court for further proceedings concerning whether the court will exercise its jurisdiction on other grounds.
- 34 -
Table of Contents
On July 15, 2014, the Company, Bank of America and related entities entered into a settlement agreement to resolve all RMBS claims asserted in the previously disclosed case entitled American International Group, Inc. et al. v. Bank of America Corporation et al (the “AIG Action”), among other matters. The settlement provides for dismissal with prejudice of the AIG Action and the release by American International Group, Inc. and certain of its affiliates (collectively, “AIG”) of the Company and its affiliates from the claims asserted therein. Bank of America paid AIG $650 million in this settlement, the Company’s portion of which was fully accrued.
Bayerische Landesbank, New York Branch (Merrill Lynch) Litigation
On May 2, 2012, Bayerische Landesbank, New York Branch, filed a complaint against ML & Co, the Company, Merrill Lynch Mortgage Investors, Inc. (“MLMI”) and Merrill Lynch Mortgage Lending, Inc. (“MLML”), in New York Supreme Court, New York County, entitled Bayerische Landesbank, New York Branch v. Merrill Lynch & Co., et al. The complaint asserted certain MBS Claims in connection with alleged purchases in thirteen offerings of Merrill Lynch-related MBS issued between 2006 and 2007. Plaintiff sought unspecified compensatory damages, punitive damages, interest and legal fees, and rescission or rescissory damages. On September 27, 2012, the case was settled for an amount not material to the Company’s results of operations.
Dexia (Merrill Lynch) Litigation
On March 29, 2012, Dexia SA/NV, Dexia Holdings, Inc., FSA Asset Management LLC and Dexia Crédit Local SA (“Dexia”) filed a complaint against ML & Co, the Company, MLMI, MLML and First Franklin Financial Corporation in New York Supreme Court, New York County, entitled Dexia, et al. v. Merrill Lynch & Co. et al. The complaint asserted certain MBS Claims in connection with its alleged purchase of fifteen MBS that were issued and/or underwritten by the Company and related entities between 2006 and 2007. Dexia sought unspecified compensatory damages, rescission, interest and legal fees. The action was removed to the U.S. District Court for the Southern District of New York. On September 27, 2012, the case was settled for an amount not material to the Company’s results of operations.
Federal Housing Finance Agency Litigation
On September 2, 2011, Federal Housing Finance Agency (“FHFA”), as conservator for Fannie Mae (“FNMA”) and Freddie Mac (“FHLMC”), filed complaints in the U.S. District Court for the Southern District of New York against Bank of America, the Company and certain related entities, and certain current and former officers and directors of these entities. The actions are entitled Federal Housing Finance Agency v. Bank of America Corporation, et al., (the “FHFA Bank of America Litigation”) and Federal Housing Finance Agency v. Merrill Lynch & Co., Inc., et al. (the “FHFA Merrill Lynch Litigation”). The complaints assert certain MBS Claims relating to MBS issued and/or underwritten by Bank of America, the Company and related entities in 23 MBS offerings and in 72 MBS offerings, respectively, between 2005 and 2008 and allegedly purchased by either FNMA or FHLMC in their investment portfolios. FHFA seeks, among other relief, rescission of the consideration FNMA and FHLMC paid for the securities or alternatively damages allegedly incurred by FNMA and FHLMC, including consequential damages. FHFA also seeks recovery of punitive damages in the FHFA Merrill Lynch Litigation.
On November 8, 2012 and November 28, 2012, the court denied motions to dismiss in the FHFA Merrill Lynch Litigation and the FHFA Bank of America Litigation, respectively.
On December 16, 2013, the district court granted FHFA’s motion for partial summary judgment, ruling that loss causation is not an element of, or a defense to, FHFA’s claims under Virginia or Washington, D.C. blue sky laws.
On March 25, 2014, Bank of America entered into a settlement with FHFA and FHLMC to resolve all outstanding RMBS litigation between FHFA, FNMA and FHLMC, and Bank of America and its affiliates, including the Company, as well as other matters. The net cost of the settlement to Bank of America was $6.3 billion, the Company’s portion of which was fully accrued. The FHFA Settlement resolved all claims asserted in the FHFA Bank of America Litigation and FHFA Merrill Lynch Litigation, among other actions. Both actions have been dismissed and FHFA, FNMA and FHLMC have released Bank of America and its affiliates, including the Company, from the claims asserted therein.
Merrill Lynch MBS Litigation
ML&Co, the Company, MLMI and certain current and former directors of MLMI were named as defendants in a consolidated class action in the U.S. District Court in the Southern District of New York, entitled Public Employees’ Ret. System of Mississippi v. Merrill Lynch & Co. Inc. Plaintiffs assert certain MBS Claims in connection with their purchase of MBS. In March 2010, the court dismissed claims related to 65 of 84 offerings with prejudice due to lack of standing as no named plaintiff purchased securities in those offerings. On November 8, 2010, the court dismissed claims related to one additional offering on separate grounds. On May 7, 2012, the court granted final approval of a settlement providing for a payment in an amount not material to the Company’s results of operations (the Company’s portion of which was fully accrued as of December 31, 2011).
- 35 -
Table of Contents
Prudential Insurance Litigation
On March 14, 2013, The Prudential Insurance Company of America and certain of its affiliates (collectively “Prudential”) filed a complaint in the U.S. District Court for the District of New Jersey, in a case entitled Prudential Insurance Company of America, et al. v. Bank of America, N.A., et al. Prudential has named, among others, the Company and certain related entities as defendants. Prudential’s complaint asserts certain MBS Claims pertaining to 54 MBS offerings in which Prudential alleges that it purchased securities between 2004 and 2007. Prudential seeks, among other relief, compensatory damages, rescission or a rescissory measure of damages, treble damages, punitive damages, and other unspecified relief. On April 17, 2014, the court granted in part and denied in part defendants’ motion to dismiss the complaint. Prudential thereafter split its claims into two separate complaints, filing an amended complaint in the original action and a complaint in a separate action entitled Prudential Portfolios 2 et al. v. Bank of America, N.A., et al. Both cases are pending in the U.S. District Court for the District of New Jersey. On February 5, 2015, the court granted in part and denied in part defendants’ motion to dismiss those complaints, granting plaintiff leave to replead in certain respects.
The parties have agreed to resolve Prudential’s claims for an amount that is not material to the Company’s results of operations (the Company’s portion of which was fully accrued as of March 31, 2015). Pursuant to the settlement, Prudential has filed stipulations for dismissal of all claims with prejudice.
Regulatory and Governmental Investigations
The Company received a number of subpoenas and other requests for information from regulators and governmental authorities regarding MBS and other mortgage-related matters, including inquiries, investigations and potential proceedings related to a number of transactions involving the Company’s underwriting and issuance of MBS and its participation in certain CDO and SIV offerings. These inquiries and investigations included, among others: investigations by the RMBS Working Group of the Financial Fraud Enforcement Task Force, including the U.S. Department of Justice (“DOJ”) and state Attorneys General concerning the purchase, securitization and underwriting of mortgage loans and RMBS. The Company provided documents and testimony and continues to cooperate fully with these inquiries and investigations.
The staff of the NYAG advised that they intended to recommend filing an action against the Company as a result of their RMBS investigation. In addition, the staff of a U.S. Attorney’s office advised that they intended to recommend that the DOJ file a civil action against Merrill Lynch related to the securitization of RMBS.
On August 21, 2014, Bank of America announced a comprehensive settlement with the U.S. Department of Justice, certain federal agencies, and the states of California, Delaware, Illinois, Kentucky, Maryland, and New York. The settlement resolves, among other things, certain federal and state civil claims concerning the Company’s participation in the packaging, origination, marketing, sale, structuring, arrangement, and issuance of RMBS and CDOs. As part of the settlement, Bank of America agreed to make $9.65 billion in payments, $5 billion of which will serve as a penalty under the Financial Institutions Reform, Recovery and Enforcement Act. Additionally, Bank of America agreed to provide $7 billion worth of consumer relief, which could include, among other things, principal forgiveness and forbearance, loan modification, and targeted lending, to be completed by August 31, 2018.
Rosen Capital Partners LP & Rosen Capital Institutional LP’s FINRA Arbitration
On May 28, 2008, two former hedge fund clients of Merrill Lynch Professional Clearing Corp. (“MLPCC”), Rosen Capital Partners LP and Rosen Capital Institutional LP (collectively, the “Rosen Funds”), filed a statement of claim asserting claims for breach of contract, fraud, and negligence against MLPCC in connection with alleged losses in the fall of 2008. On July 5, 2011, a FINRA panel awarded the Rosen Funds $64 million plus pre-judgment interest. On December 23, 2011 the California Superior Court granted the Rosen Funds’ motion to confirm the award and on February 15, 2012 entered judgment on the award and pre-judgment interest, an amount that was fully accrued. On February 5, 2013, the Court of Appeal affirmed the decision of the California Superior Court.
REGULATORY ACTIONS
Multi-State Auction Rate Securities Settlement
On July 31, 2008, the Commonwealth of Massachusetts Office of the Secretary of the Commonwealth Securities Division (“MSD”) alleged that the Company violated the Massachusetts Uniform Securities Act, which, in part, prohibits unethical or dishonest conduct or practices in the securities business, concerning the sale of ARS to retail and other customers by the Company. Without admitting or denying the allegations, the Company entered into a settlement with the MSD, in which it agreed to certain undertakings, including offering to buy back eligible ARS from eligible investors. The Company agreed to pay the MSD a civil penalty of $1,598,650.90, as part of a $125,000,000 fine that will be allocated at the Commonwealth of Massachusetts and other states’ discretion to resolve all underlying conduct relating to the sale of ARS. Three states – Connecticut, Utah, and Washington have identified their respective state settlements as constituting a final order based on violations of any laws or regulations that prohibit fraudulent, manipulative, or deceptive conduct. The Company disagrees with their characterizations. Fifty-two (52) of the potential 54 multistate settlements have been completed to date.
- 36 -
Table of Contents
Banc of America Investment Services, Inc./Banc of America Securities LLC Auction Rate Securities Settlement
As the result of the merger of Banc of America Investment Services, Inc. (“BAI”) with and into the Company on October 23, 2009 and the merger of BAS with and into the Company on November 1, 2010, the Company assumed the liabilities of BAI and BAS in the following matter: The SEC alleged that BAI and BAS (together, the “Firms”), misled customers regarding the fundamental nature and increasing risks associated with ARS that the Firms underwrote, marketed, and sold. The SEC also alleged that, by engaging in such conduct, the Firms violated Section 15(c) of the Exchange Act, as amended. The Firms neither admit nor deny these allegations. Among other undertakings, the Firms have, through their affiliate Blue Ridge Investments, L.L.C., offered to purchase at par from “Individual Investors” (as defined in the Consent of Defendants Banc of America Securities LLC and Banc of America Investment Services, Inc.) certain ARS, and have substantially completed the purchase of those ARS. The Firms have also agreed to pay a total civil penalty of $50,000,000 that will be distributed among the states and U.S. territories that enter into administrative or civil consent orders related to ARS. To the best of our knowledge and belief, two states – Idaho and Washington identified their respective state settlements as constituting a final order based on violations of any laws or regulations that prohibit fraudulent, manipulative, or deceptive conduct. Please note that BAI and BAS are no longer registered broker-dealers and this information is no longer available for verification. The Company disagrees with their characterizations. Fifty-one (51) of the potential 54 multistate settlements have been completed to date.
Multi-State Client Associate Registration Settlement
On September 8, 2009, the Texas State Securities Board (the “Board”) alleged that in connection with the sale of securities in Texas by certain of the Company’s Client Associates who were not registered in Texas, the Company failed to establish a supervisory system reasonably designed to achieve compliance with the Texas Securities Act and Rules and Regulations of the Texas State Securities Board (the “Board Rules”) and failed to enforce its established written procedures in violation of §§ 115.10(a) and (b)(1) of the Board Rules, respectively. Without admitting or denying the findings of fact or conclusions of law, the Company entered into a Consent Order with the Board in which it agreed to a reprimand, to cease and desist from engaging in the sale of securities in Texas through unregistered agents, and to comply with certain undertakings. The Company agreed to pay the State of Texas $1,568,985.00, as part of a total payment, consisting of fines, penalties and any other monetary sanctions, of $26,563,094.50 that will be allocated among the 50 states, the District of Columbia, Puerto Rico, and the U.S. Virgin Islands. The Company also agreed to pay $25,000.00 to the North American Securities Administrators Association (“NASAA”) as consideration for financial assistance provided by NASAA in connection with the multi-state investigation. Fifty-one (51) of the potential 53 multistate settlements have been completed to date.
CBOT Business Conduct Committee Decision 1/24/2013
Between June 5, 2009 and May 17, 2012, Applicant executed block trades for customers in CBOT Interest Rate futures contracts that were not reported to the Chicago Board of Trade (“CBOT”) within the applicable time limit following execution. In addition, Applicant misrepresented the true and accurate time of execution of block trades to the CBOT thereby violating legacy CBOT Rules 526.F and 432.I. Further, Applicant failed to maintain accurate written or electronic records of the block trade transactions (specifically, the order tickets and other records Applicant employed to record block trades contained inaccurate timing information) and did not have accurate and reliable time-keeping mechanisms in place upon which to base the time of execution in violation of CBOT Rule 536. By failing to diligently supervise its employees or agents in the conduct of Applicant’s business relating to the CBOT as outlined above, the Applicant violated legacy CBOT Rule 432.W. Without admitting or denying the rule violations, the Applicant consented to the entry of the CBOT’s Decision and agreed to pay a fine of $190,000.
CME Business Conduct Committee Decision 10/24/2013
Between June 4, 2009 and August 8, 2011, Applicant executed block trades for customers in the Eurodollars futures market that were not reported to the Chicago Mercantile Exchange (“CME”) within the applicable time limit following execution. In addition, Applicant misrepresented the true and accurate time of execution of block trades to the CME thereby violating legacy CME Rules 526.F and 432.I. Further, Applicant failed to maintain accurate written or electronic records of the block trade transactions (specifically, the order tickets and other records Applicant employed to record block trades contained inaccurate timing information) and did not have accurate and reliable time-keeping mechanisms in place upon which to base the time of execution in violation of CME Rule 536. By failing to diligently supervise its employees or agents in the conduct of the Applicant’s business relating to the CME as outlined above, the Applicant violated legacy CME Rule 432.W. Without admitting or denying the rule violations, the Applicant consented to the entry of the CME’s Decision and agreed to pay a fine of $60,000.
- 37 -
Table of Contents
CDO Settlement 12/12/2013
Pursuant to an Offer of Settlement made by the Company on December 12, 2013, the SEC issued an order (“Order”) stating that the Company violated the federal securities laws in connection with its structuring and marketing of a series of collateralized debt obligation transactions (“CDOs”) in 2006 and 2007. According to the Order, the Company failed to inform investors in two CDOs that a hedge fund firm that bought the equity in the transactions but whose interests were not necessarily the same as those of the CDOs’ other investors, had undisclosed rights relating to, and exercised significant influence over, the selection of the CDOs’ collateral. The Order stated that, as a result of its conduct, the Company violated Sections 17(a)(2) and 17(a)(3) of the Securities Act and section 17(a)(1) of the Exchange Act and Rule 17a-3(a)(2) thereunder. The Company consented to the entry of the Order without admitting or denying the findings therein. The Order (1) required that the Company cease and desist from committing or causing any violations and any future violations of Sections 17(a)(2) and 17(a)(3) of the Securities Act and Section 17(a)(1) of the Exchange Act and Rule 17a-3(a)(2) thereunder; (2) censured the Company; and (3) required that the Company pay disgorgement of $56,286,000 and prejudgment interest of $19,228,027 and a civil money penalty in the amount of $56,286,000 (for a total payment of $131,800,027).
CFTC ORDER 8/26/2014
From at least January 1, 2010 through April 2013 (the “Relevant Period”), MLPF&S failed to supervise diligently its officers’, employees’, and agents’ processing of exchange and clearing fees charged to its customers, in violation of CFTC Regulation 166.3. As a result, MLPF&S’s reconciliation process for identifying and correcting discrepancies between the invoices from the exchange clearinghouses and the amounts charged to customers has been inaccurate and faulty since at least January 1, 2010, and led to instances in which MLPF&S appears to have overcharged some customers and undercharged others. Where MLPF&S has confirmed that there was an overcharge to a customer, the customer’s account has been adjusted, but MLPF&S has been unable to fully resolve some discrepancies. Additionally, during the Relevant Period, MLPF&S did not hire qualified personnel to conduct and oversee the fee reconciliations or provide adequate training to existing personnel regarding fee reconciliations. Without admitting or denying any of the findings or conclusions, MLPF&S agreed to the entry of the order, agreed to pay a civil monetary penalty of $1,200,000, cease and desist from further violations of CFTC Regulation 166.3, and undertake to implement strengthened processes and procedures related to futures exchange and clearing fee reconciliations that will not only improve accuracy, but will detect when MLPF&S’s customers have been charged inaccurate futures exchange and clearing fees. MLPF&S self-identified this matter before the CFTC began its investigation and has fully cooperated with the CFTC’s review of this matter.
SEC RMBS INJUNCTION 11/25/2014
On November 25, 2014, the U.S. District Court for the Western District of North Carolina issued a Final Judgment as to MLPF&S as successor by merger to Banc of America Securities LLC (the “ SEC Final Judgment”) in the civil injunctive action for which a complaint was filed by the Securities and Exchange Commission on August 6, 2013 against MLPF&S, and other entities (collectively the “Entities”) (the “SEC Complaint”). The SEC Complaint alleged that the Entities made material misrepresentations and omissions in connection with the sale of Residential Mortgage-Backed Securities (“RMBS”). Specifically, the SEC Complaint alleged that the Entities failed to disclose the disproportionate concentration of wholesale loans underlying the RMBS as compared to prior RMBS offerings. The SEC Complaint also alleged that the concentration of wholesale loans in the RMBS included higher likelihood that the loans would be subject to material underwriting errors, become severely delinquent, fail early in the life of the loan, or prepay. The SEC Complaint further alleged that the Entities violated Regulation S-K and Subpart Regulation AB of the Securities Act of 1933 by failing to disclose material characteristics of the pool of loans underlying the RMBS, that the Entities made material misrepresentations and omissions in their public files and in the loan tapes provided to investors and rating agencies, and that MLPF&S violated section 5(b)(1) of the Securities Act by failing to file with the SEC certain loan tapes that were provided only to select investors. MLPF&S consented to the entry of the SEC Final Judgment in the SEC without admitting or denying the allegations in the SEC Complaint. The SEC Final Judgment states that MLPF&S was permanently restrained and enjoined from violating Sections 5(b)(1), 17(a)(2) and 17(a)(3) of the Securities Act of 1933, and jointly and severally with the other Entities liable for disgorgement of $109,220,000, prejudgment interest of $6,620,000 and a civil penalty of $109,220,000 (together the “Funds”); the District Court retained jurisdiction over the administration of any distribution of the Funds.
SEC Reg SHO Settlement 6/01/2015
On June 1, 2015, pursuant to SEC Administrative Release 34-75083, the SEC announced that public administrative and cease and desist proceedings were instituted against MLPF&S and Merrill Lynch Professional Clearing Corp. (“MLPro”) (collectively, “Merrill’) for violations of Rule 203(b) of Regulation SHO in connection with its practices related to its execution of short sales. The violations arose from two separate issues with respect to Merrill’s use of its easy to borrow list (“ETB List”) in connection with the execution of short sale transactions. First, Merrill’s execution platforms continued to accept short sales orders in reliance on the firm’s ETB list as the source of the locate after having learned of facts indicating that such reliance was no longer reasonable. As a consequence, Merrill’s conducted violated Rule 203(b) of Reg SHO in that Merrill lacked the requisite reasonable grounds to believe the affected securities could be borrowed for delivery on delivery date as required by the rule. In addition, by recording the ETB list as the locate source in instances where Merrill had determined that such was no longer reasonable, Merrill failed to document an
- 38 -
Table of Contents
appropriate locate as required by the rule. Second, there were in certain instances in which Merrill utilized data that was more than 24 hours old to construct its ETB List, which, at times, resulted in securities being included on the ETB List when they otherwise should not have been. MLPF&S and MLPro have consented to (a) cease and desist from committing or causing any violations and any future violations of Rule 203(b) of Regulation SHO; (b) be censured; (c) pay disgorgement of $1.56 million plus prejudgment interest; (d) pay a civil monetary penalty of $9 million; and (e) comply with certain undertakings, including retaining an independent consultant within thirty (30) days of entry of the Administrative Order to conduct a review of their policies, procedures and practices with respect to their acceptance of short sale orders for execution in reliance on the firm’s ETB List and procedures to monitor compliance therewith to satisfy certain of its obligations under Rule 203(b) of Regulation SHO. In anticipation of the institution of these proceedings, Merrill has submitted an Offer of Settlement (the “Offer”) which the Commission has determined to accept. Merrill admits the findings, acknowledges that its conduct violated the federal securities laws, admits the commission’s jurisdiction over it and the subject matter of these proceedings, and consents to the entry of this order instituting administrative and cease-and-desist proceedings pursuant to Sections 15(b) and 21c of the Securities Exchange Act of 1934, making findings, and imposing remedial sanctions and a cease-and-desist order. Accordingly, it is hereby ordered that the Merrill cease and desist from committing or causing any violations and any future violations of Rule 203(b) of Regulation SHO and is censured. Merrill shall pay disgorgement, which represents profits gained as a result of the conduct, of $1,566,245.67 and prejudgment interest of $334,564.65 to the SEC. Merrill shall pay a civil money penalty in the amount of $9 million to the SEC. Merrill shall comply with the undertakings enumerated in the offer of settlement.
SEC MCDC Settlement 6/18/2015
The SEC deems it appropriate and in the public interest that public administrative and cease-and-desist proceedings be, and hereby are, instituted against MLPF&S. MLPF&S willfully violated section 17(a)(2) of the Securities Act. MLPF&S, a registered broker-dealer, conducted inadequate due diligence in certain offerings and as a result, failed to form a reasonable basis for believing the truthfulness of the assertions by these issuers and/or obligors regarding their compliance with previous continuing disclosure undertakings pursuant to Rule 15c2-12. This resulted in MLPF&S offering and selling municipal securities on the basis of materially misleading disclosure documents. The violations were self-reported by MLPF&S to the Commission pursuant to the Division of Enforcement’s (the “Division”) Municipalities Continuing Disclosure Cooperation (MCDC) initiative. In anticipation of the institution of these proceedings, MLPF&S has submitted an Offer of Settlement (the “Offer”) which the Commission has determined to accept. Solely for the purpose of these proceedings and any other proceedings brought by or on behalf of the Commission, or to which the Commission is a party, and without admitting or denying the findings, except as to the Commission’s jurisdiction over it and the subject matter of these proceedings, which are admitted, MLPF&S consents to the entry of this order instituting administrative and cease-and-desist proceedings pursuant to Section 8a of the Securities Act of 1933 and Section 15(b) of the Securities Exchange Act of 1934, making findings, and imposing remedial sanctions and a cease-and-desist order. In view of the foregoing, the Commission deems it appropriate and in the public interest to impose the sanctions agreed to in MLPF&S’s Offer. Accordingly, it is hereby ordered that MLPF&S shall, cease and desist from committing or causing any violations and any future violations of 17(a)(2) of the Securities Act; pay a civil money penalty in the amount of $500,000 to the SEC; and retain an independent consultant to conduct a review of MLPF&S’s policies and procedures as they relate to municipal securities underwriting due diligence.
SEC 15c3-3 Order 6/23/2016
On June 23, 2016, the SEC issued an administrative order in which it found that MLPF&S and Merrill Lynch Professional Clearing Corp. (“MLPro”) had willfully violated Section 15(c)(3) of the Securities Exchange Act of 1934 (“Exchange Act”) and Rule 15c3-3 thereunder and Section 17(a)(1) of the Exchange Act and Rules 17a-3(a)(10) and 17a-5(a) thereunder, and that MLPF&S willfully violated Section 17(a)(1) of the Exchange Act and Rules 17a-5(d)(3) (as it existed prior to amendments to Rule 17a-5 in 2014), 17a-5(d)(2)(ii), 17a-5(d)(3) and 17a-11(e) thereunder, and Exchange Act Rule 21F-17. Specifically, the order found that (i) MLPF&S and MLPro engaged in a series of complex trades that allowed it to use customer cash to finance firm inventory, (ii) MLPF&S allowed certain of its clearing banks to hold liens on customer securities, and (iii) MLPF&S used language in certain of its policies, procedures, and agreements with employees that unduly limited the disclosure of confidential information. In determining to accept MLPF&S’s and MLPro’s offer, the SEC considered remedial acts promptly undertaken by MLPF&S and MLPro and substantial cooperation afforded the SEC staff during the course of its investigation. In the order, (i) MLPF&S and MLPro were censured, (ii) MLPF&S was ordered to cease and desist from committing or causing any violations and any future violations of Sections 15(c)(3) and 17(a)(1) of the Exchange Act and Rules 15c3-3, 17a-3(a)(10), 17a-5(a), 17a-5(d)(2)(ii), 17a-5(d)(3), 17a-11(e) and 21F-17 thereunder, (iii) MLPro was ordered to cease and desist from committing or causing any violations and any future violations of Sections 15(c)(3) and 17(a)(1) of the Exchange Act and Rules 15c3-3, 17a-3(a)(10) and 17a-5(a) thereunder, (iv) MLPF&S and MLPro were ordered to pay disgorgement of $50,000,000 and prejudgment interest in the amount of $7,000,000, and (v) MLPF&S was ordered to pay a civil monetary penalty of $358,000,000.
- 39 -
Table of Contents
SEC Strategic Return Notes Settlement 6/23/2016
On June 23, 2016, the SEC issued an administrative order in which it found that MLPF&S, without admitting or denying any allegations, violated Section 17(a)(2) of the Securities Act of 1933 (“Securities Act”). Specifically, the order found that MLPF&S failed to adequately disclose certain fixed costs in a proprietary volatility index linked to structured notes known as Strategic Return Notes (“SRNs”) of Bank of America Corporation, which resulted in materially misleading disclosures in the offering materials of the fixed costs associated with the SRNs. In the order, MLPF&S was ordered to (i) cease and desist from committing or causing any violations and any future violations of Section 17(a)(2) of the Securities Act, and (ii) to pay a civil monetary penalty of $10,000,000.
RBC Capital Markets LLC (RBC)
RBC is a large broker-dealer subject to many different complex legal and regulatory requirements. As a result, certain of RBC’s regulators may from time to time conduct investigations, initiate enforcement proceedings and/or enter into settlements with RBC with respect to issues raised in various investigations. RBC complies fully with its regulators in all investigations being conducted and in all settlements it reaches. In addition, RBC is and has been subject to a variety of civil legal claims in various jurisdictions, a variety of settlement agreements and a variety of orders, awards and judgments made against it by courts and tribunals, both in regard to such claims and investigations. RBC complies fully with its all settlements it reaches and all orders, awards and judgments made against it.
RBC has been named as a defendant in various legal actions, including arbitrations, class actions and other litigation including those described below, arising in connection with its activities as a broker-dealer. Certain of the actual or threatened legal actions include claims for substantial compensatory and/or punitive damages or claims for indeterminate amounts of damages. RBC is also involved, in other reviews, investigations and proceedings (both formal and informal) by governmental and self-regulatory agencies regarding RBC’s business, including among other matters, accounting and operational matters, certain of which may result in adverse judgments, settlements, fines, penalties, injunctions or other relief.
RBC contests liability and/or the amount of damages as appropriate in each pending matter. In view of the inherent difficulty of predicting the outcome of such matters, particularly in cases where claimants seek substantial or indeterminate damages or where investigations and proceedings are in the early stages, RBC cannot predict the loss or range of loss, if any, related to such matters; how or if such matters will be resolved; when they will ultimately be resolved; or what the eventual settlement, fine, penalty or other relief, if any, might be. Subject to the foregoing, RBC believes, based on current knowledge and after consultation with counsel, that the outcome of such pending matters will not have a material adverse effect on the consolidated financial condition of RBC.
On June 18, 2015, in connection with the SEC’s Municipalities Continuing Disclosure Cooperation (MCDC) initiative, the SEC commenced and settled an administrative proceeding against RBC Capital Markets, LLC for willful violations of Sections 17(a)(3) of the 1933 Act after the firm self-reported instances in which it conducted inadequate due diligence in certain municipal securities offerings and as a result, failed to form a reasonable basis for believing the truthfulness of certain material representations in official statements issued in connection with those offerings.
The Company and certain affiliates were named as defendants in a lawsuit relating to their role in transactions involving investments made by a number of Wisconsin school districts in certain collateralized debt obligations. These transactions were also the subject of a regulatory investigation, which was resolved in 2011. The Company reached a final settlement with all parties in the civil litigation, and the civil action against the Company was dismissed with prejudice on December 6, 2016.
Various regulators are conducting inquiries regarding potential violations of law by a number of banks and other entities, including the Company, regarding foreign exchange trading. Since 2015, the Company is a named defendant, along with many other entities, in pending putative class actions in the U.S. and Canada regarding foreign exchange trading. Based on the facts currently known, the ultimate resolution of these collective matters is not expected to have a material adverse effect on RBCCM.
On April 13, 2015, the Company’s affiliate, Royal Bank of Canada Trust Company (Bahamas) Limited (RBC Bahamas), was charged in France with complicity in tax fraud. RBC Bahamas believes that its actions did not violate French law and contested the charge in the French court. The trial of this matter has concluded and a verdict was delivered on January 12, 2017, acquitting the company and the other defendants.
Thornburg Mortgage Inc. (now known as TMST) and the Company were parties to a master repurchase agreement executed in September 2003 whereby TMST financed its purchase of residential mortgage-backed securities. Upon TMST’s default during the financial crisis, the Company valued TMST’s collateral at allegedly deflated prices. After TMST’s bankruptcy filing, TMST’s trustee brought suit against the Company in 2011 for breach of contract. In 2015, TMST was awarded more than $45 million in damages. The Company has appealed. The appeals court set a briefing schedule and simultaneously ordered the parties to participate in a mediation. The parties have subsequently reached an agreement to settle the matter; a motion to approve the settlement was filed with the bankruptcy court on January 10, 2016.
- 40 -
Table of Contents
On October 14, 2014, the Delaware Court of Chancery (the Court of Chancery) in a class action brought by former shareholders of Rural/Metro Corporation, held RBC Capital Markets, LLC liable for aiding and abetting a breach of fiduciary duty by three Rural/Metro directors, but did not make an additional award for attorney’s fees. A final judgment was entered on February 19, 2015 in the amount of US$93 million plus post judgment interest. RBC appealed the Court of Chancery’s determination of liability and quantum of damages, and the plaintiffs cross-appealed the ruling on additional attorneys’ fees. On November 30, 2015, the Delaware Supreme Court affirmed the Court of Chancery with respect to both the appeal and cross-appeal. RBC is cooperating with an investigation by the U.S. Securities and Exchange Commission relating to this matter. In particular, the SEC contended that RBC caused materially false and misleading information to be included in the proxy statement that Rural filed to solicit shareholder approval for the sale in violation of section 14(A) of the Exchange Act and Rule 14A-9 thereunder. On August 31, 2016, RBC was ordered by the SEC to cease and desist and paid $500,000 in disgorgement, plus interest of $77,759 and a civil penalty of $2 million.
On March 11, 2013, the New Jersey Bureau of Securities entered a consent order settling an administrative complaint against RBC, which alleged that RBC failed to follow its own procedures with respect to monthly account reviews and failed to maintain copies of the monthly account reviews with respect to certain accounts that James Hankins Jr. maintained at the firm in violation of N.J.S.A. 49:3-58(a)(2)(xi) and 49:3-59(b). Without admitting or denying the findings of fact and conclusions of law, RBC consented to a civil monetary penalty of $150,000 (of which $100,000 was suspended as a result of the firm’s cooperation) and to pay disgorgement of $300,000.
On June 12, 2012, the State of Illinois Secretary of State Securities Department consented to entry of a judgment enjoining the firm for violation of the Illinois Securities Law of 1953. RBC undertook to repurchase auction rate securities from certain customers before June 30, 2009. RBC also undertook to use best efforts to provide, by December 31, 2009, liquidity opportunities for customers ineligible for the buyback. RBC undertook to provide periodic reports to regulator. RBC paid a penalty of $1,400,139.82.
On May 10, 2012, FINRA commenced and settled an administrative proceeding against RBC for violations of FINRA Rules 1122 and 2010 and NASD Rules 2110 and 3010 for failing to establish, maintain and enforce written supervisory procedures reasonably designed to achieve compliance with applicable rules concerning short-term transactions in closed end funds. RBC paid a fine of $200,000.
On May 2, 2012, the Massachusetts Securities Division entered a consent order settling an administrative complaint against RBC, which alleged that RBC recommended unsuitable products to its brokerage and advisory clients and failed to supervise its registered representatives’ sales of inverse and leveraged ETFs in violation of Section 204(a)(2) of the Massachusetts Uniform Securities Act (“MUSA”). Without admitting or denying the allegations of fact, RBC consented to permanently cease and desist from violations of MUSA, pay restitution of $2.9 million to the investors who purchased the inverse and leveraged ETFs and pay a civil monetary penalty of $250,000.
Please see RBC’s Form BD, which is available on the FINRA BrokerCheck program, for more details.
Margin Levels Expected to be Held at the FCMs
The following is based on how the Fund has been managed as of the date of this Prospectus. While the portfolio composition may vary over time, it is not expected that the Fund will ever have futures exposure greater than two times (2x) the Fund’s assets. Thus, the maximum margin held at an FCM generally would not exceed two times the margin requirement for the Fund. The margin levels described below are based upon current exchange requirements for non-hedger accounts. It is possible that the Fund’s FCMs will require margins greater than the levels set by the relevant exchange and it is also possible that the Fund may qualify for the lower margin levels available to hedge accounts. However, because there is no certainty as to these probabilities, the estimates are made with the assumption that the applicable margin levels for the Fund is the current exchange margin levels for non-hedger accounts. The expected amount is listed first and the maximum amount is listed second. These amounts are based on current margin requirements and current futures levels. They will fluctuate with changes to either factor.
As of December 31, 2016, ProShares UltraShort Gold had futures contracts with notional amounts equal to approximately 0.3% and 0.4% of Fund assets, respectively. The minimum margin requirement as a percentage of futures notional was approximately 5.2%. Thus, the minimum margin held at FCMs was approximately 0.0% of Fund assets for ProShares UltraShort Gold.
The Fund receives the income on any securities or other property of the Fund transferred to the FCMs to fulfill requirements for margin to be held by the FCMs in respect of commodity interests, and receive a negotiated portion of any income derived by the FCMs in respect of any cash transferred to the FCMs and held for this purpose.
- 41 -
Table of Contents
MATERIAL U.S. FEDERAL INCOME TAX CONSIDERATIONS
The following discussion describes the material U.S. federal (and certain state and local) income tax considerations associated with the purchase, ownership and disposition of Shares as of the date hereof by U.S. Shareholders (as defined below) and non-U.S. Shareholders (as defined below). Except where noted, this discussion deals only with Shares held as capital assets by shareholders who acquired Shares by purchase and does not address special situations, such as those of:
| • | dealers in securities or commodities; |
| • | financial institutions; |
| • | regulated investment companies; |
| • | real estate investment trusts; |
| • | partnerships and persons in their capacity as partners; |
| • | tax-exempt organizations; |
| • | insurance companies; |
| • | persons holding Shares as a part of a hedging, integrated or conversion transaction or a straddle; |
| • | traders in securities that elect to use a mark-to-market method of accounting for their securities holdings; or |
| • | persons liable for alternative minimum tax. |
Furthermore, the discussion below is based upon the provisions of the Code, the Regulations, and administrative and judicial interpretations thereof, all as of the date hereof, and such authorities may be repealed, revoked, modified or subject to differing interpretations, possibly on a retroactive basis, so as to result in U.S. federal income tax consequences different from those described below.
A “U.S. Shareholder” of Shares means a beneficial owner of Shares that is for U.S. federal income tax purposes:
| • | an individual that is a citizen or resident of the United States; |
| • | a corporation (or other entity taxable as a corporation) created or organized in or under the laws of the United States, any state thereof or the District of Columbia; |
| • | an estate the income of which is subject to U.S. federal income taxation regardless of its source; or |
| • | a trust if it (1) is subject to the primary supervision of a court within the United States and one or more U.S. persons have the authority to control all substantial decisions of such trust or (2) has a valid election in effect under applicable Regulations to be treated as a U.S. person. |
A “non-U.S. Shareholder” of Shares means a beneficial owner of Shares that is for U.S. federal income tax purposes:
| • | an individual that is a non-resident alien; |
| • | a foreign corporation; |
| • | a foreign estate; or |
| • | a foreign trust. |
If a partnership or other entity or arrangement treated as a partnership for U.S. federal income tax purposes holds Shares, the tax treatment of a partner will generally depend upon the status of the partner and the activities of the partnership. If an investor is a partner of a partnership holding Shares, the Trust urges such investor to consult its own tax advisor.
No statutory, administrative or judicial authority directly addresses the treatment of Shares or instruments similar to Shares for U.S. federal income tax purposes. As a result, the Trust cannot assure investors that the IRS or the courts will agree with the tax consequences described herein. A different treatment from that described below could adversely affect the amount, timing and character of income, gain or loss in respect of an investment in the Shares. If an investor is considering the purchase of Shares, the Trust urges investors to consult their own tax advisor concerning the particular U.S. federal income tax consequences to investors of the purchase, ownership and disposition of Shares, as well as any consequences to investors arising under the laws of any other taxing jurisdiction.
- 42 -
Table of Contents
Under Section 7704 of the Code, unless certain exceptions apply, a publicly traded partnership is generally treated and taxed as a corporation, and not as a partnership, for U.S. federal income tax purposes. A partnership is a publicly traded partnership if (1) interests in the partnership are traded on an established securities market or (2) interests in the partnership are readily tradable on a secondary market or the substantial equivalent thereof. The Fund is a publicly traded partnership. If 90% or more of the income of a publicly traded partnership during each taxable year consists of “qualifying income” and the partnership is not required to register under the Investment Company Act, it will be treated as a partnership, and not as an association or publicly traded partnership taxable as a corporation, for U.S. federal income tax purposes (the “qualifying income exception”). Qualifying income includes dividends, interest, capital gains from the sale or other disposition of stocks and debt instruments and, in the case of a partnership a principal activity of which is the buying and selling of commodities or certain positions with respect to commodities, income and gains derived from certain swap agreements or regulated futures or forward contracts with respect to commodities. The Fund anticipates that at least 90% of its gross income for each taxable year will constitute qualifying income within the meaning of Section 7704(d) of the Code.
Sidley Austin LLP has acted as counsel to the Trust in connection with this registration statement. Under current law and assuming full compliance with the terms of the Trust Agreement (and other relevant documents) and based on factual representations made by the Fund, in the opinion of Sidley Austin LLP, the Fund is classified as a partnership for U.S. federal income tax purposes. The factual representations upon which Sidley Austin LLP has relied are: (1) the Fund has not elected and will not elect to be treated as a corporation for U.S. federal income tax purposes; and (2) for each taxable year, 90% or more of the Fund’s gross income has been, is and is expected to continue to be qualifying income. Shareholders should be aware that opinions of counsel are not binding on the IRS, and no assurance can be given that the IRS will not challenge the conclusions set forth in such opinion. The Sponsor will use its best efforts to operate the Fund in such manner as is necessary for the Fund to continue to meet the qualifying income exception.
While it is expected that the Fund will operate so that it continues to qualify to be treated for U.S. federal income tax purposes as a partnership, and not as an association or a publicly traded partnership taxable as a corporation, given the highly complex nature of the rules governing partnerships, the ongoing importance of factual determinations, the lack of direct guidance with respect to the application of tax laws to the activities the Fund is undertaking and the possibility of future changes in its circumstances, it is possible that the Fund will not so qualify for any particular year. Sidley Austin LLP has no obligation to advise the Fund or its shareholders of any subsequent change in the matters stated, represented or assumed, or of any subsequent change in the applicable law. The Fund’s taxation as a partnership depends on its ability to meet, on a continuing basis, through actual operating results, the qualifying income exception, the compliance of which will not be reviewed by Sidley Austin LLP. Accordingly, no assurance can be given that the actual results of the Fund’s operations for any taxable year will satisfy the qualifying income exception.
If for any reason the Fund becomes taxable as a corporation for U.S. federal income tax purposes, the Fund’s items of income and deduction would not pass through to the Fund’s shareholders and shareholders would be treated for U.S. federal income tax purposes as stockholders in a corporation. The Fund would be required to pay income tax at corporate rates on its net income. Distributions by the Fund to the shareholders would constitute dividend income taxable to such shareholders, to the extent of the Fund’s earnings and profits, and the payment of these distributions would not be deductible by the Fund. These consequences would have a material adverse effect on the Fund, the Fund’s shareholders and the value of the Shares.
If at the end of any taxable year the Fund fails to meet the qualifying income exception, the Fund may still qualify as a partnership if the Fund is entitled to relief under the Code for an inadvertent termination of partnership status. This relief will be available if (1) the failure is cured within a reasonable time after discovery, (2) the failure is determined by the IRS to be inadvertent, and (3) the Fund agrees to make such adjustments or to pay such amounts as are determined by the IRS. It is not possible to state whether the Fund would be entitled to this relief in any or all circumstances. It also is not clear under the Code whether this relief is available for the Fund’s first taxable year as a publicly traded partnership. If this relief provision is not applicable to a particular set of circumstances involving the Fund, it will not qualify as a partnership for U.S. federal income tax purposes. Even if this relief provision applies and the Fund retains its partnership qualification, the Fund or its shareholders (during the failure period) will be required to pay such amounts as determined by the IRS.
The remainder of this discussion assumes that the Fund qualifies to be taxed as a partnership for U.S. federal income tax purposes.
Treatment of Fund Income
A partnership generally does not incur U.S. federal income tax liability. Instead, each partner of a partnership is required to take into account its share of items of income, gain, loss, deduction and other items of the partnership. Accordingly, each shareholder in the Fund is required to include in income its allocable share of the Fund’s income, gain, loss, deduction and other items for the Fund’s taxable year ending with or within its taxable year. In computing a partner’s U.S. federal income tax liability, such items must be
- 43 -
Table of Contents
included, regardless of whether cash distributions are made by the partnership. Thus, shareholders in the Fund may be required to take into account taxable income without a corresponding current receipt of cash if the Fund generates taxable income but does not make cash distributions in an amount equal to, or if the shareholder is not able to deduct, in whole or in part, such shareholder’s allocable share of the Fund’s expenses or capital losses. The Fund’s taxable year ends on December 31 unless otherwise required by law. The Fund uses the accrual method of accounting.
Shareholders must take into account their share of ordinary income realized by the Fund’s investments, including from accruals of interest on the U.S. Treasury securities or other cash and cash equivalents held in the Fund’s portfolio. The Fund may hold U.S. Treasury securities or other debt instruments with “acquisition discount” or “original issue discount,” in which case shareholders in the Fund are required to include accrued amounts in taxable income on a current basis even though receipt of those amounts may occur in a subsequent year. The Fund may also acquire U.S. Treasury securities with “market discount.” Upon disposition of such obligations, gain would generally be required to be treated as interest income to the extent of the market discount, and shareholders in the Fund would be required to include as ordinary income their share of such market discount that accrued during the period the obligations were held by the Fund. Income or loss from transactions involving certain derivative instruments, such as periodic and certain non-periodic payments in swap transactions, will also generally constitute ordinary income or loss and may result in recognition of taxable income to a U.S. Shareholder on a current basis even though receipt of those amounts may occur in a subsequent year.
The character and timing of income that the Fund earns from the positions in its investment strategy depends on the particular U.S. federal income tax treatment of each such position. The U.S. federal income tax treatment of certain positions is not always clear, and the IRS and Congress sometimes take steps which change the manner in which certain positions are taxed. For example, the IRS has issued guidance indicating that a position that certain taxpayers were previously accounting for as prepaid forward contracts for U.S. federal income tax purposes should, instead, be accounted for under the U.S. federal income tax rules for non-dollar denominated debt instruments. The IRS has also released a Notice seeking comments from practitioners about the application of U.S. federal income tax rules to certain derivative positions, including derivative positions in commodities. The Notice asks for comments about, among other questions, when investors in these positions should have income, the character of income and gain or loss from these positions and whether the U.S. federal “constructive ownership” rules should apply to these positions. It is not possible to predict what changes, if any, will be adopted or when any such changes would take effect. However, any such changes could affect the amount, timing and character of income, gain and loss in respect of the Fund’s investments, possibly with retroactive effect. As the Fund passes through its items of income, gain and loss to shareholders, any change in the manner in which the Fund accounts for these items could have an adverse impact on the shareholders of the Fund.
The Code generally applies a “mark-to-market” system of taxing unrealized gains and losses on, and otherwise provides for special rules of taxation with respect to, Section 1256 Contracts (as defined herein). A Section 1256 Contract includes certain regulated futures contracts, certain non-equity options and certain non-U.S. currency forward contracts. The Sponsor expects substantially all of the Fund’s futures contracts to qualify as Section 1256 Contracts. Swap agreements and non-currency forward contracts are generally not Section 1256 Contracts. Section 1256 Contracts held by the Fund at the end of a taxable year of the Fund will be treated for U.S. federal income tax purposes as if they were sold by the Fund at their fair market value on the last business day of the taxable year. The net gain or loss, if any, resulting from these deemed sales (known as “marking-to-market”), together with any gain or loss resulting from any actual sales of Section 1256 Contracts (or other termination of the Fund’s obligations under such contracts), must be taken into account by the Fund in computing its taxable income for the year. If a Section 1256 Contract held by the Fund at the end of a taxable year is sold in the following year, the amount of any gain or loss realized on the sale will be adjusted to reflect the gain or loss previously taken into account under the mark-to-market rules.
Capital gains and losses from Section 1256 Contracts generally are characterized as short-term capital gains or losses to the extent of 40% of the gains or losses and as long-term capital gains or losses to the extent of 60% of the gains or losses. Shareholders of the Fund will generally take into account their pro rata share of the long-term capital gains and losses and short-term capital gains and losses from Section 1256 Contracts held by the Fund. If a non-corporate taxpayer incurs a net capital loss for a year, the portion of the loss, if any, which consists of a net loss on Section 1256 Contracts may, at the election of the taxpayer, be carried back three years. A loss carried back to a year by a non-corporate taxpayer may be deducted only to the extent (1) the loss does not exceed the net gain on Section 1256 Contracts for the year and (2) the allowance of the carryback does not increase or produce a net operating loss for the year. Due to the Fund’s investment strategy, it is also likely that a significant portion of any capital gain or loss realized by the Fund with respect to non-Section 1256 Contracts will be short-term.
Allocation of the Fund’s Profits and Losses
For U.S. federal income tax purposes, a shareholder’s distributive share of the Fund’s income, gain, loss, deduction and other items is determined by the Trust Agreement, unless an allocation under the agreement does not have “substantial economic effect,” in which case the allocations will be determined in accordance with the “partners’ interests in the partnership.” Subject to the discussions below under “— Monthly Allocation and Revaluation Conventions” and “— Section 754 Election,” the allocations pursuant to the Trust Agreement should be considered to have substantial economic effect or deemed to be made in accordance with the partners’ interests in the partnership.
- 44 -
Table of Contents
If the allocations provided by the Trust Agreement were successfully challenged by the IRS, the amount of income or loss allocated to shareholders for U.S. federal income tax purposes under the agreement could be increased or reduced, or the character of the income or loss could be modified.
As described in more detail below, the U.S. tax rules that apply to partnerships are complex and their application is not always clear. Additionally, the rules generally were not written for, and in some respects are difficult to apply to, publicly traded partnerships. The Fund applies certain assumptions and conventions intended to comply with the intent of the rules and to report income, gain, deduction, loss and credit to shareholders in a manner that reflects the economic gains and losses, but these assumptions and conventions may not comply with all aspects of the applicable Regulations. It is possible, therefore, that the IRS will successfully assert that assumptions made and/or conventions used do not satisfy the technical requirements of the Code or the Regulations and will require that tax items be adjusted or reallocated in a manner that could adversely impact an investor.
Monthly Allocation and Revaluation Conventions
In general, the Fund’s taxable income and losses are determined monthly and are apportioned among the shareholders of the Fund in proportion to the number of Shares treated as owned by each of them as of the close of the last trading day of the preceding month; provided, however, such items for the period beginning on the closing date and ending on the last day of the month in which the option closing date or the expiration of the over-allotment option occurs shall be allocated to the shareholders as of the opening of the Exchange on the first business day of the next succeeding month. By investing in Shares, a U.S. Shareholder agrees that, in the absence of an administrative determination or judicial ruling to the contrary, it will report income and loss under the monthly allocation and revaluation conventions described below, except for the period beginning on the closing date and ending on the last day of the month in which the option closing date or the expiration of the over-allotment option occurs, in which case the allocation shall take place as described above.
Under the monthly allocation convention, whoever is treated for U.S. federal income tax purposes as holding Shares as of the close of the last trading day of the preceding month will be treated as continuing to hold the Shares until immediately before the close of the last trading day of the following month. For the initial month of the Fund’s operations, the shareholders at the close of trading at month-end also received that month’s allocation. As a result, a holder who has disposed of Shares prior to the close of the last trading day of a month may be allocated income, gain, loss and deduction realized after the date of transfer.
The Code generally requires that items of partnership income and deductions be allocated between transferors and transferees of partnership interests on a daily basis. It is possible that transfers of Shares could be considered to occur for U.S. federal income tax purposes when the transfer is completed without regard to the Fund’s monthly convention for allocating income and deductions. If this were to occur, the Fund’s allocation method might be deemed to violate that requirement.
In addition, for any month in which a creation or redemption of Shares takes place, the Fund generally credits or debits, respectively, the “book” capital accounts of the holders of existing Shares with any unrealized gain or loss in that Fund’s assets. This results in the allocation of items of the Fund’s income, gain, loss, deduction and credit to existing holders of Shares to account for the difference between the tax basis and fair market value of property owned by such Fund at the time new Shares are issued or old Shares are redeemed, or the reverse section 704(c) allocations. The intended effect of these allocations is to allocate any built-in gain or loss in the Fund’s assets at the time of a creation or redemption of Shares to the investors that economically have earned such gain or loss.
As with the other allocations described above, the Fund generally uses a monthly convention for purposes of the reverse section 704(c) allocations. More specifically, the Fund generally credits or debits, respectively, the “book” capital accounts of the holders of existing Shares with any unrealized gain or loss in the Fund’s assets based on a calculation utilizing the creation/redemption price of the Fund’s Shares during the month in which the creation or redemption transaction takes place, rather than the fair market value of its assets at the time of such creation or redemption, or the “revaluation convention.” As a result, it is possible that, for U.S. federal income tax purposes, (1) a purchaser of newly issued Shares will be allocated some or all of the unrealized gain in the Fund’s assets at the time it acquires the Shares or (2) a purchaser of newly issued Shares will not be allocated its entire share in the loss in the Fund’s assets accruing after the time of such acquisition. Furthermore, the applicable Regulations generally require that the “book” capital accounts will be adjusted based on the fair market value of partnership property on the date of adjustment and do not explicitly allow the adoption of a monthly revaluation convention. The Sponsor, in an attempt to eliminate book-tax disparities, allocates items of income, gain, or loss for U.S. federal income tax purposes among the shareholders under the principles of the remedial method of Section 1.704-3(d) of the Regulations.
The Code and applicable Regulations generally require that items of partnership income and deductions be allocated between transferors and transferees of partnership interests on a daily basis, and that adjustments to “book” capital accounts be made based on the fair market value of partnership property on the date of adjustment. The Code and Regulations do not contemplate monthly allocation or revaluation conventions.
- 45 -
Table of Contents
If the IRS does not accept the Fund’s monthly allocation or revaluation convention, the IRS may contend that taxable income or losses of the Fund must be reallocated among the shareholders. If such a contention were sustained, the holders’ respective tax liabilities would be adjusted to the possible detriment of certain holders. The Sponsor is authorized to revise the Fund’s allocation and revaluation methods in order to comply with applicable law or to allocate items of partnership income and deductions in a manner that reflects more accurately the shareholders’ interests in the Fund.
Section 754 Election
The Fund has made the election permitted by Section 754 of the Code. Such an election, once made, is irrevocable without the consent of the IRS. The making of such election by the Fund generally has the effect of requiring a purchaser of Shares in the Fund to adjust, utilizing the lowest closing price during the month, its proportionate share of the basis in the Fund’s assets, or the inside basis, pursuant to Section 743(b) of the Code to fair market value (as reflected in the purchase price for the purchaser’s Shares), as if it had acquired a direct interest in the Fund’s assets. The Section 743(b) adjustment is attributed solely to a purchaser of Shares and is not added to the basis of the Fund’s assets associated with all of the other shareholders. Depending on the relationship between a holder’s purchase price for Shares and its unadjusted share of the Fund’s inside basis at the time of the purchase, the Section 754 election may be either advantageous or disadvantageous to the holder as compared to the amount of gain or loss a holder would be allocated absent the Section 754 election.
The calculations under Section 754 of the Code are complex, and there is little legal authority concerning the mechanics of the calculations, particularly in the context of publicly traded partnerships. Therefore, in making the election under Section 754 of the Code, the Fund applies certain conventions in determining and allocating the Section 743 basis adjustments to help reduce the complexity of those calculations and the resulting administrative costs to the Fund. It is possible that the IRS will successfully assert that some or all of such conventions utilized by the Fund do not satisfy the technical requirements of the Code or the Regulations and, thus, will require different basis adjustments to be made.
In order to make the basis adjustments permitted by Section 754, the Fund is required to obtain information regarding each holder’s secondary market transactions in Shares, as well as creations and redemptions of Shares. The Fund seeks such information from the record holders of Shares, and, by purchasing Shares, each beneficial owner of Shares will be deemed to have consented to the provision of such information by the record owner of such beneficial owner’s Shares. Notwithstanding the foregoing, however, there can be no guarantee that the Fund will be able to obtain such information from record owners or other sources, or that the basis adjustments that the Fund makes based on the information it is able to obtain will be effective in eliminating disparity between a holder’s outside basis in its share of the Fund interests and its share of inside basis.
Constructive Termination
The Fund will be considered to have terminated for tax purposes if there is a sale or exchange of 50% or more of the total Shares in that Fund within a twelve-month period. A constructive termination results in the closing of the Fund’s taxable year for all holders of Shares in that Fund. In the case of a holder of Shares reporting on a taxable year other than the taxable year used by the Fund (which is a fiscal year ending December 31), the early closing of the Fund’s taxable year may result in more than twelve months of its taxable income or loss being includable in such holder’s taxable income for the year of termination. The Fund would be required to make new tax elections after a termination, including a new election under Section 754. A termination could also result in penalties if the Fund were unable to determine that the termination had occurred.
Treatment of Distributions
Distributions of cash by a partnership are generally not taxable to the distributee to the extent the amount of cash does not exceed the distributee’s tax basis in its partnership interest. Thus, any cash distributions made by the Fund will be taxable to a shareholder only to the extent such distributions exceed the shareholder’s tax basis in the partnership interests it is treated as owning. See “— U.S. Shareholders—Tax Basis in Shares” below. Any cash distributions in excess of a shareholder’s tax basis generally will be considered to be gain from the sale or exchange of the Shares. See “— U.S. Shareholders—Disposition of Shares” below. The Fund does not currently expect to make any cash distributions.
Creation and Redemption of Creation Units
Shareholders, other than Authorized Participants (or holders for which an Authorized Participant is acting), generally will not recognize gain or loss as a result of an Authorized Participant’s creation or redemption of a Creation Unit. If the Fund disposes of assets in connection with the redemption of a Creation Unit, however, the disposition may give rise to gain or loss that will be
- 46 -
Table of Contents
allocated in part to investors. An Authorized Participant’s creation or redemption of a Creation Unit may also affect an investor’s share of the Fund’s tax basis in its assets, which could affect the amount of gain or loss allocated to an investor on the sale or disposition of portfolio assets by the Fund.
Disposition of Shares
If a U.S. Shareholder transfers Shares of the Fund, in a sale or other taxable disposition, the U.S. Shareholder will generally be required to recognize gain or loss measured by the difference between the amount realized on the sale and the U.S. Shareholder’s adjusted tax basis in the Shares. The amount realized will include the U.S. Shareholder’s share of the Fund’s liabilities, as well as any proceeds from the sale. The gain or loss recognized will generally be taxable as capital gain or loss.
Capital gain of non-corporate U.S. Shareholders is eligible to be taxed at reduced rates when the Shares are held for more than one year. The maximum rate is currently 20%. Capital gain of corporate U.S. Shareholders is taxed at the same rate as ordinary income. Any capital loss recognized by a U.S. Shareholder on a sale of Shares will generally be deductible only against capital gains, except that a non-corporate U.S. Shareholder may generally also offset up to $3,000 per year of ordinary income.
Medicare Tax on Investment Income
Certain U.S. Shareholders that are individuals, estates or trusts must pay an additional 3.8% tax on their “net investment income.” U.S. Shareholders should consult their own tax advisors regarding the effect, if any, of this tax on their investment in the Fund.
Tax Basis in Shares
A U.S. Shareholder’s initial tax basis in the partnership interests it is treated as holding will equal the sum of (1) the amount of cash paid by such U.S. Shareholder for its Shares and (2) such U.S. Shareholder’s share of the Fund’s liabilities. A U.S. Shareholder’s tax basis in the Shares will be increased by (1) the U.S. Shareholder’s share of the Fund’s taxable income, including capital gain, (2) the U.S. Shareholder’s share of the Fund’s income, if any, that is exempt from tax and (3) any increase in the U.S. Shareholder’s share of the Fund’s liabilities. A U.S. Shareholder’s tax basis in Shares will be decreased (but not below zero) by (1) the amount of any cash distributed (or deemed distributed) to the U.S. Shareholder, (2) the U.S. Shareholder’s share of the Fund’s losses and deductions, (3) the U.S. Shareholder’s share of the Fund’s expenditures that is neither deductible nor properly chargeable to its capital account and (4) any decrease in the U.S. Shareholder’s share of the Fund’s liabilities.
Limitations on Deductibility of Certain Losses and Expenses
The deductibility for U.S. federal income tax purposes of a U.S. Shareholder’s share of losses and expenses of the Fund is subject to certain limitations, including, but not limited to, rules providing that: (1) a U.S. Shareholder may not deduct the Fund’s losses that are allocated to it in excess of its adjusted tax basis in its Shares; (2) individuals and personal holding companies may not deduct the losses allocable to a particular “activity” in excess of the amount that they are considered to have “at risk” with respect to the activity; (3) the ability of individuals to take certain itemized deductions may be limited by the “alternative minimum tax;” and (4) a non-corporate U.S. Shareholder may deduct its share of expenses of the Fund only to the extent that such share, together with such non-corporate U.S. Shareholder’s other miscellaneous itemized deductions, exceeds 2% of such non-corporate U.S. Shareholder’s adjusted gross income. In addition, in the case of individuals whose U.S. federal adjusted gross income exceeds a certain inflation-adjusted threshold, the aggregate itemized deductions allowable for the year will be reduced by the lesser of (i) 3% of the excess of U.S. federal adjusted gross income over the applicable threshold; or (ii) 80% of the aggregate itemized deductions otherwise allowable for the taxable year (determined after giving effect to the 2% limitation described above and any other applicable limitations). It is anticipated that Management Fees that the Fund will pay will constitute miscellaneous itemized deductions. To the extent that a loss or expense that cannot be deducted currently is allocated to a U.S. Shareholder, such U.S. Shareholder may be required to report taxable income in excess of its economic income or cash distributions on the Shares. Prospective shareholders are urged to consult their own tax advisors with regard to these and other limitations on the ability to deduct losses or expenses with respect to an investment in the Fund.
Under Section 709(b) of the Code, amounts paid or incurred to organize a partnership may, at the election of the partnership, be treated as deferred expenses, which are allowed as a deduction ratably over a period of not less than 180 months. The Fund has elected or is expected to elect, to treat such expenses as ratably deductible over 180 months, beginning with the month the Fund is considered to have started its investment activities for federal tax purposes. A non-corporate U.S. Shareholder’s allocable share of such organizational expenses would constitute miscellaneous itemized deductions. Expenditures in connection with the issuance and marketing of Shares (so-called “syndication fees”) are not eligible for the 180-month amortization provision and are not deductible.
- 47 -
Table of Contents
Transferor/Transferee Allocations
In general, the Fund’s taxable income and losses are determined monthly and are apportioned among the Fund’s shareholders in proportion to the number of Shares owned by each of them as of the close of the last trading day of the preceding month; provided, however, such items for the period beginning on the closing date and ending on the last day of the month in which the option closing date or the expiration of the over-allotment option occurs shall be allocated to the shareholders as of the opening of the Exchange on the first business day of the next succeeding month. With respect to any Share that was not treated as outstanding as of the close of the last trading day of the preceding month, the first person that is treated as holding such Share (other than an underwriter or other person holding in a similar capacity and except with respect to the period beginning on the closing date and ending on the last day of the month in which the option closing date or the expiration of the over-allotment option occurs) for U.S. federal income tax purposes will be treated as holding such Share for this purpose as of the close of the last trading day of the preceding month. As a result, a shareholder transferring its Shares may be allocated income, gain, loss and deduction realized after the date of transfer.
Section 706 of the Code generally requires that items of partnership income and deductions be allocated between transferors and transferees of partnership interests on a daily basis. It is possible that transfers of Shares could be considered to occur for U.S. federal income tax purposes when the transfer is completed without regard to the Fund’s convention for allocating income and deductions. In that event, the Fund’s allocation method might be considered a monthly convention that does not literally comply with that requirement.
If the IRS treats transfers of Shares as occurring throughout each month and a monthly convention is not allowed by the Regulations (or only applies to transfers of less than all of a shareholder’s Shares), or if the IRS otherwise does not accept the Fund’s convention, the IRS may contend that taxable income or losses of the Fund must be reallocated among the shareholders. If such a contention were sustained, the shareholders’ respective tax liabilities would be adjusted to the possible detriment of certain shareholders. The Fund’s Sponsor is authorized to revise the Fund’s methods of allocation between transferors and transferees (as well as among shareholders whose interests otherwise vary during a taxable period).
Tax Reporting by the Fund
Information returns will be filed with the IRS as required with respect to income, gain, loss, deduction and other items derived from Shares of the Fund. The Fund will file a partnership return with the IRS and a Schedule K-1 to the shareholders.
Treatment of Securities Lending Transactions Involving Shares
A shareholder whose Shares are loaned to a “short seller” to cover a short sale of Shares may be considered as having disposed of those Shares. If so, such shareholder would no longer be a beneficial owner of a pro rata portion of the partnership interests with respect to those Shares during the period of the loan and may recognize gain or loss from the disposition. As a result, during the period of the loan, (1) any of the Fund’s income, gain, loss, deduction or other items with respect to those Shares would not be reported by the shareholder, and (2) any cash distributions received by the shareholder as to those Shares could be fully taxable, likely as ordinary income. Accordingly, shareholders who desire to avoid the risk of income recognition from a loan of their Shares to a short seller are urged to modify any applicable brokerage account agreements to prohibit their brokers from borrowing their Shares.
Audits and Adjustments to Tax Liability
Under the Code, adjustments in tax liability with respect to the Fund’s items generally will be made at the Fund level in a partnership proceeding rather than in separate proceedings with each shareholder. Pursuant to the Trust Agreement, the Sponsor will represent the Fund as its “Tax Matters Partner” during any audit and in any dispute with the IRS. Each shareholder will be informed of the commencement of an audit of the Fund. In general, the Tax Matters Partner may enter into a settlement agreement with the IRS on behalf of, and that is binding upon, the shareholders.
Adjustments resulting from an IRS audit may require each shareholder to adjust a prior year’s liability, and possibly may result in an audit of its return. Any audit of a shareholder’s return could result in adjustments not related to the Fund’s returns as well as those related to the Fund’s returns.
The Tax Matters Partner can extend the statute of limitations for assessment of tax deficiencies against shareholders for items in the Fund’s returns. The Tax Matters Partner may bind a shareholder with less than a 1% profits interest in the Fund to a settlement with the IRS unless that shareholder elects, by filing a statement with the IRS, not to give that authority to the Tax Matters Partner. The Tax Matters Partner may seek judicial review, by which all the shareholders are bound, of a final partnership administrative adjustment and, if the Tax Matters Partner fails to seek judicial review, judicial review may be sought by any shareholder having at least a 1% interest in profits or by any group of shareholders having in the aggregate at least a 5% interest in profits. However, only one action for judicial review will go forward, and each shareholder with an interest in the outcome may participate.
- 48 -
Table of Contents
The Bipartisan Budget Act of 2015 implements a new regime for the U.S. federal income tax audit of partnerships that generally applies for taxable years of partnerships beginning after December 31, 2017. The Sponsor will be appointed the “partnership representative” of the Fund.
Foreign Tax Credits
Subject to generally applicable limitations, U.S. Shareholders will be able to claim foreign tax credits with respect to certain foreign income taxes paid or incurred by the Fund, withheld on payments made to the Trust or paid by the Trust on behalf of Fund shareholders (if any of such foreign income taxes are so paid, incurred or withheld). U.S. Shareholders must include in their gross income, for U.S. federal income tax purposes, both their share of the Fund’s items of income and gain and also their share of the amount which is deemed to be the shareholder’s portion of foreign income taxes paid with respect to, or withheld from interest or other income derived by, the Fund. U.S. Shareholders may then subtract from their U.S. federal income tax the amount of such taxes withheld, or else treat such foreign taxes as deductions from gross income; however, as in the case of investors receiving income directly from foreign sources, the tax credit or deduction described above is subject to certain limitations. Even if the shareholder is unable to claim a credit, he or she must include all amounts described above in income. U.S. Shareholders are urged to consult their tax advisors regarding this election and its consequences to them.
Tax Shelter Disclosure Rules
There are circumstances under which certain transactions must be disclosed to the IRS in a disclosure statement attached to a taxpayer’s U.S. federal income tax return. (A copy of such statement must also be sent to the IRS Office of Tax Shelter Analysis.) In addition, the Code imposes a requirement on certain “material advisors” to maintain a list of persons participating in such transactions, which list must be furnished to the IRS upon written request. These provisions can apply to transactions not conventionally considered to involve abusive tax planning. Consequently, it is possible that such disclosure could be required by the Fund or the shareholders (1) if a shareholder incurs a loss (in each case, in excess of a threshold computed without regard to offsetting gains or other income or limitations) from the disposition (including by way of withdrawal) of Shares, or (2) possibly in other circumstances. Furthermore, the Fund’s material advisors could be required to maintain a list of persons investing in the Fund pursuant to the Code. While the tax shelter disclosure rules generally do not apply to a loss recognized on the disposition of an asset in which the taxpayer has a qualifying basis (generally a basis equal to the amount of cash paid by the taxpayer for such asset), such rules will apply to a taxpayer recognizing a loss with respect to interests in a pass-through entity (such as the Shares) even if its basis in such interests is equal to the amount of cash it paid. In addition, significant penalties may be imposed in connection with a failure to comply with these reporting requirements. U.S. Shareholders are urged to consult their tax advisors regarding the tax shelter disclosure rules and their possible application to them.
U.S. Shareholders should consult their own tax advisors regarding any tax reporting or filing obligations they may have as a result of their acquisition, ownership or disposition of Shares.
Non-U.S. Shareholders
Except as described below, the Fund anticipates that a non-U.S. Shareholder will not be subject to U.S. federal income tax on such shareholder’s distributive share of the Fund’s income, provided that such income is not considered to be income of the shareholder that is effectively connected with the conduct of a trade or business within the United States. In the case of an individual non-U.S. Shareholder, such shareholder will be subject to U.S. federal income tax on gains on the sale of Shares in the Fund’s or such shareholder’s distributive share of gains if such shareholder is present in the United States for 183 days or more during a taxable year and certain other conditions are met.
If the income from the Fund is “effectively connected” with a U.S. trade or business carried on by a non-U.S. Shareholder (and, if certain income tax treaties apply, is attributable to a U.S. permanent establishment), then such shareholder’s share of any income and any gains realized upon the sale or exchange of Shares will be subject to U.S. federal income tax at the graduated rates applicable to U.S. citizens and residents and domestic corporations. Non-U.S. Shareholders that are corporations may also be subject to a 30% U.S. branch profits tax (or lower treaty rate, if applicable) on their effectively connected earnings and profits that are not timely reinvested in a U.S. trade or business.
To the extent any interest income allocated to a non-U.S. Shareholder is considered “portfolio interest,” generally neither the allocation of such interest income to the non-U.S. Shareholder nor a subsequent distribution of such interest income to the non-U.S. Shareholder will be subject to withholding, provided that the non-U.S. Shareholder is not otherwise engaged in a trade or business in the United States and provides the Fund with a timely and properly completed and executed IRS Form W-8BEN, Form W-8BEN-E, or other applicable form. In general, “portfolio interest” is interest paid on debt obligations issued in registered form, unless the “recipient” owns 10% or more of the voting power of the issuer.
- 49 -
Table of Contents
Non-U.S. Shareholders that are individuals will be subject to U.S. federal estate tax on the value of U.S. situs property owned at the time of their death (unless a statutory exemption or tax treaty exemption applies). It is unclear whether partnership interests such as the Shares will be considered U.S. situs property. Accordingly, non-U.S. Shareholders may be subject to U.S. federal estate tax on all or part of the value of the Shares owned at the time of their death.
Non-U.S. Shareholders are advised to consult their own tax advisors with respect to the particular tax consequences to them of an investment in the Shares.
Foreign Account Tax Compliance
The Foreign Account Tax Compliance provisions of the Hiring Incentives to Restore Employment Act (“FATCA”) generally impose a reporting and 30% withholding tax regime with respect to certain items of U.S. source income (including dividends and interest) and gross proceeds from the sale or other disposal of property that can produce U.S. source interest or dividends (“Withholdable Payments”). As a general matter, the rules are designed to require U.S. persons’ direct and indirect ownership of non-U.S. accounts and non-U.S. entities to be reported to the IRS. The 30% withholding tax regime applies if there is a failure to provide required information regarding U.S. ownership. The withholding rules generally apply to Withholdable Payments (other than gross proceeds of the type described above) and beginning January 1, 2019, payments of gross proceeds of the type described above with respect to a sale or disposition.
The rules may subject a non-U.S. Shareholder’s share of Withholdable Payments received by the Fund to 30% withholding tax unless such shareholder provides information, representations and waivers of non-U.S. law as may be required to comply with the provisions of the new rules, including information regarding certain U.S. direct and indirect owners of such non-U.S. Shareholder. A non-U.S. Shareholder that is treated as a “foreign financial institution” will generally be subject to withholding unless it agrees to report certain information to the IRS regarding its U.S. accountholders and those of its affiliates.
Although the application of the withholding rules to a sale or other disposal of an interest in a partnership is unclear, it is possible that the gross proceeds of the sale or other disposal of an interest in the Fund will be subject to tax under the withholding rules if such proceeds are treated as an indirect disposal of the non-U.S. Shareholder’s interest in assets that can produce U.S. source interest or dividends, unless the selling non-U.S. Shareholder provides appropriate reporting information. Prospective shareholders should consult their own advisors regarding the requirements under FATCA with respect to their own situation.
Regulated Investment Companies (“RICs”)
The treatment of a RIC’s investment in the Fund will depend, in part, on whether the Fund is classified as a qualified publicly traded partnership (a “PTP”) for purposes of the RIC rules. RICs are only allowed to invest up to 25% of their assets in qualified PTPs and to treat gross income and gross gains derived from such investments as qualifying income for purposes of certain rules relevant to determining whether an entity qualifies as a RIC. Similarly, interests in a qualified PTP are treated as issued by such PTP and a RIC is not required to look through to the underlying partnership assets when testing compliance with certain asset diversification or gross income tests applicable to determining whether an entity qualified as a RIC. On the other hand, an investment by a RIC in a publicly traded partnership that is not a qualified PTP is not counted against the 25% limit on a RIC’s investments in qualified PTPs and the RIC is treated as owning its proportionate share of the partnership’s gross assets and earning its proportionate share of the partnership’s gross income and gross gains for purposes of the asset and income tests relevant to determining whether an entity qualifies as a RIC.
It is generally intended that the Fund is and will continue to be a qualified PTP. Prospective RIC investors should consult a tax advisor regarding the treatment of an investment in the Fund under current tax rules and in light of their particular circumstances.
Tax-Exempt Organizations
An organization that is otherwise exempt from U.S. federal income tax is nonetheless subject to taxation with respect to its “unrelated business taxable income,” or UBTI, to the extent that its UBTI from all sources exceeds $1,000 in any taxable year. Except as noted below with respect to certain categories of exempt income, UBTI generally includes income or gain derived (either directly or through a partnership) from a trade or business, the conduct of which is substantially unrelated to the exercise or performance of the organization’s exempt purpose or function.
UBTI generally does not include passive investment income, such as dividends, interest and capital gains, whether realized by the organization directly or indirectly through a partnership (such as the Fund) in which it is a partner. This type of income is exempt, subject to the discussion of “unrelated debt-financed income” below, even if it is realized from securities-trading activity that constitutes a trade or business.
- 50 -
Table of Contents
UBTI includes not only trade or business income or gain as described above, but also “unrelated debt-financed income.” This latter type of income generally consists of (1) income derived by an exempt organization (directly or through a partnership) from income producing property with respect to which there is “acquisition indebtedness” at any time during the taxable year and (2) gains derived by an exempt organization (directly or through a partnership) from the disposition of property with respect to which there is acquisition indebtedness at any time during the twelve-month period ending with the date of the disposition. The Fund does not expect to incur a significant amount of acquisition indebtedness with respect to its assets.
To the extent the Fund recognizes gain from property with respect to which there is “acquisition indebtedness,” the portion of the gain that will be treated as UBTI will be equal to the amount of the gain multiplied by a fraction, the numerator of which is the highest amount of the “acquisition indebtedness” with respect to the property during the twelve month period ending with the date of their disposition, and the denominator of which is the “average amount of the adjusted basis” of the property during the period that such property is held by the Fund during the taxable year. In determining the unrelated debt-financed income of the Fund, an allocable portion of deductions directly connected with the Fund’s debt-financed property will be taken into account. In making such a determination, for instance, a portion of losses from debt-financed securities (determined in the manner described above for evaluating the portion of any gain that would be treated as UBTI) would offset gains treated as UBTI. A charitable remainder trust is subject to a 100% federal excise tax on any UBTI that it earns; in view of the potential for UBTI, the Shares may not be a suitable investment for a charitable remainder trust.
Certain State and Local Taxation Matters
Prospective shareholders should consider, in addition to the U.S. federal income tax consequences described above, the potential state and local tax consequences of investing in the Shares.
State and local laws often differ from U.S. federal income tax laws with respect to the treatment of specific items of income, gain, loss, deduction and credit. A shareholder’s distributive share of the taxable income or loss of the Fund generally will be required to be included in determining the shareholder’s reportable income for state and local tax purposes in the jurisdiction in which the shareholder is a resident. The Fund may conduct business in one or more jurisdictions that will subject a shareholder to tax (and require a shareholder to file an income tax return with the jurisdiction with respect to the shareholder’s share of the income derived from that business). A prospective shareholder should consult its tax advisor with respect to the availability of a credit for such tax in the jurisdiction in which the shareholder is resident.
Backup Withholding
In certain circumstances, shareholders may be subject to backup withholding on certain payments paid to them if they do not establish that they are exempt from the backup withholding rules or if they do not furnish their correct taxpayer identification number (in the case of individuals, their social security number) and certain certifications, or who are otherwise subject to backup withholding. Backup withholding is not an additional tax. Any amounts withheld from payments made to an investor may be refunded or credited against an investor’s U.S. federal income tax liability, if any, provided that the required information is furnished to the IRS.
Shareholders should be aware that certain aspects of the U.S. federal, state and local income tax treatment regarding the purchase, ownership and disposition of Shares are not clear under existing law. Thus, shareholders are urged to consult their own tax advisors to determine the tax consequences of ownership of the Shares in their particular circumstances, including the application of U.S. federal, state, local and foreign tax laws.
Euroclear System
Any participant of the Euroclear System that holds Shares in the Euroclear System will be deemed to have represented to and agreed with the Fund and Euroclear Bank as a condition to Shares being in the Euroclear System to furnish to the Euroclear Bank (a) its tax identification number, (b) notice of whether it is (i) a person who is not a United States person, (ii) a foreign government, an international organization or any wholly owned agency or instrumentality of either of the foregoing or (iii) a tax exempt identity, and (c) such other information as the Euroclear Bank may request from time to time in order to comply with its United States tax reporting obligations. If a participant in the Euroclear System fails to provide such information, Euroclear Bank may, amongst other courses of action, block trades in the Shares and related income distributions of such participant.
- 51 -
Table of Contents
This Prospectus has two parts: the offered series disclosure and the general pool disclosure. These parts are bound together and are incomplete if not distributed together to prospective participants.
PERFORMANCE OF THE OTHER COMMODITY POOLS OPERATED BY
THE COMMODITY POOL OPERATOR
The following performance information is presented in accordance with CFTC regulations. The performance of the Fund will differ materially from the performance of the Other Funds which is included herein. The performance of the Other Funds which is summarized herein is materially different from the Fund and the past performance summaries of the Other Funds below are generally not representative of how the Fund might perform in the future.
All summary performance information is as of December 31, 2016. Performance information is set forth, in accordance with CFTC regulations, since each fund’s inception of trading.
| Name of Pool: |
ProShares Ultra Bloomberg Crude Oil | |
| Type of Pool: | Public, Exchange-listed Commodity Pool | |
| Date of Inception of Trading: | November 24, 2008 | |
| Aggregate Gross Capital Subscriptions1 as of December 31, 2016: | $9,483,803,081 | |
| Aggregate Net Capital Subscriptions2 as of December 31, 2016: | $1,572,919,850 | |
| Net Asset Value as of December 31, 2016: | $933,731,860 | |
| Net Asset Value per Share3 as of December 31, 2016: | $23.34 | |
| Worst Monthly Loss:4 | -38.93% | |
| (July 2015) | ||
| Worst Peak-to-Valley Loss:5 | -98.42% | |
| (Inception – February 2016) |
PAST PERFORMANCE IS NOT NECESSARILY INDICATIVE OF FUTURE RESULTS.
Rate of Return:6
| 2012 | 2013 | 2014 | 2015 | 2016 | ||||||||||||||||
| January |
-1.50 | % | 11.40 | % | -2.52 | % | -21.61 | % | -24.75 | % | ||||||||||
| February |
16.39 | % | -12.31 | % | 11.74 | % | 4.51 | % | -16.75 | % | ||||||||||
| March |
-8.66 | % | 10.30 | % | -0.94 | % | -17.91 | % | 14.14 | % | ||||||||||
| April |
1.99 | % | -8.84 | % | -1.60 | % | 43.29 | % | 31.14 | % | ||||||||||
| May |
-32.85 | % | -4.07 | % | 7.17 | % | -2.26 | % | 9.78 | % | ||||||||||
| June |
-5.48 | % | 8.91 | % | 7.33 | % | -4.80 | % | -6.05 | % | ||||||||||
| July |
5.40 | % | 18.13 | % | -12.40 | % | -38.93 | % | -28.95 | % | ||||||||||
| August |
18.59 | % | 7.04 | % | -4.12 | % | 0.96 | % | 9.10 | % | ||||||||||
| September |
-9.61 | % | -9.00 | % | -8.50 | % | -20.34 | % | 11.46 | % | ||||||||||
| October |
-13.83 | % | -10.16 | % | -20.49 | % | 3.83 | % | -7.66 | % | ||||||||||
| November |
4.23 | % | -8.24 | % | -33.62 | % | -23.74 | % | 6.48 | % | ||||||||||
| December |
4.52 | % | 12.14 | % | -36.15 | % | -28.92 | % | 12.93 | % | ||||||||||
| Annual |
-28.11 | % | 9.17 | % | -68.37 | % | -75.21 | % | -7.23 | % | ||||||||||
| Year-to-Date |
N/A | N/A | N/A | N/A | -7.23 | % | ||||||||||||||
See accompanying Footnotes to Performance Information.
- 52 -
Table of Contents
| Name of Pool: |
ProShares UltraShort Bloomberg Crude Oil | |
| Type of Pool: | Public, Exchange-listed Commodity Pool | |
| Date of Inception of Trading: | November 24, 2008 | |
| Aggregate Gross Capital Subscriptions1 as of December 31, 2016: | $4,870,143,017 | |
| Aggregate Net Capital Subscriptions2 as of December 31, 2016: | $39,624,689 | |
| Net Asset Value as of December 31, 2016: | $200,958,303 | |
| Net Asset Value per Share3 as of December 31, 2016: | $31.70 | |
| Worst Monthly Loss:4 | -35.22% | |
| (April 2015) | ||
| Worst Peak-to-Valley Loss:5 | -87.86% | |
| (February 2009—June 2014) |
PAST PERFORMANCE IS NOT NECESSARILY INDICATIVE OF FUTURE RESULTS.
Rate of Return:6
| 2012 | 2013 | 2014 | 2015 | 2016 | ||||||||||||||||
| January |
-0.18 | % | -10.82 | % | 1.19 | % | 13.70 | % | 17.85 | % | ||||||||||
| February |
-15.40 | % | 12.92 | % | -11.09 | % | -14.92 | % | 1.14 | % | ||||||||||
| March |
7.52 | % | -10.12 | % | -0.21 | % | 14.97 | % | -18.27 | % | ||||||||||
| April |
-3.25 | % | 7.27 | % | 0.71 | % | -35.22 | % | -29.23 | % | ||||||||||
| May |
45.59 | % | 2.47 | % | -7.31 | % | -1.23 | % | -11.42 | % | ||||||||||
| June |
-0.84 | % | -9.37 | % | -7.36 | % | 2.38 | % | 0.72 | % | ||||||||||
| July |
-8.47 | % | -16.56 | % | 13.04 | % | 55.07 | % | 33.66 | % | ||||||||||
| August |
-17.32 | % | -8.08 | % | 3.35 | % | -13.62 | % | -13.03 | % | ||||||||||
| September |
8.99 | % | 8.57 | % | 6.99 | % | 14.99 | % | -16.03 | % | ||||||||||
| October |
12.73 | % | 9.94 | % | 23.12 | % | -8.93 | % | 5.69 | % | ||||||||||
| November |
-6.95 | % | 7.90 | % | 41.23 | % | 26.63 | % | -13.39 | % | ||||||||||
| December |
-5.36 | % | -11.62 | % | 45.65 | % | 31.98 | % | -13.41 | % | ||||||||||
| Annual |
3.84 | % | -21.28 | % | 145.78 | % | 70.82 | % | -52.41 | % | ||||||||||
| Year-to-Date |
N/A | N/A | N/A | N/A | -52.41 | % | ||||||||||||||
| Name of Pool: |
ProShares Ultra Gold | |
| Type of Pool: | Public, Exchange-listed Commodity Pool | |
| Date of Inception of Trading: | December 1, 2008 | |
| Aggregate Gross Capital Subscriptions1 as of December 31, 2016: | $583,109,172 | |
| Aggregate Net Capital Subscriptions2 as of December 31, 2016: | $113,054,841 | |
| Net Asset Value as of December 31, 2016: | $92,127,200 | |
| Net Asset Value per Share3 as of December 31, 2016: | $32.90 | |
| Worst Monthly Loss:4 | -27.55% | |
| (June 2013) | ||
| Worst Peak-to-Valley Loss:5 | -73.12% | |
| (August 2011—December 2015) |
See accompanying Footnotes to Performance Information.
- 53 -
Table of Contents
PAST PERFORMANCE IS NOT NECESSARILY INDICATIVE OF FUTURE RESULTS.
Rate of Return:6
| 2012 | 2013 | 2014 | 2015 | 2016 | ||||||||||||||||
| January |
28.64 | % | 0.48 | % | 7.49 | % | 8.78 | % | 9.75 | % | ||||||||||
| February |
2.55 | % | -9.22 | % | 12.19 | % | -7.45 | % | 22.46 | % | ||||||||||
| March |
-12.33 | % | 1.03 | % | -5.49 | % | -4.70 | % | -0.20 | % | ||||||||||
| April |
-1.83 | % | -16.74 | % | -0.77 | % | -1.44 | % | 7.59 | % | ||||||||||
| May |
-11.53 | % | -10.49 | % | -6.04 | % | 1.62 | % | -11.52 | % | ||||||||||
| June |
4.62 | % | -27.55 | % | 10.33 | % | -3.70 | % | 18.01 | % | ||||||||||
| July |
2.48 | % | 20.84 | % | -4.74 | % | -12.35 | % | 2.86 | % | ||||||||||
| August |
2.91 | % | 12.07 | % | -0.15 | % | 6.39 | % | -5.20 | % | ||||||||||
| September |
15.51 | % | -10.09 | % | -10.69 | % | -3.97 | % | 1.70 | % | ||||||||||
| October |
-6.65 | % | -1.02 | % | -8.75 | % | 4.81 | % | -7.84 | % | ||||||||||
| November |
0.43 | % | -10.70 | % | 2.95 | % | -13.85 | % | -14.67 | % | ||||||||||
| December |
-8.05 | % | -8.02 | % | 3.63 | % | -0.69 | % | -5.81 | % | ||||||||||
| Annual |
10.35 | % | -50.75 | % | -3.05 | % | -25.68 | % | 10.68 | % | ||||||||||
| Year-to-Date |
N/A | N/A | N/A | N/A | 10.68 | % | ||||||||||||||
| Name of Pool: |
ProShares Ultra Silver | |
| Type of Pool: | Public, Exchange-listed Commodity Pool | |
| Date of Inception of Trading: | December 1, 2008 | |
| Aggregate Gross Capital Subscriptions1 as of December 31, 2016: | $2,867,795,644 | |
| Aggregate Net Capital Subscriptions2 as of December 31, 2016 | $1,216,578,358 | |
| Net Asset Value as of December 31, 2016: | $275,779,940 | |
| Net Asset Value per Share3 as of December 31, 2016: | $33.44 | |
| Worst Monthly Loss:4 | -31.08% | |
| (June 2013) | ||
| Worst Peak-to-Valley Loss:5 | -96.33% | |
| (April 2011—December 2015) |
PAST PERFORMANCE IS NOT NECESSARILY INDICATIVE OF FUTURE RESULTS.
Rate of Return:6
| 2012 | 2013 | 2014 | 2015 | 2016 | ||||||||||||||||
| January |
39.92 | % | 13.30 | % | -2.45 | % | 10.95 | % | 2.96 | % | ||||||||||
| February |
21.64 | % | -18.79 | % | 20.54 | % | -5.20 | % | 8.87 | % | ||||||||||
| March |
-25.33 | % | -2.67 | % | -12.40 | % | 0.19 | % | 7.86 | % | ||||||||||
| April |
-8.23 | % | -29.79 | % | -7.29 | % | -1.57 | % | 33.68 | % | ||||||||||
| May |
-19.70 | % | -15.45 | % | -3.41 | % | 1.07 | % | -19.67 | % | ||||||||||
| June |
-8.46 | % | -31.08 | % | 20.02 | % | -11.68 | % | 29.58 | % | ||||||||||
| July |
7.40 | % | 10.94 | % | -2.11 | % | -14.58 | % | 17.59 | % | ||||||||||
| August |
16.30 | % | 38.75 | % | -11.89 | % | -2.57 | % | -13.33 | % | ||||||||||
| September |
27.12 | % | -17.19 | % | -23.25 | % | 2.35 | % | 5.61 | % | ||||||||||
| October |
-13.81 | % | 3.68 | % | -11.00 | % | 12.78 | % | -16.49 | % | ||||||||||
| November |
11.96 | % | -19.82 | % | -3.87 | % | -19.22 | % | -13.12 | % | ||||||||||
| December |
-24.27 | % | -5.11 | % | -0.86 | % | -4.31 | % | -5.94 | % | ||||||||||
| Annual |
-0.52 | % | -63.16 | % | -37.84 | % | -31.25 | % | 23.57 | % | ||||||||||
| Year-to-Date |
N/A | N/A | N/A | N/A | 23.57 | % | ||||||||||||||
- 54 -
Table of Contents
| Name of Pool: |
ProShares UltraShort Euro | |
| Type of Pool: | Public, Exchange-listed Commodity Pool | |
| Date of Inception of Trading: | November 24, 2008 | |
| Aggregate Gross Capital Subscriptions1 as of December 31, 2016: | $2,595,824,896 | |
| Aggregate Net Capital Subscriptions2 as of December 31, 2016: | $144,957,093 | |
| Net Asset Value as of December 31, 2016: | $349,392,650 | |
| Net Asset Value per Share3 as of December 31, 2016: | $27.08 | |
| Worst Monthly Loss:4 | -8.72% | |
| (March 2016) | ||
| Worst Peak-to-Valley Loss:5 | -33.29% | |
| (November 2008—April 2014) |
See accompanying Footnotes to Performance Information.
PAST PERFORMANCE IS NOT NECESSARILY INDICATIVE OF FUTURE RESULTS.
Rate of Return:6
| 2012 | 2013 | 2014 | 2015 | 2016 | ||||||||||||||||
| January |
-2.49 | % | -5.76 | % | 3.83 | % | 14.22 | % | 0.51 | % | ||||||||||
| February |
-3.88 | % | 7.90 | % | -4.66 | % | 1.64 | % | -1.04 | % | ||||||||||
| March |
-0.47 | % | 3.51 | % | 0.22 | % | 7.50 | % | -8.72 | % | ||||||||||
| April |
1.33 | % | -5.46 | % | -1.53 | % | -8.70 | % | -1.26 | % | ||||||||||
| May |
14.31 | % | 2.46 | % | 3.44 | % | 4.12 | % | 5.90 | % | ||||||||||
| June |
-4.86 | % | -0.50 | % | -1.04 | % | -3.42 | % | 0.28 | % | ||||||||||
| July |
5.50 | % | -4.58 | % | 4.48 | % | 2.76 | % | -1.42 | % | ||||||||||
| August |
-4.52 | % | 1.15 | % | 3.75 | % | -4.61 | % | 0.51 | % | ||||||||||
| September |
-4.43 | % | -4.73 | % | 8.01 | % | 0.52 | % | -1.32 | % | ||||||||||
| October |
-1.83 | % | -0.92 | % | 1.29 | % | 2.94 | % | 4.77 | % | ||||||||||
| November |
-0.81 | % | -0.29 | % | 1.32 | % | 8.11 | % | 7.26 | % | ||||||||||
| December |
-2.97 | % | -2.64 | % | 5.33 | % | -5.84 | % | 1.38 | % | ||||||||||
| Annual |
-6.49 | % | -10.29 | % | 26.58 | % | 18.28 | % | 6.05 | % | ||||||||||
| Year-to-Date |
N/A | N/A | N/A | N/A | 6.05 | % | ||||||||||||||
| Name of Pool: |
ProShares UltraShort Yen | |
| Type of Pool: | Public, Exchange-listed Commodity Pool | |
| Date of Inception of Trading: | November 24, 2008 | |
| Aggregate Gross Capital Subscriptions1 as of December 31, 2016: | $1,823,693,848 | |
| Aggregate Net Capital Subscriptions2 as of December 31, 2016: | $52,636,008 | |
| Net Asset Value as of December 31, 2016: | $276,781,747 | |
| Net Asset Value per Share3 as of December 31, 2016: | $80.24 | |
| Worst Monthly Loss:4 | -13.65% | |
| (February 2016) | ||
| -47.04% | ||
| Worst Peak-to-Valley Loss:5 | (March 2009—January 2012) |
- 55 -
Table of Contents
PAST PERFORMANCE IS NOT NECESSARILY INDICATIVE OF FUTURE RESULTS.
Rate of Return:6
| 2012 | 2013 | 2014 | 2015 | 2016 | ||||||||||||||||
| January |
-2.11 | % | 10.61 | % | -6.14 | % | -4.19 | % | 1.18 | % | ||||||||||
| February |
13.43 | % | 2.19 | % | -0.93 | % | 3.62 | % | -13.65 | % | ||||||||||
| March |
3.44 | % | 2.86 | % | 2.61 | % | 0.32 | % | -0.43 | % | ||||||||||
| April |
-7.26 | % | 6.29 | % | -2.09 | % | -0.99 | % | -11.15 | % | ||||||||||
| May |
-3.88 | % | 5.69 | % | -0.91 | % | 7.88 | % | 8.16 | % | ||||||||||
| June |
3.81 | % | -3.30 | % | -1.07 | % | -3.00 | % | -13.59 | % | ||||||||||
| July |
-4.54 | % | -2.97 | % | 3.00 | % | 2.34 | % | -3.07 | % | ||||||||||
| August |
0.25 | % | 0.08 | % | 2.18 | % | -4.79 | % | 2.67 | % | ||||||||||
| September |
-0.86 | % | -0.11 | % | 10.91 | % | -2.22 | % | -4.04 | % | ||||||||||
| October |
4.51 | % | -0.16 | % | 4.36 | % | 1.08 | % | 6.84 | % | ||||||||||
| November |
6.38 | % | 8.32 | % | 11.44 | % | 3.95 | % | 18.56 | % | ||||||||||
| December |
10.53 | % | 5.35 | % | 1.40 | % | -4.69 | % | 4.42 | % | ||||||||||
| Annual |
23.92 | % | 39.61 | % | 26.07 | % | -1.55 | % | -8.76 | % | ||||||||||
| Year-to-Date |
N/A | N/A | N/A | N/A | -8.76 | % | ||||||||||||||
See accompanying Footnotes to Performance Information.
| Name of Pool: |
ProShares UltraShort Bloomberg Natural Gas | |
| Type of Pool: | Public, Exchange-listed Commodity Pool | |
| Date of Inception of Trading: | October 4, 2011 | |
| Aggregate Gross Capital Subscriptions1 as of December 31, 2016: | $277,322,946 | |
| Aggregate Net Capital Subscriptions2 as of December 31, 2016: | $(19,302,649) | |
| Net Asset Value as of December 31, 2016: | $4,038,794 | |
| Net Asset Value per Share3 as of December 31, 2016: | $23.10 | |
| Worst Monthly Loss:4 | -37.18% | |
| (January 2014) | ||
| Worst Peak-to-Valley Loss:5 | -81.64% | |
| (March 2012—April 2014) |
PAST PERFORMANCE IS NOT NECESSARILY INDICATIVE OF FUTURE RESULTS.
Rate of Return:6
| 2012 | 2013 | 2014 | 2015 | 2016 | ||||||||||||||||
| January |
30.13 | % | -1.67 | % | -37.18 | % | 3.30 | % | 1.27 | % | ||||||||||
| February |
0.98 | % | -5.48 | % | -5.47 | % | -4.74 | % | 71.49 | % | ||||||||||
| March |
56.44 | % | -24.30 | % | 5.67 | % | 5.89 | % | -17.44 | % | ||||||||||
| April |
-4.32 | % | -15.15 | % | -18.15 | % | -7.71 | % | -19.84 | % | ||||||||||
| May |
-8.88 | % | 17.55 | % | 11.26 | % | 8.57 | % | -0.52 | % | ||||||||||
| June |
-28.95 | % | 23.56 | % | 1.43 | % | -14.67 | % | -35.93 | % | ||||||||||
| July |
-27.12 | % | 3.81 | % | 31.07 | % | 6.87 | % | -2.13 | % | ||||||||||
| August |
30.80 | % | -5.64 | % | -10.42 | % | 3.54 | % | 4.35 | % | ||||||||||
| September |
-23.39 | % | 5.64 | % | -2.73 | % | 17.35 | % | 4.33 | % | ||||||||||
| October |
-6.83 | % | 5.95 | % | 15.73 | % | 30.43 | % | -3.38 | % | ||||||||||
| November |
11.11 | % | -15.20 | % | -13.02 | % | 19.82 | % | -12.71 | % | ||||||||||
| December |
11.43 | % | -15.04 | % | 80.09 | % | -8.04 | % | -24.57 | % | ||||||||||
| Annual |
7.26 | % | -31.50 | % | 20.00 | % | 66.27 | % | -50.35 | % | ||||||||||
| Year-to-Date |
N/A | N/A | N/A | N/A | -50.35 | % | ||||||||||||||
See accompanying Footnotes to Performance Information.
- 56 -
Table of Contents
| Name of Pool: |
ProShares UltraShort Silver | |
| Type of Pool: | Public, Exchange-listed Commodity Pool | |
| Date of Inception of Trading: | December 1, 2008 | |
| Aggregate Gross Capital Subscriptions1 as of December 31, 2016: | $2,357,287,402 | |
| Aggregate Net Capital Subscriptions2 as of December 31, 2016: | $237,767,538 | |
| Net Asset Value as of December 31, 2016: | $23,017,656 | |
| Net Asset Value per Share3 as of December 31, 2016: | $37.31 | |
| Worst Monthly Loss:4 | -32.75% | |
| (January 2012) | ||
| Worst Peak-to-Valley Loss:5 | -99.20% | |
| (Inception—November 2012) |
PAST PERFORMANCE IS NOT NECESSARILY INDICATIVE OF FUTURE RESULTS.
Rate of Return:6
| 2012 | 2013 | 2014 | 2015 | 2016 | ||||||||||||||||
| January |
-32.75 | % | -14.21 | % | 1.13 | % | -13.48 | % | -5.29 | % | ||||||||||
| February |
-20.18 | % | 21.21 | % | -18.74 | % | 3.38 | % | -10.36 | % | ||||||||||
| March |
27.37 | % | 1.17 | % | 12.13 | % | -2.16 | % | -9.47 | % | ||||||||||
| April |
6.34 | % | 28.38 | % | 6.27 | % | -0.23 | % | -27.13 | % | ||||||||||
| May |
20.84 | % | 14.53 | % | 2.02 | % | -3.34 | % | 22.15 | % | ||||||||||
| June |
3.78 | % | 39.17 | % | -17.87 | % | 12.17 | % | -24.93 | % | ||||||||||
| July |
-9.59 | % | -11.88 | % | 1.26 | % | 14.72 | % | -18.65 | % | ||||||||||
| August |
-15.77 | % | -31.22 | % | 12.03 | % | -0.50 | % | 12.60 | % | ||||||||||
| September |
-25.12 | % | 14.19 | % | 28.17 | % | -3.90 | % | -8.04 | % | ||||||||||
| October |
14.03 | % | -7.05 | % | 9.83 | % | -14.19 | % | 16.98 | % | ||||||||||
| November |
-12.57 | % | 23.06 | % | 0.22 | % | 22.43 | % | 10.18 | % | ||||||||||
| December |
29.28 | % | 2.51 | % | -1.95 | % | 2.41 | % | 3.60 | % | ||||||||||
| Annual |
-32.99 | % | 74.69 | % | 28.77 | % | 11.72 | % | -42.24 | % | ||||||||||
| Year-to-Date |
N/A | N/A | N/A | N/A | -42.24 | % | ||||||||||||||
| Name of Pool: |
ProShares Ultra VIX Short-Term Futures ETF | |
| Type of Pool: | Public, Exchange-listed Commodity Pool | |
| Date of Inception of Trading: | October 3, 2011 | |
| Aggregate Gross Capital Subscriptions1 as of December 31, 2016: | $12,952,589,665 | |
| Aggregate Net Capital Subscriptions2 as of December 31, 2016: | $3,570,038,512 | |
| Net Asset Value as of December 31, 2016: | $515,758,754 | |
| Net Asset Value per Share3 as of December 31, 2016: | $43.48 | |
| Worst Monthly Loss:4 | -57.41% | |
| (March 2012) | ||
| Worst Peak-to-Valley Loss:5 | -100.00% | |
| (Inception—December 2016) |
See accompanying Footnotes to Performance Information.
- 57 -
Table of Contents
PAST PERFORMANCE IS NOT NECESSARILY INDICATIVE OF FUTURE RESULTS.
Rate of Return:6
| 2012 | 2013 | 2014 | 2015 | 2016 | ||||||||||||||||
| January |
-44.29 | % | -42.22 | % | 33.26 | % | 24.24 | % | 34.25 | % | ||||||||||
| February |
-18.65 | % | -3.28 | % | -27.25 | % | -43.79 | % | 5.64 | % | ||||||||||
| March |
-57.41 | % | -32.67 | % | -7.29 | % | -13.32 | % | -51.67 | % | ||||||||||
| April |
-6.68 | % | -17.72 | % | -10.58 | % | -28.53 | % | -13.26 | % | ||||||||||
| May |
55.72 | % | 4.28 | % | -30.55 | % | -25.98 | % | -36.41 | % | ||||||||||
| June |
-53.69 | % | 10.79 | % | -29.08 | % | 10.78 | % | -14.07 | % | ||||||||||
| July |
-20.88 | % | -48.79 | % | 23.53 | % | -42.05 | % | -45.21 | % | ||||||||||
| August |
-30.01 | % | 25.79 | % | -24.12 | % | 169.93 | % | -21.67 | % | ||||||||||
| September |
-42.97 | % | -25.54 | % | 19.63 | % | -17.82 | % | -13.70 | % | ||||||||||
| October |
8.79 | % | -27.85 | % | -14.78 | % | -50.29 | % | -1.25 | % | ||||||||||
| November |
-41.80 | % | -22.65 | % | -18.82 | % | -6.33 | % | -35.39 | % | ||||||||||
| December |
4.64 | % | -12.99 | % | 21.81 | % | 5.41 | % | -19.36 | % | ||||||||||
| Annual |
-97.28 | % | -91.67 | % | -62.59 | % | -77.62 | % | -93.81 | % | ||||||||||
| Year-to-Date |
N/A | N/A | N/A | N/A | -93.81 | % | ||||||||||||||
| Name of Pool: |
ProShares VIX Short-Term Futures ETF | |
| Type of Pool: | Public, Exchange-listed Commodity Pool | |
| Date of Inception of Trading: | January 3, 2011 | |
| Aggregate Gross Capital Subscriptions1 as of December 31, 2016: | $2,717,525,626 | |
| Aggregate Net Capital Subscriptions2 as of December 31, 2016: | $698,630,718 | |
| Net Asset Value as of December 31, 2016: | $174,160,146 | |
| Net Asset Value per Share3 as of December 31, 2016: | $21.21 | |
| Worst Monthly Loss:4 | -32.69% | |
| (March 2012) | ||
| Worst Peak-to-Valley Loss:5 | -99.27% | |
| (September 2011—December 2016) |
PAST PERFORMANCE IS NOT NECESSARILY INDICATIVE OF FUTURE RESULTS.
Rate of Return:6
| 2012 | 2013 | 2014 | 2015 | 2016 | ||||||||||||||||
| January |
-24.92 | % | -22.82 | % | 17.09 | % | 14.74 | % | 19.62 | % | ||||||||||
| February |
-8.04 | % | 0.85 | % | -13.37 | % | -24.30 | % | 4.01 | % | ||||||||||
| March |
-32.69 | % | -17.16 | % | -2.59 | % | -6.04 | % | -29.41 | % | ||||||||||
| April |
-1.14 | % | -5.88 | % | -4.97 | % | -14.83 | % | -5.45 | % | ||||||||||
| May |
28.89 | % | 2.55 | % | -16.45 | % | -13.40 | % | -19.23 | % | ||||||||||
| June |
-29.23 | % | 7.12 | % | -15.10 | % | 7.28 | % | 1.63 | % | ||||||||||
| July |
-9.26 | % | -28.01 | % | 12.63 | % | -21.45 | % | -25.53 | % | ||||||||||
| August |
-15.50 | % | 13.12 | % | -11.98 | % | 71.07 | % | -11.04 | % | ||||||||||
| September |
-22.58 | % | -13.20 | % | 10.50 | % | -4.95 | % | -4.60 | % | ||||||||||
| October |
5.59 | % | -12.96 | % | -2.57 | % | -27.10 | % | 0.02 | % | ||||||||||
| November |
-21.88 | % | -11.75 | % | -9.56 | % | -1.15 | % | -17.88 | % | ||||||||||
| December |
7.09 | % | -6.05 | % | 14.09 | % | 6.43 | % | -9.47 | % | ||||||||||
| Annual |
-78.02 | % | -66.00 | % | -26.66 | % | -36.73 | % | -67.96 | % | ||||||||||
| Year-to-Date |
N/A | N/A | N/A | N/A | -67.96 | % | ||||||||||||||
See accompanying Footnotes to Performance Information.
- 58 -
Table of Contents
| Name of Pool: |
ProShares Short VIX Short-Term Futures ETF | |
| Type of Pool: | Public, Exchange-listed Commodity Pool | |
| Date of Inception of Trading: | October 3, 2011 | |
| Aggregate Gross Capital Subscriptions1 as of December 31, 2016: | $6,399,816,796 | |
| Aggregate Net Capital Subscriptions2 as of December 31, 2016: | $(433,253,536) | |
| Net Asset Value as of December 31, 2016: | $228,075,387 | |
| Net Asset Value per Share3 as of December 31, 2016: | $91.23 | |
| Worst Monthly Loss:4 | -47.89% | |
| (August 2015) | ||
| Worst Peak-to-Valley Loss:5 | -60.98% | |
| (July 2015—February 2016) |
PAST PERFORMANCE IS NOT NECESSARILY INDICATIVE OF FUTURE RESULTS.
Rate of Return:6
| 2012 | 2013 | 2014 | 2015 | 2016 | ||||||||||||||||
| January |
31.19 | % | 25.87 | % | -17.67 | % | -18.32 | % | -22.30 | % | ||||||||||
| February |
4.50 | % | -6.34 | % | 11.30 | % | 29.43 | % | -6.58 | % | ||||||||||
| March |
39.60 | % | 18.25 | % | 0.01 | % | 4.26 | % | 37.26 | % | ||||||||||
| April |
-3.41 | % | -2.00 | % | 3.83 | % | 15.50 | % | 2.22 | % | ||||||||||
| May |
-26.85 | % | -3.39 | % | 18.89 | % | 13.75 | % | 20.79 | % | ||||||||||
| June |
29.53 | % | -10.35 | % | 15.77 | % | -11.31 | % | -20.28 | % | ||||||||||
| July |
5.11 | % | 36.57 | % | -13.79 | % | 19.86 | % | 32.73 | % | ||||||||||
| August |
16.20 | % | -13.36 | % | 10.93 | % | -47.89 | % | 11.27 | % | ||||||||||
| September |
23.02 | % | 13.40 | % | -11.50 | % | -4.22 | % | -1.33 | % | ||||||||||
| October |
-7.76 | % | 9.11 | % | -8.50 | % | 28.56 | % | -1.36 | % | ||||||||||
| November |
22.09 | % | 12.30 | % | 9.50 | % | -3.31 | % | 17.32 | % | ||||||||||
| December |
-13.67 | % | 4.91 | % | -18.10 | % | -13.34 | % | 8.55 | % | ||||||||||
| Annual |
155.84 | % | 104.06 | % | -9.03 | % | -17.24 | % | 79.54 | % | ||||||||||
| Year-to-Date |
N/A | N/A | N/A | N/A | 79.54 | % | ||||||||||||||
| Name of Pool: |
ProShares VIX Mid-Term Futures ETF | |
| Type of Pool: | Public, Exchange-listed Commodity Pool | |
| Date of Inception of Trading: | January 3, 2011 | |
| Aggregate Gross Capital Subscriptions1 as of December 31, 2016: | $518,114,343 | |
| Aggregate Net Capital Subscriptions2 as of December 31, 2016: | $182,251,020 | |
| Net Asset Value as of December 31, 2016: | $45,818,914 | |
| Net Asset Value per Share3 as of December 31, 2016: | $42.14 | |
| Worst Monthly Loss:4 | -18.65% | |
| (January 2013) | ||
| Worst Peak-to-Valley Loss:5 | -88.24% | |
| (September 2011—December 2016) |
See accompanying Footnotes to Performance Information.
- 59 -
Table of Contents
PAST PERFORMANCE IS NOT NECESSARILY INDICATIVE OF FUTURE RESULTS.
Rate of Return:6
| 2012 | 2013 | 2014 | 2015 | 2016 | ||||||||||||||||
| January |
-9.76 | % | -18.65 | % | 3.08 | % | 6.98 | % | 8.60 | % | ||||||||||
| February |
1.25 | % | -3.13 | % | -4.27 | % | -10.54 | % | 5.89 | % | ||||||||||
| March |
-17.42 | % | -3.31 | % | -2.89 | % | 0.83 | % | -15.06 | % | ||||||||||
| April |
-0.83 | % | -6.78 | % | -3.29 | % | -5.10 | % | 3.55 | % | ||||||||||
| May |
13.10 | % | 5.89 | % | -4.07 | % | -6.52 | % | -6.39 | % | ||||||||||
| June |
-12.30 | % | 8.41 | % | -9.99 | % | 0.90 | % | 1.71 | % | ||||||||||
| July |
-5.77 | % | -16.71 | % | 1.32 | % | -7.88 | % | -8.54 | % | ||||||||||
| August |
-2.59 | % | 6.44 | % | -3.83 | % | 27.18 | % | -0.56 | % | ||||||||||
| September |
-17.84 | % | -7.58 | % | 6.37 | % | -0.83 | % | -3.24 | % | ||||||||||
| October |
-5.90 | % | -4.36 | % | -2.28 | % | -15.41 | % | -2.07 | % | ||||||||||
| November |
-10.69 | % | -5.42 | % | -2.64 | % | -0.36 | % | -4.58 | % | ||||||||||
| December |
-0.53 | % | -7.95 | % | 4.43 | % | 0.30 | % | -1.41 | % | ||||||||||
| Annual |
-53.21 | % | -44.38 | % | -17.61 | % | -15.16 | % | -21.91 | % | ||||||||||
| Year-to-Date |
N/A | N/A | N/A | N/A | -21.91 | % | ||||||||||||||
| Name of Pool: |
ProShares UltraShort Australian Dollar | |
| Type of Pool: | Public, Exchange-listed Commodity Pool | |
| Date of Inception of Trading: | July 17, 2012 | |
| Aggregate Gross Capital Subscriptions1 as of December 31, 2016: | $27,572,772 | |
| Aggregate Net Capital Subscriptions2 as of December 31, 2016: | $9,903,936 | |
| Net Asset Value as of December 31, 2016: | $16,613,473 | |
| Net Asset Value per Share3 as of December 31, 2016: | $55.38 | |
| Worst Monthly Loss:4 | -14.12% | |
| (March 2016) | ||
| Worst Peak-to-Valley Loss:5 | -22.77% | |
| (September 2015—September 2016) |
PAST PERFORMANCE IS NOT NECESSARILY INDICATIVE OF FUTURE RESULTS.
Rate of Return:6
| 2012 | 2013 | 2014 | 2015 | 2016 | ||||||||||||||||
| January |
-1.26 | % | 3.36 | % | 9.00 | % | 5.13 | % | ||||||||||||
| February |
3.60 | % | -4.43 | % | -1.36 | % | -2.33 | % | ||||||||||||
| March |
-4.35 | % | -8.03 | % | 3.90 | % | -14.12 | % | ||||||||||||
| April |
0.10 | % | -0.98 | % | -8.19 | % | 0.88 | % | ||||||||||||
| May |
16.30 | % | -0.94 | % | 6.37 | % | 9.89 | % | ||||||||||||
| June |
8.41 | % | -3.11 | % | -2.65 | % | -6.95 | % | ||||||||||||
| July* |
-4.17 | % | 2.33 | % | 2.29 | % | 10.70 | % | -4.20 | % | ||||||||||
| August |
2.68 | % | 1.28 | % | -1.48 | % | 4.60 | % | 1.80 | % | ||||||||||
| September |
-1.71 | % | -9.75 | % | 12.91 | % | 2.03 | % | -4.13 | % | ||||||||||
- 60 -
Table of Contents
| 2012 | 2013 | 2014 | 2015 | 2016 | ||||||||||||||||
| October |
-0.91 | % | -3.2 | % | -1.89 | % | -3.84 | % | 0.94 | % | ||||||||||
| November |
-1.76 | % | 7.19 | % | 6.17 | % | -3.38 | % | 5.65 | % | ||||||||||
| December |
0.15 | % | 3.06 | % | 7.76 | % | -2.26 | % | 4.25 | % | ||||||||||
| Annual |
-5.70 | % | 23.53 | % | 10.27 | % | 13.94 | % | -5.45 | % | ||||||||||
| Year-to-Date |
N/A | N/A | N/A | N/A | -5.45 | % | ||||||||||||||
See accompanying Footnotes to Performance Information.
| * | Represents rate of return from inception to July 31, 2012, as the inception of trading date for the pool was after July 1, 2012. |
| Name of Pool: |
ProShares Ultra Euro | |
| Type of Pool: | Public, Exchange-listed Commodity Pool | |
| Date of Inception of Trading: | November 24, 2008 | |
| Aggregate Gross Capital Subscriptions1 as of December 31, 2016: | $54,417,915 | |
| Aggregate Net Capital Subscriptions2 as of December 31, 2016: | $14,444,275 | |
| Net Asset Value as of December 31, 2016: | $11,914,585 | |
| Net Asset Value per Share3 as of December 31, 2016: | $14.02 | |
| Worst Monthly Loss:4 | -13.00% | |
| (January 2015) | ||
| Worst Peak-to-Valley Loss:5 | -57.77% | |
| (November 2009—December 2016) |
See accompanying Footnotes to Performance Information.
PAST PERFORMANCE IS NOT NECESSARILY INDICATIVE OF FUTURE RESULTS.
Rate of Return:6
| 2012 | 2013 | 2014 | 2015 | 2016 | ||||||||||||||||
| January |
1.94 | % | 5.71 | % | -4.00 | % | -13.00 | % | -0.90 | % | ||||||||||
| February |
3.62 | % | -7.71 | % | 4.65 | % | -2.18 | % | 0.54 | % | ||||||||||
| March |
0.05 | % | -3.75 | % | -0.48 | % | -8.11 | % | 9.10 | % | ||||||||||
| April |
-1.62 | % | 5.39 | % | 1.35 | % | 8.86 | % | 1.03 | % | ||||||||||
| May |
-12.87 | % | -2.75 | % | -3.52 | % | -4.57 | % | -5.83 | % | ||||||||||
| June |
4.59 | % | 0.17 | % | 0.84 | % | 2.75 | % | -0.96 | % | ||||||||||
| July |
-5.68 | % | 4.27 | % | -4.48 | % | -3.17 | % | 1.22 | % | ||||||||||
| August |
4.30 | % | -1.42 | % | -3.81 | % | 4.05 | % | -0.80 | % | ||||||||||
| September |
4.23 | % | 4.64 | % | -7.74 | % | -1.02 | % | 1.13 | % | ||||||||||
| October |
1.53 | % | 0.61 | % | -1.76 | % | -3.40 | % | -4.80 | % | ||||||||||
| November |
0.53 | % | 0.01 | % | -1.66 | % | -7.87 | % | -7.10 | % | ||||||||||
| December |
2.79 | % | 2.46 | % | -5.45 | % | 5.33 | % | -1.76 | % | ||||||||||
| Annual |
1.93 | % | 6.91 | % | -23.66 | % | -21.95 | % | -9.63 | % | ||||||||||
| Year-to-Date |
N/A | N/A | N/A | N/A | -9.63 | % | ||||||||||||||
| Name of Pool: |
ProShares Short Euro | |
| Type of Pool: | Public, Exchange-listed Commodity Pool | |
| Date of Inception of Trading: | June 26, 2012 | |
| Aggregate Gross Capital Subscriptions1 as of December 31, 2016: | $44,141,870 | |
| Aggregate Net Capital Subscriptions2 as of December 31, 2016: | $12,855,294 | |
| Net Asset Value as of December 31, 2016: | $15,770,088 | |
| Net Asset Value per Share3 as of December 31, 2016: | $45.06 | |
| Worst Monthly Loss:4 | -4.43% | |
| (March 2016) | ||
| Worst Peak-to-Valley Loss:5 | -13.09% | |
| (July 2012—April 2014) |
- 61 -
Table of Contents
PAST PERFORMANCE IS NOT NECESSARILY INDICATIVE OF FUTURE RESULTS.
Rate of Return:6
| 2012 | 2013 | 2014 | 2015 | 2016 | ||||||||||||||||
| January |
— | -2.88 | % | 1.91 | % | 6.92 | % | 0.24 | % | |||||||||||
| February |
— | 3.91 | % | -2.39 | % | 0.85 | % | -0.51 | % | |||||||||||
| March |
— | 1.70 | % | 0.10 | % | 3.79 | % | -4.43 | % | |||||||||||
| April |
— | -2.76 | % | -0.78 | % | -4.41 | % | -0.64 | % | |||||||||||
| May |
— | 1.24 | % | 1.69 | % | 2.06 | % | 2.92 | % | |||||||||||
| June* |
-1.32 | % | -0.24 | % | -0.57 | % | -1.67 | % | 0.18 | % | ||||||||||
| July |
2.68 | % | -2.33 | % | 2.19 | % | 1.43 | % | -0.76 | % | ||||||||||
| August |
-2.27 | % | 0.58 | % | 1.82 | % | -2.30 | % | 0.25 | % | ||||||||||
| September |
-2.23 | % | -2.40 | % | 3.94 | % | 0.27 | % | -0.69 | % | ||||||||||
| October |
-0.93 | % | -0.46 | % | 0.67 | % | 1.50 | % | 2.39 | % | ||||||||||
| November |
-0.40 | % | -0.15 | % | 0.67 | % | 3.96 | % | 3.58 | % | ||||||||||
| December |
-1.51 | % | -1.37 | % | 2.61 | % | -2.89 | % | 0.71 | % | ||||||||||
| Annual |
-5.90 | % | -5.26 | % | 12.33 | % | 9.30 | % | 3.04 | % | ||||||||||
| Year-to-Date |
N/A | N/A | N/A | N/A | 3.04 | % | ||||||||||||||
See accompanying Footnotes to Performance Information.
| * | Represents rate of return from inception to June 29, 2012, as the inception of trading date for the pool was after June 1, 2012. |
| Name of Pool: |
ProShares Ultra Yen | |
| Type of Pool: | Public, Exchange-listed Commodity Pool | |
| Date of Inception of Trading: | November 24, 2008 | |
| Aggregate Gross Capital Subscriptions1 as of December 31, 2016: | $16,323,713 | |
| Aggregate Net Capital Subscriptions2 as of December 31, 2016: | $7,266,236 | |
| Net Asset Value as of December 31, 2016: | $5,540,957 | |
| Net Asset Value per Share3 as of December 31, 2016: | $55.43 | |
| Worst Monthly Loss:4 | -16.28% | |
| (November 2016) | ||
| Worst Peak-to-Valley Loss:5 | -64.98% | |
| (August 2011—July 2015) |
PAST PERFORMANCE IS NOT NECESSARILY INDICATIVE OF FUTURE RESULTS.
Rate of Return:6
| 2012 | 2013 | 2014 | 2015 | 2016 | ||||||||||||||||
| January |
1.83 | % | -10.24 | % | 6.04 | % | 3.80 | % | -1.64 | % | ||||||||||
| February |
-12.23 | % | -2.89 | % | 0.65 | % | -3.83 | % | 14.96 | % | ||||||||||
| March |
-3.77 | % | -3.21 | % | -2.91 | % | -0.66 | % | 0.08 | % | ||||||||||
| April |
7.33 | % | -7.13 | % | 1.82 | % | 0.76 | % | 11.41 | % | ||||||||||
| May |
3.66 | % | -6.03 | % | 0.72 | % | -7.61 | % | -7.91 | % | ||||||||||
| June |
-4.03 | % | 2.26 | % | 0.86 | % | 2.63 | % | 14.33 | % | ||||||||||
| July |
4.50 | % | 2.39 | % | -3.14 | % | -2.67 | % | 1.96 | % | ||||||||||
| August |
-0.57 | % | -0.77 | % | -2.34 | % | 4.25 | % | -3.10 | % | ||||||||||
| September |
0.57 | % | -0.41 | % | -10.17 | % | 1.94 | % | 3.70 | % | ||||||||||
| October |
-4.61 | % | -0.20 | % | -4.92 | % | -1.35 | % | -6.77 | % | ||||||||||
| November |
-6.36 | % | -8.02 | % | -10.60 | % | -4.04 | % | -16.28 | % | ||||||||||
| December |
-9.85 | % | -5.48 | % | -2.11 | % | 4.51 | % | -4.62 | % | ||||||||||
| Annual |
-22.73 | % | -33.90 | % | -24.21 | % | -3.05 | % | 1.24 | % | ||||||||||
| Year-to-Date |
N/A | N/A | N/A | N/A | 1.24 | % | ||||||||||||||
See accompanying Footnotes to Performance Information.
- 62 -
Table of Contents
| Name of Pool: |
ProShares Ultra Bloomberg Natural Gas | |
| Type of Pool: | Public, Exchange-listed Commodity Pool | |
| Date of Inception of Trading: | October 4, 2011 | |
| Aggregate Gross Capital Subscriptions1 as of December 31, 2016: | $618,763,437 | |
| Aggregate Net Capital Subscriptions2 as of December 31, 2016: | $96,294,512 | |
| Net Asset Value as of December 31, 2016: | $43,203,386 | |
| Net Asset Value per Share3 as of December 31, 2016: | $18.85 | |
| Worst Monthly Loss:4 | -51.14% | |
| (December 2014) | ||
| Worst Peak-to-Valley Loss:5 | -98.83% | |
| (Inception—February 2016) |
See accompanying Footnotes to Performance Information.
PAST PERFORMANCE IS NOT NECESSARILY INDICATIVE OF FUTURE RESULTS.
Rate of Return:6
| 2012 | 2013 | 2014 | 2015 | 2016 | ||||||||||||||||
| January |
-33.79 | % | -2.67 | % | 33.18 | % | -16.96 | % | -6.84 | % | ||||||||||
| February |
-7.98 | % | 2.40 | % | -4.60 | % | -0.34 | % | -46.12 | % | ||||||||||
| March |
-39.34 | % | 29.13 | % | -8.53 | % | -10.49 | % | 16.16 | % | ||||||||||
| April |
-0.48 | % | 13.20 | % | 19.28 | % | 2.42 | % | 15.98 | % | ||||||||||
| May |
-0.06 | % | -18.86 | % | -12.75 | % | -12.18 | % | -4.07 | % | ||||||||||
| June |
21.89 | % | -21.95 | % | -4.13 | % | 10.59 | % | 47.36 | % | ||||||||||
| July |
25.46 | % | -7.13 | % | -25.71 | % | -9.47 | % | -4.53 | % | ||||||||||
| August |
-28.03 | % | 3.79 | % | 8.98 | % | -6.16 | % | -8.03 | % | ||||||||||
| September |
23.97 | % | -7.10 | % | -0.68 | % | -17.03 | % | -7.09 | % | ||||||||||
| October |
3.06 | % | -8.12 | % | -16.26 | % | -25.89 | % | -0.83 | % | ||||||||||
| November |
-14.18 | % | 16.00 | % | 4.01 | % | -20.40 | % | 8.57 | % | ||||||||||
| December |
-13.68 | % | 12.97 | % | -51.14 | % | -1.68 | % | 20.88 | % | ||||||||||
| Annual |
-61.71 | % | -0.54 | % | -60.32 | % | -69.88 | % | 1.50 | % | ||||||||||
| Year-to-Date |
N/A | N/A | N/A | N/A | 1.50 | % | ||||||||||||||
| Name of Pool: |
ProShares UltraShort Bloomberg Commodity† | |
| Type of Pool: | Public, Exchange-listed Commodity Pool | |
| Date of Inception of Trading: | November 24, 2008 | |
| Aggregate Gross Capital Subscriptions1 as of September 1, 2016: | $95,173,249 | |
| Aggregate Net Capital Subscriptions2 as of September 1, 2016: | $1,803,800 | |
| Net Asset Value as of September 1, 2016: | $0.00 | |
| Net Asset Value per Share3 as of September 1, 2016: | $0.00 | |
| Worst Monthly Loss:4 | -15.82% | |
| (April 2016) | ||
| Worst Peak-to-Valley Loss:5 | -69.20% | |
| (February 2009—September 2012) |
See accompanying Footnotes to Performance Information.
| † | ProShares UltraShort Bloomberg Commodity was liquidated on September 1, 2016 and is no longer in operation. |
- 63 -
Table of Contents
PAST PERFORMANCE IS NOT NECESSARILY INDICATIVE OF FUTURE RESULTS.
Rate of Return:6
| 2012 | 2013 | 2014 | 2015 | 2016 | ||||||||||||||||
| January |
-5.44 | % | -4.91 | % | -0.99 | % | 6.23 | % | 2.68 | % | ||||||||||
| February |
-5.47 | % | 8.48 | % | -11.70 | % | -5.78 | % | 2.49 | % | ||||||||||
| March |
8.11 | % | -1.25 | % | -1.10 | % | 10.43 | % | -7.86 | % | ||||||||||
| April |
0.31 | % | 4.61 | % | -4.94 | % | -11.13 | % | -15.82 | % | ||||||||||
| May |
20.41 | % | 4.27 | % | 5.77 | % | 4.96 | % | -0.22 | % | ||||||||||
| June |
-11.11 | % | 9.63 | % | -1.42 | % | -3.88 | % | -8.44 | % | ||||||||||
| July |
-12.82 | % | -3.05 | % | 10.50 | % | 24.17 | % | 10.33 | % | ||||||||||
| August |
-3.00 | % | -6.86 | % | 1.90 | % | 0.58 | % | -2.25 | % | ||||||||||
| September |
-3.84 | % | 4.94 | % | 13.23 | % | 6.48 | % | N/A | |||||||||||
| October |
7.73 | % | 2.71 | % | 1.17 | % | 0.37 | % | N/A | |||||||||||
| November |
-0.57 | % | 1.38 | % | 7.82 | % | 15.74 | % | N/A | |||||||||||
| December |
5.15 | % | -2.66 | % | 16.32 | % | 5.65 | % | N/A | |||||||||||
| Annual |
-4.97 | % | 17.00 | % | 38.64 | % | 61.71 | % | N/A | |||||||||||
| Year-to-Date |
N/A | N/A | N/A | N/A | -19.58 | % | ||||||||||||||
| Name of Pool: |
ProShares Ultra Bloomberg Commodity† | |
| Type of Pool: | Public, Exchange-listed Commodity Pool | |
| Date of Inception of Trading: | November 24, 2008 | |
| Aggregate Gross Capital Subscriptions1 as of September 1, 2016: | $57,464,446 | |
| Aggregate Net Capital Subscriptions2 as of September 1, 2016: | $1,435,107 | |
| Net Asset Value as of September 1, 2016: | $0.00 | |
| Net Asset Value per Share3 as of September 1, 2016: | $0.00 | |
| Worst Monthly Loss:4 | -20.40% | |
| (July 2015) | ||
| Worst Peak-to-Valley Loss:5 | -84.25% | |
| (April 2011—February 2016) |
PAST PERFORMANCE IS NOT NECESSARILY INDICATIVE OF FUTURE RESULTS.
Rate of Return:6
| 2012 | 2013 | 2014 | 2015 | 2016 | ||||||||||||||||
| January |
4.65 | % | 4.64 | % | 0.37 | % | -6.90 | % | -3.71 | % | ||||||||||
| February |
5.24 | % | -8.17 | % | 12.63 | % | 4.84 | % | -3.64 | % | ||||||||||
| March |
-8.43 | % | 0.76 | % | 0.63 | % | -10.29 | % | 7.39 | % | ||||||||||
| April |
-1.16 | % | -5.52 | % | 4.74 | % | 11.50 | % | 17.25 | % | ||||||||||
| May |
-17.71 | % | -4.66 | % | -5.82 | % | -5.61 | % | -0.72 | % | ||||||||||
| June |
10.78 | % | -9.44 | % | 1.03 | % | 3.20 | % | 8.02 | % | ||||||||||
| July |
12.77 | % | 2.51 | % | -9.88 | % | -20.40 | % | -10.28 | % | ||||||||||
| August |
2.35 | % | 6.68 | % | -2.24 | % | -2.35 | % | 1.62 | % | ||||||||||
| September |
3.16 | % | -5.25 | % | -12.27 | % | -7.00 | % | N/A | |||||||||||
| October |
-7.85 | % | -3.12 | % | -1.84 | % | -1.13 | % | N/A | |||||||||||
| November |
-0.16 | % | -1.77 | % | -8.30 | % | -14.22 | % | N/A | |||||||||||
| December |
-5.34 | % | 2.31 | % | -14.97 | % | -6.47 | % | N/A | |||||||||||
| Annual |
-5.78 | % | -20.32 | % | -32.92 | % | -45.47 | % | N/A | |||||||||||
| Year-to-Date |
N/A | N/A | N/A | N/A | 14.23 | % | ||||||||||||||
See accompanying Footnotes to Performance Information.
| † | ProShares Ultra Bloomberg Commodity was liquidated on September 1, 2016 and is no longer in operation. |
- 64 -
Table of Contents
| Name of Pool: |
ProShares Managed Futures Strategy† | |
| Type of Pool: | Public, Exchange-listed Commodity Pool | |
| Date of Inception of Trading: | October 1, 2014 | |
| Aggregate Gross Capital Subscriptions1 as of March 30, 2016: | $19,699,612 | |
| Aggregate Net Capital Subscriptions2 as of March 30, 2016: | $7,378,135 | |
| Net Asset Value as of March 30, 2016: | $0 | |
| Net Asset Value per Share3 as of March 30, 2016: | $0.00 | |
| Worst Monthly Loss:4 | -3.56% | |
| (April 2015) | ||
| Worst Peak-to-Valley Loss:5 | -7.96% | |
| (January 2015—March 2016) |
PAST PERFORMANCE IS NOT NECESSARILY INDICATIVE OF FUTURE RESULTS.
Rate of Return: 6
| 2012 | 2013 | 2014 | 2015 | 2016 | ||||||||||||||||
| January |
3.06 | % | -1.53 | % | ||||||||||||||||
| February |
-2.12 | % | 1.62 | % | ||||||||||||||||
| March |
0.69 | % | -2.42 | % | ||||||||||||||||
| April |
-3.56 | % | N/A | |||||||||||||||||
| May |
0.67 | % | N/A | |||||||||||||||||
| June |
-1.66 | % | N/A | |||||||||||||||||
| July |
-.04 | % | N/A | |||||||||||||||||
| August |
-.57 | % | N/A | |||||||||||||||||
| September |
1.04 | % | N/A | |||||||||||||||||
| October* |
0.58 | % | -1.45 | % | N/A | |||||||||||||||
| November |
3.16 | % | 1.43 | % | N/A | |||||||||||||||
| December |
1.85 | % | -.21 | % | N/A | |||||||||||||||
| Annual |
5.68 | % | -2.85 | % | N/A | |||||||||||||||
| Year-to-Date |
N/A | N/A | N/A | N/A | -2.36 | % | ||||||||||||||
| † | ProShares Managed Futures Strategy was liquidated on March 30, 2016 and is no longer in operations. |
| * | Represents rate of return from inception to October 31, 2014, as the inception of trading date for the pool was after October 1, 2014. |
| Name of Pool: |
ProShares Ultra Australian Dollar† | |
| Type of Pool: | Public, Exchange-listed Commodity Pool | |
| Date of Inception of Trading: | July 17, 2012 | |
| Aggregate Gross Capital Subscriptions1 as of June 29, 2015: | $4,000,200 | |
| Aggregate Net Capital Subscriptions2 as of June 29, 2015: | $1,476,774 | |
| Net Asset Value as of June 29, 2015: | $0 | |
| Net Asset Value per Share3 as of June 29, 2015: | $0.00 | |
| Worst Monthly Loss:4 | -14.54% | |
| (May 2013) | ||
| Worst Peak-to-Valley Loss:5 | -43.55% | |
| (March 2013—June 2015) |
See accompanying Footnotes to Performance Information.
- 65 -
Table of Contents
PAST PERFORMANCE IS NOT NECESSARILY INDICATIVE OF FUTURE RESULTS.
Rate of Return:6
| 2012 | 2013 | 2014 | 2015 | |||||||||||||
| January |
0.94 | % | -3.72 | % | -8.78 | % | ||||||||||
| February |
-3.77 | % | 4.21 | % | 0.99 | % | ||||||||||
| March |
4.28 | % | 8.27 | % | -4.96 | % | ||||||||||
| April |
-0.56 | % | 0.71 | % | 8.12 | % | ||||||||||
| May |
-14.54 | % | 0.68 | % | -6.57 | % | ||||||||||
| June |
-8.63 | % | 2.93 | % | -1.86 | % | ||||||||||
| July* |
4.03 | % | -3.08 | % | -2.53 | % | N/A | |||||||||
| August |
-2.91 | % | -1.69 | % | 1.30 | % | N/A | |||||||||
| September |
1.27 | % | 10.07 | % | -11.93 | % | N/A | |||||||||
| October |
0.59 | % | 2.97 | % | 1.32 | % | N/A | |||||||||
| November |
1.50 | % | -7.09 | % | -6.37 | % | N/A | |||||||||
| December |
-0.42 | % | -3.42 | % | -7.59 | % | N/A | |||||||||
| Annual |
3.98 | % | -23.77 | % | -13.58 | % | N/A | |||||||||
| Year-to-Date |
N/A | N/A | N/A | -13.20 | % | |||||||||||
| † | ProShares Ultra Australian Dollar was liquidated on June 29, 2015 and is no longer in operations. |
| * | Represents rate of return from inception to July 31, 2012, as the inception of trading date for the pool was after July 1, 2012. |
Footnotes to Performance Information
| 1. | “Aggregate Gross Capital Subscriptions” is the aggregate of all amounts ever contributed to the pool, including those of investors who subsequently redeemed their investments. |
| 2. | “Aggregate Net Capital Subscriptions” is the aggregate of all amounts ever contributed to the pool, excluding those of investors who subsequently redeemed their investments. |
| 3. | “Net Asset Value per Share” is the net asset value, based on the pricing policies of the Trust and determined in accordance with Generally Accepted Accounting Principles, of the pool divided by the total number of Shares outstanding as of December 31, 2016. Please see “Description of the Shares; The Fund; Certain Material Terms of the Trust Agreement—Net Asset Value (NAV)” for additional information regarding the pricing policies of the Trust. |
| 4. | “Worst Monthly Loss” is the largest single month loss sustained during the most recent five calendar years and year-to-date (or since inception of the Fund, if the Fund has had less than five calendar years of performance), expressed as a percentage. “Loss” as used in this section of the Prospectus means losses experienced by the relevant pool over the specified period and is calculated on a rate of return basis, i.e., dividing net performance by beginning equity. Loss is measured on the basis of monthly returns only, and does not reflect intra-month figures. |
| 5. | “Worst Peak-to-Valley Loss” is the largest percentage decline in Net Asset Value per Share over the most recent five calendar years and year-to-date (or since inception of the Fund, if the Fund has had less than five calendar years of performance). This need not be a continuous decline, but can be a series of positive and negative returns where the negative returns are larger than the positive returns. Worst Peak-to-Valley Loss represents the greatest percentage decline from any month-end Net Asset Value per Share that occurs without such month-end Net Asset Value per Share being equaled or exceeded as of a subsequent month-end. A Peak-to-Valley loss that begins prior to the beginning of the most recent five calendar years and ends within the most recent five calendar year period is deemed to have occurred during such five calendar year period. |
| 6. | Based on the latest calculated net asset value, as applicable to creations and redemptions of Creation Units, with respect to each period. |
Under normal market conditions, substantially all of the proceeds of the offering of the Shares of the Fund are used to enter into Financial Instruments in which the Fund invests, in combination with cash or cash equivalents and/or U.S. Treasury securities or other high credit quality, short-term fixed-income or similar securities (such as shares of money market funds and collateralized repurchase agreements) as collateral for Financial Instruments and pending investment in Financial Instruments. To the extent that the Fund does not invest the proceeds of the offering of the Shares in the manner described above on the day such proceeds are received, such proceeds will be deposited with the Custodian in a non-interest bearing account.
- 66 -
Table of Contents
To the extent that the Fund trades in futures contracts on U.S. exchanges, the assets deposited by the Fund with the FCMs (or another eligible financial institution, as applicable) as margin must be segregated pursuant to the regulations of the CFTC. Such segregated funds may be invested only in a limited range of instruments—principally U.S. government obligations to margin futures and forward contract positions.
The Sponsor has selected Merrill Lynch, Pierce, Fenner & Smith Incorporated (“MLPF&S”) and RBC Capital Markets, LLC (RBC) as its FCMs. Both MLPF&S and RBC, in their capacity as registered FCMs, serve as a clearing broker to the Trust and the Fund and as such arrange for the execution and clearing of the Fund’s futures transactions. Both MLPF&S and RBC act as clearing broker for many other funds and individuals. A variety of executing brokers may execute futures transactions on behalf of the Fund. The executing brokers will give-up all such transactions to MLPF&S or RBC, as applicable. Both of MLPF&S and RBC are registered as an FCM with the CFTC and are members of the NFA. MLPF&S and RBC are clearing members of the CBOT, CME, NYMEX, and all other major U.S. commodity exchanges. Neither MLPF&S nor RBC is affiliated with or acts as a supervisor of the Trust, the Fund, the Sponsor, the Trustee or BBH&Co. (the Administrator and the Custodian). Neither MLPF&S nor RBC, in its capacity as FCM, is acting as an underwriter or sponsor of the offering of the Shares, or has passed upon the merits of participating in this offering. Neither MLPF&S nor RBC has passed upon the adequacy of this Prospectus or on the accuracy of the information contained herein. Neither MLPF&S nor RBC provides any commodity trading advice regarding the Fund’s trading activities. Investors should not rely upon MLPF&S or RBC in deciding whether to invest in the Fund or retain their interests in the Fund. Prospective investors should also note that the Sponsor may select additional clearing brokers or replace MLPF&S and/or RBC as the Fund’s clearing broker.
To the extent, if any, that the Fund enters into trades in futures on markets other than regulated U.S. futures exchanges, funds deposited to margin positions held on such exchanges are invested in bank deposits or in instruments of a credit standing generally comparable to those authorized by the CFTC for investment of “customer segregated funds,” although applicable CFTC rules prohibit funds employed in trading on foreign exchanges from being deposited in “customer segregated fund accounts.”
The Sponsor, a registered commodity pool operator, is responsible for the cash management activities of the Fund, including investing in cash equivalents that may be used as margin for the Financial Instruments as described above.
Only Authorized Participants may create or redeem Creation Units. Each Authorized Participant must (1) be a registered broker-dealer or other securities market participant such as a bank or other financial institution which is not required to register as a broker-dealer to engage in securities transactions, (2) be a participant in DTC, and (3) have entered into an agreement with the Trust and the Sponsor (an Authorized Participant Agreement).
CREATION AND REDEMPTION OF SHARES
The Fund creates and redeems Shares from time to time, but only in one or more Creation Units. A Creation Unit is a block of 50,000 Shares of the Fund. Except when aggregated in Creation Units, the Shares are not redeemable securities.
The manner by which Creation Units are purchased and redeemed is dictated by the terms of the Authorized Participant Agreement and Authorized Participant Handbook, and all such procedures are at the discretion of the Sponsor. By placing a purchase order, an Authorized Participant agrees to deposit cash with the Custodian of the Fund (unless as provided otherwise in this Prospectus). If permitted by the Sponsor in its sole discretion with respect to the Fund, an Authorized Participant may also agree to enter into or arrange for an exchange of a futures contract for related position (“EFCRP”) or block trade with the Fund whereby the Authorized Participant would also transfer to the Fund a number and type of exchange-traded futures contracts at or near the closing settlement price for such contracts on the purchase order date. Similarly, the Sponsor in its sole discretion may agree with an Authorized Participant to use an EFCRP to effect an order to redeem Creation Units.
An EFCRP is a technique permitted by the rules of certain futures exchanges that, as utilized by the Fund in the Sponsor’s discretion, would allow the Fund to take a position in a futures contract from an Authorized Participant, or give futures contracts to an Authorized Participant, in the case of a redemption, rather than to enter the futures exchange markets to obtain such a position. An EFCRP by itself will not change either party’s net risk position materially. Because the futures position that the Fund would otherwise need to take in order to meet its investment objective can be obtained without unnecessarily impacting the financial or futures markets or their pricing, EFCRPs can generally be viewed as transactions beneficial to the Fund. A block trade is a technique that permits the Fund to obtain a futures position without going through the market auction system and can generally be viewed as a transaction beneficial to the Fund.
- 67 -
Table of Contents
Authorized Participants pay a fixed transaction fee of up to $500 in connection with each order to create or redeem a Creation Unit in order to compensate BBH&Co., as the Administrator, the Custodian and the Transfer Agent of the Fund and its Shares, for services in processing the creation and redemption of Creation Units and to offset the costs of increasing or decreasing derivative positions. Authorized Participants also may pay a variable transaction fee to the Fund of up to 0.10% of the value of the Creation Unit that is purchased or redeemed unless the transaction fee is waived or otherwise adjusted by the Sponsor. The Sponsor provides such Authorized Participant with prompt notice in advance of any such waiver or adjustment of the transaction fee. Authorized Participants may sell the Shares included in the Creation Units they purchase from the Fund to other investors. Further detail on the fees is set forth in the Authorized Participant Handbook.
The form of Authorized Participant Agreement and the related Authorized Participant Handbook set forth the procedures for the creation and redemption of Creation Units and for the payment of cash required for such creations and redemptions. The Sponsor may delegate its duties and obligations under the form of Authorized Participant Agreement to SEI or the Administrator without consent from any shareholder or Authorized Participant. The form of Authorized Participant Agreement and the related procedures attached thereto may be amended by the Sponsor without the consent of any shareholder or Authorized Participant. Authorized Participants who purchase Creation Units from the Fund receive no fees, commissions or other form of compensation or inducement of any kind from either the Sponsor or the Fund, and no such person has any obligation or responsibility to the Sponsor or the Fund to effect any sale or resale of Shares.
Authorized Participants are cautioned that some of their activities may result in their being deemed participants in a distribution in a manner which would render them statutory underwriters and subject them to the prospectus delivery and liability provisions of the 1933 Act, as described in “Plan of Distribution.”
Each Authorized Participant must be registered as a broker-dealer under the 1934 Act and regulated by FINRA, or exempt from being, or otherwise not required to be, so regulated or registered, and must be qualified to act as a broker or dealer in the states or other jurisdictions where the nature of its business so requires. Certain Authorized Participants may be regulated under federal and state banking laws and regulations. Each Authorized Participant must have its own set of rules and procedures, internal controls and information barriers as it determines is appropriate in light of its own regulatory regime.
Authorized Participants may act for their own accounts or as agents for broker-dealers, custodians and other securities market participants that wish to create or redeem Creation Units.
Persons interested in purchasing Creation Units should contact the Sponsor or the Administrator to obtain the contact information for the Authorized Participants. Shareholders who are not Authorized Participants are only able to redeem their Shares through an Authorized Participant.
Pursuant to the Authorized Participant Agreement, the Sponsor agreed to indemnify the Authorized Participants against certain liabilities, including liabilities under the 1933 Act, and to contribute to the payments the Authorized Participants may be required to make in respect of those liabilities.
The following description of the procedures for the creation and redemption of Creation Units is only a summary and an investor should refer to the relevant provisions of the Trust Agreement and the form of Authorized Participant Agreement for more detail. The Trust Agreement and the form of Authorized Participant Agreement are filed as exhibits to the Registration Statement of which this Prospectus is a part.
On any Business Day, an Authorized Participant may place an order with the Distributor to create one or more Creation Units. For purposes of processing both purchase and redemption orders, a “Business Day” for the Fund means any day on which the NAV of the Fund is determined.
Purchase orders must be placed by the cut-off time shown on page 2 or earlier if the Exchange or other exchange material to the valuation or operation of the Fund closes before the cut-off time. If a purchase order is received prior to the applicable cut-off time, the day on which SEI receives a valid purchase order is the purchase order date. If the purchase order is received after the applicable cut-off time, the purchase order date will be the next business day. Purchase orders are irrevocable. By placing a purchase order, and prior to delivery of such Creation Units, an Authorized Participant’s DTC account will be charged the non-refundable transaction fee due for the purchase order.
- 68 -
Table of Contents
Determination of Required Payment
The total payment required to create each Creation Unit is the NAV of 50,000 Shares of the Fund on the purchase order date plus the applicable transaction fee. For the Fund, Authorized Participants have create/redeem cut-off times prior to the NAV calculation time, which may be different from the close of U.S. markets, as shown in the table on page 2.
Delivery of Cash
Cash required for settlement will typically be transferred to the Custodian through: (1) the Continuous Net Settlement (“CNS”) clearing process of NSCC, as such processes have been enhanced to effect creations and redemptions of Creation Units; or (2) the facilities of DTC on a Delivery Versus Payment (DVP) basis, which is the procedure in which the buyer’s payment for securities is due at the time of delivery. Security delivery and payment are simultaneous. If the Custodian does not receive the cash by the market close on the first Business Day following the purchase order date (T+1), such order may be charged interest for delayed settlement or cancelled. The Sponsor reserves the right to extend the deadline for the Custodian to receive the cash required for settlement up to the third Business Day following the purchase order date (T+3). In the event a purchase order is cancelled, the Authorized Participant will be responsible for reimbursing the Fund for all costs associated with cancelling the order including costs for repositioning the portfolio. At its sole discretion, the Sponsor may agree to a delivery date other than T+3. Additional fees may apply for special settlement. The Creation Unit will be delivered to the Authorized Participant upon the Custodian’s receipt of the purchase amount.
Delivery of Exchange of Futures Contract for Related Position (EFCRP) Futures Contracts or Block Trades
In the event that the Sponsor shall have determined to permit the Authorized Participant to transfer futures contracts pursuant to an EFCRP or to engage in a block trade purchase of futures contracts from the Authorized Participant with respect to the Fund, as well as to deliver cash, in the creation process, futures contracts required for settlement must be transferred directly to the Fund’s account at its FCM. If the cash is not received by the market close on the third Business Day following the purchase order date (T+3); such order may be charged interest for delayed settlements or cancelled. In the event a purchase order is cancelled, the Authorized Participant will be responsible for reimbursing the Fund for all costs associated with cancelling the order including costs for repositioning the portfolio. At its sole discretion, the Sponsor may agree to a delivery date other than T+3. The Creation Unit will be delivered to the Authorized Participant upon the Custodian’s receipt of the cash purchase amount and the futures contracts.
Suspension or Rejection of Purchase Orders
In respect of the Fund, the Sponsor may, in its discretion, suspend the right to purchase, or postpone the purchase settlement date, (1) for any period during which any of the Exchange, CBOE, CFE, CME (including CBOT and NYMEX) or ICE or other exchange material to the valuation or operation of the Fund is closed or when trading is suspended or restricted on such exchanges in any of the underlying Reference Assets; (2) for any period during which an emergency exists as a result of which the fulfillment of a purchase order is not reasonably practicable; or (3) for such other period as the Sponsor determines to be necessary for the protection of the shareholders. The Sponsor will not be liable to any person or in any way for any loss or damages that may result from any such suspension or postponement.
The Sponsor also may reject a purchase order if:
| • | it determines that the purchase order is not in proper form; |
| • | the Sponsor believes that the purchase order would have adverse tax consequences to the Fund or its shareholders; |
| • | the order would be illegal; or |
| • | circumstances outside the control of the Sponsor make it, for all practical purposes, not feasible to process creations of Creation Units. |
None of the Sponsor, the Administrator or the Custodian will be liable for the suspension or rejection of any purchase order.
The procedures by which an Authorized Participant can redeem one or more Creation Units mirror the procedures for the creation of Creation Units. On any Business Day, an Authorized Participant may place an order with the Distributor to redeem one or more Creation Units. If a redemption order is received prior to the applicable cut-off time, or earlier if the Exchange or other exchange material to the valuation or operation of the Fund closes before the cut-of time, the day on which SEI receives a valid redemption order is the redemption order date. If the redemption order is received after the applicable cut-off time, the redemption order date will be the next day. Redemption orders are irrevocable. The redemption procedures allow Authorized Participants to redeem Creation Units. Individual shareholders may not redeem directly from the Fund.
- 69 -
Table of Contents
By placing a redemption order, an Authorized Participant agrees to deliver the Creation Units to be redeemed through DTC’s book-entry system to the Fund not later than noon (Eastern Time), on the first Business Day immediately following the redemption order date (T+1). The Sponsor reserves the right to extend the deadline for the Fund to receive the Creation Units required for settlement up to the third Business Day following the redemption order date (T+3). By placing a redemption order, and prior to receipt of the redemption proceeds, an Authorized Participant must wire to the Custodian the non-refundable transaction fee due for the redemption order or any proceeds due will be reduced by the amount of the fee payable. At its sole discretion, the Sponsor may agree to a delivery date other than T+3. Additional fees may apply for special settlement.
Upon request of an Authorized Participant made at the time of a redemption order, the Sponsor at its sole discretion may determine, in addition to delivering redemption proceeds, to transfer futures contracts to the Authorized Participant pursuant to an EFCRP or to a block trade sale of futures contracts to the Authorized Participant.
Determination of Redemption Proceeds
The redemption proceeds from the Fund consist of the cash redemption amount and, if permitted by the Sponsor in its sole discretion with respect to the Fund, an EFCRP or block trade with the Fund as described in “Creation and Redemption of Shares” above. The cash redemption amount is equal to the NAV of the number of Creation Unit(s) of the Fund requested in the Authorized Participant’s redemption order as of the time of the calculation of the Fund’s NAV on the redemption order date, less transaction fees and any amounts attributable to any applicable EFCRP or block trade.
Delivery of Redemption Proceeds
The redemption proceeds due from the Fund are delivered to the Authorized Participant at noon (Eastern Time), on the third Business Day immediately following the redemption order date if, by such time on such Business Day immediately following the redemption order date, the Fund’s DTC account has been credited with the Creation Units to be redeemed. The Fund should be credited through: (1) the CNS clearing process of NSCC, as such processes have been enhanced to effect creations and redemptions of Creation Units; or (2) the facilities of DTC on a Delivery Versus Payment basis. If the Fund’s DTC account has not been credited with all of the Creation Units to be redeemed by such time, the redemption distribution is delivered to the extent whole Creation Units are received. Any remainder of the redemption distribution is delivered on the next Business Day to the extent any remaining whole Creation Units are received if: (1) the Sponsor receives the fee applicable to the extension of the redemption distribution date which the Sponsor may, from time to time, determine, and (2) the remaining Creation Units to be redeemed are credited to the Fund’s DTC account by noon (Eastern Time), on such next Business Day. Any further outstanding amount of the redemption order may be cancelled. The Authorized Participant will be responsible for reimbursing the Fund for all costs associated with cancelling the order including costs for repositioning the portfolio.
The Sponsor is also authorized to deliver the redemption distribution notwithstanding that the Creation Units to be redeemed are not credited to the Fund’s DTC account by noon (Eastern Time), on the third Business Day immediately following the redemption order date if the Authorized Participant has collateralized its obligation to deliver the Creation Units through DTC’s book-entry system on such terms as the Sponsor may determine from time to time.
In the event that the Authorized Participant shall have requested, and the Sponsor shall have determined to permit the Authorized Participant to receive futures contracts pursuant to an EFCRP, as well as the cash redemption proceeds, in the redemption process, futures contracts required for settlement shall be transferred directly from the Fund’s account at its FCM to the account of the Authorized Participant at its FCM.
Suspension or Rejection of Redemption Orders
In respect of the Fund, the Sponsor may, in its discretion, suspend the right of redemption, or postpone the redemption settlement date, (1) for any period during which any of the Exchange, CBOE, CFE, CME (including CBOT and NYMEX) or ICE or other exchange material to the valuation or operation of the Fund is closed or when trading is suspended or restricted on such exchanges in any of the underlying Reference Assets; (2) for any period during which an emergency exists as a result of which the redemption distribution is not reasonably practicable; or (3) for such other period as the Sponsor determines to be necessary for the protection of the shareholders. The Sponsor will not be liable to any person or in any way for any loss or damages that may result from any such suspension or postponement.
The Sponsor will reject a redemption order if the order is not in proper form as described in the form of Authorized Participant Agreement or if the fulfillment of the order might be unlawful.
- 70 -
Table of Contents
Creation and Redemption Transaction Fee
To compensate BBH&Co. for services in processing the creation and redemption of Creation Units and to offset some or all of the transaction costs, an Authorized Participant may be required to pay a fixed transaction fee to BBH&Co. of up to $500 per order to create or redeem Creation Units and may pay a variable transaction fee to the Fund of up to 0.10% of the value of a Creation Unit. An order may include multiple Creation Units. The transaction fee(s) may be reduced, increased or otherwise changed by the Sponsor at its sole discretion.
The Sponsor may allow for early settlement of purchase or redemption orders. Such arrangements may result in additional charges to the Authorized Participant.
As of the date of this Prospectus, there is no pending legal proceeding, other than ordinary routine litigation incidental to the business of the Trust and that which is described below, to which the Trust or the Fund is a claimant or defendant or to which any of their property is the subject.
As of the date of this Prospectus, there are no material administrative, civil or criminal actions, whether pending or concluded, within five years preceding the date of the Prospectus, against the Sponsor. Louis Mayberg and Michael Sapir, both principals of the Sponsor, were named as defendants in a purported class action lawsuit in the United States District Court for the Southern District of New York, styled In re ProShares Trust Securities Litigation, Civ. No. 09-cv-6935. The Trust was also a defendant in this action, along with several others. The action was initially brought by Steven Novick, on behalf of himself and all others similarly situated, in a complaint filed August 5, 2009, and was consolidated on April 28, 2011, with 33 related putative class actions. The second amended complaint alleged that the defendants violated Sections 11 and 15 of the 1933 Act by including untrue statements of material fact and omitting material facts in the Registration Statement for one or more of ProShares’ exchange-traded funds (“ETFs”) and allegedly failing to adequately disclose the funds’ investment objectives and risks. Claimants, all purchasers of shares of ETFs sold by the Trust or ProShares Trust, sought class certification, compensatory damages, punitive damages, litigation costs, expectation damages and declaratory judgment. The six other series of the Trust named in the complaint were ProShares Ultra Silver, ProShares Ultra Gold, ProShares UltraShort Gold, ProShares UltraShort DJ-UBS Crude Oil (n/k/a ProShares UltraShort Bloomberg Crude Oil), ProShares Ultra DJ-UBS Crude Oil (n/k/a ProShares Ultra Bloomberg DJ-UBS Crude Oil), and ProShares UltraShort Silver. On September 10, 2012, the District Court issued an Opinion and Order dismissing the class action lawsuit in its entirety. On July 22, 2013, the United States Court of Appeals for the Second Circuit issued an Opinion affirming the District Court’s decision and dismissing the class action lawsuit in its entirety.
MLPF&S and RBC are clearing members of the CBOT, CME, NYMEX, and all other major U.S. commodity exchanges. From time to time, each of MLPF&S and RBC (in its capacity as a commodities broker) and its respective principals may be involved in numerous legal actions, some of which individually and all of which in the aggregate, seek significant or indeterminate damages. However, except for the actions described in the section entitled “Futures Commission Merchants—Litigation and Regulatory Disclosure Relating to FCMs” beginning on page 30, each of MLPF&S and RBC has advised that during the five years preceding the date of this Prospectus there has been no material administrative, civil, or criminal action against it or any of its respective principals.
DESCRIPTION OF THE SHARES; THE FUND; CERTAIN MATERIAL
TERMS OF THE TRUST AGREEMENT
The following summary describes in brief the Shares and certain aspects of the operation of the Trust, the Fund, and the respective responsibilities of the Trustee and the Sponsor concerning the Trust and the material terms of the Trust Agreement. Prospective investors should carefully review the Trust Agreement filed as an exhibit to the Registration Statement of which this Prospectus is a part and consult with their own advisors concerning the implications to such prospective investors of investing in a series of a Delaware statutory trust. Capitalized terms used in this section and not otherwise defined shall have such meanings assigned to them under the Trust Agreement.
The Fund issues common units of beneficial interest, or Shares, which represent units of fractional undivided beneficial interest in and ownership of the Fund.
The Shares may be purchased from the Fund or redeemed on a continuous basis, but only by Authorized Participants and only in Creation Units. Individual Shares may not be purchased or redeemed from the Fund. Shareholders that are not Authorized Participants may not purchase or redeem any Shares or Creation Units from the Fund.
- 71 -
Table of Contents
Principal Office; Location of Records; Fiscal Year
The Trust is organized as a statutory trust under the DSTA. The Trust is managed by the Sponsor, whose office is located at 7501 Wisconsin Avenue, East Tower, 10th Floor, Bethesda, Maryland 20814.
The books and records of the Fund are maintained as follows: all marketing materials are maintained at the offices of SEI, One Freedom Valley Drive, Oaks, Pennsylvania 19456. Creation Unit creation and redemption books and records, certain financial books and records (including Fund accounting records, ledgers with respect to assets, liabilities, capital, income and expenses, the registrar, transfer journals and related details) and certain trading and related documents received from FCMs are maintained by BBH&Co., 50 Post Office Square, Boston, Massachusetts 02110.
All other books and records of the Fund (including minute books and other general corporate records, trading records and related reports) are maintained at the Fund’s principal office, c/o ProShare Capital Management LLC, 7501 Wisconsin Avenue, East Tower, 10th Floor, Bethesda, Maryland 20814.
Trust books and records located at the foregoing addresses, are available for inspection and copying (upon payment of reasonable reproduction costs) by Fund shareholders or their representatives for any purposes reasonably related to such shareholder’s interest as a beneficial owner during regular business hours as provided in the Trust Agreement. The Sponsor will maintain and preserve the Trust’s books and records for a period of not less than six years.
The fiscal year of the Fund ends on December 31 of each year.
The Trust is formed and operated in a manner such that the Fund is liable only for obligations attributable to the Fund and shareholders of the Fund are not subject to the losses or liabilities of any other series of the Trust. If any creditor or shareholder in the Fund asserted against the Fund a valid claim with respect to its indebtedness or Shares, the creditor or shareholder would only be able to recover money from the Fund and its assets. Accordingly, the debts, liabilities, obligations and expenses, or collectively, claims, incurred, contracted for or otherwise existing solely with respect to the Fund, are enforceable only against the assets of the Fund, and not against any other series of the Trust or the Trust generally, or any of their respective assets. The assets of the Fund include only those funds and other assets that are paid to, held by, or distributed to the Fund on account of and for the benefit of the Fund, including, without limitation, funds delivered to the Trust for the purchase of Shares or Creation Units in the Fund. This limitation on liability is referred to as the “Inter-Series Limitation on Liability.” The Inter-Series Limitation on Liability is expressly provided for under the DSTA, which provides that if certain conditions (as set forth in Section 3804(a)) are met, then the debts of any particular series will be enforceable only against the assets of such series and not against the assets of any other series of the Trust or the Trust generally.
Wilmington Trust Company, a Delaware trust company, is the sole Trustee of the Trust. The rights and duties of the Trustee and the Sponsor with respect to the offering of the Shares and Fund management and the shareholders are governed by the provisions of the DSTA and by the Trust Agreement. The Trustee will accept service of legal process on the Trust in the State of Delaware and will make certain filings under the DSTA. The Trustee does not owe any other duties to the Trust, the Sponsor or the shareholders of the Fund. The Trustee’s principal offices are located at 1100 North Market Street, Wilmington, Delaware 19890. The Trustee is unaffiliated with the Sponsor.
The Trustee is permitted to resign upon at least sixty (60) days’ notice to the Trust, provided, that any such resignation will not be effective until a successor Trustee is appointed by the Sponsor. The Trustee is compensated by the Fund and is indemnified by the Fund against any expenses it incurs relating to or arising out of the formation, operation or termination of the Fund, as appropriate, or the performance of its duties pursuant to the Trust Agreement, except to the extent that such expenses result from the gross negligence or willful misconduct of the Trustee. The Sponsor has the discretion to replace the Trustee.
Only the assets of the Trust and the Sponsor are subject to issuer liability under the federal securities laws for the information contained in this Prospectus and under federal securities laws with respect to the issuance and sale of the Shares. Under such laws, neither the Trustee, either in its capacity as Trustee or in its individual capacity, nor any director, officer or controlling person of the Trustee is, or has any liability as, the issuer or a director, officer or controlling person of the issuer of the Shares. The Trustee’s liability in connection with the issuance and sale of the Shares is limited solely to the express obligations of the Trustee set forth in the Trust Agreement.
Under the Trust Agreement, the Sponsor has exclusive management and control of all aspects of the Trust’s business. The Trustee has no duty or liability to supervise the performance of the Sponsor, nor will the Trustee have any liability for the acts or omissions of the Sponsor. The shareholders have no voice in the day-to-day management of the business and operations of the Fund
- 72 -
Table of Contents
and the Trust, other than certain limited voting rights as set forth in the Trust Agreement. In the course of its management of the business and affairs of the Fund and the Trust, the Sponsor may, in its sole and absolute discretion, appoint an affiliate or affiliates of the Sponsor as additional sponsors and retain such persons, including affiliates of the Sponsor, as it deems necessary to effectuate and carry out the purposes, business and objectives of the Trust.
Because the Trustee has no authority over the Trust’s operations, the Trustee itself is not registered in any capacity with the CFTC.
ProShare Capital Management LLC, is the Sponsor of the Trust, the Fund and the other series of the Trust. As noted above, the Sponsor has exclusive management and control of all aspects of the business of the Fund. The Trustee has no duty or liability to supervise the performance of the Sponsor, nor will the Trustee have any liability for the acts or omissions of the Sponsor.
The Sponsor serves as the Trust’s commodity pool operator.
Specifically, with respect to the Trust, the Sponsor:
| • | selects the Fund’s service providers; |
| • | negotiates various agreements and fees; |
| • | performs such other services as the Sponsor believes that the Trust may require from time to time; |
| • | selects the FCM and Financial Instrument counterparties, if any; |
| • | manages the Fund’s portfolio of other assets, including cash equivalents; and |
| • | manages the Fund with a view toward achieving the Fund’s investment objectives. |
The Shares are not deposits or other obligations of the Sponsor, the Trustee or any of their respective subsidiaries or affiliates or any other bank, are not guaranteed by the Sponsor, the Trustee or any of their respective subsidiaries or affiliates or any other bank and are not insured by the Federal Deposit Insurance Corporation or any other governmental agency. An investment in the Shares of the Fund offered hereby is speculative and involves a high degree of risk.
The principal office of the Sponsor is located at 7501 Wisconsin Avenue, East Tower, 10th Floor, Bethesda, Maryland 20814. The telephone number of the Sponsor is (240) 497-6400.
Background and Principals
The Sponsor currently serves as the commodity pool operator of the Trust and the Fund, and previously also served as the commodity trading advisor to the Trust and the Fund. The Sponsor is registered as a commodity pool operator with the CFTC and is a member in good standing of the NFA. The Sponsor’s membership with the NFA was originally approved on June 11, 1999. It withdrew its membership with the NFA on August 31, 2000 but later re-applied and had its membership subsequently approved on January 8, 2001. Its membership with the NFA is currently effective. The Sponsor’s registration as a commodity trading advisor was approved on June 11, 1999. On February 17, 2013, the Sponsor’s commodity trading advisor registration was withdrawn. The Sponsor’s registration as a commodity pool operator was originally approved on June 11, 1999. It withdrew its registration as a commodity pool operator on August 30, 2000 but later re-applied and had its registration subsequently approved on November 28, 2007. Its registration as a commodity pool operator is currently effective. As a registered commodity pool operator, with respect to the Trust, the Sponsor must comply with various regulatory requirements under the CEA, and the rules and regulations of the CFTC and the NFA, including investor protection requirements, antifraud prohibitions, disclosure requirements, and reporting and recordkeeping requirements. The NFA approved the Sponsor as a Swaps Firm on January 4, 2013. The Sponsor is also subject to periodic inspections and audits by the CFTC and NFA. Its principal place of business is 7501 Wisconsin Avenue, East Tower, 10th Floor, Bethesda, Maryland 20814, and its telephone number is (240) 497-6400. The registration of the Sponsor with the CFTC and its membership in the NFA must not be taken as an indication that either the CFTC or the NFA has recommended or approved the Sponsor, the Trust and the Fund.
In its capacity as a commodity pool operator, the Sponsor is an organization which operates or solicits funds for commodity pools; that is, an enterprise in which funds contributed by a number of persons are combined for the purpose of trading futures contracts. For past performance of commodity pools operated by the Sponsor, see the section entitled “Performance of the Offered Commodity Pool Operated by the Commodity Pool Operator” beginning on page 26 and the section entitled “Performance of the Other Commodity Pools Operated by the Commodity Pool Operator” beginning on page 52.
- 73 -
Table of Contents
Executive Officers of the Trust and Principals and Significant Employees of the Sponsor
| Name |
Position | |
| Michael L. Sapir | Chief Executive Officer and Principal of the Sponsor | |
| Louis M. Mayberg | Principal of the Sponsor | |
| William E. Seale | Principal of the Sponsor | |
| Sapir Family Trust | Principal of the Sponsor | |
| Northstar Trust | Principal of the Sponsor | |
| Timothy N. Coakley | Chief Financial Officer and Principal of the Sponsor | |
| Edward J. Karpowicz | Principal Financial Officer of the Trust and Principal of the Sponsor | |
| Todd B. Johnson* | Principal Executive Officer of the Trust and Chief Investment Officer and Principal of the Sponsor | |
| Hratch Najarian | Director, Portfolio Management and Principal of the Sponsor | |
| Alexander Illyasov | Senior Portfolio Manager of the Sponsor | |
| Jeffrey Ploshnick | Senior Portfolio Manager and Associated Person of the Sponsor | |
| Ryan Dofflemeyer | Portfolio Manager and Associated Person of the Sponsor | |
| Benjamin McAbee | Portfolio Manager of the Sponsor | |
| Victor M. Frye | Principal of the Sponsor |
| * | Denotes principal of the Sponsor who supervises persons who participate in making trading decisions for the Fund. |
The following is a biographical summary of the business experience of the executive officers of the Trust and the principals and significant employees of the Sponsor.
ProFund Advisors LLC (“PFA”) and ProShare Advisors LLC (“PSA”) are investment advisors registered under the Investment Advisers Act of 1940 (the “Advisers Act”) and commodity pool operators registered under the CEA. PFA is also a commodity trading advisor registered under the CEA.
Michael L. Sapir, Co-Founder, Chief Executive Officer and a listed principal of the Sponsor since August 14, 2008; Co-Founder, Chief Executive Officer and a member of PFA since April 1997, and a listed principal of PFA since November 26, 2012; and Co-Founder, Chief Executive Officer and a member of PSA since January 2005 and a listed principal of PSA since January 14, 2014. As Chief Executive Officer of the Sponsor, PFA and PSA, Mr. Sapir’s responsibilities include oversight of all aspects of the Sponsor, PFA and PSA, respectively.
Louis M. Mayberg, a member and a listed principal of the Sponsor since June 9, 2008; a member of PFA since April 1997 and a listed principal of PFA since November 26, 2012; and a member of PSA since January 2005 and a listed principal of PSA since January 14, 2014. Mr. Mayberg served as Principal Executive Officer of the Trust from June 2008 to December 2013. Mr. Mayberg no longer has oversight responsibilities with respect to the operation of the Sponsor, PFA or PSA.
William E. Seale, Ph.D., a listed principal of the Sponsor since June 11, 1999; a member of PFA since April 1997 and a listed principal of PFA since November 8, 2013; and a member of PSA since April 2005 and a listed principal of PSA since January 14, 2014. He served as Chief Investment Officer of PFA from January 2003 to July 2005 and from October 2006 to June 2008 and as Director of Portfolio from January 1997 to January 2003. He served as Chief Investment Officer of PSA from October 2006 to June 2008. In these roles, Dr. Seale’s responsibilities included oversight of the investment management activities of the respective entities. Dr. Seale no longer has oversight responsibilities with respect to the operation of the Sponsor, PFA or PSA. Dr. Seale is a former commissioner of the CFTC.
Sapir Family Trust, a listed principal of the Sponsor. The Sapir Family Trust has an ownership interest in the Sponsor and PSA. The Sapir Family Trust has a passive ownership interest in the Sponsor and exercises no management authority over the Fund.
Northstar Trust, a listed principal of the Sponsor. Northstar Trust has an ownership interest in the Sponsor and PFA. Northstar Trust has a passive ownership interest in the Sponsor and exercises no management authority over the Fund.
Timothy N. Coakley, Chief Financial Officer and a listed principal of the Sponsor since March 7, 2014; Chief Financial Officer and a listed principal of PFA since March 11, 2014; and Chief Financial Officer and a listed principal of PSA since March 11, 2014. As Chief Financial Officer of the Sponsor, Mr. Coakley’s responsibilities include oversight of the financial matters of the Sponsor. Prior to becoming a listed principal of the Sponsor, Mr. Coakley has served as Chief Financial Officer of the Sponsor and PFA since January of 2000 and PSA since October of 2005.
- 74 -
Table of Contents
Edward J. Karpowicz, Principal Financial Officer of the Trust since July 2008 and a listed principal of the Sponsor since September 18, 2013. Mr. Karpowicz has been employed by PFA since July 2002 and PSA since its inception as Vice President of Financial Administration.
Todd B. Johnson, Principal Executive Officer of the Trust since January 2014; Chief Investment Officer of the Sponsor since February 27, 2009, a registered swap associated person of the Sponsor since January 4, 2013, a registered associated person of the Sponsor since January 29, 2010, and a listed principal of the Sponsor since January 16, 2009. As Principal Executive Officer of the Trust, Mr. Johnson’s responsibilities include oversight of the operations of the Trust. As Chief Investment Officer of the Sponsor, Mr. Johnson’s responsibilities include oversight of the investment management activities of the Sponsor. Mr. Johnson has served as Chief Investment Officer of PFA and PSA since December 2008 and has been registered as an associated person of PFA since December 5, 2012 and listed as a principal of PFA since November 26, 2012. In addition, Mr. Johnson has been listed as a principal and associated person of PSA since January 14, 2014. Mr. Johnson served from 2002 to December 2008 at World Asset Management (a financial services firm), working as President and Chief Investment Officer from January 2006 to December 2008, and as Managing Director and Chief Investment Officer of Quantitative Investments of Munder Capital Management, an asset management firm, from January 2002 to December 2005.
Hratch Najarian, Director, Portfolio Management of the Sponsor since August 2013 and a listed principal of the Sponsor since October 15, 2013. In these roles, Mr. Najarian’s responsibilities include oversight of the investment management activities of the Sponsor. Mr. Najarian also serves as Director, Portfolio Management of PFA and PSA since August 2013, and is listed as a principal of PFA since January 8, 2014 and a principal and associated person of PSA since January 14, 2014. Mr. Najarian served as Senior Portfolio Manager of PSA from December 2009 through September 2013. He also served as Senior Portfolio Manager of PFA from December 2009 through September 2013, as Portfolio Manager of PFA from May 2007 through November 2009, and as Associate Portfolio Manager of PFA from November 2004 through April 2007.
Alexander Illyasov, Senior Portfolio Manager of the Sponsor since August 22, 2016. In this role, Mr. Illyasov’s responsibilities include oversight of the investment management activities of the VIX Futures Funds and certain other series of the Trust. Mr. Illyasov also serves as a Senior Portfolio Manager of PFA since October 2013 and has served as Portfolio Manager of PSA since October 2013.
Jeffrey Ploshnick, Senior Portfolio Manager of the Sponsor since April 12, 2011, a registered associated person and an NFA associate member of the Sponsor since April 12, 2011. In these roles, Mr. Ploshnick’s responsibilities include day-to-day portfolio management of the Currency Funds and certain other series of the Trust. Mr. Ploshnick has been registered as an associated person of PFA since December 5, 2012. Mr. Ploshnick also serves as a Senior Portfolio Manager of PFA since May 2007 and has served as Portfolio Manager from February 2001 to April 2007. In addition, Mr. Ploshnick serves as a Senior Portfolio Manager of PSA since March 2011.
Ryan Dofflemeyer, Portfolio Manager of the Sponsor since January 3, 2011, a registered associated person and an NFA associate member of the Sponsor since October 26, 2010. In these roles, Mr. Dofflemeyer’s responsibilities include day-to-day portfolio management of the Fund and certain other series of the Trust. Mr. Dofflemeyer has been registered as an associated person of PFA since December 5, 2012. Mr. Dofflemeyer also serves as a Portfolio Manager of PFA since August 2007 and was a Portfolio Analyst between October 2003 and August 2007. In addition, Mr. Dofflemeyer also serves as Portfolio Manager for Horizon BetaPro Funds (investment funds) since May 2008 and served as a Portfolio Manager of PSA from March 2010 through September 2013. Mr. Dofflemeyer worked as a Research Assistant for the Investment Company Institute (investment funds trade organization) from September 2001 to August 2003.
Benjamin McAbee, Portfolio Manager of the Sponsor since August 22, 2016, a registered associated person and an NFA associate member of the Sponsor since December 29, 2010. In these roles, Mr. McAbee’s responsibilities include day-to-day portfolio management of certain other series of the Trust. Mr. McAbee has been registered as an associated person of PFA since December 5, 2012. Mr. McAbee also serves as a Portfolio Manager of PFA since August 2016 and has served as an Associate Portfolio Manager from December 2011 to August 2016. In addition, Mr. McAbee serves as a Portfolio Manager of PSA since August 2016.
Victor Frye, a listed principal of the Sponsor since December 2, 2008, a listed principal of PFA since November 26, 2012, and a listed principal of PSA since January 14, 2014. Mr. Frye’s responsibilities include the review and approval of advertising material of the Sponsor. Mr. Frye has been employed as Chief Compliance Officer of PFA since October 2002 and of PSA since December 2004.
- 75 -
Table of Contents
Fiduciary and Regulatory Duties of the Sponsor
The general fiduciary duties, which would otherwise be imposed on the Sponsor (which would make its operation of the Trust as described herein impracticable due to the strict prohibition imposed by such duties on, for example, conflicts of interest on behalf of a fiduciary in its dealings with its beneficiaries), are replaced by the terms of the Trust Agreement (to which terms all shareholders, by subscribing to the Shares, are deemed to consent).
The Trust Agreement provides that the Sponsor and its affiliates shall have no liability to the Trust or to any shareholder for any loss suffered by the Trust arising out of any action or inaction of the Sponsor or its affiliates or their respective directors, officers, shareholders, partners, members, managers or employees (the “Sponsor Related Parties”), if the Sponsor Related Parties, in good faith, determined that such course of conduct was in the best interests of the Fund and such course of conduct did not constitute gross negligence or willful misconduct by the Sponsor Related Parties. The Trust has agreed to indemnify the Sponsor Related Parties against claims, losses or liabilities based on their conduct relating to the Trust, provided that the conduct resulting in the claims, losses or liabilities for which indemnity is sought did not constitute gross negligence or willful misconduct and was done in good faith and in a manner reasonably believed to be in the best interests of the Fund.
Under Delaware law, a beneficial owner of a statutory trust (such as a shareholder of the Fund) may, under certain circumstances, institute legal action on behalf of himself and all other similarly situated beneficial owners (a “class action”) to recover damages for violations of fiduciary duties, or on behalf of a statutory trust (a “derivative action”) to recover damages from a third party where there has been a failure or refusal to institute proceedings to recover such damages. In addition, beneficial owners may have the right, subject to certain legal requirements, to bring class actions in federal court to enforce their rights under the federal securities laws and the rules and regulations promulgated thereunder by the SEC. Beneficial owners who have suffered losses in connection with the purchase or sale of their beneficial interests may be able to recover such losses from the Sponsor where the losses result from a violation by the Sponsor of the anti-fraud provisions of the federal securities laws.
Under certain circumstances, shareholders also have the right to institute a reparations proceeding before the CFTC against the Sponsor (a registered commodity pool operator), an FCM, as well as those of their respective employees who are required to be registered under the CEA, and the rules and regulations promulgated thereunder. Private rights of action are conferred by the CEA. Investors in futures and in commodity pools may, therefore, invoke the protections provided thereunder.
The foregoing summary describing in general terms the remedies available to shareholders under federal law is based on statutes, rules and decisions as of the date of this Prospectus. As this is a rapidly developing and changing area of the law, shareholders who believe that they may have a legal cause of action against any of the foregoing parties should consult their own counsel as to their evaluation of the status of the applicable law at such time.
Ownership or Beneficial Interest in the Fund
As of the date of this Prospectus, the Sponsor did not own any Shares of ProShares UltraShort Gold. As of the date of this Prospectus, none of the principals of the Sponsor have an ownership or beneficial interest in the Fund.
Although the Sponsor and its trading principals (i.e., those principals that are responsible for or oversee the Fund’s trading decisions) do not currently trade or hold commodity interests that could be held by the Fund for their own accounts as of the date of this Prospectus, the Sponsor and its principals reserve the right to trade commodity interests for their own accounts. Fund investors will not be permitted to inspect the records of such person’s trades or any written policies related to such trading.
Management; Voting by Shareholders
The shareholders of the Fund take no part in the management or control, and have no voice in the Trust’s operations or business.
The Sponsor has the right unilaterally to amend the Trust Agreement as it applies to the Fund provided that the shareholders have the right to vote only if expressly required under Delaware or federal law or rules or regulations of NYSE Arca (the Exchange), or if submitted to the shareholders by the Sponsor in its sole discretion. No amendment affecting the Trustee shall be binding upon or effective against the Trustee unless consented to by the Trustee in writing.
Recognition of the Trust and the Fund in Certain States
A number of states do not have “statutory trust” statutes such as that under which the Trust has been formed in the State of Delaware. It is possible, although unlikely, that a court in such a state could hold that, due to the absence of any statutory provision to the contrary in such jurisdiction, the shareholders, although entitled under Delaware law to the same limitation on personal liability as stockholders in a private corporation for profit organized under the laws of the State of Delaware, are not so entitled in such state.
- 76 -
Table of Contents
Possible Repayment of Distributions Received by Shareholders
The Shares are limited liability investments; investors may not lose more than the amount that they invest plus any profits recognized on their investment. However, shareholders of the Fund could be required, as a matter of bankruptcy law, to return to the estate of the Fund any distribution they received at a time when the Fund was in fact insolvent or in violation of the Trust Agreement.
The Shares of the Fund trade on the Exchange and provide institutional and retail investors with direct access to the Fund. The Fund’s Shares may be bought and sold on the Exchange like any other exchange-listed security.
Individual certificates will not be issued for the Shares. Instead, global certificates are deposited by the Trust with DTC and registered in the name of Cede & Co., as nominee for DTC. The global certificates evidence all of the Shares outstanding at any time. Under the Trust Agreement, shareholders are limited to (1) participants in DTC such as banks, brokers, dealers and trust companies (“DTC Participants”), (2) those who maintain, either directly or indirectly, a custodial relationship with a DTC Participant (“Indirect Participants”), and (3) those banks, brokers, dealers, trust companies and others who hold interests in the Shares through DTC Participants or Indirect Participants. The Shares are only transferable through the book-entry system of DTC. Shareholders who are not DTC Participants may transfer their Shares through DTC by instructing the DTC Participant holding their Shares (or by instructing the Indirect Participant or other entity through which their Shares are held) to transfer the Shares. Transfers are made in accordance with standard securities industry practice.
The Sponsor will furnish an annual report of the Fund in the manner required by the rules and regulations of the SEC as well as any reports required by the CFTC and the NFA, including, but not limited to, annual audited financial statements of the Fund examined and certified by independent registered public accountants and any other reports required by any other governmental authority that has jurisdiction over the activities of the Fund. Monthly account statements conforming to CFTC and NFA requirements are posted on the Sponsor’s website at www.ProShares.com. Shareholders of record will also be provided with appropriate information to permit them to file U.S. federal and state income tax returns with respect to Shares held. Additional reports may be posted on the Sponsor’s website at the discretion of the Sponsor or as required by regulatory authorities.
The Sponsor will notify shareholders of any change in the fees paid by the Trust or of any material changes to the Fund by filing with the SEC a supplement to this Prospectus and a Form 8-K, as applicable, which will be publicly available at www.sec.gov and at the Sponsor’s website at www.ProShares.com. Any such notification will include a description of shareholders’ voting rights.
The NAV in respect of the Fund means the total assets of the Fund including, but not limited to, all cash and cash equivalents or other debt securities less total liabilities of the Fund, consistently applied under the accrual method of accounting. In particular, the NAV includes any unrealized profit or loss on open Financial Instruments, and any other credit or debit accruing to the Fund but unpaid or not received by the Fund. The NAV per Share of the Fund is computed by dividing the value of the net assets of the Fund (i.e., the value of its total assets less total liabilities) by its total number of Shares outstanding. Expenses and fees are accrued daily and taken into account for purposes of determining the NAV. The Fund’s NAV is calculated on each day other than a day when the Exchange is closed for regular trading. The Fund computes its NAVs at the time set forth below, or an earlier time as set forth on www.ProShares.com, if necessitated by NYSE, the Exchange or other exchange material to the valuation or operation of the Fund closing early. The Fund’s NAV is calculated only once each trading day.
| Fund |
NAV Calculation Time* | |
| ProShares UltraShort Gold | 10:00 a.m. (Eastern Time) |
| * | For gold, this time may vary due to differences in when daylight savings time is effective between London and New York. The actual times equate to 3:00 p.m. London time for gold. |
In calculating the NAV of the Fund, the settlement value of the Fund’s non-exchange traded Financial Instruments is determined by applying the then-current disseminated levels for the benchmark to the terms of the Fund’s non-exchange traded Financial Instruments. However, in the event that an underlying Reference Asset is not trading due to the operation of daily limits or otherwise, the Sponsor may, in its sole discretion, choose to fair value the Fund’s non-exchange traded Financial Instruments for purposes of the NAV calculation. Such fair value prices would generally be determined based on available inputs about the current value of the underlying Reference Asset and would be based on principles that the Sponsor deems fair and equitable so long as such principles are consistent with normal industry standards.
- 77 -
Table of Contents
Futures contracts traded on a U.S. exchange are calculated at their then current market value, which is based upon last traded price before the NAV time, for that particular futures contract traded on the applicable U.S. exchange on the date with respect to which the NAV is being determined. If a futures contract traded on a U.S. exchange could not be liquidated on such day, due to the operation of daily limits or other rules of the exchange upon which that position is traded or otherwise, the Sponsor may, in its sole discretion, choose to determine a fair value price as the basis for determining the market value of such position for such day. Such fair value prices would generally be determined based on available inputs about the current value of the underlying Reference Assets and would be based on principles that the Sponsor deems fair and equitable so long as such principles are consistent with normal industry standards.
The Fund may use a variety of money market instruments to invest excess cash. Money Market instruments used in this capacity generally will be valued using market prices or at amortized cost.
Indicative Optimized Portfolio Value (“IOPV”)
The IOPV is an indicator of the value of the Fund’s net assets at the time the IOPV is disseminated. The IOPV is calculated and disseminated every 15 seconds throughout the trading day. The IOPV is generally calculated using the prior day’s closing net assets of the Fund as a base and updating throughout the trading day changes in the value of the Financial Instruments held by the Fund. The IOPV should not be viewed as an actual real time update of the NAV because NAV is calculated only once at the end of each trading day. The IOPV also should not be viewed as a precise value of the Shares.
The Exchange disseminates the IOPV. In addition, the IOPV is published on the Exchange’s website and is available through on-line information services such as Bloomberg Finance L.P. and/or Reuters.
The Trust, or, as the case may be, the Fund, may be dissolved at any time and for any reason by the Sponsor with written notice to the shareholders.
The Sponsor does not expect to make distributions. Depending on the Fund’s performance and an investor’s own tax situation, an investor’s income tax liability for his, her or its allocable share of the Fund’s net ordinary income or loss and capital gain or loss may exceed the capital gains an investor may realize from selling his, her or its Shares of the Fund in a taxable year.
The Sponsor and the Trust, on behalf of itself and on behalf of the Fund, have appointed BBH&Co. as the Administrator of the Fund and BBH&Co. has entered into an administrative agency agreement (the “Administrative Agency Agreement”) with the Trust (for itself and on behalf of the Fund) and the Sponsor in connection therewith. In addition, BBH&Co. serves as Transfer Agent of the Fund pursuant to the Administrative Agency Agreement. A copy of the Administrative Agency Agreement is available for inspection at BBH&Co.’s offices identified above.
The Administrator’s fees are paid on behalf of the Fund by the Sponsor.
Pursuant to the terms of the Administrative Agency Agreement and under the supervision and direction of the Sponsor, BBH&Co. prepares and files certain regulatory filings on behalf of the Fund. BBH&Co. may also perform other services for the Fund pursuant to the Administrative Agency Agreement as mutually agreed to from time to time.
The Administrator and any of its affiliates may from time to time purchase or sell Shares for their own account, as agent for their customers and for accounts over which they exercise investment discretion.
The Sponsor, on behalf of the Fund, is expected to retain the services of one or more additional service providers to assist with certain tax reporting requirements of the Fund and its shareholders.
- 78 -
Table of Contents
BBH&Co., a private bank founded in 1818, is not a publicly held company nor is it insured by the Federal Deposit Insurance Corporation. BBH&Co. is authorized to conduct a commercial banking business in accordance with the provisions of Article IV of the New York State Banking Law, New York Banking Law §§ 160 – 181, and is subject to regulation, supervision, and examination by the New York State Banking Department. BBH&Co. is also licensed to conduct a commercial banking business by the Commonwealths of Massachusetts and Pennsylvania and is subject to supervision and examination by the banking supervisors of those states.
BBH&Co. serves as the Custodian of the Fund and has entered into a custodian agreement (the “Custodian Agreement”) with the Trust (for itself and on behalf of the Fund) in connection therewith. Pursuant to the terms of the Custodian Agreement, BBH&Co. is responsible for the holding and safekeeping of assets delivered to it by the Fund, and performing various administrative duties in accordance with instructions delivered to BBH&Co. by the Fund. The Custodian’s fees are paid on behalf of the Fund by the Sponsor.
BBH&Co. serves as the Transfer Agent of the Fund for Authorized Participants and has entered into the Administrative Agency Agreement referred to above in connection therewith. Pursuant to the terms of the Administrative Agency Agreement, BBH&Co. is responsible for processing purchase and redemption orders and maintaining records of the ownership of the Fund. The Transfer Agent fees are paid on behalf of the Fund by the Sponsor.
SEI serves as the Distributor of the Fund and assists the Sponsor and the Administrator with functions and duties relating to distribution and marketing, which include the following: taking creation and redemption orders, and consulting with the marketing staff of the Sponsor and its affiliates with respect to compliance matters in connection with marketing efforts.
SEI retains all marketing materials separately for the Fund, at the offices of SEI, One Freedom Valley Drive, Oaks, Pennsylvania 19456; and its telephone number is (610) 676-1000.
The Sponsor pays SEI for performing its duties on behalf of the Fund.
SEI is a wholly owned subsidiary of SEI Investments Company, which is a public company and a global provider of investment processing, fund processing, and investment management business outsourcing solutions.
THE SECURITIES DEPOSITORY; BOOK-ENTRY ONLY SYSTEM; GLOBAL SECURITY
DTC acts as securities depository for the Shares. DTC is a limited-purpose trust company organized under the laws of the State of New York, a member of the Federal Reserve System, a “clearing corporation” within the meaning of the New York Uniform Commercial Code, and a “clearing agency” registered pursuant to the provisions of section 17A of the 1934 Act. DTC was created to hold securities of DTC Participants and to facilitate the clearance and settlement of transactions in such securities among the DTC Participants through electronic book-entry changes. This eliminates the need for physical movement of securities certificates. DTC Participants include securities brokers and dealers, banks, trust companies, clearing corporations and certain other organizations, some of whom (and/or their representatives) own DTC. Access to the DTC system is also available to others such as banks, brokers, dealers and trust companies that clear through or maintain a custodial relationship with a DTC Participant, either directly or indirectly. DTC has agreed to administer its book-entry system in accordance with its rules and bylaws and the requirements of law.
Individual certificates will not be issued for the Shares. Instead, global certificates are signed by the Sponsor on behalf of the Fund, registered in the name of Cede & Co., as nominee for DTC, and deposited with the Trust on behalf of DTC. The global certificates evidence all of the Shares of the Fund outstanding at any time. The representations, undertakings and agreements made on the part of the Fund in the global certificates are made and intended for the purpose of binding only the Fund and not the Trustee or the Sponsor individually.
Upon the settlement date of any creation, transfer or redemption of Shares, DTC credits or debits, on its book-entry registration and transfer system, the amount of the Shares so created, transferred or redeemed to the accounts of the appropriate DTC Participants. The Sponsor and the Authorized Participants designate the accounts to be credited and charged in the case of creation or redemption of Shares.
- 79 -
Table of Contents
Beneficial ownership of the Shares is limited to DTC Participants, Indirect Participants and persons holding interests through DTC Participants and Indirect Participants. Owners of beneficial interests in the Shares are shown on, and the transfer of ownership is effected only through, records maintained by DTC (with respect to DTC Participants), the records of DTC Participants (with respect to Indirect Participants) and the records of Indirect Participants (with respect to shareholders that are not DTC Participants or Indirect Participants). Shareholders are expected to receive from or through the DTC Participant maintaining the account through which the shareholder has purchased their Shares a written confirmation relating to such purchase.
Shareholders that are not DTC Participants may transfer the Shares through DTC by instructing the DTC Participant or Indirect Participant through which the shareholders hold their Shares to transfer the Shares. Shareholders that are DTC Participants may transfer the Shares by instructing DTC in accordance with the rules of DTC. Transfers are made in accordance with standard securities industry practice.
DTC may decide to discontinue providing its service with respect to Creation Units and/or the Shares of the Fund by giving notice to the Trust and the Sponsor. Under such circumstances, the Sponsor will either find a replacement for DTC to perform its functions at a comparable cost or, if a replacement is unavailable, terminate the Fund.
The rights of the shareholders generally must be exercised by DTC Participants acting on their behalf in accordance with the rules and procedures of DTC. Because the Shares can only be held in book-entry form through DTC and DTC Participants, investors must rely on DTC, DTC Participants and any other financial intermediary through which they hold the Shares to receive the benefits and exercise the rights described in this section. Investors should consult with their broker or financial institution to find out about procedures and requirements for securities held in book-entry form through DTC.
Any participant of the Euroclear System that holds shares of the Fund in the Euroclear System will be deemed to have represented to and agreed with the Fund and Euroclear Bank as a condition to the Fund shares being in the Euroclear System to furnish to the Euroclear Bank (a) its tax identification number, (b) notice of whether it is (i) a person who is not a United States person, (ii) a foreign government, an international organization or any wholly owned agency or instrumentality of either of the foregoing or (iii) a tax exempt identity, and (c) such other information as the Euroclear Bank may request from time to time in order to comply with its United States tax reporting obligations. If a participant in the Euroclear System fails to provide such information, Euroclear Bank may, amongst other courses of action, block trades in the Fund shares and related income distributions of such participant.
SHARE SPLITS OR REVERSE SPLITS
If the Sponsor believes that the per Share price of the Fund in the secondary market has fallen outside a desirable trading price range, the Sponsor may direct the Trust to declare a split or reverse split in the number of Shares outstanding and, if necessary in the Sponsor’s opinion, to make a corresponding change in the number of Shares of the Fund constituting a Creation Unit.
Sponsor
In the course of providing services, the Sponsor may simultaneously recommend the sale of a particular investment position for one account while recommending the purchase of the same investment position for another account if such recommendations are consistent with each client’s investment strategies. The Sponsor also may recommend the purchase or sale of investment positions that may also be recommended by ProShare Advisors LLC and/or ProFund Advisors LLC, affiliate of the Sponsor.
The Sponsor, its principals, officers and employees (and members of their families) and affiliates may participate directly or indirectly as investors in the Sponsor’s clients, such as the Fund. Thus, the Sponsor may recommend to clients the purchase or sale of investment positions in which it, or its officers, employees or related persons have a financial interest. The Sponsor may give advice and take actions in the performance of its duties to its clients that differ from the advice given or the timing and nature of actions taken, with respect to other clients’ accounts and/or employees’ accounts that may invest in some of the same investment positions recommended to clients.
In addition, the Sponsor, its affiliates and principals may trade for their own accounts. Consequently, non-customer and proprietary trades may be executed and cleared through any prime broker or other broker utilized by clients. It is possible that officers or employees of the Sponsor may buy or sell investment positions or other instruments that the Sponsor has recommended to, or
- 80 -
Table of Contents
purchased for, its clients and may engage in transactions for their own accounts in a manner that is inconsistent with the Sponsor’s recommendations to a client. Personal transactions by employees may raise potential conflicts of interest when such persons trade in an investment positions that is owned by, or considered for purchase or sale for, a client. The Sponsor has adopted policies and procedures designed to detect and prevent such conflicts of interest and, when they do arise, to ensure that it effects transactions for clients in a manner that is consistent with any fiduciary duty owned by the Sponsor to its clients and in accordance with applicable law.
FCMs
An FCM or its affiliates may own stock in, or have some other form of ownership interest in, one or more U.S. or foreign exchanges or swap execution facilities (each, a “Trading Facility”) or CFTC-registered derivatives clearing organization (“Clearing House”) where the Fund’s transactions in futures, options on futures, swaps (as defined in the Commodity Exchange Act), forwards or other commodity derivatives (“Contracts”) may be executed and/or cleared. As a result, an FCM or its affiliates may receive financial or other benefits related to its ownership interest when Contracts are executed on a given Trading Facility or cleared through a given Clearing House, and the FCM would, in such circumstances, have an incentive to cause Contracts to be executed on that Trading Facility or cleared by that Clearing House. In addition, employees and officers of an FCM or its affiliates may also serve on the board of directors or on one or more committees of a Trading Facility or Clearing House.
In addition, Trading Facilities and Clearing Houses may from time to time have in place other arrangements that provide their members or participants with volume, market-making or other discounts or credits, may call for members or participants to pre-pay fees based on volume thresholds, or may provide other incentive or arrangements that are intended to encourage market participants to trade on or direct trades to that Trading Facility or Clearing House. An FCM or its affiliates may participate in and obtain financial benefits from such incentive programs.
When providing execution services to the Fund (either in conjunction with clearing services or in an execution-only capacity), an FCM may direct orders to affiliated or unaffiliated market-makers, other executing firms, individual brokers or brokerage groups for execution. When such affiliated or unaffiliated parties are used, they may, where permitted, agree to price concessions, volume discounts or refunds, rebates or similar payments in return for receiving such business. Likewise, where permitted by law and the rules of the applicable Trading Facility, an FCM may solicit a counterparty to trade opposite your order or enter into transactions for its own account or the account of other counterparties that may, at times, be adverse to your interests in a Contract. In such circumstances, that counterparty may make payments and/or pay a commission to the FCM in connection with that transaction. The results of the Fund’s transactions may differ significantly from the results achieved by the FCM for its own account, its affiliates, or for other customers.
In addition, where permitted by applicable law (including, where applicable, the rules of the applicable Trading Facility), an FCM, its directors, officers, employees and affiliates may act on the other side of the Fund’s order or transaction by the purchase or sale for an account, or the execution of a transaction with a counterparty, in which the FCM or a person affiliated with the FCM has a direct or indirect interest, or may effect any such order with a counterparty that provides the FCM or its affiliates with discounts related to fees for Contracts or other products. In cases where an FCM has offered the Fund a discounted commission or clearing fee for Contracts executed through the FCM as agent or with the FCM or its affiliate acting as counterparty, the FCM or its affiliates may be doing so because of the enhanced profit potential resulting from acting as executing broker or counterparty.
An FCM or its affiliates may act as, among other things, an investor, research provider, placement agent, underwriter, distributor, remarketing agent, structurer, securitizer, lender, investment manager, investment adviser, commodity trading advisor, municipal advisor, market maker, trader, prime broker or clearing broker. In those and other capacities, an FCM, its directors, officers, employees and affiliates may take or hold positions in, or advise other customers and counterparties concerning, or publish research or express a view with respect to, a Contract or with a related financial instrument that may not be consistent with, or may be contrary to, the Fund’s interests . Unless otherwise disclosed in writing, an FCM is not necessarily acting in the Fund’s best interest and are not assessing the suitability for the Fund of any Contract or related financial instrument. Acting in one or more of the capacities noted above may give an FCM or its affiliates access to information relating to markets, investments and products. An FCM and its affiliates are under no duty to make any such information available to the Sponsor, except to the extent the FCM has agreed in writing or as may be required under applicable law.
Because the Fund is one series of the Trust and each of the below material contracts covers all the funds that constitute the Trust, the disclosures in this section reference the funds on a collective basis.
- 81 -
Table of Contents
Administrative Agency Agreement
BBH&Co. serves as the Fund’s Administrator pursuant to the terms of the Administrative Agency Agreement among the Trust, on behalf of itself and on behalf of the Fund, the Administrator and the Sponsor. The Administrator performs or supervises the performance of services necessary for the operation and administration of the Fund (other than making investment decisions or providing services provided by other service providers), including the NAV calculations, accounting and other fund administrative services.
- 82 -
Table of Contents
BBH&Co. serves as the Fund’s Transfer Agent. Pursuant to the Administrative Agency Agreement among the Trust, on behalf of itself and on behalf of the Fund, the Transfer Agent and the Sponsor, the Transfer Agent serves as the Fund’s transfer agent and agent in connection with certain other activities as provided under the Administrative Agency Agreement. Under the Administrative Agency Agreement, the Transfer Agent’s services include, among other things, assisting the Fund with the issuance and redemption of Creation Units to and from Authorized Participants, recording the issuance of Creation Units and maintaining a record of the total number of Creation Units that are authorized, issued and outstanding based upon data provided to the Transfer Agent by the Fund or the Sponsor.
The Administrative Agency Agreement has an initial term of one year and, after the initial term, will continue in effect for successive one-year periods unless terminated on at least seventy-five (75) days’ prior written notice by any party to the other parties. Notwithstanding the foregoing, any party may terminate the Administrative Agency Agreement at any time upon thirty (30) days’ prior written notice to the other party if either party is adjudged bankrupt or insolvent, or there shall be commenced against such party a case under any applicable bankruptcy, insolvency or other similar law.
In its capacity as Administrator and Transfer Agent, BBH&Co. is both exculpated and indemnified under the Administrative Agency Agreement.
BBH&Co. serves as the Fund’s Custodian. Pursuant to the Custodian Agreement between the Trust, on its own behalf and on behalf of the Fund, and the Custodian, the Custodian serves as custodian of all securities and cash at any time delivered to the Custodian by the Fund during the term of the Custodian Agreement and has authorized the Custodian to hold its securities in its name or the names of its nominees. Pursuant to the terms of the Custodian Agreement, the Custodian may deposit and/or maintain the investment assets of the Fund in a securities depository and may appoint a subcustodian to hold investment assets of the Fund. The Custodian establishes and maintains one or more securities accounts and cash accounts for the Fund pursuant to the Custodian Agreement. The Custodian maintains separate and distinct books and records segregating the assets of the Fund.
The Custodian Agreement had an initial term of one year. After the initial term, the Custodian Agreement continued and will continue in effect for successive one-year periods unless the Trust, on behalf of the Fund, independently, or the Custodian terminates the Custodian Agreement by giving to the other party a notice in writing specifying the date of such termination, which will not be less than seventy-five (75) days after the date of such notice. In the event of the appointment of a successor custodian, the parties agree that the investment assets of the Fund held by the Custodian or any subcustodian shall be delivered to the successor custodian in accordance with reasonable instructions described in the Custodian Agreement. The parties further agree to cooperate in the execution of documents and performance of other actions necessary or desirable in order to facilitate the succession of the new custodian. If no successor custodian is appointed, the Custodian shall in like manner transfer the Fund’s investment assets in accordance with the instructions set forth in the Custodian Agreement. If no instructions are given as of the effective date of termination, the Custodian may, at any time on or after such termination date and upon ten (10) consecutive calendar days’ written notice to the Fund, either: (1) deliver the investment assets held under the Custodian Agreement to the Fund; or (2) deliver any investment assets held under the Custodian Agreement to a bank or trust company that meets the criteria set forth in the Custodian Agreement, with such delivery being at the risk of the Fund. In the event that investment assets or moneys of the Fund remain in the custody of the Custodian or its subcustodians after the date of termination of the Custodian Agreement due to the failure of the Fund to issue instructions with respect to its disposition or the fact that such disposition could not be accomplished in accordance with such instructions despite diligent efforts of the Custodian, the Custodian shall be entitled to compensation for its services with respect to such investments and moneys during such period as the Custodian or its subcustodians retain possession of such items, and the provisions of the Custody Agreement shall remain in full force and effect until the disposition of the investment assets.
The Custodian is both exculpated and indemnified under the Custodian Agreement.
Pursuant to a distribution agreement (the “Distribution Agreement”) between the Trust and SEI, SEI assists the Sponsor and the Administrator with certain functions and duties relating to distribution and marketing of Shares including reviewing and approving marketing materials.
The Distribution Agreement became effective on the date of the offering of the Shares of the Fund and the Distribution Agreement will continue until December 19, 2014, continuing automatically for successive periods of three years. The Distribution Agreement may be terminated by either party at the end of the initial term or the end of any renewal term on ninety (90) days’ prior written notice. Notwithstanding the foregoing, either party may terminate the Distribution Agreement in the event of a material breach of the agreement by the other party, upon forty-five (45) days’ prior written notice, if such breach is not cured. The Distribution Agreement will automatically terminate in the event of a liquidation of the Trust.
- 83 -
Table of Contents
Each of MLPF&S and RBC, in its capacity as a registered FCM, serves as the Fund’s clearing broker and as such arranges for the execution and clearing of the Fund’s futures transactions. Pursuant to futures account agreements (each, a “Futures Account Agreement”) between MLPF&S and the Fund and RBC and the Fund, the Fund agrees to indemnify and hold harmless each of MLPF&S and RBC, its directors, officers, employees, agents and affiliates from and against all claims, damages, losses and costs (including reasonable attorneys’ fees) incurred by MLPF&S or RBC, as applicable, in connection with: (1) any failure by the Fund to perform its obligations under the Futures Account Agreement and any exercise by MLPF&S or RBC, as applicable, of its rights and remedies thereunder; (2) any failure by the Fund to comply with the applicable law; (3) any action reasonably taken by MLPF&S or RBC, as applicable, or its affiliates or agents to comply with the applicable law; and (4) any reliance by MLPF&S or RBC, as applicable, on any instruction, notice or communication that MLPF&S or RBC, as applicable reasonably believes to originate from a person authorized to act on behalf of the Fund. Also, the Fund agrees to remain liable for and pay to MLPF&S or RBC, as applicable, on demand the amount of any deficiency in the Fund’s Accounts, and the Fund shall reimburse, compensate and indemnify MLPF&S or RBC, as applicable, for any and all costs, losses, penalties, fines, taxes and damages that MLPF&S or RBC, as applicable may incur in collecting such deficiency or otherwise exercising its rights and remedies under the Futures Account Agreement.
The Futures Account Agreement may be terminated at any time by the Fund, or MLPF&S or RBC, as applicable, by written notice to the other.
PURCHASES BY EMPLOYEE BENEFIT PLANS
The following section sets forth certain consequences under the Employee Retirement Income Security Act of 1974, as amended, or ERISA, and the Code, which a fiduciary of an “employee benefit plan” as defined in and subject to ERISA or of a “plan” as defined in and subject to Section 4975 of the Code who has investment discretion should consider before deciding to invest the plan’s assets in the Fund (such “employee benefit plans” and “plans” being referred to herein as “Plans,” and such fiduciaries with investment discretion being referred to herein as “Plan Fiduciaries”). The following summary is not intended to be complete, but only to address certain questions under ERISA and the Code which are likely to be raised by the Plan Fiduciary’s own counsel.
In general, the terms “employee benefit plan” as defined in and subject to Title I of ERISA and “plan” as defined in Section 4975 of the Code together refer to any plan or account of various types which provide retirement benefits or welfare benefits to an individual or to an employer’s employees and their beneficiaries. Such plans and accounts include, but are not limited to, corporate pension and profit-sharing plans, “simplified employee pension plans,” plans for self-employed individuals (including partners), individual retirement accounts described in Section 408 of the Code and medical plans.
Each Plan Fiduciary must give appropriate consideration to the facts and circumstances that are relevant to an investment in the Fund, which may include, among other things, the role that such an investment would play in the Plan’s overall investment portfolio. Each Plan Fiduciary, before deciding to invest in the Fund, must be satisfied that such investment is prudent for the Plan, that the investments of the Plan, including the investment in the Fund, are diversified so as to minimize the risk of large losses and that an investment in the Fund complies with the Plan documents and that the purchase will not result in any non-exempt prohibited transaction under ERISA or Section 4975 of the Code.
EACH PLAN FIDUCIARY CONSIDERING ACQUIRING SHARES ON BEHALF OF A PLAN MUST CONSULT WITH ITS OWN LEGAL AND TAX ADVISORS BEFORE DOING SO. AN INVESTMENT IN THE FUND IS SPECULATIVE AND INVOLVES A HIGH DEGREE OF RISK. THE FUND IS NOT INTENDED AS A COMPLETE INVESTMENT PROGRAM.
ERISA and a regulation issued thereunder by the U.S. Department of Labor contain rules for determining when an investment by a Plan in an equity interest of an entity will result in the underlying assets of such entity being considered to constitute assets of the Plan for purposes of ERISA and Section 4975 of the Code (i.e., “plan assets”). Those rules provide that assets of an entity will not be considered assets of a Plan which purchases an equity interest in the entity if one or more exceptions apply, including (1) an exception applicable if the equity interest purchased is a “publicly-offered security” (the “Publicly-Offered Security Exception”), and (2) an exception applicable if equity interests purchased by a plan are not significant.
- 84 -
Table of Contents
The Publicly-Offered Security Exception applies if the equity interest is a security that is (1) “freely transferable,” (2) part of a class of securities that is “widely held” and (3) either (a) part of a class of securities registered under Section 12(b) or 12(g) of the 1934 Act, or (b) sold to the Plan as part of a public offering pursuant to an effective registration statement under the 1933 Act and the class of which such security is a part is registered under the 1934 Act within 120 days (or such later time as may be allowed by the SEC) after the end of the fiscal year of the issuer in which the offering of such security occurred.
The Trust expects that the Publicly-Offered Security Exception should apply with respect to the Shares of the Fund.
Among other considerations, Shares generally may not be purchased with the assets of a Plan if the Sponsor, the FCMs or any of their respective affiliates, any of their respective employees or any employees of their respective affiliates: (1) has investment discretion with respect to the investment of such plan assets; (2) has authority or responsibility to give or regularly gives investment advice with respect to such plan assets, for a fee, and pursuant to an agreement or understanding that such advice will serve as a primary basis for investment decisions with respect to such plan assets and that such advice will be based on the particular investment needs of the Plan; or (3) is an employer maintaining or contributing to such Plan. A party that is described in clause (1) or (2) of the preceding sentence would be a fiduciary under ERISA and the Code with respect to the Plan, and unless an exemption applies, any such purchase might result in a “prohibited transaction” under ERISA and the Code.
Except as otherwise set forth, the foregoing statements regarding the consequences under ERISA and the Code of an investment in Shares of the Fund are based on the provisions of the Code and ERISA as currently in effect, and the existing administrative and judicial interpretations thereunder. No assurance can be given that administrative, judicial or legislative changes will not occur that will not make the foregoing statements incorrect or incomplete.
THE PERSON WITH INVESTMENT DISCRETION SHOULD CONSULT WITH HIS OR HER ATTORNEY AND FINANCIAL ADVISORS AS TO THE PROPRIETY OF AN INVESTMENT IN SHARES IN LIGHT OF THE CIRCUMSTANCES OF THE PARTICULAR PLAN AND CURRENT TAX LAW.
Most investors buy and sell Shares in secondary market transactions through brokers. Shares of the Fund trade on the Exchange under the ticker symbol listed in this Prospectus. Shares are bought and sold throughout the trading day like other publicly traded securities. When buying or selling Shares through a broker, most investors incur customary brokerage commissions and charges.
The Fund continuously offers Shares in Creation Units to Authorized Participants. Shares of the Fund are to be offered to Authorized Participants in Creation Units at the Fund’s NAV.
Authorized Participants may offer to the public, from time to time, Shares of the Fund from any Creation Units they create. Shares of the Fund offered to the public by Authorized Participants are offered at a per Share market price that varies depending on, among other factors, the trading price of the Shares of the Fund on the Exchange, the NAV per Share and the supply of and demand for the Shares at the time of the offer. Shares initially comprising the same Creation Unit but offered by Authorized Participants to the public at different times may have different offering prices. Additionally, the price at which an Authorized Participant sells a Share may be higher or lower than the price paid by such Authorized Participant in connection with the creation of such Share in a Creation Unit. Authorized Participants do not receive from the Fund, the Sponsor or any of their affiliates, any fee or other compensation in connection with their sale of Shares to the public, although investors are expected to be charged a customary commission by their brokers in connection with the purchase and sale of Shares that varies from investor to investor. Investors are encouraged to review the terms of their brokerage accounts for applicable charges.
As of the date of this Prospectus, ABN AMRO Clearing Chicago LLC, Banca IMI Securities Corp., Barclays Capital Inc., BNP Paribas Securities Corp., Credit Suisse Securities (USA) LLC, Deutsche Bank Securities Inc., EWT, LLC, Goldman, Sachs & Co., Goldman Sachs Execution & Clearing, L.P., HRT Financial LLC, Jefferies LLC, J.P. Morgan Securities Inc., Knight Clearing Services LLC, Merrill Lynch Professional Clearing Corp., Mizuho Securities USA Inc., Newedge USA LLC, Nomura Securities International, Inc., RBC Capital Markets, LLC, SG Americas Securities, LLC, Timber Hill, LLC, UBS Securities LLC, Virtu Financial BD LLC and Wedbush Morgan Securities, Inc. have each executed an Authorized Participant Agreement and are the only Authorized Participants.
- 85 -
Table of Contents
Likelihood of Becoming a Statutory Underwriter
The Fund issues Shares in Creation Units to Authorized Participants from time to time generally in exchange for cash. Because new Shares can be created and issued on an ongoing basis at any point during the life of the Fund, a “distribution,” as such term is used in the 1933 Act, will be occurring. An Authorized Participant, other broker-dealer firm or its client could be deemed a statutory underwriter, and thus would be subject to the prospectus delivery and liability provisions of the 1933 Act, if it purchased a Creation Unit from the Fund, broke the Creation Unit down into the constituent Shares and sold the Shares to its customers; or if it chose to couple the creation of a supply of new Shares with an active selling effort involving solicitation of secondary market demand for the Shares. A determination of whether one is an underwriter must take into account all the facts and circumstances pertaining to the activities of the broker-dealer or its client in the particular case, and the examples mentioned above should not be considered a complete description of all the activities that would lead to categorization as an underwriter. Authorized Participants, other broker-dealers and other persons are cautioned that some of their activities may result in their being deemed participants in a distribution in a manner which would render them statutory underwriters and subject them to the prospectus delivery and liability provisions of the 1933 Act.
Dealers who are neither Authorized Participants nor “underwriters” but are participating in a distribution (as contrasted to ordinary secondary trading transactions), and thus dealing with Shares that are part of an “unsold allotment” within the meaning of section 4(3)(C) of the 1933 Act, would be unable to take advantage of the prospectus delivery exemption provided by section 4(3) of the 1933 Act.
Retail investors may purchase and sell Shares through traditional brokerage accounts. Investors who purchase Shares through a commission/fee-based brokerage account may pay commissions/fees charged by the brokerage account. Investors are encouraged to review the terms of their brokerage accounts for applicable charges.
The offering of Creation Units is being made in compliance with FINRA Rule 2310. Accordingly, the Authorized Participants may not make any sales to any account over which they have discretionary authority without the prior written approval of a purchaser of Shares. In any event, the maximum amount of all items of value, including compensation paid from the offering proceeds and in the form of “trail commissions,” to be paid to FINRA members, including to SEI and PDI, in connection with the offering of the Shares by the Fund will not exceed 10% of gross offering proceeds.
Sidley Austin LLP has advised the Sponsor in connection with the Shares being offered. Sidley Austin LLP also advises the Sponsor with respect to its responsibilities as sponsor of, and with respect to matters relating to, the Trust and the Fund. Sidley Austin LLP has prepared the sections “Material U.S. Federal Income Tax Considerations” with respect to U.S. federal income tax laws and “Purchases By Employee Benefit Plans” with respect to ERISA. Sidley Austin LLP has not represented, nor will it represent, the Trust, the Fund or the shareholders in matters relating to the Trust or the Fund and no other counsel has been engaged to act on their behalf.
Richards, Layton & Finger, P.A. has represented the Trust in connection with the legality of the Shares being offered hereby.
Certain opinions of counsel have been filed with the SEC as exhibits to the Registration Statement of which this Prospectus is a part.
The combined financial statements of ProShares Trust II and the individual financial statements of each of the funds comprising ProShares Trust II as of December 31, 2016 and December 31, 2015 and for each of the three years in the period ended December 31, 2016 and management’s assessment of the effectiveness of internal control over financial reporting of ProShares Trust II and management’s assessment of the effectiveness of internal control over financial reporting of each of the individual funds comprising ProShares Trust II (which assessments are included in Management’s Report on Internal Control over Financial Reporting) as of December 31, 2016 included in this Prospectus have been so included in reliance on the report of PricewaterhouseCoopers LLP, an independent registered public accounting firm, given on the authority of said firm as experts in auditing and accounting.
- 86 -
Table of Contents
WHERE INVESTORS CAN FIND MORE INFORMATION
The Trust has filed a Registration Statement on Form S-1 with the SEC under the 1933 Act. This Prospectus constitutes part of the Registration Statement filed by the Trust for itself and on behalf of the Fund. Additionally, as further discussed under “Incorporation by Reference of Certain Documents,” we have incorporated by reference certain historical information. This Prospectus does not contain all of the information set forth in such Registration Statement, certain portions of which have been omitted pursuant to the rules and regulations of the SEC, including, without limitation, certain exhibits thereto (for example, the form of the Authorized Participant Agreement). The descriptions contained herein of agreements included as exhibits to the Registration Statement are necessarily summaries and may not be complete; the exhibits themselves may be inspected without charge at the Public Reference Room maintained by the SEC at 100 F Street, NE, Washington, DC 20549, and copies of all or part thereof may be obtained from the SEC upon payment of the prescribed fees. Investors may obtain information on the operation of the Public Reference Room by calling the SEC at 1-800-SEC-0330. The SEC maintains a website that contains reports, proxy and information statements and other information regarding registrants that file electronically with the SEC. The address of such site is www.sec.gov.
- 87 -
Table of Contents
Financial Statements for the Funds are included in Appendix B.
- 88 -
Table of Contents
The Trust’s Commitment to Investors
The Sponsor and the Trust are committed to respecting the privacy of personal information investors entrust to the Trust in the course of doing business.
The Information the Trust Collects About Investors
The Sponsor, on behalf of the Trust, collects non-public personal information from various sources. For instance, forms may include names, addresses, and social security numbers. The Fund receives information from transactions in investors’ accounts, including account balances, and from correspondence between investors and the Fund or third parties, such as the Fund’s service providers. The Sponsor, on behalf of the Fund, uses such information provided by investors or their representative to process transactions, to respond to inquiries from investors, to deliver reports, products, and services, and to fulfill legal and regulatory requirements.
How the Trust Handles Investors’ Personal Information
The Sponsor does not disclose any non-public personal information about investors to anyone unless permitted by law or approved by the affected investor. The Sponsor may share information about investors with certain third parties who are not affiliated with the Trust to process or service a transaction that investors have requested or as permitted by law. For example, sharing information with non-affiliated third parties that maintain or service investors’ accounts for the Fund is essential.
The Sponsor may also share information with companies that perform administrative or marketing services for the Fund including research firms. When the Fund enters into such a relationship, such third parties’ use of customer’s information is restricted and they are prohibited from sharing it or using it for any purposes other than those for which they were hired. The Sponsor also requires service providers to maintain physical, electronic and procedural safeguards that comply with federal standards to guard investors’ non-public personal information.
- 89 -
Table of Contents
How the Trust Safeguards Investors’ Personal Information
The Sponsor maintains physical, electronic, and procedural safeguards to protect investors’ personal information. Within the Fund, access to personal information is restricted to those employees who require access to that information in order to provide products or services to customers such as processing transactions and handling inquiries. Use of customer information is restricted and customer information is required to be held in strict confidence.
The Sponsor will adhere to the policies and practices described in this notice for both current and former customers of the Fund.
INCORPORATION BY REFERENCE OF CERTAIN DOCUMENTS
The SEC allows the Trust to “incorporate by reference” into this Prospectus certain information that the Trust files with the SEC, meaning it can disclose important information to an investor by referring to those documents on file with the SEC.
The information that the Trust incorporates by reference is an important part of this Prospectus. The Trust incorporates by reference the documents listed below:
| • | All reports filed pursuant to Section 13(a) or 15(d) of the 1934 Act since December 31, 2015, except for information furnished on Form 8-K, which is not deemed filed and not incorporated herein by reference. |
Any statement contained in a document that is incorporated by reference will be modified or superseded for all purposes to the extent that a statement contained in this Prospectus (or in any other document that is subsequently filed with the SEC and incorporated by reference) modifies or is contrary to that previous statement. Any statement so modified or superseded will not be deemed a part of this Prospectus except as so modified or superseded.
The Trust will provide to you a copy of the filings that have been incorporated by reference in this Prospectus upon your request, at no cost. In addition, the Trust will also provide you with information regarding the other series of the Trust upon your request, at no cost. Any request may be made by writing or calling at the following address or telephone number:
ProShares Trust II
c/o ProShare Capital Management LLC
7501 Wisconsin Avenue
East Tower, 10th Floor
Bethesda, Maryland 20814
Telephone: (240) 497-6400
These documents may also be accessed through the web at www.ProShares.com or as described under “Where Investors Can Find More Information.” The information and other content contained on or linked from the website are not incorporated by reference in this Prospectus and should not be considered a part of this Prospectus.
Annual, quarterly and current reports and other information are on file with the SEC. You may read and copy these materials at the SEC’s Public Reference Room at 100 F Street, NE, Washington, DC 20549. The public may obtain information on the operation of the Public Reference Room by calling the SEC at 1-800-SEC-0330. The SEC maintains an internet site at www.sec.gov that contains reports, proxy and information statements and other information regarding the Trust and the Fund.
- 90 -
Table of Contents
The Glossary below defines certain of the terms and meanings used throughout this Prospectus. Each term also is defined the first time it is used in this Prospectus.
| 1933 Act | Securities Act of 1933, as amended | |
| 1934 Act | Securities Exchange Act of 1934, as amended | |
| 1940 Act | Investment Company Act of 1940, as amended | |
| Administrator | Brown Brothers Harriman & Co., as administrator for the Fund | |
| Advisers Act | The Investment Advisers Act of 1940 | |
| Authorized Participant | Those who may purchase (i.e., create) or redeem Creation Units directly from the Fund | |
| BBH&Co. | Brown Brothers Harriman & Co. | |
| Business Day | Any day on which the NAV of the Fund is determined. | |
| CBOE | Chicago Board Options Exchange, Incorporated | |
| CBOT | Chicago Board of Trade | |
| CEA | Commodity Exchange Act, as amended | |
| CFE | CBOE Futures Exchange | |
| CFTC | United States Commodity Futures Trading Commission | |
| CME | Chicago Mercantile Exchange | |
| Creation Unit | A block of 50,000 Shares that is created for sale by the Trust to Authorized Participants and/or submitted to the Trust for redemption by an Authorized Participant. | |
| Custodian | Brown Brothers Harriman & Co., as custodian for the Fund | |
| Distributor | SEI Investments Distribution Co., as distributor for the Fund | |
| DSTA | Delaware Statutory Trust Act | |
| DTC | Depository Trust Company | |
| Exchange | The exchange on which the Fund is primarily listed and traded (i.e., NYSE Arca). | |
| FCM | Futures Commission Merchant | |
| Financial Instruments | Instruments whose value is derived from the value of an underlying asset, rate or benchmark, including futures contracts, swap agreements, forward contracts and other instruments. | |
| FINRA | Financial Industry Regulatory Authority, Inc. | |
| Fund | ProShares UltraShort Gold, a series of the Trust which is offered herein. | |
| Goldman Sachs | Goldman, Sachs & Co. | |
| ICE | Intercontinental Exchange | |
| IRS | United States Internal Revenue Service | |
| LME | London Metal Exchange | |
| NAV | Net Asset Value | |
| NFA | National Futures Association | |
| NSCC | National Securities Clearing Corporation | |
| NYMEX | New York Mercantile Exchange | |
| NYSE | New York Stock Exchange | |
| NYSE Arca | NYSE Arca Equities, Inc. | |
| Other Fund | A series of the Trust that is not being offered pursuant to this registration statement. | |
Table of Contents
| PDI | ProFunds Distributors, Inc. | |
| PTP | Publicly traded partnership | |
| RBC | RBC Capital Markets, LLC | |
| Reference Asset | The underlying asset that is used to determine the value of a Financial Instrument. | |
| SEC | United States Securities & Exchange Commission | |
| SEI | SEI Investments Distribution Co. | |
| Shares | Common units of beneficial interest that represent units of fractional undivided beneficial interest in and ownership of the Fund. | |
| Sponsor | ProShare Capital Management LLC | |
| Transfer Agent | Brown Brothers Harriman & Co., as transfer agent for the Fund | |
| Trust | ProShares Trust II | |
| Trustee | Wilmington Trust Company | |
| U.S. | United States of America | |
Table of Contents
| Appendix B—Additional Financial and Other Information |
B-1
Table of Contents
B-2
Table of Contents
Market for Registrant’s Common Equity, Related Stockholder Matters and Issuer Purchases of Equity Securities.
| a) | Six of the Funds, ProShares UltraShort Bloomberg Crude Oil, ProShares UltraShort Euro, ProShares UltraShort Yen, ProShares Ultra Bloomberg Crude Oil, ProShares Ultra Euro and ProShares Ultra Yen, commenced trading on the NYSE Arca on November 25, 2008. Four of the Funds, ProShares UltraShort Gold, ProShares UltraShort Silver, ProShares Ultra Gold, and ProShares Ultra Silver, commenced trading on the NYSE Arca on December 3, 2008. Two of the Funds, ProShares VIX Short-Term Futures ETF and ProShares VIX Mid-Term Futures ETF, commenced trading on the NYSE Arca on January 3, 2011. Two of the Funds, ProShares Ultra VIX Short-Term Futures ETF and ProShares Short VIX Short-Term Futures ETF, commenced trading on the NYSE Arca on October 3, 2011. Two of the Funds, ProShares UltraShort Bloomberg Natural Gas and ProShares Ultra Bloomberg Natural Gas, commenced trading on the NYSE Arca on October 4, 2011. One of the Funds, ProShares Short Euro, commenced trading on the NYSE Arca on June 26, 2012. One of the Funds, ProShares UltraShort Australian Dollar, commenced trading on the NYSE Arca on July 17, 2012. The following tables set forth the ranges of reported high and low sales prices of each Fund’s Shares as reported on the NYSE Arca for the periods indicated below. |
Fiscal Year 2016
| Fund |
High | Low | ||||||
| ProShares VIX Short-Term Futures ETF* |
||||||||
| First Quarter |
98.80 | 57.95 | ||||||
| Second Quarter |
62.70 | 42.55 | ||||||
| Third Quarter |
45.25 | 27.75 | ||||||
| Fourth Quarter |
31.59 | 19.82 | ||||||
| ProShares VIX Mid-Term Futures ETF |
||||||||
| First Quarter |
66.66 | 52.71 | ||||||
| Second Quarter |
56.59 | 50.57 | ||||||
| Third Quarter |
52.70 | 45.54 | ||||||
| Fourth Quarter |
46.69 | 41.16 | ||||||
| ProShares Short VIX Short-Term Futures ETF |
||||||||
| First Quarter |
50.88 | 31.23 | ||||||
| Second Quarter |
65.19 | 41.89 | ||||||
| Third Quarter |
79.08 | 49.63 | ||||||
| Fourth Quarter |
97.82 | 64.32 | ||||||
| ProShares Ultra VIX Short-Term Futures ETF*# |
||||||||
| First Quarter |
290.20 | 95.55 | ||||||
| Second Quarter |
110.36 | 47.15 | ||||||
| Third Quarter |
45.80 | 16.03 | ||||||
| Fourth Quarter |
20.39 | 7.63 | ||||||
| ProShares UltraShort Bloomberg Crude Oil# |
||||||||
| First Quarter |
227.5 | 110.68 | ||||||
| Second Quarter |
148.86 | 74.12 | ||||||
| Third Quarter |
119.82 | 78.98 | ||||||
| Fourth Quarter |
97.89 | 63.05 | ||||||
| ProShares UltraShort Bloomberg Natural Gas* |
||||||||
| First Quarter |
84.81 | 42.23 | ||||||
| Second Quarter |
70.63 | 34.06 | ||||||
| Third Quarter |
41.26 | 31.48 | ||||||
| Fourth Quarter |
45.35 | 21.90 | ||||||
| ProShares UltraShort Gold |
||||||||
| First Quarter |
112.34 | 78.41 | ||||||
| Second Quarter |
84.95 | 69.72 | ||||||
B-3
Table of Contents
| Fund |
High | Low | ||||||
| Third Quarter |
71.28 | 65.57 | ||||||
| Fourth Quarter |
94.48 | 70.55 | ||||||
| ProShares UltraShort Silver |
||||||||
| First Quarter |
64.61 | 46.77 | ||||||
| Second Quarter |
52.58 | 31.65 | ||||||
| Third Quarter |
31.01 | 25.41 | ||||||
| Fourth Quarter |
39.79 | 29.52 | ||||||
| ProShares Short Euro |
||||||||
| First Quarter |
44.26 | 41.76 | ||||||
| Second Quarter |
43.79 | 41.03 | ||||||
| Third Quarter |
43.30 | 41.73 | ||||||
| Fourth Quarter |
45.75 | 42.22 | ||||||
| ProShares UltraShort Australian Dollar |
||||||||
| First Quarter |
65.86 | 51.96 | ||||||
| Second Quarter |
58.30 | 49.29 | ||||||
| Third Quarter |
53.67 | 49.17 | ||||||
| Fourth Quarter |
56.16 | 48.06 | ||||||
| ProShares UltraShort Euro |
||||||||
| First Quarter |
26.26 | 23.06 | ||||||
| Second Quarter |
24.84 | 22.46 | ||||||
| Third Quarter |
24.94 | 23.18 | ||||||
| Fourth Quarter |
27.87 | 23.79 | ||||||
| ProShares UltraShort Yen |
||||||||
| First Quarter |
89.81 | 74.50 | ||||||
| Second Quarter |
76.30 | 60.61 | ||||||
| Third Quarter |
67.94 | 58.96 | ||||||
| Fourth Quarter |
82.49 | 60.50 | ||||||
| ProShares Ultra Bloomberg Crude Oil# |
||||||||
| First Quarter |
12.51 | 6.41 | ||||||
| Second Quarter |
14.13 | 7.77 | ||||||
| Third Quarter |
12.59 | 7.84 | ||||||
| Fourth Quarter |
11.77 | 8.30 | ||||||
| ProShares Ultra Bloomberg Natural Gas |
||||||||
| First Quarter |
20.23 | 8.84 | ||||||
| Second Quarter |
17.65 | 10.16 | ||||||
| Third Quarter |
18.54 | 13.33 | ||||||
| Fourth Quarter |
19.94 | 10.88 | ||||||
| ProShares Ultra Gold |
||||||||
| First Quarter |
42.29 | 30.56 | ||||||
| Second Quarter |
45.25 | 37.85 | ||||||
| Third Quarter |
47.79 | 43.64 | ||||||
| Fourth Quarter |
43.80 | 31.88 | ||||||
| ProShares Ultra Silver |
||||||||
| First Quarter |
35.05 | 26.99 | ||||||
| Second Quarter |
47.67 | 30.79 | ||||||
| Third Quarter |
56.55 | 45.49 | ||||||
| Fourth Quarter |
46.34 | 31.36 | ||||||
| ProShares Ultra Euro |
||||||||
| First Quarter |
16.94 | 15.09 | ||||||
| Second Quarter |
17.33 | 15.58 | ||||||
| Third Quarter |
16.59 | 15.44 | ||||||
| Fourth Quarter |
16.08 | 13.54 | ||||||
B-4
Table of Contents
| Fund |
High | Low | ||||||
| ProShares Ultra Yen |
||||||||
| First Quarter |
63.49 | 53.40 | ||||||
| Second Quarter |
69.89 | 60.92 | ||||||
| Third Quarter |
77.07 | 67.58 | ||||||
| Fourth Quarter |
76.15 | 54.00 | ||||||
| * | See Note 1 of the Notes to Financial Statements in Item 15 of Part IV in this Annual Report on Form 10-K |
| # | See Note 9 of the Notes to Financial Statements in Item 15 of Part IV in this Annual Report on Form 10-K. |
Fiscal Year 2015
| Fund |
High | Low | ||||||
| ProShares VIX Short-Term Futures ETF* |
||||||||
| First Quarter |
$ | 124.15 | $ | 81.90 | ||||
| Second Quarter |
87.80 | 56.10 | ||||||
| Third Quarter |
104.85 | 51.60 | ||||||
| Fourth Quarter |
88.40 | 58.95 | ||||||
| ProShares VIX Mid-Term Futures ETF |
||||||||
| First Quarter |
$ | 69.26 | $ | 59.40 | ||||
| Second Quarter |
62.14 | 51.80 | ||||||
| Third Quarter |
70.77 | 49.07 | ||||||
| Fourth Quarter |
64.15 | 51.90 | ||||||
| ProShares Short VIX Short-Term Futures ETF |
||||||||
| First Quarter |
$ | 70.77 | $ | 48.51 | ||||
| Second Quarter |
98.13 | 65.84 | ||||||
| Third Quarter |
97.13 | 41.63 | ||||||
| Fourth Quarter |
64.74 | 43.08 | ||||||
| ProShares Ultra VIX Short-Term Futures ETF*# |
||||||||
| First Quarter |
$ | 4,251.25 | $ | 1,750.00 | ||||
| Second Quarter |
2,001.25 | 783.25 | ||||||
| Third Quarter |
2,281.25 | 608.50 | ||||||
| Fourth Quarter |
1,496.50 | 595.75 | ||||||
| ProShares UltraShort Bloomberg Crude Oil# |
||||||||
| First Quarter |
$ | 55.47 | $ | 33.26 | ||||
| Second Quarter |
43.04 | 25.45 | ||||||
| Third Quarter |
68.59 | 29.40 | ||||||
| Fourth Quarter |
73.85 | 34.96 | ||||||
| ProShares UltraShort Bloomberg Natural Gas* |
||||||||
| First Quarter |
$ | 31.25 | $ | 20.33 | ||||
| Second Quarter |
32.96 | 20.83 | ||||||
| Third Quarter |
32.63 | 22.84 | ||||||
| Fourth Quarter |
74.30 | 31.33 | ||||||
| ProShares UltraShort Gold |
||||||||
| First Quarter |
$ | 105.58 | $ | 81.59 | ||||
| Second Quarter |
100.58 | 90.40 | ||||||
| Third Quarter |
115.85 | 98.09 | ||||||
| Fourth Quarter |
118.85 | 93.48 | ||||||
| ProShares UltraShort Silver* |
||||||||
| First Quarter |
$ | 60.89 | $ | 42.25 | ||||
| Second Quarter |
56.51 | 43.25 | ||||||
| Third Quarter |
66.70 | 53.43 | ||||||
| Fourth Quarter |
66.29 | 47.04 | ||||||
B-5
Table of Contents
| Fund |
High | Low | ||||||
| ProShares Short Euro |
||||||||
| First Quarter |
$ | 46.16 | $ | 40.29 | ||||
| Second Quarter |
45.59 | 41.93 | ||||||
| Third Quarter |
44.21 | 40.26 | ||||||
| Fourth Quarter |
45.14 | 41.52 | ||||||
| ProShares UltraShort Australian Dollar |
||||||||
| First Quarter |
$ | 58.62 | $ | 50.07 | ||||
| Second Quarter |
58.17 | 49.70 | ||||||
| Third Quarter |
66.91 | 55.24 | ||||||
| Fourth Quarter |
64.60 | 57.40 | ||||||
| ProShares UltraShort Euro |
||||||||
| First Quarter |
$ | 28.58 | $ | 21.84 | ||||
| Second Quarter |
27.88 | 23.55 | ||||||
| Third Quarter |
26.20 | 22.26 | ||||||
| Fourth Quarter |
27.18 | 23.04 | ||||||
| ProShares UltraShort Yen |
||||||||
| First Quarter |
$ | 91.49 | $ | 84.06 | ||||
| Second Quarter |
97.60 | 86.80 | ||||||
| Third Quarter |
96.20 | 83.73 | ||||||
| Fourth Quarter |
93.23 | 85.29 | ||||||
| ProShares Ultra Bloomberg Crude Oil# |
||||||||
| First Quarter |
$ | 103.60 | $ | 58.90 | ||||
| Second Quarter |
107.20 | 68.70 | ||||||
| Third Quarter |
87.84 | 34.10 | ||||||
| Fourth Quarter |
54.90 | 23.12 | ||||||
| ProShares Ultra Bloomberg Natural Gas |
||||||||
| First Quarter |
$ | 78.48 | $ | 45.00 | ||||
| Second Quarter |
58.64 | 38.40 | ||||||
| Third Quarter |
48.70 | 31.70 | ||||||
| Fourth Quarter |
32.75 | 12.42 | ||||||
| ProShares Ultra Gold |
||||||||
| First Quarter |
$ | 46.85 | $ | 35.69 | ||||
| Second Quarter |
40.93 | 36.54 | ||||||
| Third Quarter |
37.18 | 31.30 | ||||||
| Fourth Quarter |
37.75 | 29.06 | ||||||
| ProShares Ultra Silver |
|
|||||||
| First Quarter |
$ | 52.29 | $ | 35.37 | ||||
| Second Quarter |
46.83 | 35.47 | ||||||
| Third Quarter |
37.17 | 28.40 | ||||||
| Fourth Quarter |
38.32 | 26.55 | ||||||
| ProShares Ultra Euro |
|
|||||||
| First Quarter |
$ | 19.65 | $ | 14.80 | ||||
| Second Quarter |
17.62 | 14.96 | ||||||
| Third Quarter |
18.19 | 15.63 | ||||||
| Fourth Quarter |
17.48 | 14.67 | ||||||
| ProShares Ultra Yen |
|
|||||||
| First Quarter |
$ | 59.88 | $ | 54.16 | ||||
| Second Quarter |
57.16 | 50.86 | ||||||
| Third Quarter |
58.07 | 51.08 | ||||||
| Fourth Quarter |
56.88 | 52.07 | ||||||
| * | See Note 1 of the Notes to Financial Statements in Item 15 of Part IV in this Annual Report on Form 10-K. |
| # | See Note 9 of the Notes to Financial Statements in Item 15 of Part IV in this Annual Report on Form 10-K. |
B-6
Table of Contents
The approximate number of holders of the Shares of each Fund as of December 31, 2016 was as follows:
| Fund |
Number of Holders | |||
| ProShares VIX Short-Term Futures ETF |
10,801 | |||
| ProShares VIX Mid-Term Futures ETF |
3,312 | |||
| ProShares Short VIX Short-Term Futures ETF |
7,176 | |||
| ProShares Ultra VIX Short-Term Futures ETF |
54,018 | |||
| ProShares UltraShort Bloomberg Crude Oil |
9,561 | |||
| ProShares UltraShort Bloomberg Natural Gas |
508 | |||
| ProShares UltraShort Gold |
2,931 | |||
| ProShares UltraShort Silver |
2,757 | |||
| ProShares Short Euro |
530 | |||
| ProShares UltraShort Australian Dollar |
410 | |||
| ProShares UltraShort Euro |
13,966 | |||
| ProShares UltraShort Yen |
7,651 | |||
| ProShares Ultra Bloomberg Crude Oil |
53,851 | |||
| ProShares Ultra Bloomberg Natural Gas |
3,512 | |||
| ProShares Ultra Gold |
8,995 | |||
| ProShares Ultra Silver |
23,801 | |||
| ProShares Ultra Euro |
2,045 | |||
| ProShares Ultra Yen |
255 | |||
| Total: |
206,080 | |||
The Funds made no distributions to Shareholders during the fiscal year ended December 31, 2016. The Funds have no obligation to make periodic distributions to Shareholders.
b) The Trust initially registered Shares on its Registration Statement on Form S-1 (File No. 333-146801), which was declared effective on November 21, 2008, and registered additional Shares on its Registration Statement on Form S-1 (File No. 333-156888), which was declared effective on February 13, 2009. The Trust terminated these two offerings before the sale of all registered Shares and re-allocated the remaining amount of the registered Shares among the Funds listed on its Registration Statement on Form S-3 (File No. 333-163511), which became effective on December 4, 2009. It then registered additional Shares and/or added Funds pursuant to post-effective amendments to that Registration Statement on Form S-3, which became effective on May 28, 2010, November 5, 2010, December 23, 2010 and April 13, 2011, as well as on a Registration Statement on Form S-1 (File No. 333-178707), which became effective on June 25, 2012. On June 26, 2012, a post-effective amendment to the Registration Statement on Form S-3 (File No. 333-163511) was declared effective, which registered additional Shares for ProShares Ultra Bloomberg Crude Oil and terminated the offerings for certain publicly offered Funds and certain Funds that had never been publicly offered. New offerings for those Funds that had been publicly offered were registered on an accompanying Registration Statement on Form S-1 (File No. 333-176878), which was also declared effective on June 26, 2012. On September 24, 2012, a Registration Statement on Form S-1 (File No. 333-183672) was declared effective, which registered additional Shares for ProShares Ultra VIX Short-Term Futures ETF, ProShares VIX Short-Term Futures ETF and ProShares Short VIX Short-Term Futures ETF. This registration statement (File No. 333-183672) was a combined prospectus and acted as a post-effective amendment to the Form S-1 (File No. 333-176878). On September 27, 2012, a Registration Statement on Form S-3 (File No. 333-183674) was declared effective, which registered additional Shares for ProShares Ultra Bloomberg Crude Oil, ProShares UltraShort Bloomberg Crude Oil and ProShares UltraShort Euro. This registration statement was a combined prospectus and acted as a post-effective amendment to the Form S-3 (File No. 333-163511). On September 28, 2012, a post-effective amendment to a Registration Statement on Form S-1 (File No. 333-178707) was declared effective, terminating the proposed offerings of several unlaunched currency funds. On January 30, 2013, a Registration Statement on Form S-1 (File No. 333-185288) was declared effective. That registration statement, which registered additional Shares to ProShares Short VIX Short-Term Futures ETF, acted as a combined prospectus and post-effective amendment to the Trust’s Form S-1 Registration Statements (File Nos. 333-183672 and 333-178707). Also, on January 30, 2013, a Registration Statement on Form S-3 (File No. 333-185289) was declared effective. That registration statement, which registered additional Shares to ProShares Ultra Bloomberg Crude Oil, ProShares UltraShort Euro, ProShares Ultra VIX Short-Term Futures ETF and ProShares VIX Short-Term Futures ETF, acted as a combined prospectus and post-effective
B-7
Table of Contents
amendment to the Trust’s Form S-1 Registration Statement (File No. 333-193672) and Form S-3 Registration Statement (File No. 333-183674). On April 24, 2013, a post-effective amendment to the Form S-1 Registration Statement (File No. 333-185288) was declared effective, terminating the registered but unlaunched offerings related to: ProShares UltraPro Short Euro. On April 29, 2013, a Registration Statement on Form S-3 (File No. 333-187820) was declared effective, which registered additional Shares for ProShares Ultra Bloomberg Crude Oil, ProShares UltraShort Bloomberg Crude Oil, ProShares Ultra Silver, ProShares UltraShort Silver, ProShares UltraShort Euro, ProShares UltraShort Yen, ProShares Ultra VIX Short-Term Futures ETF and ProShares VIX Short-Term Futures ETF. That registration statement was a combined prospectus and acted as a post-effective amendment to the Form S-3 (File No. 333-185289). On May 21, 2013, a Registration Statement on Form S-1 (File 333-188215) was declared effective, which registered additional Shares for ProShares Ultra Bloomberg Natural Gas, ProShares UltraShort Bloomberg Natural Gas, ProShares Short VIX Short-Term Futures ETF and ProShares VIX Mid-Term Futures ETF. That registration statement was a combined prospectus and acted as a post-effective amendment to the Form S-1 (File No. 333-185288). On July 30, 2013, a Registration Statement on Form S-3 (File No. 333-189967) was declared effective, which registered additional Shares for ProShares Bloomberg Crude Oil and ProShares UltraShort Yen and partially terminated registered and unissued Shares of ProShares Ultra Bloomberg Crude Oil, ProShares Ultra Silver, ProShares UltraShort Silver, ProShares UltraShort Euro and ProShares VIX Short-Term Futures ETF. That registration statement was a combined prospectus and acted as a post-effective amendment to the Form S-3 (File No. 333-187820). On May 6, 2014, a post-effective amendment to the Form S-1 Registration Statement (File No. 333-188215) was declared effective, updating the Form S-1 Registration Statement by, among other things, incorporating by reference the audited financial statements for the fiscal year ended December 31, 2013. The post-effective amendment did not register any additional shares. On July 30, 2014, a Registration Statement on Form S-1 (File No. 333-196884) was declared effective, which partially terminated registered and unissued Shares of ProShares VIX Mid-Term Futures ETF, ProShares Ultra Euro and ProShares Ultra Yen. That registration statement was a combined prospectus and acted as a post-effective amendment to two Form S-1 registration statements (File Nos. 333-188215 and 333-185288). On July 30, 2014, a Registration Statement on Form S-3 (File No. 333-196885) was also declared effective, which registered additional Shares for ProShares Ultra Bloomberg Crude Oil, ProShares UltraShort Bloomberg Crude Oil and ProShares UltraShort Euro and partially terminated registered and unissued Shares of ProShares Ultra Gold, ProShares Ultra Silver and ProShares UltraShort Silver. That Registration Statement also was a combined prospectus and acted as a post-effective amendment to the Form S-3 (File No. 333-189967). Through the July 30, 2014 filings, ProShares Short VIX Short-Term Futures ETF was transferred from the Form S-1 to the Form S-3. On September 29, 2014, a Registration Statement on Form S-1 (File No. 333-198189) was declared effective, which registered a new offering of the Managed Futures Fund and acted as a post-effective amendment to the Form S-1 Registration Statement (File No. 333-196884). On November 25, 2014, a Registration Statement on Form S-1 (File No. 333-199642) was declared effective, which registered additional Shares for ProShares Ultra Bloomberg Natural Gas, ProShares UltraShort Bloomberg Natural Gas and ProShares UltraShort Silver. That registration statement was a combined prospectus and acted as a post-effective amendment to the Form S-1 registration statement (File No. 333-198189) and the Form S-3 registration statement (333-196885). On November 25, 2014, a Registration Statement on Form S-3 (File No. 333-199641) was also declared effective, which registered additional Shares for ProShares Ultra Bloomberg Crude Oil, ProShares Ultra Gold, ProShares UltraShort Gold, ProShares Ultra Silver, ProShares UltraShort Euro, ProShares UltraShort Yen, ProShares Ultra VIX Short-Term Futures ETF, ProShares Short VIX Short-Term Futures ETF and ProShares VIX Short-Term Futures ETF. That Registration Statement also was a combined prospectus and acted as a post-effective amendment to the Form S-3 (File No. 333-196885). Through the November 25, 2014 filings, ProShares UltraShort Silver was transferred from the Form S-3 to the Form S-1. On March 31, 2015, a
B-8
Table of Contents
Registration Statement on Form S-1 (File No. 333-202724) was declared effective, which registered additional Shares for ProShares VIX Mid-Term Futures ETF, ProShares Managed Futures Strategy, ProShares Ultra Bloomberg Commodity, ProShares Ultra Bloomberg Natural Gas, ProShares UltraShort Bloomberg Natural Gas, ProShares UltraShort Silver, ProShares Ultra Australian Dollar, ProShares UltraShort Australian Dollar, ProShares Ultra Euro, ProShares Short Euro and ProShares Ultra Yen. That registration statement was a combined prospectus and acted as a post-effective amendment to the Form S-1 registration statement (File No. 333-199642). On March 31, 2015, a Registration Statement on Form S-3 (File No. 333-202725) was also declared effective, which registered additional Shares for ProShares Ultra Bloomberg Crude Oil, ProShares UltraShort Bloomberg Crude Oil, ProShares Ultra Gold, ProShares UltraShort Gold, ProShares Ultra Silver, ProShares UltraShort Euro, ProShares UltraShort Yen, ProShares Ultra VIX Short-Term Futures ETF, ProShares Short VIX Short-Term Futures ETF and ProShares VIX Short-Term Futures ETF. That Registration Statement also was a combined prospectus and acted as a post-effective amendment to the Form S-3 (File No. 333-199641). On August 11, 2015, a Registration Statement on Form S-1 (File No. 333-202724) was declared effective which removed ProShares Ultra Australian Dollar from the Form S-1. No additional shares were registered. That registration statement was a combined prospectus and acted as a pre-effective amendment to post-effective amendment No. 1 of the Form S-1. Thus, as of December 31, 2015, the Trust continued to have two effective registration statements outstanding: 1) a Form S-1 Registration Statement (No. 333-202724); and 2) a Form S-3 Registration Statement (No. 333-199641).
Substantially all of the proceeds received by each Fund from the issuance and sale of Shares to Authorized Participants are used by each Fund to enter into Financial Instruments relating to that Fund’s benchmark in combination with cash or cash equivalents and/or U.S. Treasury securities or other high credit quality, short-term fixed-income or similar securities (such as shares of money market funds and collateralized repurchase agreements) that may in part be used for direct investment or deposited with the FCMs as margin in connection with futures contracts or in segregated accounts at the Funds’ custodian bank as collateral for swap agreements or forward contracts, as applicable. Each Geared Fund continuously offers and redeems its Shares in blocks of 50,000 Shares, and each Matching VIX Fund continuously offers and redeems Shares in blocks of 25,000 Shares.
| Title of Securities Registered |
Amount Registered As of December 31, 2016 |
Shares Sold For the Three Months Ended December 31, 2016 |
Sale Price of Shares Sold For the Three Months Ended December 31, 2016 |
Shares Sold For the Year Ended December 31, 2016 |
Sale Price of Shares Sold For the Year Ended December 31, 2016 |
|||||||||||||||
| ProShares VIX Short-Term Futures ETF Common Units of Beneficial Interest* |
$ | 1,293,316,711 | 2,275,000 | $ | 53,644,908 | 12,265,000 | $ | 515,131,303 | ||||||||||||
| ProShares VIX Mid-Term Futures ETF Common Units of Beneficial Interest |
$ | 563,939,418 | 150,000 | $ | 6,824,007 | 1,100,000 | $ | 55,230,587 | ||||||||||||
| ProShares Short VIX Short-Term Futures ETF Common Units of Beneficial Interest |
$ | 3,637,796,044 | 8,900,000 | $ | 694,142,241 | 52,950,000 | $ | 2,867,628,691 | ||||||||||||
| ProShares Ultra VIX Short-Term Futures ETF Common Units of Beneficial Interest*# |
$ | 5,829,405,324 | 13,530,000 | $ | 811,415,169 | 28,958,000 | $ | 4,540,375,465 | ||||||||||||
| ProShares UltraShort Bloomberg Crude Oil Common Units of Beneficial Interest# |
$ | 1,459,211,527 | 5,400,000 | $ | 192,273,828 | 18,500,000 | $ | 1,002,034,810 | ||||||||||||
| ProShares UltraShort Bloomberg Natural Gas Common Units of Beneficial Interest* |
$ | 348,379,729 | 100,000 | $ | 2,708,916 | 950,000 | $ | 40,020,426 | ||||||||||||
| ProShares UltraShort Gold Common Units of Beneficial Interest |
$ | 188,646,875 | 50,000 | $ | 4,117,265 | 1,050,000 | $ | 83,353,994 | ||||||||||||
B-9
Table of Contents
| Title of Securities Registered |
Amount Registered As of December 31, 2016 |
Shares Sold For the Three Months Ended December 31, 2016 |
Sale Price of Shares Sold For the Three Months Ended December 31, 2016 |
Shares Sold For the Year Ended December 31, 2016 |
Sale Price of Shares Sold For the Year Ended December 31, 2016 |
|||||||||||||||
| ProShares UltraShort Silver Common Units of Beneficial Interest |
$ | 1,955,587,074 | 50,000 | $ | 1,751,904 | 1,650,000 | $ | 69,113,968 | ||||||||||||
| ProShares Short Euro Common Units of Beneficial Interest |
$ | 153,418,934 | — | $ | — | 50,000 | $ | 2,109,382 | ||||||||||||
| ProShares UltraShort Australian Dollar Common Units of Beneficial Interest |
$ | 172,771,084 | — | $ | — | — | $ | — | ||||||||||||
| ProShares UltraShort Euro Common Units of Beneficial Interest |
$ | 1,955,170,892 | — | $ | — | 650,000 | $ | 15,418,329 | ||||||||||||
| ProShares UltraShort Yen Common Units of Beneficial Interest |
$ | 785,286,665 | 200,000 | $ | 14,691,897 | 2,300,000 | $ | 150,763,218 | ||||||||||||
| ProShares Ultra Bloomberg Crude Oil Common Units of Beneficial Interest# |
$ | 4,410,088,158 | 12,400,000 | $ | 220,355,404 | 62,875,000 | $ | 1,094,604,444 | ||||||||||||
| ProShares Ultra Bloomberg Natural Gas Common Units of Beneficial Interest |
$ | 459,783,760 | 1,250,000 | $ | 16,233,792 | 3,450,000 | $ | 40,783,818 | ||||||||||||
| ProShares Ultra Gold Common Units of Beneficial Interest |
$ | 277,649,678 | 900,000 | $ | 35,154,489 | 1,050,000 | $ | 41,599,776 | ||||||||||||
| ProShares Ultra Silver Common Units of Beneficial Interest |
$ | 1,367,128,153 | 1,300,000 | $ | 48,682,187 | 2,800,000 | $ | 104,165,405 | ||||||||||||
| ProShares Ultra Euro Common Units of Beneficial Interest |
$ | 123,444,588 | 250,000 | $ | 3,797,058 | 300,000 | $ | 4,628,749 | ||||||||||||
| ProShares Ultra Yen Common Units of Beneficial Interest |
$ | 138,726,333 | — | $ | — | — | $ | — | ||||||||||||
| Total: |
$ | 25,119,750,947 | 46,755,000 | $ | 2,105,793,065 | 190,898,000 | $ | 10,626,962,365 | ||||||||||||
| c) | From October 1, 2016 through December 31, 2016, the number of Shares redeemed and average price per Share for each Fund were as follows: |
| Fund |
Total Number of Shares Redeemed |
Average Price Per Share |
||||||
| ProShares VIX Short-Term Futures ETF |
||||||||
| 10/01/16 to 10/31/16 |
150,000 | $ | 29.59 | |||||
| 11/01/16 to 11/30/16 |
1,425,000 | $ | 28.20 | |||||
| 12/01/16 to 12/31/16 |
475,000 | $ | 21.65 | |||||
| ProShares VIX Mid-Term Futures ETF |
||||||||
| 10/01/16 to 10/31/16 |
— | $ | — | |||||
| 11/01/16 to 11/30/16 |
250,000 | $ | 43.05 | |||||
| 12/01/16 to 12/31/16 |
100,000 | $ | 41.80 | |||||
| ProShares Short VIX Short-Term Futures ETF |
||||||||
| 10/01/16 to 10/31/16 |
4,900,000 | $ | 76.59 | |||||
| 11/01/16 to 11/30/16 |
5,300,000 | $ | 81.44 | |||||
| 12/01/16 to 12/31/16 |
3,150,000 | $ | 95.99 | |||||
| ProShares Ultra VIX Short-Term Futures ETF# |
||||||||
| 10/01/16 to 10/31/16 |
4,190,000 | $ | 82.94 | |||||
| 11/01/16 to 11/30/16 |
3,450,000 | $ | 85.67 | |||||
| 12/01/16 to 12/31/16 |
2,770,000 | $ | 44.24 | |||||
B-10
Table of Contents
| ProShares UltraShort Bloomberg Crude Oil# |
||||||||
| 10/01/16 to 10/31/16 |
1,400,000 | $ | 38.25 | |||||
| 11/01/16 to 11/30/16 |
1,800,000 | $ | 46.29 | |||||
| 12/01/16 to 12/31/16 |
600,000 | $ | 33.51 | |||||
| ProShares UltraShort Bloomberg Natural Gas |
||||||||
| 10/01/16 to 10/31/16 |
— | $ | — | |||||
| 11/01/16 to 11/30/16 |
100,000 | $ | 43.21 | |||||
| 12/01/16 to 12/31/16 |
— | $ | — | |||||
| ProShares UltraShort Gold |
||||||||
| 10/01/16 to 10/31/16 |
350,000 | $ | 76.53 | |||||
| 11/01/16 to 11/30/16 |
— | $ | — | |||||
| 12/01/16 to 12/31/16 |
100,000 | $ | 91.21 | |||||
| ProShares UltraShort Silver |
||||||||
| 10/01/16 to 10/31/16 |
500,000 | $ | 33.29 | |||||
| 11/01/16 to 11/30/16 |
250,000 | $ | 31.47 | |||||
| 12/01/16 to 12/31/16 |
100,000 | $ | 37.58 | |||||
| ProShares Short Euro |
||||||||
| 10/01/16 to 10/31/16 |
— | $ | — | |||||
| 11/01/16 to 11/30/16 |
— | $ | — | |||||
| 12/01/16 to 12/31/16 |
— | $ | — | |||||
| ProShares UltraShort Australian Dollar |
||||||||
| 10/01/16 to 10/31/16 |
50,000 | $ | 50.35 | |||||
| 11/01/16 to 11/30/16 |
— | $ | — | |||||
| 12/01/16 to 12/31/16 |
— | $ | — | |||||
| ProShares UltraShort Euro |
||||||||
| 10/01/16 to 10/31/16 |
600,000 | $ | 25.25 | |||||
| 11/01/16 to 11/30/16 |
1,300,000 | $ | 25.64 | |||||
| 12/01/16 to 12/31/16 |
800,000 | $ | 27.14 | |||||
| ProShares UltraShort Yen |
||||||||
| 10/01/16 to 10/31/16 |
— | $ | — | |||||
| 11/01/16 to 11/30/16 |
350,000 | $ | 67.07 | |||||
| 12/01/16 to 12/31/16 |
750,000 | $ | 77.90 | |||||
| ProShares Ultra Bloomberg Crude Oil# |
||||||||
| 10/01/16 to 10/31/16 |
6,975,000 | $ | 22.46 | |||||
| 11/01/16 to 11/30/16 |
550,000 | $ | 20.52 | |||||
| 12/01/16 to 12/31/16 |
11,475,000 | $ | 23.04 | |||||
| ProShares Ultra Bloomberg Natural Gas |
||||||||
| 10/01/16 to 10/31/16 |
250,000 | $ | 16.95 | |||||
| 11/01/16 to 11/30/16 |
100,000 | $ | 15.25 | |||||
| 12/01/16 to 12/31/16 |
800,000 | $ | 17.34 | |||||
| ProShares Ultra Gold |
||||||||
| 10/01/16 to 10/31/16 |
50,000 | $ | 40.87 | |||||
| 11/01/16 to 11/30/16 |
200,000 | $ | 37.13 | |||||
| 12/01/16 to 12/31/16 |
100,000 | $ | 34.64 | |||||
| ProShares Ultra Silver |
||||||||
| 10/01/16 to 10/31/16 |
— | $ | — | |||||
| 11/01/16 to 11/30/16 |
550,000 | $ | 37.66 | |||||
| 12/01/16 to 12/31/16 |
100,000 | $ | 31.71 | |||||
| ProShares Ultra Euro |
||||||||
| 10/01/16 to 10/31/16 |
— | $ | — | |||||
| 11/01/16 to 11/30/16 |
— | $ | — | |||||
| 12/01/16 to 12/31/16 |
— | $ | — | |||||
| ProShares Ultra Yen |
||||||||
| 10/01/16 to 10/31/16 |
— | $ | — | |||||
| 11/01/16 to 11/30/16 |
— | $ | — | |||||
| 12/01/16 to 12/31/16 |
— | $ | — |
| * | See Note 1 of the Notes to Financial Statements in Item 15 of Part IV in this Annual Report on Form 10-K regarding the reverse Share splits for ProShares VIX Short-Term Futures ETF, ProShares Ultra VIX Short-Term Futures ETF and the Share splits for ProShares UltraShort Bloomberg Natural Gas. |
| # | See Note 9 of the Notes to Financial Statements in Item 15 of Part IV in this Annual Report on Form 10-K regarding the reverse Share splits for ProShares Ultra Bloomberg Crude Oil and ProShares Ultra VIX Short-Term Futures ETF and the Share split for ProShares UltraShort Bloomberg Crude Oil. |
B-11
Table of Contents
Selected Financial Data.
Financial Highlights for the years ended December 31, 2016, 2015, 2014, 2013 and 2012 for each Fund, as applicable, are summarized below and should be read in conjunction with the Funds’ audited financial statements, and the notes and schedules related thereto, which are included in this Annual Report on Form 10-K.
PROSHARES VIX SHORT-TERM FUTURES ETF
| Year Ended December 31, 2016 |
Year Ended December 31, 2015 |
Year Ended December 31, 2014 |
Year Ended December 31, 2013 |
Year Ended December 31, 2012 |
||||||||||||||||
| Total assets |
$ | 174,247,783 | $ | 105,350,240 | $ | 111,540,076 | $ | 279,169,502 | $ | 183,678,945 | ||||||||||
| Total shareholders’ equity at end of period |
174,160,146 | 105,272,823 | 111,459,325 | 270,398,554 | 137,657,464 | |||||||||||||||
| Net investment income (loss) |
(1,436,647 | ) | (1,150,794 | ) | (1,118,548 | ) | (1,584,119 | ) | (1,053,112 | ) | ||||||||||
| Net realized and unrealized gain (loss) |
(194,856,158 | ) | (26,753,742 | ) | 22,228,972 | (161,051,480 | ) | (159,588,720 | ) | |||||||||||
| Net income (loss) |
(196,292,805 | ) | (27,904,536 | ) | 21,110,424 | (162,635,599 | ) | (160,641,832 | ) | |||||||||||
| Net increase (decrease) in net asset value per share* |
(45.00 | ) | (38.45 | ) | (38.03 | ) | (277.00 | ) | (1,489.68 | ) | ||||||||||
| PROSHARES VIX MID-TERM FUTURES ETF
|
| |||||||||||||||||||
| Year Ended December 31, 2016 |
Year Ended December 31, 2015 |
Year Ended December 31, 2014 |
Year Ended December 31, 2013 |
Year Ended December 31, 2012 |
||||||||||||||||
| Total assets |
$ | 47,936,506 | $ | 27,671,016 | $ | 29,430,266 | $ | 56,501,754 | $ | 89,824,581 | ||||||||||
| Total shareholders’ equity at end of period |
45,818,914 | 27,650,638 | 21,459,575 | 51,134,323 | 37,302,992 | |||||||||||||||
| Net investment income (loss) |
(294,491 | ) | (240,600 | ) | (386,478 | ) | (546,566 | ) | (786,167 | ) | ||||||||||
| Net realized and unrealized gain (loss) |
(12,029,971 | ) | (3,939,933 | ) | (9,219,527 | ) | (31,648,251 | ) | (70,590,582 | ) | ||||||||||
| Net income (loss) |
(12,324,462 | ) | (4,180,533 | ) | (9,606,005 | ) | (32,194,817 | ) | (71,376,749 | ) | ||||||||||
| Net increase (decrease) in net asset value per share |
(11.82 | ) | (9.64 | ) | (13.58 | ) | (61.62 | ) | (157.76 | ) | ||||||||||
| PROSHARES SHORT VIX SHORT-TERM FUTURES ETF
|
| |||||||||||||||||||
| Year Ended December 31, 2016 |
Year Ended December 31, 2015 |
Year Ended December 31, 2014 |
Year Ended December 31, 2013 |
Year Ended December 31, 2012 |
||||||||||||||||
| Total assets |
$ | 228,630,598 | $ | 674,236,256 | $ | 541,342,389 | $ | 141,868,875 | $ | 95,411,974 | ||||||||||
| Total shareholders’ equity at end of period |
228,075,387 | 642,811,361 | 506,556,124 | 141,751,202 | 82,663,633 | |||||||||||||||
| Net investment income (loss) |
(5,396,850 | ) | (5,798,200 | ) | (4,285,469 | ) | (1,328,369 | ) | (437,699 | ) | ||||||||||
| Net realized and unrealized gain (loss) |
419,316,869 | 96,936,157 | 52,474,493 | 96,687,035 | 11,731,268 | |||||||||||||||
| Net income (loss) |
413,920,019 | 91,137,957 | 48,189,024 | 95,358,666 | 11,293,569 | |||||||||||||||
| Net increase (decrease) in net asset value per share |
40.42 | (10.59 | ) | (6.10 | ) | 34.43 | 20.13 | |||||||||||||
B-12
Table of Contents
PROSHARES ULTRA VIX SHORT-TERM FUTURES ETF
| Year Ended December 31, 2016 |
Year Ended December 31, 2015 |
Year Ended December 31, 2014 |
Year Ended December 31, 2013 |
Year Ended December 31, 2012 |
||||||||||||||||
| Total assets |
$ | 552,972,566 | $ | 560,771,363 | $ | 358,364,869 | $ | 229,779,878 | $ | 156,387,315 | ||||||||||
| Total shareholders’ equity at end of period |
515,758,754 | 547,708,740 | 351,789,953 | 226,233,584 | 84,716,132 | |||||||||||||||
| Net investment income (loss) |
(8,936,777 | ) | (7,410,148 | ) | (5,359,486 | ) | (4,828,761 | ) | (3,001,646 | ) | ||||||||||
| Net realized and unrealized gain (loss) |
(1,587,220,286 | ) | (419,888,086 | ) | (75,812,141 | ) | (432,159,208 | ) | (506,284,763 | ) | ||||||||||
| Net income (loss) |
(1,596,157,063 | ) | (427,298,234 | ) | (81,171,627 | ) | (436,987,969 | ) | (509,286,409 | ) | ||||||||||
| Net increase (decrease) in net asset value per share*# |
(658.62 | ) | (2,434.37 | ) | (5,249.07 | ) | (92,227.44 | ) | (3,193,091.35 | ) | ||||||||||
| PROSHARES ULTRASHORT BLOOMBERG CRUDE OIL
|
| |||||||||||||||||||
| Year Ended December 31, 2016 |
Year Ended December 31, 2015 |
Year Ended December 31, 2014 |
Year Ended December 31, 2013 |
Year Ended December 31, 2012 |
||||||||||||||||
| Total assets |
$ | 213,341,677 | $ | 96,858,373 | $ | 173,193,149 | $ | 258,594,876 | $ | 96,137,916 | ||||||||||
| Total shareholders’ equity at end of period |
200,958,303 | 95,897,894 | 169,210,110 | 256,060,149 | 89,481,266 | |||||||||||||||
| Net investment income (loss) |
(1,408,964 | ) | (2,166,211 | ) | (2,415,841 | ) | (2,544,628 | ) | (1,078,664 | ) | ||||||||||
| Net realized and unrealized gain (loss) |
(90,265,381 | ) | 57,732,875 | 145,729,447 | (6,221,827 | ) | 35,047,625 | |||||||||||||
| Net income (loss) |
(91,674,345 | ) | 55,566,664 | 143,313,606 | (8,766,455 | ) | 33,968,961 | |||||||||||||
| Net increase (decrease) in net asset value per share# |
(34.90 | ) | 27.61 | 23.12 | (4.28 | ) | 0.74 | |||||||||||||
| PROSHARES ULTRASHORT BLOOMBERG NATURAL GAS
|
| |||||||||||||||||||
| Year Ended December 31, 2016 |
Year Ended December 31, 2015 |
Year Ended December 31, 2014 |
Year Ended December 31, 2013 |
Year Ended December 31, 2012 |
||||||||||||||||
| Total assets |
$ | 4,042,309 | $ | 11,260,804 | $ | 14,698,814 | $ | 22,744,708 | $ | 12,780,598 | ||||||||||
| Total shareholders’ equity at end of period |
4,038,794 | 10,462,856 | 14,688,564 | 22,734,767 | 12,768,340 | |||||||||||||||
| Net investment income (loss) |
(122,172 | ) | (177,124 | ) | (460,907 | ) | (209,360 | ) | (196,407 | ) | ||||||||||
| Net realized and unrealized gain (loss) |
2,578,744 | 8,800,372 | 11,696,119 | (1,952,152 | ) | 241,864 | ||||||||||||||
| Net income (loss) |
2,456,572 | 8,623,248 | 11,235,212 | (2,161,512 | ) | 45,457 | ||||||||||||||
| Net increase (decrease) in net asset value per share* |
(23.43 | ) | 18.54 | 4.67 | (10.73 | ) | 2.31 | |||||||||||||
B-13
Table of Contents
PROSHARES ULTRASHORT GOLD
| Year Ended December 31, 2016 |
Year Ended December 31, 2015 |
Year Ended December 31, 2014 |
Year Ended December 31, 2013 |
Year Ended December 31, 2012 |
||||||||||||||||
| Total assets |
$ | 63,709,441 | $ | 75,031,735 | $ | 84,214,601 | $ | 154,835,279 | $ | 92,495,298 | ||||||||||
| Total shareholders’ equity at end of period |
63,653,647 | 74,971,764 | 81,861,762 | 139,436,456 | 92,416,742 | |||||||||||||||
| Net investment income (loss) |
(461,423 | ) | (703,582 | ) | (857,817 | ) | (1,175,860 | ) | (1,106,213 | ) | ||||||||||
| Net realized and unrealized gain (loss) |
(11,000,717 | ) | 16,807,446 | (13,246,612 | ) | 63,024,399 | (39,758,386 | ) | ||||||||||||
| Net income (loss) |
(11,462,140 | ) | 16,103,864 | (14,104,429 | ) | 61,848,539 | (40,864,599 | ) | ||||||||||||
| Net increase (decrease) in net asset value per share |
(24.55 | ) | 19.23 | (6.87 | ) | 39.65 | (18.84 | ) | ||||||||||||
| PROSHARES ULTRASHORT SILVER
|
| |||||||||||||||||||
| Year Ended December 31, 2016 |
Year Ended December 31, 2015 |
Year Ended December 31, 2014 |
Year Ended December 31, 2013 |
Year Ended December 31, 2012 |
||||||||||||||||
| Total assets |
$ | 23,037,206 | $ | 56,035,123 | $ | 53,254,791 | $ | 115,311,683 | $ | 105,882,964 | ||||||||||
| Total shareholders’ equity at end of period |
23,017,656 | 55,987,938 | 53,007,867 | 112,989,686 | 100,656,703 | |||||||||||||||
| Net investment income (loss) |
(255,853 | ) | (516,464 | ) | (585,841 | ) | (973,304 | ) | (1,403,142 | ) | ||||||||||
| Net realized and unrealized gain (loss) |
(20,928,956 | ) | 14,943,700 | 17,926,873 | 91,898,519 | (51,826,102 | ) | |||||||||||||
| Net income (loss) |
(21,184,809 | ) | 14,427,236 | 17,341,032 | 90,925,215 | (53,229,244 | ) | |||||||||||||
| Net increase (decrease) in net asset value per share |
(27.27 | ) | 6.77 | 12.92 | 19.19 | (12.64 | ) | |||||||||||||
| PROSHARES SHORT EURO
|
| |||||||||||||||||||
| Year Ended December 31, 2016 |
Year Ended December 31, 2015 |
Year Ended December 31, 2014 |
Year Ended December 31, 2013 |
Year Ended December 31, 2012 |
||||||||||||||||
| Total assets |
$ | 15,859,440 | $ | 17,524,993 | $ | 14,032,932 | $ | 8,903,836 | $ | 3,804,040 | ||||||||||
| Total shareholders’ equity at end of period |
15,770,088 | 17,510,898 | 14,021,804 | 8,896,842 | 3,763,040 | |||||||||||||||
| Net investment income (loss) |
(122,728 | ) | (178,761 | ) | (118,247 | ) | (51,170 | ) | (17,891 | ) | ||||||||||
| Net realized and unrealized gain (loss) |
553,281 | 1,417,580 | 2,011,540 | (359,542 | ) | (219,269 | ) | |||||||||||||
| Net income (loss) |
430,553 | 1,238,819 | 1,893,293 | (410,712 | ) | (237,160 | ) | |||||||||||||
| Net increase (decrease) in net asset value per share |
1.28 | 3.72 | 4.48 | (2.04 | ) | (2.37 | ) | |||||||||||||
B-14
Table of Contents
PROSHARES ULTRASHORT AUSTRALIAN DOLLAR
| Year Ended December 31, 2016 |
Year Ended December 31, 2015 |
Year Ended December 31, 2014 |
Year Ended December 31, 2013 |
Year Ended December 31, 2012 |
||||||||||||||||
| Total assets |
$ | 16,658,768 | $ | 20,477,446 | $ | 23,139,187 | $ | 28,091,462 | $ | 3,832,949 | ||||||||||
| Total shareholders’ equity at end of period |
16,613,473 | 20,460,679 | 23,120,790 | 27,983,279 | 3,780,999 | |||||||||||||||
| Net investment income (loss) |
(145,652 | ) | (209,987 | ) | (213,183 | ) | (159,424 | ) | (16,229 | ) | ||||||||||
| Net realized and unrealized gain (loss) |
(1,183,820 | ) | 3,166,384 | 2,121,121 | 3,553,299 | (202,972 | ) | |||||||||||||
| Net income (loss) |
(1,329,472 | ) | 2,956,397 | 1,907,938 | 3,393,875 | (219,201 | ) | |||||||||||||
| Net increase (decrease) in net asset value per share |
(3.08 | ) | 7.08 | 4.74 | 8.83 | (2.19 | ) | |||||||||||||
| PROSHARES ULTRASHORT EURO
|
| |||||||||||||||||||
| Year Ended December 31, 2016 |
Year Ended December 31, 2015 |
Year Ended December 31, 2014 |
Year Ended December 31, 2013 |
Year Ended December 31, 2012 |
||||||||||||||||
| Total assets |
$ | 356,811,359 | $ | 556,539,359 | $ | 519,833,940 | $ | 438,217,450 | $ | 553,957,981 | ||||||||||
| Total shareholders’ equity at end of period |
349,392,650 | 522,306,518 | 517,191,349 | 418,001,115 | 526,778,026 | |||||||||||||||
| Net investment income (loss) |
(2,764,657 | ) | (5,000,587 | ) | (3,994,145 | ) | (4,375,512 | ) | (7,447,508 | ) | ||||||||||
| Net realized and unrealized gain (loss) |
19,174,666 | 86,176,969 | 114,182,807 | (48,644,550 | ) | (33,586,639 | ) | |||||||||||||
| Net income (loss) |
16,410,009 | 81,176,382 | 110,188,662 | (53,020,062 | ) | (41,034,147 | ) | |||||||||||||
| Net increase (decrease) in net asset value per share |
1.54 | 3.95 | 4.53 | (1.96 | ) | (1.32 | ) | |||||||||||||
| PROSHARES ULTRASHORT YEN
|
| |||||||||||||||||||
| Year Ended December 31, 2016 |
Year Ended December 31, 2015 |
Year Ended December 31, 2014 |
Year Ended December 31, 2013 |
Year Ended December 31, 2012 |
||||||||||||||||
| Total assets |
$ | 277,139,658 | $ | 261,207,696 | $ | 534,061,601 | $ | 590,489,940 | $ | 409,067,507 | ||||||||||
| Total shareholders’ equity at end of period |
276,781,747 | 237,372,900 | 531,471,873 | 588,121,516 | 408,563,630 | |||||||||||||||
| Net investment income (loss) |
(1,609,562 | ) | (3,623,678 | ) | (3,741,601 | ) | (4,398,231 | ) | (2,184,694 | ) | ||||||||||
| Net realized and unrealized gain (loss) |
8,431,035 | (3,541,134 | ) | 96,873,706 | 155,319,469 | 69,835,696 | ||||||||||||||
| Net income (loss) |
6,821,473 | (7,164,812 | ) | 93,132,105 | 150,921,238 | 67,651,002 | ||||||||||||||
| Net increase (decrease) in net asset value per share |
(7.70 | ) | (1.39 | ) | 18.47 | 20.11 | 9.80 | |||||||||||||
B-15
Table of Contents
PROSHARES ULTRA BLOOMBERG CRUDE OIL
| Year Ended December 31, 2016 |
Year Ended December 31, 2015 |
Year Ended December 31, 2014 |
Year Ended December 31, 2013 |
Year Ended December 31, 2012 |
||||||||||||||||
| Total assets |
$ | 962,419,733 | $ | 859,276,004 | $ | 532,881,413 | $ | 143,904,994 | $ | 499,982,244 | ||||||||||
| Total shareholders’ equity at end of period |
933,731,860 | 783,922,475 | 450,562,988 | 142,773,429 | 483,508,964 | |||||||||||||||
| Net investment income (loss) |
(6,631,380 | ) | (8,473,155 | ) | (1,766,364 | ) | (2,196,281 | ) | (3,248,430 | ) | ||||||||||
| Net realized and unrealized gain (loss) |
225,050,768 | (863,611,244 | ) | (368,561,922 | ) | 68,042,170 | (17,357,813 | ) | ||||||||||||
| Net income (loss) |
218,419,388 | (872,084,399 | ) | (370,328,286 | ) | 65,845,889 | (20,606,243 | ) | ||||||||||||
| Net increase (decrease) in net asset value per share# |
(1.81 | ) | (76.33 | ) | (219.42 | ) | 26.96 | (114.89 | ) | |||||||||||
| PROSHARES ULTRA BLOOMBERG NATURAL GAS
|
| |||||||||||||||||||
| Year Ended December 31, 2016 |
Year Ended December 31, 2015 |
Year Ended December 31, 2014 |
Year Ended December 31, 2013 |
Year Ended December 31, 2012 |
||||||||||||||||
| Total assets |
$ | 44,767,860 | $ | 38,879,917 | $ | 80,051,311 | $ | 68,626,038 | $ | 77,963,078 | ||||||||||
| Total shareholders’ equity at end of period |
43,203,386 | 38,851,184 | 70,433,207 | 62,915,779 | 73,019,370 | |||||||||||||||
| Net investment income (loss) |
(384,486 | ) | (761,335 | ) | (528,581 | ) | (821,690 | ) | (566,310 | ) | ||||||||||
| Net realized and unrealized gain (loss) |
13,794,133 | (59,570,610 | ) | (37,694,009 | ) | 41,585,400 | (5,825,840 | ) | ||||||||||||
| Net income (loss) |
13,409,647 | (60,331,945 | ) | (38,222,590 | ) | 40,763,710 | (6,392,150 | ) | ||||||||||||
| Net increase (decrease) in net asset value per share |
0.28 | (43.08 | ) | (93.70 | ) | (0.84 | ) | (251.71 | ) | |||||||||||
| PROSHARES ULTRA GOLD
|
| |||||||||||||||||||
| Year Ended December 31, 2016 |
Year Ended December 31, 2015 |
Year Ended December 31, 2014 |
Year Ended December 31, 2013 |
Year Ended December 31, 2012 |
||||||||||||||||
| Total assets |
$ | 96,632,172 | $ | 72,172,441 | $ | 104,091,956 | $ | 141,039,466 | $ | 350,986,079 | ||||||||||
| Total shareholders’ equity at end of period |
92,127,200 | 69,864,815 | 102,003,345 | 132,017,405 | 335,054,752 | |||||||||||||||
| Net investment income (loss) |
(650,951 | ) | (796,424 | ) | (1,157,348 | ) | (1,925,215 | ) | (3,169,265 | ) | ||||||||||
| Net realized and unrealized gain (loss) |
3,617,098 | (22,915,651 | ) | (784,329 | ) | (156,804,545 | ) | 31,641,746 | ||||||||||||
| Net income (loss) |
2,966,147 | (23,712,075 | ) | (1,941,677 | ) | (158,729,760 | ) | 28,472,481 | ||||||||||||
| Net increase (decrease) in net asset value per share |
3.17 | (10.27 | ) | (1.25 | ) | (42.51 | ) | 7.85 | ||||||||||||
B-16
Table of Contents
PROSHARES ULTRA SILVER
| Year Ended December 31, 2016 |
Year Ended December 31, 2015 |
Year Ended December 31, 2014 |
Year Ended December 31, 2013 |
Year Ended December 31, 2012 |
||||||||||||||||
| Total assets |
$ | 296,979,700 | $ | 239,160,686 | $ | 305,793,515 | $ | 468,353,977 | $ | 894,123,114 | ||||||||||
| Total shareholders’ equity at end of period |
275,779,940 | 216,416,642 | 291,169,743 | 465,479,519 | 747,725,400 | |||||||||||||||
| Net investment income (loss) |
(2,179,392 | ) | (2,507,859 | ) | (3,968,608 | ) | (5,280,707 | ) | (6,918,157 | ) | ||||||||||
| Net realized and unrealized gain (loss) |
63,914,077 | (88,492,326 | ) | (165,444,157 | ) | (558,275,777 | ) | (32,752,438 | ) | |||||||||||
| Net income (loss) |
61,734,685 | (91,000,185 | ) | (169,412,765 | ) | (563,556,484 | ) | (39,670,595 | ) | |||||||||||
| Net increase (decrease) in net asset value per share |
6.38 | (12.31 | ) | (23.96 | ) | (108.56 | ) | (0.87 | ) | |||||||||||
| PROSHARES ULTRA EURO
|
| |||||||||||||||||||
| Year Ended December 31, 2016 |
Year Ended December 31, 2015 |
Year Ended December 31, 2014 |
Year Ended December 31, 2013 |
Year Ended December 31, 2012 |
||||||||||||||||
| Total assets |
$ | 12,500,772 | $ | 12,437,492 | $ | 3,089,736 | $ | 2,626,494 | $ | 4,876,503 | ||||||||||
| Total shareholders’ equity at end of period |
11,914,585 | 10,857,730 | 2,981,441 | 2,603,827 | 4,870,316 | |||||||||||||||
| Net investment income (loss) |
(74,522 | ) | (104,071 | ) | (22,247 | ) | (35,024 | ) | (60,126 | ) | ||||||||||
| Net realized and unrealized gain (loss) |
(1,039,312 | ) | (1,274,395 | ) | (625,043 | ) | 224,084 | 207,279 | ||||||||||||
| Net income (loss) |
(1,113,834 | ) | (1,378,466 | ) | (647,290 | ) | 189,060 | 147,153 | ||||||||||||
| Net increase (decrease) in net asset value per share |
(1.49 | ) | (4.36 | ) | (6.16 | ) | 1.68 | 0.46 | ||||||||||||
| PROSHARES ULTRA YEN
|
| |||||||||||||||||||
| Year Ended December 31, 2016 |
Year Ended December 31, 2015 |
Year Ended December 31, 2014 |
Year Ended December 31, 2013 |
Year Ended December 31, 2012 |
||||||||||||||||
| Total assets |
$ | 5,887,949 | $ | 5,483,876 | $ | 2,135,192 | $ | 2,960,724 | $ | 4,739,474 | ||||||||||
| Total shareholders’ equity at end of period |
5,540,957 | 5,473,848 | 2,118,028 | 2,795,026 | 4,227,995 | |||||||||||||||
| Net investment income (loss) |
(45,847 | ) | (44,423 | ) | (20,862 | ) | (31,774 | ) | (44,440 | ) | ||||||||||
| Net realized and unrealized gain (loss) |
113,155 | (196,091 | ) | (396,529 | ) | (1,544,017 | ) | (1,198,640 | ) | |||||||||||
| Net income (loss) |
67,308 | (240,514 | ) | (417,391 | ) | (1,575,791 | ) | (1,243,080 | ) | |||||||||||
| Net increase (decrease) in net asset value per share |
0.68 | (1.72 | ) | (18.05 | ) | (38.21 | ) | (33.15 | ) | |||||||||||
| * | See Note 1 of the Notes to Financial Statements in Item 15 of Part IV in this Annual Report on Form 10-K. |
| # | See Note 9 of the Notes to Financial Statements in Item 15 of Part IV in this Annual Report on Form 10-K. |
| Item 7. | Management’s Discussion and Analysis of Financial Condition and Results of Operations. |
This information should be read in conjunction with the financial statements and notes to the financial statements included with this Annual Report on Form 10-K. The discussion and analysis that follows may contain statements that relate to future events or future performance. In some cases, such forward-looking statements can be identified by terminology such as “will,” “may,” “should,” “expect,” “plan,” “anticipate,” “believe,” “estimate,” “predict,” “potential” or the negative of these terms or other comparable terminology. None of the Trust, the Sponsor or the Trustee assumes responsibility for the accuracy or completeness of any forward-looking statements. Except as expressly required by federal securities laws, none of the Trust, the Sponsor or the Trustee is under a duty to update any of the forward-looking statements to conform such statements to actual results or to a change in expectations or predictions.
B-17
Table of Contents
Introduction
As further described in Item 1 in this Annual Report on Form 10-K, each “Short” Fund seeks daily investment results (before fees and expenses) that correspond to the inverse (-1x) of the daily performance of its corresponding benchmark. Each “UltraShort” Fund seeks daily investment results (before fees and expenses) that correspond to two times the inverse (-2x) of the daily performance of its corresponding benchmark. Each “Ultra” Fund seeks daily investment results (before fees and expenses) that correspond to two times (2x) the daily performance of its corresponding benchmark. Each Matching VIX Fund seeks investment results (before fees and expenses), both over a single day and over time, that match the performance of its corresponding benchmark. Daily performance is measured from the calculation of one NAV to the next.
Each of the Funds generally invests in Financial Instruments (i.e., instruments whose value is derived from the value of an underlying asset, rate or index), including futures contracts, swap agreements, forward contracts and other instruments as a substitute for investing directly in commodities, currencies, or spot volatility products in order to gain exposure to its applicable underlying commodity futures index, commodity, currency exchange rate or equity volatility index. Financial Instruments also are used to produce economically “inverse,” “inverse leveraged” or “leveraged” investment results for the Geared Funds.
Each Geared Fund seeks investment results for a single day only, not for longer periods. This is different from most exchange-traded funds and means that the return of such Fund for a period longer than a single trading day will be the result of each day’s returns compounded over the period, and usually will differ from -1x, -2x or 2x, of the return of the Geared Fund’s benchmark for that period. Longer holding periods, higher benchmark volatility, inverse exposure and greater leverage each affect the impact of compounding on a Geared Fund’s returns. Daily compounding of a Geared Fund’s investment returns can dramatically and adversely affect its longer-term performance during periods of high volatility. Geared Funds are riskier than similarly benchmarked exchange-traded funds that are not geared. Accordingly, these funds may not be suitable for all investors and should be used only by knowledgeable investors who understand the potential consequences of seeking daily, leveraged, inverse or inverse leveraged investment results. Shareholders who invest in the Geared Funds should actively manage and monitor their investments, as frequently as daily.
The Matching VIX Funds seek results that, both over a single day and over time, match (before fees and expenses) the performance of its index. If the Matching VIX Fund is successful in meeting its objective, its value (before fees and expenses) should gain approximately as much on a percentage basis as the level of the applicable VIX Futures Index when the index rises. Conversely, its value (before fees and expenses) should lose approximately as much on a percentage basis as the level of the applicable VIX Futures Index when the index declines. The Matching VIX Funds seeks to obtain investment exposure to its benchmark through the relevant futures contracts.
Liquidity and Capital Resources
In order to collateralize derivatives positions in indices, commodities or currencies, a significant portion of the NAV of each Fund is held in cash and/or U.S. Treasury securities, agency securities, or other high credit quality short term fixed-income or similar securities (such as shares of money market funds, bank deposits, bank money market accounts, certain variable rate-demand notes and repurchase agreements collateralized by government securities, whether denominated in U.S. dollars or the applicable foreign currency with respect to a Currency Fund). A portion of these investments may be posted as collateral in connection with swap agreements and each Fund’s trading in futures and forward contracts. The percentage that U.S. Treasury bills and other short-term fixed-income securities bear to the shareholders’ equity of each Fund varies from period to period as the market values of the underlying swaps, futures contracts and forward contracts change. During the years ended December 31, 2016, 2015 and 2014, each of the Funds earned interest income as follows:
B-18
Table of Contents
Interest Income
| Fund |
Interest Income Year Ended December 31, 2016 |
Interest Income Year Ended December 31, 2015 |
Interest Income Year Ended December 31, 2014 |
|||||||||
| ProShares VIX Short-Term Futures ETF |
$ | 466,392 | $ | 42,319 | $ | 47,562 | ||||||
| ProShares VIX Mid-Term Futures ETF |
107,409 | 8,293 | 16,573 | |||||||||
| ProShares Short VIX Short-Term Futures ETF |
1,126,057 | 180,686 | 81,544 | |||||||||
| ProShares Ultra VIX Short-Term Futures ETF |
1,639,964 | 156,187 | 72,700 | |||||||||
| ProShares UltraShort Bloomberg Crude Oil |
500,160 | 60,884 | 110,620 | |||||||||
| ProShares UltraShort Bloomberg Natural Gas |
19,053 | 5,830 | 16,306 | |||||||||
| ProShares UltraShort Gold |
164,570 | 31,999 | 40,675 | |||||||||
| ProShares UltraShort Silver |
93,483 | 23,831 | 30,901 | |||||||||
| ProShares Short Euro |
32,959 | 4,504 | 4,716 | |||||||||
| ProShares UltraShort Australian Dollar |
43,459 | 5,998 | 8,225 | |||||||||
| ProShares UltraShort Euro |
1,012,886 | 264,845 | 199,596 | |||||||||
| ProShares UltraShort Yen |
531,771 | 135,814 | 197,253 | |||||||||
| ProShares Ultra Bloomberg Crude Oil |
2,170,633 | 396,158 | 68,292 | |||||||||
| ProShares Ultra Bloomberg Natural Gas |
72,943 | 20,167 | 15,961 | |||||||||
| ProShares Ultra Gold |
249,319 | 42,700 | 54,755 | |||||||||
| ProShares Ultra Silver |
842,215 | 156,353 | 179,642 | |||||||||
| ProShares Ultra Euro |
25,015 | 2,797 | 1,083 | |||||||||
| ProShares Ultra Yen |
16,858 | 3,609 | 1,101 | |||||||||
Each Fund’s underlying swaps, futures, forward contracts and foreign currency forward contracts, as applicable, may be subject to periods of illiquidity because of market conditions, regulatory considerations and other reasons. For example, swaps and forward contracts are not traded on an exchange, do not have uniform terms and conditions, and in general are not transferable without the consent of the counterparty. In the case of futures contracts, commodity exchanges may limit fluctuations in certain futures contract prices during a single day by regulations referred to as “daily limits.” During a single day, no futures trades may be executed at prices beyond the daily limit. Once the price of a futures contract has increased or decreased by an amount equal to the daily limit, positions in such futures contracts can neither be taken nor liquidated unless the traders are willing to effect trades at or within the limit. Futures contract prices have occasionally moved to the daily limit for several consecutive days with little or no trading. Such market conditions could prevent a Fund from promptly liquidating its futures positions.
Entry into swap agreements or forward contracts may further impact liquidity because these contractual agreements are executed “off-exchange” between private parties and, therefore, the time required to offset or “unwind” these positions may be greater than that for exchange-traded instruments. This potential delay could be exacerbated to the extent a counterparty is not a United States person.
The large size of the positions which a Fund may acquire increases the risk of illiquidity by both making their positions more difficult to liquidate and increasing the losses incurred while trying to do so. Any type of disruption or illiquidity will potentially be exacerbated due to the fact that the Funds will typically invest in Financial Investments related to one benchmark, which in many cases is highly concentrated.
Because each Fund may enter into swaps and may trade futures and forward contracts, its capital is at risk due to changes in the value of these contracts (market risk) or the inability of counterparties to perform under the terms of the contracts (credit risk).
Market Risk
Trading in derivatives contracts involves each Fund entering into contractual commitments to purchase or sell a commodity, currency or spot volatility product underlying the Fund’s benchmark at a specified date and price, should it hold such derivatives contract into the deliverable period. Should a Fund enter into a contractual commitment to sell a physical commodity, currency or spot volatility product, it would be required to make delivery of that commodity, currency or spot volatility product at the contract price and then repurchase the contract at
B-19
Table of Contents
prevailing market prices or settle in cash. Since the repurchase price to which the value of a commodity, currency or spot volatility product can rise is unlimited, entering into commitments to sell commodities, currencies or spot volatility products would expose a Fund to theoretically unlimited risk.
For more information, see “Item 7A. Quantitative and Qualitative Disclosures About Market Risk” in this Annual Report on Form 10-K.
Credit Risk
When a Fund enters into swap agreements, futures contracts or forward contracts, the Fund is exposed to credit risk that the counterparty to the contract will not meet its obligations.
The counterparty for futures contracts traded on United States and most foreign futures exchanges as well as certain swaps is the clearing house associated with the particular exchange. In general, clearing houses are backed by their corporate members who may be required to share in the financial burden resulting from the nonperformance by one of their members and, as such, should significantly reduce this credit risk. In cases where the clearing house is not backed by the clearing members (i.e., some foreign exchanges, which may become applicable in the future), it may be backed by a consortium of banks or other financial institutions.
Certain swap and forward agreements are contracted for directly with counterparties. There can be no assurance that any counterparty, clearing member or clearing house will meet its obligations to a Fund.
Swap agreements do not generally involve the delivery of underlying assets either at the outset of a transaction or upon settlement. Accordingly, if the counterparty to an uncleared swap agreement defaults, the Fund’s risk of loss typically consists of the net amount of payments that the Fund is contractually entitled to receive, if any. Swap counterparty risk is generally limited to the amount of any unrealized gains, although in the event of a counterparty bankruptcy, there could be delays and costs associated with recovery collateral posted in segregated tri-party accounts at the Fund’s custodian bank.
Forward agreements do not involve the delivery of assets at the onset of a transaction, but may be settled physically in the underlying asset if such contracts are held to expiration, particularly in the case of currency forwards. Thus, prior to settlement, if the counterparty to a forward contract defaults, a Fund’s risk of loss will generally consist of the net amount of payments that the Fund is contractually entitled to receive, if any. However, if physically settled forwards are held until expiration (presently, there is no plan to do this), at the time of settlement, a Fund may be at risk for the full notional value of the forward contracts depending on the type of settlement procedures used.
The Sponsor attempts to minimize certain of these market and credit risks by normally:
| • | executing and clearing trades with creditworthy counterparties, as determined by the Sponsor; |
| • | limiting the outstanding amounts due from counterparties to the Funds; |
| • | not posting margin directly with a counterparty; |
| • | requiring that the counterparty posts collateral in amounts approximately equal to that owed to the Funds, as marked to market daily, subject to certain minimum thresholds; |
| • | limiting the amount of margin or premium posted at a futures commission merchant (“FCM”); and |
| • | ensuring that deliverable contracts are not held to such a date when delivery of the underlying asset could be called for. |
B-20
Table of Contents
Off-Balance Sheet Arrangements and Contractual Obligations
As of February 22, 2017, the Funds have not used, nor do they expect to use in the future, special purpose entities to facilitate off-balance sheet financing arrangements and have no loan guarantee arrangements or off-balance sheet arrangements of any kind other than agreements entered into in the normal course of business, which may include indemnification provisions related to certain risks service providers undertake in performing services which are in the best interests of the Funds. While each Fund’s exposure under such indemnification provisions cannot be estimated, these general business indemnifications are not expected to have a material impact on a Fund’s financial position.
Management fee payments made to the Sponsor are calculated as a fixed percentage of each Fund’s NAV. As such, the Sponsor cannot anticipate the amount of payments that will be required under these arrangements for future periods as NAVs are not known until a future date. The agreement with the Sponsor may be terminated by either party upon 30 days written notice to the other party.
Critical Accounting Policies
The Trust’s and the Funds’ critical accounting policies are as follows:
Preparation of the financial statements and related disclosures in compliance with accounting principles generally accepted in the United States of America requires the application of appropriate accounting rules and guidance, as well as the use of estimates. The Trust’s and the Funds’ application of these policies involves judgments and actual results may differ from the estimates used.
Each Fund has significant exposure to Financial Instruments. The Funds hold a significant portion of their assets in swaps, futures, forward contracts or foreign currency forward contracts, all of which are recorded on a trade date basis and at fair value in the financial statements, with changes in fair value reported in the Statements of Operations.
The use of fair value to measure Financial Instruments, with related unrealized gains or losses recognized in earnings in each period, is fundamental to the Trust’s and the Funds’ financial statements. The fair value of a Financial Instrument is the amount that would be received to sell an asset or paid to transfer a liability in an orderly transaction between market participants at the measurement date (the exit price).
For financial reporting purposes, the Funds value transactions based upon the final closing price in their primary markets. Accordingly, the investment valuations in these financial statements may differ from those used in the calculation of certain Funds’ final creation/redemption NAV for the year ended December 31, 2016.
Short-term investments are valued at amortized cost which approximates fair value for daily NAV purposes. For financial reporting purposes, short-term investments are valued at their market price using information provided by a third-party pricing service or market quotations.
Derivatives (e.g., futures contracts, swap agreements, forward agreements and foreign currency forward contracts) are generally valued using independent sources and/or agreements with counterparties or other procedures as determined by the Sponsor. Futures contracts, except for those entered into by the Gold, Silver, Australian Dollar and Short Euro Funds, are generally valued at the last settled price on the applicable exchange on which that future trades. Futures contracts entered into by the Gold, Silver, Australian Dollar and Short Euro Funds are valued at the last sales price prior to the time at which the NAV per Share of a Fund is determined. For financial reporting purposes, all futures contracts are valued at last settled price. If there was no sale on that day, and for non-exchange-traded derivatives, the Sponsor may in its sole discretion choose to determine a fair value price as the basis for determining the market value of such position for such day. Such fair value prices would be generally determined based on available inputs about the current value of the underlying financial instrument or commodity and would be based on principles that the Sponsor deems fair and equitable so long as such principles are consistent with normal industry standards. When market closing prices are not available, the Sponsor may fair value an asset of a Fund pursuant to the policies the Sponsor has adopted, which are consistent with normal industry standards.
B-21
Table of Contents
Fair value pricing may require subjective determinations about the value of an investment. While each Leveraged and VIX Fund’s policy is intended to result in a calculation of the Leveraged or the VIX Fund’s NAV that fairly reflects investment values as of the time of pricing, the Leveraged and the VIX Funds cannot ensure that fair values determined by the Sponsor or persons acting at their direction would accurately reflect the price that the Leveraged or the VIX Fund could obtain for an investment if it were to dispose of that investment as of the time of pricing (for instance, in a forced or distressed sale).
The prices used by the Leveraged or the VIX Fund may differ from the value that would be realized if the investments were sold and the differences could be material to the financial statements.
The Funds disclose the fair value of their investments in a hierarchy that prioritizes the inputs to valuation techniques used to measure fair value. See Note 2 in the Financial Statements in this Annual Report on Form 10-K for further information.
Discounts on short-term securities purchased are amortized and reflected as Interest Income in the Statements of Operations.
Realized gains (losses) and changes in unrealized gain (loss) on open positions are determined on a specific identification basis and recognized in the Statements of Operations in the period in which the contract is closed or the changes occur, respectively.
Each Fund pays its respective brokerage commissions, including applicable exchange fees, NFA fees, give-up fees, pit brokerage fees and other transaction related fees and expenses charged in connection with trading activities for each Fund’s investment in U.S. Commodity Futures Trading Commission regulated investments. Brokerage commissions on futures contracts are recognized on a half-turn basis. Through July 30, 2014, the Sponsor paid brokerage commissions on VIX futures contracts for the Matching VIX Funds. On July 31, 2014, the Sponsor began paying, and is currently paying, brokerage commissions on VIX futures contracts for the Matching VIX Funds that exceed variable create/redeem fees collected by more than 0.02% of the Matching VIX Fund’s average net assets annually.
Results of Operations for the Year Ended December 31, 2016 Compared to the Years Ended December 31, 2015 and 2014
ProShares VIX Short-Term Futures ETF*
Fund Performance
The following table provides summary performance information for the Fund for the years ended December 31, 2016, 2015 and 2014:
| Year Ended December 31, 2016 |
Year Ended December 31, 2015 |
Year Ended December 31, 2014 |
||||||||||
| NAV beginning of period |
$ | 105,272,823 | $ | 111,459,325 | $ | 270,398,554 | ||||||
| NAV end of period |
$ | 174,160,146 | $ | 105,272,823 | $ | 111,459,325 | ||||||
| Percentage change in NAV |
65.4 | % | (5.6 | )% | (58.8 | )% | ||||||
| Shares outstanding beginning of period |
1,589,962 | 1,064,962 | 1,894,962 | |||||||||
| Shares outstanding end of period |
8,209,451 | 1,589,962 | 1,064,962 | |||||||||
| Percentage change in shares outstanding |
416.3 | % | 49.3 | % | (43.8 | )% | ||||||
| Shares created |
12,265,000 | 2,495,000 | 2,115,000 | |||||||||
| Shares redeemed |
5,645,511 | 1,970,000 | 2,945,000 | |||||||||
| Per share NAV beginning of period |
$ | 66.21 | $ | 104.66 | $ | 142.69 | ||||||
| Per share NAV end of period |
$ | 21.21 | $ | 66.21 | $ | 104.66 | ||||||
| Percentage change in per share NAV |
(68.0 | )% | (36.7 | )% | (26.7 | )% | ||||||
| Percentage change in benchmark |
(67.8 | )% | (36.1 | )% | (25.5 | )% | ||||||
| Benchmark annualized volatility |
72.5 | % | 78.6 | % | 61.4 | % | ||||||
B-22
Table of Contents
During the year ended December 31, 2016, the increase in the Fund’s NAV resulted primarily from an increase from 1,589,962 outstanding Shares at December 31, 2015 to 8,209,451 outstanding Shares at December 31, 2016. The increase in the Fund’s NAV was offset by the cumulative effect of the Fund seeking daily investment results (before fees and expenses) that correspond to the daily performance of the S&P 500 VIX Short-Term Futures Index. By comparison, during the year ended December 31, 2015 the decrease in the Fund’s NAV resulted from the cumulative effect of the Fund seeking daily investment results (before fees and expenses) that correspond to the daily performance of the S&P 500 VIX Short-Term Futures Index. The decrease in the Fund’s NAV was offset by an increase from 1,064,962 outstanding Shares at December 31, 2014 to 1,589,962 outstanding Shares at December 31, 2015. By comparison, during the year ended December 31, 2014, the decrease in the Fund’s NAV resulted primarily from a decrease from 1,894,962 outstanding Shares at December 31, 2013 to 1,064,962 outstanding Shares at December 31, 2014. The decrease in the Fund’s NAV also resulted in part from the cumulative effect of the Fund seeking daily investment results (before fees and expenses) that correspond to the daily performance of the S&P 500 VIX Short-Term Futures Index.
For the years ended December 31, 2016, 2015 and 2014, the Fund’s daily performance had a statistical correlation over 0.99 of the daily performance of its benchmark. The Fund’s per Share NAV decrease of 68.0% for the year ended December 31, 2016, as compared to the Fund’s per Share NAV decrease of 36.7% for the year ended December 31, 2015, was primarily due to a greater decline in prices of the first and second month VIX futures during the year ended December 31, 2016. The Fund’s per Share NAV decrease of 36.7% for the year ended December 31, 2015, as compared to the Fund’s per Share NAV decrease of 26.7% for the year ended December 31, 2014, was primarily due to a greater decline in prices of the first and second month VIX futures during the year ended December 31, 2015.
During the year ended December 31, 2016, the Fund’s per Share NAV reached its high for the year on February 11, 2016 at $97.95 per Share and reached its low for the year on December 27, 2016 at $19.78 per Share. By comparison, during the year ended December 31, 2015, the Fund’s per Share NAV reached its high for the year on January 15, 2015 at $120.75 per Share and reached its low for the year on August 10, 2015 at $51.75 per Share. By comparison, during the year ended December 31, 2014, the Fund’s per Share NAV reached its high for the year on February 5, 2014 at $181.25 per Share and reached its low for the year on December 5, 2014 at $86.25 per Share.
The benchmark’s decline of 67.8% for the year ended December 31, 2016, as compared to the benchmark’s decline of 36.1% for the year ended December 31, 2015, can be attributed to a greater decline in prices of the near-term futures contracts on the VIX futures curve during the year ended December 31, 2016. The benchmark’s decline of 36.1% for the year ended December 31, 2015, as compared to the benchmark’s decline of 25.5% for the year ended December 31, 2014, can be attributed to a greater decline in prices of the near-term futures contracts on the VIX futures curve during the year ended December 31, 2015.
Net Income/Loss
The following table provides summary income information for the Fund for the years ended December 31, 2016, 2015 and 2014:
| Year Ended December 31, 2016 |
Year Ended December 31, 2015 |
Year Ended December 31, 2014 |
||||||||||
| Net investment income (loss) |
$ | (1,436,647 | ) | $ | (1,150,794 | ) | $ | (1,118,548 | ) | |||
| Management fee |
1,632,880 | 1,062,171 | 1,083,189 | |||||||||
| Brokerage commission |
270,159 | 130,942 | 82,921 | |||||||||
| Net realized gain (loss) |
(195,469,141 | ) | (19,406,840 | ) | (682,105 | ) | ||||||
| Change in net unrealized appreciation/depreciation |
612,983 | (7,346,902 | ) | 22,911,077 | ||||||||
| Net income (loss) |
$ | (196,292,805 | ) | $ | (27,904,536 | ) | $ | 21,110,424 | ||||
B-23
Table of Contents
The Fund’s net income decreased for the year ended December 31, 2016, as compared to the year ended December 31, 2015, primarily due to a greater decline in the futures prices and benchmark volatility during the year ended December 31, 2016. By comparison, the Fund’s net income decreased for the year ended December 31, 2015, as compared to the year ended December 31, 2014, primarily due to a greater decline in the futures prices and benchmark volatility during the year ended December 31, 2015.
| * | See Note 1 of the Notes to Financial Statements in Item 15 of part IV in this Annual Report on Form 10-K regarding the reverse Share split for the ProShares VIX Short-Term Futures ETF. |
ProShares VIX Mid-Term Futures ETF
Fund Performance
The following table provides summary performance information for the Fund for the years ended December 31, 2016, 2015 and 2014:
| Year Ended December 31, 2016 |
Year Ended December 31, 2015 |
Year Ended December 31, 2014 |
||||||||||
| NAV beginning of period |
$ | 27,650,638 | $ | 21,459,575 | $ | 51,134,323 | ||||||
| NAV end of period |
$ | 45,818,914 | $ | 27,650,638 | $ | 21,459,575 | ||||||
| Percentage change in NAV |
65.7 | % | 28.8 | % | (58.0 | )% | ||||||
| Shares outstanding beginning of period |
512,404 | 337,404 | 662,501 | |||||||||
| Shares outstanding end of period |
1,087,403 | 512,404 | 337,404 | |||||||||
| Percentage change in shares outstanding |
112.2 | % | 51.9 | % | (49.1 | )% | ||||||
| Shares created |
1,100,000 | 325,000 | 593,750 | |||||||||
| Shares redeemed |
525,001 | 150,000 | 918,847 | |||||||||
| Per share NAV beginning of period |
$ | 53.96 | $ | 63.60 | $ | 77.18 | ||||||
| Per share NAV end of period |
$ | 42.14 | $ | 53.96 | $ | 63.60 | ||||||
| Percentage change in per share NAV |
(21.9 | )% | (15.2 | )% | (17.6 | )% | ||||||
| Percentage change in benchmark |
(21.0 | )% | (14.3 | )% | (16.5 | )% | ||||||
| Benchmark annualized volatility |
33.4 | % | 38.8 | % | 29.1 | % | ||||||
During the year ended December 31, 2016, the increase in the Fund’s NAV resulted from an increase from 512,404 outstanding Shares at December 31, 2015 to 1,087,403 outstanding Shares at December 31, 2016. The increase in the Fund’s NAV was offset by the cumulative effect of the Fund seeking daily investment results (before fees and expenses) that correspond to the daily performance of the S&P 500 VIX Mid-Term Futures Index. By comparison, during the year ended December 31, 2015, the increase in the Fund’s NAV resulted from an increase from 337,404 outstanding Shares at December 31, 2014 to 512,404 outstanding Shares at December 31, 2015. The increase in the Fund’s NAV was offset by the cumulative effect of the Fund seeking daily investment results (before fees and expenses) that correspond to the daily performance of the S&P 500 VIX Mid-Term Futures Index. By comparison, during the year ended December 31, 2014, the decrease in the Fund’s NAV resulted primarily from a decrease from 662,501 outstanding Shares at December 31, 2013 to 337,404 outstanding Shares at December 31, 2014. The decrease in the Fund’s NAV also resulted in part from the cumulative effect of the Fund seeking daily investment results (before fees and expenses) that correspond to the daily performance of the S&P 500 VIX Mid-Term Futures Index.
For the years ended December 31, 2016, 2015 and 2014, the Fund’s daily performance had a statistical correlation over 0.99 of the daily performance of its benchmark. The Fund’s per Share NAV decrease of 21.9% for the year ended December 31, 2016, as compared to the Fund’s per Share NAV decrease of 15.2% for the year ended
B-24
Table of Contents
December 31, 2015 was primarily due to a greater depreciation in the value of the assets of the Fund during the year ended December 31, 2016. The Fund’s per Share NAV decrease of 15.2% for the year ended December 31, 2015, as compared to the Fund’s per Share NAV decrease of 17.6% for the year ended December 31, 2014, was primarily due to a lesser depreciation in the value of the assets of the Fund during the year ended December 31, 2015.
During the year ended December 31, 2016, the Fund’s per Share NAV reached its high for the year on February 11, 2016 at $66.85 per Share and reached its low for the year on December 21, 2016 at $41.09 per Share. By comparison, during the year ended December 31, 2015, the Fund’s per Share NAV reached its high for the year on September 1, 2015 at $69.30 per Share and reached its low for the year on August 10, 2015 at $49.68 per Share. By comparison, during the year ended December 31, 2014, the Fund’s per Share NAV reached its high for the year on February 5, 2014 at $85.56 per Share and reached its low for the year on August 19, 2014 at $58.76 per Share.
The benchmark’s decline of 21% for the year ended December 31, 2016, as compared to the benchmark’s decline of 14.3% for the year ended December 31, 2015, can be attributed to a greater decline in prices of the futures contracts that made up the S&P 500 VIX Mid-Term Futures Index during the year ended December 31, 2016. By comparison, the benchmark’s decline of 14.3% for the year ended December 31, 2015, as compared to the benchmark’s decline of 16.5% for the year ended December 31, 2014, can be attributed to a lesser decline in prices of the futures contracts that made up the S&P 500 VIX Mid-Term Futures Index during the year ended December 31, 2015.
Net Income/Loss
The following table provides summary income information for the Fund for the years ended December 31, 2016, 2015 and 2014:
| Year Ended December 31, 2016 |
Year Ended December 31, 2015 |
Year Ended December 31, 2014 |
||||||||||
| Net investment income (loss) |
$ | (294,491 | ) | $ | (240,600 | ) | $ | (386,478 | ) | |||
| Management fee |
369,016 | 233,390 | 392,120 | |||||||||
| Brokerage commission |
32,884 | 15,503 | 10,931 | |||||||||
| Net realized gain (loss) |
(11,085,007 | ) | (3,334,581 | ) | (14,377,068 | ) | ||||||
| Change in net unrealized appreciation/depreciation |
(944,964 | ) | (605,352 | ) | 5,157,541 | |||||||
| Net income (loss) |
$ | (12,324,462 | ) | $ | (4,180,533 | ) | $ | (9,606,005 | ) | |||
The Fund’s net income decreased for the year ended December 31, 2016, as compared to the year ended December 31, 2015, primarily due to a greater decline in futures prices during the year ended December 31, 2016. By comparison, the Fund’s net income increased for the year ended December 31, 2015, as compared to the year ended December 31, 2014, primarily due to a lesser decline in futures prices during the year ended December 31, 2015.
B-25
Table of Contents
ProShares Short VIX Short-Term Futures ETF
Fund Performance
The following table provides summary performance information for the Fund for the years ended December 31, 2016, 2015 and 2014:
| Year Ended December 31, 2016 |
Year Ended December 31, 2015 |
Year Ended December 31, 2014 |
||||||||||
| NAV beginning of period |
$ | 642,811,361 | $ | 506,556,124 | $ | 141,751,202 | ||||||
| NAV end of period |
$ | 228,075,387 | $ | 642,811,361 | $ | 506,556,124 | ||||||
| Percentage change in NAV |
(64.5 | )% | 26.9 | % | 257.4 | % | ||||||
| Shares outstanding beginning of period |
12,650,040 | 8,250,040 | 2,100,040 | |||||||||
| Shares outstanding end of period |
2,500,000 | 12,650,040 | 8,250,040 | |||||||||
| Percentage change in shares outstanding |
(80.2 | )% | 53.3 | % | 292.9 | % | ||||||
| Shares created |
52,950,000 | 24,100,000 | 16,100,000 | |||||||||
| Shares redeemed |
63,100,040 | 19,700,000 | 9,950,000 | |||||||||
| Per share NAV beginning of period |
$ | 50.81 | $ | 61.40 | $ | 67.50 | ||||||
| Per share NAV end of period |
$ | 91.23 | $ | 50.81 | $ | 61.40 | ||||||
| Percentage change in per share NAV |
79.6 | % | (17.2 | )% | (9.0 | )% | ||||||
| Percentage change in benchmark |
(67.8 | )% | (36.1 | )% | (25.5 | )% | ||||||
| Benchmark annualized volatility |
72.5 | % | 78.6 | % | 61.4 | % | ||||||
During the year ended December 31, 2016, the decrease in the Fund’s NAV resulted primarily from a decrease from 12,650,040 outstanding Shares at December 31, 2015 to 2,500,000 outstanding Shares at December 31, 2016. The decrease in the Fund’s NAV was offset by the cumulative effect of the Fund seeking daily investment results (before fees and expenses) that correspond to the inverse of the daily performance of the S&P 500 VIX Short-Term Futures Index. By comparison, during the year ended December 31, 2015, the increase in the Fund’s NAV resulted from an increase from 8,250,040 outstanding Shares at December 31, 2014 to 12,650,040 outstanding Shares at December 31, 2015. The increase in the Fund’s NAV also resulted from the cumulative effect of the Fund seeking daily investment results (before fees and expenses) that correspond to the inverse of the daily performance of the S&P 500 VIX Short-Term Futures Index. By comparison, during the year ended December 31, 2014, the increase in the Fund’s NAV resulted from an increase from 2,100,040 outstanding Shares at December 31, 2013 to 8,250,040 outstanding Shares at December 31, 2014. The increase in the Fund’s NAV also resulted from the cumulative effect of the Fund seeking daily investment results (before fees and expenses) that correspond to the inverse of the daily performance of the S&P 500 VIX Short-Term Futures Index.
For the years ended December 31, 2016, 2015 and 2014, the Fund’s daily performance had a statistical correlation over 0.99 of the inverse of the daily performance of its benchmark. The Fund’s per Share NAV increase of 79.6% for the year ended December 31, 2016, as compared to the Fund’s per Share NAV decrease of 17.2% for the year ended December 31, 2015, was primarily due to a decline in prices of the first and second month VIX futures during the year ended December 31, 2016. The Fund’s per Share NAV decrease of 17.2% for the year ended December 31, 2015, as compared to the Fund’s per Share NAV decrease of 9.0% for the year ended December 31, 2014, was primarily due to a greater decline in prices of the first and second month VIX futures during the year ended December 31, 2015.
During the year ended December 31, 2016, the Fund’s per Share NAV reached its high for the year on December 21, 2016 at $98.10 per Share and reached its low for the year on February 11, 2016 at $31.50 per Share. By comparison, during the year ended December 31, 2015, the Fund’s per Share NAV reached its high for the year on June 23, 2015 at $97.71 per Share and reached its low for the year on September 1, 2015 at $43.58 per Share. By comparison, during the year ended December 31, 2014, the Fund’s per Share NAV reached its high for the year on July 3, 2014 at $92.60 per Share and reached its low for the year on October 15, 2014 at $50.31 per Share.
The benchmark’s decline of 67.8% for the year ended December 31, 2016, as compared to the benchmark’s decline of 36.1% for the year ended December 31, 2015, can be attributed to a greater decline of the prices of the near-term
B-26
Table of Contents
futures contracts on the VIX futures curve during the year ended December 31, 2016. The benchmark’s decline of 36.1% for the year ended December 31, 2015, as compared to the benchmark’s decline of 25.5% for the year ended December 31, 2014, can be attributed to a greater decline of the prices of the near-term futures contracts on the VIX futures curve during the year ended December 31, 2015.
Net Income/Loss
The following table provides summary income information for the Fund for the years ended December 31, 2016, 2015 and 2014:
| Year Ended December 31, 2016 |
Year Ended December 31, 2015 |
Year Ended December 31, 2014 |
||||||||||
| Net investment income (loss) |
$ | (5,396,850 | ) | $ | (5,798,200 | ) | $ | (4,285,469 | ) | |||
| Management fee |
4,448,808 | 4,043,491 | 2,785,597 | |||||||||
| Brokerage commission |
2,074,099 | 1,935,395 | 1,581,416 | |||||||||
| Net realized gain (loss) |
440,379,719 | 69,828,657 | 76,945,361 | |||||||||
| Change in net unrealized appreciation/depreciation |
(21,062,850 | ) | 27,107,500 | (24,470,868 | ) | |||||||
| Net income (loss) |
$ | 413,920,019 | $ | 91,137,957 | $ | 48,189,024 | ||||||
The Fund’s net income increased for the year ended December 31, 2016, as compared to the year ended December 31, 2015, primarily due to a greater decline in futures prices during the year ended December 31, 2016. The Fund’s net income increased for the year ended December 31, 2015, as compared to the year ended December 31, 2014, primarily due to a greater decline in futures prices during the year ended December 31, 2015.
ProShares Ultra VIX Short-Term Futures ETF*#
Fund Performance
The following table provides summary performance information for the Fund for the years ended December 31, 2016, 2015 and 2014:
| Year Ended December 31, 2016 |
Year Ended December 31, 2015 |
Year Ended December 31, 2014 |
||||||||||
| NAV beginning of period |
$ | 547,708,740 | $ | 351,789,953 | $ | 226,233,584 | ||||||
| NAV end of period |
$ | 515,758,754 | $ | 547,708,740 | $ | 351,789,953 | ||||||
| Percentage change in NAV |
(5.8 | )% | 55.7 | % | 55.5 | % | ||||||
| Shares outstanding beginning of period |
780,098 | 112,161 | 26,979 | |||||||||
| Shares outstanding end of period |
11,861,530 | 780,098 | 112,161 | |||||||||
| Percentage change in shares outstanding |
1,420.5 | % | 595.5 | % | 315.7 | % | ||||||
| Shares created |
28,958,000 | 2,887,200 | 408,600 | |||||||||
| Shares redeemed |
17,876,568 | 2,219,263 | 323,418 | |||||||||
| Per share NAV beginning of period |
$ | 702.10 | $ | 3,136.47 | $ | 8,385.54 | ||||||
| Per share NAV end of period |
$ | 43.48 | $ | 702.10 | $ | 3,136.47 | ||||||
| Percentage change in per share NAV |
(93.8 | )% | (77.6 | )% | (62.6 | )% | ||||||
| Percentage change in benchmark |
(67.8 | )% | (36.1 | )% | (25.5 | )% | ||||||
| Benchmark annualized volatility |
72.5 | % | 78.6 | % | 61.4 | % | ||||||
During the year ended December 31, 2016, the decrease in the Fund’s NAV resulted from the cumulative effect of the Fund seeking daily investment results (before fees and expenses) that correspond to 2x of the daily performance of the S&P 500 VIX Short-Term Futures Index. The decrease in the Fund’s NAV was offset by an increase from 780,098 outstanding Shares at December 31, 2015 to 11,861,530 outstanding Shares at December 31, 2016. By comparison, during the year ended December 31, 2015, the increase in the Fund’s NAV resulted from an increase from 112,161 outstanding Shares at December 31, 2014 to 780,098 outstanding Shares at December 31, 2015. The increase in the Fund’s NAV was offset by the cumulative effect of the Fund seeking daily investment results (before
B-27
Table of Contents
fees and expenses) that correspond to 2x of the daily performance of the S&P 500 VIX Short-Term Futures Index. By comparison, during the year ended December 31, 2014, the increase in the Fund’s NAV resulted from an increase from 26,979 outstanding Shares at December 31, 2013 to 112,161 outstanding Shares at December 31, 2014. The increase in the Fund’s NAV was offset by the cumulative effect of the Fund seeking daily investment results (before fees and expenses) that correspond to 2x of the daily performance of the S&P 500 VIX Short-Term Futures Index.
For the years ended December 31, 2016, 2015 and 2014, the Fund’s daily performance had a statistical correlation over 0.99 to 2x of the daily performance of its benchmark. The Fund’s per Share NAV decrease of 93.8% for the year ended December 31, 2016, as compared to the Fund’s per Share NAV decrease of 77.6% for the year ended December 31, 2015, was primarily due to a greater decline in prices of the first and second month VIX futures during the year ended December 31, 2016. The Fund’s per Share NAV decrease of 77.6% for the year ended December 31, 2015, as compared to the Fund’s per Share NAV decrease of 62.6% for the year ended December 31, 2014, was primarily due to a greater decline in prices of the first and second month VIX futures during the year ended December 31, 2015.
During the year ended December 31, 2016, the Fund’s per Share NAV reached its high for the year on February 11, 2016 at $1,428.75 per Share and reached its low for the year on December 27, 2016 at $37.88 per Share. By comparison, during the year ended December 31, 2015, the Fund’s per Share NAV reached its high for the year on January 15, 2015 at $4,107.00 per Share and reached its low for the year on December 1, 2015 at $607.00 per Share. By comparison, during the year ended December 31, 2014, the Fund’s per Share NAV reached its high for the year on February 5, 2014 at $13,065.00 per Share and reached its low for the year on December 5, 2014 at $2,253.75 per Share.
The benchmark’s decline of 67.8% for the year ended December 31, 2016, as compared to the benchmark’s decline of 36.1% for the year ended December 31, 2015, can be attributed to a greater decline in prices of the near-term futures contracts on the VIX futures curve during the year ended December 31, 2016. The benchmark’s decline of 36.1% for the year ended December 31, 2015, as compared to the benchmark’s decline of 25.5% for the year ended December 31, 2014, can be attributed to a greater decline in prices of the near-term futures contracts on the VIX futures curve during the year ended December 31, 2015.
Net Income/Loss
The following table provides summary income information for the Fund for the years ended December 31, 2016, 2015 and 2014:
| Year Ended December 31, 2016 |
Year Ended December 31, 2015 |
Year Ended December 31, 2014 |
||||||||||
| Net investment income (loss) |
$ | (8,936,777 | ) | $ | (7,410,148 | ) | $ | (5,359,486 | ) | |||
| Management fee |
6,417,822 | 4,362,460 | 2,868,337 | |||||||||
| Brokerage commission |
4,158,919 | 3,203,875 | 2,563,849 | |||||||||
| Net realized gain (loss) |
(1,567,324,739 | ) | (392,223,946 | ) | (139,402,604 | ) | ||||||
| Change in net unrealized appreciation/depreciation |
(19,895,547 | ) | (27,664,140 | ) | 63,590,463 | |||||||
| Net income (loss) |
$ | (1,596,157,063 | ) | $ | (427,298,234 | ) | $ | (81,171,627 | ) | |||
The Fund’s net income decreased for the year ended December 31, 2016, as compared to the year ended December 31, 2015, primarily due to a greater decline in futures prices during the year ended December 31, 2016. By comparison, the Fund’s net income decreased for the year ended December 31, 2015, as compared to the year ended December 31, 2014, primarily due to a greater decline in futures prices during the year ended December 31, 2015.
| * | See Note 1 of the Notes to Financial Statements in Item 15 of Part IV in this Annual Report on Form 10-K regarding the reverse Share splits for the ProShares Ultra VIX Short-Term Futures ETF. |
| # | See Note 9 of the Notes to Financial Statements in Item 15 of Part IV in this Annual Report on Form 10-K regarding the reverse Share splits for the ProShares Ultra VIX Short-Term Futures ETF. |
B-28
Table of Contents
ProShares UltraShort Bloomberg Crude Oil#
Fund Performance
The following table provides summary performance information for the Fund for the years ended December 31, 2016, 2015 and 2014:
| Year Ended December 31, 2016 |
Year Ended December 31, 2015 |
Year Ended December 31, 2014 |
||||||||||
| NAV beginning of period |
$ | 95,897,894 | $ | 169,210,110 | $ | 256,060,149 | ||||||
| NAV end of period |
$ | 200,958,303 | $ | 95,897,894 | $ | 169,210,110 | ||||||
| Percentage change in NAV |
109.6 | % | (43.3 | )% | (33.9 | )% | ||||||
| Shares outstanding beginning of period |
1,439,888 | 4,339,888 | 16,139,888 | |||||||||
| Shares outstanding end of period |
6,339,884 | 1,439,888 | 4,339,888 | |||||||||
| Percentage change in shares outstanding |
340.3 | % | (66.8 | )% | (73.1 | )% | ||||||
| Shares created |
18,500,000 | 21,600,000 | 31,400,000 | |||||||||
| Shares redeemed |
13,600,004 | 24,500,000 | 43,200,000 | |||||||||
| Per share NAV beginning of period |
$ | 66.60 | $ | 38.99 | $ | 15.87 | ||||||
| Per share NAV end of period |
$ | 31.70 | $ | 66.60 | $ | 38.99 | ||||||
| Percentage change in per share NAV |
(52.4 | )% | 70.8 | % | 145.8 | % | ||||||
| Percentage change in benchmark |
6.7 | % | (44.4 | )% | (41.7 | )% | ||||||
| Benchmark annualized volatility |
44.5 | % | 45.5 | % | 23.7 | % | ||||||
During the year ended December 31, 2016, the increase in the Fund’s NAV resulted from an increase from 1,439,888 outstanding Shares at December 31, 2015 to 6,339,884 outstanding Shares at December 31, 2016. The increase in the Fund’s NAV was offset by the cumulative effect of the Fund seeking daily investment results (before fees and expenses) that correspond to 2x of the inverse of the daily performance of the Bloomberg WTI Crude Oil SubindexSM. By comparison, during the year ended December 31, 2015, the decrease in the Fund’s NAV resulted from a decrease from 4,339,888 outstanding Shares at December 31, 2014 to 1,439,888 outstanding Shares at December 31, 2015. The decrease in the Fund’s NAV was offset by the cumulative effect of the Fund seeking daily investment results (before fees and expenses) that correspond to 2x of the inverse of the daily performance of the Bloomberg WTI Crude Oil SubindexSM. By comparison, during the year ended December 31, 2014, the decrease in the Fund’s NAV resulted from a decrease from 16,139,888 outstanding Shares at December 31, 2013 to 4,339,888 outstanding Shares at December 31, 2014. The decrease in the Fund’s NAV was offset by the cumulative effect of the Fund seeking daily investment results (before fees and expenses) that correspond to 2x of the inverse of the daily performance of the Bloomberg WTI Crude Oil SubindexSM.
For the years ended December 31, 2016, 2015 and 2014, the Fund’s daily performance had a statistical correlation over 0.99 to 2x of the inverse of the daily performance of its benchmark. The Fund’s per Share NAV decrease of 52.4% for the year ended December 31, 2016, as compared to the Fund’s per Share NAV increase of 70.8% for the year ended December 31, 2015, was primarily due to a depreciation in the value of the assets of the Fund during the year ended December 31, 2016. The Fund’s per Share NAV increase of 70.8% for the year ended December 31, 2015, as compared to the Fund’s per Share NAV increase of 145.8% for the year ended December 31, 2014, was primarily due to a lesser appreciation in the value of the assets of the Fund during the year ended December 31, 2015.
During the year ended December 31, 2016, the Fund’s per Share NAV reached its high for the year on January 20, 2016 at $116.11 per Share and reached its low for the year on December 28, 2016 at $31.37 per Share. By comparison, during the year ended December 31, 2015, the Fund’s per Share NAV reached its high for the year on December 21, 2015 at $72.44 per Share and reached its low for the year on June 10, 2015 at $26.46 per Share. By comparison, during the year ended December 31, 2014, the Fund’s per Share NAV reached its high for the year on December 31, 2014 at $38.99 per Share and reached its low for the year on June 20, 2014 at $12.04 per Share.
B-29
Table of Contents
The benchmark’s rise of 6.7% for the year ended December 31, 2016, as compared to the benchmark’s decline of 44.4% for the year ended December 31, 2015, can be attributed to an increase in the price of WTI Crude Oil during the year ended December 31, 2016. By comparison, the benchmark’s decline of 44.4% for the year ended December 31, 2015, as compared to the benchmark’s decline of 41.7% for the year ended December 31, 2014, can be attributed to a greater decrease in the price of WTI Crude Oil during the year ended December 31, 2015.
Net Income/Loss
The following table provides summary income information for the Fund for the years ended December 31, 2016, 2015 and 2014:
| Year Ended December 31, 2016 |
Year Ended December 31, 2015 |
Year Ended December 31, 2014 |
||||||||||
| Net investment income (loss) |
$ | (1,408,964 | ) | $ | (2,166,211 | ) | $ | (2,415,841 | ) | |||
| Management fee |
1,755,696 | 1,978,613 | 2,448,428 | |||||||||
| Brokerage commission |
153,428 | 248,482 | 78,033 | |||||||||
| Net realized gain (loss) |
(67,756,228 | ) | 91,684,782 | 99,347,798 | ||||||||
| Change in net unrealized appreciation/depreciation |
(22,509,153 | ) | (33,951,907 | ) | 46,381,649 | |||||||
| Net income (loss) |
$ | (91,674,345 | ) | $ | 55,566,664 | $ | 143,313,606 | |||||
The Fund’s net income decreased for the year ended December 31, 2016, as compared to the year ended December 31, 2015, primarily due to an increase in the price of WTI Crude Oil during the year ended December 31, 2016. By comparison, the Fund’s net income decreased for the year ended December 31, 2015, as compared to the year ended December 31, 2014, primarily due to a greater decrease in the price of WTI Crude Oil during the year ended December 31, 2015.
| # | See Note 9 of the Notes to Financial Statements in Item 15 of Part IV in this Annual Report on Form 10-K regarding the Share split for the ProShares UltraShort Bloomberg Crude Oil. |
ProShares UltraShort Bloomberg Natural Gas*
Fund Performance
The following table provides summary performance information for the Fund for the years ended December 31, 2016, 2015 and 2014:
| Year Ended December 31, 2016 |
Year Ended December 31, 2015 |
Year Ended December 31, 2014 |
||||||||||
| NAV beginning of period |
$ | 10,462,856 | $ | 14,688,564 | $ | 22,734,767 | ||||||
| NAV end of period |
$ | 4,038,794 | $ | 10,462,856 | $ | 14,688,564 | ||||||
| Percentage change in NAV |
(61.4 | )% | (28.8 | )% | (35.4 | )% | ||||||
| Shares outstanding beginning of period |
224,856 | 524,856 | 974,856 | |||||||||
| Shares outstanding end of period |
174,832 | 224,856 | 524,856 | |||||||||
| Percentage change in shares outstanding |
(22.2 | )% | (57.2 | )% | (46.2 | )% | ||||||
| Shares created |
950,000 | 1,350,000 | 8,550,000 | |||||||||
| Shares redeemed |
1,000,024 | 1,650,000 | 9,000,000 | |||||||||
| Per share NAV beginning of period |
$ | 46.53 | $ | 27.99 | $ | 23.32 | ||||||
| Per share NAV end of period |
$ | 23.10 | $ | 46.53 | $ | 27.99 | ||||||
| Percentage change in per share NAV |
(50.4 | )% | 66.3 | % | 20.0 | % | ||||||
| Percentage change in benchmark |
10.0 | % | (40.0 | )% | (30.7 | )% | ||||||
| Benchmark annualized volatility |
40.3 | % | 40.4 | % | 42.1 | % | ||||||
During the year ended December 31, 2016, the decrease in the Fund’s NAV resulted primarily from a decrease from 224,856 outstanding Shares at December 31, 2015 to 174,832 outstanding Shares at December 31, 2016. The decrease in the Fund’s NAV also resulted in part from the cumulative effect of the Fund seeking daily investment results (before fees and expenses) that correspond to 2x of the inverse of the daily performance of the Bloomberg
B-30
Table of Contents
Natural Gas SubindexSM. By comparison, during the year ended December 31, 2015, the decrease in the Fund’s NAV resulted from a decrease from 524,856 outstanding Shares at December 31, 2014 to 224,856 outstanding Shares at December 31, 2015. The decrease in the Fund’s NAV was offset by the cumulative effect of the Fund seeking daily investment results (before fees and expenses) that correspond to 2x of the inverse of the daily performance of the Bloomberg Natural Gas SubindexSM. By comparison, during the year ended December 31, 2014, the decrease in the Fund’s NAV resulted from a decrease from 974,856 outstanding Shares at December 31, 2013 to 524,856 outstanding Shares at December 31, 2014. The decrease in the Fund’s NAV was offset by the cumulative effect of the Fund seeking daily investment results (before fees and expenses) that correspond to 2x of the inverse of the daily performance of the Bloomberg Natural Gas SubindexSM.
For the years ended December 31, 2016, 2015 and 2014, the Fund’s daily performance had a statistical correlation over 0.99 to 2x of the inverse of the daily performance of its benchmark. The Fund’s per Share NAV decrease of 50.4% for the year ended December 31, 2016, as compared to the Fund’s per Share NAV increase of 66.3% for the year ended December 31, 2015, was primarily due to a depreciation in the value of the assets of the Fund during the year ended December 31, 2016. The Fund’s per Share NAV increase of 66.3% for the year ended December 31, 2015, as compared to the Fund’s per Share NAV increase of 20.0% for the year ended December 31, 2014, was primarily due to a greater appreciation in the value of the assets of the Fund during the year ended December 31, 2015.
During the year ended December 31, 2016, the Fund’s per Share NAV reached its high for the year on March 3, 2016 at $84.20 per Share and reached its low for the year on December 28, 2016 at $21.47 per Share. By comparison, during the year ended December 31, 2015, the Fund’s per Share NAV reached its high for the year on December 16, 2015 at $72.21 per Share and reached its low for the year on January 14, 2015 at $21.53 per Share. By comparison, during the year ended December 31, 2014, the Fund’s per Share NAV reached its high for the year on December 31, 2014 at $27.99 per Share and reached its low for the year on June 12, 2014 at $11.93 per Share.
The benchmark’s rise of 10.0% for the year ended December 31, 2016, as compared to the benchmark’s decline of 40.0% for the year ended December 31, 2015, can be attributed to an increase in the price of Henry Hub Natural Gas during the year ended December 31, 2016. The benchmark’s decline of 40.0% for the year ended December 31, 2015, as compared to the benchmark’s decline of 30.7% for the year ended December 31, 2014, can be attributed to a greater decrease in the price of Henry Hub Natural Gas during the year ended December 31, 2015.
B-31
Table of Contents
Net Income/Loss
The following table provides summary income information for the Fund for the years ended December 31, 2016, 2015 and 2014:
| Year Ended December 31, 2016 |
Year Ended December 31, 2015 |
Year Ended December 31, 2014 |
||||||||||
| Net investment income (loss) |
$ | (122,172 | ) | $ | (177,124 | ) | $ | (460,907 | ) | |||
| Management fee |
81,259 | 112,277 | 385,014 | |||||||||
| Brokerage commission |
59,966 | 70,677 | 92,199 | |||||||||
| Net realized gain (loss) |
589,999 | 15,212,833 | 8,796,882 | |||||||||
| Change in net unrealized appreciation/depreciation |
1,988,745 | (6,412,461 | ) | 2,899,237 | ||||||||
| Net income (loss) |
$ | 2,456,572 | $ | 8,623,248 | $ | 11,235,212 | ||||||
The Fund’s net income decreased for the year ended December 31, 2016, as compared to the year ended December 31, 2015, primarily due to an increase in the price of Henry Hub Natural Gas, during the year ended December 31, 2016. By comparison, the Fund’s net income decreased for the year ended December 31, 2015, as compared to the year ended December 31, 2014, primarily due to a greater decrease in the price of Henry Hub Natural Gas, during the year ended December 31, 2015.
| * | See Note 1 of the Notes to Financial Statements in Item 15 of Part IV in this Annual Report on Form 10-K regarding the Share split for the ProShares UltraShort Bloomberg Natural Gas. |
ProShares UltraShort Gold
Fund Performance
The following table provides summary performance information for the Fund for the years ended December 31, 2016, 2015 and 2014:
| Year Ended December 31, 2016 |
Year Ended December 31, 2015 |
Year Ended December 31, 2014 |
||||||||||
| NAV beginning of period |
$ | 74,971,764 | $ | 81,861,762 | $ | 139,436,456 | ||||||
| NAV end of period |
$ | 63,653,647 | $ | 74,971,764 | $ | 81,861,762 | ||||||
| Percentage change in NAV |
(15.1 | )% | (8.4 | )% | (41.3 | )% | ||||||
| Shares outstanding beginning of period |
646,978 | 846,978 | 1,346,978 | |||||||||
| Shares outstanding end of period |
696,978 | 646,978 | 846,978 | |||||||||
| Percentage change in shares outstanding |
7.7 | % | (23.6 | )% | (37.1 | )% | ||||||
| Shares created |
1,050,000 | 150,000 | 550,000 | |||||||||
| Shares redeemed |
1,000,000 | 350,000 | 1,050,000 | |||||||||
| Per share NAV beginning of period |
$ | 115.88 | $ | 96.65 | $ | 103.52 | ||||||
| Per share NAV end of period |
$ | 91.33 | $ | 115.88 | $ | 96.65 | ||||||
| Percentage change in per share NAV |
(21.2 | )% | 19.9 | % | (6.6 | )% | ||||||
| Percentage change in benchmark |
8.1 | % | (12.1 | )% | 0.1 | % | ||||||
| Benchmark annualized volatility |
16.5 | % | 14.4 | % | 12.9 | % | ||||||
During the year ended December 31, 2016, the decrease in the Fund’s NAV resulted from the cumulative effect of the Fund seeking daily investment results (before fees and expenses) that correspond to 2x of the inverse of the daily performance of gold bullion as measured by the U.S. dollar p.m. LBMA Gold Price. The decrease in the Fund’s NAV was offset by an increase from 646,978 outstanding Shares at December 31, 2015 to 696,978 outstanding Shares at December 31, 2016. By comparison, during the year ended December 31, 2015, the decrease in the Fund’s NAV resulted from a decrease from 846,978 outstanding Shares at December 31, 2014 to 646,978 outstanding Shares at December 31, 2015. The decrease in the Fund’s NAV was offset by the cumulative effect of the Fund seeking daily investment results (before fees and expenses) that correspond to 2x of the inverse of the daily
B-32
Table of Contents
performance of gold bullion as measured by the U.S. dollar p.m. LBMA Gold Price†. By comparison, during the year ended December 31, 2014, the decrease in the Fund’s NAV resulted primarily from a decrease from 1,346,978 outstanding Shares at December 31, 2013 to 846,978 outstanding Shares at December 31, 2014. The decrease in the Fund’s NAV also resulted in part from the cumulative effect of the Fund seeking daily investment results (before fees and expenses) that correspond to 2x of the inverse of the daily performance of gold bullion as measured by the U.S. dollar p.m. fixing price for delivery in London.
For the years ended December 31, 2016, 2015 and 2014, the Fund’s daily performance had a statistical correlation over 0.99 to 2x of the inverse of the daily performance of its benchmark. The Fund’s per Share NAV decrease of 21.2% for the year ended December 31, 2016, as compared to the Fund’s per Share NAV increase of 19.9% for the year ended December 31, 2015, was primarily due to a depreciation in the value of the assets of the Fund during the year ended December 31, 2016. The Fund’s per Share NAV increase of 19.9% for the year ended December 31, 2015, as compared to the Fund’s per Share NAV decrease of 6.6% for the year ended December 31, 2014, was primarily due to an appreciation in the value of the assets of the Fund during the year ended December 31, 2015.
During the year ended December 31, 2016, the Fund’s per Share NAV reached its high for the year on January 5, 2016 at $112.07 per Share and reached its low for the year on July 6, 2016 at $65.63 per Share. By comparison, during the year ended December 31, 2015, the Fund’s per Share NAV reached its high for the year on December 17, 2015 at $118.51 per Share and reached its low for the year on January 22, 2015 at $83.07 per Share. By comparison, during the year ended December 31, 2014, the Fund’s per Share NAV reached its high for the year on November 5, 2014 at $109.00 per Share and reached its low for the year on March 14, 2014 at $77.10 per Share.
The benchmark’s rise of 8.1% for the year ended December 31, 2016, as compared to the benchmark’s decrease of 12.1% for the year ended December 31, 2015, can be attributed to an increase in the price of spot gold in U.S. dollar terms during the year ended December 31, 2016. By comparison, the benchmark’s decrease of 12.1% for the year ended December 31, 2015, as compared to the benchmark’s increase of 0.1% for the year ended December 31, 2014, can be attributed to a decrease in the price of spot gold in U.S. dollar terms during the year ended December 31, 2015
Net Income/Loss
The following table provides summary income information for the Fund for the years ended December 31, 2016, 2015 and 2014:
| Year Ended December 31, 2016 |
Year Ended December 31, 2015 |
Year Ended December 31, 2014 |
||||||||||
| Net investment income (loss) |
$ | (461,423 | ) | $ | (703,582 | ) | $ | (857,817 | ) | |||
| Management fee |
625,950 | 735,540 | 898,453 | |||||||||
| Brokerage commission |
43 | 41 | 39 | |||||||||
| Net realized gain (loss) |
(12,241,129 | ) | 12,708,936 | (5,312,609 | ) | |||||||
| Change in net unrealized appreciation/depreciation |
1,240,412 | 4,098,510 | (7,934,003 | ) | ||||||||
| Net income (loss) |
$ | (11,462,140 | ) | $ | 16,103,864 | $ | (14,104,429 | ) | ||||
The Fund’s net income decreased for the year ended December 31, 2016, as compared to the year ended December 31, 2015, primarily due to an increase in the price of spot gold in U.S. dollar terms during the year ended December 31, 2016. By comparison, the Fund’s net income increased for the year ended December 31, 2015, as compared to the year ended December 31, 2014, primarily due to a decrease in the price of spot gold in U.S. dollar terms during the year ended December 31, 2015.
| † | On March 19, 2015, the company that ran the London U.S. dollar gold fixing ceased calculating the price of gold for the LBMA. The LBMA selected ICE Benchmark Administration to calculate the price, which was renamed the LBMA Gold Price, and is based on an electronic, physically settled auction-based methodology, beginning on March 20, 2015. |
B-33
Table of Contents
ProShares UltraShort Silver
Fund Performance
The following table provides summary performance information for the Fund for the years ended December 31, 2016, 2015 and 2014:
| Year Ended December 31, 2016 |
Year Ended December 31, 2015 |
Year Ended December 31, 2014 |
||||||||||
| NAV beginning of period |
$ | 55,987,938 | $ | 53,007,867 | $ | 112,989,686 | ||||||
| NAV end of period |
$ | 23,017,656 | $ | 55,987,938 | $ | 53,007,867 | ||||||
| Percentage change in NAV |
(58.9 | )% | 5.6 | % | (53.1 | )% | ||||||
| Shares outstanding beginning of period |
866,978 | 916,978 | 2,516,978 | |||||||||
| Shares outstanding end of period |
616,976 | 866,978 | 916,978 | |||||||||
| Percentage change in shares outstanding |
(28.8 | )% | (5.5 | )% | (63.6 | )% | ||||||
| Shares created |
1,650,000 | 1,650,000 | 1,800,000 | |||||||||
| Shares redeemed |
1,900,002 | 1,700,000 | 3,400,000 | |||||||||
| Per share NAV beginning of period |
$ | 64.58 | $ | 57.81 | $ | 44.89 | ||||||
| Per share NAV end of period |
$ | 37.31 | $ | 64.58 | $ | 57.81 | ||||||
| Percentage change in per share NAV |
(42.2 | )% | 11.7 | % | 28.8 | % | ||||||
| Percentage change in benchmark |
17.5 | % | (13.5 | )% | (18.1 | )% | ||||||
| Benchmark annualized volatility |
27.8 | % | 24.1 | % | 21.8 | % | ||||||
During the year ended December 31, 2016, the decrease in the Fund’s NAV resulted primarily from a decrease from 866,978 outstanding Shares at December 31, 2015 to 616,976 outstanding Shares at December 31, 2016. The decrease in the Fund’s NAV also resulted in part from the cumulative effect of the Fund seeking daily investment results (before fees and expenses) that correspond to 2x of the inverse of the daily performance of silver bullion as measured by the London Silver Price. By comparison, during the year ended December 31, 2015, the increase in the Fund’s NAV resulted from the cumulative effect of the Fund seeking daily investment results (before fees and expenses) that correspond to 2x of the inverse of the daily performance of silver bullion as measured by the London Silver Price†. The increase in the Fund’s NAV was offset by a decrease from 916,978 outstanding Shares at December 31, 2014 to 866,978 outstanding Shares at December 31, 2015. By comparison, during the year ended December 31, 2014, the decrease in the Fund’s NAV resulted from a decrease from 2,516,978 outstanding Shares at December 31, 2013 to 916,978 outstanding Shares at December 31, 2014. The decrease in the Fund’s NAV was offset by the cumulative effect of the Fund seeking daily investment results (before fees and expenses) that correspond to 2x of the inverse of the daily performance of silver bullion as measured by the London Silver Price†.
For the years ended December 31, 2016, 2015 and 2014, the Fund’s daily performance had a statistical correlation over 0.99 to 2x of the inverse of the daily performance of its benchmark. The Fund’s per Share NAV decrease of 42.2% for the year ended December 31, 2016, as compared to the Fund’s per Share NAV increase of 11.7% for the year ended December 31, 2015, was primarily due to a depreciation in the value of the assets of the Fund during the year ended December 31, 2016. The Fund’s per Share NAV increase of 11.7% for the year ended December 31, 2015, as compared to the Fund’s per Share NAV increase of 28.8% for the year ended December 31, 2014, was primarily due to a lesser appreciation in the value of the assets of the Fund during the year ended December 31, 2015.
During the year ended December 31, 2016, the Fund’s per Share NAV reached its high for the year on January 28, 2016 at $66.01 per Share and reached its low for the year on August 2, 2016 at $25.21 per Share. By comparison, during the year ended December 31, 2015, the Fund’s per Share NAV reached its high for the year on December 14, 2015 at $66.08 per Share and reached its low for the year on January 23, 2015 at $43.39 per Share. By comparison, during the year ended December 31, 2014, the Fund’s per Share NAV reached its high for the year on November 6, 2014 at $65.64 per Share and reached its low for the year on February 24, 2014 at $34.40 per Share.
B-34
Table of Contents
The benchmark’s rise of 17.5% for the year ended December 31, 2016, as compared to the benchmark’s decline of 13.5% for the year ended December 31, 2015, can be attributed to an increase in the price of spot silver in U.S. dollar terms during the year ended December 31, 2016. The benchmark’s decline of 13.5% for the year ended December 31, 2015, as compared to the benchmark’s decline of 18.1% for the year ended December 31, 2014, can be attributed to a lesser decline in the price of spot silver in U.S. dollar terms during the year ended December 31, 2015.
Net Income/Loss
The following table provides summary income information for the Fund for the years ended December 31, 2016, 2015 and 2014:
| Year Ended December 31, 2016 |
Year Ended December 31, 2015 |
Year Ended December 31, 2014 |
||||||||||
| Net investment income (loss) |
$ | (255,853 | ) | $ | (516,464 | ) | $ | (585,841 | ) | |||
| Management fee |
349,293 | 540,253 | 616,703 | |||||||||
| Brokerage commission | 43 | 42 | 39 | |||||||||
| Net realized gain (loss) |
(17,556,630 | ) | 10,756,758 | 15,119,117 | ||||||||
| Change in net unrealized appreciation/depreciation |
(3,372,326 | ) | 4,186,942 | 2,807,756 | ||||||||
| Net income (loss) |
$ | (21,184,809 | ) | $ | 14,427,236 | $ | 17,341,032 | |||||
The Fund’s net income decreased for the year ended December 31, 2016, as compared to the year ended December 31, 2015, primarily due to a rise in the price of spot silver in U.S. dollar terms during the year ended December 31, 2016. By comparison, the Fund’s net income decreased for the year ended December 31, 2015, as compared to the year ended December 31, 2014, primarily due to a lesser decline in the price of spot silver in U.S. dollar terms during the year ended December 31, 2015.
| † | On August 14, 2014, the company that ran the London U.S. dollar silver fixing ceased calculating the price of silver for the LBMA. The LBMA selected the CME Group and Thomson Reuters to calculate the price, which was renamed the London Silver Price, beginning August 15, 2014. |
ProShares Short Euro
Fund Performance
The following table provides summary performance information for the Fund for the years ended December 31, 2016, 2015 and 2014:
| Year Ended December 31, 2016 |
Year Ended December 31, 2015 |
Year Ended December 31, 2014 |
||||||||||
| NAV beginning of period | $ | 17,510,898 | $ | 14,021,804 | $ | 8,896,842 | ||||||
| NAV end of period | $ | 15,770,088 | $ | 17,510,898 | $ | 14,021,804 | ||||||
| Percentage change in NAV | (9.9 | )% | 24.9 | % | 57.6 | % | ||||||
| Shares outstanding beginning of period | 400,005 | 350,005 | 250,005 | |||||||||
| Shares outstanding end of period | 350,000 | 400,005 | 350,005 | |||||||||
| Percentage change in shares outstanding | (12.5 | )% | 14.3 | % | 40.0 | % | ||||||
| Shares created | 50,000 | 550,000 | 250,000 | |||||||||
| Shares redeemed | 100,005 | 500,000 | 150,000 | |||||||||
| Per share NAV beginning of period | $ | 43.78 | $ | 40.06 | $ | 35.59 | ||||||
B-35
Table of Contents
| Year Ended December 31, 2016 |
December 31, 2015 |
Year Ended December 31, 2014 |
||||||||||
| Per share NAV end of period |
$ | 45.06 | $ | 43.78 | $ | 40.06 | ||||||
| Percentage change in per share NAV |
2.9 | % | 9.3 | % | 12.6 | % | ||||||
| Percentage change in benchmark |
(3.1 | )% | (10.2 | )% | (12.0 | )% | ||||||
| Benchmark annualized volatility |
8.3 | % | 12.1 | % | 6.1 | % | ||||||
During the year ended December 31, 2016, the decrease in the Fund’s NAV resulted from a decrease from 400,005 outstanding Shares at December 31, 2015 to 350,000 outstanding Shares at December 31, 2016. The decrease in the Fund’s NAV was offset by the cumulative effect of the Fund seeking daily investment results (before fees and expenses) that correspond to the inverse of the daily performance of the spot price of the euro versus the U.S. dollar. By comparison, during the year ended December 31, 2015, the increase in the Fund’s NAV resulted primarily from an increase from 350,005 outstanding Shares at December 31, 2014 to 400,005 outstanding Shares at December 31, 2015. The increase in the Fund’s NAV also resulted in part from the cumulative effect of the Fund seeking daily investment results (before fees and expenses) that correspond to the inverse of the daily performance of the spot price of the euro versus the U.S. dollar. By comparison, during the year ended December 31, 2014, the increase in the Fund’s NAV resulted primarily from an increase from 250,005 outstanding Shares at December 31, 2013 to 350,005 outstanding Shares at December 31, 2014. The increase in the Fund’s NAV also resulted in part from the cumulative effect of the Fund seeking daily investment results (before fees and expenses) that correspond to the inverse of the daily performance of the spot price of the euro versus the U.S. dollar.
For the years ended December 31, 2016, 2015 and 2014, the Fund’s daily performance had a statistical correlation over 0.99 of the inverse of the daily performance of its benchmark. The Fund’s per Share NAV increase of 2.9% for the year ended December 31, 2016, as compared to the Fund’s per Share NAV increase of 9.3% for the year ended December 31, 2015, was primarily due to a lesser appreciation in the value of the assets held by the Fund during the year ended December 31, 2016. The Fund’s per Share NAV increase of 9.3% for the year ended December 31, 2015, as compared to the Fund’s per Share NAV increase of 12.6% for the year ended December 31, 2014, was primarily due to a lesser appreciation in the value of the assets held by the Fund during the year ended December 31, 2015.
During the year ended December 31, 2016, the Fund’s per Share NAV reached its high for the year on December 20, 2016 at $45.67 per Share and reached its low for the year on May 2, 2016 at $41.22 per Share. By comparison, during the year ended December 31, 2015, the Fund’s per Share NAV reached its high for the year on March 13, 2015 at $46.07 per Share and reached its low for the year on January 2, 2015 at $40.37 per Share. By comparison, during the year ended December 31, 2014, the Fund’s per Share NAV reached its high for the year on December 31, 2014 at $40.06 per Share and reached its low for the year on May 6, 2014 at $35.07 per Share.
The benchmark’s decline of 3.1% for the year ended December 31, 2016, as compared to the benchmark’s decline of 10.2% for the year ended December 31, 2015, can be attributed to a lesser decrease in the value of the euro versus the U.S. dollar during the period ended December 31, 2016. By comparison, the benchmark’s decline of 10.2% for the year ended December 31, 2015, as compared to the benchmark’s decline of 12.0% for the year ended December 31, 2014, can be attributed to a lesser decrease in the value of the euro versus the U.S. dollar during the period ended December 31, 2015.
B-36
Table of Contents
Net Income/Loss
The following table provides summary income information for the Fund for the years ended December 31, 2016, 2015 and 2014:
| Year Ended December 31, 2016 |
Year Ended December 31, 2015 |
Year Ended December 31, 2014 |
||||||||||
| Net investment income (loss) |
$ | (122,728 | ) | $ | (178,761 | ) | $ | (118,247 | ) | |||
| Management fee |
153,021 | 179,286 | 121,126 | |||||||||
| Brokerage commission |
2,666 | 3,979 | 1,837 | |||||||||
| Net realized gain (loss) |
663,807 | 1,559,643 | 1,593,450 | |||||||||
| Change in net unrealized appreciation/depreciation |
(110,526 | ) | (142,063 | ) | 418,090 | |||||||
| Net income (loss) |
$ | 430,553 | $ | 1,238,819 | $ | 1,893,293 | ||||||
The Fund’s net income decreased for the year ended December 31, 2016, as compared to the year ended December 31, 2015, primarily due to a lesser decrease in the value of the euro versus the U.S. dollar during the year ended December 31, 2016. The Fund’s net income decreased for the year ended December 31, 2015, as compared to the year ended December 31, 2014, primarily due to a lesser decrease in the value of the euro versus the U.S. dollar and a higher asset base during the year ended December 31, 2015.
ProShares UltraShort Australian Dollar
Fund Performance
The following table provides summary performance information for the Fund for the years ended December 31, 2016, 2015 and 2014:
| Year Ended December 31, 2016 |
Year Ended December 31, 2015 |
Year Ended December 31, 2014 |
||||||||||
| NAV beginning of period | $ | 20,460,679 | $ | 23,120,790 | $ | 27,983,279 | ||||||
| NAV end of period | $ | 16,613,473 | $ | 20,460,679 | $ | 23,120,790 | ||||||
| Percentage change in NAV | (18.8 | )% | (11.5 | )% | (17.4 | )% | ||||||
| Shares outstanding beginning of period | 350,005 | 450,005 | 600,005 | |||||||||
| Shares outstanding end of period | 300,000 | 350,005 | 450,005 | |||||||||
| Percentage change in shares outstanding | (14.3 | )% | (22.2 | )% | (25.0 | )% | ||||||
| Shares created | — | 50,000 | — | |||||||||
| Shares redeemed | 50,005 | 150,000 | 150,000 | |||||||||
| Per share NAV beginning of period | $ | 58.46 | $ | 51.38 | $ | 46.64 | ||||||
| Per share NAV end of period | $ | 55.38 | $ | 58.46 | $ | 51.38 | ||||||
| Percentage change in per share NAV | (5.3 | )% | 13.8 | % | 10.2 | % | ||||||
| Percentage change in benchmark | (1.0 | )% | (10.7 | )% | (8.6 | )% | ||||||
| Benchmark annualized volatility | 11.5 | % | 11.9 | % | 8.4 | % | ||||||
During the year ended December 31, 2016, the decrease in the Fund’s NAV resulted primarily from a decrease from 350,005 outstanding Shares at December 31, 2015 to 300,000 outstanding Shares at December 31, 2016. The decrease in the Fund’s NAV also resulted in part from the cumulative effect of the Fund seeking daily investment results (before fees and expenses) that correspond to 2x of the inverse of the daily performance of the spot price of the Australian dollar versus the U.S. dollar. By comparison, during the year ended December 31, 2015, the decrease in the Fund’s NAV resulted from a decrease from 450,005 outstanding Shares at December 31, 2014 to 350,005 outstanding Shares at December 31, 2015. The decrease in the Fund’s NAV was offset by the cumulative effect of the Fund seeking daily investment results (before fees and expenses) that correspond to 2x of the inverse of the daily performance of the spot price of the Australian dollar versus the U.S. dollar. By comparison, during the year ended December 31, 2014, the decrease in the Fund’s NAV resulted from a decrease from 600,005 outstanding Shares at
B-37
Table of Contents
December 31, 2013 to 450,005 outstanding Shares at December 31, 2014. The decrease in the Fund’s NAV was offset by the cumulative effect of the Fund seeking daily investment results (before fees and expenses) that correspond to 2x of the inverse of the daily performance of the spot price of the Australian dollar versus the U.S. dollar.
For the years ended December 31, 2016, 2015 and 2014, the Fund’s daily performance had a statistical correlation over 0.99 to 2x of the inverse of the daily performance of its benchmark. The Fund’s per Share NAV decrease of 5.3% for the year ended December 31, 2016, as compared to the Fund’s per Share NAV increase of 13.8% for the year ended December 31, 2015, was primarily due to a depreciation in the value of the assets held by the Fund during the year ended December 31, 2016. The Fund’s per Share NAV increase of 13.8% for the year ended December 31, 2015, as compared to the Fund’s per Share NAV increase of 10.2% for the year ended December 31, 2014, was primarily due to a greater appreciation in the value of the assets held by the Fund during the year ended December 31, 2015.
During the year ended December 31, 2016, the Fund’s per Share NAV reached its high for the year on January 15, 2016 at $65.74 per Share and reached its low for the year on November 8, 2016 at $48.14 per Share. By comparison, during the year ended December 31, 2015, the Fund’s per Share NAV reached its high for the year on September 4, 2015 at $66.75 per Share and reached its low for the year on May 13, 2015 at $50.07 per Share. By comparison, during the year ended December 31, 2014, the Fund’s per Share NAV reached its high for the year on December 23, 2014 at $52.32 per Share and reached its low for the year on July 1, 2014 at $39.67 per Share.
The benchmark’s decline of 1.0% for the year ended December 31, 2016, as compared to the benchmark’s decline of 10.7% for the year ended December 31, 2015, can be attributed to a lesser decline in the value of the Australian dollar versus the U.S. dollar during the period ended December 31, 2016. By comparison, the benchmark’s decline of 10.7% for the year ended December 31, 2015, as compared to the benchmark’s decline of 8.6% for the year ended December 31, 2014, can be attributed to a greater decline in the value of the Australian dollar versus the U.S. dollar during the period ended December 31, 2015.
Net Income/Loss
The following table provides summary income information for the Fund for the years ended December 31, 2016, 2015 and 2014:
| Year Ended December 31, 2016 |
Year Ended December 31, 2015 |
Year Ended December 31, 2014 |
||||||||||
| Net investment income (loss) | $ | (145,652 | ) | $ | (209,987 | ) | $ | (213,183 | ) | |||
| Management fee |
175,191 | 199,845 | 208,597 | |||||||||
| Brokerage commission |
13,920 | 16,140 | 12,811 | |||||||||
| Net realized gain (loss) |
(2,786,709 | ) | 4,330,688 | 2,296,708 | ||||||||
| Change in net unrealized appreciation/depreciation |
1,602,889 | (1,164,304 | ) | (175,587 | ) | |||||||
| Net income (loss) |
$ | (1,329,472 | ) | $ | 2,956,397 | $ | 1,907,938 | |||||
The Fund’s net income decreased for the year ended December 31, 2016, as compared to the year ended December 31, 2015, due to a lesser decline in the value of the Australian dollar versus the U.S. dollar during the year ended December 31, 2016. The Fund’s net income increased for the year ended December 31, 2015, as compared to the year ended December 31, 2014, primarily due to a greater decline in the value of the Australian dollar versus the U.S. dollar during the year ended December 31, 2015.
B-38
Table of Contents
ProShares UltraShort Euro
Fund Performance
The following table provides summary performance information for the Fund for the years ended December 31, 2016, 2015 and 2014:
| Year Ended December 31, 2016 |
Year Ended December 31, 2015 |
Year Ended December 31, 2014 |
||||||||||
| NAV beginning of period | $ | 522,306,518 | $ | 517,191,349 | $ | 418,001,115 | ||||||
| NAV end of period | $ | 349,392,650 | $ | 522,306,518 | $ | 517,191,349 | ||||||
| Percentage change in NAV | (33.1 | )% | 1.0 | % | 23.7 | % | ||||||
| Shares outstanding beginning of period | 20,450,014 | 23,950,014 | 24,500,014 | |||||||||
| Shares outstanding end of period | 12,900,000 | 20,450,014 | 23,950,014 | |||||||||
| Percentage change in shares outstanding | (36.9 | )% | (14.6 | )% | (2.2 | )% | ||||||
| Shares created | 650,000 | 12,600,000 | 4,500,000 | |||||||||
| Shares redeemed | 8,200,014 | 16,100,000 | 5,050,000 | |||||||||
| Per share NAV beginning of period | $ | 25.54 | $ | 21.59 | $ | 17.06 | ||||||
| Per share NAV end of period | $ | 27.08 | $ | 25.54 | $ | 21.59 | ||||||
| Percentage change in per share NAV | 6.0 | % | 18.3 | % | 26.6 | % | ||||||
| Percentage change in benchmark | (3.1 | )% | (10.2 | )% | (12.0 | )% | ||||||
| Benchmark annualized volatility | 8.3 | % | 12.1 | % | 6.1 | % | ||||||
During the year ended December 31, 2016, the decrease in the Fund’s NAV resulted from a decrease from 20,450,014 outstanding Shares at December 31, 2015 to 12,900,000 outstanding Shares at December 31, 2016. The decrease in the Fund’s NAV was offset by the cumulative effect of the Fund seeking daily investment results (before fees and expenses) that correspond to 2x of the inverse of the daily performance of the spot price of the euro versus the U.S. dollar. By comparison, during the year ended December 31, 2015, the increase in the Fund’s NAV resulted from the cumulative effect of the Fund seeking daily investment results (before fees and expenses) that correspond to 2x of the inverse of the daily performance of the spot price of the euro versus the U.S. dollar. The increase in the Fund’s NAV was offset by a decrease from 23,950,014 outstanding Shares at December 31, 2014 to 20,450,014 outstanding Shares at December 31, 2015. By comparison, during the year ended December 31, 2014, the increase in the Fund’s NAV resulted primarily from the cumulative effect of the Fund seeking daily investment results (before fees and expenses) that correspond to 2x of the inverse of the daily performance of the spot price of the euro versus the U.S. dollar. The increase in the Fund’s NAV was offset by a decrease from 24,500,014 outstanding Shares at December 31, 2013 to 23,950,014 outstanding Shares at December 31, 2014.
For the years ended December 31, 2016, 2015 and 2014, the Fund’s daily performance had a statistical correlation over 0.99 to 2x of the inverse of the daily performance of its benchmark. The Fund’s per Share NAV increase of 6.0% for the year ended December 31, 2016, as compared to the Fund’s per Share NAV increase of 18.3% for the year ended December 31, 2015, was primarily due to a lesser appreciation in the value of the assets held by the Fund during the year ended December 31, 2016. The Fund’s per Share NAV increase of 18.3% for the year ended December 31, 2015, as compared to the Fund’s per Share NAV increase of 26.6% for the year ended December 31, 2014, was primarily due to a lesser appreciation in the value of the assets held by the Fund during the year ended December 31, 2015.
During the year ended December 31, 2016, the Fund’s per Share NAV reached its high for the year on December 20, 2016 at $27.77 per Share and reached its low for the year on May 2, 2016 at $22.63 per Share. By comparison, during the year ended December 31, 2015, the Fund’s per Share NAV reached its high for the year on March 13, 2015 at $28.50 per Share and reached its low for the year on January 2, 2015 at $21.94 per Share. By comparison, during the year ended December 31, 2014, the Fund’s per Share NAV reached its high for the year on December 31, 2014 at $21.59 per Share and reached its low for the year on May 6, 2014 at $16.52 per Share.
The benchmark’s decline of 3.1% for the year ended December 31, 2016, as compared to the benchmark’s decline of 10.2% for the year ended December 31, 2015, can be attributed to a lesser decline in the value of the euro versus the
B-39
Table of Contents
U.S. dollar during the year ended December 31, 2016. By comparison, the benchmark’s decline of 10.2% for the year ended December 31, 2015, as compared to the benchmark’s decline of 12.0% for the year ended December 31, 2014, can be attributed to a lesser decline in the value of the euro versus the U.S. dollar during the year ended December 31, 2015.
Net Income/Loss
The following table provides summary income information for the Fund for the years ended December 31, 2016, 2015 and 2014:
| Year Ended December 31, 2016 |
Year Ended December 31, 2015 |
Year Ended December 31, 2014 |
||||||||||
| Net investment income (loss) |
$ | (2,764,657 | ) | $ | (5,000,587 | ) | $ | (3,994,145 | ) | |||
| Management fee |
3,777,543 | 5,265,432 | 4,193,741 | |||||||||
| Net realized gain (loss) |
(25,711,276 | ) | 131,674,081 | 83,683,592 | ||||||||
| Change in net unrealized appreciation/depreciation |
44,885,942 | (45,497,112 | ) | 30,499,215 | ||||||||
| Net income (loss) |
$ | 16,410,009 | $ | 81,176,382 | $ | 110,188,662 | ||||||
The Fund’s net income decreased for the year ended December 31, 2016, as compared to the year ended December 31, 2015, primarily due to a lesser decline in the value of the euro versus the U.S. dollar during the year ended December 31, 2016. By comparison, the Fund’s net income decreased for the year ended December 31, 2015, as compared to the year ended December 31, 2014, primarily due to a lesser decline in the value of the euro versus the U.S. dollar during the year ended December 31, 2015.
ProShares UltraShort Yen
Fund Performance
The following table provides summary performance information for the Fund for the years ended December 31, 2016, 2015 and 2014:
| Year Ended December 31, 2016 |
Year Ended December 31, 2015 |
Year Ended December 31, 2014 |
||||||||||
| NAV beginning of period | $ | 237,372,900 | $ | 531,471,873 | $ | 588,121,516 | ||||||
| NAV end of period | $ | 276,781,747 | $ | 237,372,900 | $ | 531,471,873 | ||||||
| Percentage change in NAV | 16.6 | % | (55.3 | )% | (9.6 | )% | ||||||
| Shares outstanding beginning of period | 2,699,294 | 5,949,294 | 8,299,294 | |||||||||
| Shares outstanding end of period | 3,449,290 | 2,699,294 | 5,949,294 | |||||||||
| Percentage change in shares outstanding | 27.8 | % | (54.6 | )% | (28.3 | )% | ||||||
| Shares created | 2,300,000 | 1,350,000 | 2,850,000 | |||||||||
| Shares redeemed | 1,550,004 | 4,600,000 | 5,200,000 | |||||||||
| Per share NAV beginning of period | $ | 87.94 | $ | 89.33 | $ | 70.86 | ||||||
| Per share NAV end of period | $ | 80.24 | $ | 87.94 | $ | 89.33 | ||||||
| Percentage change in per share NAV | (8.8 | )% | (1.6 | )% | 26.1 | % | ||||||
| Percentage change in benchmark | 2.9 | % | (0.4 | )% | (12.1 | )% | ||||||
| Benchmark annualized volatility | 12.6 | % | 8.2 | % | 7.9 | % | ||||||
During the year ended December 31, 2016, the increase in the Fund’s NAV resulted from an increase from 2,699,294 outstanding Shares at December 31, 2015 to 3,449,290 outstanding Shares at December 31, 2016. The increase in the Fund’s NAV was offset by the cumulative effect of the Fund seeking daily investment results (before fees and expenses) that correspond to 2x of the inverse of the daily performance of the spot price of the Japanese yen versus the U.S. dollar. By comparison, during the year ended December 31, 2015, the decrease in the Fund’s NAV resulted primarily from a decrease from 5,949,294 outstanding Shares at December 31, 2014 to 2,699,294 outstanding Shares at December 31, 2015. The decrease in the Fund’s NAV also resulted in part from the cumulative effect of the Fund seeking daily investment results (before fees and expenses) that correspond to 2x of the inverse of the daily performance of the spot price of the Japanese yen versus the U.S. dollar. By comparison,
B-40
Table of Contents
during the year ended December 31, 2014, the decrease in the Fund’s NAV resulted from a decrease from 8,299,294 outstanding Shares at December 31, 2013 to 5,949,294 outstanding Shares at December 31, 2014. The decrease in the Fund’s NAV was offset by the cumulative effect of the Fund seeking daily investment results (before fees and expenses) that correspond to 2x of the inverse of the daily performance of the spot price of the Japanese yen versus the U.S. dollar.
For the years ended December 31, 2016, 2015 and 2014, the Fund’s daily performance had a statistical correlation over 0.99 to 2x of the inverse of the daily performance of its benchmark. The Fund’s per Share NAV decrease of 8.8% for the year ended December 31, 2016, as compared to the Fund’s per Share NAV decrease of 1.6% for the year ended December 31, 2015, was primarily due to a greater depreciation in the value of the assets held by the Fund during the year ended December 31, 2016. The Fund’s per Share NAV decrease of 1.6% % for the year ended December 31, 2015, as compared to the Fund’s per Share NAV increase of 26.1% for the year ended December 31, 2014, was primarily due to a depreciation in the value of the assets held by the Fund during the year ended December 31, 2015.
During the year ended December 31, 2016, the Fund’s per Share NAV reached its high for the year on January 29, 2016 at $88.99 per Share and reached its low for the year on August 18, 2016 at $59.02 per Share. By comparison, during the year ended December 31, 2015, the Fund’s per Share NAV reached its high for the year on June 5, 2015 at $97.30 per Share and reached its low for the year on January 15, 2015 at $84.11 per Share. By comparison, during the year ended December 31, 2014, the Fund’s per Share NAV reached its high for the year on December 5, 2014 at $92.07 per Share and reached its low for the year on July 17, 2014 at $64.75 per Share.
The benchmark’s rise of 2.9% for the year ended December 31, 2016, as compared to the benchmark’s decline of 0.4% for the year ended December 31, 2015, can be attributed to a rise in the value of the Japanese yen versus the U.S. dollar during the year ended December 31, 2016. By comparison, the benchmark’s decline of 0.4% for the year ended December 31, 2015, as compared to the benchmark’s decline of 12.1% for the year ended December 31, 2014, can be attributed to a lesser decline in the value of the Japanese yen versus the U.S. dollar during the year ended December 31, 2015.
Net Income/Loss
The following table provides summary income information for the Fund for the years ended December 31, 2016, 2015 and 2014:
| Year Ended December 31, 2016 |
Year Ended December 31, 2015 |
Year Ended December 31, 2014 |
||||||||||
| Net investment income (loss) |
$ | (1,609,562 | ) | $ | (3,623,678 | ) | $ | (3,741,601 | ) | |||
| Management fee |
2,141,333 | 3,759,492 | 3,938,854 | |||||||||
| Net realized gain (loss) |
(22,226,181 | ) | 8,806,429 | 127,860,058 | ||||||||
| Change in net unrealized appreciation/depreciation |
30,657,216 | (12,347,563 | ) | (30,986,352 | ) | |||||||
| Net income (loss) |
$ | 6,821,473 | $ | (7,164,812 | ) | $ | 93,132,105 | |||||
The Fund’s net income increased for the year ended December 31, 2016, as compared to the year ended December 31, 2015, primarily due to a rise in the value of the Japanese yen versus the U.S. dollar in conjunction with share transactions during the year ended December 31, 2016. By comparison, the Fund’s net income decreased for the year ended December 31, 2015, as compared to the year ended December 31, 2014, primarily due to a lesser decline in the value of the Japanese yen versus the U.S. dollar during the year ended December 31, 2015.
B-41
Table of Contents
ProShares Ultra Bloomberg Crude Oil#
Fund Performance
The following table provides summary performance information for the Fund for the years ended December 31, 2016, 2015 and 2014:
| Year Ended December 31, 2016 |
Year Ended December 31, 2015 |
Year Ended December 31, 2014 |
||||||||||
| NAV beginning of period | $ | 783,922,475 | $ | 450,562,988 | $ | 142,773,429 | ||||||
| NAV end of period | $ | 933,731,860 | $ | 783,922,475 | $ | 450,562,988 | ||||||
| Percentage change in NAV | 19.1 | % | 74.0 | % | 215.6 | % | ||||||
| Shares outstanding beginning of period | 31,163,934 | 4,439,917 | 444,917 | |||||||||
| Shares outstanding end of period | 40,013,933 | 31,163,934 | 4,439,917 | |||||||||
| Percentage change in shares outstanding | 28.4 | % | 601.9 | % | 897.9 | % | ||||||
| Shares created | 62,875,000 | 43,415,000 | 5,040,000 | |||||||||
| Shares redeemed | 54,025,001 | 16,690,983 | 1,045,000 | |||||||||
| Per share NAV beginning of period | $ | 25.15 | $ | 101.48 | $ | 320.90 | ||||||
| Per share NAV end of period | $ | 23.34 | $ | 25.15 | $ | 101.48 | ||||||
| Percentage change in per share NAV | (7.2 | )% | (75.2 | )% | (68.4 | )% | ||||||
| Percentage change in benchmark | 6.7 | % | (44.4 | )% | (41.7 | )% | ||||||
| Benchmark annualized volatility | 44.5 | % | 45.5 | % | 23.7 | % | ||||||
During the year ended December 31, 2016, the increase in the Fund’s NAV resulted from an increase from 31,163,934 outstanding Shares at December 31, 2015 to 40,013,933 outstanding Shares at December 31, 2016. The increase in the Fund’s NAV was offset by the cumulative effect of the Fund seeking daily investment results (before fees and expenses) that correspond to 2x of the daily performance of the Bloomberg WTI Crude Oil SubindexSM. By comparison, during the year ended December 31, 2015, the increase in the Fund’s NAV resulted from an increase from 4,439,917 outstanding Shares at December 31, 2014 to 31,163,934 outstanding Shares at December 31, 2015. The increase in the Fund’s NAV was offset by the cumulative effect of the Fund seeking daily investment results (before fees and expenses) that correspond to 2x of the daily performance of the Bloomberg WTI Crude Oil SubindexSM. By comparison, during the year ended December 31, 2014, the increase in the Fund’s NAV resulted from an increase from 444,917 outstanding Shares at December 31, 2013 to 4,439,917 outstanding Shares at December 31, 2014. The increase in the Fund’s NAV was offset by the cumulative effect of the Fund seeking daily investment results (before fees and expenses) that correspond to 2x of the daily performance of the Bloomberg WTI Crude Oil SubindexSM.
For the years ended December 31, 2016, 2015 and 2014, the Fund’s daily performance had a statistical correlation over 0.99 to 2x of the daily performance of its benchmark. The Fund’s per Share NAV decrease of 7.2% for the year ended December 31, 2016, as compared to the Fund’s per Share NAV decrease of 75.2% for the year ended December 31, 2015, was primarily due to a lesser depreciation in the value of the assets of the Fund during the year ended December 31, 2016. The Fund’s per Share NAV decrease of 75.2% for the year ended December 31, 2015, as compared to the Fund’s per Share NAV decrease of 68.4% for the year ended December 31, 2014, was primarily due to a greater depreciation in the value of the assets of the Fund during the year ended December 31, 2015.
During the year ended December 31, 2016, the Fund’s per Share NAV reached its high for the year on June 8, 2016 at $28.16 per Share and reached its low for the year on February 11, 2016 at $12.02 per Share. By comparison, during the year ended December 31, 2015, the Fund’s per Share NAV reached its high for the year on May 6, 2015 at $101.92 per Share and reached its low for the year on December 21, 2015 at $23.58 per Share. By comparison, during the year ended December 31, 2014, the Fund’s per Share NAV reached its high for the year on June 20, 2014 at $401.40 per Share and reached its low for the year on December 31, 2014 at $101.48 per Share.
The benchmark’s rise of 6.7% for the year ended December 31, 2016, as compared to the benchmark’s decline of 44.4% for the year ended December 31, 2015, can be attributed to an increase in the price of WTI Crude Oil during the year ended December 31, 2016. By comparison, the benchmark’s decline of 44.4% for the year ended December 31, 2015, as compared to the benchmark’s decline of 41.7% for the year ended December 31, 2014, can be attributed to a greater decrease in the price of WTI Crude Oil during the year ended December 31, 2015.
B-42
Table of Contents
Net Income/Loss
The following table provides summary income information for the Fund for the years ended December 31, 2016, 2015 and 2014:
| Year Ended December 31, 2016 |
Year Ended December 31, 2015 |
Year Ended December 31, 2014 |
||||||||||
| Net investment income (loss) | $ | (6,631,380 | ) | $ | (8,473,155 | ) | $ | (1,766,364 | ) | |||
| Management fee | 8,263,078 | 8,230,180 | 1,769,248 | |||||||||
| Brokerage commission | 538,935 | 639,133 | 65,408 | |||||||||
| Net realized gain (loss) | 74,043,666 | (896,154,368 | ) | (243,314,151 | ) | |||||||
| Change in net unrealized appreciation/depreciation |
151,007,102 | 32,543,124 | (125,247,771 | ) | ||||||||
| Net income (loss) | $ | 218,419,388 | $ | (872,084,399 | ) | $ | (370,328,286 | ) | ||||
The Fund’s net income increased for the year ended December 31, 2016, as compared to the year ended December 31, 2015, primarily due to an increase in the price of WTI Crude Oil during the year ended December 31, 2016. By comparison, the Fund’s net income decreased for the year ended December 31, 2015, as compared to the year ended December 31, 2014, primarily due to a greater decrease in the price of WTI Crude Oil during the year ended December 31, 2015.
| # | See Note 9 of the Notes to Financial Statements in Item 15 of Part IV in this Annual Report on Form 10-K regarding the reverse Share split for ProShares Ultra Bloomberg Crude Oil. |
ProShares Ultra Bloomberg Natural Gas
Fund Performance
The following table provides summary performance information for the Fund for the years ended December 31, 2016, 2015 and 2014:
| Year Ended December 31, 2016 |
Year Ended December 31, 2015 |
Year Ended December 31, 2014 |
||||||||||
| NAV beginning of period | $ | 38,851,184 | $ | 70,433,207 | $ | 62,915,779 | ||||||
| NAV end of period | $ | 43,203,386 | $ | 38,851,184 | $ | 70,433,207 | ||||||
| Percentage change in NAV | 11.2 | % | (44.8 | )% | 11.9 | % | ||||||
| Shares outstanding beginning of period | 2,092,170 | 1,142,485 | 404,985 | |||||||||
| Shares outstanding end of period | 2,292,169 | 2,092,170 | 1,142,485 | |||||||||
| Percentage change in shares outstanding | 9.6 | % | 83.1 | % | 182.1 | % | ||||||
| Shares created | 3,450,000 | 2,137,500 | 1,437,500 | |||||||||
| Shares redeemed | 3,250,001 | 1,187,815 | 700,000 | |||||||||
| Per share NAV beginning of period | $ | 18.57 | $ | 61.65 | $ | 155.35 | ||||||
| Per share NAV end of period | $ | 18.85 | $ | 18.57 | $ | 61.65 | ||||||
| Percentage change in per share NAV | 1.5 | % | (69.9 | )% | (60.3 | )% | ||||||
| Percentage change in benchmark | 10.0 | % | (40.0 | )% | (30.7 | )% | ||||||
| Benchmark annualized volatility | 40.3 | % | 40.4 | % | 42.1 | % | ||||||
During the year ended December 31, 2016, the increase in the Fund’s NAV resulted primarily from an increase from 2,092,170 outstanding Shares at December 31, 2015 to 2,292,169 outstanding Shares at December 31, 2016. The increase in the Fund’s NAV also resulted in part from the cumulative effect of the Fund seeking daily investment results (before fees and expenses) that correspond to 2x of the daily performance of the Bloomberg Natural Gas SubindexSM. By comparison, during the year ended December 31, 2015, the decrease in the Fund’s NAV resulted from the cumulative effect of the Fund seeking daily investment results (before fees and expenses) that correspond to 2x of the daily performance of the Bloomberg Natural Gas SubindexSM. The decrease in the Fund’s NAV was
B-43
Table of Contents
offset by an increase from 1,142,485 outstanding Shares at December 31, 2014 to 2,092,170 outstanding Shares at December 31, 2015. By comparison, during the year ended December 31, 2014, the increase in the Fund’s NAV resulted from an increase from 404,985 outstanding Shares at December 31, 2013 to 1,142,485 outstanding Shares at December 31, 2014. The increase in the Fund’s NAV was offset by the cumulative effect of the Fund seeking daily investment results (before fees and expenses) that correspond to 2x of the daily performance of the Bloomberg Natural Gas SubindexSM.
For the years ended December 31, 2016, 2015 and 2014, the Fund’s daily performance had a statistical correlation over 0.99 to 2x of the daily performance of its benchmark. The Fund’s per Share NAV increase of 1.5% for the year ended December 31, 2016, as compared to the Fund’s per Share NAV decrease of 69.9% for the year ended December 31, 2015, was primarily due to an appreciation in the value of the assets of the Fund during the year ended December 31, 2016. The Fund’s per Share NAV decrease of 69.9% for the year ended December 31, 2015, as compared to the Fund’s per Share NAV decrease of 60.3% for the year ended December 31, 2014, was primarily due to a greater depreciation in the value of the assets of the Fund during the year ended December 31, 2015.
During the year ended December 31, 2016, the Fund’s per Share NAV reached its high for the year on December 28, 2016 at $20.33 per Share and reached its low for the year on March 3, 2016 at $8.89 per Share. By comparison, during the year ended December 31, 2015, the Fund’s per Share NAV reached its high for the year on January 14, 2015 at $74.33 per Share and reached its low for the year on December 16, 2015 at $12.83 per Share. By comparison, during the year ended December 31, 2014, the Fund’s per Share NAV reached its high for the year on January 29, 2014 at $255.12 per Share and reached its low for the year on December 31, 2014 at $61.65 per Share.
The benchmark’s rise of 10.0% for the year ended December 31, 2016, as compared to the benchmark’s decline of 40.0% for the year ended December 31, 2015, can be attributed to an increase in the price of Henry Hub Natural Gas during the year ended December 31, 2016. By comparison, the benchmark’s decline of 40.0% for the year ended December 31, 2015, as compared to the benchmark’s decline of 30.7% for the year ended December 31, 2014, can be attributed to a greater decrease in the price of Henry Hub Natural Gas during the year ended December 31, 2015.
B-44
Table of Contents
Net Income/Loss
The following table provides summary income information for the Fund for the years ended December 31, 2016, 2015 and 2014:
| Year Ended December 31, 2016 |
Year Ended December 31, 2015 |
Year Ended December 31, 2014 |
||||||||||
| Net investment income (loss) |
$ | (384,486 | ) | $ | (761,335 | ) | $ | (528,581 | ) | |||
| Management fee |
325,435 | 574,158 | 455,794 | |||||||||
| Brokerage commission |
131,994 | 207,344 | 88,748 | |||||||||
| Net realized gain (loss) |
17,571,111 | (100,772,476 | ) | (6,459,728 | ) | |||||||
| Change in net unrealized appreciation/depreciation |
(3,776,978 | ) | 41,201,866 | (31,234,281 | ) | |||||||
| Net income (loss) |
$ | 13,409,647 | $ | (60,331,945 | ) | $ | (38,222,590 | ) | ||||
The Fund’s net income increased for the year ended December 31, 2016, as compared to the year ended December 31, 2015, primarily due to an increase in the price of Henry Hub Natural Gas during the year ended December 31, 2016. By comparison, the Fund’s net income decreased for the year ended December 31, 2015, as compared to the year ended December 31, 2014, primarily due to a greater decrease in the price of Henry Hub Natural Gas during the year ended December 31, 2015.
ProShares Ultra Gold
Fund Performance
The following table provides summary performance information for the Fund for the years ended December 31, 2016, 2015 and 2014:
| Year Ended December 31, 2016 |
Year Ended December 31, 2015 |
Year Ended December 31, 2014 |
||||||||||
| NAV beginning of period |
$ | 69,864,815 | $ | 102,003,345 | $ | 132,017,405 | ||||||
| NAV end of period |
$ | 92,127,200 | $ | 69,864,815 | $ | 102,003,345 | ||||||
| Percentage change in NAV |
31.9 | % | (31.5 | )% | (22.7 | )% | ||||||
| Shares outstanding beginning of period |
2,350,014 | 2,550,014 | 3,200,014 | |||||||||
| Shares outstanding end of period |
2,800,000 | 2,350,014 | 2,550,014 | |||||||||
| Percentage change in shares outstanding |
19.1 | % | (7.8 | )% | (20.3 | )% | ||||||
| Shares created |
1,050,000 | 150,000 | 300,000 | |||||||||
| Shares redeemed |
600,014 | 350,000 | 950,000 | |||||||||
| Per share NAV beginning of period |
$ | 29.73 | $ | 40.00 | $ | 41.26 | ||||||
| Per share NAV end of period |
$ | 32.90 | $ | 29.73 | $ | 40.00 | ||||||
| Percentage change in per share NAV |
10.7 | % | (25.7 | )% | (3.1 | )% | ||||||
| Percentage change in benchmark |
8.1 | % | (12.1 | )% | 0.1 | % | ||||||
| Benchmark annualized volatility |
16.5 | % | 14.4 | % | 12.9 | % | ||||||
During the year ended December 31, 2016, the increase in the Fund’s NAV resulted primarily from an increase from 2,350,014 outstanding Shares at December 31, 2015 to 2,800,000 outstanding Shares at December 31, 2016. The increase in the Fund’s NAV also resulted in part from the cumulative effect of the Fund seeking daily investment results (before fees and expenses) that correspond to 2x of the daily performance of gold bullion as measured by the U.S. dollar p.m. LBMA Gold Price. By comparison, during the year ended December 31, 2015, the decrease in the Fund’s NAV resulted primarily from a decrease from 2,550,014 outstanding Shares at December 31, 2014 to 2,350,014 outstanding Shares at December 31, 2015. The decrease in the Fund’s NAV also resulted in part from the cumulative effect of the Fund seeking daily investment results (before fees and expenses) that correspond to 2x of the daily performance of gold bullion as measured by the U.S. dollar p.m. LBMA Gold Price†. By comparison,
B-45
Table of Contents
during the year ended December 31, 2014, the decrease in the Fund’s NAV resulted primarily from the cumulative effect of the Fund seeking daily investment results (before fees and expenses) that correspond to 2x of the daily performance of gold bullion as measured by the U.S. dollar p.m. fixing price for delivery in London. The decrease in the Fund’s NAV also resulted in part from a decrease from 3,200,014 outstanding Shares at December 31, 2013 to 2,550,014 outstanding Shares at December 31, 2014.
For the years ended December 31, 2016, 2015 and 2014, the Fund’s daily performance had a statistical correlation over 0.99 to 2x of the daily performance of its benchmark. The Fund’s per Share NAV increase of 10.7% for the year ended December 31, 2016, as compared to the Fund’s per Share NAV decrease of 25.7% for the year ended December 31, 2015 was primarily due to appreciation in the value of the assets of the Fund during the year ended December 31, 2016. By comparison, the Fund’s per Share NAV decrease of 25.7% for the year ended December 31, 2015, as compared to the Fund’s per Share NAV decrease of 3.1% for the year ended December 31, 2014, was primarily due to a greater depreciation in the value of the assets of the Fund during the year ended December 31, 2015.
During the year ended December 31, 2016, the Fund’s per Share NAV reached its high for the year on July 6, 2016 at $47.89 per Share and reached its low for the year on January 5, 2016 at $30.67 per Share. By comparison, during the year ended December 31, 2015, the Fund’s per Share NAV reached its high for the year on January 22, 2015 at $46.03 per Share and reached its low for the year on December 17, 2015 at $29.17 per Share. By comparison, during the year ended December 31, 2014, the Fund’s per Share NAV reached its high for the year on March 14, 2014 at $54.16 per Share and reached its low for the year on November 5, 2014 at $36.05 per Share.
The benchmark’s rise of 8.1% for the year ended December 31, 2016, as compared to the benchmark’s decline of 12.1% for the year ended December 31, 2015, can be attributed to an increase in the price of spot gold in U.S. dollar terms during the year ended December 31, 2016. By comparison, the benchmark’s decline of 12.1% for the year ended December 31, 2015, as compared to the benchmark’s rise of 0.1% for the year ended December 31, 2014, can be attributed to a decrease in the price of spot gold in U.S. dollar terms during the year ended December 31, 2015.
Net Income/Loss
The following table provides summary income information for the Fund for the years ended December 31, 2016, 2015 and 2014:
| Year Ended December 31, 2016 |
Year Ended December 31, 2015 |
Year Ended December 31, 2014 |
||||||||||
| Net investment income (loss) |
$ | (650,951 | ) | $ | (796,424 | ) | $ | (1,157,348 | ) | |||
| Management fee |
900,227 | 839,083 | 1,212,064 | |||||||||
| Brokerage commission |
43 | 41 | 39 | |||||||||
| Net realized gain (loss) |
5,815,759 | (18,606,208 | ) | (9,672,972 | ) | |||||||
| Change in net unrealized appreciation/depreciation |
(2,198,661 | ) | (4,309,443 | ) | 8,888,643 | |||||||
| Net income (loss) |
$ | 2,966,147 | $ | (23,712,075 | ) | $ | (1,941,677 | ) | ||||
The Fund’s net income increased for the year ended December 31, 2016, as compared to the year ended December 31, 2015, primarily due to increase in the price of spot gold in U.S. dollar terms in conjunction with share transactions during the year ended December 31, 2016. By comparison, the Fund’s net income decreased for the year ended December 31, 2015, as compared to the year ended December 31, 2014, primarily due to a decrease in the price of spot gold in U.S. dollar terms in conjunction with share transactions during the year ended December 31, 2015.
| † | On March 19, 2015, the company that ran the London U.S. dollar gold fixing ceased calculating the price of gold for the LBMA. The LBMA selected ICE Benchmark Administration to calculate the price, which was renamed the LBMA Gold Price, and is based on an electronic, physically settled auction-based methodology, beginning on March 20, 2015. |
B-46
Table of Contents
ProShares Ultra Silver
Fund Performance
The following table provides summary performance information for the Fund for the years ended December 31, 2016, 2015 and 2014:
| Year Ended December 31, 2016 |
Year Ended December 31, 2015 |
Year Ended December 31, 2014 |
||||||||||
| NAV beginning of period |
$ | 216,416,642 | $ | 291,169,743 | $ | 465,479,519 | ||||||
| NAV end of period |
$ | 275,779,940 | $ | 216,416,642 | $ | 291,169,743 | ||||||
| Percentage change in NAV |
27.4 | % | (25.7 | )% | (37.4 | )% | ||||||
| Shares outstanding beginning of period |
7,996,533 | 7,396,533 | 7,350,007 | |||||||||
| Shares outstanding end of period |
8,246,526 | 7,996,533 | 7,396,533 | |||||||||
| Percentage change in shares outstanding |
3.1 | % | 8.1 | % | 0.6 | % | ||||||
| Shares created |
2,800,000 | 2,700,000 | 2,487,500 | |||||||||
| Shares redeemed |
2,550,007 | 2,100,000 | 2,440,974 | |||||||||
| Per share NAV beginning of period |
$ | 27.06 | $ | 39.37 | $ | 63.33 | ||||||
| Per share NAV end of period |
$ | 33.44 | $ | 27.06 | $ | 39.37 | ||||||
| Percentage change in per share NAV |
23.6 | % | (31.3 | )% | (37.8 | )% | ||||||
| Percentage change in benchmark |
17.5 | % | (13.5 | )% | (18.1 | )% | ||||||
| Benchmark annualized volatility |
27.8 | % | 24.1 | % | 21.8 | % | ||||||
During the year ended December 31, 2016, the increase in the Fund’s NAV resulted primarily from the cumulative effect of the Fund seeking daily investment results (before fees and expenses) that correspond to 2x of the daily performance of the silver bullion as measured by the London Silver Price. The increase in the Fund’s NAV also resulted in part from an increase from 7,996,533 outstanding Shares at December 31, 2015 to 8,246,526 outstanding Shares at December 31, 2016. By comparison, during the year ended December 31, 2015, the decrease in the Fund’s NAV resulted from the cumulative effect of the Fund seeking daily investment results (before fees and expenses) that correspond to 2x of the daily performance of silver bullion as measured by the London Silver Price†. The decrease in the Fund’s NAV was offset by an increase from 7,396,533 outstanding Shares at December 31, 2014 to 7,996,533 outstanding Shares at December 31, 2015. By comparison, during the year ended December 31, 2014, the decrease in the Fund’s NAV resulted from the cumulative effect of the Fund seeking daily investment results (before fees and expenses) that correspond to 2x of the daily performance of silver bullion as measured by the London Silver Price†. The decrease in the Fund’s NAV was offset by an increase from 7,350,007 outstanding Shares at December 31, 2013 to 7,396,533 outstanding Shares at December 31, 2014.
For the years ended December 31, 2016, 2015 and 2014, the Fund’s daily performance had a statistical correlation over 0.99 to 2x of the daily performance of its benchmark. The Fund’s per Share NAV increase of 23.6% for the year ended December 31, 2016, as compared to the Fund’s per Share NAV decrease of 31.3% for the year ended December 31, 2015, was primarily due to an appreciation in the value of the assets of the Fund during the year ended December 31, 2016. By comparison, the Fund’s per Share NAV decrease of 31.3% for the year ended December 31, 2015, as compared to the Fund’s per Share NAV decrease of 37.8% for the year ended December 31, 2014, was primarily due to a lesser depreciation in the value of the assets of the Fund during the year ended December 31, 2015.
During the year ended December 31, 2016, the Fund’s per Share NAV reached its high for the year on August 2, 2016 at $57.12 per Share and reached its low for the year on January 28, 2016 at $25.96 per Share. By comparison, during the year ended December 31, 2015, the Fund’s per Share NAV reached its high for the year on January 23, 2015 at $50.86 per Share and reached its low for the year on December 14, 2015 at $26.73 per Share. By comparison, during the year ended December 31, 2014, the Fund’s per Share NAV reached its high for the year on February 24, 2014 at $80.11 per Share and reached its low for the year on November 6, 2014 at $36.63 per Share.
The benchmark’s rise of 17.5% for the year ended December 31, 2016, as compared to the benchmark’s decline of 13.5% for the year ended December 31, 2015, can be attributed to a rise in the price of spot silver in U.S. dollar
B-47
Table of Contents
terms during the year ended December 31, 2016. By comparison, the benchmark’s decline of 13.5% for the year ended December 31, 2015, as compared to the benchmark’s decline of 18.1% for the year ended December 31, 2014, can be attributed to a lesser decline in the price of spot silver in U.S. dollar terms during the year ended December 31, 2015.
Net Income/Loss
The following table provides summary income information for the Fund for the years ended December 31, 2016, 2015 and 2014:
| Year Ended December 31, 2016 |
Year Ended December 31, 2015 |
Year Ended December 31, 2014 |
||||||||||
| Net investment income (loss) |
$ | (2,179,392 | ) | $ | (2,507,859 | ) | $ | (3,968,608 | ) | |||
| Management fee |
3,021,562 | 2,664,160 | 4,148,207 | |||||||||
| Brokerage commission |
45 | 52 | 43 | |||||||||
| Net realized gain (loss) |
62,342,586 | (78,309,750 | ) | (155,543,194 | ) | |||||||
| Change in net unrealized appreciation/depreciation |
1,571,491 | (10,182,576 | ) | (9,900,963 | ) | |||||||
| Net income (loss) |
$ | 61,734,685 | $ | (91,000,185 | ) | $ | (169,412,765 | ) | ||||
The Fund’s net income increased for the year ended December 31, 2016, as compared to the year ended December 31, 2015, primarily due to a rise in the price of spot silver in U.S. dollar terms during the year ended December 31, 2016. By comparison, the Fund’s net income increased for the year ended December 31, 2015, as compared to the year ended December 31, 2014, primarily due to a lesser decline in the price of spot silver in U.S. dollar terms during the year ended December 31, 2015.
| † | On August 14, 2014, the company that ran the London U.S. dollar silver fixing ceased calculating the price of silver for the LBMA. The LBMA selected the CME Group and Thomson Reuters to calculate the price, which was renamed the London Silver Price, beginning August 15, 2014. |
ProShares Ultra Euro
Fund Performance
The following table provides summary performance information for the Fund for the years ended December 31, 2016, 2015 and 2014:
| Year Ended December 31, 2016 |
Year Ended December 31, 2015 |
Year Ended December 31, 2014 |
||||||||||
| NAV beginning of period |
$ | 10,857,730 | $ | 2,981,441 | $ | 2,603,827 | ||||||
| NAV end of period |
$ | 11,914,585 | $ | 10,857,730 | $ | 2,981,441 | ||||||
| Percentage change in NAV |
9.7 | % | 264.2 | % | 14.5 | % | ||||||
| Shares outstanding beginning of period |
700,014 | 150,014 | 100,014 | |||||||||
| Shares outstanding end of period |
850,000 | 700,014 | 150,014 | |||||||||
| Percentage change in shares outstanding |
21.4 | % | 366.6 | % | 50.0 | % | ||||||
| Shares created |
300,000 | 950,000 | 50,000 | |||||||||
| Shares redeemed |
150,014 | 400,000 | — | |||||||||
| Per share NAV beginning of period |
$ | 15.51 | $ | 19.87 | $ | 26.03 | ||||||
| Per share NAV end of period |
$ | 14.02 | $ | 15.51 | $ | 19.87 | ||||||
| Percentage change in per share NAV |
(9.6 | )% | (21.9 | )% | (23.7 | )% | ||||||
| Percentage change in benchmark |
(3.1 | )% | (10.2 | )% | (12.0 | )% | ||||||
| Benchmark annualized volatility |
8.3 | % | 12.1 | % | 6.1 | % | ||||||
B-48
Table of Contents
During the year ended December 31, 2016, the increase in the Fund’s NAV resulted from an increase from 700,014 outstanding Shares at December 31, 2015 to 850,000 outstanding Shares at December 31, 2016. The increase in the Fund’s NAV was offset by the cumulative effect of the Fund seeking daily investment results (before fees and expenses) that correspond to 2x of the daily performance of the spot price of the euro versus the U.S. dollar. By comparison, during the year ended December 31, 2015, the increase in the Fund’s NAV resulted from an increase from 150,014 outstanding Shares at December 31, 2014 to 700,014 outstanding Shares at December 31, 2015. The increase in the Fund’s NAV was offset by the cumulative effect of the Fund seeking daily investment results (before fees and expenses) that correspond to 2x of the daily performance of the spot price of the euro versus the U.S. dollar. By comparison, during the year ended December 31, 2014, the increase in the Fund’s NAV resulted from an increase from 100,014 outstanding Shares at December 31, 2013 to 150,014 outstanding Shares at December 31, 2014. The increase in the Fund’s NAV was offset by the cumulative effect of the Fund seeking daily investment results (before fees and expenses) that correspond to 2x of the daily performance of the spot price of the euro versus the U.S. dollar.
For the years ended December 31, 2016, 2015 and 2014, the Fund’s daily performance had a statistical correlation over 0.99 to 2x of the daily performance of its benchmark. The Fund’s per Share NAV decrease of 9.6% for the year ended December 31, 2016, as compared to the Fund’s per Share NAV decrease of 21.9% for the year ended December 31, 2015, was primarily due to a lesser depreciation in the value of the assets held by the Fund during the year ended December 31, 2016. The Fund’s per Share NAV decrease of 21.9% for the year ended December 31, 2015, as compared to the Fund’s per Share NAV decrease of 23.7% for the year ended December 31, 2014, was primarily due to a lesser depreciation in the value of the assets held by the Fund during the year ended December 31, 2015.
During the year ended December 31, 2016, the Fund’s per Share NAV reached its high for the year on April 1, 2016 at $17.23 per Share and reached its low for the year on December 20, 2016 at $13.68 per Share. By comparison, during the year ended December 31, 2015, the Fund’s per Share NAV reached its high for the year on January 2, 2015 at $19.55 per Share and reached its low for the year on November 30, 2015 at $14.73 per Share. By comparison, during the year ended December 31, 2014, the Fund’s per Share NAV reached its high for the year on March 18, 2014 at $26.63 per Share and reached its low for the year on December 31, 2014 at $19.87 per Share.
The benchmark’s decline of 3.1% for the year ended December 31, 2016, as compared to the benchmark’s decline of 10.2% for the year ended December 31, 2015, can be attributed to a lesser decline in the value of the euro versus the U.S. dollar during the year ended December 31, 2016. By comparison, the benchmark’s decline of 10.2% for the year ended December 31, 2015, as compared to the benchmark’s decline of 12.0% for the year ended December 31, 2014, can be attributed to a lesser decrease in the value of the euro versus the U.S. dollar during the year ended December 31, 2015.
Net Income/Loss
The following table provides summary income information for the Fund for the years ended December 31, 2016, 2015 and 2014:
| Year Ended December 31, 2016 |
Year Ended December 31, 2015 |
Year Ended December 31, 2014 |
||||||||||
| Net investment income (loss) |
$ | (74,522 | ) | $ | (104,071 | ) | $ | (22,247 | ) | |||
| Management fee |
99,537 | 106,868 | 23,330 | |||||||||
| Net realized gain (loss) |
139,113 | (1,982,317 | ) | (420,528 | ) | |||||||
| Change in net unrealized appreciation/depreciation |
(1,178,425 | ) | 707,922 | (204,515 | ) | |||||||
| Net income (loss) |
$ | (1,113,834 | ) | $ | (1,378,466 | ) | $ | (647,290 | ) | |||
The Fund’s net income increased for the year ended December 31, 2016, as compared to the year ended December 31, 2015, primarily due to a lesser decrease in the value of the euro versus the U.S. dollar during the year ended December 31, 2016. By comparison, the Fund’s net income decreased for the year ended December 31, 2015, as compared to the year ended December 31, 2014, primarily due to a lesser decrease in the value of the euro versus the U.S. dollar during the year ended December 31, 2015.
B-49
Table of Contents
ProShares Ultra Yen
Fund Performance
The following table provides summary performance information for the Fund for the years ended December 31, 2016, 2015 and 2014:
| Year Ended December 31, 2016 |
Year Ended December 31, 2015 |
Year Ended December 31, 2014 |
||||||||||
| NAV beginning of period |
$ | 5,473,848 | $ | 2,118,028 | $ | 2,795,026 | ||||||
| NAV end of period |
$ | 5,540,957 | $ | 5,473,848 | $ | 2,118,028 | ||||||
| Percentage change in NAV |
1.2 | % | 158.4 | % | (24.2 | )% | ||||||
| Shares outstanding beginning of period |
99,974 | 37,504 | 37,504 | |||||||||
| Shares outstanding end of period |
99,970 | 99,974 | 37,504 | |||||||||
| Percentage change in shares outstanding |
0.0 | % | 166.6 | % | 0.0 | % | ||||||
| Shares created |
— | 75,000 | 12,500 | |||||||||
| Shares redeemed |
4 | 12,530 | 12,500 | |||||||||
| Per share NAV beginning of period |
$ | 54.75 | $ | 56.47 | $ | 74.53 | ||||||
| Per share NAV end of period |
$ | 55.43 | $ | 54.75 | $ | 56.47 | ||||||
| Percentage change in per share NAV |
1.2 | % | (3.0 | )% | (24.2 | )% | ||||||
| Percentage change in benchmark |
2.9 | % | (0.4 | )% | (12.1 | )% | ||||||
| Benchmark annualized volatility |
12.6 | % | 8.2 | % | 7.9 | % | ||||||
During the year ended December 31, 2016, the increase in the Fund’s NAV resulted from the cumulative effect of the Fund seeking daily investment results (before fees and expenses) that correspond to 2x of the daily performance of the spot price of the Japanese yen versus the U.S. dollar during the year ended December 31, 2016. The increase in the Fund’s NAV was offset by a decrease from 99,974 outstanding Shares at December 31, 2015 to 99,970 outstanding Shares at December 31, 2016. By comparison, during the year ended December 31, 2015, the increase in the Fund’s NAV resulted from an increase from 37,504 outstanding Shares at December 31, 2014 to 99,974 outstanding Shares at December 31, 2015. The increase in the Fund’s NAV was offset by the cumulative effect of the Fund seeking daily investment results (before fees and expenses) that correspond to 2x of the daily performance of the spot price of the Japanese yen versus the U.S. dollar during the year ended December 31, 2015. By comparison, during the year ended December 31, 2014, the decrease in the Fund’s NAV resulted from the cumulative effect of the Fund seeking daily investment results (before fees and expenses) that correspond to 2x of the daily performance of the spot price of the Japanese yen versus the U.S. dollar during the year ended December 31, 2014. There was no net change in the Fund’s outstanding Shares from December 31, 2013 to December 31, 2014.
For the years ended December 31, 2016, 2015 and 2014, the Fund’s daily performance had a statistical correlation over 0.99 to 2x of the daily performance of its benchmark. The Fund’s per Share NAV increase of 1.2% for the year ended December 31, 2016, as compared to the Fund’s per Share NAV decrease of 3.0% for the year ended December 31, 2015, was primarily due to an appreciation in the value of the assets held by the Fund during the year ended December 31, 2016. The Fund’s per Share NAV decrease of 3.0% for the year ended December 31, 2015, as compared to the Fund’s per Share NAV decrease of 24.2% for the year ended December 31, 2014, was primarily due to a lesser depreciation in the value of the assets held by the Fund during the year ended December 31, 2015.
During the year ended December 31, 2016, the Fund’s per Share NAV reached its high for the year on August 18, 2016 at $77.06 per Share and reached its low for the year on January 29, 2016 at $53.85 per Share. By comparison, during the year ended December 31, 2015, the Fund’s per Share NAV reached its high for the year on January 15, 2015 at $59.83 per Share and reached its low for the year on June 5, 2015 at $50.86 per Share. By comparison, during the year ended December 31, 2014, the Fund’s per Share NAV reached its high for the year on February 3, 2014 at $80.84 per Share and reached its low for the year on December 5, 2014 at $55.12 per Share.
B-50
Table of Contents
The benchmark’s rise of 2.9% for the year ended December 31, 2016, as compared to the benchmark’s decline of 0.4% for the year ended December 31, 2015, can be attributed to a rise in the value of the Japanese yen versus the U.S. dollar during the year ended December 31, 2016. By comparison, the benchmark’s decline of 0.4% for the year ended December 31, 2015, as compared to the benchmark’s decline of 12.1% for the year ended December 31, 2014, can be attributed to a lesser decline in the value of the Japanese yen versus the U.S. dollar during the year ended December 31, 2015.
Net Income/Loss
The following table provides summary income information for the Fund for the years ended December 31, 2016, 2015 and 2014:
| Year Ended December 31, 2016 |
Year Ended December 31, 2015 |
Year Ended December 31, 2014 |
||||||||||
| Net investment income (loss) |
$ | (45,847 | ) | $ | (44,423 | ) | $ | (20,862 | ) | |||
| Management fee |
62,705 | 48,032 | 21,963 | |||||||||
| Net realized gain (loss) |
717,052 | (472,907 | ) | (540,304 | ) | |||||||
| Change in net unrealized appreciation/depreciation |
(603,897 | ) | 276,816 | 143,775 | ||||||||
| Net income (loss) |
$ | 67,308 | $ | (240,514 | ) | $ | (417,391 | ) | ||||
The Fund’s net income increased for the year ended December 31, 2016, as compared to the year ended December 31, 2015, primarily due to a rise in the value of the Japanese yen versus the U.S. dollar during the year ended December 31, 2016. By comparison, the Fund’s net income increased for the year ended December 31, 2015, as compared to the year ended December 31, 2014, primarily due to a lesser decline in the value of the Japanese yen versus the U.S. dollar during the year ended December 31, 2015.
B-51
Table of Contents
Quantitative and Qualitative Disclosures About Market Risk.
Quantitative Disclosure
Equity Market Volatility Sensitivity
Each of the VIX Funds is exposed to equity market volatility risk through its holdings of Financial Instruments. The following tables provide information about each of the VIX Funds’ Financial Instruments, which are sensitive to changes in equity market volatility indexes. As of December 31, 2016 and 2015, each of the VIX Funds’ positions were as follows:
ProShares VIX Short-Term Futures ETF
As of December 31, 2016 and 2015, the ProShares VIX Short-Term Futures ETF Fund was exposed to equity market volatility risk through its holding of VIX futures contracts. The following table provides information about the Fund’s positions in VIX futures contracts as of December 31, 2016 and 2015, which were sensitive to equity market volatility risk.
Futures Positions as of December 31, 2016
| Contract |
Long or Short |
Expiration | Contracts | Valuation Price |
Contract Multiplier |
Notional Amount at Value |
||||||||||||||
| VIX Futures (CBOE) |
Long | January 2017 | 6,549 | $ | 15.13 | 1,000 | $ | 99,053,625 | ||||||||||||
| VIX Futures (CBOE) |
Long | February 2017 | 4,560 | 16.58 | 1,000 | 75,582,000 | ||||||||||||||
Futures Positions as of December 31, 2015
| Contract |
Long or Short |
Expiration | Contracts | Valuation Price |
Contract Multiplier |
Notional Amount at Value |
||||||||||||||
| VIX Futures (CBOE) |
Long | January 2016 | 2,821 | $ | 18.53 | 1,000 | $ | 52,259,025 | ||||||||||||
| VIX Futures (CBOE) |
Long | February 2016 | 2,821 | 18.88 | 1,000 | 53,246,375 | ||||||||||||||
The December 31, 2016 and 2015 futures notional values are calculated by multiplying the number of contracts held times the valuation price times the contract multiplier. The notional values will increase (decrease) proportionally with increases (decreases) in the price of the futures contract. Additional gains (losses) associated with these contracts will be equal to any such subsequent increases (decreases) in notional values, before accounting for spreads or transaction or financing costs. The Fund will generally attempt to adjust its positions in Financial Instruments each day to match the performance of the Index. While the above information properly represents the then current equity price risk and is adequate for estimating the following day’s gains or losses, estimates of future values over longer periods should take the Fund’s daily rebalancing efforts into account. Future period returns, before fees and expenses, cannot be estimated simply by estimating the return of the Index. See “Item 1A. Risk Factors” in this Annual Report on Form 10-K for additional information regarding performance for periods longer than a single day.
ProShares VIX Mid-Term Futures ETF
As of December 31, 2016 and 2015, the ProShares VIX Mid-Term Futures ETF Fund was exposed to equity market volatility risk through its holding of VIX futures contracts. The following table provides information about the Fund’s positions in VIX futures contracts as of December 31, 2016 and 2015, which were sensitive to equity market volatility risk.
B-52
Table of Contents
Futures Positions as of December 31, 2016
| Contract |
Long or Short |
Expiration | Contracts | Valuation Price |
Contract Multiplier |
Notional Amount at Value |
||||||||||||||
| VIX Futures (CBOE) |
Long | April 2017 | 474 | $ | 18.43 | 1,000 | $ | 8,733,450 | ||||||||||||
| VIX Futures (CBOE) |
Long | May 2017 | 806 | 18.83 | 1,000 | 15,172,950 | ||||||||||||||
| VIX Futures (CBOE) |
Long | June 2017 | 807 | 19.08 | 1,000 | 15,393,525 | ||||||||||||||
| VIX Futures (CBOE) |
Long | July 2017 | 332 | 19.65 | 1,000 | 6,523,800 | ||||||||||||||
Futures Positions as of December 31, 2015
| Contract |
Long or Short |
Expiration | Contracts | Valuation Price |
Contract Multiplier |
Notional Amount at Value |
||||||||||||||
| VIX Futures (CBOE) |
Long | April 2016 | 235 | $ | 19.35 | 1,000 | $ | 4,547,250 | ||||||||||||
| VIX Futures (CBOE) |
Long | May 2016 | 469 | 19.50 | 1,000 | 9,145,500 | ||||||||||||||
| VIX Futures (CBOE) |
Long | June 2016 | 469 | 19.75 | 1,000 | 9,262,750 | ||||||||||||||
| VIX Futures (CBOE) |
Long | July 2016 | 234 | 20.05 | 1,000 | 4,691,700 | ||||||||||||||
The December 31, 2016 and 2015 futures notional values are calculated by multiplying the number of contracts held times the valuation price times the contract multiplier. The notional values will increase (decrease) proportionally with increases (decreases) in the price of the futures contract. Additional gains (losses) associated with these contracts will be equal to any such subsequent increases (decreases) in notional values, before accounting for spreads or transaction or financing costs. The Fund will generally attempt to adjust its positions in Financial Instruments each day to match the performance of the Index. While the above information properly represents the then current equity price risk and is adequate for estimating the following day’s gains or losses, estimates of future values over longer periods should take the Fund’s daily rebalancing efforts into account. Future period returns, before fees and expenses, cannot be estimated simply by estimating the return of the Index. See “Item 1A. Risk Factors” in this Annual Report on Form 10-K for additional information regarding performance for periods longer than a single day.
ProShares Short VIX Short-Term Futures ETF
As of December 31, 2016 and 2015, the ProShares Short VIX Short-Term Futures ETF Fund was exposed to inverse equity market volatility risk through its holding of VIX futures contracts. The following table provides information about the Fund’s positions in VIX futures contracts as of December 31, 2016 and 2015, which were sensitive to equity market volatility risk.
Futures Positions as of December 31, 2016
| Contract |
Long or Short |
Expiration | Contracts | Valuation Price |
Contract Multiplier |
Notional Amount at Value |
||||||||||||||
| VIX Futures (CBOE) |
Short | January 2017 | 8,491 | $ | 15.13 | 1,000 | $ | (128,426,375 | ) | |||||||||||
| VIX Futures (CBOE) |
Short | February 2017 | 5,974 | 16.58 | 1,000 | (99,019,050 | ) | |||||||||||||
B-53
Table of Contents
Futures Positions as of December 31, 2015
| Contract |
Long or Short |
Expiration | Contracts | Valuation Price |
Contract Multiplier |
Notional Amount at Value |
||||||||||||||
| VIX Futures (CBOE) |
Short | January 2016 | 17,150 | $ | 18.53 | 1,000 | $ | (317,703,750 | ) | |||||||||||
| VIX Futures (CBOE) |
Short | February 2016 | 17,151 | 18.88 | 1,000 | (323,725,125 | ) | |||||||||||||
The December 31, 2016 and 2015 short futures notional values are calculated by multiplying the number of contracts held times the valuation price times the contract multiplier. The short notional values will increase (decrease) proportionally with decreases (increases) in the price of the futures contract. Additional gains (losses) associated with these contracts will be equal to any such subsequent decreases (increases) in short notional values, before accounting for spreads or transaction or financing costs. The Fund will generally attempt to adjust its positions in Financial Instruments each day to have $1.00 of short exposure to the Index for every $1.00 of net assets. While the above information properly represents the then current equity price risk and is adequate for estimating the following day’s gains or losses, estimates of future values over longer periods should take the Fund’s daily rebalancing efforts into account. Future period returns, before fees and expenses, cannot be estimated simply by estimating the return of the Index and multiplying by negative one. See “Item 1A. Risk Factors” in this Annual Report on Form 10-K for additional information regarding performance for periods longer than a single day.
ProShares Ultra VIX Short-Term Futures ETF
As of December 31, 2016 and 2015, the ProShares Ultra VIX Short-Term Futures ETF Fund was exposed to equity market volatility risk through its holding of VIX futures contracts. The following tables provide information about the Fund’s positions in these VIX futures contracts as of December 31, 2016 and 2015, which were sensitive to equity market volatility risk.
Futures Positions as of December 31, 2016
| Contract |
Long or Short |
Expiration | Contracts | Valuation Price |
Contract Multiplier |
Notional Amount at Value |
||||||||||||||
| VIX Futures (CBOE) |
Long | January 2017 | 38,688 | $ | 15.13 | 1,000 | $ | 585,156,000 | ||||||||||||
| VIX Futures (CBOE) |
Long | February 2017 | 27,012 | 16.58 | 1,000 | 447,723,900 | ||||||||||||||
Futures Positions as of December 31, 2015
| Contract |
Long or Short |
Expiration | Contracts | Valuation Price |
Contract Multiplier |
Notional Amount at Value |
||||||||||||||
| VIX Futures (CBOE) |
Long | January 2016 | 29,321 | $ | 18.53 | 1,000 | $ | 543,171,525 | ||||||||||||
| VIX Futures (CBOE) |
Long | February 2016 | 29,320 | 18.88 | 1,000 | 553,415,000 | ||||||||||||||
The December 31, 2016 and 2015 futures notional values are calculated by multiplying the number of contracts held times the valuation price times the contract multiplier. These notional values will increase (decrease) proportionally with increases (decreases) in the price of the futures contract or the level of the Index, as applicable. Additional gains (losses) associated with these contracts will be equal to any such subsequent increases (decreases) in notional values, before accounting for spreads or transaction or financing costs. The Fund will generally attempt to adjust its positions in Financial Instruments each day to have $2.00 of exposure to the Index for every $1.00 of net assets. While the above information properly represents the then current equity price risk and is adequate for estimating the following day’s gains or losses, estimates of future values over longer periods should take the Fund’s daily rebalancing efforts into account. Future period returns, before fees and expenses, cannot be estimated simply by estimating the return of the Index and multiplying by two. See “Item 1A. Risk Factors” in this Annual Report on Form 10-K for additional information regarding performance for periods longer than a single day.
B-54
Table of Contents
Commodity Price Sensitivity
Each of the Commodity Funds and the Commodity Index Funds is exposed to commodity price risk through its holdings of Financial Instruments. The following tables provide information about each of the Commodity Funds’ and the Commodity Index Funds’ Financial Instruments, which were sensitive to commodity price risk. As of December 31, 2016 and 2015, each of the Commodity Funds and the Commodity Index Funds’ positions were as follows:
ProShares UltraShort Bloomberg Crude Oil:
As of December 31, 2016 and 2015, the ProShares UltraShort Bloomberg Crude Oil Fund was exposed to inverse commodity price risk through its holding of Crude Oil futures contracts and its holding of swap agreements linked to the Bloomberg WTI Crude Oil SubindexSM. The following tables provide information about the Fund’s positions in these Financial Instruments as of December 31, 2016 and 2015, which were sensitive to commodity price risk.
Futures Positions as of December 31, 2016
| Contract |
Long or Short |
Expiration | Contracts | Valuation Price |
Contract Multiplier |
Notional Amount at Value |
||||||||||||||
| WTI Crude Oil (NYMEX) |
Short | March 2017 | 1,401 | $ | 54.66 | 1,000 | $ | (76,578,660 | ) | |||||||||||
Swap Agreements as of December 31, 2016
| Reference Index |
Counterparty | Long or Short |
Index Close | Notional Amount at Value |
||||||||
| Bloomberg WTI Crude Oil Subindex |
Citibank N.A. | Short | $ | 84.5784 | $ | (116,603,958 | ) | |||||
| Bloomberg WTI Crude Oil Subindex |
Goldman Sachs International | Short | 84.5784 | (87,898,388 | ) | |||||||
| Bloomberg WTI Crude Oil Subindex |
Societe Generale S.A. | Short | 84.5784 | (31,195,025 | ) | |||||||
| Bloomberg WTI Crude Oil Subindex |
UBS AG | Short | 84.5784 | (89,698,517 | ) | |||||||
Futures Positions as of December 31, 2015
| Contract |
Long or Short |
Expiration | Contracts | Valuation Price |
Contract Multiplier |
Notional Amount at Value |
||||||||||||||
| WTI Crude Oil (NYMEX) |
Short | March 2016 | 2,367 | $ | 38.17 | 1,000 | $ | (90,348,390 | ) | |||||||||||
Swap Agreements as of December 31, 2015
| Reference Index |
Counterparty | Long or Short |
Index Close | Notional Amount at Value |
||||||||
| Bloomberg WTI Crude Oil Subindex |
Citibank N.A. | Short | $ | 79.2476 | $ | (19,234,533 | ) | |||||
| Bloomberg WTI Crude Oil Subindex |
Deutsche Bank AG | Short | 79.2476 | (29,881,854 | ) | |||||||
| Bloomberg WTI Crude Oil Subindex |
Goldman Sachs International | Short | 79.2476 | (17,799,590 | ) | |||||||
| Bloomberg WTI Crude Oil Subindex |
Societe Generale S.A. | Short | 79.2476 | (8,303,436 | ) | |||||||
| Bloomberg WTI Crude Oil Subindex |
UBS AG | Short | 79.2476 | (26,258,293 | ) | |||||||
B-55
Table of Contents
The December 31, 2016 and 2015 short futures notional values are calculated by multiplying the number of contracts held times the valuation price times the contract multiplier. The December 31, 2016 and 2015 short swap notional values are calculated by multiplying the number of units times the closing level of the Index. These short notional values will increase (decrease) proportionally with decreases (increases) in the price of the futures contract or the level of the Index, as applicable. Additional gains (losses) associated with these contracts will be equal to any such subsequent decreases (increases) in short notional values, before accounting for spreads or transaction or financing costs. The Fund will generally attempt to adjust its positions in Financial Instruments each day to have $2.00 of short exposure to the Index for every $1.00 of net assets. While the above information properly represents the then current commodity price risk and is adequate for estimating the following day’s gains or losses, estimates of future values over longer periods should take the Fund’s daily rebalancing efforts into account. Future period
returns, before fees and expenses, cannot be estimated simply by estimating the return of the Index and multiplying by negative two. See “Item 1A. Risk Factors” in this Annual Report on Form 10-K for additional information regarding performance for periods longer than a single day. Swap counterparty risk is generally limited to the amount of any unrealized gains, although in the event of a counterparty bankruptcy, there could be delays and costs associated with recovering collateral posted in segregated tri-party accounts at the Fund’s custodian bank.
ProShares UltraShort Bloomberg Natural Gas:
As of December 31, 2016 and 2015, the ProShares UltraShort Bloomberg Natural Gas Fund was exposed to inverse commodity price risk through its holding of Natural Gas futures contracts. The following tables provide information about the Fund’s positions in these Financial Instruments as of December 31, 2016 and 2015, which were sensitive to commodity price risk.
Futures Positions as of December 31, 2016
| Contract |
Long or Short |
Expiration | Contracts | Valuation Price |
Contract Multiplier |
Notional Amount at Value |
||||||||||||||
| Natural Gas (NYMEX) |
Short | March 2017 | 219 | $ | 3.68 | 10,000 | $ | (8,067,960 | ) | |||||||||||
Futures Positions as of December 31, 2015
| Contract |
Long or Short |
Expiration | Contracts | Valuation Price |
Contract Multiplier |
Notional Amount at Value |
||||||||||||||
| Natural Gas (NYMEX) |
Short | March 2016 | 886 | $ | 2.36 | 10,000 | $ | (20,936,180 | ) | |||||||||||
The December 31, 2016 and 2015 short futures notional values are calculated by multiplying the number of Contracts held times the valuation price times the contract multiplier. The short notional values will increase (decrease) proportionally with decreases (increases) in the price of the futures contract. Additional gains (losses) associated with these contracts will be equal to any such subsequent decreases (increases) in short notional values, before accounting for spreads or transaction or financing costs. The Fund will generally attempt to adjust its positions in Financial Instruments each day to have $2.00 of short exposure to the Index for every $1.00 of net assets. While the above information properly represents the then current commodity price risk and is adequate for estimating the following day’s gains or losses, estimates of future values over longer periods should take the Fund’s daily rebalancing efforts into account. Future period returns, before fees and expenses, cannot be estimated simply by estimating the return of the Index and multiplying by negative two. See “Item 1A. Risk Factors” in this Annual Report on Form 10-K for additional information regarding performance for periods longer than a single day.
ProShares UltraShort Gold:
As of December 31, 2016 and 2015, the ProShares UltraShort Gold Fund was exposed to inverse commodity price risk through its holding of Gold futures contracts and Gold forward agreements. The following tables provide information about the Fund’s positions in these Financial Instruments as of December 31, 2016 and 2015, which were sensitive to commodity price risk.
B-56
Table of Contents
Futures Positions as of December 31, 2016
| Contract |
Long or Short |
Expiration | Contracts | Valuation Price |
Contract Multiplier |
Notional Amount at Value |
||||||||||||||
| Gold Futures (COMEX) |
Short | February 2017 | 2 | $ | 1,151.70 | 100 | $ | (230,340 | ) | |||||||||||
Forward Agreements as of December 31, 2016
| Reference Index |
Counterparty | Long or Short |
Valuation Price |
Notional Amount at Value |
||||||||
| 0.995 Fine Troy Ounce Gold |
Citibank N.A. | Short | $ | 1,146.25 | $ | (51,008,125 | ) | |||||
| 0.995 Fine Troy Ounce Gold |
Goldman Sachs International | Short | 1,146.25 | (29,227,083 | ) | |||||||
| 0.995 Fine Troy Ounce Gold |
Societe Generale S.A. | Short | 1,146.25 | (16,735,250 | ) | |||||||
| 0.995 Fine Troy Ounce Gold |
UBS AG | Short | 1,146.26 | (30,089,325 | ) | |||||||
Futures Positions as of December 31, 2015
| Contract |
Long or Short |
Expiration | Contracts | Valuation Price |
Contract Multiplier |
Notional Amount at Value |
||||||||||||||
| Gold Futures (COMEX) |
Short | February 2016 | 2 | $ | 1,060.20 | 100 | $ | (212,040 | ) | |||||||||||
Forward Agreements as of December 31, 2015
| Reference Index |
Counterparty | Long or Short |
Valuation Price |
Notional Amount at Value |
||||||||
| 0.995 Fine Troy Ounce Gold |
Citibank N.A. | Short | $ | 1,059.96 | $ | (6,889,740 | ) | |||||
| 0.995 Fine Troy Ounce Gold |
Deutsche Bank AG | Short | 1,060.01 | (72,186,681 | ) | |||||||
| 0.995 Fine Troy Ounce Gold |
Goldman Sachs International | Short | 1,059.96 | (27,874,828 | ) | |||||||
| 0.995 Fine Troy Ounce Gold |
Societe Generale S.A. | Short | 1,059.96 | (14,839,440 | ) | |||||||
| 0.995 Fine Troy Ounce Gold |
UBS AG | Short | 1,059.96 | (27,929,946 | ) | |||||||
The December 31, 2016 and 2015 short futures notional values are calculated by multiplying the number of contracts held times the valuation price times the contract multiplier. The December 31, 2016 and 2015 short forward notional values equal units multiplied by the forward price. These short notional values will increase (decrease) proportionally with decreases (increases) in the price of the futures contract or forward price, as applicable. Additional gains (losses) associated with these contracts will be equal to any such subsequent decreases (increases) in notional values, before accounting for spreads or transaction or financing costs. The Fund will generally attempt to adjust its positions in Financial Instruments each day to have $2.00 of short exposure to the Index for every $1.00 of net assets. While the above information properly represents the then current commodity price risk and is adequate for estimating the following day’s gains or losses, estimates of future values over longer periods should take the Fund’s daily rebalancing efforts into account. Future period returns, before fees and expenses, cannot be estimated simply by estimating the return of the Index and multiplying by negative two. See “Item 1A. Risk Factors” in this Annual Report on Form 10-K for additional information regarding performance for periods longer than a single day. Counterparty risk related to the forward agreements is generally limited to the amount of any unrealized gains, although in the event of a counterparty bankruptcy, there could be delays and costs associated with recovering collateral posted in segregated tri-party accounts at the Fund’s custodian bank.
ProShares UltraShort Silver:
As of December 31, 2016 and 2015, the ProShares UltraShort Silver Fund was exposed to inverse commodity price risk through its holding of Silver futures contracts and Silver forward agreements. The following tables provide information about the Fund’s positions in these Financial Instruments as of December 31, 2016 and 2015, which were sensitive to commodity price risk.
B-57
Table of Contents
Futures Positions as of December 31, 2016
| Contract |
Long or Short |
Expiration | Contracts | Valuation Price |
Contract Multiplier |
Notional Amount at Value |
||||||||||||||
| Silver Futures (COMEX) |
Short | March 2017 | 2 | $ | 15.99 | 5,000 | $ | (159,890 | ) | |||||||||||
Forward Agreements as of December 31, 2016
| Reference Index |
Counterparty | Long or Short |
Valuation Price | Notional Amount at Value |
||||||||
| 0.999 Fine Troy Ounce Silver |
Citibank, N.A. | Short | $ | 16.2459 | $ | (17,480,588 | ) | |||||
| 0.999 Fine Troy Ounce Silver |
Goldman Sachs International | Short | 16.2454 | (15,181,326 | ) | |||||||
| 0.999 Fine Troy Ounce Silver |
Societe Generale S.A. | Short | 16.2456 | (2,534,314 | ) | |||||||
| 0.999 Fine Troy Ounce Silver |
UBS AG | Short | 16.2457 | (10,673,425 | ) | |||||||
Futures Positions as of December 31, 2015
| Contract |
Long or Short |
Expiration | Contracts | Valuation Price |
Contract Multiplier |
Notional Amount at Value |
||||||||||||||
| Silver Futures (COMEX) |
Short | March 2016 | 2 | $ | 13.80 | 5,000 | $ | (138,030 | ) | |||||||||||
Forward Agreements as of December 31, 2015
| Reference Index |
Counterparty | Long or Short |
Valuation Price | Notional Amount at Value |
||||||||
| 0.999 Fine Troy Ounce Silver |
Deutsche Bank AG | Short | $ | 13.8218 | $ | (44,962,315 | ) | |||||
| 0.999 Fine Troy Ounce Silver |
Goldman Sachs International | Short | 13.8212 | (28,298,907 | ) | |||||||
| 0.999 Fine Troy Ounce Silver |
Societe Generale S.A. | Short | 13.8212 | (9,066,707 | ) | |||||||
| 0.999 Fine Troy Ounce Silver |
UBS AG | Short | 13.8212 | (29,508,262 | ) | |||||||
The December 31, 2016 and 2015 short futures notional values are calculated by multiplying the number of
contracts held times the valuation price times the contract multiplier. The December 31, 2016 and 2015 short forward notional values equal units multiplied by the forward price. These short notional values will increase (decrease) proportionally with decreases (increases) in the price of the futures contract or forward price, as applicable. Additional gains (losses) associated with these contracts will be equal to any such subsequent decreases (increases) in short notional values, before accounting for spreads or transaction or financing costs. The Fund will generally attempt to adjust its positions in Financial Instruments each day to have $2.00 of short exposure to the Index for every $1.00 of net assets. While the above information properly represents the then current commodity price risk and is adequate for estimating the following day’s gains or losses, estimates of future values over longer periods should take the Fund’s daily rebalancing efforts into account. Future period returns, before fees and expenses, cannot be estimated simply by estimating the return of the Index and multiplying by negative two. See “Item 1A. Risk Factors” in this Annual Report on Form 10-K for additional information regarding performance for periods longer than a single day. Counterparty risk related to the forward agreements is generally limited to the amount of any unrealized gains, although in the event of a counterparty bankruptcy, there could be delays and costs associated with recovering collateral posted in segregated tri-party accounts at the Fund’s custodian bank.
B-58
Table of Contents
Exchange Rate Sensitivity
Each of the Currency Funds is exposed to exchange rate risk through its holdings of Financial Instruments. The following tables provide information about each of the Currency Fund’s Financial Instruments, which are sensitive to changes in exchange rates. As of December 31, 2016 and 2015, each of the Currency Fund’s positions were as follows:
ProShares Short Euro:
As of December 31, 2016 and 2015, the ProShares Short Euro Fund was exposed to inverse exchange rate price risk through its holdings of Euro/USD foreign currency futures contracts. The following table provides information about the Fund’s positions in these Financial Instruments as of December 31, 2016 and 2015, which were sensitive to exchange rate price risk.
Futures Positions as of December 31, 2016
| Contract |
Long or Short |
Expiration | Contracts | Valuation Price |
Contract Multiplier |
Notional Amount at Value |
||||||||||||||
| Euro Fx Currency Futures (CME) |
Short | March 2017 | 120 | $ | 1.06 | 125,000 | $ | (15,861,000 | ) | |||||||||||
Futures Positions as of December 31, 2015
| Contract |
Long or Short |
Expiration | Contracts | Valuation Price |
Contract Multiplier |
Notional Amount at Value |
||||||||||||||
| Euro Fx Currency Futures (CME) |
Short | March 2016 | 129 | $ | 1.09 | 125,000 | $ | (17,553,675 | ) | |||||||||||
The December 31, 2016 and 2015 short futures notional values are calculated by multiplying the number of contracts held times the valuation price times the contract multiplier. The short notional values will increase (decrease) proportionally with decreases (increases) in the price of the futures contract. Additional gains (losses) associated with these contracts will be equal to any such subsequent decreases (increases) in short notional values, before accounting for spreads or transaction or financing costs. The Fund will generally attempt to adjust its positions in Financial Instruments each day to have $1.00 of short exposure to the euro for every $1.00 of net assets. While the above information properly represents the then current exchange rate price risk and is adequate for estimating the following day’s gains or losses, estimates of future values over longer periods should take the Fund’s daily rebalancing efforts into account. Future period returns, before fees and expenses, cannot be estimated simply by estimating the appreciation or depreciation of the euro and multiplying by negative one. See “Item 1A. Risk Factors” in this Annual Report on Form 10-K for additional information regarding performance for periods longer than a single day.
ProShares UltraShort Australian Dollar:
As of December 31, 2016 and 2015, the ProShares UltraShort Australian Dollar Fund was exposed to inverse exchange rate price risk through its holdings of AUD/USD foreign currency futures contracts. The following table provides information about the Fund’s positions in these Financial Instruments as of December 31, 2016 and 2015, which were sensitive to exchange rate price risk.
Futures Positions as of December 31, 2016
| Contract |
Long or Short |
Expiration | Contracts | Valuation Price |
Contract Multiplier |
Notional Amount at Value |
||||||||||||||
| Australian Dollar Fx Currency Futures (CME) |
Short | March 2017 |
462 | $ | 72.02 | 1,000 | $ | (33,273,240 | ) | |||||||||||
B-59
Table of Contents
Futures Positions as of December 31, 2015
| Contract |
Long or Short |
Expiration | Contracts | Valuation Price |
Contract Multiplier |
Notional Amount at Value |
||||||||||||||
| Australian Dollar Fx Currency Futures (CME) |
Short | March 2016 |
562 | $ | 72.66 | 1,000 | $ | (40,834,920 | ) | |||||||||||
The December 31, 2016 and 2015 short futures notional values are calculated by multiplying the number of contracts held times the valuation price times the contract multiplier. The short notional values will increase (decrease) proportionally with decreases (increases) in the price of the futures contract. Additional gains (losses) associated with these contracts will be equal to any such subsequent decreases (increases) in short notional values, before accounting for spreads or transaction or financing costs. The Fund will generally attempt to adjust its positions in Financial Instruments each day to have $2.00 of short exposure to the Australian dollar for every $1.00 of net assets. While the above information properly represents the then current exchange rate price risk and is adequate for estimating the following day’s gains or losses, estimates of future values over longer periods should take the Fund’s daily rebalancing efforts into account. Future period returns, before fees and expenses, cannot be estimated simply by estimating the appreciation or depreciation of the Australian dollar and multiplying by negative two. See “Item 1A. Risk Factors” in this Annual Report on Form 10-K for additional information regarding performance for periods longer than a single day.
ProShares UltraShort Euro:
As of December 31, 2016 and 2015, the ProShares UltraShort Euro Fund was exposed to inverse exchange rate price risk through its holdings of Euro/USD foreign currency forward contracts. The following tables provide information about the Fund’s positions in these Financial Instruments as of December 31, 2016 and 2015, which were sensitive to exchange rate price risk.
Foreign Currency Forward Contracts as of December 31, 2016
| Reference Currency |
Counterparty | Long or Short |
Settlement Date |
Euro | Forward Rate |
Market Value USD |
||||||||||||||
| Euro |
Goldman Sachs International | Long | 01/13/17 | 65,899,000 | 1.0535 | $ | 69,424,004 | |||||||||||||
| Euro |
UBS AG | Long | 01/13/17 | 22,361,500 | 1.0535 | 23,557,639 | ||||||||||||||
| Euro |
Goldman Sachs International | Short | 01/13/17 | (393,278,725 | ) | 1.0535 | (414,315,600 | ) | ||||||||||||
| Euro |
UBS AG | Short | 01/13/17 | (356,977,300 | ) | 1.0535 | (376,072,375 | ) | ||||||||||||
Foreign Currency Forward Contracts as of December 31, 2015
| Reference Currency |
Counterparty | Long or Short |
Settlement Date |
Euro | Forward Rate |
Market Value USD |
||||||||||||||
| Euro |
Goldman Sachs International | Long | 01/08/16 | 129,386,700 | 1.0868 | $ | 140,627,935 | |||||||||||||
| Euro |
UBS AG | Long | 01/08/16 | 75,393,200 | 1.0868 | 81,943,430 | ||||||||||||||
| Euro |
Goldman Sachs International | Short | 01/08/16 | (602,732,925 | ) | 1.0868 | (655,098,912 | ) | ||||||||||||
| Euro |
UBS AG | Short | 01/08/16 | (562,621,100 | ) | 1.0868 | (611,502,135 | ) | ||||||||||||
The December 31, 2016 and 2015 USD market values equal the number of euros multiplied by the forward rate. These short notional values will increase (decrease) proportionally with decreases (increases) in the forward price. Additional gains (losses) associated with these contracts will be equal to any such subsequent decreases (increases) in short notional values, before accounting for spreads or transaction or financing costs. The Fund will generally attempt to adjust its positions in Financial Instruments each day to have $2.00 of short exposure to the euro for every $1.00 of net assets. While the above information properly represents the then current exchange rate price risk and is adequate for estimating the following day’s gains or losses, estimates of future values over longer periods should take the Fund’s daily rebalancing efforts into account. Future period returns, before fees and expenses, cannot be
B-60
Table of Contents
estimated simply by estimating the appreciation or depreciation of the euro and multiplying by negative two. See “Item 1A. Risk Factors” in this Annual Report on Form 10-K for additional information regarding performance for periods longer than a single day. Counterparty risk related to foreign currency forward contracts is generally limited to the amount of any unrealized gains, although in the event of a counterparty bankruptcy, there could be delays and costs associated with recovering collateral posted in segregated tri-party accounts at the Fund’s custodian bank.
ProShares UltraShort Yen:
As of December 31, 2016 and 2015, the ProShares UltraShort Yen Fund was exposed to inverse exchange rate price risk through its holdings of Yen/USD foreign currency forward contracts. The following tables provide information about the Fund’s positions in these Financial Instruments as of December 31, 2016 and 2015, which were sensitive to exchange rate price risk.
Foreign Currency Forward Contracts as of December 31, 2016
| Reference Currency |
Counterparty | Long or Short |
Settlement Date |
Yen | Forward Rate | Market Value USD |
||||||||||||||
| Yen |
Goldman Sachs International | Long | 01/13/17 | 9,411,824,400 | 0.008562 | $ | 80,581,067 | |||||||||||||
| Yen |
UBS AG | Long | 01/13/17 | 675,533,300 | 0.008562 | 5,783,703 | ||||||||||||||
| Yen |
Goldman Sachs International | Short | 01/13/17 | (41,411,055,600 | ) | 0.008562 | (354,548,372 | ) | ||||||||||||
| Yen |
UBS AG | Short | 01/13/17 | (33,192,173,500 | ) | 0.008562 | (284,180,901 | ) | ||||||||||||
Foreign Currency Forward Contracts as of December 31, 2015
| Reference Currency |
Counterparty | Long or Short |
Settlement Date |
Yen | Forward Rate | Market Value USD |
||||||||||||||
| Yen |
Goldman Sachs International | Long | 01/08/16 | 5,938,040,200 | 0.008320 | $ | 49,402,434 | |||||||||||||
| Yen |
UBS AG | Long | 01/08/16 | 11,521,875,200 | 0.008320 | 95,858,003 | ||||||||||||||
| Yen |
Goldman Sachs International | Short | 01/08/16 | (33,696,676,000 | ) | 0.008320 | (280,344,651 | ) | ||||||||||||
| Yen |
UBS AG | Short | 01/08/16 | (40,852,769,100 | ) | 0.008320 | (339,880,862 | ) | ||||||||||||
The December 31, 2016 and 2015 USD market values equal the number of yen multiplied by the forward rate. These short notional values will increase (decrease) proportionally with decreases (increases) in the forward price. Additional gains (losses) associated with these contracts will be equal to any such subsequent decreases (increases) in short notional values, before accounting for spreads or transaction or financing costs. The Fund will generally attempt to adjust its positions in Financial Instruments each day to have $2.00 of short exposure to the yen for every $1.00 of net assets. While the above information properly represents the then current exchange rate price risk and is adequate for estimating the following day’s gains or losses, estimates of future values over longer periods should take the Fund’s daily rebalancing efforts into account. Future period returns, before fees and expenses, cannot be estimated simply by estimating the appreciation or depreciation of the yen and multiplying by negative two See “Item 1A. Risk Factors” in this Annual Report on Form 10-K for additional information regarding performance for periods longer than a single day. Counterparty risk related to foreign currency forward contracts is generally limited to the amount of any unrealized gains, although in the event of a counterparty bankruptcy, there could be delays and costs associated with recovering collateral posted in segregated tri-party accounts at the Fund’s custodian bank.
Commodity Price Sensitivity
Each of the Commodity Funds and the Commodity Index Funds is exposed to commodity price risk through its holdings of Financial Instruments. The following tables provide information about each of the Commodity Funds’ and the Commodity Index Funds’ Financial Instruments, which were sensitive to commodity price risk. As of December 31, 2016 and 2015, each of the Commodity Funds and the Commodity Index Funds’ positions were as follows:
B-61
Table of Contents
ProShares Ultra Bloomberg Crude Oil:
As of December 31, 2016 and 2015, the ProShares Ultra Bloomberg Crude Oil Fund was exposed to commodity price risk through its holding of Crude Oil futures contracts and its holding of swap agreements linked to the Bloomberg WTI Crude Oil SubindexSM. The following tables provide information about the Fund’s positions in these Financial Instruments as of December 31, 2016 and 2015, which were sensitive to commodity price risk.
Futures Positions as of December 31, 2016
| Contract |
Long or Short |
Expiration | Contracts | Valuation Price |
Contract Multiplier |
Notional Amount at Value |
||||||||||||||
| WTI Crude Oil (NYMEX) |
Long | March 2017 | 5,855 | $ | 54.66 | 1,000 | $ | 320,034,300 | ||||||||||||
Swap Agreements as of December 31, 2016
| Reference Index |
Counterparty | Long or Short |
Index Close | Notional Amount at Value |
||||||||
| Bloomberg WTI Crude Oil Subindex |
Citibank N.A. | Long | $ | 84.5784 | $ | 545,083,669 | ||||||
| Bloomberg WTI Crude Oil Subindex |
Goldman Sachs International | Long | 84.5784 | 379,451,639 | ||||||||
| Bloomberg WTI Crude Oil Subindex |
Societe Generale S.A. | Long | 84.5784 | 259,616,766 | ||||||||
| Bloomberg WTI Crude Oil Subindex |
UBS AG | Long | 84.5784 | 363,331,028 | ||||||||
Futures Positions as of December 31, 2015
| Contract |
Long or Short |
Expiration | Contracts | Valuation Price |
Contract Multiplier |
Notional Amount at Value |
||||||||||||||
| WTI Crude Oil (NYMEX) |
Long | March 2016 | 11,089 | $ | 38.17 | 1,000 | $ | 423,267,130 | ||||||||||||
Swap Agreements as of December 31, 2015
| Reference Index |
Counterparty | Long or Short |
Index Close | Notional Amount at Value |
||||||||
| Bloomberg WTI Crude Oil Subindex |
Citibank N.A. | Long | $ | 79.2476 | $ | 158,594,078 | ||||||
| Bloomberg WTI Crude Oil Subindex |
Deutsche Bank AG | Long | 79.2476 | 292,553,469 | ||||||||
| Bloomberg WTI Crude Oil Subindex |
Goldman Sachs International | Long | 79.2476 | 298,419,036 | ||||||||
| Bloomberg WTI Crude Oil Subindex |
Societe Generale S.A. | Long | 79.2476 | 100,733,521 | ||||||||
| Bloomberg WTI Crude Oil Subindex |
UBS AG | Long | 79.2476 | 294,338,185 | ||||||||
The December 31, 2016 and 2015 futures notional values are calculated by multiplying the number of contracts held times the valuation price times the contract multiplier. The December 31, 2016 and 2015 swap notional values are calculated by multiplying the number of units times the closing level of the Index. These notional values will increase (decrease) proportionally with increases (decreases) in the price of the futures contract or the level of the Index, as applicable. Additional gains (losses) associated with these contracts will be equal to any such subsequent increases (decreases) in notional values, before accounting for spreads or transaction or financing costs. The Fund will generally attempt to adjust its positions in Financial Instruments each day to have $2.00 of exposure to the Index for every $1.00 of net assets. While the above information properly represents the then current commodity price risk and is adequate for estimating the following day’s gains or losses, estimates of future values over longer periods should take the Fund’s daily rebalancing efforts into account. Future period returns, before fees and expenses, cannot be estimated simply by estimating the return of the Index and multiplying by two See “Item 1A. Risk Factors” in this Annual Report on Form 10-K for additional information regarding performance for periods
B-62
Table of Contents
longer than a single day. Swap counterparty risk is generally limited to the amount of any unrealized gains, although in the event of a counterparty bankruptcy, there could be delays and costs associated with recovering collateral posted in segregated tri-party accounts at the Fund’s custodian bank.
ProShares Ultra Bloomberg Natural Gas:
As of December 31, 2016 and 2015, the ProShares Ultra Bloomberg Natural Gas Fund was exposed to commodity price risk through its holding of Natural Gas futures contracts. The following tables provide information about the Fund’s positions in these Financial Instruments as of December 31, 2016 and 2015, which were sensitive to commodity price risk.
Futures Positions as of December 31, 2016
| Contract |
Long or Short |
Expiration | Contracts | Valuation Price |
Contract Multiplier |
Notional Amount at Value |
||||||||||||||
| Natural Gas (NYMEX) |
Long | March 2017 | 2,346 | $ | 3.68 | 10,000 | $ | 86,426,640 | ||||||||||||
Futures Positions as of December 31, 2015
| Contract |
Long or Short |
Expiration | Contracts | Valuation Price |
Contract Multiplier |
Notional Amount at Value |
||||||||||||||
| Natural Gas (NYMEX) |
Long | March 2016 | 3,288 | $ | 2.36 | 10,000 | $ | 77,695,440 | ||||||||||||
The December 31, 2016 and 2015 futures notional values are calculated by multiplying the number of contracts held times the valuation price times the contract multiplier. The notional values will increase (decrease) proportionally with increases (decreases) in the price of the futures contract, as applicable. Additional gains (losses) associated with these contracts will be equal to any such subsequent increases (decreases) in notional values, before accounting for spreads or transaction or financing costs. The Fund will generally attempt to adjust its positions in Financial Instruments each day to have $2.00 of exposure to the Index for every $1.00 of net assets. While the above information properly represents the then current commodity price risk and is adequate for estimating the following day’s gains or losses, estimates of future values over longer periods should take the Fund’s daily rebalancing efforts into account. Future period returns, before fees and expenses, cannot be estimated simply by estimating the return of the Index and multiplying by two. See “Item 1A. Risk Factors” in this Annual Report on Form 10-K for additional information regarding performance for periods longer than a single day.
ProShares Ultra Gold:
As of December 31, 2016 and 2015, the ProShares Ultra Gold Fund was exposed to commodity price risk through its holding of Gold futures contracts and Gold forward agreements. The following tables provide information about the Fund’s positions in these Financial Instruments as of December 31, 2016 and 2015, which were sensitive to commodity price risk.
Futures Positions as of December 31, 2016
| Contract |
Long or Short |
Expiration | Contracts | Valuation Price |
Contract Multiplier |
Notional Amount at Value |
||||||||||||||||||
| Gold Futures (COMEX) |
Long | February 2017 | 2 | $ | 1,151.70 | 100 | $ | 230,340 | ||||||||||||||||
B-63
Table of Contents
Forward Agreements as of December 31, 2016
| Reference Index |
Counterparty | Long or Short |
Valuation Price |
Notional Amount at Value |
||||||||
| 0.995 Fine Troy Ounce Gold |
Citibank N.A. | Long | $ | 1,146.25 | $ | 63,158,375 | ||||||
| 0.995 Fine Troy Ounce Gold |
Goldman Sachs International | Long | 1,146.25 | 48,509,300 | ||||||||
| 0.995 Fine Troy Ounce Gold |
Societe Generale S.A. | Long | 1,146.25 | 26,707,625 | ||||||||
| 0.995 Fine Troy Ounce Gold |
UBS AG | Long | 1,146.26 | 45,621,148 | ||||||||
Futures Positions as of December 31, 2015
| Contract |
Long or Short |
Expiration | Contracts | Valuation Price |
Contract Multiplier |
Notional Amount at Value |
||||||||||||||
| Gold Futures (COMEX) |
Long | February 2016 | 2 | $ | 1,060.20 | 100 | $ | 212,040 | ||||||||||||
Forward Agreements as of December 31, 2015
| Reference Index |
Counterparty | Long or Short |
Valuation Price |
Notional Amount at Value |
||||||||
| 0.995 Fine Troy Ounce Gold |
Citibank N.A. | Long | $ | 1,059.96 | $ | 3,179,880 | ||||||
| 0.995 Fine Troy Ounce Gold |
Deutsche Bank AG | Long | 1,060.01 | 67,734,639 | ||||||||
| 0.995 Fine Troy Ounce Gold |
Goldman Sachs International | Long | 1,059.96 | 25,036,255 | ||||||||
| 0.995 Fine Troy Ounce Gold |
Societe Generale S.A. | Long | 1,059.96 | 16,323,384 | ||||||||
| 0.995 Fine Troy Ounce Gold |
UBS AG | Long | 1,059.96 | 27,240,972 | ||||||||
The December 31, 2016 and 2015 futures notional values are calculated by multiplying the number of contracts held times the valuation price times the contract multiplier. The December 31, 2016 and 2015 forward notional values equal units multiplied by the forward price. These notional values will increase (decrease) proportionally with increases (decreases) in the price of the futures contract or forward price, as applicable. Additional gains (losses)
associated with these contracts will be equal to any such subsequent increases (decreases) in notional values, before accounting for spreads or transaction or financing costs. The Fund will generally attempt to adjust its positions in Financial Instruments each day to have $2.00 of exposure to the Index for every $1.00 of net assets. While the above information properly represents the then current commodity price risk and is adequate for estimating the following day’s gains or losses, estimates of future values over longer periods should take the Fund’s daily rebalancing efforts into account. Future period returns, before fees and expenses, cannot be estimated simply by estimating the return of the Index and multiplying by two. See “Item 1A. Risk Factors” in this Annual Report on Form 10-K for additional information regarding performance for periods longer than a single day. Counterparty risk related to the forward agreements is generally limited to the amount of any unrealized gains, although in the event of a counterparty bankruptcy, there could be delays and costs associated with recovering collateral posted in segregated tri-party accounts at the Fund’s custodian bank.
ProShares Ultra Silver:
As of December 31, 2016 and 2015, the ProShares Ultra Silver Fund was exposed to commodity price risk through its holding of Silver futures contracts and Silver forward agreements. The following tables provide information about the Fund’s positions in these Financial Instruments as of December 31, 2016 and 2015, which were sensitive to commodity price risk.
B-64
Table of Contents
Futures Positions as of December 31, 2016
| Contract |
Long or Short |
Expiration | Contracts | Valuation Price |
Contract Multiplier |
Notional Amount at Value |
||||||||||||||
| Silver Futures (COMEX) |
Long | March 2017 | 2 | $ | 15.99 | 5,000 | $ | 159,890 | ||||||||||||
| Forward Agreements as of December 31, 2016
|
||||||||||||
| Reference Index |
Counterparty | Long or Short |
Valuation Price | Notional Amount at Value |
||||||||
| 0.999 Fine Troy Ounce Silver |
Citibank, N.A. | Long | $ | 16.2459 | $ | 200,263,209 | ||||||
| 0.999 Fine Troy Ounce Silver |
Goldman Sachs International | Long | 16.2454 | 138,066,406 | ||||||||
| 0.999 Fine Troy Ounce Silver |
Societe Generale S.A. | Long | 16.2456 | 72,845,270 | ||||||||
| 0.999 Fine Troy Ounce Silver |
UBS AG | Long | 16.2457 | 140,232,882 | ||||||||
Futures Positions as of December 31, 2015
| Contract |
Long or Short |
Expiration | Contracts | Valuation Price |
Contract Multiplier |
Notional Amount at Value |
||||||||||||||
| Silver Futures (COMEX) |
Long | March 2016 | 3 | $ | 13.80 | 5,000 | $ | 207,045 | ||||||||||||
Forward Agreements as of December 31, 2015
| Reference Index |
Counterparty | Long or Short |
Valuation Price | Notional Amount at Value |
||||||||
| 0.999 Fine Troy Ounce Silver |
Deutsche Bank AG | Long | $ | 13.8218 | $ | 180,899,718 | ||||||
| 0.999 Fine Troy Ounce Silver |
Goldman Sachs International | Long | 13.8212 | 94,755,383 | ||||||||
| 0.999 Fine Troy Ounce Silver |
Societe Generale S.A. | Long | 13.8212 | 55,063,661 | ||||||||
| 0.999 Fine Troy Ounce Silver |
UBS AG | Long | 13.8212 | 101,903,708 | ||||||||
The December 31, 2016 and 2015 futures notional values are calculated by multiplying the number of contracts held times the valuation price times the contract multiplier. The December 31, 2016 and 2015 forward notional values equal units multiplied by the forward price. These notional values will increase (decrease) proportionally with increases (decreases) in the price of the futures contract or forward price, as applicable. Additional gains (losses) associated with these contracts will be equal to any such subsequent increases (decreases) in notional values, before accounting for spreads or transaction or financing costs. The Fund will generally attempt to adjust its positions in Financial Instruments each day to have $2.00 of exposure to the Index for every $1.00 of net assets. While the above information properly represents the then current commodity price risk and is adequate for estimating the following day’s gains or losses, estimates of future values over longer periods should take the Fund’s daily rebalancing efforts into account. Future period returns, before fees and expenses, cannot be estimated simply by estimating the return of the Index and multiplying by two. See “Item 1A. Risk Factors” in this Annual Report on Form 10-K for additional information regarding performance for periods longer than a single day. Counterparty risk related to the forward agreements is generally limited to the amount of any unrealized gains, although in the event of a counterparty bankruptcy, there could be delays and costs associated with recovering collateral posted in segregated tri-party accounts at the Fund’s custodian bank.
B-65
Table of Contents
Exchange Rate Sensitivity
Each of the Currency Funds is exposed to exchange rate risk through its holdings of Financial Instruments. The following tables provide information about each of the Currency Fund’s Financial Instruments, which are sensitive to changes in exchange rates. As of December 31, 2016 and 2015, each of the Currency Fund’s positions were as follows:
ProShares Ultra Euro:
As of December 31, 2016 and 2015, the ProShares Ultra Euro Fund was exposed to exchange rate price risk through its holdings of Euro/USD foreign currency forward contracts. The following tables provide information about the Fund’s positions in these Financial Instruments as of December 31, 2016 and 2015, which were sensitive to exchange rate price risk.
Foreign Currency Forward Contracts as of December 31, 2016
| Reference Currency |
Counterparty | Long or Short |
Settlement Date |
Euro | Forward Rate |
Market Value USD |
||||||||||||||
| Euro |
Goldman Sachs International | Long | 01/13/17 | 9,841,725 | 1.0535 | $ | 10,368,169 | |||||||||||||
| Euro |
UBS AG | Long | 01/13/17 | 13,774,600 | 1.0535 | 14,511,417 | ||||||||||||||
| Euro |
Goldman Sachs International | Short | 01/13/17 | (717,800 | ) | 1.0535 | (756,196 | ) | ||||||||||||
| Euro |
UBS AG | Short | 01/13/17 | (264,000 | ) | 1.0535 | (278,122 | ) | ||||||||||||
Foreign Currency Forward Contracts as of December 31, 2015
| Reference Currency |
Counterparty | Long or Short |
Settlement Date |
Euro | Forward Rate |
Market Value USD |
||||||||||||||
| Euro |
Goldman Sachs International | Long | 01/08/16 | 12,451,525 | 1.0868 | $ | 13,533,325 | |||||||||||||
| Euro |
UBS AG | Long | 01/08/16 | 11,518,600 | 1.0868 | 12,519,346 | ||||||||||||||
| Euro |
Goldman Sachs International | Short | 01/08/16 | (3,430,700 | ) | 1.0868 | (3,728,762 | ) | ||||||||||||
| Euro |
UBS AG | Short | 01/08/16 | (555,100 | ) | 1.0868 | (603,328 | ) | ||||||||||||
The December 31, 2016 and 2015 USD market value equals the number of euros multiplied by the forward rate.
These notional values will increase (decrease) proportionally with increases (decreases) in the forward price. Additional gains (losses) associated with these contracts will be equal to any such subsequent increases (decreases) in notional values, before accounting for spreads or transaction or financing costs. The Fund will generally attempt to adjust its positions in Financial Instruments each day to have $2.00 of exposure to the euro for every $1.00 of net assets. While the above information properly represents the then current exchange rate price risk and is adequate for estimating the following day’s gains or losses, estimates of future values over longer periods should take the Fund’s daily rebalancing efforts into account. Future period returns, before fees and expenses, cannot be estimated simply by estimating the appreciation or depreciation of the euro and multiplying by two. See “Item 1A. Risk Factors” in this Annual Report on Form 10-K for additional information regarding performance for periods longer than a single day. Counterparty risk related to foreign currency forward contracts is generally limited to the amount of any unrealized gains, although in the event of a counterparty bankruptcy, there could be delays and costs associated with recovering collateral posted in segregated tri-party accounts at the Fund’s custodian bank.
ProShares Ultra Yen:
As of December 31, 2016 and 2015, the ProShares Ultra Yen Fund was exposed to exchange rate price risk through its holdings of Yen/USD foreign currency forward contracts. The following table provides information about the Fund’s positions in these Financial Instruments as of December 31, 2016 and 2015, which were sensitive to exchange rate price risk.
B-66
Table of Contents
Foreign Currency Forward Contracts as of December 31, 2016
| Reference Currency |
Counterparty | Long or Short |
Settlement Date |
Yen | Forward Rate | Market Value USD |
||||||||||||||
| Yen |
Goldman Sachs International | Long | 01/13/17 | 884,408,200 | 0.008562 | $ | 7,572,024 | |||||||||||||
| Yen |
UBS AG | Long | 01/13/17 | 470,179,000 | 0.008562 | 4,025,524 | ||||||||||||||
| Yen |
Goldman Sachs International | Short | 01/13/17 | (57,041,600 | ) | 0.008562 | (488,372 | ) | ||||||||||||
Foreign Currency Forward Contracts as of December 31, 2015
| Reference Currency |
Counterparty | Long or Short |
Settlement Date |
Yen | Forward Rate | Market Value USD |
||||||||||||||
| Yen |
Goldman Sachs International | Long | 01/08/16 | 866,666,900 | 0.008320 | $ | 7,210,368 | |||||||||||||
| Yen |
UBS AG | Long | 01/08/16 | 488,922,300 | 0.008320 | 4,067,664 | ||||||||||||||
| Yen |
Goldman Sachs International | Short | 01/08/16 | (18,830,800 | ) | 0.008320 | (156,666 | ) | ||||||||||||
| Yen |
UBS AG | Short | 01/08/16 | (21,100,300 | ) | 0.008320 | (175,547 | ) | ||||||||||||
The December 31, 2016 and 2015 USD market values equal the number of yen multiplied by the forward rate. These notional values will increase (decrease) proportionally with increases (decreases) in the forward price. Additional gains (losses) associated with these contracts will be equal to any such subsequent increases (decreases) in notional values, before accounting for spreads or transaction or financing costs. The Fund will generally attempt to adjust its positions in Financial Instruments each day to have $2.00 of exposure to the yen for every $1.00 of net assets. While the above information properly represents the then current exchange rate price risk and is adequate for estimating the following day’s gains or losses, estimates of future values over longer periods should take the Fund’s daily rebalancing efforts into account. Future period returns, before fees and expenses, cannot be estimated simply by estimating the appreciation or depreciation of the yen and multiplying by two. See “Item 1A. Risk Factors” in this Annual Report on Form 10-K for additional information regarding performance for periods longer than a single day. Counterparty risk related to foreign currency forward contracts is generally limited to the amount of any unrealized gains, although in the event of a counterparty bankruptcy, there could be delays and costs associated with recovering collateral posted in segregated tri-party accounts at the Fund’s custodian bank.
Qualitative Disclosure
As described above in Item 7 in this Annual Report on Form 10-K, it is the investment objective of each Geared Fund to seek daily investment results, before fees and expenses, which correspond to a multiple, the inverse or an inverse multiple of the daily performance, whether positive or negative, of its corresponding benchmark. Each Short Fund seeks daily investment results (before fees and expenses) that correspond to the inverse (-1x) of the daily performance of its corresponding benchmark. Each UltraShort Fund seeks daily investment results (before fees and expenses) that correspond to two times the inverse (-2x) of the daily performance of its corresponding benchmark. Each Ultra Fund seeks daily investment results (before fees and expenses) that correspond to two times (2x) the daily performance of its corresponding benchmark. Each Matching VIX Fund seeks investment results (before fees and expenses), both over a single day and over time, that match the performance of a benchmark. The Geared Funds do not seek to achieve these stated investment objectives over a period of time greater than a single day because mathematical compounding prevents the Geared Funds from achieving such results. Performance over longer periods of time will be influenced not only by the cumulative period performance of the corresponding benchmark but equally by the intervening volatility of the benchmark as well as fees and expenses, including costs associated with the use of Financial Instruments such as financing costs and trading spreads. Future period returns, before fees and expenses, cannot be estimated simply by estimating the percent change in the corresponding benchmark and multiplying by two or negative two. Each Matching VIX Fund seek investment results (before fees and expenses), both over a single day and over time, that match the performance of a benchmark. Shareholders who invest in the Funds should actively manage and monitor their investments, as frequently as daily. See “Item 1A. Risk Factors” in this Annual Report on Form 10-K for additional information regarding performance for periods longer than a single day. The Matching VIX Funds seek to achieve their stated investment objectives both over a single day and over time.
B-67
Table of Contents
Primary Market Risk Exposure
The primary market risks that the Funds are exposed to depend on each Fund’s investment objective and corresponding benchmark. For example, the primary market risk that the ProShares UltraShort Bloomberg Crude Oil and the ProShares Ultra Bloomberg Crude Oil Funds are exposed to are inverse and direct exposure, respectively, to the price of crude oil as measured by the return of holding and periodically rolling crude oil futures contracts (the Bloomberg Commodity Index and its sub-indexes are based on the price of rolling futures positions, rather than on the cash price for immediate delivery of the corresponding commodity).
Each Fund’s exposure to market risk is further influenced by a number of factors, including the liquidity of the markets in which the contracts are traded and the relationships among the contracts held. The inherent uncertainty of each Fund’s trading as well as the development of drastic market occurrences could ultimately lead to a loss of all or substantially all of investors’ capital.
As described above in Item 7 in this Annual Report on Form 10-K, trading in certain futures contracts or forward agreements involves each Fund entering into contractual commitments to purchase or sell a commodity underlying a Fund’s benchmark at a specified date and price, should it hold such futures contracts or forward agreements into the deliverable period. Should a Fund enter into a contractual commitment to sell a physical commodity, it is required to make delivery of that commodity at the contract price and then repurchase the contract at prevailing market prices or settle in cash. Since the repurchase price to which the value of a commodity can rise is unlimited, entering into commitments to sell commodities would expose a Fund to theoretically unlimited risk.
Commodity Price Sensitivity
As further described above “Item 1A. Risk Factors” in this Annual Report on Form 10-K, the value of the Shares of each Fund relates directly to the value of, and realized profit or loss from, the Financial Instruments and other assets held by the Fund and fluctuations in the price of these assets could materially adversely affect an investment in the Shares. With regard to the Commodity Index Funds or the Commodity Funds, several factors may affect the price of a commodity underlying a Commodity Index Fund or a Commodity Fund, and in turn, the Financial Instruments and other assets, if any, owned by such a Fund. The impact of changes in the price of a physical commodity or of a commodity index (comprised of commodity futures contracts) will affect investors differently depending upon the Fund in which investors invest. Daily increases in the price of an underlying commodity or commodity index will negatively impact the daily performance of Shares of an UltraShort Fund and daily decreases in the price of an underlying commodity or commodity index will negatively impact the daily performance of Shares of an Ultra Fund.
Additionally, performance over time is a cumulative effect of geometrically linking each day’s leveraged or inverse leveraged returns. For instance, if a corresponding benchmark was up 10% and then down 10%, which would result in a (1.1*0.9)-1 = -1% period benchmark return, the two-day period return for a theoretical two-times fund would be equal to a (1.2 *0.8)-1 = -4% period Fund return (rather than simply two times the period return of the benchmark).
Exchange Rate Sensitivity
As further described above “Item 1A. Risk Factors” in this Annual Report on Form 10-K, the value of the Shares of each Fund relates directly to the value of, and realized profit or loss from, the Financial Instruments and other assets held by the Fund and fluctuations in the price of these assets could materially adversely affect an investment in the Shares. With regard to the Currency Funds, several factors may affect the value of the foreign currencies or the U.S. dollar, and, in turn, the Financial Instruments and other assets, if any, owned by a Fund. The impact of changes in the price of a currency will affect investors differently depending upon the Fund in which investors invest. Daily increases in the price of a currency will negatively impact the daily performance of Shares of a Short Fund or an UltraShort Fund and daily decreases in the price of a currency will negatively impact the daily performance of Shares of an Ultra Fund.
B-68
Table of Contents
Additionally, performance over time is a cumulative effect of geometrically linking each day’s leveraged or inverse leveraged returns. For instance, if a corresponding benchmark was up 10% and then down 10%, which would result in a (1.1*0.9)-1 = -1% period benchmark return, the two-day period return for a theoretical two-times fund would be equal to a (1.2 *0.8)-1 = -4% period Fund return (rather than simply two times the period return of the benchmark).
Equity Market Volatility Sensitivity
As further described above “Item 1A. Risk Factors” in this Annual Report on Form 10-K, the value of the Shares of each VIX Fund relates directly to the value of, and realized profit or loss from, the Financial Instruments and other assets held by the Fund and fluctuations in the price of these assets could materially adversely affect an investment in the Shares. Several factors may affect the price and/or liquidity of VIX futures contracts and other assets, if any, owned by a VIX Fund. The impact of changes in the price of these assets will affect investors differently depending upon the Fund in which investors invest.
Managing Market Risks
Each Fund seeks to remain fully exposed to the corresponding benchmark at the levels implied by the relevant investment objective (-1x, -2x, or 2x), regardless of market direction or sentiment. At the close of the relevant markets each trading day (see NAV calculation times), each Fund will seek to position its portfolio so that its exposure to its benchmark is consistent with its investment objective. As described above in Item 7 of this Annual Report on Form 10-K, these adjustments are done through the use of various Financial Instruments. No attempt is made to adjust market exposure in order to avoid changes to the benchmark that would cause the Funds to lose value. Factors common to all Funds that may require portfolio re-positioning are create/redeem activity and index rebalances.
For Geared Funds, the impact of the index’s movements during the day also affects whether the Fund’s portfolio needs to be re-positioned. For example, if the index for an Ultra Fund has risen on a given day, net assets of the Fund should rise. As a result, the Fund’s long exposure will need to be increased to the extent there are not offsetting factors such as redemption activity. Conversely, if the Index has fallen on a given day, net assets of an Ultra Fund should fall. As a result, the Fund’s long exposure will generally need to be decreased. Net assets for Short Funds or UltraShort Funds will generally decrease when the Index rises on a given day. As a result, the Fund’s short exposure may need to be decreased. Conversely, if the Index has fallen on a given day, a Short Funds or an UltraShort Funds assets should rise. As a result, the Fund’s short exposure may need to be increased.
The use of certain Financial Instruments introduces counterparty risk. A Fund will be subject to credit risk with respect to the amount it expects to receive from counterparties to Financial Instruments entered into by the Fund. A Fund may be negatively impacted if a counterparty fails to perform its obligations. Each Fund intends to enter into swap and forward agreements only with major global financial institutions that meet certain credit quality standards and monitoring policies. Each Fund may use various techniques to minimize credit risk including early termination or reset and payment, limiting the net amount due from any individual counterparty, and generally requiring that the counterparty post collateral with respect to amounts owed to the Funds, marked to market daily.
Most Financial Instruments held by the Funds are “unfunded” meaning that the Fund will obtain exposure to the corresponding benchmark while still being in possession of its original cash assets. The cash positions that result from use of such Financial Instruments are held in a manner to minimize both interest rate and credit risk. During the reporting period, cash positions were maintained in a non-interest bearing demand deposit account. The Funds may also invest a portion of this cash in cash equivalents (such as shares of money market funds, bank deposits, bank money market accounts, certain variable rate-demand notes and repurchase agreements collateralized by government securities).
B-69
Table of Contents
| Financial | Statements and Supplementary Data. |
Statement of Operations for the three month periods ended March 31, 2016 and 2015, June 30, 2016 and 2015, September 30, 2016 and 2015, and December 31, 2016 and 2015 and the years ended December 31, 2016 and 2015 for each Fund, as applicable.
PROSHARES VIX SHORT-TERM FUTURES ETF
| Three months ended (unaudited) | Year ended December 31,2016 |
|||||||||||||||||||
| March 31, 2016 | June 30, 2016 | September 30, 2016 | December 31, 2016 | |||||||||||||||||
| Net investment income (loss) |
$ | (221,289 | ) | $ | (487,032 | ) | $ | (407,697 | ) | $ | (320,629 | ) | $ | (1,436,647 | ) | |||||
|
|
|
|
|
|
|
|
|
|
|
|||||||||||
| Net realized and unrealized gain (loss) |
$ | (8,586,170 | ) | $ | (39,223,810 | ) | $ | (94,969,520 | ) | $ | (52,076,658 | ) | $ | (194,856,158 | ) | |||||
| Net income (loss) |
$ | (8,807,459 | ) | $ | (39,710,842 | ) | $ | (95,377,217 | ) | $ | (52,397,287 | ) | $ | (196,292,805 | ) | |||||
| Net increase (decrease) in net asset value per share* |
$ | (8.05 | ) | $ | (13.02 | ) | $ | (16.61 | ) | $ | (7.32 | ) | $ | (45.00 | ) | |||||
| Three months ended (unaudited) | Year ended December 31,2015 |
|||||||||||||||||||
| March 31, 2015 | June 30, 2015 | September 30, 2015 | December 31, 2015 | |||||||||||||||||
| Net investment income (loss) |
$ | (274,472 | ) | $ | (331,587 | ) | $ | (318,561 | ) | $ | (226,174 | ) | $ | (1,150,794 | ) | |||||
|
|
|
|
|
|
|
|
|
|
|
|||||||||||
| Net realized and unrealized gain (loss) |
$ | (20,348,051 | ) | $ | (32,570,365 | ) | $ | 51,225,945 | $ | (25,061,271 | ) | $ | (26,753,742 | ) | ||||||
| Net income (loss) |
$ | (20,622,523 | ) | $ | (32,901,952 | ) | $ | 50,907,384 | $ | (25,287,445 | ) | $ | (27,904,536 | ) | ||||||
| Net increase (decrease) in net asset value per share* |
$ | (19.24 | ) | $ | (17.83 | ) | $ | 18.75 | $ | (20.13 | ) | $ | (38.45 | ) | ||||||
PROSHARES VIX MID-TERM FUTURES ETF
| Three months ended (unaudited) | Year ended December 31,2016 |
|||||||||||||||||||
| March 31, 2016 | June 30, 2016 | September 30, 2016 | December 31, 2016 | |||||||||||||||||
| Net investment income (loss) |
$ | (51,495 | ) | $ | (69,741 | ) | $ | (89,667 | ) | $ | (83,588 | ) | $ | (294,491 | ) | |||||
|
|
|
|
|
|
|
|
|
|
|
|||||||||||
| Net realized and unrealized gain (loss) |
$ | (216,839 | ) | $ | (899,031 | ) | $ | (6,040,771 | ) | $ | (4,873,330 | ) | $ | (12,029,971 | ) | |||||
| Net income (loss) |
$ | (268,334 | ) | $ | (968,772 | ) | $ | (6,130,438 | ) | $ | (4,956,918 | ) | $ | (12,324,462 | ) | |||||
| Net increase (decrease) in net asset value per share |
$ | (1.24 | ) | $ | (0.74 | ) | $ | (6.23 | ) | $ | (3.61 | ) | $ | (11.82 | ) | |||||
| Three months ended (unaudited) | Year ended December 31,2015 |
|||||||||||||||||||
| March 31, 2015 | June 30, 2015 | September 30, 2015 | December 31, 2015 | |||||||||||||||||
| Net investment income (loss) |
$ | (63,559 | ) | $ | (57,794 | ) | $ | (59,501 | ) | $ | (59,746 | ) | $ | (240,600 | ) | |||||
|
|
|
|
|
|
|
|
|
|
|
|||||||||||
| Net realized and unrealized gain (loss) |
$ | (633,713 | ) | $ | (2,850,316 | ) | $ | 4,392,949 | $ | (4,848,853 | ) | $ | (3,939,933 | ) | ||||||
| Net income (loss) |
$ | (697,272 | ) | $ | (2,908,110 | ) | $ | 4,333,448 | $ | (4,908,599 | ) | $ | (4,180,533 | ) | ||||||
| Net increase (decrease) in net asset value per share |
$ | (2.23 | ) | $ | (6.43 | ) | $ | 8.89 | $ | (9.87 | ) | $ | (9.64 | ) | ||||||
B-70
Table of Contents
PROSHARES SHORT VIX SHORT-TERM FUTURES ETF
| Three months ended (unaudited) | Year ended December 31,2016 |
|||||||||||||||||||
| March 31, 2016 | June 30, 2016 | September 30, 2016 | December 31, 2016 | |||||||||||||||||
| Net investment income (loss) |
$ | (1,554,854 | ) | $ | (1,510,189 | ) | $ | (1,171,428 | ) | $ | (1,160,379 | ) | $ | (5,396,850 | ) | |||||
|
|
|
|
|
|
|
|
|
|
|
|||||||||||
| Net realized and unrealized gain (loss) |
$ | (38,162,938 | ) | $ | 92,425,137 | $ | 225,454,227 | $ | 139,600,443 | $ | 419,316,869 | |||||||||
| Net income (loss) |
$ | (39,717,792 | ) | $ | 90,914,948 | $ | 224,282,799 | $ | 138,440,064 | $ | 413,920,019 | |||||||||
| Net increase (decrease) in net asset value per share |
$ | (0.18 | ) | $ | (0.80 | ) | $ | 22.80 | $ | 18.60 | $ | 40.42 | ||||||||
| Three months ended (unaudited) | Year ended December 31,2015 |
|||||||||||||||||||
| March 31, 2015 | June 30, 2015 | September 30, 2015 | December 31, 2015 | |||||||||||||||||
| Net investment income (loss) |
$ | (1,492,492 | ) | $ | (840,088 | ) | $ | (1,375,292 | ) | $ | (2,090,328 | ) | $ | (5,798,200 | ) | |||||
|
|
|
|
|
|
|
|
|
|
|
|||||||||||
| Net realized and unrealized gain (loss) |
$ | 47,179,205 | $ | 62,471,026 | $ | (119,325,102 | ) | $ | 106,611,026 | $ | 96,936,157 | |||||||||
| Net income (loss) |
$ | 45,686,713 | $ | 61,630,938 | $ | (120,700,394 | ) | $ | 104,520,698 | $ | 91,137,957 | |||||||||
| Net increase (decrease) in net asset value per share |
$ | 6.27 | $ | 11.18 | $ | (31.68 | ) | $ | 3.64 | $ | (10.59 | ) | ||||||||
PROSHARES ULTRA VIX SHORT-TERM FUTURES ETF
| Three months ended (unaudited) | Year ended December 31, 2016 |
|||||||||||||||||||
| March 31, 2016 | June 30, 2016 | September 30, 2016 | December 31, 2016 | |||||||||||||||||
| Net investment income (loss) |
$ | (1,649,007 | ) | $ | (3,032,293 | ) | $ | (2,326,627 | ) | $ | (1,928,850 | ) | $ | (8,936,777 | ) | |||||
|
|
|
|
|
|
|
|
|
|
|
|||||||||||
| Net realized and unrealized gain (loss) |
$ | (212,026,452 | ) | $ | (502,252,751 | ) | $ | (606,084,450 | ) | $ | (266,856,633 | ) | $ | (1,587,220,286 | ) | |||||
| Net income (loss) |
$ | (213,675,459 | ) | $ | (505,285,044 | ) | $ | (608,411,077 | ) | $ | (268,785,483 | ) | $ | (1,596,157,063 | ) | |||||
| Net increase (decrease) in net asset value per share*# |
$ | (220.77 | ) | $ | (253.18 | ) | $ | (143.64 | ) | $ | (41.03 | ) | $ | (658.62 | ) | |||||
| Three months ended (unaudited) | Year ended December 31,2015 |
|||||||||||||||||||
| March 31, 2015 | June 30, 2015 | September 30, 2015 | December 31, 2015 | |||||||||||||||||
| Net investment income (loss) |
$ | (2,049,613 | ) | $ | (2,003,111 | ) | $ | (1,444,542 | ) | $ | (1,912,882 | ) | $ | (7,410,148 | ) | |||||
|
|
|
|
|
|
|
|
|
|
|
|||||||||||
| Net realized and unrealized gain (loss) |
$ | (223,600,088 | ) | $ | (264,338,289 | ) | $ | 182,002,869 | $ | (113,952,578 | ) | $ | (419,888,086 | ) | ||||||
| Net income (loss) |
$ | (225,649,701 | ) | $ | (266,341,400 | ) | $ | 180,558,327 | $ | (115,865,460 | ) | $ | (427,298,234 | ) | ||||||
| Net increase (decrease) in net asset value per share*# |
$ | (2,756.72 | ) | $ | 733.17 | $ | 317.61 | $ | (728.43 | ) | $ | (2,434.37 | ) | |||||||
PROSHARES ULTRASHORT BLOOMBERG CRUDE OIL
| Three months ended (unaudited) | Year ended December 31,2016 |
|||||||||||||||||||
| March 31, 2016 | June 30, 2016 | September 30, 2016 | December 31, 2016 | |||||||||||||||||
| Net investment income (loss) |
$ | (337,002 | ) | $ | (412,454 | ) | $ | (321,432 | ) | $ | (338,076 | ) | $ | (1,408,964 | ) | |||||
|
|
|
|
|
|
|
|
|
|
|
|||||||||||
| Net realized and unrealized gain (loss) |
$ | 5,569,806 | $ | (89,589,990 | ) | $ | 17,321,489 | $ | (23,566,686 | ) | $ | (90,265,381 | ) | |||||||
| Net income (loss) |
$ | 5,232,804 | $ | (90,002,444 | ) | $ | 17,000,057 | $ | (23,904,762 | ) | $ | (91,674,345 | ) | |||||||
| Net increase (decrease) in net asset value per share# |
$ | (1.71 | ) | $ | (23.92 | ) | $ | (0.97 | ) | $ | (8.30 | ) | $ | (34.90 | ) | |||||
B-71
Table of Contents
| Three months ended (unaudited) | Year ended December 31,2015 |
|||||||||||||||||||
| March 31, 2015 | June 30, 2015 | September 30, 2015 | December 31, 2015 | |||||||||||||||||
| Net investment income (loss) |
$ | (627,608 | ) | $ | (732,642 | ) | $ | (463,183 | ) | $ | (342,778 | ) | $ | (2,166,211 | ) | |||||
|
|
|
|
|
|
|
|
|
|
|
|||||||||||
| Net realized and unrealized gain (loss) |
$ | 46,090,543 | $ | (130,174,273 | ) | $ | 86,025,955 | $ | 55,790,650 | $ | 57,732,875 | |||||||||
| Net income (loss) |
$ | 45,462,935 | $ | (130,906,915 | ) | $ | 85,562,772 | $ | 55,447,872 | $ | 55,566,664 | |||||||||
| Net increase (decrease) in net asset value per share# |
$ | 4.38 | $ | (14.96 | ) | $ | 15.35 | $ | 22.84 | $ | 27.61 | |||||||||
PROSHARES ULTRASHORT BLOOMBERG NATURAL GAS
| Three months ended (unaudited) | Year ended December 31, 2016 |
|||||||||||||||||||
| March 31, 2016 | June 30, 2016 | September 30, 2016 | December 31, 2016 | |||||||||||||||||
| Net investment income (loss) |
$ | (56,298 | ) | $ | (31,909 | ) | $ | (19,256 | ) | $ | (14,709 | ) | $ | (122,172 | ) | |||||
|
|
|
|
|
|
|
|
|
|
|
|||||||||||
| Net realized and unrealized gain (loss) |
$ | 6,220,334 | $ | (3,569,149 | ) | $ | 611,260 | $ | (683,701 | ) | $ | 2,578,744 | ||||||||
| Net income (loss) |
$ | 6,164,036 | $ | (3,601,058 | ) | $ | 592,004 | $ | (698,410 | ) | $ | 2,456,572 | ||||||||
| Net increase (decrease) in net asset value per share* |
$ | 20.20 | $ | (32.64 | ) | $ | 2.23 | $ | (13.22 | ) | $ | (23.43 | ) | |||||||
| Three months ended (unaudited) | Year ended December 31, 2015 |
|||||||||||||||||||
| March 31, 2015 | June 30, 2015 | September 30, 2015 | December 31, 2015 | |||||||||||||||||
| Net investment income (loss) |
$ | (41,587 | ) | $ | (48,062 | ) | $ | (37,310 | ) | $ | (50,165 | ) | $ | (177,124 | ) | |||||
|
|
|
|
|
|
|
|
|
|
|
|||||||||||
| Net realized and unrealized gain (loss) |
$ | 2,097,816 | $ | (910,106 | ) | $ | 3,698,383 | $ | 3,914,279 | $ | 8,800,372 | |||||||||
| Net income (loss) |
$ | 2,056,229 | $ | (958,168 | ) | $ | 3,661,073 | $ | 3,864,114 | $ | 8,623,248 | |||||||||
| Net increase (decrease) in net asset value per share* |
$ | 1.17 | $ | (4.23 | ) | $ | 7.45 | $ | 14.15 | $ | 18.54 | |||||||||
PROSHARES ULTRASHORT GOLD
| Three months ended (unaudited) | Year ended December 31, 2016 |
|||||||||||||||||||
| March 31, 2016 | June 30, 2016 | September 30, 2016 | December 31, 2016 | |||||||||||||||||
| Net investment income (loss) |
$ | (116,940 | ) | $ | (114,810 | ) | $ | (119,115 | ) | $ | (110,558 | ) | $ | (461,423 | ) | |||||
|
|
|
|
|
|
|
|
|
|
|
|||||||||||
| Net realized and unrealized gain (loss) |
$ | (19,481,223 | ) | $ | (10,186,660 | ) | $ | (523,114 | ) | $ | 19,190,280 | $ | (11,000,717 | ) | ||||||
| Net income (loss) |
$ | (19,598,163 | ) | $ | (10,301,470 | ) | $ | (642,229 | ) | $ | 19,079,722 | $ | (11,462,140 | ) | ||||||
| Net increase (decrease) in net asset value per share |
$ | (33.80 | ) | $ | (11.77 | ) | $ | (0.70 | ) | $ | 21.72 | $ | (24.55 | ) | ||||||
| Three months ended (unaudited) | Year ended December 31, 2015 |
|||||||||||||||||||
| March 31, 2015 | June 30, 2015 | September 30, 2015 | December 31, 2015 | |||||||||||||||||
| Net investment income (loss) |
$ | (185,696 | ) | $ | (167,434 | ) | $ | (181,720 | ) | $ | (168,732 | ) | $ | (703,582 | ) | |||||
|
|
|
|
|
|
|
|
|
|
|
|||||||||||
| Net realized and unrealized gain (loss) |
$ | 2,615,871 | $ | 1,077,517 | $ | 5,999,565 | $ | 7,114,493 | $ | 16,807,446 | ||||||||||
| Net income (loss) |
$ | 2,430,175 | $ | 910,083 | $ | 5,817,845 | $ | 6,945,761 | $ | 16,103,864 | ||||||||||
| Net increase (decrease) in net asset value per share |
$ | 1.17 | $ | 1.18 | $ | 7.99 | $ | 8.89 | $ | 19.23 | ||||||||||
B-72
Table of Contents
PROSHARES ULTRASHORT SILVER
| Three months ended (unaudited) | Year ended December 31,2016 |
|||||||||||||||||||
| March 31, 2016 | June 30, 2016 | September 30, 2016 | December 31, 2016 | |||||||||||||||||
| Net investment income (loss) |
$ | (75,735 | ) | $ | (70,289 | ) | $ | (64,078 | ) | $ | (45,751 | ) | $ | (255,853 | ) | |||||
|
|
|
|
|
|
|
|
|
|
|
|||||||||||
| Net realized and unrealized gain (loss) |
$ | (9,579,793 | ) | $ | (15,984,890 | ) | $ | (5,356,501 | ) | $ | 9,992,228 | $ | (20,928,956 | ) | ||||||
| Net income (loss) |
$ | (9,655,528 | ) | $ | (16,055,179 | ) | $ | (5,420,579 | ) | $ | 9,946,477 | $ | (21,184,809 | ) | ||||||
| Net increase (decrease) in net asset value per share |
$ | (14.94 | ) | $ | (16.48 | ) | $ | (5.22 | ) | $ | 9.37 | $ | (27.27 | ) | ||||||
| Three months ended (unaudited) | Year ended December 31,2015 |
|||||||||||||||||||
| March 31, 2015 | June 30, 2015 | September 30, 2015 | December 31, 2015 | |||||||||||||||||
| Net investment income (loss) |
$ | (118,220 | ) | $ | (130,679 | ) | $ | (129,265 | ) | $ | (138,300 | ) | $ | (516,464 | ) | |||||
|
|
|
|
|
|
|
|
|
|
|
|||||||||||
| Net realized and unrealized gain (loss) |
$ | (5,691,197 | ) | $ | 5,720,789 | $ | 6,242,356 | $ | 8,671,752 | $ | 14,943,700 | |||||||||
| Net income (loss) |
$ | (5,809,417 | ) | $ | 5,590,110 | $ | 6,113,091 | $ | 8,533,452 | $ | 14,427,236 | |||||||||
| Net increase (decrease) in net asset value per share |
$ | (7.22 | ) | $ | 4.13 | $ | 5.31 | $ | 4.55 | $ | 6.77 | |||||||||
PROSHARES SHORT EURO
| Three months ended (unaudited) | Year ended December 31,2016 |
|||||||||||||||||||
| March 31, 2016 | June 30, 2016 | September 30, 2016 | December 31,2016 | |||||||||||||||||
| Net investment income (loss) |
$ | (35,145 | ) | $ | (31,107 | ) | $ | (29,155 | ) | $ | (27,321 | ) | $ | (122,728 | ) | |||||
|
|
|
|
|
|
|
|
|
|
|
|||||||||||
| Net realized and unrealized gain (loss) |
$ | (761,194 | ) | $ | 452,845 | $ | (160,000 | ) | $ | 1,021,630 | $ | 553,281 | ||||||||
| Net income (loss) |
$ | (796,339 | ) | $ | 421,738 | $ | (189,155 | ) | $ | 994,309 | $ | 430,553 | ||||||||
| Net increase (decrease) in net asset value per share |
$ | (2.08 | ) | $ | 1.11 | $ | (0.59 | ) | $ | 2.84 | $ | 1.28 | ||||||||
| Three months ended (unaudited) |
Year ended December 31,2015 |
|||||||||||||||||||
| March 31, 2015 | June 30, 2015 | September 30, 2015 | December 31, 2015 | |||||||||||||||||
| Net investment income (loss) |
$ | (38,347 | ) | $ | (45,895 | ) | $ | (47,612 | ) | $ | (46,907 | ) | $ | (178,761 | ) | |||||
|
|
|
|
|
|
|
|
|
|
|
|||||||||||
| Net realized and unrealized gain (loss) |
$ | 1,781,715 | $ | (777,986 | ) | $ | (32,048 | ) | $ | 445,899 | $ | 1,417,580 | ||||||||
| Net income (loss) |
$ | 1,743,368 | $ | (823,881 | ) | $ | (79,660 | ) | $ | 398,992 | $ | 1,238,819 | ||||||||
| Net increase (decrease) in net asset value per share |
$ | 4.79 | $ | (1.83 | ) | $ | (0.26 | ) | $ | 1.02 | $ | 3.72 | ||||||||
PROSHARES ULTRASHORT AUSTRALIAN DOLLAR
| Three months ended (unaudited) | Year ended December 31, 2016 |
|||||||||||||||||||
| March 31, 2016 | June 30, 2016 | September 30, 2016 | December 31, 2016 | |||||||||||||||||
| Net investment income (loss) |
$ | (45,029 | ) | $ | (36,158 | ) | $ | (33,889 | ) | $ | (30,576 | ) | $ | (145,652 | ) | |||||
|
|
|
|
|
|
|
|
|
|
|
|||||||||||
| Net realized and unrealized gain (loss) |
$ | (2,387,137 | ) | $ | 721,364 | $ | (1,289,967 | ) | $ | 1,771,920 | $ | (1,183,820 | ) | |||||||
| Net income (loss) |
$ | (2,432,166 | ) | $ | 685,206 | $ | (1,323,856 | ) | $ | 1,741,344 | $ | (1,329,472 | ) | |||||||
| Net increase (decrease) in net asset value per share |
$ | (6.95 | ) | $ | 1.96 | $ | (3.79 | ) | $ | 5.70 | $ | (3.08 | ) | |||||||
B-73
Table of Contents
| Three months ended (unaudited) | Year ended December 31, 2015 |
|||||||||||||||||||
| March 31, 2015 | June 30, 2015 | September 30, 2015 | December 31, 2015 | |||||||||||||||||
| Net investment income (loss) |
$ | (55,714 | ) | $ | (48,012 | ) | $ | (54,415 | ) | $ | (51,846 | ) | $ | (209,987 | ) | |||||
|
|
|
|
|
|
|
|
|
|
|
|||||||||||
| Net realized and unrealized gain (loss) |
$ | 2,656,367 | $ | (963,218 | ) | $ | 3,544,373 | $ | (2,071,138 | ) | $ | 3,166,384 | ||||||||
| Net income (loss) |
$ | 2,600,653 | $ | (1,011,230 | ) | $ | 3,489,958 | $ | (2,122,984 | ) | $ | 2,956,397 | ||||||||
| Net increase (decrease) in net asset value per share |
$ | 6.06 | $ | (2.89 | ) | $ | 9.97 | $ | (6.06 | ) | $ | 7.08 | ||||||||
PROSHARES ULTRASHORT EURO
| Three months ended (unaudited) | Year ended December 31, 2016 |
|||||||||||||||||||
| March 31, 2016 | June 30, 2016 | September 30, 2016 | December 31, 2016 | |||||||||||||||||
| Net investment income (loss) |
$ | (804,953 | ) | $ | (666,494 | ) | $ | (657,657 | ) | $ | (635,553 | ) | $ | (2,764,657 | ) | |||||
|
|
|
|
|
|
|
|
|
|
|
|||||||||||
| Net realized and unrealized gain (loss) |
$ | (41,031,168 | ) | $ | 18,960,086 | $ | (8,051,669 | ) | $ | 49,297,417 | $ | 19,174,666 | ||||||||
| Net income (loss) |
$ | (41,836,121 | ) | $ | 18,293,592 | $ | (8,709,326 | ) | $ | 48,661,864 | $ | 16,410,009 | ||||||||
| Net increase (decrease) in net asset value per share |
$ | (2.35 | ) | $ | 1.13 | $ | (0.54 | ) | $ | 3.30 | $ | 1.54 | ||||||||
| Three months ended (unaudited) | Year ended December 31, 2015 |
|||||||||||||||||||
| March 31, 2015 | June 30, 2015 | September 30, 2015 | December 31, 2015 | |||||||||||||||||
| Net investment income (loss) |
$ | (1,189,555 | ) | $ | (1,296,221 | ) | $ | (1,351,762 | ) | $ | (1,163,049 | ) | $ | (5,000,587 | ) | |||||
|
|
|
|
|
|
|
|
|
|
|
|||||||||||
| Net realized and unrealized gain (loss) |
$ | 114,159,808 | $ | (48,496,893 | ) | $ | (7,308,030 | ) | $ | 27,822,084 | $ | 86,176,969 | ||||||||
| Net income (loss) |
$ | 112,970,253 | $ | (49,793,114 | ) | $ | (8,659,792 | ) | $ | 26,659,035 | $ | 81,176,382 | ||||||||
| Net increase (decrease) in net asset value per share |
$ | 5.36 | $ | (2.21 | ) | $ | (0.36 | ) | $ | 1.16 | $ | 3.95 | ||||||||
PROSHARES ULTRASHORT YEN
| Three months ended (unaudited) | Year ended December 31, 2016 |
|||||||||||||||||||
| March 31, 2016 | June 30, 2016 | September 30, 2016 | December 31, 2016 | |||||||||||||||||
| Net investment income (loss) |
$ | (400,797 | ) | $ | (324,778 | ) | $ | (408,214 | ) | $ | (475,773 | ) | $ | (1,609,562 | ) | |||||
|
|
|
|
|
|
|
|
|
|
|
|||||||||||
| Net realized and unrealized gain (loss) |
$ | (28,677,455 | ) | $ | (33,065,456 | ) | $ | (10,390,487 | ) | $ | 80,564,433 | $ | 8,431,035 | |||||||
| Net income (loss) |
$ | (29,078,252 | ) | $ | (33,390,234 | ) | $ | (10,798,701 | ) | $ | 80,088,660 | $ | 6,821,473 | |||||||
| Net increase (decrease) in net asset value per share |
$ | (11.43 | ) | $ | (12.98 | ) | $ | (2.85 | ) | $ | 19.56 | $ | (7.70 | ) | ||||||
| Three months ended (unaudited) | Year ended December 31, 2015 |
|||||||||||||||||||
| March 31, 2015 | June 30, 2015 | September 30, 2015 | December 31, 2015 | |||||||||||||||||
| Net investment income (loss) |
$ | (1,116,544 | ) | $ | (973,386 | ) | $ | (865,306 | ) | $ | (668,442 | ) | $ | (3,623,678 | ) | |||||
|
|
|
|
|
|
|
|
|
|
|
|||||||||||
| Net realized and unrealized gain (loss) |
$ | (2,867,365 | ) | $ | 15,764,799 | $ | (19,107,015 | ) | $ | 2,668,447 | $ | (3,541,134 | ) | |||||||
| Net income (loss) |
$ | (3,983,909 | ) | $ | 14,791,413 | $ | (19,972,321 | ) | $ | 2,000,005 | $ | (7,164,812 | ) | |||||||
| Net increase (decrease) in net asset value per share |
$ | (0.36 | ) | $ | 3.21 | $ | (4.36 | ) | $ | 0.12 | $ | (1.39 | ) | |||||||
B-74
Table of Contents
PROSHARES ULTRA BLOOMBERG CRUDE OIL
| Three months ended (unaudited) | Year ended December 31, 2016 |
|||||||||||||||||||
| March 31, 2016 | June 30, 2016 | September 30, 2016 | December 31, 2016 | |||||||||||||||||
| Net investment income (loss) |
$ | (1,525,927 | ) | $ | (1,768,802 | ) | $ | (1,683,430 | ) | $ | (1,653,221 | ) | $ | (6,631,380 | ) | |||||
|
|
|
|
|
|
|
|
|
|
|
|||||||||||
| Net realized and unrealized gain (loss) |
$ | (158,102,104 | ) | $ | 296,192,078 | $ | (80,625,440 | ) | $ | 167,586,234 | $ | 225,050,768 | ||||||||
| Net income (loss) |
$ | (159,628,031 | ) | $ | 294,423,276 | $ | (82,308,870 | ) | $ | 165,933,013 | $ | 218,419,388 | ||||||||
| Net increase (decrease) in net asset value per share# |
$ | (7.16 | ) | $ | 6.34 | $ | (3.31 | ) | $ | 2.32 | $ | (1.81 | ) | |||||||
| Three months ended (unaudited) | Year ended December 31, 2015 |
|||||||||||||||||||
| March 31, 2015 | June 30, 2015 | September 30, 2015 | December 31, 2015 | |||||||||||||||||
| Net investment income (loss) |
$ | (1,844,712 | ) | $ | (2,559,682 | ) | $ | (2,085,145 | ) | $ | (1,983,616 | ) | $ | (8,473,155 | ) | |||||
|
|
|
|
|
|
|
|
|
|
|
|||||||||||
| Net realized and unrealized gain (loss) |
$ | (193,319,571 | ) | $ | 358,080,448 | $ | (588,538,331 | ) | $ | (439,833,790 | ) | $ | (863,611,244 | ) | ||||||
| Net income (loss) |
$ | (195,164,283 | ) | $ | 355,520,766 | $ | (590,623,476 | ) | $ | (441,817,406 | ) | $ | (872,084,399 | ) | ||||||
| Net increase (decrease) in net asset value per share# |
$ | (33.23 | ) | $ | 22.75 | $ | (46.30 | ) | $ | (19.55 | ) | $ | (76.33 | ) | ||||||
PROSHARES ULTRA BLOOMBERG NATURAL GAS
| Three months ended (unaudited) | Year ended December 31, 2016 |
|||||||||||||||||||
| March 31, 2016 | June 30, 2016 | September 30, 2016 | December 31, 2016 | |||||||||||||||||
| Net investment income (loss) |
$ | (88,761 | ) | $ | (100,326 | ) | $ | (93,432 | ) | $ | (101,967 | ) | $ | (384,486 | ) | |||||
|
|
|
|
|
|
|
|
|
|
|
|||||||||||
| Net realized and unrealized gain (loss) |
$ | (13,053,665 | ) | $ | 18,337,272 | $ | (6,443,095 | ) | $ | 14,953,621 | $ | 13,794,133 | ||||||||
| Net income (loss) |
$ | (13,142,426 | ) | $ | 18,236,946 | $ | (6,536,527 | ) | $ | 14,851,654 | $ | 13,409,647 | ||||||||
| Net increase (decrease) in net asset value per share |
$ | (7.74 | ) | $ | 6.92 | $ | (3.27 | ) | $ | 4.37 | $ | 0.28 | ||||||||
| Three months ended (unaudited) | Year ended December 31, 2015 |
|||||||||||||||||||
| March 31, 2015 | June 30, 2015 | September 30, 2015 | December 31, 2015 | |||||||||||||||||
| Net investment income (loss) |
$ | (206,884 | ) | $ | (222,837 | ) | $ | (190,466 | ) | $ | (141,148 | ) | $ | (761,335 | ) | |||||
|
|
|
|
|
|
|
|
|
|
|
|||||||||||
| Net realized and unrealized gain (loss) |
$ | (18,381,540 | ) | $ | 2,617,359 | $ | (21,633,331 | ) | $ | (22,173,098 | ) | $ | (59,570,610 | ) | ||||||
| Net income (loss) |
$ | (18,588,424 | ) | $ | 2,394,522 | $ | (21,823,797 | ) | $ | (22,314,246 | ) | $ | (60,331,945 | ) | ||||||
| Net increase (decrease) in net asset value per share |
$ | (15.98 | ) | $ | (0.25 | ) | $ | (13.40 | ) | $ | (13.45 | ) | $ | (43.08 | ) | |||||
PROSHARES ULTRA GOLD
| Three months ended (unaudited) | Year ended December 31, 2016 |
|||||||||||||||||||
| March 31, 2016 | June 30, 2016 | September 30, 2016 | December 31, 2016 | |||||||||||||||||
| Net investment income (loss) |
$ | (152,453 | ) | $ | (161,625 | ) | $ | (172,490 | ) | $ | (164,383 | ) | $ | (650,951 | ) | |||||
|
|
|
|
|
|
|
|
|
|
|
|||||||||||
| Net realized and unrealized gain (loss) |
$ | 23,076,136 | $ | 11,212,784 | $ | (792,881 | ) | $ | (29,878,941 | ) | $ | 3,617,098 | ||||||||
| Net income (loss) |
$ | 22,923,683 | $ | 11,051,159 | $ | (965,371 | ) | $ | (30,043,324 | ) | $ | 2,966,147 | ||||||||
| Net increase (decrease) in net asset value per share |
$ | 10.15 | $ | 4.92 | $ | (0.38 | ) | $ | (11.52 | ) | $ | 3.17 | ||||||||
B-75
Table of Contents
| Three months ended (unaudited) | Year ended December 31, 2015 |
|||||||||||||||||||
| March 31, 2015 | June 30, 2015 | September 30, 2015 | December 31, 2015 | |||||||||||||||||
| Net investment income (loss) |
$ | (227,743 | ) | $ | (212,388 | ) | $ | (190,084 | ) | $ | (166,209 | ) | $ | (796,424 | ) | |||||
|
|
|
|
|
|
|
|
|
|
|
|||||||||||
| Net realized and unrealized gain (loss) |
$ | (3,374,221 | ) | $ | (3,014,902 | ) | $ | (9,190,257 | ) | $ | (7,336,271 | ) | $ | (22,915,651 | ) | |||||
| Net income (loss) |
$ | (3,601,964 | ) | $ | (3,227,290 | ) | $ | (9,380,341 | ) | $ | (7,502,480 | ) | $ | (23,712,075 | ) | |||||
| Net increase (decrease) in net asset value per share |
$ | (1.62 | ) | $ | (1.36 | ) | $ | (3.87 | ) | $ | (3.42 | ) | $ | (10.27 | ) | |||||
PROSHARES ULTRA SILVER
| Three months ended (unaudited) | Year ended December 31, 2016 |
|||||||||||||||||||
| March 31, 2016 | June 30, 2016 | September 30, 2016 | December 31, 2016 | |||||||||||||||||
| Net investment income (loss) |
$ | (458,870 | ) | $ | (553,155 | ) | $ | (701,202 | ) | $ | (466,165 | ) | $ | (2,179,392 | ) | |||||
|
|
|
|
|
|
|
|
|
|
|
|||||||||||
| Net realized and unrealized gain (loss) |
$ | 45,578,002 | $ | 108,003,006 | $ | 31,136,300 | $ | (120,803,231 | ) | $ | 63,914,077 | |||||||||
| Net income (loss) |
$ | 45,119,132 | $ | 107,449,851 | $ | 30,435,098 | $ | (121,269,396 | ) | $ | 61,734,685 | |||||||||
| Net increase (decrease) in net asset value per share |
$ | 5.67 | $ | 12.80 | $ | 3.47 | $ | (15.56 | ) | $ | 6.38 | |||||||||
| Three months ended (unaudited) | Year ended December 31, 2015 |
|||||||||||||||||||
| March 31, 2015 | June 30, 2015 | September 30, 2015 | December 31, 2015 | |||||||||||||||||
| Net investment income (loss) |
$ | (699,839 | ) | $ | (679,148 | ) | $ | (596,454 | ) | $ | (532,418 | ) | $ | (2,507,859 | ) | |||||
|
|
|
|
|
|
|
|
|
|
|
|||||||||||
| Net realized and unrealized gain (loss) |
$ | 17,250,785 | $ | (34,725,040 | ) | $ | (42,765,969 | ) | $ | (28,252,102 | ) | $ | (88,492,326 | ) | ||||||
| Net income (loss) |
$ | 16,550,946 | $ | (35,404,188 | ) | $ | (43,362,423 | ) | $ | (28,784,520 | ) | $ | (91,000,185 | ) | ||||||
| Net increase (decrease) in net asset value per share |
$ | 2.11 | $ | (5.03 | ) | $ | (5.40 | ) | $ | (3.99 | ) | $ | (12.31 | ) | ||||||
PROSHARES ULTRA EURO
| Three months ended (unaudited) | Year ended December 31, 2016 |
|||||||||||||||||||
| March 31, 2016 | June 30, 2016 | September 30, 2016 | December 31, 2016 | |||||||||||||||||
| Net investment income (loss) |
$ | (20,743 | ) | $ | (16,403 | ) | $ | (16,659 | ) | $ | (20,717 | ) | $ | (74,522 | ) | |||||
|
|
|
|
|
|
|
|
|
|
|
|||||||||||
| Net realized and unrealized gain (loss) |
$ | 896,550 | $ | (557,861 | ) | $ | 162,469 | $ | (1,540,470 | ) | $ | (1,039,312 | ) | |||||||
| Net income (loss) |
$ | 875,807 | $ | (574,264 | ) | $ | 145,810 | $ | (1,561,187 | ) | $ | (1,113,834 | ) | |||||||
| Net increase (decrease) in net asset value per share |
$ | 1.35 | $ | (0.97 | ) | $ | 0.24 | $ | (2.11 | ) | $ | (1.49 | ) | |||||||
| Three months ended (unaudited) | Year ended December 31, 2015 |
|||||||||||||||||||
| March 31, 2015 | June 30, 2015 | September 30, 2015 | December 31, 2015 | |||||||||||||||||
| Net investment income (loss) |
$ | (15,698 | ) | $ | (34,217 | ) | $ | (26,696 | ) | $ | (27,460 | ) | $ | (104,071 | ) | |||||
|
|
|
|
|
|
|
|
|
|
|
|||||||||||
| Net realized and unrealized gain (loss) |
$ | (1,740,537 | ) | $ | 1,082,327 | $ | 59,448 | $ | (675,633 | ) | $ | (1,274,395 | ) | |||||||
| Net income (loss) |
$ | (1,756,235 | ) | $ | 1,048,110 | $ | 32,752 | $ | (703,093 | ) | $ | (1,378,466 | ) | |||||||
| Net increase (decrease) in net asset value per share |
$ | (4.33 | ) | $ | 1.05 | $ | (0.04 | ) | $ | (1.04 | ) | $ | (4.36 | ) | ||||||
B-76
Table of Contents
PROSHARES ULTRA YEN
| Three months ended (unaudited) | Year ended December 31, 2016 |
|||||||||||||||||||
| March 31, 2016 | June 30, 2016 | September 30, 2016 | December 31, 2016 | |||||||||||||||||
| Net investment income (loss) |
$ | (11,106 | ) | $ | (11,556 | ) | $ | (12,886 | ) | $ | (10,299 | ) | $ | (45,847 | ) | |||||
|
|
|
|
|
|
|
|
|
|
|
|||||||||||
| Net realized and unrealized gain (loss) |
$ | 731,464 | $ | 1,082,813 | $ | 191,351 | $ | (1,892,473 | ) | $ | 113,155 | |||||||||
| Net income (loss) |
$ | 720,358 | $ | 1,071,257 | $ | 178,465 | $ | (1,902,772 | ) | $ | 67,308 | |||||||||
| Net increase (decrease) in net asset value per share |
$ | 7.21 | $ | 10.71 | $ | 1.79 | $ | (19.03 | ) | $ | 0.68 | |||||||||
| Three months ended (unaudited) | Year ended December 31, 2015 |
|||||||||||||||||||
| March 31, 2015 | June 30, 2015 | September 30, 2015 | December 31, 2015 | |||||||||||||||||
| Net investment income (loss) |
$ | (9,090 | ) | $ | (12,481 | ) | $ | (11,745 | ) | $ | (11,107 | ) | $ | (44,423 | ) | |||||
|
|
|
|
|
|
|
|
|
|
|
|||||||||||
| Net realized and unrealized gain (loss) |
$ | (106,753 | ) | $ | (237,139 | ) | $ | 197,237 | $ | (49,436 | ) | $ | (196,091 | ) | ||||||
| Net income (loss) |
$ | (115,843 | ) | $ | (249,620 | ) | $ | 185,492 | $ | (60,543 | ) | $ | (240,514 | ) | ||||||
| Net increase (decrease) in net asset value per share |
$ | (0.47 | ) | $ | (2.50 | ) | $ | 1.86 | $ | (0.61 | ) | $ | (1.72 | ) | ||||||
See the Index to Financial Statements on Page 136 for a list of the financial statements being filed as part of this Annual Report on Form 10-K. Those Financial Statements, and the notes and schedules related thereto, are incorporated by reference into this Item 8.
| * | See Note 1 of the Notes to Financial Statements in Item 15 of Part IV in this Annual Report on Form 10-K. |
| # | See Note 9 of the Notes to Financial Statements in Item 15 of Part IV in this Annual Report on Form 10-K. |
Changes in and Disagreements With Accountants on Accounting and Financial Disclosure.
Not applicable.
Controls and Procedures.
Disclosure Controls and Procedures
Under the supervision and with the participation of the principal executive officer and principal financial officer of the Trust, Trust management has evaluated the effectiveness of the Trust’s and the Funds’ disclosure controls and procedures, and have concluded that the disclosure controls and procedures of the Trust and the Funds (as defined in Rule 13a-15(e) and 15d-15(e) under the Securities Exchange Act of 1934, as amended (the “1934 Act”)) were effective, as of December 31, 2016, including providing reasonable assurance that information required to be disclosed in the reports that the Trust files or submits under the 1934 Act on behalf of the Trust and the Funds is recorded, processed, summarized and reported, within the time periods specified in the applicable rules and forms, and that such information is accumulated and communicated to the duly authorized officers of the Trust as appropriate to allow timely decisions regarding required disclosure.
Management’s Annual Report on Internal Control Over Financial Reporting
The Trust’s management takes responsibility for establishing and maintaining adequate internal control over financial reporting of the Trust and the Funds, as defined in Rules 13a-15(f) and 15d-15(f) under the 1934 Act. The Trust’s and the Funds’ internal control over financial reporting is a process designed to provide reasonable assurance regarding the reliability of financial reporting and the preparation of financial statements for external purposes in accordance with accounting principles generally accepted in the United States of America. Internal control over financial reporting includes those policies and procedures that: (1) pertain to the maintenance of records that, in reasonable detail, accurately and fairly reflect the transactions and dispositions of the assets of the Trust and the Funds; (2) provide reasonable assurance that transactions are recorded as necessary to permit preparation of
B-77
Table of Contents
financial statements in accordance with generally accepted accounting principles, and that the Trust’s and the Funds’ receipts and expenditures are being made only in accordance with appropriate authorizations of management of the Trust on behalf of the Trust and the Funds; and (3) provide reasonable assurance regarding prevention or timely detection of unauthorized acquisition, use or disposition of the Trust’s or the Funds’ assets that could have a material effect on the Trust’s or the Funds’ financial statements.
Because of its inherent limitations, internal control over financial reporting may not prevent or detect misstatements. Also, projections of any evaluation of effectiveness to future periods are subject to the risk that controls may become inadequate because of changes in conditions, or that the degree of compliance with the policies or procedures may deteriorate.
The principal executive officer and principal financial officer of the Trust assessed the effectiveness of the Trust’s and the Funds’ internal control over financial reporting as of December 31, 2016. Their assessment included an evaluation of the design of the Trust’s and the Funds’ internal control over financial reporting and testing of the operational effectiveness of their internal control over financial reporting. In making its assessment, the Trust’s management has utilized the criteria set forth by the Committee of Sponsoring Organizations of the Treadway Commission (COSO) in its report entitled Internal Control – Integrated Framework (2013). Based on their assessment and those criteria, the principal executive officer and principal financial officer of the Trust concluded that the Trust’s and the Funds’ internal control over financial reporting was effective as of December 31, 2016.
The effectiveness of the Trust’s and the Funds’ internal control over financial reporting as of December 31, 2016 has been audited by PricewaterhouseCoopers LLP, the independent registered public accounting firm, as stated in their report which is included herein.
Changes in Internal Control over Financial Reporting
There were no changes in the Trust’s or the Funds’ internal control over financial reporting that occurred during the quarter ended December 31, 2016 that have materially affected, or are reasonably likely to materially affect, the Trust’s or the Funds’ internal control over financial reporting.
Certifications
The certifications by the Principal Executive Officer and Principal Financial Officer of the Trust required by Section 302 and Section 906 of the Sarbanes-Oxley Act of 2002, which are filed or furnished as exhibits to this Annual Report on Form 10-K, apply both to the Trust taken as a whole and each Fund, and the Principal Executive Officer and Principal Financial Officer of the Trust are certifying both as to the Trust taken as a whole and each Fund.
Not applicable.
B-78
Table of Contents
Directors, Executive Officers and Corporate Governance.
The Sponsor
ProShare Capital Management LLC is the Sponsor of the Trust and the Funds. The Sponsor has exclusive management and control of all aspects of the business of the Funds. The Trustee has no duty or liability to supervise the performance of the Sponsor, nor will the Trustee have any liability for the acts or omissions of the Sponsor.
As of December 31, 2016, the Sponsor serves as the Trust’s commodity pool operator.
Specifically, with respect to the Trust, the Sponsor:
| • | selects the Funds’ service providers; |
| • | negotiates various agreements and fees; |
| • | performs such other services as the Sponsor believes that the Trust may require from time to time; |
| • | selects the FCM and Financial Instrument counterparties; |
| • | manages each Fund’s portfolio of other assets, including cash equivalents; and |
| • | manages the Funds with a view toward achieving the Funds’ investment objectives. |
Background and Principals
As of December 31, 2016, the Sponsor served as the commodity pool operator of the Trust and the Funds, and previously also served as the commodity trading advisor to the Trust and the Funds. The Sponsor is registered as a commodity pool operator with the CFTC and is a member in good standing of the NFA. The Sponsor’s membership with the NFA was originally approved on June 11, 1999. It withdrew its membership with the NFA on August 31, 2000 but later re-applied and had its membership subsequently approved on January 8, 2001. Its membership with the NFA is currently effective. The Sponsor’s registration as a commodity trading advisor was approved on June 11, 1999. On February 17, 2013, the Sponsor’s commodity trading advisor registration was withdrawn. The Sponsor’s registration as a commodity pool operator was originally approved on June 11, 1999. It withdrew its registration as a commodity pool operator on August 30, 2000 but later re-applied and had its registration subsequently approved on November 28, 2007. Its registration as a commodity pool operator is currently effective. As a registered commodity pool operator, with respect to the Trust, the Sponsor must comply with various regulatory requirements under the CEA, and the rules and regulations of the CFTC and the NFA, including investor protection requirements, antifraud prohibitions, disclosure requirements, and reporting and recordkeeping requirements. The NFA approved the Sponsor as a Swaps Firm on January 4, 2013. The Sponsor is also subject to periodic inspections and audits by the CFTC and NFA. Its principal place of business is 7501 Wisconsin Avenue, Suite 1000, Bethesda, Maryland 20814 and its telephone number is (240) 497-6400. The registration of the Sponsor with the CFTC and its membership in the NFA must not be taken as an indication that either the CFTC or the NFA has recommended or approved the Sponsor, the Trust and the Funds.
In its capacity as a commodity pool operator, the Sponsor is an organization which operates or solicits funds for commodity pools; that is, an enterprise in which funds contributed by a number of persons are combined for the purpose of trading futures contracts.
Executive Officers of the Trust and Principals and Significant Employees of the Sponsor
| Name |
Position | |
| Michael L. Sapir | Chief Executive Officer and Principal of the Sponsor | |
| Louis M. Mayberg | Principal of the Sponsor | |
| William E. Seale | Principal of the Sponsor |
B-79
Table of Contents
| Sapir Family Trust | Principal of the Sponsor | |
| Northstar Trust | Principal of the Sponsor | |
| Timothy N. Coakley | Chief Financial Officer and Principal of the Sponsor | |
| Edward J. Karpowicz | Principal Financial Officer of the Trust and Principal of the Sponsor | |
| Todd B. Johnson* | Principal Executive Officer of the Trust and Chief Investment Officer and Principal of the Sponsor | |
| Hratch Najarian | Director, Portfolio Management and Principal of the Sponsor | |
| Jeffrey A. Ploshnick | Senior Portfolio Manager and Associated Person of the Sponsor | |
| Ryan T. Dofflemeyer | Portfolio Manager and Associated Person of the Sponsor | |
| Victor M. Frye | Principal of the Sponsor |
| * | Denotes Principal of the Sponsor who supervises persons who participate in making trading decisions for the Funds. |
The following is a biographical summary of the business experience of the executive officers of the Trust and the principals and significant employees of the Sponsor.
ProFund Advisors LLC (“PFA”) and ProShare Advisors LLC (“PSA”) are investment advisers registered under the Investment Advisers Act of 1940 and commodity pool operators registered under the CEA. PFA is also a commodity trading advisor registered under the CEA.
Michael L. Sapir, Chairman and Chief Executive Officer and a listed Principal of the Sponsor since August 14, 2008; Chairman and Chief Executive Officer and a member of PFA since April 1997, and a listed Principal of PFA since November 26, 2012; and Chairman and Chief Executive Officer and a member of PSA since January 2005 and a listed Principal of PSA since January 14, 2014. As Chairman and Chief Executive Officer of the Sponsor, PFA and PSA, Mr. Sapir’s responsibilities include oversight of all aspects of the Sponsor, PFA and PSA, respectively.
Louis M. Mayberg, a member and a listed Principal of the Sponsor since June 9, 2008; a member of PFA since April 1997 and a listed Principal of PFA since November 26, 2012; and a member of PSA since January 2005 and a listed Principal of PSA since January 14, 2014. Mr. Mayberg served as Principal Executive Officer of the Trust from June 2008 to December 2013.
William E. Seale, Ph.D., a member of the Sponsor and a listed Principal of the Sponsor since June 11, 1999; a member of PFA since April 1997 and a listed Principal of PFA since November 8, 2013; and a member of PSA since April 2005 and a listed Principal of PSA since January 14, 2014. Dr. Seale served as Chief Investment Officer of PFA from January 2003 to July 2005 and from October 2006 to June 2008 and as Director of Portfolio from January 1997 to January 2003. Dr. Seale served as Chief Investment Officer of PSA from October 2006 to June 2008. In these roles, Dr. Seale’s responsibilities included oversight of the investment management activities of the respective entities. Dr. Seale is a former commissioner of the CFTC.
Sapir Family Trust, a listed Principal of the Sponsor. The Sapir Family Trust has an ownership interest in the Sponsor and PSA. The Sapir Family Trust has a passive ownership interest in the Sponsor and exercises no management authority over the Funds.
Northstar Trust, a listed Principal of the Sponsor. Northstar Trust has an ownership interest in the Sponsor and PFA. Northstar Trust has a passive ownership interest in the Sponsor and exercises no management authority over the Funds.
Timothy N. Coakley, Chief Financial Officer and a listed Principal of the Sponsor since March 7, 2014; Chief Financial Officer and a listed Principal of PFA since March 11, 2014; and Chief Financial Officer and a listed Principal of PSA since March 11, 2014. As Chief Financial Officer of the Sponsor, Mr. Coakley’s responsibilities include oversight of the financial matters of the Sponsor.
B-80
Table of Contents
Edward J. Karpowicz, Principal Financial Officer of the Trust since July 2008 and a listed principal of the Sponsor since September 18, 2013. Mr. Karpowicz has been employed by PFA since July 2002 and PSA since its inception as Vice President of Financial Administration. Mr. Karpowicz is 53 years old.
Todd B. Johnson, Principal Executive Officer of the Trust since January 2014; Chief Investment Officer of the Sponsor since February 27, 2009, a registered swap associated person of the Sponsor since January 4, 2013, a registered associated person of the Sponsor since January 29, 2010, and a listed principal of the Sponsor since January 16, 2009. As Principal Executive Officer of the Trust, Mr. Johnson’s responsibilities include oversight of the operations of the Trust. As Chief Investment Officer of the Sponsor, Mr. Johnson’s responsibilities include oversight of the investment management activities of the Sponsor. Mr. Johnson has served as Chief Investment Officer of PFA and PSA since December 2008 and has been registered as an associated person of PFA since December 5, 2012 and listed as a principal of PFA since November 26, 2012. In addition, Mr. Johnson has been listed as a principal and associated person of PSA since January 14, 2014. Mr. Johnson served from 2002 to December 2008 at World Asset Management (a financial services firm), working as President and Chief Investment Officer from January 2006 to December 2008, and as Managing Director and Chief Investment Officer of Quantitative Investments of Munder Capital Management, an asset management firm, from January 2002 to December 2005. Mr. Johnson is 53 years old.
Hratch Najarian, Director, Portfolio Management of the Sponsor since August 2013 and a listed principal of the Sponsor since October 15, 2013. In these roles, Mr. Najarian’s responsibilities include oversight of the investment management activities of the Sponsor. Mr. Najarian also serves as Director, Portfolio Management of PFA and PSA since August 2013, and is listed as a principal of PFA since January 8, 2014 and a principal and associated person of PSA since January 14, 2014. Mr. Najarian served as Senior Portfolio Manager of PSA from December 2009 through September 2013. He also served as Senior Portfolio Manager of PFA from December 2009 through September 2013, as Portfolio Manager of PFA from May 2007 through November 2009, and as Associate Portfolio Manager of PFA from November 2004 through April 2007.
Benjamin McAbee, Portfolio Manager of the Sponsor since August 22, 2016, a registered associated person and an NFA associate member of the Sponsor since December 29, 2010. In these roles, Mr. McAbee’s responsibilities include day-to-day portfolio management of the Currency Funds and certain other series of the Trust. Mr. McAbee has been registered as an associated person of PFA since December 5, 2012. Mr. McAbee also serves as a Portfolio Manager of PFA since August 2016 and has served as an Associate Portfolio Manager from December 2011 to August 2016. In addition, Mr. McAbee serves as a Portfolio Manager of PSA since August 2016.
Jeffrey A. Ploshnick, Senior Portfolio Manager of the Sponsor since April 12, 2011, a registered associated person and an NFA associate member of the Sponsor since April 12, 2011. In these roles, Mr. Ploshnick’s responsibilities include day-to-day portfolio management of the Currency Funds. Mr. Ploshnick has been registered as an associated person of PFA since December 5, 2012. Mr. Ploshnick also serves as a Senior Portfolio Manager of PFA since May 2007 and has served as Portfolio Manager from February 2001 to April 2007. In addition, Mr. Ploshnick also serves as a Senior Portfolio Manager of PSA since March 2011.
Alexander Ilyasov, Senior Portfolio Manager of the Sponsor since August 22, 2016. In this role,
Mr. Illyasov’s responsibilities include oversight of the investment management activities of the VIX Futures
Funds and certain other series of the Trust. Mr. Illyasov also serves as a Senior Portfolio Manager of PFA since October 2013 and has served as Portfolio Manager of PSA since October 2013.
Ryan T. Dofflemeyer, Portfolio Manager of the Sponsor since January 3, 2011, a registered associated person and an NFA associate member of the Sponsor since October 26, 2010. In these roles, Mr. Dofflemeyer’s responsibilities include day-to-day portfolio management of the VIX Funds, the Managed Futures Fund, the Commodity Index Funds, the Commodity Funds and certain other series of the Trust. Mr. Dofflemeyer has been registered as an associated person of PFA since December 5, 2012. Mr. Dofflemeyer also serves as a Portfolio Manager of PFA since August 2007 and was a Portfolio Analyst between October 2003 and August 2007. In addition,
B-81
Table of Contents
Mr. Dofflemeyer also serves as Portfolio Manager for Horizon BetaPro Funds (investment funds) since May 2008 and served as a Portfolio Manager of PSA from March 2010 through September 2013. Mr. Dofflemeyer worked as a Research Assistant for the Investment Company Institute (investment funds trade organization) from September 2001 to August 2003.
Victor M. Frye, a listed principal of the Sponsor since December 2, 2008, a listed principal of PFA since November 26, 2012, and a listed principal of PSA since January 14, 2014. Mr. Frye’s responsibilities include the review and approval of advertising material of the Sponsor. Mr. Frye has been employed as Chief Compliance Officer of PFA since October 2002 and of PSA since December 2004.
B-82
Table of Contents
Indemnification
The Trust Agreement provides that the Sponsor and its affiliates shall have no liability to the Trust or to any shareholder for any loss suffered by the Trust arising out of any action or inaction of the Sponsor or its affiliates or their respective directors, officers, shareholders, partners, members, managers or employees (the “Sponsor Related Parties”), if the Sponsor Related Parties, in good faith, determined that such course of conduct was in the best interests of the Funds and such course of conduct did not constitute gross negligence or willful misconduct by the Sponsor Related Parties. The Trust has agreed to indemnify the Sponsor Related Parties against claims, losses or liabilities based on their conduct relating to the Trust, provided that the conduct resulting in the claims, losses or liabilities for which indemnity is sought did not constitute gross negligence or willful misconduct and was done in good faith and in a manner reasonably believed to be in the best interests of the Funds.
Code of Ethics
The Trust has adopted a code of ethics (“Code of Ethics”) that applies to its Principal Executive Officer and Principal Financial Officer. A copy of the Code of Ethics can be obtained, without charge, upon written request to the Sponsor at the following address: ProShare Capital Management LLC, Attn: General Counsel, 7501 Wisconsin Avenue, Suite 1000, Bethesda, MD 20814.
The Funds have no employees or directors and are managed by the Sponsor. None of the officers of the Trust, or the members or officers of the Sponsor receive compensation from the Funds.
The Sponsor receives a monthly Management Fee from each Fund, with the exception of each Matching VIX Fund. equal to 0.95% annually of the average daily net asset value per share at the end of each month. The Sponsor receives a monthly Management Fee from each Matching VIX Fund equal to 0.85% annually of the average daily net asset value per share at the end of each month. During the first year of each Fund’s operations, the Sponsor will waive the Management Fee to the extent that such amounts cumulatively exceed the offering costs incurred by each Fund. For the year ended December 31, 2016, the following represents Management Fees earned by the Sponsor:
| Fund |
||||
| ProShares VIX Short-Term Futures ETF |
$ | 1,632,880 | ||
| ProShares VIX Mid-Term Futures ETF |
369,016 | |||
| ProShares Short VIX Short-Term Futures ETF |
4,448,808 | |||
| ProShares Ultra VIX Short-Term Futures ETF |
6,417,822 | |||
| ProShares UltraShort Bloomberg Crude Oil |
1,755,696 | |||
| ProShares UltraShort Bloomberg Natural Gas |
81,259 | |||
| ProShares UltraShort Gold |
625,950 | |||
| ProShares UltraShort Silver |
349,293 | |||
| ProShares Short Euro |
153,021 | |||
| ProShares UltraShort Australian Dollar |
175,191 | |||
| ProShares UltraShort Euro |
3,777,543 | |||
| ProShares UltraShort Yen |
2,141,333 | |||
| ProShares Ultra Bloomberg Crude Oil |
8,263,078 | |||
| ProShares Ultra Bloomberg Natural Gas |
325,435 | |||
| ProShares Ultra Gold |
900,227 | |||
| ProShares Ultra Silver |
3,021,562 | |||
| ProShares Ultra Euro |
99,537 | |||
| ProShares Ultra Yen |
62,705 | |||
B-83
Table of Contents
Security Ownership of Certain Beneficial Owners and Management and Related Stockholder Matters.
Not applicable.
Certain Relationships and Related Transactions, and Director Independence.
See “Item 11. Executive Compensation” in this Annual Report on Form 10-K.
Principal Accounting Fees and Services.
(1) to (4). Fees for services performed by PricewaterhouseCoopers LLP (“PwC”) for the years ended December 31, 2016 and 2015 were as follows :
| Year Ended December 31, 2016 |
Year Ended December 31, 2015 |
|||||||
| Audit Fees |
742,060 | 775,725 | ||||||
| Audit-Related Fees |
33,000 | 12,500 | ||||||
| Tax Fees |
3,243,200 | 3,369,100 | ||||||
| All Other Fees |
— | — | ||||||
|
|
|
|
|
|||||
| Total |
4,018,260 | 4,157,325 | ||||||
Audit fees for the year ended December 31, 2016 consist of fees paid to PwC for the audit of the Funds’ December 31, 2016 annual financial statements included in the Annual Report on Form 10-K for the year ended December 31, 2016, for the review of the financial statements included in each Form 10-Q, and for the audits of financial statements included with registration statements. Audit fees for the year ended December 31, 2015 consist of fees paid to PwC for the audit of the Funds’ December 31, 2015 annual financial statements included in the Annual Report on Form 10-K for the year ended December 31, 2015, for the review of the financial statements included in each Form 10-Q, and for the audits of financial statements included with registration statements. Tax fees include certain tax compliance and reporting services provided by PwC to the Trust, including processing beneficial ownership information as it relates to the preparation of tax reporting packages and the subsequent delivery of related information to the IRS. Services also include assistance with tax reporting and related information using a web-based tax package product developed by PwC and a toll-free tax package support help line.
(5) The Sponsor approved all of the services provided by PwC described above. The Sponsor pre-approves all audit and allowed non-audit services of the Trust’s independent registered public accounting firm, including all engagement fees and terms.
(6) None of the hours expended on PwC’s engagement to audit each Fund’s financial statements for the years ended December 31, 2015 or 2016 were attributable to work performed by persons other than the principal accountant’s full-time, permanent employees.
B-84
Table of Contents
ProShares Trust II
Financial Statements as of December 31, 2016
| Documents |
Page | |||
| B-86 | ||||
| Statements of Financial Condition, Schedules of Investments, Statements of Operations, Statements of Changes in Shareholders’ Equity and Statements of Cash Flows: | ||||
| B-88 | ||||
| B-94 | ||||
| B-100 | ||||
| B-106 | ||||
| B-112 | ||||
| B-118 | ||||
| B-124 | ||||
| B-131 | ||||
| B-137 | ||||
| B-143 | ||||
| B-149 | ||||
| B-155 | ||||
| B-161 | ||||
| B-167 | ||||
| B-173 | ||||
| B-180 | ||||
| B-187 | ||||
| B-193 | ||||
| B-199 | ||||
| Notes to Financial Statements | B-203 | |||
B-85
Table of Contents
Report of Independent Registered Public Accounting Firm
To the Sponsor of ProShares Trust II and the Shareholders of each of the eighteen funds listed below, comprising ProShares Trust II
In our opinion, the accompanying combined and individual statements of financial condition, including the individual schedules of investments, and the related combined and individual statements of operations, of changes in shareholders’ equity and of cash flows, present fairly, in all material respects, the combined financial position of ProShares Trust II as of December 31, 2016 and 2015, and the individual financial positions of each of the following eighteen funds comprising ProShares Trust II
| ProShares VIX Short-Term Futures ETF (a) | ProShares UltraShort Yen (a) | |
| ProShares VIX Mid-Term Futures ETF (a) | ProShares Ultra Bloomberg Crude Oil (a) | |
| ProShares Short VIX Short-Term Futures ETF (a) | ProShares Ultra Bloomberg Natural Gas (a) | |
| ProShares Ultra VIX Short-Term Futures ETF (a) | ProShares Ultra Gold (a) | |
| ProShares UltraShort Bloomberg Crude Oil (a) | ProShares Ultra Silver (a) | |
| ProShares UltraShort Bloomberg Natural Gas (a) | ProShares Ultra Euro (a) | |
| ProShares UltraShort Gold (a) | ProShares Ultra Yen (a) | |
| ProShares UltraShort Silver (a) | ||
| ProShares Short Euro (a) | ProShares Trust II (“combined”) (b) | |
| ProShares UltraShort Australian Dollar (a) | ||
| ProShares UltraShort Euro (a) |
| (a) | A statement of financial condition, including the schedule of investments, is presented as of December 31, 2016 and 2015, and the related statements of operations, of changes in shareholders’ equity and of cash flows are presented for each of the three years in the period ended December 31, 2016. |
| (b) | A statement of financial condition is presented as of December 31, 2016 and 2015, and the related statements of operations, of changes in shareholders’ equity and of cash flows are presented for each of the three years in the period ended December 31, 2016. |
(collectively, the “Trust”) as of December 31, 2016 and 2015, and the combined and individual results of their operations and their cash flows, for the respective periods described in (a) and (b) above in conformity with accounting principles generally accepted in the United States of America. Also in our opinion, the combined Trust and each of the individual funds maintained, in all material respects, effective internal control over financial reporting as of December 31, 2016, based on criteria established in Internal Control - Integrated Framework (2013) issued by the Committee of Sponsoring Organizations of the Treadway Commission (COSO). The Trust’s management is responsible for these financial statements, for maintaining effective internal control over financial reporting and for its assessment of the effectiveness of internal control over financial reporting, included in Management’s Annual Report on Internal Control Over Financial Reporting appearing under Item 9A. Our responsibility is to express opinions on the combined Trust and each of the individual fund’s financial statements and on the combined Trust’s and each of the individual fund’s internal control over financial reporting based on our integrated audits. We conducted our audits in accordance with the standards of the Public Company Accounting Oversight Board (United States). Those standards require that we plan and perform the audits to obtain reasonable assurance about whether the financial statements are free of material misstatement and whether effective internal control over financial reporting was maintained in all material respects. Our audits of the financial statements included examining, on a test basis, evidence supporting the amounts and disclosures in the financial statements, assessing the accounting principles used and significant estimates made by management, and evaluating the overall financial statement presentation. Our audits of internal control over financial reporting included obtaining an understanding of internal control over financial reporting, assessing the risk that a material weakness exists, and testing and evaluating the design and operating effectiveness of internal control based on the assessed risk. Our audits also included performing such other procedures as we considered necessary in the circumstances. We believe that our audits provide a reasonable basis for our opinions.
B-86
Table of Contents
A trust’s internal control over financial reporting is a process designed to provide reasonable assurance regarding the reliability of financial reporting and the preparation of financial statements for external purposes in accordance with generally accepted accounting principles. A trust’s internal control over financial reporting includes those policies and procedures that (i) pertain to the maintenance of records that, in reasonable detail, accurately and fairly reflect the transactions and dispositions of the assets of the trust; (ii) provide reasonable assurance that transactions are recorded as necessary to permit preparation of financial statements in accordance with generally accepted accounting principles, and that receipts and expenditures of the trust are being made only in accordance with authorizations of management of the trust; and (iii) provide reasonable assurance regarding prevention or timely detection of unauthorized acquisition, use, or disposition of the trust’s assets that could have a material effect on the financial statements.
Because of its inherent limitations, internal control over financial reporting may not prevent or detect misstatements. Also, projections of any evaluation of effectiveness to future periods are subject to the risk that controls may become inadequate because of changes in conditions, or that the degree of compliance with the policies or procedures may deteriorate.
/s/ PricewaterhouseCoopers LLP
Baltimore, Maryland
February 27, 2017
B-87
Table of Contents
PROSHARES VIX SHORT-TERM FUTURES ETF
STATEMENTS OF FINANCIAL CONDITION
| December 31, 2016 | December 31, 2015 | |||||||
| Assets |
||||||||
| Cash |
$ | 4,536,425 | $ | 2,124,103 | ||||
| Segregated cash balances with brokers for futures contracts |
17,235,855 | 5,888,545 | ||||||
| Short-term U.S. government and agency obligations (Note 3) (cost $147,990,045 and $96,075,481, respectively) |
147,991,233 | 96,073,659 | ||||||
| Receivable on open futures contracts |
4,484,270 | 1,263,933 | ||||||
|
|
|
|
|
|||||
| Total assets |
174,247,783 | 105,350,240 | ||||||
|
|
|
|
|
|||||
| Liabilities and shareholders’ equity |
||||||||
| Liabilities |
||||||||
| Payable to Sponsor |
87,637 | 77,417 | ||||||
|
|
|
|
|
|||||
| Total liabilities |
87,637 | 77,417 | ||||||
|
|
|
|
|
|||||
| Commitments and Contingencies (Note 2) |
||||||||
| Shareholders’ equity |
||||||||
| Shareholders’ equity |
174,160,146 | 105,272,823 | ||||||
|
|
|
|
|
|||||
| Total liabilities and shareholders’ equity |
$ | 174,247,783 | $ | 105,350,240 | ||||
|
|
|
|
|
|||||
| Shares outstanding (Note 1) |
8,209,451 | 1,589,962 | ||||||
|
|
|
|
|
|||||
| Net asset value per share (Note 1) |
$ | 21.21 | $ | 66.21 | ||||
|
|
|
|
|
|||||
| Market value per share (Note 1) (Note 2) |
$ | 21.26 | $ | 66.65 | ||||
|
|
|
|
|
|||||
See accompanying notes to financial statements.
B-88
Table of Contents
PROSHARES VIX SHORT-TERM FUTURES ETF
SCHEDULE OF INVESTMENTS
DECEMBER 31, 2016
| Principal Amount | Value | |||||||
| Short-term U.S. government and agency obligations |
|
|||||||
| (85% of shareholders’ equity) |
|
|||||||
| U.S. Treasury Bills^^: |
||||||||
| 0.382% due 01/12/17† |
$ | 39,000,000 | $ | 38,996,151 | ||||
| 0.330% due 01/19/17† |
9,000,000 | 8,998,340 | ||||||
| 0.353% due 01/26/17† |
15,500,000 | 15,495,891 | ||||||
| 0.409% due 02/02/17† |
32,560,000 | 32,548,741 | ||||||
| 0.425% due 02/09/17† |
5,000,000 | 4,997,739 | ||||||
| 0.390% due 02/16/17 |
10,000,000 | 9,994,561 | ||||||
| 0.493% due 03/23/17 |
37,000,000 | 36,959,810 | ||||||
|
|
|
|||||||
| Total short-term U.S. government and agency obligations (cost $147,990,045) |
$ | 147,991,233 | ||||||
|
|
|
|||||||
Futures Contracts Purchased††
| Number of Contracts |
Notional Amount at Value |
Unrealized Appreciation (Depreciation) |
||||||||||
| VIX Futures - CBOE, expires January 2017 |
6,549 | $ | 99,053,625 | $ | (2,742,526 | ) | ||||||
| VIX Futures - CBOE, expires February 2017 |
4,560 | 75,582,000 | 2,273,874 | |||||||||
|
|
|
|||||||||||
| $ | (468,652 | ) | ||||||||||
|
|
|
|||||||||||
| ^^ | Rates shown represents discount rate at the time of purchase. |
| † | All or partial amount pledged as collateral for futures contracts. |
| †† | Cash collateral in the amount of $17,235,855 was pledged to cover margin requirements for open futures contracts as of December 31, 2016. |
See accompanying notes to financial statements.
B-89
Table of Contents
PROSHARES VIX SHORT-TERM FUTURES ETF
SCHEDULE OF INVESTMENTS
DECEMBER 31, 2015
| Principal Amount | Value | |||||||
| Short-term U.S. government and agency obligations |
|
|||||||
| (91% of shareholders’ equity) |
|
|||||||
| U.S. Treasury Bills^^: |
||||||||
| 0.087% due 01/07/16 |
$ | 5,167,000 | $ | 5,166,983 | ||||
| 0.165% due 01/28/16 |
4,768,000 | 4,767,587 | ||||||
| 0.007% due 02/04/16 |
44,408,000 | 44,404,749 | ||||||
| 0.000% due 02/25/16 |
6,625,000 | 6,624,282 | ||||||
| 0.190% due 03/03/16 |
2,943,000 | 2,942,542 | ||||||
| 0.070% due 03/10/16 |
2,214,000 | 2,213,533 | ||||||
| 0.201% due 03/17/16† |
14,428,000 | 14,425,221 | ||||||
| 0.060% due 03/24/16† |
5,088,000 | 5,085,965 | ||||||
| 0.366% due 05/26/16† |
10,459,000 | 10,442,797 | ||||||
|
|
|
|||||||
| Total short-term U.S. government and agency obligations (cost $96,075,481) |
$ | 96,073,659 | ||||||
|
|
|
|||||||
Futures Contracts Purchased††
| Number of Contracts |
Notional Amount at Value |
Unrealized Appreciation (Depreciation) |
||||||||||
| VIX Futures - CBOE, expires January 2016 |
2,821 | $ | 52,259,025 | $ | (958,831 | ) | ||||||
| VIX Futures - CBOE, expires February 2016 |
2,821 | 53,246,375 | (119,794 | ) | ||||||||
|
|
|
|||||||||||
| $ | (1,078,625 | ) | ||||||||||
|
|
|
|||||||||||
| ^^ | Rates shown represents discount rate at the time of purchase. |
| † | All or partial amount pledged as collateral for futures contracts. |
| †† | Cash collateral in the amount of $5,888,545 was pledged to cover margin requirements for open futures contracts as of December 31, 2015. |
See accompanying notes to financial statements.
B-90
Table of Contents
PROSHARES VIX SHORT-TERM FUTURES ETF
STATEMENTS OF OPERATIONS
FOR THE YEARS ENDED DECEMBER 31, 2016, 2015 AND 2014
| Year ended December 31, 2016 |
Year ended December 31, 2015 |
Year ended December 31, 2014 |
||||||||||
| Investment Income |
||||||||||||
| Interest |
$ | 466,392 | $ | 42,319 | $ | 47,562 | ||||||
|
|
|
|
|
|
|
|||||||
| Expenses |
||||||||||||
| Management fee |
1,632,880 | 1,062,171 | 1,083,189 | |||||||||
| Brokerage commissions and fees |
270,159 | 130,942 | 82,921 | |||||||||
|
|
|
|
|
|
|
|||||||
| Total expenses |
1,903,039 | 1,193,113 | 1,166,110 | |||||||||
|
|
|
|
|
|
|
|||||||
| Net investment income (loss) |
(1,436,647 | ) | (1,150,794 | ) | (1,118,548 | ) | ||||||
|
|
|
|
|
|
|
|||||||
| Realized and unrealized gain (loss) on investment activity |
||||||||||||
| Net realized gain (loss) on |
||||||||||||
| Futures contracts |
(195,475,791 | ) | (19,408,543 | ) | (694,347 | ) | ||||||
| Short-term U.S. government and agency obligations |
6,650 | 1,703 | 12,242 | |||||||||
|
|
|
|
|
|
|
|||||||
| Net realized gain (loss) |
(195,469,141 | ) | (19,406,840 | ) | (682,105 | ) | ||||||
|
|
|
|
|
|
|
|||||||
| Change in net unrealized appreciation/depreciation on |
||||||||||||
| Futures contracts |
609,973 | (7,343,245 | ) | 22,917,306 | ||||||||
| Short-term U.S. government and agency obligations |
3,010 | (3,657 | ) | (6,229 | ) | |||||||
|
|
|
|
|
|
|
|||||||
| Change in net unrealized appreciation/depreciation |
612,983 | (7,346,902 | ) | 22,911,077 | ||||||||
|
|
|
|
|
|
|
|||||||
| Net realized and unrealized gain (loss) |
(194,856,158 | ) | (26,753,742 | ) | 22,228,972 | |||||||
|
|
|
|
|
|
|
|||||||
| Net income (loss) |
$ | (196,292,805 | ) | $ | (27,904,536 | ) | $ | 21,110,424 | ||||
|
|
|
|
|
|
|
|||||||
See accompanying notes to financial statements.
B-91
Table of Contents
PROSHARES VIX SHORT-TERM FUTURES ETF
STATEMENTS OF CHANGES IN SHAREHOLDERS’ EQUITY
FOR THE YEARS ENDED DECEMBER 31, 2016, 2015 AND 2014
| Year ended December 31, 2016 |
Year ended December 31, 2015 |
Year ended December 31, 2014 |
||||||||||
| Shareholders’ equity, beginning of period |
$ | 105,272,823 | $ | 111,459,325 | $ | 270,398,554 | ||||||
| Addition of 12,265,000, 2,495,000 and 2,115,000 shares, respectively (Note 1) |
515,131,303 | 187,659,682 | 228,373,046 | |||||||||
| Redemption of 5,645,511, 1,970,000 and 2,945,000 shares, respectively (Note 1) |
(249,951,175 | ) | (165,941,648 | ) | (408,422,699 | ) | ||||||
|
|
|
|
|
|
|
|||||||
| Net addition (redemption) of 6,619,489, 525,000 and (830,000) shares, respectively (Note 1) |
265,180,128 | 21,718,034 | (180,049,653 | ) | ||||||||
|
|
|
|
|
|
|
|||||||
| Net investment income (loss) |
(1,436,647 | ) | (1,150,794 | ) | (1,118,548 | ) | ||||||
| Net realized gain (loss) |
(195,469,141 | ) | (19,406,840 | ) | (682,105 | ) | ||||||
| Change in net unrealized appreciation/depreciation |
612,983 | (7,346,902 | ) | 22,911,077 | ||||||||
|
|
|
|
|
|
|
|||||||
| Net income (loss) |
(196,292,805 | ) | (27,904,536 | ) | 21,110,424 | |||||||
|
|
|
|
|
|
|
|||||||
| Shareholders’ equity, end of period |
$ | 174,160,146 | $ | 105,272,823 | $ | 111,459,325 | ||||||
|
|
|
|
|
|
|
|||||||
See accompanying notes to financial statements.
B-92
Table of Contents
PROSHARES VIX SHORT-TERM FUTURES ETF
STATEMENTS OF CASH FLOWS
FOR THE YEARS ENDED DECEMBER 31, 2016, 2015 AND 2014
| Year ended December 31, 2016 |
Year ended December 31, 2015 |
Year ended December 31, 2014 |
||||||||||
| Cash flow from operating activities |
||||||||||||
| Net income (loss) |
$ | (196,292,805 | ) | $ | (27,904,536 | ) | $ | 21,110,424 | ||||
| Adjustments to reconcile net income (loss) to net cash provided by (used in) operating activities: |
||||||||||||
| Decrease (Increase) in segregated cash balances with brokers for futures contracts |
(11,347,310 | ) | 12,551,205 | 45,580,600 | ||||||||
| Purchases of short-term U.S. government and agency obligations |
(920,726,003 | ) | (599,166,468 | ) | (674,817,750 | ) | ||||||
| Proceeds from sales or maturities of short-term U.S government and agency obligations |
869,284,481 | 585,220,876 | 800,418,587 | |||||||||
| Net amortization and accretion on short-term U.S government and agency obligations |
(466,392 | ) | (41,722 | ) | (46,740 | ) | ||||||
| Net realized gain (loss) on investments |
(6,650 | ) | (1,703 | ) | (12,242 | ) | ||||||
| Change in unrealized appreciation/depreciation on investments |
(3,010 | ) | 3,657 | 6,229 | ||||||||
| Decrease (Increase) in receivable on futures contracts |
(3,220,337 | ) | 8,053,303 | (6,138,219 | ) | |||||||
| Increase (Decrease) in payable to Sponsor |
10,220 | (3,334 | ) | (128,002 | ) | |||||||
|
|
|
|
|
|
|
|||||||
| Net cash provided by (used in) operating activities |
(262,767,806 | ) | (21,288,722 | ) | 185,972,887 | |||||||
|
|
|
|
|
|
|
|||||||
| Cash flow from financing activities |
||||||||||||
| Proceeds from addition of shares |
515,131,303 | 187,659,682 | 228,373,046 | |||||||||
| Payment on shares redeemed |
(249,951,175 | ) | (165,941,648 | ) | (416,984,894 | ) | ||||||
|
|
|
|
|
|
|
|||||||
| Net cash provided by (used in) financing activities |
265,180,128 | 21,718,034 | (188,611,848 | ) | ||||||||
|
|
|
|
|
|
|
|||||||
| Net increase (decrease) in cash |
2,412,322 | 429,312 | (2,638,961 | ) | ||||||||
| Cash, beginning of period |
2,124,103 | 1,694,791 | 4,333,752 | |||||||||
|
|
|
|
|
|
|
|||||||
| Cash, end of period |
$ | 4,536,425 | $ | 2,124,103 | $ | 1,694,791 | ||||||
|
|
|
|
|
|
|
|||||||
See accompanying notes to financial statements.
B-93
Table of Contents
PROSHARES VIX MID-TERM FUTURES ETF
STATEMENTS OF FINANCIAL CONDITION
| December 31, 2016 | December 31, 2015 | |||||||
| Assets |
||||||||
| Cash |
$ | 1,155,115 | $ | 671,791 | ||||
| Segregated cash balances with brokers for futures contracts |
1,052,615 | 980,750 | ||||||
| Short-term U.S. government and agency obligations (Note 3) (cost $45,486,489 and $25,975,462, respectively) |
45,486,235 | 25,976,287 | ||||||
| Receivable on open futures contracts |
242,541 | 42,188 | ||||||
|
|
|
|
|
|||||
| Total assets |
47,936,506 | 27,671,016 | ||||||
|
|
|
|
|
|||||
| Liabilities and shareholders’ equity |
||||||||
| Liabilities |
||||||||
| Payable for capital shares redeemed |
2,085,020 | — | ||||||
| Payable to Sponsor |
32,572 | 20,378 | ||||||
|
|
|
|
|
|||||
| Total liabilities |
2,117,592 | 20,378 | ||||||
|
|
|
|
|
|||||
| Commitments and Contingencies (Note 2) |
||||||||
| Shareholders’ equity |
||||||||
| Shareholders’ equity |
45,818,914 | 27,650,638 | ||||||
|
|
|
|
|
|||||
| Total liabilities and shareholders’ equity |
$ | 47,936,506 | $ | 27,671,016 | ||||
|
|
|
|
|
|||||
| Shares outstanding |
1,087,403 | 512,404 | ||||||
|
|
|
|
|
|||||
| Net asset value per share |
$ | 42.14 | $ | 53.96 | ||||
|
|
|
|
|
|||||
| Market value per share (Note 2) |
$ | 42.34 | $ | 53.99 | ||||
|
|
|
|
|
|||||
See accompanying notes to financial statements.
B-94
Table of Contents
PROSHARES VIX MID-TERM FUTURES ETF
SCHEDULE OF INVESTMENTS
DECEMBER 31, 2016
| Principal Amount | Value | |||||||
| Short-term U.S. government and agency obligations |
|
|||||||
| (99% of shareholders’ equity) |
|
|||||||
| U.S. Treasury Bills^^: |
||||||||
| 0.281% due 01/05/17 |
$ | 1,500,000 | $ | 1,499,968 | ||||
| 0.390% due 01/12/17 |
18,500,000 | 18,498,174 | ||||||
| 0.299% due 01/19/17 |
2,000,000 | 1,999,631 | ||||||
| 0.311% due 01/26/17 |
1,500,000 | 1,499,602 | ||||||
| 0.411% due 02/02/17 |
2,000,000 | 1,999,308 | ||||||
| 0.372% due 02/09/17† |
10,000,000 | 9,995,478 | ||||||
| 0.390% due 02/16/17 |
6,000,000 | 5,996,737 | ||||||
| 0.491% due 02/23/17† |
4,000,000 | 3,997,337 | ||||||
|
|
|
|||||||
| Total short-term U.S. government and agency obligations (cost $45,486,489) |
$ | 45,486,235 | ||||||
|
|
|
|||||||
Futures Contracts Purchased††
| Number of Contracts |
Notional Amount at Value |
Unrealized Appreciation (Depreciation) |
||||||||||
| VIX Futures - CBOE, expires April 2017 |
474 | $ | 8,733,450 | $ | (655,635 | ) | ||||||
| VIX Futures - CBOE, expires May 2017 |
806 | 15,172,950 | (628,070 | ) | ||||||||
| VIX Futures - CBOE, expires June 2017 |
807 | 15,393,525 | (72,915 | ) | ||||||||
| VIX Futures - CBOE, expires July 2017 |
332 | 6,523,800 | 68,375 | |||||||||
|
|
|
|||||||||||
| $ | (1,288,245 | ) | ||||||||||
|
|
|
|||||||||||
| ^^ | Rates shown represents discount rate at the time of purchase. |
| † | All or partial amount pledged as collateral for futures contracts. |
| †† | Cash collateral in the amount of $1,052,615 was pledged to cover margin requirements for open futures contracts as of December 31, 2016. |
See accompanying notes to financial statements.
B-95
Table of Contents
PROSHARES VIX MID-TERM FUTURES ETF
SCHEDULE OF INVESTMENTS
DECEMBER 31, 2015
| Principal Amount | Value | |||||||
| Short-term U.S. government and agency obligations |
|
|||||||
| (94% of shareholders’ equity) |
|
|||||||
| U.S. Treasury Bills^^: |
||||||||
| 0.019% due 02/04/16 |
$ | 15,119,000 | $ | 15,117,893 | ||||
| 0.000% due 02/25/16 |
1,778,000 | 1,777,808 | ||||||
| 0.209% due 03/03/16† |
9,082,000 | 9,080,586 | ||||||
|
|
|
|||||||
| Total short-term U.S. government and agency obligations (cost $25,975,462) |
$ | 25,976,287 | ||||||
|
|
|
|||||||
Futures Contracts Purchased††
| Number of Contracts |
Notional Amount at Value |
Unrealized Appreciation (Depreciation) |
||||||||||
| VIX Futures - CBOE, expires April 2016 |
235 | $ | 4,547,250 | $ | (168,335 | ) | ||||||
| VIX Futures - CBOE, expires May 2016 |
469 | 9,145,500 | 10,005 | |||||||||
| VIX Futures - CBOE, expires June 2016 |
469 | 9,262,750 | (135,125 | ) | ||||||||
| VIX Futures - CBOE, expires July 2016 |
234 | 4,691,700 | (50,905 | ) | ||||||||
|
|
|
|||||||||||
| $ | (344,360 | ) | ||||||||||
|
|
|
|||||||||||
| ^^ | Rates shown represents discount rate at the time of purchase. |
| † | All or partial amount pledged as collateral for futures contracts. |
| †† | Cash collateral in the amount of $980,750 was pledged to cover margin requirements for open futures contracts as of December 31, 2015. |
See accompanying notes to financial statements.
B-96
Table of Contents
PROSHARES VIX MID-TERM FUTURES ETF
STATEMENTS OF OPERATIONS
FOR THE YEARS ENDED DECEMBER 31, 2016, 2015 AND 2014
| Year ended December 31, 2016 |
Year ended December 31, 2015 |
Year ended December 31, 2014 |
||||||||||
| Investment Income |
||||||||||||
| Interest |
$ | 107,409 | $ | 8,293 | $ | 16,573 | ||||||
|
|
|
|
|
|
|
|||||||
| Expenses |
||||||||||||
| Management fee |
369,016 | 233,390 | 392,120 | |||||||||
| Brokerage commissions and fees |
32,884 | 15,503 | 10,931 | |||||||||
|
|
|
|
|
|
|
|||||||
| Total expenses |
401,900 | 248,893 | 403,051 | |||||||||
|
|
|
|
|
|
|
|||||||
| Net investment income (loss) |
(294,491 | ) | (240,600 | ) | (386,478 | ) | ||||||
|
|
|
|
|
|
|
|||||||
| Realized and unrealized gain (loss) on investment activity |
||||||||||||
| Net realized gain (loss) on |
||||||||||||
| Futures contracts |
(11,085,506 | ) | (3,335,936 | ) | (14,378,810 | ) | ||||||
| Short-term U.S. government and agency obligations |
499 | 1,355 | 1,742 | |||||||||
|
|
|
|
|
|
|
|||||||
| Net realized gain (loss) |
(11,085,007 | ) | (3,334,581 | ) | (14,377,068 | ) | ||||||
|
|
|
|
|
|
|
|||||||
| Change in net unrealized appreciation/depreciation on |
||||||||||||
| Futures contracts |
(943,885 | ) | (605,025 | ) | 5,157,354 | |||||||
| Short-term U.S. government and agency obligations |
(1,079 | ) | (327 | ) | 187 | |||||||
|
|
|
|
|
|
|
|||||||
| Change in net unrealized appreciation/depreciation |
(944,964 | ) | (605,352 | ) | 5,157,541 | |||||||
|
|
|
|
|
|
|
|||||||
| Net realized and unrealized gain (loss) |
(12,029,971 | ) | (3,939,933 | ) | (9,219,527 | ) | ||||||
|
|
|
|
|
|
|
|||||||
| Net income (loss) |
$ | (12,324,462 | ) | $ | (4,180,533 | ) | $ | (9,606,005 | ) | |||
|
|
|
|
|
|
|
|||||||
See accompanying notes to financial statements.
B-97
Table of Contents
PROSHARES VIX MID-TERM FUTURES ETF
STATEMENTS OF CHANGES IN SHAREHOLDERS’ EQUITY
FOR THE YEARS ENDED DECEMBER 31, 2016, 2015 AND 2014
| Year ended December 31, 2016 |
Year ended December 31, 2015 |
Year ended December 31, 2014 |
||||||||||
| Shareholders’ equity, beginning of period |
$ | 27,650,638 | $ | 21,459,575 | $ | 51,134,323 | ||||||
| Addition of 1,100,000, 325,000 and 593,750 shares, respectively |
55,230,587 | 19,318,111 | 41,886,902 | |||||||||
| Redemption of 525,001, 150,000 and 918,847 shares, respectively |
(24,737,849 | ) | (8,946,515 | ) | (61,955,645 | ) | ||||||
|
|
|
|
|
|
|
|||||||
| Net addition (redemption) of 574,999, 175,000 and (325,097) shares, respectively |
30,492,738 | 10,371,596 | (20,068,743 | ) | ||||||||
|
|
|
|
|
|
|
|||||||
| Net investment income (loss) |
(294,491 | ) | (240,600 | ) | (386,478 | ) | ||||||
| Net realized gain (loss) |
(11,085,007 | ) | (3,334,581 | ) | (14,377,068 | ) | ||||||
| Change in net unrealized appreciation/depreciation |
(944,964 | ) | (605,352 | ) | 5,157,541 | |||||||
|
|
|
|
|
|
|
|||||||
| Net income (loss) |
(12,324,462 | ) | (4,180,533 | ) | (9,606,005 | ) | ||||||
|
|
|
|
|
|
|
|||||||
| Shareholders’ equity, end of period |
$ | 45,818,914 | $ | 27,650,638 | $ | 21,459,575 | ||||||
|
|
|
|
|
|
|
|||||||
See accompanying notes to financial statements.
B-98
Table of Contents
PROSHARES VIX MID-TERM FUTURES ETF
STATEMENTS OF CASH FLOWS
FOR THE YEARS ENDED DECEMBER 31, 2016, 2015 AND 2014
| Year ended December 31, 2016 |
Year ended December 31, 2015 |
Year ended December 31, 2014 |
||||||||||
| Cash flow from operating activities |
||||||||||||
| Net income (loss) |
$ | (12,324,462 | ) | $ | (4,180,533 | ) | $ | (9,606,005 | ) | |||
| Adjustments to reconcile net income (loss) to net cash provided by (used in) operating activities: |
||||||||||||
| Decrease (Increase) in segregated cash balances with brokers for futures contracts |
(71,865 | ) | 926,200 | 6,547,440 | ||||||||
| Purchases of short-term U.S. government and agency obligations |
(175,738,460 | ) | (95,567,067 | ) | (161,570,392 | ) | ||||||
| Proceeds from sales or maturities of short-term U.S government and agency obligations |
156,335,340 | 93,706,007 | 183,523,221 | |||||||||
| Net amortization and accretion on short-term U.S government and agency obligations |
(107,408 | ) | (8,293 | ) | (16,573 | ) | ||||||
| Net realized gain (loss) on investments |
(499 | ) | (1,355 | ) | (1,742 | ) | ||||||
| Change in unrealized appreciation/depreciation on investments |
1,079 | 327 | (187 | ) | ||||||||
| Decrease (Increase) in receivable on futures contracts |
(200,353 | ) | 1,741,140 | (1,682,594 | ) | |||||||
| Increase (Decrease) in payable to Sponsor |
12,194 | (2,358 | ) | (22,712 | ) | |||||||
|
|
|
|
|
|
|
|||||||
| Net cash provided by (used in) operating activities |
(32,094,434 | ) | (3,385,932 | ) | 17,170,456 | |||||||
|
|
|
|
|
|
|
|||||||
| Cash flow from financing activities |
||||||||||||
| Proceeds from addition of shares |
55,230,587 | 19,318,111 | 41,886,902 | |||||||||
| Payment on shares redeemed |
(22,652,829 | ) | (16,894,470 | ) | (59,329,673 | ) | ||||||
|
|
|
|
|
|
|
|||||||
| Net cash provided by (used in) financing activities |
32,577,758 | 2,423,641 | (17,442,771 | ) | ||||||||
|
|
|
|
|
|
|
|||||||
| Net increase (decrease) in cash |
483,324 | (962,291 | ) | (272,315 | ) | |||||||
| Cash, beginning of period |
671,791 | 1,634,082 | 1,906,397 | |||||||||
|
|
|
|
|
|
|
|||||||
| Cash, end of period |
$ | 1,155,115 | $ | 671,791 | $ | 1,634,082 | ||||||
|
|
|
|
|
|
|
|||||||
See accompanying notes to financial statements.
B-99
Table of Contents
PROSHARES SHORT VIX SHORT-TERM FUTURES ETF
STATEMENTS OF FINANCIAL CONDITION
| December 31, 2016 | December 31, 2015 | |||||||
| Assets |
||||||||
| Cash |
$ | 1,850,760 | $ | 5,150,976 | ||||
| Segregated cash balances with brokers for futures contracts |
55,323,984 | 123,528,405 | ||||||
| Short-term U.S. government and agency obligations (Note 3) (cost $170,391,741 and $535,381,199, respectively) |
170,396,436 | 535,392,718 | ||||||
| Receivable from capital shares sold |
— | 10,164,157 | ||||||
| Receivable on open futures contracts |
1,059,418 | — | ||||||
|
|
|
|
|
|||||
| Total assets |
228,630,598 | 674,236,256 | ||||||
|
|
|
|
|
|||||
| Liabilities and shareholders’ equity |
||||||||
| Liabilities |
||||||||
| Payable for capital shares redeemed |
— | 29,497,107 | ||||||
| Payable on open futures contracts |
325,000 | 1,420,271 | ||||||
| Payable to Sponsor |
230,211 | 507,517 | ||||||
|
|
|
|
|
|||||
| Total liabilities |
555,211 | 31,424,895 | ||||||
|
|
|
|
|
|||||
| Commitments and Contingencies (Note 2) |
||||||||
| Shareholders’ equity |
||||||||
| Shareholders’ equity |
228,075,387 | 642,811,361 | ||||||
|
|
|
|
|
|||||
| Total liabilities and shareholders’ equity |
$ | 228,630,598 | $ | 674,236,256 | ||||
|
|
|
|
|
|||||
| Shares outstanding |
2,500,000 | 12,650,040 | ||||||
|
|
|
|
|
|||||
| Net asset value per share |
$ | 91.23 | $ | 50.81 | ||||
|
|
|
|
|
|||||
| Market value per share (Note 2) |
$ | 90.98 | $ | 50.45 | ||||
|
|
|
|
|
|||||
See accompanying notes to financial statements.
B-100
Table of Contents
PROSHARES SHORT VIX SHORT-TERM FUTURES ETF
SCHEDULE OF INVESTMENTS
DECEMBER 31, 2016
| Principal Amount | Value | |||||||
| Short-term U.S. government and agency obligations |
|
|||||||
| (75% of shareholders’ equity) |
|
|||||||
| U.S. Treasury Bills^^: |
||||||||
| 0.471% due 02/09/17 |
$ | 47,500,000 | $ | 47,478,520 | ||||
| 0.437% due 02/16/17† |
95,000,000 | 94,948,330 | ||||||
| 0.493% due 03/23/17 |
28,000,000 | 27,969,586 | ||||||
|
|
|
|||||||
| Total short-term U.S. government and agency obligations (cost $170,391,741) |
$ | 170,396,436 | ||||||
|
|
|
|||||||
Futures Contracts Sold††
| Number of Contracts |
Notional Amount at Value |
Unrealized Appreciation (Depreciation) |
||||||||||
| VIX Futures - CBOE, expires January 2017 |
8,491 | $ | 128,426,375 | $ | (7,027,685 | ) | ||||||
| VIX Futures - CBOE, expires February 2017 |
5,974 | 99,019,050 | (3,281,926 | ) | ||||||||
|
|
|
|||||||||||
| $ | (10,309,611 | ) | ||||||||||
|
|
|
|||||||||||
| ^^ | Rates shown represents discount rate at the time of purchase. |
| † | All or partial amount pledged as collateral for futures contracts. |
| †† | Cash collateral in the amount of $55,323,984 was pledged to cover margin requirements for open futures contracts as of December 31, 2016. |
See accompanying notes to financial statements.
B-101
Table of Contents
PROSHARES SHORT VIX SHORT-TERM FUTURES ETF
SCHEDULE OF INVESTMENTS
DECEMBER 31, 2015
| Principal Amount | Value | |||||||
| Short-term U.S. government and agency obligations |
||||||||
| (83% of shareholders’ equity) |
||||||||
| U.S. Treasury Bills^^: |
||||||||
| 0.065% due 01/07/16 |
$ | 44,561,000 | $ | 44,560,853 | ||||
| 0.053% due 01/14/16 |
13,600,000 | 13,599,660 | ||||||
| 0.000% due 01/21/16 |
10,817,000 | 10,816,540 | ||||||
| 0.165% due 01/28/16 |
22,342,000 | 22,340,063 | ||||||
| 0.035% due 02/04/16 |
36,091,000 | 36,088,358 | ||||||
| 0.036% due 02/11/16 |
85,348,000 | 85,336,743 | ||||||
| 0.000% due 02/25/16 |
10,901,000 | 10,899,819 | ||||||
| 0.208% due 03/03/16 |
63,916,000 | 63,906,048 | ||||||
| 0.194% due 03/17/16 |
74,289,000 | 74,274,692 | ||||||
| 0.206% due 03/24/16 |
35,842,000 | 35,827,663 | ||||||
| 0.364% due 05/26/16† |
137,956,000 | 137,742,279 | ||||||
|
|
|
|||||||
| Total short-term U.S. government and agency obligations (cost $535,381,199) |
$ | 535,392,718 | ||||||
|
|
|
|||||||
Futures Contracts Sold††
| Number of Contracts |
Notional Amount at Value |
Unrealized Appreciation (Depreciation) |
||||||||||
| VIX Futures - CBOE, expires January 2016 |
17,150 | $ | 317,703,750 | $ | 10,805,245 | |||||||
| VIX Futures - CBOE, expires February 2016 |
17,151 | 323,725,125 | (58,830 | ) | ||||||||
|
|
|
|||||||||||
| $ | 10,746,415 | |||||||||||
|
|
|
|||||||||||
| ^^ | Rates shown represents discount rate at the time of purchase. |
| † | All or partial amount pledged as collateral for futures contracts. |
| †† | Cash collateral in the amount of $123,528,405 was pledged to cover margin requirements for open futures contracts as of December 31, 2015. |
See accompanying notes to financial statements.
B-102
Table of Contents
PROSHARES SHORT VIX SHORT-TERM FUTURES ETF
STATEMENTS OF OPERATIONS
FOR THE YEARS ENDED DECEMBER 31, 2016, 2015 AND 2014
| Year ended December 31, 2016 |
Year ended December 31, 2015 |
Year ended December 31, 2014 |
||||||||||
| Investment Income |
||||||||||||
| Interest |
$ | 1,126,057 | $ | 180,686 | $ | 81,544 | ||||||
|
|
|
|
|
|
|
|||||||
| Expenses |
||||||||||||
| Management fee |
4,448,808 | 4,043,491 | 2,785,597 | |||||||||
| Brokerage commissions and fees |
2,074,099 | 1,935,395 | 1,581,416 | |||||||||
|
|
|
|
|
|
|
|||||||
| Total expenses |
6,522,907 | 5,978,886 | 4,367,013 | |||||||||
|
|
|
|
|
|
|
|||||||
| Net investment income (loss) |
(5,396,850 | ) | (5,798,200 | ) | (4,285,469 | ) | ||||||
|
|
|
|
|
|
|
|||||||
| Realized and unrealized gain (loss) on investment activity |
||||||||||||
| Net realized gain (loss) on |
||||||||||||
| Futures contracts |
440,391,389 | 69,793,028 | 76,925,998 | |||||||||
| Short-term U.S. government and agency obligations |
(11,670 | ) | 35,629 | 19,363 | ||||||||
|
|
|
|
|
|
|
|||||||
| Net realized gain (loss) |
440,379,719 | 69,828,657 | 76,945,361 | |||||||||
|
|
|
|
|
|
|
|||||||
| Change in net unrealized appreciation/depreciation on |
||||||||||||
| Futures contracts |
(21,056,026 | ) | 27,098,564 | (24,469,104 | ) | |||||||
| Short-term U.S. government and agency obligations |
(6,824 | ) | 8,936 | (1,764 | ) | |||||||
|
|
|
|
|
|
|
|||||||
| Change in net unrealized appreciation/depreciation |
(21,062,850 | ) | 27,107,500 | (24,470,868 | ) | |||||||
|
|
|
|
|
|
|
|||||||
| Net realized and unrealized gain (loss) |
419,316,869 | 96,936,157 | 52,474,493 | |||||||||
|
|
|
|
|
|
|
|||||||
| Net income (loss) |
$ | 413,920,019 | $ | 91,137,957 | $ | 48,189,024 | ||||||
|
|
|
|
|
|
|
|||||||
See accompanying notes to financial statements.
B-103
Table of Contents
PROSHARES SHORT VIX SHORT-TERM FUTURES ETF
STATEMENTS OF CHANGES IN SHAREHOLDERS’ EQUITY
FOR THE YEARS ENDED DECEMBER 31, 2016, 2015 AND 2014
| Year ended December 31, 2016 |
Year ended December 31, 2015 |
Year ended December 31, 2014 |
||||||||||
| Shareholders’ equity, beginning of period |
$ | 642,811,361 | $ | 506,556,124 | $ | 141,751,202 | ||||||
| Addition of 52,950,000, 24,100,000 and 16,100,000 shares, respectively |
2,867,628,691 | 1,403,231,166 | 1,056,547,830 | |||||||||
| Redemption of 63,100,040, 19,700,000 and 9,950,000 shares, respectively |
(3,696,284,684 | ) | (1,358,113,886 | ) | (739,931,932 | ) | ||||||
|
|
|
|
|
|
|
|||||||
| Net addition (redemption) of (10,150,040), 4,400,000 and 6,150,000 shares, respectively |
(828,655,993 | ) | 45,117,280 | 316,615,898 | ||||||||
|
|
|
|
|
|
|
|||||||
| Net investment income (loss) |
(5,396,850 | ) | (5,798,200 | ) | (4,285,469 | ) | ||||||
| Net realized gain (loss) |
440,379,719 | 69,828,657 | 76,945,361 | |||||||||
| Change in net unrealized appreciation/depreciation |
(21,062,850 | ) | 27,107,500 | (24,470,868 | ) | |||||||
|
|
|
|
|
|
|
|||||||
| Net income (loss) |
413,920,019 | 91,137,957 | 48,189,024 | |||||||||
|
|
|
|
|
|
|
|||||||
| Shareholders’ equity, end of period |
$ | 228,075,387 | $ | 642,811,361 | $ | 506,556,124 | ||||||
|
|
|
|
|
|
|
|||||||
See accompanying notes to financial statements.
B-104
Table of Contents
PROSHARES SHORT VIX SHORT-TERM FUTURES ETF
STATEMENTS OF CASH FLOWS
FOR THE YEARS ENDED DECEMBER 31, 2016, 2015 AND 2014
| Year ended December 31, 2016 |
Year ended December 31, 2015 |
Year ended December 31, 2014 |
||||||||||
| Cash flow from operating activities |
||||||||||||
| Net income (loss) |
$ | 413,920,019 | $ | 91,137,957 | $ | 48,189,024 | ||||||
| Adjustments to reconcile net income (loss) to net cash provided by (used in) operating activities: |
||||||||||||
| Decrease (Increase) in segregated cash balances with brokers for futures contracts |
68,204,421 | (38,283,455 | ) | (51,692,300 | ) | |||||||
| Purchases of short-term U.S. government and agency obligations |
(2,915,165,614 | ) | (2,104,319,382 | ) | (1,647,460,143 | ) | ||||||
| Proceeds from sales or maturities of short-term U.S government and agency obligations |
3,281,269,459 | 2,016,127,119 | 1,306,143,088 | |||||||||
| Net amortization and accretion on short-term U.S government and agency obligations |
(1,126,057 | ) | (180,670 | ) | (81,544 | ) | ||||||
| Net realized gain (loss) on investments |
11,670 | (35,629 | ) | (19,363 | ) | |||||||
| Change in unrealized appreciation/depreciation on investments |
6,824 | (8,936 | ) | 1,764 | ||||||||
| Decrease (Increase) in receivable on futures contracts |
(1,059,418 | ) | — | 603,833 | ||||||||
| Increase (Decrease) in payable to Sponsor |
(277,306 | ) | 100,052 | 289,792 | ||||||||
| Increase (Decrease) in payable on futures contracts |
(1,095,271 | ) | (29,599,748 | ) | 31,020,019 | |||||||
|
|
|
|
|
|
|
|||||||
| Net cash provided by (used in) operating activities |
844,688,727 | (65,062,692 | ) | (313,005,830 | ) | |||||||
|
|
|
|
|
|
|
|||||||
| Cash flow from financing activities |
||||||||||||
| Proceeds from addition of shares |
2,877,792,848 | 1,393,067,009 | 1,056,547,830 | |||||||||
| Payment on shares redeemed |
(3,725,781,791 | ) | (1,331,975,560 | ) | (736,573,151 | ) | ||||||
|
|
|
|
|
|
|
|||||||
| Net cash provided by (used in) financing activities |
(847,988,943 | ) | 61,091,449 | 319,974,679 | ||||||||
|
|
|
|
|
|
|
|||||||
| Net increase (decrease) in cash |
(3,300,216 | ) | (3,971,243 | ) | 6,968,849 | |||||||
| Cash, beginning of period |
5,150,976 | 9,122,219 | 2,153,370 | |||||||||
|
|
|
|
|
|
|
|||||||
| Cash, end of period |
$ | 1,850,760 | $ | 5,150,976 | $ | 9,122,219 | ||||||
|
|
|
|
|
|
|
|||||||
See accompanying notes to financial statements.
B-105
Table of Contents
PROSHARES ULTRA VIX SHORT-TERM FUTURES ETF
STATEMENTS OF FINANCIAL CONDITION
| December 31, 2016 | December 31, 2015 | |||||||
| Assets |
||||||||
| Cash |
$ | 10,969,955 | $ | 9,081,964 | ||||
| Segregated cash balances with brokers for futures contracts |
71,363,625 | 62,348,600 | ||||||
| Short-term U.S. government and agency obligations (Note 3) |
434,671,795 | 438,357,849 | ||||||
| Receivable from capital shares sold |
– | 32,987,472 | ||||||
| Receivable on open futures contracts |
35,967,191 | 17,995,478 | ||||||
|
|
|
|
|
|||||
| Total assets |
552,972,566 | 560,771,363 | ||||||
|
|
|
|
|
|||||
| Liabilities and shareholders’ equity |
||||||||
| Liabilities |
||||||||
| Payable for capital shares redeemed |
36,789,539 | 12,635,235 | ||||||
| Payable to Sponsor |
424,273 | 427,388 | ||||||
|
|
|
|
|
|||||
| Total liabilities |
37,213,812 | 13,062,623 | ||||||
|
|
|
|
|
|||||
| Commitments and Contingencies (Note 2) |
||||||||
| Shareholders’ equity |
||||||||
| Shareholders’ equity |
515,758,754 | 547,708,740 | ||||||
|
|
|
|
|
|||||
| Total liabilities and shareholders’ equity |
$ | 552,972,566 | $ | 560,771,363 | ||||
|
|
|
|
|
|||||
| Shares outstanding (Note 1) (Note 9) |
11,861,530 | 780,098 | ||||||
|
|
|
|
|
|||||
| Net asset value per share (Note 1) (Note 9) |
$ | 43.48 | $ | 702.10 | ||||
|
|
|
|
|
|||||
| Market value per share (Note 1) (Note 2) (Note 9) |
$ | 43.75 | $ | 708.75 | ||||
|
|
|
|
|
|||||
See accompanying notes to financial statements.
B-106
Table of Contents
PROSHARES ULTRA VIX SHORT-TERM FUTURES ETF
SCHEDULE OF INVESTMENTS
DECEMBER 31, 2016
| Principal Amount | Value | |||||||
| Short-term U.S. government and agency obligations |
||||||||
| (84% of shareholders’ equity) |
||||||||
| U.S. Treasury Bills^^: |
||||||||
| 0.294% due 01/05/17 |
$ | 20,161,000 | $ | 20,160,569 | ||||
| 0.307% due 01/12/17 |
68,063,000 | 68,056,282 | ||||||
| 0.336% due 01/19/17† |
62,500,000 | 62,488,475 | ||||||
| 0.319% due 01/26/17† |
66,000,000 | 65,982,504 | ||||||
| 0.342% due 02/02/17† |
60,092,000 | 60,071,220 | ||||||
| 0.442% due 02/09/17† |
14,000,000 | 13,993,669 | ||||||
| 0.435% due 02/16/17† |
133,000,000 | 132,927,661 | ||||||
| 0.491% due 02/23/17† |
8,000,000 | 7,994,674 | ||||||
| 0.493% due 03/23/17 |
3,000,000 | 2,996,741 | ||||||
|
|
|
|||||||
| Total short-term U.S. government and agency obligations (cost $434,676,067) |
$ | 434,671,795 | ||||||
|
|
|
|||||||
Futures Contracts Purchased††
| Number of Contracts |
Notional Amount at Value |
Unrealized Appreciation (Depreciation) |
||||||||||
| VIX Futures - CBOE, expires January 2017 |
38,688 | $ | 585,156,000 | $ | (21,567,112 | ) | ||||||
| VIX Futures - CBOE, expires February 2017 |
27,012 | 447,723,900 | 13,594,875 | |||||||||
|
|
|
|||||||||||
| $ | (7,972,237 | ) | ||||||||||
|
|
|
|||||||||||
| ^^ | Rates shown represents discount rate at the time of purchase. |
| † | All or partial amount pledged as collateral for futures contracts. |
| †† | Cash collateral in the amount of $71,363,625 was pledged to cover margin requirements for open futures contracts as of |
December 31, 2016.
See accompanying notes to financial statements.
B-107
Table of Contents
PROSHARES ULTRA VIX SHORT-TERM FUTURES ETF
SCHEDULE OF INVESTMENTS
DECEMBER 31, 2015
| Principal Amount | Value | |||||||
| Short-term U.S. government and agency obligations |
||||||||
| (80% of shareholders’ equity) |
||||||||
| U.S. Treasury Bills^^: |
||||||||
| 0.000% due 01/07/16 |
$ | 1,000,000 | $ | 999,997 | ||||
| 0.000% due 01/14/16 |
9,071,000 | 9,070,773 | ||||||
| 0.000% due 01/21/16 |
1,327,000 | 1,326,944 | ||||||
| 0.055% due 01/28/16 |
3,000,000 | 2,999,740 | ||||||
| 0.130% due 02/04/16 |
2,385,000 | 2,384,825 | ||||||
| 0.150% due 02/11/16 |
15,718,000 | 15,715,927 | ||||||
| 0.129% due 02/18/16 |
8,386,000 | 8,384,795 | ||||||
| 0.125% due 02/25/16 |
62,257,000 | 62,250,257 | ||||||
| 0.181% due 03/03/16 |
71,491,000 | 71,479,869 | ||||||
| 0.066% due 03/10/16† |
62,525,000 | 62,511,820 | ||||||
| 0.207% due 03/17/16† |
94,427,000 | 94,408,813 | ||||||
| 0.101% due 03/24/16† |
29,399,000 | 29,387,240 | ||||||
| 0.366% due 05/26/16† |
77,557,000 | 77,436,849 | ||||||
|
|
|
|||||||
| Total short-term U.S. government and agency obligations (cost $438,333,277) |
$ | 438,357,849 | ||||||
|
|
|
|||||||
Futures Contracts Purchased††
| Number of Contracts |
Notional Amount at Value |
Unrealized Appreciation (Depreciation) |
||||||||||
| VIX Futures - CBOE, expires January 2016 |
29,321 | $ | 543,171,525 | $ | 10,546,019 | |||||||
| VIX Futures - CBOE, expires February 2016 |
29,320 | 553,415,000 | 1,348,447 | |||||||||
|
|
|
|||||||||||
| $ | 11,894,466 | |||||||||||
|
|
|
|||||||||||
| ^^ | Rates shown represents discount rate at the time of purchase. |
| † | All or partial amount pledged as collateral for futures contracts. |
| †† | Cash collateral in the amount of $62,348,600 was pledged to cover margin requirements for open futures contracts as of December 31, 2015. |
See accompanying notes to financial statements.
B-108
Table of Contents
PROSHARES ULTRA VIX SHORT-TERM FUTURES ETF
STATEMENTS OF OPERATIONS
FOR THE YEARS ENDED DECEMBER 31, 2016, 2015 AND 2014
| Year ended December 31, 2016 |
Year ended December 31, 2015 |
Year ended December 31, 2014 |
||||||||||
| Investment Income |
||||||||||||
| Interest |
$ | 1,639,964 | $ | 156,187 | $ | 72,700 | ||||||
|
|
|
|
|
|
|
|||||||
| Expenses |
||||||||||||
| Management fee |
6,417,822 | 4,362,460 | 2,868,337 | |||||||||
| Brokerage commissions and fees |
4,158,919 | 3,203,875 | 2,563,849 | |||||||||
|
|
|
|
|
|
|
|||||||
| Total expenses |
10,576,741 | 7,566,335 | 5,432,186 | |||||||||
|
|
|
|
|
|
|
|||||||
| Net investment income (loss) |
(8,936,777 | ) | (7,410,148 | ) | (5,359,486 | ) | ||||||
|
|
|
|
|
|
|
|||||||
| Realized and unrealized gain (loss) on investment activity |
||||||||||||
| Net realized gain (loss) on |
||||||||||||
| Futures contracts |
(1,567,340,688 | ) | (392,174,228 | ) | (139,412,525 | ) | ||||||
| Short-term U.S. government and agency obligations |
15,949 | (49,718 | ) | 9,921 | ||||||||
|
|
|
|
|
|
|
|||||||
| Net realized gain (loss) |
(1,567,324,739 | ) | (392,223,946 | ) | (139,402,604 | ) | ||||||
|
|
|
|
|
|
|
|||||||
| Change in net unrealized appreciation/depreciation on |
||||||||||||
| Futures contracts |
(19,866,703 | ) | (27,690,787 | ) | 63,595,164 | |||||||
| Short-term U.S. government and agency obligations |
(28,844 | ) | 26,647 | (4,701 | ) | |||||||
|
|
|
|
|
|
|
|||||||
| Change in net unrealized appreciation/depreciation |
(19,895,547 | ) | (27,664,140 | ) | 63,590,463 | |||||||
|
|
|
|
|
|
|
|||||||
| Net realized and unrealized gain (loss) |
(1,587,220,286 | ) | (419,888,086 | ) | (75,812,141 | ) | ||||||
|
|
|
|
|
|
|
|||||||
| Net income (loss) |
$ | (1,596,157,063 | ) | $ | (427,298,234 | ) | $ | (81,171,627 | ) | |||
|
|
|
|
|
|
|
|||||||
See accompanying notes to financial statements.
B-109
Table of Contents
PROSHARES ULTRA VIX SHORT-TERM FUTURES ETF
STATEMENTS OF CHANGES IN SHAREHOLDERS’ EQUITY
FOR THE YEARS ENDED DECEMBER 31, 2016, 2015 AND 2014
| Year ended December 31, 2016 |
Year ended December 31, 2015 |
Year ended December 31, 2014 |
||||||||||
| Shareholders’ equity, beginning of period |
$ | 547,708,740 | $ | 351,789,953 | $ | 226,233,584 | ||||||
| Addition of 28,958,000, 2,887,200 and 408,600 shares, respectively (Note 1) (Note 9) |
4,540,375,465 | 3,192,766,319 | 1,646,851,705 | |||||||||
| Redemption of 17,876,568, 2,219,263 and 323,418 shares, respectively (Note 1) (Note 9) |
(2,976,168,388 | ) | (2,569,549,298 | ) | (1,440,123,709 | ) | ||||||
|
|
|
|
|
|
|
|||||||
| Net addition (redemption) of 11,081,432, 667,937 and 85,182 shares, respectively (Note 1) (Note 9) |
1,564,207,077 | 623,217,021 | 206,727,996 | |||||||||
|
|
|
|
|
|
|
|||||||
| Net investment income (loss) |
(8,936,777 | ) | (7,410,148 | ) | (5,359,486 | ) | ||||||
| Net realized gain (loss) |
(1,567,324,739 | ) | (392,223,946 | ) | (139,402,604 | ) | ||||||
| Change in net unrealized appreciation/depreciation |
(19,895,547 | ) | (27,664,140 | ) | 63,590,463 | |||||||
|
|
|
|
|
|
|
|||||||
| Net income (loss) |
(1,596,157,063 | ) | (427,298,234 | ) | (81,171,627 | ) | ||||||
|
|
|
|
|
|
|
|||||||
| Shareholders’ equity, end of period |
$ | 515,758,754 | $ | 547,708,740 | $ | 351,789,953 | ||||||
|
|
|
|
|
|
|
|||||||
See accompanying notes to financial statements.
B-110
Table of Contents
PROSHARES ULTRA VIX SHORT-TERM FUTURES ETF
STATEMENTS OF CASH FLOWS
FOR THE YEARS ENDED DECEMBER 31, 2016, 2015 AND 2014
| Year ended December 31, 2016 |
Year ended December 31, 2015 |
Year ended December 31, 2014 |
||||||||||
| Cash flow from operating activities |
||||||||||||
| Net income (loss) |
$ | (1,596,157,063 | ) | $ | (427,298,234 | ) | $ | (81,171,627 | ) | |||
| Adjustments to reconcile net income (loss) to net cash provided by (used in) operating activities: |
||||||||||||
| Decrease (Increase) in segregated cash balances with brokers for futures contracts |
(9,015,025 | ) | 54,559,100 | (9,805,950 | ) | |||||||
| Purchases of short-term U.S. government and agency obligations |
(4,242,730,514 | ) | (3,411,109,730 | ) | (2,489,268,812 | ) | ||||||
| Proceeds from sales or maturities of short-term U.S government and agency obligations |
4,248,037,733 | 3,155,524,185 | 2,416,241,031 | |||||||||
| Net amortization and accretion on short-term U.S government and agency obligations |
(1,634,060 | ) | (156,187 | ) | (72,700 | ) | ||||||
| Net realized gain (loss) on investments |
(15,949 | ) | 49,718 | (9,921 | ) | |||||||
| Change in unrealized appreciation/depreciation on investments |
28,844 | (26,647 | ) | 4,701 | ||||||||
| Decrease (Increase) in receivable on futures contracts |
(17,971,713 | ) | 24,535,963 | (42,531,441 | ) | |||||||
| Increase (Decrease) in payable to Sponsor |
(3,115 | ) | 124,528 | 113,369 | ||||||||
| Increase (Decrease) in payable on futures contracts |
— | — | (3,356,803 | ) | ||||||||
|
|
|
|
|
|
|
|||||||
| Net cash provided by (used in) operating activities |
(1,619,460,862 | ) | (603,797,304 | ) | (209,858,153 | ) | ||||||
|
|
|
|
|
|
|
|||||||
| Cash flow from financing activities |
||||||||||||
| Proceeds from addition of shares |
4,573,362,937 | 3,172,328,095 | 1,645,206,121 | |||||||||
| Payment on shares redeemed |
(2,952,014,084 | ) | (2,563,186,119 | ) | (1,433,851,653 | ) | ||||||
|
|
|
|
|
|
|
|||||||
| Net cash provided by (used in) financing activities |
1,621,348,853 | 609,141,976 | 211,354,468 | |||||||||
|
|
|
|
|
|
|
|||||||
| Net increase (decrease) in cash |
1,887,991 | 5,344,672 | 1,496,315 | |||||||||
| Cash, beginning of period |
9,081,964 | 3,737,292 | 2,240,977 | |||||||||
|
|
|
|
|
|
|
|||||||
| Cash, end of period |
$ | 10,969,955 | $ | 9,081,964 | $ | 3,737,292 | ||||||
|
|
|
|
|
|
|
|||||||
See accompanying notes to financial statements.
B-111
Table of Contents
PROSHARES ULTRASHORT BLOOMBERG CRUDE OIL
STATEMENTS OF FINANCIAL CONDITION
| December 31, 2016 | December 31, 2015 | |||||||
| Assets |
||||||||
| Cash |
$ | 2,715,772 | $ | 598,645 | ||||
| Segregated cash balances with brokers for futures contracts |
4,931,520 | 10,154,430 | ||||||
| Short-term U.S. government and agency obligations (Note 3) (cost $205,694,828 and $79,694,797, respectively) |
205,694,385 | 79,692,642 | ||||||
| Unrealized appreciation on swap agreements |
— | 6,412,656 | ||||||
|
|
|
|
|
|||||
| Total assets |
213,341,677 | 96,858,373 | ||||||
|
|
|
|
|
|||||
| Liabilities and shareholders’ equity |
||||||||
| Liabilities |
||||||||
| Payable on open futures contracts |
13,602 | 850,883 | ||||||
| Brokerage commissions and fees payable |
— | 8,453 | ||||||
| Payable to Sponsor |
162,891 | 101,143 | ||||||
| Unrealized depreciation on swap agreements |
12,206,881 | — | ||||||
|
|
|
|
|
|||||
| Total liabilities |
12,383,374 | 960,479 | ||||||
|
|
|
|
|
|||||
| Commitments and Contingencies (Note 2) |
||||||||
| Shareholders’ equity |
||||||||
| Shareholders’ equity |
200,958,303 | 95,897,894 | ||||||
|
|
|
|
|
|||||
| Total liabilities and shareholders’ equity |
$ | 213,341,677 | $ | 96,858,373 | ||||
|
|
|
|
|
|||||
| Shares outstanding (Note 9) |
6,339,884 | 1,439,888 | ||||||
|
|
|
|
|
|||||
| Net asset value per share (Note 9) |
$ | 31.70 | $ | 66.60 | ||||
|
|
|
|
|
|||||
| Market value per share (Note 2) (Note 9) |
$ | 31.65 | $ | 66.82 | ||||
|
|
|
|
|
|||||
See accompanying notes to financial statements.
B-112
Table of Contents
PROSHARES ULTRASHORT BLOOMBERG CRUDE OIL
SCHEDULE OF INVESTMENTS
DECEMBER 31, 2016
| Principal Amount | Value | |||||||
| Short-term U.S. government and agency obligations |
|
|||||||
| (102% of shareholders’ equity) |
|
|||||||
| U.S. Treasury Bills^^: |
||||||||
| 0.281% due 01/05/17† |
$ | 14,476,000 | $ | 14,475,690 | ||||
| 0.353% due 01/12/17† |
56,495,000 | 56,489,424 | ||||||
| 0.344% due 01/19/17† |
38,000,000 | 37,992,993 | ||||||
| 0.395% due 01/26/17† |
13,300,000 | 13,296,474 | ||||||
| 0.406% due 02/02/17 |
5,500,000 | 5,498,098 | ||||||
| 0.441% due 02/09/17† |
9,000,000 | 8,995,930 | ||||||
| 0.390% due 02/16/17 |
11,000,000 | 10,994,017 | ||||||
| 0.458% due 03/02/17† |
50,000,000 | 49,960,930 | ||||||
| 0.493% due 03/23/17† |
3,000,000 | 2,996,741 | ||||||
| 0.516% due 03/30/17† |
5,000,000 | 4,994,088 | ||||||
|
|
|
|||||||
| Total short-term U.S. government and agency obligations (cost $205,694,828) |
$ | 205,694,385 | ||||||
|
|
|
|||||||
Futures Contracts Sold††
| Number of Contracts |
Notional Amount at Value |
Unrealized Appreciation (Depreciation) |
||||||||||
| WTI Crude Oil - NYMEX, expires March 2017 |
1,401 | $ | 76,578,660 | $ | (1,426,815 | ) | ||||||
Swap Agreements^
| Rate Paid (Received)* |
Termination Date |
Notional Amount at Value** |
Unrealized Appreciation (Depreciation) |
|||||||||||||
| Swap agreement with Citibank N.A. based on Bloomberg WTI Crude Oil Subindex |
0.18 | % | 01/10/17 | $ | (116,603,958 | ) | $ | (4,742,191 | ) | |||||||
| Swap agreement with Goldman Sachs International based on Bloomberg WTI Crude Oil Subindex |
0.25 | 01/10/17 | (87,898,388 | ) | (3,061,395 | ) | ||||||||||
| Swap agreement with Societe Generale S.A. based on Bloomberg WTI Crude Oil Subindex |
0.25 | 01/10/17 | (31,195,025 | ) | (1,050,699 | ) | ||||||||||
| Swap agreement with UBS AG based on Bloomberg WTI Crude Oil Subindex |
0.25 | 01/10/17 | (89,698,517 | ) | (3,352,596 | ) | ||||||||||
|
|
|
|||||||||||||||
| $ | (12,206,881 | ) | ||||||||||||||
|
|
|
|||||||||||||||
| † | All or partial amount pledged as collateral for swap agreements and/or futures contracts. |
| †† | Cash collateral in the amount of $4,931,520 was pledged to cover margin requirements for open futures contracts as of December 31, 2016. |
| ^ | The positions and counterparties herein are as of December 31, 2016. The Funds continually evaluate different counterparties for their transactions and counterparties are subject to change. New counterparties can be added at anytime. |
| ^^ | Rates shown represents discount rate at the time of purchase. |
| * | Reflects the floating financing rate, as of December 31, 2016, on the notional amount of the swap agreement paid to the counterparty or received from the counterparty, excluding any commissions. |
| ** | For swap agreements, a positive amount represents “long” exposure to the benchmark index. A negative amount represents “short” exposure to the benchmark index. |
See accompanying notes to financial statements.
B-113
Table of Contents
PROSHARES ULTRASHORT BLOOMBERG CRUDE OIL
SCHEDULE OF INVESTMENTS
DECEMBER 31, 2015
| Principal Amount | Value | |||||||
| Short-term U.S. government and agency obligations |
|
|||||||
| (83% of shareholders’ equity) |
|
|||||||
| U.S. Treasury Bills^^: |
||||||||
| 0.080% due 01/07/16 |
$ | 3,329,000 | $ | 3,328,989 | ||||
| 0.020% due 01/21/16 |
21,612,000 | 21,611,082 | ||||||
| 0.026% due 02/04/16 |
5,980,000 | 5,979,562 | ||||||
| 0.180% due 02/18/16† |
5,106,000 | 5,105,266 | ||||||
| 0.000% due 02/25/16† |
14,974,000 | 14,972,378 | ||||||
| 0.200% due 03/10/16 |
2,835,000 | 2,834,403 | ||||||
| 0.172% due 03/17/16† |
2,372,000 | 2,371,543 | ||||||
| 0.176% due 03/24/16† |
14,653,000 | 14,647,139 | ||||||
| 0.353% due 05/26/16† |
8,856,000 | 8,842,280 | ||||||
|
|
|
|||||||
| Total short-term U.S. government and agency obligations (cost $79,694,797) |
$ | 79,692,642 | ||||||
|
|
|
|||||||
Futures Contracts Sold††
| Number of Contracts |
Notional Amount at Value |
Unrealized Appreciation (Depreciation) |
||||||||||
| Crude Oil - NYMEX, expires March 2016 |
2,367 | $ | 90,348,390 | $ | 2,464,513 | |||||||
Swap Agreements^
| Rate Paid (Received)* |
Termination Date | Notional Amount at Value** |
Unrealized Appreciation (Depreciation) |
|||||||||||||
| Swap agreement with Citibank N.A. based on Bloomberg WTI Crude Oil Subindex |
0.18 | % | 01/06/16 | $ | (19,234,533 | ) | $ | 1,098,278 | ||||||||
| Swap agreement with Deutsche Bank AG based on Bloomberg WTI Crude Oil Subindex |
0.25 | 01/06/16 | (29,881,854 | ) | 1,722,894 | |||||||||||
| Swap agreement with Goldman Sachs International based on Bloomberg WTI Crude Oil Subindex |
0.25 | 01/06/16 | (17,799,590 | ) | 1,595,552 | |||||||||||
| Swap agreement with Societe Generale S.A. based on Bloomberg WTI Crude Oil Subindex |
0.25 | 01/06/16 | (8,303,436 | ) | 521,142 | |||||||||||
| Swap agreement with UBS AG based on Bloomberg WTI Crude Oil Subindex |
0.25 | 01/06/16 | (26,258,293 | ) | 1,474,790 | |||||||||||
|
|
|
|||||||||||||||
| $ | 6,412,656 | |||||||||||||||
|
|
|
|||||||||||||||
| † | All or partial amount pledged as collateral for swap agreements and/or futures contracts. |
| †† | Cash collateral in the amount of $10,154,430 was pledged to cover margin requirements for open futures contracts as of December 31, 2015. |
| ^ | The positions and counterparties herein are as of December 31, 2015. The Funds continually evaluate different counterparties for their transactions and counterparties are subject to change. New counterparties can be added at anytime. |
| ^^ | Rates shown represents discount rate at the time of purchase. |
| * | Reflects the floating financing rate, as of December 31, 2015, on the notional amount of the swap agreement paid to the counterparty or received from the counterparty, excluding any commissions. |
| ** | For swap agreements, a positive amount represents “long” exposure to the benchmark index. A negative amount represents “short” exposure to the benchmark index. |
See accompanying notes to financial statements.
B-114
Table of Contents
PROSHARES ULTRASHORT BLOOMBERG CRUDE OIL
STATEMENTS OF OPERATIONS
FOR THE YEARS ENDED DECEMBER 31, 2016, 2015 AND 2014
| Year ended December 31, 2016 |
Year ended December 31, 2015 |
Year ended December 31, 2014 |
||||||||||
| Investment Income |
||||||||||||
| Interest |
$ | 500,160 | $ | 60,884 | $ | 110,620 | ||||||
|
|
|
|
|
|
|
|||||||
| Expenses |
||||||||||||
| Management fee |
1,755,696 | 1,978,613 | 2,448,428 | |||||||||
| Brokerage commissions and fees |
153,428 | 248,482 | 78,033 | |||||||||
|
|
|
|
|
|
|
|||||||
| Total expenses |
1,909,124 | 2,227,095 | 2,526,461 | |||||||||
|
|
|
|
|
|
|
|||||||
| Net investment income (loss) |
(1,408,964 | ) | (2,166,211 | ) | (2,415,841 | ) | ||||||
|
|
|
|
|
|
|
|||||||
| Realized and unrealized gain (loss) on investment activity |
||||||||||||
| Net realized gain (loss) on |
||||||||||||
| Futures contracts |
(12,045,454 | ) | 46,904,474 | 44,472,509 | ||||||||
| Swap agreements |
(55,706,710 | ) | 44,765,850 | 54,854,588 | ||||||||
| Short-term U.S. government and agency obligations |
(4,064 | ) | 14,458 | 20,701 | ||||||||
|
|
|
|
|
|
|
|||||||
| Net realized gain (loss) |
(67,756,228 | ) | 91,684,782 | 99,347,798 | ||||||||
|
|
|
|
|
|
|
|||||||
| Change in net unrealized appreciation/depreciation on |
||||||||||||
| Futures contracts |
(3,891,328 | ) | (13,342,090 | ) | 17,039,376 | |||||||
| Swap agreements |
(18,619,537 | ) | (20,605,421 | ) | 29,350,977 | |||||||
| Short-term U.S. government and agency obligations |
1,712 | (4,396 | ) | (8,704 | ) | |||||||
|
|
|
|
|
|
|
|||||||
| Change in net unrealized appreciation/depreciation |
(22,509,153 | ) | (33,951,907 | ) | 46,381,649 | |||||||
|
|
|
|
|
|
|
|||||||
| Net realized and unrealized gain (loss) |
(90,265,381 | ) | 57,732,875 | 145,729,447 | ||||||||
|
|
|
|
|
|
|
|||||||
| Net income (loss) |
$ | (91,674,345 | ) | $ | 55,566,664 | $ | 143,313,606 | |||||
|
|
|
|
|
|
|
|||||||
See accompanying notes to financial statements.
B-115
Table of Contents
PROSHARES ULTRASHORT BLOOMBERG CRUDE OIL
STATEMENTS OF CHANGES IN SHAREHOLDERS’ EQUITY
FOR THE YEARS ENDED DECEMBER 31, 2016, 2015 AND 2014
| Year ended December 31, 2016 |
Year ended December 31, 2015 |
Year ended December 31, 2014 |
||||||||||
| Shareholders’ equity, beginning of period |
$ | 95,897,894 | $ | 169,210,110 | $ | 256,060,149 | ||||||
| Addition of 18,500,000, 21,600,000 and 31,400,000 shares, respectively (Note 9) |
1,002,034,810 | 796,070,368 | 474,919,955 | |||||||||
| Redemption of 13,600,004, 24,500,000 and 43,200,000 shares, respectively (Note 9) |
(805,300,056 | ) | (924,949,248 | ) | (705,083,600 | ) | ||||||
|
|
|
|
|
|
|
|||||||
| Net addition (redemption) of 4,899,996, (2,900,000) and (11,800,000) shares, respectively (Note 9) |
196,734,754 | (128,878,880 | ) | (230,163,645 | ) | |||||||
|
|
|
|
|
|
|
|||||||
| Net investment income (loss) |
(1,408,964 | ) | (2,166,211 | ) | (2,415,841 | ) | ||||||
| Net realized gain (loss) |
(67,756,228 | ) | 91,684,782 | 99,347,798 | ||||||||
| Change in net unrealized appreciation/depreciation |
(22,509,153 | ) | (33,951,907 | ) | 46,381,649 | |||||||
|
|
|
|
|
|
|
|||||||
| Net income (loss) |
(91,674,345 | ) | 55,566,664 | 143,313,606 | ||||||||
|
|
|
|
|
|
|
|||||||
| Shareholders’ equity, end of period |
$ | 200,958,303 | $ | 95,897,894 | $ | 169,210,110 | ||||||
|
|
|
|
|
|
|
|||||||
See accompanying notes to financial statements.
B-116
Table of Contents
PROSHARES ULTRASHORT BLOOMBERG CRUDE OIL
STATEMENTS OF CASH FLOWS
FOR THE YEARS ENDED DECEMBER 31, 2016, 2015 AND 2014
| Year ended December 31, 2016 |
Year ended December 31, 2015 |
Year ended December 31, 2014 |
||||||||||
| Cash flow from operating activities |
||||||||||||
| Net income (loss) |
$ | (91,674,345 | ) | $ | 55,566,664 | $ | 143,313,606 | |||||
| Adjustments to reconcile net income (loss) to net cash provided by (used in) operating activities: |
||||||||||||
| Decrease (Increase) in segregated cash balances with brokers for futures contracts |
5,222,910 | 2,138,235 | (4,659,270 | ) | ||||||||
| Purchases of short-term U.S. government and agency obligations |
(1,099,847,442 | ) | (1,238,357,695 | ) | (1,127,199,240 | ) | ||||||
| Proceeds from sales or maturities of short-term U.S government and agency obligations |
974,343,507 | 1,290,330,607 | 1,243,311,872 | |||||||||
| Net amortization and accretion on short-term U.S government and agency obligations |
(500,160 | ) | (60,884 | ) | (110,620 | ) | ||||||
| Net realized gain (loss) on investments |
4,064 | (14,458 | ) | (20,701 | ) | |||||||
| Change in unrealized appreciation/depreciation on investments |
18,617,825 | 20,609,817 | (29,342,273 | ) | ||||||||
| Decrease (Increase) in receivable on futures contracts |
— | 1,293,531 | 210,412 | |||||||||
| Increase (Decrease) in payable to Sponsor |
61,748 | (27,242 | ) | (73,442 | ) | |||||||
| Increase (Decrease) in brokerage commissions and fees payable |
(8,453 | ) | 8,453 | — | ||||||||
| Increase (Decrease) in payable on futures contracts |
(837,281 | ) | 850,883 | — | ||||||||
|
|
|
|
|
|
|
|||||||
| Net cash provided by (used in) operating activities |
(194,617,627 | ) | 132,337,911 | 225,430,344 | ||||||||
|
|
|
|
|
|
|
|||||||
| Cash flow from financing activities |
||||||||||||
| Proceeds from addition of shares |
1,002,034,810 | 796,070,368 | 474,919,955 | |||||||||
| Payment on shares redeemed |
(805,300,056 | ) | (928,803,902 | ) | (701,228,946 | ) | ||||||
|
|
|
|
|
|
|
|||||||
| Net cash provided by (used in) financing activities |
196,734,754 | (132,733,534 | ) | (226,308,991 | ) | |||||||
|
|
|
|
|
|
|
|||||||
| Net increase (decrease) in cash |
2,117,127 | (395,623 | ) | (878,647 | ) | |||||||
| Cash, beginning of period |
598,645 | 994,268 | 1,872,915 | |||||||||
|
|
|
|
|
|
|
|||||||
| Cash, end of period |
$ | 2,715,772 | $ | 598,645 | $ | 994,268 | ||||||
|
|
|
|
|
|
|
|||||||
See accompanying notes to financial statements.
B-117
Table of Contents
PROSHARES ULTRASHORT BLOOMBERG NATURAL GAS
STATEMENTS OF FINANCIAL CONDITION
| December 31, 2016 | December 31, 2015 | |||||||
| Assets |
||||||||
| Cash |
$ | 326,631 | $ | 1,099,140 | ||||
| Segregated cash balances with brokers for futures contracts |
710,655 | 2,046,660 | ||||||
| Short-term U.S. government and agency obligations (Note 3) (cost $2,899,188 and $8,114,653, respectively) |
2,899,151 | 8,115,004 | ||||||
| Receivable on open futures contracts |
105,872 | — | ||||||
|
|
|
|
|
|||||
| Total assets |
4,042,309 | 11,260,804 | ||||||
|
|
|
|
|
|||||
| Liabilities and shareholders’ equity |
||||||||
| Liabilities |
||||||||
| Payable on open futures contracts |
— | 785,170 | ||||||
| Brokerage commissions and fees payable |
144 | 1,908 | ||||||
| Payable to Sponsor |
3,371 | 10,870 | ||||||
|
|
|
|
|
|||||
| Total liabilities |
3,515 | 797,948 | ||||||
|
|
|
|
|
|||||
| Commitments and Contingencies (Note 2) |
||||||||
| Shareholders’ equity |
||||||||
| Shareholders’ equity |
4,038,794 | 10,462,856 | ||||||
|
|
|
|
|
|||||
| Total liabilities and shareholders’ equity |
$ | 4,042,309 | $ | 11,260,804 | ||||
|
|
|
|
|
|||||
| Shares outstanding (Note 1) |
174,832 | 224,856 | ||||||
|
|
|
|
|
|||||
| Net asset value per share (Note 1) |
$ | 23.10 | $ | 46.53 | ||||
|
|
|
|
|
|||||
| Market value per share (Note 1) (Note 2) |
$ | 23.05 | $ | 46.55 | ||||
|
|
|
|
|
|||||
See accompanying notes to financial statements.
B-118
Table of Contents
PROSHARES ULTRASHORT BLOOMBERG NATURAL GAS
SCHEDULE OF INVESTMENTS
DECEMBER 31, 2016
| Principal Amount | Value | |||||||
| Short-term U.S. government and agency obligations |
|
|||||||
| (72% of shareholders’ equity) |
|
|||||||
| U.S. Treasury Bills^^: |
||||||||
| 0.343% due 01/26/17 |
$ | 1,900,000 | $ | 1,899,497 | ||||
| 0.406% due 02/02/17 |
1,000,000 | 999,654 | ||||||
|
|
|
|||||||
| Total short-term U.S. government and agency obligations (cost $2,899,188) |
$ | 2,899,151 | ||||||
|
|
|
|||||||
Futures Contracts Sold††
| Number of Contracts |
Notional Amount at Value |
Unrealized Appreciation (Depreciation) |
||||||||||
| Natural Gas - NYMEX, expires March 2017 |
219 | $ | 8,067,960 | $ | (482,031 | ) | ||||||
| ^^ | Rates shown represents discount rate at the time of purchase. |
| †† | Cash collateral in the amount of $710,655 was pledged to cover margin requirements for open futures contracts as of December 31, 2016. |
See accompanying notes to financial statements.
B-119
Table of Contents
PROSHARES ULTRASHORT BLOOMBERG NATURAL GAS
SCHEDULE OF INVESTMENTS
DECEMBER 31, 2015
| Principal Amount | Value | |||||||
| Short-term U.S. government and agency obligations |
|
|||||||
| (78% of shareholders’ equity) |
|
|||||||
| U.S. Treasury Bills^^: |
||||||||
| 0.233% due 03/17/16 |
$ | 814,000 | $ | 813,843 | ||||
| 0.185% due 03/24/16 |
1,294,000 | 1,293,482 | ||||||
| 0.386% due 05/26/16 |
6,017,000 | 6,007,679 | ||||||
|
|
|
|||||||
| Total short-term U.S. government and agency obligations (cost $8,114,653) |
$ | 8,115,004 | ||||||
|
|
|
|||||||
Futures Contracts Sold††
| Number of Contracts |
Notional Amount at Value |
Unrealized Appreciation (Depreciation) |
||||||||||
| Natural Gas - NYMEX, expires March 2016 |
886 | $ | 20,936,180 | $ | (2,471,164 | ) | ||||||
| ^^ | Rates shown represents discount rate at the time of purchase. |
| †† | Cash collateral in the amount of $2,046,660 was pledged to cover margin requirements for open futures contracts as of December 31, 2015. |
See accompanying notes to financial statements.
B-120
Table of Contents
PROSHARES ULTRASHORT BLOOMBERG NATURAL GAS
STATEMENTS OF OPERATIONS
FOR THE YEARS ENDED DECEMBER 31, 2016, 2015 AND 2014
| Year ended December 31, 2016 |
Year ended December 31, 2015 |
Year ended December 31, 2014 |
||||||||||
| Investment Income |
||||||||||||
| Interest |
$ | 19,053 | $ | 5,830 | $ | 16,306 | ||||||
|
|
|
|
|
|
|
|||||||
| Expenses |
||||||||||||
| Management fee |
81,259 | 112,277 | 385,014 | |||||||||
| Brokerage commissions and fees |
59,966 | 70,677 | 92,199 | |||||||||
|
|
|
|
|
|
|
|||||||
| Total expenses |
141,225 | 182,954 | 477,213 | |||||||||
|
|
|
|
|
|
|
|||||||
| Net investment income (loss) |
(122,172 | ) | (177,124 | ) | (460,907 | ) | ||||||
|
|
|
|
|
|
|
|||||||
| Realized and unrealized gain (loss) on investment activity |
||||||||||||
| Net realized gain (loss) on |
||||||||||||
| Futures contracts |
586,860 | 15,212,804 | 8,791,719 | |||||||||
| Short-term U.S. government and agency obligations |
3,139 | 29 | 5,163 | |||||||||
|
|
|
|
|
|
|
|||||||
| Net realized gain (loss) |
589,999 | 15,212,833 | 8,796,882 | |||||||||
|
|
|
|
|
|
|
|||||||
| Change in net unrealized appreciation/depreciation on |
||||||||||||
| Futures contracts |
1,989,133 | (6,412,629 | ) | 2,899,165 | ||||||||
| Short-term U.S. government and agency obligations |
(388 | ) | 168 | 72 | ||||||||
|
|
|
|
|
|
|
|||||||
| Change in net unrealized appreciation/depreciation |
1,988,745 | (6,412,461 | ) | 2,899,237 | ||||||||
|
|
|
|
|
|
|
|||||||
| Net realized and unrealized gain (loss) |
2,578,744 | 8,800,372 | 11,696,119 | |||||||||
|
|
|
|
|
|
|
|||||||
| Net income (loss) |
$ | 2,456,572 | $ | 8,623,248 | $ | 11,235,212 | ||||||
|
|
|
|
|
|
|
|||||||
See accompanying notes to financial statements.
B-121
Table of Contents
PROSHARES ULTRASHORT BLOOMBERG NATURAL GAS
STATEMENTS OF CHANGES IN SHAREHOLDERS’ EQUITY
FOR THE YEARS ENDED DECEMBER 31, 2016, 2015 AND 2014
| Year ended December 31, 2016 |
Year ended December 31, 2015 |
Year ended December 31, 2014 |
||||||||||
| Shareholders’ equity, beginning of period |
$ | 10,462,856 | $ | 14,688,564 | $ | 22,734,767 | ||||||
| Addition of 950,000, 1,350,000 and 8,550,000 shares, respectively (Note 1) |
40,020,426 | 37,204,187 | 119,491,987 | |||||||||
| Redemption of 1,000,024, 1,650,000 and 9,000,000 shares, respectively (Note 1) |
(48,901,060 | ) | (50,053,143 | ) | (138,773,402 | ) | ||||||
|
|
|
|
|
|
|
|||||||
| Net addition (redemption) of (50,024), (300,000) and (450,000) shares, respectively (Note 1) |
(8,880,634 | ) | (12,848,956 | ) | (19,281,415 | ) | ||||||
|
|
|
|
|
|
|
|||||||
| Net investment income (loss) |
(122,172 | ) | (177,124 | ) | (460,907 | ) | ||||||
| Net realized gain (loss) |
589,999 | 15,212,833 | 8,796,882 | |||||||||
| Change in net unrealized appreciation/depreciation |
1,988,745 | (6,412,461 | ) | 2,899,237 | ||||||||
|
|
|
|
|
|
|
|||||||
| Net income (loss) |
2,456,572 | 8,623,248 | 11,235,212 | |||||||||
|
|
|
|
|
|
|
|||||||
| Shareholders’ equity, end of period |
$ | 4,038,794 | $ | 10,462,856 | $ | 14,688,564 | ||||||
|
|
|
|
|
|
|
|||||||
See accompanying notes to financial statements.
B-122
Table of Contents
PROSHARES ULTRASHORT BLOOMBERG NATURAL GAS
STATEMENTS OF CASH FLOWS
FOR THE YEARS ENDED DECEMBER 31, 2016, 2015 AND 2014
| Year ended December 31, 2016 |
Year ended December 31, 2015 |
Year ended December 31, 2014 |
||||||||||
| Cash flow from operating activities |
||||||||||||
| Net income (loss) |
$ | 2,456,572 | $ | 8,623,248 | $ | 11,235,212 | ||||||
| Adjustments to reconcile net income (loss) to net cash provided by (used in) operating activities: |
||||||||||||
| Decrease (Increase) in segregated cash balances with brokers for futures contracts |
1,336,005 | 2,359,170 | (2,021,030 | ) | ||||||||
| Purchases of short-term U.S. government and agency obligations |
(46,397,398 | ) | (59,678,558 | ) | (208,007,837 | ) | ||||||
| Proceeds from sales or maturities of short-term U.S government and agency obligations |
51,635,055 | 60,242,291 | 217,631,381 | |||||||||
| Net amortization and accretion on short-term U.S government and agency obligations |
(19,053 | ) | (5,830 | ) | (16,306 | ) | ||||||
| Net realized gain (loss) on investments |
(3,139 | ) | (29 | ) | (5,163 | ) | ||||||
| Change in unrealized appreciation/depreciation on investments |
388 | (168 | ) | (72 | ) | |||||||
| Decrease (Increase) in receivable on futures contracts |
(105,872 | ) | 923,531 | 597,017 | ||||||||
| Increase (Decrease) in payable to Sponsor |
(7,499 | ) | 620 | 309 | ||||||||
| Increase (Decrease) in brokerage commissions and fees payable |
(1,764 | ) | 1,908 | — | ||||||||
| Increase (Decrease) in payable on futures contracts |
(785,170 | ) | 785,170 | — | ||||||||
|
|
|
|
|
|
|
|||||||
| Net cash provided by (used in) operating activities |
8,108,125 | 13,251,353 | 19,413,511 | |||||||||
|
|
|
|
|
|
|
|||||||
| Cash flow from financing activities |
||||||||||||
| Proceeds from addition of shares |
40,020,426 | 37,204,187 | 119,491,987 | |||||||||
| Payment on shares redeemed |
(48,901,060 | ) | (50,053,143 | ) | (138,773,402 | ) | ||||||
|
|
|
|
|
|
|
|||||||
| Net cash provided by (used in) financing activities |
(8,880,634 | ) | (12,848,956 | ) | (19,281,415 | ) | ||||||
|
|
|
|
|
|
|
|||||||
| Net increase (decrease) in cash |
(772,509 | ) | 402,397 | 132,096 | ||||||||
| Cash, beginning of period |
1,099,140 | 696,743 | 564,647 | |||||||||
|
|
|
|
|
|
|
|||||||
| Cash, end of period |
$ | 326,631 | $ | 1,099,140 | $ | 696,743 | ||||||
|
|
|
|
|
|
|
|||||||
See accompanying notes to financial statements.
B-123
Table of Contents
STATEMENTS OF FINANCIAL CONDITION
| December 31, 2016 | December 31, 2015 | |||||||
| Assets |
||||||||
| Cash |
$ | 120,840 | $ | 151,638 | ||||
| Segregated cash balances with brokers for futures contracts |
13,200 | 91,250 | ||||||
| Short-term U.S. government and agency obligations (Note 3) (cost $60,540,275 and $72,981,653, respectively) |
60,540,555 | 72,979,905 | ||||||
| Unrealized appreciation on forward agreements |
3,033,566 | 1,808,942 | ||||||
| Receivable on open futures contracts |
1,280 | — | ||||||
|
|
|
|
|
|||||
| Total assets |
63,709,441 | 75,031,735 | ||||||
|
|
|
|
|
|||||
| Liabilities and shareholders’ equity |
||||||||
| Liabilities |
||||||||
| Payable on open futures contracts |
— | 80 | ||||||
| Payable to Sponsor |
55,794 | 59,891 | ||||||
|
|
|
|
|
|||||
| Total liabilities |
55,794 | 59,971 | ||||||
|
|
|
|
|
|||||
| Commitments and Contingencies (Note 2) |
||||||||
| Shareholders’ equity |
||||||||
| Shareholders’ equity |
63,653,647 | 74,971,764 | ||||||
|
|
|
|
|
|||||
| Total liabilities and shareholders’ equity |
$ | 63,709,441 | $ | 75,031,735 | ||||
|
|
|
|
|
|||||
| Shares outstanding |
696,978 | 646,978 | ||||||
|
|
|
|
|
|||||
| Net asset value per share |
$ | 91.33 | $ | 115.88 | ||||
|
|
|
|
|
|||||
| Market value per share (Note 2) |
$ | 90.54 | $ | 115.83 | ||||
|
|
|
|
|
|||||
See accompanying notes to financial statements.
B-124
Table of Contents
PROSHARES ULTRASHORT GOLD
SCHEDULE OF INVESTMENTS
DECEMBER 31, 2016
| Principal Amount | Value | |||||||
| Short-term U.S. government and agency obligations |
||||||||
| (95% of shareholders’ equity) |
||||||||
| U.S. Treasury Bills^^: |
||||||||
| 0.435% due 01/12/17 |
$ | 1,572,000 | $ | 1,571,845 | ||||
| 0.308% due 01/19/17† |
1,000,000 | 999,815 | ||||||
| 0.371% due 01/26/17 |
10,000,000 | 9,997,349 | ||||||
| 0.407% due 02/02/17 |
13,000,000 | 12,995,504 | ||||||
| 0.406% due 02/16/17† |
18,000,000 | 17,990,210 | ||||||
| 0.491% due 02/23/17† |
5,000,000 | 4,996,671 | ||||||
| 0.481% due 03/09/17† |
10,000,000 | 9,991,333 | ||||||
| 0.493% due 03/23/17 |
2,000,000 | 1,997,828 | ||||||
|
|
|
|||||||
| Total short-term U.S. government and agency obligations (cost $60,540,275) |
$ | 60,540,555 | ||||||
|
|
|
|||||||
Futures Contracts Sold††
| Number of Contracts |
Notional Amount at Value |
Unrealized Appreciation (Depreciation) |
||||||||||
| Gold Futures - COMEX, expires February 2017 |
2 | $ | 230,340 | $ | 18,980 | |||||||
Forward Agreements^
| Rate Paid (Received)* |
Settlement Date | Commitment to (Deliver)/Receive |
Notional Amount at Value** |
Unrealized Appreciation (Depreciation) |
||||||||||||||||
| Forward agreements with Citibank, N.A. based on 0.995 Fine Troy Ounce Gold |
(0.85 | )% | 01/10/17 | $ | (44,500 | ) | $ | (51,008,125 | ) | $ | 1,147,811 | |||||||||
| Forward agreements with Goldman Sachs International based on 0.995 Fine Troy Ounce Gold |
(0.70 | ) | 01/10/17 | (25,498 | ) | (29,227,083 | ) | 881,454 | ||||||||||||
| Forward agreements with Societe Generale S.A. based on 0.995 Fine Troy Ounce Gold |
(0.65 | ) | 01/10/17 | (14,600 | ) | (16,735,250 | ) | 393,006 | ||||||||||||
| Forward agreements with UBS AG based on 0.995 Fine Troy Ounce Gold |
(0.74 | ) | 01/10/17 | (26,250 | ) | (30,089,325 | ) | 611,295 | ||||||||||||
|
|
|
|||||||||||||||||||
| $ | 3,033,566 | |||||||||||||||||||
|
|
|
|||||||||||||||||||
| † | All or partial amount pledged as collateral for forward agreements and/or futures contracts. |
| †† | Cash collateral in the amount of $13,200 was pledged to cover margin requirements for open futures contracts as of December 31, 2016. |
| ^ | The positions and counterparties herein are as of December 31, 2016. The Funds continually evaluate different counterparties for their transactions and counterparties are subject to change. New counterparties can be added at anytime. |
| ^^ | Rates shown represents discount rate at the time of purchase. |
| * | Reflects the floating financing rate, as of December 31, 2016, on the notional amount of the forward agreement paid to the counterparty or received from the counterparty, excluding any commissions. |
| ** | For forward agreements, a positive amount represents “long” exposure to the underlying commodity. A negative amount represents “short” exposure to the underlying commodity. |
See accompanying notes to financial statements.
B-125
Table of Contents
PROSHARES ULTRASHORT GOLD
SCHEDULE OF INVESTMENTS
DECEMBER 31, 2015
| Principal Amount | Value | |||||||||
| Short-term U.S. government and agency obligations |
| |||||||||
| (97% of shareholders’ equity) |
| |||||||||
| U.S. Treasury Bills^^: |
| |||||||||
| 0.135% due 01/07/16† |
$ | 10,805,000 | $ | 10,804,964 | ||||||
| 0.040% due 01/14/16† |
30,298,000 | 30,297,243 | ||||||||
| 0.043% due 01/21/16 |
6,940,000 | 6,939,705 | ||||||||
| 0.000% due 02/25/16† |
10,734,000 | 10,732,837 | ||||||||
| 0.210% due 03/03/16 |
1,742,000 | 1,741,729 | ||||||||
| 0.070% due 03/10/16† |
4,806,000 | 4,804,987 | ||||||||
| 0.181% due 03/17/16† |
500,000 | 499,904 | ||||||||
| 0.203% due 03/24/16† |
2,297,000 | 2,296,081 | ||||||||
| 0.353% due 05/26/16† |
4,870,000 | 4,862,455 | ||||||||
|
|
|
|||||||||
| Total short-term U.S. government and agency obligations (cost $72,981,653) |
|
$ | 72,979,905 | |||||||
|
|
|
|||||||||
Futures Contracts Sold††
| Number of Contracts |
Notional Amount at Value |
Unrealized Appreciation (Depreciation) |
||||||||||
| Gold Futures - COMEX, expires February 2016 |
2 | $ | 212,040 | $ | 5,220 | |||||||
Forward Agreements^
| Rate Paid (Received)* |
Settlement Date | Commitment to (Deliver)/Receive |
Notional Amount at Value** |
Unrealized Appreciation (Depreciation) |
||||||||||||||||
| Forward agreements with Citibank, N.A. based on 0.995 Fine Troy Ounce Gold |
0.50 | % | 01/06/16 | $ | (6,500 | ) | $ | (6,889,740 | ) | $ | 3,915 | |||||||||
| Forward agreements with Deutsche Bank AG based on 0.995 Fine Troy Ounce Gold |
0.25 | 01/06/16 | (68,100 | ) | (72,186,681 | ) | 1,046,664 | |||||||||||||
| Forward agreements with Goldman Sachs International based on 0.995 Fine Troy Ounce Gold |
0.60 | 01/06/16 | (26,298 | ) | (27,874,828 | ) | 158,827 | |||||||||||||
| Forward agreements with Societe Generale S.A. based on 0.995 Fine Troy Ounce Gold |
0.74 | 01/06/16 | (14,000 | ) | (14,839,440 | ) | 212,680 | |||||||||||||
| Forward agreements with UBS AG based on 0.995 Fine Troy Ounce Gold |
0.61 | 01/06/16 | (26,350 | ) | (27,929,946 | ) | 386,856 | |||||||||||||
|
|
|
|||||||||||||||||||
| $ | 1,808,942 | |||||||||||||||||||
|
|
|
|||||||||||||||||||
| † | All or partial amount pledged as collateral for forward agreements and/or futures contracts. |
| †† | Cash collateral in the amount of $8,250 was pledged to cover margin requirements for open futures contracts as of December 31, 2015. |
| ^ | The positions and counterparties herein are as of December 31, 2015. The Funds continually evaluate different counterparties for their transactions and counterparties are subject to change. New counterparties can be added at anytime. |
| ^^ | Rates shown represents discount rate at the time of purchase. |
See accompanying notes to financial statements.
B-126
Table of Contents
PROSHARES ULTRASHORT GOLD
SCHEDULE OF INVESTMENTS
DECEMBER 31, 2015
| * | Reflects the floating financing rate, as of December 31, 2015, on the notional amount of the forward agreement paid to the counterparty or received from the counterparty, excluding any commissions. |
| ** | For forward agreements, a positive amount represents “long” exposure to the underlying commodity. A negative amount represents “short” exposure to the underlying commodity. |
See accompanying notes to financial statements.
B-127
Table of Contents
PROSHARES ULTRASHORT GOLD
STATEMENTS OF OPERATIONS
FOR THE YEARS ENDED DECEMBER 31, 2016, 2015 AND 2014
| Year ended December 31, 2016 |
Year ended December 31, 2015 |
Year ended December 31, 2014 |
||||||||||
| Investment Income |
||||||||||||
| Interest |
$ | 164,570 | $ | 31,999 | $ | 40,675 | ||||||
|
|
|
|
|
|
|
|||||||
| Expenses |
||||||||||||
| Management fee |
625,950 | 735,540 | 898,453 | |||||||||
| Brokerage commissions and fees |
43 | 41 | 39 | |||||||||
|
|
|
|
|
|
|
|||||||
| Total expenses |
625,993 | 735,581 | 898,492 | |||||||||
|
|
|
|
|
|
|
|||||||
| Net investment income (loss) |
(461,423 | ) | (703,582 | ) | (857,817 | ) | ||||||
|
|
|
|
|
|
|
|||||||
| Realized and unrealized gain (loss) on investment activity |
||||||||||||
| Net realized gain (loss) on |
||||||||||||
| Futures contracts |
(29,440 | ) | 15,950 | 23,310 | ||||||||
| Forward agreements |
(12,211,311 | ) | 12,691,685 | (5,339,792 | ) | |||||||
| Short-term U.S. government and agency obligations |
(378 | ) | 1,301 | 3,873 | ||||||||
|
|
|
|
|
|
|
|||||||
| Net realized gain (loss) |
(12,241,129 | ) | 12,708,936 | (5,312,609 | ) | |||||||
|
|
|
|
|
|
|
|||||||
| Change in net unrealized appreciation/depreciation on |
||||||||||||
| Futures contracts |
13,760 | 9,740 | (19,040 | ) | ||||||||
| Forward agreements |
1,224,624 | 4,091,720 | (7,915,831 | ) | ||||||||
| Short-term U.S. government and agency obligations |
2,028 | (2,950 | ) | 868 | ||||||||
|
|
|
|
|
|
|
|||||||
| Change in net unrealized appreciation/depreciation |
1,240,412 | 4,098,510 | (7,934,003 | ) | ||||||||
|
|
|
|
|
|
|
|||||||
| Net realized and unrealized gain (loss) |
(11,000,717 | ) | 16,807,446 | (13,246,612 | ) | |||||||
|
|
|
|
|
|
|
|||||||
| Net income (loss) |
$ | (11,462,140 | ) | $ | 16,103,864 | $ | (14,104,429 | ) | ||||
|
|
|
|
|
|
|
|||||||
See accompanying notes to financial statements.
B-128
Table of Contents
PROSHARES ULTRASHORT GOLD
STATEMENTS OF CHANGES IN SHAREHOLDERS’ EQUITY
FOR THE YEARS ENDED DECEMBER 31, 2016, 2015 AND 2014
| Year ended December 31, 2016 |
Year ended December 31, 2015 |
Year ended December 31, 2014 |
||||||||||
| Shareholders’ equity, beginning of period |
$ | 74,971,764 | $ | 81,861,762 | $ | 139,436,456 | ||||||
| Addition of 1,050,000, 150,000 and 550,000 shares, respectively |
83,353,994 | 13,383,255 | 51,784,693 | |||||||||
| Redemption of 1,000,000, 350,000 and 1,050,000 shares, respectively |
(83,209,971 | ) | (36,377,117 | ) | (95,254,958 | ) | ||||||
|
|
|
|
|
|
|
|||||||
| Net addition (redemption) of 50,000, (200,000) and (500,000) shares, respectively |
144,023 | (22,993,862 | ) | (43,470,265 | ) | |||||||
|
|
|
|
|
|
|
|||||||
| Net investment income (loss) |
(461,423 | ) | (703,582 | ) | (857,817 | ) | ||||||
| Net realized gain (loss) |
(12,241,129 | ) | 12,708,936 | (5,312,609 | ) | |||||||
| Change in net unrealized appreciation/depreciation |
1,240,412 | 4,098,510 | (7,934,003 | ) | ||||||||
|
|
|
|
|
|
|
|||||||
| Net income (loss) |
(11,462,140 | ) | 16,103,864 | (14,104,429 | ) | |||||||
|
|
|
|
|
|
|
|||||||
| Shareholders’ equity, end of period |
$ | 63,653,647 | $ | 74,971,764 | $ | 81,861,762 | ||||||
|
|
|
|
|
|
|
|||||||
See accompanying notes to financial statements.
B-129
Table of Contents
PROSHARES ULTRASHORT GOLD
STATEMENTS OF CASH FLOWS
FOR THE YEARS ENDED DECEMBER 31, 2016, 2015 AND 2014
| Year ended December 31, 2016 |
Year ended December 31, 2015 |
Year ended December 31, 2014 |
||||||||||
| Cash flow from operating activities |
||||||||||||
| Net income (loss) |
$ | (11,462,140 | ) | $ | 16,103,864 | $ | (14,104,429 | ) | ||||
| Adjustments to reconcile net income (loss) to net cash provided by (used in) operating activities: |
||||||||||||
| Decrease (Increase) in segregated cash balances with brokers for futures contracts |
78,050 | (82,450 | ) | 7,150 | ||||||||
| Purchases of short-term U.S. government and agency obligations |
(320,273,448 | ) | (254,497,395 | ) | (320,898,147 | ) | ||||||
| Proceeds from sales or maturities of short-term U.S government and agency obligations |
332,879,016 | 265,587,947 | 385,891,756 | |||||||||
| Net amortization and accretion on short-term U.S government and agency obligations |
(164,568 | ) | (31,999 | ) | (40,646 | ) | ||||||
| Net realized gain (loss) on investments |
378 | (1,301 | ) | (3,873 | ) | |||||||
| Change in unrealized appreciation/depreciation on investments |
(1,226,652 | ) | (4,088,770 | ) | 7,914,963 | |||||||
| Decrease (Increase) in receivable on futures contracts |
(1,280 | ) | 3,260 | (2,960 | ) | |||||||
| Increase (Decrease) in payable to Sponsor |
(4,097 | ) | (10,170 | ) | (53,758 | ) | ||||||
| Increase (Decrease) in payable on futures contracts |
(80 | ) | 80 | — | ||||||||
|
|
|
|
|
|
|
|||||||
| Net cash provided by (used in) operating activities |
(174,821 | ) | 22,983,066 | 58,710,056 | ||||||||
|
|
|
|
|
|
|
|||||||
| Cash flow from financing activities |
||||||||||||
| Proceeds from addition of shares |
83,353,994 | 13,383,255 | 51,784,693 | |||||||||
| Payment on shares redeemed |
(83,209,971 | ) | (36,377,117 | ) | (110,529,962 | ) | ||||||
|
|
|
|
|
|
|
|||||||
| Net cash provided by (used in) financing activities |
144,023 | (22,993,862 | ) | (58,745,269 | ) | |||||||
|
|
|
|
|
|
|
|||||||
| Net increase (decrease) in cash |
(30,798 | ) | (10,796 | ) | (35,213 | ) | ||||||
| Cash, beginning of period |
151,638 | 162,434 | 197,647 | |||||||||
|
|
|
|
|
|
|
|||||||
| Cash, end of period |
$ | 120,840 | $ | 151,638 | $ | 162,434 | ||||||
|
|
|
|
|
|
|
|||||||
See accompanying notes to financial statements.
B-130
Table of Contents
STATEMENTS OF FINANCIAL CONDITION
| December 31, 2016 | December 31, 2015 | |||||||
| Assets |
||||||||
| Cash |
$ | 86,051 | $ | 514,784 | ||||
| Segregated cash balances with brokers for futures contracts |
14,300 | 11,440 | ||||||
| Short-term U.S. government and agency obligations (Note 3) |
21,550,319 | 50,730,230 | ||||||
| Unrealized appreciation on forward agreements |
1,384,246 | 4,778,279 | ||||||
| Receivable on open futures contracts |
2,290 | 390 | ||||||
|
|
|
|
|
|||||
| Total assets |
23,037,206 | 56,035,123 | ||||||
|
|
|
|
|
|||||
| Liabilities and shareholders’ equity |
||||||||
| Liabilities |
||||||||
| Payable to Sponsor |
19,550 | 47,185 | ||||||
|
|
|
|
|
|||||
| Total liabilities |
19,550 | 47,185 | ||||||
|
|
|
|
|
|||||
| Commitments and Contingencies (Note 2) |
||||||||
| Shareholders’ equity |
||||||||
| Shareholders’ equity |
23,017,656 | 55,987,938 | ||||||
|
|
|
|
|
|||||
| Total liabilities and shareholders’ equity |
$ | 23,037,206 | $ | 56,035,123 | ||||
|
|
|
|
|
|||||
| Shares outstanding |
616,976 | 866,978 | ||||||
|
|
|
|
|
|||||
| Net asset value per share |
$ | 37.31 | $ | 64.58 | ||||
|
|
|
|
|
|||||
| Market value per share (Note 2) |
$ | 38.76 | $ | 64.55 | ||||
|
|
|
|
|
|||||
See accompanying notes to financial statements.
B-131
Table of Contents
PROSHARES ULTRASHORT SILVER
SCHEDULE OF INVESTMENTS
DECEMBER 31, 2016
| Principal Amount | Value | |||||||
| Short-term U.S. government and agency obligations |
|
|||||||
| (94% of shareholders’ equity) |
|
|||||||
| U.S. Treasury Bills^^: |
||||||||
| 0.339% due 01/12/17† |
$ | 5,759,000 | $ | 5,758,432 | ||||
| 0.455% due 01/19/17 |
1,500,000 | 1,499,723 | ||||||
| 0.371% due 01/26/17 |
1,000,000 | 999,735 | ||||||
| 0.409% due 02/02/17 |
1,300,000 | 1,299,551 | ||||||
| 0.452% due 02/09/17† |
8,000,000 | 7,996,382 | ||||||
| 0.491% due 02/23/17† |
2,000,000 | 1,998,668 | ||||||
| 0.493% due 03/23/17† |
2,000,000 | 1,997,828 | ||||||
|
|
|
|||||||
| Total short-term U.S. government and agency obligations (cost $21,549,766) |
$ | 21,550,319 | ||||||
|
|
|
|||||||
Futures Contracts Sold††
| Number of Contracts |
Notional Amount at Value |
Unrealized Appreciation (Depreciation) |
||||||||||
| Silver Futures - COMEX, expires March 2017 |
2 | $ | 159,890 | $ | 27,310 | |||||||
Forward Agreements^
| Rate Paid (Received)* |
Settlement Date | Commitment to (Deliver)/Receive |
Notional Amount at Value** |
Unrealized Appreciation (Depreciation) |
||||||||||||||||
| Forward agreements with Citibank, N.A. based on 0.999 Fine Troy Ounce Silver |
(1.05 | )% | 01/10/17 | $ | (1,076,000 | ) | $ | (17,480,588 | ) | $ | 610,478 | |||||||||
| Forward agreements with Goldman Sachs International based on 0.999 Fine Troy Ounce Silver |
(0.80 | ) | 01/10/17 | (934,500 | ) | (15,181,326 | ) | 323,829 | ||||||||||||
| Forward agreements with Societe Generale based on 0.999 Fine Troy Ounce Silver |
(0.80 | ) | 01/10/17 | (156,000 | ) | (2,534,314 | ) | 86,543 | ||||||||||||
| Forward agreements with UBS AG based on 0.999 Fine Troy Ounce Silver |
(0.82 | ) | 01/10/17 | (657,000 | ) | (10,673,425 | ) | 363,396 | ||||||||||||
|
|
|
|||||||||||||||||||
| $ | 1,384,246 | |||||||||||||||||||
|
|
|
|||||||||||||||||||
| † | All or partial amount pledged as collateral for forward agreements and/or futures contracts. |
| †† | Cash collateral in the amount of $14,300 was pledged to cover margin requirements for open futures contracts as of December 31, 2016. |
| ^ | The positions and counterparties herein are as of December 31, 2016. The Funds continually evaluate different counterparties for their transactions and counterparties are subject to change. New counterparties can be added at anytime. |
| ^^ | Rates shown represents discount rate at the time of purchase. |
| * | Reflects the floating financing rate, as of December 31, 2016, on the notional amount of the forward agreement paid to the |
counterparty or received from the counterparty, excluding any commissions.
| ** | For forward agreements, a positive amount represents “long” exposure to the underlying commodity. A negative amount represents “short” exposure to the underlying commodity. |
See accompanying notes to financial statements.
B-132
Table of Contents
PROSHARES ULTRASHORT SILVER
SCHEDULE OF INVESTMENTS
DECEMBER 31, 2015
| Principal Amount | Value | |||||||||
| Short-term U.S. government and agency obligations |
| |||||||||
| (91% of shareholders’ equity) |
| |||||||||
| U.S. Treasury Bills^^: |
| |||||||||
| 0.135% due 01/07/16† |
$ | 8,744,000 | $ | 8,743,971 | ||||||
| 0.043% due 01/21/16 |
1,641,000 | 1,640,930 | ||||||||
| 0.055% due 01/28/16 |
1,000,000 | 999,913 | ||||||||
| 0.000% due 02/11/16† |
1,982,000 | 1,981,739 | ||||||||
| 0.138% due 02/18/16† |
8,323,000 | 8,321,804 | ||||||||
| 0.000% due 02/25/16† |
4,001,000 | 4,000,567 | ||||||||
| 0.181% due 03/17/16† |
4,573,000 | 4,572,119 | ||||||||
| 0.163% due 03/24/16† |
18,199,000 | 18,191,721 | ||||||||
| 0.386% due 05/26/16† |
2,281,000 | 2,277,466 | ||||||||
|
|
|
|||||||||
| Total short-term U.S. government and agency obligations (cost $50,730,044) |
|
$ | 50,730,230 | |||||||
|
|
|
|||||||||
Futures Contracts Sold††
| Number of Contracts |
Notional Amount at Value |
Unrealized Appreciation (Depreciation) |
||||||||||
| Silver Futures - COMEX, expires March 2016 |
2 | $ | 138,030 | $ | 5,970 | |||||||
Forward Agreements^
| Rate Paid (Received)* |
Settlement Date | Commitment to (Deliver)/Receive |
Notional Amount at Value** |
Unrealized Appreciation (Depreciation) |
||||||||||||||||
| Forward agreements with Deutsche Bank AG based on 0.999 Fine Troy Ounce Silver |
(0.50 | )% | 01/06/16 | $ | (3,253,000 | ) | $ | (44,962,315 | ) | $ | 2,500,263 | |||||||||
| Forward agreements with Goldman Sachs International based on 0.999 Fine Troy Ounce Silver |
(0.10 | ) | 01/06/16 | (2,047,500 | ) | (28,298,907 | ) | 1,044,986 | ||||||||||||
| Forward agreements with Societe Generale based on 0.999 Fine Troy Ounce Silver |
0.00 | 01/06/16 | (656,000 | ) | (9,066,707 | ) | 438,975 | |||||||||||||
| Forward agreements with UBS AG based on 0.999 Fine Troy Ounce Silver |
(0.09 | ) | 01/06/16 | (2,135,000 | ) | (29,508,262 | ) | 794,055 | ||||||||||||
|
|
|
|||||||||||||||||||
| $ | 4,778,279 | |||||||||||||||||||
|
|
|
|||||||||||||||||||
| † | All or partial amount pledged as collateral for forward agreements and/or futures contracts. |
| †† | Cash collateral in the amount of $11,440 was pledged to cover margin requirements for open futures contracts as of December 31, 2015. |
| ^ | The positions and counterparties herein are as of December 31, 2015. The Funds continually evaluate different counterparties for their transactions and counterparties are subject to change. New counterparties can be added at anytime. |
| ^^ | Rates shown represents discount rate at the time of purchase. |
| * | Reflects the floating financing rate, as of December 31, 2015, on the notional amount of the forward agreement paid to the counterparty or received from the counterparty, excluding any commissions. |
| ** | For forward agreements, a positive amount represents “long” exposure to the underlying commodity. A negative amount represents “short” exposure to the underlying commodity. |
See accompanying notes to financial statements.
B-133
Table of Contents
PROSHARES ULTRASHORT SILVER
STATEMENTS OF OPERATIONS
FOR THE YEARS ENDED DECEMBER 31, 2016, 2015 AND 2014
| Year ended December 31, 2016 |
Year ended December 31, 2015 |
Year ended December 31, 2014 |
||||||||||
| Investment Income |
||||||||||||
| Interest |
$ | 93,483 | $ | 23,831 | $ | 30,901 | ||||||
|
|
|
|
|
|
|
|||||||
| Expenses |
||||||||||||
| Management fee |
349,293 | 540,253 | 616,703 | |||||||||
| Brokerage commissions and fees |
43 | 42 | 39 | |||||||||
|
|
|
|
|
|
|
|||||||
| Total expenses |
349,336 | 540,295 | 616,742 | |||||||||
|
|
|
|
|
|
|
|||||||
| Net investment income (loss) |
(255,853 | ) | (516,464 | ) | (585,841 | ) | ||||||
|
|
|
|
|
|
|
|||||||
| Realized and unrealized gain (loss) on investment activity |
||||||||||||
| Net realized gain (loss) on |
||||||||||||
| Futures contracts |
(40,250 | ) | 15,575 | 32,275 | ||||||||
| Forward agreements |
(17,514,464 | ) | 10,743,970 | 15,082,608 | ||||||||
| Short-term U.S. government and agency obligations |
(1,916 | ) | (2,787 | ) | 4,234 | |||||||
|
|
|
|
|
|
|
|||||||
| Net realized gain (loss) |
(17,556,630 | ) | 10,756,758 | 15,119,117 | ||||||||
|
|
|
|
|
|
|
|||||||
| Change in net unrealized appreciation/depreciation on |
||||||||||||
| Futures contracts |
21,340 | 4,410 | (12,640 | ) | ||||||||
| Forward agreements |
(3,394,033 | ) | 4,183,326 | 2,822,810 | ||||||||
| Short-term U.S. government and agency obligations |
367 | (794 | ) | (2,414 | ) | |||||||
|
|
|
|
|
|
|
|||||||
| Change in net unrealized appreciation/depreciation |
(3,372,326 | ) | 4,186,942 | 2,807,756 | ||||||||
|
|
|
|
|
|
|
|||||||
| Net realized and unrealized gain (loss) |
(20,928,956 | ) | 14,943,700 | 17,926,873 | ||||||||
|
|
|
|
|
|
|
|||||||
| Net income (loss) |
$ | (21,184,809 | ) | $ | 14,427,236 | $ | 17,341,032 | |||||
|
|
|
|
|
|
|
|||||||
See accompanying notes to financial statements.
B-134
Table of Contents
PROSHARES ULTRASHORT SILVER
STATEMENTS OF CHANGES IN SHAREHOLDERS’ EQUITY
FOR THE YEARS ENDED DECEMBER 31, 2016, 2015 AND 2014
| Year ended December 31, 2016 |
Year ended December 31, 2015 |
Year ended December 31, 2014 |
||||||||||
| Shareholders’ equity, beginning of period |
$ | 55,987,938 | $ | 53,007,867 | $ | 112,989,686 | ||||||
| Addition of 1,650,000, 1,650,000 and 1,800,000 shares, respectively (Note 1) |
69,113,968 | 84,272,164 | 72,497,634 | |||||||||
| Redemption of 1,900,002, 1,700,000 and 3,400,000 shares, respectively (Note 1) |
(80,899,441 | ) | (95,719,329 | ) | (149,820,485 | ) | ||||||
|
|
|
|
|
|
|
|||||||
| Net addition (redemption) of (250,002), (50,000) and (1,600,000) shares, respectively (Note 1) |
(11,785,473 | ) | (11,447,165 | ) | (77,322,851 | ) | ||||||
|
|
|
|
|
|
|
|||||||
| Net investment income (loss) |
(255,853 | ) | (516,464 | ) | (585,841 | ) | ||||||
| Net realized gain (loss) |
(17,556,630 | ) | 10,756,758 | 15,119,117 | ||||||||
| Change in net unrealized appreciation/depreciation |
(3,372,326 | ) | 4,186,942 | 2,807,756 | ||||||||
|
|
|
|
|
|
|
|||||||
| Net income (loss) |
(21,184,809 | ) | 14,427,236 | 17,341,032 | ||||||||
|
|
|
|
|
|
|
|||||||
| Shareholders’ equity, end of period |
$ | 23,017,656 | $ | 55,987,938 | $ | 53,007,867 | ||||||
|
|
|
|
|
|
|
|||||||
See accompanying notes to financial statements.
B-135
Table of Contents
PROSHARES ULTRASHORT SILVER
STATEMENTS OF CASH FLOWS
FOR THE YEARS ENDED DECEMBER 31, 2016, 2015 AND 2014
| Year ended December 31, 2016 |
Year ended December 31, 2015 |
Year ended December 31, 2014 |
||||||||||
| Cash flow from operating activities |
||||||||||||
| Net income (loss) |
$ | (21,184,809 | ) | $ | 14,427,236 | $ | 17,341,032 | |||||
| Adjustments to reconcile net income (loss) to net cash provided by (used in) operating activities: |
||||||||||||
| Decrease (Increase) in segregated cash balances with brokers for futures contracts |
(2,860 | ) | 2,860 | 7,700 | ||||||||
| Purchases of short-term U.S. government and agency obligations |
(149,552,689 | ) | (220,073,123 | ) | (243,452,982 | ) | ||||||
| Proceeds from sales or maturities of short-term U.S government and agency obligations |
178,824,533 | 221,589,835 | 306,085,077 | |||||||||
| Net amortization and accretion on short-term U.S government and agency obligations |
(93,482 | ) | (23,831 | ) | (30,901 | ) | ||||||
| Net realized gain (loss) on investments |
1,916 | 2,787 | (4,234 | ) | ||||||||
| Change in unrealized appreciation/depreciation on investments |
3,393,666 | (4,182,532 | ) | (2,820,396 | ) | |||||||
| Decrease (Increase) in receivable on futures contracts |
(1,900 | ) | 6,380 | (4,320 | ) | |||||||
| Increase (Decrease) in payable to Sponsor |
(27,635 | ) | 4,831 | (51,786 | ) | |||||||
|
|
|
|
|
|
|
|||||||
| Net cash provided by (used in) operating activities |
11,356,740 | 11,754,443 | 77,069,190 | |||||||||
|
|
|
|
|
|
|
|||||||
| Cash flow from financing activities |
||||||||||||
| Proceeds from addition of shares |
69,113,968 | 84,272,164 | 72,497,634 | |||||||||
| Payment on shares redeemed |
(80,899,441 | ) | (95,719,329 | ) | (149,820,485 | ) | ||||||
|
|
|
|
|
|
|
|||||||
| Net cash provided by (used in) financing activities |
(11,785,473 | ) | (11,447,165 | ) | (77,322,851 | ) | ||||||
|
|
|
|
|
|
|
|||||||
| Net increase (decrease) in cash |
(428,733 | ) | 307,278 | (253,661 | ) | |||||||
| Cash, beginning of period |
514,784 | 207,506 | 461,167 | |||||||||
|
|
|
|
|
|
|
|||||||
| Cash, end of period |
$ | 86,051 | $ | 514,784 | $ | 207,506 | ||||||
|
|
|
|
|
|
|
|||||||
See accompanying notes to financial statements.
B-136
Table of Contents
STATEMENTS OF FINANCIAL CONDITION
| December 31, 2016 | December 31, 2015 | |||||||
| Assets |
||||||||
| Cash |
$ | 2,292,012 | $ | 1,783,802 | ||||
| Segregated cash balances with brokers for futures contracts |
402,600 | 503,745 | ||||||
| Short-term U.S. government and agency obligations (Note 3) (cost $13,164,807 and $15,153,202, respectively) |
13,164,828 | 15,153,211 | ||||||
| Receivable on open futures contracts |
— | 84,235 | ||||||
|
|
|
|
|
|||||
| Total assets |
15,859,440 | 17,524,993 | ||||||
|
|
|
|
|
|||||
| Liabilities and shareholders’ equity |
||||||||
| Liabilities |
||||||||
| Payable on open futures contracts |
76,666 | — | ||||||
| Payable to Sponsor |
12,686 | 14,095 | ||||||
|
|
|
|
|
|||||
| Total liabilities |
89,352 | 14,095 | ||||||
|
|
|
|
|
|||||
| Commitments and Contingencies (Note 2) |
||||||||
| Shareholders’ equity |
||||||||
| Shareholders’ equity |
15,770,088 | 17,510,898 | ||||||
|
|
|
|
|
|||||
| Total liabilities and shareholders’ equity |
$ | 15,859,440 | $ | 17,524,993 | ||||
|
|
|
|
|
|||||
| Shares outstanding |
350,000 | 400,005 | ||||||
|
|
|
|
|
|||||
| Net asset value per share |
$ | 45.06 | $ | 43.78 | ||||
|
|
|
|
|
|||||
| Market value per share (Note 2) |
$ | 45.12 | $ | 43.74 | ||||
|
|
|
|
|
|||||
See accompanying notes to financial statements.
B-137
Table of Contents
PROSHARES SHORT EURO
SCHEDULE OF INVESTMENTS
DECEMBER 31, 2016
| Principal Amount | Value | |||||||
| Short-term U.S. government and agency obligations |
|
|||||||
| (83% of shareholders’ equity) |
|
|||||||
| U.S. Treasury Bills^^: |
||||||||
| 0.270% due 01/12/17 |
$ | 8,168,000 | $ | 8,167,194 | ||||
| 0.355% due 01/19/17 |
2,000,000 | 1,999,631 | ||||||
| 0.491% due 02/23/17 |
3,000,000 | 2,998,003 | ||||||
|
|
|
|||||||
| Total short-term U.S. government and agency obligations (cost $13,164,807) |
$ | 13,164,828 | ||||||
|
|
|
|||||||
Futures Contracts Sold††
| Number of Contracts |
Notional Amount at Value |
Unrealized Appreciation (Depreciation) |
||||||||||
| Euro Fx Currency Futures - CME, expires March 2017 |
120 | $ | 15,861,000 | $ | 132,900 | |||||||
| ^^ | Rates shown represents discount rate at the time of purchase. |
| †† | Cash collateral in the amount of $402,600 was pledged to cover margin requirements for open futures contracts as of December 31, 2016. |
See accompanying notes to financial statements.
B-138
Table of Contents
PROSHARES SHORT EURO
SCHEDULE OF INVESTMENTS
DECEMBER 31, 2015
| Principal Amount | Value | |||||||
| Short-term U.S. government and agency obligations |
|
|||||||
| (87% of shareholders’ equity) |
|
|||||||
| U.S. Treasury Bills^^: |
||||||||
| 0.000% due 01/07/16 |
$ | 5,605,000 | $ | 5,604,982 | ||||
| 0.027% due 02/04/16 |
2,555,000 | 2,554,813 | ||||||
| 0.000% due 02/25/16 |
2,962,000 | 2,961,679 | ||||||
| 0.200% due 03/10/16 |
1,635,000 | 1,634,655 | ||||||
| 0.181% due 03/17/16 |
200,000 | 199,961 | ||||||
| 0.203% due 03/24/16 |
2,198,000 | 2,197,121 | ||||||
|
|
|
|||||||
| Total short-term U.S. government and agency obligations (cost $15,153,202) |
$ | 15,153,211 | ||||||
|
|
|
|||||||
Futures Contracts Sold††
| Number of Contracts |
Notional Amount at Value |
Unrealized Appreciation (Depreciation) |
||||||||||
| Euro Fx Currency Futures - CME, expires March 2016 |
129 | $ | 17,553,675 | $ | 243,438 | |||||||
| ^^ | Rates shown represents discount rate at the time of purchase. |
| †† | Cash collateral in the amount of $503,745 was pledged to cover margin requirements for open futures contracts as of December 31, 2015 |
See accompanying notes to financial statements.
B-139
Table of Contents
PROSHARES SHORT EURO
STATEMENTS OF OPERATIONS
FOR THE YEARS ENDED DECEMBER 31, 2016, 2015 AND 2014
| Year ended December 31, 2016 |
Year ended December 31, 2015 |
Year ended December 31, 2014 |
||||||||||
| Investment Income |
||||||||||||
| Interest |
$ | 32,959 | $ | 4,504 | $ | 4,716 | ||||||
|
|
|
|
|
|
|
|||||||
| Expenses |
||||||||||||
| Management fee |
153,021 | 179,286 | 121,126 | |||||||||
| Brokerage commissions and fees |
2,666 | 3,979 | 1,837 | |||||||||
|
|
|
|
|
|
|
|||||||
| Total expenses |
155,687 | 183,265 | 122,963 | |||||||||
|
|
|
|
|
|
|
|||||||
| Net investment income (loss) |
(122,728 | ) | (178,761 | ) | (118,247 | ) | ||||||
|
|
|
|
|
|
|
|||||||
| Realized and unrealized gain (loss) on investment activity |
||||||||||||
| Net realized gain (loss) on |
||||||||||||
| Futures contracts |
663,774 | 1,559,425 | 1,593,048 | |||||||||
| Short-term U.S. government and agency obligations |
33 | 218 | 402 | |||||||||
|
|
|
|
|
|
|
|||||||
| Net realized gain (loss) |
663,807 | 1,559,643 | 1,593,450 | |||||||||
|
|
|
|
|
|
|
|||||||
| Change in net unrealized appreciation/depreciation on |
||||||||||||
| Futures contracts |
(110,538 | ) | (141,893 | ) | 418,562 | |||||||
| Short-term U.S. government and agency obligations |
12 | (170 | ) | (472 | ) | |||||||
|
|
|
|
|
|
|
|||||||
| Change in net unrealized appreciation/depreciation |
(110,526 | ) | (142,063 | ) | 418,090 | |||||||
|
|
|
|
|
|
|
|||||||
| Net realized and unrealized gain (loss) |
553,281 | 1,417,580 | 2,011,540 | |||||||||
|
|
|
|
|
|
|
|||||||
| Net income (loss) |
$ | 430,553 | $ | 1,238,819 | $ | 1,893,293 | ||||||
|
|
|
|
|
|
|
|||||||
See accompanying notes to financial statements.
B-140
Table of Contents
PROSHARES SHORT EURO
STATEMENTS OF CHANGES IN SHAREHOLDERS’ EQUITY
FOR THE YEARS ENDED DECEMBER 31, 2016, 2015 AND 2014
| Year ended December 31, 2016 |
Year ended December 31, 2015 |
Year ended December 31, 2014 |
||||||||||
| Shareholders’ equity, beginning of period |
$ | 17,510,898 | $ | 14,021,804 | $ | 8,896,842 | ||||||
| Addition of 50,000, 550,000 and 250,000 shares, respectively |
2,109,382 | 23,563,492 | 8,924,282 | |||||||||
| Redemption of 100,005, 500,000 and 150,000 shares, respectively |
(4,280,745 | ) | (21,313,217 | ) | (5,692,613 | ) | ||||||
|
|
|
|
|
|
|
|||||||
| Net addition (redemption) of (50,005), 50,000 and 100,000 shares, respectively |
(2,171,363 | ) | 2,250,275 | 3,231,669 | ||||||||
|
|
|
|
|
|
|
|||||||
| Net investment income (loss) |
(122,728 | ) | (178,761 | ) | (118,247 | ) | ||||||
| Net realized gain (loss) |
663,807 | 1,559,643 | 1,593,450 | |||||||||
| Change in net unrealized appreciation/depreciation |
(110,526 | ) | (142,063 | ) | 418,090 | |||||||
|
|
|
|
|
|
|
|||||||
| Net income (loss) |
430,553 | 1,238,819 | 1,893,293 | |||||||||
|
|
|
|
|
|
|
|||||||
| Shareholders’ equity, end of period |
$ | 15,770,088 | $ | 17,510,898 | $ | 14,021,804 | ||||||
|
|
|
|
|
|
|
|||||||
See accompanying notes to financial statements.
B-141
Table of Contents
PROSHARES SHORT EURO
STATEMENTS OF CASH FLOWS
FOR THE YEARS ENDED DECEMBER 31, 2016, 2015 AND 2014
| Year ended December 31, 2016 |
Year ended December 31, 2015 |
Year ended December 31, 2014 |
||||||||||
| Cash flow from operating activities |
||||||||||||
| Net income (loss) |
$ | 430,553 | $ | 1,238,819 | $ | 1,893,293 | ||||||
| Adjustments to reconcile net income (loss) to net cash provided by (used in) operating activities: |
||||||||||||
| Decrease (Increase) in segregated cash balances with brokers for futures contracts |
101,145 | (260,865 | ) | (114,180 | ) | |||||||
| Purchases of short-term U.S. government and agency obligations |
(53,315,548 | ) | (56,503,913 | ) | (36,652,485 | ) | ||||||
| Proceeds from sales or maturities of short-term U.S government and agency obligations |
55,336,935 | 53,441,831 | 32,472,610 | |||||||||
| Net amortization and accretion on short-term U.S government and agency obligations |
(32,959 | ) | (4,504 | ) | (4,716 | ) | ||||||
| Net realized gain (loss) on investments |
(33 | ) | (218 | ) | (402 | ) | ||||||
| Change in unrealized appreciation/depreciation on investments |
(12 | ) | 170 | 472 | ||||||||
| Decrease (Increase) in receivable on futures contracts |
84,235 | (20,985 | ) | (54,150 | ) | |||||||
| Increase (Decrease) in payable to Sponsor |
(1,409 | ) | 2,967 | 4,134 | ||||||||
| Increase (Decrease) in payable on futures contracts |
76,666 | — | — | |||||||||
|
|
|
|
|
|
|
|||||||
| Net cash provided by (used in) operating activities |
2,679,573 | (2,106,698 | ) | (2,455,424 | ) | |||||||
|
|
|
|
|
|
|
|||||||
| Cash flow from financing activities |
||||||||||||
| Proceeds from addition of shares |
2,109,382 | 23,563,492 | 8,924,282 | |||||||||
| Payment on shares redeemed |
(4,280,745 | ) | (21,313,217 | ) | (5,692,613 | ) | ||||||
|
|
|
|
|
|
|
|||||||
| Net cash provided by (used in) financing activities |
(2,171,363 | ) | 2,250,275 | 3,231,669 | ||||||||
|
|
|
|
|
|
|
|||||||
| Net increase (decrease) in cash |
508,210 | 143,577 | 776,245 | |||||||||
| Cash, beginning of period |
1,783,802 | 1,640,225 | 863,980 | |||||||||
|
|
|
|
|
|
|
|||||||
| Cash, end of period |
$ | 2,292,012 | $ | 1,783,802 | $ | 1,640,225 | ||||||
|
|
|
|
|
|
|
|||||||
See accompanying notes to financial statements.
B-142
Table of Contents
PROSHARES ULTRASHORT AUSTRALIAN DOLLAR
STATEMENTS OF FINANCIAL CONDITION
| December 31, 2016 | December 31, 2015 | |||||||
| Assets |
||||||||
| Cash |
$ | 2,834,389 | $ | 1,958,996 | ||||
| Segregated cash balances with brokers for futures contracts |
914,760 | 57,065 | ||||||
| Short-term U.S. government and agency obligations (Note 3) (cost $12,909,895 and $18,409,449, respectively) |
12,909,619 | 18,408,894 | ||||||
| Receivable on open futures contracts |
— | 52,491 | ||||||
|
|
|
|
|
|||||
| Total assets |
16,658,768 | 20,477,446 | ||||||
|
|
|
|
|
|||||
| Liabilities and shareholders’ equity |
||||||||
| Liabilities |
||||||||
| Payable on open futures contracts |
32,340 | — | ||||||
| Payable to Sponsor |
12,955 | 16,767 | ||||||
|
|
|
|
|
|||||
| Total liabilities |
45,295 | 16,767 | ||||||
|
|
|
|
|
|||||
| Commitments and Contingencies (Note 2) |
||||||||
| Shareholders’ equity |
||||||||
| Shareholders’ equity |
16,613,473 | 20,460,679 | ||||||
|
|
|
|
|
|||||
| Total liabilities and shareholders’ equity |
$ | 16,658,768 | $ | 20,477,446 | ||||
|
|
|
|
|
|||||
| Shares outstanding |
300,000 | 350,005 | ||||||
|
|
|
|
|
|||||
| Net asset value per share |
$ | 55.38 | $ | 58.46 | ||||
|
|
|
|
|
|||||
| Market value per share (Note 2) |
$ | 55.24 | $ | 58.15 | ||||
|
|
|
|
|
|||||
See accompanying notes to financial statements.
B-143
Table of Contents
PROSHARES ULTRASHORT AUSTRALIAN DOLLAR
SCHEDULE OF INVESTMENTS
DECEMBER 31, 2016
| Principal Amount | Value | |||||||
| Short-term U.S. government and agency obligations |
|
|||||||
| (78% of shareholders’ equity) |
|
|||||||
| U.S. Treasury Bills^^: |
||||||||
| 0.326% due 01/19/17 |
$ | 12,912,000 | $ | 12,909,619 | ||||
|
|
|
|||||||
| Total short-term U.S. government and agency obligations (cost $12,909,895) |
$ | 12,909,619 | ||||||
|
|
|
|||||||
Futures Contracts Sold††
| Number of Contracts |
Notional Amount at Value |
Unrealized Appreciation (Depreciation) |
||||||||||
| Australian Dollar Fx Currency Futures – CME, expires March 2017 |
462 | $ | 33,273,240 | $ | 1,182,340 | |||||||
| ^^ | Rates shown represents discount rate at the time of purchase. |
| †† | Cash collateral in the amount of $914,760 was pledged to cover margin requirements for open futures contracts as of December 31, 2016. |
See accompanying notes to financial statements.
B-144
Table of Contents
PROSHARES ULTRASHORT AUSTRALIAN DOLLAR
SCHEDULE OF INVESTMENTS
DECEMBER 31, 2015
| Principal Amount | Value | |||||||
| Short-term U.S. government and agency obligations |
|
|||||||
| (90% of shareholders’ equity) |
|
|||||||
| U.S. Treasury Bills^^: |
||||||||
| 0.048% due 02/04/16 |
$ | 2,538,000 | $ | 2,537,814 | ||||
| 0.000% due 02/25/16 |
415,000 | 414,955 | ||||||
| 0.151% due 03/03/16† |
1,267,000 | 1,266,803 | ||||||
| 0.156% due 03/24/16† |
14,195,000 | 14,189,322 | ||||||
|
|
|
|||||||
| Total short-term U.S. government and agency obligations (cost $18,409,449) |
$ | 18,408,894 | ||||||
|
|
|
|||||||
Futures Contracts Sold††
| Number of Contracts |
Notional Amount at Value |
Unrealized Appreciation (Depreciation) |
||||||||||
| Australian Dollar Fx Currency Futures - CME, expires March 2016 |
562 | $ | 40,834,920 | $ | (420,270 | ) | ||||||
| ^^ | Rates shown represents discount rate at the time of purchase. |
| † | All or partial amount pledged as collateral for futures contracts. |
| †† | Cash collateral in the amount of $57,065 was pledged to cover margin requirements for open futures contracts as of December 31, 2015. |
See accompanying notes to financial statements.
B-145
Table of Contents
PROSHARES ULTRASHORT AUSTRALIAN DOLLAR
STATEMENTS OF OPERATIONS
FOR THE YEARS ENDED DECEMBER 31, 2016, 2015 AND 2014
| Year ended December 31, 2016 |
Year ended December 31, 2015 |
Year ended December 31, 2014 |
||||||||||
| Investment Income |
||||||||||||
| Interest |
$ | 43,459 | $ | 5,998 | $ | 8,225 | ||||||
|
|
|
|
|
|
|
|||||||
| Expenses |
||||||||||||
| Management fee |
175,191 | 199,845 | 208,597 | |||||||||
| Brokerage commissions and fees |
13,920 | 16,140 | 12,811 | |||||||||
|
|
|
|
|
|
|
|||||||
| Total expenses |
189,111 | 215,985 | 221,408 | |||||||||
|
|
|
|
|
|
|
|||||||
| Net investment income (loss) |
(145,652 | ) | (209,987 | ) | (213,183 | ) | ||||||
|
|
|
|
|
|
|
|||||||
| Realized and unrealized gain (loss) on investment activity |
||||||||||||
| Net realized gain (loss) on |
||||||||||||
| Futures contracts |
(2,787,204 | ) | 4,330,463 | 2,296,216 | ||||||||
| Short-term U.S. government and agency obligations |
495 | 225 | 492 | |||||||||
|
|
|
|
|
|
|
|||||||
| Net realized gain (loss) |
(2,786,709 | ) | 4,330,688 | 2,296,708 | ||||||||
|
|
|
|
|
|
|
|||||||
| Change in net unrealized appreciation/depreciation on |
||||||||||||
| Futures contracts |
1,602,610 | (1,163,751 | ) | (174,124 | ) | |||||||
| Short-term U.S. government and agency obligations |
279 | (553 | ) | (1,463 | ) | |||||||
|
|
|
|
|
|
|
|||||||
| Change in net unrealized appreciation/depreciation |
1,602,889 | (1,164,304 | ) | (175,587 | ) | |||||||
|
|
|
|
|
|
|
|||||||
| Net realized and unrealized gain (loss) |
(1,183,820 | ) | 3,166,384 | 2,121,121 | ||||||||
|
|
|
|
|
|
|
|||||||
| Net income (loss) |
$ | (1,329,472 | ) | $ | 2,956,397 | $ | 1,907,938 | |||||
|
|
|
|
|
|
|
|||||||
See accompanying notes to financial statements.
B-146
Table of Contents
PROSHARES ULTRASHORT AUSTRALIAN DOLLAR
STATEMENTS OF CHANGES IN SHAREHOLDERS’ EQUITY
FOR THE YEARS ENDED DECEMBER 31, 2016, 2015 AND 2014
| Year ended December 31, 2016 |
Year ended December 31, 2015 |
Year ended December 31, 2014 |
||||||||||
| Shareholders’ equity, beginning of period |
$ | 20,460,679 | $ | 23,120,790 | $ | 27,983,279 | ||||||
| Addition of 0, 50,000 and 0 shares, respectively |
— | 2,764,167 | — | |||||||||
| Redemption of 50,005, 150,000 and 150,000 shares, respectively |
(2,517,734 | ) | (8,380,675 | ) | (6,770,427 | ) | ||||||
|
|
|
|
|
|
|
|||||||
| Net addition (redemption) of (50,005), (100,000) and (150,000) shares, respectively |
(2,517,734 | ) | (5,616,508 | ) | (6,770,427 | ) | ||||||
|
|
|
|
|
|
|
|||||||
| Net investment income (loss) |
(145,652 | ) | (209,987 | ) | (213,183 | ) | ||||||
| Net realized gain (loss) |
(2,786,709 | ) | 4,330,688 | 2,296,708 | ||||||||
| Change in net unrealized appreciation/depreciation |
1,602,889 | (1,164,304 | ) | (175,587 | ) | |||||||
|
|
|
|
|
|
|
|||||||
| Net income (loss) |
(1,329,472 | ) | 2,956,397 | 1,907,938 | ||||||||
|
|
|
|
|
|
|
|||||||
| Shareholders’ equity, end of period |
$ | 16,613,473 | $ | 20,460,679 | $ | 23,120,790 | ||||||
|
|
|
|
|
|
|
|||||||
See accompanying notes to financial statements.
B-147
Table of Contents
PROSHARES ULTRASHORT AUSTRALIAN DOLLAR
STATEMENTS OF CASH FLOWS
FOR THE YEARS ENDED DECEMBER 31, 2016, 2015 AND 2014
| Year ended December 31, 2016 |
Year ended December 31, 2015 |
Year ended December 31, 2014 |
||||||||||
| Cash flow from operating activities |
||||||||||||
| Net income (loss) |
$ | (1,329,472 | ) | $ | 2,956,397 | $ | 1,907,938 | |||||
| Adjustments to reconcile net income (loss) to net cash provided by (used in) operating activities: |
||||||||||||
| Decrease (Increase) in segregated cash balances with brokers for futures contracts |
(857,695 | ) | 963,152 | 121,418 | ||||||||
| Purchases of short-term U.S. government and agency obligations |
(51,162,005 | ) | (61,647,966 | ) | (41,309,385 | ) | ||||||
| Proceeds from sales or maturities of short-term U.S government and agency obligations |
56,705,513 | 63,512,421 | 45,247,467 | |||||||||
| Net amortization and accretion on short-term U.S government and agency obligations |
(43,459 | ) | (5,998 | ) | (8,225 | ) | ||||||
| Net realized gain (loss) on investments |
(495 | ) | (225 | ) | (492 | ) | ||||||
| Change in unrealized appreciation/depreciation on investments |
(279 | ) | 553 | 1,463 | ||||||||
| Decrease (Increase) in receivable on futures contracts |
52,491 | 10,043 | (62,534 | ) | ||||||||
| Increase (Decrease) in payable to Sponsor |
(3,812 | ) | (1,630 | ) | (3,620 | ) | ||||||
| Increase (Decrease) in payable on futures contracts |
32,340 | — | (86,166 | ) | ||||||||
|
|
|
|
|
|
|
|||||||
| Net cash provided by (used in) operating activities |
3,393,127 | 5,786,747 | 5,807,864 | |||||||||
|
|
|
|
|
|
|
|||||||
| Cash flow from financing activities |
||||||||||||
| Proceeds from addition of shares |
— | 2,764,167 | — | |||||||||
| Payment on shares redeemed |
(2,517,734 | ) | (8,380,675 | ) | (6,770,427 | ) | ||||||
|
|
|
|
|
|
|
|||||||
| Net cash provided by (used in) financing activities |
(2,517,734 | ) | (5,616,508 | ) | (6,770,427 | ) | ||||||
|
|
|
|
|
|
|
|||||||
| Net increase (decrease) in cash |
875,393 | 170,239 | (962,563 | ) | ||||||||
| Cash, beginning of period |
1,958,996 | 1,788,757 | 2,751,320 | |||||||||
|
|
|
|
|
|
|
|||||||
| Cash, end of period |
$ | 2,834,389 | $ | 1,958,996 | $ | 1,788,757 | ||||||
|
|
|
|
|
|
|
|||||||
See accompanying notes to financial statements.
B-148
Table of Contents
STATEMENTS OF FINANCIAL CONDITION
| December 31, 2016 | December 31, 2015 | |||||||
| Assets |
||||||||
| Cash |
$ | 2,916,502 | $ | 10,372,583 | ||||
| Short-term U.S. government and agency obligations (Note 3) |
337,375,787 | 546,166,776 | ||||||
| Unrealized appreciation on foreign currency forward contracts |
16,519,070 | — | ||||||
|
|
|
|
|
|||||
| Total assets |
356,811,359 | 556,539,359 | ||||||
|
|
|
|
|
|||||
| Liabilities and shareholders’ equity |
||||||||
| Liabilities |
||||||||
| Payable for capital shares redeemed |
6,771,472 | 5,108,230 | ||||||
| Payable to Sponsor |
291,098 | 414,275 | ||||||
| Unrealized depreciation on foreign currency forward contracts |
356,139 | 28,710,336 | ||||||
|
|
|
|
|
|||||
| Total liabilities |
7,418,709 | 34,232,841 | ||||||
|
|
|
|
|
|||||
| Commitments and Contingencies (Note 2) |
||||||||
| Shareholders’ equity |
||||||||
| Shareholders’ equity |
349,392,650 | 522,306,518 | ||||||
|
|
|
|
|
|||||
| Total liabilities and shareholders’ equity |
$ | 356,811,359 | $ | 556,539,359 | ||||
|
|
|
|
|
|||||
| Shares outstanding |
12,900,000 | 20,450,014 | ||||||
|
|
|
|
|
|||||
| Net asset value per share |
$ | 27.08 | $ | 25.54 | ||||
|
|
|
|
|
|||||
| Market value per share (Note 2) |
$ | 27.08 | $ | 25.53 | ||||
|
|
|
|
|
|||||
See accompanying notes to financial statements.
B-149
Table of Contents
PROSHARES ULTRASHORT EURO
SCHEDULE OF INVESTMENTS
DECEMBER 31, 2016
| Principal Amount | Value | |||||||
| Short-term U.S. government and agency obligations |
|
|||||||
| (97% of shareholders’ equity) |
|
|||||||
| U.S. Treasury Bills^^: |
||||||||
| 0.286% due 01/05/17† |
$ | 35,000,000 | $ | 34,999,251 | ||||
| 0.421% due 01/12/17† |
39,020,000 | 39,016,149 | ||||||
| 0.342% due 01/19/17 |
4,000,000 | 3,999,263 | ||||||
| 0.350% due 01/26/17† |
68,000,000 | 67,981,973 | ||||||
| 0.391% due 02/02/17† |
65,000,000 | 64,977,523 | ||||||
| 0.471% due 02/09/17 |
3,500,000 | 3,498,417 | ||||||
| 0.390% due 02/16/17 |
33,000,000 | 32,982,051 | ||||||
| 0.491% due 02/23/17† |
45,000,000 | 44,970,039 | ||||||
| 0.493% due 03/23/17† |
45,000,000 | 44,951,121 | ||||||
|
|
|
|||||||
| Total short-term U.S. government and agency obligations (cost $337,373,566) |
$ | 337,375,787 | ||||||
|
|
|
|||||||
Foreign Currency Forward Contracts^
| Settlement Date | Local Currency | Notional Amount at Value (USD) |
Unrealized Appreciation (Depreciation) |
|||||||||||||
| Contracts to Purchase |
||||||||||||||||
| Euro with Goldman Sachs International |
01/13/17 | 65,899,000 | $ | 69,424,004 | $ | 295,605 | ||||||||||
| Euro with UBS AG |
01/13/17 | 22,361,500 | 23,557,639 | (356,139 | ) | |||||||||||
|
|
|
|||||||||||||||
| $ | (60,534 | ) | ||||||||||||||
|
|
|
|||||||||||||||
| Contracts to Sell |
||||||||||||||||
| Euro with Goldman Sachs International |
01/13/17 | (393,278,725 | ) | $ | (414,315,600 | ) | $ | 7,813,462 | ||||||||
| Euro with UBS AG |
01/13/17 | (356,977,300 | ) | (376,072,375 | ) | 8,410,003 | ||||||||||
|
|
|
|||||||||||||||
| $ | 16,223,465 | |||||||||||||||
|
|
|
|||||||||||||||
| † | All or partial amount pledged as collateral for foreign currency forward contracts. |
| ^ | The positions and counterparties herein are as of December 31, 2016. The Funds continually evaluate different counterparties for their transactions and counterparties are subject to change. New counterparties can be added at any time. |
| ^^ | Rates shown represents discount rate at the time of purchase. |
See accompanying notes to financial statements.
B-150
Table of Contents
PROSHARES ULTRASHORT EURO
SCHEDULE OF INVESTMENTS
DECEMBER 31, 2015
| Principal Amount | Value | |||||||
| Short-term U.S. government and agency obligations |
|
|||||||
| (105% of shareholders’ equity) |
|
|||||||
| U.S. Treasury Bills^^: |
||||||||
| 0.000% due 01/21/16 |
$ | 44,995,000 | $ | 44,993,088 | ||||
| 0.133% due 01/28/16 |
67,289,000 | 67,283,166 | ||||||
| 0.027% due 02/04/16† |
98,693,000 | 98,685,776 | ||||||
| 0.150% due 02/11/16 |
29,669,000 | 29,665,087 | ||||||
| 0.180% due 02/18/16 |
7,296,000 | 7,294,952 | ||||||
| 0.000% due 02/25/16† |
21,719,000 | 21,716,648 | ||||||
| 0.167% due 03/03/16† |
44,405,000 | 44,398,086 | ||||||
| 0.175% due 03/24/16† |
143,484,000 | 143,426,606 | ||||||
| 0.353% due 05/26/16† |
88,841,000 | 88,703,367 | ||||||
|
|
|
|||||||
| Total short-term U.S. government and agency obligations (cost $546,177,230) |
$ | 546,166,776 | ||||||
|
|
|
|||||||
Foreign Currency Forward Contracts^
| Settlement Date | Local Currency | Notional Amount at Value (USD) |
Unrealized Appreciation (Depreciation) |
|||||||||||||
| Contracts to Purchase |
||||||||||||||||
| Euro with Goldman Sachs International |
01/08/16 | 129,386,700 | $ | 140,627,935 | $ | (1,100,282 | ) | |||||||||
| Euro with UBS AG |
01/08/16 | 75,393,200 | 81,943,430 | (865,112 | ) | |||||||||||
|
|
|
|||||||||||||||
| $ | (1,965,394 | ) | ||||||||||||||
|
|
|
|||||||||||||||
| Contracts to Sell |
||||||||||||||||
| Euro with Goldman Sachs International |
01/08/16 | (602,732,925 | ) | $ | (655,098,912 | ) | $ | (13,891,742 | ) | |||||||
| Euro with UBS AG |
01/08/16 | (562,621,100 | ) | (611,502,135 | ) | (12,853,200 | ) | |||||||||
|
|
|
|||||||||||||||
| $ | (26,744,942 | ) | ||||||||||||||
|
|
|
|||||||||||||||
| † | All or partial amount pledged as collateral for foreign currency forward contracts. |
| ^ | The positions and counterparties herein are as of December 31, 2015. The Funds continually evaluate different counterparties for their transactions and counterparties are subject to change. New counterparties can be added at any time. |
| ^^ | Rates shown represents discount rate at the time of purchase. |
See accompanying notes to financial statements.
B-151
Table of Contents
PROSHARES ULTRASHORT EURO
STATEMENTS OF OPERATIONS
FOR THE YEARS ENDED DECEMBER 31, 2016, 2015 AND 2014
| Year ended December 31, 2016 |
Year ended December 31, 2015 |
Year ended December 31, 2014 |
||||||||||
| Investment Income |
||||||||||||
| Interest |
$ | 1,012,886 | $ | 264,845 | $ | 199,596 | ||||||
|
|
|
|
|
|
|
|||||||
| Expenses |
||||||||||||
| Management fee |
3,777,543 | 5,265,432 | 4,193,741 | |||||||||
|
|
|
|
|
|
|
|||||||
| Total expenses |
3,777,543 | 5,265,432 | 4,193,741 | |||||||||
|
|
|
|
|
|
|
|||||||
| Net investment income (loss) |
(2,764,657 | ) | (5,000,587 | ) | (3,994,145 | ) | ||||||
|
|
|
|
|
|
|
|||||||
| Realized and unrealized gain (loss) on investment activity |
||||||||||||
| Net realized gain (loss) on |
||||||||||||
| Foreign currency forward contracts |
(25,711,518 | ) | 131,651,572 | 83,678,955 | ||||||||
| Short-term U.S. government and agency obligations |
242 | 22,509 | 4,637 | |||||||||
|
|
|
|
|
|
|
|||||||
| Net realized gain (loss) |
(25,711,276 | ) | 131,674,081 | 83,683,592 | ||||||||
|
|
|
|
|
|
|
|||||||
| Change in net unrealized appreciation/depreciation on |
||||||||||||
| Foreign currency forward contracts |
44,873,267 | (45,473,330 | ) | 30,511,501 | ||||||||
| Short-term U.S. government and agency obligations |
12,675 | (23,782 | ) | (12,286 | ) | |||||||
|
|
|
|
|
|
|
|||||||
| Change in net unrealized appreciation/depreciation |
44,885,942 | (45,497,112 | ) | 30,499,215 | ||||||||
|
|
|
|
|
|
|
|||||||
| Net realized and unrealized gain (loss) |
19,174,666 | 86,176,969 | 114,182,807 | |||||||||
|
|
|
|
|
|
|
|||||||
| Net income (loss) |
$ | 16,410,009 | $ | 81,176,382 | $ | 110,188,662 | ||||||
|
|
|
|
|
|
|
|||||||
See accompanying notes to financial statements.
B-152
Table of Contents
PROSHARES ULTRASHORT EURO
STATEMENTS OF CHANGES IN SHAREHOLDERS’ EQUITY
FOR THE YEARS ENDED DECEMBER 31, 2016, 2015 AND 2014
| Year ended December 31, 2016 |
Year ended December 31, 2015 |
Year ended December 31, 2014 |
||||||||||
| Shareholders’ equity, beginning of period |
$ | 522,306,518 | $ | 517,191,349 | $ | 418,001,115 | ||||||
| Addition of 650,000, 12,600,000 and 4,500,000 shares, respectively |
15,418,329 | 328,253,174 | 84,751,333 | |||||||||
| Redemption of 8,200,014, 16,100,000 and 5,050,000 shares, respectively |
(204,742,206 | ) | (404,314,387 | ) | (95,749,761 | ) | ||||||
|
|
|
|
|
|
|
|||||||
| Net addition (redemption) of (7,550,014), (3,500,000) and (550,000) shares, respectively |
(189,323,877 | ) | (76,061,213 | ) | (10,998,428 | ) | ||||||
|
|
|
|
|
|
|
|||||||
| Net investment income (loss) |
(2,764,657 | ) | (5,000,587 | ) | (3,994,145 | ) | ||||||
| Net realized gain (loss) |
(25,711,276 | ) | 131,674,081 | 83,683,592 | ||||||||
| Change in net unrealized appreciation/depreciation |
44,885,942 | (45,497,112 | ) | 30,499,215 | ||||||||
|
|
|
|
|
|
|
|||||||
| Net income (loss) |
16,410,009 | 81,176,382 | 110,188,662 | |||||||||
|
|
|
|
|
|
|
|||||||
| Shareholders’ equity, end of period |
$ | 349,392,650 | $ | 522,306,518 | $ | 517,191,349 | ||||||
|
|
|
|
|
|
|
|||||||
See accompanying notes to financial statements.
B-153
Table of Contents
PROSHARES ULTRASHORT EURO
STATEMENTS OF CASH FLOWS
FOR THE YEARS ENDED DECEMBER 31, 2016, 2015 AND 2014
| Year ended December 31, 2016 |
Year ended December 31, 2015 |
Year ended December 31, 2014 |
||||||||||
| Cash flow from operating activities |
||||||||||||
| Net income (loss) |
$ | 16,410,009 | $ | 81,176,382 | $ | 110,188,662 | ||||||
| Adjustments to reconcile net income (loss) to net cash provided by (used in) operating activities: |
||||||||||||
| Purchases of short-term U.S. government and agency obligations |
(1,535,809,146 | ) | (1,901,774,819 | ) | (1,291,071,881 | ) | ||||||
| Proceeds from sales or maturities of short-term U.S government and agency obligations |
1,745,625,938 | 1,842,981,707 | 1,241,999,870 | |||||||||
| Net amortization and accretion on short-term U.S government and agency obligations |
(1,012,886 | ) | (263,820 | ) | (199,596 | ) | ||||||
| Net realized gain (loss) on investments |
(242 | ) | (22,509 | ) | (4,637 | ) | ||||||
| Change in unrealized appreciation/depreciation on investments |
(44,885,942 | ) | 45,497,112 | (30,499,215 | ) | |||||||
| Increase (Decrease) in payable to Sponsor |
(123,177 | ) | 28,455 | 40,427 | ||||||||
|
|
|
|
|
|
|
|||||||
| Net cash provided by (used in) operating activities |
180,204,554 | 67,622,508 | 30,453,630 | |||||||||
|
|
|
|
|
|
|
|||||||
| Cash flow from financing activities |
||||||||||||
| Proceeds from addition of shares |
15,418,329 | 341,209,778 | 71,794,729 | |||||||||
| Payment on shares redeemed |
(203,078,964 | ) | (399,206,157 | ) | (101,720,845 | ) | ||||||
|
|
|
|
|
|
|
|||||||
| Net cash provided by (used in) financing activities |
(187,660,635 | ) | (57,996,379 | ) | (29,926,116 | ) | ||||||
|
|
|
|
|
|
|
|||||||
| Net increase (decrease) in cash |
(7,456,081 | ) | 9,626,129 | 527,514 | ||||||||
| Cash, beginning of period |
10,372,583 | 746,454 | 218,940 | |||||||||
|
|
|
|
|
|
|
|||||||
| Cash, end of period |
$ | 2,916,502 | $ | 10,372,583 | $ | 746,454 | ||||||
|
|
|
|
|
|
|
|||||||
See accompanying notes to financial statements.
B-154
Table of Contents
STATEMENTS OF FINANCIAL CONDITION
| December 31, 2016 | December 31, 2015 | |||||||
| Assets |
||||||||
| Cash |
$ | 3,166,988 | $ | 276,968 | ||||
| Short-term U.S. government and agency obligations (Note 3) |
257,102,313 | 259,997,001 | ||||||
| Unrealized appreciation on foreign currency forward contracts |
16,870,357 | 933,727 | ||||||
|
|
|
|
|
|||||
| Total assets |
277,139,658 | 261,207,696 | ||||||
|
|
|
|
|
|||||
| Liabilities and shareholders’ equity |
||||||||
| Liabilities |
||||||||
| Payable for capital shares redeemed |
– | 8,794,729 | ||||||
| Payable to Sponsor |
232,491 | 210,888 | ||||||
| Unrealized depreciation on foreign currency forward contracts |
125,420 | 14,829,179 | ||||||
|
|
|
|
|
|||||
| Total liabilities |
357,911 | 23,834,796 | ||||||
|
|
|
|
|
|||||
| Commitments and Contingencies (Note 2) |
||||||||
| Shareholders’ equity |
||||||||
| Shareholders’ equity |
276,781,747 | 237,372,900 | ||||||
|
|
|
|
|
|||||
| Total liabilities and shareholders’ equity |
$ | 277,139,658 | $ | 261,207,696 | ||||
|
|
|
|
|
|||||
| Shares outstanding |
3,449,290 | 2,699,294 | ||||||
|
|
|
|
|
|||||
| Net asset value per share |
$ | 80.24 | $ | 87.94 | ||||
|
|
|
|
|
|||||
| Market value per share (Note 2) |
$ | 80.25 | $ | 87.89 | ||||
|
|
|
|
|
|||||
See accompanying notes to financial statements.
B-155
Table of Contents
PROSHARES ULTRASHORT YEN
SCHEDULE OF INVESTMENTS
DECEMBER 31, 2016
| Principal Amount | Value | |||||||
| Short-term U.S. government and agency obligations |
|
|||||||
| (93% of shareholders’ equity) |
|
|||||||
| U.S. Treasury Bills^^: |
||||||||
| 0.286% due 01/05/17† |
$ | 21,383,000 | $ | 21,382,543 | ||||
| 0.343% due 01/12/17† |
32,400,000 | 32,396,802 | ||||||
| 0.405% due 01/19/17† |
12,500,000 | 12,497,695 | ||||||
| 0.346% due 01/26/17† |
57,000,000 | 56,984,889 | ||||||
| 0.390% due 02/02/17† |
30,006,000 | 29,995,624 | ||||||
| 0.452% due 02/09/17† |
35,000,000 | 34,984,173 | ||||||
| 0.393% due 02/16/17 |
53,000,000 | 52,971,173 | ||||||
| 0.491% due 02/23/17† |
15,900,000 | 15,889,414 | ||||||
|
|
|
|||||||
| Total short-term U.S. government and agency obligations (cost $257,103,135) |
$ | 257,102,313 | ||||||
|
|
|
|||||||
Foreign Currency Forward Contracts^
| Settlement Date | Local Currency | Notional Amount at Value (USD) |
Unrealized Appreciation (Depreciation) |
|||||||||||||
| Contracts to Purchase |
||||||||||||||||
| Yen with Goldman Sachs International |
01/13/17 | 9,411,824,400 | $ | 80,581,067 | $ | 215,477 | ||||||||||
| Yen with UBS AG |
01/13/17 | 675,533,300 | 5,783,703 | (125,420 | ) | |||||||||||
|
|
|
|||||||||||||||
| $ | 90,057 | |||||||||||||||
|
|
|
|||||||||||||||
| Contracts to Sell |
||||||||||||||||
| Yen with Goldman Sachs International |
01/13/17 | (41,411,055,600 | ) | $ | (354,548,372 | ) | $ | 8,041,302 | ||||||||
| Yen with UBS AG |
01/13/17 | (33,192,173,500 | ) | (284,180,901 | ) | 8,613,578 | ||||||||||
|
|
|
|||||||||||||||
| $ | 16,654,880 | |||||||||||||||
|
|
|
|||||||||||||||
| † | All or partial amount pledged as collateral for foreign currency forward contracts. |
| ^ | The positions and counterparties herein are as of December 31, 2016. The Funds continually evaluate different counterparties for their transactions and counterparties are subject to change. New counterparties can be added at anytime. |
| ^^ | Rates shown represents discount rate at the time of purchase. |
See accompanying notes to financial statements.
B-156
Table of Contents
PROSHARES ULTRASHORT YEN
SCHEDULE OF INVESTMENTS
DECEMBER 31, 2015
| Principal Amount | Value | |||||||
| Short-term U.S. government and agency obligations |
|
|||||||
| (110% of shareholders’ equity) |
|
|||||||
| U.S. Treasury Bills^^: |
||||||||
| 0.080% due 01/07/16 |
$ | 4,417,000 | $ | 4,416,985 | ||||
| 0.148% due 01/14/16 |
6,017,000 | 6,016,850 | ||||||
| 0.043% due 01/21/16 |
5,361,000 | 5,360,772 | ||||||
| 0.110% due 01/28/16 |
6,089,000 | 6,088,472 | ||||||
| 0.013% due 02/04/16 |
38,515,000 | 38,512,181 | ||||||
| 0.150% due 02/11/16 |
9,617,000 | 9,615,732 | ||||||
| 0.000% due 02/25/16† |
142,667,000 | 142,651,549 | ||||||
| 0.208% due 03/03/16 |
8,000,000 | 7,998,754 | ||||||
| 0.181% due 03/17/16† |
800,000 | 799,846 | ||||||
| 0.152% due 03/24/16† |
28,369,000 | 28,357,652 | ||||||
| 0.366% due 05/26/16† |
10,194,000 | 10,178,208 | ||||||
|
|
|
|||||||
| Total short-term U.S. government and agency obligations (cost $260,014,650) |
$ | 259,997,001 | ||||||
|
|
|
|||||||
Foreign Currency Forward Contracts^
| Settlement Date | Local Currency | Notional Amount at Value (USD) |
Unrealized Appreciation (Depreciation) |
|||||||||||||
| Contracts to Purchase |
||||||||||||||||
| Yen with Goldman Sachs International |
01/08/16 | 5,938,040,200 | $ | 49,402,434 | $ | 319,567 | ||||||||||
| Yen with UBS AG |
01/08/16 | 11,521,875,200 | 95,858,003 | 614,160 | ||||||||||||
|
|
|
|||||||||||||||
| $ | 933,727 | |||||||||||||||
|
|
|
|||||||||||||||
| Contracts to Sell |
||||||||||||||||
| Yen with Goldman Sachs International |
01/08/16 | (33,696,676,000 | ) | $ | (280,344,651 | ) | $ | (6,789,972 | ) | |||||||
| Yen with UBS AG |
01/08/16 | (40,852,769,100 | ) | (339,880,862 | ) | (8,039,207 | ) | |||||||||
|
|
|
|||||||||||||||
| $ | (14,829,179 | ) | ||||||||||||||
|
|
|
|||||||||||||||
| † | All or partial amount pledged as collateral for foreign currency forward contracts. |
| ^ | The positions and counterparties herein are as of December 31, 2015. The Funds continually evaluate different counterparties for their transactions and counterparties are subject to change. New counterparties can be added at any time. |
| ^^ | Rates shown represents discount rate at the time of purchase. |
See accompanying notes to financial statements.
B-157
Table of Contents
PROSHARES ULTRASHORT YEN
STATEMENTS OF OPERATIONS
FOR THE YEARS ENDED DECEMBER 31, 2016, 2015 AND 2014
| Year ended December 31, 2016 |
Year ended December 31, 2015 |
Year ended December 31, 2014 |
||||||||||
| Investment Income |
||||||||||||
| Interest |
$ | 531,771 | $ | 135,814 | $ | 197,253 | ||||||
|
|
|
|
|
|
|
|||||||
| Expenses |
||||||||||||
| Management fee |
2,141,333 | 3,759,492 | 3,938,854 | |||||||||
|
|
|
|
|
|
|
|||||||
| Total expenses |
2,141,333 | 3,759,492 | 3,938,854 | |||||||||
|
|
|
|
|
|
|
|||||||
| Net investment income (loss) |
(1,609,562 | ) | (3,623,678 | ) | (3,741,601 | ) | ||||||
|
|
|
|
|
|
|
|||||||
| Realized and unrealized gain (loss) on investment activity |
||||||||||||
| Net realized gain (loss) on |
||||||||||||
| Foreign currency forward contracts |
(22,220,271 | ) | 8,809,464 | 127,846,225 | ||||||||
| Short-term U.S. government and agency obligations |
(5,910 | ) | (3,035 | ) | 13,833 | |||||||
|
|
|
|
|
|
|
|||||||
| Net realized gain (loss) |
(22,226,181 | ) | 8,806,429 | 127,860,058 | ||||||||
|
|
|
|
|
|
|
|||||||
| Change in net unrealized appreciation/depreciation on |
||||||||||||
| Foreign currency forward contracts |
30,640,389 | (12,316,677 | ) | (30,965,459 | ) | |||||||
| Short-term U.S. government and agency obligations |
16,827 | (30,886 | ) | (20,893 | ) | |||||||
|
|
|
|
|
|
|
|||||||
| Change in net unrealized appreciation/depreciation |
30,657,216 | (12,347,563 | ) | (30,986,352 | ) | |||||||
|
|
|
|
|
|
|
|||||||
| Net realized and unrealized gain (loss) |
8,431,035 | (3,541,134 | ) | 96,873,706 | ||||||||
|
|
|
|
|
|
|
|||||||
| Net income (loss) |
$ | 6,821,473 | $ | (7,164,812 | ) | $ | 93,132,105 | |||||
|
|
|
|
|
|
|
|||||||
See accompanying notes to financial statements.
B-158
Table of Contents
PROSHARES ULTRASHORT YEN
STATEMENTS OF CHANGES IN SHAREHOLDERS’ EQUITY
FOR THE YEARS ENDED DECEMBER 31, 2016, 2015 AND 2014
| Year ended December 31, 2016 |
Year ended December 31, 2015 |
Year ended December 31, 2014 |
||||||||||
| Shareholders’ equity, beginning of period |
$ | 237,372,900 | $ | 531,471,873 | $ | 588,121,516 | ||||||
| Addition of 2,300,000, 1,350,000 and 2,850,000 shares, respectively |
150,763,218 | 124,524,909 | 216,403,570 | |||||||||
| Redemption of 1,550,004, 4,600,000 and 5,200,000 shares, respectively |
(118,175,844 | ) | (411,459,070 | ) | (366,185,318 | ) | ||||||
|
|
|
|
|
|
|
|||||||
| Net addition (redemption) of 749,996, (3,250,000) and (2,350,000) shares, respectively |
32,587,374 | (286,934,161 | ) | (149,781,748 | ) | |||||||
|
|
|
|
|
|
|
|||||||
| Net investment income (loss) |
(1,609,562 | ) | (3,623,678 | ) | (3,741,601 | ) | ||||||
| Net realized gain (loss) |
(22,226,181 | ) | 8,806,429 | 127,860,058 | ||||||||
| Change in net unrealized appreciation/depreciation |
30,657,216 | (12,347,563 | ) | (30,986,352 | ) | |||||||
|
|
|
|
|
|
|
|||||||
| Net income (loss) |
6,821,473 | (7,164,812 | ) | 93,132,105 | ||||||||
|
|
|
|
|
|
|
|||||||
| Shareholders’ equity, end of period |
$ | 276,781,747 | $ | 237,372,900 | $ | 531,471,873 | ||||||
|
|
|
|
|
|
|
|||||||
See accompanying notes to financial statements.
B-159
Table of Contents
PROSHARES ULTRASHORT YEN
STATEMENTS OF CASH FLOWS
FOR THE YEARS ENDED DECEMBER 31, 2016, 2015 AND 2014
| Year ended December 31, 2016 |
Year ended December 31, 2015 |
Year ended December 31, 2014 |
||||||||||
| Cash flow from operating activities |
||||||||||||
| Net income (loss) |
$ | 6,821,473 | $ | (7,164,812 | ) | $ | 93,132,105 | |||||
| Adjustments to reconcile net income (loss) to net cash provided by (used in) operating activities: |
||||||||||||
| Purchases of short-term U.S. government and agency obligations |
(1,044,852,917 | ) | (1,322,695,643 | ) | (1,219,436,703 | ) | ||||||
| Proceeds from sales or maturities of short-term U.S government and agency obligations |
1,048,290,293 | 1,595,758,281 | 1,245,266,414 | |||||||||
| Net amortization and accretion on short-term U.S government and agency obligations |
(531,771 | ) | (135,814 | ) | (197,253 | ) | ||||||
| Net realized gain (loss) on investments |
5,910 | 3,035 | (13,833 | ) | ||||||||
| Change in unrealized appreciation/depreciation on investments |
(30,657,216 | ) | 12,347,563 | 30,986,352 | ||||||||
| Increase (Decrease) in payable to Sponsor |
21,603 | (228,916 | ) | 2,264 | ||||||||
|
|
|
|
|
|
|
|||||||
| Net cash provided by (used in) operating activities |
(20,902,625 | ) | 277,883,694 | 149,739,346 | ||||||||
|
|
|
|
|
|
|
|||||||
| Cash flow from financing activities |
||||||||||||
| Proceeds from addition of shares |
150,763,218 | 124,524,909 | 216,403,570 | |||||||||
| Payment on shares redeemed |
(126,970,573 | ) | (402,664,341 | ) | (366,185,318 | ) | ||||||
|
|
|
|
|
|
|
|||||||
| Net cash provided by (used in) financing activities |
23,792,645 | (278,139,432 | ) | (149,781,748 | ) | |||||||
|
|
|
|
|
|
|
|||||||
| Net increase (decrease) in cash |
2,890,020 | (255,738 | ) | (42,402 | ) | |||||||
| Cash, beginning of period |
276,968 | 532,706 | 575,108 | |||||||||
|
|
|
|
|
|
|
|||||||
| Cash, end of period |
$ | 3,166,988 | $ | 276,968 | $ | 532,706 | ||||||
|
|
|
|
|
|
|
|||||||
See accompanying notes to financial statements.
B-160
Table of Contents
PROSHARES ULTRA BLOOMBERG CRUDE OIL
STATEMENTS OF FINANCIAL CONDITION
| December 31, 2016 | December 31, 2015 | |||||||
| Assets |
||||||||
| Cash |
$ | 1,401,555 | $ | 4,008,379 | ||||
| Segregated cash balances with brokers for futures contracts |
20,609,600 | 47,571,810 | ||||||
| Short-term U.S. government and agency obligations (Note 3) (cost $885,046,303 and $797,652,302, respectively) |
885,050,007 | 797,650,543 | ||||||
| Unrealized appreciation on swap agreements |
55,358,571 | — | ||||||
| Receivable from capital shares sold |
— | 4,894,509 | ||||||
| Receivable on open futures contracts |
— | 5,150,763 | ||||||
|
|
|
|
|
|||||
| Total assets |
962,419,733 | 859,276,004 | ||||||
|
|
|
|
|
|||||
| Liabilities and shareholders’ equity |
||||||||
| Liabilities |
||||||||
| Payable for capital shares redeemed |
25,879,004 | 2,514,956 | ||||||
| Payable on open futures contracts |
1,993,438 | — | ||||||
| Brokerage commissions and fees payable |
2,332 | 25,000 | ||||||
| Payable to Sponsor |
813,099 | 636,984 | ||||||
| Unrealized depreciation on swap agreements |
— | 72,176,589 | ||||||
|
|
|
|
|
|||||
| Total liabilities |
28,687,873 | 75,353,529 | ||||||
|
|
|
|
|
|||||
| Commitments and Contingencies (Note 2) |
||||||||
| Shareholders’ equity |
||||||||
| Shareholders’ equity |
933,731,860 | 783,922,475 | ||||||
|
|
|
|
|
|||||
| Total liabilities and shareholders’ equity |
$ | 962,419,733 | $ | 859,276,004 | ||||
|
|
|
|
|
|||||
| Shares outstanding (Note 9) |
40,013,933 | 31,163,934 | ||||||
|
|
|
|
|
|||||
| Net asset value per share (Note 9) |
$ | 23.34 | $ | 25.15 | ||||
|
|
|
|
|
|||||
| Market value per share (Note 2) (Note 9) |
$ | 23.36 | $ | 25.08 | ||||
|
|
|
|
|
|||||
See accompanying notes to financial statements.
B-161
Table of Contents
PROSHARES ULTRA BLOOMBERG CRUDE OIL
SCHEDULE OF INVESTMENTS
DECEMBER 31, 2016
| Principal Amount | Value | |||||||
| Short-term U.S. government and agency obligations |
|
|||||||
| (95% of shareholders’ equity) |
|
|||||||
| U.S. Treasury Bills^^: |
||||||||
| 0.289% due 01/05/17† |
$ | 144,500,000 | $ | 144,496,908 | ||||
| 0.270% due 01/12/17† |
113,636,000 | 113,624,784 | ||||||
| 0.371% due 01/19/17† |
48,500,000 | 48,491,057 | ||||||
| 0.362% due 01/26/17† |
106,000,000 | 105,971,899 | ||||||
| 0.418% due 02/02/17† |
105,749,000 | 105,712,432 | ||||||
| 0.400% due 02/09/17† |
108,000,000 | 107,951,162 | ||||||
| 0.420% due 02/16/17† |
77,000,000 | 76,958,120 | ||||||
| 0.491% due 02/23/17† |
20,000,000 | 19,986,684 | ||||||
| 0.481% due 03/09/17† |
150,000,000 | 149,869,995 | ||||||
| 0.493% due 03/23/17 |
12,000,000 | 11,986,966 | ||||||
|
|
|
|||||||
| Total short-term U.S. government and agency obligations (cost $885,046,303) |
$ | 885,050,007 | ||||||
|
|
|
|||||||
Futures Contracts Purchased††
| Number of Contracts |
Notional Amount at Value |
Unrealized Appreciation (Depreciation) |
||||||||||
| WTI Crude Oil - NYMEX, expires March 2017 |
5,855 | $ | 320,034,300 | $ | 5,537,165 | |||||||
Swap Agreements^
| Rate Paid (Received)* |
Termination Date | Notional Amount at Value** |
Unrealized Appreciation (Depreciation) |
|||||||||||||
| Swap agreement with Citibank N.A. based on Bloomberg WTI Crude Oil Subindex |
0.18 | % | 01/10/17 | $ | 545,083,669 | $ | 18,427,009 | |||||||||
| Swap agreement with Goldman Sachs International based on Bloomberg WTI Crude Oil Subindex |
0.25 | 01/10/17 | 379,451,639 | 14,016,906 | ||||||||||||
| Swap agreement with Societe Generale S.A. based on Bloomberg WTI Crude Oil Subindex |
0.25 | 01/10/17 | 259,616,766 | 8,661,821 | ||||||||||||
| Swap agreement with UBS AG based on Bloomberg WTI Crude Oil Subindex |
0.25 | 01/10/17 | 363,331,028 | 14,252,835 | ||||||||||||
|
|
|
|||||||||||||||
| $ | 55,358,571 | |||||||||||||||
|
|
|
|||||||||||||||
| † | All or partial amount pledged as collateral for swap agreements and/or futures contracts. |
| †† | Cash collateral in the amount of $20,609,600 was pledged to cover margin requirements for open futures contracts as of December 31, 2016. |
| ^ | The positions and counterparties herein are as of December 31, 2016. The Funds continually evaluate different counterparties for their transactions and counterparties are subject to change. New counterparties can be added at any time. |
| ^^ | Rates shown represents discount rate at the time of purchase. |
| * | Reflects the floating financing rate, as of December 31, 2016, on the notional amount of the swap agreement paid to the counterparty or received from the counterparty, excluding any commissions. |
| ** | For swap agreements, a positive amount represents “long” exposure to the benchmark index. A negative amount represents “short” exposure to the benchmark index. |
See accompanying notes to financial statements.
B-162
Table of Contents
PROSHARES ULTRA BLOOMBERG CRUDE OIL
SCHEDULE OF INVESTMENTS
DECEMBER 31, 2015
| Principal Amount | Value | |||||||
| Short-term U.S. government and agency obligations |
|
|||||||
| (102% of shareholders’ equity) |
|
|||||||
| U.S. Treasury Bills^^: |
||||||||
| 0.087% due 01/07/16 |
$ | 55,485,000 | $ | 55,484,817 | ||||
| 0.040% due 01/14/16 |
18,803,000 | 18,802,530 | ||||||
| 0.001% due 01/21/16 |
6,843,000 | 6,842,709 | ||||||
| 0.094% due 01/28/16† |
91,564,000 | 91,556,061 | ||||||
| 0.025% due 02/04/16 |
80,508,000 | 80,502,107 | ||||||
| 0.005% due 02/11/16† |
74,430,000 | 74,420,183 | ||||||
| 0.119% due 02/18/16† |
68,546,000 | 68,536,150 | ||||||
| 0.013% due 02/25/16† |
38,009,000 | 38,004,884 | ||||||
| 0.202% due 03/03/16† |
86,544,000 | 86,530,525 | ||||||
| 0.200% due 03/10/16† |
25,596,000 | 25,590,604 | ||||||
| 0.147% due 03/17/16† |
73,235,000 | 73,220,895 | ||||||
| 0.178% due 03/24/16† |
44,753,000 | 44,735,099 | ||||||
| 0.356% due 05/26/16† |
133,631,000 | 133,423,979 | ||||||
|
|
|
|||||||
| Total short-term U.S. government and agency obligations (cost $797,652,302) |
$ | 797,650,543 | ||||||
|
|
|
|||||||
Futures Contracts Purchased††
| Number of Contracts |
Notional Amount at Value |
Unrealized Appreciation (Depreciation) |
||||||||||
| Crude Oil - NYMEX, expires March 2016 |
11,089 | $ | 423,267,130 | $ | (17,929,314 | ) | ||||||
Swap Agreements^
| Rate Paid (Received)* |
Termination Date | Notional Amount at Value** |
Unrealized Appreciation (Depreciation) |
|||||||||||||
| Swap agreement with Citibank N.A. based on Bloomberg WTI Crude Oil Subindex |
0.18 | % | 01/06/16 | $ | 158,594,078 | $ | (2,509,989 | ) | ||||||||
| Swap agreement with Deutsche Bank AG based on Bloomberg WTI Crude Oil Subindex |
0.25 | 01/06/16 | 292,553,469 | (20,221,872 | ) | |||||||||||
| Swap agreement with Goldman Sachs International based on Bloomberg WTI Crude Oil Subindex |
0.25 | 01/06/16 | 298,419,036 | (20,806,119 | ) | |||||||||||
| Swap agreement with Societe Generale S.A. based on Bloomberg WTI Crude Oil Subindex |
0.25 | 01/06/16 | 100,733,521 | (6,357,459 | ) | |||||||||||
| Swap agreement with UBS AG based on Bloomberg WTI Crude Oil Subindex |
0.25 | 01/06/16 | 294,338,185 | (22,281,150 | ) | |||||||||||
|
|
|
|||||||||||||||
| $ | (72,176,589 | ) | ||||||||||||||
|
|
|
|||||||||||||||
| † | All or partial amount pledged as collateral for swap agreements and/or futures contracts. |
| †† | Cash collateral in the amount of $47,571,810 was pledged to cover margin requirements for open futures contracts as of December 31, 2015. |
| ^ | The positions and counterparties herein are as of December 31, 2015. The Funds continually evaluate different counterparties for their transactions and counterparties are subject to change. New counterparties can be added at anytime. |
| ^^ | Rates shown represents discount rate at the time of the purchase. |
| * | Reflects the floating financing rate, as of December 31, 2015, on the notional amount of the swap agreement paid to the counterparty or received from the counterparty, excluding any commissions. |
| ** | For swap agreements, a positive amount represents “long” exposure to the benchmark index. A negative amount represents “short” exposure to the benchmark index. |
See accompanying notes to financial statements.
B-163
Table of Contents
PROSHARES ULTRA BLOOMBERG CRUDE OIL
STATEMENTS OF OPERATIONS
FOR THE YEARS ENDED DECEMBER 31, 2016, 2015 AND 2014
| Year ended December 31, 2016 |
Year ended December 31, 2015 |
Year ended December 31, 2014 |
||||||||||
| Investment Income |
||||||||||||
| Interest |
$ | 2,170,633 | $ | 396,158 | $ | 68,292 | ||||||
|
|
|
|
|
|
|
|||||||
| Expenses |
||||||||||||
| Management fee |
8,263,078 | 8,230,180 | 1,769,248 | |||||||||
| Brokerage commissions and fees |
538,935 | 639,133 | 65,408 | |||||||||
|
|
|
|
|
|
|
|||||||
| Total expenses |
8,802,013 | 8,869,313 | 1,834,656 | |||||||||
|
|
|
|
|
|
|
|||||||
| Net investment income (loss) |
(6,631,380 | ) | (8,473,155 | ) | (1,766,364 | ) | ||||||
|
|
|
|
|
|
|
|||||||
| Realized and unrealized gain (loss) on investment activity |
||||||||||||
| Net realized gain (loss) on |
||||||||||||
| Futures contracts |
43,093,616 | (297,227,106 | ) | (109,160,069 | ) | |||||||
| Swap agreements |
30,967,424 | (598,949,990 | ) | (134,165,888 | ) | |||||||
| Short-term U.S. government and agency obligations |
(17,374 | ) | 22,728 | 11,806 | ||||||||
|
|
|
|
|
|
|
|||||||
| Net realized gain (loss) |
74,043,666 | (896,154,368 | ) | (243,314,151 | ) | |||||||
|
|
|
|
|
|
|
|||||||
| Change in net unrealized appreciation/depreciation on |
||||||||||||
| Futures contracts |
23,466,479 | 28,545,473 | (47,101,448 | ) | ||||||||
| Swap agreements |
127,535,160 | 4,004,508 | (78,138,990 | ) | ||||||||
| Short-term U.S. government and agency obligations |
5,463 | (6,857 | ) | (7,333 | ) | |||||||
|
|
|
|
|
|
|
|||||||
| Change in net unrealized appreciation/depreciation |
151,007,102 | 32,543,124 | (125,247,771 | ) | ||||||||
|
|
|
|
|
|
|
|||||||
| Net realized and unrealized gain (loss) |
225,050,768 | (863,611,244 | ) | (368,561,922 | ) | |||||||
|
|
|
|
|
|
|
|||||||
| Net income (loss) |
$ | 218,419,388 | $ | (872,084,399 | ) | $ | (370,328,286 | ) | ||||
|
|
|
|
|
|
|
|||||||
See accompanying notes to financial statements.
B-164
Table of Contents
PROSHARES ULTRA BLOOMBERG CRUDE OIL
STATEMENTS OF CHANGES IN SHAREHOLDERS’ EQUITY
FOR THE YEARS ENDED DECEMBER 31, 2016, 2015 AND 2014
| Year ended December 31, 2016 |
Year ended December 31, 2015 |
Year ended December 31, 2014 |
||||||||||
| Shareholders’ equity, beginning of period |
$ | 783,922,475 | $ | 450,562,988 | $ | 142,773,429 | ||||||
| Addition of 62,875,000, 43,415,000 and 5,040,000 shares, respectively (Note 9) |
1,094,604,444 | 2,505,616,928 | 1,007,757,253 | |||||||||
| Redemption of 54,025,001, 16,690,983 and 1,045,000 shares, respectively (Note 9) |
(1,163,214,447 | ) | (1,300,173,042 | ) | (329,639,408 | ) | ||||||
|
|
|
|
|
|
|
|||||||
| Net addition (redemption) of 8,849,999, 26,724,017 and 3,995,000 shares, respectively (Note 9) |
(68,610,003 | ) | 1,205,443,886 | 678,117,845 | ||||||||
|
|
|
|
|
|
|
|||||||
| Net investment income (loss) |
(6,631,380 | ) | (8,473,155 | ) | (1,766,364 | ) | ||||||
| Net realized gain (loss) |
74,043,666 | (896,154,368 | ) | (243,314,151 | ) | |||||||
| Change in net unrealized appreciation/depreciation |
151,007,102 | 32,543,124 | (125,247,771 | ) | ||||||||
|
|
|
|
|
|
|
|||||||
| Net income (loss) |
218,419,388 | (872,084,399 | ) | (370,328,286 | ) | |||||||
|
|
|
|
|
|
|
|||||||
| Shareholders’ equity, end of period |
$ | 933,731,860 | $ | 783,922,475 | $ | 450,562,988 | ||||||
|
|
|
|
|
|
|
|||||||
See accompanying notes to financial statements.
B-165
Table of Contents
PROSHARES ULTRA BLOOMBERG CRUDE OIL
STATEMENTS OF CASH FLOWS
FOR THE YEARS ENDED DECEMBER 31, 2016, 2015 AND 2014
| Year ended December 31, 2016 |
Year ended December 31, 2015 |
Year ended December 31, 2014 |
||||||||||
| Cash flow from operating activities |
||||||||||||
| Net income (loss) |
$ | 218,419,388 | $ | (872,084,399 | ) | $ | (370,328,286 | ) | ||||
| Adjustments to reconcile net income (loss) to net cash provided by (used in) operating activities: |
||||||||||||
| Decrease (Increase) in segregated cash balances with brokers for futures contracts |
26,962,210 | (12,966,690 | ) | (30,783,225 | ) | |||||||
| Purchases of short-term U.S. government and agency obligations |
(3,746,504,691 | ) | (4,300,690,737 | ) | (1,059,239,810 | ) | ||||||
| Proceeds from sales or maturities of short-term U.S government and agency obligations |
3,661,263,949 | 3,970,639,458 | 729,547,449 | |||||||||
| Net amortization and accretion on short-term U.S government and agency obligations |
(2,170,633 | ) | (382,657 | ) | (68,292 | ) | ||||||
| Net realized gain (loss) on investments |
17,374 | (22,728 | ) | (11,806 | ) | |||||||
| Change in unrealized appreciation/depreciation on investments |
(127,540,623 | ) | (3,997,651 | ) | 78,146,323 | |||||||
| Decrease (Increase) in receivable on futures contracts |
5,150,763 | (5,150,763 | ) | — | ||||||||
| Increase (Decrease) in payable to Sponsor |
176,115 | 316,922 | 185,707 | |||||||||
| Increase (Decrease) in brokerage commissions and fees payable |
(22,668 | ) | 25,000 | — | ||||||||
| Increase (Decrease) in payable on futures contracts |
1,993,438 | (5,817,266 | ) | 4,820,056 | ||||||||
|
|
|
|
|
|
|
|||||||
| Net cash provided by (used in) operating activities |
37,744,622 | (1,230,131,511 | ) | (647,731,884 | ) | |||||||
|
|
|
|
|
|
|
|||||||
| Cash flow from financing activities |
||||||||||||
| Proceeds from addition of shares |
1,099,498,953 | 2,529,448,592 | 979,031,080 | |||||||||
| Payment on shares redeemed |
(1,139,850,399 | ) | (1,297,658,086 | ) | (329,639,408 | ) | ||||||
|
|
|
|
|
|
|
|||||||
| Net cash provided by (used in) financing activities |
(40,351,446 | ) | 1,231,790,506 | 649,391,672 | ||||||||
|
|
|
|
|
|
|
|||||||
| Net increase (decrease) in cash |
(2,606,824 | ) | 1,658,995 | 1,659,788 | ||||||||
| Cash, beginning of period |
4,008,379 | 2,349,384 | 689,596 | |||||||||
|
|
|
|
|
|
|
|||||||
| Cash, end of period |
$ | 1,401,555 | $ | 4,008,379 | $ | 2,349,384 | ||||||
|
|
|
|
|
|
|
|||||||
See accompanying notes to financial statements.
B-166
Table of Contents
PROSHARES ULTRA BLOOMBERG NATURAL GAS
STATEMENTS OF FINANCIAL CONDITION
| December 31, 2016 | December 31, 2015 | |||||||
| Assets |
||||||||
| Cash |
$ | 971,442 | $ | 1,411,137 | ||||
| Segregated cash balances with brokers for futures contracts |
7,612,770 | 7,595,280 | ||||||
| Short-term U.S. government and agency obligations (Note 3) (cost $36,183,384 and $26,806,648, respectively) |
36,183,648 | 26,807,731 | ||||||
| Receivable on open futures contracts |
— | 3,065,769 | ||||||
|
|
|
|
|
|||||
| Total assets |
44,767,860 | 38,879,917 | ||||||
|
|
|
|
|
|||||
| Liabilities and shareholders’ equity |
||||||||
| Liabilities |
||||||||
| Payable on open futures contracts |
1,528,005 | — | ||||||
| Brokerage commissions and fees payable |
433 | 3,623 | ||||||
| Payable to Sponsor |
36,036 | 25,110 | ||||||
|
|
|
|
|
|||||
| Total liabilities |
1,564,474 | 28,733 | ||||||
|
|
|
|
|
|||||
| Commitments and Contingencies (Note 2) |
||||||||
| Shareholders’ equity |
||||||||
| Shareholders’ equity |
43,203,386 | 38,851,184 | ||||||
|
|
|
|
|
|||||
| Total liabilities and shareholders’ equity |
$ | 44,767,860 | $ | 38,879,917 | ||||
|
|
|
|
|
|||||
| Shares outstanding |
2,292,169 | 2,092,170 | ||||||
|
|
|
|
|
|||||
| Net asset value per share |
$ | 18.85 | $ | 18.57 | ||||
|
|
|
|
|
|||||
| Market value per share (Note 2) |
$ | 18.96 | $ | 18.48 | ||||
|
|
|
|
|
|||||
See accompanying notes to financial statements.
B-167
Table of Contents
PROSHARES ULTRA BLOOMBERG NATURAL GAS
SCHEDULE OF INVESTMENTS
DECEMBER 31, 2016
| Principal Amount | Value | |||||||
| Short-term U.S. government and agency obligations (84% of shareholders’ equity) |
|
|||||||
| U.S. Treasury Bills^^: |
||||||||
| 0.435% due 01/12/17 |
$ | 1,200,000 | $ | 1,199,882 | ||||
| 0.345% due 01/19/17 |
8,000,000 | 7,998,525 | ||||||
| 0.311% due 01/26/17 |
3,000,000 | 2,999,205 | ||||||
| 0.403% due 02/02/17 |
3,000,000 | 2,998,963 | ||||||
| 0.425% due 02/09/17 |
4,000,000 | 3,998,191 | ||||||
| 0.440% due 02/16/17 |
12,000,000 | 11,993,473 | ||||||
| 0.491% due 02/23/17 |
2,000,000 | 1,998,668 | ||||||
| 0.493% due 03/23/17 |
3,000,000 | 2,996,741 | ||||||
|
|
|
|||||||
| Total short-term U.S. government and agency obligations (cost $36,183,384) |
$ | 36,183,648 | ||||||
|
|
|
|||||||
Futures Contracts Purchased††
| Number of Contracts |
Notional Amount at Value |
Unrealized Appreciation (Depreciation) |
||||||||||
| Natural Gas - NYMEX, expires March 2017 |
2,346 | $ | 86,426,640 | $ | 2,536,720 | |||||||
| ^^ | Rates shown represents discount rate at the time of the purchase. |
| †† | Cash collateral in the amount of $7,612,770 was pledged to cover margin requirements for open futures contracts as of December 31, 2016. |
See accompanying notes to financial statements.
B-168
Table of Contents
PROSHARES ULTRA BLOOMBERG NATURAL GAS
SCHEDULE OF INVESTMENTS
DECEMBER 31, 2015
| Principal Amount | Value | |||||||
| Short-term U.S. government and agency obligations |
|
|||||||
| (69% of shareholders’ equity) |
||||||||
| U.S. Treasury Bills^^: |
||||||||
| 0.080% due 01/07/16 |
$ | 1,137,000 | $ | 1,136,996 | ||||
| 0.165% due 01/28/16 |
861,000 | 860,925 | ||||||
| 0.035% due 02/04/16 |
1,316,000 | 1,315,904 | ||||||
| 0.000% due 02/25/16 |
588,000 | 587,936 | ||||||
| 0.151% due 03/03/16 |
3,234,000 | 3,233,497 | ||||||
| 0.200% due 03/10/16 |
1,823,000 | 1,822,616 | ||||||
| 0.186% due 03/24/16 |
17,857,000 | 17,849,857 | ||||||
|
|
|
|||||||
| Total short-term U.S. government and agency obligations (cost $26,806,648) |
$ | 26,807,731 | ||||||
|
|
|
|||||||
Futures Contracts Purchased††
| Number of Contracts |
Notional Amount at Value |
Unrealized Appreciation (Depreciation) |
||||||||||
| Natural Gas - NYMEX, expires March 2016 |
3,288 | $ | 77,695,440 | $ | 6,312,879 | |||||||
| ^^ | Rates shown represents discount rate at the time of the purchase. |
| †† | Cash collateral in the amount of $7,595,280 was pledged to cover margin requirements for open futures contracts as of December 31, 2015. |
See accompanying notes to financial statements.
B-169
Table of Contents
PROSHARES ULTRA BLOOMBERG NATURAL GAS
STATEMENTS OF OPERATIONS
FOR THE YEARS ENDED DECEMBER 31, 2016, 2015 AND 2014
| Year ended December 31, 2016 |
Year ended December 31, 2015 |
Year ended December 31, 2014 |
||||||||||
| Investment Income |
||||||||||||
| Interest |
$ | 72,943 | $ | 20,167 | $ | 15,961 | ||||||
|
|
|
|
|
|
|
|||||||
| Expenses |
||||||||||||
| Management fee |
325,435 | 574,158 | 455,794 | |||||||||
| Brokerage commissions and fees |
131,994 | 207,344 | 88,748 | |||||||||
|
|
|
|
|
|
|
|||||||
| Total expenses |
457,429 | 781,502 | 544,542 | |||||||||
|
|
|
|
|
|
|
|||||||
| Net investment income (loss) |
(384,486 | ) | (761,335 | ) | (528,581 | ) | ||||||
|
|
|
|
|
|
|
|||||||
| Realized and unrealized gain (loss) on investment activity |
||||||||||||
| Net realized gain (loss) on |
||||||||||||
| Futures contracts |
17,571,809 | (100,776,817 | ) | (6,464,796 | ) | |||||||
| Short-term U.S. government and agency obligations |
(698 | ) | 4,341 | 5,068 | ||||||||
|
|
|
|
|
|
|
|||||||
| Net realized gain (loss) |
17,571,111 | (100,772,476 | ) | (6,459,728 | ) | |||||||
|
|
|
|
|
|
|
|||||||
| Change in net unrealized appreciation/depreciation on |
||||||||||||
| Futures contracts |
(3,776,159 | ) | 41,202,162 | (31,232,744 | ) | |||||||
| Short-term U.S. government and agency obligations |
(819 | ) | (296 | ) | (1,537 | ) | ||||||
|
|
|
|
|
|
|
|||||||
| Change in net unrealized appreciation/depreciation |
(3,776,978 | ) | 41,201,866 | (31,234,281 | ) | |||||||
|
|
|
|
|
|
|
|||||||
| Net realized and unrealized gain (loss) |
13,794,133 | (59,570,610 | ) | (37,694,009 | ) | |||||||
|
|
|
|
|
|
|
|||||||
| Net income (loss) |
$ | 13,409,647 | $ | (60,331,945 | ) | $ | (38,222,590 | ) | ||||
|
|
|
|
|
|
|
|||||||
See accompanying notes to financial statements.
B-170
Table of Contents
PROSHARES ULTRA BLOOMBERG NATURAL GAS
STATEMENTS OF CHANGES IN SHAREHOLDERS’ EQUITY
FOR THE YEARS ENDED DECEMBER 31, 2016, 2015 AND 2014
| Year ended December 31, 2016 |
Year ended December 31, 2015 |
Year ended December 31, 2014 |
||||||||||
| Shareholders’ equity, beginning of period |
$ | 38,851,184 | $ | 70,433,207 | $ | 62,915,779 | ||||||
| Addition of 3,450,000, 2,137,500 and 1,437,500 shares, respectively (Note 1) |
40,783,818 | 83,526,876 | 171,856,215 | |||||||||
| Redemption of 3,250,001, 1,187,815 and 700,000 shares, respectively (Note 1) |
(49,841,263 | ) | (54,776,954 | ) | (126,116,197 | ) | ||||||
|
|
|
|
|
|
|
|||||||
| Net addition (redemption) of 199,999, 949,685 and 737,500 shares, respectively (Note 1) |
(9,057,445 | ) | 28,749,922 | 45,740,018 | ||||||||
|
|
|
|
|
|
|
|||||||
| Net investment income (loss) |
(384,486 | ) | (761,335 | ) | (528,581 | ) | ||||||
| Net realized gain (loss) |
17,571,111 | (100,772,476 | ) | (6,459,728 | ) | |||||||
| Change in net unrealized appreciation/depreciation |
(3,776,978 | ) | 41,201,866 | (31,234,281 | ) | |||||||
|
|
|
|
|
|
|
|||||||
| Net income (loss) |
13,409,647 | (60,331,945 | ) | (38,222,590 | ) | |||||||
|
|
|
|
|
|
|
|||||||
| Shareholders’ equity, end of period |
$ | 43,203,386 | $ | 38,851,184 | $ | 70,433,207 | ||||||
|
|
|
|
|
|
|
|||||||
See accompanying notes to financial statements.
B-171
Table of Contents
PROSHARES ULTRA BLOOMBERG NATURAL GAS
STATEMENTS OF CASH FLOWS
FOR THE YEARS ENDED DECEMBER 31, 2016, 2015 AND 2014
| Year ended December 31, 2016 |
Year ended December 31, 2015 |
Year ended December 31, 2014 |
||||||||||
| Cash flow from operating activities |
||||||||||||
| Net income (loss) |
$ | 13,409,647 | $ | (60,331,945 | ) | $ | (38,222,590 | ) | ||||
| Adjustments to reconcile net income (loss) to net cash provided by (used in) operating activities: |
||||||||||||
| Decrease (Increase) in segregated cash balances with brokers for futures contracts |
(17,490 | ) | 13,538,800 | (14,531,880 | ) | |||||||
| Purchases of short-term U.S. government and agency obligations |
(136,277,314 | ) | (262,203,648 | ) | (269,350,242 | ) | ||||||
| Proceeds from sales or maturities of short-term U.S government and agency obligations |
126,972,823 | 288,829,035 | 274,880,518 | |||||||||
| Net amortization and accretion on short-term U.S government and agency obligations |
(72,943 | ) | (18,846 | ) | (15,961 | ) | ||||||
| Net realized gain (loss) on investments |
698 | (4,341 | ) | (5,068 | ) | |||||||
| Change in unrealized appreciation/depreciation on investments |
819 | 296 | 1,537 | |||||||||
| Decrease (Increase) in receivable on futures contracts |
3,065,769 | (3,065,769 | ) | — | ||||||||
| Increase (Decrease) in payable to Sponsor |
10,926 | (40,680 | ) | (15,937 | ) | |||||||
| Increase (Decrease) in brokerage commissions and fees payable |
(3,190 | ) | 3,623 | — | ||||||||
| Increase (Decrease) in payable on futures contracts |
1,528,005 | (9,552,314 | ) | 3,923,782 | ||||||||
|
|
|
|
|
|
|
|||||||
| Net cash provided by (used in) operating activities |
8,617,750 | (32,845,789 | ) | (43,335,841 | ) | |||||||
|
|
|
|
|
|
|
|||||||
| Cash flow from financing activities |
||||||||||||
| Proceeds from addition of shares |
40,783,818 | 87,380,298 | 168,002,793 | |||||||||
| Payment on shares redeemed |
(49,841,263 | ) | (54,776,954 | ) | (126,116,197 | ) | ||||||
|
|
|
|
|
|
|
|||||||
| Net cash provided by (used in) financing activities |
(9,057,445 | ) | 32,603,344 | 41,886,596 | ||||||||
|
|
|
|
|
|
|
|||||||
| Net increase (decrease) in cash |
(439,695 | ) | (242,445 | ) | (1,449,245 | ) | ||||||
| Cash, beginning of period |
1,411,137 | 1,653,582 | 3,102,827 | |||||||||
|
|
|
|
|
|
|
|||||||
| Cash, end of period |
$ | 971,442 | $ | 1,411,137 | $ | 1,653,582 | ||||||
|
|
|
|
|
|
|
|||||||
See accompanying notes to financial statements.
B-172
Table of Contents
STATEMENTS OF FINANCIAL CONDITION
| December 31, 2016 | December 31, 2015 | |||||||
| Assets |
||||||||
| Cash |
$ | 1,262,351 | $ | 251,524 | ||||
| Segregated cash balances with brokers for futures contracts |
13,200 | 8,250 | ||||||
| Short-term U.S. government and agency obligations (Note 3) (cost $95,356,703 and $71,908,280, respectively) |
95,356,621 | 71,912,587 | ||||||
| Receivable on open futures contracts |
— | 80 | ||||||
|
|
|
|
|
|||||
| Total assets |
96,632,172 | 72,172,441 | ||||||
|
|
|
|
|
|||||
| Liabilities and shareholders’ equity |
||||||||
| Liabilities |
||||||||
| Payable on open futures contracts |
1,280 | — | ||||||
| Payable to Sponsor |
72,585 | 57,031 | ||||||
| Unrealized depreciation on forward agreements |
4,431,107 | 2,250,595 | ||||||
|
|
|
|
|
|||||
| Total liabilities |
4,504,972 | 2,307,626 | ||||||
|
|
|
|
|
|||||
| Commitments and Contingencies (Note 2) |
||||||||
| Shareholders’ equity |
||||||||
| Shareholders’ equity |
92,127,200 | 69,864,815 | ||||||
|
|
|
|
|
|||||
| Total liabilities and shareholders’ equity |
$ | 96,632,172 | $ | 72,172,441 | ||||
|
|
|
|
|
|||||
| Shares outstanding |
2,800,000 | 2,350,014 | ||||||
|
|
|
|
|
|||||
| Net asset value per share |
$ | 32.90 | $ | 29.73 | ||||
|
|
|
|
|
|||||
| Market value per share (Note 2) |
$ | 33.20 | $ | 29.73 | ||||
|
|
|
|
|
|||||
See accompanying notes to financial statements.
B-173
Table of Contents
PROSHARES ULTRA GOLD
SCHEDULE OF INVESTMENTS
DECEMBER 31, 2016
| Principal Amount | Value | |||||||
| Short-term U.S. government and agency obligations |
|
|||||||
| (104% of shareholders’ equity) |
|
|||||||
| U.S. Treasury Bills^^: |
||||||||
| 0.318% due 01/05/17† |
$ | 5,340,000 | $ | 5,339,886 | ||||
| 0.276% due 01/12/17† |
15,564,000 | 15,562,464 | ||||||
| 0.355% due 01/19/17† |
4,395,000 | 4,394,189 | ||||||
| 0.360% due 01/26/17† |
22,000,000 | 21,994,168 | ||||||
| 0.406% due 02/02/17† |
6,100,000 | 6,097,891 | ||||||
| 0.393% due 02/16/17† |
11,006,000 | 11,000,014 | ||||||
| 0.491% due 02/23/17† |
4,000,000 | 3,997,337 | ||||||
| 0.493% due 03/23/17† |
27,000,000 | 26,970,672 | ||||||
|
|
|
|||||||
| Total short-term U.S. government and agency obligations (cost $95,356,703) |
$ | 95,356,621 | ||||||
|
|
|
|||||||
Futures Contracts Purchased††
| Number of Contracts |
Notional Amount at Value |
Unrealized Appreciation (Depreciation) |
||||||||||
| Gold Futures - COMEX, expires February 2017 |
2 | $ | 230,340 | $ | (18,960 | ) | ||||||
Forward Agreements^
| Rate Paid (Received)* |
Settlement Date | Commitment to (Deliver)/Receive |
Notional Amount at Value** |
Unrealized Appreciation (Depreciation) |
||||||||||||||||
| Forward agreements with Citibank, N.A. based on 0.995 Fine Troy Ounce Gold |
1.35 | % | 01/10/17 | $ | 55,100 | $ | 63,158,375 | $ | (1,464,982 | ) | ||||||||||
| Forward agreements with Goldman Sachs International based on 0.995 Fine Troy Ounce Gold |
1.55 | 01/10/17 | 42,320 | 48,509,300 | (1,112,916 | ) | ||||||||||||||
| Forward agreements with Societe Generale based on 0.995 Fine Troy Ounce Gold |
1.55 | 01/10/17 | 23,300 | 26,707,625 | (643,587 | ) | ||||||||||||||
| Forward agreements with UBS AG based on 0.995 Fine Troy Ounce Gold |
1.54 | 01/10/17 | 39,800 | 45,621,148 | (1,209,622 | ) | ||||||||||||||
|
|
|
|||||||||||||||||||
| $ | (4,431,107 | ) | ||||||||||||||||||
|
|
|
|||||||||||||||||||
| † | All or partial amount pledged as collateral for forward agreements and/or futures contracts. |
| †† | Cash collateral in the amount of $13,200 was pledged to cover margin requirements for open futures contracts as of December 31, 2016. |
| ^ | The positions and counterparties herein are as of December 31, 2016. The Funds continually evaluate different counterparties for their transactions and counterparties are subject to change. New counterparties can be added at anytime. |
| ^^ | Rates shown represents discount rate at the time of purchase. |
| * | Reflects the floating financing rate, as of December 31, 2016 on the notional amount of the forward agreement paid to the counterparty or received from the counterparty, excluding any commissions. |
| ** | For forward agreements, a positive amount represents “long” exposure to the underlying commodity. A negative amount represents “short” exposure to the underlying commodity. |
See accompanying notes to financial statements.
B-174
Table of Contents
PROSHARES ULTRA GOLD
SCHEDULE OF INVESTMENTS
DECEMBER 31, 2015
| Principal Amount | Value | |||||||||
| Short-term U.S. government and agency obligations |
| |||||||||
| (103% of shareholders’ equity) |
| |||||||||
| U.S. Treasury Bills^^: |
| |||||||||
| 0.135% due 01/07/16† |
$ | 7,778,000 | $ | 7,777,974 | ||||||
| 0.110% due 01/28/16 |
9,751,000 | 9,750,155 | ||||||||
| 0.000% due 02/04/16† |
1,484,000 | 1,483,891 | ||||||||
| 0.000% due 02/25/16† |
2,659,000 | 2,658,712 | ||||||||
| 0.208% due 03/03/16 |
22,780,000 | 22,776,453 | ||||||||
| 0.240% due 03/17/16 |
1,450,000 | 1,449,721 | ||||||||
| 0.184% due 03/24/16† |
18,286,000 | 18,278,686 | ||||||||
| 0.353% due 05/26/16† |
7,749,000 | 7,736,995 | ||||||||
|
|
|
|||||||||
| Total short-term U.S. government and agency obligations (cost $71,908,280) |
|
$ | 71,912,587 | |||||||
|
|
|
|||||||||
Futures Contracts Purchased††
| Number of Contracts |
Notional Amount at Value |
Unrealized Appreciation (Depreciation) |
||||||||||
| Gold Futures - COMEX, expires February 2016 |
2 | $ | 212,040 | $ | (5,200 | ) | ||||||
Forward Agreements^
| Rate Paid (Received)* |
Settlement Date | Commitment to (Deliver)/Receive |
Notional Amount at Value** |
Unrealized Appreciation (Depreciation) |
||||||||||||||||
| Forward agreements with Citibank, N.A. based on 0.995 Fine Troy Ounce Gold |
0.00 | % | 01/06/16 | $ | 3,000 | $ | 3,179,880 | $ | (4,614 | ) | ||||||||||
| Forward agreements with Deutsche Bank AG based on 0.995 Fine Troy Ounce Gold |
0.35 | 01/06/16 | 63,900 | 67,734,639 | (1,049,383 | ) | ||||||||||||||
| Forward agreements with Goldman Sachs International based on 0.995 Fine Troy Ounce Gold |
0.25 | 01/06/16 | 23,620 | 25,036,255 | (520,730 | ) | ||||||||||||||
| Forward agreements with Societe Generale based on 0.995 Fine Troy Ounce Gold |
0.26 | 01/06/16 | 15,400 | 16,323,384 | (244,992 | ) | ||||||||||||||
| Forward agreements with UBS AG based on 0.995 Fine Troy Ounce Gold |
0.19 | 01/06/16 | 25,700 | 27,240,972 | (430,876 | ) | ||||||||||||||
|
|
|
|||||||||||||||||||
| $ | (2,250,595 | ) | ||||||||||||||||||
|
|
|
|||||||||||||||||||
| † | All or partial amount pledged as collateral for forward agreements and/or futures contracts. |
| †† | Cash collateral in the amount of $8,250 was pledged to cover margin requirements for open futures contracts as of December 31, 2015. |
| ^ | The positions and counterparties herein are as of December 31, 2015. The Funds continually evaluate different counterparties for their transactions and counterparties are subject to change. New counterparties can be added at any time. |
See accompanying notes to financial statements.
B-175
Table of Contents
PROSHARES ULTRA GOLD
SCHEDULE OF INVESTMENTS
DECEMBER 31, 2015
| ^^ | Rates shown represents discount rate at the time of purchase. |
| * | Reflects the floating financing rate, as of December 31, 2015, on the notional amount of the forward agreement paid to the counterparty or received from the counterparty, excluding any commissions. |
| ** | For forward agreements, a positive amount represents “long” exposure to the underlying commodity. A negative amount represents “short” exposure to the underlying commodity. |
See accompanying notes to financial statements.
B-176
Table of Contents
PROSHARES ULTRA GOLD
STATEMENTS OF OPERATIONS
FOR THE YEARS ENDED DECEMBER 31, 2016, 2015 AND 2014
| Year ended December 31, 2016 |
Year ended December 31, 2015 |
Year ended December 31, 2014 |
||||||||||
| Investment Income |
||||||||||||
| Interest |
$ | 249,319 | $ | 42,700 | $ | 54,755 | ||||||
|
|
|
|
|
|
|
|||||||
| Expenses |
||||||||||||
| Management fee |
900,227 | 839,083 | 1,212,064 | |||||||||
| Brokerage commissions and fees |
43 | 41 | 39 | |||||||||
|
|
|
|
|
|
|
|||||||
| Total expenses |
900,270 | 839,124 | 1,212,103 | |||||||||
|
|
|
|
|
|
|
|||||||
| Net investment income (loss) |
(650,951 | ) | (796,424 | ) | (1,157,348 | ) | ||||||
|
|
|
|
|
|
|
|||||||
| Realized and unrealized gain (loss) on investment activity |
||||||||||||
| Net realized gain (loss) on |
||||||||||||
| Futures contracts |
29,500 | (16,180 | ) | (23,260 | ) | |||||||
| Forward agreements |
5,787,065 | (18,589,635 | ) | (9,651,073 | ) | |||||||
| Short-term U.S. government and agency obligations |
(806 | ) | (393 | ) | 1,361 | |||||||
|
|
|
|
|
|
|
|||||||
| Net realized gain (loss) |
5,815,759 | (18,606,208 | ) | (9,672,972 | ) | |||||||
|
|
|
|
|
|
|
|||||||
| Change in net unrealized appreciation/depreciation on |
||||||||||||
| Futures contracts |
(13,760 | ) | (9,780 | ) | 19,140 | |||||||
| Forward agreements |
(2,180,512 | ) | (4,301,749 | ) | 8,864,128 | |||||||
| Short-term U.S. government and agency obligations |
(4,389 | ) | 2,086 | 5,375 | ||||||||
|
|
|
|
|
|
|
|||||||
| Change in net unrealized appreciation/depreciation |
(2,198,661 | ) | (4,309,443 | ) | 8,888,643 | |||||||
|
|
|
|
|
|
|
|||||||
| Net realized and unrealized gain (loss) |
3,617,098 | (22,915,651 | ) | (784,329 | ) | |||||||
|
|
|
|
|
|
|
|||||||
| Net income (loss) |
$ | 2,966,147 | $ | (23,712,075 | ) | $ | (1,941,677 | ) | ||||
|
|
|
|
|
|
|
|||||||
See accompanying notes to financial statements.
B-177
Table of Contents
PROSHARES ULTRA GOLD
STATEMENTS OF CHANGES IN SHAREHOLDERS’ EQUITY
FOR THE YEARS ENDED DECEMBER 31, 2016, 2015 AND 2014
| Year ended December 31, 2016 |
Year ended December 31, 2015 |
Year ended December 31, 2014 |
||||||||||
| Shareholders’ equity, beginning of period |
$ | 69,864,815 | $ | 102,003,345 | $ | 132,017,405 | ||||||
| Addition of 1,050,000, 150,000 and 300,000 shares, respectively |
41,599,776 | 5,401,300 | 13,559,078 | |||||||||
| Redemption of 600,014, 350,000 and 950,000 shares, respectively |
(22,303,538 | ) | (13,827,755 | ) | (41,631,461 | ) | ||||||
|
|
|
|
|
|
|
|||||||
| Net addition (redemption) of 449,986, (200,000) and (650,000) shares, respectively |
19,296,238 | (8,426,455 | ) | (28,072,383 | ) | |||||||
|
|
|
|
|
|
|
|||||||
| Net investment income (loss) |
(650,951 | ) | (796,424 | ) | (1,157,348 | ) | ||||||
| Net realized gain (loss) |
5,815,759 | (18,606,208 | ) | (9,672,972 | ) | |||||||
| Change in net unrealized appreciation/depreciation |
(2,198,661 | ) | (4,309,443 | ) | 8,888,643 | |||||||
|
|
|
|
|
|
|
|||||||
| Net income (loss) |
2,966,147 | (23,712,075 | ) | (1,941,677 | ) | |||||||
|
|
|
|
|
|
|
|||||||
| Shareholders’ equity, end of period |
$ | 92,127,200 | $ | 69,864,815 | $ | 102,003,345 | ||||||
|
|
|
|
|
|
|
|||||||
See accompanying notes to financial statements.
B-178
Table of Contents
PROSHARES ULTRA GOLD
STATEMENTS OF CASH FLOWS
FOR THE YEARS ENDED DECEMBER 31, 2016, 2015 AND 2014
| Year ended December 31, 2016 |
Year ended December 31, 2015 |
Year ended December 31, 2014 |
||||||||||
| Cash flow from operating activities |
||||||||||||
| Net income (loss) |
$ | 2,966,147 | $ | (23,712,075 | ) | $ | (1,941,677 | ) | ||||
| Adjustments to reconcile net income (loss) to net cash provided by (used in) operating activities: |
||||||||||||
| Decrease (Increase) in segregated cash balances with brokers for futures contracts |
(4,950 | ) | 550 | 7,150 | ||||||||
| Purchases of short-term U.S. government and agency obligations |
(406,481,915 | ) | (260,988,119 | ) | (407,203,130 | ) | ||||||
| Proceeds from sales or maturities of short-term U.S government and agency obligations |
383,282,007 | 291,047,782 | 446,217,714 | |||||||||
| Net amortization and accretion on short-term U.S government and agency obligations |
(249,321 | ) | (42,700 | ) | (54,755 | ) | ||||||
| Net realized gain (loss) on investments |
806 | 393 | (1,361 | ) | ||||||||
| Change in unrealized appreciation/depreciation on investments |
2,184,901 | 4,299,663 | (8,869,503 | ) | ||||||||
| Decrease (Increase) in receivable on futures contracts |
80 | (80 | ) | — | ||||||||
| Increase (Decrease) in payable to Sponsor |
15,554 | (28,602 | ) | (25,929 | ) | |||||||
| Increase (Decrease) in payable on futures contracts |
1,280 | (3,260 | ) | 2,960 | ||||||||
|
|
|
|
|
|
|
|||||||
| Net cash provided by (used in) operating activities |
(18,285,411 | ) | 10,573,552 | 28,131,469 | ||||||||
|
|
|
|
|
|
|
|||||||
| Cash flow from financing activities |
||||||||||||
| Proceeds from addition of shares |
41,599,776 | 5,401,300 | 13,559,078 | |||||||||
| Payment on shares redeemed |
(22,303,538 | ) | (15,827,473 | ) | (41,728,968 | ) | ||||||
|
|
|
|
|
|
|
|||||||
| Net cash provided by (used in) financing activities |
19,296,238 | (10,426,173 | ) | (28,169,890 | ) | |||||||
|
|
|
|
|
|
|
|||||||
| Net increase (decrease) in cash |
1,010,827 | 147,379 | (38,421 | ) | ||||||||
| Cash, beginning of period |
251,524 | 104,145 | 142,566 | |||||||||
|
|
|
|
|
|
|
|||||||
| Cash, end of period |
$ | 1,262,351 | $ | 251,524 | $ | 104,145 | ||||||
|
|
|
|
|
|
|
|||||||
See accompanying notes to financial statements.
B-179
Table of Contents
STATEMENTS OF FINANCIAL CONDITION
| December 31, 2016 | December 31, 2015 | |||||||
| Assets |
||||||||
| Cash |
$ | 1,664,601 | $ | 243,900 | ||||
| Segregated cash balances with brokers for futures contracts |
14,300 | 17,160 | ||||||
| Short-term U.S. government and agency obligations (Note 3) (cost $295,296,440 and $238,900,176, respectively) |
295,300,799 | 238,899,626 | ||||||
|
|
|
|
|
|||||
| Total assets |
296,979,700 | 239,160,686 | ||||||
|
|
|
|
|
|||||
| Liabilities and shareholders’ equity |
||||||||
| Liabilities |
||||||||
| Payable on open futures contracts |
2,290 | 1,875 | ||||||
| Payable to Sponsor |
221,281 | 181,068 | ||||||
| Unrealized depreciation on forward agreements |
20,976,189 | 22,561,101 | ||||||
|
|
|
|
|
|||||
| Total liabilities |
21,199,760 | 22,744,044 | ||||||
|
|
|
|
|
|||||
| Commitments and Contingencies (Note 2) |
||||||||
| Shareholders’ equity |
||||||||
| Shareholders’ equity |
275,779,940 | 216,416,642 | ||||||
|
|
|
|
|
|||||
| Total liabilities and shareholders’ equity |
$ | 296,979,700 | $ | 239,160,686 | ||||
|
|
|
|
|
|||||
| Shares outstanding |
8,246,526 | 7,996,533 | ||||||
|
|
|
|
|
|||||
| Net asset value per share |
$ | 33.44 | $ | 27.06 | ||||
|
|
|
|
|
|||||
| Market value per share (Note 2) |
$ | 32.09 | $ | 27.08 | ||||
|
|
|
|
|
|||||
See accompanying notes to financial statements.
B-180
Table of Contents
PROSHARES ULTRA SILVER
SCHEDULE OF INVESTMENTS
DECEMBER 31, 2016
| Principal Amount | Value | |||||||
| Short-term U.S. government and agency obligations |
||||||||
| (107% of shareholders’ equity) |
||||||||
| U.S. Treasury Bills^^: |
||||||||
| 0.318% due 01/05/17† |
$ | 52,000,000 | $ | 51,998,887 | ||||
| 0.354% due 01/12/17† |
68,895,000 | 68,888,200 | ||||||
| 0.339% due 01/19/17† |
27,000,000 | 26,995,021 | ||||||
| 0.371% due 01/26/17 |
2,000,000 | 1,999,470 | ||||||
| 0.394% due 02/02/17† |
9,500,000 | 9,496,715 | ||||||
| 0.452% due 02/09/17† |
76,000,000 | 75,965,633 | ||||||
| 0.423% due 02/16/17† |
36,000,000 | 35,980,420 | ||||||
| 0.491% due 02/23/17† |
6,000,000 | 5,996,005 | ||||||
| 0.493% due 03/23/17 |
18,000,000 | 17,980,448 | ||||||
|
|
|
|||||||
| Total short-term U.S. government and agency obligations (cost $295,296,440) |
$ | 295,300,799 | ||||||
|
|
|
|||||||
Futures Contracts Purchased††
| Number of Contracts |
Notional Amount at Value |
Unrealized Appreciation (Depreciation) |
||||||||||
| Silver Futures - COMEX, expires March 2017 |
2 | $ | 159,890 | $ | (27,360 | ) | ||||||
Forward Agreements^
| Rate Paid (Received)* |
Settlement Date | Commitment to (Deliver)/Receive |
Notional Amount at Value** |
Unrealized Appreciation (Depreciation) |
||||||||||||||||
| Forward agreements with Citibank, N.A. based on 0.999 Fine Troy Ounce Silver |
1.55 | % | 01/10/17 | $ | 12,327,000 | $ | 200,263,209 | $ | (6,946,009 | ) | ||||||||||
| Forward agreements with Goldman Sachs International based on 0.999 Fine Troy Ounce Silver |
1.65 | 01/10/17 | 8,498,800 | 138,066,406 | (5,869,092 | ) | ||||||||||||||
| Forward agreements with Societe Generale S.A. based on 0.999 Fine Troy Ounce Silver |
1.70 | 01/10/17 | 4,484,000 | 72,845,270 | (2,532,729 | ) | ||||||||||||||
| Forward agreements with UBS AG based on 0.999 Fine Troy Ounce Silver |
1.72 | 01/10/17 | 8,632,000 | 140,232,882 | (5,628,359 | ) | ||||||||||||||
|
|
|
|||||||||||||||||||
| $ | (20,976,189 | ) | ||||||||||||||||||
|
|
|
|||||||||||||||||||
| † | All or partial amount pledged as collateral for forward agreements and/or futures contracts. |
| †† | Cash collateral in the amount of $14,300 was pledged to cover margin requirements for open futures contracts as of December 31, 2016. |
| ^ | The positions and counterparties herein are as of December 31, 2016. The Funds continually evaluate different counterparties for their transactions and counterparties are subject to change. New counterparties can be added at anytime. |
| ^^ | Rates shown represents discount rate at the time of purchase. |
| * | Reflects the floating financing rate, as of December 31, 2016, on the notional amount of the forward agreement paid to the counterparty or received from the counterparty, excluding any commissions. |
| ** | For forward agreements, a positive amount represents “long” exposure to the underlying commodity. A negative amount represents “short” exposure to the underlying commodity. |
See accompanying notes to financial statements.
B-181
Table of Contents
PROSHARES ULTRA SILVER
SCHEDULE OF INVESTMENTS
DECEMBER 31, 2015
| Principal Amount | Value | |||||||
| Short-term U.S. government and agency obligations |
||||||||
| (110% of shareholders’ equity) |
||||||||
| U.S. Treasury Bills^^: |
||||||||
| 0.135% due 01/07/16† |
$ | 19,913,000 | $ | 19,912,934 | ||||
| 0.040% due 01/14/16 |
17,050,000 | 17,049,574 | ||||||
| 0.001% due 01/21/16† |
34,041,000 | 34,039,553 | ||||||
| 0.039% due 02/04/16† |
29,869,000 | 29,866,814 | ||||||
| 0.115% due 02/18/16 |
2,811,000 | 2,810,596 | ||||||
| 0.000% due 02/25/16† |
41,656,000 | 41,651,489 | ||||||
| 0.199% due 03/03/16† |
40,444,000 | 40,437,703 | ||||||
| 0.200% due 03/10/16 |
2,873,000 | 2,872,394 | ||||||
| 0.180% due 03/24/16† |
30,018,000 | 30,005,993 | ||||||
| 0.356% due 05/26/16† |
20,284,000 | 20,252,576 | ||||||
|
|
|
|||||||
| Total short-term U.S. government and agency obligations (cost $238,900,176) |
$ | 238,899,626 | ||||||
|
|
|
|||||||
Futures Contracts Purchased††
| Number of Contracts |
Notional Amount at Value |
Unrealized Appreciation (Depreciation) |
||||||||||
| Silver Futures - COMEX, expires March 2016 |
3 | $ | 207,045 | $ | (9,030 | ) | ||||||
Forward Agreements^
| Rate Paid (Received)* |
Settlement Date | Commitment to (Deliver)/Receive |
Notional Amount at Value** |
Unrealized Appreciation (Depreciation) |
||||||||||||||||
| Forward agreements with Deutsche Bank AG based on 0.999 Fine Troy Ounce Silver |
1.10 | % | 01/06/16 | $ | 13,088,000 | $ | 180,899,718 | $ | (9,355,945 | ) | ||||||||||
| Forward agreements with Goldman Sachs International based on 0.999 Fine Troy Ounce Silver |
0.95 | 01/06/16 | 6,855,800 | 94,755,383 | (5,106,853 | ) | ||||||||||||||
| Forward agreements with Societe Generale S.A. based on 0.999 Fine Troy Ounce Silver |
1.00 | 01/06/16 | 3,984,000 | 55,063,661 | (2,704,459 | ) | ||||||||||||||
| Forward agreements with UBS AG based on 0.999 Fine Troy Ounce Silver |
0.99 | 01/06/16 | 7,373,000 | 101,903,708 | (5,393,844 | ) | ||||||||||||||
|
|
|
|||||||||||||||||||
| $ | (22,561,101 | ) | ||||||||||||||||||
|
|
|
|||||||||||||||||||
| † | All or partial amount pledged as collateral for forward agreements and/or futures contracts. |
| †† | Cash collateral in the amount of $17,160 was pledged to cover margin requirements for open futures contracts as of December 31, 2015. |
| ^ | The positions and counterparties herein are as of December 31, 2015. The Funds continually evaluate different counterparties for their transactions and counterparties are subject to change. New counterparties can be added at any time. |
| ^^ | Rates shown represents discount rate at the time of purchase. |
See accompanying notes to financial statements.
B-182
Table of Contents
PROSHARES ULTRA SILVER
SCHEDULE OF INVESTMENTS
DECEMBER 31, 2015
| * | Reflects the floating financing rate, as of December 31, 2015, on the notional amount of the forward agreement paid to the counterparty or received from the counterparty, excluding any commissions. |
| ** | For forward agreements, a positive amount represents “long” exposure to the underlying commodity. A negative amount represents “short” exposure to the underlying commodity. |
See accompanying notes to financial statements.
B-183
Table of Contents
PROSHARES ULTRA SILVER
STATEMENTS OF OPERATIONS
FOR THE YEARS ENDED DECEMBER 31, 2016, 2015 AND 2014
| Year ended December 31, 2016 |
Year ended December 31, 2015 |
Year ended December 31, 2014 |
||||||||||
| Investment Income |
||||||||||||
| Interest |
$ | 842,215 | $ | 156,353 | $ | 179,642 | ||||||
|
|
|
|
|
|
|
|||||||
| Expenses |
||||||||||||
| Management fee |
3,021,562 | 2,664,160 | 4,148,207 | |||||||||
| Brokerage commissions and fees |
45 | 52 | 43 | |||||||||
|
|
|
|
|
|
|
|||||||
| Total expenses |
3,021,607 | 2,664,212 | 4,148,250 | |||||||||
|
|
|
|
|
|
|
|||||||
| Net investment income (loss) |
(2,179,392 | ) | (2,507,859 | ) | (3,968,608 | ) | ||||||
|
|
|
|
|
|
|
|||||||
| Realized and unrealized gain (loss) on investment activity |
||||||||||||
| Net realized gain (loss) on |
||||||||||||
| Futures contracts |
45,750 | (19,600 | ) | (52,451 | ) | |||||||
| Forward agreements |
62,296,691 | (78,289,709 | ) | (155,498,969 | ) | |||||||
| Short-term U.S. government and agency obligations |
145 | (441 | ) | 8,226 | ||||||||
|
|
|
|
|
|
|
|||||||
| Net realized gain (loss) |
62,342,586 | (78,309,750 | ) | (155,543,194 | ) | |||||||
|
|
|
|
|
|
|
|||||||
| Change in net unrealized appreciation/depreciation on |
||||||||||||
| Futures contracts |
(18,330 | ) | (7,470 | ) | 12,640 | |||||||
| Forward agreements |
1,584,912 | (10,165,981 | ) | (9,902,240 | ) | |||||||
| Short-term U.S. government and agency obligations |
4,909 | (9,125 | ) | (11,363 | ) | |||||||
|
|
|
|
|
|
|
|||||||
| Change in net unrealized appreciation/depreciation |
1,571,491 | (10,182,576 | ) | (9,900,963 | ) | |||||||
|
|
|
|
|
|
|
|||||||
| Net realized and unrealized gain (loss) |
63,914,077 | (88,492,326 | ) | (165,444,157 | ) | |||||||
|
|
|
|
|
|
|
|||||||
| Net income (loss) |
$ | 61,734,685 | $ | (91,000,185 | ) | $ | (169,412,765 | ) | ||||
|
|
|
|
|
|
|
|||||||
See accompanying notes to financial statements.
B-184
Table of Contents
PROSHARES ULTRA SILVER
STATEMENTS OF CHANGES IN SHAREHOLDERS’ EQUITY
FOR THE YEARS ENDED DECEMBER 31, 2016, 2015 AND 2014
| Year ended December 31, 2016 |
Year ended December 31, 2015 |
Year ended December 31, 2014 |
||||||||||
| Shareholders’ equity, beginning of period |
$ | 216,416,642 | $ | 291,169,743 | $ | 465,479,519 | ||||||
| Addition of 2,800,000, 2,700,000 and 2,487,500 shares, respectively |
104,165,405 | 96,078,803 | 144,929,400 | |||||||||
|
Redemption of 2,550,007, 2,100,000 and 2,440,974 shares, respectively |
(106,536,792 | ) | (79,831,719 | ) | (149,826,411 | ) | ||||||
|
|
|
|
|
|
|
|||||||
| Net addition (redemption) of 249,993, 600,000 and 46,526 shares, respectively |
(2,371,387 | ) | 16,247,084 | (4,897,011 | ) | |||||||
|
|
|
|
|
|
|
|||||||
| Net investment income (loss) |
(2,179,392 | ) | (2,507,859 | ) | (3,968,608 | ) | ||||||
| Net realized gain (loss) |
62,342,586 | (78,309,750 | ) | (155,543,194 | ) | |||||||
| Change in net unrealized appreciation/depreciation |
1,571,491 | (10,182,576 | ) | (9,900,963 | ) | |||||||
|
|
|
|
|
|
|
|||||||
| Net income (loss) |
61,734,685 | (91,000,185 | ) | (169,412,765 | ) | |||||||
|
|
|
|
|
|
|
|||||||
| Shareholders’ equity, end of period |
$ | 275,779,940 | $ | 216,416,642 | $ | 291,169,743 | ||||||
|
|
|
|
|
|
|
|||||||
See accompanying notes to financial statements.
B-185
Table of Contents
PROSHARES ULTRA SILVER
STATEMENTS OF CASH FLOWS
FOR THE YEARS ENDED DECEMBER 31, 2016, 2015 AND 2014
| Year ended December 31, 2016 |
Year ended December 31, 2015 |
Year ended December 31, 2014 |
||||||||||
| Cash flow from operating activities |
||||||||||||
| Net income (loss) |
$ | 61,734,685 | $ | (91,000,185 | ) | $ | (169,412,765 | ) | ||||
| Adjustments to reconcile net income (loss) to net cash provided by (used in) operating activities: |
||||||||||||
| Decrease (Increase) in segregated cash balances with brokers for futures contracts |
2,860 | (2,860 | ) | 7,700 | ||||||||
| Purchases of short-term U.S. government and agency obligations |
(1,412,194,485 | ) | (835,846,036 | ) | (1,432,093,309 | ) | ||||||
| Proceeds from sales or maturities of short-term U.S government and agency obligations |
1,356,640,583 | 902,567,408 | 1,594,662,608 | |||||||||
| Net amortization and accretion on short-term U.S government and agency obligations |
(842,217 | ) | (156,353 | ) | (177,671 | ) | ||||||
| Net realized gain (loss) on investments |
(145 | ) | 441 | (8,226 | ) | |||||||
| Change in unrealized appreciation/depreciation on investments |
(1,589,821 | ) | 10,175,106 | 9,913,603 | ||||||||
| Increase (Decrease) in payable to Sponsor |
40,213 | (72,982 | ) | (125,078 | ) | |||||||
| Increase (Decrease) in payable on futures contracts |
415 | (4,895 | ) | 4,320 | ||||||||
|
|
|
|
|
|
|
|||||||
| Net cash provided by (used in) operating activities |
3,792,088 | (14,340,356 | ) | 2,771,182 | ||||||||
|
|
|
|
|
|
|
|||||||
| Cash flow from financing activities |
||||||||||||
| Proceeds from addition of shares |
104,165,405 | 96,078,803 | 144,929,400 | |||||||||
| Payment on shares redeemed |
(106,536,792 | ) | (81,799,551 | ) | (147,858,579 | ) | ||||||
|
|
|
|
|
|
|
|||||||
| Net cash provided by (used in) financing activities |
(2,371,387 | ) | 14,279,252 | (2,929,179 | ) | |||||||
|
|
|
|
|
|
|
|||||||
| Net increase (decrease) in cash |
1,420,701 | (61,104 | ) | (157,997 | ) | |||||||
| Cash, beginning of period |
243,900 | 305,004 | 463,001 | |||||||||
|
|
|
|
|
|
|
|||||||
| Cash, end of period |
$ | 1,664,601 | $ | 243,900 | $ | 305,004 | ||||||
|
|
|
|
|
|
|
|||||||
See accompanying notes to financial statements.
B-186
Table of Contents
STATEMENTS OF FINANCIAL CONDITION
| December 31, 2016 | December 31, 2015 | |||||||
| Assets |
||||||||
| Cash |
$ | 606,393 | $ | 227,310 | ||||
| Short-term U.S. government and agency obligations (Note 3) |
11,891,831 | 11,605,262 | ||||||
| Unrealized appreciation on foreign currency forward contracts |
2,548 | 604,920 | ||||||
|
|
|
|
|
|||||
| Total assets |
12,500,772 | 12,437,492 | ||||||
|
|
|
|
|
|||||
| Liabilities and shareholders’ equity |
||||||||
| Liabilities |
||||||||
| Payable for capital shares redeemed |
— | 1,569,718 | ||||||
| Payable to Sponsor |
9,629 | 10,044 | ||||||
| Unrealized depreciation on foreign currency forward contracts |
576,558 | — | ||||||
|
|
|
|
|
|||||
| Total liabilities |
586,187 | 1,579,762 | ||||||
|
|
|
|
|
|||||
| Commitments and Contingencies (Note 2) |
||||||||
| Shareholders’ equity |
||||||||
| Shareholders’ equity |
11,914,585 | 10,857,730 | ||||||
|
|
|
|
|
|||||
| Total liabilities and shareholders’ equity |
$ | 12,500,772 | $ | 12,437,492 | ||||
|
|
|
|
|
|||||
| Shares outstanding |
850,000 | 700,014 | ||||||
|
|
|
|
|
|||||
| Net asset value per share |
$ | 14.02 | $ | 15.51 | ||||
|
|
|
|
|
|||||
| Market value per share (Note 2) |
$ | 14.09 | $ | 15.51 | ||||
|
|
|
|
|
|||||
See accompanying notes to financial statements.
B-187
Table of Contents
PROSHARES ULTRA EURO
SCHEDULE OF INVESTMENTS
DECEMBER 31, 2016
| Principal Amount | Value | |||||||
| Short-term U.S. government and agency obligations |
||||||||
| (100% of shareholders’ equity) |
||||||||
| U.S. Treasury Bills^^: |
||||||||
| 0.295% due 01/05/17† |
$ | 1,000,000 | $ | 999,979 | ||||
| 0.270% due 01/12/17 |
901,000 | 900,911 | ||||||
| 0.299% due 01/19/17† |
2,000,000 | 1,999,631 | ||||||
| 0.493% due 03/23/17 |
8,000,000 | 7,991,310 | ||||||
|
|
|
|||||||
| Total short-term U.S. government and agency obligations (cost $11,891,729) |
$ | 11,891,831 | ||||||
|
|
|
|||||||
Foreign Currency Forward Contracts^
| Settlement Date | Local Currency | Notional Amount at Value (USD) |
Unrealized Appreciation (Depreciation) |
|||||||||||||
| Contracts to Purchase |
||||||||||||||||
| Euro with Goldman Sachs International |
01/13/17 | 9,841,725 | $ | 10,368,169 | $ | (236,099 | ) | |||||||||
| Euro with UBS AG |
01/13/17 | 13,774,600 | 14,511,417 | (337,302 | ) | |||||||||||
|
|
|
|||||||||||||||
| $ | (573,401 | ) | ||||||||||||||
|
|
|
|||||||||||||||
| Contracts to Sell |
||||||||||||||||
| Euro with Goldman Sachs International |
01/13/17 | (717,800 | ) | $ | (756,196 | ) | $ | (3,157 | ) | |||||||
| Euro with UBS AG |
01/13/17 | (264,000 | ) | (278,122 | ) | 2,548 | ||||||||||
|
|
|
|||||||||||||||
| $ | (609 | ) | ||||||||||||||
|
|
|
|||||||||||||||
| † | All or partial amount pledged as collateral for foreign currency forward contracts. |
| ^ | The positions and counterparties herein are as of December 31, 2016. The Funds continually evaluate different counterparties for their transactions and counterparties are subject to change. New counterparties can be added at any time. |
| ^^ | Rates shown represents discount rate at the time of purchase. |
See accompanying notes to financial statements.
B-188
Table of Contents
PROSHARES ULTRA EURO
SCHEDULE OF INVESTMENTS
DECEMBER 31, 2015
| Principal Amount | Value | |||||||
| Short-term U.S. government and agency obligations |
||||||||
| (107% of shareholders’ equity) |
||||||||
| U.S. Treasury Bills^^: |
||||||||
| 0.000% due 01/21/16† |
$ | 7,404,000 | $ | 7,403,685 | ||||
| 0.035% due 02/04/16 |
790,000 | 789,942 | ||||||
| 0.166% due 03/24/16† |
3,413,000 | 3,411,635 | ||||||
|
|
|
|||||||
| Total short-term U.S. government and agency obligations (cost $11,605,665) |
$ | 11,605,262 | ||||||
|
|
|
|||||||
Foreign Currency Forward Contracts^
| Settlement Date | Local Currency | Notional Amount at Value (USD) |
Unrealized Appreciation (Depreciation) |
|||||||||||||
| Contracts to Purchase |
||||||||||||||||
| Euro with Goldman Sachs International |
01/08/16 | 12,451,525 | $ | 13,533,325 | $ | 298,929 | ||||||||||
| Euro with UBS AG |
01/08/16 | 11,518,600 | 12,519,346 | 288,302 | ||||||||||||
|
|
|
|||||||||||||||
| $ | 587,231 | |||||||||||||||
|
|
|
|||||||||||||||
| Contracts to Sell |
||||||||||||||||
| Euro with Goldman Sachs International |
01/08/16 | (3,430,700 | ) | $ | (3,728,762 | ) | $ | 16,425 | ||||||||
| Euro with UBS AG |
01/08/16 | (555,100 | ) | (603,328 | ) | 1,264 | ||||||||||
|
|
|
|||||||||||||||
| $ | 17,689 | |||||||||||||||
|
|
|
|||||||||||||||
| † | All or partial amount pledged as collateral for foreign currency forward contracts. |
| ^ | The positions and counterparties herein are as of December 31, 2015. The Funds continually evaluate different counterparties for their transactions and counterparties are subject to change. New counterparties can be added at any time. |
| ^^ | Rates shown represents discount rate at the time of purchase. |
See accompanying notes to financial statements.
B-189
Table of Contents
PROSHARES ULTRA EURO
STATEMENTS OF OPERATIONS
FOR THE YEARS ENDED DECEMBER 31, 2016, 2015 AND 2014
| Year ended December 31, 2016 |
Year ended December 31, 2015 |
Year ended December 31, 2014 |
||||||||||
| Investment Income |
||||||||||||
| Interest |
$ | 25,015 | $ | 2,797 | $ | 1,083 | ||||||
|
|
|
|
|
|
|
|||||||
| Expenses |
||||||||||||
| Management fee |
99,537 | 106,868 | 23,330 | |||||||||
|
|
|
|
|
|
|
|||||||
| Total expenses |
99,537 | 106,868 | 23,330 | |||||||||
|
|
|
|
|
|
|
|||||||
| Net investment income (loss) |
(74,522 | ) | (104,071 | ) | (22,247 | ) | ||||||
|
|
|
|
|
|
|
|||||||
| Realized and unrealized gain (loss) on investment activity |
||||||||||||
| Net realized gain (loss) on |
||||||||||||
| Foreign currency forward contracts |
138,959 | (1,982,208 | ) | (420,533 | ) | |||||||
| Short-term U.S. government and agency obligations |
154 | (109 | ) | 5 | ||||||||
|
|
|
|
|
|
|
|||||||
| Net realized gain (loss) |
139,113 | (1,982,317 | ) | (420,528 | ) | |||||||
|
|
|
|
|
|
|
|||||||
| Change in net unrealized appreciation/depreciation on |
||||||||||||
| Foreign currency forward contracts |
(1,178,930 | ) | 708,291 | (204,333 | ) | |||||||
| Short-term U.S. government and agency obligations |
505 | (369 | ) | (182 | ) | |||||||
|
|
|
|
|
|
|
|||||||
| Change in net unrealized appreciation/depreciation |
(1,178,425 | ) | 707,922 | (204,515 | ) | |||||||
|
|
|
|
|
|
|
|||||||
| Net realized and unrealized gain (loss) |
(1,039,312 | ) | (1,274,395 | ) | (625,043 | ) | ||||||
|
|
|
|
|
|
|
|||||||
| Net income (loss) |
$ | (1,113,834 | ) | $ | (1,378,466 | ) | $ | (647,290 | ) | |||
|
|
|
|
|
|
|
|||||||
See accompanying notes to financial statements.
B-190
Table of Contents
PROSHARES ULTRA EURO
STATEMENTS OF CHANGES IN SHAREHOLDERS’ EQUITY
FOR THE YEARS ENDED DECEMBER 31, 2016, 2015 AND 2014
| Year ended December 31, 2016 |
Year ended December 31, 2015 |
Year ended December 31, 2014 |
||||||||||
| Shareholders’ equity, beginning of period |
$ | 10,857,730 | $ | 2,981,441 | $ | 2,603,827 | ||||||
| Addition of 300,000, 950,000 and 50,000 shares, respectively |
4,628,749 | 15,916,613 | 1,024,904 | |||||||||
| Redemption of 150,014, 400,000 and 0 shares, respectively |
(2,458,060 | ) | (6,661,858 | ) | — | |||||||
|
|
|
|
|
|
|
|||||||
| Net addition (redemption) of 149,986, 550,000 and 50,000 shares, respectively |
2,170,689 | 9,254,755 | 1,024,904 | |||||||||
|
|
|
|
|
|
|
|||||||
| Net investment income (loss) |
(74,522 | ) | (104,071 | ) | (22,247 | ) | ||||||
| Net realized gain (loss) |
139,113 | (1,982,317 | ) | (420,528 | ) | |||||||
| Change in net unrealized appreciation/depreciation |
(1,178,425 | ) | 707,922 | (204,515 | ) | |||||||
|
|
|
|
|
|
|
|||||||
| Net income (loss) |
(1,113,834 | ) | (1,378,466 | ) | (647,290 | ) | ||||||
|
|
|
|
|
|
|
|||||||
| Shareholders’ equity, end of period |
$ | 11,914,585 | $ | 10,857,730 | $ | 2,981,441 | ||||||
|
|
|
|
|
|
|
|||||||
See accompanying notes to financial statements.
B-191
Table of Contents
PROSHARES ULTRA EURO
STATEMENTS OF CASH FLOWS
FOR THE YEARS ENDED DECEMBER 31, 2016, 2015 AND 2014
| Year ended December 31, 2016 |
Year ended December 31, 2015 |
Year ended December 31, 2014 |
||||||||||
| Cash flow from operating activities |
||||||||||||
| Net income (loss) |
$ | (1,113,834 | ) | $ | (1,378,466 | ) | $ | (647,290 | ) | |||
| Adjustments to reconcile net income (loss) to net cash provided by (used in) operating activities: |
||||||||||||
| Purchases of short-term U.S. government and agency obligations |
(48,066,675 | ) | (42,137,395 | ) | (7,297,855 | ) | ||||||
| Proceeds from sales or maturities of short-term U.S government and agency obligations |
47,805,780 | 32,950,150 | 7,338,926 | |||||||||
|
Net amortization and accretion on short-term U.S government and agency obligations |
(25,015 | ) | (2,797 | ) | (1,083 | ) | ||||||
| Net realized gain (loss) on investments |
(154 | ) | 109 | (5 | ) | |||||||
| Change in unrealized appreciation/depreciation on investments |
1,178,425 | (707,922 | ) | 204,515 | ||||||||
| Increase (Decrease) in payable to Sponsor |
(415 | ) | 8,041 | (718 | ) | |||||||
|
|
|
|
|
|
|
|||||||
| Net cash provided by (used in) operating activities |
(221,888 | ) | (11,268,280 | ) | (403,510 | ) | ||||||
|
|
|
|
|
|
|
|||||||
| Cash flow from financing activities |
||||||||||||
| Proceeds from addition of shares |
4,628,749 | 15,916,613 | 1,024,904 | |||||||||
| Payment on shares redeemed |
(4,027,778 | ) | (5,092,140 | ) | — | |||||||
|
|
|
|
|
|
|
|||||||
| Net cash provided by (used in) financing activities |
600,971 | 10,824,473 | 1,024,904 | |||||||||
|
|
|
|
|
|
|
|||||||
| Net increase (decrease) in cash |
379,083 | (443,807 | ) | 621,394 | ||||||||
| Cash, beginning of period |
227,310 | 671,117 | 49,723 | |||||||||
|
|
|
|
|
|
|
|||||||
| Cash, end of period |
$ | 606,393 | $ | 227,310 | $ | 671,117 | ||||||
|
|
|
|
|
|
|
|||||||
See accompanying notes to financial statements.
B-192
Table of Contents
STATEMENTS OF FINANCIAL CONDITION
| December 31, 2016 | December 31, 2015 | |||||||
| Assets |
||||||||
| Cash |
$ | 604,691 | $ | 147,371 | ||||
| Short-term U.S. government and agency obligations (Note 3) (cost $5,283,104 and $5,069,206, respectively) |
5,282,879 | 5,069,491 | ||||||
| Unrealized appreciation on foreign currency forward contracts |
379 | 267,014 | ||||||
|
|
|
|
|
|||||
| Total assets |
5,887,949 | 5,483,876 | ||||||
|
|
|
|
|
|||||
| Liabilities and shareholders’ equity |
||||||||
| Liabilities |
||||||||
| Payable to Sponsor |
4,537 | 4,325 | ||||||
| Unrealized depreciation on foreign currency forward contracts |
342,455 | 5,703 | ||||||
|
|
|
|
|
|||||
| Total liabilities |
346,992 | 10,028 | ||||||
|
|
|
|
|
|||||
| Commitments and Contingencies (Note 2) |
||||||||
| Shareholders’ equity |
||||||||
| Shareholders’ equity |
5,540,957 | 5,473,848 | ||||||
|
|
|
|
|
|||||
| Total liabilities and shareholders’ equity |
$ | 5,887,949 | $ | 5,483,876 | ||||
|
|
|
|
|
|||||
| Shares outstanding |
99,970 | 99,974 | ||||||
|
|
|
|
|
|||||
| Net asset value per share |
$ | 55.43 | $ | 54.75 | ||||
|
|
|
|
|
|||||
| Market value per share (Note 2) |
$ | 55.52 | $ | 54.70 | ||||
|
|
|
|
|
|||||
See accompanying notes to financial statements.
B-193
Table of Contents
PROSHARES ULTRA YEN
SCHEDULE OF INVESTMENTS
DECEMBER 31, 2016
| Principal Amount | Value | |||||||
| Short-term U.S. government and agency obligations |
|
|||||||
| (95% of shareholders’ equity) |
|
|||||||
| U.S. Treasury Bills^^: |
||||||||
| 0.210% due 01/05/17† |
$ | 150,000 | $ | 149,997 | ||||
| 0.270% due 01/12/17 |
480,000 | 479,953 | ||||||
| 0.311% due 01/26/17† |
1,655,000 | 1,654,561 | ||||||
| 0.390% due 02/16/17 |
3,000,000 | 2,998,368 | ||||||
|
|
|
|||||||
| Total short-term U.S. government and agency obligations (cost $5,283,104) |
$ | 5,282,879 | ||||||
|
|
|
|||||||
Foreign Currency Forward Contracts^
| Settlement Date | Local Currency | Notional Amount at Value (USD) |
Unrealized Appreciation (Depreciation) |
|||||||||||||
| Contracts to Purchase |
||||||||||||||||
| Yen with Goldman Sachs International |
01/13/17 | 884,408,200 | $ | 7,572,024 | $ | (220,115 | ) | |||||||||
| Yen with UBS AG |
01/13/17 | 470,179,000 | 4,025,524 | (122,340 | ) | |||||||||||
|
|
|
|||||||||||||||
| $ | (342,455 | ) | ||||||||||||||
|
|
|
|||||||||||||||
| Contracts to Sell |
||||||||||||||||
| Yen with Goldman Sachs International |
01/13/17 | (57,041,600 | ) | $ | (488,372 | ) | $ | 379 | ||||||||
|
|
|
|||||||||||||||
| $ | 379 | |||||||||||||||
|
|
|
|||||||||||||||
| † | All or partial amount pledged as collateral for foreign currency forward contracts. |
| ^ | The positions and counterparties herein are as of December 31, 2016. The Funds continually evaluate different counterparties for their transactions and counterparties are subject to change. New counterparties can be added at anytime. |
| ^^ | Rates shown represents discount rate at the time of purchase. |
See accompanying notes to financial statements.
B-194
Table of Contents
PROSHARES ULTRA YEN
SCHEDULE OF INVESTMENTS
DECEMBER 31, 2015
| Principal Amount | Value | |||||||
| Short-term U.S. government and agency obligations |
||||||||
| (93% of shareholders’ equity) |
||||||||
| U.S. Treasury Bills^^: |
||||||||
| 0.165% due 01/28/16† |
$ | 3,811,000 | $ | 3,810,670 | ||||
| 0.000% due 02/25/16 |
360,000 | 359,961 | ||||||
| 0.208% due 03/03/16 |
899,000 | 898,860 | ||||||
|
|
|
|||||||
| Total short-term U.S. government and agency obligations (cost $5,069,206) |
$ | 5,069,491 | ||||||
|
|
|
|||||||
Foreign Currency Forward Contracts^
| Settlement Date | Local Currency | Notional Amount at Value (USD) |
Unrealized Appreciation (Depreciation) |
|||||||||
| Contracts to Purchase |
||||||||||||
| Yen with Goldman Sachs International |
01/08/16 | 866,666,900 | $ | 7,210,368 | $ | 172,891 | ||||||
| Yen with UBS AG |
01/08/16 | 488,922,300 | 4,067,664 | 94,123 | ||||||||
|
|
|
|||||||||||
| $ | 267,014 | |||||||||||
|
|
|
|||||||||||
| Contracts to Sell |
||||||||||||
| Yen with Goldman Sachs International |
01/08/16 | (18,830,800) | $ | (156,666 | ) | $ | (3,104 | ) | ||||
| Yen with UBS AG |
01/08/16 | (21,100,300) | (175,547 | ) | (2,599 | ) | ||||||
|
|
|
|||||||||||
| $ | (5,703 | ) | ||||||||||
|
|
|
|||||||||||
| † | All or partial amount pledged as collateral for foreign currency forward contracts. |
| ^ | The positions and counterparties herein are as of December 31, 2015. The Funds continually evaluate different counterparties for their transactions and counterparties are subject to change. New counterparties can be added at any time. |
| ^^ | Rates shown represents discount rate at the time of purchase. |
See accompanying notes to financial statements.
B-195
Table of Contents
PROSHARES ULTRA YEN
STATEMENTS OF OPERATIONS
FOR THE YEARS ENDED DECEMBER 31, 2016, 2015 AND 2014
| Year ended December 31, 2016 |
Year ended December 31, 2015 |
Year ended December 31, 2014 |
||||||||||
| Investment Income |
||||||||||||
| Interest |
$ | 16,858 | $ | 3,609 | $ | 1,101 | ||||||
|
|
|
|
|
|
|
|||||||
| Expenses |
||||||||||||
| Management fee |
62,705 | 48,032 | 21,963 | |||||||||
|
|
|
|
|
|
|
|||||||
| Total expenses |
62,705 | 48,032 | 21,963 | |||||||||
|
|
|
|
|
|
|
|||||||
| Net investment income (loss) |
(45,847 | ) | (44,423 | ) | (20,862 | ) | ||||||
|
|
|
|
|
|
|
|||||||
| Realized and unrealized gain (loss) on investment activity |
||||||||||||
| Net realized gain (loss) on |
||||||||||||
| Foreign currency forward contracts |
717,086 | (472,913 | ) | (540,398 | ) | |||||||
| Short-term U.S. government and agency obligations |
(34 | ) | 6 | 94 | ||||||||
|
|
|
|
|
|
|
|||||||
| Net realized gain (loss) |
717,052 | (472,907 | ) | (540,304 | ) | |||||||
|
|
|
|
|
|
|
|||||||
| Change in net unrealized appreciation/depreciation on |
||||||||||||
| Foreign currency forward contracts |
(603,387 | ) | 276,556 | 144,064 | ||||||||
| Short-term U.S. government and agency obligations |
(510 | ) | 260 | (289 | ) | |||||||
|
|
|
|
|
|
|
|||||||
| Change in net unrealized appreciation/depreciation |
(603,897 | ) | 276,816 | 143,775 | ||||||||
|
|
|
|
|
|
|
|||||||
| Net realized and unrealized gain (loss) |
113,155 | (196,091 | ) | (396,529 | ) | |||||||
|
|
|
|
|
|
|
|||||||
| Net income (loss) |
$ | 67,308 | $ | (240,514 | ) | $ | (417,391 | ) | ||||
|
|
|
|
|
|
|
|||||||
See accompanying notes to financial statements.
B-196
Table of Contents
PROSHARES ULTRA YEN
STATEMENTS OF CHANGES IN SHAREHOLDERS’ EQUITY
FOR THE YEARS ENDED DECEMBER 31, 2016, 2015 AND 2014
| Year ended December 31, 2016 |
Year ended December 31, 2015 |
Year ended December 31, 2014 |
||||||||||
| Shareholders’ equity, beginning of period |
$ | 5,473,848 | $ | 2,118,028 | $ | 2,795,026 | ||||||
| Addition of 0, 75,000 and 12,500 shares, respectively (Note 1) |
— | 4,285,016 | 716,043 | |||||||||
| Redemption of 4, 12,530 and 12,500 shares, respectively (Note 1) |
(199 | ) | (688,682 | ) | (975,650 | ) | ||||||
|
|
|
|
|
|
|
|||||||
| Net addition (redemption) of (4), 62,470 and 0 shares, respectively (Note 1) |
(199 | ) | 3,596,334 | (259,607 | ) | |||||||
|
|
|
|
|
|
|
|||||||
| Net investment income (loss) |
(45,847 | ) | (44,423 | ) | (20,862 | ) | ||||||
| Net realized gain (loss) |
717,052 | (472,907 | ) | (540,304 | ) | |||||||
| Change in net unrealized appreciation/depreciation |
(603,897 | ) | 276,816 | 143,775 | ||||||||
|
|
|
|
|
|
|
|||||||
| Net income (loss) |
67,308 | (240,514 | ) | (417,391 | ) | |||||||
|
|
|
|
|
|
|
|||||||
| Shareholders’ equity, end of period |
$ | 5,540,957 | $ | 5,473,848 | $ | 2,118,028 | ||||||
|
|
|
|
|
|
|
|||||||
See accompanying notes to financial statements.
B-197
Table of Contents
PROSHARES ULTRA YEN
STATEMENTS OF CASH FLOWS
FOR THE YEARS ENDED DECEMBER 31, 2016, 2015 AND 2014
| Year ended December 31, 2016 |
Year ended December 31, 2015 |
Year ended December 31, 2014 |
||||||||||
| Cash flow from operating activities |
||||||||||||
| Net income (loss) |
$ | 67,308 | $ | (240,514 | ) | $ | (417,391 | ) | ||||
| Adjustments to reconcile net income (loss) to net cash provided by (used in) operating activities: |
||||||||||||
| Purchases of short-term U.S. government and agency obligations |
(28,924,289 | ) | (12,557,564 | ) | (5,540,122 | ) | ||||||
| Proceeds from sales or maturities of short-term U.S government and agency obligations |
28,727,215 | 8,779,817 | 7,181,715 | |||||||||
| Net amortization and accretion on short-term U.S government and agency obligations |
(16,858 | ) | (3,609 | ) | (1,101 | ) | ||||||
| Net realized gain (loss) on investments |
34 | (6 | ) | (94 | ) | |||||||
| Change in unrealized appreciation/depreciation on investments |
603,897 | (276,816 | ) | (143,775 | ) | |||||||
| Increase (Decrease) in payable to Sponsor |
212 | 2,810 | (822 | ) | ||||||||
|
|
|
|
|
|
|
|||||||
| Net cash provided by (used in) operating activities |
457,519 | (4,295,882 | ) | 1,078,410 | ||||||||
|
|
|
|
|
|
|
|||||||
| Cash flow from financing activities |
||||||||||||
| Proceeds from addition of shares |
— | 4,285,016 | 716,043 | |||||||||
| Payment on shares redeemed |
(199 | ) | (688,682 | ) | (975,650 | ) | ||||||
|
|
|
|
|
|
|
|||||||
| Net cash provided by (used in) financing activities |
(199 | ) | 3,596,334 | (259,607 | ) | |||||||
|
|
|
|
|
|
|
|||||||
| Net increase (decrease) in cash |
457,320 | (699,548 | ) | 818,803 | ||||||||
| Cash, beginning of period |
147,371 | 846,919 | 28,116 | |||||||||
|
|
|
|
|
|
|
|||||||
| Cash, end of period |
$ | 604,691 | $ | 147,371 | $ | 846,919 | ||||||
|
|
|
|
|
|
|
|||||||
See accompanying notes to financial statements.
B-198
Table of Contents
COMBINED STATEMENTS OF FINANCIAL CONDITION
| December 31, 2016 | December 31, 2015 | |||||||
| Assets |
||||||||
| Cash |
$ | 39,482,473 | $ | 48,049,225 | ||||
| Segregated cash balances with brokers for futures contracts |
180,212,984 | 261,083,712 | ||||||
| Short-term U.S. government and agency obligations (Note 3) (cost $3,038,837,465 and $3,313,585,456, respectively) |
3,038,848,441 | 3,313,591,600 | ||||||
| Unrealized appreciation on swap agreements |
55,358,571 | 6,669,519 | ||||||
| Unrealized appreciation on forward agreements |
4,417,812 | 6,587,221 | ||||||
| Unrealized appreciation on foreign currency forward contracts |
33,392,354 | 1,805,661 | ||||||
| Receivable from capital shares sold |
— | 48,046,138 | ||||||
| Receivable on open futures contracts |
41,862,862 | 27,655,327 | ||||||
|
|
|
|
|
|||||
| Total assets |
3,393,575,497 | 3,713,488,403 | ||||||
|
|
|
|
|
|||||
| Liabilities and shareholders’ equity |
||||||||
| Liabilities |
||||||||
| Payable for capital shares redeemed |
71,525,035 | 60,119,975 | ||||||
| Payable on open futures contracts |
3,972,621 | 3,078,269 | ||||||
| Brokerage commissions and fees payable |
2,909 | 39,148 | ||||||
| Payable to Sponsor |
2,722,696 | 2,839,305 | ||||||
| Unrealized depreciation on swap agreements |
12,206,881 | 72,446,044 | ||||||
| Unrealized depreciation on forward agreements |
25,407,296 | 24,811,696 | ||||||
| Unrealized depreciation on foreign currency forward contracts |
1,400,572 | 43,545,218 | ||||||
|
|
|
|
|
|||||
| Total liabilities |
117,238,010 | 206,879,655 | ||||||
|
|
|
|
|
|||||
| Commitments and Contingencies (Note 2) |
||||||||
| Shareholders’ equity |
||||||||
| Shareholders’ equity |
3,276,337,487 | 3,506,608,748 | ||||||
|
|
|
|
|
|||||
| Total liabilities and shareholders’ equity |
$ | 3,393,575,497 | $ | 3,713,488,403 | ||||
|
|
|
|
|
|||||
| Shares outstanding |
102,788,942 | 87,793,127 | ||||||
|
|
|
|
|
|||||
See accompanying notes to financial statements.
B-199
Table of Contents
PROSHARES TRUST II
COMBINED STATEMENTS OF OPERATIONS
FOR THE YEARS ENDED DECEMBER 31, 2016, 2015 AND 2014
| Year ended December 31, 2016* |
Year ended December 31, 2015** |
Year ended December 31, 2014 |
||||||||||
| Investment Income |
||||||||||||
| Interest |
$ | 9,133,928 | $ | 1,546,729 | $ | 1,151,784 | ||||||
|
|
|
|
|
|
|
|||||||
| Expenses |
||||||||||||
| Management fee |
34,712,239 | 35,055,606 | 27,669,705 | |||||||||
| Brokerage commissions and fees |
7,438,871 | 6,480,284 | 4,580,430 | |||||||||
| Offering costs |
— | 59,479 | 16,401 | |||||||||
| Limitation by Sponsor |
— | (11,814 | ) | (9,474 | ) | |||||||
|
|
|
|
|
|
|
|||||||
| Total expenses |
42,151,110 | 41,583,555 | 32,257,062 | |||||||||
|
|
|
|
|
|
|
|||||||
| Net investment income (loss) |
(33,017,182 | ) | (40,036,826 | ) | (31,105,278 | ) | ||||||
|
|
|
|
|
|
|
|||||||
| Realized and unrealized gain (loss) on investment activity |
||||||||||||
| Net realized gain (loss) on |
||||||||||||
| Futures contracts |
(1,286,470,453 | ) | (675,706,798 | ) | (136,360,050 | ) | ||||||
| Swap agreements |
(25,398,375 | ) | (553,434,721 | ) | (79,470,613 | ) | ||||||
| Forward agreements |
38,357,981 | (73,443,689 | ) | (155,407,226 | ) | |||||||
| Foreign currency forward contracts |
(47,075,744 | ) | 138,005,915 | 210,564,249 | ||||||||
| Short-term U.S. government and agency obligations |
(15,768 | ) | 47,732 | 123,212 | ||||||||
|
|
|
|
|
|
|
|||||||
| Net realized gain (loss) |
(1,320,602,359 | ) | (1,164,531,561 | ) | (160,550,428 | ) | ||||||
|
|
|
|
|
|
|
|||||||
| Change in net unrealized appreciation/depreciation on |
||||||||||||
| Futures contracts |
(22,030,613 | ) | 40,193,356 | 9,175,329 | ||||||||
| Swap agreements |
108,928,215 | (16,849,426 | ) | (48,539,505 | ) | |||||||
| Forward agreements |
(2,765,009 | ) | (6,192,684 | ) | (6,131,133 | ) | ||||||
| Foreign currency forward contracts |
73,731,339 | (56,805,160 | ) | (514,227 | ) | |||||||
| Short-term U.S. government and agency obligations |
4,832 | (46,135 | ) | (73,469 | ) | |||||||
|
|
|
|
|
|
|
|||||||
| Change in net unrealized appreciation/depreciation |
157,868,764 | (39,700,049 | ) | (46,083,005 | ) | |||||||
|
|
|
|
|
|
|
|||||||
| Net realized and unrealized gain (loss) |
(1,162,733,595 | ) | (1,204,231,610 | ) | (206,633,433 | ) | ||||||
|
|
|
|
|
|
|
|||||||
| Net income (loss) |
$ | (1,195,750,777 | ) | $ | (1,244,268,436 | ) | $ | (237,738,711 | ) | |||
|
|
|
|
|
|
|
|||||||
| * | The operations include the activity of: ProShares Managed Futures Strategy through March 30, 2016, and ProShares UltraShort Bloomberg Commodity and ProShares Ultra Bloomberg Commodity through September 1, 2016, the date of liquidation, respectively. See Note 1. |
| ** | The operations include the activity of ProShares Ultra Australian Dollar through June 29, 2015, the date of liquidation, respectively. See Note 1. |
See accompanying notes to financial statements.
B-200
Table of Contents
PROSHARES TRUST II
COMBINED STATEMENTS OF CHANGES IN SHAREHOLDERS’ EQUITY
FOR THE YEARS ENDED DECEMBER 31, 2016, 2015 AND 2014
| Year ended December 31, 2016* |
Year ended December 31, 2015** |
Year ended December 31, 2014 |
||||||||||
| Shareholders’ equity, beginning of period |
$ | 3,506,608,748 | $ | 3,332,060,486 | $ | 3,082,207,084 | ||||||
| Addition of 191,098,000, 119,309,700 and 78,857,360 shares, respectively |
10,633,008,985 | 8,943,932,891 | 5,351,585,350 | |||||||||
| Redemption of 176,102,185, 94,955,635 and 86,585,739 shares, respectively |
(9,667,529,469 | ) | (7,525,116,193 | ) | (4,863,993,237 | ) | ||||||
|
|
|
|
|
|
|
|||||||
| Net addition (redemption) of 14,995,815, 24,354,065 and (7,728,379) shares, respectively |
965,479,516 | 1,418,816,698 | 487,592,113 | |||||||||
|
|
|
|
|
|
|
|||||||
| Net investment income (loss) |
(33,017,182 | ) | (40,036,826 | ) | (31,105,278 | ) | ||||||
| Net realized gain (loss) |
(1,320,602,359 | ) | (1,164,531,561 | ) | (160,550,428 | ) | ||||||
| Change in net unrealized appreciation/depreciation |
157,868,764 | (39,700,049 | ) | (46,083,005 | ) | |||||||
|
|
|
|
|
|
|
|||||||
| Net income (loss) |
(1,195,750,777 | ) | (1,244,268,436 | ) | (237,738,711 | ) | ||||||
|
|
|
|
|
|
|
|||||||
| Shareholders’ equity, end of period |
$ | 3,276,337,487 | $ | 3,506,608,748 | $ | 3,332,060,486 | ||||||
|
|
|
|
|
|
|
|||||||
| * | The operations include the activity of: ProShares Managed Futures Strategy through March 30, 2016, and ProShares UltraShort Bloomberg Commodity and ProShares Ultra Bloomberg Commodity through September 1, 2016, the date of liquidation, respectively. See Note 1. |
| ** | The operations include the activity of ProShares Ultra Australian Dollar through June 29, 2015, the date of liquidation, respectively. See Note 1. |
See accompanying notes to financial statements.
B-201
Table of Contents
PROSHARES TRUST II
COMBINED STATEMENTS OF CASH FLOWS
FOR THE YEARS ENDED DECEMBER 31, 2016, 2015 AND 2014
| Year ended December 31, 2016* |
Year ended December 31, 2015** |
Year ended December 31, 2014 |
||||||||||
| Cash flow from operating activities |
||||||||||||
| Net income (loss) |
$ | (1,195,750,777 | ) | $ | (1,244,268,436 | ) | $ | (237,738,711 | ) | |||
| Adjustments to reconcile net income (loss) to net cash provided by (used in) operating activities: |
||||||||||||
| Decrease (Increase) in segregated cash balances with brokers for futures contracts |
80,870,728 | 35,477,903 | (61,515,085 | ) | ||||||||
| Purchases of short-term U.S. government and agency obligations |
(18,373,450,463 | ) | (17,070,603,480 | ) | (12,667,505,150 | ) | ||||||
| Proceeds from sales or maturities of short-term U.S government and agency obligations |
18,657,310,693 | 16,764,420,326 | 12,509,293,100 | |||||||||
| Net amortization and accretion on short-term U.S government and agency obligations |
(9,128,007 | ) | (1,530,269 | ) | (1,148,962 | ) | ||||||
| Net realized gain (loss) on investments |
15,768 | (47,732 | ) | (123,212 | ) | |||||||
| Change in unrealized appreciation/depreciation on investments |
(179,899,377 | ) | 79,893,405 | 55,258,334 | ||||||||
| Decrease (Increase) in receivable on futures contracts |
(14,207,535 | ) | 28,346,999 | (49,071,751 | ) | |||||||
| Decrease (Increase) in Limitation by Sponsor |
— | 9,474 | (9,474 | ) | ||||||||
| Change in offering cost |
— | 49,384 | (49,384 | ) | ||||||||
| Increase (Decrease) in payable to Sponsor |
(116,609 | ) | 181,800 | 134,637 | ||||||||
| Increase (Decrease) in brokerage commissions and fees payable |
(36,239 | ) | 39,148 | — | ||||||||
| Increase (Decrease) in payable on futures contracts |
894,352 | (43,327,729 | ) | 36,334,537 | ||||||||
| Increase (Decrease) in payable for offering costs |
— | (65,785 | ) | 65,785 | ||||||||
|
|
|
|
|
|
|
|||||||
| Net cash provided by (used in) operating activities |
(1,033,497,466 | ) | (1,451,424,992 | ) | (416,075,336 | ) | ||||||
|
|
|
|
|
|
|
|||||||
| Cash flow from financing activities |
||||||||||||
| Proceeds from addition of shares |
10,681,055,123 | 8,953,972,200 | 5,304,403,567 | |||||||||
| Payment on shares redeemed |
(9,656,124,409 | ) | (7,490,397,088 | ) | (4,875,819,732 | ) | ||||||
|
|
|
|
|
|
|
|||||||
| Net cash provided by (used in) financing activities |
1,024,930,714 | 1,463,575,112 | 428,583,835 | |||||||||
|
|
|
|
|
|
|
|||||||
| Net increase (decrease) in cash |
(8,566,752 | ) | 12,150,120 | 12,508,499 | ||||||||
| Cash, beginning of period |
48,049,351 | 35,899,231 | 23,390,732 | |||||||||
|
|
|
|
|
|
|
|||||||
| Cash, end of period |
$ | 39,482,599 | $ | 48,049,351 | $ | 35,899,231 | ||||||
|
|
|
|
|
|
|
|||||||
| * | The operations include the activity of: ProShares Managed Futures Strategy through March 30, 2016, and ProShares UltraShort Bloomberg Commodity and ProShares Ultra Bloomberg Commodity through September 1, 2016, the date of liquidation, respectively. See Note 1. |
| ** | The operations include the activity of ProShares Ultra Australian Dollar through June 29, 2015, the date of liquidation, respectively. See Note 1. |
See accompanying notes to financial statements.
B-202
Table of Contents
NOTES TO FINANCIAL STATEMENTS
December 31, 2016
NOTE 1 – ORGANIZATION
ProShares Trust II (formerly known as the Commodities and Currencies Trust) (the “Trust”) is a Delaware statutory trust formed on October 9, 2007 and is currently organized into separate series (each, a “Fund” and collectively, the “Funds”). As of December 31, 2016, the following eighteen series of the Trust have commenced investment operations: (i) ProShares VIX Short-Term Futures ETF and ProShares VIX Mid-Term Futures ETF (each, a “Matching VIX Fund” and collectively, the “Matching VIX Funds”); (ii) ProShares Short VIX Short-Term Futures ETF and ProShares Ultra VIX Short-Term Futures ETF (each, a “Geared VIX Fund” and collectively, the “Geared VIX Funds”); (iii) ProShares UltraShort Bloomberg Crude Oil, ProShares UltraShort Bloomberg Natural Gas, ProShares UltraShort Gold, ProShares UltraShort Silver, ProShares UltraShort Australian Dollar, ProShares UltraShort Euro, ProShares UltraShort Yen, ProShares Ultra Bloomberg Crude Oil, ProShares Ultra Bloomberg Natural Gas, ProShares Ultra Gold, ProShares Ultra Silver, ProShares Ultra Euro and ProShares Ultra Yen (each, a “Leveraged Fund” and collectively, the “Leveraged Funds”); and (iv) ProShares Short Euro (the “Short Euro Fund”). Each of the Funds listed above issues common units of beneficial interest (“Shares”), which represent units of fractional undivided beneficial interest in and ownership of only that Fund. The Shares of each Fund are listed on the New York Stock Exchange Archipelago (“NYSE Arca”). The Leveraged Funds, the Short Euro Fund and the Geared VIX Funds, are collectively referred to as the “Geared Funds” in these Notes to Financial Statements. The Geared VIX Funds and the Matching VIX Funds are collectively referred to as the “VIX Funds” in these Notes to Financial Statements.
On February 18, 2016, the Trust announced plans to liquidate ProShares Managed Futures Strategy (ticker symbol: FUTS). ProShares Managed Futures Strategy was closed to purchases and redemptions as of the close of regular trading on the NYSE Arca on March 18, 2016. Beginning March 21, 2016, no secondary market for ProShares Managed Futures Strategy’s Shares remained. Proceeds of the liquidation were distributed to shareholders on March 30, 2016. Any shareholders remaining in the fund on March 30, 2016 automatically had their shares redeemed for cash at ProShares Managed Futures Strategy’s net asset value per Share as of March 21, 2016. On March 31, 2016, the NYSE Arca filed a Form 25 removing the listing of ProShares Managed Futures Strategy on the NYSE Arca. On April 11, 2016 a Form 15 was filed with the SEC terminating the registration of ProShares Managed Futures Strategy.
On July 25, 2016, the Trust announced plans to liquidate ProShares Ultra Bloomberg Commodity (ticker symbol: UCD) and ProShares UltraShort Bloomberg Commodity (ticker symbol: CMD). ProShares Ultra Bloomberg Commodity and UltraShort Bloomberg Commodity were closed to purchases and redemptions as of the close of regular trading on the NYSE Arca on August 25, 2016. Beginning August 26, 2016, no secondary market for ProShares Ultra Bloomberg Commodity’s and ProShares UltraShort Bloomberg Commodity’s Shares remained. Proceeds of the liquidation were distributed to shareholders on September 1, 2016. Any shareholders remaining in each liquidating Fund on September 1, 2016 automatically had their shares redeemed for cash at each liquidating Fund’s net asset value per Share as of August 26, 2016. On September 2, 2016, the NYSE Arca filed a Form 25 removing the listing of ProShares Ultra Bloomberg Commodity and UltraShort Bloomberg Commodity on the NYSE Arca. On September 27, 2016, a Form 15 was filed with the SEC terminating the registration of ProShares Ultra Bloomberg Commodity and ProShares UltraShort Bloomberg Commodity.
The Trust had no operations prior to November 24, 2008, other than matters relating to its organization, the registration of each series under the Securities Act of 1933, as amended, and the sale and issuance to ProShare Capital Management LLC (the “Sponsor”) of fourteen Shares at an aggregate purchase price of $350 in each of the following Funds: ProShares UltraShort Bloomberg Crude Oil, ProShares UltraShort Gold, ProShares UltraShort Silver, ProShares UltraShort Euro, ProShares UltraShort Yen, ProShares Ultra Bloomberg Crude Oil, ProShares Ultra Gold, ProShares Ultra Silver, ProShares Ultra Euro and ProShares Ultra Yen.
B-203
Table of Contents
Groups of Funds are collectively referred to in several different ways. References to “Short Funds,” “UltraShort Funds,” or “Ultra Funds” refer to the different Funds based upon their investment objectives, but without distinguishing among the Funds’ benchmarks.
References to “Commodity Index Funds,” “Commodity Funds” and “Currency Funds” refer to the different Funds according to their general benchmark categories without distinguishing among the Funds’ investment objectives or Fund-specific benchmarks. References to “VIX Funds” refer to the different Funds based upon their investment objective and their general benchmark categories.
Each “Short” Fund seeks daily investment results (before fees and expenses) that correspond to the inverse (-1x) of the daily performance of its corresponding benchmark. Each “UltraShort” Fund seeks daily investment results (before fees and expenses) that correspond to two times the inverse (-2x) of the daily performance of its corresponding benchmark. Each “Ultra” Fund seeks daily investment results (before fees and expenses) that correspond to two times (2x) the daily performance of its corresponding benchmark. Each Matching VIX Fund seeks investment results (before fees and expenses), both over a single day and over time, that match the performance of its corresponding benchmark. Daily performance is measured from the calculation of one NAV to the next.
The Geared Funds do not seek to achieve their stated investment objective over a period of time greater than a single day because mathematical compounding prevents the Geared Funds from achieving such results. Accordingly, results over periods of time greater than a single day should not be expected to be a simple multiple (e.g., -1x, -2x or 2x) of the period return of the corresponding benchmark and will likely differ significantly.
Each of the Funds generally invests in Financial Instruments (i.e., instruments whose value is derived from the value of an underlying asset, rate or index, including futures contracts, swap agreements, forward contracts and other instruments) as a substitute for investing directly in commodities, currencies, or spot volatility products in order to gain exposure to its applicable underlying commodity futures index, commodity, currency exchange rate or equity volatility index. Financial Instruments also are used to produce economically “inverse,” “inverse leveraged” or “leveraged” investment results for the Geared Funds.
Share Splits and Reverse Share Splits
The table below includes Share splits and reverse Share splits for the Funds during the years ended December 31, 2014, 2015 and 2016. The ticker symbols for these Funds did not change, and each Fund continues to trade on the NYSE Arca.
| Fund | Execution Date (Prior to Opening of Trading) |
Type of Split | Date Trading Resumed at Post- Split Price | |||
| ProShares Short VIX Short-Term Futures ETF |
January 21, 2014 |
2-for-1 Share split |
January 24, 2014 | |||
| ProShares Ultra VIX Short-Term Futures ETF |
January 21, 2014 |
1-for-4 reverse Share split |
January 24, 2014 | |||
| ProShares Ultra Silver |
January 21, 2014 |
1-for-4 reverse Share split |
January 24, 2014 | |||
| ProShares VIX Mid-Term Futures ETF |
November 6, 2014 |
1-for-4 reverse Share split |
November 6, 2014 | |||
| ProShares Ultra VIX Short-Term Futures ETF |
May 20, 2015 |
1-for-5 reverse Share split |
May 20, 2015 | |||
| ProShares Ultra Bloomberg Crude Oil |
May 20, 2015 |
1-for-5 reverse Share split |
May 20, 2015 | |||
| ProShares Ultra Bloomberg Natural Gas |
May 20, 2015 |
1-for-4 reverse Share split |
May 20, 2015 | |||
| ProShares Ultra Yen |
May 20, 2015 |
1-for-4 reverse Share split |
May 20, 2015 | |||
| ProShares UltraShort Silver |
November 13, 2015 |
2-for-1 Share split |
November 13, 2015 | |||
| ProShares UltraShort Bloomberg Natural Gas |
July 20, 2016 |
3-for-1 Share split |
July 25, 2016 | |||
| ProShares VIX Short-Term Futures ETF |
July 25, 2016 |
1-for-5 reverse Share split |
July 25, 2016 | |||
| ProShares Ultra VIX Short-Term Futures ETF |
July 25, 2016 |
1-for-5 reverse Share split |
July 25, 2016 | |||
B-204
Table of Contents
The reverse splits were applied retroactively for all periods presented, reducing the number of Shares outstanding for each of the Funds, and resulted in a proportionate increase in the price per Share and per Share information of each such Fund. Therefore, the reverse splits did not change the aggregate net asset value of a shareholder’s investment at the time of the reverse split.
The splits were applied retroactively for all periods presented, increasing the number of Shares outstanding for each of the Funds, and resulted in a proportionate decrease in the price per Share and per Share information of each such Fund. Therefore, the splits did not change the aggregate net asset value of a shareholder’s investment at the time of the split.
NOTE 2 – SIGNIFICANT ACCOUNTING POLICIES
Each Fund is an investment company, as defined by Financial Accounting Standards Board (“FASB”) Accounting Standards Codification (“ASC”) Topic 946 “Financial Services — Investment Companies.” As such, the Funds follow the investment company accounting and reporting guidance. The following is a summary of significant accounting policies followed by each Fund, as applicable, in preparation of its financial statements. These policies are in conformity with accounting principles generally accepted in the United States of America (“GAAP”).
Use of Estimates & Indemnifications
The preparation of financial statements in conformity with GAAP requires management to make estimates and assumptions that affect the reported amounts of assets and liabilities and disclosures of contingent assets and liabilities at the date of the financial statements and the reported amounts of revenues and expenses during the reporting period. Actual results could differ from those estimates.
In the normal course of business, the Trust enters into contracts that contain a variety of representations which provide general indemnifications. The Trust’s maximum exposure under these arrangements cannot be known; however, the Trust expects any risk of loss to be remote.
Basis of Presentation
Pursuant to rules and regulations of the U.S. Securities and Exchange Commission (“SEC”), audited financial statements are presented for the Trust as a whole, as the SEC registrant, and for each Fund individually. The debts, liabilities, obligations and expenses incurred, contracted for or otherwise existing with respect to a particular Fund shall be enforceable only against the assets of such Fund and not against the assets of the Trust generally or any other Fund. Accordingly, the assets of one Fund of the Trust include only those funds and other assets that are paid to, held by or distributed to the Trust for the purchase of Shares in that Fund.
Statement of Cash Flows
The cash amount shown in the Statements of Cash Flows is the amount reported as cash in the Statement of Financial Condition dated December 31, 2016 and 2015, and represents non-segregated cash with the custodian and does not include short-term investments.
B-205
Table of Contents
Final Net Asset Value for Fiscal Period
The cut-off times and the times of the calculation of the Funds’ final net asset value for creation and redemption of fund Shares for the year ended December 31, 2016 were as follows. All times are Eastern Standard Time:
| Create/Redeem Cut-off* |
NAV Calculation Time |
NAV Calculation Date | ||||
| UltraShort Silver, Ultra Silver |
6:30 a.m. | 7:00 a.m. | December 30 | |||
| UltraShort Gold, Ultra Gold |
9:30 a.m. | 10:00 a.m. | December 30 | |||
| UltraShort Bloomberg Crude Oil, Ultra Bloomberg Crude Oil |
2:00 p.m. | 2:30 p.m. | December 30 | |||
| UltraShort Bloomberg Natural Gas, Ultra Bloomberg Natural Gas |
2:00 p.m. | 2:30 p.m. | December 30 | |||
| UltraShort Australian Dollar |
3:00 p.m. | 4:00 p.m. | December 30 | |||
| Short Euro, |
3:00 p.m. | 4:00 p.m. | December 30 | |||
| UltraShort Euro, Ultra Euro |
||||||
| UltraShort Yen, Ultra Yen |
3:00 p.m. | 4:00 p.m. | December 30 | |||
| VIX Short-Term Futures ETF, Ultra VIX Short-Term Futures ETF, Short VIX Short-Term Futures ETF |
2:00 p.m. | 4:15 p.m. | December 30 | |||
| VIX Mid-Term Futures ETF |
2:00 p.m. | 4:15 p.m. | December 30 |
| * | Although the Funds’ shares may continue to trade on secondary markets subsequent to the calculation of the final NAV, these times represent the final opportunity to transact in creation or redemption units for the year ended December 31, 2016. |
Market value per Share is determined at the close of the NYSE Arca and may be later than when the Funds’ NAV per Share is calculated.
For financial reporting purposes, the Funds value transactions based upon the final closing price in their primary markets. Accordingly, the investment valuations in these financial statements may differ from those used in the calculation of certain of the Funds’ final creation/redemption NAV for the year ended December 31, 2016.
Investment Valuation
Short-term investments are valued at amortized cost which approximates fair value for daily NAV purposes. For financial reporting purposes, short-term investments are valued at their market price using information provided by a third-party pricing service or market quotations. In each of these situations, valuations are typically categorized as Level I in the fair value hierarchy.
Derivatives (e.g., futures contracts, swap agreements, forward agreements and foreign currency forward contracts) are generally valued using independent sources and/or agreements with counterparties or other procedures as determined by the Sponsor. Futures contracts, except for those entered into by the Gold, Silver, Australian Dollar and Short Euro Funds, are generally valued at the last settled price on the applicable exchange on which that future trades. Futures contracts entered into by the Gold, Silver, Australian Dollar and Short Euro Funds are valued at the last sales price prior to the time at which the NAV per Share of a Fund is determined. For financial reporting purposes, all futures contracts are valued at the last settled price. Futures contracts valuations are typically categorized as Level I in the fair value hierarchy. Swap agreements, forward agreements and foreign currency forward contracts valuations are typically categorized as Level II in the fair value hierarchy. If there was no sale on that day, and for non-exchange-traded derivatives, the Sponsor may in its sole discretion choose to determine a fair value price as the basis for determining the market value of such position for such day. Such fair value prices would generally be determined based on available inputs about the current value of the underlying financial instrument or commodity and would be based on principles that the Sponsor deems fair and equitable so long as such principles are consistent with industry standards. When market closing prices are not available, the Sponsor may fair value an asset of a Fund pursuant to the policies the Sponsor has adopted, which are consistent with normal industry standards. Depending on the source and relevant significance of valuation inputs, these instruments may be classified as Level II or Level III in the fair value hierarchy.
Fair value pricing may require subjective determinations about the value of an investment. While the Funds’ policies are intended to result in a calculation of its respective Fund’s NAV that fairly reflects investment values as of the time of pricing, such Fund cannot ensure that fair values determined by the Sponsor or persons acting at their direction would accurately reflect the price that a Fund could obtain for an investment if it were to dispose of that investment as of the time of pricing (for instance, in a forced or distressed sale). The prices used by such Fund may differ from the value that would be realized if the investments were sold and the differences could be material to the financial statements.
B-206
Table of Contents
Fair Value of Financial Instruments
The Funds disclose the fair value of their investments in a hierarchy that prioritizes the inputs to valuation techniques used to measure fair value. The disclosure requirements establish a fair value hierarchy that distinguishes between: (1) market participant assumptions developed based on market data obtained from sources independent of the Funds (observable inputs); and (2) the Funds’ own assumptions about market participant assumptions developed based on the best information available under the circumstances (unobservable inputs). The three levels defined by the disclosure requirements hierarchy are as follows:
Level I – Quoted prices (unadjusted) in active markets for identical assets or liabilities that the reporting entity has the ability to access at the measurement date.
Level II – Inputs other than quoted prices included within Level I that are observable for the asset or liability, either directly or indirectly. Level II assets include the following: quoted prices for similar assets or liabilities in active markets, quoted prices for identical or similar assets or liabilities in markets that are not active, inputs other than quoted prices that are observable for the asset or liability, and inputs that are derived principally from or corroborated by observable market data by correlation or other means (market-corroborated inputs).
Level III – Unobservable pricing input at the measurement date for the asset or liability. Unobservable inputs shall be used to measure fair value to the extent that observable inputs are not available.
In some instances, the inputs used to measure fair value might fall in different levels of the fair value hierarchy. The level in the fair value hierarchy within which the fair value measurement in its entirety falls is determined based on the lowest input level that is significant to the fair value measurement in its entirety.
Fair value measurements also require additional disclosure when the volume and level of activity for the asset or liability have significantly decreased, as well as when circumstances indicate that a transaction is not orderly.
The following table summarizes the valuation of investments at December 31, 2016 using the fair value hierarchy:
| Level I - Quoted Prices | Level II - Other Significant Observable Inputs | |||||||||||||||||||||||
| Short-Term U.S. Government and Agencies |
Futures Contracts* |
Forward Agreements |
Foreign Currency Forward Contracts |
Swap Agreements |
Total | |||||||||||||||||||
| VIX Short-Term Futures ETF |
$ | 147,991,233 | $ | (468,652 | ) | $ | — | $ | — | $ | — | $ | 147,522,581 | |||||||||||
| VIX Mid-Term Futures ETF |
45,486,235 | (1,288,245 | ) | — | — | — | 44,197,990 | |||||||||||||||||
| Short VIX Short-Term Futures ETF |
170,396,436 | (10,309,611 | ) | — | — | — | 160,086,825 | |||||||||||||||||
| Ultra VIX Short-Term Futures ETF |
434,671,795 | (7,972,237 | ) | — | — | — | 426,699,558 | |||||||||||||||||
| UltraShort Bloomberg Crude Oil |
205,694,385 | (1,426,815 | ) | — | — | (12,206,881 | ) | 192,060,689 | ||||||||||||||||
| UltraShort Bloomberg Natural Gas |
2,899,151 | (482,031 | ) | — | — | — | 2,417,120 | |||||||||||||||||
| UltraShort Gold |
60,540,555 | 18,980 | 3,033,566 | — | — | 63,593,101 | ||||||||||||||||||
| UltraShort Silver |
21,550,319 | 27,310 | 1,384,246 | — | — | 22,961,875 | ||||||||||||||||||
| Short Euro |
13,164,828 | 132,900 | — | — | — | 13,297,728 | ||||||||||||||||||
| UltraShort Australian Dollar |
12,909,619 | 1,182,340 | — | — | — | 14,091,959 | ||||||||||||||||||
| UltraShort Euro |
337,375,787 | — | — | 16,162,931 | — | 353,538,718 | ||||||||||||||||||
| UltraShort Yen |
257,102,313 | — | — | 16,744,937 | — | 273,847,250 | ||||||||||||||||||
| Ultra Bloomberg Crude Oil |
885,050,007 | 5,537,165 | — | — | 55,358,571 | 945,945,743 | ||||||||||||||||||
| Ultra Bloomberg Natural Gas |
36,183,648 | 2,536,720 | — | — | — | 38,720,368 | ||||||||||||||||||
| Ultra Gold |
95,356,621 | (18,960 | ) | (4,431,107 | ) | — | — | 90,906,554 | ||||||||||||||||
| Ultra Silver |
295,300,799 | (27,360 | ) | (20,976,189 | ) | — | — | 274,297,250 | ||||||||||||||||
| Ultra Euro |
11,891,831 | — | — | (574,010 | ) | — | 11,317,821 | |||||||||||||||||
| Ultra Yen |
5,282,879 | — | — | (342,076 | ) | — | 4,940,803 | |||||||||||||||||
|
|
|
|
|
|
|
|
|
|
|
|
|
|||||||||||||
| Total Trust |
$ | 3,038,848,441 | $ | (12,558,496 | ) | $ | (20,989,484 | ) | $ | 31,991,782 | $ | 43,151,690 | $ | 3,080,443,933 | ||||||||||
| * | Includes cumulative appreciation/depreciation of futures contracts as reported in the Schedules of Investments. Only current day’s variation margin is reported within the Statements of Financial Condition in receivable/payable on open futures. |
B-207
Table of Contents
At December 31, 2016, there were no Level III portfolio investments for which significant unobservable inputs were used to determine fair value.
The Funds’ policy is to recognize transfers between valuation levels at the end of the reporting period.
At December 31, 2016, there were no significant transfers in or out of Level I and Level II fair value measurements.
The inputs or methodology used for valuing investments are not necessarily an indication of the risk associated with investing in those securities.
The following table summarizes the valuation of investments at December 31, 2015 using the fair value hierarchy:
| Level I - Quoted Prices | Level II - Other Significant Observable Inputs | |||||||||||||||||||||||
| Short-Term U.S. Government and Agencies |
Futures Contracts* |
Forward Agreements |
Foreign Currency Forward Contracts |
Swap Agreements |
Total | |||||||||||||||||||
| VIX Short-Term Futures ETF |
$ | 96,073,659 | $ | (1,078,625 | ) | $ | — | $ | — | $ | — | $ | 94,995,034 | |||||||||||
| VIX Mid-Term Futures ETF |
25,976,287 | (344,360 | ) | — | — | — | 25,631,927 | |||||||||||||||||
| Short VIX Short-Term Futures ETF |
535,392,718 | 10,746,415 | — | — | — | 546,139,133 | ||||||||||||||||||
| Ultra VIX Short-Term Futures ETF |
438,357,849 | 11,894,466 | — | — | — | 450,252,315 | ||||||||||||||||||
| UltraShort Bloomberg Crude Oil |
79,692,642 | 2,464,513 | — | — | 6,412,656 | 88,569,811 | ||||||||||||||||||
| UltraShort Bloomberg Natural Gas |
8,115,004 | (2,471,164 | ) | — | — | — | 5,643,840 | |||||||||||||||||
| UltraShort Gold |
72,979,905 | 5,220 | 1,808,942 | — | — | 74,794,067 | ||||||||||||||||||
| UltraShort Silver |
50,730,230 | 5,970 | 4,778,279 | — | — | 55,514,479 | ||||||||||||||||||
| Short Euro |
15,153,211 | 243,438 | — | — | — | 15,396,649 | ||||||||||||||||||
| UltraShort Australian Dollar |
18,408,894 | (420,270 | ) | — | — | — | 17,988,624 | |||||||||||||||||
| UltraShort Euro |
546,166,776 | — | — | (28,710,336 | ) | — | 517,456,440 | |||||||||||||||||
| UltraShort Yen |
259,997,001 | — | — | (13,895,452 | ) | — | 246,101,549 | |||||||||||||||||
| Ultra Bloomberg Crude Oil |
797,650,543 | (17,929,314 | ) | — | — | (72,176,589 | ) | 707,544,640 | ||||||||||||||||
| Ultra Bloomberg Natural Gas |
26,807,731 | 6,312,879 | — | — | — | 33,120,610 | ||||||||||||||||||
| Ultra Gold |
71,912,587 | (5,200 | ) | (2,250,595 | ) | — | — | 69,656,792 | ||||||||||||||||
| Ultra Silver |
238,899,626 | (9,030 | ) | (22,561,101 | ) | — | — | 216,329,495 | ||||||||||||||||
| Ultra Euro |
11,605,262 | — | — | 604,920 | — | 12,210,182 | ||||||||||||||||||
| Ultra Yen |
5,069,491 | — | — | 261,311 | — | 5,330,802 | ||||||||||||||||||
|
|
|
|
|
|
|
|
|
|
|
|
|
|||||||||||||
| Total Trust** |
$ | 3,298,989,416 | $ | 9,414,938 | $ | (18,224,475 | ) | $ | (41,739,557 | ) | $ | (65,763,933 | ) | $ | 3,182,676,389 | |||||||||
| * | Includes cumulative appreciation/depreciation of futures contracts as reported in the Schedules of Investments. Only current day’s variation margin is reported within the Statements of Financial Condition in receivable/payable on open futures. |
| ** | Amounts exclude the activity of: ProShares Managed Futures Strategy which liquidated on March 30, 2016, ProShares UltraShort Bloomberg Commodity and ProShares Ultra Bloomberg Commodity which liquidated on September 1, 2016. |
At December 31, 2015, there were no Level III portfolio investments for which significant unobservable inputs were used to determine fair value.
The Funds’ policy is to recognize transfers between valuation levels at the end of the reporting period.
B-208
Table of Contents
At December 31, 2015, there were no significant transfers in or out of Level I and Level II fair value measurements.
The inputs or methodology used for valuing investments are not necessarily an indication of the risk associated with investing in those securities.
Investment Transactions and Related Income
Investment transactions are recorded on the trade date. All such transactions are recorded on the identified cost basis and marked to market daily. Unrealized appreciation/depreciation on open contracts are reflected in the Statements of Financial Condition and changes in the unrealized appreciation/depreciation between periods are reflected in the Statements of Operations. Discounts on short-term securities purchased are amortized and reflected as Interest Income in the Statements of Operations.
Brokerage Commissions and Fees
Each Fund pays its respective brokerage commissions, including applicable exchange fees, National Futures Association (“NFA”) fees, give-up fees, pit brokerage fees and other transaction related fees and expenses charged in connection with trading activities for each Fund’s investment in U.S. Commodity Futures Trading Commission (“CFTC”) regulated investments. The effects of trading spreads, financing costs/fees associated with Financial Instruments, and costs relating to the purchase of U.S. Treasury securities or similar high credit quality short-term fixed-income securities would also be borne by the Funds. Brokerage commissions on futures contracts are recognized on a half-turn basis (e.g., the first half is recognized when the contract is purchased (opened) and the second half is recognized when the transaction is closed). Through July 30, 2014, the Sponsor paid brokerage commissions on VIX futures contracts for the Matching VIX Funds. On July 31, 2014, the Sponsor began paying, and is currently paying, brokerage commissions on VIX futures contracts for the Matching VIX Funds that exceed variable create/redeem fees collected by more than 0.02% of the Matching VIX Fund’s average net assets annually.
Federal Income Tax
Each Fund is registered as a series of a Delaware statutory trust and is treated as a partnership for U.S. federal income tax purposes. Accordingly, no Fund expects to incur U.S. federal income tax liability; rather, each beneficial owner of a Fund’s Shares is required to take into account its allocable share of its Fund’s income, gain, loss, deductions and other items for its Fund’s taxable year ending with or within the beneficial owner’s taxable year.
Management of the Funds has reviewed all open tax years and major jurisdictions (i.e., the last four tax year ends and the interim tax period since then, as applicable) and concluded that there is no tax liability resulting from unrecognized tax benefits relating to uncertain income tax positions taken or expected to be taken in future tax returns. The Funds are also not aware of any tax positions for which it is reasonably possible that the total amounts of unrecognized tax benefits will significantly change in the next twelve months. On an ongoing basis, management will monitor its tax positions taken under the interpretation to determine if adjustments to conclusions are necessary based on factors including, but not limited to, on-going analysis of tax law, regulation, and interpretations thereof.
NOTE 3 – INVESTMENTS
Short-Term Investments
The Funds may purchase U.S. Treasury Bills, agency securities, and other high-credit quality short-term fixed income or similar securities with original maturities of one year or less. A portion of these investments may be posted as collateral in connection with swap agreements and/or used as collateral for a Fund’s trading in futures and forward contracts.
Accounting for Derivative Instruments
In seeking to achieve each Fund’s investment objective, the Sponsor uses a mathematical approach to investing. Using this approach, the Sponsor determines the type, quantity and mix of investment positions, including derivative positions, which the Sponsor believes in combination, should produce returns consistent with a Fund’s objective.
All open derivative positions at period end are reflected on each respective Fund’s Schedule of Investments. Certain Funds utilized a varying level of derivative instruments in conjunction with investment securities in seeking to meet their investment objective during
B-209
Table of Contents
the period. While the volume of open positions may vary on a daily basis as each Fund transacts derivatives contracts in order to achieve the appropriate exposure to meet its investment objective, the volume of these open positions relative to the net assets of each respective Fund at the date of this report is generally representative of open positions throughout the reporting period.
Following is a description of the derivative instruments used by the Funds during the reporting period, including the primary underlying risk exposures related to each instrument type.
Futures Contracts
The Funds enter into futures contracts to gain exposure to changes in the value of, or as a substitute for investing directly in (or shorting), an underlying index, currency or commodity. A futures contract obligates the seller to deliver (and the purchaser to accept) the future delivery of a specified quantity and type of asset at a specified time and place. The contractual obligations of a buyer or seller may generally be satisfied by taking or making physical delivery of the underlying commodity, if applicable, or by making an offsetting sale or purchase of an identical futures contract on the same or linked exchange before the designated date of delivery, or by cash settlement at expiration of contract.
Upon entering into a futures contract, each Fund is required to deposit and maintain as collateral at least such initial margin as required by the exchange on which the transaction is affected. The initial margin is segregated as cash and/or securities balances with brokers for futures contracts, as disclosed in the Statements of Financial Condition, and is restricted as to its use. The Funds that enter into futures contracts maintain collateral at the broker in the form of cash and/or securities. Pursuant to the futures contract, each Fund generally agrees to receive from or pay to the broker(s) an amount of cash equal to the daily fluctuation in value of the futures contract. Such receipts or payments are known as variation margin and are recorded by each Fund as unrealized gains or losses. Each Fund will realize a gain or loss upon closing of a futures transaction.
Futures contracts involve, to varying degrees, elements of market risk (specifically commodity price risk or equity market volatility risk) and exposure to loss in excess of the amount of variation margin. The face or contract amounts reflect the extent of the total exposure each Fund has in the particular classes of instruments. Additional risks associated with the use of futures contracts are imperfect correlation between movements in the price of the futures contracts and the market value of the underlying index or commodity and the possibility of an illiquid market for a futures contract. With futures contracts, there is minimal but some counterparty risk to the Funds since futures contracts are exchange-traded and the exchange’s clearinghouse, as counterparty to all exchange-traded futures contracts, guarantees the futures contracts against default. Many futures exchanges and boards of trade limit the amount of fluctuation permitted in futures contract prices during a single trading day. Once the daily limit has been reached in a particular contract, no trades may be made that day at a price beyond that limit or trading may be suspended for specified times during the trading day. Futures contracts prices could move to the limit for several consecutive trading days with little or no trading, thereby preventing prompt liquidation of futures positions and potentially subjecting a Fund to substantial losses. If trading is not possible, or if a Fund determines not to close a futures position in anticipation of adverse price movements, the Fund will be required to make daily cash payments of variation margin. The risk the Fund will be unable to close out a futures position will be minimized by entering into such transactions on a national exchange with an active and liquid secondary market.
Swap Agreements
Certain of the Funds enter into swap agreements for purposes of pursuing their investment objectives or as a substitute for investing directly in (or shorting) an underlying index, currency or commodity, or to create an economic hedge against a position. Swap agreements are two-party contracts that have traditionally been entered into primarily with institutional investors in over-the-counter (“OTC”) markets for a specified period, ranging from a day to more than one year. However, the Dodd-Frank Wall Street Reform and Consumer Protection Act (the “Dodd-Frank Act”) provides for significant reforms of the OTC derivative markets, including a requirement to execute certain swap transactions on a CFTC-regulated market and/or to clear such transactions through a CFTC-regulated central clearing organization. In a standard swap transaction, two parties agree to exchange the returns earned or realized on a particular predetermined investment, instrument or index in exchange for a fixed or floating rate of return in respect of a predetermined notional amount. Transaction or commission costs are reflected in the benchmark level at which the transaction is entered into. The gross returns to be exchanged are calculated with respect to a notional amount and the benchmark returns to which the swap is linked. Swap agreements do not involve the delivery of underlying instruments.
B-210
Table of Contents
Generally, swap agreements entered into by the Funds calculate and settle the obligations of the parties to the agreement on a “net basis” with a single payment. Consequently, each Fund’s current obligations (or rights) under a swap agreement will generally be equal only to the net amount to be paid or received under the agreement based on the relative values of such obligations (or rights) (the “net amount”). In a typical swap agreement entered into by a Matching VIX Fund or an Ultra Fund, the Matching VIX Fund or Ultra Fund would be entitled to settlement payments in the event the level of the benchmark increases and would be required to make payments to the swap counterparties in the event the level of the benchmark decreases, adjusted for any transaction costs or trading spreads on the notional amount the Funds may pay. In a typical swap agreement entered into by a Short Fund or an UltraShort Fund, the Short Fund or UltraShort Fund would be required to make payments to the swap counterparties in the event the level of the benchmark increases and would be entitled to settlement payments in the event the level of the benchmark decreases, adjusted for any transaction costs or trading spreads on the notional amount the Funds may pay.
The net amount of the excess, if any, of each Fund’s obligations over its entitlements with respect to each uncleared swap agreement is accrued on a daily basis and an amount of cash and/or securities having an aggregate value at least equal to such accrued excess is maintained for the benefit of the counterparty in a segregated account by the Funds’ Custodian. The net amount of the excess, if any, of each Fund’s entitlements over its obligations with respect to each uncleared swap agreement is accrued on a daily basis and an amount of cash and/or securities having an aggregate value at least equal to such accrued excess is maintained for the benefit of the Fund in a segregated account by the Fund’s Custodian. Until a swap agreement is settled in cash, the gain or loss on the notional amount less any transaction costs or trading spreads payable by each Fund on the notional amount are recorded as “unrealized appreciation or depreciation on swap agreements” and, when cash is exchanged, the gain or loss realized is recorded as “realized gains or losses on swap agreements.” Swap agreements are generally valued at the last settled price of the benchmark referenced asset.
The Trust, on behalf of a Fund, may enter into agreements with certain counterparties for derivative transactions. These agreements contain various conditions, events of default, termination events, covenants and representations. The triggering of certain events or the default on certain terms of the agreement could allow a party to terminate a transaction under the agreement and request immediate payment in an amount equal to the net positions owed the party under the agreement. This could cause a Fund to have to enter into a new transaction with the same counterparty, enter into a transaction with a different counterparty or seek to achieve its investment objective through any number of different investments or investment techniques.
Swap agreements involve, to varying degrees, elements of market risk and exposure to loss in excess of the unrealized gain/loss reflected. The notional amounts reflect the extent of the total investment exposure each Fund has under the swap agreement, which may exceed the NAV of each Fund. Additional risks associated with the use of swap agreements are imperfect correlations between movements in the notional amount and the price of the underlying reference index and the inability of counterparties to perform. Each Fund bears the risk of loss of the amount expected to be received under a swap agreement in the event of the default or bankruptcy of a swap agreement counterparty. A Fund will typically enter into swap agreements only with major global financial institutions. The creditworthiness of each of the firms that is a party to a swap agreement is monitored by the Sponsor. The Sponsor may use various techniques to minimize credit risk including early termination and payment, using different counterparties, limiting the net amount due from any individual counterparty and generally requiring collateral to be posted by the counterparty in an amount approximately equal to that owed to the Funds. All of the outstanding swap agreements at December 30, 2016 contractually terminate within one month but may be terminated without penalty by either party daily. Upon termination, the Fund is entitled to pay or receive the “unrealized appreciation or depreciation” amount.
The Funds, as applicable, collateralize swap agreements by segregating or designating cash and/or certain securities as indicated on the Statements of Financial Condition or Schedules of Investments. As noted above, collateral posted in connection with uncleared derivative transactions is held for the benefit of the counterparty in a segregated tri-party account at the Custodian to protect the counterparty against non-payment by the Funds. In the event of a default by the counterparty, the Funds will seek withdrawal of this collateral from the segregated account and may incur certain costs in exercising its right with respect to the collateral. If a counterparty becomes bankrupt or otherwise fails to perform its obligations due to financial difficulties, the Funds may experience significant delays in obtaining any recovery in a bankruptcy or other reorganizational proceeding. The Funds may obtain only limited recovery or may obtain no recovery in such circumstances.
The Funds remain subject to credit risk with respect to the amount they expect to receive from counterparties. However, the Funds have sought to mitigate these risks in connection with uncleared swaps by generally requiring that the counterparties for each Fund agree to post collateral for the benefit of the Fund, marked to market daily, in an amount approximately equal to what the counterparty owes the Fund, subject to certain minimum thresholds. In the event of the bankruptcy of a counterparty, the Fund will have direct
B-211
Table of Contents
access to the collateral received from the counterparty, generally as of the day prior to the bankruptcy, because there is a one day time lag between the Fund’s request for collateral and the delivery of such collateral. To the extent any such collateral is insufficient, the Funds will be exposed to counterparty risk as described above, including the possible delays in recovering amounts as a result of bankruptcy proceedings. As of December 31, 2016, the collateral posted by counterparties consisted of cash and/or U.S. Treasury securities.
The counterparty/credit risk for cleared derivative transactions is generally lower than for uncleared OTC derivatives since generally a clearing organization becomes substituted for each counterparty to a cleared derivative contract and, in effect, guarantees the parties’ performance under the contract as each party to a trade looks only to the clearing organization for performance of financial obligations. In addition, cleared derivative transactions benefit from daily marking-to-market and settlement, and segregation and minimum capital requirements applicable to intermediaries.
Forward Contracts
Certain of the Funds enter into forward contracts for purposes of pursuing their investment objectives and as a substitute for investing directly in (or shorting) commodities and/or currencies. A forward contract is an agreement between two parties to purchase or sell a specified quantity of an asset at or before a specified date in the future at a specified price. Forward contracts are typically traded in OTC markets and all details of the contract are negotiated between the counterparties to the agreement. Accordingly, the forward contracts are valued by reference to the contracts traded in the OTC markets.
The contractual obligations of a buyer or seller may generally be satisfied by taking or making physical delivery of the underlying commodity or currency, establishing an opposite position in the contract and recognizing the profit or loss on both positions simultaneously on the delivery date or, in some instances, paying a cash settlement before the designated date of delivery. The forward contracts are adjusted by the daily fluctuation of the underlying commodity or currency and any gains or losses are recorded for financial statement purposes as unrealized gains or losses until the contract settlement date.
Forward contracts have traditionally not been cleared or guaranteed by a third party. As a result of the Dodd-Frank Act, the CFTC now regulates non-deliverable forwards (including deliverable forwards where the parties do not take delivery). Certain non-deliverable forward contracts, such as non-deliverable foreign exchange forwards, may be subject to regulation as swap agreements, including mandatory clearing. Changes in the forward markets may entail increased costs and result in burdensome reporting requirements.
The Funds may collateralize uncleared forward commodity contracts by segregating or designating cash and/or certain securities as indicated on their Statements of Financial Condition or Schedules of Investments. Such collateral is held for the benefit of the counterparty in a segregated tri-party account at the Custodian to protect the counterparty against non-payment by the Funds. In the event of a default by the counterparty, the Funds will seek withdrawal of this collateral from the segregated account and may incur certain costs in exercising its right with respect to the collateral. If a counterparty becomes bankrupt or otherwise fails to perform its obligations due to financial difficulties, the Funds may experience significant delays in obtaining any recovery in a bankruptcy or other reorganizational proceeding. The Funds may obtain only limited recovery or may obtain no recovery in such circumstances.
The Funds remain subject to credit risk with respect to the amount they expect to receive from counterparties. However, the Funds have sought to mitigate these risks by generally requiring that the counterparties for each Fund agree to post collateral for the benefit of the Fund, marked to market daily, in an amount approximately equal to what the counterparty owes the Fund, subject to minimum thresholds. In the event of the bankruptcy of counterparty, the Fund will have direct access to the collateral received from the counterparty, generally as of the day prior to the bankruptcy, because there is a one day time lag between the Fund’s request for collateral and the delivery of such collateral. To the extent any such collateral is insufficient, the Fund will be exposed to counterparty risk as described above, including the possible delays in recovering amounts as a result of bankruptcy proceedings. As of December 31, 2016, the collateral posted by counterparties consisted of cash and/or U.S. Treasury securities.
Participants in trading foreign exchange forward contracts often do not require margin deposits, but rely upon internal credit limitations and their judgments regarding the creditworthiness of their counterparties. In recent years, however, many OTC market participants in foreign exchange trading have begun to require their counterparties to post margin.
B-212
Table of Contents
A Fund will typically enter into forward contracts only with major global financial institutions. The creditworthiness of each of the firms that is a party to a forward contract is monitored by the Sponsor.
The counterparty/credit risk for cleared derivative transactions is generally lower than for uncleared OTC derivatives since generally a clearing organization becomes substituted for each counterparty to a cleared derivative contract and, in effect, guarantees the parties’ performance under the contract as each party to a trade looks only to the clearing organization for performance of financial obligations. In addition, cleared derivative transactions benefit from daily marking-to-market and settlement, and segregation and minimum capital requirements applicable to intermediaries.
The following tables indicate the location of derivative related items on the Statement of Financial Condition as well as the effect of derivative instruments on the Statement of Operations during the reporting period.
Fair Value of Derivative Instruments
as of December 31, 2016
| Assets Derivatives |
Liability Derivatives |
|||||||||||||||
| Derivatives not accounted for as hedging instruments |
Statements of Financial Condition Location |
Fund |
Unrealized Appreciation |
Statements of Financial Condition Location |
Fund |
Unrealized Depreciation |
||||||||||
| VIX Futures Contracts |
Receivables on open futures contracts |
ProShares VIX Short-Term Futures ETF |
$ | 2,273,874 | * | Payable on open futures contracts |
ProShares VIX Short-Term Futures ETF |
$ | 2,742,526 | * | ||||||
| ProShares VIX Mid- Term Futures ETF |
68,375 | * | ProShares VIX Mid-Term Futures ETF |
1,356,620 | * | |||||||||||
| ProShares Ultra VIX Short-Term Futures ETF |
13,594,875 | * | ProShares Short VIX Short-Term Futures ETF |
10,309,611 | * | |||||||||||
| ProShares Ultra VIX Short-Term Futures ETF |
21,567,112 | * | ||||||||||||||
| Commodities Contracts |
Receivables on open futures contracts, unrealized appreciation on swap and/or forward agreements |
ProShares UltraShort Gold |
|
3,052,546 |
* |
Payable on open futures contracts, unrealized depreciation on swap and/or forward agreements |
ProShares UltraShort Bloomberg Crude Oil |
13,633,696 | * | |||||||
| ProShares UltraShort Silver |
|
1,411,556 |
* |
ProShares UltraShort Bloomberg Natural Gas |
482,031 | * | ||||||||||
| ProShares Ultra Bloomberg Crude Oil |
60,895,736 | * | ProShares Ultra Gold |
4,450,067 | * | |||||||||||
| ProShares Ultra Bloomberg Natural Gas |
|
2,536,720 |
* |
ProShares Ultra Silver |
|
21,003,549 |
* | |||||||||
| Foreign Exchange Contracts |
Unrealized appreciation on foreign currency forward contracts and receivables on open futures contracts |
ProShares Short Euro |
|
132,900 |
* |
Unrealized depreciation on foreign currency forward contracts and payable on open futures contracts |
ProShares UltraShort Euro |
356,139 | ||||||||
| ProShares UltraShort Australian Dollar |
1,182,340 | * | ProShares UltraShort Yen |
|
125,420 |
| ||||||||||
| ProShares UltraShort Euro |
16,519,070 | ProShares Ultra Euro |
|
576,558 |
| |||||||||||
| ProShares UltraShort Yen |
|
16,870,357 |
|
ProShares Ultra Yen |
|
342,455 |
| |||||||||
| ProShares Ultra Euro |
2,548 | |||||||||||||||
| ProShares Ultra Yen |
379 | |||||||||||||||
|
|
|
|
|
|||||||||||||
| Total Trust |
$ | 118,541,276 | * | Total Trust |
$ | 76,945,784 | * | |||||||||
| * | Includes cumulative appreciation/depreciation of futures contracts as reported in the Schedules of Investments. Only current day’s variation margin is reported within the Statements of Financial Condition in receivable/payable on open futures contracts. |
B-213
Table of Contents
Fair Value of Derivative Instruments
as of December 31, 2015
| Assets Derivatives |
Liability Derivatives |
|||||||||||||||
| Derivatives not accounted for as hedging instruments |
Statements of Financial Condition Location |
Fund |
Unrealized Appreciation |
Statements of Financial Condition Location |
Fund |
Unrealized Depreciation |
||||||||||
| VIX Futures Contracts |
Receivables on open futures contracts |
ProShares VIX Mid- Term Futures ETF |
$ | 10,005 | * | Payable on open futures contracts |
ProShares VIX Short- Term Futures ETF |
$ | 1,078,625 | * | ||||||
| ProShares Short VIX Short-Term Futures ETF |
10,805,245 | * | ProShares VIX Mid-Term Futures ETF |
354,365 | * | |||||||||||
| ProShares Ultra VIX Short-Term Futures ETF |
11,894,466 | * | ProShares Short VIX Short-Term Futures ETF |
58,830 | * | |||||||||||
| Commodities Contracts |
Receivables on open futures contracts, unrealized appreciation on swap and/or forward agreements |
ProShares UltraShort Bloomberg Crude Oil |
8,877,169 | * | Payable on open futures contracts, unrealized depreciation on swap and/or forward agreements |
ProShares UltraShort Bloomberg Natural Gas |
2,471,164 | * | ||||||||
| ProShares Ultra Bloomberg Natural Gas |
6,312,879 | * | ProShares Ultra Bloomberg Crude Oil |
90,105,903 | * | |||||||||||
| ProShares UltraShort Gold |
1,814,162 | * | ProShares Ultra Gold |
2,255,795 | * | |||||||||||
| ProShares UltraShort Silver |
4,784,249 | * | ProShares Ultra Silver |
22,570,131 | * | |||||||||||
| Foreign Exchange Contracts |
Unrealized appreciation on foreign currency forward contracts and receivables on open futures contracts |
ProShares Short Euro |
243,438 | * | Unrealized depreciation on foreign currency forward contracts and payable on open futures contracts |
ProShares UltraShort Australian Dollar |
420,270 | * | ||||||||
| ProShares UltraShort Yen |
933,727 | ProShares UltraShort Euro |
28,710,336 | |||||||||||||
| ProShares Ultra Euro |
604,920 | ProShares UltraShort Yen |
14,829,179 | |||||||||||||
| ProShares Ultra Yen |
267,014 | ProShares Ultra Yen |
5,703 | |||||||||||||
|
|
|
|
|
|||||||||||||
| Total Trust** |
$ | 46,547,274 | * | Total Trust** |
$ | 162,860,301 | * | |||||||||
| * | Includes cumulative appreciation/depreciation of futures contracts as reported in the Schedules of Investments. Only current day’s variation margin is reported within the Statements of Financial Condition in receivable/payable on open futures contracts. |
| ** | Amounts exclude the activity of: ProShares Managed Futures Strategy which liquidated on March 30, 2016, ProShares UltraShort Bloomberg Commodity and ProShares Ultra Bloomberg Commodity which liquidated on September 1, 2016. |
B-214
Table of Contents
The Effect of Derivative Instruments on the Statements of Operations
For the year ended December 31, 2016
| Derivatives not accounted for as hedging instruments |
Location of Gain (Loss) on Derivatives |
Fund |
Realized Gain (Loss) on Derivatives Recognized in Income |
Change in Unrealized Appreciation/ Depreciation on Derivatives Recognized in Income |
||||||||
| VIX Futures Contracts |
Net realized gain (loss) on futures contracts/ changes in unrealized appreciation/ depreciation on futures contracts |
ProShares VIX Short-Term Futures ETF |
$ | (195,475,791 | ) | $ | 609,973 | |||||
| ProShares VIX Mid-Term Futures ETF |
(11,085,506 | ) | (943,885 | ) | ||||||||
| ProShares Short VIX Short-Term Futures ETF |
440,391,389 | (21,056,026 | ) | |||||||||
| ProShares Ultra VIX Short-Term Futures ETF |
(1,567,340,688 | ) | (19,866,703 | ) | ||||||||
| Commodity Contracts |
Net realized gain (loss) on futures contracts, swap and/or forward agreements/changes in unrealized appreciation/ depreciation on futures contracts, swap and/or forward agreements |
ProShares UltraShort Bloomberg Crude Oil |
(67,752,164 | ) | (22,510,865 | ) | ||||||
| ProShares UltraShort Bloomberg Natural Gas |
586,860 | 1,989,133 | ||||||||||
| ProShares UltraShort Gold |
(12,240,751 | ) | 1,238,384 | |||||||||
| ProShares UltraShort Silver |
(17,554,714 | ) | (3,372,693 | ) | ||||||||
| ProShares Ultra Bloomberg Crude Oil |
74,061,040 | 151,001,639 | ||||||||||
| ProShares Ultra Bloomberg Natural Gas |
17,571,809 | (3,776,159 | ) | |||||||||
| ProShares Ultra Gold |
5,816,565 | (2,194,272 | ) | |||||||||
| ProShares Ultra Silver |
62,342,441 | 1,566,582 | ||||||||||
| Foreign Exchange Contracts |
Net realized gain (loss) on futures and/or foreign currency forward contracts/changes in unrealized appreciation/ depreciation on futures and/or foreign currency forward contracts |
ProShares Short Euro |
663,774 | (110,538 | ) | |||||||
| ProShares UltraShort Australian Dollar |
(2,787,204 | ) | 1,602,610 | |||||||||
| ProShares UltraShort Euro |
(25,711,518 | ) | 44,873,267 | |||||||||
| ProShares UltraShort Yen |
(22,220,271 | ) | 30,640,389 | |||||||||
| ProShares Ultra Euro |
138,959 | (1,178,930 | ) | |||||||||
| ProShares Ultra Yen |
717,086 | (603,387 | ) | |||||||||
|
|
|
|
|
|||||||||
| Total Trust |
$ | (1,319,878,684 | ) | $ | 157,908,519 | |||||||
B-215
Table of Contents
The Effect of Derivative Instruments on the Statements of Operations
For the year ended December 31, 2015
| Derivatives not accounted for as |
Location of Gain or (Loss) on Derivatives Recognized in Income |
Fund |
Realized Gain or (Loss) on Derivatives Recognized in Income |
Change in Unrealized Appreciation or Depreciation on Derivatives Recognized in Income |
||||||||
| VIX Futures Contracts |
Net realized gain (loss) on futures contracts / changes in unrealized appreciation/ depreciation on futures contracts |
ProShares VIX Short-Term Futures ETF |
$ | (19,408,543 | ) | $ | (7,343,245 | ) | ||||
| ProShares VIX Mid-Term Futures ETF |
(3,335,936 | ) | (605,025 | ) | ||||||||
| ProShares Short VIX Short-Term Futures ETF |
69,793,028 | 27,098,564 | ||||||||||
| ProShares Ultra VIX Short-Term Futures ETF |
(392,174,228 | ) | (27,690,787 | ) | ||||||||
| Commodity Contracts |
Net realized gain (loss) on futures contracts, swap and/or forward agreements/changes in unrealized appreciation/ depreciation on futures contracts, swap and/or forward agreements |
ProShares UltraShort Bloomberg Crude Oil |
91,670,324 | (33,947,511 | ) | |||||||
| ProShares UltraShort Bloomberg Natural Gas |
15,212,804 | (6,412,629 | ) | |||||||||
| ProShares UltraShort Gold |
12,707,635 | 4,101,460 | ||||||||||
| ProShares UltraShort Silver |
10,759,545 | 4,187,736 | ||||||||||
| ProShares Ultra Bloomberg Crude Oil |
(896,177,096 | ) | 32,549,981 | |||||||||
| ProShares Ultra Bloomberg Natural Gas |
(100,776,817 | ) | 41,202,162 | |||||||||
| ProShares Ultra Gold |
(18,605,815 | ) | (4,311,529 | ) | ||||||||
| ProShares Ultra Silver |
(78,309,309 | ) | (10,173,451 | ) | ||||||||
| Foreign Exchange Contracts |
Net realized gain (loss) on futures and/or foreign currency forward contracts/changes in unrealized appreciation/ depreciation on futures and/or foreign currency forward contracts |
ProShares Short Euro |
1,559,425 | (141,893 | ) | |||||||
| ProShares UltraShort Australian Dollar |
4,330,463 | (1,163,751 | ) | |||||||||
| ProShares UltraShort Euro |
131,651,572 | (45,473,330 | ) | |||||||||
| ProShares UltraShort Yen |
8,809,464 | (12,316,677 | ) | |||||||||
| ProShares Ultra Euro |
(1,982,208 | ) | 708,291 | |||||||||
| ProShares Ultra Yen |
(472,913 | ) | 276,556 | |||||||||
|
|
|
|
|
|||||||||
| Total Trust* |
$ | (1,164,748,605 | ) | $ | (39,455,078 | ) | ||||||
| * | Amounts exclude the activity of: ProShares Managed Futures Strategy which liquidated on March 30, 2016, ProShares UltraShort Bloomberg Commodity and ProShares Ultra Bloomberg Commodity which liquidated on September 1, 2016. |
B-216
Table of Contents
The Effect of Derivative Instruments on the Statements of Operations
For the year ended December 31, 2014
| Derivatives not accounted for as hedging instruments |
Location of Gain or (Loss) on Derivatives Recognized in Income |
Fund |
Realized Gain or (Loss) on Derivatives Recognized in Income |
Change in Unrealized Appreciation or Depreciation on Derivatives Recognized in Income |
||||||||
| VIX Futures Contracts |
Net realized gain (loss) on futures contracts / changes in unrealized appreciation/ depreciation on futures contracts |
ProShares VIX Short-Term Futures ETF |
$ | (694,347 | ) | $ | 22,917,306 | |||||
| ProShares VIX Mid-Term Futures ETF |
(14,378,810 | ) | 5,157,354 | |||||||||
| ProShares Short VIX Short-Term Futures ETF |
76,925,998 | (24,469,104 | ) | |||||||||
| ProShares Ultra VIX Short-Term Futures ETF |
(139,412,525 | ) | 63,595,164 | |||||||||
| Commodity Contracts |
Net realized gain (loss) on futures contracts, swap and/or forward agreements/changes in unrealized appreciation/ depreciation on futures contracts, swap and/or forward agreements |
ProShares UltraShort Bloomberg Crude Oil |
99,327,097 | 46,390,353 | ||||||||
| ProShares UltraShort Bloomberg Natural Gas |
8,791,719 | 2,899,165 | ||||||||||
| ProShares UltraShort Gold |
(5,316,482 | ) | (7,934,871 | ) | ||||||||
| ProShares UltraShort Silver |
15,114,883 | 2,810,170 | ||||||||||
| ProShares Ultra Bloomberg Crude Oil |
(243,325,957 | ) | (125,240,438 | ) | ||||||||
| ProShares Ultra Bloomberg Natural Gas |
(6,464,796 | ) | (31,232,744 | ) | ||||||||
| ProShares Ultra Gold |
(9,674,333 | ) | 8,883,268 | |||||||||
| ProShares Ultra Silver |
(155,551,420 | ) | (9,889,600 | ) | ||||||||
| Foreign Exchange Contracts |
Net realized gain (loss) on futures and/or foreign currency forward contracts/changes in unrealized appreciation/ depreciation on futures and/or foreign currency forward contracts |
ProShares Short Euro |
1,593,048 | 418,562 | ||||||||
| ProShares UltraShort Australian Dollar |
2,296,216 | (174,124 | ) | |||||||||
| ProShares UltraShort Euro |
83,678,955 | 30,511,501 | ||||||||||
| ProShares UltraShort Yen |
127,846,225 | (30,965,459 | ) | |||||||||
| ProShares Ultra Euro |
(420,533 | ) | (204,333 | ) | ||||||||
| ProShares Ultra Yen |
(540,398 | ) | 144,064 | |||||||||
|
|
|
|
|
|||||||||
| Total Trust* |
$ | (160,205,460 | ) | $ | (46,383,766 | ) | ||||||
| * | Amounts exclude the activity of ProShares Ultra Australian Dollar which liquidated on June 29, 2015, ProShares Managed Futures Strategy which liquidated on March 30, 2016, ProShares UltraShort Bloomberg Commodity and ProShares Ultra Bloomberg Commodity which liquidated on September 1, 2016. |
B-217
Table of Contents
Offsetting Assets and Liabilities
Each Fund is subject to master netting agreements or similar arrangements that allow for amounts owed between each Fund and the counterparty to be netted upon an early termination. The party that has the larger payable pays the excess of the larger amount over the smaller amount to the other party. The master netting agreements or similar arrangements do not apply to amounts owed to/from different counterparties. As described above, the Funds utilize derivative instruments to achieve their investment objective during the year. The amounts shown in the Statements of Financial Condition do not take into consideration the effects of legally enforceable master netting agreements or similar arrangements.
For financial reporting purposes, the Funds do not offset derivative assets and derivative liabilities that are subject to netting arrangements in the Statements of Financial Condition. The following table presents each Fund’s derivatives by investment type and by counterparty net of amounts available for offset under a master netting agreement and the related collateral received or pledged by the Funds as of December 31, 2016:
| Fair Values of Derivative Instruments as of December 31, 2016 | ||||||||||||||||||||||||
| Assets | Liabilities | |||||||||||||||||||||||
| Gross Amounts of Recognized Assets presented in the Statements of Financial Condition |
Gross Amounts Offset in the the Statements of Financial Condition |
Net Amounts of Assets presented in the Statements of Financial Condition |
Gross Amounts of Recognized Liabilities presented in the Statements of Financial Condition |
Gross Amounts Offset in the Statements of Financial Condition |
Net Amounts of Liabilities presented in the Statements of Financial Condition |
|||||||||||||||||||
| ProShares UltraShort Bloomberg Crude Oil Swap agreements |
$ | — | $ | — | $ | — | $ | 12,206,881 | $ | — | $ | 12,206,881 | ||||||||||||
| ProShares UltraShort Gold |
||||||||||||||||||||||||
| Forward agreements |
3,033,566 | — | 3,033,566 | — | — | — | ||||||||||||||||||
| ProShares UltraShort Silver |
||||||||||||||||||||||||
| Forward agreements |
1,384,246 | — | 1,384,246 | — | — | — | ||||||||||||||||||
| ProShares UltraShort Euro |
||||||||||||||||||||||||
| Foreign currency forward contracts |
16,519,070 | — | 16,519,070 | 356,139 | — | 356,139 | ||||||||||||||||||
| ProShares UltraShort Yen |
||||||||||||||||||||||||
| Foreign currency forward contracts |
16,870,357 | — | 16,870,357 | 125,420 | — | 125,420 | ||||||||||||||||||
| ProShares Ultra Bloomberg Crude Oil Swap agreements |
55,358,571 | — | 55,358,571 | — | — | — | ||||||||||||||||||
| ProShares Ultra Gold |
||||||||||||||||||||||||
| Forward agreements |
— | — | — | 4,431,107 | — | 4,431,107 | ||||||||||||||||||
| ProShares Ultra Silver |
||||||||||||||||||||||||
| Forward agreements |
— | — | — | 20,976,189 | — | 20,976,189 | ||||||||||||||||||
| ProShares Ultra Euro |
||||||||||||||||||||||||
| Foreign currency forward contracts |
2,548 | — | 2,548 | 576,558 | — | 576,558 | ||||||||||||||||||
| ProShares Ultra Yen |
||||||||||||||||||||||||
| Foreign currency forward contracts |
379 | — | 379 | 342,455 | — | 342,455 | ||||||||||||||||||
Asset (Liability) amounts shown in the table below represent amounts owed to (by) the Funds for the derivative-related investments at December 31, 2016. These amounts may be collateralized by cash or financial instruments, segregated for the benefit of the Funds or the counterparties, depending on whether the related contracts are in an appreciated or depreciated position at period end. Amounts shown in the column labeled “Net Amount” represent the uncollateralized portions of these amounts at period end. These amounts may be un-collateralized due to timing differences related to market movements or due to minimum thresholds for collateral movement, as further described above under the caption “Accounting for Derivative Instruments”.
B-218
Table of Contents
| Gross Amounts Not Offset in the Statements of Financial Condition as of December 31, 2016 |
||||||||||||||||
| Amounts of Recognized Assets / (Liabilities) presented in the Statements of Financial Condition |
Financial Instruments for the Benefit of (the Funds) / the Counterparties |
Cash Collateral for the Benefit of (the Funds) / the Counterparties |
Net Amount | |||||||||||||
| ProShares UltraShort Bloomberg Crude Oil |
||||||||||||||||
| Citibank N.A. |
$ | (4,742,191 | ) | $ | 4,742,191 | $ | — | $ | — | |||||||
| Goldman Sachs International |
(3,061,395 | ) | 3,061,395 | — | — | |||||||||||
| Societe Generale S.A. |
(1,050,699 | ) | 1,050,699 | — | — | |||||||||||
| UBS AG |
(3,352,596 | ) | 3,352,596 | — | — | |||||||||||
| ProShares UltraShort Gold |
||||||||||||||||
| Citibank N.A. |
1,147,811 | — | — | 1,147,811 | ||||||||||||
| Goldman Sachs International |
881,454 | (874,948 | ) | — | 6,506 | |||||||||||
| Societe Generale S.A. |
393,006 | (393,006 | ) | — | — | |||||||||||
| UBS AG |
611,295 | — | (611,295 | ) | — | |||||||||||
| ProShares UltraShort Silver |
||||||||||||||||
| Citibank N.A. |
610,478 | — | — | 610,478 | ||||||||||||
| Goldman Sachs International |
323,829 | (323,829 | ) | — | — | |||||||||||
| Societe Generale S.A. |
86,543 | (86,543 | ) | — | — | |||||||||||
| UBS AG |
363,396 | — | (363,396 | ) | — | |||||||||||
| ProShares UltraShort Euro |
||||||||||||||||
| Goldman Sachs International |
8,109,067 | (8,109,067 | ) | — | — | |||||||||||
| UBS AG |
8,053,864 | — | (8,053,864 | ) | — | |||||||||||
| ProShares UltraShort Yen |
||||||||||||||||
| Goldman Sachs International |
8,256,779 | (7,771,819 | ) | — | 484,960 | |||||||||||
| UBS AG |
8,488,158 | — | (7,980,000 | ) | 508,158 | |||||||||||
| ProShares Ultra Bloomberg Crude Oil |
||||||||||||||||
| Citibank N.A. |
18,427,009 | — | — | 18,427,009 | ||||||||||||
| Goldman Sachs International |
14,016,906 | (14,016,906 | ) | — | — | |||||||||||
| Societe Generale S.A. |
8,661,821 | (8,661,821 | ) | — | — | |||||||||||
| UBS AG |
14,252,835 | — | (14,252,835 | ) | — | |||||||||||
| ProShares Ultra Gold |
||||||||||||||||
| Citibank N.A. |
(1,464,982 | ) | 1,464,982 | — | — | |||||||||||
| Goldman Sachs International |
(1,112,916 | ) | 1,112,916 | — | — | |||||||||||
| Societe Generale S.A. |
(643,587 | ) | 643,587 | — | — | |||||||||||
| UBS AG |
(1,209,622 | ) | 1,209,622 | — | — | |||||||||||
| ProShares Ultra Silver |
||||||||||||||||
| Citibank N.A. |
(6,946,009 | ) | 6,946,009 | — | — | |||||||||||
| Goldman Sachs International |
(5,869,092 | ) | 5,869,092 | — | — | |||||||||||
| Societe Generale S.A. |
(2,532,729 | ) | 2,532,729 | — | — | |||||||||||
| UBS AG |
(5,628,359 | ) | 5,628,359 | — | — | |||||||||||
| ProShares Ultra Euro |
||||||||||||||||
| Goldman Sachs International |
(239,256 | ) | 239,256 | — | — | |||||||||||
| UBS AG |
(334,754 | ) | 334,754 | — | — | |||||||||||
| ProShares Ultra Yen |
||||||||||||||||
| Goldman Sachs International |
(219,736 | ) | 219,736 | — | — | |||||||||||
| UBS AG |
(122,340 | ) | 122,340 | — | — | |||||||||||
B-219
Table of Contents
The following table presents each Fund’s derivatives by investment type and by counterparty net of amounts available for offset
under a master netting agreement and the related collateral received or pledged by the Funds as of December 31, 2015:
| Fair Values of Derivative Instruments as of December 31, 2015 | ||||||||||||||||||||||||
| Assets | Liabilities | |||||||||||||||||||||||
| Gross Amounts of Recognized Assets presented in the Statements of Financial Condition |
Gross Amounts Offset in the the Statements of Financial Condition |
Net Amounts of Assets presented in the Statements of Financial Condition |
Gross Amounts of Recognized Liabilities presented in the Statements of Financial Condition |
Gross Amounts Offset in the Statements of Financial Condition |
Net Amounts of Liabilities presented in the Statements of Financial Condition |
|||||||||||||||||||
| ProShares UltraShort Bloomberg Crude Oil Swap agreements |
$ | 6,412,656 | $ | — | $ | 6,412,656 | $ | — | $ | — | $ | — | ||||||||||||
| ProShares UltraShort Gold |
||||||||||||||||||||||||
| Forward agreements |
1,808,942 | — | 1,808,942 | — | — | — | ||||||||||||||||||
| ProShares UltraShort Silver |
||||||||||||||||||||||||
| Forward agreements |
4,778,279 | — | 4,778,279 | — | — | — | ||||||||||||||||||
| ProShares UltraShort Euro |
||||||||||||||||||||||||
| Foreign currency forward contracts |
— | — | — | 28,710,336 | — | 28,710,336 | ||||||||||||||||||
| ProShares UltraShort Yen |
||||||||||||||||||||||||
| Foreign currency forward contracts |
933,727 | — | 933,727 | 14,829,179 | — | 14,829,179 | ||||||||||||||||||
| ProShares Ultra Bloomberg Crude Oil Swap agreements |
— | — | — | 72,176,589 | — | 72,176,589 | ||||||||||||||||||
| ProShares Ultra Gold |
||||||||||||||||||||||||
| Forward agreements |
— | — | — | 2,250,595 | — | 2,250,595 | ||||||||||||||||||
| ProShares Ultra Silver |
||||||||||||||||||||||||
| Forward agreements |
— | — | — | 22,561,101 | — | 22,561,101 | ||||||||||||||||||
| ProShares Ultra Euro |
||||||||||||||||||||||||
| Foreign currency forward contracts |
604,920 | — | 604,920 | — | — | — | ||||||||||||||||||
| ProShares Ultra Yen |
||||||||||||||||||||||||
| Foreign currency forward contracts |
267,014 | — | 267,014 | 5,703 | — | 5,703 | ||||||||||||||||||
Asset (Liability) amounts shown in the table below represent amounts owed to (by) the Funds for the derivative-related investments at December 31, 2015. These amounts may be collateralized by cash or financial instruments, segregated for the benefit of the Funds or the counterparties, depending on whether the related contracts are in an appreciated or depreciated position at period end. Amounts shown in the column labeled “Net Amount” represent the uncollateralized portions of these amounts at period end. These amounts may be un-collateralized due to timing differences related to market movements or due to minimum thresholds for collateral movement, as further described above under the caption “Accounting for Derivative Instruments”.
B-220
Table of Contents
|
Gross Amounts Not Offset in the Statements of Financial Condition as of December 31, 2015 |
||||||||||||||||
| Amounts of Recognized Assets / (Liabilities) presented in the Statements of Financial Condition |
Financial Instruments for the Benefit of (the Funds) / the Counterparties |
Cash Collateral for the Benefit of (the Funds) / the Counterparties |
Net Amount | |||||||||||||
| ProShares UltraShort Bloomberg Crude Oil |
||||||||||||||||
| Citibank N.A. |
$ | 1,098,278 | $ | — | $ | — | $ | 1,098,278 | ||||||||
| Deutsche Bank AG |
1,722,894 | — | (1,722,894 | ) | — | |||||||||||
| Goldman Sachs International |
1,595,552 | (1,595,552 | ) | — | — | |||||||||||
| Societe Generale S.A. |
521,142 | (521,142 | ) | — | — | |||||||||||
| UBS AG |
1,474,790 | (1,474,790 | ) | — | — | |||||||||||
| ProShares UltraShort Gold |
||||||||||||||||
| Citibank N.A. |
3,915 | — | — | 3,915 | ||||||||||||
| Deutsche Bank AG |
1,046,664 | — | (1,046,664 | ) | — | |||||||||||
| Goldman Sachs International |
158,827 | — | — | 158,827 | ||||||||||||
| Societe Generale S.A. |
212,680 | (212,680 | ) | — | — | |||||||||||
| UBS AG |
386,856 | (386,856 | ) | — | — | |||||||||||
| ProShares UltraShort Silver |
||||||||||||||||
| Deutsche Bank AG |
2,500,263 | — | (2,500,000 | ) | 263 | |||||||||||
| Goldman Sachs International |
1,044,986 | (858,460 | ) | — | 186,526 | |||||||||||
| Societe Generale S.A. |
438,975 | (438,975 | ) | — | — | |||||||||||
| UBS AG |
794,055 | (582,692 | ) | — | 211,363 | |||||||||||
| ProShares UltraShort Euro |
||||||||||||||||
| Goldman Sachs International |
(14,992,024 | ) | 14,992,024 | — | — | |||||||||||
| UBS AG |
(13,718,312 | ) | 13,718,312 | — | — | |||||||||||
| ProShares UltraShort Yen |
||||||||||||||||
| Goldman Sachs International |
(6,470,405 | ) | 6,470,405 | — | — | |||||||||||
| UBS AG |
(7,425,047 | ) | 7,425,047 | — | — | |||||||||||
| ProShares Ultra Bloomberg Crude Oil |
||||||||||||||||
| Citibank N.A. |
(2,509,989 | ) | 2,509,989 | — | — | |||||||||||
| Deutsche Bank AG |
(20,221,872 | ) | 20,221,872 | — | — | |||||||||||
| Goldman Sachs International |
(20,806,119 | ) | 20,806,119 | — | — | |||||||||||
| Societe Generale S.A. |
(6,357,459 | ) | 6,357,459 | — | — | |||||||||||
| UBS AG |
(22,281,150 | ) | 22,281,150 | — | — | |||||||||||
| ProShares Ultra Gold |
||||||||||||||||
| Citibank N.A. |
(4,614 | ) | — | — | (4,614 | ) | ||||||||||
| Deutsche Bank AG |
(1,049,383 | ) | 1,049,383 | — | — | |||||||||||
| Goldman Sachs International |
(520,730 | ) | 520,730 | — | — | |||||||||||
| Societe Generale S.A. |
(244,992 | ) | 244,992 | — | — | |||||||||||
| UBS AG |
(430,876 | ) | 430,876 | — | — | |||||||||||
| ProShares Ultra Silver |
||||||||||||||||
| Deutsche Bank AG |
(9,355,945 | ) | 9,355,945 | — | — | |||||||||||
| Goldman Sachs International |
(5,106,853 | ) | 5,106,853 | — | — | |||||||||||
| Societe Generale S.A. |
(2,704,459 | ) | 2,704,459 | — | — | |||||||||||
| UBS AG |
(5,393,844 | ) | 5,393,844 | — | — | |||||||||||
| ProShares Ultra Euro |
||||||||||||||||
| Goldman Sachs International |
315,354 | (315,354 | ) | — | — | |||||||||||
| UBS AG |
289,566 | (289,566 | ) | — | — | |||||||||||
| ProShares Ultra Yen |
||||||||||||||||
| Goldman Sachs International |
169,787 | — | — | 169,787 | ||||||||||||
| UBS AG |
91,524 | — | — | 91,524 | ||||||||||||
B-221
Table of Contents
NOTE 4 – AGREEMENTS
Management Fee
Each Leveraged Fund, the Short Euro Fund and each Geared VIX Fund pays the Sponsor a Management Fee, monthly in arrears, in an amount equal to 0.95% per annum of its average daily NAV of such Fund. Each Matching VIX Fund pays the Sponsor a Management Fee, monthly in arrears, in an amount equal to 0.85% per annum of its average daily NAV of such Fund. The Sponsor did not and will not charge the Management Fee in the first year of operation of each Fund in an amount equal to the offering costs. The Sponsor reimbursed each Fund, to the extent that its offering costs exceed the Management Fee, for the first year of operations.
The Management Fee is paid in consideration of the Sponsor’s services as commodity pool operator, and for managing the business and affairs of the Funds. From the Management Fee, the Sponsor pays all of the routine operational, administrative and other ordinary expenses of each Fund, generally as determined by the Sponsor, including but not limited to the Administrator, Custodian, Distributor, ProFunds Distributors, Inc. (“PDI”), an affiliated broker-dealer of the Sponsor, Transfer Agent, accounting and auditing fees and expenses, any index licensors for the Funds, and the normal and expected expenses incurred in connection with the continuous offering of Shares of each Fund after the commencement of its trading operations, including, but not limited to, expenses such as tax preparation expenses, legal fees not in excess of $100,000 per annum, ongoing SEC registration fees not exceeding 0.021% per annum of the NAV of a Fund and Financial Industry Regulatory Authority (“FINRA”) filing fees, individual Schedule K-1 preparation and mailing fees not exceeding 0.10% per annum of the net assets of a Fund, and report preparation and mailing expenses.
Non-Recurring Fees and Expenses
Each Fund pays all its non-recurring and unusual fees and expenses, if any, as determined by the Sponsor. Non-recurring and unusual fees and expenses are fees and expenses that are unexpected or unusual in nature, such as legal claims and liabilities, litigation costs or indemnification or other material expenses which are not currently anticipated obligations of the Funds.
The Administrator
The Sponsor and the Trust, for itself and on behalf of each Fund, has appointed Brown Brothers Harriman & Co. (“BBH&Co.”) as the Administrator of the Funds, and the Sponsor, and the Trust, on its own behalf and on behalf of each Fund, and BBH&Co. have entered into an Administrative Agency Agreement (the “Administration Agreement”) in connection therewith. Pursuant to the terms of the Administration Agreement and under the supervision and direction of the Sponsor and the Trust, BBH&Co. prepares and files certain regulatory filings on behalf of the Funds. BBH&Co. may also perform other services for the Funds pursuant to the Administration Agreement as mutually agreed upon by the Sponsor, the Trust and BBH&Co. from time to time. Pursuant to the terms of the Administration Agreement, BBH&Co. also serves as the Transfer Agent of the Funds. The Administrator’s fees are paid on behalf of the Funds by the Sponsor.
The Custodian
BBH&Co. serves as the Custodian of the Funds, and the Trust, on its own behalf and on behalf of each Fund, and BBH&Co. have entered into a Custodian Agreement in connection therewith. Pursuant to the terms of the Custodian Agreement, BBH&Co. is responsible for the holding and safekeeping of assets delivered to it by the Funds, and performing various administrative duties in accordance with instructions delivered to BBH&Co. by the Funds. The Custodian’s fees are paid on behalf of the Funds by the Sponsor.
B-222
Table of Contents
The Distributor
SEI Investments Distribution Co. (“SEI”), serves as Distributor of the Funds and assists the Sponsor and the Administrator with certain functions and duties relating to distribution and marketing, including taking creation and redemption orders, consulting with the marketing staff of the Sponsor and its affiliates with respect to compliance with the requirements of FINRA and/or the NFA in connection with marketing efforts, and reviewing and filing of marketing materials with FINRA and/or the NFA. SEI retains all marketing materials separately for each Fund, at c/o SEI, One Freedom Valley Drive, Oaks, PA 19456. The Sponsor, on behalf of each Fund, has entered into a Distribution Services Agreement with SEI. The Sponsor pays SEI for performing its duties on behalf of the Funds.
NOTE 5 – OFFERING COSTS
Offering costs will be amortized by the Funds over a twelve month period on a straight-line basis beginning once the fund commences operations. The Sponsor will not charge its Management Fee in the first year of operations of a Fund in an amount equal to the offering costs. Normal and expected expenses incurred in connection with the continuous offering of Shares of a Fund after the commencement of its trading operations will be paid by the Sponsor.
NOTE 6 – CREATION AND REDEMPTION OF CREATION UNITS
Each Fund issues and redeems shares from time to time, but only in one or more Creation Units. A Creation Unit is a block of 50,000 Shares of a Geared Fund and 25,000 Shares of a Matching VIX Fund. Creation Units may be created or redeemed only by Authorized Participants. As a result of the Share splits and reverse Share splits as described in Note 1, certain redemptions as disclosed in the Statements of Changes in Shareholders’ Equity reflect payment of fractional share balances on beneficial shareholder accounts.
Except when aggregated in Creation Units, the Shares are not redeemable securities. Retail investors, therefore, generally will not be able to purchase or redeem Shares directly from or with a Fund. Rather, most retail investors will purchase or sell Shares in the secondary market with the assistance of a broker. Thus, some of the information contained in these Notes to Financial Statements—such as references to the Transaction Fees imposed on purchases and redemptions—is not relevant to retail investors.
Transaction Fees on Creation and Redemption Transactions
The manner by which Creation Units are purchased or redeemed is dictated by the terms of the Authorized Participant Agreement and Authorized Participant Handbook. By placing a purchase order, an Authorized Participant agrees to: (1) deposit cash with the Custodian; and (2) if permitted by the Sponsor in its sole discretion, enter into or arrange for an exchange of futures contract for related position or block trade whereby the Authorized Participant would also transfer to such Fund a number and type of exchange-traded futures contracts at or near the closing settlement price for such contracts on the purchase order date.
Authorized Participants may pay a fixed transaction fee of up to $500 in connection with each order to create or redeem a Creation Unit in order to compensate BBH&Co., as the Administrator, the Custodian and the Transfer Agent of each Fund and its Shares, for services in processing the creation and redemption of Creation Units and to offset the costs of increasing or decreasing derivative positions. Authorized Participants also may pay a variable transaction fee to the Fund of up to 0.10% (and a variable transaction fee to the Matching VIX Funds of 0.05%) of the value of the Creation Unit that is purchased or redeemed unless the transaction fee is waived or otherwise adjusted by the Sponsor. The Sponsor provides such Authorized Participant with prompt notice in advance of any such waiver or adjustment of the transaction fee. Authorized Participants may sell the Shares included in the Creation Units they purchase from the Funds to other investors in the secondary market.
Transaction fees for the years ended December 31, 2016, 2015 and 2014 which are included in the Addition and/or Redemption of Shares on the Statements of Changes in Shareholders’ Equity, were as follows:
B-223
Table of Contents
| Fund |
Year Ended December 31, 2016 |
Year Ended December 31, 2015 |
Year Ended December 31, 2014 |
|||||||||
| VIX Short-Term Futures ETF |
$ | 229,699 | $ | 105,024 | $ | 72,020 | ||||||
| VIX Mid-Term Futures ETF |
24,056 | 8,521 | 8,927 | |||||||||
| Short VIX Short-Term Futures ETF |
801,564 | 342,734 | 218,121 | |||||||||
| Ultra VIX Short-Term Futures ETF |
1,822,247 | 1,391,292 | 734,298 | |||||||||
| UltraShort Bloomberg Crude Oil |
398,027 | 382,054 | 257,458 | |||||||||
| UltraShort Bloomberg Natural Gas |
8,989 | 8,853 | 26,053 | |||||||||
| UltraShort Gold |
29,854 | 11,024 | 32,473 | |||||||||
| UltraShort Silver |
16,729 | 39,354 | 48,832 | |||||||||
| Short Euro |
— | — | — | |||||||||
| UltraShort Australian Dollar |
— | — | — | |||||||||
| UltraShort Euro |
— | — | — | |||||||||
| UltraShort Yen |
— | — | — | |||||||||
| Ultra Bloomberg Crude Oil |
504,533 | 847,422 | 299,493 | |||||||||
| Ultra Bloomberg Natural Gas |
9,175 | 13,939 | 30,073 | |||||||||
| Ultra Gold |
14,138 | 4,218 | 12,088 | |||||||||
| Ultra Silver |
47,414 | 38,848 | 65,208 | |||||||||
| Ultra Euro |
— | — | — | |||||||||
| Ultra Yen |
— | — | — | |||||||||
|
|
|
|
|
|
|
|||||||
| Total Trust* |
$ | 3,906,425 | $ | 3,193,283 | $ | 1,805,044 | ||||||
| * | Amounts exclude the activity of ProShares Ultra Australian Dollar which liquidated on June 29, 2015, ProShares Managed Futures Strategy which liquidated on March 30, 2016, ProShares UltraShort Bloomberg Commodity and ProShares Ultra Bloomberg Commodity which liquidated on September 1, 2016. |
B-224
Table of Contents
NOTE 7 – FINANCIAL HIGHLIGHTS
Selected data for a Share outstanding throughout the year ended December 31, 2016:
| For the Year Ended December 31, 2016 |
||||||||||||||||||||||||
| Per Share Operating Performance |
VIX Short- Term Futures ETF* |
VIX Mid- Term Futures ETF |
Short VIX Short-Term Futures ETF |
Ultra VIX Short-Term Futures ETF*^ |
UltraShort Bloomberg Crude Oil^ |
UltraShort Bloomberg Natural Gas* |
||||||||||||||||||
| Net asset value, at December 31, 2015 |
$ | 66.2109 | $ | 53.9626 | $ | 50.8150 | $ | 702.1025 | $ | 66.6009 | $ | 46.5314 | ||||||||||||
| Net investment income (loss) |
(0.2754 | ) | (0.3333 | ) | (0.6090 | ) | (1.9193 | ) | (0.3600 | ) | (0.6812 | ) | ||||||||||||
| Net realized and unrealized gain (loss)# |
(44.7209 | ) | (11.4932 | ) | 41.0242 | (656.7016 | ) | (34.5434 | ) | (22.7492 | ) | |||||||||||||
| Change in net asset value from operations |
(44.9963 | ) | (11.8265 | ) | 40.4152 | (658.6209 | ) | (34.9034 | ) | (23.4304 | ) | |||||||||||||
| Net asset value, at December 31, 2016 |
$ | 21.2146 | $ | 42.1361 | $ | 91.2302 | $ | 43.4816 | $ | 31.6975 | $ | 23.1010 | ||||||||||||
| Market value per share, at December 31, 2015† |
$ | 66.65 | $ | 53.99 | $ | 50.45 | $ | 708.75 | $ | 66.82 | $ | 46.55 | ||||||||||||
| Market value per share, at December 31, 2016† |
$ | 21.26 | $ | 42.34 | $ | 90.98 | $ | 43.75 | $ | 31.65 | $ | 23.05 | ||||||||||||
| Total Return, at net asset value |
(68.0 | )% | (21.9 | )% | 79.5 | % | (93.8 | )% | (52.4 | )% | (50.4 | )% | ||||||||||||
| Total Return, at market value |
(68.1 | )% | (21.6 | )% | 80.3 | % | (93.8 | )% | (52.6 | )% | (50.5 | )% | ||||||||||||
| Ratios to Average Net Assets |
||||||||||||||||||||||||
| Expense ratio |
0.99 | % | 0.93 | % | 1.39 | % | 1.57 | % | 1.03 | % | 1.65 | % | ||||||||||||
| Expense ratio, excluding brokerage commissions |
0.85 | % | 0.85 | % | 0.95 | % | 0.95 | % | 0.95 | % | 0.95 | % | ||||||||||||
| Net investment income (loss) |
(0.75 | )% | (0.68 | )% | (1.15 | )% | (1.32 | )% | (0.76 | )% | (1.43 | )% | ||||||||||||
| * | See Note 1 of these Notes for Financial Statements. |
| ^ | See Note 9 of these Notes for Financial Statements. |
| # | The amount shown for a share outstanding throughout the period may not accord with the change in aggregate gains and losses during the period because of timing of creation and redemption units in relation to fluctuating net asset value during the period. |
| † | Market values are determined at the close of the New York Stock Exchange, which may be later than when the Funds’ net asset value is calculated. |
B-225
Table of Contents
| For the Year Ended December 31, 2016 |
||||||||||||||||||||||||
| Per Share Operating Performance |
UltraShort Gold |
UltraShort Silver |
Short Euro |
UltraShort Australian Dollar |
UltraShort Euro |
UltraShort Yen |
||||||||||||||||||
| Net asset value, at December 31, 2015 |
$ | 115.8799 | $ | 64.5783 | $ | 43.7767 | $ | 58.4582 | $ | 25.5406 | $ | 87.9389 | ||||||||||||
| Net investment income (loss) |
(0.5542 | ) | (0.2641 | ) | (0.3268 | ) | (0.4268 | ) | (0.1703 | ) | (0.4974 | ) | ||||||||||||
| Net realized and unrealized gain (loss)# |
(23.9976 | ) | (27.0070 | ) | 1.6075 | (2.6532 | ) | 1.7144 | (7.1984 | ) | ||||||||||||||
| Change in net asset value from operations |
(24.5518 | ) | (27.2711 | ) | 1.2807 | (3.0800 | ) | 1.5441 | (7.6958 | ) | ||||||||||||||
| Net asset value, at December 31, 2016 |
$ | 91.3281 | $ | 37.3072 | $ | 45.0574 | $ | 55.3782 | $ | 27.0847 | $ | 80.2431 | ||||||||||||
| Market value per share, at December 31, 2015† |
$ | 115.83 | $ | 64.55 | $ | 43.74 | $ | 58.15 | $ | 25.53 | $ | 87.89 | ||||||||||||
| Market value per share, at December 31, 2016† |
$ | 90.54 | $ | 38.76 | $ | 45.12 | $ | 55.24 | $ | 27.08 | $ | 80.25 | ||||||||||||
| Total Return, at net asset value |
(21.2 | )% | (42.2 | )% | 2.9 | % | (5.3 | )% | 6.0 | % | (8.8 | )% | ||||||||||||
| Total Return, at market value |
(21.8 | )% | (40.0 | )% | 3.2 | % | (5.0 | )% | 6.1 | % | (8.7 | )% | ||||||||||||
| Ratios to Average Net Assets |
||||||||||||||||||||||||
| Expense ratio |
0.95 | % | 0.95 | % | 0.97 | % | 1.03 | % | 0.95 | % | 0.95 | % | ||||||||||||
| Expense ratio, excluding brokerage commissions |
0.95 | % | 0.95 | % | 0.95 | % | 0.95 | % | 0.95 | % | 0.95 | % | ||||||||||||
| Net investment income (loss) |
(0.70 | )% | (0.70 | )% | (0.76 | )% | (0.79 | )% | (0.70 | )% | (0.71 | )% | ||||||||||||
| # | The amount shown for a share outstanding throughout the period may not accord with the change in aggregate gains and losses during the period because of timing of creation and redemption units in relation to fluctuating net asset value during the period. |
| † | Market values are determined at the close of the New York Stock Exchange, which may be later than when the Funds’ net asset value is calculated. |
B-226
Table of Contents
| For the Year Ended December 31, 2016 |
||||||||||||||||||||||||
| Per Share Operating Performance |
Ultra Bloomberg Crude Oil^ |
Ultra Bloomberg Natural Gas |
Ultra Gold |
Ultra Silver |
Ultra Euro |
Ultra Yen |
||||||||||||||||||
| Net asset value, at December 31, 2015 |
$ | 25.1548 | $ | 18.5698 | $ | 29.7295 | $ | 27.0638 | $ | 15.5107 | $ | 54.7527 | ||||||||||||
| Net investment income (loss) |
(0.1534 | ) | (0.1579 | ) | (0.2751 | ) | (0.2717 | ) | (0.1119 | ) | (0.4586 | ) | ||||||||||||
| Net realized and unrealized gain (loss)# |
(1.6662 | ) | 0.4364 | 3.4482 | 6.6499 | (1.3816 | ) | 1.1321 | ||||||||||||||||
| Change in net asset value from operations |
(1.8196 | ) | 0.2785 | 3.1731 | 6.3782 | (1.4935 | ) | 0.6735 | ||||||||||||||||
| Net asset value, at December 31, 2016 |
$ | 23.3352 | $ | 18.8483 | $ | 32.9026 | $ | 33.4420 | $ | 14.0172 | $ | 55.4262 | ||||||||||||
| Market value per share, at December 31, 2015† |
$ | 25.08 | $ | 18.48 | $ | 29.73 | $ | 27.08 | $ | 15.51 | $ | 54.70 | ||||||||||||
| Market value per share, at December 31, 2016† |
$ | 23.36 | $ | 18.96 | $ | 33.20 | $ | 32.09 | $ | 14.09 | $ | 55.52 | ||||||||||||
| Total Return, at net asset value |
(7.2 | )% | 1.5 | % | 10.7 | % | 23.6 | % | (9.6 | )% | 1.2 | % | ||||||||||||
| Total Return, at market value |
(6.9 | )% | 2.6 | % | 11.7 | % | 18.5 | % | (9.2 | )% | 1.5 | % | ||||||||||||
| Ratios to Average Net Assets |
||||||||||||||||||||||||
| Expense ratio |
1.01 | % | 1.34 | % | 0.95 | % | 0.95 | % | 0.95 | % | 0.95 | % | ||||||||||||
| Expense ratio, excluding brokerage commissions |
0.95 | % | 0.95 | % | 0.95 | % | 0.95 | % | 0.95 | % | 0.95 | % | ||||||||||||
| Net investment income (loss) |
(0.76 | )% | (1.12 | )% | (0.69 | )% | (0.69 | )% | (0.71 | )% | (0.69 | )% | ||||||||||||
| ^ | See Note 9 of these Notes for Financial Statements. |
| # | The amount shown for a share outstanding throughout the period may not accord with the change in aggregate gains and losses during the period because of timing of creation and redemption units in relation to fluctuating net asset value during the period. |
| † | Market values are determined at the close of the New York Stock Exchange, which may be later than when the Funds’ net asset value is calculated. |
B-227
Table of Contents
Selected data for a Share outstanding throughout the year ended December 31, 2015:
| For the Year Ended December 31, 2015 |
||||||||||||||||||||||||
| Per Share Operating Performance |
VIX Short- Term Futures ETF* |
VIX Mid- Term Futures ETF |
Short VIX Short-Term Futures ETF |
Ultra VIX Short-Term Futures ETF*^ |
UltraShort Bloomberg Crude Oil^ |
UltraShort Bloomberg Natural Gas* |
||||||||||||||||||
| Net asset value, at December 31, 2014 |
$ | 104.6604 | $ | 63.6020 | $ | 61.4004 | $ | 3,136.4730 | $ | 38.9895 | $ | 27.9859 | ||||||||||||
| Net investment income (loss) |
(0.6622 | ) | (0.5053 | ) | (0.8162 | ) | (18.0602 | ) | (0.3924 | ) | (0.4438 | ) | ||||||||||||
| Net realized and unrealized gain (loss)# |
(37.7873 | ) | (9.1341 | ) | (9.7692 | ) | (2,416.3103 | ) | 28.0038 | 18.9893 | ||||||||||||||
| Change in net asset value from operations |
(38.4495 | ) | (9.6394 | ) | (10.5854 | ) | (2,434.3705 | ) | 27.6114 | 18.5455 | ||||||||||||||
| Net asset value, at December 31, 2015 |
$ | 66.2109 | $ | 53.9626 | $ | 50.8150 | $ | 702.1025 | $ | 66.6009 | $ | 46.5314 | ||||||||||||
| Market value per share, at December 31, 2014† |
$ | 104.95 | $ | 63.89 | $ | 61.16 | $ | 3,143.75 | $ | 38.26 | $ | 27.34 | ||||||||||||
| Market value per share, at December 31, 2015† |
$ | 66.65 | $ | 53.99 | $ | 50.45 | $ | 708.75 | $ | 66.82 | $ | 46.55 | ||||||||||||
| Total Return, at net asset value |
(36.7 | )% | (15.2 | )% | (17.2 | )% | (77.6 | )% | 70.8 | % | 66.3 | % | ||||||||||||
| Total Return, at market value |
(36.5 | )% | (15.5 | )% | (17.5 | )% | (77.5 | )% | 74.6 | % | 70.3 | % | ||||||||||||
| Ratios to Average Net Assets |
||||||||||||||||||||||||
| Expense ratio |
0.95 | % | 0.91 | % | 1.40 | % | 1.65 | % | 1.07 | % | 1.55 | % | ||||||||||||
| Expense ratio, excluding brokerage commissions |
0.85 | % | 0.85 | % | 0.95 | % | 0.95 | % | 0.95 | % | 0.95 | % | ||||||||||||
| Net investment income (loss) |
(0.92 | )% | (0.88 | )% | (1.36 | )% | (1.61 | )% | (1.04 | )% | (1.50 | )% | ||||||||||||
| * | See Note 1 of these Notes for Financial Statements. |
| ^ | See Note 9 of these Notes for Financial Statements. |
| # | The amount shown for a share outstanding throughout the period may not accord with the change in aggregate gains and losses during the period because of timing of creation and redemption units in relation to fluctuating net asset value during the period. |
| † | Market values are determined at the close of the New York Stock Exchange, which may be later than when the Funds’ net asset value is calculated. |
B-228
Table of Contents
| For the Year Ended December 31, 2015 |
||||||||||||||||||||||||
| Per Share Operating Performance |
UltraShort Gold |
UltraShort Silver* |
Short Euro |
UltraShort Australian Dollar |
UltraShort Euro |
UltraShort Yen |
||||||||||||||||||
| Net asset value, at December 31, 2014 |
$ | 96.6516 | $ | 57.8071 | $ | 40.0617 | $ | 51.3790 | $ | 21.5946 | $ | 89.3336 | ||||||||||||
| Net investment income (loss) |
(0.9149 | ) | (0.4968 | ) | (0.4096 | ) | (0.5741 | ) | (0.2256 | ) | (0.8243 | ) | ||||||||||||
| Net realized and unrealized gain (loss)# |
20.1432 | 7.2680 | 4.1246 | 7.6533 | 4.1716 | (0.5704 | ) | |||||||||||||||||
| Change in net asset value from operations |
19.2283 | 6.7712 | 3.7150 | 7.0792 | 3.9460 | (1.3947 | ) | |||||||||||||||||
| Net asset value, at December 31, 2015 |
$ | 115.8799 | $ | 64.5783 | $ | 43.7767 | $ | 58.4582 | $ | 25.5406 | $ | 87.9389 | ||||||||||||
| Market value per share, at December 31, 2014† |
$ | 100.22 | $ | 59.70 | $ | 40.03 | $ | 51.37 | $ | 21.61 | $ | 89.30 | ||||||||||||
| Market value per share, at December 31, 2015† |
$ | 115.83 | $ | 64.55 | $ | 43.74 | $ | 58.15 | $ | 25.53 | $ | 87.89 | ||||||||||||
| Total Return, at net asset value |
19.9 | % | 11.7 | % | 9.3 | % | 13.8 | % | 18.3 | % | (1.6 | )% | ||||||||||||
| Total Return, at market value |
15.6 | % | 8.1 | % | 9.3 | % | 13.2 | % | 18.1 | % | (1.6 | )% | ||||||||||||
| Ratios to Average Net Assets |
||||||||||||||||||||||||
| Expense ratio |
0.95 | % | 0.95 | % | 0.97 | % | 1.03 | % | 0.95 | % | 0.95 | % | ||||||||||||
| Expense ratio, excluding brokerage commissions |
0.95 | % | 0.95 | % | 0.95 | % | 0.95 | % | 0.95 | % | 0.95 | % | ||||||||||||
| Net investment income (loss) |
(0.91 | )% | (0.91 | )% | (0.95 | )% | (1.00 | )% | (0.90 | )% | (0.92 | )% | ||||||||||||
| * | See Note 1 of these Notes for Financial Statements. |
| # | The amount shown for a share outstanding throughout the period may not accord with the change in aggregate gains and losses during the period because of timing of creation and redemption units in relation to fluctuating net asset value during the period. |
| † | Market values are determined at the close of the New York Stock Exchange, which may be later than when the Funds’ net asset value is calculated. |
B-229
Table of Contents
| For the Year Ended December 31, 2015 |
||||||||||||||||||||||||
| Per Share Operating Performance |
Ultra Bloomberg Crude Oil^ |
Ultra Bloomberg Natural Gas* |
Ultra Gold |
Ultra Silver |
Ultra Euro |
Ultra Yen* |
||||||||||||||||||
| Net asset value, at December 31, 2014 |
$ | 101.4800 | $ | 61.6491 | $ | 40.0011 | $ | 39.3657 | $ | 19.8744 | $ | 56.4747 | ||||||||||||
| Net investment income (loss) |
(0.5621 | ) | (0.4982 | ) | (0.3292 | ) | (0.3258 | ) | (0.1505 | ) | (0.4787 | ) | ||||||||||||
| Net realized and unrealized gain (loss)# |
(75.7631 | ) | (42.5811 | ) | (9.9424 | ) | (11.9761 | ) | (4.2132 | ) | (1.2433 | ) | ||||||||||||
| Change in net asset value from operations |
(76.3252 | ) | (43.0793 | ) | (10.2716 | ) | (12.3019 | ) | (4.3637 | ) | (1.7220 | ) | ||||||||||||
| Net asset value, at December 31, 2015 |
$ | 25.1548 | $ | 18.5698 | $ | 29.7295 | $ | 27.0638 | $ | 15.5107 | $ | 54.7527 | ||||||||||||
| Market value per share, at December 31, 2014† |
$ | 103.70 | $ | 63.12 | $ | 38.41 | $ | 38.05 | $ | 19.80 | $ | 56.48 | ||||||||||||
| Market value per share, at December 31, 2015† |
$ | 25.08 | $ | 18.48 | $ | 29.73 | $ | 27.08 | $ | 15.51 | $ | 54.70 | ||||||||||||
| Total Return, at net asset value |
(75.2 | )% | (69.9 | )% | (25.7 | )% | (31.3 | )% | (22.0 | )% | (3.0 | )% | ||||||||||||
| Total Return, at market value |
(75.8 | )% | (70.7 | )% | (22.6 | )% | (28.8 | )% | (21.7 | )% | (3.2 | )% | ||||||||||||
| Ratios to Average Net Assets |
||||||||||||||||||||||||
| Expense ratio |
1.02 | % | 1.29 | % | 0.95 | % | 0.95 | % | 0.95 | % | 0.95 | % | ||||||||||||
| Expense ratio, excluding brokerage commissions |
0.95 | % | 0.95 | % | 0.95 | % | 0.95 | % | 0.95 | % | 0.95 | % | ||||||||||||
| Net investment income (loss) |
(0.98 | )% | (1.26 | )% | (0.90 | )% | (0.89 | )% | (0.93 | )% | (0.88 | )% | ||||||||||||
| * | See Note 1 of these Notes for Financial Statements. |
| ^ | See Note 9 of these Notes for Financial Statements. |
| # | The amount shown for a share outstanding throughout the period may not accord with the change in aggregate gains and losses during the period because of timing of creation and redemption units in relation to fluctuating net asset value during the period. |
| † | Market values are determined at the close of the New York Stock Exchange, which may be later than when the Funds’ net asset value is calculated. |
B-230
Table of Contents
Selected data for a Share outstanding throughout the year ended December 31, 2014:
| For the Year Ended December 31, 2014 |
||||||||||||||||||||||||
| Per Share Operating Performance |
VIX Short- Term Futures ETF* |
VIX Mid- Term Futures ETF* |
Short VIX Short-Term Futures ETF |
Ultra VIX Short-Term Futures ETF*^ |
UltraShort Bloomberg Crude Oil^ |
UltraShort Bloomberg Natural Gas* |
||||||||||||||||||
| Net asset value, at December 31, 2013 |
$ | 142.6934 | $ | 77.1837 | $ | 67.4993 | $ | 8,385.5437 | $ | 15.8651 | $ | 23.3212 | ||||||||||||
| Net investment income (loss) |
(1.0237 | ) | (0.5666 | ) | (1.0247 | ) | (72.6365 | ) | (0.1387 | ) | (0.1654 | ) | ||||||||||||
| Net realized and unrealized gain (loss)# |
(37.0093 | ) | (13.0151 | ) | (5.0742 | ) | (5,176.4342 | ) | 23.2631 | 4.8301 | ||||||||||||||
| Change in net asset value from operations |
(38.0330 | ) | (13.5817 | ) | (6.0989 | ) | (5,249.0707 | ) | 23.1244 | 4.6647 | ||||||||||||||
| Net asset value, at December 31, 2014 |
$ | 104.6604 | $ | 63.6020 | $ | 61.4004 | $ | 3,136.4730 | $ | 38.9895 | $ | 27.9859 | ||||||||||||
| Market value per share, at December 31, 2013† |
$ | 142.65 | $ | 77.16 | $ | 67.47 | $ | 8,390.00 | $ | 15.79 | $ | 23.12 | ||||||||||||
| Market value per share, at December 31, 2014† |
$ | 104.95 | $ | 63.89 | $ | 61.16 | $ | 3,143.75 | $ | 38.26 | $ | 27.34 | ||||||||||||
| Total Return, at net asset value |
(26.7 | )% | (17.6 | )% | (9.0 | )% | (62.6 | )% | 145.8 | % | 20.0 | % | ||||||||||||
| Total Return, at market value |
(26.4 | )% | (17.2 | )% | (9.4 | )% | (62.5 | )% | 142.3 | % | 18.3 | % | ||||||||||||
| Ratios to Average Net Assets |
||||||||||||||||||||||||
| Expense ratio |
0.92 | % | 0.87 | % | 1.49 | % | 1.80 | % | 0.98 | % | 1.18 | % | ||||||||||||
| Expense ratio, excluding brokerage commissions |
0.85 | % | 0.85 | % | 0.95 | % | 0.95 | % | 0.95 | % | 0.95 | % | ||||||||||||
| Net investment income (loss) |
(0.88 | )% | (0.84 | )% | (1.46 | )% | (1.78 | )% | (0.94 | )% | (1.14 | )% | ||||||||||||
| * | See Note 1 of these Notes for Financial Statements. |
| ^ | See Note 9 of these Notes for Financial Statements. |
| # | The amount shown for a share outstanding throughout the period may not accord with the change in aggregate gains and losses during the period because of timing of creation and redemption units in relation to fluctuating net asset value during the period. |
| † | Market values are determined at the close of the New York Stock Exchange, which may be later than when the Funds’ net asset value is calculated. |
B-231
Table of Contents
| For the Year Ended December 31, 2014 |
||||||||||||||||||||||||
| Per Share Operating Performance |
UltraShort Gold |
UltraShort Silver* |
Short Euro |
UltraShort Australian Dollar |
UltraShort Euro |
UltraShort Yen |
||||||||||||||||||
| Net asset value, at December 31, 2013 |
$ | 103.5180 | $ | 44.8910 | $ | 35.5867 | $ | 46.6384 | $ | 17.0613 | $ | 70.8640 | ||||||||||||
| Net investment income (loss) |
(0.8233 | ) | (0.3937 | ) | (0.3428 | ) | (0.4272 | ) | (0.1642 | ) | (0.6412 | ) | ||||||||||||
| Net realized and unrealized gain (loss)# |
(6.0431 | ) | 13.3098 | 4.8178 | 5.1678 | 4.6975 | 19.1108 | |||||||||||||||||
| Change in net asset value from operations |
(6.8664 | ) | 12.9161 | 4.4750 | 4.7406 | 4.5333 | 18.4696 | |||||||||||||||||
| Net asset value, at December 31, 2014 |
$ | 96.6516 | $ | 57.8071 | $ | 40.0617 | $ | 51.3790 | $ | 21.5946 | $ | 89.3336 | ||||||||||||
| Market value per share, at December 31, 2013† |
$ | 103.53 | $ | 45.10 | $ | 35.66 | $ | 46.66 | $ | 17.06 | $ | 70.91 | ||||||||||||
| Market value per share, at December 31, 2014† |
$ | 100.22 | $ | 59.70 | $ | 40.03 | $ | 51.37 | $ | 21.61 | $ | 89.30 | ||||||||||||
| Total Return, at net asset value |
(6.6 | )% | 28.8 | % | 12.6 | % | 10.2 | % | 26.6 | % | 26.1 | % | ||||||||||||
| Total Return, at market value |
(3.2 | )% | 32.4 | % | 12.3 | % | 10.1 | % | 26.7 | % | 25.9 | % | ||||||||||||
| Ratios to Average Net Assets |
||||||||||||||||||||||||
| Expense ratio |
0.95 | % | 0.95 | % | 0.96 | % | 1.01 | % | 0.95 | % | 0.95 | % | ||||||||||||
| Expense ratio, excluding brokerage commissions |
0.95 | % | 0.95 | % | 0.95 | % | 0.95 | % | 0.95 | % | 0.95 | % | ||||||||||||
| Net investment income (loss) |
(0.91 | )% | (0.90 | )% | (0.93 | )% | (0.97 | )% | (0.90 | )% | (0.90 | )% | ||||||||||||
| * | See Note 1 of these Notes for Financial Statements. |
| # | Percentages The amount shown for a share outstanding throughout the period may not accord with the change in aggregate gains and losses during the period because of timing of creation and redemption units in relation to fluctuating net asset value during the period. |
| † | Market values are determined at the close of the New York Stock Exchange, which may be later than when the Funds’ net asset value is calculated. |
B-232
Table of Contents
| For the Year Ended December 31, 2014 |
||||||||||||||||||||||||
| Per Share Operating Performance |
Ultra Bloomberg Crude Oil^ |
Ultra Bloomberg Natural Gas* |
Ultra Gold |
Ultra Silver |
Ultra Euro |
Ultra Yen* |
||||||||||||||||||
| Net asset value, at December 31, 2013 |
$ | 320.8990 | $ | 155.3534 | $ | 41.2553 | $ | 63.3305 | $ | 26.0346 | $ | 74.5261 | ||||||||||||
| Net investment income (loss) |
(2.1856 | ) | (1.5167 | ) | (0.4078 | ) | (0.5348 | ) | (0.2185 | ) | (0.6693 | ) | ||||||||||||
| Net realized and unrealized gain (loss)# |
(217.2334 | ) | (92.1876 | ) | (0.8464 | ) | (23.4300 | ) | (5.9417 | ) | (17.3821 | ) | ||||||||||||
| Change in net asset value from operations |
(219.4190 | ) | (93.7043 | ) | (1.2542 | ) | (23.9648 | ) | (6.1602 | ) | (18.0514 | ) | ||||||||||||
| Net asset value, at December 31, 2014 |
$ | 101.4800 | $ | 61.6491 | $ | 40.0011 | $ | 39.3657 | $ | 19.8744 | $ | 56.4747 | ||||||||||||
| Market value per share, at December 31, 2013† |
$ | 322.20 | $ | 157.12 | $ | 41.26 | $ | 63.04 | $ | 25.98 | $ | 74.44 | ||||||||||||
| Market value per share, at December 31, 2014† |
$ | 103.70 | $ | 63.12 | $ | 38.41 | $ | 38.05 | $ | 19.80 | $ | 56.48 | ||||||||||||
| Total Return, at net asset value |
(68.4 | )% | (60.3 | )% | (3.0 | )% | (37.8 | )% | (23.7 | )% | (24.2 | )% | ||||||||||||
| Total Return, at market value |
(67.8 | )% | (59.8 | )% | (6.9 | )% | (39.6 | )% | (23.8 | )% | (24.1 | )% | ||||||||||||
| Ratios to Average Net Assets |
||||||||||||||||||||||||
| Expense ratio |
0.99 | % | 1.13 | % | 0.95 | % | 0.95 | % | 0.95 | % | 0.95 | % | ||||||||||||
| Expense ratio, excluding brokerage commissions |
0.95 | % | 0.95 | % | 0.95 | % | 0.95 | % | 0.95 | % | 0.95 | % | ||||||||||||
| Net investment income (loss) |
(0.95 | )% | (1.10 | )% | (0.91 | )% | (0.91 | )% | (0.91 | )% | (0.90 | )% | ||||||||||||
| * | See Note 1 of these Notes for Financial Statements. |
| ^ | See Note 9 of these Notes for Financial Statements. |
| # | The amount shown for a share outstanding throughout the period may not accord with the change in aggregate gains and losses during the period because of timing of creation and redemption units in relation to fluctuating net asset value during the period. |
| † | Market values are determined at the close of the New York Stock Exchange, which may be later than when the Funds’ net asset value is calculated. |
B-233
Table of Contents
NOTE 8 – RISK
Correlation and Compounding Risk
The Geared Funds do not seek to achieve their stated investment objective over a period of time greater than a single day (as measured from NAV calculation time to NAV calculation time). The return of a Geared Fund for a period longer than a single day is the result of its return for each day compounded over the period and usually will differ from the inverse (-1x), two times the inverse (-2x), or two times (2x) of the return of the Geared Fund’s benchmark for the period. A Fund will lose money if its benchmark performance is flat over time, and it is possible for a Geared Fund to lose money over time even if the performance of its benchmark increases (or decreases in the case of Short and UltraShort Funds), as a result of daily rebalancing, the benchmark’s volatility and compounding. Longer holding periods, higher benchmark volatility, inverse exposure and greater leverage each affect the impact of compounding on a Fund’s returns. Daily compounding of a Geared Fund’s investment returns can dramatically and adversely affect its longer-term performance during periods of high volatility. Volatility may be at least as important to a Geared Fund’s return for a period as the return of the Fund’s underlying benchmark. The Matching VIX Funds seek to achieve their stated investment objective both over a single day and over time.
Each Ultra and UltraShort Fund uses leverage and should produce daily returns that are more volatile than that of its benchmark. For example, the daily return of an Ultra Fund with a 2x multiple should be approximately two times as volatile on a daily basis as is the return of a fund with an objective of matching the same benchmark. The daily return of a Short or UltraShort Fund is designed to return the inverse (-1x) or two times the inverse (-2x) of the return that would be expected of a fund with an objective of matching the same benchmark. The Geared Funds are not appropriate for all investors and present different risks than other funds. The Leveraged Funds use leverage and are riskier than similarly benchmarked exchange-traded funds that do not use leverage. An investor should only consider an investment in a Geared Fund if he or she understands the consequences of seeking daily leveraged, daily inverse or daily inverse leveraged investment results. Daily objective geared funds, if used properly and in conjunction with the investor’s view on the future direction and volatility of the markets, can be useful tools for investors who want to manage their exposure to various markets and market segments and who are willing to monitor and/or periodically rebalance their portfolios. Shareholders who invest in the Funds should actively manage and monitor their investments, as frequently as daily.
While the Funds expect to meet their investment objectives, several factors may affect their ability to do so. Among these factors are: (1) the Sponsor’s ability to purchase and sell Financial Instruments in a manner that correlates to a Fund’s objective; (2) an imperfect correlation between the performance of Financial Instruments held by a Fund and the performance of the applicable benchmark; (3) bid-ask spreads on such Financial Instruments; (4) fees, expenses, transaction costs, financing costs associated with the use of Financial Instruments and commission costs; (5) holding instruments traded in a market that has become illiquid or disrupted; (6) a Fund’s Share prices being rounded to the nearest cent and/or valuation methodology; (7) changes to a benchmark index that are not disseminated in advance; (8) the need to conform a Fund’s portfolio holdings to comply with investment restrictions or policies or regulatory or tax law requirements; (9) early and unanticipated closings of the markets on which the holdings of a Fund trade, resulting in the inability of the Fund to execute intended portfolio transactions; (10) accounting standards; and (11) differences caused by a Fund obtaining exposure to only a representative sample of the components of a benchmark, overweighting or underweighting certain components of a benchmark or obtaining exposure to assets that are not included in a benchmark.
A number of factors may affect a Geared Fund’s ability to achieve a high degree of correlation with its benchmark, and there can be no guarantee that a Fund will achieve a high degree of correlation. Failure to achieve a high degree of correlation may prevent a Geared Fund from achieving its investment objective. In order to achieve a high degree of correlation with their underlying benchmarks, the Geared Funds seek to rebalance their portfolios daily to keep exposure consistent with their investment objectives. Being materially under- or over-exposed to the benchmark may prevent such Geared Funds from achieving a high degree of correlation with such benchmark. Market disruptions or closure, large amounts of assets into or out of the Geared Funds, regulatory restrictions or extreme market volatility will adversely affect such Funds’ ability to adjust exposure to requisite levels. The target amount of portfolio exposure is impacted dynamically by the benchmarks’ movements during each day. Because of this, it is unlikely that the Geared Funds will be perfectly exposed (i.e., -1x, -2x or 2x, as applicable) to its benchmark at the end of each day, and the likelihood of being materially under- or over-exposed is higher on days when the benchmark levels are volatile near the close of the trading day.
B-234
Table of Contents
In addition, unlike other funds that do not rebalance their portfolios as frequently, each Geared Fund may be subject to increased trading costs associated with daily portfolio rebalancing in order to maintain appropriate exposure to the underlying benchmarks.
Counterparty Risk
Certain of the Funds will use swap agreements and/or forward contracts as a means to achieve their respective investment objectives. Such Funds will use either swap agreements and/or forward contracts referencing their respective benchmarks. These Funds may also invest in other swap agreements or forward contracts if such instruments tend to exhibit trading prices or returns that correlate with the benchmark or a component of the benchmark and will further the investment objective of the Fund. Certain Funds may invest in swap agreements or forward contracts if position accountability rules or position limits are reached with respect to specific futures contracts or the market for a specific futures contract experiences emergencies (e.g., natural disaster, terrorist attack or an act of God) or disruptions (e.g., a trading halt or a flash crash) that prevent the Funds from obtaining the appropriate amount of investment exposure to the affected futures contract or certain other futures contracts. Although unlikely, those Funds, under these circumstances, could have 100% exposure to swap agreements or forward contracts.
Swap agreements and forward contracts are generally traded in OTC markets and have only recently become subject to regulation by the CFTC. CFTC rules, however, do not cover all types of swap agreements and forward contracts. Investors, therefore, may not receive the protection of CFTC regulation or the statutory scheme of the Commodity Exchange Act (the “CEA”) in connection with each Fund’s swap agreements or forward contracts. The lack of regulation in these markets could expose investors to significant losses under certain circumstances, including in the event of trading abuses or financial failure by participants.
The Funds will be subject to credit risk with respect to the counterparties to the derivatives contracts (whether a clearing corporation in the case of cleared instruments or another third party in the case of OTC uncleared instruments). Unlike in futures contracts, the counterparty to uncleared swap agreements or forward contracts is generally a single bank or other financial institution, rather than a clearing organization backed by a group of financial institutions. As a result, a Fund is subject to credit risk with respect to the amount it expects to receive from counterparties to uncleared swaps and forward contracts entered into as part of that Fund’s principal investment strategy. If a counterparty becomes bankrupt or otherwise fails to perform its obligations due to financial difficulties, a Fund could suffer significant losses on these contracts and the value of an investor’s investment in a Fund may decline.
The Funds have sought to mitigate these risks by generally requiring that the counterparties for each Fund agree to post collateral for the benefit of the Fund, marked to market daily, subject to certain minimum thresholds; however there are no limitations on the percentage of its assets each Fund may invest in swap agreements or forward contracts with a particular counterparty. To the extent any such collateral is insufficient or there are delays in accessing the collateral, the Funds will be exposed to counterparty risk as described above, including possible delays in recovering amounts as a result of bankruptcy proceedings. The Funds typically enter into transactions only with major global financial institutions.
OTC swaps or forward contracts are less liquid than futures contracts because they are not traded on an exchange, do not have uniform terms and conditions, and are generally entered into based upon the creditworthiness of the parties and the availability of credit support, such as collateral, and in general, are not transferable without the consent of the counterparty. If the level of the Fund’s benchmark has a dramatic intraday move that would cause a material decline in the Fund’s NAV, the terms of the swap may permit the counterparty to immediately close out the transaction with the Fund. In that event, it may not be possible for the Fund to enter into another swap agreement or to invest in other Financial Instruments necessary to achieve the desired exposure consistent with the Fund’s objective. This, in turn, may prevent the Fund from achieving its investment objective, particularly if the level of the Fund’s benchmark reverses all or part of its intraday move by the end of the day. In addition, cleared derivative transactions benefit from daily marking-to-market and settlement, and segregation and minimum capital requirements applicable to intermediaries. Transactions entered into directly between two counterparties generally
B-235
Table of Contents
do not benefit from such protections. This exposes the Funds to the risk that a counterparty will not settle a transaction in accordance with its terms and conditions because of a dispute over the terms of the contract (whether or not bona fide) or because of a credit or liquidity problem, thus causing the Funds to suffer a loss.
Each counterparty and/or any of its affiliates may be an Authorized Participant or shareholder of a Fund.
The counterparty risk for cleared derivative transactions is generally lower than for uncleared OTC derivatives since generally a clearing organization becomes substituted for each counterparty to a cleared derivative contract and, in effect, guarantees the parties’ performance under the contract as each party to a trade looks only to the clearing house for performance of financial obligations. However, there can be no assurance that the clearing house, or its members, will satisfy its obligations to the Fund.
Leverage Risk
The Leveraged Funds may utilize leverage in seeking to achieve their respective investment objectives and will lose more money in market environments adverse to their respective daily investment objectives than funds that do not employ leverage. The use of leveraged and/or inverse leveraged positions could result in the total loss of an investor’s investment.
For example, because the UltraShort Funds and Ultra Funds include a two times the inverse (-2x), or a two times (2x) multiplier, a single-day movement in the relevant benchmark approaching 50% at any point in the day (for an UltraShort Fund or an UltraShort Fund) could result in the total loss or almost total loss of an investor’s investment if that movement is contrary to the investment objective of the Fund in which an investor has invested, even if such Fund’s benchmark subsequently moves in an opposite direction, eliminating all or a portion of the movement. This would be the case with downward single-day or intraday movements in the underlying benchmark of an Ultra Fund or upward single-day or intraday movements in the benchmark of an UltraShort Fund, even if the underlying benchmark maintains a level greater than zero at all times.
Liquidity Risk
Financial Instruments cannot always be liquidated at the desired price. It is difficult to execute a trade at a specific price when there is a relatively small volume of buy and sell orders in a market. A market disruption can also make it difficult to liquidate a position or find a swap or forward contract counterparty at a reasonable cost. Market illiquidity may cause losses for the Funds. The large size of the positions which the Funds may acquire increases the risk of illiquidity by both making their positions more difficult to liquidate and increasing the losses incurred while trying to do so. Any type of disruption or illiquidity will potentially be exacerbated due to the fact that the Funds will typically invest in Financial Instruments related to one benchmark, which in many cases is highly concentrated.
“Contango” and “Backwardation” Risk
In Funds that hold futures contracts, as the futures contracts near expiration, they are generally replaced by contracts that have a later expiration. Thus, for example, a contract purchased and held in November 2015 may specify a January 2016 expiration. As that contract nears expiration, it may be replaced by selling the January 2016 contract and purchasing the contract expiring in March 2016. This process is referred to as “rolling.” Rolling may have a positive or negative impact on performance. For example, historically, the prices of certain types of futures contracts have frequently been higher for contracts with shorter-term expirations than for contracts with longer-term expirations, which is referred to as “backwardation.” In these circumstances, absent other factors, the sale of the January 2016 contract would take place at a price that is higher than the price at which the March 2016 contract is purchased, thereby creating a gain in connection with rolling. While certain types of futures contracts have historically exhibited consistent periods of backwardation, backwardation will likely not exist in these markets at all times. The presence of contango (where prices of contracts are higher in the distant delivery months than in the nearer delivery months due to the costs of long-term storage of a physical commodity prior to delivery or other factors) in certain futures contracts at the time of rolling would be expected to adversely affect an Ultra Fund or a Matching VIX Fund that invests in such futures, and positively affect a Short Fund or an UltraShort Fund that invests in such futures. Similarly, the presence of backwardation in certain futures contracts at the time of rolling such contracts would be expected to adversely affect the Short Funds and UltraShort Funds, and positively affect the Ultra Funds and Matching VIX Funds.
B-236
Table of Contents
Since the introduction of VIX futures contracts, there have frequently been periods where VIX futures prices reflect higher expected volatility levels further out in time. This can result in a loss from “rolling” the VIX futures to maintain the constant weighted average maturity of the applicable VIX Futures Index. Losses from exchanging a lower priced VIX future for a higher priced longer-term future in the rolling process would adversely affect the value of each VIX Futures Index and, accordingly, decrease the return of the Ultra VIX Short-Term Futures ETF and the Matching VIX Funds.
Gold and silver historically exhibit persistent “contango” markets rather than backwardation. Natural gas, like crude oil, moves in and out of backwardation and contango but historically has been in contango most commonly. It is generally believed this is because the market needs to build inventories for most of the year in order to have enough storage to make it through a normal winter. Periods of backwardation are typically thought to be caused by demand shocks or supply shortages such as an unusually cold winter or a hurricane.
NOTE 9 – SUBSEQUENT EVENTS
Management has evaluated the possibility of subsequent events existing in the Trust’s and the Funds’ financial statements through the date the financial statements were issued. The subsequent events were as follows:
On December 22, 2016, the Trust announced a 2-for-1 split of the shares of beneficial interest of ProShares UltraShort Bloomberg Crude Oil (NYSE Arca symbol “SCO”). The split was effective prior to the opening of trading on NYSE Arca on January 12, 2017.
The split was effective for shareholders of record after the close of the markets on January 9, 2017 and payable after the close of the markets on January 11, 2017. The Fund traded at its post-split price on January 12, 2017. The ticker symbol for the Fund did not change, and the Fund continues to trade on NYSE Arca.
The split was applied retroactively for all periods presented, increasing the number of shares outstanding for ProShares UltraShort Bloomberg Crude Oil, and resulted in a proportionate decrease in the price per share and per share information of ProShares UltraShort Bloomberg Crude Oil. Therefore, the split did not change the aggregate net asset value of a shareholder’s investment at the time of the split.
On December 22, 2016, the Trust announced a 1-for-2 reverse split of the shares of beneficial interest of ProShares Ultra Bloomberg Crude Oil (NYSE Arca symbol “UCO”) and a 1-for-5 reverse split of the shares of beneficial interest of ProShares Ultra VIX Short-Term Futures ETF (NYSE Arca symbol “UVXY”). The reverse splits were effective prior to the opening of trading on NYSE Arca on January 12, 2017.
The reverse splits were effective for shareholders at the market open on January 12, 2017, when the Funds traded at their post-split price. The ticker symbols for the Funds did not change, and each Fund was issued a new CUSIP numbers.
The reverse splits were applied retroactively for all periods presented, reducing the number of shares outstanding for ProShares Ultra Bloomberg Crude Oil and ProShares Ultra VIX Short-Term Futures ETF, and resulted in a proportionate increase in the price per share and per share information of ProShares Ultra Bloomberg Crude Oil and ProShares Ultra VIX Short-Term Futures ETF. Therefore, the reverse splits did not change the aggregate net asset value of a shareholder’s investment at the time of the reverse splits.
B-237
Table of Contents
PART II
Information Not Required in Prospectus
| Item 13. | Other Expenses of Issuance and Distribution. |
The following chart reflects estimated amounts required to prepare and file this Registration Statement and complete the offering of the Shares.
| Approximate Amount |
||||
| Securities and Exchange Commission Registration Fee |
$ | 18,582 | * | |
| FINRA Filing Fee |
$ | 0 | ||
| Printing Expenses |
$ | 10,000 | ||
| Fees of Certified Public Accountants |
$ | 5,000 | ||
| Fees of Counsel |
$ | 15,000 | ||
|
|
|
|||
| Total |
$ | 48,582 | ||
|
|
|
|||
| * | Previously paid in connection with the filing of an earlier Registration Statement on Form S-3 (Registration No. 333-213918). |
| Item 14. | Indemnification of Directors and Officers. |
The amended and restated Trust Agreement of the Trust provides for, and as amended from time-to-time, will provide for, the indemnification of the Sponsor. The Sponsor (including Covered Persons as will be provided under each amended and restated Trust Agreement) shall be indemnified by the Trust (or any Fund separately to the extent the matter in question relates to a single Fund or is otherwise disproportionate), against any losses, judgments, liabilities, expenses and amounts paid in settlement of any claims sustained by it in connection with the defense or disposition of any action, suit or other proceeding, whether civil or criminal, before any court or administrative or legislative body, in which such Sponsor may be or may have been involved as a party or otherwise or with which such Sponsor may be or may have been threatened, while in office or thereafter, by reason of any alleged act or omission as the Sponsor or by reason of his or her being or having been the Sponsor except with respect to any matter as to which such Sponsor shall have been finally adjudicated in any such action, suit or other proceeding not to have acted in good faith in the reasonable belief that such Sponsor’s action was in the best interests of the Trust and except that the Sponsor shall not be indemnified against any liability to the Trust or its Shareholders by reason of willful misconduct or gross negligence of such Sponsor.
| Item 15. | Recent Sales of Unregistered Securities. |
None.
| Item 16. | Exhibits and Financial Statement Schedules. |
The following documents (unless otherwise indicated) are filed herewith and made a part of this Registration Statement:
| (a) | Exhibits. The following exhibits are filed herewith: |
II-1
Table of Contents
| Exhibit Number |
Description of Document | |
| 4.1 | Amended and Restated Trust Agreement of ProShares Trust II(1) | |
| 4.2 | Form of Authorized Participant Agreement(2) | |
| 5.1 | Opinion of Richards, Layton & Finger, P.A. as to legality | |
| 8.1 | Opinion of Sidley Austin LLP as to income tax matters | |
| 10.1 | Form of Sponsor Agreement(3) | |
| 10.2 | Form of Administration and Transfer Agency Services Agreement(2) | |
| 10.3 | Form of Custodian Agreement(4) | |
| 10.4 | Form of Distribution Agreement(2) | |
| 10.5 | Form of Futures Account Agreement(2) | |
| 10.6 | Form of Institutional Master Futures Client Account Agreement(5) | |
| 23.1 | Consent of Richards, Layton & Finger, P.A. (included in Exhibit 5.1) | |
| 23.2 | Consent of Sidley Austin LLP (included in Exhibit 8.1) | |
| 23.3 | Consent of PricewaterhouseCoopers LLP | |
| 24.1 | Power of Attorney(6) | |
| (1) | Incorporated by reference to the Trust’s Registration Statement, filed on September 18, 2008. |
| (2) | Incorporated by reference to the Trust’s Registration Statement, filed on November 17, 2008. |
| (3) | Incorporated by reference to the Trust’s Registration Statement, filed on August 15, 2008. |
| (4) | Incorporated by reference to the Trust’s Registration Statement, filed on October 22, 2008. |
| (5) | Incorporated by reference to the Trust’s Registration Statement filed on September 16, 2011. |
| (6) | Previously filed with the Registration Statement on February 7, 2017 |
| (b) | The following financial statements are included in the Prospectus: |
| ProShares VIX Short-Term Futures ETF |
||
| ProShares VIX Mid-Term Futures ETF |
||
| ProShares Short VIX Short-Term Futures ETF |
||
| ProShares Ultra VIX Short-Term Futures ETF |
||
| ProShares UltraShort Bloomberg Crude Oil |
||
| ProShares UltraShort Bloomberg Natural Gas |
||
| ProShares UltraShort Gold |
||
| ProShares UltraShort Silver |
||
| ProShares Short Euro |
||
| ProShares UltraShort Australian Dollar |
||
| ProShares UltraShort Euro |
||
| ProShares UltraShort Yen |
||
| ProShares Ultra Bloomberg Crude Oil |
||
| ProShares Ultra Bloomberg Natural Gas |
||
| ProShares Ultra Gold |
||
II-2
Table of Contents
| ProShares Ultra Silver |
||
| ProShares Ultra Euro |
||
| ProShares Ultra Yen |
||
| ProShares Trust II |
||
| Notes to Financial Statements |
||
| Item 17. | Undertakings. |
| (a) | The undersigned registrant hereby undertakes: |
| (1) | To file, during any period in which offers or sales are being made, a post-effective amendment to this registration statement; |
| (i) | To include any prospectus required by section 10(a)(3) of the Securities Act of 1933, as amended; |
| (ii) | To reflect in the prospectus any facts or events arising after the effective date of the registration statement (or the most recent post-effective amendment thereof) which, individually or in the aggregate, represent a fundamental change in the information set forth in the registration statement. |
| Notwithstanding the foregoing, any increase or decrease in volume of securities offered (if the total dollar value of securities offered would not exceed that which was registered) and any deviation from the low or high end of the estimated maximum offering range may be reflected in the form of prospectus filed with the Commission pursuant to Rule 424(b) if, in the aggregate, the changes in volume and price represent no more than a 20 per cent change in the maximum aggregate offering price set forth in the “Calculation of Registration Fee” table in the effective registration statement; |
| (iii) | To include any material information with respect to the plan of distribution not previously disclosed in the registration statement or any material change to such information in the registration statement; |
Provided, however, that:
| (A) | Paragraphs (a)(1)(i) and (a)(1)(ii) of this section do not apply if the registration statement is on Form S–8, and the information required to be included in a post-effective amendment by those paragraphs is contained in reports filed with or furnished to the Commission by the registrant pursuant to section 13 or section 15(d) of the Securities Exchange Act of 1934 that are incorporated by reference in the registration statement; and |
| (B) | Paragraphs (a)(1)(i), (a)(1)(ii) and (a)(1)(iii) of this section do not apply if the registration statement is on Form S–3 or Form F–3 and the information required to be included in a post-effective amendment by those paragraphs is contained in reports filed with or furnished to the Commission by the registrant pursuant to section 13 or section 15(d) of the Securities Exchange Act of 1934 that are incorporated by reference in the registration statement, or is contained in a form of prospectus filed pursuant to Rule 424(b) that is part of the registration statement. |
| (2) | That, for the purpose of determining any liability under the Securities Act of 1933, each such post-effective amendment shall be deemed to be a new registration statement relating to the securities offered therein, and the offering of such securities at that time shall be deemed to be the bona fide offering thereof. |
II-3
Table of Contents
| (3) | To remove from registration by means of a post-effective amendment any of the securities being registered which remain unsold at the termination of the offering. |
| (4) | That each prospectus filed pursuant to Rule 424(b) as part of a registration statement relating to this offering, other than registration statements relying on Rule 430B or other than prospectuses filed in reliance on Rule 430A, shall be deemed to be part of and included in this registration statement as of the date it is first used after effectiveness. Provided, however, that no statement made in a registration statement or prospectus that is part of the registration statement or made in a document incorporated or deemed incorporated by reference into a registration statement or prospectus that is part of the registration statement will, as to a purchaser with a time of contract of sale prior to such first use, supersede or modify any statement that was made in the registration statement or prospectus that was part of the registration statement or made in any such document immediately prior to such date of first use. |
| (5) | That, for the purpose of determining liability of the registrant under the Securities Act of 1933 to any purchaser in the initial distribution of the securities: |
The undersigned registrant undertakes that in a primary offering of securities of the undersigned registrant pursuant to this registration statement, regardless of the underwriting method used to sell the securities to the purchaser, if the securities are offered or sold to such purchaser by means of any of the following communications, the undersigned registrant will be a seller to the purchaser and will be considered to offer or sell such securities to such purchaser:
| (i) | Any preliminary prospectus or prospectus of the undersigned registrant relating to the offering required to be filed pursuant to Rule 424; |
| (ii) | Any free writing prospectus relating to the offering prepared by or on behalf of the undersigned registrant or used or referred to by the undersigned registrant; |
| (iii) | The portion of any other free writing prospectus relating to the offering containing material information about the undersigned registrant or their securities provided by or on behalf of the undersigned registrant; and |
| (iv) | Any other communication that is an offer in the offering made by the undersigned registrant to the purchaser. |
| (b) | Insofar as indemnification for liabilities under the Securities Act of 1933 may be permitted to directors, officers or persons controlling the registrant pursuant to the provisions described in Item 14 above, or otherwise, the registrant has been informed that in the opinion of the Securities and Exchange Commission such indemnification is against public policy as expressed in the Act and is, therefore, unenforceable. In the event that a claim for indemnification against such liabilities (other than the payment by the registrant of expenses incurred or paid by a director, officer or controlling person of the registrant in the successful defense of any such action, suit or proceeding) is asserted by such director, officer or controlling person in connection with the securities being registered, the registrant will, unless in the opinion of their respective counsel the matter has been settled by controlling precedent, submit to a court of appropriate jurisdiction the question whether such indemnification by it is against public policy as expressed in the Act and will be governed by the final adjudication of such issue. |
| (i) | The undersigned registrant hereby undertakes that: |
| (1) | For purposes of determining any liability under the Securities Act of 1933, the information omitted from the form of prospectus filed as part of this registration statement in reliance upon Rule 430A and contained in a form of prospectus filed by the registrant pursuant to Rule 424(b)(1) or (4) or 497(h) under the Securities Act shall be deemed to be part of this registration statement as of the time it was declared effective. |
| (2) | For the purpose of determining any liability under the Securities Act of 1933, each post-effective amendment that contains a form of prospectus shall be deemed to be a new registration statement relating to the securities offered therein, and the offering of such securities at the time shall be deemed to be the initial bona fide offering thereof. |
II-4
Table of Contents
SIGNATURES
Pursuant to the requirements of the Securities Act of 1933, the Registrant has duly caused this Registration Statement on Form S-1 to be signed on its behalf by the undersigned, thereunto duly authorized, in the city of Bethesda, State of Maryland, on the 27th day of February, 2017.
| ProShares Trust II | ||
| By: | /s/ Todd B. Johnson | |
| Name: | Todd B. Johnson | |
| Title: | Principal Executive Officer | |
Pursuant to the requirements of the Securities Act of 1933, this Registration Statement on Form S-1 has been signed by the following persons in the capacities and on the date indicated.
| /s/ Todd B. Johnson |
Principal Executive Officer | February 27, 2017 | ||
| Name: Todd B. Johnson | ||||
| /s/ Edward Karpowicz |
Principal Financial Officer | February 27, 2017 | ||
| Name: Edward Karpowicz | Principal Accounting Officer |
|||
Pursuant to the requirements of the Securities Act of 1933, this Registration Statement on Form S-1 has been signed by the following persons on behalf of the Sponsor in the capacities and on the date indicated.
| /s/ Louis M. Mayberg Name: Louis M. Mayberg* |
Member of the Sponsor (Director) |
February 27, 2017 | ||
| /s/ Michael L. Sapir Name: Michael L. Sapir* |
Member of the Sponsor (Director) |
February 27, 2017 | ||
* Signed by Todd B. Johnson pursuant to power of attorney dated February 7, 2017.