Attached files
| file | filename |
|---|---|
| EX-23.1 - EX-23.1 - J.Jill, Inc. | d272297dex231.htm |
| EX-10.18 - EX-10.18 - J.Jill, Inc. | d272297dex1018.htm |
| EX-10.17 - EX-10.17 - J.Jill, Inc. | d272297dex1017.htm |
| EX-10.16 - EX-10.16 - J.Jill, Inc. | d272297dex1016.htm |
| EX-10.15 - EX-10.15 - J.Jill, Inc. | d272297dex1015.htm |
| EX-10.14 - EX-10.14 - J.Jill, Inc. | d272297dex1014.htm |
| EX-10.13 - EX-10.13 - J.Jill, Inc. | d272297dex1013.htm |
| EX-10.11 - EX-10.11 - J.Jill, Inc. | d272297dex1011.htm |
| EX-10.10 - EX-10.10 - J.Jill, Inc. | d272297dex1010.htm |
| EX-10.9 - EX-10.9 - J.Jill, Inc. | d272297dex109.htm |
| EX-10.2 - EX-10.2 - J.Jill, Inc. | d272297dex102.htm |
| EX-10.1 - EX-10.1 - J.Jill, Inc. | d272297dex101.htm |
| EX-5.1 - EX-5.1 - J.Jill, Inc. | d272297dex51.htm |
| EX-3.2 - EX-3.2 - J.Jill, Inc. | d272297dex32.htm |
| EX-3.1 - EX-3.1 - J.Jill, Inc. | d272297dex31.htm |
| EX-1.1 - EX-1.1 - J.Jill, Inc. | d272297dex11.htm |
Table of Contents
As filed with the Securities and Exchange Commission on February 27, 2017
Registration No. 333-215993
UNITED STATES
SECURITIES AND EXCHANGE COMMISSION
Washington, D.C. 20549
Amendment No. 1
to
FORM S-1
REGISTRATION STATEMENT
UNDER
THE SECURITIES ACT OF 1933
J.Jill, Inc.
(Exact Name of Registrant as Specified in Its Charter)
| Delaware | 5621 | 45-1459825 | ||
| (State or other jurisdiction of incorporation or organization) |
(Primary Standard Industrial Classification Code Number) |
(IRS Employer Identification Number) |
4 Batterymarch Park
Quincy, MA 02169
(617) 376-4300
(Address, including zip code, and telephone number, including area code, of Registrant’s principal executive offices)
David Biese
Chief Financial Officer
4 Batterymarch Park
Quincy, MA 02169
(617) 376-4300
(Name, address, including zip code, and telephone number, including area code, of agent for service)
With copies to:
| Raphael M. Russo, Esq. Paul, Weiss, Rifkind, Wharton & Garrison LLP 1285 Avenue of the Americas New York, NY 10019-6064 (212) 373-3000 |
Marc D. Jaffe, Esq. Ian D. Schuman, Esq. Latham & Watkins LLP 885 Third Avenue New York, NY 10022 (212) 906-1200 |
Approximate date of commencement of proposed sale to the public: As soon as practicable after the effective date of this Registration Statement.
If any of the securities being registered on this Form are to be offered on a delayed or continuous basis pursuant to Rule 415 under the Securities Act of 1933, please check the following box. ☐
If this Form is filed to register additional securities for an offering pursuant to Rule 462(b) under the Securities Act, please check the following box and list the Securities Act registration statement number of the earlier effective registration statement for the same offering. ☐
If this Form is a post-effective amendment filed pursuant to Rule 462(c) under the Securities Act, check the following box and list the Securities Act registration statement number of the earlier effective registration statement for the same offering. ☐
If this Form is a post-effective amendment filed pursuant to Rule 462(d) under the Securities Act, check the following box and list the Securities Act registration statement number of the earlier effective registration statement for the same offering. ☐
Indicate by check mark whether the registrant is a large accelerated filer, an accelerated filer, a non-accelerated filer, or a smaller reporting company. See the definitions of “large accelerated filer,” “accelerated filer” and “smaller reporting company” in Rule 12b-2 of the Exchange Act.
| Large accelerated filer ☐ | Accelerated filer ☐ | Non-accelerated filer ☑ | Smaller reporting company ☐ |
(Do not check if a smaller reporting company)
CALCULATION OF REGISTRATION FEE
|
| ||||||||
| Title of each Class of Securities to be Registered |
Amount to be Registered(1)(2) |
Proposed Maximum Offering Price per Share |
Proposed Maximum Offering Price(1)(2) |
Amount of Registration Fee(3) | ||||
| Common Stock, par value $0.01 per share |
13,416,667 | $16.00 | $214,666,672 | $24,880 | ||||
|
| ||||||||
|
| ||||||||
| (1) | Estimated solely for the purpose of calculating the registration fee pursuant to Rule 457(o) under the Securities Act of 1933, as amended. |
| (2) | Includes offering price of 1,750,000 additional shares that the underwriters have the option to purchase to cover over-allotments, if any. |
| (3) | $11,590 of such fee was previously paid and the remaining amount of $13,290 is being paid herewith. |
The registrant hereby amends this Registration Statement on such date or dates as may be necessary to delay its effective date until the registrant shall file a further amendment which specifically states that this Registration Statement shall thereafter become effective in accordance with Section 8(a) of the Securities Act of 1933 or until the Registration Statement shall become effective on such date as the Commission, acting pursuant to said Section 8(a), may determine.
Table of Contents
The information in this prospectus is not complete and may be changed. We may not sell these securities until the registration statement filed with the Securities and Exchange Commission is effective. This prospectus is not an offer to sell these securities and it is not soliciting an offer to buy these securities in any state where the offer or sale is not permitted.
Subject to Completion
Preliminary Prospectus dated February 27, 2017
PROSPECTUS
11,666,667 Shares

J.Jill, Inc.
Common Stock
This is J.Jill, Inc.’s initial public offering. All of the 11,666,667 shares of common stock are being sold by the selling stockholder. We will not receive any proceeds from the sale of shares to be offered by the selling stockholder.
We are an “emerging growth company” as defined under the federal securities laws and are eligible for reduced public company reporting requirements. Please see “Prospectus Summary—Implications of being an Emerging Growth Company.” We will also be a “controlled company” under the corporate governance rules for New York Stock Exchange listed companies and will be exempt from certain corporate governance requirements of the rules. See “Risk Factors—Risks Related to this Offering and Ownership of our Common Stock.”
We expect the public offering price to be between $14.00 and $16.00 per share. Currently, no public market exists for the shares. The shares have been approved for listing on the New York Stock Exchange under the symbol “JILL.”
Investing in the common stock involves risks that are described in the “Risk Factors” section beginning on page 17 of this prospectus.
| Per Share |
Total |
|||||||
| Public offering price |
$ | $ | ||||||
| Underwriting discount(1) |
$ | $ | ||||||
| Proceeds, before expenses, to the selling stockholder |
$ | $ | ||||||
| (1) | We refer you to the section “Underwriting” beginning on page 134 of this prospectus for additional information regarding underwriting compensation. |
The underwriters may also exercise their option to purchase up to an additional 1,750,000 shares from the selling stockholder at the public offering price, less the underwriting discount, for 30 days after the date of this prospectus.
Neither the Securities and Exchange Commission nor any state securities commission has approved or disapproved of these securities or determined if this prospectus is truthful or complete. Any representation to the contrary is a criminal offense.
The shares will be ready for delivery on or about , 2017.
| BofA Merrill Lynch | Morgan Stanley | Jefferies | ||||
| Deutsche Bank Securities | RBC Capital Markets |
UBS Investment Bank |
Wells Fargo Securities | |||
| Cowen and Company | Macquarie Capital | SunTrust Robinson Humphrey | ||
The date of this prospectus is , 2017.
Table of Contents

Table of Contents

Table of Contents

Table of Contents

Table of Contents

Table of Contents

Table of Contents

Table of Contents
For investors outside the United States: neither we nor the underwriters have done anything that would permit this offering or possession or distribution of this prospectus or any free writing prospectus we may provide to you in connection with this offering in any jurisdiction where action for that purpose is required, other than in the United States. You are required to inform yourselves about and to observe any restrictions relating to this offering and the distribution of this prospectus and any such free writing prospectus outside of the United States.
| 1 | ||||
| 17 | ||||
| 39 | ||||
| 41 | ||||
| 41 | ||||
| 42 | ||||
| 43 | ||||
| 45 | ||||
| 47 | ||||
| 49 | ||||
| MANAGEMENT’S DISCUSSION AND ANALYSIS OF FINANCIAL CONDITION AND RESULTS OF OPERATIONS |
58 | |||
| 83 | ||||
| 97 | ||||
| 102 | ||||
| 118 | ||||
| 121 | ||||
| 123 | ||||
| 128 | ||||
| 130 | ||||
| 134 | ||||
| 142 | ||||
| 142 | ||||
| 142 | ||||
| F-1 |
You should rely only on the information contained in this prospectus and any related free writing prospectus that we may provide to you in connection with this offering. We have not, and the underwriters have not, authorized any other person to provide you with different information. If anyone provides you with different or inconsistent information, you should not rely on it. We are not, and the underwriters are not, making an offer to sell these securities in any jurisdiction where the offer or sale is not permitted. You should assume that the information appearing in this prospectus is accurate only as of the date on the front cover of this prospectus. Our business, financial condition, results of operations and prospects may have changed since that date.
i
Table of Contents
Trademarks, Trade Names and Service Marks
We use various trademarks, trade names and service marks in our business, including without limitation J.Jill®, The J.Jill Wearever Collection® and Pure Jill®. This prospectus contains references to our trademarks and to trademarks belonging to other entities. Solely for convenience, trademarks and trade names referred to in this prospectus may appear without the ® or ™ symbols, but such references are not intended to indicate, in any way, that we will not assert, to the fullest extent under applicable law, our rights or the rights of the applicable licensor to these trademarks and trade names. We do not intend our use or display of other companies’ trade names or trademarks to imply a relationship with, or endorsement or sponsorship of us by, any other companies.
Industry and Market Data
Industry and market data used throughout this prospectus were obtained through company research, surveys and studies conducted by third parties and industry and general publications. Industry publications and surveys generally state that the information contained therein has been obtained from sources believed to be reliable. Statistical data in this prospectus related to our customers is based on the approximately 97% of transactions that we are able to match to an identifiable customer. Although we believe the industry and market data to be reliable as of the date of this prospectus, this information could prove to be inaccurate. Industry and market data could be wrong because of the method by which sources obtained their data and because information cannot always be verified with complete certainty due to the limits on the availability and reliability of raw data, the voluntary nature of the data gathering process and other limitations and uncertainties. In addition, we do not know all of the assumptions regarding general economic conditions or growth that were used in preparing the forecasts from the sources relied upon or cited herein. While we are not aware of any misstatements regarding the industry data presented herein, estimates involve risks and uncertainties and are subject to change based on various factors, including those discussed under the heading “Risk Factors.”
Basis of Presentation
On May 8, 2015, an investment vehicle of investment funds affiliated with TowerBrook Capital Partners L.P. acquired all of our outstanding equity interests through the newly formed entities JJill Holdings, Inc. (“JJill Holdings”) and JJill Topco Holdings, LP (“JJill Topco Holdings”). We refer to such acquisition and the related financing transactions as the “Acquisition.” As a result of the Acquisition and related change in control, JJill Holdings applied purchase accounting as of May 8, 2015. We elected to push down the effects of the Acquisition to our consolidated financial statements. As such, the financial information provided in this prospectus is presented as “Predecessor” or “Successor” to indicate whether they relate to the period preceding the Acquisition or the period succeeding the Acquisition, respectively. Due to the change in the basis of accounting resulting from the Acquisition, the consolidated financial statements for the Predecessor periods and the consolidated financial statements for the Successor periods, included elsewhere in this prospectus, are not necessarily comparable.
Our fiscal year is the 52- or 53-week period ending on the Saturday closest to the January calendar month-end. The Predecessor period from February 1, 2015 to May 7, 2015, which is presented separately as the “2015 Predecessor Period” in this prospectus, consisted of approximately 14 weeks. The Successor period from May 8, 2015 to January 30, 2016, which is presented separately as the “2015 Successor Period” in this prospectus, consisted of approximately 38 weeks. References in this prospectus to “pro forma fiscal year 2015” refer to the unaudited pro forma consolidated statement of operations, which has been derived from our consolidated audited statements of operations included elsewhere in this prospectus and represents the addition of the Predecessor period from February 1, 2015 through May 7, 2015 and the Successor period from May 8, 2015 through January 30, 2016 and gives effect to the following as if they had occurred on February 1, 2015: (i) the Acquisition; (ii) the related Acquisition financing as provided for under our term loan credit agreement, dated as of May 8, 2015, by and among Jill Holdings LLC, Jill Acquisition LLC, a wholly-owned subsidiary of us, the various lenders party thereto and Jefferies Finance LLC as the administrative agent, as amended on May 27, 2016 by Amendment No. 1 thereto (the “Term Loan”) and our ABL credit agreement, dated as of May 8, 2015, by and among Jill Holdings LLC, Jill Acquisition LLC, certain subsidiaries from time to time party thereto, the lenders
ii
Table of Contents
party thereto and CIT Finance LLC as the administrative agent and collateral agent, as amended on May 27, 2016 by Amendment No. 1 thereto (the “ABL Facility”); and (iii) our merger with our direct parent company, JJill Holdings, which will occur prior to the completion of this offering, as if they had occurred on February 1, 2015. See “Unaudited Pro Forma Consolidated Financial Information” included elsewhere in this prospectus for additional information. References in this prospectus to “fiscal year 2016” refer to the fiscal year ending January 28, 2017, references to “fiscal year 2015” refer to the year ended January 30, 2016, references to “fiscal year 2014” refer to the fiscal year ended January 31, 2015 and references to “fiscal year 2013” refer to the fiscal year ended February 1, 2014.
As used in this prospectus, unless otherwise indicated or the context otherwise requires, references to:
| • | the “Company,” “J.Jill,” “we,” “us” and “our” refer to J.Jill, Inc. and its consolidated subsidiaries; |
| • | “TowerBrook” means TowerBrook Capital Partners L.P. or the investment funds affiliated with TowerBrook Capital Partners L.P. or an investment vehicle of such funds, as the context requires; |
| • | “GAAP” refers to U.S. generally accepted accounting principles; |
| • | “retention rate” refers to, for a one-year period or fiscal year, the percentage of customers that made at least one purchase at J.Jill in the previous one-year period or fiscal year and also made at least one purchase at J.Jill in such one-year period or fiscal year; |
| • | “4-wall contribution” refers to a particular store’s or group of stores’ net sales, less product costs and direct operating costs, including payroll, occupancy and other operating costs specifically associated with that store or group of stores. 4-wall contribution is an assessment of store-level profitability and a supplemental measure of the operating performance of our stores that is neither required by, nor presented in accordance with, GAAP and our calculations thereof may not be comparable to those reported by other companies. We present this measure as we believe it is frequently used by securities analysts, investors and other interested parties to evaluate companies in our industry and we use it internally as a benchmark to compare our performance to that of our competitors. This measure has limitations as an analytical tool, and you should not consider it in isolation or as a substitute for analysis of our results as reported under GAAP; |
| • | “payback” or “payback period” refer to, for a particular store or group of stores, the period of time from its opening measured in years, that it takes for the cumulative 4-wall contribution for a particular store or group of stores to equal our net cash investment in that store or group of stores; |
| • | “cash-on-cash return” is calculated by dividing the 4-wall contribution for a particular store or group of stores by our total net cash investment in that store or group of stores. Cash-on-cash return is a supplemental measure of operating performance that is neither required by, nor presented in accordance with, GAAP and our calculations thereof may not be comparable to those reported by other companies. We present this measure as we believe it is frequently used by securities analysts, investors and other interested parties to evaluate companies in our industry and we use it internally as a benchmark to compare our performance to that of our competitors. This measure has limitations as an analytical tool, and you should not consider it in isolation or as a substitute for analysis of our results as reported under GAAP; |
| • | “total company comparable sales” refers to net sales from our full-price stores, open for more than 52 weeks, and our direct channel. When a store in the total company comparable store base is temporarily closed for remodeling or other reasons, it is included in total company comparable sales only using the full weeks it was open. Total company comparable sales for fiscal year 2012 are based on 52 weeks and exclude the 53rd week in fiscal year 2012; |
| • | “average unit volume” is calculated by dividing our total net retail sales by our total number of stores; |
iii
Table of Contents
| • | “active customer base” refers to unique customers who have made a purchase within the past twelve months; |
| • | “Aided Brand Awareness” refers to a measure of the number of people who recognize the J.Jill brand from a list of possible names offered as a prompt in a customer survey we conducted; |
| • | “Net Promoter Score” refers to a customer loyalty metric used in a customer survey we conducted, that was calculated based on responses to a single question: How likely are you to recommend J.Jill to your friends and family?; |
| • | “full-price store” or “full-price location” refer to a store that is not a clearance store; and |
| • | “E-commerce business” refers to the orders of J.Jill’s products that are placed through our website, www.jjill.com. |
Non-GAAP Financial Measures
The following financial measures presented in this prospectus are key performance indicators used by management and typically used by our competitors in the retail industry, but are not recognized under GAAP:
| • | “Adjusted EBITDA” represents net income (loss) plus interest expense, provision (benefit) for income taxes, depreciation and amortization, the amortization of the step-up to fair value of merchandise inventory resulting from the application of a purchase accounting adjustment related to the Acquisition, certain Acquisition-related expenses, sponsor fees, equity-based compensation expense, write-off of property and equipment and other non-recurring expenses, primarily consisting of outside legal and professional fees associated with certain non-recurring transactions and events; and |
| • | “Adjusted EBITDA margin” represents, for any period, Adjusted EBITDA as a percentage of net sales. |
Adjusted EBITDA and Adjusted EBITDA margin are supplemental measures of our operating performance that are neither required by, nor presented in accordance with, GAAP and our calculations thereof may not be comparable to those reported by other companies. We present these measures as we believe they are frequently used by securities analysts, investors and other interested parties to evaluate companies in our industry and we use them internally as a benchmark to compare our performance to that of our competitors. These measures have limitations as analytical tools, and you should not consider them in isolation or as substitutes for analysis of our results as reported under GAAP.
Adjusted EBITDA is not a measurement of our financial performance under GAAP and should not be considered as an alternative to net income (loss), operating income or any other performance measures derived in accordance with GAAP or as an alternative to cash flows from operating activities as a measure of our liquidity. We believe Adjusted EBITDA facilitates operating performance comparisons from period to period by isolating the effects of some items that vary from period to period without any correlation to ongoing operating performance. Potential differences between our measure of Adjusted EBITDA versus other similar companies’ measures of Adjusted EBITDA may be caused by variations in capital structures (affecting interest expense), tax positions (such as the impact on periods or changes in effective tax rates or net operating losses) and the age and book depreciation of facilities and equipment (affecting relative depreciation expense). Our presentation of Adjusted EBITDA should not be construed as an inference that our future results will be unaffected by unusual or non-recurring items.
For a discussion of the use of these financial measures and a reconciliation of net income to Adjusted EBITDA and the calculation of Adjusted EBITDA margin, see “Prospectus Summary—Summary Consolidated Historical and Pro Forma Financial and Other Data.”
iv
Table of Contents
The following summary contains selected information about us and about this offering. It does not contain all of the information that is important to you and your investment decision. Before you make an investment decision, you should review this prospectus in its entirety, including matters set forth under “Risk Factors,” “Management’s Discussion and Analysis of Financial Condition and Results of Operations” and our consolidated financial statements and the related notes thereto included elsewhere in this prospectus. Some of the statements in the following summary constitute forward-looking statements. See “Cautionary Note Regarding Forward-Looking Statements.”
In this prospectus, unless otherwise indicated or the context otherwise requires, references to the “Company,” “J.Jill,” “we,” “us,” and “our” refer to J.Jill, Inc. and its consolidated subsidiaries.
Overview
Our Company
J.Jill is a nationally recognized women’s apparel brand focused on a loyal, engaged and affluent customer in the attractive 40-65 age segment. The J.Jill brand represents an easy, relaxed and inspired style that reflects the confidence and comfort of a woman with a rich, full life. We operate a highly profitable omni-channel platform that is well diversified across our direct (42% of net sales for the twelve months ended October 29, 2016) and retail (58% of net sales for the twelve months ended October 29, 2016) channels. We began as a catalog company and have been a pioneer of the omni-channel model with a compelling presence across stores, website and catalog since 1999. We have developed an industry-leading customer database that allows us to match approximately 97% of transactions to an identifiable customer. We take a data-centric approach, in which we leverage our database and apply our insights to manage our business as well as to acquire and engage customers to drive optimum value and productivity. Our goals are to Create a great brand, to Build a successful business and to Make J.Jill a great place to work. To achieve this, we have aligned our strategy and team around four guiding pillars – Brand, Customer, Product and Channel.
Brand and Customer. Our brand promise to the J.Jill woman is to delight her with great wear-now product, to inspire her confidence through J.Jill’s approach to dressing and to provide her with friendly, guiding service wherever and whenever she chooses to shop. While we find that women of all ages are attracted to our brand, our typical customer is 40-65 years old, is college educated and has an annual household income that exceeds $150,000. She leads a busy, yet balanced life, as she works outside the home, is involved in her community and has a family with children. She engages across both our direct and retail channels and is highly loyal, as evidenced by the fact that approximately 70% of our gross sales in pro forma fiscal year 2015 came from customers that have been shopping with J.Jill for at least five years.
Product. Our customers strongly associate our products with a modern balance of style, quality, comfort and ease suitable for a broad range of occasions at accessible prices. Our product assortment is marketed under the J.Jill brand name, sold exclusively through our direct and retail channels, and includes knit and woven tops, bottoms and dresses as well as sweaters, outerwear and accessories across a full range of sizes, including Misses, Petites, Women’s and Tall. We also offer most of these products across our two sub-brands, Pure Jill and Wearever. We design and merchandise our products in-house around clear product stories, grounded with essential yet versatile styles and fabrications updated each month with fresh colors, layering options, novelty and fashion. Each of our monthly merchandised collections includes approximately 40% new styles, which provides a consistent flow of fresh product.
Channel. We operate an omni-channel platform that delivers a seamless experience to our customer wherever and whenever she chooses to shop across our website, retail stores and catalog. Driven by our direct-to-consumer heritage, we have a highly profitable omni-channel platform that is well-diversified across our direct
1
Table of Contents
and retail channels. As of January 28, 2017, our retail store portfolio consists of 275 stores in 43 states. Of these stores, 273 are full-price locations averaging approximately 3,750 square feet, with approximately half of our stores located in lifestyle centers and approximately half in premium malls. Our stores have produced strong and consistent performance, with 98% of our full-price locations generating positive 4-wall contribution in pro forma fiscal year 2015. Our new store openings have produced an average payback of approximately two years. We introduced a new store design in 2013 that showcases our brand concept and elevates, yet simplifies the J.Jill shopping experience. Within our direct channel, E-commerce represented 88% of net sales for the twelve months ended October 29, 2016 and catalog orders represented 12% of net sales for the twelve months ended October 29, 2016. Our website provides customers with continuous access to the entire J.Jill product offering and features rich content, including updates on new collections and guidance on how to wear and wardrobe our styles, as well as the ability to chat live with a customer service representative. We produce 25 annual editions of our catalog and circulated 57 million copies in 2015. Our catalog, combined with an increased investment in online marketing, drives customer acquisition and engagement across all of our channels. Our omni-channel approach allows us to drive customer response and purchasing behavior in all channels.
Under the leadership of Paula Bennett, our President and Chief Executive Officer, we have delivered strong, consistent growth in sales and profitability. We have established a solid foundation to support long-term, sustainable growth by investing to build our team, market our brand and enhance our systems, distribution center and data insight capabilities. Net income in pro forma fiscal year 2015 was $14.3 million. We believe our customer-focused strategy, foundational investments and data insights have resulted in consistent, profitable growth and industry-leading Adjusted EBITDA margins of 14.6% in pro forma fiscal year 2015. For a reconciliation of our Adjusted EBITDA to our net income, please see “Prospectus Summary—Summary Consolidated Historical and Pro Forma Financial and Other Data.” Recent financial highlights include:
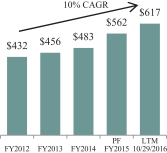
| • | Total net sales growth from $432 million in fiscal year 2012, to $562 million in pro forma fiscal year 2015, reflecting a 9% compound annual growth rate (“CAGR”), and to $617 million for the twelve months ended October 29, 2016, reflecting a 10% CAGR; |
| • | Positive total company comparable sales growth in 17 of the last 19 consecutive quarters, including in each of the last ten consecutive quarters; |
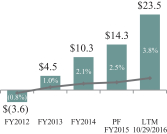
| • | Net income growth from a loss of $3.6 million in fiscal year 2012, to $14.3 million in pro forma fiscal year 2015 and to $23.5 million for the twelve months ended October 29, 2016; |
| • | Net income margin expansion of 330 basis points, from (0.8%) in fiscal year 2012, to 2.5% in pro forma fiscal year 2015, and of 460 basis points to 3.8% for the twelve months ended October 29, 2016; |
| • | 19 consecutive quarters of positive Adjusted EBITDA growth; |
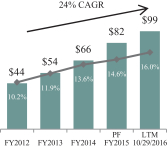
| • | Adjusted EBITDA growth from $44 million in fiscal year 2012, to $82 million in pro forma fiscal year 2015, reflecting a 23% CAGR, and to $99 million for the twelve months ended October 29, 2016, reflecting a 24% CAGR; and |
| • | Adjusted EBITDA margin expansion of 440 basis points, from 10.2% in fiscal year 2012, to 14.6% in pro forma fiscal year 2015, and of 580 basis points to 16.0% for the twelve months ended October 29, 2016. |
2
Table of Contents
$ in millions
| Net Sales |
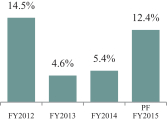
Total Company Comparable Sales | |
|
| |
| Net Income & Margin |
Adjusted EBITDA & Margin | |
|
| |
Competitive Strengths
We attribute our success to the following competitive strengths:
Distinct, Well-Recognized Brand. The J.Jill brand represents an easy, relaxed and inspired style that reflects the confidence and comfort of a woman with a rich, full life. We have cultivated a differentiated brand that resonates with our customers, as evidenced by the fact that we have one of the highest levels of brand satisfaction and one of the highest aided brand awareness scores relative to our peers. Through our commitment to our customer and our brand building activities, we have created significant brand trust and an emotional connection with our customers that we believe will facilitate sustainable sales growth and market share gains over time.
Industry-Leading Omni-Channel Business. We have developed a powerful, omni-channel business model comprised of our industry-leading direct channel and our retail stores. Our direct and retail channels complement and drive traffic to one another, and we leverage our targeted marketing initiatives to acquire new customers across all channels. While 64% of new to brand customers first engage with J.Jill through our retail stores, we have a strong track record of migrating customers from a single-channel customer to a more valuable, omni-channel customer. On average, our omni-channel customers purchase on nearly three more occasions per year and spend nearly three more times per year than our single-channel customers. As a result, our direct penetration has grown rapidly and accounted for 42% of net sales for the twelve months ended October 29, 2016 driven primarily by growth in our E-commerce business. We believe our strong omni-channel capabilities enable us to deliver a seamless brand experience to our customer, wherever and whenever she chooses to shop.
3
Table of Contents
Data-Centric Approach That Drives Consistent Profitability and Mitigates Risk. We believe we have strong customer and transaction data capabilities, but it is our use of the data that distinguishes us from our competitors. We have developed industry-leading data capture capabilities that allow us to match approximately 97% of transactions to an identifiable customer, which we believe is significantly ahead of the industry standard. We maintain an extensive customer database that tracks customer details from personal identifiers and demographic overlay (e.g., name, address, age and household income) and transaction history (e.g., orders, returns and order value). We continually leverage this database and apply our insights to operate our business, as well as to acquire new customers and then create, build and maintain a relationship with each customer to drive optimum value. For example, in fiscal year 2015 we utilized insights from our data to expand our marketing investment and focus our initiatives to emphasize customer acquisition. This drove growth in active customers by 12% and new customers by 15%. We also increased spend per customer by 6% as customers purchased more frequently and spent more per transaction. We believe our data-centric approach allows us to respond to customer preferences and mitigate risk leading to consistent, predictable operating and financial performance over time.
Affluent and Loyal Customer Base. We target an attractive demographic of affluent women in the 40-65 age range, a segment of the population that is experiencing outsized population growth between 2010 and 2020 in the United States, according to the U.S. Census Bureau. With an average annual household income that exceeds $150,000, our customer has significant spending power. She is highly loyal as evidenced by the fact that approximately 70% of our gross sales in pro forma fiscal year 2015 came from customers that have been shopping with J.Jill for at least five years. Customers who remain with our brand for five years or longer spend nearly twice as much and shop with us 1.5 times more per year than a new-to-brand customer. Our private label credit card program also drives customer loyalty and encourages spending, as average spend per card holder is over two times higher than non-card holders. We believe we will continue to develop long-term customer relationships that will drive profitable sales growth.
Customer-Focused Product Assortment. Our customers strongly associate our product with a modern balance of style, quality, comfort and ease suitable for a broad range of occasions at accessible price points, with an average selling price of $45. Our customer-focused assortment spans a full range of sizes and is designed to provide easy wardrobing that is relevant to her lifestyle. Each year we offer 12 merchandise collections that are introduced approximately every four weeks and designed and delivered to provide a consistent flow of fresh products. We create product newness through the use of different fabrics, colors, patterns and silhouettes, with approximately 40% new styles delivered in each monthly collection, which motivates our customer to visit our stores and/or our website more frequently. We have an in-house, customer centric product design and development process that leverages our extensive database of customer feedback and allows us to identify and incorporate changes in our customers’ preferences, mitigating fashion risk. We believe our customer focused approach to product development and continual delivery of fresh, high quality products drives traffic, frequency and conversion.
Highly Experienced Leadership Team, Delivering Superior Results. Our leadership team is led by President and Chief Executive Officer, Paula Bennett, who joined J.Jill in 2008 and is responsible for leading our successful revitalization and profitable growth. Ms. Bennett is a retail veteran with over 35 years of experience who understands the importance of a strong brand, possesses deep knowledge of our customers and has extensive direct and retail channel experience. Ms. Bennett previously served as Chief Operating Officer of Eileen Fisher, Inc. and also held leadership positions at Bloomingdale’s and Tiffany & Co. She has built a team from leading global organizations with an average of 25 years of industry experience and significant expertise in merchandising, marketing, retail, E-commerce, human resources and finance. We have developed a strong and collaborative culture aligned around our goals to Create a great brand, Build a successful business and Make J.Jill a great place to work. Additionally, we have enhanced and realigned our organizational structure to further elevate the omni-channel customer experience including the recent hires of a Chief Information Officer and a Senior Vice President of Marketing. Our leadership team is aligned and incentivized around growing Adjusted EBITDA and has delivered superior and consistent operating results, growing net sales by a 10% CAGR, Adjusted EBITDA by a 24% CAGR and Adjusted EBITDA margin by 580 basis points from fiscal year 2012 through the twelve months ended October 29, 2016.
4
Table of Contents
Business Growth Strategies
Key drivers of our growth strategy include:
Grow Size and Value of Our Active Customer Base. We have a significant opportunity to continue to attract new customers to our brand and to grow the size and value of our active customer base across all channels. Historically, we grew our business by driving spend per customer. We strategically increased our marketing investment to drive growth through the acquisition of new customers, reactivation of lapsed customers and the retention of existing customers. This investment has proven effective as, for example, in fiscal year 2015 we increased our marketing investment by 16%, resulting in active customer base growth of 12%, including new customer growth of 15%. We also experienced an increase in spend per customer by 6% as customers purchased more frequently and spent more per transaction. In addition, in fiscal year 2015, the number of our omni-channel customers, who purchase on nearly three more occasions per year and spend nearly three more times per year than our single-channel customers, increased by 21%. We recently began a brand voice and customer segmentation initiative which, upon completion, will further enhance our ability to target the highest value customers and increase customer spending. Through these initiatives, we believe we will continue to attract new customers to our brand, migrate customers from single-channel to more profitable omni-channel customers and increase overall customer retention and spend.
Increase Direct Sales. Given our strong foundation that positions us to capitalize on the growth of online and mobile shopping, we believe we have the opportunity to grow our direct sales from 42% of our net sales to approximately 50% over the next few years. According to Euromonitor, online apparel sales are expected to grow at a CAGR of approximately 15% from 2015 to 2020, which is significantly above the long-term growth of the broader apparel industry. We are undertaking several initiatives to enhance our capabilities and drive additional direct sales. We are in the process of re-platforming our website to improve our customers’ personalized shopping experience and increase the ease of navigation, checkout and overall engagement. Our new platform, managed by our experienced team, will provide us with the opportunity to expand internationally. In addition, our mobile platform provides us with the ability to effectively engage with our customer on her mobile device by providing her with access to product research and the ability to connect with the brand socially. We believe our powerful direct platform will enable us to further strengthen our dominant market position and broaden our customer reach.
Profitably Expand Our Store Base. Based on our proven new store economics, we believe that we have the potential to grow our store base by up to 100 stores over the long term from our total of 275 stores as of January 28, 2017. We will target new locations in lifestyle centers and premium malls, and we plan to open 10-15 new stores in fiscal year 2017 and in each year thereafter. Our new store model targets an average of approximately $1.0 million of net sales per store and approximately $270,000 of 4-wall contribution within the first full year of operations. We introduced a new store design concept in 2013 that showcases our brand concept and elevates, yet simplifies the J.Jill shopping experience. The new store concept provides a welcoming, easy-to-shop format that guides her through clearly merchandised product stories. All of our new and refreshed stores will reflect our new design concept. We also plan to selectively close underperforming stores on an annual basis, including one in 2016.
Strengthen Omni-Channel Capabilities. We are pursuing a variety of initiatives designed to enhance our omni-channel capabilities focused on best serving our customer, wherever and whenever she chooses to shop. We have recently enhanced our management team to focus on the omni-channel customer experience, including the recent hires of a Chief Information Officer and a Senior Vice President of Marketing. We will continue to leverage our insight into customer attributes and behavior, which will guide strategic investments in our business. For example, we will enhance our ability to seamlessly manage our inventory across all of our channels. We also plan to implement technology to further fulfill customer demand, including ship from store to customer and order online for pickup in store. We expect our sustainable model, combined with our omni-channel initiatives, will continue to drive traffic, increase average transaction value and enhance conversion across all of our channels.
5
Table of Contents
Enhance Product Assortment. We believe there is an opportunity to grow our business by selectively broadening and enhancing our assortment in certain product categories, including our Pure Jill and Wearever sub-brands, our Women’s and Petite’s businesses, and accessories. Based on strong demand for our extended size product and our sub-brands, we believe we have the opportunity to expand and focus these categories in selected stores as well as test the offering in stand-alone store formats. We also believe we have the opportunity to continue to optimize our assortment architecture and productivity by delivering the right mix and flow of fashion and basics to our channels. In addition, we will continue delivering high quality customer focused product assortments across each of our channels, while strengthening visual merchandising. Through our focused and enhanced product offering, particularly in our sub-brands and extended sizes, we believe we will continue to drive profitable sales growth over time.
Recent Developments
Our audited consolidated financial statements for the fiscal year ended January 28, 2017 (“fiscal year 2016”) are not yet available. We have presented preliminary estimated ranges of certain of our financial results below for fiscal year 2016, based on information currently available to management. We have provided ranges, rather than specific amounts, for certain financial results below, primarily because our financial closing procedures for the three months and year ended January 28, 2017 are not yet complete. As a result, our actual results may vary materially from the estimated preliminary results included herein and will not be publicly available until after the closing of this offering. Accordingly, you should not place undue reliance on these estimates. The preliminary financial data included in this prospectus has been prepared by, and is the responsibility of, management. Our independent registered public accounting firm has not audited, reviewed, compiled, or performed any procedures with respect to the preliminary estimated financial data below and does not express an opinion or any other form of assurance with respect thereto. See “Risk Factors,” “Management’s Discussion and Analysis of Financial Condition and Results of Operations” and “Special Note Regarding Forward-Looking Statements” for additional information regarding factors that could result in differences between the preliminary estimated ranges of certain financial results presented below and the financial results we will ultimately report for fiscal year 2016.
For the thirteen weeks ended January 28, 2017, we estimate that our net sales will range from $166.4 million to $167.4 million, an increase of $21.5 million, or 14.8%, at the mid-point of the estimated net sales range when compared with net sales of $145.4 million for the thirteen weeks ended January 30, 2016. The increase in net sales was due to an increase in total comparable company sales of approximately 10.7% to 10.9% for the thirteen weeks ended January 28, 2017. As of January 28, 2017, our inventory balance was $66.6 million.
For fiscal year 2016, we estimate that our net sales will range from $638.5 million to $639.5 million, an increase of $77.0 million, or 13.7%, using the mid-point of the estimated net sales range when compared with net sales of $562.0 million for pro forma fiscal year 2015. The increase in net sales was due to an increase in total comparable company sales of approximately 11.1% to 11.3% for fiscal year 2016, primarily driven by an increase in our active customer base from 1.5 million during pro forma fiscal year 2015 to 1.7 million for fiscal year 2016. Omni-channel customers represent approximately 22% of our active customer base for fiscal year 2016, an increase from 20% for pro forma fiscal year 2015. Our direct channel was responsible for 43% of our net sales for fiscal year 2016, an increase from 40% for pro forma fiscal year 2015. Within our direct channel, E-commerce represented 89% of net sales for fiscal year 2016 and catalog orders represented 11% of net sales for fiscal year 2016. Our retail channel was responsible for 57% of our net sales for fiscal year 2016, a decrease from 60% for pro forma fiscal year 2015.
For fiscal year 2016, we estimate that our net income (loss) and total comprehensive income (loss) will range from $22.5 million to $24.1 million, an increase of $9.0 million, or 62.9%, using the mid-point of the estimated range when compared with net income (loss) and total comprehensive income (loss) of $14.3 million for pro forma fiscal year 2015.
6
Table of Contents
For fiscal year 2016, we estimate that our Adjusted EBITDA will range from $104.4 million to $106.5 million, an increase of $23.5 million, or 28.7%, using the mid-point of the estimated range when compared with our Adjusted EBITDA of $82.0 million for pro forma fiscal year 2015. Adjusted EBITDA is a non-GAAP financial measure that has limitations as an analytical tool. Adjusted EBITDA should not be considered as an alternative to, or substitute for, net income (loss), which is calculated in accordance with GAAP. To address these limitations we reconciled Adjusted EBITDA to the nearest GAAP financial measure, net income (loss), below. For an explanation of how we define Adjusted EBITDA and Adjusted EBITDA margin and why we believe the presentation of Adjusted EBITDA and Adjusted EBITDA margin information is useful to investors, see “—Summary Consolidated Historical And Pro Forma Financial And Other Data.”
Our management has determined that net income (loss) is the only component of our comprehensive income (loss). Accordingly, there is no difference between net income (loss) and comprehensive income (loss). The following table provides a reconciliation of net income (loss) to Adjusted EBITDA and the calculation of Adjusted EBITDA margin for the ranges presented for fiscal year 2016 and for pro forma fiscal year 2015.
| For the Fiscal Year Ended January 28, 2017 |
For the Fiscal Year Ended January 30, 2016 |
|||||||||||
| (in thousands) |
Low | High | Pro Forma (unaudited) |
|||||||||
| Statements of Operations Data: |
||||||||||||
| Net income (loss) |
$ | 22,503 | $ | 24,103 | $ | 14,295 | ||||||
| Interest expense, net |
18,670 | 18,670 | 16,893 | |||||||||
| Provision (benefit) for income taxes |
16,200 | 17,300 | 10,223 | |||||||||
| Depreciation and amortization |
36,219 | 36,219 | 37,802 | |||||||||
| Equity-based compensation expense(a) |
623 | 623 | 609 | |||||||||
| Write-off of property and equipment(b) |
385 | 385 | 349 | |||||||||
| Other non-recurring expenses(c) |
9,800 | 9,200 | 1,784 | |||||||||
|
|
|
|
|
|
|
|||||||
| Adjusted EBITDA |
$ | 104,400 | $ | 106,500 | $ | 81,955 | ||||||
|
|
|
|
|
|
|
|||||||
| Net sales |
$ | 638,500 | $ | 639,500 | $ | 562,015 | ||||||
| Adjusted EBITDA margin |
16.4 | % | 16.7 | % | 14.6 | % | ||||||
| Total Company Comparable Sales |
11.1 | % | 11.3 | % | 12.4 | % | ||||||
| (a) | Represents expenses associated with equity incentive units granted to our management. Prior to the Acquisition, incentive units were accounted for as a liability-classified award and the related compensation expense was recognized based on changes in the intrinsic value of the award at each reporting period. Subsequent to the Acquisition, new incentive units were granted to management and are accounted for as equity-classified awards with the related compensation expense recognized based on fair value at the date of the grants. |
| (b) | Represents the net gain or loss on the disposal of fixed assets. |
| (c) | Represents items management believes are not indicative of ongoing operating performance. These expenses are primarily composed of legal and professional fees associated with non-recurring events. The pro forma fiscal year 2015 and fiscal year 2016 expenses are primarily due to legal, accounting, and professional fees incurred in connection with this offering. |
Risks Relating to Our Business and Our Common Stock
An investment in our common stock involves a high degree of risk. You should carefully consider the risks summarized in the “Risk Factors” section of this prospectus immediately following this prospectus summary.
7
Table of Contents
Corporate Conversion
On February 24, 2017, we converted from a Delaware limited liability company named Jill Intermediate LLC into a Delaware corporation and changed our name to J.Jill, Inc. In conjunction with the conversion, all of our outstanding equity interests converted into 43,747,944 shares of common stock. Jill Intermediate LLC had one class of equity interests, all of which were held by JJill Holdings, our former direct parent company, and JJill Topco Holdings, the direct parent company of JJill Holdings. In conjunction with our conversion into a Delaware corporation, JJill Holdings and JJill Topco Holdings each received shares of our common stock in proportion to the percentage of Jill Intermediate LLC’s equity interests held by them prior to the conversion. Following our conversion into a Delaware corporation, JJill Holdings, our former direct parent, merged with and into us, and we were the surviving entity to such merger. We are a holding company, and Jill Acquisition LLC, our wholly-owned subsidiary, will remain the operating company for our business assets. All of the shares of our common stock are held by JJill Topco Holdings, our current direct parent. Following the completion of this offering, JJill Topco Holdings plans to distribute all of the shares of our common stock held by it, other than the shares it sells in this offering, to its partners in accordance with the terms of its limited partnership agreement. For more information, please see “Corporate Conversion.”
The diagram below depicts our organizational structure immediately following the consummation of this offering and the transactions described above:
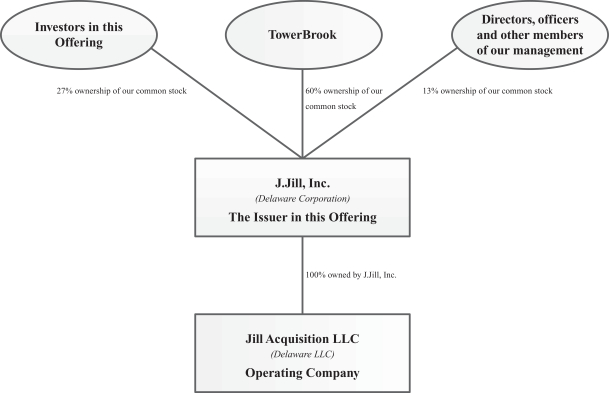
Our Sponsor
We were acquired by TowerBrook in May 2015. TowerBrook is an investment management firm that is based in the United States and Europe. It focuses on making investments in European and North American companies.
8
Table of Contents
Following this offering, TowerBrook will control approximately 60% of the voting power of our outstanding common stock (or 57% if the underwriters exercise their option to purchase additional shares). As a result, TowerBrook will control any action requiring the general approval of our stockholders, including the election of our board of directors (which will control our management and affairs), the adoption of amendments to our certificate of incorporation and bylaws and the approval of any merger or sale of substantially all of our assets. Because TowerBrook will hold more than 50% of the voting power of our outstanding common stock, we will be a “controlled company” under the corporate governance rules for New York Stock Exchange listed companies. We will therefore be permitted to, and we intend to, elect not to comply with certain corporate governance requirements. See “Management—Controlled Company.” We will also be party to a Stockholders Agreement with TowerBrook, pursuant to which TowerBrook will be entitled to certain veto rights including with respect to any payment or declaration of any dividend or other distribution on our equity securities (subject to certain exceptions specified therein), as long as TowerBrook beneficially owns at least 50% of our common stock. See “Certain Relationships and Related Party Transactions—Stockholders Agreement.”
Control by TowerBrook may give rise to actual or perceived conflicts of interest with holders of our common stock. TowerBrook’s significant ownership in us, its rights under the Stockholders Agreement and its resulting ability to effectively control us may discourage a third party from making a significant equity investment in us or a transaction involving a change of control, including transactions in which holders of shares of our common stock might otherwise receive a premium for such holders’ shares over the then-current market price. See “Risk Factors— Risks Related to this Offering and Ownership of Our Common Stock” for a summary of the potential conflicts of interests that may arise as a result of our control by TowerBrook.
Implications of being an Emerging Growth Company
We are an “emerging growth company” as defined in the Jumpstart Our Business Startups Act, or “JOBS Act” enacted in April 2012. As an “emerging growth company,” we may take advantage of specified reduced reporting and other requirements that are otherwise applicable to public companies. These provisions include, among other things:
| • | being permitted to present only two years of audited financial statements, in addition to any required unaudited interim financial statements, with correspondingly reduced Management’s Discussion and Analysis of Financial Condition and Results of Operations in this prospectus; |
| • | exemption from the auditor attestation requirement in the assessment of our internal controls over financial reporting; |
| • | exemption from new or revised financial accounting standards applicable to public companies until such standards are also applicable to private companies; |
| • | exemption from compliance with any new requirements adopted by the Public Company Accounting Oversight Board (United States), requiring mandatory audit firm rotation or a supplement to our auditor’s report in which the auditor would be required to provide additional information about the audit and our financial statements; |
| • | an exemption from the requirement to seek non-binding advisory votes on executive compensation and golden parachute arrangements; and |
| • | reduced disclosure about executive compensation arrangements. |
We may take advantage of these provisions until the end of the fiscal year following the fifth anniversary of our initial public offering or such earlier time that we are no longer an “emerging growth
9
Table of Contents
company.” We will cease to be an “emerging growth company” if we have $1.0 billion or more in “total annual gross revenues” during our most recently completed fiscal year, if we become a “large accelerated filer” with a market capitalization of $700 million or more, or as of any date on which we have issued more than $1.0 billion in non-convertible debt over the three-year period to such date. We may choose to take advantage of some, but not all, of these reduced burdens. For example, we have taken advantage of the reduced reporting requirement with respect to disclosure regarding our executive compensation arrangements and expect to take advantage of the exemption from auditor attestation on the effectiveness of our internal control over financial reporting. For as long as we take advantage of the reduced reporting obligations, the information that we provide stockholders may be different from information provided by other public companies. We are irrevocably electing to “opt out” of the extended transition period relating to the exemption from new or revised financial accounting standards and as a result, we will comply with new or revised accounting standards on the relevant dates on which adoption of such standards is required for non-“emerging growth companies.”
In addition, upon the closing of this offering, we will be a “controlled company” within the meaning of the New York Stock Exchange corporate governance standards because more than 50% of our voting common stock will be owned by TowerBrook. For further information on the implications of this distinction, see “Risk Factors—Risks Related to this Offering and Ownership of Our Common Stock” and “Management—Board Committees.”
Corporate Information
We were originally organized as Jill Intermediate LLC, a Delaware limited liability company, in February 2011. On February 24, 2017, we completed transactions pursuant to which we converted into a Delaware corporation and changed our name to J.Jill, Inc. Our principal executive office is located at 4 Batterymarch Park, Quincy, MA 02169, and our telephone number is (617) 376-4300. Our website address is www.jjill.com. Our website and the information contained on, or that can be accessed through, our website will not be deemed to be incorporated by reference in, and are not considered part of, this prospectus. You should not rely on our website or any such information in making your decision whether to purchase shares of our common stock.
10
Table of Contents
The Offering
| Issuer in this offering |
J.Jill, Inc. |
| Common stock offered by the selling stockholder |
11,666,667 shares (or 13,416,667 shares, if the underwriters exercise in full their option to purchase additional shares as described below). |
| Option to purchase additional shares |
The selling stockholder has granted the underwriters an option to purchase up to an additional 1,750,000 shares. The underwriters may exercise this option at any time within 30 days from the date of this prospectus. See “Underwriting.” |
| Common stock outstanding immediately after this offering |
43,747,944 shares. |
| Use of proceeds |
The selling stockholder will receive all the proceeds from the sale of shares of our common stock in this offering. We will not receive any proceeds from the sale of shares of our common stock in this offering. |
| Controlled company |
Upon completion of this offering, TowerBrook will continue to beneficially own more than 50% of our outstanding common stock. As a result, we are eligible to, and we intend to, avail ourselves of the “controlled company” exemptions under the rules of the New York Stock Exchange (“NYSE”), including exemptions from certain of the corporate governance listing requirements. See “Management—Controlled Company” |
| Voting rights |
Holders of our common stock are entitled to one vote for each share held of record on all matters submitted to a vote of stockholders. |
| Dividend policy |
We do not currently intend to pay dividends on our common stock. We plan to retain any earnings for use in the operation of our business and to fund future growth. |
| Listing |
Our common stock has been approved for listing on the NYSE under the symbol “JILL.” |
| Risk factors |
You should read the section entitled “Risk Factors” beginning on page 17 of, and the other information included in, this prospectus for a discussion of some of the risks and uncertainties you should carefully consider before deciding to invest in our common stock. |
The number of shares of our common stock to be outstanding immediately after the closing of this offering is based on 43,747,944 shares of common stock outstanding as of October 29, 2016 and, except as otherwise indicated, all information in this prospectus, reflects and assumes the following:
| • | assumes an initial public offering price of $15.00 per share of common stock, the midpoint of the price range on the cover of this prospectus; |
11
Table of Contents
| • | reflects the completion of our corporate conversion from a Delaware limited liability company to a Delaware corporation and the merger of JJill Holdings with and into us, as described under “Corporate Conversion”; |
| • | reflects the conversion of all of our outstanding equity interests into 43,747,944 shares of our common stock, which was effectuated on February 24, 2017; |
| • | assumes no exercise of the underwriters’ option to purchase 1,750,000 additional shares of common stock in this offering; and |
| • | does not reflect an additional 2,237,303 shares of our common stock reserved for future grant under our Equity Incentive Plan (as defined herein) which we expect to adopt in connection with this offering. |
12
Table of Contents
SUMMARY CONSOLIDATED HISTORICAL AND PRO FORMA FINANCIAL AND OTHER DATA
The following tables present our summary consolidated financial and other data as of and for the periods indicated. The summary consolidated statements of operations data for the fiscal years ended February 1, 2014 and January 31, 2015, the periods from February 1, 2015 to May 7, 2015 (Predecessor) and from May 8, 2015 to January 30, 2016 (Successor), and the summary consolidated balance sheet data as of January 31, 2015 and January 30, 2016 are derived from our audited consolidated financial statements included elsewhere in this prospectus. Our historical audited results are not necessarily indicative of the results that should be expected in any future period.
The summary consolidated statements of operations data for the period from May 8, 2015 to October 31, 2015 (Successor) and the thirty-nine weeks ended October 29, 2016 (Successor) and the summary consolidated balance sheet data as of October 29, 2016 are derived from our unaudited consolidated financial statements included elsewhere in this prospectus. We have prepared our unaudited consolidated financial statements on the same basis as our audited consolidated financial statements and have included all adjustments, consisting only of normal recurring adjustments that, in our opinion, are necessary to present fairly the financial information set forth in those statements. The results for any interim period are not necessarily indicative of the results that may be expected for the full year and our historical unaudited results are not necessarily indicative of the results that should be expected in any future period.
We have derived the summary consolidated statements of operations data for the twelve months ended October 29, 2016 by adding the summary consolidated statements of operations data for the thirty-nine weeks ended October 29, 2016 to the summary consolidated statements of operations data for the 2015 Successor Period and subtracting the summary consolidated statements of operations data for the period from May 8, 2015 to October 31, 2015. We believe that presentation of the summary consolidated statements of operations data for the twelve months ended October 29, 2016 is useful to investors because it presents information about how our business has performed in the twelve month period immediately preceding the date of our most recent interim financial statements, which allows investors to review our current performance trends over a period consisting of our four most recent consecutive fiscal quarters.
For purposes of presenting a comparison of our fiscal year 2013 and fiscal year 2014 results, in addition to standalone results for the 2015 Predecessor Period and 2015 Successor Period, we have also presented summary unaudited pro forma consolidated financial and other data for the fiscal year ended January 30, 2016. The unaudited pro forma consolidated statement of operations for the fiscal year ended January 30, 2016 has been derived from the historical audited statements of operations included elsewhere in this prospectus, and represents the addition of the 2015 Predecessor Period and the 2015 Successor Period and gives effect to certain transactions, as described in “Unaudited Pro Forma Consolidated Financial Information” contained elsewhere in this prospectus, as if they had occurred on February 1, 2015. We believe that this presentation provides meaningful information about our results of operations on a period to period basis. The unaudited pro forma consolidated statement of operations is presented for illustrative purposes and does not purport to represent what the results of operations would actually have been if the transactions had occurred as of the date indicated or what the results of operations would be for any future periods.
13
Table of Contents
The summary historical financial data presented below does not purport to project our financial position or results of operations for any future date or period and should be read together with “Selected Historical Consolidated Financial and Other Data,” “Unaudited Pro Forma Consolidated Financial Information,” “Management’s Discussion and Analysis of Financial Condition and Results of Operations,” and our consolidated financial statements and related notes thereto included elsewhere in this prospectus.
| Interim Periods | ||||||||||||||||||||||||||||||||||||||||||||||||||||
| Predecessor | Pro Forma (unaudited) |
Predecessor |
Successor |
Predecessor |
Successor (unaudited) |
|||||||||||||||||||||||||||||||||||||||||||||||
| (in thousands, except share and per share data) |
For the Year Ended |
For the Year Ended |
For the Year Ended |
For the |
For the |
For the |
For the |
For
the |
Twelve |
|||||||||||||||||||||||||||||||||||||||||||
| Statements of Operations Data: |
||||||||||||||||||||||||||||||||||||||||||||||||||||
| Net sales |
$ | 456,026 | $ | 483,400 | $ | 562,015 | $ | 141,921 | $ | 420,094 | $ | 141,921 | $ | 274,741 | $ | 472,139 | $ | 617,492 | ||||||||||||||||||||||||||||||||||
| Costs of goods sold |
161,261 | 164,792 | 188,852 | 44,232 | 155,091 | 44,232 | 101,185 | 149,673 | 203,579 | |||||||||||||||||||||||||||||||||||||||||||
|
|
|
|
|
|
|
|
|
|
|
|
|
|
|
|
|
|
|
|||||||||||||||||||||||||||||||||||
| Gross profit |
294,765 | 318,608 | 373,163 | 97,689 | 265,003 | 97,689 | 173,556 | 322,466 | 413,913 | |||||||||||||||||||||||||||||||||||||||||||
| Selling, general and administrative expenses |
267,319 | 279,557 | 331,752 | 80,151 | 246,482 | 80,151 | 161,236 | 273,882 | 359,128 | |||||||||||||||||||||||||||||||||||||||||||
| Acquisition-related expenses |
— | — | — | 13,341 | — | 13,341 | — | — | — | |||||||||||||||||||||||||||||||||||||||||||
|
|
|
|
|
|
|
|
|
|
|
|
|
|
|
|
|
|
|
|||||||||||||||||||||||||||||||||||
| Operating income |
27,446 | 39,051 | 41,411 | 4,197 | 18,521 | 4,197 | 12,320 | 48,584 | 54,785 | |||||||||||||||||||||||||||||||||||||||||||
| Interest expense |
19,064 | 17,895 | 16,893 | 4,599 | 11,893 | 4,599 | 7,922 | 13,630 | 17,601 | |||||||||||||||||||||||||||||||||||||||||||
|
|
|
|
|
|
|
|
|
|
|
|
|
|
|
|
|
|
|
|||||||||||||||||||||||||||||||||||
| Income (loss) before provision for income taxes |
8,382 | 21,156 | 24,518 | (402 | ) | 6,628 | (402 | ) | 4,398 | 34,954 | 37,184 | |||||||||||||||||||||||||||||||||||||||||
| Provision (benefit) for income taxes |
3,884 | 10,860 | 10,223 | 1,499 | 2,322 | 1,499 | 1,541 | 12,924 | 13,705 | |||||||||||||||||||||||||||||||||||||||||||
|
|
|
|
|
|
|
|
|
|
|
|
|
|
|
|
|
|
|
|||||||||||||||||||||||||||||||||||
| Net income |
$ | 4,498 | $ | 10,296 | $ | 14,295 | $ | (1,901 | ) | $ | 4,306 | $ | (1,901 | ) | $ | 2,857 | $ | 22,030 | $ | 23,479 | ||||||||||||||||||||||||||||||||
|
|
|
|
|
|
|
|
|
|
|
|
|
|
|
|
|
|
|
|||||||||||||||||||||||||||||||||||
| Net income (loss) per share attributable to common stockholders(1): |
||||||||||||||||||||||||||||||||||||||||||||||||||||
| Basic |
$ | 0.10 | $ | 0.24 | $ | 0.35 | $ | (0.04 | ) | $ | 0.10 | $ | (0.04 | ) | $ | 0.07 | $ | 0.50 | $ | 0.54 | ||||||||||||||||||||||||||||||||
| Diluted |
$ | 0.10 | $ | 0.24 | $ | 0.34 | $ | (0.04 | ) | $ | 0.10 | $ | (0.04 | ) | $ | 0.07 | $ | 0.50 | $ | 0.54 | ||||||||||||||||||||||||||||||||
| Weighted average number of common shares outstanding(1): |
||||||||||||||||||||||||||||||||||||||||||||||||||||
| Basic |
43,747,944 | 43,747,944 | 40,333,974 | 43,747,944 | 43,747,944 | 43,747,944 | 43,747,944 | 43,747,944 | 43,747,944 | |||||||||||||||||||||||||||||||||||||||||||
| Diluted |
43,747,944 | 43,747,944 | 42,531,433 | 43,747,944 | 43,747,944 | 43,747,944 | 43,747,944 | 43,747,944 | 43,747,944 | |||||||||||||||||||||||||||||||||||||||||||
| Other Financial Data: |
||||||||||||||||||||||||||||||||||||||||||||||||||||
| Adjusted |
$ | 54,241 | $ | 65,720 | $ | 81,955 | $ | 23,672 | $ | 59,699 | $ | 23,672 | $ | 44,277 | $ | 83,539 | $ | 98,961 | ||||||||||||||||||||||||||||||||||
| Adjusted EBITDA margin(3) |
11.9 | % | 13.6 | % | 14.6 | % | 16.7 | % | 14.2 | % | 16.7 | % | 16.1 | % | 17.7 | % | 16.0 | % | ||||||||||||||||||||||||||||||||||
14
Table of Contents
| Successor | ||||||||
| (in thousands) |
January 30, 2016 |
October 29, 2016 |
||||||
| Balance Sheet data (at end of period): |
||||||||
| Cash |
$ | 27,505 | $ | 4,955 | ||||
| Net operating assets and liabilities(4) |
3,477 | 19,749 | ||||||
| Total assets |
582,032 | 578,468 | ||||||
| Current and non-current portions of long-term debt, net of discount and debt issuance costs |
239,978 | 277,256 | ||||||
| Total equity |
166,571 | 118,754 | ||||||
| (1) | See Note 15 to our audited consolidated financial statements included elsewhere in this prospectus for additional information regarding the calculation of basic and diluted net income (loss) per share attributable to common stockholders. Except for the pro forma periods, there are no potentially dilutive securities outstanding in any historical period presented, basic and diluted net income (loss) per share attributable to common stockholders is the same in each historical period. See Note 12 to our Unaudited Pro Forma Consolidated Statement of Operations Adjustments within “Unaudited Pro Forma Consolidated Financial Information” included elsewhere in this prospectus for additional information regarding the calculation of pro forma basic and diluted net income. |
| (2) | Adjusted EBITDA represents net income (loss) plus interest expense, provision (benefit) for income taxes, depreciation and amortization, the amortization of the step-up to fair value of merchandise inventory resulting from the application of a purchase accounting adjustment related to the Acquisition, certain Acquisition-related expenses, sponsor fees, equity-based compensation expense, write-off of property and equipment and other non-recurring expenses, primarily consisting of outside legal and professional fees associated with certain non-recurring transactions and events. We present Adjusted EBITDA on a consolidated basis because our management uses it as a supplemental measure in assessing our operating performance, and we believe that it is helpful to investors, securities analysts and other interested parties as a measure of our comparative operating performance from period to period. Adjusted EBITDA is not a measurement of financial performance under GAAP. It should not be considered an alternative to net income (loss) as a measure of our operating performance or any other measure of performance derived in accordance with GAAP. Adjusted EBITDA has limitations as an analytical tool, and you should not consider such measure either in isolation or as a substitute for analyzing our results as reported under GAAP. Our definition and calculation of Adjusted EBITDA is not necessarily comparable to other similarly titled measures used by other companies due to different methods of calculation. To address these limitations we reconciled Adjusted EBITDA to the nearest GAAP financial measure, net income (loss). |
The following provides a reconciliation of net income (loss) to Adjusted EBITDA for the periods presented and the calculation of Adjusted EBITDA margin:
| Interim Periods | ||||||||||||||||||||||||||||||||||||||||||||||||||||||||
| Predecessor | Pro Forma (unaudited) |
Predecessor |
Successor |
Predecessor |
Successor (unaudited) |
|||||||||||||||||||||||||||||||||||||||||||||||||||
| (in thousands) |
For the Year |
For the Year |
For the Year |
For the Year |
For
the |
For the |
For
the |
For the |
For the Nine Weeks |
Twelve |
||||||||||||||||||||||||||||||||||||||||||||||
| Statements of Operations Data: |
||||||||||||||||||||||||||||||||||||||||||||||||||||||||
| Net income (loss) |
$ | (3,601 | ) | $ | 4,498 | $ | 10,296 | $ | 14,295 | $ | (1,901 | ) | $ | 4,306 | $ | (1,901 | ) | $ | 2,857 | $ | 22,030 | $ | 23,479 | |||||||||||||||||||||||||||||||||
| Interest expense |
19,183 | 19,064 | 17,895 | 16,893 | 4,599 | 11,893 | 4,599 | 7,922 | 13,630 | 17,601 | ||||||||||||||||||||||||||||||||||||||||||||||
| Provision (benefit) for income |
(2,583 | ) | 3,884 | 10,860 | 10,223 | 1,499 | 2,322 | 1,499 | 1,541 | 12,924 | 13,705 | |||||||||||||||||||||||||||||||||||||||||||||
| Depreciation and amortization |
27,333 | 22,910 | 19,051 | 37,802 | 5,147 | 28,702 | 5,147 | 20,112 | 27,282 | 35,872 | ||||||||||||||||||||||||||||||||||||||||||||||
| Inventory step-up(a) |
— | — | — | — | — | 10,471 | — | 10,471 | — | — | ||||||||||||||||||||||||||||||||||||||||||||||
| Acquisition-related expenses(b) |
— | — | — | — | 13,341 | — | 13,341 | — | — | — | ||||||||||||||||||||||||||||||||||||||||||||||
| Sponsor fees(c) |
1,000 | 1,000 | 1,000 | — | 250 | — | 250 | — | — | — | ||||||||||||||||||||||||||||||||||||||||||||||
| Equity-based compensation expense(d) |
417 | 1,930 | 5,152 | 609 | 441 | 168 | 441 | 119 | 458 | 507 | ||||||||||||||||||||||||||||||||||||||||||||||
| Write-off of property and equipment(e) |
250 | 386 | 58 | 349 | 112 | 237 | 112 | 48 | 384 | 573 | ||||||||||||||||||||||||||||||||||||||||||||||
| Other non-recurring expenses(f) |
1,914 | 569 | 1,408 | 1,784 | 184 | 1,600 | 184 | 1,207 | 6,831 | 7,224 | ||||||||||||||||||||||||||||||||||||||||||||||
|
|
|
|
|
|
|
|
|
|
|
|
|
|
|
|
|
|
|
|
|
|||||||||||||||||||||||||||||||||||||
| Adjusted EBITDA |
$ | 43,913 | $ | 54,241 | $ | 65,720 | $ | 81,955 | $ | 23,672 | $ | 59,699 | $ | 23,672 | $ | 44,277 | $ | 83,539 | $ | 98,961 | ||||||||||||||||||||||||||||||||||||
|
|
|
|
|
|
|
|
|
|
|
|
|
|
|
|
|
|
|
|
|
|||||||||||||||||||||||||||||||||||||
| Net sales |
$ | 431,881 | $ | 456,026 | $ | 483,400 | $ | 562,015 | $ | 141,921 | $ | 420,094 | $ | 141,921 | $ | 274,741 | $ | 472,139 | $ | 617,492 | ||||||||||||||||||||||||||||||||||||
| Adjusted EBITDA margin(3) |
10.2 | % | 11.9 | % | 13.6 | % | 14.6 | % | 16.7 | % | 14.2 | % | 16.7 | % | 16.1 | % | 17.7 | % | 16.0 | % | ||||||||||||||||||||||||||||||||||||
| (a) | Represents the impact to cost of goods sold resulting from the amortization of the step-up to fair value of merchandise inventory resulting from the application of a purchase accounting adjustment related to the Acquisition. |
| (b) | Represents transaction costs incurred in connection with the Acquisition, consisting substantially of legal and advisory fees, which are not expected to recur. |
| (c) | Represents management fees charged by our previous equity sponsors. |
| (d) | Represents expenses associated with equity incentive units granted to our management. Prior to the Acquisition, incentive units were accounted for as a liability-classified award and the related compensation expense was recognized based on changes in the intrinsic value of |
15
Table of Contents
| the award at each reporting period. Subsequent to the Acquisition, new incentive units were granted to management and are accounted for as equity-classified awards with the related compensation expense recognized based on fair value at the date of the grants. |
| (e) | Represents the net gain or loss on the disposal of fixed assets. |
| (f) | Represents items management believes are not indicative of ongoing operating performance. These expenses are primarily composed of legal and professional fees associated with non-recurring events. The fiscal year 2012 costs are primarily associated with legal and professional services incurred in connection with the Company having entered into agreements with lenders to amend certain loan agreement covenants. The fiscal year 2014 expenses were primarily related to legal and professional services associated with the Company’s evaluation of a sale of the business. The pro forma fiscal year 2015 expenses are primarily due to legal, accounting, and professional fees incurred in connection with this offering. |
| (3) | Adjusted EBITDA margin is defined as Adjusted EBITDA divided by net sales. |
| (4) | Net operating assets and liabilities consist of current assets excluding cash, less current liabilities excluding the current portion of long-term debt. |
| (5) | For the pro forma thirty-nine weeks ended October 29, 2016 there were no adjustments to net income as all adjustments related to the Acquisition had been reflected in our historical financial statements. Pro forma net income per share attributable to common stockholders, basic and pro forma net income per share attributable to common stockholders, diluted during the thirty-nine weeks ended October 29, 2016 were $0.54 and $0.51, respectively. See Note 12 to our Unaudited Pro Forma Consolidated Statement of Operations Adjustments within “Unaudited Pro Forma Consolidated Financial Information” included elsewhere in this prospectus for additional information regarding the calculation of pro forma basic and diluted net income for the thirty-nine weeks ended October 29, 2016. |
16
Table of Contents
This offering and investing in our common stock involve a high degree of risk. You should carefully consider the risks and uncertainties described below, as well as the other information contained in this prospectus, including our consolidated financial statements and the related notes thereto included elsewhere in this prospectus, and “Management’s Discussion and Analysis of Financial Condition and Results of Operations,” before deciding to invest in our common stock. The risks described below are not the only risks facing us. Additional risks and uncertainties not currently known to us or those we currently deem to be immaterial may also materially and adversely affect our business, financial condition and results of operations. Any of the following risks could adversely affect our business, financial condition and results of operations, in which case the trading price of our common stock could decline and you could lose all or part of your investment.
Risks Related to Our Business and Industry
Our business is sensitive to economic conditions and consumer spending.
We face numerous business risks relating to macroeconomic factors. The retail industry is cyclical and consumer purchases of discretionary retail items, including our merchandise, generally decline during recessionary periods and other times when disposable income is lower. Factors impacting discretionary consumer spending include general economic conditions, wages and employment, consumer debt, reductions in net worth based on severe market declines, residential real estate and mortgage markets, taxation, volatility of fuel and energy prices, interest rates, consumer confidence, political and economic uncertainty and other macroeconomic factors. Deterioration in economic conditions or increasing unemployment levels may reduce the level of consumer spending and inhibit consumers’ use of credit, which may adversely affect our revenues and profits. In recessionary periods and other periods where disposable income is adversely affected, we may have to increase the number of promotional sales or otherwise dispose of inventory for which we have previously paid to manufacture, which could further adversely affect our profitability. It is difficult to predict when or for how long any of these conditions can affect our business and a prolonged economic downturn could have a material adverse effect on our business, financial condition and results of operations.
Our inability to anticipate and respond to changing customer preferences and shifts in fashion and industry trends in a timely manner could have a material adverse effect on our business, financial condition and results of operations.
Our success largely depends on our ability to consistently gauge tastes and trends and provide a balanced assortment of merchandise that satisfies customer demands in a timely manner. We enter into agreements to manufacture and purchase our merchandise well in advance of the applicable selling season and our failure to anticipate, identify or react appropriately in a timely manner to changes in customer preferences, tastes and trends and economic conditions could lead to, among other things, missed opportunities, excess inventory or inventory shortages, markdowns and write-offs, all of which could negatively impact our profitability and have a material adverse effect on our business, financial condition and results of operations. Failure to respond to changing customer preferences and fashion trends could also negatively impact our brand image with our customers and result in diminished brand loyalty.
Our inability to maintain our brand image, engage new and existing customers and gain market share could have a material adverse effect on our growth strategy and our business, financial condition and results of operations.
Our ability to maintain our brand image and reputation is integral to our business, as well as the implementation of our strategy to grow. Maintaining, promoting and growing our brand will depend largely on the success of our design, merchandising and marketing efforts and our ability to provide a consistent, high-quality customer experience. Our reputation could be jeopardized if we fail to maintain high standards for
17
Table of Contents
merchandise quality and integrity and any negative publicity about these types of concerns may reduce demand for our merchandise. While our brand enjoys a loyal customer base, the success of our growth strategy depends, in part, on our ability to keep existing customers engaged as well as attract new customers to shop our brand. If we experience damage to our reputation or loss of consumer confidence, we may not be able to retain existing customers or acquire new customers, which could have a material adverse effect on our business, financial condition and results of operations.
Our inability to manage our inventory levels and merchandise mix, including with respect to our omni-channel retail operations, could have a material adverse effect on our business, financial condition and results of operations.
Customer demand is difficult to predict and the lead times required for a substantial portion of our merchandise make it challenging to respond quickly to changes. Though we have the ability to source certain merchandise categories with shorter lead times, we generally enter into contracts for a substantial portion of our merchandise well in advance of the applicable selling season. Our business, financial condition and results of operations could be materially adversely affected if we are unable to manage inventory levels and merchandise mix and respond to changes in customer demand patterns. Inventory levels in excess of customer demand may result in lower than planned profitability. On the other hand, if we underestimate demand for our merchandise, we may experience inventory shortages resulting in missed sales and lost revenues. Either of these events could significantly affect our operating results and brand image and loyalty. Our profitability may also be impacted by changes in our merchandise mix and changes in our pricing. These changes could have a material adverse effect on our business, financial condition and results of operations.
In addition, our omni-channel operations create additional complexities in our ability to manage inventory levels, as well as certain operational issues in stores and on our website, including timely shipping and returns. Accordingly, our success depends to a large degree on continually evolving the processes and technology that enable us to plan and manage inventory levels and fulfill orders, address any related operational issues in store and on our website and further align channels to optimize our omni-channel operations. If we are unable to successfully manage these complexities, it may have a material adverse effect on our business, financial condition and results of operations.
Competitive pressures from other retailers as well as adverse structural developments in the retail sector may have a material adverse effect on our business, financial condition and results of operations.
The women’s apparel industry is highly competitive. We compete with local, national and international retail chains and department stores, specialty and discount stores, catalogs and internet businesses offering similar categories of merchandise. We face a variety of competitive challenges, including price pressure, anticipating and quickly responding to changing customer demands or preferences, maintaining favorable brand recognition and effectively marketing our merchandise to our customers in diverse demographic markets, sourcing merchandise efficiently and developing merchandise assortments in styles that appeal to our customers in ways that favorably distinguish us from our competitors. In addition, the internet and other new technologies facilitate competitive entry and comparison shopping. We strive to offer an omni-channel shopping experience for our customers that enhances their shopping experiences. Omni-channel retailing is constantly evolving and we must keep pace with changing customer expectations and new developments by our competitors. Furthermore, many of our competitors have advantages over us, including substantially greater financial, marketing and other resources. Increased levels of promotional activity by our competitors, some of whom may be able to adopt more aggressive pricing policies than we can, both on our website and in stores, may negatively impact our sales and profitability. There can be no assurances that we will be able to compete successfully with these companies in the future. In addition to competing for sales, we compete for favorable store locations, lease terms and qualified sales associates and professional staff. Increased competition in these areas may result in higher costs and reduced profitability, which could have a material adverse effect on our business, financial condition and results of operations.
18
Table of Contents
We may be unable to accurately forecast our operating results and growth rate, which may adversely affect our reported results.
We may not be able to accurately forecast our operating results and growth rate. We use a variety of factors in our forecasting and planning processes, including historical results, recent history and assessments of economic and market conditions, among other things. The growth rates in sales and profitability that we have experienced historically may not be sustainable as our active customer base expands and we achieve higher market penetration rates, and our percentage growth rates may decrease. The growth of our sales and profitability depends on the continued growth of demand for the merchandise we offer. A softening of demand, whether caused by changes in customer preferences or a weakening of the economy or other factors, may result in decreased net sales or growth. Furthermore, many of our expenses and investments are fixed, and we may not be able to adjust our spending in a timely manner to compensate for any unexpected shortfall in our net sales results. Failure to accurately forecast our operating results and growth rate could cause our actual results to be materially lower than anticipated, and if our growth rates decline as a result, investors’ perceptions of our business may be adversely affected, and the market price of our common stock could decline.
Our inability to successfully optimize our omni-channel operations and maintain a relevant and reliable omni-channel experience for our customers could have an adverse effect on our growth strategy and our business, financial condition and results of operations.
Growing our business through our omni-channel operations is key to our growth strategy. Our goal is to offer our customers seamless access to our merchandise across our channels, including both our direct and retail channels. Accordingly, our success depends on our ability to anticipate and implement innovations in sales and marketing strategies to appeal to existing and potential customers who increasingly rely on multiple channels, such as E-commerce, to meet their shopping needs. Failure to enhance our technology and marketing efforts to align with our customers’ developing shopping preferences could significantly impair our ability to meet our strategic business and financial goals. If we do not successfully optimize our omni-channel operations or if they do not achieve their intended objectives, it could have a material adverse effect on our business, financial condition and results of operations.
We depend on our E-commerce business and failure to successfully manage this business and deliver a seamless omni-channel shopping experience to our customers could have an adverse effect on our growth strategy and our business, financial condition and results of operations.
Sales through our direct channel, of which our E-commerce business constitutes the vast majority, accounted for approximately 42% of our total net sales for the twelve months ended October 29, 2016. Our business, financial condition and results of operations are dependent on maintaining our E-commerce business and expanding this business is an important part of our strategy to grow through our omni-channel operations. Dependence on our E-commerce business and the continued growth of our direct and retail channels subjects us to certain risks, including:
| • | the failure to successfully implement new systems, system enhancements and internet platforms; |
| • | the failure of our technology infrastructure or the computer systems that operate our website and their related support systems, causing, among other things, website downtimes, telecommunications issues or other technical failures; |
| • | the reliance on third-party computer hardware/software providers; |
| • | rapid technological change; |
| • | liability for online content; |
19
Table of Contents
| • | violations of federal, state, foreign or other applicable laws, including those relating to data protection; |
| • | credit card fraud; |
| • | cyber security and vulnerability to electronic break-ins and other similar disruptions; and |
| • | diversion of traffic and sales from our stores. |
Our failure to successfully address and respond to these risks and uncertainties could negatively impact sales, increase costs, diminish our growth prospects and damage the reputation of our brand, each of which could have a material adverse effect on our business, financial condition and results of operations.
Our business depends on effective marketing and increasing customer traffic and the success of our direct channel depends on customers’ use of our website and response to catalogs and digital marketing.
We have many initiatives in our marketing programs. If our competitors increase their spending on marketing, if our marketing expenses increase, if our marketing becomes less effective than that of our competitors, or if we do not adequately leverage technology and data analytics needed to generate concise competitive insight, we could experience a material adverse effect on our business, financial condition and results of operations. A failure to sufficiently innovate or maintain adequate and effective marketing strategies could inhibit our ability to maintain brand relevance and increase sales.
In particular, the level of customer traffic and volume of customer purchases through our direct channel, which accounted for approximately 42% of our net sales for the twelve months ended October 29, 2016, is substantially dependent on our ability to provide a content-rich and user-friendly website, widely distributed and informative catalogs, a fun, easy and hassle-free customer experience and reliable delivery of our merchandise. If we are unable to maintain and increase customers’ use of our E-commerce platform, and the volume of purchases declines, our business, financial condition and results of operations could be adversely affected.
Customer response to our catalogs and digital marketing is substantially dependent on merchandise assortment, merchandise availability and creative presentation, as well as the selection of customers to whom our catalogs are sent and to whom our digital marketing is directed, changes in mailing strategies and the size of our mailings. Our maintenance of a robust customer database has also been a key component of our overall strategy. If the performance of our website, catalogs and email declines, or if our overall marketing strategy is not successful, it could have a material adverse effect on our business, financial condition and results of operations.
We occupy our stores under long-term leases, which are subject to future increases in occupancy costs and which we may be unable to renew or may limit our flexibility to move to new locations.
We lease all of our store locations, our corporate headquarters and our distribution and customer contact center. We typically occupy our stores under operating leases with terms of up to ten years, which may include options to renew for additional multi-year periods thereafter. We depend on cash flow from operations to pay our lease expenses. If our business does not generate sufficient cash flow from operating activities to fund these expenses, we may not be able to service our lease expenses, which could materially harm our business. In the future, we may not be able to negotiate favorable lease terms. Our inability to do so may cause our occupancy costs to be higher in future years or may force us to close stores in desirable locations. If we are unable to renew our store leases, we may be forced to close or relocate a store, which could subject us to significant construction and other costs. Closing a store, for even a brief period to permit relocation, would reduce the revenue contribution of that store. Additionally, the revenue and profit, if any, generated at a relocated store may not equal the revenue and profit generated at the previous location.
20
Table of Contents
Long-term leases can limit our flexibility to move a store to a new location. Some of our leases have early cancellation clauses, which permit the lease to be terminated if certain sales levels are not met in specific periods, whereas some of our leases are non-cancelable. If an existing or future store is not profitable, and we have the right to close it, we may nonetheless be committed to perform our obligations under the applicable lease including, among other things, paying the base rent for the balance of the lease term. Moreover, even if a lease has an early cancellation clause, we may not satisfy the contractual requirements for early cancellation under that lease. Our inability to enter into new leases or renew existing leases on terms acceptable to us or be released from our obligations under leases for stores that we close could have a material adverse effect on our business, financial condition and results of operations.
Our growth strategy depends in part on our ability to open and operate new retail stores on a profitable basis and if we are not successful in implementing future retail store expansion, or if such new stores would negatively impact sales from our existing stores or from our direct channel, our growth and profitability could be adversely impacted.
Our growth strategy depends in part on our ability to open and operate new retail stores on a profitable basis. We may be unable to identify and open new retail locations in desirable places in the future. We compete with other retailers and businesses for suitable retail locations. Local land use, local zoning issues, environmental regulations, governmental permits and approvals and other regulations may affect our ability to find suitable retail locations and also influence the cost of leasing them. We also may have difficulty negotiating real estate leases for new stores on acceptable terms. In addition, construction, environmental, zoning and real estate delays may negatively affect retail location openings and increase costs and capital expenditures. If we are unable to open new retail store locations in desirable places and on favorable terms, our net sales and profits could be materially adversely affected.
As we expand our store base, our lease expense and our cash outlays for rent under the lease terms will increase. Such growth will require that we continue to expand and improve our operating capabilities, including making investments in our information technology and operational infrastructure, and expand, train and manage our employee base, and we may be unable to do so. We primarily rely on cash flow generated from our operations to pay our lease expenses and to fund our growth initiatives. It requires a significant investment to open a new retail store. If we open a large number of stores relatively close in time, the cost of these retail store openings and lease expenses and the cost of continuing operations could reduce our cash position. If our business does not generate sufficient cash flow from operating activities to fund these expenses, we may not have sufficient cash available to address other aspects of our business or we may be unable to service our lease expenses, which could materially harm our business.
As we increase the number of retail stores, our stores may become more highly concentrated in geographic regions we already serve. As a result, the number of customers and related net sales at individual stores may decline and the payback period may be increased. The growth in the number of our retail stores could also draw customers away from our direct business and if our competitors open stores with similar formats, our retail store format may become less unique and may be less attractive to customers as a shopping destination. If either of these events occurs, our business, financial condition and results of operations could be materially adversely affected.
There can be no assurances that we will be able to achieve our store expansion goals, nor can there be any assurances that our newly opened stores will achieve revenue or profitability levels comparable to those of our existing stores in the time periods estimated by us. In addition, the substantial management time and resources which our retail store expansion strategy requires may result in disruption to our existing business operations which may decrease our profitability. If our stores fail to achieve, or are unable to sustain, acceptable revenue, profitability and cash flow levels, we may incur store asset impairment charges, significant costs associated with closing those stores or both, which could have a material adverse effect on our business, financial condition and results of operations.
21
Table of Contents
We rely on third-party service providers, such as Federal Express and the U.S. Postal Service, for the delivery of our merchandise and our catalogs.
We primarily utilize Federal Express to support retail store shipping. We also use the U.S. Postal Service to deliver millions of catalogs each year, and we depend on third parties to print and mail our catalogs. As a result, postal rate increases and paper and printing costs will affect the cost of our catalog and promotional mailings. We rely on discounts from the basic postal rate structure, such as discounts for bulk mailings and sorting. The operational and financial difficulties of the U.S. Postal Service are well documented. Any significant and unanticipated increase in postage, shipping costs, reduction in service, slow-down in delivery or increase in paper and printing costs could impair our ability to deliver merchandise and catalogs in a timely or economically efficient manner and could adversely impact our profitability if we are unable to pass such increases directly on to our customers or if we are unable to implement more efficient delivery and order fulfillment systems, all of which could have a material adverse effect on our business, financial condition and results of operations.
Competitive pricing pressures with respect to shipping our merchandise to our customers may harm our business and results of operations.
Historically, the shipping and handling fees we charge our direct customers are intended to recover the related shipping and handling expenses. Online and omni-channel retailers are increasing their focus on delivery services, as customers are increasingly seeking faster, guaranteed delivery times and low-price or free shipping. To remain competitive, we may be required to offer discounted, free or other more competitive shipping options to our customers, which may result in declines in our shipping and handling fees and increased shipping and handling expense. Declines in the shipping and handling fees that we generate may have a material adverse effect on our profitability to the extent that our shipping and handling expense is not declining proportionally, or if our shipping and handling expense would increase, which could have a material adverse effect on our business, financial condition and results of operations.
We are subject to payment-related risks.
We accept payments using a variety of methods, including credit cards, debit cards, gift cards, cash and bank checks. For existing and future payment methods we offer to our customers, we may become subject to additional regulations and compliance requirements (including obligations to implement enhanced authentication processes that could result in increased costs and reduce the ease of use of certain payment methods), as well as fraud. For certain payment methods, including credit and debit cards, we pay interchange and other fees, which may increase over time, thereby raising our operating costs and lowering profitability. We rely on third-party service providers for payment processing services, including the processing of credit and debit cards. In each case, it could disrupt our business if these third-party service providers become unwilling or unable to provide these services to us. We are also subject to payment card association operating rules, including data security rules, certification requirements and rules governing electronic funds transfers, which could change or be reinterpreted to make it difficult or impossible for us to comply. If we fail to comply with these rules or requirements, or if our data security systems are breached or compromised, we may be liable for card issuing banks’ and others’ costs, subject to fines and higher transaction fees and/or lose our ability to accept credit and debit card payments from our customers and process electronic funds transfers or facilitate other types of payments. Any of these developments could have a material adverse effect on our business, financial condition and results of operations.
On October 1, 2015, under payment card industry standards, liability shifted for certain debit and credit card transactions to retailers who do not accept Europay, MasterCard and Visa (“EMV”) chip technology transactions. Until we complete the implementation of EMV chip technology in our stores, we may be liable for chargebacks related to counterfeit transactions generated through EMV chip enabled cards, which could have a material adverse effect on our business, financial condition and results of operations. Further, we may experience a decrease in transaction volume if we cannot process transactions for cardholders whose issuer has migrated entirely from magnetic strip to EMV chip enabled cards.
22
Table of Contents
If we fail to acquire new customers in a cost-effective manner, it could have an adverse impact on our growth strategy as we may not be able to increase net revenue or profit per active customer.
The success of our growth strategy depends in part on our ability to acquire new customers in a cost-effective manner. In order to expand our active customer base, we must appeal to and acquire customers who identify with our brand. We have made significant investments related to customer acquisition and expect to continue to spend significant amounts to acquire additional customers. As our brand becomes more widely known in the market, future marketing campaigns may not result in the acquisition of new customers at the same rate as past campaigns. There can be no assurances that the revenue from new customers we acquire will ultimately exceed the cost of acquiring those customers.
We use paid and non-paid advertising. Our paid advertising includes catalogs, paid search engine marketing, email, display and other advertising. Our non-paid advertising efforts include search engine optimization and social media. We obtain a significant amount of traffic via search engines and, therefore, rely on search engines such as Google, Yahoo! and Bing. Search engines frequently update and change the logic that determines the placement and display of results of a user’s search, such that the purchased or algorithmic placement of links to our site can be negatively affected. A major search engine could change its algorithms in a manner that negatively affects our paid or non-paid search ranking, and competitive dynamics could impact the effectiveness of search engine marketing or search engine optimization. We also obtain traffic via social networking websites or other channels used by our current and prospective customers. As E-commerce and social networking continue to rapidly evolve, we must continue to establish relationships with these channels and may be unable to develop or maintain these relationships on acceptable terms. Additionally, digital advertising costs may continue to rise and as our usage of these channels expands, such costs may impact our ability to acquire new customers in a cost-effective manner. If the level of usage of these channels by our active customer base does not grow as expected, we may suffer a decline in customer growth or net sales. If we are unable to acquire new customers in a cost-effective manner, it could have a material adverse effect on our business, financial condition and results of operations.
Interruptions in our foreign sourcing operations and the relationships with our suppliers and agents could disrupt production, shipment or receipt of our merchandise, which would result in lost sales and increased costs.
We do not own or operate any manufacturing facilities and therefore depend upon independent third-party suppliers for the manufacturing of all of our merchandise, primarily through the use of agents. In pro forma fiscal year 2015, approximately 81% of our products were sourced through agents and 19% were sourced directly from suppliers and factories. Our merchandise is manufactured to our specifications primarily by factories outside of the United States. Some of the factors that might affect a supplier’s ability to ship orders of our merchandise in a timely manner or to meet our quality standards are outside of our control, including inclement weather, natural disasters, political and financial instability, legal and regulatory developments, strikes, health concerns regarding infectious diseases, and acts of terrorism. Inadequate labor conditions, health or safety issues in the factories where goods are produced can negatively impact our brand’s reputation. Late delivery of merchandise or delivery of merchandise that does not meet our quality standards could cause us to miss the delivery date requirements of our customers or delay timely delivery of merchandise to our stores for those items. These events could cause us to fail to meet customer expectations, cause our customers to cancel orders or cause us to be unable to deliver merchandise in sufficient quantities or of sufficient quality to our stores, which could result in lost sales.
We have no long-term merchandise supply contracts as we typically transact business on an order-by-order basis. If we are unable to maintain the relationships with our suppliers and agents and are unexpectedly required to change suppliers or agents, or if a key supplier or agent is unable or unwilling to supply acceptable merchandise in sufficient quantities on acceptable terms, we could experience a significant disruption in the supply of merchandise. We could also experience operational difficulties with our suppliers, such as reductions in the availability of production capacity, supply chain disruptions, errors in complying with merchandise
23
Table of Contents
specifications, insufficient quality control, shortages of fabrics or other raw materials, failures to meet production deadlines or increases in manufacturing costs.
We source our imported merchandise from eight countries including China, India, the Philippines, Indonesia and Vietnam. Approximately 75% of our products were sourced in Asia in pro forma fiscal year 2015. Any event causing a sudden disruption of manufacturing or imports from Asia or elsewhere, including the imposition of additional import restrictions, could materially harm our operations. Many of our imports are subject to existing or potential duties, tariffs or quotas that may limit the quantity of certain types of goods that may be imported into the United States from countries in Asia or elsewhere. We compete with other companies for production facilities and import quota capacity. While substantially all of our foreign purchases of our merchandise are negotiated and paid for in U.S. dollars, the cost of our merchandise may be affected by fluctuations in the value of relevant foreign currencies.
In addition, we are engaging in growing the amount of production carried out in other developing countries. These countries may present other risks with regard to infrastructure available to support manufacturing, labor and employee relations, political and economic stability, corruption, regulatory, environmental, health and safety compliance. While we endeavor to monitor and audit facilities where our production is done, any significant events with factories we use can adversely impact our reputation, brand and product delivery.
Furthermore, many of our suppliers rely on working capital financing to support their operations. To the extent any of our suppliers are unable to obtain adequate credit or their borrowing costs increase, we may experience delays in obtaining merchandise, our suppliers increasing their prices or our suppliers modifying payment terms in a manner that is unfavorable to us.
The failure of our suppliers to comply with our social compliance program requirements could have a material adverse effect on our reputation, business, financial condition and results of operations.
We require our third-party suppliers to comply with all applicable laws and regulations, as well as our Terms of Engagement-Commitment to Ethical Sourcing, which cover many areas, including labor, health, safety, environmental and other legal standards. We monitor compliance with these standards using third-party monitoring firms. Although we have an active program to provide training for our third-party suppliers and monitor their compliance with these standards, we do not control the suppliers or their practices. Any failure of our third-party suppliers to comply with our ethical sourcing standards or labor or other local laws in the country of manufacture, or the divergence of a third-party supplier’s labor practices from those generally accepted as ethical in the United States, could disrupt the shipment of merchandise to our stores, force us to locate alternative manufacturing sources, reduce demand for our merchandise, damage our reputation and/or expose us to potential liability for their wrongdoings. Any of these events could have a material adverse effect on our reputation, business, financial condition and results of operations.
We rely on third parties to provide services in connection with certain aspects of our business, and any failure by these third parties to perform their obligations could have an adverse effect on our business, financial condition and results of operations.
We have entered into agreements with third parties that include, but are not limited to, logistics services, information technology systems (including hosting our website), servicing certain customer calls, software development and support, catalog production, select marketing services, distribution and employee benefits servicing. Services provided by third-party suppliers could be interrupted as a result of many factors, such as acts of nature or contract disputes. Any failure by a third party to provide services for which we have contracted on a timely basis or within expected service level and performance standards could result in a disruption of our business and have an adverse effect on our business, financial condition and results of operations.
24
Table of Contents
Increases in the demand for, or the price of, cotton and other raw materials used to manufacture our merchandise or other fluctuations in sourcing or distribution costs could increase our costs and negatively impact our profitability.
We believe that we have strong supplier relationships, and we work continuously with our suppliers to manage cost increases. Our overall profitability depends, in part, on the success of our ability to mitigate rising costs or shortages of raw materials used to manufacture our merchandise. Cotton and other raw materials used to manufacture our merchandise are subject to availability constraints and price volatility impacted by a number of factors, including supply and demand for fabrics, weather, government regulations, economic climate and other unpredictable factors. In addition, our sourcing costs may fluctuate due to labor conditions, transportation or freight costs, energy prices, currency fluctuations or other unpredictable factors. The cost of labor at many of our third-party suppliers has been increasing in recent years, and we believe it is unlikely that such cost pressures will abate.
Most of our merchandise is shipped from our suppliers by ocean vessel. If a disruption occurs in the operation of ports through which our merchandise is imported, we may incur increased costs related to air freight or use of alternative ports. Shipping by air is significantly more expensive than shipping by ocean and our margins and profitability could be reduced. Shipping to alternative ports could also lead to delays in receipt of our merchandise. We rely on third-party shipping companies to deliver our merchandise to us. Failures by these shipping companies to deliver our merchandise to us or lack of capacity in the shipping industry could lead to delays in receipt of our merchandise or increased expense in the delivery of our merchandise. Any of these developments could have a material adverse effect on our business, financial condition and results of operations.
Reductions in the volume of mall traffic or the closing of shopping malls as a result of changing economic conditions or demographic patterns could significantly reduce our sales and leave us with unsold inventory.
A significant portion of our stores are currently located in shopping malls. Sales at stores located in malls are highly dependent on the traffic in those malls and the ability of developers to generate traffic near our stores. In recent years, there has been increased purchasing of merchandise online. This has adversely affected mall traffic. A continuation of this trend could adversely impact the sales generated by our mall stores, which could have a material adverse effect on our business, financial condition and results of operations.
Unseasonal or severe weather conditions may adversely affect our merchandise sales.
Our business is adversely affected by unseasonal weather conditions. Sales of certain seasonal apparel items are dependent in part on the weather and may decline when weather conditions do not favor the use of this apparel. Severe weather events may also impact our ability to supply our retail stores, deliver orders to customers on schedule and staff our retail stores and distribution and customer contact center, which could have a material adverse effect on our business, financial condition and results of operations.
Material damage to, or interruptions in, our information systems could have a material adverse effect on our business, financial condition and results of operations, and we may be exposed to risks and costs associated with protecting the integrity and security of our customers’ information.
We depend largely upon our information technology systems in the conduct of all aspects of our operations, including to operate our website, process transactions, respond to customer inquiries, manage inventory, purchase, sell and ship goods on a timely basis and maintain cost-efficient operations. Such systems are subject to damage or interruption from power outages, computer and telecommunications failures, computer viruses, security breaches and natural disasters. Damage or interruption to our information technology systems may require a significant investment to fix or replace the affected system, and we may suffer interruptions in our operations in the interim. In addition, costs and potential problems and interruptions associated with the implementation of new or upgraded systems and technology or with maintenance or adequate support of existing systems could also disrupt or reduce the efficiency of our operations.
25
Table of Contents
Additionally, a significant number of customer purchases across our omni-channel platform are made using credit cards, and a significant number of our customer orders are placed through our website. We process, store and transmit large amounts of data, including personal information, for our customers. From time to time, we may implement strategic initiatives related to elevating our customer service experience, such as customer membership programs, where we collect and maintain increasing amounts of customer data. We also handle and transmit sensitive information about our suppliers and workforce, including social security numbers, bank account information and health and medical information. We depend in part throughout our operations on the secure transmission of confidential information over public networks. In addition, security breaches can also occur as a result of non-technical issues, including vandalism, catastrophic events and human error. Our operations may further be impacted by security breaches that occur at third-party suppliers. Although we maintain cyber-security insurance, there can be no assurances that our insurance coverage will be sufficient, or that insurance proceeds will be paid to us in a timely manner.
States and the federal government have enacted additional laws and regulations to protect consumers against identity theft, including laws governing treatment of personally identifiable information. As the data privacy and security laws and regulations evolve, we may be subject to more extensive requirements to protect the customer information that we process in connection with the purchases of our merchandise. There can be no assurances that we will be able to operate our operations in accordance with Payment Card Industry Data Security Standards (PCI DSS), other industry recommended practices or applicable laws and regulations or any future security standards or regulations, or that meeting those standards will in fact prevent a data breach. These laws have increased the costs of doing business and, if we fail to implement appropriate safeguards or we fail to detect and provide prompt notice of unauthorized access as required by some of these laws, we could be subject to potential claims for damages and other remedies.
If a third party is able to circumvent our security measures, they could destroy or steal valuable information or disrupt our operations. Because techniques used to obtain unauthorized access or to sabotage systems change frequently and often are not recognized until launched against a target, we may be unable to anticipate these techniques or to implement adequate preventative measures. Any security breach could expose us to risks of data loss, fines, litigation and liability and could seriously disrupt our operations and harm our reputation. In addition, we could be required to expend significant resources to change our business practices or modify our service offerings in connection with the protection of personally identifiable information, which could have a material adverse effect on our business, financial condition and results of operations.
The impact of privacy breaches at service providers could also severely damage our business and reputation.
We rely heavily on technology services provided by third parties for the successful operation of our business, including electronic messaging, digital marketing efforts and the collection and retention of customer data and associate information. We also rely on third parties to process credit card transactions, perform E-commerce and social media activities and retain data relating to our financial position and results of operations, strategic initiatives and other important information. The facilities and systems of our third-party service providers may be vulnerable to cyber-security breaches, acts of vandalism, computer viruses, misplaced or lost data, programming and/or human errors or other similar events. Any actual or perceived misappropriation, loss or other unauthorized disclosure of confidential or personally identifiable information by our third-party service providers could severely damage our reputation and our relationship with our customers, associates and investors as well as expose us to risks of litigation, liability or other penalties, all of which could have a material adverse effect on our business, financial condition and results of operations.
Our failure to comply with data protection laws and regulations could subject us to sanctions and damages and could harm our reputation and business.
We collect and process personal data as part of our business. As a result, we are subject to U.S. data protection laws and regulations at both the federal and state levels. The legislative and regulatory landscape for data protection continues to evolve, and in recent years there has been an increasing focus on privacy and data
26
Table of Contents
security issues. The strategic use of our customer data base, including interactions with our customers, marketing efforts and analysis of customer behavior, rely on the collection, retention and use of customer data and may be affected by these laws and regulations and their interpretation and enforcement. Alleged violations of laws, regulations or contractual obligations relating to privacy and data protection, and any relevant claims, may expose us to potential liability, require us to expend significant resources in responding to and defending such allegations and claims, and result in negative publicity and a loss of confidence in us by our customers, all of which could have an adverse effect on our business, financial condition and results of operations. Further, it is unclear how the laws and regulations relating to the collection, process and use of personal data will further develop in the United States, and to what extent this may affect our operations in the future. Any failure to comply with data protection laws and regulations, or future changes required to the way in which we use personal data, could have a material adverse effect on our business, financial condition and results of operations.
Increased usage of social media poses reputational risks.
As use of social media becomes more prevalent, our susceptibility to risks related to social media increases. The immediacy of social media precludes us from having real-time control over postings made regarding us via social media, whether matters of fact or opinion. Information distributed via social media could result in immediate unfavorable publicity for which we, like our competitors, do not have the ability to reverse. This unfavorable publicity could result in damage to our reputation and therefore have a material adverse effect on our business, financial condition and results of operations.
We depend on our executive management and key personnel and may not be able to retain or replace these employees or recruit additional qualified personnel, which could harm our business.
We believe that we have benefited substantially from the leadership and experience of our senior executives, including our President and Chief Executive Officer, Paula Bennett. The loss of the services of any of our senior executives could have a material adverse effect on our business, financial condition and results of operations, as we may not be able to find suitable management personnel to replace departing executives on a timely basis. In addition, as our business expands, we believe that our future success will depend greatly on our continued ability to attract and retain highly skilled and qualified personnel. There is a high level of competition for personnel in the retail industry. Our inability to meet our staffing requirements in the future could impair our ability to increase revenue and could otherwise harm our business.
Our failure to find store employees that reflect our brand image and embody our culture could adversely affect our business, financial condition and results of operations.
Our success depends in part upon our ability to attract, motivate and retain a sufficient number of store employees, including store managers, who understand and appreciate our culture and customers, and are able to adequately and effectively represent this culture and establish credibility with our customers. The store employee turnover rate in the retail industry is generally high. Labor shortages and excessive store employee turnover will result in higher employee costs associated with finding, hiring and training new store employees. If we are unable to hire and retain store personnel capable of consistently providing a high level of customer service, our ability to open new stores and operate existing stores may be impaired and our performance and brand image may be negatively impacted. Competition for such qualified individuals and wage increases by other retailers could require us to pay higher wages to attract a sufficient number of employees. We are also dependent upon temporary personnel to adequately staff our stores and distribution and customer contact center, with heightened dependence during busy periods such as the holiday season. There can be no assurances that there will be sufficient sources of suitable temporary personnel to meet our demand. Any such failure to meet our staffing needs or any material increases in employee turnover rates could have a material adverse effect on our business, financial condition and results of operations.
27
Table of Contents
Labor organizing and other activities could negatively impact us.
Currently, none of our employees are represented by a union. However, our employees have the right at any time to form or affiliate with a union. Such organizing activities could lead to work slowdowns or stoppages, which could lead to disruption in our operations and increases in our labor costs, either of which could materially adversely affect our business, financial condition and results of operations.
Increases in labor costs, including wages, could adversely affect our business, financial condition and results of operations.
The labor costs associated with our retail stores and our distribution and customer contact center are subject to many external factors, including unemployment levels, prevailing wage rates, minimum wage laws, potential collective bargaining arrangements, health insurance costs and other insurance costs and changes in employment and labor legislation or other workplace regulation. From time to time, legislative proposals are made to increase the federal minimum wage in the United States, as well as the minimum wage in a number of individual states and municipalities, and to reform entitlement programs, such as health insurance and paid leave programs. As minimum wage rates increase or related laws and regulations change, we may need to increase not only the wage rates of our minimum wage employees, but also the wages paid to our other hourly or salaried employees. Any increase in the cost of our labor could have an adverse effect on our business, financial condition and results of operations or if we fail to pay such higher wages we could suffer increased employee turnover. Increases in labor costs could force us to increase prices, which could adversely impact our sales. If competitive pressures or other factors prevent us from offsetting increased labor costs by increases in prices, our profitability may decline and could have a material adverse effect on our business, financial condition and results of operations.
We could be materially and adversely affected if our distribution and customer contact center is damaged or closed or if its operations are diminished.
Our distribution and customer contact center is located in Tilton, New Hampshire. The distribution center manages the receipt, storage, sorting, packing and distribution of merchandise to our stores and to our direct customers. Independent third-party transportation companies then deliver merchandise from the distribution center to our stores or direct to our customers. The customer contact center handles all customer interactions, other than those in retail stores, including phone sales orders and service calls, emails and internet contacts. Any significant interruption in the operations of our Tilton distribution and customer contact center, our third-party distribution, fulfillment or transportation providers, for any reason, including natural disasters, accidents, inclement weather, technology system failures, work stoppages, slowdowns or strikes or other unforeseen events and circumstances, could delay or impair our ability to receive orders and to distribute merchandise to our stores and/or our customers. This could lead to inventory issues, increased costs, lower sales and a loss of loyalty to our brand, among other things, which could adversely affect our business, financial condition and results of operations.
Inventory shrinkage could have a material adverse effect on our business, financial condition and results of operations.
We are subject to the risk of inventory loss and theft. Although our inventory shrinkage rates have not been material, or fluctuated significantly in recent years, there can be no assurances that actual rates of inventory loss and theft in the future will be within our estimates or that the measures we are taking will effectively reduce inventory shrinkage. Although some level of inventory shrinkage is an unavoidable cost of doing business, if we were to experience higher rates of inventory shrinkage or incur increased security costs to combat inventory theft, it could have a material adverse effect on our business, financial condition and results of operations.
28
Table of Contents
We may be unable to protect our trademarks and other intellectual property rights.
We believe that our trademarks and service marks are important to our success and our competitive position due to their name recognition with our customers. We devote substantial resources to the establishment and protection of our trademarks and service marks. We are not aware of any valid claims of infringement or challenges to our right to use any of our trademarks and service marks. Nevertheless, there can be no assurances that the actions we have taken to establish and protect our trademarks and service marks will be adequate to prevent imitation of our merchandise by others or to prevent others from seeking to block sales of our merchandise as a violation of the trademarks, service marks and intellectual property of others. Also, others may assert rights in, or ownership of, our trademarks and other intellectual property and we may not be able to successfully resolve these types of conflicts to our satisfaction.
We may be subject to liability if we infringe upon the intellectual property rights of third parties.
Third parties may sue us for alleged infringement of their proprietary rights. The party claiming infringement might have greater resources than we do to pursue its claims, and we could be forced to incur substantial costs and devote significant management resources to defend against such litigation. If the party claiming infringement were to prevail, we could be forced to discontinue the use of the related trademark or design and/or pay significant damages or enter into expensive royalty or licensing arrangements with the prevailing party, assuming these royalty or licensing arrangements are available at all on an economically feasible basis, which they may not be. We could also be required to pay substantial damages. Such infringement claims could harm our brand. In addition, any payments we are required to make and any injunction we are required to comply with as a result of such infringement could have a material adverse effect on our business, financial condition and results of operations.
We are subject to laws and regulations in the jurisdictions in which we operate and changes to the regulatory environment in which we operate or failure to comply with applicable laws and regulations could adversely affect our business, financial condition and results of operations.
Our business requires compliance with many laws and regulations in the United States and abroad, including, without limitation, labor and employment, tax, environmental, privacy, anti-bribery laws and regulations, trade laws and customs, truth-in-advertising, E-commerce, consumer protection and zoning and occupancy laws and ordinances that regulate retailers generally and/or govern the importation, promotion and sale of merchandise and the operation of stores and warehouse facilities. In addition, in the future, there may be new legal or regulatory requirements or more stringent interpretations of applicable requirements, which could increase the complexity of the regulatory environment in which we operate and the related cost of compliance. While it is our policy and practice to comply with all legal and regulatory requirements and our procedures and internal controls are designed to ensure such compliance, failure to achieve compliance could subject us to lawsuits and other proceedings, and could also lead to damage awards, fines and penalties. Litigation matters may include, among other things, government and agency investigations, employment, commercial, intellectual property, tort, advertising and, after this offering, stockholder claims. We cannot predict with certainty the outcomes of these legal proceedings and other contingencies. The outcome of some of these legal proceedings, audits and other contingencies could require us to take, or refrain from taking, actions which could negatively affect our operations or require us to pay substantial amounts of money adversely affecting our business, financial condition and results of operations. Even a claim of an alleged violation of applicable laws or regulations could negatively affect our reputation. Additionally, defending against these lawsuits and proceedings may be necessary, which could result in substantial costs and diversion of management’s attention and resources, causing a material adverse effect on our business, financial condition and results of operations. Any pending or future legal proceedings and audits could have a material adverse effect on our business, financial condition and results of operations.
29
Table of Contents
Changes in tax laws and regulations or in our operations may impact our effective tax rate and may adversely affect our business, financial condition and operating results.
Changes in tax laws in any of the multiple jurisdictions in which we operate, or adverse outcomes from tax audits that we may be subject to in any of the jurisdictions in which we operate, could result in an unfavorable change in our effective tax rate, which could adversely affect our business, financial condition and operating results.
Additionally, results of the November 2016 U.S. elections have introduced greater uncertainty with respect to tax and trade policies, tariffs and government regulations affecting trade between the U.S. and other countries. We source the majority of our merchandise from manufacturers located outside of the U.S., including a significant amount from Asia. Major developments in tax policy or trade relations, such as the disallowance of tax deductions for imported merchandise or the imposition of unilateral tariffs on imported products, could have a material adverse effect on our business, results of operations and liquidity.
War, terrorism, civil unrest or other violence may negatively impact availability of merchandise and/or otherwise adversely impact our business.
In the event of war, terrorism, civil unrest or other violence, our ability to obtain merchandise available for sale in our stores or on our websites may be negatively impacted. A substantial portion of our merchandise is imported from other countries, see “—Interruptions in our foreign sourcing operations and the relationships with our suppliers and agents could disrupt production, shipment or receipt of our merchandise, which would result in lost sales and could increase our costs.” If commercial transportation is curtailed or substantially delayed, our business may be adversely impacted, as we may have difficulty shipping merchandise to our distribution and customer contact center and stores, as well as fulfilling catalog and website orders. In addition, our stores are located in public areas where large numbers of people typically gather. Terrorist attacks, threats of terrorist attacks or civil unrest involving public areas could cause people not to visit areas where our stores are located. Other types of violence in malls or in other public areas could lead to lower customer traffic in areas in which we operate stores. If any of these events were to occur, we may be required to suspend operations in some or all of our stores, which could have a material adverse effect on our business, financial condition and results of operations.
The terms of our term loan credit agreement and asset-based revolving credit facility restrict our operational and financial flexibility, which could adversely affect our ability to respond to changes in our business and to manage our operations.
Our Term Loan and our ABL Facility (together with the Term Loan, the “Credit Agreements”), contain, and any additional debt financing we may incur would likely contain, covenants that restrict our operations, including limitations on our ability to grant liens, incur additional debt, pay dividends, cause our subsidiaries to pay dividends to us, make certain investments and engage in certain merger, consolidation or asset sale transactions. A failure by us to comply with the covenants or financial ratios contained in our Credit Agreements could result in an event of default, which could adversely affect our ability to respond to changes in our business and manage our operations. Upon the occurrence of an event of default, the lenders could elect to declare all amounts outstanding to be due and payable and exercise other remedies as set forth in our Credit Agreements. If the indebtedness under our Credit Agreements were to be accelerated, our future financial condition could be materially adversely affected. See “Management’s Discussion and Analysis of Financial Condition and Results of Operations—Liquidity and Capital Resources—Credit Facilities.”
Changes to estimates related to our property, fixtures and equipment or operating results that are lower than our current estimates at certain store locations may cause us to incur impairment charges on certain long-lived assets, which may adversely affect our results of operations.
In accordance with accounting guidance as it relates to the impairment of long-lived assets, we make certain estimates and projections with regard to individual store operations, as well as our overall performance, in
30
Table of Contents
connection with our impairment analyses for long-lived assets. When impairment triggers are deemed to exist for any location, the estimated undiscounted future cash flows are compared to its carrying value. If the carrying value exceeds the undiscounted cash flows, an impairment charge equal to the difference between the carrying value and the fair value is recorded. The projections of future cash flows used in these analyses require the use of judgment and a number of estimates and projections of future operating results. If actual results differ from our estimates, additional charges for asset impairments may be required in the future. If future impairment charges are significant, our reported operating results would be adversely affected.
Goodwill and identifiable intangible assets represent a significant portion of our total assets and any impairment of these assets could adversely affect our results of operations.
Our goodwill and indefinite-lived intangible assets, which consist of goodwill from the Acquisition, and our trade name, represented a significant portion of our total assets as of January 30, 2016. Accounting rules require the evaluation of our goodwill and indefinite-lived intangible assets for impairment at least annually, or more frequently when events or changes in circumstances indicate that the carrying value of such assets may not be recoverable. Such indicators are based on market conditions and the operational performance of our business.
To test goodwill for impairment, we may initially use a qualitative approach to determine whether conditions exist to indicate that it is more likely than not that the fair value of a reporting unit is less than its carrying value. If our management concludes, based on its assessment of relevant events, facts and circumstances that it is more likely than not that a reporting unit’s carrying value is greater than its fair value, then a quantitative analysis will be performed to determine if there is any impairment. We may also elect to initially perform a quantitative analysis, which is a two-step assessment. In step one we estimate the reporting unit’s fair value by estimating the future cash flows of the reporting units to which the goodwill relates, and then discount the future cash flows at a market-participant-derived weighted average cost of capital. The estimates of fair value of reporting units are based on the best information available as of the date of the assessment. If the carrying value of a reporting unit exceeds its estimated fair value in the first step, a second step is performed. Step two compares the implied fair value of goodwill to the carrying amount of goodwill. The implied fair value of goodwill is determined by a hypothetical purchase price allocation using the reporting unit’s fair value as the purchase price. If the implied fair value of the goodwill is less than the reporting unit’s carrying amount, then goodwill is impaired and is written down to the implied fair value amount.
To test our other indefinite-lived assets for impairment, which consists of our trade name, we determine the fair value of our trade name using the relief-from-royalty method, which estimates the present value of royalty income that could be hypothetically earned by licensing the brand name to a third party over the remaining useful life. If in conducting an impairment evaluation we determine that the carrying value of an asset exceeded its fair value, we would be required to record a non-cash impairment charge for the difference between the carrying value and the fair value of the asset. If a significant amount of our goodwill and identifiable intangible assets were deemed to be impaired, our business, financial condition and results of operations could be materially adversely affected.
Changes in accounting standards and subjective assumptions, estimates and judgments by management related to complex accounting matters could significantly affect our financial results or financial condition.
Generally accepted accounting principles and related accounting pronouncements, implementation guidelines and interpretations with regard to a wide range of matters that are relevant to our business, including but not limited to revenue recognition, business combinations, impairment of goodwill, indefinite-lived intangible assets and long-lived assets, inventory and equity-based compensation, are highly complex and involve many subjective assumptions, estimates and judgments. Changes in these rules or their interpretation or changes in underlying assumptions, estimates or judgments could significantly change our reported or expected financial performance or financial condition.
31
Table of Contents
Changes in lease accounting standards may materially and adversely affect us.
The Financial Accounting Standards Board, or FASB, recently adopted new accounting rules, to be effective for our fiscal year beginning after December 2018 that will require companies to capitalize all leases on their balance sheets by recognizing a lessee’s rights and obligations. When the rules are effective, we will be required to account for the leases for stores as assets and liabilities on our balance sheet, where previously we accounted for such leases on an “off balance sheet” basis. As a result, a significant amount of lease related assets and liabilities will be recorded on our balance sheet and we may be required to make other changes to the recording and classification of our lease related expenses. Though these changes will not have any direct impact on our overall financial condition, these changes could cause investors or others to believe that we are highly leveraged and could change the calculations of financial metrics and covenants under our debt facilities, as well as third-party financial models regarding our financial condition.
Risks Related to this Offering and Ownership of Our Common Stock
We are an “emerging growth company,” and will be able take advantage of reduced disclosure requirements applicable to “emerging growth companies,” which could make our common stock less attractive to investors.
We are an “emerging growth company,” as defined in the Jumpstart Our Business Startups Act of 2012, or JOBS Act, and, for as long as we continue to be an “emerging growth company,” we intend to take advantage of certain exemptions from various reporting requirements applicable to other public companies but not to “emerging growth companies.” These exemptions include not being required to comply with the auditor attestation requirements of Section 404 of the Sarbanes-Oxley Act, reduced disclosure obligations regarding executive compensation in our periodic reports and proxy statements, and exemptions from the requirements of holding a nonbinding advisory vote on executive compensation and stockholder approval of any golden parachute payments not previously approved. We could be an “emerging growth company” for up to five years, or until the earliest of (i) the last day of the first fiscal year in which our annual gross revenues exceed $1 billion, (ii) the date that we become a “large accelerated filer” as defined in Rule 12b-2 under the Exchange Act, which would occur if the market value of our common stock that is held by non-affiliates exceeds $700 million as of the last business day of our most recently completed second fiscal quarter, or (iii) the date on which we have issued more than $1 billion in non-convertible debt during the preceding three-year period. We cannot predict if investors will find our common stock less attractive if we choose to rely on these exemptions. If some investors find our common stock less attractive as a result of any choices to reduce future disclosure, there may be a less active trading market for our common stock and our stock price may be more volatile.
We will incur significantly increased costs and devote substantial management time as a result of operating as a public company particularly after we are no longer an “emerging growth company.”
As a public company, we will incur significant legal, accounting and other expenses that we did not incur as a private company. For example, we will be required to comply with certain of the requirements of the Sarbanes-Oxley Act and the Dodd-Frank Wall Street Reform and Consumer Protection Act, as well as rules and regulations subsequently implemented by the Securities and Exchange Commission, and the NYSE, our stock exchange, including the establishment and maintenance of effective disclosure and financial controls and changes in corporate governance practices. We expect that compliance with these requirements will increase our legal and financial compliance costs and will make some activities more time consuming and costly. In addition, we expect that our management and other personnel will need to divert attention from operational and other business matters to devote substantial time to these public company requirements. In particular, we expect to incur significant expenses and devote substantial management effort toward ensuring compliance with the requirements of the Sarbanes-Oxley Act. In that regard, we expect to hire additional accounting and financial staff with appropriate public company experience and technical accounting knowledge.
However, for as long as we remain an “emerging growth company” as defined in the JOBS Act, we intend to take advantage of certain exemptions from various reporting requirements that are applicable to other
32
Table of Contents
public companies that are not “emerging growth companies” including, but not limited to, not being required to comply with the auditor attestation requirements of Section 404 of the Sarbanes-Oxley Act, reduced disclosure obligations regarding executive compensation in our periodic reports and proxy statements, and exemptions from the requirements of holding a nonbinding advisory vote on executive compensation and stockholder approval of any golden parachute payments not previously approved. We intend to take advantage of these reporting exemptions until we are no longer an “emerging growth company.”
Under the JOBS Act, “emerging growth companies” can delay adopting new or revised accounting standards until such time as those standards apply to private companies. We have irrevocably elected not to avail ourselves of this exemption from new or revised accounting standards and, therefore, we will be subject to the same new or revised accounting standards as other public companies that are not “emerging growth companies.”
After we are no longer an “emerging growth company,” we expect to incur additional management time and cost to comply with the more stringent reporting requirements applicable to companies that are deemed accelerated filers or large accelerated filers, including complying with the auditor attestation requirements of Section 404 of the Sarbanes-Oxley Act.
We cannot predict or estimate the amount of additional costs we may incur as a result of becoming a public company or the timing of such costs.
If we are unable to design, implement and maintain effective internal controls in accordance with Section 404 of the Sarbanes-Oxley Act, it could have a material adverse effect on our business and stock price. We have identified material weaknesses in our internal control over financial reporting.
As a public company, we will have significant requirements for enhanced financial reporting and internal controls. The process of designing and implementing effective internal controls is a continuous effort that requires us to anticipate and react to changes in our business and the economic and regulatory environments and to expend significant resources to maintain a system of internal controls that is adequate to satisfy our reporting obligations as a public company. If we are unable to establish or maintain appropriate internal financial reporting controls and procedures, it could cause us to fail to meet our reporting obligations on a timely basis, result in material misstatements in our consolidated financial statements and harm our operating results. In addition, we will be required, pursuant to Section 404 of the Sarbanes-Oxley Act, to furnish a report by management on, among other things, the effectiveness of our internal control over financial reporting for the first fiscal year beginning after the effective date of this offering. This assessment will need to include disclosure of any material weaknesses identified by our management in our internal control over financial reporting. Testing and maintaining internal controls may divert our management’s attention from other matters that are important to our business. We may not be able to conclude on an ongoing basis that we have effective internal control over financial reporting in accordance with Section 404 of the Sarbanes-Oxley Act.
In connection with the audit of our consolidated financial statements as of January 30, 2016 and for the period from May 8, 2015 through January 30, 2016, we identified material weaknesses in our internal control over financial reporting. A material weakness is a deficiency, or combination of deficiencies, in internal control over financial reporting such that there is a reasonable possibility that a material misstatement of our financial statements will not be prevented or detected on a timely basis.
We determined that we did not maintain a sufficient complement of personnel with the level of accounting expertise and supervisory review structure commensurate with the complexity of our financial accounting and financial reporting requirements. We also did not design and maintain controls related to the accounting for business combinations. Specifically, we did not design controls to review certain purchase accounting adjustments such as the amortization of customer list intangibles. These control deficiencies resulted in audit adjustments to our consolidated financial statements and could result in material misstatements to our annual or interim consolidated financial statements that would not be prevented or detected. Accordingly, our
33
Table of Contents
management has determined that these control deficiencies constitute material weaknesses. We are in the process of implementing measures designed to improve our internal control over financial reporting and remediate the control deficiencies that led to our material weaknesses, including that we have hired additional finance personnel and are establishing formalized accounting policies and procedures and internal controls.
We cannot assure you that the measures we have taken to date, together with any measures we may take in the future, will be sufficient to remediate the control deficiencies that led to our material weaknesses in our internal control over financial reporting or to avoid potential future material weaknesses. If we are unable to conclude that we have effective internal control over financial reporting or if our efforts are not successful to remediate the control deficiencies that led to our material weaknesses in our internal control over financial reporting or other material weaknesses or control deficiencies occur in the future, the accuracy and timing of our financial reporting may be adversely affected, we may be unable to maintain compliance with securities law requirements regarding timely filing of periodic reports in addition to applicable stock exchange listing requirements and investors may lose confidence in our financial reporting, which could have a material adverse effect on the trading price of our stock.
We are a “controlled company” within the meaning of the NYSE rules and, as a result, qualify for and intend to rely on exemptions from certain corporate governance requirements.
Following this offering, TowerBrook will continue to control a majority of the voting power of our outstanding voting stock, and as a result we will be a controlled company within the meaning of the corporate governance standards. Under the NYSE rules, a company of which more than 50% of the voting power is held by another person or group of persons acting together is a controlled company and may elect not to comply with certain corporate governance requirements, including the requirements that:
| • | a majority of the board of directors consist of independent directors; |
| • | the nominating and corporate governance committee be composed entirely of independent directors with a written charter addressing the committee’s purpose and responsibilities; |
| • | the compensation committee be composed entirely of independent directors with a written charter addressing the committee’s purpose and responsibilities; and |
| • | there be an annual performance evaluation of the nominating and corporate governance and compensation committees. |
These requirements will not apply to us as long as we remain a controlled company. Accordingly, you may not have the same protections afforded to stockholders of companies that are subject to all of the corporate governance requirements of the NYSE.
We continue to be controlled by TowerBrook, and TowerBrook’s interests may conflict with our interests and the interests of other stockholders.
Following this offering, TowerBrook will own 60% of our common equity (or 57% if the underwriters exercise their option to purchase additional shares in full). In addition, representatives of TowerBrook comprise a majority of our directors. As a result, TowerBrook will have effective control over the outcome of votes on all matters requiring approval by our stockholders, including entering into significant corporate transactions such as mergers, tender offers and the sale of all or substantially all of our assets and issuance of additional debt or equity. In addition, as long as TowerBrook beneficially owns at least 50% of our common stock, the Stockholders Agreement will provide TowerBrook with veto rights with respect to certain material matters. The interests of TowerBrook and its affiliates could conflict with or differ from our interests or the interests of our other stockholders. For example, the concentration of ownership held by TowerBrook could delay, defer or prevent a change of control of our company or impede a merger, takeover or other business combination which
34
Table of Contents
may otherwise be favorable for us. Additionally, TowerBrook is in the business of making investments in companies and may, from time to time, acquire and hold interests in businesses that compete, directly or indirectly with us. TowerBrook may also pursue acquisition opportunities that may be complementary to our business, and as a result, those acquisition opportunities may not be available to us. So long as TowerBrook continues to directly or indirectly own a significant amount of our equity, even if such amount is less than 50%, TowerBrook will continue to be able to substantially influence or effectively control our ability to enter into corporate transactions.
Our certificate of incorporation will contain a provision renouncing our interest and expectancy in certain corporate opportunities.
Our certificate of incorporation will provide for the allocation of certain corporate opportunities between us and TowerBrook. Under these provisions, neither TowerBrook, its portfolio companies, funds or other affiliates, nor any of their officers, directors, agents, stockholders, members or partners will have any duty to refrain from engaging, directly or indirectly, in the same business activities, similar business activities or lines of business in which we operate. For instance, a director of our company who also serves as a director, officer, partner or employee of TowerBrook or any of its portfolio companies, funds or other affiliates may pursue certain acquisitions or other opportunities that may be complementary to our business and, as a result, such acquisition or other opportunities may not be available to us. These potential conflicts of interest could have a material adverse effect on our business, financial condition, results of operations or prospects if attractive corporate opportunities are allocated by TowerBrook to itself or its portfolio companies, funds or other affiliates instead of to us. The terms of our certificate of incorporation are more fully described in “Description of Capital Stock.”
Provisions in our organizational documents and Delaware law may discourage our acquisition by a third party.
Our certificate of incorporation will authorize our board of directors to issue preferred stock without stockholder approval. If the board of directors elects to issue preferred stock, it could be more difficult for a third party to acquire us. In addition, some provisions of our certificate of incorporation and bylaws could make it more difficult for a third party to acquire control of us, even if the change of control would be beneficial to our stockholders.
Section 203 of the General Corporation Law of the State of Delaware (the “DGCL”) affects the ability of an “interested stockholder” to engage in certain business combinations, for a period of three years following the time that the stockholder becomes an “interested stockholder.” We will elect in our certificate of incorporation not to be subject to Section 203 of the DGCL. Nevertheless, our certificate of incorporation will contain provisions that have the same effect as Section 203 of the DGCL, except that it will provide that affiliates of TowerBrook and their transferees will not be deemed to be “interested stockholders,” regardless of the percentage of our voting stock owned by them, and will therefore not be subject to such restrictions. These charter provisions may limit the ability of third parties to acquire control of our company. See “Description of Capital Stock—Certain Anti-Takeover, Limited Liability and Indemnification Provisions.”
We are a holding company and rely on dividends, distributions and other payments, advances and transfers of funds from our subsidiaries to meet our obligations.
We are a holding company that does not conduct any business operations of our own. As a result, we are largely dependent upon cash dividends and distributions and other transfers from our subsidiaries to meet our obligations. The agreements governing the indebtedness of our subsidiaries impose restrictions on our subsidiaries’ ability to pay dividends or other distributions to us. See “Management’s Discussion and Analysis of Financial Condition and Results of Operations—Liquidity and Capital Resources—Credit Facilities.” The deterioration of the earnings from, or other available assets of, our subsidiaries for any reason could also limit or impair their ability to pay dividends or other distributions to us.
35
Table of Contents
Investors in this offering will experience immediate and substantial dilution.
Based on our pro forma net tangible book value per share as of October 29, 2016 and an assumed initial public offering price of $15.00 per share (the midpoint of the range set forth on the cover of this prospectus), purchasers of our common stock in this offering will experience an immediate and substantial dilution of $20.61 per share, representing the difference between our pro forma net tangible book value per share and the assumed initial public offering price. This dilution is due in large part to earlier investors having paid substantially less than the initial public offering price when they purchased their shares. See “Dilution.”
Future sales of our common stock in the public market, or the perception in the public market that such sales may occur, could reduce our stock price.
After the completion of this offering, we will have 43,747,944 outstanding shares of common stock. This number includes 11,666,667 shares that the selling stockholder is selling in this offering, which may be resold immediately in the public market. The number of outstanding shares of common stock also includes 32,081,277 shares, including shares controlled by TowerBrook, that are “restricted securities,” as defined under Rule 144 under the Securities Act of 1933, as amended (the “Securities Act”), and eligible for sale in the public market subject to the requirements of Rule 144. We, each of our officers and directors, TowerBrook and substantially all of our existing stockholders have agreed that (subject to certain exceptions), for a period of 180 days after the date of this prospectus, we and they will not, without the prior written consent of Merrill Lynch, Pierce, Fenner & Smith Incorporated, Morgan Stanley & Co. LLC and Jefferies LLC, dispose of any shares or any securities convertible into or exchangeable for our common stock, see “Underwriting.” Following the expiration of the applicable lock-up period, all of the issued and outstanding shares of our common stock will be eligible for future sale, subject to the applicable volume, manner of sale, holding periods and other limitations of Rule 144. Sales of significant amounts of stock in the public market could adversely affect prevailing market prices of our common stock. See “Shares Eligible for Future Sale” for a discussion of the shares of common stock that may be sold into the public market in the future.
There can be no assurances that a viable public market for our common stock will develop.
Prior to this offering, our common stock was not traded on any market. An active, liquid and orderly trading market for our common stock may not develop or be maintained after this offering. Active, liquid and orderly trading markets usually result in less price volatility and more efficiency in carrying out investors’ purchase and sale orders. We cannot predict the extent to which investor interest in our common stock will lead to the development of an active trading market on the NYSE or otherwise or how liquid that market might become. If an active public market for our common stock does not develop, or is not sustained, it may be difficult for you to sell your shares at a price that is attractive to you or at all.
The initial public offering price of our common stock may not be indicative of the market price of our common stock after this offering.
The initial public offering price was determined by negotiations between us and representatives of the underwriters, based on numerous factors which we discuss in “Underwriting” and may not be indicative of the market price of our common stock after this offering. If you purchase our common stock, you may not be able to resell those shares at or above the initial public offering price.
36
Table of Contents
Our stock price may be volatile.
The market price of our common stock could vary significantly as a result of a number of factors, some of which are beyond our control. In the event of a drop in the market price of our common stock, you could lose a substantial part or all of your investment in our common stock. The following factors could affect our stock price:
| • | our operating and financial performance; |
| • | quarterly variations in the rate of growth (if any) of our financial indicators, such as net income per share, net income and revenues; |
| • | the public reaction to our press releases, our other public announcements and our filings with the SEC; |
| • | strategic actions by our competitors; |
| • | changes in operating performance and the stock market valuations of other companies; |
| • | announcements related to litigation; |
| • | our failure to meet revenue or earnings estimates made by research analysts or other investors; |
| • | changes in revenue or earnings estimates, or changes in recommendations or withdrawal of research coverage, by equity research analysts; |
| • | speculation in the press or investment community; |
| • | sales of our common stock by us or our stockholders, or the perception that such sales may occur; |
| • | changes in accounting principles, policies, guidance, interpretations or standards; |
| • | additions or departures of key management personnel; |
| • | actions by our stockholders; |
| • | general market conditions; |
| • | domestic and international economic, legal and regulatory factors unrelated to our performance; and |
| • | the realization of any risks described under this “Risk Factors” section, or other risks that may materialize in the future. |
The stock markets in general have experienced extreme volatility that has often been unrelated to the operating performance of particular companies. These broad market fluctuations may adversely affect the trading price of our common stock. Securities class action litigation has often been instituted against companies following periods of volatility in the overall market and in the market price of a company’s securities. Such litigation, if instituted against us, could result in very substantial costs, divert our management’s attention and resources and harm our business, financial condition and results of operations.
If securities or industry analysts do not publish research or reports about our business or publish negative reports, our stock price could decline.
The trading market for our common stock will be influenced by the research and reports that industry or securities analysts publish about us or our business. If one or more of these analysts cease coverage of our
37
Table of Contents
company or fail to publish reports on us regularly, we could lose visibility in the financial markets, which in turn could cause our stock price or trading volume to decline. Moreover, if one or more of the analysts who cover our company downgrades our common stock or if our operating results do not meet their expectations, our stock price could decline.
The issuance by us of additional shares of common stock or convertible securities may dilute your ownership of us and could adversely affect our stock price.
In connection with this offering, we intend to file a registration statement with the SEC on Form S-8 providing for the registration of 2,237,303 shares of our common stock issued or reserved for issuance under our long-term incentive plan. Subject to the satisfaction of vesting conditions and the expiration of lock-up agreements, shares registered under the registration statement on Form S-8 will be available for resale immediately in the public market without restriction. From time to time in the future, we may also issue additional shares of our common stock or securities convertible into common stock pursuant to a variety of transactions, including acquisitions. The issuance by us of additional shares of our common stock or securities convertible into our common stock would dilute your ownership of us and the sale of a significant amount of such shares in the public market could adversely affect prevailing market prices of our common stock.
We may issue preferred stock whose terms could adversely affect the voting power or value of our common stock.
Our certificate of incorporation will authorize us to issue, without the approval of our stockholders, one or more classes or series of preferred stock having such designations, preferences, limitations and relative rights, including preferences over our common stock respecting dividends and distributions, as our board of directors may determine. The terms of one or more classes or series of preferred stock could adversely impact the voting power or value of our common stock. For example, we might grant holders of preferred stock the right to elect some number of our directors in all events or on the happening of specified events or the right to veto specified transactions. Similarly, the repurchase or redemption rights or liquidation preferences we might assign to holders of preferred stock could affect the residual value of the common stock.
Our designation of the Delaware Court of Chancery as the exclusive forum for certain types of stockholder legal proceedings could limit our stockholders’ ability to obtain a more favorable forum.
Our certificate of incorporation will provide that unless we consent in writing to the selection of an alternative forum, the Court of Chancery of the State of Delaware will, to the fullest extent permitted by applicable law, be the sole and exclusive forum for (i) any derivative action or proceeding brought on our behalf, (ii) any action asserting a claim of breach of a fiduciary duty owed by any of our directors, officers, employees or agents to us or our stockholders, (iii) any action asserting a claim arising pursuant to any provision of the DGCL, our certificate of incorporation or our bylaws or (iv) any action asserting a claim against us that is governed by the internal affairs doctrine, in each such case subject to such Court of Chancery having personal jurisdiction over the indispensable parties named as defendants therein. Any person or entity purchasing or otherwise acquiring any interest in shares of our capital stock will be deemed to have notice of, and consented to, the provisions of our certificate of incorporation described in the preceding sentence. This choice of forum provision may limit a stockholder’s ability to bring a claim in a judicial forum that it finds favorable for disputes with us or our directors, officers, employees or agents, which may discourage such lawsuits against us and such persons. See “Description of Capital Stock—Forum Selection.” Alternatively, if a court were to find these provisions of our certificate of incorporation inapplicable to, or unenforceable in respect of, one or more of the specified types of actions or proceedings, we may incur additional costs that we do not currently anticipate associated with resolving such matters in other jurisdictions, which could adversely affect our business, financial condition and results of operations.
38
Table of Contents
CAUTIONARY NOTE REGARDING FORWARD-LOOKING STATEMENTS
This prospectus contains forward-looking statements, which involve risks and uncertainties. These forward-looking statements are generally identified by the use of forward-looking terminology, including the terms “anticipate,” “believe,” “could,” “estimate,” “expect,” “intend,” “may,” “plan,” “potential,” “predict,” “project,” “should,” “target,” “will,” “would” and, in each case, their negative or other various or comparable terminology. All statements other than statements of historical facts contained in this prospectus, including statements regarding our strategy, future operations, future financial position, future revenue, projected costs, prospects, plans, objectives of management and expected market growth are forward-looking statements. The forward-looking statements are contained principally in the sections entitled “Prospectus Summary,” “Risk Factors,” “Use of Proceeds,” “Management’s Discussion and Analysis of Financial Condition and Results of Operations” and “Business” and include, among other things, statements relating to:
| • | our strategy, outlook and growth prospects; |
| • | our operational and financial targets and dividend policy; |
| • | our planned expansion of the store base and the implementation of the new design in our existing stores; |
| • | general economic trends and trends in the industry and markets; and |
| • | the competitive environment in which we operate. |
These statements involve known and unknown risks, uncertainties and other important factors that may cause our actual results, performance or achievements to be materially different from any future results, performance or achievements expressed or implied by the forward-looking statements. Important factors that could cause our results to vary from expectations include, but are not limited to:
| • | our ability to successfully expand and increase sales; |
| • | our ability to maintain and enhance a strong brand image; |
| • | our ability to successfully optimize our omni-channel operations and maintain a relevant and reliable omni-channel experience; |
| • | our ability to generate adequate cash from our existing business to support our growth; |
| • | our ability to identify and respond to new and changing customer preferences; |
| • | our ability to compete effectively in an environment of intense competition; |
| • | our ability to contain the increase in the cost of shipping our merchandise, mailing catalogs, paper and printing; |
| • | our ability to acquire new customers in a cost-effective manner; |
| • | the success of the locations in which our stores are located and our ability to open and operate new retail stores on a profitable basis; |
| • | our ability to adapt to changes in consumer spending and general economic conditions; |
| • | natural disasters, unusually adverse weather conditions, boycotts and unanticipated events; |
| • | our dependence on third-party vendors to provide us with sufficient quantities of merchandise at acceptable prices; |
| • | increases in costs of raw materials, distribution and sourcing costs and in the costs of labor and employment; |
39
Table of Contents
| • | the susceptibility of the price and availability of our merchandise to international trade conditions; |
| • | failure of our suppliers and their manufacturing sources to use acceptable labor or other practices; |
| • | our dependence upon key executive management or our inability to hire or retain the talent required for our business; |
| • | failure of our information technology systems to support our current and growing business; |
| • | disruptions in our supply chain and distribution and customer contact center; |
| • | our ability to protect our trademarks or other intellectual property rights; |
| • | infringement on the intellectual property of third parties; |
| • | acts of war, terrorism or civil unrest; |
| • | the impact of governmental laws and regulations and the outcomes of legal proceedings; |
| • | our ability to secure the personal information of our customers and employees and comply with applicable security standards; |
| • | impairment charges for goodwill, indefinite-lived intangible assets or other long-lived assets; |
| • | our failure to maintain adequate internal controls over our financial and management systems; |
| • | increased costs as a result of being a public company; and |
| • | other risks, uncertainties and factors set forth in this prospectus, including those set forth under “Risk Factors.” |
These forward-looking statements reflect our views with respect to future events as of the date of this prospectus and are based on assumptions and subject to risks and uncertainties. Given these uncertainties, you should not place undue reliance on these forward-looking statements. These forward-looking statements represent our estimates and assumptions only as of the date of this prospectus and, except as required by law, we undertake no obligation to update or review publicly any forward-looking statements, whether as a result of new information, future events or otherwise after the date of this prospectus. We anticipate that subsequent events and developments will cause our views to change. You should read this prospectus and the documents filed as exhibits to the registration statement, of which this prospectus is a part, completely and with the understanding that our actual future results may be materially different from what we expect. Our forward-looking statements do not reflect the potential impact of any future acquisitions, merger, dispositions, joint ventures or investments we may undertake. We qualify all of our forward-looking statements by these cautionary statements.
40
Table of Contents
The selling stockholder is selling all of the shares of our common stock being sold in this offering, including any shares that may be sold in connection with the exercise of the underwriters’ option to purchase additional shares. See “Principal and Selling Stockholders.” Accordingly, we will not receive any proceeds from the sale of shares of our common stock in this offering. We will bear all costs, fees and expenses in connection with this offering, which are estimated to be $6.1 million.
We currently do not plan to declare cash dividends on shares of our common stock in the foreseeable future. We expect that we will retain all of our future earnings for use in the operation and expansion of our business. Subject to the foregoing, the payment of cash dividends in the future, if any, will be at the discretion of our board of directors and will depend upon such factors as earnings levels, capital requirements, restrictions imposed by applicable law, our overall financial condition, restrictions in our debt agreements, including our Term Loan and ABL Facility, and any other factors deemed relevant by our board of directors. As a holding company, our ability to pay dividends depends on our receipt of cash dividends from our operating subsidiaries, which may further restrict our ability to pay dividends as a result of restrictions on their ability to pay dividends to us under our Term Loan, our ABL Facility and under future indebtedness that we or they may incur. See “Risk Factors—Risks Related to this Offering and Ownership of Our Common Stock” and “Management’s Discussion and Analysis of Financial Condition and Results of Operations—Liquidity and Capital Resources—Credit Facilities.”
41
Table of Contents
On February 24, 2017, we converted from a Delaware limited liability company named Jill Intermediate LLC into a Delaware corporation and changed our name to J.Jill, Inc. In order to consummate the corporate conversion, a certificate of conversion was filed with the Secretary of State of the State of Delaware. In conjunction with the conversion, all of our outstanding equity interests were converted into 43,747,944 shares of common stock. Jill Intermediate LLC had one class of equity interests, all of which were held by JJill Holdings, our former direct parent company, and JJill Topco Holdings, the direct parent company of JJill Holdings. In conjunction with our conversion into a Delaware corporation, JJill Holdings and JJill Topco Holdings each received shares of our common stock in proportion to the percentage of Jill Intermediate LLC’s equity interests held by them prior to the conversion.
In connection with the conversion, J.Jill, Inc. will continue to hold all assets of Jill Intermediate LLC and will assume all of its liabilities and obligations. We are a holding company, and Jill Acquisition LLC, our wholly-owned subsidiary, will remain the operating company for our business assets. J.Jill, Inc. is governed by a certificate of incorporation filed with the Delaware Secretary of State and bylaws, the material portions of which are described in this prospectus under “Description of Capital Stock.”
Following our conversion into a Delaware corporation, JJill Holdings, our former direct parent company, merged with and into us, and we were the surviving entity to such merger. Prior to the completion of this offering, all of the shares of our common stock are held by JJill Topco Holdings, our current direct parent. Following the completion of this offering, JJill Topco Holdings plans to distribute all of the shares of our common stock held by it, other than the shares it sells in this offering, to its partners in accordance with the terms of its limited partnership agreement.
The diagram below depicts our organizational structure immediately following the consummation of this offering and the transactions described above:
42
Table of Contents
The following table sets forth our cash and our capitalization as of October 29, 2016, on:
| • | an actual basis; and |
| • | a pro forma basis to give effect to the completion of our corporate conversion from a Delaware limited liability company to a Delaware corporation, the merger of JJill Holdings with and into us and the conversion of all of our outstanding common units into 43,747,944 shares of common stock, each of which occurred on February 24, 2017, as described under “Corporate Conversion.” |
| As of October 29, 2016 |
||||||||
| Actual | Pro Forma | |||||||
| (in thousands, except share and per share data) |
|
|
||||||
| Cash |
$ | 4,955 | $ | 4,955 | ||||
|
|
|
|
|
|||||
| Debt: |
||||||||
| Term Loan(1) |
$ | 274,356 | 274,356 | |||||
| Current portion of long-term debt |
2,900 | 2,900 | ||||||
|
|
|
|
|
|||||
| Total debt, net of discount and debt issuance costs |
277,256 | 277,256 | ||||||
| Equity: |
||||||||
| Preferred stock, $0.01 par value, no shares authorized, issued and outstanding (historical); 50,000,000 shares authorized, no shares issued and outstanding (pro forma) |
— | — | ||||||
| Common stock, par value $0.01 per share; no shares authorized, issued and outstanding (historical); 250,000,000 shares authorized, 43,747,944 issued and outstanding (pro forma) |
— | 437 | ||||||
| Common units, zero par value, 1,000,000 units authorized, issued and outstanding (historical); no units authorized, issued and outstanding (pro forma) |
— | — | ||||||
| Contributed capital |
107,712 | — | ||||||
| Additional paid-in capital |
— | 115,835 | ||||||
| Accumulated earnings |
11,042 | 2,482 | ||||||
|
|
|
|
|
|||||
| Total equity |
118,754 | 118,754 | ||||||
|
|
|
|
|
|||||
| Total capitalization |
$ | 396,010 | $ | 396,010 | ||||
|
|
|
|
|
|||||
| (1) | On January 18, 2017, we made a voluntary prepayment of $10.1 million, including accrued interest, on our Term Loan. This prepayment is not reflected in the table above. |
You should read this table together with the information included elsewhere in this prospectus, including “Prospectus Summary—Summary Consolidated Financial Data,” “Selected Consolidated Financial Data,” “Management’s Discussion and Analysis of Financial Condition and Results of Operations” and our consolidated financial statements and related notes thereto.
The foregoing table is based on 43,747,944 shares of our common stock outstanding as of October 29, 2016, and except as otherwise indicated, reflects and assumes the following:
| • | assumes an initial public offering price of $15.00 per share of common stock, the midpoint of the price range on the cover of this prospectus; |
| • | reflects the completion of our corporate conversion from a Delaware limited liability company to a Delaware corporation and the merger of JJill Holdings with and into us, as described under “Corporate Conversion”; |
| • | reflects the conversion of all of our outstanding equity interests into 43,747,944 shares of our common stock, which was effectuated on February 24, 2017; |
43
Table of Contents
| • | assumes no exercise of the underwriters’ option to purchase 1,750,000 additional shares of common stock in this offering; and |
| • | does not reflect an additional 2,237,303 shares of our common stock reserved for future grant under our Equity Incentive Plan (as defined herein), which we expect to adopt in connection with this offering. |
44
Table of Contents
Purchasers of the common stock in this offering will experience immediate and substantial dilution to the extent of the difference between the initial public offering price per share of our common stock and the net tangible book value per share of our common stock as of October 29, 2016.
Our historical net tangible book value (deficit) as of October 29, 2016 was $(245.4) million, or $(245.42) per unit. Our historical net tangible book value (deficit) represents the amount of our total tangible assets (total assets less total intangible assets) less total liabilities. Historical net tangible book value (deficit) per share represents historical net tangible book value (deficit) divided by the number of shares of common stock issued and outstanding as of October 29, 2016.
Our pro forma net tangible book value (deficit) as of October 29, 2016 was $(245.4) million, or $(5.61) per share of our common stock. Pro forma net tangible book value (deficit) represents the amount of our total tangible assets (total assets less total intangible assets) less total liabilities, after giving effect to the completion of our corporate conversion from a Delaware limited liability company to a Delaware corporation and the merger of JJill Holdings with and into us, as described under “Corporate Conversion.” Pro forma net tangible book value (deficit) per share represents our pro forma net tangible book value (deficit) divided by the total number of shares outstanding as of October 29, 2016, after giving effect to the conversion of all of our outstanding common units into 43,747,944 shares of common stock.
Dilution per share to new investors is determined by subtracting the net tangible book value per share from the initial public offering price per share paid by new investors. Because all of the shares of our common stock to be sold in this offering, including those subject to the underwriters’ option to purchase additional shares, will be sold by the selling shareholder, there will be no increase in the number of shares of our common stock outstanding as a result of this offering. The following table illustrates the per share dilution to new investors purchasing shares in this offering, based on an assumed initial public offering price of $15.00 per share (which is the midpoint of the range set forth on the cover page of this prospectus):
| Assumed initial public offering price per share |
$ | 15.00 | ||||||
| Historical net tangible book value per unit as of October 29, 2016 |
(245.42 | ) | ||||||
| Increase per share attributable to the pro forma adjustments described above |
239.81 | |||||||
|
|
|
|||||||
| Pro forma net tangible book value per share as of October 29, 2016 |
(5.61 | ) | ||||||
|
|
|
|||||||
| Dilution in net tangible book value per share |
$ | 20.61 | ||||||
|
|
|
The following table summarizes, as of October 29, 2016, the total number of shares of common stock owned by existing stockholders and to be owned by new investors, the total consideration paid, and the average price per share paid by our existing stockholders and to be paid by new investors in this offering at the assumed initial public offering price of $15.00 per share, calculated before deduction of estimated underwriting discounts and commissions.
| Shares Purchased |
Total Consideration |
Average |
||||||||||||||||||
| Number |
Percent |
Amount |
Percent |
|||||||||||||||||
| Existing stockholders |
32,081,277 | 73.33 | % | $ | 170,657,157 | 49.37 | % | $ | 5.32 | |||||||||||
| Investors in the offering |
11,666,667 | 26.67 | % | 175,000,005 | 50.63 | % | 15.00 | |||||||||||||
|
|
|
|
|
|
|
|
|
|
|
|||||||||||
| Total |
43,747,944 | 100 | % | $ | 345,657,162 | 100 | % | |||||||||||||
|
|
|
|
|
|
|
|
|
|||||||||||||
45
Table of Contents
A $1.00 increase (decrease) in the assumed initial public offering price would increase (decrease) total consideration paid by new investors, total consideration paid by all shareholders and average price per share paid by new investors by $11.7 million, $11.7 million and $1.00 per share, respectively. An increase (decrease) of 1.0 million in the number of shares offered by the selling shareholder, assuming no changes in the assumed initial public offering price per share would increase (decrease) total consideration paid by new investors and total consideration paid by all shareholders by $15.0 million and $15.0 million, respectively.
If the underwriters were to fully exercise their option to purchase additional shares of our common stock, the percentage of common stock held by existing investors would be 69%, and the percentage of shares of common stock held by new investors would be 31%.
The foregoing tables and calculations are based on 43,747,944 shares of our common stock outstanding as of October 29, 2016, and except as otherwise indicated, reflects and assumes the following:
| • | assumes an initial public offering price of $15.00 per share of common stock, the midpoint of the price range on the cover of this prospectus; |
| • | reflects the completion of our corporate conversion from a Delaware limited liability company to a Delaware corporation and the merger of JJill Holdings with and into us, as described under “Corporate Conversion”; |
| • | reflects the conversion of all of our outstanding equity interests into 43,747,944 shares of our common stock, which was effectuated on February 24, 2017; |
| • | assumes no exercise of the underwriters’ option to purchase 1,750,000 additional shares of common stock in this offering; and |
| • | does not reflect an additional 2,237,303 shares of our common stock reserved for future grant under our Equity Incentive Plan (as defined herein) which we expect to adopt in connection with this offering. |
We may choose to raise additional capital due to market conditions or strategic considerations even if we believe we have sufficient funds for our current or future operating plans. To the extent that additional capital is raised through the sale of equity or convertible debt securities, the issuance of such securities could result in further dilution to our stockholders.
46
Table of Contents
SELECTED HISTORICAL CONSOLIDATED FINANCIAL AND OTHER DATA
The following tables present our selected consolidated financial and other data as of and for the periods indicated. The selected consolidated statements of operations data for the fiscal years ended February 1, 2014 and January 31, 2015, the periods from February 1, 2015 to May 7, 2015 (Predecessor) and from May 8, 2015 to January 30, 2016 (Successor), and the selected consolidated balance sheet data as of January 30, 2016 and January 31, 2015 are derived from our audited consolidated financial statements included elsewhere in this prospectus. We have derived the selected consolidated balance sheet data as of February 2, 2013 and February 1, 2014 and the consolidated statement of operations data for the fiscal year ended February 2, 2013 from our audited consolidated financial statements, which are not included in this prospectus. Our historical audited results are not necessarily indicative of the results that should be expected in any future period.
The selected consolidated statements of operations data for the period from May 8, 2015 to October 31, 2015 (Successor) and the thirty-nine weeks ended October 29, 2016 (Successor) and the selected consolidated balance sheet data as of October 29, 2016 are derived from our unaudited consolidated financial statements included elsewhere in this prospectus. We have prepared our unaudited consolidated financial statements on the same basis as our audited consolidated financial statements and have included all adjustments, consisting only of normal recurring adjustments that, in our opinion, are necessary to present fairly the financial information set forth in those statements. The results for any interim period are not necessarily indicative of the results that may be expected for the full year and our historical unaudited results are not necessarily indicative of the results that should be expected in any future period.
The selected historical financial data presented below does not purport to project our financial position or results of operations for any future date or period and should be read together with “Management’s Discussion and Analysis of Financial Condition and Results of Operations,” and our consolidated financial statements and related notes thereto included elsewhere in this prospectus.
| Interim Periods | ||||||||||||||||||||||||||||||||||||||||
| Predecessor | Successor |
Predecessor |
Successor | |||||||||||||||||||||||||||||||||||||
| (in thousands, except |
For the |
For the |
For the |
For
the |
For the May 8, |
For
the |
For the (unaudited) |
For
the (unaudited) |
||||||||||||||||||||||||||||||||
| Statements of Operations Data: |
||||||||||||||||||||||||||||||||||||||||
| Net sales |
$ | 431,881 | $ | 456,026 | $ | 483,400 | $ | 141,921 | $ | 420,094 | $ | 141,921 | $ | 274,741 | $ | 472,139 | ||||||||||||||||||||||||
| Costs of goods sold |
155,363 | 161,261 | 164,792 | 44,232 | 155,091 | 44,232 | 101,185 | 149,673 | ||||||||||||||||||||||||||||||||
|
|
|
|
|
|
|
|
|
|
|
|
|
|
|
|
|
|||||||||||||||||||||||||
| Gross profit |
276,518 | 294,765 | 318,608 | 97,689 | 265,003 | 97,689 | 173,556 | 322,466 | ||||||||||||||||||||||||||||||||
| Selling, general and administrative expenses |
263,519 | 267,319 | 279,557 | 80,151 | 246,482 | 80,151 | 161,236 | 273,882 | ||||||||||||||||||||||||||||||||
| Acquisition-related expenses |
— | — | — | 13,341 | — | 13,341 | — | — | ||||||||||||||||||||||||||||||||
|
|
|
|
|
|
|
|
|
|
|
|
|
|
|
|
|
|||||||||||||||||||||||||
| Operating income |
12,999 | 27,446 | 39,051 | 4,197 | 18,521 | 4,197 | 12,320 | 48,584 | ||||||||||||||||||||||||||||||||
| Interest expense |
19,183 | 19,064 | 17,895 | 4,599 | 11,893 | 4,599 | 7,922 | 13,630 | ||||||||||||||||||||||||||||||||
|
|
|
|
|
|
|
|
|
|
|
|
|
|
|
|
|
|||||||||||||||||||||||||
| Income (loss) before provision for income taxes |
(6,184 | ) | 8,382 | 21,156 | (402 | ) | 6,628 | (402 | ) | 4,398 | 34,954 | |||||||||||||||||||||||||||||
| Provision (benefit) for income taxes |
(2,583 | ) | 3,884 | 10,860 | 1,499 | 2,322 | 1,499 | 1,541 | 12,924 | |||||||||||||||||||||||||||||||
|
|
|
|
|
|
|
|
|
|
|
|
|
|
|
|
|
|||||||||||||||||||||||||
| Net income (loss) |
$ | (3,601 | ) | $ | 4,498 | $ | 10,296 | $ | (1,901 | ) | $ | 4,306 | $ | (1,901 | ) | $ | 2,857 | $ | 22,030 | |||||||||||||||||||||
|
|
|
|
|
|
|
|
|
|
|
|
|
|
|
|
|
|||||||||||||||||||||||||
| Net income (loss) per share attributable to common stockholders(1): |
||||||||||||||||||||||||||||||||||||||||
| Basic and diluted |
$ | (0.08 | ) | $ | 0.10 | $ | 0.24 | $ | (0.04 | ) | $ | 0.10 | $ | (0.04 | ) | $ | 0.07 | $ | 0.50 | |||||||||||||||||||||
| Weighted average number of common shares outstanding(1): |
||||||||||||||||||||||||||||||||||||||||
| Basic and diluted |
43,747,944 | 43,747,944 | 43,747,944 | 43,747,944 | 43,747,944 | 43,747,944 | 43,747,944 | 43,747,944 | ||||||||||||||||||||||||||||||||
47
Table of Contents
| Interim Periods | ||||||||||||||||||||||||||||||||||||||||
| Predecessor | Successor |
Predecessor |
Successor | |||||||||||||||||||||||||||||||||||||
| (in thousands, except |
For the |
For the |
For the |
For
the |
For the May 8, |
For
the |
For the (unaudited) |
For
the (unaudited) |
||||||||||||||||||||||||||||||||
| Other Financial Data: |
||||||||||||||||||||||||||||||||||||||||
| Adjusted EBITDA(2) |
$ | 43,913 | $ | 54,241 | $ | 65,720 | $ | 23,672 | $ | 59,699 | $ | 23,672 | $ | 44,277 | $ | 83,539 | ||||||||||||||||||||||||
| Adjusted EBITDA margin(3) |
10.2 | % | 11.9 | % | 13.6 | % | 16.7 | % | 14.2 | % | 16.7 | % | 16.1 | % | 17.7 | % | ||||||||||||||||||||||||
| (in thousands) |
Predecessor | Successor | ||||||||||||||||||||||
| February 2, |
February 1, |
January 31, |
January 30, |
October 29, 2016 |
||||||||||||||||||||
| Balance Sheet data (at end of period): |
||||||||||||||||||||||||
| Cash |
$ | 673 | $ | 518 | $ | 604 | $ | 27,505 | $ | 4,955 | ||||||||||||||
| Net operating assets and liabilities(4) |
2,338 | (7,472 | ) | (8,055 | ) | 3,477 | 19,749 | |||||||||||||||||
| Total assets |
254,441 | 259,735 | 278,232 | 582,032 | 578,468 | |||||||||||||||||||
| Current and non-current portions of long-term debt, net of discount and debt issuance costs |
106,318 | 94,153 | 82,369 | 239,978 | 277,256 | |||||||||||||||||||
| Preferred capital |
72,824 | 72,824 | 72,824 | — | — | |||||||||||||||||||
| Total equity |
(22,986 | ) | (16,765 | ) | (1,317 | ) | 166,571 | 118,754 | ||||||||||||||||
| (1) | Basic net income (loss) per share attributable to common stockholders is computed by dividing net income (loss) by basic weighted average common shares outstanding. Diluted net income (loss) per share attributable to common stockholders is computed by dividing net income (loss) by the diluted weighted average common shares outstanding, which has been adjusted to include any potentially dilutive securities. There are no potentially dilutive securities outstanding in any of the historical period presented above. As such, basic and diluted net income (loss) per share attributable to common stockholders is the same in each period. |
| (2) | Adjusted EBITDA represents net income (loss) plus interest expense, provision (benefit) for income taxes, depreciation and amortization, the amortization of the step-up to fair value of merchandise inventory resulting from the application of a purchase accounting adjustment related to the Acquisition, certain Acquisition-related expenses, sponsor fees, equity-based compensation expense, write-off of property and equipment and other non-recurring expenses, primarily consisting of outside legal and professional fees associated with certain non-recurring transactions and events. We present Adjusted EBITDA on a consolidated basis because our management uses it as a supplemental measure in assessing our operating performance, and we believe that it is helpful to investors, securities analysts and other interested parties as a measure of our comparative operating performance from period to period. Adjusted EBITDA is not a measurement of financial performance under GAAP. It should not be considered an alternative to net income (loss) as a measure of our operating performance or any other measure of performance derived in accordance with GAAP. In addition, Adjusted EBITDA should not be construed as an inference that our future results will be unaffected by unusual or nonrecurring items, or affected by similar nonrecurring items. Adjusted EBITDA has limitations as an analytical tool, and you should not consider such measure either in isolation or as a substitute for analyzing our results as reported under GAAP. Our definition and calculation of Adjusted EBITDA is not necessarily comparable to other similarly titled measures used by other companies due to different methods of calculation. We recommend that you review the reconciliation of Adjusted EBITDA to net income (loss), the most directly comparable GAAP financial measure, under “Prospectus Summary—Summary Consolidated Historical and Pro Forma Financial and Other Data” and not rely solely on Adjusted EBITDA or any single financial measure to evaluate our business. |
| (3) | Adjusted EBITDA margin is defined as Adjusted EBITDA divided by net sales. We recommend that you review the calculation of Adjusted EBITDA margin, under “Prospectus Summary—Summary Consolidated Historical and Pro Forma Financial and Other Data.” |
| (4) | Net operating assets and liabilities consist of current assets excluding cash, less current liabilities excluding the current portion of long-term debt. |
48
Table of Contents
UNAUDITED PRO FORMA CONSOLIDATED FINANCIAL INFORMATION
The following unaudited pro forma consolidated financial statements should be read in conjunction with “Selected Historical Consolidated Financial and Other Data,” “Management’s Discussion and Analysis of the Financial Condition and Results of Operations” and our consolidated financial statements and the related notes thereto, included elsewhere in this prospectus.
The unaudited pro forma consolidated balance sheet at October 29, 2016 has been derived from the unaudited historical balance sheet included elsewhere in this prospectus and gives effect to our conversion from a Delaware limited liability company named Jill Intermediate LLC into a Delaware corporation (the “Corporate Conversion”) and the merger of JJill Holdings, our direct parent, with and into us (the “Parent Merger”), which occurred prior to the completion of this offering as if they had occurred on October 29, 2016. As the Acquisition and the Financing (as defined below) are reflected in our historical consolidated balance sheet as of October 29, 2016, included elsewhere in this prospectus, there are no pro forma adjustments to our consolidated balance sheet to reflect the Acquisition and the Financing.
The unaudited pro forma consolidated statement of operations for the year ended January 30, 2016 has been derived from our consolidated audited statements of operations included elsewhere in this prospectus and represents the addition of the Predecessor period from February 1, 2015 through May 7, 2015 and the Successor period from May 8, 2015 through January 30, 2016, and gives effect to the following as if they had occurred on February 1, 2015:
| • | JJill Holdings’ acquisition of approximately 94% of the outstanding interests of Jill Intermediate LLC and JJill Topco Holdings’ acquisition of approximately 6% of the outstanding interests of Jill Intermediate LLC and our election to push down the effects of the Acquisition to our consolidated financial statements (the “Acquisition”); |
| • | the related Acquisition financing as provided for under the Term Loan for $250.0 million and the ABL Facility for $40.0 million (the “Financing”); |
| • | the Corporate Conversion and the Parent Merger, which occurred prior to the completion of this offering; and |
| • | the distribution of our common stock by JJill Topco Holdings to its partners that hold vested and unvested Class A Common Interests (“Common Interests”) in accordance with its limited partnership agreement, upon completion of this offering (the “Distribution”). The shares of J.Jill, Inc. common stock distributed in respect of unvested Common Interests will become restricted J.Jill, Inc. common stock, subject to the original vesting terms of such Common Interests. Holders of vested and unvested Common Interests will receive a pro rata distribution of vested and unvested J.Jill, Inc. common stock, equal to their fair value of Common Interests immediately prior to the distribution, resulting in no incremental fair value. |
The unaudited pro forma consolidated statement of operations does not include the impacts of any revenue, cost or other operating synergies that may result from the Acquisition. There are no pro forma adjustments to our statement of operations (i) for the year ended January 30, 2016 or for the nine months ended October 29, 2016 related to the Parent Merger as there will be no impact to our statements of operations as a result of the Parent Merger; or (ii) for the nine months ended October 29, 2016 related to the Acquisition and the Financing, as both of these transactions were reflected for the entire period in our unaudited consolidated statement of operations for the nine months ended October 29, 2016. However, there are pro forma adjustments to EPS for the nine months ended October 29, 2016 to give effect to the Corporate Conversion and the Distribution.
49
Table of Contents
The accompanying unaudited pro forma consolidated financial information has been prepared in accordance with Article 11 of Regulation S-X. The pro forma adjustments reflect events that are (i) directly attributed to the Acquisition, the Financing and the Parent Merger; (ii) factually supportable; and (iii) with respect to the pro forma statements of operations, expected to have a continuing impact on the consolidated results.
The unaudited pro forma consolidated financial information presented is based on available information and assumptions we believe are reasonable. The unaudited pro forma consolidated balance sheet and the unaudited pro forma consolidated statement of operations are presented for illustrative purposes and do not purport to represent what the results of operations would actually have been if the Acquisition, the Financing and the Parent Merger had occurred as of the dates indicated or what the results of operations would be for any future periods.
50
Table of Contents
J.Jill, Inc.
UNAUDITED PRO FORMA CONSOLIDATED BALANCE SHEET
(in thousands, except share and per share data)
| October 29, 2016 | ||||||||||||
| Actual |
Pro Forma |
Pro Forma |
||||||||||
| Assets |
||||||||||||
| Current assets: |
||||||||||||
| Cash |
$ | 4,955 | $ | $ | 4,955 | |||||||
| Accounts receivable |
11,338 | 11,338 | ||||||||||
| Inventories, net |
79,041 | 79,041 | ||||||||||
| Prepaid expenses and other current assets |
18,215 | 18,215 | ||||||||||
|
|
|
|
|
|
|
|||||||
| Total current assets |
113,549 | — | 113,549 | |||||||||
| Property and equipment, net |
98,050 | 98,050 | ||||||||||
| Intangible assets, net |
167,603 | 167,603 | ||||||||||
| Goodwill |
196,572 | 196,572 | ||||||||||
| Receivable from related party |
1,617 | 1,617 | ||||||||||
| Other assets |
1,077 | 1,077 | ||||||||||
|
|
|
|
|
|
|
|||||||
| Total assets |
$ | 578,468 | $ | — | $ | 578,468 | ||||||
|
|
|
|
|
|
|
|||||||
| Liabilities and Members’ / Stockholders’ Equity |
||||||||||||
| Current liabilities: |
||||||||||||
| Accounts payable |
$ | 39,574 | $ | $ | 39,574 | |||||||
| Accrued expenses and other current liabilities |
49,271 | 49,271 | ||||||||||
| Current portion of long-term debt |
2,900 | 2,900 | ||||||||||
|
|
|
|
|
|
|
|||||||
| Total current liabilities |
91,745 | — | 91,745 | |||||||||
| Long-term debt, net of current portion |
274,356 | 274,356 | ||||||||||
| Deferred income taxes |
77,342 | 77,342 | ||||||||||
| Other liabilities |
16,271 | 16,271 | ||||||||||
|
|
|
|
|
|
|
|||||||
| Total liabilities |
$ | 459,714 | — | $ | 459,714 | |||||||
|
|
|
|
|
|
|
|||||||
| Commitments and contingencies |
||||||||||||
| Members’ Equity / Stockholders’ Equity |
||||||||||||
| Preferred stock, $0.01 par value, no shares authorized, issued and outstanding (historical); 50,000,000 shares authorized, no shares issued and outstanding (pro forma) |
— | — | ||||||||||
| Common stock, par value $0.01 per share; no shares authorized, issued and outstanding (historical); 250,000,000 shares authorized, 43,747,944 issued and outstanding (pro forma) |
— | 437 | (1) | 437 | ||||||||
| Common units, zero par value, 1,000,000 units authorized, issued and outstanding (historical); no units authorized, issued and outstanding (pro forma) |
— | — | (1) | — | ||||||||
| Contributed capital |
107,712 | (107,712 | )(1) | — | ||||||||
| Additional paid-in capital |
— | 115,835 | 115,835 | |||||||||
| Accumulated earnings (deficit) |
11,042 | (8,560 | )(1) | 2,482 | ||||||||
|
|
|
|
|
|
|
|||||||
| Total members’/ stockholders’ equity |
118,754 | — | 118,754 | |||||||||
|
|
|
|
|
|
|
|||||||
| Total liabilities and members’/ stockholders’ equity |
$ | 578,468 | $ | — | $ | 578,468 | ||||||
|
|
|
|
|
|
|
|||||||
See notes to Unaudited Pro Forma Consolidated Balance Sheet
51
Table of Contents
J.Jill, Inc.
UNAUDITED PRO FORMA CONSOLIDATED STATEMENT OF OPERATIONS
(in thousands, except share and per share data)
| Predecessor |
Successor |
Pro Forma |
||||||||||||||||||
|
For the Period |
For the Period |
Pro Forma |
For the Fiscal |
|||||||||||||||||
| Net sales |
$ | 141,921 | $ | 420,094 | $ | — | $ | 562,015 | ||||||||||||
| Costs of goods sold |
44,232 | 155,091 | (10,471 | )(2) | 188,852 | |||||||||||||||
|
|
|
|
|
|
|
|
|
|||||||||||||
| Gross profit |
97,689 | 265,003 | 10,471 | 373,163 | ||||||||||||||||
| Operating expenses |
80,151 | 246,482 | 2,044 | (3) | 331,752 | |||||||||||||||
| 1,943 | (4) | |||||||||||||||||||
| (250 | )(5) | |||||||||||||||||||
| (34 | )(6) | |||||||||||||||||||
| 973 | (7) | |||||||||||||||||||
| 443 | (8) | |||||||||||||||||||
| Acquisition-related expenses |
13,341 | — | (13,341 | )(9) | — | |||||||||||||||
|
|
|
|
|
|
|
|
|
|||||||||||||
| Operating income |
4,197 | 18,521 | 18,693 | 41,411 | ||||||||||||||||
| Interest expense |
4,599 | 11,893 | 401 | (10) | 16,893 | |||||||||||||||
|
|
|
|
|
|
|
|
|
|||||||||||||
| Income (loss) before provision for income taxes |
(402 | ) | 6,628 | 18,292 | 24,518 | |||||||||||||||
| Provision for income taxes |
1,499 | 2,322 | 6,402 | (11) | 10,223 | |||||||||||||||
|
|
|
|
|
|
|
|
|
|||||||||||||
| Net income (loss) |
$ | (1,901 | ) | $ | 4,306 | $ | 11,890 | $ | 14,295 | |||||||||||
|
|
|
|
|
|
|
|
|
|||||||||||||
| Net income (loss) per share attributable to common stockholders: |
||||||||||||||||||||
| Basic |
$ | (0.04 | ) | $ | 0.10 | $ | 0.35 | |||||||||||||
| Diluted |
$ | (0.04 | ) | $ | 0.10 | $ | 0.34 | |||||||||||||
| Weighted average number of common shares outstanding: |
||||||||||||||||||||
| Basic |
43,747,944 | 43,747,944 | (3,413,970 | )(12) | 40,333,974 | |||||||||||||||
| Diluted |
43,747,944 | 43,747,944 |
|
(1,216,511 |
)(12) |
42,531,433 | ||||||||||||||
See notes to Unaudited Pro Forma Consolidated Statement of Operations
52
Table of Contents
NOTE A—Description of the Acquisition, Financing, Corporate Conversion, Parent Merger and Distribution
On May 8, 2015, JJill Holdings and JJill Topco Holdings completed the Acquisition of the Company. The purchase price of the Acquisition was $396.4 million, which was funded through an equity contribution by JJill Holdings and JJill Topco Holdings and borrowings under our Term Loan. JJill Holdings accounted for the Acquisition as a business combination under the acquisition method of accounting. Accordingly, the purchase price was allocated to the assets acquired and liabilities assumed based on their estimated fair values at the date of Acquisition. We have elected to push down the effects of the Acquisition to our consolidated historical financial statements.
In conjunction with the Acquisition, we entered into our seven-year Term Loan of $250.0 million, which contains certain terms and conditions that require us to comply with financial and other covenants. The Term Loan has a variable interest rate which is based on a rate per annum equal to LIBOR plus 5.0%, with a minimum required LIBOR per annum of 1.0%. The rate per annum was 6.0% at January 30, 2016. The Term Loan is collateralized by all of our assets and contains a provision requiring scheduled quarterly repayments that began October 31, 2015 and that continue until maturity on May 8, 2022.
We also entered into our five-year secured $40.0 million asset-based ABL Facility. Our ABL Facility is collateralized by a first lien on accounts receivable and inventory. Amounts outstanding under the ABL Facility bear interest of LIBOR plus the applicable margin, as defined in the agreement. The ABL Facility consists of revolving loans whereby interest on each revolving loan is payable upon maturity, with durations ranging between 30 to 180 days. Principal is payable upon maturity of the ABL Facility on May 8, 2020. The ABL Facility also requires the payment of monthly fees based on the average quarterly unused portion, as well as a fee on the balance of the outstanding letters of credit. As of October 29, 2016, there were no amounts that had been drawn under the ABL Facility. Based on the borrowing terms of the agreement, the available borrowing capacity at October 29, 2016 was $38.5 million.
In securing the Term Loan and the ABL Facility, we incurred financing and issuance costs of $9.6 million. Debt issuance costs are deferred and amortized using the effective interest rate method for the Term Loan and the straight-line method for the ABL Facility. Debt discounts are deferred and amortized using the effective interest rate method over the term of the related debt agreements.
On February 24, 2017, we completed transactions pursuant to which we converted from a Delaware limited liability company named Jill Intermediate LLC into a Delaware corporation and changed our name to J.Jill, Inc. In order to consummate the corporate conversion, a certificate of conversion was filed with the Secretary of State of the State of Delaware. In conjunction with the conversion, all of our outstanding equity interests were converted into shares of common stock. In connection with the conversion, J.Jill, Inc. will continue to hold all assets of Jill Intermediate LLC and will assume all of its liabilities and obligations. Following our conversion into a Delaware corporation, JJill Holdings, our direct parent company, merged with and into us and we were the surviving entity to such merger. Following the merger, all of the shares of our common stock are held by JJill Topco Holdings, our current direct parent. Upon completion of this offering, our common stock held by JJill Topco Holdings will be distributed to its partners that hold vested and unvested Class A Common Interests in accordance with its limited partnership agreement. The shares of J.Jill, Inc. common stock distributed in respect of unvested Common Interests will become restricted J.Jill, Inc. common stock, subject to the original vesting terms of such Common Interests. Holders of vested and unvested Common Interests will receive a pro rata distribution of vested and unvested J.Jill, Inc. common stock, equal to their fair value of Common Interests immediately prior to the distribution, resulting in no incremental fair value.
JJill Topco Holdings controlled both JJill Holdings and J.Jill, Inc. As a result, the merger of J.Jill, Inc., and JJill Holdings, its direct parent, was accounted for as a merger of entities under common control in accordance with Accounting Standards Codification (“ASC”) 805. Accordingly, the merger does not result in a change in the
53
Table of Contents
basis of accounting. The results of the merger reflect the combination of the results of operations of JJill Holdings and the Company. JJill Holdings did not have operations on its own, except for transaction cost of $8.6 million incurred to execute the Acquisition of the Company. As these costs are non-recurring in nature, the unaudited pro forma consolidated statement of operations did not reflect such costs.
Notes to Unaudited Pro Forma Consolidated Balance Sheet
| (1) | Represents the (i) conversion of our common units to 43,747,944 shares of common stock and (ii) the reclassification of $8.6 million from contributed capital to accumulated deficit upon the Parent Merger. |
Notes to Unaudited Pro Forma Consolidated Statement of Operations Adjustments
| (2) | Represents the elimination of the increase in cost of goods sold resulting from the amortization of the fair value step-up of merchandise inventory reflected in the purchase price allocation at the date of the Acquisition. The Company’s inventory turn is approximately four times per year. As such, the step up in the fair value of inventory, which increased cost of goods sold within approximately the first three months after the Acquisition, has been removed from the unaudited pro forma consolidated statement of operations as there is no continuing impact on the results of operations. |
| (3) | Represents the incremental depreciation expense resulting from the increase in fair value of certain fixed assets, reflected in the purchase price allocation at the date of the Acquisition. |
| Fixed Asset |
Estimated Useful Life |
Fair Value at |
Estimated |
|||||||||
| Leasehold improvements |
|
Shorter of estimated useful life or lease term |
|
$ | 39,924 | $ | 11,012 | |||||
| Furniture, fixtures & equipment |
5-7 years | 21,222 | 6,812 | |||||||||
| Computer software |
3-5 years | 5,490 | 3,286 | |||||||||
| Computer hardware |
3-5 years | 3,209 | 1,426 | |||||||||
| Construction in process |
N/A | 8,839 | — | |||||||||
|
|
|
|
|
|||||||||
| Total |
$ | 78,684 | 22,536 | |||||||||
|
|
|
|||||||||||
| Less: historical depreciation expense |
(20,492 | ) | ||||||||||
|
|
|
|||||||||||
| Additional depreciation expense |
$ | 2,044 | ||||||||||
|
|
|
|||||||||||
| (4) | Represents the incremental amortization expense resulting from the increase in fair value of certain definite-lived intangible assets, reflected in the purchase price allocation at the date of acquisition. |
| Intangible Asset |
Estimated |
Fair Value at |
Estimated |
|||||||||
| Customer relationship—retail |
8 years | $ | 12,400 | $ | 2,607 | |||||||
| Customer relationship—direct |
9 years | 41,700 | 8,067 | |||||||||
| Customer relationship—multi-channel |
16 years | 80,100 | 5,293 | |||||||||
|
|
|
|
|
|||||||||
| Total |
$ | 134,200 | 15,967 | |||||||||
|
|
|
|||||||||||
| Less: historical amortization expense |
(14,024 | ) | ||||||||||
|
|
|
|||||||||||
| Pro forma adjustment |
$ | 1,943 | ||||||||||
|
|
|
|||||||||||
54
Table of Contents
Total amortization of acquired intangible assets over the next five years is expected to be as follows:
| Fiscal Year |
Amortization |
|||
| 2016 |
$ | 16,025 | ||
| 2017 |
14,143 | |||
| 2018 |
12,471 | |||
| 2019 |
11,008 | |||
| 2020 |
9,805 | |||
| Thereafter |
54,781 | |||
|
|
|
|||
| $ | 118,233 | |||
|
|
|
|||
| (5) | Represents the elimination of the management fee charged by our previous equity sponsor for the period from February 1, 2015 through May 7, 2015 as it is not expected to have a continuing impact on the results of operations. |
| (6) | Represents the net decrease in amortization expense related to recognition of the fair value of favorable/unfavorable leases. |
| (7) | Represents incremental pro forma deferred rent expense resulting from the recalculation of deferred rent expense from the Acquisition. |
| (8) | Represents the incremental compensation expense related to certain management incentive bonuses awarded in connection with the Acquisition. These bonuses are being amortized over the required service period, which is greater than a year, and thus were deemed to have an ongoing impact on the results of operations. |
| (9) | Represents the elimination of the transaction costs incurred in connection with the Acquisition, consisting substantially of legal and advisory fees, which are not expected to have a continuing impact on the results of operations. |
| (10) | Represents the net change in interest expense resulting from (i) the elimination of cash interest and amortization of deferred issuance costs related to our debt facilities in place during the 2015 Predecessor Period, which were repaid in conjunction with the Acquisition and (ii) the addition of interest expense and amortization of deferred issuance costs for the same period related to our new debt facilities. The following table summarizes the interest expense under the respective facilities for the period: |
|
Interest Expense |
||||
| Annual pro forma interest expense: |
||||
| Term Loan interest expense |
$ | 15,138 | (a) | |
| Amortization of deferred issuance costs on the Term Loan |
1,197 | (b) | ||
| ABL Facility interest expense |
331 | (c) | ||
| Other interest expense |
227 | |||
|
|
|
|||
| Total interest expense |
16,893 | |||
| Less: historical interest expense |
(16,492 | ) | ||
|
|
|
|||
| Additional interest expense |
$ | 401 | ||
|
|
|
|||
| (a) | Reflects annual interest expense on the $250 million Term Loan, assuming an interest rate of 6%. |
55
Table of Contents
| (b) | Reflects amortization of deferred issuance costs for the year. |
| (c) | Reflects various fees under the ABL Facility, including the unused line fee of 0.375% and amortization of deferred financing fees. |
A 1/8% increase or decrease in the variable interest rate of the Term Loan facility would increase or decrease our annual interest expense by $0.3 million.
| (11) | Represents the income tax effect for the above adjustments reflecting an estimated statutory tax rate of 35%. |
| (12) | Basic and diluted net income (loss) per share attributable to common stockholders for the pro forma fiscal year ended January 30, 2016 and the thirty-nine weeks ended October 29, 2016 are based on our capital structure after giving effect to the Corporate Conversion and the Distribution. |
During the pro forma thirty-nine weeks ended October 29, 2016 there were no adjustments to net income as all adjustments related to the Acquisition and the Financing had been reflected in our historical financial statements for the thirty-nine weeks ended October 29, 2016.
After giving effect to the Corporate Conversion and the Distribution, pro forma basic and diluted net income (loss) per share attributable to common stockholders was as follows:
| Pro Forma | ||||||||
| For the Fiscal Year Ended January 30, 2016 |
For the Thirty-Nine Weeks Ended October 29, 2016 |
|||||||
| Basic pro forma net income per share attributable to common stockholders: |
||||||||
| Numerator |
||||||||
| Pro forma net income attributable to common stockholders |
$ | 14,295 | $ | 22,030 | ||||
|
|
|
|
|
|||||
| Denominator |
||||||||
| Weighted average common shares outstanding — basic |
43,747,944 | 43,747,944 | ||||||
| Pro forma adjustments (1): |
||||||||
| Restricted common shares |
(3,673,456 | ) | (3,673,456 | ) | ||||
| Weighted average common shares vested |
259,486 | 834,474 | ||||||
|
|
|
|
|
|||||
| Pro forma weighted average common shares outstanding — basic |
40,333,974 | 40,908,962 | ||||||
|
|
|
|
|
|||||
| Pro forma net income per share attributable to common stockholders — basic |
$ | 0.35 | $ | 0.54 | ||||
|
|
|
|
|
|||||
56
Table of Contents
| Pro Forma | ||||||||
| For the Fiscal Year Ended January 30, 2016 |
For the Thirty-Nine Weeks Ended October 29, 2016 |
|||||||
| Diluted pro forma net income per share attributable to common stockholders: |
||||||||
| Numerator |
||||||||
| Pro forma net income attributable to common stockholders |
$ | 14,295 | $ | 22,030 | ||||
|
|
|
|
|
|||||
| Denominator |
||||||||
| Weighted average common shares outstanding — basic |
40,333,974 | 40,908,962 | ||||||
| Dilutive effect of J.Jill, Inc. restricted common shares (1) |
2,197,459 | 2,001,337 | ||||||
|
|
|
|
|
|||||
| Pro forma weighted average common shares outstanding — diluted |
42,531,433 | 42,910,299 | ||||||
|
|
|
|
|
|||||
| Pro forma net income per share attributable to common stockholders — diluted |
$ | 0.34 | $ | 0.51 | ||||
|
|
|
|
|
|||||
| (1) | Upon the completion of this offering, holders of vested and unvested JJill Topco Holdings Common Interests will receive vested and unvested J.Jill, Inc. common stock, respectively, in a distribution by JJill Topco Holdings in accordance with its limited partnership agreement. The shares of J.Jill, Inc. common stock distributed in respect of unvested Common Interests will become restricted J.Jill, Inc. common stock subject to the original vesting terms of such Common Interests. Holders of vested and unvested Common Interests will receive a pro rata distribution of vested and unvested J.Jill, Inc. common stock, equal to their fair value of Common Interests immediately prior to the distribution, resulting in no incremental fair value. |
The adjustment to pro forma basic weighted average shares for the pro forma fiscal year ended January 30, 2016 assumes that (i) the Corporate Conversion and the Distribution occurred on February 1, 2015; (ii) at that date, 3,673,456 shares of the 43,747,944 shares outstanding after the Corporate Conversion were restricted shares that were subject to vesting restrictions due to the Distribution; and (iii) during the pro forma fiscal year ended January 30, 2016, 259,486 shares of those 3,673,456 restricted shares vested in accordance with the vesting conditions on a weighted average basis. The adjustment to pro forma basic weighted average shares for the thirty-nine weeks ended October 29, 2016 assumes that during the thirty-nine weeks ended October 29, 2016, an additional 574,988 shares of the 3,673,456 restricted shares vested in accordance with the vesting conditions on a weighted average basis.
57
Table of Contents
MANAGEMENT’S DISCUSSION AND ANALYSIS OF FINANCIAL
CONDITION AND RESULTS OF OPERATIONS
The following discussion and analysis should be read in conjunction with our consolidated financial statements and related notes thereto included elsewhere in this prospectus, as well as the information presented under “Selected Historical Consolidated Financial and Other Data” and “Unaudited Pro Forma Consolidated Financial Information.” The following discussion contains forward-looking statements that reflect our plans, estimates and assumptions. Our actual results could differ materially from those discussed in the forward-looking statements. Factors that could cause such differences are discussed in the sections of this prospectus titled “Risk Factors” and “Cautionary Note Regarding Forward-Looking Statements.”
We operate on a 52- or 53-week fiscal year that ends on the Saturday that is closest to January 31 of that year. Each fiscal year generally is comprised of four 13-week fiscal quarters, although in the years with 53 weeks, the fourth quarter represents a 14-week period. Fiscal year 2013, fiscal year 2014 and pro forma fiscal year 2015 ended on February 1, 2014, January 31, 2015 and January 30, 2016, respectively, and were each comprised of 52 weeks.
Overview
J.Jill is a nationally recognized women’s apparel brand focused on a loyal, engaged and affluent customer in the attractive 40-65 age segment. The J.Jill brand represents an easy, relaxed and inspired style that reflects the confidence and comfort of a woman with a rich, full life. We operate a highly profitable omni-channel platform that is well diversified across our direct (42% of net sales for the twelve months ended October 29, 2016) and retail (58% of net sales for the twelve months ended October 29, 2016) channels. We began as a catalog company and have been a pioneer of the omni-channel model with a compelling presence across stores, website and catalog since 1999. We have developed an industry-leading customer database that allows us to match approximately 97% of transactions to an identifiable customer. We take a data-centric approach, in which we leverage our database and apply our insights to manage our business as well as to acquire and engage customers to drive optimum value and productivity. Our goals are to Create a great brand, to Build a successful business and to Make J.Jill a great place to work. To achieve this, we have aligned our strategy and team around four guiding pillars – Brand, Customer, Product and Channel.
Our Growth Strategy
We plan to pursue the following strategies to continue to enhance our competitive positioning and drive growth in sales and profitability:
| • | Grow the size and value of our active customer base. We have a significant opportunity to continue to attract new customers to our brand and to grow the size and value of our active customer base across all channels. We have strategically increased our marketing investment to drive growth through the acquisition of new customers, reactivation of lapsed customers and the retention of existing customers. |
| • | Increase direct sales. Given our strong foundation that positions us to capitalize on the growth of online and mobile shopping, we believe we have the opportunity to grow our direct sales from 42% of our net sales to approximately 50% over the next few years. We are undertaking several initiatives to enhance our capabilities and drive additional direct sales. |
| • | Profitably expand our store base. Based on our proven new store economics, we believe that we have the potential to grow our store base by up to 100 stores over the long term from our total of 275 stores as of January 28, 2017. We will target new locations in lifestyle centers and premium malls, and we plan to open 10-15 new stores in fiscal year 2017 and in each year thereafter. |
58
Table of Contents
| • | Strengthen omni-channel capabilities. We are pursuing a variety of initiatives designed to enhance our omni-channel capabilities focused on best serving our customer, wherever and whenever she chooses to shop. We expect our sustainable model, combined with our omni-channel initiatives, will continue to drive traffic, increase average transaction value and enhance conversion across all of our channels. |
| • | Enhance product assortment. We believe there is an opportunity to grow our business by selectively broadening and enhancing our assortment in certain product categories including our Pure Jill and Wearever sub-brands, our Women’s and Petite’s businesses and accessories. Through our focused and enhanced product offering, particularly in our sub-brands and extended sizes, we believe we will continue to drive profitable sales growth over time. |
Factors Affecting Our Operating Results
Various factors are expected to continue to affect our results of operations going forward, including the following:
Overall Economic Trends. Consumer purchases of clothing and other merchandise generally decline during recessionary periods and other periods when disposable income is adversely affected, and consequently our results of operations are affected by general economic conditions. For example, reduced consumer confidence and lower availability and higher cost of consumer credit reduces demand for our merchandise and limit our ability to increase or sustain prices. The growth rate of the market could be affected by macroeconomic conditions in the United States.
Consumer Preferences and Fashion Trends. Our ability to maintain our appeal to existing customers and attract new customers depends on our ability to anticipate fashion trends. During periods in which we have successfully anticipated fashion trends we have generally had more favorable results.
Competition. The retail industry is highly competitive and retailers compete based on a variety of factors, including design, quality, price and customer service. Levels of competition and the ability of our competitors to more accurately predict fashion trends and otherwise attract customers through competitive pricing or other factors may impact our results of operations.
Our Strategic Initiatives. We are in the process of implementing significant business initiatives that have had and will continue to have an impact on our results of operations, including our brand voice and customer segmentation initiatives. Although these initiatives are designed to create growth in our business and continuing improvement in our operating results, the timing of expenditures related to these initiatives, as well as the achievement of returns on our investments, may affect our results of operation in future periods.
Pricing and Changes in Our Merchandise Mix. Our product offering changes from period to period, as do the prices at which goods are sold and the margins we are able to earn from the sales of those goods. The levels at which we are able to price our merchandise are influenced by a variety of factors, including the quality of our products, cost of production, prices at which our competitors are selling similar products and the willingness of our customers to pay for products.
How We Assess the Performance of Our Business
In assessing the performance of our business, we consider a variety of financial and operating metrics, including GAAP and non-GAAP measures, including the following:
Net sales consists primarily of revenues, net of merchandise returns and discounts, generated from the sale of apparel and accessory merchandise through our direct channel and retail channel. Net sales also include shipping and handling fees collected from customers. Revenue from our retail channel is recognized at the time of sale and revenue from our direct channel is recognized upon receipt of merchandise by the customer.
59
Table of Contents
Net sales are impacted by the size of our active customer base, product assortment and availability, marketing and promotional activities and the spending habits of our customers. Net sales are also impacted by the migration of single-channel customers to omni-channel customers, who on average spend nearly three times more than single channel customers.
Total company comparable sales includes net sales from our full-price stores that have been open for more than 52 weeks and from our direct channel. This measure highlights the performance of existing stores open during the period, while excluding the impact of new store openings and closures. When a store in the total company comparable store base is temporarily closed for remodeling or other reasons, it is included in total company comparable sales only using the full weeks it was open. Certain of our competitors and other retailers calculate total company comparable sales differently than we do. As a result, the reporting of our total company comparable sales may not be comparable to sales data made available by other companies.
Number of stores reflects all stores open at the end of a reporting period. In connection with opening new stores, we incur pre-opening costs. Pre-opening costs include expenses incurred prior to opening a new store and primarily consist of payroll, travel, training, marketing, initial opening supplies and costs of transporting initial inventory and fixtures to store locations, as well as occupancy costs incurred from the time of possession of a store site to the opening of that store. These pre-opening costs are included in selling, general and administrative expenses and are generally incurred and expensed within 30 days of opening a new store.
Gross profit is equal to our net sales less cost of goods sold. Gross profit as a percentage of our net sales is referred to as gross margin. Cost of goods sold includes the direct cost of sold merchandise, inventory shrinkage, and adjustments and reserves for excess, aged and obsolete inventory. We review our inventory levels on an ongoing basis to identify slow-moving merchandise and use product markdowns to efficiently sell these products. Changes in the assortment of our products may also impact our gross profit. The timing and level of markdowns are driven by customer acceptance of our merchandise. Certain of our competitors and other retailers report cost of goods sold differently than we do. As a result, the reporting of our gross profit and gross margin may not be comparable to other companies.
The primary drivers of the cost of goods sold are raw materials, which fluctuate based on certain factors beyond our control, including labor conditions, transportation or freight costs, energy prices, currency fluctuations and commodity prices. We place orders with merchandise suppliers in United States dollars and, as a result, are not exposed to significant foreign currency exchange risk.
Selling, general and administrative expenses include all operating costs not included in cost of goods sold. These expenses include all payroll and related expenses, occupancy costs and other operating expenses related to our stores and to our operations at our headquarters, including utilities, depreciation and amortization. These expenses also include marketing expense, including catalog production and mailing costs, warehousing, distribution and shipping costs, customer service operations, consulting and software services, professional services and other administrative costs.
Our historical revenue growth has been accompanied by increased selling, general and administrative expenses. The most significant increases were in occupancy costs associated with retail store expansion, and in marketing and payroll investments. While we expect these expenses to increase as we continue to open new stores, increase brand awareness and grow our business, we believe these expenses will decrease as a percentage of net sales over time.
As a public company, we will incur significant legal, accounting and other expenses that we did not incur as a private company. We expect that compliance with the Sarbanes-Oxley Act and the Dodd-Frank Wall Street Reform and Consumer Protection Act, as well as rules and regulations subsequently implemented by the Securities and Exchange Commission, will increase our legal and financial compliance costs and will make some activities more time consuming and costly. In addition, we expect that our management and other personnel will
60
Table of Contents
need to devote substantial time to these public company requirements. In particular, we expect to incur significant expenses and devote substantial management effort toward ensuring compliance with the requirements of the Sarbanes-Oxley Act. In that regard, we expect to hire additional accounting and financial staff with appropriate public company experience and technical accounting knowledge.
Adjusted EBITDA represents net income (loss) plus interest expense, provision (benefit) for income taxes, depreciation and amortization, the amortization of the step-up to fair value of merchandise inventory resulting from the application of a purchase accounting adjustment related to the Acquisition, certain Acquisition-related expenses, sponsor fees, equity-based compensation expense, write-off of property and equipment and other non-recurring expenses, primarily consisting of outside legal and professional fees associated with certain non-recurring transactions and events. We present Adjusted EBITDA on a consolidated basis because our management uses it as a supplemental measure in assessing our operating performance, and we believe that it is helpful to investors, securities analysts and other interested parties as a measure of our comparative operating performance from period to period. We also use Adjusted EBITDA as one of the primary methods for planning and forecasting overall expected performance of our business and for evaluating on a quarterly and annual basis actual results against such expectations. Further, we recognize Adjusted EBITDA as a commonly used measure in determining business value and as such, use it internally to report results.
Adjusted EBITDA margin represents, for any period, Adjusted EBITDA as a percentage of net sales.
While we believe that Adjusted EBITDA and Adjusted EBITDA margin are useful in evaluating our business, Adjusted EBITDA and Adjusted EBITDA margin are non-GAAP financial measures that have limitations as an analytical tool. Adjusted EBITDA should not be considered as an alternative to, or substitute for, net income (loss), which is calculated in accordance with GAAP. In addition, other companies, including companies in our industry, may calculate Adjusted EBITDA and Adjusted EBITDA margin differently or not at all, which reduces the usefulness of Adjusted EBITDA and Adjusted EBITDA margin as a tool for comparison. We recommend that you review the reconciliation of Adjusted EBITDA to net income (loss), the most directly comparable GAAP financial measure, and our calculation of Adjusted EBITDA margin, under “Prospectus Summary—Summary Consolidated Historical and Pro Forma Financial and Other Data” and not rely solely on Adjusted EBITDA, Adjusted EBITDA margin or any single financial measure to evaluate our business.
Factors Affecting the Comparability of our Results of Operations
Acquisition
On May 8, 2015, JJill Holdings acquired approximately 94% of the outstanding interests of Jill Intermediate LLC and JJill Topco Holdings acquired the remaining 6% of the outstanding interests of Jill Intermediate LLC. JJill Topco Holdings owns 100% of JJill Holdings. The purchase price was $396.4 million, which consisted of $386.3 million of cash consideration and $10.1 million of noncash consideration in the form of an equity rollover by Jill Intermediate LLC’s predecessor management owners. The Acquisition was funded through an equity contribution by JJill Holdings and JJill Topco Holdings and borrowings under our seven-year $250.0 million Term Loan, as described under “Credit Facilities” below.
JJill Holdings accounted for the Acquisition as a business combination under the acquisition method of accounting. Accordingly, the purchase price was allocated to the assets acquired and liabilities assumed based on their estimated fair values at the date of Acquisition.
We have elected to push down the effects of the Acquisition to our consolidated financial statements. The financial information for all periods after May 7, 2015 represents the financial information of the Successor. Prior to, and including, May 7, 2015, the consolidated financial statements, included elsewhere in this prospectus, include the accounts of the Predecessor.
Due to the change in the basis of accounting resulting from the Acquisition, the Predecessor’s consolidated financial statements and the Successor’s consolidated financial statements, included elsewhere in this prospectus,
61
Table of Contents
are not comparable. See “Unaudited Pro Forma Consolidated Financial Information” and our historical audited consolidated financial statements and the related notes thereto included elsewhere in this prospectus for additional information regarding the Acquisition.
Recent Transactions
Amendment to Credit Facility and Dividend
On May 27, 2016, we entered into an agreement to amend our Term Loan to borrow an additional $40.0 million in loans. The other terms and conditions of the Term Loan remained substantially unchanged, as discussed in “—Liquidity and Capital Resources—Credit Facilities.” We used the additional loan proceeds, along with cash on hand, to fund a $70.0 million dividend to the partners of JJill Topco Holdings, which was approved by the members of Jill Intermediate LLC and the board of directors of JJill Topco Holdings on May 27, 2016.
On January 18, 2017, we made a voluntary prepayment of $10.1 million, including accrued interest, on our Term Loan.
Results of Operations
Period from February 1, 2015 to May 7, 2015 (Predecessor) and Period from May 8, 2015 through October 31, 2015 (Successor) Compared to the Thirty-Nine Weeks Ended October 29, 2016 (Successor)
The following table summarizes our consolidated results of operations for the periods indicated:
| Predecessor | Successor | |||||||||||||||||||||||
| For the Period from February 1, 2015 to May 7, 2015 |
For the Period from May 8, 2015 to October 31, 2015 |
For the Thirty-Nine Weeks Ended October 29, 2016 |
||||||||||||||||||||||
| (in thousands) |
Dollars |
% of Net |
Dollars |
% of Net |
Dollars |
% of Net |
||||||||||||||||||
| Net sales |
$ | 141,921 | 100.0% | $ | 274,741 | 100.0% | $ | 472,139 | 100.0% | |||||||||||||||
| Costs of goods sold |
44,232 | 31.2% | 101,185 | 36.8% | 149,673 | 31.7% | ||||||||||||||||||
|
|
|
|
|
|
|
|
|
|
|
|
|
|||||||||||||
| Gross profit |
97,689 | 68.8% | 173,556 | 63.2% | 322,466 | 68.3% | ||||||||||||||||||
| Selling, general and administrative expenses |
80,151 | 56.5% | 161,236 | 58.7% | 273,882 | 58.0% | ||||||||||||||||||
| Acquisition-related expenses |
13,341 | 9.4% | — | — | — | — | ||||||||||||||||||
|
|
|
|
|
|
|
|
|
|
|
|
|
|||||||||||||
| Operating income |
4,197 | 2.9% | 12,320 | 4.5% | 48,584 | 10.3% | ||||||||||||||||||
| Interest expense |
4,599 | 3.2% | 7,922 | 2.9% | 13,630 | 2.9% | ||||||||||||||||||
|
|
|
|
|
|
|
|
|
|
|
|
|
|||||||||||||
| Income (loss) before provision for income taxes |
(402 | ) | (0.3)% | 4,398 | 1.6% | 34,954 | 7.4% | |||||||||||||||||
| Provision (benefit) for income taxes |
1,499 | 1.0% | 1,541 | 0.6% | 12,924 | 2.7% | ||||||||||||||||||
|
|
|
|
|
|
|
|
|
|
|
|
|
|||||||||||||
| Net income (loss) |
$ | (1,901 | ) | (1.3)% | $ | 2,857 | 1.0% | $ | 22,030 | 4.7% | ||||||||||||||
|
|
|
|
|
|
|
|
|
|
|
|
|
|||||||||||||
Net Sales
Net sales were $472.1 million for the thirty-nine weeks ended October 29, 2016, compared to $141.9 million for the Predecessor period from February 1, 2015 to May 7, 2015 (the “2015 Predecessor Period”) and $274.7 million for the Successor period from May 8, 2015 to October 31, 2015 (the “2015 Interim Successor Period”). This increase was due to an increase in total comparable company sales, primarily driven by an increase in our active customer base in the thirty-nine weeks ended October 29, 2016.
Our direct channel was responsible for 37% of our net sales for the 2015 Predecessor Period, 38% in the 2015 Interim Successor Period, and 41% in the thirty-nine weeks ended October 29, 2016. Our retail channel was responsible for 63% of our net sales for the 2015 Predecessor Period, 62% in the 2015 Interim Successor Period, and 59% in the thirty-nine weeks ended October 29, 2016. At the end of those same periods, we operated 250, 260, and 271 retail stores, respectively.
62
Table of Contents
Gross Profit and Cost of Goods Sold
Gross profit was $322.5 million for the thirty-nine weeks ended October 29, 2016, compared to $97.7 million for the 2015 Predecessor Period and $173.6 million for the 2015 Interim Successor Period. This increase was primarily due to an increase in net sales, partially offset by an increase in cost of goods sold resulting from amortizing the increase in the fair value of merchandise inventory in the 2015 Interim Successor Period as a result of the application of purchase accounting.
Selling, General and Administrative Expenses
Selling, general and administrative expenses were $273.9 million for the thirty-nine weeks ended October 29, 2016, compared to $80.2 million for the 2015 Predecessor Period and $161.2 million for the 2015 Interim Successor Period. The increase included higher sales related expenses, increased marketing costs to acquire and retain customers and increased corporate payroll and other expenses to support business growth. The increase also related to increased depreciation and amortization expense, including deferred rent amortization, due to (i) the revaluation of assets and liabilities that occurred in connection with the Acquisition, (ii) increased capital spending in stores as a result of opening new stores and remodeling existing stores, and (iii) increased capital spending on information systems, primarily due to the implementation of a new merchandising system. The selling, general and administrative expenses increases were partially offset by lower equity-based compensation due to a change in our equity-based compensation plan following the Acquisition compared to the plan that was in place prior to the Acquisition.
As a percentage of net sales, selling, general and administrative expenses were 58.0% for the thirty-nine weeks ended October 29, 2016, compared to 56.5% for the 2015 Predecessor Period and 58.7% for the 2015 Interim Successor Period.
Acquisition-Related Expenses
We incurred expenses related to the Acquisition of $13.3 million during the 2015 Predecessor Period, consisting primarily of legal and advisory fees. No such costs were incurred during the 2015 Interim Successor Period or the thirty-nine weeks ended October 29, 2016.
Interest Expense
Interest expense was $13.6 million for the thirty-nine weeks ended October 29, 2016, compared to $4.6 million for the 2015 Predecessor Period and $7.9 million for the 2015 Interim Successor Period. This increase is due to the addition of $40.0 million to our Term Loan pursuant to an amendment on May 27, 2016.
Provision for Income Taxes
The provision for income taxes was $12.9 million for the thirty-nine weeks ended October 29, 2016, compared to $1.5 million for the 2015 Predecessor Period and $1.5 million for the 2015 Interim Successor Period. Our effective tax rate for the same periods was 37.0%, (372.9%) and 35.0%, respectively. The disparity in the 2015 Predecessor Period was due to lower income (loss) before provision for income taxes as a result of the inclusion of certain expenses related to the Acquisition in that period, which are not deductible for tax purposes.
63
Table of Contents
Period from February 1, 2015 to May 7, 2015 (Predecessor) and Period from May 8, 2015 through January 30, 2016 (Successor) Compared to the Fiscal Year Ended January 31, 2015 (Predecessor)
The following table summarizes our consolidated results of operations for the periods indicated:
| Predecessor | Successor | |||||||||||||||||||||||
| For the Fiscal Year ended January 31, 2015 |
For the Period February 1, 2015 to May 7, 2015 |
For the Period May 8, 2015 to January 30, 2016 |
||||||||||||||||||||||
| (in thousands) |
Dollars |
% of Net |
Dollars |
% of Net |
Dollars |
% of Net |
||||||||||||||||||
| Net sales |
$ | 483,400 | 100.0% | $ | 141,921 | 100.0% | $ | 420,094 | 100.0% | |||||||||||||||
| Costs of goods sold |
164,792 | 34.1% | 44,232 | 31.2% | 155,091 | 36.9% | ||||||||||||||||||
|
|
|
|
|
|
|
|
|
|
|
|
|
|||||||||||||
| Gross profit |
318,608 | 65.9% | 97,689 | 68.8% | 265,003 | 63.1% | ||||||||||||||||||
| Selling, general and administrative expenses |
279,557 | 57.8% | 80,151 | 56.5% | 246,482 | 58.7% | ||||||||||||||||||
| Acquisition-related expenses |
— | — | 13,341 | 9.4% | — | — | ||||||||||||||||||
|
|
|
|
|
|
|
|
|
|
|
|
|
|||||||||||||
| Operating income |
39,051 | 8.1% | 4,197 | 2.9% | 18,521 | 4.4% | ||||||||||||||||||
| Interest expense |
17,895 | 3.7% | 4,599 | 3.2% | 11,893 | 2.8% | ||||||||||||||||||
|
|
|
|
|
|
|
|
|
|
|
|
|
|||||||||||||
| Income (loss) before provision for income taxes |
21,156 | 4.4% | (402 | ) | (0.3)% | 6,628 | 1.6% | |||||||||||||||||
| Provision for income taxes |
10,860 | 2.3% | 1,499 | 1.0% | 2,322 | 0.6% | ||||||||||||||||||
|
|
|
|
|
|
|
|
|
|
|
|
|
|||||||||||||
| Net income (loss) |
$ | 10,296 | 2.1% | $ | (1,901 | ) | (1.3)% | $ | 4,306 | 1.0% | ||||||||||||||
|
|
|
|
|
|
|
|
|
|
|
|
|
|||||||||||||
Net Sales
Net sales were $141.9 million for the Predecessor period from February 1, 2015 to May 7, 2015 (the “2015 Predecessor Period”) and $420.1 million for the Successor period from May 8, 2015 to January 30, 2016 (the “2015 Successor Period”), compared to $483.4 million for the Predecessor fiscal year ended January 31, 2015 (“fiscal year 2014”). At the end of those same periods, we operated 250, 261, and 248 retail stores, respectively.
Our direct channel was responsible for 39% of our net sales in fiscal year 2014, 37% in the 2015 Predecessor Period, and 41% in the 2015 Successor Period. Our retail channel was responsible for 61% of our net sales in fiscal year 2014, 63% in the 2015 Predecessor Period, and 59% in the 2015 Successor Period. The increase in net sales was due to an increase in total comparable company sales, primarily driven by an increase in our active customer base.
Gross Profit and Cost of Goods Sold
Gross profit was $97.7 million for the 2015 Predecessor Period and $265.0 million for the 2015 Successor Period, compared to $318.6 million for fiscal year 2014. The increase was primarily due to an increase in net sales partially offset by an increase in cost of goods sold during the 2015 Successor Period resulting from the amortization of the step-up to fair value of merchandise inventory resulting from the application of a purchase accounting adjustment related to the Acquisition.
Selling, General and Administrative Expenses
Selling, general and administrative expenses were $80.2 million for the 2015 Predecessor Period and $246.5 million for the 2015 Successor Period, compared to $279.6 million for fiscal year 2014. The increase included higher sales related expenses, increased marketing costs to acquire and retain customers and increased corporate payroll and other expenses to support business growth. The increase also reflects increased depreciation and amortization expense, including deferred rent amortization, due to (i) the revaluation of assets
64
Table of Contents
and liabilities that occurred in connection with the Acquisition, (ii) increased capital spending in stores as a result of opening new stores and remodeling existing stores, and (iii) increased capital spending on information systems primarily due to the implementation of a new merchandising system. This increase also includes an increase in incentive compensation expense driven by the improved performance of our business.
As a percentage of net sales, selling, general and administrative expenses were 56.5% for the 2015 Predecessor Period and 58.7% for the 2015 Successor Period, compared to 57.8% for fiscal year 2014.
Acquisition-Related Expenses
We incurred acquisition-related expenses of $13.3 million during the 2015 Predecessor Period, consisting primarily of legal and advisory fees. No such costs were incurred during the 2015 Successor Period or fiscal year 2014.
Interest Expense
Interest expense was $4.6 million for the 2015 Predecessor Period and $11.9 million for the 2015 Successor Period, compared to $17.9 million for fiscal year 2014. In fiscal year 2014, our interest expense was higher due to voluntary prepayments on our predecessor term loan facility, which accelerated the amortization of deferred financing costs. During the 2015 Successor Period, interest incurred on debt decreased as a result of a decrease in the weighted average interest rate and lower amortization of deferred financing costs, offset by an increase in debt.
Provision for Income Taxes
The provision for income taxes was $1.5 million for the 2015 Predecessor Period and $2.3 million for the 2015 Successor Period, compared to $10.9 million for fiscal year 2014. Our effective tax rates for the same periods were (372.9)%, 35.0% and 51.3%, respectively. The decrease in provision for income taxes was primarily due to lower income (loss) before provision for income taxes for the 2015 Predecessor Period as a result of the inclusion of certain expenses related to the Acquisition in that period.
Supplemental Pro Forma Fiscal Year Ended January 30, 2016 Compared to Fiscal Year Ended January 31, 2015 (Predecessor)
In addition to the historical analysis of results of operations for the audited historical statements of operations presented for fiscal year 2014, the 2015 Predecessor Period and the 2015 Successor Period, we have also presented a supplemental unaudited pro forma consolidated statement of operations for the fiscal year ended January 30, 2016 (“pro forma fiscal year 2015”).
The unaudited consolidated statement of operations for pro forma fiscal year 2015 was derived from our historical audited statements of operations included elsewhere in this prospectus. The unaudited pro forma consolidated statement of operations gives effect to (i) the Acquisition, (ii) the related financing as provided for under our Term Loan for $250.0 million and our ABL Facility of $40.0 million (the “Financing”), (iii) the Corporate Conversion and the Parent Merger and (iv) the distribution of our common stock by JJill Topco Holdings to its partners that hold vested and unvested JJill Topco Holdings Common Interests in accordance with its limited partnership agreement (where holders of vested and unvested Common Interests will receive a pro rata distribution of vested and unvested J.Jill, Inc. common stock, equal to their fair value of Common Interests immediately prior to the distribution, resulting in no incremental fair value), upon completion of this offering, as if they were entered into on February 1, 2015. The historical financial information has been adjusted to give effect to the pro forma adjustments that are (i) directly attributed to the Acquisition and related Financing, (ii) factually supportable and (iii) expected to have a continuing impact on the consolidated statement of operations.
65
Table of Contents
The unaudited consolidated pro forma fiscal year 2015 statement of operations has been prepared in accordance with Article 11 of Regulation S-X. Although this presentation is not prepared in accordance with GAAP, we believe this information provides a meaningful comparison of our performance for our unaudited pro forma fiscal year 2015 as compared to fiscal year 2014. Management believes the assumptions applied to these adjustments are reasonable based on available information. The unaudited pro forma consolidated statement of operations is presented for informational purposes only and is not necessarily indicative of the results of operations that would have been reported had the Acquisition and related transactions occurred on February 1, 2015, or indicative of results of operations expected to occur in the future. This unaudited pro forma information should be read in conjunction with “Unaudited Pro Forma Consolidated Financial Information,” “Selected Historical Financial Information,” “—Predecessor Period from February 1, 2015 to May 7, 2015 and Successor Period from May 8, 2015 to January 30, 2016 Compared to the Fiscal Year Ended January 31, 2015 (Predecessor)” and our historical audited consolidated financial statements included elsewhere in this prospectus.
The following table summarizes our consolidated results of operations for the periods indicated:
| Predecessor |
Pro Forma |
Change from Fiscal |
||||||||||||||||||||||
| For the Fiscal January 31, 2015 |
For the Fiscal January 30, 2016 |
|||||||||||||||||||||||
| (in thousands) |
Dollars |
% of Net |
Dollars |
% of Net |
$ Change |
% Change |
||||||||||||||||||
| Net sales |
$ | 483,400 | 100.0% | $ | 562,015 | 100.0% | $ | 78,615 | 16.3% | |||||||||||||||
| Costs of goods sold |
164,792 | 34.1% | 188,852 | 33.6% | 24,060 | 14.6% | ||||||||||||||||||
|
|
|
|
|
|
|
|
|
|
|
|||||||||||||||
| Gross profit |
318,608 | 65.9% | 373,163 | 66.4% | 54,555 | 17.1% | ||||||||||||||||||
| Selling, general and administrative expenses |
279,557 | 57.8% | 331,752 | 59.0% | 52,195 | 18.7% | ||||||||||||||||||
|
|
|
|
|
|
|
|
|
|
|
|||||||||||||||
| Operating income |
39,051 | 8.1% | 41,411 | 7.4% | 2,360 | 6.0% | ||||||||||||||||||
| Interest expense |
17,895 | 3.7% | 16,893 | 3.0% | (1,002 | ) | (5.6)% | |||||||||||||||||
|
|
|
|
|
|
|
|
|
|
|
|||||||||||||||
| Income before provision for income taxes |
21,156 | 4.4% | 24,518 | 4.4% | 3,362 | 15.9% | ||||||||||||||||||
| Provision for income taxes |
10,860 | 2.3% | 10,223 | 1.8% | (637 | ) | (5.9)% | |||||||||||||||||
|
|
|
|
|
|
|
|
|
|
|
|||||||||||||||
| Net income |
$ | 10,296 | 2.1% | $ | 14,295 | 2.6% | $ | 3,999 | 38.8% | |||||||||||||||
|
|
|
|
|
|
|
|
|
|
|
|||||||||||||||
Net Sales
Net sales for pro forma fiscal year 2015 increased $78.6 million, or 16.3%, to $562.0 million, from $483.4 million for fiscal year 2014. This increase was primarily due to an increase in total comparable company sales of 12.4%, which was driven by an 11.6% increase in our active customer base. Our direct channel was responsible for 40% of our net sales in pro forma fiscal year 2015, an increase from 39% in fiscal year 2014. Our retail channel was responsible for 60% of our net sales in pro forma fiscal year 2015 and 61% in fiscal year 2014. At the end of those same periods, we operated 261 and 248 retail stores, respectively.
Gross Profit and Cost of Goods Sold
Gross profit for pro forma fiscal year 2015 increased $54.6 million, or 17.1%, to $373.2 million, from $318.6 million for fiscal year 2014. This increase was due primarily to the increase in net sales of 16.3%. The balance of the increase reflects gross margin for pro forma fiscal year 2015 increasing to 66.4% from 65.9% for fiscal year 2014. The increased gross margin was primarily due to supply chain efficiencies.
Selling, General and Administrative Expenses
Selling, general and administrative expenses for pro forma fiscal year 2015 increased $52.2 million, or 18.7%, to $331.8 million from $279.6 million for fiscal year 2014. As a percentage of net sales, selling, general
66
Table of Contents
and administrative expenses for pro forma fiscal year 2015 were 59.0% as compared to 57.8% for fiscal year 2014. These increases related to higher sales related expenses of $16.6 million, increased marketing costs of $7.6 million and increased corporate payroll and other expenses of $5.3 million to support business growth. The increase also related to increased depreciation and amortization expense of $22.6 million, including deferred rent amortization, due to (i) the revaluation of assets and liabilities that occurred in connection with the Acquisition, (ii) increased capital spending in stores as a result of opening new stores and remodeling existing stores, and (iii) increased capital spending on information systems primarily due to the implementation of a new merchandising system. Further, incentive compensation expenses increased $4.7 million, driven by improved performance of the business, offset by an equity-based compensation decrease of $4.5 million due to the implementation of a new equity-based compensation plan following the Acquisition compared to the plan that was in place prior to the Acquisition.
Interest Expense
Interest expense for pro forma fiscal year 2015 decreased by $1.0 million, or 5.6%, to $16.9 million from $17.9 million for fiscal year 2014. The decrease in interest expense was due to a decrease in the weighted average interest rate to 6.1% from 15.4% and lower amortization of deferred financing costs. In fiscal year 2014, we incurred additional amortization resulting from voluntary prepayments on our predecessor term loan facility, which accelerated the amortization of deferred financing costs. The decrease in interest expense was partially offset by an increase in average debt outstanding, to $249.4 million during pro forma fiscal year 2015 from $97.3 million in fiscal year 2014.
The average debt balance and weighted average interest rates for pro forma fiscal year 2015 assume our Term Loan and ABL Facility were entered into on February 1, 2015. See “Unaudited Pro Forma Consolidated Financial Information,” “—Factors Affecting the Comparability of our Results of Operations—Acquisition,” “—Liquidity and Capital Resources—Credit Facilities” elsewhere in this prospectus for additional information regarding our Term Loan and ABL Facility and the Acquisition.
Provision for Income Taxes
The provision for income taxes for pro forma fiscal year 2015 decreased by $0.6 million, or 5.9%, to $10.2 million from $10.9 million for fiscal year 2014. Our effective tax rate was 41.7% for pro forma fiscal year 2015 and 51.3% for fiscal year 2014. This decrease in the effective rate was due to the higher amount of non-deductible equity-based compensation expenses in fiscal year 2014 compared to pro forma fiscal year 2015.
67
Table of Contents
Fiscal Year Ended January 31, 2015 (Predecessor) Compared to Fiscal Year Ended February 1, 2014 (Predecessor)
The following table summarizes our consolidated results of operations for the periods indicated:
| Predecessor |
Change from Fiscal Year |
|||||||||||||||||||||||
| For the Fiscal
Year |
For the Fiscal
Year |
|||||||||||||||||||||||
| (in thousands) |
Dollars |
% of Net |
Dollars |
% of Net |
$ Change |
% Change |
||||||||||||||||||
| Net sales |
$ | 456,026 | 100.0% | $ | 483,400 | 100.0% | $ | 27,374 | 6.0% | |||||||||||||||
| Costs of goods sold |
161,261 | 35.4% | 164,792 | 34.1% | 3,531 | 2.2% | ||||||||||||||||||
|
|
|
|
|
|
|
|
|
|
|
|||||||||||||||
| Gross profit |
294,765 | 64.6% | 318,608 | 65.9% | 23,843 | 8.1% | ||||||||||||||||||
| Selling, general and administrative expenses |
267,319 | 58.6% | 279,557 | 57.8% | 12,238 | 4.6% | ||||||||||||||||||
|
|
|
|
|
|
|
|
|
|
|
|||||||||||||||
| Operating income |
27,446 | 6.0% | 39,051 | 8.1% | 11,605 | 42.3% | ||||||||||||||||||
| Interest expense |
19,064 | 4.2% | 17,895 | 3.7% | (1,169 | ) | (6.1)% | |||||||||||||||||
|
|
|
|
|
|
|
|
|
|
|
|||||||||||||||
| Income before provision for income taxes |
8,382 | 1.8% | 21,156 | 4.4% | 12,774 | 152.4% | ||||||||||||||||||
| Provision for income taxes |
3,884 | 0.8% | 10,860 | 2.3% | 6,976 | 179.6% | ||||||||||||||||||
|
|
|
|
|
|
|
|
|
|
|
|||||||||||||||
| Net income |
$ | 4,498 | 1.0% | $ | 10,296 | 2.1% | $ | 5,798 | 128.9% | |||||||||||||||
|
|
|
|
|
|
|
|
|
|
|
|||||||||||||||
Net Sales
Net sales for fiscal year 2014 increased $27.4 million, or 6.0%, to $483.4 million, from $456.0 million for fiscal year ended February 1, 2014 (“fiscal year 2013”). This increase was primarily due to an increase in total comparable company sales of 5.4%, driven by an increase in the average net sales per customer. Our direct channel was responsible for 39% of our net sales in both fiscal year 2014 and fiscal year 2013. Our retail channel was responsible for 61% of our net sales in both fiscal year 2014 and fiscal year 2013. At the end of those same periods, we operated 248 and 234 retail stores, respectively.
Gross Profit and Cost of Goods Sold
Gross profit for fiscal year 2014 increased $23.8 million, or 8.1%, to $318.6 million, from $294.8 million for fiscal year 2013. This increase was due primarily to the increase in net sales of 6.0%. The balance of the increase reflects gross margin for fiscal year 2014 increasing to 65.9% from 64.6% for fiscal year 2013. The increased gross margin was primarily due to a reduction in promotional markdowns.
Selling, General and Administrative Expenses
Selling, general and administrative expenses for fiscal year 2014 increased $12.2 million, or 4.6%, to $279.6 million from $267.3 million for fiscal year 2013. The increase included higher sales related expenses of $6.1 million and increased incentive and equity-based compensation expenses of $5.0 million due primarily to improved performance, as well as increased corporate payroll and other expenses of $3.8 million and increased marketing costs of $1.8 million to support the growth of the business. These increases were partially offset by decreased depreciation and amortization expense of $3.9 million, resulting from certain fixed assets becoming fully-depreciated during fiscal year 2014. As a percentage of net sales, selling, general and administrative expenses for fiscal year 2014 were 57.8% as compared to 58.6% for fiscal year 2013. This rate reduction was due primarily to gaining efficiencies on increased sales and the associated leveraging of fixed costs.
68
Table of Contents
Interest Expense
Interest expense for fiscal year 2014 decreased by $1.2 million, or 6.1%, to $17.9 million, from $19.1 million for fiscal year 2013. Interest incurred on debt decreased by $0.6 million, resulting from a decrease in average debt from $97.3 million during fiscal year 2014 compared to $107.0 million for fiscal year 2013 as a result of scheduled payments and voluntary prepayments on our predecessor term loan facility in fiscal year 2014. This was partially offset by an increase in the weighted average interest rate to 15.4% compared to 14.5% during the same periods.
Provision for Income Taxes
The provision for income taxes for fiscal year 2014 increased by $7.0 million, or 179.6%, to $10.9 million from $3.9 million for fiscal year 2013 due to the improved performance of our business. Our effective tax rate was 51.3% and 46.3% for fiscal year 2014 and fiscal year 2013, respectively. This increase in the effective rate was due to a higher amount of non-deductible equity-based compensation expenses in fiscal year 2014.
69
Table of Contents
Quarterly Results
The following table sets forth our historical consolidated statements of income for each of the eleven fiscal quarters through the thirteen weeks ended October 29, 2016. This unaudited quarterly information has been prepared on the same basis as our annual audited consolidated financial statements included elsewhere in this prospectus and includes all adjustments, consisting of only normal recurring adjustments, that we consider necessary to fairly present the financial information for the fiscal quarters presented below. The unaudited quarterly data below should be read in conjunction with our audited and unaudited consolidated financial statements and the related notes thereto included elsewhere in this prospectus.
| Predecessor | Successor | |||||||||||||||||||||||||||||||||||||||||||||||
| Fiscal Year 2014 |
Fiscal Year 2015 | Fiscal Year 2016 |
||||||||||||||||||||||||||||||||||||||||||||||
| Thirteen weeks ended |
|
Period May 7, |
Period |
Thirteen weeks ended | ||||||||||||||||||||||||||||||||||||||||||||
| May 3, |
August 2, |
November 1, |
January 31, |
May 2, |
October 31, |
January 30, |
April 30, |
July 30, |
October 29, |
|||||||||||||||||||||||||||||||||||||||
| (in thousands, |
||||||||||||||||||||||||||||||||||||||||||||||||
| Net sales |
$ | 106,857 | $ | 121,890 | $ | 125,710 | $ | 128,943 | $ | 132,552 | $ | 9,369 | $ | 132,112 | $ | 142,629 | $ | 145,353 | $ | 147,665 | $ | 165,035 | $ | 159,439 | ||||||||||||||||||||||||
| Costs of goods sold |
33,680 | 40,133 | 41,021 | 49,958 | 42,156 | 2,076 | 54,468 | 46,717 | 53,906 | 46,159 | 52,179 | 51,335 | ||||||||||||||||||||||||||||||||||||
|
|
|
|
|
|
|
|
|
|
|
|
|
|
|
|
|
|
|
|
|
|
|
|
|
|||||||||||||||||||||||||
| Gross profit |
73,177 | 81,757 | 84,689 | 78,985 | 90,396 | 7,293 | 77,644 | 95,912 | 91,447 | 101,506 | 112,856 | 108,104 | ||||||||||||||||||||||||||||||||||||
| Selling, general and administrative expenses |
66,078 | 67,604 | 71,938 | 73,937 | 74,946 | 5,205 | 75,276 | 85,960 | 85,246 | 87,072 | 94,173 | 92,637 | ||||||||||||||||||||||||||||||||||||
| Acquisition-related expenses |
— | — | — | — | — | 13,341 | — | — | — | — | — | — | ||||||||||||||||||||||||||||||||||||
|
|
|
|
|
|
|
|
|
|
|
|
|
|
|
|
|
|
|
|
|
|
|
|
|
|||||||||||||||||||||||||
| Operating income (loss) |
7,099 | 14,153 | 12,751 | 5,048 | 15,450 | (11,253 | ) | 2,368 | 9,952 | 6,201 | 14,434 | 18,683 | 15,467 | |||||||||||||||||||||||||||||||||||
| Interest expense |
4,491 | 4,631 | 4,492 | 4,281 | 4,335 | 264 | 3,902 | 4,020 | 3,971 | 4,112 | 4,674 | 4,844 | ||||||||||||||||||||||||||||||||||||
|
|
|
|
|
|
|
|
|
|
|
|
|
|
|
|
|
|
|
|
|
|
|
|
|
|||||||||||||||||||||||||
| Income (loss) before provision (benefit) for income taxes |
2,608 | 9,522 | 8,259 | 767 | 11,115 | (11,517 | ) | (1,534 | ) | 5,932 | 2,230 | 10,322 | 14,009 | 10,623 | ||||||||||||||||||||||||||||||||||
| Provision (benefit) for income taxes |
1,339 | 4,888 | 4,239 | 394 | 790 | 709 | (538 | ) | 2,079 | 781 | 4,249 | 5,860 | 2,815 | |||||||||||||||||||||||||||||||||||
|
|
|
|
|
|
|
|
|
|
|
|
|
|
|
|
|
|
|
|
|
|
|
|
|
|||||||||||||||||||||||||
| Net income (loss) |
$ | 1,269 | $ | 4,634 | $ | 4,020 | $ | 373 | $ | 10,325 | $ | (12,226 | ) | $ | (996 | ) | $ | 3,853 | $ | 1,449 | $ | 6,073 | $ | 8,149 | $ | 7,808 | ||||||||||||||||||||||
|
|
|
|
|
|
|
|
|
|
|
|
|
|
|
|
|
|
|
|
|
|
|
|
|
|||||||||||||||||||||||||
| Total Company Comparable Sales |
(2.4 | %) | 5.0 | % | 7.3 | % | 11.1 | % | 20.1 | % | * | * | 9.6 | % | 8.6 | % | 10.9 | % | 13.1 | % | 10.0 | % | ||||||||||||||||||||||||||
| * | We do not calculate total company comparable sales for the period from May 3, 2015 to May 7, 2015 and the period from May 8, 2015 to August 1, 2015 as they do not present a meaningful comparison to our other periods. |
Liquidity and Capital Resources
General
Our primary sources of liquidity and capital resources are cash generated from operating activities and availability under our ABL Facility. Our primary requirements for liquidity and capital are working capital and general corporate needs, including merchandise inventories, marketing, including catalog production and distribution, payroll, store occupancy costs and capital expenditures associated with opening new stores, remodeling existing stores and upgrading information systems. Additional future liquidity needs will include costs of operating as a public company.
70
Table of Contents
We believe that our current sources of liquidity and capital will be sufficient to finance our continued operations, growth strategy and additional expenses we expect to incur as a public company for at least the next 12 months. There can be no assurance, however, that our business will generate sufficient cash flows from operations or that future borrowings will be available under our ABL Facility or otherwise to enable us to service our indebtedness, or to make capital expenditures in the future. Our future operating performance and our ability to service or extend our indebtedness will be subject to future economic conditions and to financial, business, and other factors, many of which are beyond our control.
Capital expenditures were $7.4 million during the 2015 Predecessor Period, $26.6 million during the 2015 Successor Period, $34.0 million during pro forma fiscal year 2015 and $24.1 million during fiscal year 2014. The increase in capital expenditures was due primarily to an increase in the remodeling of stores and investment in information systems. We currently expect that our capital expenditures for fiscal year 2016 will be approximately $40.0 million including approximately $12.0 million for construction of new stores, $15.0 million for remodeling of existing stores and $13.0 million for investments in information technology. During the thirty-nine weeks ended October 29, 2016 capital expenditures totaled $25.7 million.
Cash Flow Analysis
The following table shows our cash flows information for the periods presented:
| Fiscal Periods | Interim Periods | |||||||||||||||||||||||||||
| Predecessor | Successor |
Predecessor |
Successor | |||||||||||||||||||||||||
| For the |
For the |
For
the |
For
the |
For the |
For
the |
For the Thirty-Nine Weeks |
||||||||||||||||||||||
| (in thousands) |
(unaudited) | (unaudited) | ||||||||||||||||||||||||||
| Net cash provided by operating activities |
$ | 45,293 | $ | 41,374 | $ | 5,733 | $ | 50,562 | $ | 5,733 | $ | 18,932 | $ | 36,971 | ||||||||||||||
| Net cash used in investing activities |
(27,419 | ) | (24,143 | ) | (7,406 | ) | (412,303 | ) | (7,406 | ) | (403,613 | ) | (25,706 | ) | ||||||||||||||
| Net cash (used in) provided by financing activities |
(18,029 | ) | (17,145 | ) | 1,604 | 389,246 | 1,604 | 389,871 | (33,815 | ) | ||||||||||||||||||
Net Cash provided by (used in) Operating Activities
Net cash provided by operating activities during the thirty-nine weeks ended October 29, 2016 was $37.0 million. Key elements of cash provided by operating activities were (i) net income of $22.0 million, (ii) adjustments to reconcile net income to net cash provided by operating activities of $29.6 million, primarily driven by depreciation and amortization, and (iii) an increase in net operating assets and liabilities of $14.7 million, primarily driven by increases in inventories and accounts receivable, which was partially offset by increases in accrued expenses and other noncurrent liabilities.
Net cash provided by operating activities during the 2015 Interim Successor Period was $18.9 million. Key elements of cash provided by operating activities were (i) net income of $2.9 million, (ii) adjustments to reconcile net loss to net cash provided by operating activities of $34.8 million, primarily driven by depreciation and amortization and amortization of the step-up to fair value of merchandise inventory resulting from the application of a purchase accounting adjustment related to the Acquisition, and (iii) an increase in net operating assets and liabilities of $18.7 million, primarily due to increases in taxes receivable, inventories and prepaid expenses and other current assets, partially offset by increases in accrued expenses and other noncurrent liabilities.
71
Table of Contents
Net cash provided by operating activities during the 2015 Successor Period was $50.6 million. Key elements of cash provided by operating activities were (i) net income of $4.3 million, (ii) adjustments to reconcile net income to net cash provided by operating activities of $36.4 million, primarily driven by depreciation and amortization and amortization of the step-up to fair value of merchandise inventory resulting from the application of a purchase accounting adjustment related to the Acquisition, and (iii) a decrease in net operating assets and liabilities and other activities of $9.9 million, primary due to a decrease in accounts receivable and an increase in accounts payable as well as an increase in accrued incentive plan expenses resulting from increased earnings, partially offset by increases in taxes receivable, prepaid expenses, and other current assets.
Net cash provided by operating activities during the 2015 Predecessor Period was $5.7 million. Key elements of cash provided by operating activities were (i) net loss of $1.9 million, (ii) adjustments to reconcile net loss to net cash provided by operating activities of $6.7 million, which primarily consisted of depreciation and amortization, and payment-in-kind interest on debt, and (iii) a decrease in net operating assets and liabilities and other activities of $0.9 million, primarily driven by accrued Acquisition expenses paid at the Acquisition date, partially offset by a decrease in accounts payable and increases in accounts receivable and inventories.
Net cash provided by operating activities during fiscal year 2014 was $41.4 million. Key elements of cash provided by operating activities were (i) net income of $10.3 million, (ii) adjustments to reconcile net income to net cash provided by operating activities of $28.8 million, primarily driven by depreciation and amortization, payment-in-kind interest, and equity-based compensation charges, and (iii) a decrease in net operating assets and liabilities of $2.3 million, largely due to an increase in accrued expenses and an increase in accounts payable partially offset by increases in inventories and accounts receivable.
Net cash provided by operating activities during fiscal year 2013 was $45.3 million. Key elements of cash provided by operating activities were (i) net income of $4.5 million, (ii) adjustments to reconcile net income to net cash provided by operating activities of $27.1 million, primarily driven by depreciation and amortization and payment-in-kind interest on debt, and (iii) a decrease in net operating assets and liabilities and other activities of $13.7 million, largely due to an increase in accounts payable partially offset by increases in inventories and prepaid assets and a decrease in accrued taxes payable.
Net Cash used in Investing Activities
Net cash used in investing activities during the thirty-nine weeks ended October 29, 2016 was $25.7 million, representing purchases of property and equipment related to new store openings, remodeling existing stores, and upgrading our information systems, including our merchandising system.
Net cash used in investing activities during the 2015 Interim Successor Period was $403.6 million, consisting of $385.7 million of cash paid in connection with the Acquisition, net of cash received, and $17.9 million of purchases of property and equipment related to new store openings, remodeling existing stores and upgrading our information systems, including our merchandising system.
Net cash used in investing activities during the 2015 Successor Period was $412.3 million, consisting of the $385.7 million of cash paid in connection with the Acquisition, net of cash received, and $26.6 million of purchases of property and equipment to new store openings, remodeling existing stores and upgrading our information systems, including our merchandising system.
Net cash used in investing activities during the 2015 Predecessor Period was $7.4 million, consisting of purchases of property and equipment related to new store openings, remodeling existing stores and upgrading our information systems, including our merchandising system.
Net cash used in investing activities during fiscal year 2014 was $24.1 million, representing purchases of property and equipment related to new store openings, remodeling existing stores and upgrading our information systems infrastructure and select software.
72
Table of Contents
Net cash used in investing activities during fiscal year 2013 was $27.4 million, representing purchases of property and equipment related to new store openings, remodeling existing stores and upgrading our information systems infrastructure and select software.
Net Cash (used in) provided by Financing Activities
Net cash used in financing activities during the thirty-nine weeks ended October 29, 2016 was $33.8 million, including $38.3 million of proceeds received on long-term debt, net of $1.7 million debt issuance costs paid. The proceeds from the long-term debt, along with cash on hand, were used to fund a $70.0 million dividend to the partners of JJill Topco Holdings. Financing activities also included $2.1 million of scheduled repayments on our Term Loan.
Net cash provided by financing activities during the 2015 Interim Successor Period was $389.9 million, primarily consisting of $240.4 million of proceeds from borrowings under our Term Loan, net of $9.6 million debt issuance costs paid, and $160.5 million of equity proceeds, both incurred in connection with the Acquisition. Financing activities also included an $8.6 million distribution to JJill Topco Holdings as reimbursement for Acquisition-related costs.
Net cash provided by financing activities during the 2015 Successor Period was $389.2 million, primarily consisting of $240.4 million of proceeds from borrowings under our Term Loan, net of $9.6 million debt issuance costs paid, and $160.5 million of equity proceeds, both incurred in connection with the Acquisition. Financing activities also included an $8.6 million distribution to JJill Topco Holdings as reimbursement for Acquisition-related costs and $1.3 million of scheduled repayments of our Term Loan.
Net cash provided by financing activities during the 2015 Predecessor Period was $1.6 million, consisting of $7.3 million of net proceeds from borrowings on our previous revolving credit facility in excess of repayments, which was partially offset by $5.0 million of prepayments and $0.7 million of scheduled repayments on our predecessor term loans.
Net cash used in financing activities during fiscal year 2014 was $17.1 million, consisting of the use of cash from operations to make voluntary prepayments and scheduled payments of our predecessor term loans.
Net cash used in financing activities during fiscal year 2013 was $18.0 million consisting of the use of cash from operations to make voluntary prepayments and scheduled payments of our predecessor term loans.
Dividends
On June 6, 2016, we paid a $70.0 million dividend to the partners of JJill Topco Holdings.
After completion of this offering, we intend to retain any future earnings for use in the operation and growth of our business, and therefore we do not anticipate paying any cash dividends in the foreseeable future. See “Dividend Policy” elsewhere in this prospectus for additional information regarding dividends.
Credit Facilities
As described above, we entered into our Term Loan and ABL Facility in connection with the Acquisition. Concurrently, we repaid the principal and interest balances outstanding under our previous credit facilities, as required by the respective agreements upon a change-in-control transaction. The following describes the credit facilities entered into in connection with the Acquisition.
On May 8, 2015, we entered into the seven-year Term Loan of $250.0 million in conjunction with the Acquisition. Obligations under the Term Loan are guaranteed by all of our current and future domestic restricted subsidiaries, subject to certain exceptions. Our borrowings under the Term Loan are secured by (i) first-priority liens on substantially all assets other than the ABL Priority Collateral (as defined below) and (ii) second-priority
73
Table of Contents
liens on the ABL Priority Collateral, in each case subject to permitted liens and certain exceptions. The Term Loan contains certain terms and conditions which require us to comply with financial and other covenants, including certain restrictions on our ability to incur additional indebtedness, create liens, enter into transactions with affiliates, transfer assets, pay dividends, cause our subsidiaries to pay dividends to us, consolidate or merge with other entities or undergo a change in control, make advances, investments and loans and modify our organizational documents. The financial covenants requiring us to comply with a maximum leverage ratio and limiting our capital expenditures are considered by us to be the covenants which are currently the most restrictive. The maximum leverage ratio covenant requires us not to exceed, with respect to the four quarter period ending October 31, 2016, a ratio of consolidated debt (net of unrestricted cash) to Adjusted EBITDA (subject to certain adjustments under the Term Loan) of 5.0 to 1.0, which steps down to 3.0 to 1.0 over time. The Term Loan contains a financial covenant limiting our capital expenditures to $45.0 million for the fiscal year ending January 28, 2017 plus additional amounts as permitted, decreasing to $27.5 million per fiscal year over time. The Term Loan prohibits our ability to pay dividends to our shareholders and the ability of our subsidiaries to pay dividends to us, subject to certain exceptions. We may pay dividends, and our subsidiaries may pay dividends to us, if our leverage ratio would not exceed 2.5 to 1.0 after giving effect thereto. We may also pay dividends up to the amount of our retained excess cash flow, plus certain other amounts, if our leverage ratio would not exceed 3.25 to 1.0 after giving effect thereto. The Term Loan contains certain events of default. If a default occurs and is not cured within an applicable cure period or is not waived, our obligations under the Term Loan may be accelerated. The Term Loan allows us to elect, at our own option, the applicable interest rate for borrowings under the Term Loan using a LIBOR or Base Rate variable interest rate plus an applicable margin. LIBOR loans under the Term Loan accrue interest at a rate equal to LIBOR plus 5.00%, with a minimum LIBOR per annum of 1.00%. Base Rate loans under the Term Loan accrue interest at a rate equal to (i) the highest of (a) the prime rate, (b) the Federal Funds Effective Rate plus 0.50%, (c) LIBOR with a one-month interest period plus 1.00% and (d) 2.00%, plus (ii) 4.00%. As of October 29, 2016, we were in compliance with all financial covenants under our Term Loan.
On May 8, 2015, we also entered into the ABL Facility, our five-year secured $40.0 million asset-based revolving credit facility. Obligations under the ABL Facility are guaranteed by all of our current and future domestic restricted subsidiaries, subject to certain exceptions. Our borrowings under the ABL Facility are secured by (i) first-priority liens on accounts, inventory and certain other assets (the “ABL Priority Collateral”) and (ii) second-priority liens on substantially all other assets, in each case subject to permitted liens and certain exceptions. The ABL Facility provides for a calculated borrowing base of up to (i) 90% of the net amount of eligible credit card receivables, plus (ii) 85% of the net book value of eligible accounts receivable, plus (iii) the lesser of (A) 100% of the value of eligible inventory and (B) 90% of the net orderly liquidation value of eligible inventory, plus (iv) the least of (A) 100% of the value of eligible in-transit inventory, (B) 90% of the net orderly liquidation value of eligible in-transit inventory and (C) the in-transit maximum amount (the in-transit maximum amount is an amount not to exceed $12.5 million during the 1st and 3rd calendar quarters and $10.0 million during the 2nd and 4th calendar quarters), minus (v) the sum of certain reserves established from time to time by the administrative agent under the ABL Facility.
The ABL Facility allows us to elect, at our own option, the applicable interest rate for borrowings under the ABL Facility using a LIBOR or Base Rate variable interest rate plus an applicable margin. LIBOR loans under the ABL Facility accrue interest at a rate equal to LIBOR plus a spread ranging from 1.75% to 1.50, subject to availability. Base Rate loans under the ABL Facility accrue interest at a rate equal to (i) the highest of (a) the prime rate, (b) the overnight Federal Funds Effective Rate plus 0.50%, (c) LIBOR with a one-month interest period plus 1.00% and (d) 2.00%, plus (ii) a spread ranging from 0.50% to 0.75%, subject to availability. Principal is payable upon maturity of the ABL Facility on May 8, 2020. The ABL Facility also requires the payment of monthly fees based on the average quarterly unused portion of the commitment, as well as a fee on the balance of the outstanding letters of credit.
The ABL Facility contains certain terms and conditions which require us to comply with financial and other covenants, including certain restrictions on the ability to incur additional indebtedness, create liens, enter into
74
Table of Contents
transactions with affiliates, transfer assets, pay dividends, consolidate or merge with other entities, undergo a change in control, make advances, investments and loans or modify our organizational documents. The ABL Facility contains a financial covenant requiring us to maintain a minimum fixed charge coverage ratio of 1.0 to 1.0, with the ratio being Adjusted EBITDA (subject to certain adjustments under the ABL Facility) to fixed charges. The ABL Facility prohibits our ability to pay dividends to our shareholders and the ability of our subsidiaries to pay dividends to us, subject to certain exceptions. We may pay dividends, and our subsidiaries may pay dividends to us, if our fixed charge coverage ratio is at least 1.0 to 1.0 and our availability under the ABL Facility exceeds certain thresholds after giving effect thereto. The ABL Facility contains certain events of default. If a default occurs and is not cured within an applicable cure period or is not waived, our obligations under the ABL Facility may be accelerated. As of October 29, 2016, we were in compliance with all financial covenants under our ABL Facility.
As of January 30, 2016 and October 29, 2016 there were no amounts outstanding under the ABL Facility. Based on the borrowing terms of the ABL Facility, the maximum additional borrowing capacity at both January 30, 2016 and October 29, 2016 was $38.5 million.
On May 27, 2016, we entered into an agreement to amend our Term Loan to borrow an additional $40.0 million in additional loans, for a total of $288.1 million outstanding, to permit certain dividends and to make certain adjustments to the financial covenant. The other terms and conditions of the Term Loan remained substantially unchanged.
On January 18, 2017, we made a voluntary prepayment of $10.1 million, including accrued interest, on our Term Loan.
See our audited consolidated financial statements and Note 9 thereto for a discussion of our credit facilities prior to the Acquisition.
Contractual Obligations
We enter into long-term contractual obligations and commitments in the normal course of business. As of October 29, 2016 our outstanding contractual cash obligations were due during the periods presented below:
| Payments Due by Period |
||||||||||||||||||||
| (in thousands) |
Total |
Less than 1 |
1 - 3 years |
3 - 5 years |
More than 5 |
|||||||||||||||
| Long-Term Debt Obligations |
||||||||||||||||||||
| Principal payment obligations(1) |
$ | 286,675 | $ | 2,900 | $ | 5,800 | $ | 5,800 | $ | 272,175 | ||||||||||
| Interest expense on long-term debt(2) |
94,313 | 17,516 | 34,405 | 33,741 | 8,651 | |||||||||||||||
| Operating Lease Obligations(3) |
302,508 | 42,336 | 75,078 | 63,531 | 121,563 | |||||||||||||||
| Purchase Obligations(4) |
124,883 | 124,883 | — | — | — | |||||||||||||||
|
|
|
|
|
|
|
|
|
|
|
|||||||||||
| Total |
$ | 808,379 | $ | 187,635 | $ | 115,283 | $ | 103,072 | $ | 402,389 | ||||||||||
|
|
|
|
|
|
|
|
|
|
|
|||||||||||
| (1) | Amounts assume that the Term Loan is paid upon maturity, and the ABL Facility remains undrawn, which may or may not reflect future events. The table above includes $10.1 million of principal and interest obligations due on our Term Loan, which was voluntarily prepaid on January 18, 2017. |
| (2) | Assumes an interest rate of 6.0% per annum, consistent with the interest rate at October 29, 2016. |
| (3) | Assumes the base lease term included in our outstanding operating lease arrangements as of October 29, 2016. Our future operating lease obligations would change if we were to exercise renewal options or if we renewed existing leases or entered into new operating leases. |
| (4) | Purchase obligations represent purchase commitments on inventory that are short-term and are typically made six to nine months in advance of planned receipt. It also includes commitments related to certain selling, general and administrative expenses that are generally for periods of a year or less. |
Off Balance Sheet Arrangements
We are not a party to any off balance sheet arrangements.
75
Table of Contents
Critical Accounting Policies and Significant Estimates
Our discussion of results of operations and financial condition is based upon the consolidated financial statements and unaudited consolidated financial statements included elsewhere in this prospectus, which have been prepared in accordance with GAAP. The preparation of financial statements in conformity with GAAP requires management to make estimates and certain assumptions about future events that affect the classification and amounts reported in our consolidated financial statements and accompanying notes, including revenue and expenses, assets and liabilities, and the disclosure of contingent assets and liabilities. These estimates and assumptions are based on our historical results as well as management’s judgment. Although management believes the judgment applied in preparing estimates is reasonable based on circumstances and information known at the time, actual results could vary materially from estimates based on assumptions used in the preparation of our consolidated financial statements.
The most significant accounting estimates involve a high degree of judgment or complexity. Management believes the estimates and judgments most critical to the preparation of our consolidated financial statements and to the understanding of our reported financial results include those made in connection with revenue recognition, including accounting for gift card breakage and estimated merchandise returns; accounting for business combinations; estimating the value of inventory; impairment assessments for goodwill and other indefinite-lived intangible assets, and long-lived assets; and estimating equity-based compensation expense. Management evaluates its policies and assumptions on an ongoing basis. Our significant accounting policies related to these accounts in the preparation of our consolidated financial statements are described below (see Note 2 to our audited consolidated financial statements and Note 1 of our unaudited consolidated financial statements presented elsewhere in this prospectus for additional information regarding our critical accounting policies).
Revenue Recognition
We recognize revenue and the related cost of merchandise sold when merchandise is received by our customers. Revenue from our retail operations is recognized at the time of sale. Revenue from catalog and e-commerce sales is recognized upon receipt of merchandise by the customer. Discounts provided to customers are recorded as a reduction to sales revenue. The criteria for recognition of revenue is met when persuasive evidence that an arrangement exists, delivery of product has occurred, the price is fixed or determinable and collectability is reasonably assured. In circumstances where either title or risk of loss pass upon receipt by the customer, we defer recognition of revenue until such event occurs, based on shipping records.
At the time sales revenue is recognized, we record a reserve for merchandise returns based on prior returns experience and expected future returns in accordance with our return policy and discretionary returns practices. We monitor our returns experience and resulting reserves on an ongoing basis and we believe our estimates are reasonable. We do not believe there is a reasonable likelihood that there will be a material change in the assumptions used to calculate the allowance for sales returns. However, if the actual cost of sales returns are significantly different than the estimated allowance, our results of operations could be materially affected.
We sell gift cards without expiration dates to customers. Proceeds from the sale of gift cards are deferred and reflected as gift cards redeemable until the customer redeems the gift card or when the likelihood of redemption is remote. Based upon historical experience, we estimate the value of outstanding gift cards that will ultimately not be redeemed (breakage) nor escheated under statutory unclaimed property laws. This amount is recognized as revenue over the time pattern established by our historical gift card redemption experience. We monitor our gift card redemption experience and associated accounting on an ongoing basis. Our historical experience has not varied significantly from amounts historically recorded and we believe our assumptions are reasonable.
76
Table of Contents
Business Combinations
JJill Holdings accounted for the Acquisition under the acquisition method of accounting. We elected to push down the effects of the Acquisition and the application of the acquisition method of accounting to our consolidated financial statements. This method requires allocating the purchase price to the acquisition date fair value of assets acquired, including separately identifiable intangible assets, and liabilities assumed. The excess of the purchase price over the fair value of net assets acquired is recorded as goodwill. Determining the fair value of assets acquired and liabilities assumed requires management’s judgment, based on available information at the time of acquisition and subsequently obtained during a measurement period up to one year following the date of acquisition, relating to events or circumstances that existed at the acquisition date. Management’s judgment relies upon estimates and assumptions related to future cash flows, discount rates, useful lives of assets, market conditions and other items. The fair value of assets acquired and liabilities assumed in a business combination is estimated in accordance with the policies described below.
Inventory: Our inventory consists entirely of finished good merchandise. Management values the inventory acquired in business combinations based on the income approach, which bases fair value on the net retail value, less operating expenses and a reasonable profit allowance.
Property and Equipment: Our property and equipment consists primarily of leasehold improvements, furniture and fixtures, computer software and hardware, and construction in progress. To determine the fair value of property and equipment acquired in a business transaction, we primarily apply the replacement cost approach, which assumes that replacement cost is the best indication of fair value. In certain instances, particularly with respect to determining the fair value of assets with an active secondary market, we also give consideration to the market approach, which is based on current selling prices of similar assets available for purchase in an arms-length transaction.
Intangible assets other than goodwill: The fair value of intangible assets other than goodwill acquired in a business combination is recorded at fair value at the date of acquisition, as follows:
Trade Name: The fair value of our trade name is determined using the relief-from-royalty method, a variation of the income approach. The relief-from-royalty method determines the present value of the economic royalty savings associated with the ownership or possession of the trade name based on an estimated royalty rate applied to the cash flows to be generated by the business. The estimated royalty rate is determined based on the assessment of a reasonable royalty rate that a third party would negotiate in an arm’s-length license agreement for the use of the trade name.
Customer Relationships: The fair value of customer relationships are calculated using the excess earnings method. Under this method, the value of an intangible asset is equal to the present value of the after-tax cash flows attributable solely to the subject intangible asset, after making adjustments for the required return on and of the other associated assets.
Leasehold interests: Leasehold interests acquired are recorded as intangible real estate assets to the extent the terms of a lease are favorable compared to current market transactions, or as liabilities to the extent lease terms are unfavorable compared to the current market transactions. We assess the value of its assumed leaseholds based on the difference between contractual rent and market rent calculated for each remaining lease year of each lease, discounted to present value. Market rent is estimated by analyzing comparable leases in the location of its retail locations and an assumed annual inflation rate. The rate applied to calculate present value is based upon data available from industry reports. Variations in any of these factors could have an impact on the classification of leaseholds and the value of resulting assets and liabilities. We include favorable and unfavorable leasehold interests as other assets and other liabilities, respectively, on its consolidated balance sheet.
Deferred tax assets and liabilities: We record deferred tax assets and liabilities in connection with a business combination in accordance with the basis of the purchase price consideration for tax purposes as allocated to the assets acquired, based on the established hierarchy of tax regulations.
77
Table of Contents
Merchandise Inventory
Inventory consists of finished goods merchandise held for sale to our customers. Inventory is stated at the lower of cost or net realizable value, net of reserves for inventory. Cost is calculated using the weighted average method of accounting, and includes the cost to purchase merchandise from our manufacturers, duties and inbound freight.
In the normal course of business, we record inventory reserves based on past and projected sales performance, as well as the inventory on hand. The carrying value of inventory is reduced to estimated net realizable value when factors indicate that merchandise will not be sold on terms sufficient to recover its cost.
We monitor inventory levels, sales trends and sales forecasts to estimate and record reserves for excess, slow-moving and obsolete inventory. We utilize internal channels, including sales catalogs, the internet, and price reductions in retail and outlet stores to liquidate excess inventory. In some cases, external channels such as discount marketers and inventory liquidators are utilized. The prices obtained through these off-price selling methods varies based on many factors. Accordingly, estimates of future sales prices requires management judgment based on historical experience, assessment of current conditions and assumptions about future transactions. In addition, we conduct physical inventory counts to determine and record actual shrinkage. Estimates for shrinkage are recorded between physical counts, based on actual shrinkage experience. Actual shrinkage can vary from these estimates. When observed differences are identified, we adjust our inventory balances accordingly. We believe our assumptions are reasonable, and monitor actual results to adjust estimates and inventory balances on an ongoing basis. We have not made significant changes to our assumptions during the periods presented in our consolidated financial statements included elsewhere in this prospectus, and estimates have not varied significantly from historically recorded amounts.
Asset Impairment Assessments
Goodwill
We evaluate goodwill annually during the fourth fiscal quarter to determine whether the carrying value reflected on the balance sheet is recoverable, and more frequently if events or circumstances indicate that the fair value of a reporting unit is less than its fair value. Our two reporting units applicable to goodwill impairment assessments are defined as its direct and retail sales channels. Examples of impairment indicators that would trigger an impairment assessment of goodwill between annual evaluations include, among others, macro-economic conditions, competitive environment, industry conditions, changes in our profitability and cash flows, and changes in sales trends or customer demand.
We may assess our goodwill for impairment initially using a qualitative approach (“step zero”) to determine whether conditions exist to indicate that it is more likely than not that the fair value of a reporting unit is less than its carrying value. If management concludes, based on assessment of relevant events, facts and circumstances, that it is more likely than not that a reporting unit’s fair value is greater than its carrying value, no further impairment testing is required.
If management’s assessment of qualitative factors indicates that it is more likely than not that the fair value of a reporting unit is less than its carrying value, then a two-step quantitative assessment is performed. We also have the option to bypass the qualitative assessment described above and proceed directly to the two-step quantitative assessment. “Step one” requires comparing the fair value of a reporting unit to its carrying value, including goodwill. We estimate the fair value of reporting units using the income approach. The income approach uses a discounted cash flow analysis, which involves significant estimates and assumptions, including preparation of revenue and profitability growth forecasts, selection of the discount rate and the terminal year multiple.
78
Table of Contents
If the fair value of the respective reporting unit exceeds its carrying amount, goodwill is not considered to be impaired and no further testing is required. If the carrying amount of a reporting unit exceeds its fair value, the second step of the goodwill impairment test is to measure the amount of impairment loss, if any. “Step two” compares the implied fair value of goodwill to the carrying amount of goodwill. The implied fair value of goodwill is determined by a hypothetical purchase price allocation using the reporting unit’s fair value as the purchase price. If the carrying amount of goodwill exceeds the implied fair value, an impairment charge is recorded to write down goodwill to its implied fair value.
To assess for impairment, during the fourth quarter of the 2015 Successor Period, we performed a step one test, and for fiscal year 2014 and fiscal year 2013, we performed a step zero test. Our tests for impairment of goodwill resulted in a determination that the fair value of each reporting unit exceeded the carrying value of its net assets during the 2015 Successor Period, fiscal year 2014 and fiscal year 2013. We do not anticipate any material impairment charges in the near term. This analysis contains uncertainties because it requires us to make assumptions and to apply judgments to estimate industry economic factors and the profitability of future business strategies. If actual results are not consistent with our estimates and assumptions, we may be exposed to future impairment losses that could be material.
Indefinite-Lived Intangible Assets
Our trade name has been assigned an indefinite life as we currently anticipate that it will contribute cash flows to us indefinitely. Our trade name is reviewed at least annually to determine whether events and circumstances continue to support an indefinite, useful life.
We evaluate our trade name for potential impairment at least annually during the fourth fiscal quarter, or whenever events or changes in circumstances indicate that its carrying value may not be recoverable. Conditions that may indicate impairment include, but are not limited to, significant loss of market share to a competitor, the identification of other impaired assets within a reporting unit, loss of key personnel that negatively and materially has an adverse effect on our operations, the disposition of a significant portion of a reporting unit or a significant adverse change in business climate or regulations.
Impairment losses are recorded to the extent that the carrying value of the indefinite-lived intangible asset exceeds its fair value. We measure the fair value of our trade name using the income approach, which uses a discounted cash flow analysis. The most significant estimates and assumptions inherent in this approach are the preparation of revenue and profitability growth forecasts, selection of the discount rate, and selection of the terminal year multiple.
We assessed the carrying value of intangible assets as described above and determined that no impairment losses were required during the 2015 Successor Period, fiscal year 2014 or fiscal year 2013.
Long-Lived Assets
Long-lived assets include definite-lived intangible assets subject to amortization and property and equipment. Long-lived assets obtained in a business combination are recorded at the acquisition-date fair value, while property and equipment purchased in the normal course of business is recorded at cost.
We assess the carrying value of long-lived assets for potential impairment whenever indicators exist that the carrying value of an asset group might not be recoverable. Indicators of impairment include, among others, a significant decrease in the market price of an asset, a significant adverse change in the extent or manner in which an asset is being used or in its physical condition, and operating or cash flow performance that demonstrates continuing losses associated with an asset group.
When indicators of potential impairment exist, we compare the sum of estimated undiscounted future cash flows expected to result from the use and eventual disposition of the asset group to the carrying value of the asset group. If the carrying value of an asset group exceeds the sum of estimated undiscounted future cash flows,
79
Table of Contents
we record an impairment loss in the amount required to reduce carrying value of the asset group to fair value. We estimate the fair value of an asset group based on the present value of estimated future cash flows, calculated by discounting the cash flow projections used in the previous step.
We assessed the carrying value of long-lived assets as described above and determined that no impairment losses were required during the 2015 Successor Period, the 2015 Predecessor Period, fiscal year 2014 or fiscal year 2013.
Determining the fair value of long-lived assets requires management judgment and relies upon the use of significant estimates and assumptions, including future sales, our margins and cash flows, current and future market conditions, discount rates applied, useful lives and other factors. We believe our assumptions are reasonable based on available information. Changes in assumptions and estimates used in the impairment analysis, or future results that vary from assumptions used in the analysis, could affect the estimated fair value of long-lived intangible assets and could result in impairment charges in a future period.
Equity-based Compensation
Successor
JJill Topco Holdings maintains an Incentive Equity Plan that allows JJill Topco Holdings to grant incentive units to certain of our directors and senior executives, by granting Class A Common Interests (“Common Interests”). During the 2015 Successor Period, JJill Topco Holdings issued Common Interests, which are considered to be equity-classified awards. We recognize the fair value of the awards as compensation expense, net of estimated forfeitures, over the requisite service period, which is generally the vesting period of the award. We account for equity-based compensation for JJill Topco Holdings’ Common Interests by recognizing the fair value of equity-based compensation as an expense within selling, general and administrative expenses in our consolidated statements of operations and comprehensive income (loss) as the costs are deemed to be for our benefit. Fair value of the awards is determined at the date of grant using an option pricing model. Use of an option pricing model requires that we make assumptions as to the volatility of JJill Topco Holdings’ Common Interests, the expected dividend yield, the expected term and the risk-free interest rate that approximates the expected term. All key assumptions and inputs are the responsibility of management and we believe them to be reasonable.
During the periods presented, JJill Topco Holdings’ Common Interests were not publicly traded. As there has been no public market for JJill Topco Holdings’ Common Interests to date, the estimated fair value of the Common Interests has been determined by JJill Topco Holdings’ board of directors as of the respective grant date of each Common Interest, with input from management, considering as one of the factors the most recently available third-party valuations of common stock and JJill Topco Holdings’ board of directors’ assessment of additional objective and subjective factors that it believed were relevant and which may have changed from the date of the most recent valuation through the date of the grant. These third-party valuations were performed in accordance with the guidance outlined in the American Institute of Certified Public Accountants’ Accounting and Valuation Guide, Valuation of Privately-Held-Company Equity Securities Issued as Compensation. JJill Topco Holdings’ Common Interests valuation was prepared using the option-pricing method (“OPM”), which uses market approaches to estimate the enterprise value. The OPM treats common interests and preferred stock as call options on the total equity value of a company, with exercise prices based on the value thresholds at which the allocation among the various holders of a company’s securities changes. Under this method, the common interest has value only if the funds available for distribution to stockholders exceeded the value of the preferred stock liquidation preferences at the time of the liquidity event, such as a sale. In addition to considering these valuations, JJill Topco Holdings’ board of directors considered various objective and subjective factors to determine the fair value of JJill Topco Holdings’ common interest as of each grant date, including:
| • | our financial position, including cash on hand, and our historical and forecasted performance and operating results; |
80
Table of Contents
| • | external market conditions affecting our industry; |
| • | the lack of an active market for JJill Topco Holdings’ Common Interests and preferred stock; and |
| • | the likelihood of achieving a liquidity event, such as an initial public offering (“IPO”) or sale of our company in light of prevailing market conditions. |
The assumptions underlying these valuations represent management’s best estimates, which involve inherent uncertainties and the application of management judgment. As a result, if factors or expected outcomes change and we use significantly different assumptions or estimates, our equity-based compensation expense could be materially different.
Following the closing of this offering, the fair value of our common stock will be determined based on the quoted market price of our common stock.
Predecessor
During the Predecessor periods, we accounted for compensation expense related to our share-based awards using the intrinsic value method, as permitted by ASC 718 for nonpublic entities, with changes in the value of the share-based awards being recognized as compensation expense at each reporting period. JJIP LLC (“JJIP”), a Limited Partnership, was formed by our then current owners and held a portion of our outstanding common units. A management incentive unit equity program was established by JJIP to provide the opportunity for our key employees to participate in the appreciation of the business. During such periods, service-based and performance-based awards were issued. For service-only share-based awards, we recognized the related compensation expense in the period in which the award holder is required to provide service, which is generally over the required service period.
For the performance-based awards, vesting occurred upon achievement or satisfaction of a specified performance condition. Such conditions would be met upon the earlier of the attainment of a predetermined return on investment by certain equity investors in the Predecessor entity, or a change in control, whereby all outstanding unvested awards would immediately vest. We considered the probability of achieving the established performance targets in determining our equity-based compensation with respect to these awards at the end of each reporting period. During fiscal year 2014 and the 2015 Predecessor Period, there was no compensation expense recognized for the performance-based awards. The performance conditions of the Predecessor plan were met only on the date of the Acquisition.
Jumpstart Our Business Startups Act of 2012 (JOBS Act)
In April 2012, the JOBS Act was signed into law. The JOBS Act contains provisions that, among other things, reduce certain reporting requirements for an “emerging growth company.” As an “emerging growth company,” we are electing not to take advantage of the extended transition period afforded by the JOBS Act for the implementation of new or revised accounting standards, and, as a result, we will comply with new or revised accounting standards on the relevant dates on which adoption of such standards is required for non-emerging growth public companies. Section 107 of the JOBS Act provides that our decision not to take advantage of the extended transition period is irrevocable.
We have chosen to rely on the other exemptions and reduced reporting requirements provided by the JOBS Act. Subject to certain conditions set forth in the JOBS Act, as an “emerging growth company” we are not required to, among other things, (i) provide an auditor’s attestation report on our system of internal controls over financial reporting pursuant to Section 404 of the Sarbanes-Oxley Act, (ii) provide all of the compensation disclosure that may be required of non-emerging growth public companies under the Dodd-Frank Act, (iii) comply with any requirement that may be adopted by the Public Company Accounting Oversight Board (United States) regarding mandatory audit firm rotation or a supplement to the auditor’s report providing additional
81
Table of Contents
information about the audit and the consolidated financial statements (auditor discussion and analysis) and (iv) disclose certain executive compensation-related items, such as the correlation between executive compensation and performance and comparisons of the chief executive officer’s compensation to median employee compensation. We may remain an “emerging growth company” until the last day of the fiscal year following the fifth anniversary of the completion of this offering. However, if certain events occur prior to the end of such five-year period, including if we become a “large accelerated filer,” our annual gross revenue equals or exceeds $1.0 billion or we issue more than $1.0 billion of non-convertible debt in any three-year period, we will cease to be an “emerging growth company” prior to the end of such five-year period.
Recent Accounting Pronouncements
See Note 3 to our audited consolidated financial statements and Note 1 to our unaudited interim consolidated financial statements included elsewhere in this prospectus for information regarding recently issued accounting pronouncements.
Quantitative and Qualitative Disclosure of Market Risks
Interest Rate Risk
We are subject to interest rate risk in connection with borrowings under the Term Loan and ABL Facility, which bear interest at variable rates equal to LIBOR plus a margin as defined in the respective agreements described above. As of October 29, 2016, there was no outstanding balance under the ABL Facility, the undrawn borrowing availability under the ABL Facility was $38.5 million and the amount outstanding under the Term Loan had increased to $286.7 million as a result of the amendment described above. We currently do not engage in any interest rate hedging activity and we have no intention to do so in the foreseeable future. Based on the average interest rate on the ABL Facility during the period from the date the facility was entered into on May 8, 2015 through January 30, 2016, and during the first nine months of fiscal year 2016, and to the extent that borrowings were outstanding, a 10% change in our current interest rate would reduce net income $1.1 million during fiscal year 2016.
Impact of Inflation
Our results of operations and financial condition are presented based on historical cost. While it is difficult to accurately measure the impact of inflation due to the imprecise nature of the estimates required, we believe the effects of inflation, if any, on our results of operations and financial condition have been immaterial. We cannot assure you our business will not be affected in the future by inflation.
82
Table of Contents
Company Overview
J.Jill is a nationally recognized women’s apparel brand focused on a loyal, engaged and affluent customer in the attractive 40-65 age segment. The J.Jill brand represents an easy, relaxed and inspired style that reflects the confidence and comfort of a woman with a rich, full life. We operate a highly profitable omni-channel platform that is well diversified across our direct (42% of net sales for the twelve months ended October 29, 2016) and retail (58% of net sales for the twelve months ended October 29, 2016) channels. We began as a catalog company and have been a pioneer of the omni-channel model with a compelling presence across stores, website and catalog since 1999. We have developed an industry-leading customer database that allows us to match approximately 97% of transactions to an identifiable customer. We take a data-centric approach, in which we leverage our database and apply our insights to manage our business as well as to acquire and engage customers to drive optimum value and productivity. Our goals are to Create a great brand, to Build a successful business and to Make J.Jill a great place to work. To achieve this, we have aligned our strategy and team around four guiding pillars – Brand, Customer, Product and Channel.
Brand and Customer. Our brand promise to the J.Jill woman is to delight her with great wear-now product, to inspire her confidence through J.Jill’s approach to dressing and to provide her with friendly, guiding service wherever and whenever she chooses to shop. While we find that women of all ages are attracted to our brand, our typical customer is 40-65 years old, is college educated and has an annual household income that exceeds $150,000. She leads a busy, yet balanced life, as she works outside the home, is involved in her community and has a family with children. She engages across both our direct and retail channels and is highly loyal, as evidenced by the fact that approximately 70% of our gross sales in pro forma fiscal year 2015 came from customers that have been shopping with J.Jill for at least five years.
Product. Our customers strongly associate our products with a modern balance of style, quality, comfort and ease suitable for a broad range of occasions at accessible prices. Our product assortment is marketed under the J.Jill brand name, sold exclusively through our direct and retail channels, and includes knit and woven tops, bottoms and dresses as well as sweaters, outerwear and accessories across a full range of sizes, including Misses, Petites, Women’s and Tall. We also offer most of these products across our two sub-brands, Pure Jill and Wearever. We design and merchandise our products in-house around clear product stories, grounded with essential yet versatile styles and fabrications updated each month with fresh colors, layering options, novelty and fashion. Each of our monthly merchandised collections includes approximately 40% new styles, which provides a consistent flow of fresh product.
Channel. We operate an omni-channel platform that delivers a seamless experience to our customer wherever and whenever she chooses to shop across our website, retail stores and catalog. Driven by our direct-to-consumer heritage, we have a highly profitable omni-channel platform that is well-diversified across our direct and retail channels. Our retail store portfolio consists of 273 full-price stores averaging approximately 3,750 square feet across 43 states, with approximately half of our stores located in lifestyle centers and approximately half in premium malls. Our stores have produced strong and consistent performance, with 98% of our full-price locations generating positive 4-wall contribution in pro forma fiscal year 2015. Our new store openings have produced an average payback of approximately two years. We introduced a new store design in 2013 that showcases our brand concept and elevates, yet simplifies the J.Jill shopping experience. Within our direct channel, E-commerce represented 88% of net sales for the twelve months ended October 29, 2016 and catalog orders represented 12% of net sales for the twelve months ended October 29, 2016. Our website provides customers with continuous access to the entire J.Jill product offering and features rich content, including updates on new collections and guidance on how to wear and wardrobe our styles as well as the ability to chat live with a customer service representative. We produce 25 annual editions of our catalog and circulated 57 million copies in 2015. Our catalog, combined with an increased investment in online marketing, drives customer acquisition and engagement across all of our channels. Our omni-channel approach allows us to drive customer response and purchasing behavior in all channels.
83
Table of Contents
Under the leadership of Paula Bennett, our President and Chief Executive Officer, we have delivered strong, consistent growth in sales and profitability. We have established a solid foundation to support long-term, sustainable growth by investing to build our team, market our brand and enhance our systems, distribution center and data insight capabilities. Net income in pro forma fiscal year 2015 was $14.3 million. We believe our customer-focused strategy, foundational investments and data insights have resulted in consistent, profitable growth and industry-leading Adjusted EBITDA margins of 14.6% in pro forma fiscal year 2015. For a reconciliation of our Adjusted EBITDA to our net income, please see “Prospectus Summary—Summary Consolidated Historical and Pro Forma Financial and Other Data.” Recent financial highlights include:
| • | Total net sales growth from $432 million in fiscal year 2012, to $562 million in pro forma fiscal year 2015, reflecting a 9% compound annual growth rate (“CAGR”), and to $617 million for the twelve months ended October 29, 2016, reflecting a 10% CAGR; |
| • | Positive total company comparable sales growth in 17 of the last 19 consecutive quarters, including in each of the last ten consecutive quarters; |
| • | Net income growth from a loss of $3.6 million in fiscal year 2012, to $14.3 million in pro forma fiscal year 2015 and to $23.5 million for the twelve months ended October 29, 2016; |
| • | Net income margin expansion of 330 basis points, from (0.8%) in fiscal year 2012, to 2.5% in pro forma fiscal year 2015, and of 460 basis points to 3.8% for the twelve months ended October 29, 2016; |
| • | 19 consecutive quarters of positive Adjusted EBITDA growth; |
| • | Adjusted EBITDA growth from $44 million in fiscal year 2012, to $82 million in pro forma fiscal year 2015, reflecting a 23% CAGR, and to $99 million for the twelve months ended October 29, 2016, reflecting a 24% CAGR; and |
| • | Adjusted EBITDA margin expansion of 440 basis points, from 10.2% in fiscal year 2012, to 14.6% in pro forma fiscal year 2015, and of 580 basis points to 16.0% for the twelve months ended October 29, 2016. |
84
Table of Contents
$ in millions
| Net Sales |
Total Company Comparable Sales | |
|
|
| |
| Net Income & Margin |
Adjusted EBITDA & Margin | |
|
|
| |
Competitive Strengths
We attribute our success to the following competitive strengths:
Distinct, Well-Recognized Brand. The J.Jill brand represents an easy, relaxed and inspired style that reflects the confidence and comfort of a woman with a rich, full life. We have cultivated a differentiated brand that resonates with our customers, as evidenced by the fact that we have one of the highest levels of brand satisfaction and one of the highest aided brand awareness scores relative to our peers. Through our commitment to our customer and our brand building activities, we have created significant brand trust and an emotional connection with our customers that we believe will facilitate sustainable sales growth and market share gains over time.
Industry-Leading Omni-Channel Business. We have developed a powerful, omni-channel business model comprised of our industry-leading direct channel and our retail stores. Our direct and retail channels complement and drive traffic to one another, and we leverage our targeted marketing initiatives to acquire new customers across all channels. While 64% of new to brand customers first engage with J.Jill through our retail stores, we have a strong track record of migrating customers from a single-channel customer to a more valuable, omni-channel customer. On average, our omni-channel customers shop and spend nearly three times more per year compared to a single-channel customer. As a result, our direct penetration has grown rapidly and accounted for 42% of net sales for the twelve months ended October 29, 2016 driven primarily by growth in our E-commerce business. We believe our strong omni-channel capabilities enable us to deliver a seamless brand experience to our customer, wherever and whenever she chooses to shop.
Data-Centric Approach That Drives Consistent Profitability and Mitigates Risk. We believe we have strong customer and transaction data capabilities, but it is our use of the data that distinguishes us from our competitors. We have developed industry-leading data capture capabilities that allow us to match approximately 97% of transactions to an identifiable customer, which we believe is significantly ahead of the industry standard.
85
Table of Contents
We maintain an extensive customer database that tracks customer details from personal identifiers and demographic overlay (e.g., name, address, age, household income) and transaction history (e.g, orders, returns, order value). We continually leverage this database and apply our insights to operate our business as well as to acquire new customers and then create, build and maintain a relationship with each customer to drive optimum value. For example, in pro forma fiscal year 2015 we utilized insights from our data to expand our marketing investment and focus our initiatives to emphasize customer acquisition. This drove growth in active customers by 12% and new customers by 15%. We also increased spend per customer by 6% as customers purchased more frequently and spent more per transaction. We believe our data-centric approach allows us to respond to customer preferences and mitigate risk leading to consistent, predictable operating and financial performance over time.
Affluent and Loyal Customer Base. We target an attractive demographic of affluent women in the 40-65 age range, a segment of the population that is experiencing outsized population growth between 2010 and 2020 in the United States, according to the U.S. Census Bureau. With an average annual household income that exceeds $150,000, our customer has significant spending power. She is highly loyal as evidenced by the fact that approximately 70% of our gross sales in pro forma fiscal year 2015 came from customers that have been shopping with J.Jill for at least five years. Customers who remain with our brand for five years or longer spend nearly twice as much and shop with us 1.5 times more per year than a new-to-brand customer. Our private label credit card program also drives customer loyalty and encourages spending, as the spend per card holder is over two times higher than non-card holders. We believe we will continue to develop long-term customer relationships that will drive profitable sales growth.
Customer-Focused Product Assortment. Our customers strongly associate our product with a modern balance of style, quality, comfort and ease suitable for a broad range of occasions at accessible price points, with an average selling price of $45. Our customer-focused assortment spans a full range of sizes and is designed to provide easy wardrobing that is relevant to her lifestyle. Each year we offer 12 merchandise collections that are introduced approximately every four weeks and designed and delivered to provide a consistent flow of fresh products. We create product newness through the use of different fabrics, colors, patterns and silhouettes, with approximately 40% new styles delivered in each monthly collection, which motivates our customer to visit our stores and/or our website more frequently. We have an in-house, customer centric product design and development process that leverages our extensive database of customer feedback and allows us to identify and incorporate changes in our customers’ preferences, mitigating fashion risk. We believe our customer focused approach to product development and continual delivery of fresh, high quality products drives traffic, frequency and conversion.
Highly Experienced Leadership Team, Delivering Superior Results. Our leadership team is led by President and Chief Executive Officer, Paula Bennett, who joined J.Jill in 2008 and is responsible for leading our successful revitalization and profitable growth. Ms. Bennett is a retail veteran with over 35 years of experience who understands the importance of a strong brand, possesses deep knowledge of our customers and has extensive direct and retail channel experience. Ms. Bennett previously served as Chief Operating Officer of Eileen Fisher, Inc. and also held leadership positions at Bloomingdale’s and Tiffany & Co. She has built a team from leading global organizations with an average of 25 years of industry experience and significant expertise in merchandising, marketing, retail, E-commerce, human resources and finance. We have developed a strong and collaborative culture aligned around our goals to Create a great brand, Build a successful business and Make J.Jill a great place to work. Additionally, we have enhanced and realigned our organizational structure to further elevate the omni-channel customer experience including the recent hires of a Chief Information Officer and a Senior Vice President of Marketing. Our leadership team is aligned and incentivized around growing Adjusted EBITDA and has delivered superior and consistent operating results, growing net sales by a 10% CAGR, Adjusted EBITDA by a 24% CAGR and Adjusted EBITDA margin by 580 basis points from fiscal year 2012 through the twelve months ended October 29, 2016.
86
Table of Contents
Growth Strategy
Key drivers of our growth strategy include:
Grow Size and Value of Our Customer Base. We have a significant opportunity to continue to attract new customers to our brand and to grow the size and value of our active customer base across all channels. Historically, we grew our business by driving spend per customer. We strategically increased our marketing investment to drive growth through the acquisition of new customers, reactivation of lapsed customers and the retention of existing customers. This investment has proven effective as, for example, in pro forma fiscal year 2015 we increased our marketing investment by 16%, resulting in active customer base growth of 12% and new customer growth of 15%. We also experienced an increase in spend per customer by 6% as customers purchased more frequently and spent more per transaction. In addition, in pro forma fiscal year 2015, the number of our omni-channel customers, who purchase on nearly three more occasions per year and spend nearly three more times per year than our single-channel customers, increased by 21%. We recently began a brand voice and customer segmentation initiative which, upon completion, will further enhance our ability to target the highest value customers and increase customer spending. Through these initiatives, we believe we will continue to attract new customers to our brand, migrate customers from single-channel to more profitable omni-channel customers and increase overall customer retention and spend.
Increase Direct Sales. Given our strong foundation that positions us to capitalize on the growth of online and mobile shopping, we believe we have the opportunity to grow our direct sales from 42% of our net sales to approximately 50% over the next few years. According to Euromonitor, online apparel sales are expected to grow at a CAGR of approximately 15% from 2015 to 2020, which is significantly above the long-term growth of the broader apparel industry. We are undertaking several initiatives to enhance our capabilities and drive additional direct sales. We are in the process of re-platforming our website to improve our customers’ personalized shopping experience and increase the ease of navigation, checkout and overall engagement. Our new platform, managed by our experienced team will provide us with the opportunity to expand internationally. In addition, our mobile platform provides us with the ability to effectively engage with our customer on her mobile device by providing her with access to product research and the ability to connect with the brand socially. We believe our powerful direct platform will enable us to further strengthen our dominant market position and broaden our customer reach.
Profitably Expand Our Store Base. Based on our proven new store economics, we believe that we have the potential to grow our store base by up to 100 stores over the long term from our total of 275 stores as of January 28, 2017. We will target new locations in lifestyle centers and premium malls, and we plan to open 10-15 new stores in fiscal year 2017 and in each year thereafter. Our new store model targets an average of approximately $1.0 million of net sales per store and approximately $270,000 of 4-wall contribution within the first full year of operations. We introduced a new store design concept in 2013 that showcases our brand concept and elevates, yet simplifies the J.Jill shopping experience. The new store concept provides a welcoming, easy-to-shop format that guides her through clearly merchandised product stories. All of our new stores will reflect our new design concept, and we intend to continue this design for new stores and refresh our existing stores as appropriate. We also plan to selectively close underperforming stores on an annual basis, including one in 2016.
Strengthen Omni-Channel Capabilities. We are pursuing a variety of initiatives designed to enhance our omni-channel capabilities focused on best serving our customer, wherever and whenever she chooses to shop. We have recently enhanced our management team to focus on the omni-channel customer experience, including the recent hires of a Chief Information Officer and a Senior Vice President of Marketing. We will continue to leverage our insight into customer attributes and behavior, which will guide strategic investments in our business. For example, we will enhance our ability to seamlessly manage our inventory across all of our channels. We also plan to implement technology to further fulfill customer demand, including ship from store to customer and order online for pickup in store. We expect our sustainable model, combined with our omni-channel initiatives, will continue to drive traffic, increase average transaction value and enhance conversion across all of our channels.
87
Table of Contents
Enhance Product Assortment. We believe there is an opportunity to grow our business by selectively broadening and enhancing our assortment in certain product categories, including our Pure Jill and Wearever sub-brands, our Women’s and Petite’s businesses, and accessories. Based on strong demand for our extended size product and our sub-brands, we believe we have the opportunity to expand and focus these categories in selected stores as well as test the offering in stand-alone store formats. We also believe we have the opportunity to continue to optimize our assortment architecture and productivity by delivering the right mix and flow of fashion and basics to our channels. In addition, we will continue delivering high quality customer-focused product assortments across each of our channels, while strengthening visual merchandising. Through our focused and enhanced product offering, particularly in our sub-brands and extended sizes, we believe we will continue to drive profitable sales growth over time.
Market
J.Jill operates as a specialty retailer in the large and growing women’s apparel industry. According to Euromonitor, total apparel sales in the United States grew from $301 billion in 2010 to $343 billion in 2015, reflecting a CAGR of 3%. Within apparel, E-commerce sales grew at a 15% CAGR from $23 billion to $46 billion, while brick-and-mortar sales remained relatively flat. As we continue to grow our business and expand beyond the United States, global apparel sales are expected to grow at a CAGR of 4%. Online sales are expected to grow at a CAGR of approximately 15%, which is significantly above the long-term growth of the broader apparel industry. Given our strong foundation that positions us to capitalize on the growth of online and mobile shopping, we believe we have the opportunity to grow our direct sales from 42% of our net sales to approximately 50% over the next few years. Within the women’s apparel market, we believe we have an opportunity to gain share within the Sportswear market for women over the age of 40, which has a market size of approximately $42 billion for the twelve month period ended May 2015, according to data from the NPD Group, Inc., and consists of 79 million women, according to a U.S. Census Bureau projection. With our sales of $0.6 billion and an active customer base of 1.7 million for the twelve months ended October 29, 2016, we believe we have significant runway ahead to gain share within this market.
J.Jill’s active customer base is primarily comprised of women in the attractive 40 to 65 age range. This age group contains the largest share of households earnings more than $100,000 annually and represents a sizable market opportunity for J.Jill.
| % of U.S. Households Earning More Than $100K / Year By Age
|
||||
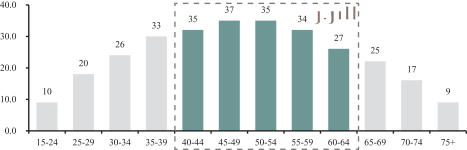
|
||||
| Source: U.S. Census Bureau | ||||
Pillars
We manage J.Jill to deliver our goals to Create a great brand, to Build a successful business and to Make J.Jill a great place to work. To achieve this, we have aligned our strategy and team around four guiding pillars—Brand, Customer, Product and Channel.
Brand
The J.Jill brand represents an easy, relaxed and inspired style that reflects the confidence and comfort of a woman with a rich, full life. We have developed a unique brand image that encourages customers to build deep,
88
Table of Contents
personal connections with our brand and that differentiates us from our peers. Our brand promise to the J.Jill woman is to delight her with great wear-now product, to inspire her confidence through J.Jill’s approach to dressing and to provide her with friendly, guiding service wherever and whenever she chooses to shop. We use our key brand attributes—Naturally Authentic, Thoughtfully Engaging, Relaxed Femininity, Positive Energy and Confident Simplicity—to guide all brand messaging, which is consistently communicated to our customers, whether she chooses to shop on our www.jjill.com website, in our retail stores or through our catalog.
We believe we have the ability to create and maintain positive brand associations with customers. We have cultivated a differentiated brand that resonates with our loyal customers, as evidenced by one of the highest levels of brand satisfaction and one of the highest aided brand awareness scores relative to our peers.
Customer
While we find that women of all ages are attracted to our brand, our typical customer is 40 to 65 years old, is college educated and has an annual household income that exceeds $150,000. She leads a busy, yet balanced life, as she works outside the home, is involved in her community and has a family with children. She values comfort, ease and versatility in her wardrobe, in addition to quality fabrics and thoughtful details. She is fashion conscious and looks to J.Jill to interpret current trends most relevant to her needs and lifestyle. She buys wear-now product and is willing to invest in special, unique pieces. She is tech savvy, but also loves the J.Jill store experience and frequently engages with us across all channels.
Our customers are highly loyal, as evidenced by our average customer tenure of seven years and annual retention rate of 59% in pro forma fiscal year 2015. As our customers increase their tenure with our brand, they tend to spend more and order more frequently. Customers who have been with the brand for more than five years comprise approximately 61% of our active customer base, and in pro forma fiscal year 2015 represented approximately 70% of our gross sales and shopped with us 1.5 times more per year than new-to-brand customers. Additionally, as customers are retained over time, they tend to migrate from single channel customers to more valuable, omni-channel customers. Overall, our omni-channel customers shop nearly three more times per year and spend nearly three more times per year than our single-channel customers, and are highly loyal, as evidenced by their average annual retention rate of 84%. Omni-channel customers now reflect 21% of our active customer base for the twelve months ended October 29, 2016, which has increased from 19% in fiscal year 2014 and 20% in pro forma fiscal year 2015.
Product
Our Products
Our products are marketed under the J.Jill brand name and sold exclusively through our direct and retail channels. Our diverse assortment of apparel spans knit and woven tops, bottoms and dresses as well as sweaters and outerwear. We also offer a range of complementary footwear and accessories, including scarves, jewelry and hosiery. By presenting our merchandise to her in clear product stories, we strive to uncomplicate fashion across her entire wardrobe, providing comfortable, easy and versatile collections that enable her to dress confidently for a broad range of occasions. Our products are available across the full range of sizes including Misses, Petites, Women’s and Tall, and reflect a modern balance of style, quality, comfort and ease at accessible price points, with an average selling price of $45.
Our apparel assortment represents our brand concept of an easy, relaxed and inspired style that reflects the confidence and comfort of a woman with a rich, full life. The core products of our assortment are designed and merchandised in-house around clear product stories, grounded with essential yet versatile styles and fabrications that are typically represented across a season. Assortments are updated each month with fresh colors, layering options, novelty and fashion. Our foundation is comprised of a full assortment of knits, wovens and
89
Table of Contents
sweaters, and provides easy dressing options for everyday wear. In addition to our core assortment, we have developed two sub-brands as extensions of our brand aesthetic and our customer lifestyle needs:
| • | Pure Jill. Our Pure Jill sub-brand reflects the art of understated ease. It is designed with a clear focus and minimalist approach to style, and reflected in simple shapes, unstructured silhouettes, interesting textures, soft natural fabrics and artful details. |
| • | Wearever. Our Wearever sub-brand consists of our refined rayon jersey knit collection that is designed for work, travel and home. It has a foundational collection of versatile shapes and proportions, in solids and prints that mix easily to provide endless options—everything works together. These soft knits are easy care and wrinkle-free, and always look great. |
We also offer accessories in unique, versatile and wearable collections, inspired by the raw materials and organic motifs found in nature. Primarily driven by scarves and jewelry, they seamlessly complete our customer’s wardrobe.
Product Design and Development
Each year we offer 12 merchandise collections that are introduced approximately every four weeks and designed and delivered to provide a consistent flow of fresh products. All of our merchandise is designed in-house, and we create newness through the use of different fabrics, colors, patterns and silhouettes, with approximately 40% new styles in each monthly collection. We introduce each collection simultaneously on our website, in our retail stores and in our catalogs. We support each collection with continuous web updates, sequenced floor sets and 25 corresponding catalog editions in addition to regular, coordinated marketing activities. Our new product development lifecycle typically takes 48 weeks from design concept through delivery. We leverage feedback and purchasing data from our customer database along with continual collaborative hindsighting to guide our product and merchandising decision making. Joann Fielder, our Executive Vice President and Chief Creative and Merchandising Officer, oversees a team responsible for design, product development, sourcing, creative, merchandising and inventory planning. This close coordination between our creative and merchandising teams ensures that our product and brand message is clearly communicated to our customers across all channels.
We believe our merchandising strategy, flow of fresh, new styles and ability to integrate continuous customer feedback and purchasing data allow us to consistently deliver relevant products to our customers. Our disciplined planning and product lifecycle management strategies enable effective in-season inventory management to maximize inventory turn and productivity. Through these effective inventory management practices, we are able to minimize markdowns and promotional activity, allowing us to drive favorable gross margins.
Omni-Channel
We are an omni-channel retailer, delivering a seamless brand experience to our customer, wherever and whenever she chooses to shop across our website, retail stores and catalog. Driven by our direct-to-consumer heritage, we have a highly profitable omni-channel platform that is well-diversified across our direct and retail channels. In 1999, we became an omni-channel retailer, with the launch of our website and the opening of our first retail stores in Natick, Massachusetts and Providence, Rhode Island. Our channels reinforce one another and drive traffic to each other, and we deliver a consistent brand message by coordinating the release of our monthly collection across our website, retail stores and catalogs, allowing our customers to experience a uniform brand message. We believe that our customers’ buying decisions are influenced by this consistent messaging and experience across our sales channels. While 64% of new customers first engage with J.Jill through our retail stores, we have a strong track record of migrating customers from a single-channel customer to a more valuable, omni-channel customer over time.
90
Table of Contents
Direct Channel
Our direct channel, which represented 42% of total net sales for the twelve months ended October 29, 2016, consists of our website and catalog orders. Given our recent growth in the direct channel, we expect to grow this business to approximately 50% of total net sales over the next few years.
Industry-Leading E-commerce Platform
Our website, www.jjill.com, is a natural extension of our retail stores and our catalog, and provides customers with a broader range of colors and sizes, including Women’s and Tall sizes, than available in our stores. Our website has been optimized for shopping and purchasing across desktop, mobile phone and tablet devices. The website features updates on new collections, guidance on how to wear and match our products and the ability to chat live with a sales representative, all of which facilitate customer engagement and interaction. Additionally, we leverage our website as an efficient inventory clearance vehicle, which allows us to keep our retail store products fresh and representative of our newest collection. Within our direct channel, E-commerce represented 86% of pro forma fiscal year 2015 net sales, an increase from 85% of fiscal year 2014 net sales. For the twelve months ended October 29, 2016, E-Commerce represented 88% of net sales.
Catalog
Our catalogs are an integral part of our business. As one of our primary marketing vehicles, our catalogs promote and reinforce our brand image and drive customer acquisition and engagement across all of our channels. In fiscal year 2015, we produced and issued 25 catalog editions for a total circulation of 57 million copies distributed to both new and existing customers. As on our website and in our retail stores, our catalogs reflect our product offering in settings that align with our merchandise segments, including our sub-brands, and provide guidance on styling and wardrobing. Our catalogs are designed in-house, providing us with greater creative control as well as effectively managing our catalog production costs. Within our direct channel, catalog orders represented 14% of pro forma fiscal year 2015 net sales, a decrease from 15% of fiscal year 2014 net sales. For the twelve months ended October 29, 2016, catalog represented 12% of net sales.
Retail Channel
Our Stores
Our retail channel represented 58% of net sales for the twelve months ended October 29, 2016. As of October 29, 2016, we operated 271 stores across 43 states with approximately half located in lifestyle centers and the remaining in premium malls; all of our stores are leased. Our stores range in size from approximately 2,350 to 6,550 square feet, and the average store is approximately 3,750 square feet. Our stores are profitable, with 98% of our 261 full-price locations contributing positive 4-wall contribution in pro forma fiscal year 2015. The average unit volume of the store portfolio is $1.3 million with net sales per square foot of $355 in pro forma fiscal year 2015, up from $306 in fiscal year 2012.
We introduced a new store design concept in 2013 that showcases our brand concept and elevates, yet simplifies the J.Jill shopping experience. The new store concept provides a welcoming, easy-to-shop format that guides her through clearly merchandised product stories. With natural materials in soothing neutral colors, comfortable fabrics and elegant seating areas, the atmosphere is aspirational, yet attainable. When she cannot find an item in-stock at her local store, our concierge service leverages our in-store ordering platform and ships products to her home with no shipping charge. Between fiscal year 2013 and 2016, we remodeled or refreshed approximately 20 stores per year. In fiscal year 2017, we anticipate refreshing approximately 30 stores per year as leases come up for renewal. By the end of fiscal year 2016, approximately 70% of our store base will be refreshed.
91
Table of Contents
Site Selection
We believe our store expansion model supports our ability to grow our store footprint in both new and existing markets across the United States with the potential to simultaneously enhance our direct channel sales by migrating single-channel customers to omni-channel customers. New store locations are evaluated on various factors, including customer demographics within a market, concentration of existing customers, location of existing stores and center tenant quality and mix. We also leverage our customer database, including purchasing history and customer demographics, to determine geographic locations that may benefit from a retail store. We target opening new stores in high traffic locations with desirable demographic characteristics and favorable lease economics. We believe we can add up to 100 stores to our store base of 275 over the long term. We plan to open 10-15 new stores in fiscal year 2017 and in each year thereafter. We also plan to selectively close underperforming stores on an annual basis, including one in 2016.
Our store growth is supported by proven new store economics that we believe are compelling. Our new store operating model targets an average store size of 3,600 square feet and net sales per store of approximately $1.0 million in the first full year of operations. The new store operating model targets 4-wall contribution of approximately $270,000 within the first full year of operations. The average payback period of the new store operating model is approximately two years, reflecting a target pre-tax cash-on-cash return of approximately 50%.
The following table shows new store openings since fiscal year 2012. The stores opened in the last three years were primarily in lifestyle centers.
| Store Open Year |
Total Stores |
Total Stores at |
||||||
| Fiscal Year 2012 |
7 | 227 | ||||||
| Fiscal Year 2013 |
13 | 234 | ||||||
| Fiscal Year 2014 |
19 | 248 | ||||||
| Pro Forma Fiscal Year 2015 |
15 | 261 | ||||||
| Fiscal Year 2016 |
15 | 275 | ||||||
Data Analytics
Driven by our rich catalog heritage and omni-channel platform, we have significant customer insights and data, which we use to drive the majority of our decision making. We have developed industry-leading data capture capabilities which allow us to match approximately 97% of transactions to an identifiable customer, which we believe is significantly ahead of the industry standard. Our extensive database of customer information contains personal identifiers (e.g., name, address and email), demographic overlay (e.g., age, household income and occupation), contact history (e.g., catalog and email) and transaction history (e.g., orders, returns and order value). As of the end of pro forma fiscal year 2015, our database had over ten million names.
We have significant visibility into our customers’ transaction behavior, including purchases made across our channels. As such, we can identify a single-channel customer who purchases a product through our website, our retail store or our catalog, as well as an omni-channel customer who purchases in more than one channel. We continually leverage this customer database to drive data analysis and insights that we use in managing our business. This analysis, along with continuous testing strategies, has created a foundation of knowledge that underlies our confidence in our strategies and our decision making. We also use the database to acquire, develop and retain customers and then create, build and maintain a relationship with each customer to drive optimum value. We believe our use of customer data and our data insight capabilities distinguish us from our competitors.
Marketing and Advertising
We leverage a variety of marketing and advertising vehicles to increase brand awareness, acquire new customers, drive customer traffic across our channels, and strengthen and reinforce our brand image. These
92
Table of Contents
include our 25 annual catalog editions, promotional mailings, email communications, digital and print advertisements and public relations initiatives. We leverage our customer database to strategically optimize the value of our marketing investments across customer segments and channels. This enables us to productively acquire new customers, effectively market to existing customers, increase customer retention levels and reactivate lapsed customers.
Our catalog, combined with an increased investment in online marketing, drive customer acquisition and engagement across all of our channels. We reinforce a consistent brand message by coordinating the release of our monthly collection across our website, retail stores and catalogs, allowing our customers to experience a uniform brand message wherever and whenever she chooses to shop. We also engage in a wide range of other marketing and advertising strategies to promote our brand, including media coverage in specialty publications and magazines.
In late 2014, we strategically increased our marketing investment to drive growth through the acquisition of new customers, reactivation of lapsed customers and the retention of existing customers. This investment has proven effective as, for example, in pro forma fiscal year 2015 we increased our marketing investment by 16%, resulting in active customer base growth of 12%, from 1.4 million to 1.5 million, including new customer growth of 15%. We have continued to increase our marketing investment in fiscal year 2016, resulting in continued growth of our active customer base to 1.7 million for the twelve months ended October 29, 2016. In pro forma fiscal 2015, we also experienced an increase in spend per customer by 6% as customers purchased more frequently and spent more per transaction. We believe these efforts will drive increased brand awareness, leading to higher sales in our stores and direct business over time. Our active customer base represents unique customers who have made a purchase within the past twelve months.
We offer a private label credit card program through an agreement with Comenity Capital Bank, under which they own the credit card receivables. We recently renewed our agreement with ADS on favorable terms to us. All credit card holders receive invitations to exclusive customer events and promotions including special purchase events three times per year, a special offer for her birthday, and a 5% discount when purchases are made on the card. We promote the benefits of the credit card throughout our website, our retail stores and our catalog through banner ads, signage and customer service and selling associate representatives. Additionally, we leverage regional print advertising to promote the card and its benefits to new and existing customers. We believe that our credit card program encourages customer loyalty, repeat visits and additional spending. In pro forma fiscal year 2015, 52% of our gross sales were generated by our credit card holders and we had nearly one million credit card holders. In addition, spend per customer for a J.Jill credit card holder was over two times higher in pro forma fiscal year 2015 versus a non-card holder.
Sourcing and Supply Strategy
We outsource the manufacturing of our products, which eliminates the need to own or operate manufacturing facilities. In order to efficiently source our products, we work primarily with agents who represent suppliers and factories. In pro forma fiscal year 2015 approximately 81% of our products were sourced through agents and 19% were sourced directly from suppliers and factories. We currently work with three primary agents that help us identify quality suppliers and coordinate our manufacturing requirements. Additionally, the agents manage the development of samples of merchandise produced in the factories, inspect finished merchandise, ensure the timely delivery of goods and carry out other administrative and oversight functions on our behalf. We source the remainder of our products by interacting directly with suppliers and factories both domestically and abroad.
Agents work with 24 suppliers on our behalf and we work directly with five suppliers. We source our merchandise globally from eight countries including China, India, the Philippines, Indonesia, and Vietnam, and no single supplier accounts for more than 20% of merchandise purchased. Approximately 75% of our products were sourced in Asia in pro forma fiscal year 2015.
93
Table of Contents
We have no long-term merchandise supply contracts as we typically transact business on an order-by-order basis to maintain flexibility. We believe our strong relationships with suppliers have provided us with the ability to negotiate favorable pricing terms, further improving our overall cost structure and profitability. Our dedicated sourcing team actively negotiates and manages product costs to deliver initial mark-up objectives. The team further focuses on quality control to ensure that merchandise meets required technical specifications and inspects the merchandise to ensure it meets our strict standards, including regular in-line inspections while goods are in production. Upon receipt, merchandise is further inspected on a test basis for consistency in cut, size and color, as well as for conformity with specifications and overall quality of manufacturing. Our sourcing team ensures that the customer has a consistent product and satisfying brand experience regardless of product size, color or collection.
Omni-Channel Distribution and Customer Contact Center
We lease our 520,000 square foot state-of-the-art distribution and customer contact center in Tilton, New Hampshire. The facility manages the receipt, storage, sorting, packing and distribution of merchandise for our direct and retail channels. Retail stores are replenished at least once a week from this facility and shipped by third-party delivery services, providing our retail stores with a steady flow of new inventory that helps to maintain product freshness. Our distribution system is designed to operate in a highly-efficient and cost-effective manner, including our ability to profitably support individual direct orders which we believe differentiates ourselves from our competitors. In pro forma fiscal year 2015, the distribution center handled 29.2 million units, split between 15.8 million retail (54%) and 13.4 million direct (46%) pieces, and we believe this facility is sufficient to support our future growth.
The customer contact center is an extension of our brand, providing a consistent customer experience at every stage of a purchase across all of our channels. We manage over 3.3 million annual customer interactions through our in-house customer contact center in Tilton, New Hampshire. Our customer contact center is responsible for nearly all live customer interactions, other than in retail stores, including order taking and further serves as an important feedback loop in gathering customer responses to our brand, product and service. We continue to refine and improve our contact center strategy and experience to support the constantly evolving digital landscape.
Information Systems
We use information systems to support business intelligence and processes across our sales channels. We continue to invest in information systems and technology to enhance the customer experience, drive sales and create operating efficiencies. We utilize third-party providers for customer database and customer campaign management, ensuring efficient maintenance of information in a secure, backed-up environment. We also utilize a proprietary E-commerce platform hosted by a third-party provider and a well-developed proprietary data warehouse for business intelligence.
We recently implemented a new core merchandising system in support of a single view of inventory across all channels, increased efficiency in sales support areas and superior product management and reporting tools. This system is foundational to our plans to create a more scalable and seamless omni-channel platform and enhances our capabilities in merchandising and inventory management. We also intend to replace our e-commerce platform in 2017 to drive future growth and further enable digital capabilities.
We also invested in a new central processor and upgraded infrastructure and communication networks to increase system processing speed and uptime, improve security, and increase system back-up and recovery capabilities. We also made strategic investments, including a significant upgrade to our retail inventory allocation system and the implementation of a new, scalable design and sourcing system (PLM) that enables significant benefits by enhancing collaboration and sharing in the creative process, increasing automation and adding analysis tools.
94
Table of Contents
Seasonality
While the retail business is generally seasonal in nature, we have historically not experienced significant seasonal fluctuations in our sales. Our merchandise offering drives consistent sales across seasons with no quarter contributing more than 26% of total annual net sales in pro forma fiscal year 2015.
Competition
The women’s apparel industry is highly competitive. We compete with local, national and international retail chains and department stores, specialty and discount stores, catalogs and internet businesses offering similar categories of merchandise. We compete primarily on the basis of design, service, quality and value. We believe our distinct combination of design, service, quality and value allows us to compete effectively and we believe we differentiate ourselves from competitors based on the strength of our brand, our industry-leading omni-channel platform, our strong data capabilities, our loyal customer base, our customer-focused product assortment and our highly experienced leadership team. Our competitors range from smaller, growing companies to considerably larger players with substantially greater financial, marketing and other resources.
Employees
As of January 28, 2017, we employed 1,406 full-time and 2,395 part-time employees. Of these employees, 342 are employed in our headquarters in Quincy, Massachusetts, 3,009 are employed in our retail stores and 450 work in our distribution and customer contact center and administrative office in Tilton, New Hampshire. The number of employees, particularly part-time employees, fluctuates depending upon seasonal needs.
Our employees are not represented by a labor union and are not party to a collective bargaining agreement. We consider our relations with our employees to be good.
Intellectual Property
Our trademarks are important to our marketing efforts. We own or have the rights to use certain trademarks, service marks and trade names that are registered with the U.S. Patent and Trademark Office or other foreign trademark registration offices or exist under common law in the United States and other jurisdictions. Trademarks that are important in identifying and distinguishing our products and services include, but are not limited to, J.Jill®, The J.Jill Wearever Collection® and Pure Jill®. Our rights to some of these trademarks may be limited to select markets. We also own domain names, including “www.jjill.com.”
Properties
We are headquartered in Quincy, Massachusetts. Our principal executive offices are leased under a lease agreement expiring in December 2021, with options to renew thereafter. Our 520,000 square foot distribution and customer contact center, located in Tilton, New Hampshire, supports both our direct and retail channels and is leased under a lease agreement expiring in September 2030, with options to renew thereafter. We consider these properties to be in good condition and believe that our facilities are adequate for operations and provide sufficient capacity to meet our anticipated future requirements.
As of January 28, 2017, we operated 275 stores in 43 states. Of these stores, 273 are full-price locations with approximately half located in lifestyle centers and half in premium malls. The average size of our stores is approximately 3,750 square feet. All of our retail stores are leased from third parties and new stores historically have had terms of ten years. The average remaining lease term is 4.6 years. A portion of our leases have options to renew for periods up to five years. Generally, store leases contain standard provisions concerning the payment of rent, events of default and the rights and obligations of each party. Rent due under the leases is generally comprised of annual base rent plus a contingent rent payment based on the store’s sales in excess of a specified threshold. Some of the leases also contain early termination options, which can be exercised by us or the landlord under certain conditions. The leases also generally require us to pay real estate taxes, insurance and certain common area costs. We renegotiate with landlords to obtain more favorable terms as opportunities arise.
95
Table of Contents
The current terms of our leases expire as follows:
| Fiscal Years Lease Terms Expire |
Number of Stores |
|||
| 2016 – 2018 |
107 | |||
| 2019 – 2021 |
55 | |||
| 2022 – 2024 |
63 | |||
| 2025 and later |
50 | |||
The table below sets forth the number of retail stores by state that we operated as of January 28, 2017.
| State |
Number |
State |
Number |
State |
Number |
|||||||||||
| Alabama |
5 | Louisiana |
3 | Ohio |
9 | |||||||||||
| Arizona |
6 | Maine |
2 | Oklahoma |
2 | |||||||||||
| Arkansas |
3 | Maryland |
8 | Oregon |
5 | |||||||||||
| California |
30 | Massachusetts |
13 | Pennsylvania |
11 | |||||||||||
| Colorado |
7 | Michigan |
9 | Rhode Island |
2 | |||||||||||
| Connecticut |
8 | Minnesota |
8 | South Carolina |
4 | |||||||||||
| Delaware |
1 | Mississippi |
1 | Tennessee |
6 | |||||||||||
| Florida |
12 | Missouri |
6 | Texas |
17 | |||||||||||
| Georgia |
10 | Nebraska |
2 | Utah |
1 | |||||||||||
| Idaho |
1 | Nevada |
2 | Vermont |
1 | |||||||||||
| Illinois |
16 | New Hampshire |
1 | Virginia |
10 | |||||||||||
| Indiana |
2 | New Jersey |
14 | Washington |
6 | |||||||||||
| Iowa |
2 | New Mexico |
1 | Wisconsin |
4 | |||||||||||
| Kansas |
2 | New York |
11 | |||||||||||||
| Kentucky |
2 | North Carolina |
9 | |||||||||||||
Legal Proceedings
From time to time, we are subject to certain legal proceedings and claims in the ordinary course of business. We are not presently party to any legal proceedings the resolution of which we believe would have a material adverse effect on our business, financial condition, operating results or cash flows. We establish reserves for specific legal matters when we determine that the likelihood of an unfavorable outcome is probable and the loss is reasonably estimable.
Regulation and Legislation
We are subject to labor and employment, tax, environmental, privacy and anti-bribery laws. We are also subject to regulations, trade laws and customs, truth-in-advertising, consumer protection and zoning and occupancy laws and ordinances that regulate retailers generally and/or govern the importation, promotion and sale of merchandise and the operation of stores and warehouse facilities. We monitor changes in these laws and believe that we are in material compliance with applicable laws.
A substantial portion of our products are manufactured outside the United States. These products are imported and are subject to U.S. customs laws, which impose tariffs as well as import quota restrictions for textiles and apparel. Some of our imported products are eligible for duty-advantaged programs. While importation of goods from foreign countries from which we buy our products may be subject to embargo by U.S. Customs authorities if shipments exceed quota limits, we closely monitor import quotas and believe we have the sourcing network to efficiently shift production to factories located in countries with available quotas. The existence of import quotas has, therefore, not had a material adverse effect on our business. See “Risk Factors—Risks Related to Our Business and Industry—We are subject to laws and regulations in the jurisdictions in which we operate and changes to the regulatory environment in which we operate or failure to comply with applicable laws and regulations could adversely affect our business, financial condition and results of operations.”
96
Table of Contents
The following table sets forth the name, age and position of each of our executive officers and the directors of JJill Holdings, our parent, who will serve as our directors upon our conversion from a Delaware limited liability company to a Delaware corporation prior to the closing of this offering.
| Name |
Age |
Position(s) | ||||
| Paula Bennett |
67 | President and Chief Executive Officer and Director | ||||
| David Biese |
52 | Senior Vice President and Chief Financial Officer | ||||
| Joann Fielder |
63 | Executive Vice President and Chief Merchandising and Creative Officer | ||||
| Michael Rahamim |
64 | Chairman of the Board of Directors | ||||
| Andrew Rolfe |
50 | Director | ||||
| Travis Nelson |
46 | Director | ||||
| Marka Hansen |
63 | Director | ||||
| Michael Recht |
36 | Director | ||||
| Michael Eck |
54 | Director | ||||
| Linda Heasley |
61 | Director Nominee | ||||
Executive Officers
Paula Bennett was appointed President of J.Jill in January 2008 and was named Chief Executive Officer in July 2009. She has also served on our board of directors since 2009. Ms. Bennett is responsible for the strategic leadership, growth and profitability of the brand and business, while guiding the organization successfully through profitable turnaround and ownership transitions. Ms. Bennett has over 35 years of retail management experience and has extensive expertise in apparel merchandising, buying, marketing and brand building across both direct and retail marketing channels. Prior to joining J.Jill, Ms. Bennett served as President and Chief Executive Officer of a number of portfolio companies of Orchard Brands Corporation, a direct marketing company. From 1998 through 2005, Ms. Bennett was Chief Operating Officer of Eileen Fisher, Inc., where she led the development of the retail portfolio while launching the E-commerce business. Earlier in her career, she also served as Vice President of Retail Sales at Calvin Klein Collection. From 1987 through 1995, Ms. Bennett held significant leadership positions at Tiffany & Co., including Vice President of Sales and Customer Service, Vice President and General Manager of the Fifth Avenue Flagship store, Vice President of Retail Administration and Vice President of the Trade Division. Ms. Bennett began her career in buying and merchandise management at Bloomingdale’s, and later, Federated Merchandising Services. Ms. Bennett is a graduate of The Ohio State University. She was selected to serve on our board of directors because of her experience as an apparel industry executive, including as our Chief Executive Officer, and her extensive knowledge of the omni-channel and women’s apparel industry.
David Biese joined J.Jill as Senior Vice President and Chief Financial Officer in August 2009 and is responsible for providing strategic guidance on all financial matters, as well as the Real Estate and Distribution functions. Until the recent hiring of our Chief Information Officer and General Counsel, Mr. Biese was responsible for information services and legal oversight. Before joining J.Jill, he was Senior Vice President of Merchandise Operations for Trans World Entertainment Corporation (“FYE”), a publicly held national specialty retailer. He previously served as Vice President of Finance and Treasurer at FYE. Earlier in his career, Mr. Biese was Vice President and Controller at Carson Pirie Scott & Co., a department store division of publicly held Saks Incorporated. Mr. Biese is a Certified Public Accountant and started his career as a public accountant at KPMG. He is a graduate of the University of Wisconsin at Oshkosh.
Joann Fielder has served as J.Jill’s Executive Vice President and Chief Merchandising and Creative Officer since July 2015. Ms. Fielder joined J.Jill in September 2011 as Senior Vice President of Design, Product Development and Sourcing. She was promoted to Senior Vice President, Chief Creative Officer in August 2013. Ms. Fielder has extensive experience in design and product development. Prior to joining J.Jill, Ms. Fielder served as Senior Vice President and Chief Design Officer at Avenue. Prior to her role at Avenue, she served as
97
Table of Contents
Executive Vice President of Design Development at Ann Taylor. Earlier in her career, Ms. Fielder also held roles as Vice President of Merchandising for Brooks Brothers and Vice President of Product Development for Talbots. Ms. Fielder is a graduate of The Tobe Coburn School.
Board of Directors
Michael Rahamim has served as Chairman of the board of directors of J.Jill since May 2015. From January 2011 through January 2014, Mr. Rahamim served as the Executive Chairman of Phase Eight (Fashion & Designs) Limited (“Phase Eight”), a portfolio company of TowerBrook, our principal stockholder, and remained Chairman of the Board until January 2015, when Phase Eight was sold. Mr. Rahamim has over 20 years of experience in the fashion retail industry. In 1992, Mr. Rahamim developed the UK franchise of Kookai S.A., a French high fashion business, and introduced the Sandro and Maje French high fashion brands to the UK. Mr. Rahamim has previously worked in soft commodities and financial futures and was one of the founding seat holders on the London International Financial Futures Exchange. He qualified as a Chartered Accountant in 1977. Mr. Rahimim currently serves as a director of Kaporal Jeans and has served as a director of Whistles Limited from March 2009 until April 2016. He is also a member of the Senior Advisory Board of TowerBrook. Mr. Rahamim was selected to serve on our board of directors because of his extensive understanding of the International fashion retail industry through his experience in leadership positions and his investments with other retailers.
Andrew Rolfe has served as a director of J.Jill since May 2015. Mr. Rolfe has served as a Managing Director and the Head of Private Equity, USA of TowerBrook, our principal stockholder, since January 2011. Mr. Rolfe is also the Chairman of the Portfolio Committee and a member of the Management Committee at TowerBrook. Prior to joining TowerBrook, Mr. Rolfe served as President of The Gap Inc.’s (“The Gap”) International Division from November 2003 until February 2006, where he also served as a member of the Executive Leadership Team. Mr. Rolfe has also held roles as the Chairman and Chief Executive Officer of Pret A Manger (Europe) Ltd and the Chief Executive Officer of Booker Foodservice. He currently serves as a director of True Religion Apparel, Inc., Wilton Industries, Inc., Kaporal Jeans and Beverages & More, Inc. Mr. Rolfe received his M.B.A. from Harvard Business School and his B.A. from Oxford University. He was selected to serve on our board of directors because of his extensive experience in leadership positions in the retail industry.
Travis Nelson has served as a director of J.Jill since May 2015. Mr. Nelson has served as a Managing Director at TowerBrook, our principal stockholder, since January 2011. Prior to joining TowerBrook, Mr. Nelson co-founded Pacific Partners LLC (“Pacific Partners”), a private equity firm specializing in healthcare, media and communications investments and served as a Managing Director from 2000 to 2005. Prior to founding Pacific Partners, Mr. Nelson served as a Principal at Oak Hill Capital Management where he worked on private investments in a wide range of companies. Earlier in his career, Mr. Nelson was an investment professional at Goldman Sachs and Freeman Spogli & Co., and served as a consultant to the CEO of NetJets. He currently serves as a director of Vistage International, Inc., Floworks International, LLC, True Religion Apparel, Inc. and Beverages & More, Inc. Mr. Nelson earned his B.A. from DePauw University and received his M.B.A. from the Stanford Graduate School of Business. He was selected to serve on our board of directors because of his broad finance experience, including extensive experience in financing and mergers and acquisitions.
Marka Hansen has served as a director of J.Jill since May 2015. Ms. Hansen previously served as a Retail Consultant at Stitch Fix, Inc. from February 2013 to August 2013. Prior to that, she was the President of Gap North America from February 2007 until February 2011. Ms. Hansen served as the President of Banana Republic, LLC, a division of The Gap, from June 2003 until February 2007, and has served in various leadership positions at The Gap since joining the company in 1987. Ms. Hansen currently serves as a director of Sur la Table, Stitch Fix, Inc., The Orvis Company, Inc. and True Religion Apparel, Inc. She received her B.A. in Liberal Studies from Loyola Marymount University. Ms. Hansen was selected to serve on our board of directors because of her extensive experience in leadership positions in the retail industry.
Michael Recht has served as a director of J.Jill since May 2015. Mr. Recht has served as a Senior Principal at TowerBrook, our principal stockholder, since August 2013. From August 2010 to August 2013, Mr.
98
Table of Contents
Recht was a Senior Associate with the Retail & Consumer team at Apax Partners LLP (“Apax”). Prior to joining Apax, Mr. Recht was an Associate at Thoma Cressey Bravo where he focused on investments in the consumer products and services sector. Prior to that, Mr. Recht was a member of the Technology & Defense teams at CIBC World Markets. He currently serves as a director of Wilton Industries, Inc. He received his M.B.A. from the Kellogg School of Management at Northwestern University and his B.A. from Williams College. Mr. Recht was selected to serve on our board of directors because of his broad finance experience, particularly in the retail and consumer products industry.
Michael Eck has served as a director of J.Jill since November 2016. Mr. Eck was the Global Head of the Consumer and Retail Investment Banking Group at Morgan Stanley from 2008 until his retirement in 2014. Prior to that, Mr. Eck worked at Citigroup from 1993 to 2008, where he was the Global Head of the Consumer and Retail Banking Group, and at Credit Suisse First Boston from 1987 to 1993. In January 2016, Mr. Eck joined M Klein and Company, a global strategic advisory firm, as a Senior Advisor. He is currently an independent board member of Blue Buffalo Pet Products, Inc., a publicly-held leading natural pet food company, where he serves as Chairman of the Audit Committee. Mr. Eck is also a board member of USA Ultimate and the co-founder and chief executive officer of Steer for Student Athletes. In addition, he previously served as a member of the Senior Advisory Board of Shopkick. Mr. Eck received his Masters in Management from Northwestern University and his B.S. in Business from the McIntire School of Commerce at the University of Virginia. He was selected to serve on our board of directors because of his extensive knowledge of corporate strategy, corporate financing and accounting, capital investment and operations and the consumer sector.
Linda Heasley is a nominee to our board of directors. Ms. Heasley has served as the Chief Executive Officer of The Honey Baked Ham Company, LLC since February 2017. From February 2013 to September 2016, she was the President and Chief Executive Officer of Lane Bryant, Inc., a division of Ascena Retail Group, Inc., and from October 2016 to February 2017, she was the President and Chief Executive Officer of Plus Fashion Segment, also a division of Ascena Retail Group, Inc. Prior to that, Ms. Heasley served as the Chairman, President and Chief Executive Officer of Limited Stores LLC from August 2007 until February 2013. She has held senior leadership roles at CVS Health Corporation, Timberland LLC and Limited Brands, Inc. Ms. Heasley received her M.B.A. from the University of California, Los Angeles (UCLA) and her A.B. from Harvard University. She was selected to serve on our board of directors because of her expertise in women’s apparel businesses and her extensive experience in leadership positions in the retail industry.
Family Relationships
There are no family relationships among any of our directors or executive officers.
Controlled Company
The shares of our common stock offered in this offering have been approved for listing on the NYSE. As TowerBrook will continue to control more than 50% of our combined voting power upon the completion of this offering, we will be considered a “controlled company” for the purposes of that exchange’s rules and corporate governance standards. As a “controlled company,” we may elect not to comply with certain NYSE corporate governance requirements, including those that would otherwise require our board of directors to have a majority of independent directors and require that we either establish a Compensation and Nominating and Corporate Governance Committees, each comprised entirely of independent directors, or otherwise ensure that the compensation of our executive officers and nominees for directors are determined or recommended to our board of directors by the independent members of our board of directors.
Board Composition
Our board of directors will consist of eight members upon completion of this offering. Each director is to hold office until his or her successor is duly elected and qualified or until his or her earlier death, resignation or removal. The authorized number of each class of directors may be increased or decreased by the stockholders
99
Table of Contents
in accordance with our bylaws. At any meeting of the board of directors, except as otherwise required by law, a majority of the total number of directors then in office will constitute a quorum for all purposes.
Our certificate of incorporation will provide that the board of directors will be divided into three classes of directors, with staggered three-year terms, with the classes to be as nearly equal in number as possible. As a result, approximately one-third of the board of directors will be elected each year. The classification of directors has the effect of making it more difficult for stockholders to change the composition of the board of directors.
In connection with this offering, we will enter into a Stockholders Agreement with TowerBrook. Under the Stockholders Agreement, TowerBrook will have the right, to designate for nomination representatives to our board of directors and committees of our board of directors. TowerBrook will initially be entitled to designate for nomination five of our eight directors. See “Certain Relationships and Related Party Transactions—Stockholders Agreement.”
Director Independence
Our board of directors has determined that Michael Rahamim, Marka Hansen, Michael Eck and Linda Heasley are “independent directors,” as defined by the applicable NYSE rules.
Board Committees
Our board of directors will establish, upon the completion of this offering, an audit committee, a compensation committee and a nominating and corporate governance committee. Each of these committees will operate under a charter that has been approved by our board of directors.
Audit Committee
Our audit committee will assist our board of directors in monitoring the audit of our consolidated financial statements, our independent registered public accounting firm’s qualifications and independence, the performance of our audit function and independent auditors and our compliance with legal and regulatory requirements. The audit committee will have direct responsibility for the appointment, compensation, retention (including termination) and oversight of our independent auditors, and our independent auditors report directly to the audit committee. The audit committee will also review and approve related party transactions as required by the applicable NYSE rules.
Upon completion of this offering, we will have an audit committee consisting of four directors, including at least one member that qualifies as an “audit committee financial expert” as such term is defined in Item 407(d)(5) of Regulation S-K. The audit committee will include directors who are “independent” for purposes of Rule 10A-3 of the Securities Exchange Act of 1934 and under the listing standards of the NYSE.
Compensation Committee
Following the completion of this offering, our compensation committee will be responsible for reviewing and recommending policies relating to the compensation and benefits of our directors and employees, including our Chief Executive Officer and other executive officers.
Because we will be a “controlled company” under the rules of the NYSE, our compensation committee is not required to be comprised entirely of “independent” directors, although if such rules change in the future or we no longer meet the definition of a controlled company under the current rules, we will adjust the composition of the compensation committee accordingly in order to comply with such rules.
The compensation committee will have the sole authority to retain and terminate any compensation consultant to assist in the evaluation of employee compensation and to approve the consultant’s fees and the other terms and conditions of the consultant’s retention.
100
Table of Contents
Nominating and Corporate Governance Committee
Following the completion of this offering, our nominating and corporate governance committee will be responsible for selecting or recommending that our board of directors select candidates for election to our board of directors, developing and recommending to the board of directors corporate governance guidelines that are applicable to us and overseeing board of director and management evaluations.
Because we will be a “controlled company” under the NYSE rules, our nominating and corporate governance committee is not required to be comprised entirely of “independent” directors, although if such rules change in the future or we no longer meet the definition of a controlled company under the current rules, we will adjust the composition of our nominating and corporate governance committee accordingly in order to comply with such rules.
Compensation Committee Interlocks and Insider Participation
None of our executive officers serves, or in the past has served, as a member of the board of directors or compensation committee, or other committee serving an equivalent function, of any entity that has one or more executive officers who serve as members of our board of directors or our compensation committee. None of the members of our compensation committee is, or has ever been, an officer or employee of our company.
Code of Business Conduct and Ethics
Upon consummation of this offering, our board of directors will adopt a code of business conduct and ethics that will apply to all of our directors, officers and employees and is intended to comply with the relevant listing requirements for a code of conduct as well as qualify as a “code of ethics” as defined by the rules of the SEC. The statement will contain general guidelines for conducting our business consistent with the highest standards of business ethics. We intend to disclose future amendments to certain provisions of our code of business conduct and ethics, or waivers of such provisions applicable to any principal executive officer, principal financial officer, principal accounting officer and controller, or persons performing similar functions, and our directors, on our website at www.jjill.com. Following the consummation of this offering, the code of business conduct and ethics will be available on our website.
Board Leadership Structure and Board’s Role in Risk Oversight
The board of directors has an oversight role, as a whole and also at the committee level, in overseeing management of its risks. The board of directors regularly reviews information regarding our credit, liquidity and operations, as well as the risks associated with each. The compensation committee of the board of directors is responsible for overseeing the management of risks relating to its employee compensation plans and arrangements and the audit committee of the board of directors oversees the management of financial risks. While each committee is responsible for evaluating certain risks and overseeing the management of such risks, the entire board of directors is regularly informed through committee reports about such risks.
101
Table of Contents
Summary Compensation Table
The following summary compensation table sets forth information regarding the compensation paid to, awarded to, or earned by our President and Chief Executive Officer and our two other most highly compensated executive officers for services rendered in all capacities during the years ended January 30, 2016 and January 28, 2017.
| Name and Principal Position |
Fiscal Year |
Salary(1) | Stock Awards(2)(3) |
Non-Equity Incentive Plan Compensation(4) |
All Other Compensation(5) |
Total | ||||||||||||||||||
| Paula Bennett President and Chief Executive Officer |
2016 | $ | 729,616 | — | — | $ | 27,415 | $ | 757,031 | |||||||||||||||
| 2015 | $ | 700,000 | $ | 563,165 | $ | 1,657,466 | $ | 1,738,471 | $ | 4,659,102 | ||||||||||||||
| Joann Fielder Executive Vice President, Chief Merchandising and Creative Officer |
2016 | $ | 596,154 | — | — | $ | 3,998 | $ | 600,152 | |||||||||||||||
| 2015 | $ | 546,298 | $ | 175,989 | $ | 688,127 | $ | 1,099,228 | $ | 2,509,642 | ||||||||||||||
| David Biese Senior Vice President, Chief Financial Officer |
2016 | $ | 421,397 | — | — | $ | 4,004 | $ | 425,401 | |||||||||||||||
| 2015 | $ | 420,421 | $ | 140,791 | $ | 447,965 | $ | 1,156,944 | $ | 2,166,121 | ||||||||||||||
| (1) | The base salary reflects the amount actually paid to each named executive for fiscal years 2015 and 2016 and includes the effect of any mid-year adjustments to their base salaries, if applicable. As of the end of fiscal year 2016, the annual base salary rate for Ms. Bennett, Ms. Fielder, and Mr. Biese was $735,000, $600,000, and $443,226, respectively. |
| (2) | All equity awards granted to our named executive officers were in the form of Common Interests of JJill Topco Holdings, which are profits interests. Each profits interest generally entitles the holder, upon a sale transaction or other similar transactions, to a percentage of the appreciation in the equity value of JJill Topco Holdings, arising after the date on which the profits interests was granted (the value of JJill Topco Holdings or of the Common Interests on the date of grant is, in either case, referred to as the “profits interest hurdle”). Therefore, a Common Interest will generally have value only to the extent that the equity value of JJill Topco Holdings has appreciated above the profits interest hurdle applicable to such interest. If, in connection with a sale or similar transactions, there has been no appreciation in the value of JJill Topco Holdings above the applicable profits interest hurdle, no payment will be made with respect to such Common Interests. |
| (3) | There was no public market for the Common Interests in fiscal year 2015, and thus the market value reflected in the table above is based on the total fair market value attributable to all Common Interests on the date of grant, taking into account the applicable profits interest hurdle for each unit and computed in accordance with FASB ASC Topic 718. For information about the assumptions used in these calculations, see Note 16 of the Company’s audited consolidated financial statements for fiscal year 2015 included as part of this registration statement. |
102
Table of Contents
| (4) | Amounts set forth in the Non-Equity Incentive Plan Compensation column for fiscal year 2015 represent cash bonuses paid to each of our named executive officers pursuant to the Company’s Annual Incentive Plan for such year, which bonuses are determined based on the Company’s EBITDA (adjusted to reflect the payment of such bonuses, which is referred to herein as the “adjusted EBITDA”). In fiscal year 2015, the Company achieved an adjusted EBITDA of $91.1 million (which exceeded the adjusted EBITDA target by approximately $13.1 million, resulting in a multiplier of approximately 2.3678x) and the cash bonuses to each of our named executive officers were paid in April 2016. |
The Company’s Annual Incentive Plan for fiscal year 2016 is also measured based on the Company’s adjusted EBITDA. Threshold and target adjusted EBITDA performance goals were established along with their corresponding payout opportunities. As was the case in fiscal year 2015, no bonus pool cap was established to the extent that actual adjusted EBITDA exceeds the target performance goal. The annual target bonus (as a % of base salary) for each of Mses. Bennett and Fielder and Mr. Biese under the Company’s Annual Incentive Plan for fiscal year 2016 is 100%, 60% and 45%, respectively. The following table outlines the adjusted EBITDA performance objectives and the payout multiplier for fiscal year 2016:
| Below Threshold |
Threshold |
Above Threshold but Below Target |
Target |
Above Target | ||||||
| Adjusted EBITDA | < $91.1 million | $91.1 million | >$91.1 million, but < $105.0 million | $105.0 million | > $105.0 million | |||||
| Payout Multiplier | No payout | 0.5x | 0.1x increase to multiplier for every additional $2.78 million in adjusted EBITDA generated | 1.0x | 0.1x increase to multiplier for every additional $1.28 million in adjusted EBITDA generated | |||||
Because the Company’s adjusted EBITDA for fiscal year 2016 has not yet been certified, the amount payable, if any, to our named executive officers under the Company’s Annual Incentive Plan for fiscal year 2016 is not yet determinable. Certification of adjusted EBITDA is expected in April 2017 and, upon such determination, the Company will disclose in a separate filing any amounts paid to our named executive officers under the Company’s Annual Incentive Plan for fiscal year 2016.
| (5) | Amounts shown in the All Other Compensation column for fiscal years 2015 and 2016 represent the following: |
| Discretionary Transaction Bonus (a) |
Make-Whole Bonus (including tax gross-up)(b) |
401(k) Matching Contributions |
Other(c) | |||||||||||||||||||||||||||||
| 2015 | 2016 | 2015 | 2016 | 2015 | 2016 | 2015 | 2016 | |||||||||||||||||||||||||
| Paula Bennett |
$ | 1,672,350 | — | — | — | $ | 3,571 | $ | 4,015 | $ | 62,550 | $ | 23,400 | |||||||||||||||||||
| Joann Fielder |
$ | 1,000,000 | — | $ | 95,455 | — | $ | 3,773 | $ | 3,998 | — | — | ||||||||||||||||||||
| David Biese |
$ | 1,115,000 | — | $ | 38,182 | — | $ | 3,762 | $ | 4,004 | — | — | ||||||||||||||||||||
| (a) | These discretionary transaction bonuses were paid in May 2015 to each named executive officer in connection with the Acquisition. |
| (b) | The so-called “make-whole bonuses” were payable based on the terms of award agreements with Ms. Fielder and Mr. Biese, which provided for payment of a bonus in connection with certain qualifying transactions, including the Acquisition. Pursuant to the terms of the award agreements, the amount of the make-whole bonus was determined based on the value achieved in the qualifying transaction and included a tax gross-up of $25,455 and $10,182 for Ms. Fielder and Mr. Biese, respectively. |
103
Table of Contents
| (c) | The amount in this column is comprised of the following: |
| 2015 | 2016 | |||||||
| Reimbursement of Legal Fees |
$ | 41,150 | $ | 2,000 | ||||
| Car Allowance |
$ | 21,400 | $ | 21,400 | ||||
Employment Agreements
We have entered into employment agreements with each of our named executive officers. In addition to customary terms and provisions, the employment agreements set forth the annual base salary, target bonus percentage, equity grants, terms of severance and eligibility for employee benefits.
Employment Agreement with Paula Bennett, our President and Chief Executive Officer
In connection with the Acquisition, we entered into an employment agreement, which became effective on May 8, 2015, with Paula Bennett to serve as President and Chief Executive Officer of Jill Acquisition, LLC and, following this offering, the Company, until such time as either Ms. Bennett or we terminate Ms. Bennett’s employment. The agreement contemplates that upon the hiring of a new President, Ms. Bennett shall no longer serve as President of the Company, but will remain its Chief Executive Officer. The employment agreement further provides that Ms. Bennett will serve as the senior-most executive officer of Jill Acquisition, LLC or the Company, as applicable, and that, in connection with this offering, she will be nominated as a member of, and shall report directly to, the Company’s board of directors.
Ms. Bennett’s employment agreement provides for an annual base salary of no less than $700,000 (as may be increased (but not decreased) from time to time), a target bonus of 100% of Ms. Bennett’s annual base salary based on achievement of performance targets, and the grant of 8,045,213 Common Interests (which have been made pursuant to an equity grant agreement). The employment agreement provides that Ms. Bennett is entitled to (i) participate in all of our benefit plans and programs (including four weeks of vacation), (ii) indemnification and director and officer liability insurance protection, and (iii) reimbursement of up to $25,000 in legal fees incurred in connection with the negotiation of her employment agreement. Notwithstanding the foregoing, the Company ultimately agreed to reimburse Ms. Bennett $41,150 in legal fees in 2015.
The employment agreement for Ms. Bennett includes confidentiality and assignment of intellectual property provisions, an 18-month post-employment prohibition on competition, and a 24-month post-employment prohibition on solicitation of employees or contract workers with whom Ms. Bennett had material business contact during the course of her employment.
Ms. Bennett is also entitled to severance upon certain terminations of employment, as described below under “Potential Payments Upon Termination of Employment or Change in Control.”
Employment Agreement with Joann Fielder, our Chief Merchandising and Creative Officer
In connection with the Acquisition, we entered into an employment agreement, which became effective on May 8, 2015, with Joann Fielder to serve as Senior Vice President, Chief Creative Officer for an initial five-year term (i.e., through May 8, 2020), which term extends automatically for consecutive one-year periods unless either we or Ms. Fielder provides at least 90 days’ notice of non-renewal prior to the expiration of the initial or any renewal term. The employment agreement provides that Ms. Fielder will report to the Chief Executive Officer. In connection with her promotion to Executive Vice President, Chief Merchandising and Creative Officer, Ms. Fielder’s employment agreement was amended on July 27, 2015, to reflect an increase in salary and target bonus opportunity, and an additional grant of Common Interests.
104
Table of Contents
Pursuant to the terms of her employment agreement, as amended, Ms. Fielder is entitled to a base salary of no less than $575,000 per year (as may be increased (but not decreased) from time to time) and a target bonus of 60% of her annual base salary based on achievement of performance targets. In addition, Ms. Fielder received two grants of Common Interests: (i) 2,011,303 units granted on May 22, 2015, and (ii) an additional 502,826 units were granted on July 27, 2015, in connection with her promotion. The employment agreement provides that Ms. Fielder is entitled to participate in all of our benefit plans and programs.
Ms. Fielder’s employment agreement includes customary terms and conditions, including confidentiality and assignment of intellectual property provisions, a 12-month post-employment prohibition on competition, a 12-month post-employment prohibition on solicitation of customers, and a 12-month post-employment prohibition on solicitation of employees, agents, or contract workers with whom Ms. Fielder had material business contact during the course of her employment.
Ms. Fielder is also entitled to severance upon certain terminations of employment, as described below under “Potential Payments Upon Termination of Employment or Change in Control.”
Employment Agreement with David Biese, our Chief Financial Officer
In connection with the Acquisition, we entered into an employment agreement, which became effective on May 8, 2015, with David Biese to serve as Senior Vice President, Chief Financial Officer for an initial five-year term (i.e., through May 8, 2020), which term extends automatically for consecutive one-year periods unless either we or Mr. Biese provides at least 90 days’ notice of non-renewal prior to the expiration of the initial or any renewal term. The employment agreement provides that Mr. Biese will report to the Chief Executive Officer.
Pursuant to the terms his employment agreement, Mr. Biese is entitled to a base salary of no less than $423,225, (as may be increased (but not decreased) from time to time) a target bonus of 45% of his annual base salary based on achievement of performance targets, and a grant of 2,011,303 Class A Common Units. The employment agreement provides that Mr. Biese is entitled to participate in all of our benefit plans and programs.
Mr. Biese’s employment agreement includes customary terms and conditions, including confidentiality and assignment of intellectual property provisions, a six-month post-employment prohibition on competition against any businesses of Sycamore Partners or any of its affiliates or portfolio companies or Golden Gate Capital or any of its affiliates or portfolio companies (i.e., predecessor owners), a 12-month post-employment prohibition on solicitation of customers, and a 12-month post-employment prohibition on solicitation of employees, agents, or contract workers with whom Mr. Biese had material business contact during the course of his employment.
Mr. Biese is also entitled to severance upon certain terminations of employment, as described below under “Potential Payments Upon Termination of Employment or Change in Control.”
Outstanding Equity Awards at Fiscal Year-End
The following table provides information about the outstanding equity awards held by our named executive officers as of January 28, 2017.
| Name |
Number of Shares or Units of Stock (Unvested Common Units) |
Market Value of Shares or Units of |
||||||
| Paula Bennett |
5,363,475 | (1) | $ | 10,887,855 | ||||
| Joann Fielder |
1,340,869 | (2) | $ | 2,721,963 | ||||
| 335,217 | (3) | $ | 680,491 | |||||
| David Biese |
1,340,869 | (2) | $ | 2,721,963 | ||||
105
Table of Contents
| (1) | Grant scheduled to vest in installments of approximately 134,087 units beginning on June 8, 2015, and on the eighth day of each successive month through May 8, 2020. On October 23, 2015, Ms. Bennett transferred all of her Common Interests to BNY Mellon Trust of Delaware, in its capacity as trustee to the Paula L. Bennett 2015 Family Trust. |
| (2) | Grant scheduled to vest in installments of approximately 33,522 units beginning on May 31, 2015, and on the last day of each successive month through April 30, 2020. |
| (3) | Grant scheduled to vest in installments of approximately 8,380 units beginning on July 31, 2015, and on the last day of each successive month through April 30, 2020. |
| (4) | There was no public market for the Common Interests as of January 28, 2017, and thus the market value reflected in the table above is based on the total fair market value of $2.03 per Common Interest, as determined by the board of directors of JJill Topco Holdings in consultation with a third-party valuation firm in January 2017, taking into account the applicable profits interest hurdle for each unit and a marketability discount of 6%. |
Retirement Benefits
We sponsor a 401(k) plan, which is a qualified retirement plan offered to all eligible employees, including our named executive officers, and which permits eligible employees to elect to defer a portion of their compensation on a pre-tax basis. Pursuant to the terms of the 401(k) plan, we provide a company match of 50% of a named executive’s contributions to the plan, up to a maximum of 3% of such executive’s eligible annual compensation. We do not maintain any defined benefit pension plans or any nonqualified deferred compensation plans.
Potential Payments Upon Termination of Employment or Change in Control
Paula Bennett
Mandatory Retirement (termination without “cause”) and/or “Good Reason” Resignation: Upon a termination of employment by us without “cause” (referred to in Ms. Bennett’s employment agreement as a “mandatory retirement”) or a resignation by Ms. Bennett for “good reason,” then upon the execution of an irrevocable release of claims and continued material compliance with the terms of the restrictive covenants set forth in her employment agreement, Ms. Bennett shall be entitled to receive the following:
| • | Payment of any accrued benefits including accrued base salary, benefits, reimbursement of business expenses through the date of termination as well as payment of the unpaid annual bonus for the year preceding the year of termination (except in the event of a termination for “cause”), continued indemnification, and continued right to director & officer liability insurance coverage for a period of six years following such termination of employment, which are collectively referred to herein as “accrued benefits”; |
| • | An annual bonus for the year of termination (without proration) based on actual results (with any personal non-financial performance goals deemed achieved at 100%), payable at the time annual bonuses are paid to active employees; |
| • | If such termination of employment occurs prior to November 8, 2017: |
| • | Base salary continuation for a period of 18 months following the date of termination; and |
| • | Medical and dental coverage continuation for 18 months following the date of termination with the costs of the premiums shared in the same proportion as before the termination of Ms. Bennett’s employment (unless such coverage is otherwise obtained through a new employer); and |
106
Table of Contents
| • | Full acceleration of any then-unvested Common Interests if such termination of employment occurs (i) at any time on and after a change in control, (ii) at any time following the execution of a merger, acquisition, sale, or other agreement providing for a change in control (but before the consummation of such change in control), (iii) within six months prior to consummation of a change in control, or (iv) at any time following this offering. |
If the severance payments and vesting described above would be a “parachute payment” resulting in a lost tax deduction for the Company under Section 280G of the Code and excise tax to Ms. Bennett under Section 4999 of the Code, the payments and vesting would be reduced to the extent that such reduction would leave Ms. Bennett with a greater after-tax amount.
Voluntary Retirement: If Ms. Bennett voluntarily resigns without “good reason” upon at least six months’ notice or such shorter period as mutually agreed between Ms. Bennett and the board of directors, with any such resignation to become effective on or after November 8, 2017 (defined in Ms. Bennett’s employment agreement as a “voluntary retirement”), then upon the execution of an irrevocable release of claims, Ms. Bennett shall be entitled to receive the following:
| • | Accrued benefits; and |
| • | An annual bonus for the year of termination (prorated for the number of days of employment through such year) based on actual results (with any personal non-financial performance goals deemed achieved at 100%), payable at the time annual bonuses are paid to active employees. |
All other terminations of employment: Upon any other termination of employment, including a resignation without “good reason” that does not qualify as a voluntary retirement, Ms. Bennett shall be entitled only to accrued benefits (except that, if Ms. Bennett is terminated for “cause,” she shall not be entitled to any unpaid annual bonus for the year preceding such termination of employment for “cause”).
Joann Fielder and David Biese
Termination without “Cause” and/or “Good Reason” Resignation: Upon a termination of employment by us without “cause” or a resignation by either Mr. Biese or Ms. Fielder for “good reason,” then upon the execution of an irrevocable release of claims and continued compliance with the terms of the restrictive covenants set forth in his or her respective employment agreement, Mr. Biese or Ms. Fielder, as applicable, shall be entitled to:
| • | Payment of any accrued benefits including accrued base salary, benefits and reimbursement of business expenses due through the date of termination; |
| • | Base salary continuation for a period of 12 months following the date of termination; and, for Mr. Biese only, an annual bonus for the year of termination based on actual results for the entire year, payable at the time annual bonuses are paid to active employees and prorated for the number of full weeks of employment in the year of termination; |
| • | Medical and dental coverage continuation for 12 months following the date of termination with the costs of the premiums shared in the same proportion as before the termination of such executive’s employment (unless such coverage is otherwise obtained through a new employer); and |
| • | If such termination occurs within 12 months following a change in control, full acceleration of any then-unvested Common Interests. |
If the severance payments and vesting described above would be a “parachute payment” resulting in a lost tax deduction for the Company under Section 280G of the Code and excise tax to the executive under Section 4999 of the Code, such payments and vesting would be reduced to the extent necessary to avoid the imposition of any excise tax or loss in tax deduction.
107
Table of Contents
Resignation without “Good Reason” (Mr. Biese only). Provided that Mr. Biese has given at least 90 days’ prior written notice of his intent to resign without “good reason” and that he continues to provide services to us through such period (or such shorter period as mutually agreed to by the board of directors and Mr. Biese), then upon the execution of an irrevocable release of claims and continued compliance with the terms of the restrictive covenants set forth in his employment agreement, Mr. Biese shall be entitled to:
| • | Payments of any accrued benefits including accrued base salary, benefits and reimbursement of business expenses due through the date of termination; and |
| • | An annual bonus for the year of termination based on actual results for the entire year, payable at the time annual bonuses are paid to active employees and prorated for the number of full weeks of employment in the year of termination. |
All other terminations of employment: Upon any other termination of employment, and except as set forth above, Mr. Biese or Ms. Fielder, as applicable, will be entitled only to accrued base salary and benefits through the date of termination.
Definitions of “Cause” and “Good Reason”
For purposes of Ms. Bennett’s employment agreement, the definition of “cause” generally means her (i) willful breach of certain provisions of the restrictive covenants contained in her employment agreement; (ii) willful failure to follow a lawful directive of the board of directors; (iii) willful or gross neglect in the performance or nonperformance of any of her duties or responsibilities; (iv) dishonesty with respect to any material matter arising in the performance of her duties that results in material injury to our financial condition or reputation, or fraud or willful misconduct in connection with her duties; (v) use of alcohol or drugs in a manner that materially interferes with the performance of her duties; or (vi) conviction or plea of no contest to any misdemeanor involving theft, fraud, dishonesty, or act of moral turpitude or to any felony. For purposes of Mr. Biese’s and Ms. Fielder’s employment agreements, “cause” generally means such executive’s (i) breach of any material provisions of his or her employment agreement; (ii) failure to follow a lawful directive of his or her reporting officer; (iii) negligence in the performance or nonperformance of any of his or her duties or responsibilities; (iv) dishonesty, fraud, or willful misconduct with respect to our business or affairs; (v) conviction of or plea of no contest to any misdemeanor involving theft, fraud, dishonesty, or act of moral turpitude or to any felony; or (vi) use of alcohol or drugs in a manner that materially interferes with the performance of his or her duties.
For purposes of Ms. Bennett’s employment agreement, the definition of “good reason” generally means (i) a material reduction in her duties and responsibilities (other than in respect of her removal as President following the hiring of an individual with such title); (ii) her removal as Chief Executive Officer (or President, if applicable) or failure to elect or reelect her as a member of the board of directors; (iii) a reduction in her base salary or target annual bonus; (iv) her ceasing to serve as the senior-most executive officer of the Company (or any entity that directly or indirectly owns 100% of Jill Acquisition, LLC’s securities and/or assets); (v) a change in reporting structure such that Ms. Bennett no longer reports to the board of directors; (vi) the failure of any executive officer (other than the chief legal/compliance officer) to report directly to Ms. Bennett; (vii) a material breach of her Common Interest award agreement; or (viii) the relocation of Ms. Bennett’s work location outside of the Quincy, Massachusetts area. For purposes of Mr. Biese’s and Ms. Fielder’s employment agreements, “good reason” generally means (i) a reduction in such executive’s title below the level of Senior Vice President or Executive Vice President, as applicable; (ii) a material reduction in his or her base salary; or (iii) a relocation of their principal work location outside of the Quincy, Massachusetts area.
Estimated Payments Upon Termination of Employment or Change in Control
The description below shows the severance payments and benefits that each named executive officer would, if applicable, have received had his or her employment been terminated, (1) due to his or her resignation
108
Table of Contents
without “good reason” or (2) by us without “cause” (including, for Ms. Bennett, a “mandatory retirement”) or pursuant to a resignation with “good reason,” whether prior to or following a change in control. The amounts are calculated as if the date of termination and, as applicable, the change in control, occurred on January 28, 2017.
Paula Bennett
| • | Mandatory Retirement (termination without “cause”) and/or “Good Reason” Resignation: $1,119,625, which represents the sum of (x) $1,102,500 in base salary continuation for a period of 18 months following the date of termination, (y) $17,125 in continued medical and dental coverage for a period of 18 months following the date of termination, and (z) an annual bonus for the year of termination based on actual results. Since adjusted EBITDA for fiscal year 2016 has not yet been determined, the amount that would be payable in respect of Ms. Bennett’s annual bonus is not yet determinable (Ms. Bennett’s target annual bonus is equal to 100% of her annual base salary). In the event that such mandatory retirement or “good reason” resignation were to occur following, or within six months prior to, a change in control, Ms. Bennett would be entitled to an additional $10,887,855 in respect of the acceleration of her then-unvested Common Interests. |
Joann Fielder
| • | Termination without “Cause” and/or “Good Reason” Resignation: $616,694, which represents the sum of (x) $600,000 in base salary continuation for a period of 12 months following the date of termination and (y) $16,694 in continued medical and dental coverage for a period of 12 months following the date of termination. In the event that such termination were to occur within 12 months following a change in control, Ms. Fielder would be entitled to an additional $3,402,454 in respect of the acceleration of her then-unvested Common Interests. |
David Biese
| • | Termination without “Cause” and/or “Good Reason” Resignation: $459,920, which represents the sum of (x) $443,226 in base salary continuation for a period of 12 months following the date of termination, (y) $16,694 in continued medical and dental coverage for a period of 12 months following the date of termination, and (z) an annual bonus for the year of termination based on actual results and prorated for the number of full weeks of employment through January 28, 2017. Since adjusted EBITDA for fiscal year 2016 has not yet been determined, the amount that would be payable in respect of Mr. Biese’s annual bonus is not yet determinable (Mr. Biese’s target annual bonus is equal to 45% of his annual base salary). In the event that such termination were to occur within 12 months following a change in control, Mr. Biese would be entitled to an additional $2,721,963 in respect of the acceleration of his then-unvested Common Interests. |
| • | Resignation without “Good Reason”: An annual bonus for the year of termination based on actual results and prorated for the number of full weeks of employment through January 28, 2017. Since adjusted EBITDA for fiscal year 2016 has not yet been determined, the amount that would be payable in respect of Mr. Biese’s annual bonus is not yet determinable (Mr. Biese’s target annual bonus is equal to 45% of his annual base salary). |
A change in control, as defined in the JJill Topco Holdings partnership agreement, includes (i) the sale of all or substantially all of the assets of JJill Topco Holdings on a consolidated basis, (ii) a sale of all or substantially all of the equity interests of JJill Topco Holdings (in either case, whether by merger, recapitalization, consolidation, reorganization, combination or otherwise), or (iii) any other transaction having the same effect as any of the foregoing. This offering will not constitute a change in control for purposes of determining acceleration of outstanding equity.
109
Table of Contents
Compensation of Directors
In fiscal years 2015 and 2016, as a member-managed limited liability company, the Company did not have a board of directors. Upon our conversion from a Delaware limited liability company to a Delaware corporation prior to the closing of this offering, we shall appoint certain directors of JJill Holdings, our parent, to serve as members of our newly formed board of directors, as described above under “Management.” We anticipate that each of our non-employee directors will receive an annual director fee, fees for attending meetings of the board of directors as well as committee meetings and equity awards in connection with their services. In addition, each director will be reimbursed for out-of-pocket expenses in connection with their services. As of the time of this offering, we are evaluating the specific terms of our director compensation program.
Looking Ahead: Post-IPO Compensation Program Features
Tax Considerations
For U.S. federal income tax purposes, public companies may generally not deduct any portion of compensation that is in excess of $1 million paid in a taxable year to a named executive officer unless that compensation qualifies as “performance-based compensation” under Section 162(m) of the Code. Nevertheless, we expect to be eligible for transition relief from the deduction limitations until our first stockholder meeting at which directors are elected that occurs in 2021. In addition, our board of directors believes that it should not be constrained by the requirements of Section 162(m) of the Code where those requirements would impair flexibility in compensating our named executive officers in a manner that can best promote our corporate objectives. We intend to continue to compensate our executive officers in a manner consistent with the best interests of our stockholders and reserve the right to award compensation that may not be deductible under Section 162(m) of the Code where the Company believes it is appropriate to do so.
Section 409A of the Code requires that “nonqualified deferred compensation” be deferred and paid under plans or arrangements that satisfy the requirements of the statute and regulates with respect to the timing of deferral elections, timing of payments, and certain other matters. Failure to satisfy these requirements can expose employees and other service providers to accelerated income tax liabilities, penalty taxes, and interest on their vested compensation under such plans. Accordingly, as a general matter, it is our intention to design and administer our compensation and benefits plans and arrangements for all of our employees and other service providers, including our named executive officers, so that they are either exempt from, or satisfy the requirements of, Section 409A of the Code.
Clawback Policy
In connection with or following this offering, we intend to seek approval of our board of directors to voluntarily adopt a policy that would require an executive to repay to us any excess incentive compensation paid to such individual should the misconduct of that individual result in the restatement of our financials. In addition, we reserve the right to adopt any additional clawback policies as may be necessary to protect our compensation policies and objectives and as may be required by law, including mandates under the Dodd-Frank Wall Street Reform and Consumer Protection Act of 2010.
Anti-Hedging or Pledging Policy
In connection with or following this offering, we intend to seek approval of our board of directors to adopt a policy prohibiting directors and named executive officers from engaging in any hedging or similar transaction involving common stock, holding common stock in a margin account, or pledging common stock as collateral for loan.
110
Table of Contents
Equity Incentive Plan
Our board of directors plans to adopt and our current stockholders plan to approve, the 2017 Omnibus Equity Incentive Plan (the “Equity Incentive Plan”) to become effective upon the consummation of this offering. The following is a summary of certain terms and conditions of the Equity Incentive Plan. This summary is qualified in its entirety by reference to the Equity Incentive Plan, which is attached as an exhibit to this registration statement. You are encouraged to read the full Equity Incentive Plan.
Administration. The compensation committee of our board of directors (or subcommittee thereof, if necessary for Section 162(m) of the Code) (the “Compensation Committee”) will administer the Equity Incentive Plan. The Compensation Committee will have the authority to determine the terms and conditions of any agreements evidencing any awards granted under the Equity Incentive Plan and to adopt, alter and repeal rules, guidelines and practices relating to the Equity Incentive Plan. The Compensation Committee will have full discretion to administer and interpret the Equity Incentive Plan and to adopt such rules, regulations and procedures as it deems necessary or advisable and to determine, among other things, the time or times at which the awards may be exercised and whether and under what circumstances an award may be exercised.
Eligibility. Any current or prospective employees, directors, officers, consultants or advisors of the Company or its affiliates who are selected by the Compensation Committee will be eligible for awards under the Equity Incentive Plan. The Compensation Committee will have the sole and complete authority to determine who will be granted an award under the Equity Incentive Plan.
Number of Shares Authorized. The Equity Incentive Plan provides for an aggregate of 2,237,303 shares of our common stock. No more than 2,237,303 shares of our common stock may be issued with respect to incentive stock options under the Equity Incentive Plan. No participant may be granted awards of options and stock appreciation rights with respect to more than 570,000 shares of our common stock in any 12-month period. No more than 570,000 shares of our common stock may be granted under the Equity Incentive Plan with respect to any performance compensation awards to any participant during a performance period (or with respect to each year if the performance period is more than one year). The maximum amount payable to any participant under the Equity Incentive Plan for any single year during a performance period (or with respect to each single year in the event a performance period extends beyond a single year) for a cash denominated award that is intended to qualify as performance-based compensation under Section 162(m) of the Code is $5,000,000. The maximum grant date fair value of cash and equity awards that may be awarded to a non-employee director under the Equity Incentive Plan during any one fiscal year will be $300,000. If any award granted under the Equity Incentive Plan expires, terminates, or is canceled or forfeited without being settled or exercised, or if a stock appreciation right is settled in cash or otherwise without the issuance of shares, shares of our common stock subject to such award will again be made available for future grants. In addition, if any shares are surrendered or tendered to pay the exercise price of an award or to satisfy withholding taxes owed, such shares will again be available for grants under the Equity Incentive Plan.
Change in Capitalization. If there is a change in our capitalization in the event of a stock or extraordinary cash dividend, recapitalization, stock split, reverse stock split, reorganization, merger, consolidation, split-up, split-off, spin-off, combination, repurchase or exchange of shares of our common stock or other relevant change in capitalization or applicable law or circumstances, such that the Compensation Committee determines that an adjustment to the terms of the Equity Incentive Plan (or awards thereunder) is necessary or appropriate, then the Compensation Committee shall make adjustments in a manner that it deems equitable. Such adjustments may be to the number of shares reserved for issuance under the Equity Incentive Plan, the number of shares covered by awards then outstanding under the Equity Incentive Plan, the limitations on awards under the Equity Incentive Plan, or the exercise price of outstanding options, or such other equitable substitution or adjustments as it may determine appropriate.
Awards Available for Grant. The Compensation Committee may grant awards of non-qualified stock options, incentive (qualified) stock options, stock appreciation rights (“SARs”), restricted stock awards, restricted
111
Table of Contents
stock units, other stock-based awards, performance compensation awards (including cash bonus awards), other cash-based awards or any combination of the foregoing. Awards may be granted under the Equity Incentive Plan in assumption of, or in substitution for, outstanding awards previously granted by an entity acquired by the Company or with which the Company combines, which are referred to herein as “Substitute Awards.”
Stock Options. The Compensation Committee will be authorized to grant options to purchase shares of our common stock that are either “qualified,” meaning they are intended to satisfy the requirements of Section 422 of the Code for incentive stock options, or “non-qualified,” meaning they are not intended to satisfy the requirements of Section 422 of the Code. All options granted under the Equity Incentive Plan shall be non-qualified unless the applicable award agreement expressly states that the option is intended to be an “incentive stock option.” Options granted under the Equity Incentive Plan will be subject to the terms and conditions established by the Compensation Committee. Under the terms of the Equity Incentive Plan, the exercise price of the options will not be less than the fair market value of our common stock at the time of grant (except with respect to Substitute Awards). Options granted under the Equity Incentive Plan will be subject to such terms, including the exercise price and the conditions and timing of exercise, as may be determined by the Compensation Committee and specified in the applicable award agreement. The maximum term of an option granted under the Equity Incentive Plan will be ten years from the date of grant (or five years in the case of a qualified option granted to a 10% stockholder), provided that if the term of a non-qualified option would expire at a time when trading in the shares of our common stock is prohibited by the Company’s insider trading policy, the option’s term shall be extended automatically until the 30th day following the expiration of such prohibition (as long as such extension shall not violate Section 409A of the Code). Payment in respect of the exercise of an option may be made in cash, by check, by cash equivalent and/or by delivery of shares of our common stock valued at the fair market value at the time the option is exercised, provided that such shares are not subject to any pledge or other security interest, or by such other method as the Compensation Committee may permit in its sole discretion, including (i) by delivery of other property having a fair market value equal to the exercise price and all applicable required withholding taxes, (ii) if there is a public market for the shares of our common stock at such time, by means of a broker-assisted cashless exercise mechanism or (iii) by means of a “net exercise” procedure effected by withholding the minimum number of shares otherwise deliverable in respect of an option that are needed to pay the exercise price and all applicable required withholding taxes. Any fractional shares of common stock will be settled in cash.
Stock Appreciation Rights. The Compensation Committee will be authorized to award SARs under the Equity Incentive Plan. SARs will be subject to the terms and conditions established by the Compensation Committee. A SAR is a contractual right that allows a participant to receive, in the form of either cash, shares or any combination of cash and shares, the appreciation, if any, in the value of a share over a certain period of time. An option granted under the Equity Incentive Plan may include SARs, and SARs may also be awarded to a participant independent of the grant of an option. SARs granted in connection with an option shall be subject to terms similar to the option corresponding to such SARs, including with respect to vesting and expiration. Except as otherwise provided by the Compensation Committee (in the case of Substitute Awards or SARs granted in tandem with previously granted options), the strike price per share of our common stock underlying each SAR shall not be less than 100% of the fair market value of such share, determined as of the date of grant and the maximum term of a SAR granted under the Equity Incentive Plan will be ten years from the date of grant. The remaining terms of each grant of SARs shall be established by the Compensation Committee and reflected in the award agreement.
Restricted Stock. The Compensation Committee will be authorized to grant restricted stock under the Equity Incentive Plan, which will be subject to the terms and conditions established by the Compensation Committee. Restricted stock is common stock that is generally non-transferable and is subject to other restrictions determined by the Compensation Committee for a specified period. Any accumulated dividends will be payable at the same time that the underlying restricted stock vests.
Restricted Stock Unit Awards. The Compensation Committee will be authorized to grant restricted stock unit awards, which will be subject to the terms and conditions established by the Compensation Committee. A
112
Table of Contents
restricted stock unit award, once vested, may be settled in a number of shares of our common stock equal to the number of units earned, or in cash equal to the fair market value of the number of shares of our common stock, earned in respect of such restricted stock unit award of units earned, at the election of the Compensation Committee. Restricted stock units may be settled at the expiration of the period over which the units are to be earned or at a later date selected by the Compensation Committee. To the extent provided in an award agreement, the holder of outstanding restricted stock units shall be entitled to be credited with dividend equivalent payments upon the payment by us of dividends on shares of our common stock, either in cash or, at the sole discretion of the Compensation Committee, in shares of our common stock having a fair market value equal to the amount of such dividends, and interest may, at the sole discretion of the Compensation Committee, be credited on the amount of cash dividend equivalents at a rate and subject to such terms as determined by the Compensation Committee, which accumulated dividend equivalents (and interest thereon, if applicable) shall be payable at the same time that the underlying restricted stock units are settled.
Other Stock-Based Awards. The Compensation Committee will be authorized to grant awards of unrestricted shares of our common stock, rights to receive grants of awards at a future date or other awards denominated in shares of our common stock under such terms and conditions as the Compensation Committee may determine and as set forth in the applicable award agreement.
Performance Compensation Awards. The Compensation Committee may grant any award under the Equity Incentive Plan in the form of a “Performance Compensation Award” (including cash bonuses) intended to qualify as performance-based compensation for purposes of Section 162(m) of the Code by conditioning the number of shares earned or vested, or any payout, under the award on the satisfaction of certain “Performance Goals.” The Compensation Committee may establish these Performance Goals with reference to one or more of the following:
| • | net earnings or net income (before or after taxes); |
| • | basic or diluted earnings per share (before or after taxes); |
| • | net revenue or net revenue growth; |
| • | gross revenue or gross revenue growth, gross profit or gross profit growth; |
| • | net operating profit (before or after taxes); |
| • | return measures (including, but not limited to, return on investment, assets, net assets, capital, gross revenue or gross revenue growth, invested capital, equity or sales); |
| • | cash flow measures (including, but not limited to, operating cash flow, free cash flow and cash flow return on capital), which may but are not required to be measured on a per-share basis; |
| • | earnings before or after taxes, interest, depreciation, and amortization (including EBIT and EBITDA); |
| • | gross or net operating margins; |
| • | productivity ratios; |
| • | share price (including, but not limited to, growth measures and total shareholder return); |
| • | expense targets or cost reduction goals, general and administrative expense savings; |
113
Table of Contents
| • | operating efficiency; |
| • | objective measures of customer satisfaction; |
| • | working capital targets; |
| • | measures of economic value added or other “value creation” metrics; |
| • | enterprise value; |
| • | stockholder return; |
| • | customer retention; |
| • | competitive market metrics; |
| • | employee retention; |
| • | total company comparable sales; |
| • | objective measures of personal targets, goals or completion of projects (including but not limited to succession and hiring projects, completion of specific acquisitions, reorganizations or other corporate transactions or capital-raising transactions, expansions of specific business operations and meeting divisional or project budgets); |
| • | system-wide revenues; |
| • | cost of capital, debt leverage year-end cash position or book value; |
| • | strategic objectives, development of new product lines and related revenue, sales and margin targets, or international operations; or |
| • | any combination of the foregoing. |
Any Performance Goal elements can be stated as a percentage of another Performance Goal or used on an absolute, relative or adjusted basis to measure the performance of the Company and/or its affiliates or any divisions, operations or business units, product lines, asset classes, brands, or administrative departments or any combination thereof, as the Compensation Committee deems appropriate. Performance Goals may be compared to the performance of a group of comparator companies or a published or special index that the Compensation Committee deems appropriate or stock market indices. The Compensation Committee may provide for accelerated vesting of any award based on the achievement of Performance Goals. Any award that is intended to qualify as “performance-based compensation” under Section 162(m) of the Code will be granted, and Performance Goals for such an award will be established, by the Compensation Committee in writing not later than 90 days after the commencement of the performance period to which the Performance Goals relate, or such other period required under Section 162(m) of the Code. Before any payment is made in connection with any award intended to qualify as performance-based compensation under Section 162(m) of the Code, the Compensation Committee must certify in writing that the Performance Goals established with respect to such award have been achieved. In determining the actual amount of an individual participant’s Performance Compensation Award for a performance period, the Compensation Committee may reduce or eliminate the amount of the Performance Compensation Award earned consistent with Section 162(m) of the Code.
114
Table of Contents
The Compensation Committee may also specify adjustments or modifications (to the extent that it would not result in adverse consequences under Section 162(m) of the Code) to be made to the calculation of a Performance Goal for such performance period, based on and in order to appropriately reflect any of the following events: (i) asset write-downs; (ii) litigation or claim judgments or settlements; (iii) the effect of changes in tax laws, accounting principles, or other laws or regulatory rules affecting reported results; (iv) any reorganization and restructuring programs; (v) extraordinary nonrecurring items and/or in management’s discussion and analysis of financial condition and results of operations appearing in the Company’s annual report to stockholders for the applicable year; (vi) acquisitions or divestitures; (vii) any other specific, unusual or nonrecurring events; (viii) foreign exchange gains and losses; (ix) discontinued operations and nonrecurring charges; and (x) a change in our fiscal year.
Unless otherwise provided in the applicable award agreement, a participant shall be eligible to receive payment in respect of a Performance Compensation Award only to the extent that (i) the Performance Goals for such period are achieved and certified by the Compensation Committee; and (ii) all or some of the portion of such participant’s Performance Compensation Award has been earned for the performance period based on the application of the “Performance Formula” (as defined in the Equity Incentive Plan) to such Performance Goals.
Effect of a Change in Control. Unless otherwise provided in an award agreement, or any applicable employment, consulting, change in control, severance or other agreement between a participant and us, in the event of a change in control, if (A) the buyer or successor company has agreed to provide for the substitution, assumption, exchange or other continuation of equity awards granted pursuant to the Equity Incentive Plan, then in the event that a participant’s employment or service is involuntarily terminated other than for cause (and other than due to death or disability) within the 12-month period following a change in control or (B) if the buyer or successor company has not agreed to a provision for the substitution, assumption, exchange or other continuation of equity awards granted pursuant to the Equity Incentive Plan, then, in either case, (i) all then-outstanding options and SARs will become immediately exercisable as of such participant’s date of termination with respect to all of the shares subject to such option or SAR; and/or (ii) the restricted period shall expire as of such participant’s date of termination with respect to all of the then-outstanding shares of restricted stock or restricted stock units (including without limitation a waiver of any applicable Performance Goals); provided that any award whose vesting or exercisability is otherwise subject to the achievement of performance conditions, the portion of such award that shall become fully vested and immediately exercisable shall be based on the assumed achievement of target performance as determined by the Compensation Committee and prorated for the number of days elapsed from the grant date of such award through the date of termination. In addition, the Compensation Committee may in its discretion and upon at least ten days’ notice to the affected persons, cancel any outstanding award and pay the holders, in cash, securities or other property (including of the acquiring or successor company), or any combination thereof, the value of such awards based upon the price per share of our common stock received or to be received by other stockholders of the Company in the event. Notwithstanding the above, the Compensation Committee shall exercise such discretion over the timing or settlement of any award subject to Section 409A of the Code at the time such award is granted.
Nontransferability. Each award may be exercised during the participant’s lifetime by the participant or, if permissible under applicable law, by the participant’s guardian or legal representative. No award may be assigned, alienated, pledged, attached, sold or otherwise transferred or encumbered by a participant other than by will or by the laws of descent and distribution unless the Compensation Committee permits the award to be transferred to a permitted transferee (as defined in the Equity Incentive Plan).
Amendment. The Equity Incentive Plan will have a term of ten years. The board of directors may amend, suspend or terminate the Equity Incentive Plan at any time, subject to stockholder approval if necessary to comply with any tax, NYSE or other applicable regulatory requirement. No amendment, suspension or termination will materially and adversely affect the rights of any participant or recipient of any award without the consent of the participant or recipient.
115
Table of Contents
The Compensation Committee may, to the extent consistent with the terms of any applicable award agreement, waive any conditions or rights under, amend any terms of, or alter, suspend, discontinue, cancel or terminate, any award theretofore granted or the associated award agreement, prospectively or retroactively; provided that any such waiver, amendment, alteration, suspension, discontinuance, cancellation or termination that would materially and adversely affect the rights of any participant or any holder or beneficiary of any option theretofore granted will not to that extent be effective without the consent of the affected participant, holder or beneficiary; and provided further that, without stockholder approval, (i) no amendment or modification may reduce the option price of any option or the strike price of any SAR, (ii) the Compensation Committee may not cancel any outstanding option and replace it with a new option (with a lower exercise price) or cancel any SAR and replace it with a new SAR (with a lower strike price) or other award or cash in a manner that would be treated as a repricing (for compensation disclosure or accounting purposes) and (iii) the Compensation Committee may not take any other action considered a repricing for purposes of the stockholder approval rules of the applicable securities exchange on which our common shares are listed. However, stockholder approval is not required with respect to clauses (i), (ii), and (iii) above with respect to certain adjustments on changes in capitalization. In addition, none of the requirements described in the preceding clauses (i), (ii), and (iii) can be amended without the approval of our stockholders.
U.S. Federal Income Tax Consequences
The following is a general summary of the material U.S. federal income tax consequences of the grant, exercise and vesting of awards under the Equity Incentive Plan and the disposition of shares acquired pursuant to the exercise or settlement of such awards and is intended to reflect the current provisions of the Code and the regulations thereunder. This summary is not intended to be a complete statement of applicable law, nor does it address foreign, state, local or payroll tax considerations. This summary assumes that all awards described in the summary are exempt from, or comply with, the requirement of Section 409A of the Code. Moreover, the U.S. federal income tax consequences to any particular participant may differ from those described herein by reason of, among other things, the particular circumstances of such participant.
Stock Options. Holders of incentive stock options will generally incur no federal income tax liability at the time of grant or upon vesting or exercise of those options. However, the spread at exercise will be an “item of tax preference,” which may give rise to “alternative minimum tax” liability for the taxable year in which the exercise occurs. If the holder does not dispose of the shares before the later of two years following the date of grant and one year following the date of exercise, the difference between the exercise price and the amount realized upon disposition of the shares will constitute long-term capital gain or loss, as the case may be. Assuming the holding period is satisfied, no deduction will be allowed to us for federal income tax purposes in connection with the grant or exercise of the incentive stock option. If, within two years following the date of grant or within one year following the date of exercise, the holder of shares acquired through the exercise of an incentive stock option disposes of those shares, the participant will generally realize taxable compensation at the time of such disposition equal to the difference between the exercise price and the lesser of the fair market value of the share on the date of exercise or the amount realized on the subsequent disposition of the shares, and that amount will generally be deductible by us for federal income tax purposes, subject to the possible limitations on deductibility under Sections 280G and 162(m) of the Code for compensation paid to executives designated in those Sections. Finally, if an incentive stock option becomes first exercisable in any one year for shares having an aggregate value in excess of $100,000 (based on the grant date value), the portion of the incentive stock option in respect of those excess shares will be treated as a non-qualified stock option for federal income tax purposes.
No income will be realized by a participant upon grant or vesting of an option that does not qualify as an incentive stock option (“a non-qualified stock option”). Upon the exercise of a non-qualified stock option, the participant will recognize ordinary compensation income in an amount equal to the excess, if any, of the fair market value of the underlying exercised shares over the option exercise price paid at the time of exercise, and the participant’s tax basis will equal the sum of the compensation income recognized and the exercise price. We
116
Table of Contents
will be able to deduct this same excess amount for U.S. federal income tax purposes, but such deduction may be limited under Sections 280G and 162(m) of the Code for compensation paid to certain executives designated in those Sections. In the event of a sale of shares received upon the exercise of a non-qualified stock option, any appreciation or depreciation after the exercise date generally will be taxed as capital gain or loss and will be long-term gain or loss if the holding period for such shares is more than one year.
SARs. No income will be realized by a participant upon grant or vesting of a SAR. Upon the exercise of a SAR, the participant will recognize ordinary compensation income in an amount equal to the fair market value of the payment received in respect of the SAR. We will be able to deduct this same amount for U.S. federal income tax purposes, but such deduction may be limited under Sections 280G and 162(m) of the Code for compensation paid to certain executives designated in those Sections.
Restricted Stock. A participant will not be subject to tax upon the grant of an award of restricted stock unless the participant otherwise elects to be taxed at the time of grant pursuant to Section 83(b) of the Code. On the date an award of restricted stock becomes transferable or is no longer subject to a substantial risk of forfeiture (i.e., the vesting date), the participant will have taxable compensation equal to the difference between the fair market value of the shares on that date over the amount the participant paid for such shares, if any, unless the participant made an election under Section 83(b) of the Code to be taxed at the time of grant. If the participant made an election under Section 83(b), the participant will have taxable compensation at the time of grant equal to the difference between the fair market value of the shares on the date of grant over the amount the participant paid for such shares, if any. If the election is made, the participant will not be allowed a deduction for amounts subsequently required to be returned to us. (Special rules apply to the receipt and disposition of restricted shares received by officers and directors who are subject to Section 16(b) of the Exchange Act). We will be able to deduct, at the same time as it is recognized by the participant, the amount of taxable compensation to the participant for U.S. federal income tax purposes, but such deduction may be limited under Sections 280G and 162(m) of the Code for compensation paid to certain executives designated in those Sections.
Restricted Stock Units. A participant will not be subject to tax upon the grant or vesting of a restricted stock unit award. Rather, upon the delivery of shares or cash pursuant to a restricted stock unit award, the participant will have taxable compensation equal to the fair market value of the number of shares (or the amount of cash) the participant actually receives with respect to the award. We will be able to deduct the amount of taxable compensation to the participant for U.S. federal income tax purposes, but the deduction may be limited under Sections 280G and 162(m) of the Code for compensation paid to certain executives designated in those Sections.
Section 162(m). In general, Section 162(m) of the Code denies a publicly held corporation a deduction for U.S. federal income tax purposes for compensation in excess of $1,000,000 per year per person to its chief executive officer and the three other officers whose compensation is required to be disclosed in its proxy statement (excluding the chief financial officer), subject to certain exceptions. The Equity Incentive Plan is intended to satisfy an exception with respect to grants of options and SARs to covered employees. In addition, the Equity Incentive Plan is designed to permit certain awards of restricted stock, restricted stock units and other awards (including cash bonus awards) to be awarded as Performance Compensation Awards intended to qualify under the “performance-based compensation” exception to Section 162(m) of the Code. As discussed above, we do not believe that Section 162(m) would apply to our executives’ compensation, but if it were to apply, as a new public company, we expect to be eligible for transition relief from the deduction limitations imposed under Section 162(m) of the Code until our first stockholder meeting at which directors are elected that occurs in 2021. In addition, we reserve the right to award compensation as to which a deduction may be limited under Section 162(m) where we believe it is appropriate to do so.
117
Table of Contents
CERTAIN RELATIONSHIPS AND RELATED PARTY TRANSACTIONS
Other than compensation arrangements for our named executive officers and directors, we describe below each transaction or series of similar transactions, since February 3, 2013, to which we were a party or will be a party, in which:
| • | the amounts involved exceeded or will exceed $120,000; and |
| • | any of our directors, executive officers or holders of more than 5% of our capital stock, or any member of the immediate family of the foregoing persons, had or will have a direct or indirect material interest. |
Compensation and indemnification arrangements for our named executive officers and directors are described below under “—Indemnification Agreements.”
Subordinated Debt Facility
On September 27, 2012, we entered into a six-year subordinated debt facility agreement (the “Subordinated Debt Agreement”). The lender under the Subordinated Debt Agreement was an affiliate of Golden Gate Capital, which was a minority equity holder of ours prior to the Acquisition. The Subordinated Debt Agreement was an unsecured mezzanine term loan and provided for borrowings of $30.0 million. Borrowings under the Subordinated Debt Agreement accrued interest at a rate of 24.0%. This facility was provided through JJ Mezz Funding Corp., which was a variable interest entity established to facilitate such financing. On May 8, 2015, contemporaneously with the Acquisition, the subordinated debt facility was repaid in full in an amount of $40.9 million and the Subordinated Debt Agreement was terminated by us.
Related Party Receivable
In connection with the Acquisition, two of our directors, Michael Rahamim and Marka Hansen, and a director of an indirect parent company of ours, invested new money in JJill Topco Holdings and entered into subscription agreements with JJill Topco Holdings. Following the Acquisition, JJill Topco Holdings held $1.9 million of cash consideration from these investments and did not contribute the cash to us and our subsidiaries. As a result, we recorded a related party receivable in the amount of $1.9 million.
Stockholders Agreement
In connection with this offering, we will enter into a Stockholders Agreement with TowerBrook, which, as further described below, will contain certain rights for TowerBrook.
Consent Rights
For so long as TowerBrook beneficially owns at least 50% of our common stock, TowerBrook will have prior approval rights over the following transactions:
| • | any increase or decrease in the size of our board of directors; |
| • | any incurrence of indebtedness (other than (i) debt existing as of the date of the Stockholders Agreement or refinancing thereof, (ii) capital leases approved by the board of directors and (iii) intercompany debt) in excess of $10.0 million; |
| • | any authorization, creation (by way of reclassification, merger, consolidation or otherwise) or issuance of equity securities (including preferred stock) other than issuances (i) pursuant to an equity compensation plan, (ii) by a subsidiary to us or another wholly owned subsidiary or (iii) upon conversion of convertible securities or exercise of options or warrants outstanding as of the date of the Stockholders Agreement or issued in compliance with the Stockholders Agreement; |
118
Table of Contents
| • | any redemption or repurchase of our equity securities, other than (i) from any director, officer, independent contractor or employee in connection with the termination of the employment or services of such director, officer or employee as contemplated by the applicable equity compensation plan or award agreement or (ii) pursuant to an offer made pro rata to all stockholders party to the Stockholders’ Agreement; |
| • | any material acquisition of the assets or equity interests of any other entity in any single transaction or series of related transactions; |
| • | any fundamental changes to the nature of our business that involve the entry into any new line of business; |
| • | the adoption, approval or issuance of any “poison pill,” stockholder or similar rights plan by us or our subsidiaries or any amendment of such plan; |
| • | any amendment, restatement or modification of our certificate of incorporation or bylaws; |
| • | any payment or declaration of any dividend or other distribution on any of our equity securities or entering into a recapitalization transaction the primary purpose of which is to pay a dividend, other than dividends required to be made pursuant to the terms of any outstanding preferred stock; |
| • | appointment or removal of the chairperson of our board of directors; |
| • | the consummation of a change of control or entry into any contract or agreement the effect of which would be a change of control; and |
| • | our or any of our subsidiaries’ entry into any voluntary liquidation, dissolution or commencement of bankruptcy or insolvency proceedings, the adoption of a plan with respect to any of the foregoing or the decision not to oppose any similar proceeding commenced by a third party. |
The effect of the Stockholders Agreement will be that TowerBrook may maintain control over our significant corporate transactions even if it holds less than a majority of our common stock.
Composition of the Board of Directors
The Stockholders Agreement will also provide TowerBrook with certain rights with respect to the designation of directors to serve on our board of directors. As set forth in the Stockholder’s Agreement, for so long as TowerBrook beneficially owns at least 50% of our common stock, it will be entitled to designate for nomination a majority of our board of directors. When TowerBrook beneficially owns less than 50% of our common stock but owns at least 10% of our common stock, TowerBrook will be entitled to designate for nomination a number of directors in proportion to its ownership of our common stock, rounded up to the nearest whole person. When TowerBrook owns less than 10% of our common stock but owns at least 5% of our common stock, TowerBrook will be entitled to designate for nomination the greater of (i) a number of directors in proportion to its ownership of our common stock, rounded up to the nearest whole person, and (ii) one director.
Registration Rights Agreement
In connection with this offering, we intend to enter into a registration rights agreement that will provide TowerBrook an unlimited number of “demand” registrations and customary “piggyback” registration rights, and will provide certain members of our management with customary “piggyback” registration rights. The registration rights agreement will also provide that we will pay certain expenses relating to such registrations and indemnify the registration rights holders against certain liabilities which may arise under the Securities Act.
Services Agreement
We are party to a services agreement with TowerBrook, pursuant to which TowerBrook has performed and will perform management support advisory services, planning and finance services for us. Under the terms of the services agreement, effective May 8, 2015, we paid an upfront lump sum advisory fee of $4.0 million. Under the
119
Table of Contents
services agreement, we also agreed to pay and reimburse reasonable out of pocket expenses to TowerBrook for conducting these advisory services. In the 2015 Successor Period, we reimbursed TowerBrook $0.3 million in relation to these services. We also distributed $8.6 million to JJill Topco Holdings in the 2015 Successor Period to reimburse expenses associated with the Acquisition.
Prior to the Acquisition, our previous equity holders performed certain management support and finance services for us. In the 2015 Predecessor Period, we paid management fees of $0.3 million and in fiscal year 2014, we paid management fees of $1.0 million for these services.
Indemnification Agreements
We expect to enter into customary indemnification agreements with our executive officers and directors that provide, in general, that we will provide them with customary indemnification in connection with their service to us or on our behalf.
These indemnification agreements will require us, among other things, to indemnify our directors and officers against liabilities that may arise by reason of their status or service as directors or officers, other than liabilities arising from willful misconduct. These indemnification agreements also will require us to advance any expenses incurred by the directors or officers as a result of any proceeding against them as to which they could be indemnified and to obtain directors’ and officers’ insurance, if available on reasonable terms.
Policies and Procedures for Related Party Transactions
Upon the consummation of this offering, we will adopt a written Related Person Transaction Policy (the “policy”), which will set forth our policy with respect to the review, approval, ratification and disclosure of all related person transactions by our Audit Committee. In accordance with the policy, our Audit Committee will have overall responsibility for implementation of and compliance with the policy.
For purposes of the policy, a “related person transaction” is a transaction, arrangement or relationship (or any series of similar transactions, arrangements or relationships) in which we were, are or will be a participant and the amount involved exceeded, exceeds or will exceed $120,000 and in which any related person (as defined in the policy) had, has or will have a direct or indirect material interest. A “related person transaction” does not include any employment relationship or transaction involving an executive officer and any related compensation resulting solely from that employment relationship that has been reviewed and approved by our board of directors or Compensation Committee.
The policy will require that notice of a proposed related person transaction be provided to our legal department prior to entry into such transaction. If our legal department determines that such transaction is a related person transaction, the proposed transaction will be submitted to our Audit Committee for consideration. Under the policy, our Audit Committee may approve only those related person transactions that are in, or not inconsistent with, our best interests and the best interests of our stockholders. In the event that we become aware of a related person transaction that has not been previously reviewed, approved or ratified under the policy and that is ongoing or is completed, the transaction will be submitted to the Audit Committee so that it may determine whether to ratify, rescind or terminate the related person transaction.
The policy will also provide that the Audit Committee review certain previously approved or ratified related person transactions that are ongoing to determine whether the related person transaction remains in our best interests and the best interests of our stockholders. Additionally, we will make periodic inquiries of directors and executive officers with respect to any potential related person transaction of which they may be a party or of which they may be aware.
120
Table of Contents
PRINCIPAL AND SELLING STOCKHOLDERS
The following table sets forth the beneficial ownership of our common stock by:
| • | each person, or group of affiliated persons, who we know to beneficially own more than 5% of our common stock; |
| • | each of our named executive officers; |
| • | each of our directors; |
| • | all of our executive officers and directors as a group; and |
| • | the selling stockholder. |
Following our conversion to a Delaware corporation and the merger of JJill Holdings with and into us, as described under “Corporate Conversion,” JJill Topco Holdings will hold all of our issued and outstanding common stock. Following the completion of this offering, JJill Topco Holdings plans to distribute all of the shares of our common stock held by it, other than the shares it sells in this offering, to its partners in accordance with the terms of its limited partnership agreement. If the underwriters’ option to purchase additional shares is not exercised in full, JJill Topco Holdings will distribute its remaining shares of our common stock to its limited partners. All shares of our common stock distributed by JJill Topco Holdings will be subject to restrictions on transfer as described under “Shares Eligible for Future Sale—Lock-up Agreements.” Cash proceeds received by JJill Topco Holdings from the sale of shares of our common stock in this offering, net of underwriting discounts, will be distributed to the partners of JJill Topco Holdings in accordance with its limited partnership agreement.
Beneficial ownership is determined in accordance with the rules of the SEC. These rules generally attribute beneficial ownership of securities to persons who possess sole or shared voting power or investment power with respect to such securities. Except as otherwise indicated, all persons listed below have sole voting and investment power with respect to the shares beneficially owned by them, subject to applicable community property laws. Unless otherwise indicated, the address of each person or entity named in the table below is c/o J.Jill, Inc., 4 Batterymarch Park, Quincy, Massachusetts 02169.
| Shares Beneficially Owned Before the Offering |
Shares to be Sold in the Offering |
Shares Beneficially Owned After the Offering |
||||||||||||||||||||||||||||||
| Number | Percent | Excluding Exercise of Option to Purchase Additional Shares |
Including Exercise of Option to Purchase Additional Shares |
Excluding Exercise of Option to Purchase Additional Shares |
Including Exercise of Option to Purchase Additional Shares |
|||||||||||||||||||||||||||
| Number | Percent | Number | Percent | |||||||||||||||||||||||||||||
| 5% Stockholders |
||||||||||||||||||||||||||||||||
| Entities affiliated with TowerBrook(1) |
43,747,944 | 100.0 | % | 11,666,667 | 13,416,667 | 26,420,350 | 60.4 | % | 24,876,752 | 56.9 | % | |||||||||||||||||||||
| Named Executive Officers and Directors |
||||||||||||||||||||||||||||||||
| Paula Bennett(2) |
— | — | — | — | 2,335,869 | 5.3 | % | 2,278,136 | 5.2 | % | ||||||||||||||||||||||
| David Biese(3) |
— | — | — | — | 539,515 | 1.2 | % | 527,972 | 1.2 | % | ||||||||||||||||||||||
| Joann Fielder(4) |
— | — | — | — | 699,607 | 1.6 | % | 658,733 | 1.5 | % | ||||||||||||||||||||||
| Michael Rahamim(5) |
— | — | — | — | 247,197 | * | 232,743 | * | ||||||||||||||||||||||||
| Marka Hansen(6) |
— | — | — | — | 91,695 | * | 86,337 | * | ||||||||||||||||||||||||
| Travis Nelson |
— | — | — | — | — | — | — | — | ||||||||||||||||||||||||
| Michael Recht |
— | — | — | — | — | — | — | — | ||||||||||||||||||||||||
| Andrew Rolfe |
— | — | — | — | — | — | — | — | ||||||||||||||||||||||||
| Michael Eck(7) |
— | — | — | — | 5,792 | * | 5,723 | * | ||||||||||||||||||||||||
| Linda Heasley |
— | — | — | — | — | — | — | — | ||||||||||||||||||||||||
| All current directors and executive officers as a group |
— | — | — | — | 3,919,675 | 9.0 | % | 3,789,644 | 8.7 | % | ||||||||||||||||||||||
121
Table of Contents
| * | Represents beneficial ownership of less than one percent of shares outstanding. |
| (1) | Prior to the distribution of shares of our common stock described above, the shares are held directly by JJill Topco Holdings, LP, the selling stockholder in this offering. The general partner of JJill Topco Holdings, LP is JJ Holdings GP, LLC. The sole member of JJ Holdings GP, LLC is TI IV JJill Holdings, LP. Following the distribution of shares described above, the shares are held directly by JJ Holdings, GP, LLC and TI IV JJill Holdings, LP. The general partner of TI IV JJill Holdings, LP is TI IV JJ GP, LLC. The sole member of TI IV JJ GP, LLC is TowerBrook Investors IV (Onshore), L.P. The general partner of TowerBrook Investors IV (Onshore), L.P. is TowerBrook Investors GP IV, L.P., and its ultimate general partner is TowerBrook Investors, Ltd. The natural persons that have voting or investment power over shares of common stock beneficially owned by TowerBrook Investors GP IV, L.P. and TowerBrook Investors, Ltd. are Neal Moszkowski and Ramez Sousou. The address of each of the entities and natural persons identified in this footnote is c/o TowerBrook Capital Partners L.P., 65 East 55th Street, 27th Floor, New York, New York 10022. |
| (2) | Consists of 10,647 shares of common stock held directly by Ms. Bennett (or 10,025 shares if the underwriters exercise their option to purchase additional shares in full), 890,253 shares of common stock held by the Paula L. Bennett Grantor Retained Annuity Trust (or 838,241 shares if the underwriters exercise their option to purchase additional shares in full) and 1,434,969 shares of common stock held by the Paula L. Bennett 2015 Family Trust (or 1,429,870 shares if the underwriters exercise their option to purchase additional shares in full). BNY Mellon Trust of Delaware is the trustee of both the Paula L. Bennett Grantor Retained Annuity Trust and the Paula L. Bennett 2015 Family Trust. Of the shares held by the Paula L. Bennett 2015 Family Trust, 908,814 shares (or 905,584 shares if the underwriters exercise their option to purchase additional shares in full) are subject to vesting in equal monthly installments through May 8, 2020. |
| (3) | Of the shares shown, 230,384 shares (or 229,576 shares if the underwriters exercise their option to purchase additional shares in full) are subject to vesting in equal monthly installments through April 30, 2020. |
| (4) | Of the shares shown, 287,980 shares (or 286,971 shares if the underwriters exercise their option to purchase additional shares in full) are subject to vesting in equal monthly installments through April 30, 2020. |
| (5) | Of the shares shown, 215,245 shares (or 214,480 shares if the underwriters exercise their option to purchase additional shares in full) are subject to vesting in equal annual installments through May 8, 2020. |
| (6) | Of the shares shown, 72,609 shares (or 72,354 shares if the underwriters exercise their option to purchase additional shares in full) are subject to vesting in equal annual installments through May 8, 2020. |
| (7) | All of the shares shown are subject to vesting until November 15, 2017. |
122
Table of Contents
The following is a summary of all material characteristics of our capital stock as set forth in our certificate of incorporation and bylaws, which will be in effect upon our conversion from a Delaware limited liability company to a Delaware corporation. The summary does not purport to be complete and is qualified in its entirety by reference to our certificate of incorporation and bylaws, all of which are incorporated by reference as exhibits to the registration statement of which this prospectus is a part, and the applicable provisions of Delaware law.
Capital Stock
Our certificate of incorporation will provide that our authorized capital stock will consist of 250,000,000 shares of common stock, par value $0.01 per share, and 50,000,000 shares of preferred stock, par value $0.01 per share. After the consummation of this offering, we expect to have 43,747,944 shares of common stock and zero shares of preferred stock outstanding.
Common Stock
Voting Rights
The holders of our common stock are entitled to one vote per share of common stock on each matter properly submitted to the stockholders on which the holders of shares of common stock are entitled to vote, including the election of directors, and will not have cumulative voting rights.
Dividend Rights
The holders of our common stock will be entitled to receive dividends when, as, and if declared by our board of directors out of legally available funds.
All shares of our common stock will be entitled to share equally in any dividends our board of directors may declare from legally available sources, subject to the terms of any outstanding preferred stock. See “—Preferred Stock.” Provisions of our debt agreements and other contracts, including requirements under our certificate of incorporation described elsewhere in this prospectus, may impose restrictions on our ability to declare dividends with respect to our common stock.
Liquidation Rights
Upon a liquidation or dissolution of the Company, whether voluntary or involuntary and subject to the rights of the holders of any preferred stock, all shares of our common stock will be entitled to share equally in the assets available for distribution to holders of common stock after payment of all of our prior obligations, including any then-outstanding preferred stock.
Other Matters
The holders of our common stock will have no preemptive rights. All of the outstanding shares of common stock are, and the shares of common stock to be sold in this offering when issued and paid for will be, fully paid and nonassessable. There will be no redemption or sinking fund provisions applicable to our common stock. The rights, preferences and privileges of holders of common stock will be subject to the rights of the holders of shares of any series of preferred stock that may be issued in the future.
123
Table of Contents
Preferred Stock
After the consummation of this offering, our board of directors may, by a majority vote, issue, from time to time, up to an aggregate of 50,000,000 shares of preferred stock in one or more series and to fix or alter the designations, preferences, rights and any qualifications, limitations or restrictions of the shares of each such series thereof, including the dividend rights, dividend rates, conversion rights, voting rights, terms of redemption (including sinking fund provisions), redemption prices, liquidation preferences and the number of shares constituting any series or designations of such series. See “—Certain Anti-Takeover, Limited Liability and Indemnification Provisions.” Our board of directors may authorize the issuance of preferred stock with voting or conversion rights that could adversely affect the voting power or other rights of the holders of common stock. The issuance of preferred stock, while providing flexibility in connection with possible future financings and acquisitions and other corporate purposes could, under certain circumstances, have the effect of delaying, deferring or preventing a change in control of us and might affect the market price of our common stock. See “—Certain Anti-Takeover, Limited Liability and Indemnification Provisions.” We have no current plan to issue any shares of preferred stock following the consummation of this offering.
Certain Anti-Takeover, Limited Liability and Indemnification Provisions
Certain provisions in our certificate of incorporation and bylaws summarized below may be deemed to have an anti-takeover effect and may delay, deter or prevent a tender offer or takeover attempt that a stockholder might consider to be in its best interests, including attempts that might result in a premium being paid over the market price for the shares held by stockholders.
“Blank Check” Preferred Stock
Our certificate of incorporation will provide that our board of directors may, by a majority vote, issue shares of preferred stock. Preferred stock could be issued by our board of directors to increase the number of outstanding shares making a takeover more difficult and expensive. See “—Preferred Stock.”
No Cumulative Voting
Our certificate of incorporation will provide that stockholders do not have the right to cumulative votes in the election of directors.
Stockholder Action by Written Consent
Our certificate of incorporation will provide that, prior to the date on which TowerBrook ceases to beneficially own more than 50% of the outstanding shares of our common stock (the “Triggering Event”), any action required to be or that may be taken at any meeting of stockholders may be taken without a meeting, without prior notice and without a vote, if and only if a consent in writing, setting forth the action so taken, shall be signed by the stockholders having not less than the minimum number of votes necessary to take such action.
Classified Board
Our certificate of incorporation and bylaws will provide that following this offering, our board of directors will have three classes of directors:
| • | Class I shall consist of directors whom shall serve an initial one-year term; |
| • | Class II shall consist of directors whom shall serve an initial two-year term; and |
| • | Class III shall consist of directors whom shall serve an initial three-year term. |
124
Table of Contents
The number of directors on our board of directors may be fixed by at least two-thirds of the members of our board of directors then in office; provided, however, that prior to the Triggering Event, the number of directors on our board of directors may not be increased or decreased without the approval of a majority of the directors that have been appointed by TowerBrook then in office.
Advance Notice Requirements for Stockholder Proposals and Director Nominations
Our bylaws will provide that stockholders seeking to bring business before an annual meeting of stockholders, or to nominate candidates for election as directors at an annual meeting of stockholders, must provide timely notice thereof in writing. To be timely, a stockholder’s notice generally must be delivered to and received at our principal executive offices not less than 90 days nor more than 120 days prior to the first anniversary of the preceding year’s annual meeting; provided, that, in the event that the date of such meeting is advanced more than 30 days prior to, or delayed by more than 60 days after, the anniversary of the preceding year’s annual meeting of our stockholders, a stockholder’s notice to be timely must be so delivered not earlier than the close of business on the 120th day prior to such meeting and not later than the close of business on the later of the 90th day prior to such meeting or, if the first public announcement of the date of such annual meeting is less than 100 days prior to the date of such annual meeting, the 10th day following the day on which public announcement of the date of such meeting is first made. Our bylaws will also specify certain requirements as to the form and content of a stockholder’s notice. These provisions may preclude stockholders from bringing matters before an annual meeting of stockholders or from making nominations for directors at an annual meeting of stockholders.
Special Meetings of Stockholders
Subject to the rights of the preferred stock, special meetings of our stockholders may be called only by the chairman of our board of directors or by a resolution adopted by a majority of our board of directors. Stockholders are not permitted to call a special meeting of stockholders, to require that the chairman call such a special meeting, or to require that our board of directors request the calling of a special meeting of stockholders.
Removal of Directors
Until the Triggering Event, any director may be removed from office at any time, with or without cause, by holders of a majority of the voting power of our outstanding common stock. Our certificate of incorporation will provide that, after the Triggering Event, our directors may be removed only for cause by the affirmative vote of at least 66 2⁄3% of the voting power of our outstanding common stock. This requirement of a supermajority vote to remove directors could enable a minority of our stockholders to prevent a change in the composition of our board.
Super-Majority Approval Requirements
The Delaware General Corporation Law generally provides that the affirmative vote of the holders of a majority of the outstanding shares entitled to vote on any matter is required to amend a corporation’s certificate of incorporation or bylaws, unless either a corporation’s certificate of incorporation or bylaws require a greater percentage. Our certificate of incorporation and bylaws will provide that, at any time after the Triggering Event, the affirmative vote of holders of 66 2⁄3% of our outstanding common stock will be required to amend, alter, change or repeal our certificate of incorporation or bylaws. Our bylaws may also be amended or repealed by a majority vote of our board of directors. Prior to the Triggering Event, the requirement of a super-majority vote to approve amendments to our certificate of incorporation and bylaws could enable a minority of our stockholders to exercise veto power over any such amendments.
Limitation of Officer and Director Liability and Indemnification Agreements
Our certificate of incorporation will limit the liability of our directors to the fullest extent permitted by the Delaware General Corporation Law and provides that we will provide them with customary indemnification.
125
Table of Contents
We expect to enter into indemnification agreements with each of our executive officers and directors that provide them, in general, with customary indemnification in connection with their service to us or on our behalf.
Forum Selection
Our certificate of incorporation will provide that the Court of Chancery of the State of Delaware will be the exclusive forum for (i) any derivative action or proceeding brought on our behalf, (ii) any action asserting a breach of fiduciary duty, (iii) any action asserting a claim against us arising pursuant to any provision of the DGCL or (iv) any action asserting a claim against us that is governed by the internal affairs doctrine, in each such case subject to such Court of Chancery having personal jurisdiction over the indispensable parties named as defendants therein. However, it is possible that a court could find our forum selection provision to be inapplicable or unenforceable.
Delaware Anti-Takeover Law
We have elected to be exempt from the restrictions imposed under Section 203 of the DGCL. However, our certificate of incorporation will contain similar provisions providing that we may not engage in certain “business combinations” with any “interested stockholder” for a three-year period following the time that such stockholder becomes an interested stockholder unless:
| • | prior to such time, our board of directors approved either the business combination or the transaction which resulted in the stockholder becoming an interested stockholder; |
| • | upon consummation of the transaction which resulted in the stockholder becoming an “interested stockholder,” the interested stockholder owned at least 85% of our voting stock outstanding at the time the transaction commenced (excluding certain shares); or |
| • | on or subsequent to such time, the business combination is approved by the Board and authorized at an annual or special meeting of stockholders, and not by written consent, by the affirmative vote of at least two-thirds of the outstanding voting stock not owned by the interested stockholder. |
Generally, a “business combination” includes a merger, asset or stock sale or other transaction resulting in a financial benefit to the interested stockholder. Subject to certain exceptions, an “interested stockholder” is a person who, together with that person’s affiliates and associates, owns, or within the previous three years owned, 15% or more of our voting stock.
Under some circumstances, this provision will make it more difficult for a person who is an interested stockholder to effect various business combinations with us for a three-year period.
Our certificate of incorporation will provide that TowerBrook and its various affiliates, successors and transferees will not be deemed to be “interested stockholders” regardless of the percentage of our voting stock owned by them, and accordingly will not be subject to this provision.
Corporate Opportunity
Our certificate of incorporation will provide that, to the fullest extent permitted by law, the doctrine of “corporate opportunity” will not apply against TowerBrook, any of our non-employee directors who are employees, affiliates or consultants of TowerBrook or its affiliates (other than us or our subsidiaries) or any of their respective affiliates in a manner that would prohibit them from investing in competing businesses or doing business with our customers. See “Risk Factors—Risks Related to this Offering and Ownership of Our Common Stock—Our certificate of incorporation will contain a provision renouncing our interest and expectancy in certain corporate opportunities.”
126
Table of Contents
Transfer Agent and Registrar
The transfer agent and registrar for our common stock will be American Stock Transfer & Trust Company, LLC.
Securities Exchange
The shares of our common stock have been approved for listing on the NYSE under the symbol “JILL.”
127
Table of Contents
SHARES ELIGIBLE FOR FUTURE SALE
Prior to this offering, there has been no public market for our common stock. Future sales of our common stock in the public market, or the availability of such shares for sale in the public market, could adversely affect the market price of our common stock prevailing from time to time. As described below, only a limited number of shares will be available for sale shortly after this offering due to contractual and legal restrictions on resale. Nevertheless, sales of a substantial number of shares of our common stock in the public market after such restrictions lapse, or the perception that those sales may occur, could adversely affect the prevailing market price of our common stock at such time and our ability to raise equity-related capital at a time and price we deem appropriate.
Upon completion of this offering, we will have outstanding an aggregate of 43,747,944 shares of common stock. Of these shares, all of the 11,666,667 shares of common stock to be sold in this offering (or 13,416,667 shares assuming the underwriters exercise the option to purchase additional shares in full) will be freely tradable without restriction unless the shares are held by any of our “affiliates” as such term is defined in Rule 144 under the Securities Act, and without further registration under the Securities Act. All remaining shares of common stock will be deemed “restricted securities” as such term is defined under Rule 144. The restricted securities were, or will be, issued and sold by us in private transactions and are eligible for public sale only if registered under the Securities Act or if they qualify for an exemption from registration under Rule 144 or Rule 701 under the Securities Act, which rules are summarized below.
As a result of the lock-up agreements described below and the provisions of Rule 144 and Rule 701 under the Securities Act, the shares of our common stock (excluding the shares to be sold in this offering) that will be available for sale in the public market are as follows:
| • | no shares will be eligible for sale on the date of this prospectus or prior to 180 days after the date of this prospectus; and |
| • | 32,081,277 shares will be eligible for sale upon the expiration of the lock-up agreements beginning 180 days after the date of this prospectus and when permitted under Rule 144 or Rule 701. |
Lock-up Agreements
We, affiliates of TowerBrook, certain of our other existing stockholders and all of our directors and executive officers have agreed not to sell any common stock or securities convertible into or exercisable or exchangeable for shares of common stock for a period of 180 days from the date of this prospectus, subject to certain exceptions. Please see “Underwriting” for a description of these lock-up provisions. The representatives of the underwriters, in their sole discretion, may at any time release all or any portion of the shares from the restrictions in such agreements.
Rule 144
In general, under Rule 144 under the Securities Act as currently in effect, a person (or persons whose shares are aggregated) who is not deemed to have been an affiliate of ours at any time during the six months preceding a sale, and who has beneficially owned restricted securities within the meaning of Rule 144 for at least six months (including any period of consecutive ownership of preceding non-affiliated holders) would be entitled to sell those shares, subject only to the availability of current public information about us. A non-affiliated person who has beneficially owned restricted securities within the meaning of Rule 144 for at least one year would be entitled to sell those shares without regard to the provisions of Rule 144.
A person (or persons whose shares are aggregated) who is deemed to be an affiliate of ours and who has beneficially owned restricted securities within the meaning of Rule 144 for at least six months would be entitled
128
Table of Contents
to sell within any three-month period a number of shares that does not exceed the greater of one percent of the then outstanding shares of our common stock or the average weekly trading volume of our common stock reported by the NYSE during the four calendar weeks preceding the filing of notice of the sale. Such sales are also subject to certain manner of sale provisions, notice requirements and the availability of current public information about us.
Rule 701
In general, under Rule 701 under the Securities Act, any of our employees, directors, officers, consultants or advisors who purchases shares from us in connection with a compensatory stock or option plan or other written agreement before the effective date of this offering is entitled to sell such shares 90 days after the effective date of this offering in reliance on Rule 144, without having to comply with the holding period requirement of Rule 144 and, in the case of non-affiliates, without having to comply with the public information, volume limitation or notice filing provisions of Rule 144. The SEC has indicated that Rule 701 will apply to typical stock options granted by an issuer before it becomes subject to the reporting requirements of the Exchange Act, along with the shares acquired upon exercise of such options, including exercises after the date of this prospectus.
Stock Issued Under Employee Plans
We intend to file a registration statement on Form S-8 under the Securities Act to register stock issuable under the Equity Incentive Plan. This registration statement on Form S-8 is expected to be filed following the effective date of the registration statement of which this prospectus is a part and will be effective upon filing. Accordingly, shares registered under such registration statement will be available for sale in the open market following the effective date, unless such shares are subject to vesting restrictions with us, Rule 144 restrictions applicable to our affiliates or the lock-up restrictions described above.
Registration Rights
After this offering, and subject to the lock-up agreements, members of our management and affiliates of TowerBrook will be entitled to certain rights with respect to the registration of their shares of our common stock under the Securities Act after the completion of this offering. For more information, see “Certain Relationships and Related Party Transactions—Registration Rights Agreement.” After such registration, these shares of our common stock will become freely tradable without restriction under the Securities Act.
129
Table of Contents
MATERIAL U.S. FEDERAL INCOME TAX CONSIDERATIONS
The following is a discussion of material U.S. federal income tax considerations applicable to Non-U.S. Holders (as defined below) with respect to the ownership and disposition of our common stock issued pursuant to this offering. The following discussion is based upon current provisions of the Internal Revenue Code of 1986, as amended (the “Code”), U.S. judicial decisions, administrative pronouncements and existing and proposed Treasury regulations, all as in effect as of the date hereof. All of the preceding authorities are subject to change at any time, possibly with retroactive effect, so as to result in U.S. federal income tax consequences different from those discussed below. We have not requested, and will not request, a ruling from the U.S. Internal Revenue Service (the “IRS”) with respect to any of the U.S. federal income tax consequences described below, and as a result there can be no assurance that the IRS will not disagree with or challenge any of the conclusions we have reached and describe herein.
This discussion only addresses beneficial owners of our common stock that hold such common stock as a capital asset within the meaning of Section 1221 of the Code (generally, property held for investment). This discussion does not address all aspects of U.S. federal income taxation that may be important to a Non-U.S. Holder in light of such Non-U.S. Holder’s particular circumstances or that may be applicable to Non-U.S. Holders subject to special treatment under U.S. federal income tax law (including, for example, financial institutions, regulated investment companies, real estate investment trusts, dealers in securities, traders in securities that elect mark-to-market treatment, insurance companies, tax-exempt entities, Non-U.S. Holders who acquire our common stock pursuant to the exercise of employee stock options or otherwise as compensation for their services, Non-U.S. Holders liable for the alternative minimum tax, controlled foreign corporations, passive foreign investment companies, former citizens or former long-term residents of the United States, and Non-U.S. Holders that hold our common stock as part of a hedge, straddle, constructive sale or conversion transaction). In addition, this discussion does not address U.S. federal tax laws other than those pertaining to the U.S. federal income tax (such as U.S. federal estate or gift tax or the Medicare contribution tax on certain net investment income), nor does it address any aspects of U.S. state, local or non-U.S. taxes. Non-U.S. Holders are urged to consult with their own tax advisors regarding the possible application of these taxes.
For the purposes of this discussion, the term “Non-U.S. Holder” means a beneficial owner of our common stock that is an individual, corporation, estate or trust, other than:
| • | an individual who is a citizen or resident of the United States, as determined for U.S. federal income tax purposes; |
| • | a corporation, or other entity taxable as a corporation for U.S. federal income tax purposes, created or organized in the United States or under the laws of the United States, any state thereof or the District of Columbia; |
| • | an estate, the income of which is includible in gross income for U.S. federal income tax purposes regardless of its source; or |
| • | a trust if: (i) a court within the United States is able to exercise primary supervision over the administration of the trust and one or more U.S. persons have the authority to control all substantial decisions of the trust; or (ii) it has a valid election in effect under applicable U.S. Treasury regulations to be treated as a domestic trust. |
If an entity or arrangement treated as a partnership for U.S. federal income tax purposes holds shares of our common stock, the tax treatment of a person treated as a partner generally will depend on the status of the partner and the activities of the partnership. Persons that, for U.S. federal income tax purposes, are treated as partners in a partnership holding shares of our common stock are urged to consult their own tax advisors.
130
Table of Contents
Prospective purchasers are urged to consult their tax advisors as to the particular consequences to them under U.S. federal, state and local, and applicable foreign tax laws of the acquisition, ownership and disposition of our common stock.
Distributions
Although we do not anticipate that we will make any distributions on our common stock in the foreseeable future, distributions of cash or property that we pay in respect of our common stock will constitute dividends for U.S. federal income tax purposes to the extent paid from our current or accumulated earnings and profits (as determined under U.S. federal income tax principles). Subject to the discussions below under “—U.S. Trade or Business Income,” “—Information Reporting and Backup Withholding” and “—FATCA,” you generally will be subject to U.S. federal withholding tax at a 30% rate, or at a reduced rate prescribed by an applicable income tax treaty, on any dividends received in respect of our common stock. If the amount of the distribution exceeds our current and accumulated earnings and profits, such excess first will be treated as a return of capital to the extent of your tax basis in our common stock, and thereafter will be treated as capital gain. However, except to the extent that we elect (or the paying agent or other intermediary through which you hold your common stock elects) otherwise, we (or the intermediary) must generally withhold on the entire distribution, in which case you would be entitled to a refund from the IRS for the withholding tax on the portion of the distribution that exceeded our current and accumulated earnings and profits.
In order to obtain a reduced rate of U.S. federal withholding tax under an applicable income tax treaty, you will be required to provide a properly executed IRS Form W-8BEN or Form W-8BEN-E (or, in each case, a successor form) certifying your entitlement to benefits under the treaty. If you are eligible for a reduced rate of U.S. federal withholding tax under an income tax treaty, you may obtain a refund of any excess amounts withheld by filing an appropriate claim for a refund with the IRS. You are urged to consult your own tax advisor regarding your possible entitlement to benefits under an income tax treaty.
Sale, Exchange or Other Taxable Disposition of Common Stock
Subject to the discussions below under “—U.S. Trade or Business Income,” “—Information Reporting and Backup Withholding” and “—FATCA,” you generally will not be subject to U.S. federal income or withholding tax in respect of any gain on a sale, exchange or other taxable disposition of our common stock unless:
| • | the gain is U.S. trade or business income, in which case, such gain will be taxed as described in “—U.S. Trade or Business Income” below; |
| • | you are an individual who is present in the United States for 183 or more days in the taxable year of the disposition and certain other conditions are met, in which case you will be subject to U.S. federal income tax at a rate of 30% (or a reduced rate under an applicable income tax treaty) on the amount by which certain capital gains allocable to U.S. sources exceed certain capital losses allocable to U.S. sources; or |
| • | we are or have been a “United States real property holding corporation” (a “USRPHC”) under Section 897 of the Code at any time during the shorter of the five-year period ending on the date of the disposition and your holding period for the common stock, in which case, subject to the exception set forth in the second sentence of the next paragraph, such gain will be subject to U.S. federal income tax in the same manner as U.S. trade or business income discussed below. |
In general, a corporation is a USRPHC if the fair market value of its “United States real property interests” equals or exceeds 50% of the sum of the fair market value of its worldwide real property interests and its other assets used or held for use in a trade or business. If we are a USRPHC, gain will not be subject to tax as
131
Table of Contents
U.S. trade or business income if your holdings (direct and indirect) at all times during the applicable period described in the third bullet point above constituted 5% or less of our common stock, provided that our common stock was regularly traded on an established securities market during such period. We believe that we are not currently, and we do not anticipate becoming in the future, a USRPHC for U.S. federal income tax purposes.
U.S. Trade or Business Income
For purposes of this discussion, dividend income and gain on the sale, exchange or other taxable disposition of our common stock will be considered to be “U.S. trade or business income” if (A) such income or gain is (i) effectively connected with your conduct of a trade or business within the United States and (ii) if you are eligible for the benefits of an income tax treaty with the United States and such treaty requires, attributable to a permanent establishment (or, if you are an individual, a fixed base) that you maintain in the United States or (B) with respect to gain, we are or have been a USRPHC at any time during the shorter of the five-year period ending on the date of the disposition of our common stock and your holding period for our common stock (subject to the 5% ownership exception set forth above in the second paragraph of “—Sale, Exchange or Other Taxable Disposition of Common Stock).” Generally, U.S. trade or business income is not subject to U.S. federal withholding tax (provided that you comply with applicable certification and disclosure requirements, including providing a properly executed IRS Form W-8ECI (or successor form)); instead, you are subject to U.S. federal income tax on a net basis at regular U.S. federal income tax rates (generally in the same manner as a U.S. person) on your U.S. trade or business income. If you are a corporation, any U.S. trade or business income that you receive may also be subject to a “branch profits tax” at a 30% rate, or at a lower rate prescribed by an applicable income tax treaty.
Information Reporting and Backup Withholding
We must annually report to the IRS and to each Non-U.S. Holder any dividend income that is subject to U.S. federal withholding tax or that is exempt from such withholding. Copies of these information returns may also be made available under the provisions of a specific treaty or agreement to the tax authorities of the country in which a Non-U.S. Holder resides. Under certain circumstances, the Code imposes a backup withholding obligation on certain reportable payments. Dividends paid to you will generally be exempt from backup withholding if you provide a properly executed IRS Form W-8BEN or Form W-8BEN-E (or, in each case, a successor form) or otherwise establish an exemption and we do not have actual knowledge or reason to know that you are a U.S. person or that the conditions of such other exemption are not, in fact, satisfied.
The payment of the proceeds from the disposition of our common stock to or through the U.S. office of any broker (U.S. or non-U.S.) will be subject to information reporting and possible backup withholding unless you certify as to your non-U.S. status under penalties of perjury or otherwise establish an exemption and the broker does not have actual knowledge or reason to know that you are a U.S. person or that the conditions of any other exemption are not, in fact, satisfied. The payment of proceeds from the disposition of our common stock to or through a non-U.S. office of a non-U.S. broker will not be subject to information reporting or backup withholding unless the non-U.S. broker has certain types of relationships with the United States (a “U.S. related financial intermediary”). In the case of the payment of proceeds from the disposition of our common stock to or through a non-U.S. office of a broker that is either a U.S. person or a U.S. related financial intermediary, the Treasury regulations require information reporting (but not backup withholding) on the payment unless the broker has documentary evidence in its files that the owner is not a U.S. person and the broker has no knowledge to the contrary. You are urged to consult your tax advisor on the application of information reporting and backup withholding in light of your particular circumstances.
Backup withholding is not an additional tax. Any amounts withheld under the backup withholding rules from a payment to you will be refunded or credited against your U.S. federal income tax liability, if any, provided that the required information is timely furnished to the IRS.
132
Table of Contents
FATCA
Pursuant to Section 1471 through 1474 of the Code, commonly referred to as the Foreign Account Tax Compliance Act (“FATCA”), foreign financial institutions (which include most foreign hedge funds, private equity funds, mutual funds, securitization vehicles and other investment vehicles) and certain other foreign entities must comply with information reporting rules with respect to their U.S. account holders and investors or be subject to a withholding tax on U.S. source payments made to them (whether received as a beneficial owner or as an intermediary for another party).
More specifically, a foreign financial institution or other foreign entity that does not comply with the FATCA reporting requirements will generally be subject to a 30% withholding tax with respect to any “withholdable payments.” For this purpose, withholdable payments generally include U.S.-source payments otherwise subject to nonresident withholding tax (e.g., U.S.-source dividends) and also include the entire gross proceeds from the sale of any equity instruments of U.S. issuers (such as our common stock). The FATCA withholding tax will apply even if the payment would otherwise not be subject to U.S. nonresident withholding tax (e.g., because it is capital gain). Foreign financial institutions located in jurisdictions that have an intergovernmental agreement with the United States governing FATCA may be subject to different rules.
FATCA currently applies to dividends made in respect of our common stock. Final Treasury regulations defer this withholding obligation for gross proceeds from dispositions of U.S. common stock until January 1, 2019. To avoid withholding on dividends and gross proceeds, as applicable, Non-U.S. Holders may be required to provide the Company (or its withholding agents) with applicable tax forms or other information. Non-U.S. Holders are urged to consult with their own tax advisors regarding the effect, if any, of the FATCA provisions to them based on their particular circumstances.
133
Table of Contents
Merrill Lynch, Pierce, Fenner & Smith Incorporated, Morgan Stanley & Co. LLC and Jefferies LLC are acting as representatives of each of the underwriters named below. Subject to the terms and conditions set forth in an underwriting agreement among us, the selling stockholder and the underwriters, the selling stockholder has agreed to sell to the underwriters, and each of the underwriters has agreed, severally and not jointly, to purchase from the selling stockholder, the number of shares of common stock set forth opposite its name below.
| Underwriter | Number of Shares |
|||
| Merrill Lynch, Pierce, Fenner & Smith Incorporated |
||||
| Morgan Stanley & Co. LLC |
||||
| Jefferies LLC |
||||
| Deutsche Bank Securities Inc. |
||||
| RBC Capital Markets, LLC |
||||
| UBS Securities LLC |
||||
| Wells Fargo Securities, LLC |
||||
| Cowen and Company, LLC |
||||
| Macquarie Capital (USA) Inc. |
||||
| SunTrust Robinson Humphrey, Inc. |
||||
|
|
|
|||
| Total |
11,666,667 | |||
|
|
|
|||
Subject to the terms and conditions set forth in the underwriting agreement, the underwriters have agreed, severally and not jointly, to purchase all of the shares sold under the underwriting agreement if any of these shares are purchased. If an underwriter defaults, the underwriting agreement provides that the purchase commitments of the nondefaulting underwriters may be increased or the underwriting agreement may be terminated.
We and the selling stockholder have agreed to indemnify the underwriters against certain liabilities, including liabilities under the Securities Act, or to contribute to payments the underwriters may be required to make in respect of those liabilities.
The underwriters are offering the shares, subject to prior sale, when, as and if issued to and accepted by them, subject to approval of legal matters by their counsel, including the validity of the shares, and other conditions contained in the underwriting agreement, such as the receipt by the underwriters of officer’s certificates and legal opinions. The underwriters reserve the right to withdraw, cancel or modify offers to the public and to reject orders in whole or in part.
Commissions and Discounts
The representatives have advised us and the selling stockholder that the underwriters propose initially to offer the shares to the public at the public offering price set forth on the cover page of this prospectus and to dealers at that price less a concession not in excess of $ per share. After the initial offering, the public offering price, concession or any other term of the offering may be changed.
The following table shows the public offering price, underwriting discount and proceeds before expenses to the selling stockholder. The information assumes either no exercise or full exercise by the underwriters of their option to purchase additional shares.
| Per Share |
Without Option |
With Option | ||||
| Public offering price |
$ | $ | $ | |||
| Underwriting discount |
$ | $ | $ | |||
| Proceeds to the selling stockholder |
$ | $ | $ |
134
Table of Contents
The expenses of the offering, not including the underwriting discount, are estimated at $6.1 million and are payable by us. We have also agreed to reimburse the underwriters for certain of their expenses in an amount up to $25,000.
Option to Purchase Additional Shares
The selling stockholder has granted an option to the underwriters, exercisable for 30 days after the date of this prospectus, to purchase up to 1,750,000 additional shares at the public offering price, less the underwriting discount. If the underwriters exercise this option, each will be obligated, subject to conditions contained in the underwriting agreement, to purchase a number of additional shares proportionate to that underwriter’s initial amount reflected in the above table.
No Sales of Similar Securities
We and the selling stockholder, our executive officers and directors and our other existing security holders have agreed not to sell or transfer any common stock or securities convertible into, exchangeable for, exercisable for, or repayable with common stock, for 180 days after the date of this prospectus without first obtaining the written consent of Merrill Lynch, Pierce, Fenner & Smith Incorporated, Morgan Stanley & Co. LLC and Jefferies LLC. Specifically, we and these other persons have agreed, with certain limited exceptions, not to directly or indirectly
| • | offer, pledge, sell or contract to sell any common stock, |
| • | sell any option or contract to purchase any common stock, |
| • | purchase any option or contract to sell any common stock, |
| • | grant any option, right or warrant for the sale of any common stock, |
| • | lend or otherwise dispose of or transfer any common stock, |
| • | request or demand that we file a registration statement related to the common stock or |
| • | enter into any swap or other agreement that transfers, in whole or in part, the economic consequence of ownership of any common stock whether any such swap or transaction is to be settled by delivery of shares or other securities, in cash or otherwise. |
This lock-up provision applies to common stock and to securities convertible into or exchangeable or exercisable for or repayable with common stock. It also applies to common stock owned now, and in some cases acquired later, by the person executing the agreement or for which the person executing the agreement later acquires the power of disposition with certain limited exceptions, including transfers of shares made among our indirect parent JJill Topco Holdings and its limited partners on or after the completion of this offering as described under “Principal and Selling Stockholders.” Merrill Lynch, Pierce, Fenner & Smith Incorporated, Morgan Stanley & Co. LLC and Jefferies LLC, in their sole discretion, may release the common stock and other securities subject to the lock-up agreements described above in whole or in part at any time.
Listing
The shares have been approved for listing on the NYSE under the symbol “JILL.”
135
Table of Contents
Before this offering, there has been no public market for our common stock. The initial public offering price will be determined through negotiations among us, the selling stockholder and the representatives. In addition to prevailing market conditions, the factors to be considered in determining the initial public offering price are
| • | the valuation multiples of publicly traded companies that the representatives believe to be comparable to us, |
| • | our financial information, |
| • | the history of, and the prospects for, our company and the industry in which we compete, |
| • | an assessment of our management, its past and present operations, and the prospects for, and timing of, our future revenues, |
| • | the present state of our development and |
| • | the above factors in relation to market values and various valuation measures of other companies engaged in activities similar to ours. |
An active trading market for the shares may not develop. It is also possible that after the offering the shares will not trade in the public market at or above the initial public offering price.
The underwriters do not expect to sell more than 5% of the shares in the aggregate to accounts over which they exercise discretionary authority.
Price Stabilization, Short Positions and Penalty Bids
Until the distribution of the shares is completed, SEC rules may limit underwriters and selling group members from bidding for and purchasing our common stock. However, the representatives may engage in transactions that stabilize the price of the common stock, such as bids or purchases to peg, fix or maintain that price.
In connection with the offering, the underwriters may purchase and sell our common stock in the open market. These transactions may include short sales, purchases on the open market to cover positions created by short sales and stabilizing transactions. Short sales involve the sale by the underwriters of a greater number of shares than they are required to purchase in the offering. “Covered” short sales are sales made in an amount not greater than the underwriters’ option to purchase additional shares described above. The underwriters may close out any covered short position by either exercising their option to purchase additional shares or purchasing shares in the open market. In determining the source of shares to close out the covered short position, the underwriters will consider, among other things, the price of shares available for purchase in the open market as compared to the price at which they may purchase shares through the option granted to them. “Naked” short sales are sales in excess of such option. The underwriters must close out any naked short position by purchasing shares in the open market. A naked short position is more likely to be created if the underwriters are concerned that there may be downward pressure on the price of our common stock in the open market after pricing that could adversely affect investors who purchase in the offering. Stabilizing transactions consist of various bids for or purchases of shares of common stock made by the underwriters in the open market prior to the completion of the offering.
The underwriters may also impose a penalty bid. This occurs when a particular underwriter repays to the underwriters a portion of the underwriting discount received by it because the representatives have repurchased shares sold by or for the account of such underwriter in stabilizing or short covering transactions.
136
Table of Contents
Similar to other purchase transactions, the underwriters’ purchases to cover the syndicate short sales may have the effect of raising or maintaining the market price of our common stock or preventing or retarding a decline in the market price of our common stock. As a result, the price of our common stock may be higher than the price that might otherwise exist in the open market. The underwriters may conduct these transactions on the NYSE, in the over-the-counter market or otherwise.
Neither we nor any of the underwriters make any representation or prediction as to the direction or magnitude of any effect that the transactions described above may have on the price of our common stock. In addition, neither we nor any of the underwriters make any representation that the representatives will engage in these transactions or that these transactions, once commenced, will not be discontinued without notice.
Electronic Distribution
In connection with the offering, certain of the underwriters or securities dealers may distribute prospectuses by electronic means, such as e-mail.
Other Relationships
Some of the underwriters and their affiliates have engaged in, and may in the future engage in, investment banking and other commercial dealings in the ordinary course of business with us or our affiliates. They have received, or may in the future receive, customary fees and commissions for these transactions.
In addition, in the ordinary course of their business activities, the underwriters and their affiliates may make or hold a broad array of investments and actively trade debt and equity securities (or related derivative securities) and financial instruments (including bank loans) for their own account and for the accounts of their customers. Such investments and securities activities may involve securities and/or instruments of ours or our affiliates. The underwriters and their affiliates may also make investment recommendations and/or publish or express independent research views in respect of such securities or financial instruments and may hold, or recommend to clients that they acquire, long and/or short positions in such securities and instruments.
European Economic Area
In relation to each member state of the European Economic Area, no offer of ordinary shares which are the subject of the offering has been, or will be made to the public in that Member State, other than under the following exemptions under the Prospectus Directive:
| (a) | to any legal entity which is a qualified investor as defined in the Prospectus Directive; |
| (b) | to fewer than 150 natural or legal persons (other than qualified investors as defined in the Prospectus Directive), subject to obtaining the prior consent of the representatives for any such offer; or |
| (c) | in any other circumstances falling within Article 3(2) of the Prospectus Directive, |
provided that no such offer of ordinary shares referred to in (a) to (c) above shall result in a requirement for the Company or any of the representatives to publish a prospectus pursuant to Article 3 of the Prospectus Directive, or supplement a prospectus pursuant to Article 16 of the Prospectus Directive.
Each person located in a Member State to whom any offer of ordinary shares is made or who receives any communication in respect of an offer of ordinary shares, or who initially acquires any ordinary shares will be deemed to have represented, warranted, acknowledged and agreed to and with each representative and the Company that (1) it is a “qualified investor” within the meaning of the law in that Member State implementing Article 2(1)(e) of the Prospectus Directive; and (2) in the case of any ordinary shares acquired by it as a financial
137
Table of Contents
intermediary as that term is used in Article 3(2) of the Prospectus Directive, the ordinary shares acquired by it in the offer have not been acquired on behalf of, nor have they been acquired with a view to their offer or resale to, persons in any Member State other than qualified investors, as that term is defined in the Prospectus Directive, or in circumstances in which the prior consent of the representatives has been given to the offer or resale; or where ordinary shares have been acquired by it on behalf of persons in any Member State other than qualified investors, the offer of those ordinary shares to it is not treated under the Prospectus Directive as having been made to such persons.
The Company, the representatives and their respective affiliates will rely upon the truth and accuracy of the foregoing representations, acknowledgments and agreements.
This prospectus has been prepared on the basis that any offer of shares in any Member State will be made pursuant to an exemption under the Prospectus Directive from the requirement to publish a prospectus for offers of shares. Accordingly any person making or intending to make an offer in that Member State of shares which are the subject of the offering contemplated in this prospectus may only do so in circumstances in which no obligation arises for the Company or any of the representatives to publish a prospectus pursuant to Article 3 of the Prospectus Directive in relation to such offer. Neither the Company nor the representatives have authorized, nor do they authorize, the making of any offer of shares in circumstances in which an obligation arises for the Company or the representatives to publish a prospectus for such offer.
For the purposes of this provision, the expression an “offer of ordinary shares to the public” in relation to any ordinary shares in any Member State means the communication in any form and by any means of sufficient information on the terms of the offer and the ordinary shares to be offered so as to enable an investor to decide to purchase or subscribe the ordinary shares, as the same may be varied in that Member State by any measure implementing the Prospectus Directive in that Member State, the expression “Prospectus Directive” means Directive 2003/71/EC (as amended) and includes any relevant implementing measure in each Member State.
The above selling restriction is in addition to any other selling restrictions set out below.
Notice to Prospective Investors in the United Kingdom
In addition, in the United Kingdom, this document is being distributed only to, and is directed only at, and any offer subsequently made may only be directed at persons who are “qualified investors” (as defined in the Prospectus Directive) (i) who have professional experience in matters relating to investments falling within Article 19 (5) of the Financial Services and Markets Act 2000 (Financial Promotion) Order 2005, as amended (the “Order”) and/or (ii) who are high net worth companies (or persons to whom it may otherwise be lawfully communicated) falling within Article 49(2)(a) to (d) of the Order (all such persons together being referred to as “relevant persons”). This document must not be acted on or relied on in the United Kingdom by persons who are not relevant persons. In the United Kingdom, any investment or investment activity to which this document relates is only available to, and will be engaged in with, relevant persons.
Notice to Prospective Investors in Switzerland
The shares may not be publicly offered in Switzerland and will not be listed on the SIX Swiss Exchange (“SIX”) or on any other stock exchange or regulated trading facility in Switzerland. This document has been prepared without regard to the disclosure standards for issuance prospectuses under art. 652a or art. 1156 of the Swiss Code of Obligations or the disclosure standards for listing prospectuses under art. 27 ff. of the SIX Listing Rules or the listing rules of any other stock exchange or regulated trading facility in Switzerland. Neither this document nor any other offering or marketing material relating to the shares or the offering may be publicly distributed or otherwise made publicly available in Switzerland.
Neither this document nor any other offering or marketing material relating to the offering, the Company, the shares have been or will be filed with or approved by any Swiss regulatory authority. In particular, this
138
Table of Contents
document will not be filed with, and the offer of shares will not be supervised by, the Swiss Financial Market Supervisory Authority FINMA (FINMA), and the offer of shares has not been and will not be authorized under the Swiss Federal Act on Collective Investment Schemes (“CISA”). The investor protection afforded to acquirers of interests in collective investment schemes under the CISA does not extend to acquirers of shares.
Notice to Prospective Investors in the Dubai International Financial Centre
This prospectus relates to an Exempt Offer in accordance with the Offered Securities Rules of the Dubai Financial Services Authority (“DFSA”). This prospectus is intended for distribution only to persons of a type specified in the Offered Securities Rules of the DFSA. It must not be delivered to, or relied on by, any other person. The DFSA has no responsibility for reviewing or verifying any documents in connection with Exempt Offers. The DFSA has not approved this prospectus nor taken steps to verify the information set forth herein and has no responsibility for the prospectus. The shares to which this prospectus relates may be illiquid and/or subject to restrictions on their resale. Prospective purchasers of the shares offered should conduct their own due diligence on the shares. If you do not understand the contents of this prospectus you should consult an authorized financial advisor.
Notice to Prospective Investors in Australia
No placement document, prospectus, product disclosure statement or other disclosure document has been lodged with the Australian Securities and Investments Commission, in relation to the offering. This prospectus does not constitute a prospectus, product disclosure statement or other disclosure document under the Corporations Act 2001 (the “Corporations Act”), and does not purport to include the information required for a prospectus, product disclosure statement or other disclosure document under the Corporations Act.
Any offer in Australia of the shares may only be made to persons (the “Exempt Investors”) who are “sophisticated investors” (within the meaning of section 708(8) of the Corporations Act), “professional investors” (within the meaning of section 708(11) of the Corporations Act) or otherwise pursuant to one or more exemptions contained in section 708 of the Corporations Act so that it is lawful to offer the shares without disclosure to investors under Chapter 6D of the Corporations Act.
The shares applied for by Exempt Investors in Australia must not be offered for sale in Australia in the period of 12 months after the date of allotment under the offering, except in circumstances where disclosure to investors under Chapter 6D of the Corporations Act would not be required pursuant to an exemption under section 708 of the Corporations Act or otherwise or where the offer is pursuant to a disclosure document which complies with Chapter 6D of the Corporations Act. Any person acquiring shares must observe such Australian on-sale restrictions.
This prospectus contains general information only and does not take account of the investment objectives, financial situation or particular needs of any particular person. It does not contain any securities recommendations or financial product advice. Before making an investment decision, investors need to consider whether the information in this prospectus is appropriate to their needs, objectives and circumstances, and, if necessary, seek expert advice on those matters.
Notice to Prospective Investors in Hong Kong
The shares have not been offered or sold and will not be offered or sold in Hong Kong, by means of any document, other than (a) to “professional investors” as defined in the Securities and Futures Ordinance (Cap. 571) of Hong Kong and any rules made under that Ordinance; or (b) in other circumstances which do not result in the document being a “prospectus” as defined in the Companies Ordinance (Cap. 32) of Hong Kong or which do not constitute an offer to the public within the meaning of that Ordinance. No advertisement, invitation or document relating to the shares has been or may be issued or has been or may be in the possession of any person
139
Table of Contents
for the purposes of issue, whether in Hong Kong or elsewhere, which is directed at, or the contents of which are likely to be accessed or read by, the public of Hong Kong (except if permitted to do so under the securities laws of Hong Kong) other than with respect to shares which are or are intended to be disposed of only to persons outside Hong Kong or only to “professional investors” as defined in the Securities and Futures Ordinance and any rules made under that Ordinance.
Notice to Prospective Investors in Japan
The shares have not been and will not be registered under the Financial Instruments and Exchange Law of Japan (Law No. 25 of 1948, as amended) and, accordingly, will not be offered or sold, directly or indirectly, in Japan, or for the benefit of any Japanese Person or to others for re-offering or resale, directly or indirectly, in Japan or to any Japanese Person, except in compliance with all applicable laws, regulations and ministerial guidelines promulgated by relevant Japanese governmental or regulatory authorities in effect at the relevant time. For the purposes of this paragraph, “Japanese Person” shall mean any person resident in Japan, including any corporation or other entity organized under the laws of Japan.
Notice to Prospective Investors in Singapore
This prospectus has not been registered as a prospectus with the Monetary Authority of Singapore. Accordingly, this prospectus and any other document or material in connection with the offer or sale, or invitation for subscription or purchase, of the shares may not be circulated or distributed, nor may the shares be offered or sold, or be made the subject of an invitation for subscription or purchase, whether directly or indirectly, to persons in Singapore other than (i) to an institutional investor under Section 274 of the Securities and Futures Act, Chapter 289 of Singapore (the “SFA”), (ii) to a relevant person pursuant to Section 275(1), or any person pursuant to Section 275(1A), and in accordance with the conditions specified in Section 275, of the SFA, or (iii) otherwise pursuant to, and in accordance with the conditions of, any other applicable provision of the SFA.
Where the shares are subscribed or purchased under Section 275 of the SFA by a relevant person which is:
| (a) | a corporation (which is not an accredited investor (as defined in Section 4A of the SFA)) the sole business of which is to hold investments and the entire share capital of which is owned by one or more individuals, each of whom is an accredited investor; or a trust (where the trustee is not an accredited investor) whose sole purpose is to hold investments and each beneficiary of the trust is an individual who is an accredited investor, |
securities (as defined in Section 239(1) of the SFA) of that corporation or the beneficiaries’ rights and interest (howsoever described) in that trust shall not be transferred within six months after that corporation or that trust has acquired the shares pursuant to an offer made under Section 275 of the SFA except:
| (a) | to an institutional investor or to a relevant person defined in Section 275(2) of the SFA, or to any person arising from an offer referred to in Section 275(1A) or Section 276(4)(i)(B) of the SFA; |
| (b) | where no consideration is or will be given for the transfer; |
| (c) | where the transfer is by operation of law; |
| (d) | as specified in Section 276(7) of the SFA; or |
| (e) | as specified in Regulation 32 of the Securities and Futures (Offers of Investments) (Shares and Debentures) Regulations 2005 of Singapore. |
140
Table of Contents
Notice to Prospective Investors in Canada
The shares may be sold only to purchasers purchasing, or deemed to be purchasing, as principal that are accredited investors, as defined in National Instrument 45-106 Prospectus Exemptions or subsection 73.3(1) of the Securities Act (Ontario), and are permitted clients, as defined in National Instrument 31-103 Registration Requirements, Exemptions and Ongoing Registrant Obligations. Any resale of the shares must be made in accordance with an exemption from, or in a transaction not subject to, the prospectus requirements of applicable securities laws.
Securities legislation in certain provinces or territories of Canada may provide a purchaser with remedies for rescission or damages if this prospectus (including any amendment thereto) contains a misrepresentation, provided that the remedies for rescission or damages are exercised by the purchaser within the time limit prescribed by the securities legislation of the purchaser’s province or territory. The purchaser should refer to any applicable provisions of the securities legislation of the purchaser’s province or territory for particulars of these rights or consult with a legal advisor.
Pursuant to section 3A.3 (or, in the case of securities issued or guaranteed by the government of a non-Canadian jurisdiction, section 3A.4) of National Instrument 33-105 Underwriting Conflicts (NI 33-105), the underwriters are not required to comply with the disclosure requirements of NI 33-105 regarding underwriter conflicts of interest in connection with this offering.
141
Table of Contents
The validity of the shares offered hereby will be passed upon for us by Paul, Weiss, Rifkind, Wharton & Garrison LLP, New York, New York. Latham & Watkins LLP, New York, New York has acted as counsel for the underwriters in connection with certain legal matters related to this offering.
The consolidated financial statements as of January 31, 2015 (Predecessor) and January 30, 2016 (Successor) and for the fiscal year ended February 1, 2014 (Predecessor), the fiscal year ended January 31, 2015 (Predecessor), the period from February 1, 2015 through May 7, 2015 (Predecessor) and the period from May 8, 2015 through January 30, 2016 (Successor) included in this prospectus have been so included in reliance on the report of PricewaterhouseCoopers LLP, an independent registered public accounting firm, given on the authority of said firm as experts in auditing and accounting.
WHERE YOU CAN FIND MORE INFORMATION
We have filed with the SEC a registration statement on Form S-1 with respect to the common stock being sold in this offering. This prospectus constitutes a part of that registration statement. This prospectus does not contain all the information set forth in the registration statement and the exhibits and schedules to the registration statement, because some parts have been omitted in accordance with the rules and regulations of the SEC. For further information with respect to us and our common stock being sold in this offering, you should refer to the registration statement and the exhibits and schedules filed as part of the registration statement. Statements contained in this prospectus regarding the contents of any agreement, contract or other document referred to are not necessarily complete; reference is made in each instance to the copy of the contract or document filed as an exhibit to the registration statement. Each statement is qualified by reference to the exhibit. You may inspect a copy of the registration statement without charge at the SEC’s principal office in Washington, D.C. Copies of all or any part of the registration statement may be obtained after payment of fees prescribed by the SEC from the SEC’s Public Reference Room at the SEC’s principal office, at 100 F Street, N.E., Washington, D.C. 20549.
You may obtain information regarding the operation of the Public Reference Room by calling the SEC at 1-800-SEC-0330. The SEC maintains an Internet site that contains reports, proxy and information statements and other information regarding registrants that file electronically with the SEC. The SEC’s website address is www.sec.gov.
After we have completed this offering, we will file annual, quarterly and current reports, proxy statements and other information with the SEC. We intend to make these filings available on our website once this offering is completed. You may read and copy any reports, statements or other information on file at the public reference rooms. You can also request copies of these documents, for a copying fee, by writing to the SEC, or you can review these documents on the SEC’s website, as described above. In addition, we will provide electronic or paper copies of our filings free of charge upon request.
142
Table of Contents
J. Jill, Inc.
INDEX TO CONSOLIDATED FINANCIAL STATEMENTS
| F-2 | ||||
| Audited Consolidated Financial Statements |
||||
| Consolidated Balance Sheets as of January 31, 2015 (Predecessor) and January 30, 2016 (Successor) |
F-4 | |||
| F-5 | ||||
| F-6 | ||||
| F-6 | ||||
| F-7 | ||||
| F-8 | ||||
| Unaudited Consolidated Financial Statements |
||||
| Consolidated Balance Sheets at January 30, 2016 (Successor) and October 29, 2016 (Successor) |
F-46 | |||
| F-47 | ||||
| F-48 | ||||
| F-49 | ||||
| F-50 | ||||
F-1
Table of Contents
Report of Independent Registered Public Accounting Firm
To the Board of Directors and Shareholders of J.Jill, Inc.
In our opinion, the accompanying consolidated balance sheet as of January 31, 2015 and the related consolidated statements of operations and comprehensive income (loss), of members’ equity and of cash flows for the period from February 1, 2015 to May 7, 2015 and for each of the two years in the period ended January 31, 2015 present fairly, in all material respects, the financial position of J.Jill, Inc. and its subsidiaries (Predecessor) as of January 31, 2015 and the results of their operations and their cash flows for the period from February 1, 2015 to May 7, 2015 and for each of the two years in the period ended January 31, 2015 in conformity with accounting principles generally accepted in the United States of America. These financial statements are the responsibility of the Company’s management. Our responsibility is to express an opinion on these financial statements based on our audits. We conducted our audits of these financial statements in accordance with the standards of the Public Company Accounting Oversight Board (United States). Those standards require that we plan and perform the audit to obtain reasonable assurance about whether the financial statements are free of material misstatement. An audit includes examining, on a test basis, evidence supporting the amounts and disclosures in the financial statements, assessing the accounting principles used and significant estimates made by management, and evaluating the overall financial statement presentation. We believe that our audits provide a reasonable basis for our opinion.
As discussed in Note 3 to the consolidated financial statements, the Company changed the manner in which it classifies deferred taxes and the manner in which it classifies debt issuance costs in fiscal year 2015.
/s/ PricewaterhouseCoopers LLP
Boston, Massachusetts
October 21, 2016, except for the effects of the corporate conversion as discussed in Note 1, Note 15 and Note 18 and the parent merger as discussed in Note 18, as to which the date is February 25, 2017
F-2
Table of Contents
Report of Independent Registered Public Accounting Firm
To the Board of Directors and Shareholders of J.Jill, Inc.
In our opinion, the accompanying consolidated balance sheet as of January 30, 2016 and the related consolidated statements of operations and comprehensive income (loss), of members’ equity and of cash flows for the period from May 8, 2015 to January 30, 2016 present fairly, in all material respects, the financial position of J.Jill, Inc. and its subsidiaries (Successor) as of January 30, 2016 and the results of their operations and their cash flows for the period from May 8, 2015 to January 30, 2016 in conformity with accounting principles generally accepted in the United States of America. These financial statements are the responsibility of the Company’s management. Our responsibility is to express an opinion on these financial statements based on our audit. We conducted our audit of these financial statements in accordance with the standards of the Public Company Accounting Oversight Board (United States). Those standards require that we plan and perform the audit to obtain reasonable assurance about whether the financial statements are free of material misstatement. An audit includes examining, on a test basis, evidence supporting the amounts and disclosures in the financial statements, assessing the accounting principles used and significant estimates made by management, and evaluating the overall financial statement presentation. We believe that our audit provides a reasonable basis for our opinion.
/s/ PricewaterhouseCoopers LLP
Boston, Massachusetts
October 21, 2016, except for the effects of the corporate conversion as discussed in Note 1, Note 15 and Note 18 and the parent merger as discussed in Note 18, as to which the date is February 25, 2017
F-3
Table of Contents
J. Jill, Inc.
(in thousands, except unit data)
| Predecessor | Successor | |||||||||||
| January 31, 2015 |
|
January 30, 2016 |
||||||||||
| Assets |
||||||||||||
| Current assets: |
||||||||||||
| Cash |
$ | 604 | $ | 27,505 | ||||||||
| Accounts receivable |
3,677 | 3,164 | ||||||||||
| Inventories, net |
55,317 | 64,406 | ||||||||||
| Prepaid expenses and other current assets |
11,710 | 20,539 | ||||||||||
|
|
|
|
|
|
|
|||||||
| Total current assets |
71,308 | 115,614 | ||||||||||
| Property and equipment, net |
62,035 | 86,810 | ||||||||||
| Intangible assets, net |
76,836 | 179,965 | ||||||||||
| Goodwill |
67,413 | 196,572 | ||||||||||
| Receivable from related party |
— | 1,850 | ||||||||||
| Other assets |
640 | 1,221 | ||||||||||
|
|
|
|
|
|
|
|||||||
| Total assets |
$ | 278,232 | $ | 582,032 | ||||||||
|
|
|
|
|
|
|
|||||||
| Liabilities, Preferred Capital and Members’ Equity |
||||||||||||
| Current liabilities: |
||||||||||||
| Accounts payable |
$ | 42,752 | $ | 41,041 | ||||||||
| Accrued expenses and other current liabilities |
36,007 | 43,591 | ||||||||||
| Current portion of long-term debt |
2,168 | 2,500 | ||||||||||
|
|
|
|
|
|
|
|||||||
| Total current liabilities |
80,927 | 87,132 | ||||||||||
| Long-term debt, net of discount and current portion |
80,201 | 237,478 | ||||||||||
| Deferred income taxes |
27,466 | 78,837 | ||||||||||
| Other liabilities |
18,131 | 12,014 | ||||||||||
|
|
|
|
|
|
|
|||||||
| Total liabilities |
206,725 | 415,461 | ||||||||||
|
|
|
|
|
|
|
|||||||
| Commitments and contingencies (see Note 11) |
||||||||||||
| Preferred capital |
72,824 | — | ||||||||||
| Members’ Equity |
||||||||||||
| Class A units, zero par value, 100 units authorized, issued and outstanding at January 31, 2015 (Predecessor) and zero units authorized, issued and outstanding at January 30, 2016 (Successor) |
1 | — | ||||||||||
| Class B units, zero par value, 3,927,601.3 units authorized, issued and outstanding at January 31, 2015 (Predecessor) and zero units authorized, issued and outstanding at January 30, 2016 (Successor) |
39,276 | — | ||||||||||
| Common units, zero par value, 1,000,000 units authorized, issued and outstanding at January 31, 2015 (Predecessor) and January 30, 2016 (Successor) |
— | — | ||||||||||
| Contributed capital |
7,292 | 162,265 | ||||||||||
| Accumulated (deficit) earnings |
(47,886 | ) | 4,306 | |||||||||
|
|
|
|
|
|
|
|||||||
| Total members’ (deficit) equity |
(1,317 | ) | 166,571 | |||||||||
|
|
|
|
|
|
|
|||||||
| Total liabilities, preferred capital and members’ equity |
$ | 278,232 | $ | 582,032 | ||||||||
|
|
|
|
|
|
|
|||||||
The accompanying notes are an integral part of these consolidated financial statements.
F-4
Table of Contents
J. Jill, Inc.
CONSOLIDATED STATEMENTS OF OPERATIONS AND
COMPREHENSIVE INCOME (LOSS)
(in thousands, except share and per share data)
| Predecessor | Successor | |||||||||||||||||||
| For the Fiscal Year Ended February 1, 2014 |
For the Fiscal Year Ended January 31, 2015 |
For the Period from February 1, 2015 to May 7, 2015 |
For the Period from May 8, 2015 to January 30, 2016 |
|||||||||||||||||
| Net sales |
$ | 456,026 | $ | 483,400 | $ | 141,921 | $ | 420,094 | ||||||||||||
| Costs of goods sold |
161,261 | 164,792 | 44,232 | 155,091 | ||||||||||||||||
|
|
|
|
|
|
|
|
|
|||||||||||||
| Gross profit |
294,765 | 318,608 | 97,689 | 265,003 | ||||||||||||||||
| Selling, general and administrative expenses |
267,319 | 279,557 | 80,151 | 246,482 | ||||||||||||||||
| Acquisition-related expenses |
— | — | 13,341 | — | ||||||||||||||||
|
|
|
|
|
|
|
|
|
|||||||||||||
| Operating income |
27,446 | 39,051 | 4,197 | 18,521 | ||||||||||||||||
| Interest expense |
19,064 | 17,895 | 4,599 | 11,893 | ||||||||||||||||
|
|
|
|
|
|
|
|
|
|||||||||||||
| Income (loss) before provision for income taxes |
8,382 | 21,156 | (402 | ) | 6,628 | |||||||||||||||
| Provision for income taxes |
3,884 | 10,860 | 1,499 | 2,322 | ||||||||||||||||
|
|
|
|
|
|
|
|
|
|||||||||||||
| Net income (loss) and total comprehensive income (loss) |
$ | 4,498 | $ | 10,296 | $ | (1,901 | ) | $ | 4,306 | |||||||||||
|
|
|
|
|
|
|
|
|
|||||||||||||
| Net income (loss) per common share attributable to common stockholders: |
||||||||||||||||||||
| Basic and diluted |
$ | 0.10 | $ | 0.24 | $ | (0.04 | ) | $ | 0.10 | |||||||||||
| Weighted average number of common shares outstanding: |
||||||||||||||||||||
| Basic and diluted |
43,747,944 | 43,747,944 | 43,747,944 | 43,747,944 | ||||||||||||||||
The accompanying notes are an integral part of these consolidated financial statements.
F-5
Table of Contents
J. Jill, Inc.
CONSOLIDATED STATEMENTS OF MEMBERS’ EQUITY
(PREDECESSOR)
(in thousands, except unit data)
| Preferred Capital |
|
Class A Units |
Class B Units |
Common Units |
Contributed Capital |
Accumulated (Deficit) |
Total Members’ Equity (Deficit) |
|||||||||||||||||||||||||||||||||||||
| Units |
Amount |
Units |
Amount |
Units |
Amount |
|||||||||||||||||||||||||||||||||||||||
| Balance, February 2, 2013 |
$ | 72,824 | 100 | $ | 1 | 3,927,601 | $ | 39,276 | 1,000,000 | $ | — | $ | 417 | $ | (62,680 | ) | $ | (22,986 | ) | |||||||||||||||||||||||||
| Equity-based compensation |
— | — | — | — | — | — | — | 1,930 | — | 1,930 | ||||||||||||||||||||||||||||||||||
| Repurchase of common equity interests |
— | — | — | — | — | — | — | (207 | ) | — | (207 | ) | ||||||||||||||||||||||||||||||||
| Net income |
— | — | — | — | — | — | — | — | 4,498 | 4,498 | ||||||||||||||||||||||||||||||||||
|
|
|
|
|
|
|
|
|
|
|
|
|
|
|
|
|
|
|
|
|
|
|
|||||||||||||||||||||||
| Balance, February 1, 2014 |
72,824 | 100 | 1 | 3,927,601 | 39,276 | 1,000,000 | — | 2,140 | (58,182 | ) | (16,765 | ) | ||||||||||||||||||||||||||||||||
| Equity-based compensation |
— | — | — | — | — | — | — | 5,152 | — | 5,152 | ||||||||||||||||||||||||||||||||||
| Net income |
— | — | — | — | — | — | — | — | 10,296 | 10,296 | ||||||||||||||||||||||||||||||||||
|
|
|
|
|
|
|
|
|
|
|
|
|
|
|
|
|
|
|
|
|
|
|
|||||||||||||||||||||||
| Balance, January 31, 2015 |
72,824 | 100 | 1 | 3,927,601 | 39,276 | 1,000,000 | — | 7,292 | (47,886 | ) | (1,317 | ) | ||||||||||||||||||||||||||||||||
| Equity-based compensation |
— | — | — | — | — | — | — | 441 | — | 441 | ||||||||||||||||||||||||||||||||||
| Net loss |
— | — | — | — | — | — | — | — | (1,901 | ) | (1,901 | ) | ||||||||||||||||||||||||||||||||
|
|
|
|
|
|
|
|
|
|
|
|
|
|
|
|
|
|
|
|
|
|
|
|||||||||||||||||||||||
| Balance, May 7, 2015 |
72,824 | 100 | 1 | 3,927,601 | 39,276 | 1,000,000 | — | 7,733 | (49,787 | ) | (2,777 | ) | ||||||||||||||||||||||||||||||||
| Elimination of equity in connection with Acquisition (see Note 4) |
(72,824 | ) | (100 | ) | (1 | ) | (3,927,601 | ) | (39,276 | ) | (1,000,000 | ) | — | (7,733 | ) | 49,787 | 2,777 | |||||||||||||||||||||||||||
|
|
|
|
|
|
|
|
|
|
|
|
|
|
|
|
|
|
|
|
|
|
|
|||||||||||||||||||||||
| Balance, May 8, 2015 |
$ | — | $ | — | $ | — | $ | — | $ | — | — | $ | — | $ | — | $ | — | $ | — | |||||||||||||||||||||||||
|
|
|
|
|
|
|
|
|
|
|
|
|
|
|
|
|
|
|
|
|
|
|
|||||||||||||||||||||||
J. Jill, Inc.
CONSOLIDATED STATEMENT OF MEMBERS’ EQUITY
(SUCCESSOR)
(in thousands, except unit data)
| Common Units | Contributed Capital |
Accumulated Earnings |
Total Members’ Equity |
|||||||||||||||||
| Units | Amount | |||||||||||||||||||
| Balance, May 8, 2015 |
1,000,000 | $ | — | $ | 170,657 | $ | — | $ | 170,657 | |||||||||||
| Distribution to member |
— | — | (8,560 | ) | — | (8,560 | ) | |||||||||||||
| Equity-based compensation |
— | — | 168 | — | 168 | |||||||||||||||
| Net income |
— | — | — | 4,306 | 4,306 | |||||||||||||||
|
|
|
|
|
|
|
|
|
|
|
|||||||||||
| Balance, January 30, 2016 |
1,000,000 | $ | — | $ | 162,265 | $ | 4,306 | $ | 166,571 | |||||||||||
|
|
|
|
|
|
|
|
|
|
|
|||||||||||
The accompanying notes are an integral part of these consolidated financial statements.
F-6
Table of Contents
J.Jill, Inc.
CONSOLIDATED STATEMENTS OF CASH FLOWS
(in thousands)
| Predecessor |
Successor |
|||||||||||||||||||
| For
the |
For the Fiscal |
For the |
For
the |
|||||||||||||||||
| Net income (loss) |
$ | 4,498 | $ | 10,296 | $ | (1,901 | ) | $ | 4,306 | |||||||||||
| Operating activities: |
||||||||||||||||||||
| Adjustments to reconcile net income (loss) to net cash provided by operating activities |
||||||||||||||||||||
| Depreciation and amortization |
22,910 | 19,051 | 5,147 | 28,702 | ||||||||||||||||
| Amortization of inventory fair value adjustment |
— | — | — | 10,471 | ||||||||||||||||
| Loss on disposal of fixed assets |
386 | 58 | 112 | 237 | ||||||||||||||||
| Noncash amortization of deferred financing and debt discount costs |
2,256 | 1,680 | 657 | 983 | ||||||||||||||||
| Payment-in-kind interest on debt |
3,982 | 4,476 | 1,192 | — | ||||||||||||||||
| Equity-based compensation |
1,930 | 5,152 | 441 | 168 | ||||||||||||||||
| Deferred rent liability |
904 | 309 | 84 | 3,071 | ||||||||||||||||
| Deferred income taxes |
(5,233 | ) | (1,903 | ) | (961 | ) | (7,261 | ) | ||||||||||||
| Changes in operating assets and liabilities, net of Acquisition |
||||||||||||||||||||
| Accounts receivable |
226 | (2,058 | ) | (3,504 | ) | 4,017 | ||||||||||||||
| Inventories |
(2,888 | ) | (10,273 | ) | (6,955 | ) | (1,577 | ) | ||||||||||||
| Prepaid expenses and other current assets |
(1,398 | ) | 349 | (1,716 | ) | (7,112 | ) | |||||||||||||
| Accounts payable |
15,728 | 3,066 | (7,608 | ) | 3,931 | |||||||||||||||
| Accrued taxes payable |
(1,136 | ) | — | 1,542 | (1,966 | ) | ||||||||||||||
| Accrued expenses |
522 | 6,531 | 17,285 | 8,356 | ||||||||||||||||
| Other noncurrent assets |
— | (12 | ) | 12 | (1,113 | ) | ||||||||||||||
| Other noncurrent liabilities |
2,606 | 4,652 | 1,906 | 5,349 | ||||||||||||||||
|
|
|
|
|
|
|
|
|
|||||||||||||
| Net cash provided by operating activities |
45,293 | 41,374 | 5,733 | 50,562 | ||||||||||||||||
|
|
|
|
|
|
|
|
|
|||||||||||||
| Investing activities: |
||||||||||||||||||||
| Acquisition, net of cash acquired |
— | — | — | (385,744 | ) | |||||||||||||||
| Purchases of property and equipment |
(27,419 | ) | (24,143 | ) | (7,406 | ) | (26,559 | ) | ||||||||||||
|
|
|
|
|
|
|
|
|
|||||||||||||
| Net cash used in investing activities |
(27,419 | ) | (24,143 | ) | (7,406 | ) | (412,303 | ) | ||||||||||||
|
|
|
|
|
|
|
|
|
|||||||||||||
| Financing activities: |
||||||||||||||||||||
| Repurchase of common interests units |
(207 | ) | — | — | — | |||||||||||||||
| Repayments on long-term debt |
(17,822 | ) | (17,145 | ) | (5,646 | ) | (1,250 | ) | ||||||||||||
| Proceeds from long-term debt |
— | — | — | 250,000 | ||||||||||||||||
| Payment of debt issuance costs |
— | — | — | (9,640 | ) | |||||||||||||||
| Proceeds from equity investment |
— | — | — | 160,546 | ||||||||||||||||
| Receivable from related party |
— | — | — | (1,850 | ) | |||||||||||||||
| Distribution to member |
— | — | — | (8,560 | ) | |||||||||||||||
| Proceeds from revolving credit facility |
21,000 | 87,750 | 58,750 | — | ||||||||||||||||
| Repayments of revolving credit facility |
(21,000 | ) | (87,750 | ) | (51,500 | ) | — | |||||||||||||
|
|
|
|
|
|
|
|
|
|||||||||||||
| Net cash (used in) provided by financing activities |
(18,029 | ) | (17,145 | ) | 1,604 | 389,246 | ||||||||||||||
|
|
|
|
|
|
|
|
|
|||||||||||||
| Net change in cash |
(155 | ) | 86 | (69 | ) | 27,505 | ||||||||||||||
| Cash: |
||||||||||||||||||||
| Beginning of Period |
673 | 518 | 604 | — | ||||||||||||||||
|
|
|
|
|
|
|
|
|
|||||||||||||
| End of Period |
$ | 518 | $ | 604 | $ | 535 | $ | 27,505 | ||||||||||||
|
|
|
|
|
|
|
|
|
|||||||||||||
| Supplemental cash flow information: |
||||||||||||||||||||
| Cash paid for interest |
$ | 12,747 | $ | 12,531 | $ | 2,952 | $ | 11,192 | ||||||||||||
| Cash paid for taxes |
10,244 | 12,599 | 882 | 16,033 | ||||||||||||||||
| Noncash investing and financing activities: |
||||||||||||||||||||
| Noncash purchase consideration |
— | — | — | 10,111 | ||||||||||||||||
| Capital expenditures financed with accounts payable and accrued expenses |
805 | 3,605 | 2,547 | 1,274 | ||||||||||||||||
The accompanying notes are an integral part of these consolidated financial statements.
F-7
Table of Contents
J.Jill, Inc.
Notes to Consolidated Financial Statements
1. General
J.Jill, Inc. (“J.Jill” or the “Company”) is a nationally recognized women’s apparel brand, headquartered in Quincy, Massachusetts, focused on affluent customers in the 40-65 age segment in 43 states. J.Jill operates an integrated omni-channel platform that is well diversified across its retail stores, website and catalogs.
The Company was originally formed as a Delaware Limited Liability Company named Jill Intermediate LLC on February 17, 2011 and holds the ownership interests of Jill Acquisition LLC and its subsidiaries. On May 8, 2015, a 94% controlling interest in the Company was acquired (the “Acquisition”) by Jill Holdings, Inc. (“Holdings”) and the remaining 6% was acquired by JJill Topco Holdings, LP (“Topco”), a Delaware limited partnership formed by TowerBrook Capital Partners L.P. (“TowerBrook”). The purchase price was $396.4 million, which consisted of $386.3 million of cash consideration and $10.1 million of noncash consideration in the form of an equity rollover by management. Holdings, a Delaware corporation, was formed for the purpose of effecting the Acquisition and has no operations of its own, except for costs incurred related to the Acquisition. Holdings is a wholly-owned subsidiary of Topco. Holdings accounted for the Acquisition as a business combination under the acquisition method of accounting. Accordingly, the assets acquired and liabilities assumed were recorded at fair value with the remaining purchase price recorded as goodwill (see Note 4). The Company elected to pushdown the effects of the Acquisition to its consolidated financial statements.
On February 24, 2017, Jill Intermediate LLC completed a conversion from a Delaware limited liability company into a Delaware corporation and changed its name to J.Jill, Inc. (the “Corporate Conversion”). In conjunction with the conversion, all of the outstanding equity of Jill Intermediate LLC converted into shares of common stock of J.Jill, Inc. Accordingly, all historical earnings per share amounts presented in the accompanying consolidated statements of operations and comprehensive income (loss) and the notes to the consolidated financial statements (see Note 15) have been adjusted retroactively to reflect the Corporate Conversion.
2. Summary of Significant Accounting Policies
Basis of Presentation
The consolidated financial statements prior to and including May 7, 2015 represent the financial information of the Company and its subsidiaries prior to the Acquisition, as well as consolidated variable interest entities (“VIEs”) (see Note 10), and are labeled as Predecessor (“Predecessor”). The consolidated financial statements for the periods beginning and subsequent to May 8, 2015 represent the financial information of the Company and its subsidiaries subsequent to the Acquisition and are labeled as Successor (“Successor”). Due to the change in the basis of accounting resulting from the Acquisition, the Company’s consolidated financial statements for these reporting periods are not comparable.
The consolidated financial statements have been prepared in conformity with accounting principles generally accepted in the United States of America (“GAAP”).
The Company uses a 52 to 53 week fiscal year ending on the Saturday closest to January 31. Each fiscal year generally is comprised of four 13 week fiscal quarters, although in the years with 53 weeks the fourth quarter represents a 14 week period. The period from February 1, 2015 to May 7, 2015 (Predecessor period) included approximately 14 weeks of operations. The Predecessor fiscal years of 2013 and 2014 each had 52 weeks of operations. The period from May 8, 2015 to January 30, 2016 (Successor period) included approximately 38 weeks of operations.
F-8
Table of Contents
J.Jill, Inc.
Notes to Consolidated Financial Statements
Use of Estimates
The preparation of the consolidated financial statements in accordance with GAAP requires management to make estimates and judgments that affect reported amounts of assets, liabilities, members’ equity, net sales and expenses, and the disclosure of contingent assets and liabilities. Significant estimates relied upon in preparing these consolidated financial statements include, but are not limited to, revenue recognition, including merchandise returns and accounting for gift card breakage; accounting for business combinations; estimating the fair value of inventory and inventory reserves; impairment assessments of goodwill, intangible assets, and other long-lived assets; and equity-based compensation. Actual results could differ from those estimates.
Principles of Consolidation
The accompanying consolidated financial statements include the assets, liabilities and results of operations of the Company and its subsidiaries. For periods prior to the Acquisition, the consolidated financial statements include the assets, liabilities and results of operations of the Predecessor and its subsidiaries, as well as consolidated VIEs, for which the Predecessor had determined that it was the primary beneficiary (see Note 10). All intercompany balances and transactions have been eliminated in the consolidated financial statements.
Segment Reporting
The Company determined its operating segments on the same basis that it assesses performance and makes operating decisions. The Company’s operating segments consist of its retail and direct channels, which have been aggregated into one reportable segment.
All of the Company’s identifiable assets are located in the United States, which is where the Company is domiciled. The Company does not have sales outside the United States, nor does any customer represent more than 10% of total revenues for any period presented.
Variable Interest Entities
The Company regularly evaluates its relationships with other entities to identify whether they are variable interest entities and to assess whether it is the primary beneficiary of such entities. Under GAAP, a reporting entity shall consolidate a VIE when that reporting entity has a variable interest that provides the reporting entity with a controlling financial interest. The entity that ultimately consolidates the VIE shall be the reporting entity that a) has the power to direct the activities of the VIE that most significantly impact the VIE’s economic performance, and b) has the obligation to absorb losses or the right to receive benefits from the VIE that could be significant to the VIE. If the determination is made that a company is the primary beneficiary of a variable interest entity, then that entity is included in its consolidated financial statements.
As of January 31, 2015 (Predecessor), the Company determined that it had a variable interest in three unrelated entities for which it determined it was the primary beneficiary (see Note 10). These VIEs were consolidated during the 2013, 2014 and 2015 Predecessor periods and all intercompany transactions were eliminated in consolidation.
Concurrent with the May 8, 2015 Acquisition (see Note 4), the obligations held by each of the three VIEs were repaid in full and no further obligations remained. Accordingly, these entities were not consolidated in the 2015 Successor period and they were dissolved.
F-9
Table of Contents
J.Jill, Inc.
Notes to Consolidated Financial Statements
Business Combinations
The Company accounts for business combinations under the acquisition method of accounting. Under this method, acquired assets, including separately identifiable intangible assets, and any assumed liabilities are recorded at their acquisition date estimated fair value. The excess of purchase price over the fair value amounts assigned to the assets acquired and liabilities assumed represents the goodwill amount resulting from the acquisition. Determining the fair value of assets acquired and liabilities assumed involves the use of significant estimates and assumptions.
Concurrent with the Acquisition, the Company elected to apply pushdown accounting. Pushdown accounting refers to the use of the acquirer’s basis in the preparation of the acquiree’s separate financial statements as the new basis of accounting for the acquiree. See Note 4 for a discussion of the Acquisition and the related impact of pushdown accounting on the Company’s consolidated financial statements.
Accounts Receivable
The Company’s accounts receivable relate primarily to payments due from banks for credit and debit transactions for approximately 2 to 5 days of sales. These receivables do not bear interest.
Inventories
Inventory consists of finished goods held for sale. Inventory is stated at the lower of cost or market, net of reserves. Cost is calculated using the weighted average method of accounting, and includes the cost to purchase merchandise from the Company’s manufacturers plus duties and inbound freight. The net realizable value of the Company’s inventory is estimated based on historical experience, current and forecasted demand, and market conditions. The allowance for excess and obsolete inventory requires management to make assumptions and to apply judgment regarding a number of factors, including past and projected sales performance and current inventory levels. As of January 31, 2015 (Predecessor) and January 30, 2016 (Successor), an inventory reserve of $1.5 million and $1.5 million has been recorded, respectively. The Company sells excess inventory in its stores and on-line at www.jjill.com. In limited cases, discount marketers and inventory liquidators are utilized.
Inventory from domestic suppliers is recorded when it is received at the distribution center. Inventory from foreign suppliers is recorded when goods are cleared for export on board the ship at the port of shipment.
Property and Equipment
Property and equipment purchases are recorded at cost. Property and equipment is presented net of accumulated depreciation. Depreciation is computed using the straight-line method over the estimated useful lives of the respective assets. Leasehold improvements are amortized over the shorter of the term of the related lease or the estimated useful lives of the improvements. Expenditures for repairs and maintenance are charged to expense as incurred. Expenditures for betterments and major improvements that significantly enhance the value and increase the estimated useful life of the asset are capitalized and depreciated over the new estimated useful life. The carrying amounts of assets sold or retired and the related accumulated depreciation are eliminated in the year of disposal, and any resulting gains or losses are included in the accompanying consolidated statements of operations and comprehensive income (loss).
Estimated useful lives of property and equipment asset categories are as follows:
| Furniture, fixtures and equipment |
5-7 years | |
| Computer software and hardware |
3-5 years | |
| Leasehold improvements |
Shorter of estimated useful life or lease term |
F-10
Table of Contents
J.Jill, Inc.
Notes to Consolidated Financial Statements
Capitalized Interest
The cost of interest that is incurred in connection with ongoing construction projects is capitalized using a weighted average interest rate. These costs are included in property and equipment and amortized over the useful life of the related property or equipment.
Long-lived Assets
The carrying value of long-lived assets, including amortizable identifiable intangible assets, and asset groups are evaluated whenever events or changes in circumstances indicate that the carrying value may not be recoverable. Conditions that may indicate impairment include, but are not limited to, a significant decrease in the market price of an asset, a significant adverse change in the extent or manner in which an asset is being used or a significant decrease in its physical condition, and operating or cash flow performance that demonstrates continuing losses associated with an asset or asset group. A potential impairment has occurred if the projected future undiscounted cash flows expected to result from the use and eventual disposition of the asset or asset group are less than the carrying value of the asset or asset group. The estimate of cash flows includes management’s assumptions of cash inflows and outflows directly resulting from the use of the asset in operation. If the carrying value exceeds the sum of the undiscounted cash flows, an impairment charge is recorded equal to the excess of the asset or asset group’s carrying value over its fair value. Fair value is measured based on a projected discounted cash flow model using a discount rate the Company believes is commensurate with the risk inherent in its business. Any impairment charge would be recognized within operating expenses as a selling, general and administrative expense.
Goodwill and Indefinite-Lived Intangible Assets
Goodwill and indefinite-lived intangible assets are not amortized, but are reviewed for impairment at least annually, or more frequently when events or changes in circumstances indicate that the carrying value may not be recoverable. Judgments regarding indicators of potential impairment are based on market conditions and operational performance of the business.
At each fiscal year-end, the Company performs an impairment analysis of goodwill. The Company may assess its goodwill for impairment initially using a qualitative approach (“step zero”) to determine whether conditions exist to indicate that it is more likely than not that the fair value of a reporting unit is less than its carrying value. If management concludes, based on its assessment of relevant events, facts and circumstances that it is more likely than not that a reporting unit’s carrying value is greater than its fair value, then a quantitative analysis will be performed to determine if there is any impairment. The Company may also elect to initially perform a quantitative analysis instead of starting with step zero. The quantitative assessment for goodwill is a two-step assessment. “Step one” requires comparing the carrying value of a reporting unit, including goodwill, to its fair value using the income approach. The income approach uses a discounted cash flow model, which involves significant estimates and assumptions, including preparation of revenue and profitability growth forecasts, selection of a discount rate, and selection of a terminal year multiple. If the fair value of the respective reporting unit exceeds its carrying amount, goodwill is not considered to be impaired and no further testing is required. If the carrying amount of a reporting unit exceeds its fair value, the second step of the goodwill impairment test is to measure the amount of impairment loss, if any. “Step two” compares the implied fair value of goodwill to the carrying amount of goodwill. The implied fair value of goodwill is determined by a hypothetical purchase price allocation using the reporting unit’s fair value as the purchase price. If the carrying amount of goodwill exceeds the implied fair value, an impairment charge is recorded to write down goodwill to its implied fair value and is recorded as a selling, general and administrative expense within the Company’s consolidated statement of operations and comprehensive income (loss).
F-11
Table of Contents
J.Jill, Inc.
Notes to Consolidated Financial Statements
At each year end, the Company also performs an impairment analysis of its indefinite-lived intangible assets. Impairment losses are recorded to the extent that the carrying value of the indefinite-lived intangible asset exceeds its fair value. The Company measures the fair value of its trade name using the income approach, which uses a discounted cash flow model. The most significant estimates and assumptions inherent in this approach are the preparation of revenue and profitability growth forecasts, selection of a discount rate and a terminal year multiple.
Revenue Recognition
Revenue is primarily derived from the sale of apparel and accessory merchandise through our retail channel and direct channel, which includes website and catalog phone orders and is recognized when all of the following criteria are satisfied: (i) persuasive evidence of an arrangement exists; (ii) the price is fixed or determinable; (iii) collectability is reasonably assured; and (iv) delivery of products has occurred. Revenue also includes shipping and handling fees collected from customers. Revenue from our retail channel is recognized at the time of sale and revenue from our direct channel is recognized upon receipt of merchandise by the customer.
The Company has a return policy where merchandise returns will be accepted within 90 days of the original purchase date. At the sole discretion of the Company, returns may also be accepted after 90 days as a customer accommodation. At the time of sale, the Company records an estimated sales reserve for merchandise returns based on historical prior returns experience and expected future returns. The Company collects and remits sales and use taxes in all states in which retail and direct sales occur and taxes are applicable. These taxes are reported on a net basis and are thereby excluded from revenue.
Shipping and handling costs of $8.6 million, $9.0 million, $2.3 million and $7.9 million were recorded in selling, general and administrative expenses, for the 2013, 2014, 2015 Predecessor and 2015 Successor periods, respectively. Customer payments made in advance of the customer receiving merchandise are recorded as deferred revenue within accrued expenses and other liabilities in the Company’s consolidated balance sheets.
The Company sells gift cards without expiration dates to customers. The Company does not charge administrative fees on unused gift cards. Proceeds from the sale of gift cards are recorded as deferred revenue until the customer redeems the gift card or when the likelihood of redemption is remote. Based upon historical experience, the Company estimates the value of outstanding gift cards that will ultimately not be redeemed (“gift card breakage”) and will not be escheated under statutory unclaimed property laws. This gift card breakage amount is recognized as revenue over the time period established by the Company’s historical gift card redemption pattern.
The Company recognized gift card breakage revenue of $0.5 million, $0.5 million, $0.3 million and $0.4 million during the 2013, 2014, 2015 Predecessor and 2015 Successor periods, respectively.
The Company also receives royalty payments through its private label credit card agreement. The royalty payments are recognized as revenue as they are received over the term of the agreement. Royalty payments recognized were $1.2 million, $1.5 million, $0.5 million and $1.3 million for the 2013, 2014, and 2015 Predecessor and 2015 Successor periods, respectively.
Cost of Goods Sold
The Company’s cost of goods sold includes the direct costs of sold merchandise, which include customs, taxes, duties, and inbound shipping costs, inventory shrinkage, and adjustments and reserves for excess, aged and obsolete inventory. Cost of goods sold does not include distribution center costs and allocations of indirect costs, such as occupancy, depreciation, amortization, or labor and benefits.
F-12
Table of Contents
J.Jill, Inc.
Notes to Consolidated Financial Statements
Advertising Costs
The Company incurs costs to produce, print, and distribute its catalogs. Catalog costs are considered direct response advertising, are capitalized as incurred, and are amortized over the expected sales life of each catalog for a period generally not exceeding six months. The expected sales life of each catalog is determined based on a detailed marketing forecast, which considers historical experience for similar catalogs, coupled with current sales trends. Amortized catalog advertising expenses were approximately $24.9 million, $25.5 million, $7.8 million and $21.6 million for the 2013, 2014, 2015 Predecessor and 2015 Successor periods, respectively, and are included in selling, general and administrative expenses in the accompanying consolidated statements of operations and comprehensive income (loss).
Other advertising costs are recorded as incurred. Other advertising expenses recorded were $11.8 million, $10.9 million, $3.2 million and $10.9 million for the 2013, 2014, 2015 Predecessor and 2015 Successor periods, respectively, and are included in selling, general and administrative expenses in the accompanying consolidated statements of operations and comprehensive income (loss).
Operating Leases and Deferred Rent
Certain operating leases contain predetermined escalations of the minimum rental payments to be made over the lease term. The Company recognizes the related rent expense on a straight-line basis over the life of the lease, taking into account fixed escalations as well as reasonably assured renewal periods.
Certain retail store leases include allowances from landlords in the form of cash. These allowances are part of the negotiated terms of the lease. The Company records the full amount of the allowance when specific performance criteria are met as a deferred liability. The deferred liability is amortized into income as a reduction of rent expense over the term of the applicable lease, including reasonably assured renewal periods. The Company recognizes those liabilities to be amortized within a year as a current liability and those greater than a year as a long-term liability. For purposes of recognizing these allowances and minimum rental expenses on a straight-line basis, the Company uses the date it obtains the legal right to use and control the leased space to begin amortization, which is generally when the Company takes possession of the space and begins to make improvements in preparation for its intended use.
Certain retail store leases also provide for contingent rent in addition to fixed rent. The contingent rent is determined as a percentage of gross sales in excess of predefined levels. The Company records a rent liability in accrued liabilities and the corresponding rent expense when it becomes probable that the Company will achieve a specified gross sales amount.
Certain store operating leases contain cancellation clauses allowing the leases to be terminated at the Company’s discretion, provided certain minimum sales levels are not achieved within a defined period of time after opening. The Company has not historically exercised these cancellation clauses and has therefore disclosed commitments for the full terms of such leases in the accompanying disclosures.
Debt Issuance Costs
The Company defers costs directly associated with acquiring third-party financing. Debt issuance costs are deferred and amortized using the effective interest rate method over the term of the related long-term debt agreement and the straight-line method for the revolving credit agreement. Debt issuances costs related to long-term debt are reflected as a direct deduction from the carrying amount of the debt in accordance with the Company’s adoption of ASU 2015-03 (see Note 3).
F-13
Table of Contents
J.Jill, Inc.
Notes to Consolidated Financial Statements
Income Taxes
The Company accounts for income taxes using the asset and liability method and elected to be taxed as a C corporation. Under this method, deferred tax assets and liabilities are recognized for the expected future tax consequences of temporary differences between the financial statement carrying values and their respective tax bases, using enacted tax rates expected to be applicable in the years in which the temporary differences are expected to reverse. Changes in deferred tax assets and liabilities are recorded in the provision for income taxes. The Company evaluates the realizability of its deferred tax assets and establishes a valuation allowance when it is more likely than not that all or a portion of the deferred tax assets will not be realized. Potential for recovery of deferred tax assets is evaluated by estimating the future taxable profits expected, scheduling of anticipated reversals of taxable temporary differences, and considering prudent and feasible tax planning strategies.
The Company records liabilities for uncertain income tax positions based on a two-step process. The first step is recognition, where an individual tax position is evaluated as to whether it has a likelihood of greater than 50% of being sustained upon examination based on the technical merits of the position, including resolution of any related appeals or litigation processes. For tax positions that are currently estimated to have less than a 50% likelihood of being sustained, no tax benefit is recorded. For tax positions that have met the recognition threshold in the first step, the Company performs the second step of measuring the benefit to be recorded. The amount of the benefit that may be recognized is the largest amount that has a greater than 50% likelihood of being realized on ultimate settlement. The actual benefits ultimately realized may differ from the estimates. In future periods, changes in facts, circumstances and new information may require the Company to change the recognition and measurement estimates with regard to individual tax positions. Changes in recognition and measurement estimates are recorded in income tax expense and liability in the period in which such changes occur.
Any interest or penalties incurred related to unrecognized tax benefits are recorded as tax expense in the provision for income tax expense line item of the accompanying consolidated statements of operations and comprehensive income (loss). The Company has not incurred interest expense or penalties related to income taxes during any period presented in the consolidated financial statements.
Fair Value of Financial Instruments
Certain assets and liabilities are carried at fair value in accordance with GAAP. Fair value is defined as the exchange price that would be received for an asset or paid to transfer a liability (an exit price) in the principal or most advantageous market for the asset or liability in an orderly transaction between market participants on the measurement date.
Valuation techniques used to measure fair value requires the Company to maximize the use of observable inputs and minimize the use of unobservable inputs. The hierarchy gives the highest priority to unadjusted quoted prices in active markets for identical assets or liabilities (Level 1 measurements) and the lowest priority to unobservable inputs (Level 3 measurements). Financial assets and liabilities carried at fair value are to be classified and disclosed in one of the following three levels of the fair value hierarchy, of which the first two are considered observable and the last is considered unobservable:
| Level 1: | Quoted prices in active markets for identical assets or liabilities. |
| Level 2: | Observable inputs, other than Level 1 prices, such as quoted prices for similar assets or liabilities in active markets; quoted prices for similar assets or liabilities in markets that are not active; or other inputs other than quoted prices that are observable or can be corroborated by observable market data for substantially the full term of the assets or liabilities, including interest rates and yield curves, and market corroborated inputs. |
F-14
Table of Contents
J.Jill, Inc.
Notes to Consolidated Financial Statements
| Level 3: | Unobservable inputs for the asset or liability that are supported by little or no market activity and that are significant to the fair value of the assets or liabilities. These are valued based on management’s estimates and assumptions that market participants would use in pricing the asset or liability. |
As of January 30, 2016 (Successor) the Company had no assets or liabilities that were measured at fair value for reporting purposes on a recurring basis. The fair value of the Company’s debt was approximately $103.0 million and $250.4 million at January 31, 2015 (Predecessor) and January 30, 2016 (Successor), respectively. The fair value of the Predecessor debt was determined using a discounted cash flow model, which represents a level 3 measurement.
The Company believes that the carrying amounts of its other financial instruments, including cash, accounts receivable, accounts payable and any amounts drawn on its revolving credit facilities, consisting primarily of instruments without extended maturities, the fair value of which, based on management’s estimates, approximates their carrying value due to the short-term maturities of these instruments.
Comprehensive Income (Loss)
Comprehensive income (loss) is a measure of net income (loss) and all other changes in equity that result from transactions other than with equity holders, and would normally be recorded in the consolidated statements of members’ equity and the consolidated statements of comprehensive income (loss). The Company’s management has determined that net income (loss) is the only component of the Company’s comprehensive income (loss). Accordingly, there is no difference between net income (loss) and comprehensive income (loss).
Equity-based Compensation
Predecessor
The Predecessor accounted for liability-classified equity-based compensation for employees and a director of the Company by recognizing the value of equity-based compensation as an expense in the calculation of net income (loss), based on the intrinsic value of the award, in accordance with ASC 718. The awards were revalued at each reporting period and the Predecessor recognized the related equity-based compensation expense.
The Predecessor recognized equity-based compensation generated at JJIP LLC (“JJIP”) (see Note 16) and recognized the related expense in the Predecessor’s consolidated financial statements. These equity-based compensation costs were incurred by JJIP and deemed to be for the benefit of J.Jill, and were therefore recognized as an equity contribution by the Company.
Successor
The Company accounts for equity-based compensation for employees and directors by recognizing the fair value of equity-based compensation as an expense in the calculation of net income (loss), based on the grant-date fair value. The Company recognizes equity-based compensation expense in the periods in which the employee or director is required to provide service, which is generally over the vesting period of the individual equity instruments. The fair value of the equity-based awards is determined using the Black-Scholes option pricing model.
All of the equity-based awards granted by the Company during the 2015 Successor period were considered equity-classified awards and compensation expense for these awards was recognized based on the portion of awards that are expected to vest. In developing a forfeiture rate estimate, the Company has considered its
F-15
Table of Contents
J.Jill, Inc.
Notes to Consolidated Financial Statements
historical experience to estimate pre-vesting forfeitures for service-based awards. The impact of a forfeiture rate adjustment is recognized in full in the period of adjustment, and if the actual forfeiture rate is materially different from the Company’s estimate, the Company may be required to record adjustments to equity-based compensation expense in future periods.
The Company recognizes equity-based compensation generated at Topco and records the related expense in its consolidated financial statements as the costs are deemed to be for the benefit of the Company (see Note 16). The expenses were allocated from the parent level to the Company and recognized as an equity contribution.
Earnings Per Share
Basic net income (loss) per share attributable to common stockholders is calculated by dividing net income (loss) available to common stockholders by the weighted average number of common shares outstanding for the period. Diluted net income (loss) per share attributable to common stockholders is calculated by dividing net income (loss) available to common stockholders by the diluted weighted average number of common shares outstanding for the period. There were no potentially dilutive securities outstanding during the 2013, 2014, 2015 Predecessor or 2015 Successor periods.
Credit Card Agreement
The Company has an arrangement with a third party to provide a private label credit card to its customers through February 2018 with two, two-year extension periods. The Company does not bear the credit risk associated with the private label credit card at any point prior to the termination of the agreement, at which point the Company is obligated to purchase the receivables. If the arrangement is terminated prior to September 7, 2021 and other criteria are met, the Company is obligated to pay a purchase price premium. The potential impact of the purchase obligation cannot be reasonably estimated as of the issuance date.
The Company also receives reimbursements for costs of marketing programs related to the credit card, which are recorded as a reduction in operating expenses in the accompanying consolidated statements of operations and comprehensive income (loss). Reimbursements amounted to $0.7 million, $0.5 million, $0.2 million, and $0.6 million for the 2013, 2014, 2015 Predecessor and 2015 Successor periods, respectively.
The Company also receives royalty payments from the credit card agreement, as discussed in Revenue Recognition, above.
Employee Benefit Plan
The Company has a 401(k) retirement plan under third-party administration covering all eligible employees who meet certain age and employment requirements pursuant to Section 401(k) of the Internal Revenue Code. Subject to certain dollar limits, eligible employees may contribute a portion of their pretax annual compensation to the plan, on a tax-deferred basis. The plan operates on a calendar year basis. The Company may, at its discretion, make elective contributions of up to 50% of the first 3% of the gross salary of the employee, which vests over a five year period. Discretionary contributions made by the Company for the 2013, 2014, 2015 Predecessor and 2015 Successor periods, were $0.5 million, $0.6 million, $0.2 million and $0.4 million, respectively.
Concentration of Credit Risks
Financial instruments that potentially subject the Company to concentrations of credit risk principally consist of cash held in financial institutions and accounts receivable. The Company considers the credit risk
F-16
Table of Contents
J.Jill, Inc.
Notes to Consolidated Financial Statements
associated with these financial instruments to be minimal. Cash is held by financial institutions with high credit ratings and the Company has not historically sustained any credit losses associated with its cash balances. The Company evaluates the credit risk associated with accounts receivable to determine if an allowance for doubtful accounts is necessary. As of January 31, 2015 (Predecessor) and January 30, 2016 (Successor), the Company determined that no allowance for doubtful accounts was necessary.
3. Accounting Standards
Recently Adopted Accounting Standards
In April 2015, the FASB issued ASU 2015-03, Simplifying the Presentation of Debt Issuance Costs. The amendments in this update require that debt issuance costs related to a recognized debt liability be presented in the balance sheet as a direct deduction from the carrying amount of that debt liability, consistent with debt discounts. The amendments in this update are effective for financial statements issued for fiscal years beginning after December 15, 2015, and interim periods within those fiscal years. Early adoption of the amendments in this update was permitted for financial statements that have not been previously issued. The Company has adopted this standard for its fiscal year ended January 30, 2016 on a retrospective basis, which resulted in the reclassification of $0.4 million of debt issuance costs from other assets to long-term debt as of January 31, 2015 in the consolidated balance sheet.
In August 2015, the FASB issued ASU 2015-15, Presentation and Subsequent Measurement of Debt Issuance Costs Associated with Line-of-Credit Arrangements, stating that the SEC staff would not object to an entity deferring and presenting debt issuance costs as an asset and subsequently amortizing the deferred debt issuance costs ratably over the term of the line-of-credit arrangement, regardless of whether there are any outstanding borrowings on the line-of-credit arrangement. The amendments in this update are effective concurrent with adoption of ASU 2015-03. The Company has adopted this standard for its fiscal year ended January 30, 2016 (Successor). The adoption had no impact on the Company’s results of operations or balance sheet as debt issuance costs related to line-of-credit arrangements continue to be presented as an asset on the Company’s consolidated balance sheets.
In November 2015, the FASB issued ASU 2015-17, Balance Sheet Classification of Deferred Taxes. The amendments in this update require that deferred tax liabilities and assets be classified as noncurrent in a classified statement of financial position. The amendments in this update may be applied either prospectively to all deferred tax liabilities and assets or retrospectively to all periods presented. For public business entities, the amendments in this update are effective for financial statements issued for annual periods beginning after December 15, 2016, and interim periods within those annual periods. Early application is permitted for all entities as of the beginning of interim or annual reporting periods. The Company has adopted this standard for its fiscal year ended January 30, 2016 (Successor) and retrospectively reclassified $1.0 million of deferred taxes from “Current Deferred Taxes” to “Deferred Taxes” as of January 31, 2015 in the consolidated balance sheets.
Recently Issued Accounting Pronouncements
In May 2014, the FASB issued ASU 2014-09, Revenue from Contracts with Customers—Topic 606, which supersedes the revenue recognition requirements in FASB ASC 605. The new guidance established principles for reporting revenue and cash flows arising from an entity’s contracts with customers. This new revenue recognition standard will replace most of the recognition guidance within GAAP. This guidance was deferred by ASU 2015-14, Revenue from Contracts with Customers (Topic 606): Deferral of the Effective Date, issued by the FASB in August 2015, which deferred the effective date of ASU 2014-09 from annual and interim periods beginning after December 15, 2016 to annual and interim periods beginning after December 15, 2017. In March 2016, the FASB issued ASU 2016-08, Revenue from Contracts with Customers: Principal versus Agent Considerations, which
F-17
Table of Contents
J.Jill, Inc.
Notes to Consolidated Financial Statements
further clarifies the implementation guidance in ASU 2014-09. In April 2016, the FASB issued ASU 2016-10, Revenue from Contracts with Customers (Topic 606): Identifying Performance Obligations and Licensing, to expand the guidance on identifying performance obligations and licensing within ASU 2014-09. In May 2016, the FASB issued ASU 2016-12, Revenues from Contracts with Customers: Narrow-Scope Improvements and Practical Expedients, which amends the guidance in the new revenue standard on collectability, noncash consideration, presentation of sales tax, and transition. The amendments are intended to address implementation issues that were raised by stakeholders and provide additional practical expedients to reduce the cost and complexity of applying the new revenue standard. These standards are effective for fiscal years beginning after December 15, 2017, including interim periods within that reporting period. Earlier application is permitted only as of annual reporting periods beginning after December 15, 2016, including interim reporting periods within that reporting period. The Company is evaluating the impact adopting these standards will have on its consolidated financial statements.
In August 2014, the FASB issued ASU 2014-15, Disclosure of Uncertainties about an Entity’s Ability to Continue as a Going Concern. This amendment states that in connection with preparing financial statements for each annual and interim reporting period, an entity’s management should evaluate whether there are conditions or events that raise substantial doubt about the entity’s ability to continue as a going concern within one year after the date that the financial statements are issued (or within one year after the date that the financial statements are available to be issued, when applicable). The amendments in this update are effective for the annual reporting period ending after December 15, 2016, and for annual periods and interim periods thereafter. Early application is permitted. The Company does not expect adoption of ASU 2014-15 to have a material impact on its consolidated financial statements.
In January 2015, the FASB issued ASU 2015-01, Income Statement—Extraordinary and Unusual Items. The amendments in this update eliminate the concept of extraordinary items in Subtopic 225-20, which required entities to consider whether an underlying event or transaction is extraordinary. However, the amendments retain the presentation and disclosure guidance for items that are unusual in nature or occur infrequently. The amendments in this update are effective for fiscal years, and interim periods within those years, beginning after December 15, 2015. The Company does not expect adoption of ASU 2015-01 to have a material impact on its consolidated financial statements.
In February 2015, the FASB issued ASU 2015-02, Amendments to the Consolidation Analysis. Update 2015-02 amended the process that a reporting entity must perform to determine whether it should consolidate certain types of legal entities. The amendments in this update are effective for public business entities for fiscal years, and for interim periods within those fiscal years, beginning after December 15, 2015. The Company does not expect adoption of ASU 2015-02 to have a material impact on its consolidated financial statements.
In July 2015, the FASB issued ASU 2015-11, Simplifying the Measurement of Inventory. The amendments in this update more closely align the measurement of inventory in GAAP with the measurement of inventory in International Financial Reporting Standards, under which an entity should measure inventory at the lower of cost or net realizable value. Net realizable value is the estimated selling price in the ordinary course of business, less reasonably predictable costs of completion, disposal, and transportation. For public business entities, the amendments are effective for fiscal years beginning after December 15, 2016, including interim periods within those fiscal years and must apply the amendments of this update prospectively. The Company is evaluating the impact of adopting ASU 2015-11 will have on its consolidated financial statements.
In September 2015, the FASB issued ASU 2015-16, Simplifying the Accounting for Measurement-Period Adjustments. The amendments in this update require that an acquirer recognize adjustments to provisional amounts that are identified during the measurement period in the reporting period in which the adjustment amounts are determined. To simplify the accounting for adjustments made to provisional amounts recognized in
F-18
Table of Contents
J.Jill, Inc.
Notes to Consolidated Financial Statements
a business combination, the amendments in this update eliminate the requirement to retrospectively account for those adjustments. For public business entities, the amendments in this update are effective for fiscal years beginning after December 15, 2015, including interim periods within those fiscal years. The Company does not expect adoption of ASU 2015-16 to have a material impact on its consolidated financial statements.
In February 2016, the FASB issued ASU 2016-02, Leases. The amendments in this update include a new FASB ASC Topic 842, which supersedes Topic 840. The core principle of Topic 842 is that a lessee should recognize the assets and liabilities that arise from leases. For public business entities, the amendments in this update are effective for fiscal years beginning after December 15, 2018, including interim periods within those fiscal years. Early application is permitted for all entities as of the beginning of interim or annual reporting periods. The Company is evaluating the impact of adopting ASU 2016-02 will have on its consolidated financial statements.
In March 2016, the FASB issued ASU 2016-09, Improvements to Employee Share-Based Payment Accounting. The amendments in this update involve several aspects of accounting for equity-based payment transactions, including income tax consequences, classification of awards, and classification on the statement of cash flows. For public business entities, the amendments in this update are effective for annual periods beginning after December 15, 2016, and interim periods within those annual periods. Early adoption is permitted for any entity in any interim or annual period. If an entity early adopts the amendments in an interim period, any adjustments should be reflected as of the beginning of the fiscal year that includes that interim period. An entity that elects early adoption must adopt all of the amendments in the same period. The Company is evaluating the impact of adopting ASU 2016-09 will have on its consolidated financial statements.
4. Acquisition
On May 8, 2015, Holdings, a wholly owned subsidiary of Topco, acquired approximately 94% of the outstanding interests of the Company, with Topco acquiring the remaining 6% of the outstanding membership interests of the Company. The purchase price was $396.4 million, which consisted of $386.3 million of cash consideration and $10.1 million of noncash consideration in the form of an equity rollover by management owners of the Predecessor entity. The Acquisition was funded through an equity contribution by Holdings and Topco and borrowings under the Company’s term loan agreement (see Note 9).
F-19
Table of Contents
J.Jill, Inc.
Notes to Consolidated Financial Statements
The Acquisition resulted in a new basis of accounting for Holdings, and in accordance with the Company’s election to apply pushdown accounting, the impact of the Acquisition has been recognized in the Successor periods of the Company’s consolidated financial statements. The following table summarizes the final allocation of the $396.4 million purchase price to the assets acquired and liabilities assumed (in thousands):
|
As of May 8, |
||||
| Assets acquired: |
||||
| Cash |
$ | 535 | ||
| Accounts receivable |
7,181 | |||
| Inventories |
73,300 | |||
| Prepaid expenses and other |
13,427 | |||
| Property and equipment |
78,684 | |||
| Intangible assets |
192,300 | |||
| Goodwill |
196,572 | |||
| Other assets |
256 | |||
|
|
|
|||
| Total assets acquired |
562,255 | |||
|
|
|
|||
| Liabilities assumed: |
||||
| Current liabilities |
75,583 | |||
| Deferred income taxes |
86,098 | |||
| Other liabilities |
4,184 | |||
|
|
|
|||
| Total liabilities assumed |
165,865 | |||
|
|
|
|||
| Net assets acquired |
$ | 396,390 | ||
|
|
|
|||
As a result of the Company pushing down the effects of the Acquisition recorded by Holdings, certain accounting adjustments are reflected in Intermediate’s consolidated financial statements, as discussed below.
The Company recorded goodwill of $196.6 million in the Successor consolidated balance sheet. Goodwill recognized is primarily attributable to the acquisition of an assembled workforce and other intangible assets that do not qualify for separate recognition.
The fair value of the acquired intangible assets was estimated using the relief from royalty method for our trade name and the excess earnings method for customer relationships. Under the relief-from-royalty method, the fair value estimate of the acquired trade name was determined based on the present value of the economic royalty savings associated with the ownership or possession of the trade name based on an estimated royalty rate applied to the cash flows to be generated by the business. The fair value of the trade name acquired as a result of the Acquisition was $58.1 million.
The fair value of customer relationships acquired in the Acquisition was estimated using the excess earnings method. Under the excess earnings method, the value of the intangible asset is equal to the present value of the after-tax cash flows attributable solely to the subject intangible asset. The fair value of customer relationships acquired as a result of the Acquisition was $134.2 million.
The Company also recorded certain favorable and unfavorable leasehold interests as a result of the Acquisition. Favorable leasehold interests are included in other assets and unfavorable leasehold interests are included in other liabilities. The fair value of favorable leasehold interests is determined using the income approach, whereby the difference between contractual rent and market rent is calculated for each remaining term for each lease, and then discounted to present value. All leasehold interests are amortized based upon patterns in which the economic benefits or obligations are expected to be realized. Accordingly, the favorable and unfavorable leasehold interests are being amortized over the respective lease terms of the properties.
F-20
Table of Contents
J.Jill, Inc.
Notes to Consolidated Financial Statements
The following are the favorable and unfavorable leasehold interests and their respective weighted average useful lives (in thousands):
| Fair Value at Acquisition |
Weighted Averaged Useful Life |
|||||||
| Leasehold Interests |
||||||||
| Favorable |
$ | 161 | 8.8 years | |||||
| Unfavorable |
(3,727 | ) | 6.4 years | |||||
|
|
|
|||||||
| Net non-market leasehold interests |
$ | (3,566 | ) | |||||
|
|
|
|||||||
The Company recorded $13.3 million of costs related to the Acquisition in the 2015 Predecessor period. These costs are included as acquisition-related expenses on the consolidated statement of operations and comprehensive income (loss) of the 2015 Predecessor period and were paid at the close of the Acquisition by Holdings and included as part of consideration for the acquired business. Additionally, there were management incentive bonuses awarded as part of the Acquisition that were deemed to be for the benefit of the acquired entity, and therefore, were recognized separately within sales, general and administrative expenses on the consolidated statement of operations and comprehensive income (loss) in the 2015 Successor period over the service period of 18 months.
The following unaudited pro forma financial information summarizes the combined results of operations for the Company as though the Acquisition occurred on February 2, 2014 (in thousands):
| For the Year Ended January 30, 2016 |
For the Year Ended January 31, 2015 |
|||||||
| Net sales |
$ | 562,015 | $ | 483,400 | ||||
| Net income (loss) |
$ | 20,751 | $ | (18,138 | ) | |||
Net income for the pro forma year ended January 31, 2015 includes $13.3 million of acquisition-related expenses incurred during the 2015 Predecessor period. Pro forma net income for the year ended January 31, 2015 also includes $10.5 million cost of goods sold incurred during the 2015 Successor period resulting from the increase in fair value of merchandise inventory reflected in the purchase price allocation at the date of acquisition, as though the Acquisition occurred on February 2, 2014. These amounts are excluded from pro forma net income for the year ended January 30, 2016. The unaudited pro forma financial information is presented for informational purposes only and may not be indicative of results that would have been achieved if the Acquisition had taken place on February 2, 2014.
5. Prepaid Expenses and Other Current Assets
Prepaid expenses and other current assets include the following (in thousands):
| January 31, 2015 (Predecessor) |
January 30, 2016 (Successor) |
|||||||||||
| Income tax receivable |
$ | — | $ | 4,407 | ||||||||
| Prepaid rent |
4,712 | 5,207 | ||||||||||
| Prepaid catalog costs |
2,708 | 3,326 | ||||||||||
| Prepaid store supplies |
1,409 | 2,607 | ||||||||||
| Other prepaid expenses |
2,194 | 4,281 | ||||||||||
| Other current assets |
687 | 711 | ||||||||||
|
|
|
|
|
|||||||||
| Total prepaid expenses and other current assets |
$ | 11,710 | $ | 20,539 | ||||||||
|
|
|
|
|
|||||||||
F-21
Table of Contents
J.Jill, Inc.
Notes to Consolidated Financial Statements
6. Goodwill and Other Intangible Assets
Goodwill
The following table shows changes in the carrying amount of goodwill for the 2015 Predecessor and 2015 Successor periods (in thousands):
| Balance as of February 1, 2014 (Predecessor) |
$ | 67,413 | ||
|
|
|
|||
| Balance as of January 31, 2015 (Predecessor) |
67,413 | |||
| Elimination of Predecessor goodwill |
(67,413 | ) | ||
| Goodwill recognized as part of the Acquisition |
196,572 | |||
|
|
|
|||
| Balance at January 30, 2016 (Successor) |
$ | 196,572 | ||
|
|
|
As a result of the Acquisition (see Note 4), the carrying value of the Company’s goodwill in the Predecessor period was eliminated and goodwill related to the Acquisition was recorded in the Successor period.
At the end of the 2015 Successor period, the Company elected to perform a step one analysis to assess goodwill for any potential impairment. The Company did not recognize impairment charges related to goodwill during the 2013, 2014 and 2015 Predecessor periods or the 2015 Successor period.
Intangible Assets
A summary of intangible assets as of January 31, 2015 (Predecessor) and January 30, 2016 (Successor) is as follows (in thousands):
| January 31, 2015 (Predecessor) |
January 30, 2016 (Successor) |
|||||||||||||||||||||||||||
|
Weighted |
Gross |
Accumulated |
Net Book |
Gross |
Accumulated |
Net Book |
||||||||||||||||||||||
| Indefinite-lived: |
||||||||||||||||||||||||||||
| Trade name |
N/A | $ | 30,900 | $ | — | $ | 30,900 | $ | 58,100 | $ | — | $ | 58,100 | |||||||||||||||
| Definite-lived: |
||||||||||||||||||||||||||||
| Customer Relationships |
13.2 | 75,000 | (29,064 | ) | 45,936 | 134,200 | (12,335 | ) | 121,865 | |||||||||||||||||||
| Other |
1.5 | 900 | (900 | ) | — | — | — | — | ||||||||||||||||||||
|
|
|
|
|
|
|
|
|
|
|
|
|
|||||||||||||||||
| Total Intangible Assets |
$ | 106,800 | $ | (29,964 | ) | $ | 76,836 | $ | 192,300 | $ | (12,335 | ) | $ | 179,965 | ||||||||||||||
|
|
|
|
|
|
|
|
|
|
|
|
|
|||||||||||||||||
F-22
Table of Contents
J.Jill, Inc.
Notes to Consolidated Financial Statements
The definite-lived intangible assets are amortized over the period the Company expects to receive the related economic benefit, which for customer lists is based upon estimated future net cash inflows. The estimated useful lives of intangible assets are as follows:
| For intangible assets prior to the Acquisition (Predecessor) |
||||
| Asset |
Amortization Method | Estimated Useful Life | ||
| Customer lists |
Pattern of economic benefit | 9 – 14 years | ||
| Non-compete agreements |
Straight-line basis | 1.5 years | ||
| For intangible assets subsequent to the Acquisition (Successor) |
||||
| Asset |
Amortization Method | Estimated Useful Life | ||
| Customer lists |
Pattern of economic benefit | 9 – 16 years | ||
Total amortization expense for these amortizable intangible assets was $7.6 million, $7.2 million, $1.8 million and $12.3 million for the 2013, 2014, and 2015 Predecessor and 2015 Successor periods, respectively. The Company did not recognize any impairment charges related to definite and indefinite-lived intangible assets for the 2013, 2014, and 2015 Predecessor and 2015 Successor periods, respectively.
The estimated amortization expense for each of the next five years and thereafter is as follows (in thousands):
| Fiscal Year |
Estimated |
|||
| 2016 |
$ | 16,482 | ||
| 2017 |
14,522 | |||
| 2018 |
12,784 | |||
| 2019 |
11,263 | |||
| 2020 |
10,015 | |||
| Thereafter |
56,799 | |||
|
|
|
|||
| Total |
$ | 121,865 | ||
|
|
|
|||
7. Property and Equipment
Property and equipment at January 31, 2015 (Predecessor) and January 30, 2016 (Successor) consist of the following (in thousands):
| January 31, 2015 (Predecessor) |
January 30, 2016 (Successor) |
|||||||
| Leasehold improvements |
$ | 61,768 | $ | 51,896 | ||||
| Furniture, fixtures and equipment |
29,800 | 27,973 | ||||||
| Computer hardware and software |
19,466 | 10,665 | ||||||
|
|
|
|
|
|||||
| Total property and equipment, gross |
111,034 | 90,534 | ||||||
| Accumulated depreciation |
(58,273 | ) | (16,924 | ) | ||||
|
|
|
|
|
|||||
| 52,761 | 73,610 | |||||||
| Construction in progress |
9,274 | 13,200 | ||||||
|
|
|
|
|
|||||
| Property and equipment, net |
$ | 62,035 | $ | 86,810 | ||||
|
|
|
|
|
|||||
F-23
Table of Contents
J.Jill, Inc.
Notes to Consolidated Financial Statements
Construction in progress is primarily comprised of leasehold improvements, furniture, fixtures and equipment related to unopened retail stores and costs incurred related to the implementation of certain computer software. Capitalized software, subject to amortization, included in property and equipment at January 31, 2015 (Predecessor) and January 30, 2016 (Successor) had a cost basis of approximately $11.6 million and $6.7 million, respectively, and accumulated amortization of $6.6 million, $2.4 million, respectively.
Total depreciation expense was $15.8 million, $12.1 million, $3.5 million and $17.0 million for the 2013, 2014, and 2015 Predecessor and 2015 Successor periods, respectively.
During the 2013, 2014, and 2015 Predecessor and 2015 Successor periods, the Company did not recognize any impairment charges associated with property and equipment.
The Company capitalized interest in connection with construction in progress of $0.5 million, $0.4 million, $0.1 million and $0.4 million for the 2013, 2014, and 2015 Predecessor and 2015 Successor periods, respectively.
8. Accrued Expenses and Other Current Liabilities
Accrued expenses and other current liabilities include the following (in thousands):
| January 31, 2015 (Predecessor) |
January 30, 2016 (Successor) |
|||||||
| Accrued payroll and benefits |
$ | 8,792 | $ | 14,066 | ||||
| Accrued returns reserve |
4,929 | 6,432 | ||||||
| Gift certificates redeemable |
5,081 | 5,431 | ||||||
| Taxes, other than income taxes |
2,716 | 3,437 | ||||||
| Accrued occupancy |
2,421 | 1,862 | ||||||
| Accrued construction |
1,598 | 1,274 | ||||||
| Other |
10,470 | 11,089 | ||||||
|
|
|
|
|
|||||
| Total accrued expenses and other current liabilities |
$ | 36,007 | $ | 43,591 | ||||
|
|
|
|
|
|||||
The following table reflects the changes in the accrued returns reserve for the 2013 and 2014 fiscal years, 2015 Predecessor period and the 2015 Successor period (in thousands):
| Accrued returns reserve |
Beginning |
Charged |
Deductions |
End of |
||||||||||||
| Fiscal Year Ended February 1, 2014 (Predecessor) |
$ | 4,469 | — | $ | 248 | $ | 4,221 | |||||||||
| Fiscal Year Ended January 31, 2015 (Predecessor) |
4,221 | 708 | — | 4,929 | ||||||||||||
| Period from February 1, 2015 to May 7, 2015 (Predecessor) |
4,929 | 1,231 | — | 6,160 | ||||||||||||
| Period from May 8, 2015 to January 30, 2016 (Successor) |
6,160 | 272 | — | 6,432 | ||||||||||||
F-24
Table of Contents
J.Jill, Inc.
Notes to Consolidated Financial Statements
9. Debt
The components of the Company’s outstanding debt were as follows (in thousands):
| January 31, 2015 (Predecessor) |
January 30, 2016 (Successor) |
|||||||
| Term loan |
$ | 46,836 | $ | 248,750 | ||||
| Subordinated debt |
39,728 | — | ||||||
|
|
|
|
|
|||||
| Total debt |
86,564 | 248,750 | ||||||
| Discount on debt and debt issuance costs |
(4,195 | ) | (8,772 | ) | ||||
| Less: Current portion |
(2,168 | ) | (2,500 | ) | ||||
|
|
|
|
|
|||||
| Net long-term debt |
$ | 80,201 | $ | 237,478 | ||||
|
|
|
|
|
|||||
The Company recorded interest expense of $19.1 million, $17.9 million, $4.6 million and $11.9 million in the 2013, 2014, and 2015 Predecessor and 2015 Successor periods, respectively.
Predecessor Debt
Prior to the Acquisition on May 8, 2015, the Company had a term loan facility, a revolving credit facility and a subordinated debt facility. In conjunction with the Acquisition (see Note 4), these facilities were settled and the agreements were terminated. Certain prepayment penalties and fees of $2.9 million related to the settlement of these facilities are not reflected in either the Predecessor or Successor consolidated statements of operation and comprehensive income (loss) periods, but instead are presented “on the black line.” These terminated facility agreements are discussed below.
Term Loan Facility
On April 29, 2011, the Company entered into a term loan facility agreement and an asset-based revolving credit facility agreement. Both the term loan facility and the asset-based revolving credit facility were subsequently amended on September 27, 2012. These facilities were provided through JJ Lease Funding Corp. and JJ AB Funding Corp., respectively, both of which were variable interest entities established to facilitate such financings (see Note 10).
The amended six-year term loan facility agreement provided for borrowings of $120.0 million. Borrowings under the amended term loan facility were maintained as either Eurodollar or Base Rate loans, each of which had a variable interest rate plus an applicable margin. Eurodollar loans under the amended term loan facility accrued interest at a rate equal to adjusted LIBOR plus 8.50%, with a minimum adjusted LIBOR per annum of 1.50%. Base Rate loans under the amended term loan facility accrued interest at a rate equal to (i) the greatest of (a) the financial institution’s prime rate, (b) the Federal Funds Effective Rate plus 0.50% and (c) adjusted LIBOR, with a minimum adjusted LIBOR of 1.50%, plus 1.00%, plus (ii) 7.50%. The rate per annum was 10.00% as of January 31, 2015 (Predecessor). Borrowings under the amended term loan facility were collateralized by all of the assets of the Company and the agreement contained a provision requiring scheduled quarterly interest and principal payments.
Revolving Credit Facility
The five-year amended secured asset-based revolving credit facility agreement provided for borrowings up to $40.0 million. Under the terms of the agreement, the asset-based revolving credit facility agreement provided
F-25
Table of Contents
J.Jill, Inc.
Notes to Consolidated Financial Statements
for borrowings up to (i) 90% of eligible credit card receivables, plus (ii) 85% of the net orderly liquidation value of eligible inventory, plus (iii) the lesser of (a) the in-transit maximum amount or (b) 85% of the net orderly liquidation value of eligible in-transit inventory, less (iv) certain reserves established by the lender, as defined in the agreement. Borrowings under the asset-based revolving credit facility agreements were collateralized by a first lien on accounts receivable and inventory.
The asset-based revolving credit facility consisted of revolving loans and swingline loans. Borrowings classified as revolving loans under the asset-based revolving credit facility were able to be maintained as either Eurodollar or Base Rate loans, each of which had a variable interest rate plus an applicable margin. Borrowings classified as swingline loans under the asset-based revolving credit facility were Base Rate loans. Eurodollar loans accrued interest at a rate equal to LIBOR plus a spread ranging from 2.25% to 2.75%, depending on borrowing amounts. Base Rate loans accrued interest at a rate equal to (i) the greatest of (a) the financial institution’s prime rate, (b) the Federal Funds Effective Rate plus 0.50% and (c) LIBOR plus 1.00%, plus (ii) a spread ranging from 1.25% to 1.75%, depending on borrowing amounts.
Interest on each Eurodollar loan was payable on the last day of each interest period, and interest on each Base Rate loan was payable on the last business day of April, July, October and January. For both Eurodollar and Base Rate loans, interest was payable upon repayment maturity, with durations ranging between 30 to 90 days.
The asset-based revolving credit facility agreement also required the quarterly payment, in arrears, of a commitment fee of 0.5% per annum of the average daily unused portion of the facility as well as a fee on the balance of the outstanding letters of credit. As of January 31, 2015 (Predecessor), there were no amounts outstanding under the asset-based revolving credit facility agreement. Based on the terms of the agreement, the Predecessor’s available borrowing capacity under the asset-based revolving credit facility agreement as of January 31, 2015 (Predecessor) was $36.7 million.
Subordinated Debt Facility
On September 27, 2012, the Company entered into a six-year subordinated debt facility agreement with an affiliate of the Company in conjunction with the amendment to the term loan facility agreement and asset-based revolving credit facility agreement. The subordinated debt facility was an unsecured mezzanine term loan and provided for borrowings of $30.0 million. This facility was provided through JJ Mezz Funding Corp., which was a variable interest entity established to facilitate such financing (see Note 10).
Borrowings under the mezzanine term loan accrued interest at a rate of 24.0%. The 24.0% interest rate on the mezzanine term loan included a Payment in Kind (“PIK”) interest factor whereby one half of the 24.0% interest due was payable in cash and one half was added to the outstanding principal amount of the mezzanine term loan. The outstanding principal balance was to be payable upon maturity of the mezzanine term loans on September 27, 2018. As a result of the PIK interest factor, additional long-term debt of $4.5 million was incurred as of January 31, 2015 (Predecessor). As of January 31, 2015 (Predecessor), the Company had $39.7 million of outstanding borrowings under the mezzanine term loan.
In connection with the amended term loan facility agreement, amended asset-based revolving loan agreement and the subordinated debt facility agreement, the Company was subject to various financial reporting, financial and other covenants, including maintaining specific liquidity measures. In addition, there were negative covenants including certain restrictions on the ability to: incur additional indebtedness, create liens, enter into transactions with affiliates, transfer assets, pay dividends, consolidate or merge with other entities, or undergo a change in control. Each loan also contained provisions in the event of default.
F-26
Table of Contents
J.Jill, Inc.
Notes to Consolidated Financial Statements
Successor Debt
Term Loan Credit Agreement
On May 8, 2015, the Company entered into a term loan credit agreement (the “Term Loan Agreement”) in conjunction with the Acquisition (see Note 4). The seven-year Term Loan Agreement provides for borrowings of $250.0 million. The Company can elect, at its option, the applicable interest rate for borrowings under the Term Loan Agreement using a LIBOR or Base Rate variable interest rate plus an applicable margin. LIBOR loans under the Term Loan Agreement accrue interest at a rate equal to LIBOR plus 5.00%, with a minimum LIBOR per annum of 1.00%. Base Rate loans under the Term Loan Agreement accrue interest at a rate equal to (i) the greatest of (a) the financial institution’s prime rate, (b) the Federal Funds Effective Rate plus 0.50%, or (c) LIBOR, with a minimum LIBOR of 1.00% plus 1.00%, and (d) 2.00%, plus (ii) 4.00%.
Current borrowings under the Term Loan Agreement accrue interest at a rate equal to LIBOR plus 5.00%, with a minimum LIBOR per annum of 1.00%, and are payable on a quarterly basis. The rate per annum was 6.00% throughout the 2015 Successor period. Repayments of $0.6 million are payable quarterly, beginning on October 31, 2015 and continuing until maturity on May 8, 2022, when the remaining outstanding principal balance of $233.1 million is due.
The Company incurred $9.6 million of debt issuance costs in connection with the Term Loan Agreement. These fees are presented as a direct deduction from the carrying amount of the long-term debt on the consolidated balance sheet.
As of January 30, 2016 (Successor), the Company had $248.8 million of outstanding borrowings under the Term Loan Agreement. During the 2015 Successor period, the Company recorded interest expense of $11.0 million on the Term Loan Agreement. In addition, during the 2015 Successor period, $0.9 million of the debt issuance cost was amortized to interest expense.
Borrowings under the Term Loan Agreement are collateralized by all of the assets of the Company. In connection with the Term Loan Agreement, the Company is subject to various financial reporting, financial and other covenants, including maintaining specific liquidity measurements. In addition, there are negative covenants, including certain restrictions on the Company’s ability to: incur additional indebtedness, create liens, enter into transactions with affiliates, transfer assets, pay dividends, consolidate or merge with other entities, undergo a change in control, make advances, investments and loans, or modify its organizational documents. As of January 30, 2016 (Successor), the Company was in compliance with all financial covenants.
Asset-Based Revolving Credit Agreement
On May 8, 2015, the Company entered into a five-year secured $40.0 million asset-based revolving credit facility agreement (the “ABL Facility”). The ABL Facility matures on May 8, 2020.
Under the terms of this agreement, the ABL Facility provides for borrowings up to (i) 90% of eligible credit card receivables, plus (ii) 85% of eligible accounts receivable, plus (iii) the lesser of (a) 100% of the value of eligible inventory at such time and (b) 90% of the net orderly liquidation value of eligible inventory at such time, plus (iv) the lesser of (a) 100% of the value of eligible in-transit inventory at such time, (b) 90% of the net orderly liquidation value of eligible in-transit inventory at such time and (c) the in-transit maximum amount (the in-transit maximum amount is not to exceed $12.5 million during the 1st and 3rd calendar quarters and $10.0 million during the 2nd and 4th calendar quarters), less (v) certain reserves established by the lender, as defined in the ABL Facility.
F-27
Table of Contents
J.Jill, Inc.
Notes to Consolidated Financial Statements
The ABL Facility consists of revolving loans and swingline loans. Borrowings classified as revolving loans under the ABL Facility may be maintained as either LIBOR or Base Rate loans, each of which has a variable interest rate plus an applicable margin. Borrowings classified as swingline loans under the ABL Facility are Base Rate loans. LIBOR loans under the ABL Facility accrue interest at a rate equal to LIBOR plus a spread of 2.00% from May 8, 2015 to August 31, 2015, and thereafter ranging from 1.50% to 1.75%, depending on borrowing amounts. Base Rate loans under the ABL Facility accrue interest at a rate equal to (i) the greatest of (a) the financial institution’s prime rate, (b) the overnight Federal Funds Effective Rate plus 0.50%, (c) LIBOR plus 1.00%, and (d) 2.00%, plus (ii) a spread of 1.00% from May 8, 2015 to August 31, 2015, and thereafter ranging from 0.50% to 0.75%, depending on borrowing amounts.
Interest on each LIBOR loan is payable on the last day of each interest period and no more than quarterly, and interest on each Base Rate loan is payable in arrears on the last business day of April, July, October and January. For both LIBOR and Base Rate loans, interest is payable periodically upon repayment, conversion or maturity, with interest periods ranging between 30 to 180 days at the election of the Company, or 12 months with the consent of all lenders.
The ABL Facility also requires the quarterly payment, in arrears, of a commitment fee. The commitment fee is payable in an amount equal to 0.375% from May 8, 2015 to July 1, 2016, and thereafter at an amount equal to (i) 0.375% for each calendar quarter during which historical excess availability is greater than 50% of availability, and (ii) 0.25% for each calendar quarter during which historical excess availability is less than or equal to 50% of availability.
During the fiscal year ended January 30, 2016 (Successor), there were no amounts drawn or outstanding under the ABL Facility. Based on the terms of the agreement and the reduction for the letters of credit, the Company’s available borrowing capacity under the ABL Facility as of January 30, 2016 (Successor) was $38.5 million.
The Company incurred $1.1 million of debt issuance costs in connection with the related ABL Facility, which were capitalized and are included in other assets on the consolidated balance sheet. During the 2015 Successor period, $0.1 million of the debt issuance cost was amortized to interest expense.
Borrowings under the ABL Facility are collateralized by a first lien on accounts receivable and inventory. In connection with the ABL Facility, the Company is subject to various financial reporting, financial and other covenants, including maintaining specific liquidity measurements. In addition, there are negative covenants, including certain restrictions on the Company’s ability to: incur additional indebtedness, create liens, enter into with affiliates, transfer assets, pay dividends, consolidate or merge with other entities, undergo a change in control, make advances, investments and loans or modify its organizational documents. As of January 30, 2016 (Successor), the Company was in compliance with all financial covenants.
The Term Loan Agreement and the ABL Facility contain provisions on the occurrence of a default event. In the event of a payment default that is not cured within five business days or is not waived, or a covenant default that is not cured within 30 business days or is not waived, the Company’s obligations under these credit facilities may be accelerated. In addition, a 2% interest surcharge will be imposed during events of default.
Letters of Credit
As of January 31, 2015 (Predecessor) and January 30, 2016 (Successor), there were outstanding letters of credit of $1.3 million and $1.6 million, respectively, which reduced the availability under the ABL Facility. As of January 30, 2016 (Successor), the maximum commitment for letters of credit was $10.0 million. Letters of credit
F-28
Table of Contents
J.Jill, Inc.
Notes to Consolidated Financial Statements
accrue interest at a rate equal to revolving loans maintained as Base Rate loans under the ABL facility. In addition, a 2% interest surcharge will be imposed during events of default. The Company primarily used letters of credit to secure payment of workers’ compensation claims. Letters of credit are generally obtained for a one year term and automatically renew annually, and would only be drawn upon if the Company fails to comply with its contractual obligations.
Payments of Debt Obligations Due by Period
As of January 30, 2016 (Successor), minimum future principal amounts payable under the Company’s Term Loan Agreement are as follows (in thousands):
| Fiscal Year |
||||
| 2016 |
$ | 2,500 | ||
| 2017 |
2,500 | |||
| 2018 |
2,500 | |||
| 2019 |
2,500 | |||
| 2020 |
2,500 | |||
| Thereafter |
236,250 | |||
|
|
|
|||
| $ | 248,750 | |||
|
|
|
|||
10. Variable Interest Entities
During the Predecessor periods the Company maintained several financing facilities with third-party financing companies, including JJ Lease Funding Corp., JJ AB Funding Corp. and JJ Mezz Funding Corp. The financing facilities were independent special purpose entities established for the sole purpose of obtaining financing for the benefit and at the direction of the Company. Each of these facilities were deemed VIEs, for which the Company was determined to be the primary beneficiary. Each of these VIEs were consolidated within the Company’s financial statements for the 2013, 2014 and 2015 Predecessor periods.
Contemporaneously with the Acquisition, on May 8, 2015 (see Note 4), these financing facilities were repaid and terminated by the Company. These three financing facilities ceased being VIEs to the Company and were no longer consolidated in the 2015 Successor period.
JJ Lease Funding Corp.
The Company entered into a sale leaseback arrangement with JJ Lease Funding Corp., whereby the Company sold and immediately leased back from JJ Lease Funding Corp. certain tangible and intangible assets of the Company in exchange for cash consideration to the Company of $120.0 million. The Company did not recognize any gain or loss on the sale of its assets.
The Company’s lease financing arrangement with JJ Lease Funding Corp. was funded through a term loan agreement between JJ Lease Funding Corp. and a commercial lender. The terms of the term loan agreement were structured such that the aggregated payments due under the lease financing arrangement would equal the principal and interest due under the term loan. When the term loan is repaid in full, the ownership of the assets would be reverted back to the Company. JJ Lease Funding Corp. does not have any other assets or liabilities or income and expense other than those associated with the term loan and the sale leaseback arrangement. Under the terms of the lease financing arrangement, the Company’s obligations are limited to amounts due to JJ Lease Funding Corp. and the Company has no obligations under the term loan facility. The Company determined that it was the primary beneficiary of JJ Lease Funding Corp. due to i) the establishment of JJ Lease Funding Corp.
F-29
Table of Contents
J.Jill, Inc.
Notes to Consolidated Financial Statements
being for the sole purpose of effecting the lease financing arrangement at the direction of the Company and ii) the Company absorbing any potential variability related to the term loan based on its payment terms equaling the payment terms of the lease financing arrangement.
As of January 31, 2015 (Predecessor), the Company consolidated JJ Lease Funding Corp., and accordingly consolidated the outstanding principal due under the term loan of $46.8 million in its consolidated balance sheet of which $44.7 million is included in long-term debt, net of current portion of $2.1 million. During the 2013, 2014 and 2015 Predecessor periods, the Company consolidated $10.2 million, $8.0 million and $1.6 million, respectively, in interest expense related to the term loan as interest expense within its consolidated statements of operations and comprehensive income (loss).
JJ AB Funding Corp.
The Company entered into a commodities purchase financing agreement with JJ AB Funding Corp., whereby JJ AB Funding Corp. entered into a five-year secured $40.0 million asset-based revolving credit facility with a commercial lender. Under the terms of the commodities purchase financing agreement, the Company’s obligations were limited to amounts due to JJ AB Funding Corp. and the Company had no obligations under the revolving credit facility. Amounts due by the Company were equal to the purchase price of the commodities purchased plus a nominal agreed upon profit rate, which were equal in total to JJ AB Funding Corp.’s interest and principal obligations under the revolving credit facility.
JJ AB Funding Corp. does not have any other assets or liabilities or income and expense other than those associated with the revolving credit facility and commodities purchase financing agreement. The Company determined that it was the primary beneficiary of JJ AB Funding Corp. due to i) the establishment of JJ AB Funding Corp. being for the sole purpose of effecting the commodities purchase financing agreement at the direction of the Company and ii) the Company absorbing any potential variability related to the revolving credit facility based on its payment terms equaling the payment terms of the commodities purchase financing agreement.
The Company consolidated JJ AB Funding Corp., however, there were no amounts outstanding under the revolving credit facility as of January 31, 2015 (Predecessor). During the 2013, 2014 and 2015 Predecessor periods, the Company consolidated $0.6 million, $0.7 million and $0.3 million, respectively, in interest expense related to the revolving credit facility as interest expense within its consolidated statements of operations and comprehensive income (loss).
JJ Mezz Funding Corp.
The Company entered into a commodities purchase financing arrangement with JJ Mezz Funding Corp., whereby JJ Mezz Funding Corp. entered into a six-year unsecured $30.0 million subordinated debt facility with a commercial lender. Amounts due under the subordinated debt facility were to be paid through the proceeds received under JJ Mezz Funding Corp.’s commodities purchase financing arrangement, whose payments were guaranteed by the Company. Payments due by the Company to JJ Mezz Funding Corp. for the commodities purchase financing arrangement were equal to the purchase price of the commodities purchased plus a nominal agreed upon profit rate, which were equal in total to JJ Mezz Funding Corp.’s interest and principal obligations under the subordinated debt facility.
JJ Mezz Funding Corp. does not have any other assets or liabilities or income and expense other than those associated with the subordinated debt facility and commodities purchase financing arrangement. Under the terms of the commodities purchase financing arrangement, the Company’s obligations were limited to amounts due to JJ Mezz Funding Corp. and the Company had no obligations under the subordinated debt facility. The Company
F-30
Table of Contents
J.Jill, Inc.
Notes to Consolidated Financial Statements
determined that it was the primary beneficiary of JJ Mezz Funding Corp. due to i) the establishment of JJ Mezz Funding Corp. being for the sole purpose of effecting the commodities purchase financing arrangement at the direction of the Company and ii) the Company absorbing any potential variability related to the subordinated debt facility based on its payment terms equaling the payment terms of the commodities purchase financing arrangement.
As of January 31, 2015 (Predecessor), the Company consolidated JJ Mezz Funding Corp., and accordingly consolidated the outstanding principal due under the subordinated debt facility of $39.7 million in its consolidated balance sheet as long-term debt, net of current portion. During the 2013, 2014 and 2015 Predecessor periods, the Company consolidated $8.6 million, $9.5 million and $2.7 million, respectively, in interest expense related to the subordinated debt facility as interest expense within its consolidated statements of operations and comprehensive income (loss).
11. Commitments and Contingencies
Operating Lease Agreements
The Company leases retail, distribution and corporate office facilities under various operating leases having initial or remaining terms of more than one year. Many of these leases require that the Company pay taxes, maintenance, insurance, and certain other operating expenses applicable to leased properties. Rental payments under the terms of some store facility leases include contingent rent based on sales levels, whereas other payment terms are based on the greater of a minimum rental payment or a percentage of the store’s gross receipts.
The original lease terms under existing arrangements range from 1-20 years and may or may not include renewal options, rent escalation clauses, and/or landlord leasehold improvement incentives. In the case of operating leases with rent escalation clauses, the payment escalations are accrued and the rent expense is recognized on a straight-line basis over the lease term. The Company recorded a deferred lease liability of $6.8 million and $3.3 million as of January 31, 2015 (Predecessor) and January 30, 2016 (Successor), respectively. In certain instances, the Company also receives allowances for its store leases, which it accrues and amortizes ratably over the life of the lease. The Company maintained a tenant improvement incentive liability of $9.5 million and $5.1 million as of and January 31, 2015 (Predecessor) and January 30, 2016 (Successor), respectively.
The following table summarizes future minimum rental payments required under all noncancelable operating lease obligations as of January 30, 2016 (Successor) (in thousands):
| Fiscal Year |
||||
| 2016 |
$ | 42,279 | ||
| 2017 |
38,946 | |||
| 2018 |
35,430 | |||
| 2019 |
32,248 | |||
| 2020 |
31,135 | |||
| Thereafter |
130,119 | |||
|
|
|
|||
| Total |
$ | 310,157 | ||
|
|
|
|||
Total rental expense was $42.1 million, $44.3 million, $12.7 million and $36.2 million for the 2013, 2014, and 2015 Predecessor and 2015 Successor periods, respectively, exclusive of contingent rental expense recorded of $2.0 million, $1.9 million, $0.5 million and $1.8 million for the same respective periods.
F-31
Table of Contents
J.Jill, Inc.
Notes to Consolidated Financial Statements
Legal Proceedings
The Company is subject to various legal proceedings that arise in the ordinary course of business. The Company accrues for liabilities associated with these proceedings which are determined to be probable and can be reasonably estimated. Although the outcome of such proceedings cannot be predicted with certainty, management does not believe that it is reasonably possible that these outstanding proceedings will result in unaccrued losses that would be material. The Company maintains insurance policies to mitigate the financial impact of certain litigation.
Concentration Risk
An adverse change in the Company’s relationships with its key suppliers, or loss of the supply of one of the Company’s key products for any reason, could have a material effect on the business and results of operations of the Company. Two suppliers accounted for approximately 15.2% and 10.6% of the Company’s purchases during the 2015 Successor periods.
Other Commitments
In addition to the lease commitments disclosed above, the Company enters into other cancelable and noncancelable commitments. Typically, these commitments are for less than one year in duration and are principally for the procurement of inventory. Preliminary commitments with the Company’s merchandise vendors typically are made six to nine months in advance of the planned receipt date. The Company had outstanding inventory purchase commitments of $84.9 million as of January 30, 2016 (Successor).
12. Other Liabilities
Other liabilities include the following (in thousands):
| January 31, 2015 (Predecessor) |
January 30, 2016 (Successor) |
|||||||
| Deferred rent |
$ | 6,777 | $ | 3,326 | ||||
| Deferred lease credits |
9,537 | 5,078 | ||||||
| Unfavorable leasehold interests |
1,369 | 3,137 | ||||||
| Other |
448 | 473 | ||||||
|
|
|
|
|
|||||
| Total other liabilities |
$ | 18,131 | $ | 12,014 | ||||
|
|
|
|
|
|||||
13. Preferred Capital and Members’ Equity
Predecessor
In conjunction with the Acquisition (see Note 4), the securities that were in existence in the Predecessor periods, as further discussed below, were settled and no longer outstanding subsequent to May 8, 2015.
Common Units
The Predecessor LLC Agreement, as amended and restated (the “Predecessor LLC Agreement”), authorized the Predecessor to issue up to 1,000,000 Common Units. In April 2011, the Predecessor issued 1,000,000 Common Units, 100 Class A Units and 3,927,601.3 Class B Units, and simultaneously entered into a
F-32
Table of Contents
J.Jill, Inc.
Notes to Consolidated Financial Statements
commodities purchase agreement (the “Commodities Purchase Agreement”) for purposes of providing a preferred capital investment of $72.8 million (the “Preferred Capital”) to an investor of the Predecessor. The voting and liquidation rights of the holders of the Predecessor’s Common Units were subject to and qualified by rights, powers and preferences of holders of the Preferred Capital, and Class A and Class B Units as set forth below. As of January 31, 2015 (Predecessor), 1,000,000 Common Units were outstanding and no Common Units were available for future issuance.
Preferred Capital
The Preferred Capital is classified outside of members’ equity because it contains certain redemption features that are not solely within the control of the Company. The voting and liquidation rights of the Preferred Capital were subject to and qualified by rights, powers and preferences of the Predecessor’s investors as set forth below.
Class A and B Units
The Predecessor’s LLC Agreement authorized the Predecessor to issue up to 100 Class A Units and 3,927,601.3 Class B Units. In April 2011, the Predecessor issued 100 Class A Units and 3,927,601.3 Class B Units and received $1,000 and $39.3 million, respectively, as a capital contribution upon issuance. The voting and liquidation rights of the holders of the Predecessor’s Class A and Class B Units were subject to and qualified by rights, powers and preferences of the holder of the Preferred Capital as set forth below. As of January 31, 2015 (Predecessor), 100 Class A Units and 3,927,601.3 Class B Units were outstanding and no Class A or Class B Units were available for future issuance.
Non-Liquidating Distributions
In the event of a non-liquidating distribution, at the discretion of the Predecessor, the holder of the Preferred Capital and the holders of Class A and Class B Units as a group, were limited to an amount up to each holder’s aggregate unreturned capital on a pro rata basis. Any remaining amounts were to be distributed to holders of Common Units.
Liquidation Preferences
As defined within the Predecessor LLC Agreements, if the Predecessor is liquidated, dissolved or wound-up, the holder of the Preferred Capital would have been entitled to their return of capital in preference of holders of Class A and Class B Units, while Common Unit holders would have been entitled to any remaining liquidating distributions. The holder of the Preferred Capital was entitled to all liquidating distributions paid by the Predecessor until such payments equal the aggregate original issuance price paid of $72.8 million.
Subject to the payment in full of amounts due to the holder of the Preferred Capital, each holder of Class A and B Units would have been entitled to any liquidating distributions paid by the Predecessor up to an amount equal to each holder’s aggregate original issuance price paid of $1,000 and $39.3 million, respectively, on a pro rata basis.
Any remaining liquidating distributions paid by the Predecessor, subsequent to payment in full of amounts due first to the holder of the Preferred Capital and second to holders of Class A and Class B Units, would have been paid out to holders of Common Units.
F-33
Table of Contents
J.Jill, Inc.
Notes to Consolidated Financial Statements
Redemption Rights
The Predecessor was established with a finite life of 49 years, commencing on the date of filing of its certificate of formation. At the end of its 49-year term, the Predecessor would be liquidated and all outstanding unreturned capital would be distributed to the then current owners, in accordance with the liquidation preferences described above. Owners were also entitled to a distribution of their unreturned capital prior to the completion of the Predecessor’s 49-year term upon the occurrence of an earlier liquidation event as defined by the Commodities Purchase Agreement.
Voting Rights
The Preferred Capital, Class A Units, Class B Units and Common Units held no voting rights. The Predecessor was governed by the board of managers, for which the holders of the Preferred Capital, Class A and Class B Units each had the right to appoint members to the board of managers, as determined by the Predecessor LLC Agreements.
Successor
On May 8, 2015, Holdings, a wholly owned subsidiary of Topco, acquired approximately 94% of the 1,000,000 issued and outstanding interests of the Company, with Topco acquiring the remaining 6% of the issued and outstanding membership interests of the Company (see Note 4). In connection with the Acquisition, the Predecessor LLC Agreement of the Company was amended. The terms of the amended agreement were substantially the same as the previously amended and restated agreement, including the rights of Common Unit holders.
14. Income Taxes
The provision for income taxes for the 2013, 2014, and 2015 Predecessor and 2015 Successor periods consists of the following (in thousands):
| For the (Predecessor) |
For the Year Ended (Predecessor) |
For the 2015 (Predecessor) |
For the (Successor) |
|||||||||||||||||
| Current |
||||||||||||||||||||
| U.S. Federal |
$ | 7,157 | $ | 9,843 | $ | 1,957 | $ | 8,052 | ||||||||||||
| State and local |
1,967 | 2,920 | 503 | 1,533 | ||||||||||||||||
|
|
|
|
|
|
|
|
|
|||||||||||||
| Total current |
9,124 | 12,763 | 2,460 | 9,585 | ||||||||||||||||
|
|
|
|
|
|
|
|
|
|||||||||||||
| Deferred tax benefit |
||||||||||||||||||||
| U.S. Federal |
(4,478 | ) | (1,615 | ) | (793 | ) | (6,212 | ) | ||||||||||||
| State and local |
(762 | ) | (288 | ) | (168 | ) | (1,051 | ) | ||||||||||||
|
|
|
|
|
|
|
|
|
|||||||||||||
| Total deferred tax benefit |
(5,240 | ) | (1,903 | ) | (961 | ) | (7,263 | ) | ||||||||||||
|
|
|
|
|
|
|
|
|
|||||||||||||
| Provision for income taxes |
$ | 3,884 | $ | 10,860 | $ | 1,499 | $ | 2,322 | ||||||||||||
|
|
|
|
|
|
|
|
|
|||||||||||||
F-34
Table of Contents
J.Jill, Inc.
Notes to Consolidated Financial Statements
A reconciliation of the federal statutory income tax rate to the Company’s effective tax rate is as follows for the periods presented:
| For the (Predecessor) |
For the (Predecessor) |
For the (Predecessor) |
For the (Successor) |
|||||||||||||||||
| Federal statutory income tax rate |
35.0 | % | 35.0 | % | 35.0 | % | 35.0 | % | ||||||||||||
| State income taxes, net of federal tax effect |
6.0 | % | 7.6 | % | (39.9 | )% | 0.9 | % | ||||||||||||
| Acquisition-related costs |
— | % | — | % | (344.5 | )% | — | % | ||||||||||||
| Nondeductible equity-based compensation expense |
7.2 | % | 8.5 | % | (38.3 | )% | 0.9 | % | ||||||||||||
| Other |
(1.9 | )% | 0.2 | % | 14.8 | % | (1.8 | )% | ||||||||||||
|
|
|
|
|
|
|
|
|
|||||||||||||
| Effective tax rate |
46.3 | % | 51.3 | % | (372.9 | )% | 35.0 | % | ||||||||||||
|
|
|
|
|
|
|
|
|
|||||||||||||
The effective tax rate in the 2015 Predecessor period reflects transaction costs related to the Acquisition, which were not deductible for tax purposes.
The components of deferred tax assets (liabilities) were as follows (in thousands):
| January 31, 2015 (Predecessor) |
January 30, 2016 (Successor) |
|||||||
| Deferred tax assets |
||||||||
| Net credit carry forwards |
$ | 63 | $ | 12 | ||||
| Gift card asset |
— | 40 | ||||||
| Deferred revenue |
168 | 130 | ||||||
| Accrued expenses |
8,871 | 3,370 | ||||||
|
|
|
|
|
|||||
| Total deferred tax assets |
9,102 | 3,552 | ||||||
|
|
|
|
|
|||||
| Deferred tax liabilities |
||||||||
| Gift card liability |
(66 | ) | — | |||||
| Inventory |
(2,551 | ) | (2,480 | ) | ||||
| Fixed Assets |
(9,574 | ) | (13,571 | ) | ||||
| Intangible assets |
(24,377 | ) | (65,573 | ) | ||||
| Prepaid expense |
— | (765 | ) | |||||
|
|
|
|
|
|||||
| Total deferred tax liabilities |
(36,568 | ) | (82,389 | ) | ||||
|
|
|
|
|
|||||
| Net deferred tax liabilities |
$ | (27,466 | ) | $ | (78,837 | ) | ||
|
|
|
|
|
|||||
The Company had state tax credit carryforwards of $0.1 million as of January 31, 2015 (Predecessor) and no state tax credit carryforwards as of January 30, 2016 (Successor). These tax credit carryforwards expire in 2017. As of January 31, 2015 (Predecessor) and January 30, 2016 (Successor), the Company had no net operating loss carryforwards.
The Company has considered the need for a valuation allowance based on the more likely than not criterion. In determining the need for a valuation allowance, management makes assumptions and applies judgment, including forecasting future earnings and considering the reversals of existing deferred tax liabilities. Based on this analysis, management determined that no valuation allowance was required. The Company
F-35
Table of Contents
J.Jill, Inc.
Notes to Consolidated Financial Statements
performed an analysis of its tax positions and determined that no material uncertain tax positions exist. Therefore, there is no liability for uncertain tax positions as of January 31, 2015 (Predecessor) or January 30, 2016 (Successor).
As of January 31, 2015 (Predecessor) and January 30, 2016 (Successor), the Company had no material unrecognized tax benefits.
J.Jill, Inc. and Holdings each file a consolidated income tax return in the United States federal jurisdiction and multiple state jurisdictions. The Company’s income tax returns periodically are examined by the Internal Revenue Service (the “IRS”). Tax periods from 2012 onward are open to audit by major tax jurisdictions under the statute of limitations. The IRS completed an examination of the fiscal year 2013 tax return without adjustment.
15. Earnings Per Share
Predecessor
Given the liquidation preferences and distribution terms as described in Note 13, the Preferred Capital, Class A Units and Class B Units have been excluded from the calculation of earnings per share as any non-liquidating distributions to each of these equity holders were limited to each equity holder’s return of capital. During the 2013, 2014 and 2015 Predecessor periods there were no non-liquidating distributions approved by the Predecessor’s board of managers.
Successor
In conjunction with the Acquisition (see Note 4), the holder of the Preferred Capital received a return of their original investment of $72.8 million and the Commodities Purchase Agreement was terminated. In addition, the capital relating to the 100 Class A Units and the 3,927,601.3 Class B Units was returned to the holders and these units were no longer outstanding subsequent to the May 8, 2015 Acquisition.
F-36
Table of Contents
J.Jill, Inc.
Notes to Consolidated Financial Statements
The following table summarizes the computation of basic and diluted net income (loss) per share attributable to common stockholders for the 2013, 2014 and 2015 Predecessor and 2015 Successor periods (in thousands, except share and per share data):
| For the Fiscal |
For the Fiscal |
For the Period 2015 |
For the Period |
|||||||||||||
| Numerator |
||||||||||||||||
| Net income (loss) attributable to common stockholders, basic and diluted |
$ | 4,498 | $ | 10,296 | $ | (1,901 | ) | $ | 4,306 | |||||||
| Denominator |
||||||||||||||||
| Weighted average common shares outstanding, basic and diluted |
43,747,944 | 43,747,944 | 43,747,944 | 43,747,944 | ||||||||||||
| Net income (loss) per share attributable to common stockholders, basic and diluted |
$ | 0.10 | $ | 0.24 | $ | (0.04 | ) | $ | 0.10 | |||||||
|
|
|
|
|
|
|
|
|
|||||||||
16. Equity-Based Compensation
Predecessor Plan
In conjunction with the Acquisition (see Note 4), the equity-based compensation plans that were in existence in the Predecessor periods, as further discussed below, were settled and no longer outstanding subsequent to May 8, 2015.
On March 30, 2012, JJIP, a Limited Partnership (the “Partnership”), was formed by the then current owners of the Company and held a portion of the outstanding common units of the Company. A Management Incentive Unit equity program (the “Predecessor Plan”) was established by JJIP to provide the opportunity for key employees of the Company to participate in the appreciation of the business.
The Predecessor Plan allowed Management Incentive Units (“MIUs”) to be granted to employees of the Company at the discretion of JJIP’s board of managers, not to exceed a maximum of 105,000 outstanding at any given time. The MIUs entitled the employees to an interest in JJIP upon the vesting of the MIU. When distributions are made by the Company to JJIP, a holder of common units in the Predecessor periods, JJIP’s board of managers would determine the allocation of that distribution to the JJIP interest holders. As of January 31, 2015 (Predecessor), there were an aggregate 14,006 MIUs authorized and available for future issuance.
The vesting terms of MIUs granted by JJIP to employees of the Company were determined on a grant-by-grant basis, according to the terms set forth by JJIP’s board of managers. Half of the MIUs were granted as time-based vesting awards with the remaining half granted as performance-based vesting awards. MIUs granted with
F-37
Table of Contents
J.Jill, Inc.
Notes to Consolidated Financial Statements
time-based vesting features generally vested over a four year vesting period, with 25% of the MIUs cliff vesting at the later of one year from the date of employment with the Company (“First Vesting Date”), but not to exceed one year from the date of grant. The remaining 75% of the Units vested quarterly over a three year period, beginning on the First Vesting Date. The MIUs contain provisions for accelerated vesting upon an approved sale of the Partnership or forfeiture of unvested MIUs or both vested and unvested MIUs in the event of termination of employment from the Company without cause or with cause, respectively.
MIUs with a performance-based vesting feature were determined to vest upon the achievement of a specified Threshold Return, as defined by the Plan. The Company reviewed the likelihood of achieving the Threshold Return at the end of each reporting period. During the 2014 and 2015 Predecessor periods, the Company determined that the likelihood of achieving the Threshold Return was not probable, and therefore no compensation expense was recognized related to the MIUs with performance-based vesting features. As of January 31, 2015 (Predecessor), there were 45,450 performance-based vesting units outstanding and unvested.
The MIUs also contained a repurchase feature, whereby upon termination, JJIP had the right to purchase from former employees any or all of the vested MIUs for cash. The amount of consideration provided by JJIP was based on a stated formula, per the terms of the Plan, which prevented employees from being exposed to all of the risks and rewards of owning the MIUs. Based on the repurchase feature of the MIUs, the Company determined that the MIUs were liability classified awards.
Although the MIUs were granted by JJIP, which had an economic interest in the Predecessor entity, the services provided were for the benefit of J.Jill. As a result, the corresponding compensation expense was recognized in the consolidated statement of operations and comprehensive income (loss) of the Company with a corresponding capital contribution from JJIP.
The Company accounted for compensation expense related to liability classified awards using the intrinsic value method, as permitted by ASC 718 for nonpublic entities, and recorded changes in the value of these awards as compensation expense at each reporting period. To determine the intrinsic value, the Predecessor calculated the difference between the exercise price, if any, of the MIU compared to its estimated repurchase price at each reporting period. The repurchase price of the MIUs was determined using an estimate of the excess of the Predecessor’s EBITDA, multiplied by a fixed multiple, over a predetermined dollar value threshold. The difference between these two amounts, if positive, was then divided by the total number of MIUs outstanding. As a result of the pending Acquisition, at January 31, 2015, the repurchase calculation was amended to reflect the anticipated transaction value.
F-38
Table of Contents
J.Jill, Inc.
Notes to Consolidated Financial Statements
As of January 31, 2015 (Predecessor), 36,113 time vesting units were vested and 9,431 time vesting units were unvested. The following table summarizes the MIU activity of the time vesting units during the 2013, 2014 and 2015 Predecessor periods:
| Number |
||||
| Unvested units outstanding, February 2, 2013 |
27,419 | |||
| Granted |
5,350 | |||
| Vested |
(10,963 | ) | ||
| Forfeited |
(4,609 | ) | ||
|
|
|
|||
| Unvested units outstanding, February 1, 2014 |
17,197 | |||
| Granted |
3,750 | |||
| Vested |
(11,516 | ) | ||
| Forfeited |
— | |||
|
|
|
|||
| Unvested units outstanding, January 31, 2015 |
9,431 | |||
| Granted |
— | |||
| Vested |
(3,403 | ) | ||
| Forfeited |
— | |||
|
|
|
|||
| Unvested units outstanding, May 7, 2015 |
6,028 | |||
|
|
|
|||
The aggregate intrinsic value of MIUs as of January 31, 2015 that vested during the period was $2.2 million, respectively. The aggregate intrinsic value of the unvested time and performance units was $9.9 million as of January 31, 2015. Compensation expense of $1.9 million, $5.2 million and $0.4 million was recorded in selling, general and administrative expenses in the consolidated statements of operations and comprehensive income (loss) for the 2013, 2014 and 2015 Predecessor periods, respectively. The intrinsic value of MIUs was $7.3 million as of January 31, 2015 (Predecessor).
In conjunction with the Acquisition (see Note 4), the unvested time-based MIUs were automatically vested as a result of the change in control and all of the issued and outstanding vested time-based MIUs were settled. All of the performance-based awards issued and outstanding achieved their specified Threshold Return upon the Acquisition and were also settled. The acceleration of the vesting conditions due to a change in control resulted in compensation expense of approximately $7.4 million, which was not reflected in either the Predecessor or Successor consolidated statements of operations and comprehensive income (loss) periods, but instead are presented “on the black line.”
Successor Plan
On May 8, 2015, Topco established an Incentive Equity Plan (the “Plan”), which allows Topco to grant Topco Class A Common Interests (“Common Interests”) to certain directors, senior executives and key employees of the Company. The Plan is administered by Topco’s board of directors, along with input from the Company’s Chief Executive Officer. Grant date fair value, vesting and any other restrictions are determined at the discretion of Topco’s board of directors.
The Plan allows Topco to grant up to 32,683,677 of its Class A Common Interests. As of January 30, 2016 (Successor), there were an aggregate of 12,148,274 Common Interests authorized and available for future issuance. Topco did not grant any Common Interests to nonemployees.
F-39
Table of Contents
J.Jill, Inc.
Notes to Consolidated Financial Statements
Common Interests participate in distributions from Topco proportionate to their ownership, pursuant first to the full satisfaction and repayment of the unreturned capital of the preferred interests of Topco and then to the achievement of a predefined Profits Interest Threshold (“PIT”), as stated in each grant agreement. The preferred interests and the PITs are considered when determining the fair value of each grant.
Common Interests granted to employees of the Company are classified as equity awards and are generally subject to a five year vesting period, with either a monthly or annual cliff vest. The Plan also contains a fair value repurchase feature, allowing Topco to repurchase vested Common Interests upon termination of employment. The Common Interests contain provisions for accelerated vesting upon an approved sale of the Partnership or the termination of employment. If termination of employment is without cause, as defined in the Grant Agreement, all then-unvested units are forfeited and vested interests are subject to repurchase. If termination of employment is for cause, as defined in the Grant Agreement, all vested and unvested units will be forfeited. Topco did not repurchase any units during the 2015 Successor period and no units were forfeited or expired. Vested Common Interests that are repurchased or forfeited due to termination will be available for future issuance. As of January 30, 2016 (Successor), Topco does not expect to repurchase Common Interests.
The Company historically has been a private company and lacks certain company-specific historical and implied volatility information. Therefore, it estimates its expected share volatility based on the historical volatility of a publicly traded group of peer companies. The expected term of the Company’s Common Interests is estimated based on management’s estimate of time until a potential liquidity event. The risk-free rate is determined by reference to the U.S. Treasury yield curve in effect at the time of grant of the award for time periods approximately equal to the expected term of the award. Expected dividend yield is based on the fact that the Company has never paid cash dividends, and as of January 30, 2016 (Successor) did not anticipate paying any cash dividends to Common Interest holders in the foreseeable future.
The following assumptions were used by management in its option pricing model to determine the fair value of the Common Interests granted to directors, senior executives and key employees, and is presented on a weighted average basis:
| January 30, 2016 |
||||
| Risk-free rate |
1.23 | % | ||
| Expected term (in years) |
4.0 | |||
| Expected volatility |
35 | % | ||
| Expected dividend yield |
0.0 | % | ||
The following table summarizes Common Interests activity in the 2015 Successor period:
| Number of |
Weighted |
|||||||
| Units outstanding at May 8, 2015 (Successor) |
— | $ | — | |||||
| Granted |
20,535,403 | 0.07 | ||||||
| Vested |
(2,402,837 | ) | 0.07 | |||||
| Forfeited |
— | — | ||||||
|
|
|
|
|
|||||
| Unvested units outstanding at January 30, 2016 (Successor) |
18,132,566 | $ | 0.07 | |||||
|
|
|
|
|
|||||
F-40
Table of Contents
J.Jill, Inc.
Notes to Consolidated Financial Statements
The aggregate intrinsic value of Common Interests is calculated as the difference between the price paid, if any, of the Common Interests and its fair value. The aggregate intrinsic value of Common Interests that vested during the 2015 Successor period was equal to its fair value and was $0.9 million. Equity-based compensation expense of $0.2 million is recorded as a selling, general and administrative expense in the consolidated statement of operations and comprehensive income (loss) for the 2015 Successor period. As of January 30, 2016 (Successor), there was $1.2 million of total unrecognized compensation expense related to unvested Common Interests, which is expected to be recognized over a weighted average service period of 4.3 years.
17. Related Party Transactions
In connection with the Acquisition, $1.9 million of cash consideration from independent directors of Topco was held by Topco. The Company recorded a corresponding related party receivable for this amount in the January 30, 2016 (Successor) consolidated balance sheet.
Since the Acquisition (see Note 4), TowerBrook, an affiliate of Topco, has performed and will perform management support advisory services, planning and finance services for the Company. Under the terms of the services agreement with TowerBrook, effective May 8, 2015, Holdings paid an upfront lump sum fee of $4.0 million. TowerBrook is also eligible to earn a fee of up to 1% of the Transaction Value at completion of: (i) a sale of all or substantially all of the assets of the Company; or (ii) the sale of a majority of the outstanding voting equity interests of the Company or entity of which the Company is a direct and wholly-owned subsidiary; or (iii) an underwritten public offering and sale of equity securities of the Company or any beneficiary affiliate (“Exit”). The Company has also agreed to pay and reimburse reasonable out of pocket expenses. The agreement term is continuous and terminates only upon a complete equity Exit by TowerBrook and its affiliates, mutual written consent, unilateral consent by TowerBrook, or by the Company upon a willful material breach of the agreement that is not cured within 30 days of written notice.
For the 2015 Successor period, the Company incurred out-of-pocket expenses of $0.3 million in relation to these services, which are included in operating expenses in the accompanying Successor consolidated statements of operations and comprehensive income (loss). Amounts payable to Topco equity holders were $0.1 million and were included in accrued expenses in the accompanying January 30, 2016 (Successor) consolidated balance sheet. The Company also distributed $8.6 million to Topco in the Successor period to reimburse them for expenses associated with the Acquisition.
Prior to the May 8, 2015 Acquisition, the Company’s equity holders (the “Advisors”) performed certain management support, advisory services, planning and finance services for the Company. Under the terms of the services agreement entered into in 2011, the Company paid an annual advisory fee of $1.0 million, payable in four quarterly installments, and subject to an adjustment increase in the event of an acquisition. The agreement term was continuous and could be terminated only upon a public offering, a change of control to a new equity investor, gross negligence or willful breach by the Advisors, mutual agreement, or dissolution, liquidation, sale or disposal of the Company’s assets.
For the 2013, 2014 and 2015 Predecessor periods, the Company incurred management fees and out of pocket expenses of $1.1 million, $1.0 million and $0.3 million, respectively, which are included in operating expenses in the accompanying Predecessor consolidated statements of operations and comprehensive income (loss). Amounts payable to the Company’s equity holders were $0.3 million and are included in accrued expenses in the accompanying January 31, 2015 (Predecessor) consolidated balance sheet.
In connection with a refinancing, the Company entered into a subordinated, unsecured $30.0 million debt facility with an affiliate of a minority equity holder of the Company. A total amount of $40.9 million was paid in
F-41
Table of Contents
J.Jill, Inc.
Notes to Consolidated Financial Statements
connection with the Acquisition, including principal and accrued interest, to settle all remaining obligations under this credit facility.
18. Subsequent Events
On May 27, 2016, the Company entered into an agreement to amend its existing term loan agreement to add $40.0 million in additional loans. The other terms and conditions of the term loan agreement remained substantially unchanged (see Note 9). The Company used the additional loan proceeds, along with available cash on hand, to fund a $70.0 million dividend to the partners of Topco, which was approved by the board of directors on May 26, 2016.
On February 24, 2017, Jill Intermediate LLC completed a conversion from a Delaware limited liability company into a Delaware corporation and changed its name to J.Jill, Inc. In conjunction with the conversion, all of the outstanding equity of Jill Intermediate LLC converted into shares of common stock of J.Jill, Inc. Accordingly, all historical earnings per share amounts presented in the accompanying consolidated statements of operations and comprehensive income (loss) and the related notes to the consolidated financial statements have been adjusted retroactively to reflect the Corporate Conversion.
Immediately after completing the Corporate Conversion, J.Jill, Inc. merged with and into its direct parent JJill Holdings on February 24, 2017, with J.Jill, Inc. continuing as the surviving entity (the “Parent Merger”). The Parent Merger is a reorganization of entities under common control and in accordance with ASC 805, the Company’s financial statements will be retroactively restated to reflect the Parent Merger as of the earliest date that common control existed, in the period in which the Parent Merger occurred. JJill Holdings did not have operations on its own, except for buyer transaction costs of $8,560 incurred to execute the Acquisition of the Company. The restated combined results of operations of the Company and JJill Holdings, will be adjusted retroactively by $8,560, and will result in the Company’s net income (loss) for the period from May 8, 2015 to January 30, 2016 (Successor) to be ($4,254) and net income (loss) per share attributable to common stockholders to be ($0.10).
The Company has evaluated subsequent events from the balance sheet date through October 21, 2016, the date at which the consolidated financial statements were available to be issued, and with respect to the Corporate Conversion and Parent Merger described above through February 25, 2017 and determined that there are no other material items to disclose.
F-42
Table of Contents
J.Jill, Inc.
Notes to Consolidated Financial Statements
19. Condensed Financial Information of Registrant (Parent Company Only)
J.Jill, Inc.
(PARENT COMPANY ONLY)
CONDENSED BALANCE SHEETS
(in thousands, except unit data)
| Predecessor January 31, 2015 |
Successor January 30, 2016 |
|||||||
| Assets |
||||||||
| Investment in subsidiaries |
$ | 71,507 | $ | 166,571 | ||||
|
|
|
|
|
|||||
| Preferred Capital and Members’ Equity |
||||||||
| Preferred capital |
72,824 | — | ||||||
| Members’ Equity |
||||||||
| Class A units, zero par value, 100 units authorized, issued and outstanding at January 31, 2015 (Predecessor) and zero units authorized, issued and outstanding at January 30, 2016 (Successor) |
1 | — | ||||||
| Class B units, zero par value, 3,927,601.3 units authorized, issued and outstanding at January 31, 2015 (Predecessor) and zero units authorized, issued and outstanding at January 30, 2016 (Successor) |
39,276 | — | ||||||
| Common units, zero par value, 1,000,000 units authorized, issued and outstanding at January 31, 2015 (Predecessor) and January 30, 2016 (Successor) |
— | — | ||||||
| Contributed capital |
7,292 | 162,265 | ||||||
| Accumulated (deficit) earnings |
(47,886 | ) | 4,306 | |||||
|
|
|
|
|
|||||
| Total members’ (deficit) equity |
(1,317 | ) | 166,571 | |||||
|
|
|
|
|
|||||
| Total preferred capital and members’ equity |
$ | 71,507 | $ | 166,571 | ||||
|
|
|
|
|
|||||
The accompanying notes are an integral part of these condensed financial statements
F-43
Table of Contents
J.Jill, Inc.
(PARENT COMPANY ONLY)
CONDENSED STATEMENTS OF OPERATIONS AND
COMPREHENSIVE INCOME (LOSS)
(in thousands, except per share data)
| Predecessor |
Successor |
|||||||||||||||||||
| For the Fiscal |
For the Fiscal |
For the Period |
For the Period |
|||||||||||||||||
| Equity in net income (loss) of subsidiaries |
$ | 4,498 | $ | 10,296 | $ | (1,901 | ) | $ | 4,306 | |||||||||||
|
|
|
|
|
|
|
|
|
|||||||||||||
| Net income (loss) and total comprehensive income (loss) |
$ | 4,498 | $ | 10,296 | $ | (1,901 | ) | $ | 4,306 | |||||||||||
|
|
|
|
|
|
|
|
|
|||||||||||||
| Net income (loss) per share attributable to common stockholders: |
||||||||||||||||||||
| Basic and diluted |
$ | 0.10 | $ | 0.24 | $ | (0.04 | ) | $ | 0.10 | |||||||||||
| Weighted average number of common shares outstanding: |
||||||||||||||||||||
| Basic and diluted |
43,747,944 | 43,747,944 | 43,747,944 | 43,747,944 | ||||||||||||||||
A statement of cash flows has not been presented as J.Jill, Inc. parent company did not have any cash as of, or for the year ended February 1, 2014, the year ended January 31, 2015, the period from February 1, 2015 to May 7, 2015 or the period from May 8, 2015 to January 30, 2016.
The accompanying note is an integral part of these condensed financial statements
Note to Condensed Financial Statements of Registrant (Parent Company Only)
Basis of Presentation
These condensed parent company-only financial statements have been prepared in accordance with Rule 12-04, Schedule I of Regulation S-X, as the restricted net assets of the subsidiaries of J.Jill, Inc. (as defined in Rule 4-08(e)(3) of Regulation S-X) exceed 25% of the consolidated net assets of the company. The ability of J.Jill, Inc.’s operating subsidiaries to pay dividends may be restricted due to the terms of the subsidiaries’ term loan and asset-based revolving credit agreements, as defined in Note 9 to the audited consolidated financial statements.
On February 24, 2017, Jill Intermediate LLC completed a conversion from a Delaware limited liability company into a Delaware corporation and changed its name to J.Jill, Inc. In conjunction with the conversion, all of the outstanding equity of Jill Intermediate LLC converted into shares of common stock of J.Jill, Inc. Accordingly, all historical earnings per share amounts presented in the condensed parent company statements of operations and comprehensive income (loss) have been adjusted retroactively to reflect the Corporate Conversion.
F-44
Table of Contents
These condensed parent company financial statements have been prepared using the same accounting principles and policies described in the notes to the consolidated financial statements, with the only exception being that the parent company accounts for its subsidiaries using the equity method. These condensed financial statements should be read in conjunction with the consolidated financial statements and related notes thereto included elsewhere in this prospectus.
F-45
Table of Contents
J.Jill, Inc.
UNAUDITED CONSOLIDATED BALANCE SHEETS
(in thousands, except common unit data)
| Successor January 30, 2016 |
Successor October 29, 2016 |
|||||||
| Assets |
||||||||
| Current assets: |
||||||||
| Cash |
$ | 27,505 | $ | 4,955 | ||||
| Accounts receivable |
3,164 | 11,338 | ||||||
| Inventories, net |
64,406 | 79,041 | ||||||
| Prepaid expenses and other current assets |
20,539 | 18,215 | ||||||
|
|
|
|
|
|||||
| Total current assets |
115,614 | 113,549 | ||||||
| Property and equipment, net |
86,810 | 98,050 | ||||||
| Intangible assets, net |
179,965 | 167,603 | ||||||
| Goodwill |
196,572 | 196,572 | ||||||
| Receivable from related party |
1,850 | 1,617 | ||||||
| Other assets |
1,221 | 1,077 | ||||||
|
|
|
|
|
|||||
| Total assets |
$ | 582,032 | $ | 578,468 | ||||
|
|
|
|
|
|||||
| Liabilities and Members’ Equity |
||||||||
| Current liabilities: |
||||||||
| Accounts payable |
$ | 41,041 | $ | 39,574 | ||||
| Accrued expenses and other current liabilities |
43,591 | 49,271 | ||||||
| Current portion of long-term debt |
2,500 | 2,900 | ||||||
|
|
|
|
|
|||||
| Total current liabilities |
87,132 | 91,745 | ||||||
| Long-term debt, net of current portion |
237,478 | 274,356 | ||||||
| Deferred income taxes |
78,837 | 77,342 | ||||||
| Other liabilities |
12,014 | 16,271 | ||||||
|
|
|
|
|
|||||
| Total liabilities |
415,461 | 459,714 | ||||||
|
|
|
|
|
|||||
| Commitments and contingencies (see Note 8) |
||||||||
| Members’ Equity |
||||||||
| Common units, zero par value, 1,000,000 units authorized, issued and outstanding as of January 30, 2016 and October 29, 2016 |
— | — | ||||||
| Contributed capital |
162,265 | 107,712 | ||||||
| Accumulated earnings |
4,306 | 11,042 | ||||||
|
|
|
|
|
|||||
| Total members’ equity |
166,571 | 118,754 | ||||||
|
|
|
|
|
|||||
| Total liabilities and members’ equity |
$ | 582,032 | $ | 578,468 | ||||
|
|
|
|
|
|||||
The accompanying notes are an integral part of these consolidated financial statements.
F-46
Table of Contents
J.Jill, Inc.
UNAUDITED CONSOLIDATED STATEMENTS OF OPERATIONS AND
COMPREHENSIVE INCOME (LOSS)
(in thousands, except share and per share data)
| Predecessor |
Successor |
|||||||||||
| For the Period |
For the Period |
For the |
||||||||||
| Net sales |
$ | 141,921 | $ | 274,741 | $ | 472,139 | ||||||
| Costs of goods sold |
44,232 | 101,185 | 149,673 | |||||||||
|
|
|
|
|
|
|
|||||||
| Gross profit |
97,689 | 173,556 | 322,466 | |||||||||
| Selling, general and administrative expenses |
80,151 | 161,236 | 273,882 | |||||||||
| Acquisition-related expenses |
13,341 | — | — | |||||||||
|
|
|
|
|
|
|
|||||||
| Operating income |
4,197 | 12,320 | 48,584 | |||||||||
| Interest expense |
4,599 | 7,922 | 13,630 | |||||||||
|
|
|
|
|
|
|
|||||||
| Income (loss) before provision for income taxes |
(402 | ) | 4,398 | 34,954 | ||||||||
| Provision for income taxes |
1,499 | 1,541 | 12,924 | |||||||||
|
|
|
|
|
|
|
|||||||
| Net income (loss) and total comprehensive income (loss) |
$ | (1,901 | ) | $ | 2,857 | $ | 22,030 | |||||
|
|
|
|
|
|
|
|||||||
| Net income (loss) per share attributable to common stockholders: |
||||||||||||
| Basic and diluted |
$ | (0.04 | ) | $ | 0.07 | $ | 0.50 | |||||
| Weighted average number of shares outstanding: |
||||||||||||
| Basic and diluted |
43,747,944 | 43,747,944 | 43,747,944 | |||||||||
The accompanying notes are an integral part of these consolidated financial statements.
F-47
Table of Contents
J.Jill, Inc.
UNAUDITED CONSOLIDATED STATEMENTS OF MEMBERS’ EQUITY
(in thousands, except common unit data)
| Common Units | Contributed Capital |
Accumulated Earnings |
Total Members’ Equity |
|||||||||||||||||
| Units | Amount | |||||||||||||||||||
| Balance, January 30, 2016 (Successor) |
1,000,000 | $ | — | $ | 162,265 | 4,306 | $ | 166,571 | ||||||||||||
| Dividend |
— | — | (54,706 | ) | (15,294 | ) | (70,000 | ) | ||||||||||||
| Equity based compensation |
— | — | 458 | — | 458 | |||||||||||||||
| Repurchase of Class A Common Interests |
— | — | (305 | ) | — | (305 | ) | |||||||||||||
| Net income |
— | — | — | 22,030 | 22,030 | |||||||||||||||
|
|
|
|
|
|
|
|
|
|
|
|||||||||||
| Balance, October 29, 2016 (Successor) |
1,000,000 | $ | — | $ | 107,712 | $ | 11,042 | $ | 118,754 | |||||||||||
|
|
|
|
|
|
|
|
|
|
|
|||||||||||
The accompanying notes are an integral part of these consolidated financial statements.
F-48
Table of Contents
J.Jill, Inc.
UNAUDITED CONSOLIDATED STATEMENTS OF CASH FLOWS
(in thousands)
| Predecessor |
Successor |
|||||||||||
| For the Period |
For the Period May 8, 2015 to October 31, |
For
the |
||||||||||
| Net income (loss) |
$ | (1,901 | ) | $ | 2,857 | $ | 22,030 | |||||
| Operating activities: |
||||||||||||
| Adjustments to reconcile net income (loss) to net cash provided by operating activities |
||||||||||||
| Depreciation and amortization |
5,147 | 20,112 | 27,282 | |||||||||
| Amortization of inventory fair value adjustment |
— | 10,471 | — | |||||||||
| Loss on disposal of fixed assets |
112 | 48 | 384 | |||||||||
| Noncash amortization of deferred financing and debt discount costs |
657 | 643 | 1,139 | |||||||||
| Payment-in-kind interest on debt |
1,192 | — | — | |||||||||
| Equity-based compensation |
441 | 119 | 458 | |||||||||
| Deferred rent liability |
84 | 2,141 | 1,851 | |||||||||
| Deferred income taxes |
(961 | ) | 1,229 | (1,495 | ) | |||||||
| Changes in operating assets and liabilities, net of Acquisition |
||||||||||||
| Accounts receivable |
(3,504 | ) | (1,004 | ) | (8,174 | ) | ||||||
| Taxes receivable |
— | (15,144 | ) | 2,356 | ||||||||
| Inventories |
(6,955 | ) | (7,050 | ) | (14,634 | ) | ||||||
| Prepaid expenses and other current assets |
(1,716 | ) | (3,889 | ) | (31 | ) | ||||||
| Accounts payable |
(7,608 | ) | (547 | ) | (1,984 | ) | ||||||
| Accrued taxes payable |
1,542 | (1,966 | ) | — | ||||||||
| Accrued expenses |
17,285 | 8,805 | 4,839 | |||||||||
| Other noncurrent assets |
12 | (1,061 | ) | (7 | ) | |||||||
| Other noncurrent liabilities |
1,906 | 3,168 | 2,957 | |||||||||
|
|
|
|
|
|
|
|||||||
| Net cash provided by Operating Activities |
5,733 | 18,932 | 36,971 | |||||||||
|
|
|
|
|
|
|
|||||||
| Investing Activities: |
||||||||||||
| Acquisition, net of cash acquired |
— | (385,744 | ) | — | ||||||||
| Purchases of property and equipment |
(7,406 | ) | (17,869 | ) | (25,706 | ) | ||||||
|
|
|
|
|
|
|
|||||||
| Net cash used in Investing Activities |
(7,406 | ) | (403,613 | ) | (25,706 | ) | ||||||
|
|
|
|
|
|
|
|||||||
| Financing Activities: |
||||||||||||
| Repayments on long-term debt |
(5,646 | ) | (625 | ) | (2,075 | ) | ||||||
| Proceeds from long-term debt |
— | 250,000 | 40,000 | |||||||||
| Payment of debt issuance costs |
— | (9,640 | ) | (1,668 | ) | |||||||
| Proceeds from equity investment |
— | 160,546 | — | |||||||||
| Receivable from related party |
— | (1,850 | ) | 233 | ||||||||
| Dividend to parent |
— | (70,000 | ) | |||||||||
| Distribution to member |
— | (8,560 | ) | — | ||||||||
| Repurchase of Class A Common Interest |
— | — | (305 | ) | ||||||||
| Proceeds from revolving credit facility |
58,750 | — | — | |||||||||
| Repayments of revolving credit facility |
(51,500 | ) | — | — | ||||||||
|
|
|
|
|
|
|
|||||||
| Net cash provided by (used in) Financing Activities |
1,604 | 389,871 | (33,815 | ) | ||||||||
|
|
|
|
|
|
|
|||||||
| Net change in cash and cash equivalents |
(69 | ) | 5,190 | (22,550 | ) | |||||||
| Cash: |
||||||||||||
| Beginning of Period |
604 | — | 27,505 | |||||||||
|
|
|
|
|
|
|
|||||||
| End of Period |
$ | 535 | $ | 5,190 | $ | 4,955 | ||||||
|
|
|
|
|
|
|
|||||||
| Supplemental cash flow information: |
||||||||||||
| Cash paid for interest |
$ | 2,952 | $ | 7,367 | $ | 11,390 | ||||||
| Cash paid for taxes |
882 | 16,013 | 12,032 | |||||||||
| Noncash investing and financing activities: |
||||||||||||
| Noncash purchase consideration |
— | 10,111 | — | |||||||||
| Capital expenditures financed with accounts payable and accrued expenses |
2,547 | 1,872 | 2,623 | |||||||||
The accompanying notes are an integral part of these consolidated financial statements.
F-49
Table of Contents
1. Summary of Significant Accounting Policies
Basis of Presentation
The consolidated financial statements prior to and including May 7, 2015 represent the financial information of the Company and its subsidiaries prior to the Acquisition and are labeled as Predecessor (“Predecessor”). The consolidated financial statements for the periods beginning and subsequent to May 8, 2015 represent the financial information of the Company and its subsidiaries subsequent to the Acquisition and are labeled as Successor (“Successor”). The consolidated financial statements from May 8, 2015 to October 31, 2015 is referred to as the “2015 Interim Successor Period.” Due to the change in the basis of accounting resulting from the Acquisition, the Company’s consolidated financial statements for these reporting periods are not comparable.
On February 24, 2017, Jill Intermediate LLC completed a conversion from a Delaware limited liability company into a Delaware corporation and changed its name to J.Jill, Inc. In conjunction with the conversion, all of the outstanding equity of Jill Intermediate LLC converted into shares of common stock of J.Jill, Inc. Accordingly, all historical earnings per share amounts presented in the accompanying consolidated statements of operations and comprehensive income (loss) and the related notes to the consolidated financial statements have been adjusted retroactively to reflect the Corporate Conversion.
The accompanying consolidated financial statements have been prepared in conformity with accounting principles generally accepted in the United States of America (“GAAP”).
All significant intercompany balances and transactions have been eliminated in consolidation. Certain information in footnote disclosures normally included in annual financial statements has been omitted for the interim periods presented in accordance with the rules and regulations of the Securities and Exchange Commission and GAAP.
In the opinion of management, the consolidated financial statements contain all normal and recurring adjustments necessary to present fairly the financial position and results of operations of the Company. The consolidated balance sheet as of January 30, 2016 is derived from the audited consolidated balance sheet for the year then ended. The results of operations for the thirty-nine weeks ended October 29, 2016 are not necessarily indicative of results to be expected for the full year ended January 28, 2017. These interim consolidated financial statements should be read in conjunction with the consolidated financial statements for the year ended January 30, 2016 and the related notes thereto included elsewhere in this prospectus.
Recently Issued Accounting Pronouncements
In June 2016, the FASB issued ASU 2016-13, Measurement of Credit Losses on Financial Instruments. This amendment significantly changes how entities measure credit losses for most financial assets and certain other instruments that aren’t measured at fair value through net income. This guidance affects loans, debt securities, trade receivables, net investments in leases, off balance sheet credit exposures, reinsurance receivables, and any other financial assets not excluded from the scope that have the contractual right to receive cash. The standard will replace the incurred loss approach with a current expected credit loss model for instruments measured at amortized cost, requiring an entity to reflect its current estimate of all expected credit losses. The allowance for credit losses is a valuation account that is deducted from the amortized cost basis of the financial assets to present the net amount expected to be collected. The update also requires certain incremental disclosures. The amendments in this update are effective for fiscal years beginning after December 15, 2019, including interim periods within those fiscal years. The Company is evaluating the impact adopting this standard will have on its consolidated financial statements.
In August 2016, the FASB issued ASU 2016-15, Statement of Cash Flows. The pronouncement was issued to address diversity in how certain cash receipts and cash payments are presented in the statement of cash flows.
F-50
Table of Contents
The new guidance provides clarity around the cash flow classification for eight specific issues in an effort to reduce the current and potential future diversity in practice. The standard, which is to be applied retrospectively, will be effective for the first interim period within annual reporting periods beginning after December 15, 2017, and early adoption is permitted. The Company is evaluating the impact adopting ASU 2016-15 will have on its consolidated financial statements.
In October 2016, the FASB issued ASU 2016-17, Consolidation (Topic 810), Interests Held through Related Parties That Are under Common Control. This update amends the consolidation guidance on how a reporting entity that is the single decision maker of a VIE should treat indirect interests in the entity held through related parties that are under common control with the reporting entity when determining whether it is the primary beneficiary of that VIE. For public business entities, the amendments in this update are effective for fiscal years beginning after December 15, 2016, including interim periods within those fiscal years. The Company does not expect adoption of ASU 2016-17 to have a material impact on its consolidated financial statements.
2. Debt
The components of the Company’s outstanding debt were as follows (in thousands):
| January 30, 2016 (Successor) |
October 29, 2016 (Successor) |
|||||||
| Term loan |
$ | 248,750 | $ | 286,675 | ||||
| Discount on debt and debt issuance costs |
(8,772 | ) | (9,419 | ) | ||||
| Less: Current portion |
(2,500 | ) | (2,900 | ) | ||||
|
|
|
|
|
|||||
| Net long-term debt |
$ | 237,478 | $ | 274,356 | ||||
|
|
|
|
|
|||||
On May 27, 2016, the Company entered into an agreement to amend its existing Term Loan Agreement to add an additional $40.0 million in borrowings under existing terms and conditions. As a result of the amendment, the scheduled quarterly payments were increased to $0.7 million beginning on July 30, 2016. As of October 29, 2016 (Successor), the Company was in compliance with all financial covenants.
The Company recorded interest expense of $4.6 million, $7.9 million, and $13.6 million in the 2015 Predecessor period, the 2015 Interim Successor period and the thirty-nine weeks ended October 29, 2016 (Successor), respectively.
As of October 29, 2016, minimum future principal amounts payable under the Company’s Term Loan Agreement are as follows (in thousands):
| Fiscal Year |
||||
| Remainder of 2016 |
$ | 725 | ||
| 2017 |
2,900 | |||
| 2018 |
2,900 | |||
| 2019 |
2,900 | |||
| 2020 |
2,900 | |||
| Thereafter |
274,350 | |||
|
|
|
|||
| $ | 286,675 | |||
|
|
|
|||
F-51
Table of Contents
3. Acquisition
On May 8, 2015, Holdings, a wholly owned subsidiary of Topco, acquired approximately 94% of the outstanding interests of the Company, with Topco acquiring the remaining 6% of the outstanding membership interests of the Company. The following unaudited pro forma financial information summarizes the combined results of operations for the Company as though the Acquisition occurred on February 2, 2014 (in thousands):
|
For the Thirty- |
||||
| Net sales |
$ | 416,662 | ||
| Net income |
$ | 18,664 | ||
The unaudited pro forma financial information is presented for informational purposes only and may not be indicative of results that would have been achieved if the Acquisition had taken place on February 2, 2014.
4. Income Taxes
The Company recorded income tax expense of $1.5 million, $1.5 million, and $12.9 million in the 2015 Predecessor period, the 2015 Interim Successor period and the thirty-nine weeks ended October 29, 2016 (Successor), respectively. The effective tax rates were (372.9%), 35.0% and 37.0% in the 2015 Predecessor period, the 2015 Interim Successor period and the thirty-nine weeks ended October 29, 2016 (Successor), respectively.
The effective tax rates for the 2015 Interim Successor period and the thirty-nine weeks ended October 29, 2016 (Successor) reflect the federal statutory rate of 35.0% as well as the impact of state income taxes. The effective tax rate in the 2015 Predecessor period reflects transaction costs related to the Acquisition, which were not deductible for tax purposes.
5. Earnings Per Share
The following table summarizes the computation of basic and diluted net income (loss) per share attributable to common stockholders for the 2015 Predecessor, 2015 Interim Successor and the thirty-nine weeks ended October 29, 2016 (Successor) (in thousands, except share and per share data):
| Period from |
For the Period from May 8, |
For the Thirty- October 29, 2016 |
||||||||||||||
| Numerator |
||||||||||||||||
| Net income (loss) attributable to common stockholders, based and diluted |
$ | (1,901 | ) | $ | 2,857 | $ | 22,030 | |||||||||
| Denominator |
||||||||||||||||
| Weighted average common shares outstanding, basic and diluted |
43,747,944 | 43,747,944 | 43,747,944 | |||||||||||||
| Net income (loss) per share attributable to common stockholders, basic and diluted |
$ | (0.04 | ) | $ | 0.07 | $ | 0.50 | |||||||||
|
|
|
|
|
|
|
|||||||||||
6. Equity-Based Compensation
Compensation expense for the 2015 Predecessor period, 2015 Interim Successor and the thirty-nine weeks ended October 29, 2016 (Successor) was $0.4 million, $0.1 million and $0.5 million, respectively.
F-52
Table of Contents
In conjunction with the Acquisition, the unvested time-based MIUs in the Predecessor period were automatically vested as a result of the change in control and all of the issued and outstanding vested time-based MIUs were settled. All of the performance-based awards issued and outstanding achieved their specified Threshold Return upon the Acquisition and were also settled. The acceleration of the vesting conditions due to the change in control resulted in compensation expense of approximately $7.4 million, which was not reflected in either the Predecessor or Successor consolidated statements of operations and comprehensive income (loss) periods, but instead are presented “on the black line.”
On May 8, 2015 a new incentive equity plan was established that allows up to 32,683,677 of its Class A Common Interests to be granted. As of October 29, 2016 (Successor), there were an aggregate of 10,136,972 Common Interests authorized and available for future issuance.
The following table summarizes Common Interests during the thirty-nine weeks ended October 29, 2016 (Successor):
| Number of |
Weighted |
|||||||
| Unvested units at January 30, 2016 |
18,132,566 | $ | 0.07 | |||||
| Granted |
3,016,954 | 0.25 | ||||||
| Vested |
(3,155,734 | ) | 0.07 | |||||
| Forfeited |
(771,000 | ) | 0.07 | |||||
|
|
|
|
|
|||||
| Unvested units at October 29, 2016 |
17,222,786 | $ | 0.10 | |||||
|
|
|
|
|
|||||
7. Related Party Transactions
On May 26, 2016, the Company’s board of directors approved a $70.0 million dividend to the partners of Topco, which was paid using cash on hand along with the proceeds from the long-term loan amendment (see Note 2).
8. Commitments and Contingencies
Operating Lease Agreements
The Company recorded a deferred lease liability of $3.3 million and $5.8 million as of January 30, 2016 (Successor) and October 29, 2016 (Successor), respectively. In certain instances, the Company also receives allowances for its store leases, which it accrues and amortizes ratably over the life of the lease. The Company maintained a tenant improvement incentive liability of $5.1 million and $7.4 million as of January 30, 2016 (Successor) and October 29, 2016 (Successor), respectively.
The following table summarizes future minimum rental payments required under all noncancelable operating lease obligations as of October 29, 2016 (Successor) (in thousands):
| Fiscal Year |
||||
| Remainder of 2016 |
$ | 10,814 | ||
| 2017 |
42,040 | |||
| 2018 |
38,533 | |||
| 2019 |
34,786 | |||
| 2020 |
33,474 | |||
| Thereafter |
142,861 | |||
|
|
|
|||
| $ | 302,508 | |||
|
|
|
|||
F-53
Table of Contents
Total rental expense was $12.7 million, $23.7 million and $41.1 million for the 2015 Predecessor, 2015 Interim Successor period and nine month 2016 Successor periods, respectively, exclusive of contingent rental expense recorded of $0.5 million, $0.9 million and $1.4 million for the same respective periods.
Legal Proceedings
The Company is subject to various legal proceedings that arise in the ordinary course of business. The Company accrues for liabilities associated with these proceedings which are determined to be probable and which can be reasonably estimated. Although the outcome of such proceedings cannot be predicted with certainty, management does not believe that it is reasonably possible that these outstanding proceedings will result in unaccrued losses that would be material. The Company maintains insurance policies to mitigate the financial impact of certain litigation.
Concentration Risk
An adverse change in the Company’s relationships with its key suppliers, or loss of the supply of one of the Company’s key products for any reason, could have a material effect on the business and results of operations of the Company. One supplier accounted for approximately 16.4% of the Company’s purchases during the thirty-nine weeks ended October 29, 2016.
Other Commitments
In addition to the lease commitments disclosed above, the Company enters into other cancelable and noncancelable commitments. Typically, these commitments are for less than one year in duration and are principally for the procurement of inventory. Preliminary commitments with the Company’s merchandise vendors typically are made six to nine months in advance of the planned receipt date. The Company had outstanding purchase commitments of $84.9 million and $124.9 million as of January 30, 2016 (Successor) and October 29, 2016 (Successor), respectively.
9. Subsequent Events
On February 24, 2017, Jill Intermediate LLC completed a conversion from a Delaware limited liability company into a Delaware corporation and changed its name to J.Jill, Inc. In conjunction with the conversion, all of the outstanding equity of Jill Intermediate LLC converted into shares of common stock of J.Jill, Inc. Accordingly, all historical earnings per share amounts presented in the accompanying consolidated statements of operations and comprehensive income (loss) and the notes to the consolidated financial statements (see Note 5) have been adjusted retroactively to reflect the Corporate Conversion.
Immediately after completing the Corporate Conversion, J.Jill, Inc. merged with and into its direct parent JJill Holdings on February 24, 2017, with J.Jill, Inc. continuing as the surviving entity (the “Parent Merger”). The Parent Merger is a reorganization of entities under common control and in accordance with ASC 805, the Company’s financial statements will be retroactively restated to reflect the Parent Merger as of the earliest date that common control existed, in the period in which the Parent Merger occurred. JJill Holdings did not have operations on its own, except for buyer transaction costs of $8,560 incurred to execute the Acquisition of the Company. The restated combined results of operations of the Company and JJill Holdings, will be adjusted retroactively by $8,560, and will result in the Company’s net income (loss) for the period from May 8, 2015 to January 30, 2016 (Successor) to be ($4,254) and net income (loss) per share attributable to common stockholders to be ($0.10).
The Company has evaluated subsequent events from the balance sheet date through December 22, 2016, the date at which the interim consolidated financial statements were available to be issued, and with respect to the Corporate Conversion and Parent Merger described above, through February 25, 2017, and determined that there are no material items to disclose.
F-54
Table of Contents

Table of Contents
Through and including , 2017 (the 25th day after the date of this prospectus), all dealers effecting transactions in the common stock, whether or not participating in this offering, may be required to deliver a prospectus. This delivery requirement is in addition to a dealer’s obligation to deliver a prospectus when acting as an underwriter and with respect to an unsold allotment or subscription.
11,666,667 Shares
J.Jill, Inc.
Common Stock

PROSPECTUS
BofA Merrill Lynch
Morgan Stanley
Jefferies
Deutsche Bank Securities
RBC Capital Markets
UBS Investment Bank
Wells Fargo Securities
Cowen and Company
Macquarie Capital
SunTrust Robinson Humphrey
, 2017
Table of Contents
PART II
INFORMATION NOT REQUIRED IN PROSPECTUS
Item 13. Other Expenses of Issuance and Distribution.
Set forth below is a table of the registration fee for the Securities and Exchange Commission and estimates of all other expenses to be paid by the registrant in connection with the issuance and distribution of the securities described in the registration statement:
| SEC registration fee |
$ | 24,880 | ||
| Stock exchange listing fee |
25,000 | |||
| Financial Industry Regulatory Authority filing fee |
31,890 | |||
| Printing expenses |
140,000 | |||
| Legal fees and expenses |
2,675,000 | |||
| Accounting fees and expenses |
2,550,000 | |||
| Blue Sky fees and expenses |
15,000 | |||
| Transfer agent and registrar fees |
6,500 | |||
| Miscellaneous |
656,730 | |||
|
|
|
|||
| Total |
$ | 6,125,000 | ||
|
|
|
Item 14. Indemnification of Directors and Officers.
Section 145 of the Delaware General Corporation Law provides that a corporation may indemnify directors and officers as well as other employees and individuals against expenses (including attorneys’ fees), judgments, fines and amounts paid in settlement actually and reasonably incurred by such person in connection with any threatened, pending or completed actions, suits or proceedings in which such person is made a party by reason of such person being or having been a director, officer, employee or agent to the Registrant. The Delaware General Corporation Law provides that Section 145 is not exclusive of other rights to which those seeking indemnification may be entitled under any bylaw, agreement, vote of stockholders or disinterested directors or otherwise. The Registrant’s Bylaws provide for indemnification by the Registrant of its directors, officers and employees to the fullest extent permitted by the Delaware General Corporation Law.
Section 102(b)(7) of the Delaware General Corporation Law permits a corporation to provide in its certificate of incorporation that a director of the corporation shall not be personally liable to the corporation or its stockholders for monetary damages for breach of fiduciary duty as a director, except for liability (i) for any breach of the director’s duty of loyalty to the corporation or its stockholders, (ii) for acts or omissions not in good faith or which involve intentional misconduct or a knowing violation of law, (iii) for unlawful payments of dividends or unlawful stock repurchases, redemptions or other distributions, or (iv) for any transaction from which the director derived an improper personal benefit. The Registrant’s Certificate of Incorporation provides for such limitation of liability.
The Registrant maintains standard policies of insurance under which coverage is provided (a) to its directors and officers against loss rising from claims made by reason of breach of duty or other wrongful act, and (b) to the Registrant with respect to payments which may be made by the Registrant to such officers and directors pursuant to the above indemnification provision or otherwise as a matter of law.
The proposed form of Underwriting Agreement filed as Exhibit 1.1 to this Registration Statement provides for indemnification of directors and officers of the Registrant by the underwriters against certain liabilities.
II-1
Table of Contents
We expect to enter into customary indemnification agreements with our executive officers and directors that provide them, in general, with customary indemnification in connection with their service to us or on our behalf.
Item 15. Recent Sales of Unregistered Securities
Prior to the closing of this offering, we will complete transactions pursuant to which we will convert from a Delaware limited liability company into a Delaware corporation. In connection with the conversion, all of our outstanding equity interests will convert into shares of common stock. The issuance of shares of common stock to our members in the conversion will be exempt from registration under the Securities Act by virtue of the exemption contained in Section 4(a)(2) of the Securities Act on the basis that the transactions did not involve a public offering. No underwriters will be involved in the issuance.
Item 16. Exhibits and Financial Statement Schedules.
(a) Exhibits
| Exhibit Number |
Exhibit Description | |
| 1.1 | Form of Underwriting Agreement. | |
| 3.1 | Certificate of Incorporation of J.Jill, Inc. | |
| 3.2 | Bylaws of J.Jill, Inc. | |
| 5.1 | Opinion of Paul, Weiss, Rifkind, Wharton & Garrison LLP as to the validity of the securities being offered. | |
| 10.1 | Form of Indemnification Agreement. | |
| 10.2 | Form of Registration Rights Agreement. | |
| 10.3* | J.Jill, Inc. 2017 Omnibus Equity Incentive Plan. | |
| 10.4* | Term Loan Credit Agreement, dated as of May 8, 2015, among Jill Holdings LLC, Jill Acquisition LLC, the various lenders party thereto from time to time and Jefferies Finance LLC, as the administrative agent. | |
| 10.5* | Amendment No. 1 to Term Loan Credit Agreement, dated as of May 27, 2016, among Jill Acquisition LLC, Jill Intermediate LLC, the lenders party thereto and Jefferies LCC as the administrative agent. | |
| 10.6* | ABL Credit Agreement, dated as of May 8, 2015, among Jill Holdings LLC, Jill Acquisition LLC, certain subsidiaries of Jill Acquisition LLC from time to time party thereto, the lenders party thereto and CIT Finance LLC, as the administrative agent and collateral agent. | |
| 10.7* | Amendment No. 1 to ABL Credit Agreement, dated as of May 27, 2016, among Jill Acquisition LLC, Jill Intermediate LLC, certain subsidiaries of Jill Acquisition LLC from time to time party thereto, the lenders party thereto and CIT Finance LLC, as the administrative agent and collateral agent. | |
| 10.8* | Services Agreement, dated as of May 8, 2015, by and between Jill Acquisition LLC and TowerBrook Capital Partners L.P. | |
| 10.9 | Amended and Restated Employment Agreement, dated as of March 30, 2015, by and between Paula Bennett, JJill Topco Holdings, LP, Jill Acquisition LLC, and certain other parties thereto. | |
| 10.10 | Amended and Restated Employment Agreement, dated as of as May 22, 2015, by and between David Biese and Jill Acquisition LLC. | |
II-2
Table of Contents
| Exhibit Number |
Exhibit Description | |
| 10.11 | Amended and Restated Employment Agreement, dated as of May 22, 2015, by and between Joann Fielder and Jill Acquisition LLC and Amendment No. 1 thereto, dated as of July 27, 2015. | |
| 10.12* | Lease Agreement, dated as of September 30, 2010, by and between Cole JJ Tilton NH, LLC and Jill Acquisition LLC. | |
| 10.13 | Form of Stockholders Agreement. | |
| 10.14 | Form of Stock Option Award Agreement under the J.Jill, Inc. 2017 Omnibus Equity Incentive Plan. | |
| 10.15 | Form of Restricted Stock Unit Award Agreement under the J.Jill, Inc. 2017 Omnibus Equity Incentive Plan. | |
| 10.16 | Amended and Restated Agreement of Limited Partnership of JJill Topco Holdings, LP, dated as of May 8, 2015. | |
| 10.17 | JJill Topco Holdings, LP Incentive Equity Plan. | |
| 10.18 | Form of Grant Agreement under the JJill Topco Holdings, LP Incentive Equity Plan. | |
| 21.1* | Subsidiaries of J.Jill, Inc. | |
| 23.1 | Consent of PricewaterhouseCoopers LLP, independent registered public accounting firm. | |
| 23.2 | Consent of Paul, Weiss, Rifkind, Wharton & Garrison LLP (included in Exhibit 5.1 to this Registration Statement). | |
| 23.3* | Consent of Linda Heasley, Director Nominee. | |
| 24.1 | Powers of Attorney (included in signature page). | |
| * | Previously filed. |
(b) Financial Statement Schedule
All schedules are omitted because the required information is either not present, not present in material amounts or presented within the consolidated financial statements included in the prospectus and are incorporated herein by reference.
Item 17. Undertakings.
The undersigned registrant hereby undertakes:
| (1) | That, for the purpose of determining liability under the Securities Act of 1933 to any purchaser, if the registrant is subject to Rule 430C, each prospectus filed pursuant to Rule 424(b) as part of a registration statement relating to an offering, other than registration statements relying on Rule 430B or other than prospectuses filed in reliance on Rule 430A, shall be deemed to be part of and included in the registration statement as of the date it is first used after effectiveness. Provided, however, that no statement made in a registration statement or prospectus that is part of the registration statement or made in a document incorporated or deemed incorporated by reference into the registration statement or prospectus that is part of the registration statement will, as to a purchaser with a time of contract of sale prior to such first use, supersede or modify any statement that was made in the registration statement or prospectus that was part of the registration statement or made in any such document immediately prior to such date of first use. |
| (2) | That, for the purpose of determining liability of the registrant under the Securities Act of 1933 to any purchaser in the initial distribution of the securities, the undersigned registrant undertakes that |
II-3
Table of Contents
| in a primary offering of securities of the undersigned registrant pursuant to this registration statement, regardless of the underwriting method used to sell the securities to the purchaser, if the securities are offered or sold to such purchaser by means of any of the following communications, the undersigned registrant will be a seller to the purchaser and will be considered to offer or sell such securities to such purchaser: |
| (i) | Any preliminary prospectus or prospectus of the undersigned registrant relating to the offering required to be filed pursuant to Rule 424; |
| (ii) | Any free writing prospectus relating to the offering prepared by or on behalf of the undersigned registrant or used or referred to by the undersigned registrant; |
| (iii) | The portion of any other free writing prospectus relating to the offering containing material information about the undersigned registrant or its securities provided by or on behalf of the undersigned registrant; and |
| (iv) | Any other communication that is an offer in the offering made by the undersigned registrant to the purchaser. |
The undersigned registrant hereby undertakes to provide to the underwriters at the closing specified in the underwriting agreement, certificates in such denominations and registered in such names as required by the underwriters to permit prompt delivery to each purchaser.
Insofar as indemnification for liabilities arising under the Securities Act may be permitted to directors, officers and controlling persons of the registrant pursuant to the foregoing provisions, or otherwise, the registrant has been advised that in the opinion of the Securities and Exchange Commission such indemnification is against public policy as expressed in the Securities Act and is, therefore, unenforceable. In the event that a claim for indemnification against such liabilities (other than the payment by the registrant of expenses incurred or paid by a director, officer or controlling person of the registrant in the successful defense of any action, suit or proceeding) is asserted by such director, officer or controlling person in connection with the securities being registered, the registrant will, unless in the opinion of its counsel the matter has been settled by controlling precedent, submit to a court of appropriate jurisdiction the question whether such indemnification by it is against public policy as expressed in the Securities Act and will be governed by the final adjudication of such issue.
The undersigned registrant hereby undertakes that:
| (1) | For purposes of determining any liability under the Securities Act, the information omitted from the form of prospectus filed as part of this registration statement in reliance upon Rule 430A and contained in a form of prospectus filed by the registrant pursuant to Rule 424(b)(1) or (4) or 497(h) under the Securities Act shall be deemed to be part of this registration statement as of the time it was declared effective. |
| (2) | For purposes of determining any liability under the Securities Act, each post-effective amendment that contains a form of prospectus shall be deemed to be a new registration statement relating to the securities offered therein, and the offering of such securities at that time shall be deemed to be the initial bona fide offering thereof. |
II-4
Table of Contents
SIGNATURES
Pursuant to the requirements of the Securities Act of 1933, J.Jill, Inc. has duly caused this Registration Statement to be signed on its behalf by the undersigned, thereunto duly authorized, in Quincy, State of Massachusetts, on the 27th day of February, 2017.
| J.JILL, INC. | ||
| By: |
/s/ Paula Bennett | |
| Paula Bennett President, Chief Executive Officer and Director | ||
POWER OF ATTORNEY
Each person whose signature appears below authorizes Paula Bennett and David Biese, or any of them, as his or her true and lawful attorney-in-fact and agent, with full power of substitution and resubstitution, to execute in his or her name and on his or her behalf, in any and all capacities, this Registrant’s registration statement on Form S-1 and any amendments thereto (and any additional registration statement related thereto permitted by Rule 462(b) promulgated under the Securities Act of 1933 (and all further amendments, including post-effective amendments thereto)), necessary or advisable to enable the registrant to comply with the Securities Act of 1933, and any rules, regulations and requirements of the Securities and Exchange Commission, in respect thereof, in connection with the registration of the securities which are the subject of such registration statement, which amendments may make such changes in such registration statement as such attorney may deem appropriate, and with full power and authority to perform and do any and all acts and things whatsoever which any such attorney or substitute may deem necessary or advisable to be performed or done in connection with any or all of the above-described matters, as fully as each of the undersigned could do if personally present and acting, hereby ratifying and approving all acts of any such attorney or substitute.
Pursuant to the requirements of the Securities Act of 1933, this Registration Statement has been signed by the following persons in the capacities and on the dates indicated.
| Signature |
Capacity |
Date | ||
| /s/ Paula Bennett Paula Bennett |
President, Chief Executive Officer and Director (Principal Executive Officer) |
February 27, 2017 | ||
| /s/ David Biese David Biese |
Senior Vice President and Chief Financial Officer (Principal Financial Officer and Principal Accounting Officer) |
February 27, 2017 | ||
| /s/ Michael Rahamim Michael Rahamim |
Chairman of the Board of Directors |
February 27, 2017 | ||
| /s/ Andrew Rolfe Andrew Rolfe |
Director |
February 27, 2017 | ||
| /s/ Travis Nelson Travis Nelson |
Director |
February 27, 2017 | ||
| /s/ Marka Hansen Marka Hansen |
Director |
February 27, 2017 | ||
| /s/ Michael Recht Michael Recht |
Director |
February 27, 2017 | ||
| /s/ Michael Eck Michael Eck |
Director |
February 27, 2017 | ||
Table of Contents
EXHIBIT INDEX
| Exhibit Number |
Exhibit Description | |
| 1.1 | Form of Underwriting Agreement. | |
| 3.1 | Certificate of Incorporation of J.Jill, Inc. | |
| 3.2 | Bylaws of J.Jill, Inc. | |
| 5.1 | Opinion of Paul, Weiss, Rifkind, Wharton & Garrison LLP as to the validity of the securities being offered. | |
| 10.1 | Form of Indemnification Agreement. | |
| 10.2 | Form of Registration Rights Agreement. | |
| 10.3* | J.Jill, Inc. 2017 Omnibus Equity Incentive Plan. | |
| 10.4* | Term Loan Credit Agreement, dated as of May 8, 2015, among Jill Holdings LLC, Jill Acquisition LLC, the various lenders party thereto from time to time and Jefferies Finance LLC, as the administrative agent. | |
| 10.5* | Amendment No. 1 to Term Loan Credit Agreement, dated as of May 27, 2016, among Jill Acquisition LLC, Jill Intermediate LLC, the lenders party thereto and Jefferies LCC as the administrative agent. | |
| 10.6* | ABL Credit Agreement, dated as of May 8, 2015, among Jill Holdings LLC, Jill Acquisition LLC, certain subsidiaries of Jill Acquisition LLC from time to time party thereto, the lenders party thereto and CIT Finance LLC, as the administrative agent and collateral agent. | |
| 10.7* | Amendment No. 1 to ABL Credit Agreement, dated as of May 27, 2016, among Jill Acquisition LLC, Jill Intermediate LLC, certain subsidiaries of Jill Acquisition LLC from time to time party thereto, the lenders party thereto and CIT Finance LLC, as the administrative agent and collateral agent. | |
| 10.8* | Services Agreement, dated as of May 8, 2015, by and between Jill Acquisition LLC and TowerBrook Capital Partners L.P. | |
| 10.9 | Amended and Restated Employment Agreement, dated as of March 30, 2015, by and between Paula Bennett, JJill Topco Holdings, LP, Jill Acquisition LLC, and certain other parties thereto. | |
| 10.10 | Amended and Restated Employment Agreement, dated as of as May 22, 2015, by and between David Biese and Jill Acquisition LLC. | |
| 10.11 | Amended and Restated Employment Agreement, dated as of May 22, 2015, by and between Joann Fielder and Jill Acquisition LLC and Amendment No. 1 thereto, dated as of July 27, 2015. | |
| 10.12* | Lease Agreement, dated as of September 30, 2010, by and between Cole JJ Tilton NH, LLC and Jill Acquisition LLC. | |
| 10.13 | Form of Stockholders Agreement. | |
| 10.14 | Form of Stock Option Award Agreement under the J.Jill, Inc. 2017 Omnibus Equity Incentive Plan. | |
| 10.15 | Form of Restricted Stock Unit Award Agreement under the J.Jill, Inc. 2017 Omnibus Equity Incentive Plan. | |
| 10.16 | Amended and Restated Agreement of Limited Partnership of JJill Topco Holdings, LP, dated as of May 8, 2015. | |
| 10.17 | JJill Topco Holdings, LP Incentive Equity Plan. | |
| 10.18 | Form of Grant Agreement under the JJill Topco Holdings, LP Incentive Equity Plan. | |
| 21.1* | List of subsidiaries of J.Jill, Inc. | |
Table of Contents
| Exhibit Number |
Exhibit Description | |
| 23.1 | Consent of PricewaterhouseCoopers LLP, independent registered public accounting firm. | |
| 23.2 | Consent of Paul, Weiss, Rifkind, Wharton & Garrison LLP (included in Exhibit 5.1 to this Registration Statement). | |
| 23.3* | Consent of Linda Heasley, Director Nominee. | |
| 24.1 | Powers of Attorney (included in signature page). | |
| * | Previously filed. |