Attached files
| file | filename |
|---|---|
| EX-32.2 - CERTIFICATION OF CFO SECTION 906 - GENESIS ENERGY LP | gel12312016exhibit322.htm |
| EX-32.1 - CERTIFICATION OF CEO SECTION 906 - GENESIS ENERGY LP | gel12312016exhibit321.htm |
| EX-31.2 - CERTIFICATION OF CFO SECTION 302 - GENESIS ENERGY LP | gel12312016exhibit312.htm |
| EX-31.1 - CERTIFICATION OF CEO SECTION 302 - GENESIS ENERGY LP | gel12312016exhibit311.htm |
| EX-23.2 - CONSENT OF DELOITTE & TOUCHE LLP - GENESIS ENERGY LP | gel12312016exhibit232.htm |
| EX-23.1 - CONSENT OF DELOITTE & TOUCHE LLP - GENESIS ENERGY LP | gel12312016exhibit231.htm |
| EX-21.1 - SUBSIDIARIES OF THE REGISTRANT - GENESIS ENERGY LP | gel12312016exhibit211.htm |
UNITED STATES SECURITIES AND EXCHANGE COMMISSION
Washington, D.C. 20549
Form 10-K
x ANNUAL REPORT PURSUANT TO SECTION 13 OR 15(d) OF THE SECURITIES EXCHANGE ACT OF 1934
For the fiscal year ended December 31, 2016
OR
¨ TRANSITION REPORT PURSUANT TO SECTION 13 OR 15(d) OF THE SECURITIES EXCHANGE ACT OF 1934
Commission file number 1-12295
GENESIS ENERGY, L.P.
(Exact name of registrant as specified in its charter)
Delaware | 76-0513049 | |
(State or other jurisdiction of incorporation or organization) | (I.R.S. Employer Identification No.) | |
919 Milam, Suite 2100, Houston, TX 77002
(Address of principal executive offices) (Zip code)
(713) 860-2500
Registrant’s telephone number, including area code:
Securities registered pursuant to Section 12(b) of the Act:
Title of Each Class | Name of Each Exchange on Which Registered | |
Common Units | NYSE | |
Securities registered pursuant to Section 12(g) of the Act:
NONE
Indicate by check mark if the registrant is a well-known seasoned issuer, as defined in Rule 405 of the Securities Act. Yes x No o
Indicate by check mark if the registrant is not required to file reports pursuant to Section 13 or Section 15(d) of the Act. Yes o No x
Indicate by check mark whether the registrant (1) has filed all reports required to be filed by Section 13 or 15(d) of the Securities Exchange Act of 1934 during the preceding 12 months (or for such shorter period that the registrant was required to file such reports), and (2) has been subject to such filing requirements for the past 90 days. Yes x No o
Indicate by check mark whether the registrant has submitted electronically and posted on its corporate Website, if any, every Interactive Data File required to be submitted and posted pursuant to Rule 405 of Regulation S-T during the preceding 12 months (or for such shorter period that the registrant was required to submit and post such files). Yes x No o
Indicate by check mark if disclosure of delinquent filers pursuant to Item 405 of Regulation S-K is not contained herein, and will not be contained, to the best of registrant’s knowledge, in definitive proxy or information statements incorporated by reference in Part III of this Form 10-K or any amendment to this Form 10-K. o
Indicate by check mark whether the registrant is a large accelerated filer, an accelerated filer, a non-accelerated filer, or a smaller reporting company. See the definitions of “large accelerated filer”, “accelerated filer” and “smaller reporting company” in Rule 12b-2 of the Exchange Act.
Large accelerated filer | x | Accelerated filer | ¨ |
Non-accelerated filer | o | Smaller reporting company | ¨ |
Indicate by check mark whether the registrant is a shell company (as defined in Rule 12b-2) of the Act). Yes o No x
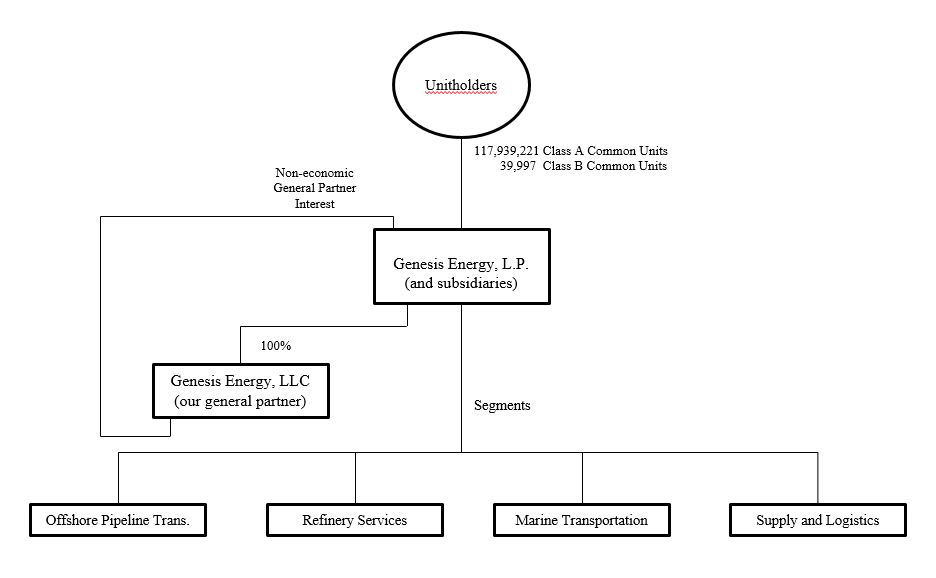
The aggregate market value of the Class A common units held by non-affiliates of the Registrant on June 30, 2016 (the last business day of Registrant’s most recently completed second fiscal quarter) was approximately $3.5 billion based on $38.37 per unit, the closing price of the common units as reported on the NYSE. For purposes of this computation, all executive officers, directors and 10% owners of the registrant are deemed to be affiliates. Such a determination should not be deemed an admission that such executive officers, directors and 10% beneficial owners are affiliates. On February 24, 2017, the Registrant had 117,939,221 Class A Common Units and 39,997 Class B Common Units outstanding.
GENESIS ENERGY, L.P.
2016 FORM 10-K ANNUAL REPORT
Table of Contents
Page | ||
Item 1 | ||
Item 1A. | ||
Item 1B. | ||
Item 2. | ||
Item 3. | ||
Item 4. | ||
Item 5. | ||
Item 6. | ||
Item 7. | ||
Item 7A. | ||
Item 8. | ||
Item 9. | ||
Item 9A. | ||
Item 9B. | ||
Item 10. | ||
Item 11. | ||
Item 12. | ||
Item 13. | ||
Item 14. | ||
Item 15. | ||
2
Definitions
Unless the context otherwise requires, references in this annual report to “Genesis Energy, L.P.,” “Genesis,” “we,” “our,” “us” or like terms refer to Genesis Energy, L.P. and its operating subsidiaries. As generally used within the energy industry and in this annual report, the identified terms have the following meanings:
Bbl or Barrel: One stock tank barrel, or 42 U.S. gallons liquid volume, used in reference to crude oil or other liquid hydrocarbons.
Bbls/day: Barrels per day.
Bcf: Billion cubic feet of gas.
CO2: Carbon dioxide.
DST: Dry short tons (2,000 pounds), a unit of weight measurement.
FERC: Federal Energy Regulatory Commission.
Gal: Gallon.
MBbls: Thousand Bbls.
MBbls/d: Thousand Bbls per day.
Mcf: Thousand cubic feet of gas.
mmBtu: One million British thermal units, an energy measurement.
MMcf: Thousand Mcf.
NaHS: (commonly pronounced as “nash”) Sodium hydrosulfide.
NaOH or Caustic Soda: Sodium hydroxide.
Natural gas liquid(s) or NGL(s): The combination of ethane, propane, normal butane, isobutane and natural gasolines that, when removed from natural gas, become liquid under various levels of higher pressure and lower temperature.
Sour gas: Natural gas containing more than four parts per million of hydrogen sulfide.
Wellhead: The point at which the hydrocarbons and water exit the ground.
FORWARD-LOOKING INFORMATION
The statements in this Annual Report on Form 10-K that are not historical information may be “forward looking statements” as defined under federal law. All statements, other than historical facts, included in this document that address activities, events or developments that we expect or anticipate will or may occur in the future, including things such as plans for growth of the business, future capital expenditures, competitive strengths, goals, references to future goals or intentions and other such references are forward-looking statements, and historical performance is not necessarily indicative of future performance. These forward-looking statements are identified as any statement that does not relate strictly to historical or current facts. They use words such as “anticipate,” “believe,” “continue,” “estimate,” “expect,” “forecast,” “goal,” “intend,” “may,” “could,” “plan,” “position,” “projection,” “strategy,” “should” or “will,” or the negative of those terms or other variations of them or by comparable terminology. In particular, statements, expressed or implied, concerning future actions, conditions or events or future operating results or the ability to generate sales, income or cash flow are forward-looking statements. Forward-looking statements are not guarantees of performance. They involve risks, uncertainties and assumptions. Future actions, conditions or events and future results of operations may differ materially from those expressed in these forward-looking statements. Many of the factors that will determine these results are beyond our ability or the ability of our affiliates to control or predict. Specific factors that could cause actual results to differ from those in the forward-looking statements include, among others:
• | demand for, the supply of, our assumptions about, changes in forecast data for, and price trends related to crude oil, liquid petroleum, natural gas, NaHS, caustic soda and CO2, all of which may be affected by economic activity, capital expenditures by energy producers, weather, alternative energy sources, international events, conservation and technological advances; |
3
• | throughput levels and rates; |
• | changes in, or challenges to, our tariff rates; |
• | our ability to successfully identify and close strategic acquisitions on acceptable terms (including obtaining third-party consents and waivers of preferential rights), develop or construct energy infrastructure assets, make cost saving changes in operations and integrate acquired assets or businesses into our existing operations; |
• | service interruptions in our pipeline transportation systems, and processing operations; |
• | shutdowns or cutbacks at refineries, petrochemical plants, utilities or other businesses for which we transport crude oil, petroleum, natural gas or other products or to whom we sell such products; |
• | risks inherent in marine transportation and vessel operation, including accidents and discharge of pollutants; |
• | changes in laws and regulations to which we are subject, including tax withholding issues, regulations regarding qualifying income, accounting pronouncements, and safety, environmental and employment laws and regulations; |
• | the effects of production declines resulting from the suspension of drilling in the Gulf of Mexico and the effects of future laws and government regulation resulting from the Macondo accident and oil spill in the Gulf; |
• | planned capital expenditures and availability of capital resources to fund capital expenditures; |
• | our inability to borrow or otherwise access funds needed for operations, expansions or capital expenditures as a result of our credit agreement and the indentures governing our notes, which contain various affirmative and negative covenants; |
• | loss of key personnel; |
• | cash from operations that we generate could decrease or fail to meet expectations, either of which could reduce our ability to pay quarterly cash distributions at the current level or continue to increase quarterly cash distributions in the future; |
• | an increase in the competition that our operations encounter; |
• | cost and availability of insurance; |
• | hazards and operating risks that may not be covered fully by insurance; |
• | our financial and commodity hedging arrangements, which may reduce our earnings, profitability and cash flow; |
• | changes in global economic conditions, including capital and credit markets conditions, inflation and interest rates; |
• | natural disasters, accidents or terrorism; |
• | changes in the financial condition of customers or counterparties; |
• | adverse rulings, judgments, or settlements in litigation or other legal or tax matters; |
• | the treatment of us as a corporation for federal income tax purposes or if we become subject to entity-level taxation for state tax purposes; and |
• | the potential that our internal controls may not be adequate, weaknesses may be discovered or remediation of any identified weaknesses may not be successful and the impact these could have on our unit price. |
You should not put undue reliance on any forward-looking statements. When considering forward-looking statements, please review the risk factors described under “Risk Factors” discussed in Item 1A. These risks may also be specifically described in our Quarterly Reports on Form 10-Q, Current Reports on Form 8-K and Form 8-K/A and other documents that we may file from time to time with the SEC. Except as required by applicable securities laws, we do not intend to update these forward-looking statements and information.
4
PART I
Item 1. Business
General
We are a growth-oriented master limited partnership formed in Delaware in 1996 and focused on the midstream segment of the crude oil and natural gas industry in the Gulf Coast region of the United States, Wyoming and in the Gulf of Mexico. Our common units are traded on the New York Stock Exchange under the ticker symbol “GEL.” Our principal executive offices are located at 919 Milam, Suite 2100, Houston, Texas 77002 and our telephone number is (713) 860-2500. Except to the extent otherwise provided, the information contained in this annual report is as of December 31, 2016.
We provide an integrated suite of services to refiners, crude oil and natural gas producers, and industrial and commercial enterprises. We currently have two distinct, complimentary types of operations-(i) our onshore-based refinery-centric operations located primarily in the Gulf Coast region of the U.S., which focus on providing a suite of services primarily to refiners, and (ii) our offshore Gulf of Mexico crude oil and natural gas pipeline transportation and handling operations, which focus on providing a suite of services primarily to integrated and large independent energy companies who make intensive capital investments (often in excess of billions of dollars) to develop numerous large-reservoir, long-lived crude oil and natural gas properties. Our onshore-based operations occur upstream of, at, and downstream of refinery complexes. Upstream of refineries, we aggregate, purchase, gather and transport crude oil, which we sell to refiners. Within refineries, we provide services to assist in sulfur removal/balancing requirements. Downstream of refineries, we provide transportation services as well as market outlets for finished refined petroleum products and certain refining by-products. In our offshore crude oil and natural gas pipeline transportation and handling operations, we provide service to one of the most active drilling and development regions in the U.S.—the Gulf of Mexico, a producing region representing approximately 18% of the crude oil production in the U.S. in 2016. We have a diverse portfolio of customers, operations and assets, including pipelines, refinery-related plants, storage tanks and terminals, railcars, rail loading and unloading facilities, barges and other vessels, and trucks. Substantially all of our revenues are derived from providing services to refiners, integrated and large independent crude oil and natural gas companies, and industrial and commercial enterprises.
We conduct our operations and own our operating assets through our subsidiaries and joint ventures. Our general partner, Genesis Energy, LLC, a wholly-owned subsidiary that owns a non-economic general partner interest in us, has sole responsibility for conducting our business and managing our operations. Our outstanding common units (including our Class B common units) representing limited partner interests constitute all of the economic equity interests in us.
In the fourth quarter of 2016, we reorganized our operating segments as a result of the way our Chief Executive Officer, who is our chief operating decision maker, evaluates the performance of operations, develops strategy and allocates resources. The results of our onshore pipeline transportation segment, formerly reported under its own segment, are now reported in our supply and logistics segment. This change is consistent with the increasingly integrated nature of our onshore operations.
As a result of the above changes, we currently manage our businesses through four divisions that constitute our reportable segments - offshore pipeline transportation, refinery services, marine transportation, and supply and logistics. Our disclosures related to prior periods have been recast to reflect our reorganized segments.
Offshore Pipeline Transportation Segment
We conduct our offshore crude oil and natural gas pipeline transportation and handling operations through our offshore pipeline transportation segment, which focuses on providing a suite of services to integrated and large independent energy companies who make intensive capital investments (often in excess of billions of dollars) to develop numerous large-reservoir, long-lived crude oil and natural gas properties in the Gulf of Mexico, primarily offshore Texas, Louisiana, Mississippi and Alabama. This segment provides services to one of the most active drilling and development regions in the U.S.—the Gulf of Mexico, a producing region representing approximately 18% of the crude oil production in the U.S. in 2016. Even though those large-reservoir properties and the related pipelines and other infrastructure needed to develop them are capital intensive, we believe they are generally much less sensitive to short-term commodity price volatility, particularly once a project has been sanctioned. Due to the size and scope of these activities, our customers are predominantly large integrated oil companies and large independent crude oil producers.
We own interests in various offshore crude oil and natural gas pipeline systems, platforms and related infrastructure. We own interests in approximately 1,437 miles of crude oil pipelines with an aggregate design capacity of approximately 1,810 MBbls per day, a number of which pipeline systems are substantial and/or strategically located. For example, we own a 64% interest in the Poseidon pipeline system and 100% of the Cameron Highway pipeline system, or CHOPS, which is one of the largest crude oil pipelines (in terms of both length and design capacity) located in the Gulf of Mexico. We also own 100% of the Southeast Keathley Canyon Pipeline Company, LLC ("SEKCO"), which is a deepwater pipeline servicing the Lucius field in the southern Keathley Canyon area of the Gulf of Mexico.
5
Our interests in offshore natural gas pipeline systems and related infrastructure includes approximately 1,157 miles of pipe with an aggregate design capacity of approximately 4,863 MMcf per day. We also own an interest in six offshore hub platforms with aggregate processing capacity of approximately 2,256 MMcf per day of natural gas and 167 MBbls per day of crude oil.
Our offshore pipelines generate cash flows from fees charged to customers or substantially similar arrangements that otherwise limit our direct exposure to changes in commodity prices. Each of our offshore pipelines currently has significant available capacity to accommodate future growth in the fields from which the production is dedicated to that pipeline, including fields that have yet to commence production activities, as well as volumes from non-dedicated fields.
Refinery Services Segment
We primarily (i) provide services to ten refining operations located mostly in Texas, Louisiana, Arkansas, Oklahoma, Montana and Utah; (ii) operate significant storage and transportation assets in relation to those services; and (iii) sell NaHS (pronounced nash, and also known as sodium hydrosulfide) and NaOH (also known as caustic soda) to large industrial and commercial companies. Our refinery services primarily involve processing refiners’ high sulfur (or “sour”) gas streams to remove the sulfur. Our refinery services footprint also includes NaHS and caustic soda terminals, and we utilize railcars, ships, barges and trucks to transport product. Our refinery services contracts are typically long-term in nature and have an average remaining term of three years. NaHS is a by-product derived from our refinery sulfur removal services process, and it constitutes the sole consideration we receive for these services. A majority of the NaHS we receive is sourced from refineries owned and operated by large companies, including Phillips 66, CITGO, HollyFrontier, Calumet and Ergon. We sell our NaHS to customers in a variety of industries, with the largest customers involved in mining of base metals, primarily copper and molybdenum, and the production of pulp and paper. We believe we are one of the largest marketers of NaHS in North and South America.
Marine Transportation Segment
We own a fleet of 83 barges (74 inland and 9 offshore) with a combined transportation capacity of 2.9 million barrels and 43 push/tow boats (34 inland and 9 offshore). Our marine transportation segment is a provider of transportation services by tank barge primarily for refined petroleum products, including heavy fuel oil and asphalt, as well as crude oil. Refiners accounted for approximately 80% of our marine transportation volumes for 2016.
We also own the M/T American Phoenix, an ocean going tanker with 330,000 barrels of cargo capacity. The M/T American Phoenix is currently transporting refined products.
We are a provider of transportation services for our customers and, in almost all cases, do not assume ownership of the products that we transport. Most of our marine transportation services are conducted under term contracts, some of which have renewal options for customers with whom we have traditionally had long-standing relationships. For more information regarding our charter arrangements, please refer to the marine transportation segment discussion below. All of our vessels operate under the U.S. flag and are qualified for domestic trade under the Jones Act.
Supply and Logistics Segment
Our supply and logistics segment owns and/or leases our increasingly integrated suite of onshore crude oil and refined products infrastructure, including pipelines, trucks, terminals, railcars, and rail loading and unloading facilities. It uses those assets, together with other modes of transportation owned by third parties and us, to service its customers and for its own account. The increasingly integrated nature of our supply and logistics assets is particularly evident in certain of our recently completed or ongoing growth initiatives in areas such as Louisiana, Texas and Wyoming.
We own five onshore crude oil pipeline systems, with approximately 580 miles of pipe located primarily in Alabama, Florida, Louisiana, Mississippi, Texas and Wyoming. The Federal Energy Regulatory Commission, or FERC, regulates the rates charged by four of our onshore systems to their customers. The rates for the other onshore pipeline are regulated by the Railroad Commission of Texas. Our onshore pipelines generate cash flows from fees charged to customers. Each of our onshore pipelines has significant available capacity to accommodate potential future growth in volumes.
We own two CO2 pipelines with approximately 270 miles of pipe. We have leased our NEJD System, comprised of 183 miles of pipe in North East Jackson Dome, Mississippi, to an affiliate of an independent crude oil company through 2028. We receive a fixed quarterly payment under the NEJD arrangement. That company also has the exclusive right to use our Free State pipeline, comprised of 86 miles of pipe, pursuant to a transportation agreement that expires in 2028. Payments on the Free State pipeline are subject to an "incentive" tariff which provides that the average rate per mcf that we charge during any month decreases as our aggregate throughput for that month increases above specified thresholds.
We have access to a suite of more than 200 trucks, 400 trailers, 523 railcars, and terminals and tankage with 4.6 million barrels of storage capacity (excluding capacity associated with our common carrier crude oil pipelines) in multiple locations along the Gulf Coast. Our crude-by-rail operations consist of a total of six facilities, either in operation or under
6
construction, designed to load and/or unload crude oil. The two facilities located in Texas and Wyoming were designed primarily to load crude oil produced locally onto railcars for further transportation to refining markets. The four other facilities (two in Louisiana, one in Mississippi and one in Florida) were designed primarily to unload crude oil from railcars into pipelines, or onto barges, for delivery to refinery customers. In addition, four of these facilities are directly connected to our integrated pipeline and terminal infrastructure. Usually, our supply and logistics segment experiences limited direct commodity price risk because it utilizes back-to-back purchases and sales, matching sale and purchase volumes on a monthly basis. Unsold volumes are hedged with NYMEX derivatives to offset the remaining price risk.
Our Objectives and Strategies
Our primary objective continues to be to deliver the best value to our unitholders while never wavering from our commitment to safe and responsible operations. A lot has changed, we recognize, in how the market apparently values unit prices for MLPs or other midstream entities over the last year and a half to two years. The move to eliminate our IDRs over six years ago and our track record of delivering annualized double-digit growth in distributions were historically rewarded. However, we have recently concluded the valuation metrics demanded by the markets have changed in recent times, especially in light of numerous freezes, cuts or total elimination of distributions over the recent energy business cycle by other entities in our space with which we compete commercially and/or for external capital.
We now believe the best way to promote unit price appreciation under current conditions is to exercise strong financial discipline designed primarily to maintain and enhance our financial flexibility across the business cycle. We believe prospectively we can naturally restore our financial flexibility with cash flows from operations. During 2016, we accelerated that process by issuing additional equity and lowering the future growth rate of quarterly distributions.
Business Strategy
Our primary business strategy is to provide an integrated suite of services to refiners, crude oil and natural gas producers, and industrial and commercial enterprises. Successfully executing this strategy should enable us to generate and grow sustainable cash flows. We currently have two distinct, complimentary types of operations: (i) our onshore-based crude oil and refined petroleum products transportation, supply and logistics, and handling operations, focusing predominantly on refinery-centric customers (as opposed to producers), and (ii) our offshore Gulf of Mexico crude oil and natural gas pipeline transportation and handling operations, focusing on integrated and large independent energy companies who make intensive capital investments (often in excess of billions of dollars) to develop numerous large-reservoir, long-lived crude oil and natural gas properties. Refiners are the shippers of approximately 80% of the volumes transported on our onshore crude pipelines, and refiners contract for approximately 80% of the use of our inland barges, which are used primarily to transport intermediate refined products (not crude oil) between refining complexes. The shippers on our offshore pipelines are mostly integrated and large independent energy companies who have developed, and continue to explore for, numerous large-reservoir, long-lived crude oil properties whose production is ideally suited for the vast majority of refineries along the Gulf Coast, unlike the lighter crude oil and condensates produced from numerous onshore shale plays. Those large-reservoir properties and the related pipelines and other infrastructure needed to develop them are capital intensive and yet, we believe, economically viable, in most cases, even in this lower commodity price environment.
We intend to develop our business by:
• | Identifying and exploiting incremental profit opportunities, including cost synergies, across an increasingly integrated footprint; |
• | Optimizing our existing assets and creating synergies through additional commercial and operating advancement; |
• | Leveraging customer relationships across business segments; |
• | Attracting new customers and expanding our scope of services offered to existing customers; |
• | Expanding the geographic reach of our businesses; |
• | Economically expanding our pipeline and terminal operations; |
• | Evaluating internal and third party growth opportunities (including asset and business acquisitions) that leverage our core competencies and strengths and further integrate our businesses; and |
• | Focusing on health, safety and environmental stewardship. |
7
Financial Strategy
We believe that preserving financial flexibility is an important factor in our overall strategy and success. Over the long-term, we intend to:
• | Increase the relative contribution of recurring and throughput-based revenues, emphasizing longer-term contractual arrangements; |
• | Prudently manage our limited direct commodity price risks; |
• | Maintain a sound, disciplined capital structure; and |
• | Create strategic arrangements and share capital costs and risks through joint ventures and strategic alliances. |
Competitive Strengths
We believe we are well positioned to execute our strategies and ultimately achieve our objectives due primarily to the following competitive strengths:
• | We have limited direct commodity price risk exposure. The volumes of crude oil, refined products or intermediate feedstocks we purchase are either subject to back-to-back sales contracts or are hedged with NYMEX derivatives to limit our direct exposure to movements in the price of the commodity, although we cannot completely eliminate commodity price exposure. Our risk management policy requires us to monitor the effectiveness of the hedges to maintain a value at risk of such hedged inventory not in excess of $2.5 million. In addition, our service contracts with refiners allow us to adjust the rates we charge for processing to maintain a balance between NaHS supply and demand. |
• | Our businesses encompass a balanced, diversified portfolio of customers, operations and assets. We operate four business segments and own and operate assets that enable us to provide a number of services primarily to refiners, crude oil and natural gas producers, and industrial and commercial enterprises that use NaHS and caustic soda. Our business lines complement each other by allowing us to offer an integrated suite of services to common customers across segments. Our businesses are primarily focused on providing (i) onshore-based refinery-centric crude oil and refined products transportation and handling services and (ii) offshore crude oil and natural gas pipeline transportation and related handling services in the Gulf of Mexico to mostly integrated and large independent energy companies. We are not dependent upon any one customer or principal location for our revenues. |
• | Some of our pipeline transportation and related assets are strategically located. Our pipelines are critical to the ongoing operations of our refiner and producer customers. In addition, a majority of our terminals are located in areas that can be accessed by truck, rail or barge. |
• | We believe we are one of the largest marketers of NaHS in North and South America. We believe the scale of our well-established refinery services operations as well as our integrated suite of assets provides us with a unique cost advantage over some of our existing and potential competitors. |
• | Some of our supply and logistics assets are operationally flexible. Our portfolio of trucks, railcars, barges and terminals affords us flexibility within our existing regional footprint and provides us the capability to enter new markets and expand our customer relationships. |
• | Our marine transportation assets provide waterborne transportation throughout North America. Our fleet of barges and boats provide service to both inland and offshore customers within a large North American geographic footprint. All of our vessels operate under the U.S. flag and are qualified for U.S. coastwise trade under the Jones Act. |
• | Our businesses provide relatively consistent consolidated financial performance. Our historically consistent and improving financial performance, combined with our goal of a conservative capital structure over the long term, has allowed us to generate relatively stable and increasing cash flows, allowing us to increase our distribution for forty-six consecutive quarters as of our most recent distribution declaration. |
• | We are financially flexible and have significant liquidity. As of December 31, 2016, we had $412.3 million available under our $1.7 billion revolving credit agreement, including up to $125.5 million available under the $200 million petroleum products inventory loan sublimit and $90.5 million available for letters of credit. Our inventory borrowing base was $74.5 million at December 31, 2016. |
• | Our expertise and reputation for high performance standards and quality enable us to provide refiners with economic and proven services. Our extensive understanding of the sulfur removal process and crude oil refining can provide us with an advantage when evaluating new opportunities and/or markets. |
• | We have an experienced, knowledgeable and motivated executive management team with a proven track record. Our executive management team has an average of more than 25 years of experience in the midstream sector. Its members |
8
have worked in leadership roles at a number of large, successful public companies, including other publicly-traded partnerships. Through their equity interest in us, our executive management team is incentivized to create value by increasing cash flows.
Recent Developments and Status of Certain Growth Initiatives
The following is a brief listing of developments since December 31, 2015. Additional information regarding most of these items may be found elsewhere in this report.
Houston Area Crude Oil Pipeline and Terminal Infrastructure
We are constructing new, and expanding existing, crude oil pipeline and terminal facilities in Webster, Texas and Texas City, Texas as a result of expanding our crude oil pipeline and terminal infrastructure in the Houston area. We are constructing a new crude oil pipeline that will deliver crude oil received from upstream crude oil pipelines (including CHOPS, which delivers crude oil originating in the deepwater Gulf of Mexico to the Texas City area) to our new Texas City Terminal, which will ultimately connect to our existing 18-inch Webster to Texas City crude oil pipeline. Our new Texas City Terminal will initially include approximately 750,000 barrels of crude oil tankage. As a part of this project, we are also making the necessary upgrades on our existing 18-inch Webster to Texas City crude oil pipeline to reverse the direction of flow. The result of this expanded crude oil infrastructure will allow additional optionality to Houston and Baytown area refineries, including the Exxon-Mobil Baytown refinery, its largest refinery in the U.S.A., and provide additional delivery outlets for other crude oil pipelines. We expect these assets to become operational in the first half of 2017.
Raceland Terminal and Crude Oil Pipeline
We are constructing a new crude oil terminal and pipeline in Raceland, Louisiana that will be connected to existing midstream infrastructure that will provide further distribution to the Louisiana refining markets. Our new Raceland Terminal will consist of 515,000 barrels of crude oil tankage and unit train unloading facilities capable of unloading up to two unit trains per day. We are constructing a new crude oil pipeline that will deliver crude oil received from the Poseidon system, which currently delivers crude oil originating in the deepwater Gulf of Mexico to the Houma, Louisiana area, to our Raceland Terminal for further distribution. We expect these assets to become fully operational in the first half of 2017.
Inland Marine Barge Transportation Expansion
We ordered 28 new-build barges and 18 new-build push boats for our inland marine barge transportation fleet. We have accepted delivery of 20 of those barges and 14 of those push boats through December 31, 2016. We expect to take delivery of those remaining vessels periodically into 2017.
Baton Rouge Terminal
We constructed a new crude oil, intermediates and refined products import/export terminal in Baton Rouge that is located near the Port of Greater Baton Rouge and is connected to the port's existing deepwater docks on the Mississippi River. We constructed approximately 1.1 million barrels of tankage for the storage of crude oil, intermediates and/or refined products with the capability to expand to provide additional terminaling services to our customers. In addition, we constructed a new pipeline from the terminal that will allow for deliveries to existing ExxonMobil facilities in the area, as well as connect our previously constructed 17 mile line to the terminal allowing for receipts from the Scenic Station Rail Facility. Shippers to Scenic Station will have access to both the local Baton Rouge refining market, as well as the ability to access other attractive refining markets via our Baton Rouge Terminal. Our Baton Rouge Terminal and related facilities became operational early in the fourth quarter of 2016.
Wyoming Crude Oil Pipeline
In the third quarter of 2015, we completed construction of a new 60 mile crude oil pipeline to transport crude oil from new receipt point stations in Campbell County and Converse County, Wyoming to our existing Pronghorn Rail Facility. This new crude oil pipeline has an initial capacity of approximately 30,000 barrels per day and is supplied by truck volumes and third party gathering infrastructure in the Powder River Basin.
We also constructed a new 75 mile pipeline from our Pronghorn Rail Facility to a delivery point at our new Guernsey Station in Platte County, Wyoming. This Pronghorn to Guernsey pipeline has an initial capacity of approximately 45,000 barrels per day and will allow for connectivity to additional downstream pipeline markets at Guernsey, including regional refineries and Cushing, Oklahoma via the Pony Express Pipeline. This pipeline became operational in the first quarter of 2016.
9
Forty-six Consecutive Distribution Rate Increases
We have increased our quarterly distribution rate for forty-six consecutive quarters. On February 14, 2017, we paid a quarterly cash distribution of $0.710 (or $2.84 on an annualized basis) per unit to unitholders of record as of January 31, 2017, an increase of 1.4% from the distribution in the prior quarter, and an increase of 8.4% from the distribution in February 2016. As in the past, future increases (if any) in our quarterly distribution rate will depend on our ability to execute critical components of our business strategy.
Ownership Structure
We conduct our operations and own our operating assets through subsidiaries and joint ventures. As is customary with publicly traded limited partnerships, Genesis Energy, LLC, our general partner, is responsible for operating our business, including providing all necessary personnel and other resources.
The following chart depicts our organizational structure at December 31, 2016.
Description of Segments and Related Assets
We conduct our businesses through four operating segments: offshore pipeline transportation, refinery services, marine transportation and supply and logistics. These segments are strategic business units that provide a variety of energy-related services. Financial information with respect to each of our segments can be found in Note 12 to our Consolidated Financial Statements in Item 8.
We have a diverse portfolio of customers, operations and assets, including pipelines, refinery-related plants, storage tanks and terminals, railcars, rail loading and unloading facilities, barges and other vessels, and trucks. Substantially all of our revenues are derived from providing services to refiners, integrated and large independent crude oil and natural gas companies, and large industrial and commercial enterprises. Our onshore-based operations occur upstream of, at, and downstream of refinery complexes. Upstream of refineries, we aggregate, purchase, gather and transport crude oil, which we sell to refiners. Within refineries, we provide services to assist in sulfur removal/balancing requirements. Downstream of refineries, we provide transportation services as well as market outlets for finished refined petroleum products and certain refining byproducts.
10
Offshore Pipeline Transportation
Offshore Crude Oil and Natural Gas Pipelines
We own interests in several crude oil and natural gas pipelines and related infrastructure located offshore in the Gulf of Mexico, a producing region representing approximately 18% of the crude oil production in the U.S. in 2016.
The table below reflects our interests in our operating offshore crude oil pipelines:
Offshore crude oil pipelines | Operator | System Miles | Design Capacity (Bbls/day) (1) | Interest Owned | Throughput (Bbls/day) 100% basis | Throughput (Bbls/day) net to ownership interest | |||||||||||
Main Lines | |||||||||||||||||
CHOPS | Genesis | 380 | 500,000 | 100 | % | 204,533 | 204,533 | ||||||||||
Poseidon | Genesis | 367 | 350,000 | 64 | % | 262,829 | 168,211 | ||||||||||
Odyssey | Shell Pipeline | 120 | 200,000 | 29 | % | 106,933 | 31,011 | ||||||||||
Eugene Island Pipeline and Other | Genesis/Shell Pipeline | 184 | 39,000 | 23 | % | 7,468 | 7,468 | ||||||||||
Total | 1,051 | 1,089,000 | 581,763 | 411,223 | |||||||||||||
Lateral Lines (2) | |||||||||||||||||
SEKCO | Genesis | 149 | 115,000 | 100 | % | ||||||||||||
Shenzi Crude Oil Pipeline | Genesis | 83 | 230,000 | 100 | % | ||||||||||||
Allegheny Crude Oil Pipeline | Genesis | 40 | 140,000 | 100 | % | ||||||||||||
Marco Polo Crude Oil Pipeline | Genesis | 37 | 120,000 | 100 | % | ||||||||||||
Constitution Crude Oil Pipeline | Genesis | 67 | 80,000 | 100 | % | ||||||||||||
Viosca Knoll Crude Oil Pipeline | Genesis | 6 | 5,000 | 100 | % | ||||||||||||
Tarantula | Genesis | 4 | 30,000 | 100 | % | ||||||||||||
(1) | Capacity figures presented represent 100% of the design capacity; except for Eugene Island, which represents our net capacity in the undivided interest (23%) in that system. Ultimate capacities can vary primarily as a result of pressure requirements, installed pumps, related facilities and the viscosity of the crude oil actually moved. |
(2) | Represents 100% owned lateral crude oil pipelines which, other than our Viosca Knoll Crude Oil Pipeline, ultimately flow into our other offshore crude oil pipelines (including CHOPS and Poseidon) and thus are excluded from main lines above. |
• | CHOPS. CHOPS is comprised of 24- to 30-inch diameter pipelines designed to deliver crude oil from fields in the Gulf of Mexico to refining markets along the Texas Gulf Coast via interconnections with refineries located in Port Arthur and Texas City, Texas. CHOPS also includes two strategically located multi-purpose offshore platforms. |
• | Poseidon. The Poseidon system is comprised of 16- to 24-inch diameter pipelines to deliver crude oil from developments in the central and western offshore Gulf of Mexico to other pipelines and terminals onshore and offshore Louisiana. An affiliate of Shell owns the remaining 36% interest in Poseidon. |
• | Odyssey. The Odyssey system is comprised of 12- to 20-inch diameter pipelines to deliver crude oil from developments in the eastern Gulf of Mexico to other pipelines and terminals onshore Louisiana. An affiliate of Shell owns the remaining 71% interest in Odyssey. |
• | Eugene Island. The Eugene Island system is comprised of a network of crude oil pipelines, the main pipeline of which is 20 inches in diameter, to deliver crude oil from developments in the central Gulf of Mexico to other pipelines and terminals onshore Louisiana. Other owners in Eugene Island include affiliates of Exxon Mobil, Chevron, ConocoPhillips and Shell Oil Company. |
11
• | SEKCO Pipeline. SEKCO is a deepwater pipeline serving the Lucius crude oil and natural gas field located in the southern Keathley Canyon area of the Gulf of Mexico. SEKCO has crude oil transportation agreements with seven Gulf of Mexico producers, including Anadarko U.S. Offshore Corporation, Exxon Mobil Corporation, Eni Petroleum US LLC, Petrobras America and Inpex Corporation. Those producers have dedicated their production from Lucius to that pipeline for the life of the reserves. We expect the SEKCO pipeline to also provide capacity for additional projects in the deepwater Gulf of Mexico in the future. |
• | Shenzi Crude Oil. The Shenzi Crude Oil Pipeline gathers crude oil production from the Shenzi production field located in the Green Canyon area of the Gulf of Mexico offshore Louisiana for delivery to both our CHOPS and Poseidon pipeline systems. |
• | Allegheny Crude Oil. The Allegheny Crude Oil Pipeline connects the Allegheny and South Timbalier 316 platforms in the Green Canyon area of the Gulf of Mexico with the CHOPS and Poseidon pipelines. |
• | Marco Polo Crude Oil. The Marco Polo Crude Oil Pipeline transports crude oil from our Marco Polo crude oil platform to an interconnect with the Allegheny Crude Oil Pipeline in Green Canyon Block 164. |
• | Constitution Crude Oil. The Constitution Crude Oil Pipeline gathers crude oil from the Constitution, Caesar Tonga and Ticonderoga production fields located in the Green Canyon area of the Gulf of Mexico for delivery to either the CHOPS or Poseidon pipelines. |
None of our offshore crude oil pipelines are rate regulated with the exception of Eugene Island, which is regulated by the FERC.
The table below reflects our interests in our operating offshore natural gas pipelines:
Offshore natural gas pipelines | Operator | System Miles | Design Capacity (MMcf/day) (1) | Interest Owned | |||||||
Independence Trail | Genesis | 135 | 1,000 | 100 | % | ||||||
Viosca Knoll Gathering System | Genesis | 107 | 600 | 100 | % | ||||||
High Island Offshore System | Genesis | 287 | 500 | 100 | % | ||||||
Anaconda Gathering System | Genesis | 183 | 300 | 100 | % | ||||||
Green Canyon Laterals | Genesis | 34 | 213 | Various (2) | |||||||
Manta Ray Offshore Gathering System | Enbridge | 237 | 800 | 25.7 | % | ||||||
Nautilus System | Enbridge | 101 | 600 | 25.7 | % | ||||||
Total | 1,084 | 4,013 | |||||||||
(1) | Capacity figures presented represent 100% of the design capacity. |
(2) | We proportionately consolidate our undivided interests, which range from 2.7% to 33.3%, in 28 miles of the Green Canyon Lateral pipelines. The remainder of the laterals are wholly owned. |
• | Independence Trail. The Independence Trail pipeline transports natural gas from certain pipeline interconnects to the Tennessee Gas Pipeline at a pipeline interconnect on the West Delta 68 pipeline junction platform. Natural gas transported on the Independence Trail Pipeline originates from production fields in the Atwater Valley, DeSoto Canyon, Lloyd Ridge and Mississippi Canyon areas of the Gulf of Mexico. |
• | Viosca Knoll Gathering System. Viosca Knoll gathers natural gas from producing fields located in the Main Pass, Mississippi Canyon and Viosca Knoll areas of the Gulf of Mexico for delivery to several major interstate pipelines, including the High Point Gas Transmission, Transco, Dauphin Island Gathering System, Tennessee Gas Pipeline and Destin Pipelines. |
• | High Island. The High Island Offshore System (HIOS) transports natural gas from producing fields located in the Galveston, Garden Banks, West Cameron, High Island and East Breaks areas of the Gulf of Mexico to interconnects with the TC Offshore system and Kinetica Energy Express. HIOS includes 201 miles of pipeline and eight pipeline junction and service platforms that are regulated by the FERC. In addition, this system included the 86-mile East Breaks Gathering System, which connects HIOS to the Hoover-Diana deepwater platform located in Alaminos Canyon Block 25. |
• | Anaconda. The Anaconda Gathering System gathers natural gas from producing fields located in the Green Canyon area of the Gulf of Mexico for delivery to the Nautilus System. |
• | Green Canyon. The Green Canyon Laterals represent a collection of small diameter pipelines that gather natural gas for delivery to HIOS and various other downstream pipelines. |
12
• | Manta Ray. The Manta Ray Offshore Gathering System gathers natural gas from producing fields located in the Green Canyon, Southern Green Canyon, Ship Shoal, South Timbalier and Ewing Bank areas of the Gulf of Mexico for delivery to numerous downstream pipelines, including the Nautilus System. This system includes three pipeline junction platforms. |
• | Nautilus. The Nautilus System connects the Anaconda Gathering system and Manta Ray Offshore Gathering System to the Neptune natural gas processing plant located in south Louisiana. |
Offshore Hub Platforms
Offshore Hub platforms are typically used to interconnect the offshore pipeline network; provide an efficient means to perform pipeline maintenance; locate compression, separation and production handling equipment and similar assets; and conduct drilling operations during the initial development phase of a crude oil and natural gas property. The results of operations from offshore platform services are primarily dependent upon the level of commodity charges and/or demand-type fees billable to customers. Revenue from commodity charges is based on a fee per unit of volume delivered to the platform (typically per MMcf of natural gas or per barrel of crude oil) multiplied by the total volume of each product delivered. Demand-type fees are similar to firm capacity reservation agreements for a pipeline in that they are charged to a customer regardless of the volume the customer actually delivers to the platform. Contracts for platform services often include both demand-type fees and commodity charges, but demand-type fees generally expire after a contractually fixed period of time and in some instances may be subject to cancellation by customers.
The table below reflects our interests in our operating offshore hub platforms:
Offshore hub platform | Operator | Water Depth (Feet) | Natural Gas Capacity (MMcf/day) (1) | Crude Oil Capacity (Bbls/day) (1) | Interest Owned | |||||||||
Marco Polo | Anadarko | 4,300 | 300 | 120,000 | 100 | % | ||||||||
Viosca Knoll 817 | Genesis | 671 | 145 | 5,000 | 100 | % | ||||||||
Garden Banks 72 (2) | Genesis | 518 | 216 | 36,000 | 50 | % | ||||||||
East Cameron 373 | Genesis | 441 | 195 | 3,000 | 100 | % | ||||||||
Total | 856 | 164,000 | ||||||||||||
(1) | Capacity figures presented represent 100% of the design capacity. |
(2) | We proportionately consolidate our undivided interest in the Garden Banks 72 platform. |
• | Marco Polo. The Marco Polo platform, which is located in Green Canyon Block 608, processes crude oil and natural gas from production fields located in the South Green Canyon area of the Gulf of Mexico. |
• | Viosca Knoll. The Viosca Knoll 817 platform primarily serves as a base for gathering deepwater production in the Viosca Knoll area, including the Ram Powell development. |
• | Garden Banks. The Garden Banks 72 platform serves as a base for gathering deepwater production from the Garden Banks area of the Gulf of Mexico. This platform also serves as a junction platform for the CHOPS and Poseidon pipeline systems. |
• | East Cameron. The East Cameron 373 platform processes production from the Garden Banks and East Cameron areas of the Gulf of Mexico. |
Customers
Due to the cost of finding, developing and producing crude oil properties in the deepwater regions of the Gulf of Mexico, most of our offshore pipeline customers are integrated crude oil companies and other large producers, and those producers desire to have longer-term arrangements ensuring that their production can access the markets.
Usually, our offshore crude oil pipeline customers enter into buy-sell or other transportation arrangements, pursuant to which the pipeline acquires possession (and, sometimes, title) from its customer of the relevant production at a specified location (often a producer’s platform or at another interconnection) and redelivers possession (and title, if applicable) to such customer of an equivalent volume at one or more specified downstream locations (such as a refinery or an interconnection with another pipeline). Most of the production handled by our offshore pipelines is pursuant to life-of-reserve commitments that include both firm and interruptible capacity arrangements.
Revenues from customers of our offshore pipeline transportation segment did not account for more than ten percent of our consolidated revenues.
13
Competition
The principal competition for our offshore pipelines includes other crude oil and natural gas pipeline systems as well as producers who may elect to build or utilize their own production handling facilities. Our offshore pipelines compete for new production on the basis of geographic proximity to the production, cost of connection, available capacity, transportation rates and access to onshore markets. In addition, the ability of our offshore pipelines to access future reserves will be subject to our ability, or the producers’ ability, to fund the significant capital expenditures required to connect to the new production. In general, most of our offshore pipelines are not subject to regulatory rate-making authority, and the rates our offshore pipelines charge for services are dependent on the quality of the service required by the customer and the amount and term of the reserve commitment by that customer.
Refinery Services
Our refinery services segment primarily (i) provides sulfur-extraction services to ten refining operations located mostly in Texas, Louisiana, Arkansas, Oklahoma and Utah, (ii) operates significant storage and transportation assets in relation to those services and (iii) sells NaHS and caustic soda to large industrial and commercial companies. Our refinery services primarily involve processing refiners' high sulfur (or “sour”) gas streams that the refineries have generated from crude oil processing operations. Our process applies our proprietary technology, which uses large quantities of caustic soda (the primary raw material used in our process) to act as a scrubbing agent under prescribed temperature and pressure to remove sulfur. Sulfur removal in a refinery is a key factor in optimizing production of refined products such as gasoline, diesel and aviation fuel. Our sulfur removal technology returns a clean (sulfur-free) hydrocarbon stream to the refinery for further processing into refined products, and simultaneously produces NaHS. The resultant NaHS constitutes the sole consideration we receive for our refinery services activities. A majority of the NaHS we receive is sourced from refineries owned and operated by large companies, including Phillips 66, CITGO, HollyFrontier, Calumet and Ergon. Our ten refinery services contracts have an average remaining life of three years. This includes the extended term of our recently renegotiated refinery services contract with Phillips 66 at our Westlake, Louisiana facility, which now extends through 2026. The timing upon which these contracts renew vary based upon location and terms specified within each specific contract.
Our refinery services footprint includes NaHS and caustic soda terminals in the Gulf Coast, the Midwest, Montana, Utah, British Columbia and South America. In conjunction with our supply and logistics segment, we sell and deliver (via railcars, ships, barges and trucks) NaHS and caustic soda to approximately 150 customers. We believe we are one of the largest marketers of NaHS in North and South America. By minimizing our costs through utilization of our own logistical assets and leased storage sites, we believe we have a competitive advantage over other suppliers of NaHS. NaHS is used in the specialty chemicals business (plastic additives, dyes and personal care products), in pulp and paper business, and in connection with mining operations (nickel, gold and separating copper from molybdenum) as well as bauxite refining (aluminum). NaHS has also gained acceptance in environmental applications, including waste treatment programs requiring stabilization and reduction of heavy and toxic metals and flue gas scrubbing. Additionally, NaHS can be used for removing hair from hides at the beginning of the tannery process.
Caustic soda is used in many of the same industries as NaHS. Many applications require both chemicals for use in the same process. For example, caustic soda can increase the yields in bauxite refining, pulp manufacturing and in the recovery of copper, gold and nickel. Caustic soda is also used as a cleaning agent (when combined with water and heated) for process equipment and storage tanks at refineries.
Customers
We provide on-site sulfur removal services utilizing NaHS units at ten refining locations. Even though some of our customers have elected to own the sulfur removal facilities located at their refineries, we operate those facilities. We market all of our NaHS as well as small amounts of NaHS for a handful of third parties.
We sell our NaHS to customers in a variety of industries, with the largest customers involved in mining of base metals, primarily copper and molybdenum and the production of pulp and paper. We sell to customers in the copper mining industry in the western U.S., Canada and Mexico. We also export the NaHS to South America for sale to customers for mining in Peru and Chile. No sulfur removal customer or NaHS sales customer is responsible for more than ten percent of our consolidated revenues. Many of the industries that our NaHS customers are in (such as copper mining and the pulp and paper industry) participate in global markets for their products. As a result, this creates an indirect exposure for NaHS to global demand for the end products of our customers. Provisions in our service contracts with refiners allow us to adjust our sour gas processing rates (sulfur removal) to maintain a balance between NaHS supply and demand.
We sell caustic soda to many of the same customers who purchase NaHS from us, including pulp and paper manufacturers and customers in the copper mining industry. We also supply caustic soda to some of the refineries in which we operate for use in cleaning processing equipment.
14
Competition
Our competitors for the supply of NaHS consist primarily of parties who produce NaHS as a by-product of or an alternative to other sulfur derivative products, including fertilizers, pesticides, other agricultural products, plastic additives and lubricants. Typically our competitors for the supply of NaHS have only one location and they do not have the logistical infrastructure that we have to supply customers. These competitors often reduce NaHS production when demand for their alternative sulfur derivatives is high and increase NaHS production when demand for these alternatives is low. Also, they tend to supply less when prices and demand for elemental sulfur are higher and supply more NaHS when the price of elemental sulfur falls.
Demand for NaHS faces competition from alternative sulfidity management mediums such as sulfidic caustic, emulsified sulfur, salt cake and flake NaHS. Changes in the value, supply and/or demand of these alternative products can impact the volume and/or value of our NaHS sold.
Typically, our competitors for sulfur removal services include refineries themselves through the use of their sulfur removal processes.
Our competitors for sales of caustic soda include manufacturers of caustic soda. These competitors supply caustic soda to our refinery services operations and support us in our third-party caustic soda sales. By utilizing our storage capabilities and having access to transportation assets, we sell caustic soda to third parties who gain efficiencies from acquiring both NaHS and caustic soda from one source.
We do not have any NaHS sales customer or sulfur removal customer that accounted for more than ten percent of our consolidated revenues.
Marine Transportation
Our marine transportation segment consists of (i) our inland marine fleet which transports heavy refined petroleum products, including asphalt, principally serving refineries and storage terminals along the Gulf Coast, Intracoastal Canal and western river systems of the U.S., principally along the Mississippi River and its tributaries, (ii) our offshore marine fleet which transports crude oil and refined petroleum products, principally serving refineries and storage terminals along the Gulf Coast, Eastern Seaboard, Great Lakes and Caribbean, and (iii) our modern double-hulled, Jones Act qualified tanker M/T American Phoenix which is currently under charter serving a customer along the Gulf Coast until 2020. The below table includes operational information relating to our marine transportation fleet:
Inland | Offshore | American Phoenix | |||
Aggregate Fleet Design Capacity (Bbls) (in thousands) | 2,058 | 884 | 330 | ||
Individual Vessel Capacity Range (Bbls) (in thousands) (1) | 23-39 | 65-136 | 330 | ||
Number of: | |||||
Push/Tug Boats | 34 | 9 | — | ||
Barges | 74 | 9 | — | ||
Product Tankers | — | — | 1 | ||
(1) | Represents capacity per barge ranges on our inland and offshore barge, as well as the capacity of our M/T American Phoenix. |
Customers
Our marine customers are primarily refiners and some large energy companies. Our M/T American Phoenix is currently operating under a long term charter into 2020 with Phillips 66. We are a provider of transportation services for our customers and, in almost all cases, do not assume ownership of the products we transport. Marine transportation services are conducted under term contracts, some of which have renewal options for customers with whom we have traditionally had long-standing relationships, as well as spot contracts. Most have been our customers for many years and we generally anticipate continued relationships; however, there is no assurance that any individual contract will be renewed.
A term contract is an agreement with a specific customer to transport cargo from a designated origin to a designated destination at a set rate (affreightment) or at a daily rate (time charter). The rate may or may not escalate during the term of the contract; however, the base rate generally remains constant and contracts often include escalation provisions to recover changes in specific costs such as fuel. Time charters, which insulate us from revenue fluctuations caused by weather and navigational delays and temporary market declines, represented over 95% of our marine transportation revenues under term contracts during
15
2016, 2015 and 2014. A spot contract is an agreement with a customer to move cargo from a specific origin to a designated destination for a rate negotiated at the time the cargo movement takes place. Spot contract rates are at the current “market” rate and are subject to market volatility. We typically maintain a higher mix of term contracts to spot contracts to provide a predictable revenue stream while maintaining spot market exposure to take advantage of new business opportunities and existing customers’ peak demands. During 2016, 2015 and 2014, approximately 62%, 75% and 80%, respectively, of our marine transportation revenues were from term contracts and 38%, 25% and 20%, respectively, were from spot contracts.
Revenues from customers of our marine transportation segment did not account for more than ten percent of our consolidated revenues.
Competition
Our competitors for the marine transportation of crude oil and heavy refined petroleum products are both midstream MLPs with marine transportation divisions, along with companies that are in the business of solely marine transportation operations. Competition among common marine carriers is based on a number of factors including proximity to production, refineries and connecting infrastructures, customer service, and transportation pricing.
Our marine transportation segment also competes with other modes of transporting crude oil and heavy refined petroleum products, including pipeline, rail and trucking operations. Each such mode of transportation has different advantages and disadvantages, which often are fact and circumstance dependent. For example, without requiring longer-term economic commitments from shippers, marine and truck transportation can offer shippers much more flexibility to access numerous markets in multiple directions (i.e. pipelines tend to flow in a single direction and are geographically limited by their receipt and delivery points with other pipelines and facilities), and marine transportation offers shippers certain economies of scale as compared to truck transportation. In addition, due to construction costs and timing considerations, marine and truck transportation can provide cost effective and immediate services to a nascent producing region, whereas new pipelines can be very expensive and time consuming to construct and may require shippers to make longer-term economic commitments, such as take-or-pay commitments. On the other hand, in mature developed areas serviced by extensive, multi-directional pipelines, with extensive connections to various market, pipeline transportation may be preferred by shippers, especially if shippers are willing to make longer-term economic commitments, such as take-or-pay commitments.
Supply and Logistics
We provide supply and logistics services to Gulf Coast crude oil refineries and producers through a combination of purchasing, transporting, storing, blending and marketing of crude oil and refined products (primarily fuel oil, asphalt, and other heavy refined products). In connection with these services, we utilize our increasingly integrated portfolio of logistical assets consisting of pipelines, trucks, terminals, railcars and barges. The increasingly integrated nature of our supply and logistics assets is particularly evident in certain of our recently completed or ongoing growth initiatives in areas such as Louisiana, Texas and Wyoming. Our crude oil related services include gathering crude oil from producers at the wellhead, transporting crude oil by gathering line, truck, railcar and barge to pipeline injection points, transporting crude oil for our gathering and marketing operations and for other shippers on our pipelines and marketing crude oil to refiners. Not unlike our crude oil operations, we also gather refined products from refineries, transport refined products via pipeline, truck, railcar and barge, and sell refined products to customers in wholesale markets. For certain of these services, we generate fee-based income related to the transportation services provided. In some cases, we also profit from the difference between the price at which we re-sell the crude oil and petroleum products less the price at which we purchase the crude oil and products, minus the associated costs of aggregation and transportation.
Our crude oil supply and logistics operations are concentrated in Texas, Louisiana, Alabama, Florida, Mississippi and Wyoming. These operations help to ensure (among other things) a base supply source for our crude oil pipeline systems, refinery customers and other shippers while providing our producer customers with a market outlet for their production. We attempt to limit our direct commodity price risk in our supply and logistics segment by utilizing back-to-back purchases and sales, matching sale and purchase volumes on a monthly basis and hedging unsold volumes (primarily with NYMEX derivatives to offset the remaining price risk); however, we cannot completely eliminate commodity price risks. By utilizing our network of pipelines, trucks, railcars, barges, and terminals, we are able to provide transportation related services to, and in many cases back-to-back gathering and marketing arrangements with, crude oil refiners and producers. Additionally, our crude oil gathering and marketing expertise and knowledge base provide us with an ability to capitalize on opportunities that arise from time to time in our market areas. We gather and market approximately 50,000 barrels per day of crude oil, much of which is produced from large resource basins throughout Texas and the Gulf Coast. Our crude oil pipelines transport many of these barrels, as well barrels for third party producers and refiners to which we charge fees for our transportation services. Given our network of terminals, we also have the ability to store crude oil during periods of contango (crude oil prices for future deliveries are higher than for current deliveries) for delivery in future months. When we purchase and store crude oil during periods of contango, we attempt to limit direct commodity price risk by simultaneously entering into a contract to sell the inventory in a future period, either with a counterparty or in the crude oil futures market. The most substantial component of the
16
costs we incur while aggregating crude oil and petroleum products relates to operating our fleet of owned and leased trucks and railcars and incurring transportation related costs.
Onshore Crude Oil Pipelines
Through the onshore pipeline systems and related assets we own and operate, we transport crude oil for our gathering and marketing operations and for other shippers pursuant to tariff rates regulated by FERC or the Railroad Commission of Texas, or TXRRC. Accordingly, we offer transportation services to any shipper of crude oil, if the products tendered for transportation satisfy the conditions and specifications contained in the applicable tariff. Pipeline revenues are a function of the level of throughput and the particular point where the crude oil is injected into the pipeline and the delivery point. We also may earn revenue from pipeline loss allowance volumes. In exchange for bearing the risk of pipeline volumetric losses, we deduct volumetric pipeline loss allowances and crude oil quality deductions. Such allowances and deductions are offset by measurement gains and losses. When our actual volume losses are less than the related allowances and deductions, we recognize the difference as income and inventory available for sale valued at the market price for the crude oil.
The margins from our onshore crude oil pipeline operations are generated by the difference between the sum of revenues from regulated published tariffs and pipeline loss allowance revenues and the fixed and variable costs of operating and maintaining our pipelines.
We own and operate five onshore common carrier crude oil pipeline systems: the Texas System, the Jay System, the Mississippi System, the Louisiana System and the Wyoming System.
Texas System | Jay System | Mississippi System | Louisiana System | Wyoming System | |||||
Product | Crude Oil | Crude Oil | Crude Oil | Crude Oil Intermediates Refined Products | Crude Oil | ||||
Interest Owned | 100% | 100% | 100% | 100% | 100% | ||||
Design Capacity (Bbls/day) (1) | Existing 8" - 60,000 Looped 18" - 275,000 | 150,000 | 45,000 | 350,000 | 30,000/ 45,000 | ||||
2016 Throughput (Bbls/day) | 33,814 | 14,815 | 10,247 | 44,295 | 10,959 | ||||
System Miles | 47 | 135 | 235 | 25 | 135 | ||||
Approximate owned tankage storage capacity (Bbls) | 360,000 | 230,000 | 247,500 | 350,000 | 450,000 | ||||
Location | Hastings Junction, TX to Webster, TX Webster, TX to Texas City, TX | Southern AL/FL to Mobile, AL | Soso, MS to Liberty, MS | Port Hudson, LA to Baton Rouge, LA Baton Rouge, LA to Port Allen, LA | Wright, WY (Campbell County) to Douglas, WY (Pronghorn) Douglas, WY to Guernsey, WY | ||||
Rate Regulated | TXRRC | FERC | FERC | FERC | FERC | ||||
(1) | Our Wyoming pipeline system has an initial capacity of approximately 30,000 barrels per day from Campbell County to the Pronghorn Rail Facility and an initial capacity of 45,000 barrels per day from the Pronghorn Rail Facility to Platte County, Wyoming. |
• | Texas System. Our Texas System transports crude oil from Hastings Junction (south of Houston) to several delivery points near Houston, Texas (including our Webster, Texas facility and ultimately into the Texas City refining market). This system also takes delivery of crude oil volumes at Texas City for delivery to our Webster, Texas facility, which ultimately connects to other crude oil pipelines. We earn a tariff for our transportation services, with the tariff rate per barrel of crude oil varying with the distance from injection point to delivery point. See "Recent Developments and |
17
Status of Certain Growth Initiatives" for further information surrounding developments and current growth initiatives surrounding our Houston area crude oil infrastructure project.
• | Jay System. Our Jay System provides crude oil shippers access to refineries, pipelines and storage near Mobile, Alabama. That system also includes gathering connections to approximately 46 wells, additional crude oil storage capacity of 20,000 barrels in the field, an interconnect with our Walnut Hill rail facility, a delivery connection to a refinery in Alabama and an interconnection to another common carrier pipeline that delivers crude oil into Mississippi. |
• | Mississippi System. Our Mississippi System provides shippers of crude oil in Mississippi indirect access to refineries, pipelines, storage, terminals and other crude oil infrastructure located in the Midwest. That system is adjacent to several crude oil fields that are in various phases of being produced through tertiary recovery strategy, including CO2 injection and flooding. We provide transportation services on our Mississippi pipeline through an “incentive” tariff which provides that the average rate per barrel that we charge during any month decreases as our aggregate throughput for that month increases above specified thresholds. |
• | Louisiana System. Our Louisiana System transports crude oil from Port Hudson to our Baton Rouge Scenic Station rail unloading facility and continues downstream to the Anchorage Tank Farm servicing Exxon Mobil Corporation's Baton Rouge refinery. This refinery is one of the largest refinery complexes in North America, with more than 500,000 barrels per day of refining capacity. Our Louisiana system also connects the Anchorage Tank Farm to our new Port of Baton Rouge Terminal (which was also built to service Exxon's Baton Rouge refinery), allowing bidirectional flow of crude oil, intermediates and refined products between the Anchorage Tank Farm and this terminal. |
This pipeline system serves as a key asset in our increasingly integrated Baton Rouge area midstream infrastructure, which also includes terminal and rail facilities as discussed previously.
Additionally, as discussed in "Recent Developments and Growth Initiatives" above, in the fourth quarter of 2013, we began construction on a new terminal, crude oil pipeline and unit train unloading facility in Raceland, Louisiana which will be connected to existing midstream infrastructure that will provide further distribution to the Louisiana refining markets. We expect this facility to be operational in the first half of 2017.
• | Wyoming System. Our Wyoming System transports crude oil from receipt point stations in Campbell County and Converse County, Wyoming to our Pronghorn Rail Facility near Douglas, Wyoming. This crude oil pipeline has an initial capacity of approximately 30,000 barrels per day and is supplied by truck volumes and third party gathering infrastructure in the Powder River Basin. This pipeline system became operational in the third quarter of 2015. We have also completed construction of a new 75 mile pipeline from our Pronghorn Rail Facility to a delivery point at our new Guernsey Station in Platte County, Wyoming. This Pronghorn to Guernsey pipeline has an initial capacity of approximately 45,000 barrels per day and will allow for connectivity to additional downstream pipeline markets at Guernsey, including regional refineries and Cushing, Oklahoma via the Pony Express Pipeline. This pipeline became operational in the first quarter of 2016. |
This pipeline system serves as a key asset in our increasingly integrated Wyoming midstream infrastructure, which also includes terminal and rail facilities as discussed previously.
Other Supply and Logistics Operations
We own five operational crude oil rail loading/unloading facilities located in Baton Rouge, Louisiana; Walnut Hill, Florida; Wink, Texas; Natchez, Mississippi and Douglas, Wyoming which provide synergies to our existing asset footprint. We generally earn a fee for loading or unloading railcars at these facilities. Three of these facilities, our Baton Rouge, Louisiana, Walnut Hill, Florida, and Douglas, Wyoming facilities are directly connected to our existing integrated crude oil pipeline and terminal infrastructure. See further discussion of these facilities above.
Within our supply and logistics business segment, we employ many types of logistically flexible assets. These assets include 200 trucks, 400 trailers, 523 railcars, and terminals and other tankage with 4.6 million barrels of leased and owned storage capacity in multiple locations along the Gulf Coast, accessible by pipeline, truck, rail or barge, in addition to tankage related to our crude oil pipelines, previously mentioned. Our leased railcars consist of approximately 51 refined product railcars and 472 crude oil railcars.
Our refined products supply and logistics operations are concentrated in the Gulf Coast region, principally Texas and Louisiana, and in Wyoming. Through our footprint of owned and leased pipelines, trucks, leased railcars, terminals and barges, we are able to provide Gulf Coast area refineries with transportation services as well as market outlets for certain heavy refined products. We primarily engage in the transportation and supply of fuel oil, asphalt, and other heavy refined products to our customers in wholesale markets. We have the ability from time to time to obtain various grades of refined products from our refinery customers and blend them to meet the requirements of our other market customers. However, because our refinery customers may choose to manufacture such refined products based on a number of economic and operating factors, we cannot predict the timing of contribution margins related to our blending services.
18
CO2 Pipelines
We transport CO2 on our Free State pipeline for a fee and we lease our Northeast Jackson Dome Pipeline System, or NEJD System, for a fee.
Free State Pipeline | |
Product | CO2 |
Interest owned | 100% |
System miles | 86 |
Pipeline diameter | 20" |
Location | Jackson Dome near Jackson, MS to East Mississippi |
Rate Regulated | No |
Our Free State pipeline extends from CO2 source fields near Jackson, Mississippi to crude oil fields in eastern Mississippi. We have a transportation services agreement through 2028 related to our Free State pipeline with a single shipper who has the right to use 100% of that pipeline's capacity.
Our NEJD System transports CO2 to tertiary crude oil recovery operations in southwest Mississippi. We have leased that pipeline to an affiliate of the shipper on our Free State pipeline through 2028. Our NEJD lessee is responsible for all operations and maintenance on that system and will bear and assume substantially all obligations and liabilities with respect to that system.
Customers
Our supply and logistics business encompasses numerous refiners and hundreds of producers, for which we provide transportation related services, as well as gather from and market to crude oil and refined products. During 2016, more than 10% of our consolidated revenues were generated from Shell.
Competition
In our crude oil supply and logistics operations, we compete with other midstream service providers and regional and local companies who may have significant market share in the respective areas in which they operate. Competition among common carrier pipelines is based primarily on posted tariffs, quality of customer service and proximity to refineries, production and connecting pipelines. We believe that high capital costs, tariff regulation and the cost of acquiring rights-of-way make it unlikely that other competing pipeline systems, comparable in size and scope to our onshore pipelines, will be built in the same geographic areas in the near future. In addition, as the majority of our onshore pipelines directly serve refineries we believe that these pipelines are not subject to the same competitive pressures as those tied directly to crude oil production. Additionally, the shipper on our Free State pipeline is required to use our Free State pipeline for any transportation of CO2 within a dedicated area.
In our refined products supply and logistics operations, we compete primarily with regional companies. See "Marine Transportation - Competition" for additional discussion of our competitors. Competitive factors in our supply and logistics business include price, relationships with customers, range and quality of services, knowledge of products and markets, availability of trade credit and capabilities of risk management systems.
Geographic Segments
All of our operations are in the U.S.. Additionally, we transport and sell NaHS to customers in South America and Canada. Revenues from customers in foreign countries totaled approximately $8 million, $12 million and $18 million in 2016, 2015 and 2014, respectively. These amounts exclude sales to certain customers where the title to certain NaHS shipments is transferred in the U.S. prior to the NaHS being transported to South America or Canada. The remainder of our revenues was generated from sales to customers in the U.S.
Credit Exposure
Due to the nature of our operations, a disproportionate percentage of our trade receivables constitute obligations of refiners, large oil producers and integrated oil companies. This energy industry concentration has the potential to affect our overall exposure to credit risk, either positively or negatively, in that our customers could be affected by similar changes in economic, industry or other conditions. However, we believe that the credit risk posed by this industry concentration is offset by the creditworthiness of our specific customer base in the context of our specific transactions as well as other factors,
19
including the strategic nature of certain of our assets and relationships and our credit procedures. Our portfolio of accounts receivable is generally comprised in large part of obligations of refiners, integrated and large independent oil and natural gas producers, and mining and other industrial companies that purchase NaHS, most of which have stable payment histories. The credit risk related to contracts that are traded on the NYMEX is limited due to the daily cash settlement procedures and other NYMEX requirements.
When we market crude oil, petroleum products and NaHS and provide transportation and other services, we must determine the amount, if any, of the line of credit we will extend to any given customer. We have established procedures to manage our credit exposure, including initial credit approvals, credit limits, collateral requirements and rights of offset. Letters of credit, prepayments and guarantees are also utilized to limit credit risk to ensure that our established credit criteria are met. We use similar procedures to manage our exposure to our customers in the offshore pipeline transportation and marine transportation segments.
As a result of our activities in the Gulf of Mexico and onshore, our largest customers include Shell, Exxon Mobil Corporation, BP PLC, Marathon Petroleum Corporation and Anadarko Petroleum Corporation.
Employees
To carry out our business activities, we employed approximately 1,200 employees at December 31, 2016. None of our employees are represented by labor unions, and we believe that relationships with our employees are good.
Regulation
Pipeline Rate and Access Regulation
The rates and the terms and conditions of service of our interstate common carrier pipeline operations are subject to regulation by FERC under the Interstate Commerce Act, or ICA. Under the ICA, rates must be “just and reasonable,” and must not be unduly discriminatory or confer any undue preference on any shipper. FERC regulations require that oil pipeline rates and terms and conditions of service for regulated pipelines be filed with FERC and posted publicly.
Effective January 1, 1995, FERC promulgated rules simplifying and streamlining the ratemaking process. Previously established rates were “grandfathered,” limiting the challenges that could be made to existing tariff rates. Increases from grandfathered rates of interstate oil pipelines are currently regulated by FERC primarily through an index methodology, whereby a pipeline is allowed to change its rates based on the year-to-year change in an index. Under FERC regulations, we are able to change our rates within prescribed ceiling levels that are tied to the Producer Price Index for Finished Goods. Rate increases made pursuant to the index will be subject to protest, but such protests must show that the rate increase resulting from application of the index is substantially in excess of the applicable pipeline’s increase in costs.
In addition to the index methodology, FERC allows for rate changes under three other methods—cost-of-service, competitive market showings and agreements between shippers and the oil pipeline company that the rate is acceptable, or Settlement Rates. The pipeline tariff rates on our Mississippi, Jay, Louisiana, and Wyoming Systems are either rates that are subject to change under the index methodology or Settlement Rates. None of our tariffs have been subjected to a protest or complaint by any shipper or other interested party.
Our offshore pipelines, with the exception of our Eugene Island pipeline, are neither interstate nor common carrier pipelines. However, these pipelines are subject to federal regulation under the Outer Continental Shelf Lands Act, which requires all pipelines operating on or across the outer continental shelf to provide nondiscriminatory transportation service.
Our intrastate common carrier pipeline operations in Texas are subject to regulation by the Railroad Commission of Texas. The applicable Texas statutes require that pipeline rates and practices be reasonable and non-discriminatory and that pipeline rates provide a fair return on the aggregate value of the property of a common carrier, after providing reasonable allowance for depreciation and other factors and for reasonable operating expenses. Although no assurance can be given that the tariffs we charge would ultimately be upheld if challenged, we believe that the tariffs now in effect can be sustained.
Our CO2 pipelines are subject to regulation by the state agencies in the states in which they are located.
Marine Regulations
Maritime Law. The operation of towboats, tugboats, barges, vessels and marine equipment create maritime obligations involving property, personnel and cargo and are subject to regulation by the U.S. Coast Guard, or USCG, the Environmental Protection Agency, or EPA, the Department of Homeland Security, or DHS, federal laws, state laws and certain international conventions under General Maritime Law. These obligations can create risks which are varied and include, among other things, the risk of collision and allision, which may precipitate claims for personal injury, cargo, contract, pollution, third-party claims and property damages to vessels and facilities. Routine towage operations can also create risk of personal injury under the Jones Act and General Maritime Law, cargo claims involving the quality of a product and delivery, terminal claims, contractual
20
claims and regulatory issues. Federal regulations also require that all tank barges engaged in the transportation of oil and petroleum in the U.S. be double hulled. All of our barges are double-hulled.
All of our barges are inspected by the USCG and carry certificates of inspection. All of our towboats and tugboats are certificated by the USCG. Most of our vessels are built to American Bureau of Shipping, or ABS, classification standards and in some instances are inspected periodically by ABS to maintain the vessels in class standards. The crews we employ aboard vessels, including captains, pilots, engineers, tankermen and ordinary seamen, are documented by the USCG.
We are required by various governmental agencies to obtain licenses, certificates and permits for our vessels depending upon such factors as the cargo transported, the waters in which the vessels operate and other factors. We are of the opinion that our vessels have obtained and can maintain all required licenses, certificates and permits required by such governmental agencies for the foreseeable future.
We believe that additional security and environmental related regulations may be imposed on the marine industry in the form of contingency planning requirements. Generally, we endorse the anticipated additional regulations and believe we are currently operating to standards at least equal to anticipated additional regulations.
Jones Act: The Jones Act is a federal law that restricts maritime transportation between locations in the U.S. to vessels built and registered in the U.S. and owned and manned by U.S. citizens. We are responsible for monitoring the ownership of our subsidiary that engages in maritime transportation and for taking any remedial action necessary to insure that no violation of the Jones Act ownership restrictions occurs. Jones Act requirements significantly increase operating costs of U.S.-flag vessel operations compared to foreign-flag vessel operations. Further, the USCG and ABS maintain the most stringent regime of vessel inspection in the world, which tends to result in higher regulatory compliance costs for U.S.-flag operators than for owners of vessels registered under foreign flags or flags of convenience. The Jones Act and General Maritime Law also provide damage remedies for crew members injured in the service of the vessel arising from employer negligence or vessel unseaworthiness.
Merchant Marine Act of 1936: The Merchant Marine Act of 1936 is a federal law providing that, upon proclamation by the president of the U.S. of a national emergency or a threat to the national security, the U.S. Secretary of Transportation may requisition or purchase any vessel or other watercraft owned by U.S. citizens (including us, provided that we are considered a U.S. citizen for this purpose). If one of our tow boats or barges were purchased or requisitioned by the U.S. government under this law, we would be entitled to be paid the fair market value of the vessel in the case of a purchase or, in the case of a requisition, the fair market value of charter hire. However, if one of our tow boats is requisitioned or purchased and its associated barge or barges are left idle, we would not be entitled to receive any compensation for the lost revenues resulting from the idled barges. We also would not be entitled to be compensated for any consequential damages we suffer as a result of the requisition or purchase of any of our tow boats or barges.
Security Requirements: The Maritime Transportation Security Act of 2002 requires, among other things, submission to and approval by the USCG of vessel and waterfront facility security plans, or VSP. Our VSP’s have been approved and we are operating in compliance with the plans for all of its vessels and that are subject to the requirements, whether engaged in domestic or foreign trade.
Railcar Regulation
We operate a number of railcar loading and unloading facilities and lease a significant number of railcars. Our railcar operations are subject to the regulatory jurisdiction of the Federal Railroad Administration of the DOT, the Occupational Safety and Health Administration, or OSHA, as well as other federal and state regulatory agencies. We believe that our railcar operations are in substantial compliance with all existing federal, state and local regulations.
DOT and OSHA have jurisdiction under several federal statutes over a number of safety and health aspects of rail operations, including the transportation of hazardous materials. State agencies regulate some aspects of rail operations with respect to health and safety in areas not otherwise preempted by federal law.
Environmental Regulations
General
We are subject to stringent federal, state and local laws and regulations governing the discharge of materials into the environment or otherwise relating to environmental protection. These laws and regulations may (i) require the acquisition of and compliance with permits for regulated activities, (ii) limit or prohibit operations on environmentally sensitive lands such as wetlands or wilderness areas or areas inhabited by endangered or threatened species, (iii) result in capital expenditures to limit or prevent emissions or discharges, and (iv) place burdensome restrictions on our operations, including the management and disposal of wastes. Failure to comply with these laws and regulations may result in the assessment of administrative, civil and criminal penalties, including the assessment of monetary penalties, the imposition of investigatory and remedial obligations, the suspension or revocation of necessary permits, licenses and authorizations, the requirement that additional pollution controls be
21
installed and the issuance of orders enjoining future operations or imposing additional compliance requirements. Changes in environmental laws and regulations occur frequently, typically increasing in stringency through time, and any changes that result in more stringent and costly operating restrictions, emission control, waste handling, disposal, cleanup and other environmental requirements have the potential to have a material adverse effect on our operations. While we believe that we are in substantial compliance with current environmental laws and regulations and that continued compliance with existing requirements would not materially affect us, there is no assurance that this trend will continue in the future. Revised or new additional regulations that result in increased compliance costs or additional operating restrictions, particularly if those costs are not fully recoverable from our customers, could have a material adverse effect on our business, financial position, results of operations and cash flows.
Hazardous Substances and Waste Handling
The Comprehensive Environmental Response, Compensation, and Liability Act, as amended, or CERCLA, also known as the “Superfund” law, and analogous state laws impose liability, without regard to fault or the legality of the original conduct, on certain classes of persons. These persons include current owners and operators of the site where a release of hazardous substances occurred, prior owners or operators that owned or operated the site at the time of the release of hazardous substances, and companies that disposed or arranged for the disposal of the hazardous substances found at the site. We currently own or lease, and have in the past owned or leased, properties that have been in use for many years with the gathering and transportation of hydrocarbons including crude oil and other activities that could cause an environmental impact. Persons deemed “responsible persons” under CERCLA may be subject to strict and joint and several liability for the costs of removing or remediating previously disposed wastes (including wastes disposed of or released by prior owners or operators) or property contamination (including groundwater contamination), for damages to natural resources, and for the costs of certain health studies. CERCLA also authorizes the EPA and, in some instances, third parties to act in response to threats to the public health or the environment and to seek to recover the costs they incur from the responsible classes of persons. It is not uncommon for neighboring landowners and other third parties to file claims for personal injury and property damage allegedly caused by hazardous substances or other pollutants released into the environment.
We also may incur liability under the Resource Conservation and Recovery Act, as amended, or RCRA, and analogous state laws which impose requirements and also liability relating to the management and disposal of solid and hazardous wastes. While RCRA regulates both solid and hazardous wastes, it imposes strict requirements on the generation, storage, treatment, transportation and disposal of hazardous wastes. Certain petroleum production wastes are excluded from RCRA’s hazardous waste regulations. However, it is possible that these wastes, which could include wastes currently generated during our operations, will in the future be designated as “hazardous wastes” and, therefore, be subject to more rigorous and costly disposal requirements. Indeed, legislation has been proposed from time to time in Congress to re-categorize certain crude oil and natural gas exploration and production wastes as “hazardous wastes.” Also, in December 2016, the EPA agreed in a consent decree to review its regulation of oil and gas waste. It has until March 2019 to determine whether any revisions are necessary. Any such changes in the laws and regulations could have a material adverse effect on our capital expenditures and operating expenses.
We believe that we are in substantial compliance with the requirements of CERCLA, RCRA and related state and local laws and regulations, and that we hold all necessary and up-to-date permits, registrations and other authorizations required under such laws and regulations. Although we believe that the current costs of managing our wastes as they are presently classified are reflected in our budget, any legislative or regulatory reclassification of oil and natural gas exploration and production wastes could increase our costs to manage and dispose of such wastes.
Water Discharges
The Federal Water Pollution Control Act, as amended, also known as the “Clean Water Act,” and analogous state laws impose restrictions and strict controls regarding the unauthorized discharge of pollutants, including crude oil, into navigable waters of the U.S., as well as state waters. Permits must be obtained to discharge pollutants into these waters. In addition, the Clean Water Act and analogous state laws require individual permits or coverage under general permits for discharges of storm water runoff from certain types of facilities. These permits may require us to monitor and sample the storm water runoff from certain of our facilities. Some states also maintain groundwater protection programs that require permits for discharges or operations that may impact groundwater conditions. The Oil Pollution Act, or the OPA, is the primary federal law for oil spill liability. The OPA contains numerous requirements relating to the prevention of and response to oil spills into waters of the U.S., including the requirement that operators of offshore facilities and certain onshore facilities near or crossing waterways must maintain certain significant levels of financial assurance to cover potential environmental cleanup and restoration costs. Under the OPA, strict, joint and several liability may be imposed on “responsible parties” for all containment and cleanup costs and certain other damages arising from a release, including, but not limited to, the costs of responding to a release of oil to surface waters and natural resource damages, resulting from oil spills into or upon navigable waters, adjoining shorelines or in the exclusive economic zone of the U.S.. A “responsible party” includes the owner or operator of an onshore facility.
22
Noncompliance with the Clean Water Act or the OPA may result in substantial civil and criminal penalties. We believe we are in material compliance with each of these requirements.
Air Emissions
The Federal Clean Air Act, or CAA, as amended, and analogous state and local laws and regulations restrict the emission of air pollutants, and impose permit requirements and other obligations. Regulated emissions occur as a result of our operations, including the handling or storage of crude oil and other petroleum products. Both federal and state laws impose substantial penalties for violation of these applicable requirements. Accordingly, our failure to comply with these requirements could subject us to monetary penalties, injunctions, conditions or restrictions on operations, revocation or suspension of necessary permits and, potentially, criminal enforcement actions.
NEPA
Under the National Environmental Policy Act, or NEPA, a federal agency, commonly in conjunction with a current permittee or applicant, may be required to prepare an environmental assessment or a detailed environmental impact statement before taking any major action, including issuing a permit for a pipeline extension or addition that would affect the quality of the environment. Should an environmental impact statement or environmental assessment be required for any proposed pipeline extensions or additions, NEPA may prevent or delay construction or alter the proposed location, design or method of construction.
Climate Change
In December 2009, the EPA published its findings that emissions of carbon dioxide, methane and other greenhouse gases ("GHGs") present an endangerment to human health and the environment because emissions of such gases are, according to the EPA, contributing to the warming of the earth’s atmosphere and other climatic changes. These findings served as a statutory prerequisite for EPA to adopt and implement regulations that would restrict emissions of GHGs under existing provisions of the CAA. The EPA also adopted two sets of related rules, one of which purports to regulate emissions of GHGs from motor vehicles and the other of which regulates emissions of GHGs from certain large stationary sources of emissions such as power plants or industrial facilities. The EPA finalized the motor vehicle rule in April 2010 and it became effective in July 2010. The EPA adopted the stationary source rule, also known as the "Tailoring Rule," in May 2010, and it became effective in January 2011. The tailoring rule established new GHG emissions thresholds that determine when stationary sources must obtain permits under the PSD and Title V programs of the Clean Air Act. On June 23, 2014, in Utility Air Regulatory Group v. EPA (“UARG v. EPA”), the Supreme Court held that stationary sources could not become subject to PSD or Title V permitting solely by reason of their GHG emissions. The Court ruled, however, that the EPA may require installation of best available control technology for GHG emissions at sources otherwise subject to the PSD and Title V programs. On December 19, 2014, EPA issued two memoranda providing initial guidance on GHG permitting requirements in response to the Court’s decision in UARG v. EPA. In its preliminary guidance, EPA indicated it would promulgate a rule to rescind any PSD permits issued under the portions of the Tailoring Rule that were vacated by the Court. In the interim, EPA issued a narrowly crafted “no action assurance” indicating it will exercise its enforcement discretion not to pursue enforcement of the terms and conditions relating to GHGs in an EPA-issued PSD permit, and for related terms and conditions in a Title V permit. On April 30, 2015, the EPA issued a final rule allowing permitting authorities to rescind PSD permits issued under the invalid regulations.
Additionally, in September 2009, the EPA issued a final rule requiring the reporting of GHG emissions from specified large GHG emission sources in the U.S., beginning in 2011 for emissions occurring in 2010. Further, in November 2010, the EPA expanded its existing GHG reporting rule to include onshore and offshore crude oil and natural gas production and onshore processing, transmission, storage and distribution facilities, which may include certain of our facilities, beginning in 2012 for emissions occurring in 2011. In October 2015, the EPA amended the GHG reporting rule to add the reporting of GHG emissions from gathering and boosting systems, completions and workovers of crude oil wells using hydraulic fracturing, and blowdowns of natural gas transmission pipelines. As a result of this continued regulatory focus, future GHG regulations of the crude oil and natural gas industry remain a possibility. The EPA has continued to adopt GHG regulations of other industries, such as its August 2015 adoption of three separate, but related, actions to address carbon dioxide pollution from power plants, including final Carbon Pollution Standards for new, modified and reconstructed power plants, a final Clean Power Plan to cut carbon dioxide pollution from existing power plants, and a proposed federal plan to implement the Clean Power Plan emission guidelines. Upon publication of the Clean Power Plan on October 23, 2015, more than two dozen States as well as industry and labor groups challenged the Clean Power Plan in the D.C. Circuit Court of Appeals.
Further, the U.S. Congress has considered various proposals to reduce GHG emissions that may impose a carbon emissions tax, a cap-and-trade program or other programs aimed at carbon reduction, and almost half of the states, either individually or through multi-state regional initiatives, have already taken legal measures to reduce GHG emissions, primarily through the planned development of GHG emission inventories and/or GHG cap-and-trade programs. The net effect of this legislation is to impose increasing costs on the combustion of carbon-based fuels such as crude oil, refined petroleum products
23
and natural gas. Our compliance with any future legislation or regulation of GHGs, if it occurs, may result in materially increased compliance and operating costs.
In addition, in December 2015, the United States joined the international community at the 21st Conference of the Parties (COP-21) of the United Nations Framework Convention on Climate Change in Paris, France. The resulting Paris Agreement calls for the parties to undertake “ambitious efforts” to limit the average global temperature, and to conserve and enhance sinks and reservoirs of GHGs. The Agreement, if ratified, establishes a framework for the parties to cooperate and report actions to reduce GHG emissions.
The effect on our operations of CAA regulations, legislative efforts or related implementation regulations that regulate or restrict emissions of GHGs in areas that we conduct business could adversely affect the demand for the products that we transport, store and distribute and, depending on the particular program adopted, could increase our costs to operate and maintain our facilities by requiring that we, among other things, measure and report our emissions, install new emission controls on our facilities, acquire allowances to authorize our GHG emissions, pay any taxes related to our GHG emissions and administer and manage a GHG emissions program. We may be unable to include some or all of such increased costs in the rates charged by our pipelines or other facilities, and any such recovery may depend on events beyond our control, including the outcome of future rate proceedings before the FERC or state regulatory agencies and the provisions of any final legislation or implementing regulations. Any GHG emissions legislation or regulatory programs applicable to power plants or refineries could also increase the cost of consuming, and thereby adversely affect demand for the crude oil and natural gas that we produce. Consequently, legislation and regulatory programs to reduce GHG emissions could have an adverse effect on our business, financial condition and results of operations. It is not possible at this time to predict with any accuracy the structure or outcome of any future legislative or regulatory efforts to address such emissions or the eventual costs to us of compliance.
Furthermore, claims have been made against certain energy companies alleging that GHG emissions from crude oil and natural gas operations constitute a public nuisance under federal and/or state common law. As a result, private individuals may seek to enforce environmental laws and regulations against us and could allege personal injury or property damages. While our business is not a party to any such litigation, we could be named in actions making similar allegations. An unfavorable ruling in any such case could adversely impact our business, financial condition and results of operations.
Safety and Security Regulations
Our crude oil and CO2 pipelines are subject to construction, installation, operation and safety regulation by the U.S. Department of Transportation, or DOT, and various other federal, state and local agencies. Congress has enacted several pipeline safety acts over the years. Currently, the Pipeline and Hazardous Materials Safety Administration under DOT administers pipeline safety requirements for natural gas and hazardous liquid pipelines pursuant to detailed regulations set forth in 49 C.F.R. Parts 190 to 195. These regulations, among other things, address pipeline integrity management and pipeline operator qualification rules. Significant expenses could be incurred in the future if additional safety measures are required or if safety standards are raised and exceed the current pipeline control system capabilities.
We are subject to the DOT Integrity Management, or IM, regulations, which require that we perform baseline assessments of all pipelines that could affect a High Consequence Area, or HCA, including certain populated areas and environmentally sensitive areas. After completing a baseline assessment, we continue to assess all pipelines at specified intervals and periodically evaluate the integrity of each pipeline segment that could affect a HCA. The integrity of these pipelines must be assessed by internal inspection, pressure test, or equivalent alternative new technology.
The IM regulations required us to prepare an Integrity Management Plan, or IMP, that details the risk assessment factors, the overall risk rating for each segment of pipe, a schedule for completing the integrity assessment, the methods to assess pipeline integrity, and an explanation of the assessment methods selected. The regulations also require periodic review of HCA pipeline segments to ensure that adequate preventative and mitigative measures exist and that companies take prompt action to address pipeline integrity issues. No assurance can be given that the cost of testing and the required rehabilitation identified will not be material costs to us that may not be fully recoverable by tariff increases.
We have developed a Risk Management Plan required by the EPA as part of our IMP. This plan is intended to minimize the offsite consequences of catastrophic spills. As part of this program, we have developed a mapping program. This mapping program identified HCAs and unusually sensitive areas along the pipeline right-of-ways in addition to mapping of shorelines to characterize the potential impact of a spill of crude oil on waterways.
Our crude oil, refined products and refinery services operations are also subject to the requirements of OSHA and comparable state statutes. Various other federal and state regulations require that we train all operations employees in Hazardous Communication ("HAZCOM") and disclose information about the hazardous materials used in our operations. Certain information must be reported to employees, government agencies and local citizens upon request.
States are responsible for enforcing the federal regulations and more stringent state pipeline regulations and inspection with respect to hazardous liquids pipelines, including crude oil, natural gas and CO2 pipelines. In practice, states vary
24
considerably in their authority and capacity to address pipeline safety. We do not anticipate any significant problems in complying with applicable state laws and regulations in those states in which we operate.
Our trucking operations are licensed to perform both intrastate and interstate motor carrier services. As a motor carrier, we are subject to certain safety regulations issued by the DOT. The trucking regulations cover, among other things, driver operations, log book maintenance, truck manifest preparations, safety placard placement on the trucks and trailer vehicles, drug and alcohol testing, operation and equipment safety and many other aspects of truck operations. We are also subject to OSHA with respect to our trucking operations.
The USCG regulates occupational health standards related to our marine operations. Shore-side operations are subject to the regulations of OSHA and comparable state statutes. The Maritime Transportation Security Act requires, among other things, submission to and approval of the USCG of vessel security plans.
Since the terrorist attacks of September 11, 2001, the U.S. Government has issued numerous warnings that energy assets could be the subject of future terrorist attacks. We have instituted security measures and procedures in conformity with federal guidance. We will institute, as appropriate, additional security measures or procedures indicated by the federal government. None of these measures or procedures should be construed as a guarantee that our assets are protected in the event of a terrorist attack.
Available Information
The public may read and copy any materials that we file with the SEC at the SEC’s Public Reference Room at 100 F Street, N.E., Washington, DC 20549. The public may obtain information on the operation of the Public Reference Room by calling the SEC at 1-800-SEC-0330. We make available free of charge on our internet website (www.genesisenergy.com) our annual report on Form 10-K, quarterly reports on Form 10-Q, current reports on Form 8-K and amendments to those reports filed or furnished pursuant to Section 13(a) or 15(d) of the Securities Exchange Act of 1934 as soon as reasonably practicable after we electronically file the material with, or furnish it to, the SEC. These documents are also available at the SEC’s website (www.sec.gov). Additionally, on our internet website we make available our Corporate Governance Guidelines, Code of Business Conduct and Ethics, Audit Committee Charter and Governance, Compensation and Business Development Committee Charter. Information on our website is not incorporated into this Form 10-K or our other securities filings and is not a part of this Form 10-K or our other securities filings.
Item 1A. Risk Factors
Risks Related to Our Business
Our indebtedness could adversely restrict our ability to operate, affect our financial condition, and prevent us from complying with our requirements under our debt instruments and could prevent us from paying cash distributions to our unitholders.
We have outstanding debt and the ability to incur more debt. As of December 31, 2016, we had approximately $1.3 billion outstanding of senior secured indebtedness and an additional $1.8 billion of senior unsecured indebtedness. We must comply with various affirmative and negative covenants contained in our credit agreement and the indentures governing our notes, some of which may restrict the way in which we would like to conduct our business. Among other things, these covenants limit or will limit our ability to:
• | incur additional indebtedness or liens; |
• | make payments in respect of or redeem or acquire any debt or equity issued by us; |
• | sell assets; |
• | make loans or investments; |
• | make guarantees; |
• | enter into any hedging agreement for speculative purposes; |
• | acquire or be acquired by other companies; and |
• | amend some of our contracts. |
The restrictions under our indebtedness may prevent us from engaging in certain transactions which might otherwise be considered beneficial to us and could have other important consequences to unitholders. For example, they could:
• | increase our vulnerability to general adverse economic and industry conditions; |
• | limit our ability to make distributions; to fund future working capital, capital expenditures and other general partnership requirements; to engage in future acquisitions, construction or development activities; access capital markets (debt and equity); or to otherwise fully realize the value of our assets and opportunities because of the need to |
25
dedicate a substantial portion of our cash flows from operations to payments on our indebtedness or to comply with any restrictive terms of our indebtedness;
• | limit our flexibility in planning for, or reacting to, changes in our businesses and the industries in which we operate; and |
• | place us at a competitive disadvantage as compared to our competitors that have less debt. |
We may incur additional indebtedness (public or private) in the future under our existing credit agreement, by issuing debt instruments, under new credit agreements, under joint venture credit agreements, under capital leases or synthetic leases, on a project-finance or other basis or a combination of any of these. If we incur additional indebtedness in the future, it likely would be under our existing credit agreement or under arrangements that may have terms and conditions at least as restrictive as those contained in our existing credit agreement and the indentures governing our existing notes. Failure to comply with the terms and conditions of any existing or future indebtedness would constitute an event of default. If an event of default occurs, the lenders or noteholders will have the right to accelerate the maturity of such indebtedness and foreclose upon the collateral, if any, securing that indebtedness. In addition, if there is a change of control as described in our credit facility, that would be an event of default, unless our creditors agreed otherwise, and, under our credit facility, any such event could limit our ability to fulfill our obligations under our debt instruments and to make cash distributions to unitholders which could adversely affect the market price of our securities.
In addition, from time to time, some of our joint ventures may have substantial indebtedness, which will include affirmative and negative covenants and other provisions that limit their freedom to conduct certain operations, events of default, prepayment and other customary terms.
We may not be able to access adequate capital (debt and/or equity) on economically viable terms or any terms.
The capital markets (debt and equity) have previously been from time to time disrupted and volatile as a result of adverse conditions, including recessionary pressures, bubble-affects and precipitous commodity price declines. These circumstances and events, which can last for extended periods of time, have led to reduced capital availability, tighter lending standards and higher interest rates on loans for companies in the energy industry, especially non-investment grade companies. Although we cannot predict the future condition of the capital markets, future turmoil in capital markets and the related higher cost of capital could have a material adverse effect on our business, liquidity, financial condition and cash flows, particularly if our ability to borrow money from lenders or access the capital markets to finance our operations were to be impaired for long.
If we are unable to access the amounts and types of capital we seek at a cost and/or on terms that have been available to us historically, we could be materially and adversely affected. Such an inability to access capital could limit or prohibit our ability to execute significant portions of our business plan, such as executing our growth strategy, refinancing our debt and/or optimizing our capital structure.
We may not be able to fully execute our growth strategy due to various factors, such as unreceptive capital markets and/or excessive competition for acquisitions.
Our strategy contemplates substantial growth through the development and acquisition of a wide range of midstream and other energy infrastructure assets while maintaining a strong balance sheet. This strategy includes constructing and acquiring additional assets and businesses to enhance our ability to compete effectively, diversify our asset portfolio and, thereby, provide more stable cash flow. We regularly consider and enter into discussions regarding, and are currently contemplating, additional potential joint ventures, stand-alone projects and other transactions that we believe will present opportunities to realize synergies, expand our role in the energy infrastructure business, and increase our market position and, ultimately, increase distributions to unitholders. A number of factors could adversely affect our ability to execute our growth strategy, including an inability to raise adequate capital on acceptable terms, competition from competitors and/or an inability to successfully integrate one or more acquired businesses into our operations.
We will need new capital to finance the future development and acquisition of assets and businesses. Limitations on our access to capital will impair our ability to execute this strategy. Expensive capital will limit our ability to develop or acquire accretive assets. Although we intend to continue to expand our business, this strategy may require substantial capital, and we may not be able to raise the necessary funds on satisfactory terms, if at all.
In addition, we experience competition for the assets we purchase or contemplate purchasing. Increased competition for a limited pool of assets could result in our not being the successful bidder more often or our acquiring assets at a higher relative price than that which we have paid historically. Either occurrence would limit our ability to fully execute our growth strategy. Our ability to execute our growth strategy may impact the market price of our securities.
We may be unable to integrate successfully businesses we acquire. We may incur substantial expenses, delays or other problems in connection with our growth strategy that could negatively impact our results of operations. Moreover, acquisitions and business expansions involve numerous risks, including:
26
• | difficulties in the assimilation of the operations, technologies, services and products of the acquired companies or business segments; |
• | inefficiencies and complexities that can arise because of unfamiliarity with new assets and the businesses associated with them, including unfamiliarity with their markets; and |
• | diversion of the attention of management and other personnel from day-to-day business to the development or acquisition of new businesses and other business opportunities. |
Our actual construction, development and acquisition costs could exceed our forecast, and our cash flow from construction and development projects may not be immediate.
Our forecast contemplates significant expenditures for the development, construction or other acquisition of energy infrastructure assets, including some construction and development projects with technological challenges. We (or our joint ventures) may not be able to complete our projects at the costs currently estimated. If we (or our joint ventures) experience material cost overruns, we will have to finance these overruns using one or more of the following methods:
• | using cash from operations; |
• | delaying other planned projects; |
• | incurring additional indebtedness; or |
• | issuing additional debt or equity. |
Any or all of these methods may not be available when needed or may adversely affect our future results of operations.
In addition, some construction projects require substantial investments over a long period of time before they begin generating any meaningful cash flow.
Fluctuations in interest rates could adversely affect our business.
We have exposure to movements in interest rates. The interest rates on our credit facility ($1.3 billion outstanding at December 31, 2016) are variable. Our results of operations and our cash flow, as well as our access to future capital and our ability to fund our growth strategy, could be adversely affected by significant increases in interest rates.
An increase in interest rates may also cause a corresponding decline in demand for equity investments, in general, and in particular, for yield-based equity investments such as our common units. Any such reduction in demand for our common units resulting from other more attractive investment opportunities may cause the trading price of our common units to decline.
We may not have sufficient cash from operations to pay the current level of quarterly distribution following the establishment of cash reserves and payment of fees and expenses.
The amount of cash we distribute on our units principally depends upon margins we generate from our businesses, which fluctuate from quarter to quarter based on, among other things:
• | the volumes and prices at which we purchase and sell crude oil, natural gas, refined products, and caustic soda; |
• | the volumes of sodium hydrosulfide, or NaHS, that we receive for our refinery services and the prices at which we sell NaHS; |
• | the demand for our services; |
• | the level of competition; |
• | the level of our operating costs; |
• | the effect of worldwide energy conservation measures; |
• | governmental regulations and taxes; |
• | the level of our general and administrative costs; and |
• | prevailing economic conditions. |
In addition, the actual amount of cash we will have available for distribution will depend on other factors that include:
• | the level of capital expenditures we make, including the cost of acquisitions (if any); |
• | our debt service requirements; |
• | fluctuations in our working capital; |
• | restrictions on distributions contained in our debt instruments; |
• | our ability to borrow under our working capital facility to pay distributions; and |
• | the amount of cash reserves required in the conduct of our business. |
27
Our ability to pay distributions each quarter depends primarily on our cash flow, including cash flow from financial reserves and working capital borrowings, and our cash requirements, so it is not solely a function of profitability, which will be affected by non-cash items. As a result, we may make cash distributions during periods when we record losses and we may not make distributions during periods when we record net income.
Our profitability and cash flow are dependent on our ability to increase or, at a minimum, maintain our current commodity-crude oil, natural gas, refined products, NaHS and caustic soda-volumes, which often depend on actions and commitments by parties beyond our control.
Our profitability and cash flow are dependent on our ability to increase or, at a minimum, maintain our current commodity-crude oil, natural gas, refined products, NaHS, and caustic soda-volumes. We access commodity volumes through various sources, such as producers, service providers (including gatherers, shippers, marketers and other aggregators) and refiners. Depending on the needs of each customer and the market in which it operates, we can either provide a service for a fee (as in the case of our pipeline, marine vessel and railcar transportation operations) or we can acquire the commodity from our customer and resell it to another party.
Our source of volumes depends on successful exploration and development of additional crude oil and natural gas reserves by others; continued demand for refining and our related sulfur removal and other services, for which we are paid in NaHS; the breadth and depth of our logistics operations; the extent that third parties provide NaHS for resale; and other matters beyond our control.
The crude oil, natural gas and refined products available to us and our refinery customers are derived from reserves produced from existing wells, and these reserves naturally decline over time. In order to offset this natural decline, our energy infrastructure assets must access additional reserves. Additionally, some of the projects we have planned or recently completed are dependent on reserves that we expect to be produced from newly discovered properties that producers are currently developing.
Finding and developing new reserves is very expensive, requiring large capital expenditures by producers for exploration and development drilling, installing production facilities and constructing pipeline extensions to reach new wells. Many economic and business factors out of our control can adversely affect the decision by any producer to explore for and develop new reserves. These factors include the prevailing market price of the commodity, the capital budgets of producers, the depletion rate of existing reservoirs, the success of new wells drilled, environmental concerns, regulatory initiatives, cost and availability of equipment, capital budget limitations or the lack of available capital and other matters beyond our control. Additional reserves, if discovered, may not be developed in the near future or at all. The precipitous decline in crude oil and natural gas prices beginning in late 2014 and continuing into 2016 has forced most producers to significantly curtail their planned capital expenditures. Thus, crude oil and natural gas production in our market areas could decline, which could have a material negative impact on our revenues and prospects.
Demand for our services is dependent on the demand for crude oil and natural gas. Any decrease in demand for crude oil or natural gas, including by those refineries or connecting carriers to which we deliver could adversely affect our cash flows. The demand for crude oil also is dependent on the competition from refineries, the impact of future economic conditions, fuel conservation measures, alternative fuel requirements or sources fuel sources such as electricity, coal, fuel oils or nuclear energy, government regulation or technological advances in fuel economy and energy generation devices, all of which could reduce demand for our services. A reduction in demand for our services in the markets we serve could result in impairments of our assets and have a material adverse effect on our business, financial condition and results of operations.
Our ability to access NaHS depends primarily on the demand for our proprietary sulfur removal process. Demand for our services could be adversely affected by many factors, including lower refinery utilization rates, U.S. refineries accessing more “sweet” (instead of "sour") crude, and the development of alternative sulfur removal processes that might be more economically beneficial to refiners.
We are dependent on third parties for NaOH for use in our sulfur removal process as well as volume to market to third parties. Should regulatory requirements or operational difficulties disrupt the manufacture of caustic soda by these producers, we could be affected.
Our sulfur removal operations are dependent upon the supply of caustic soda, the demand for NaHS, and the continuing operations of the refiners for whom we process sour natural gas.
Caustic soda is a major component of the proprietary sulfur removal process we provide to our refinery customers. Because we are a large consumer of caustic soda, we can leverage our economies of scale and logistics capabilities to effectively market caustic soda to third parties. NaHS, the resulting by-product from our sulfur removal operations, is a vital ingredient in a number of industrial and consumer products and processes. Any decrease in the supply of caustic soda could affect our ability to provide sulfur removal services to refiners and any decrease in the demand for NaHS by the parties to whom we sell the NaHS could adversely affect our business. Refineries’ need for our sulfur removal services is also dependent
28
on refining competition from other refineries by refiners to process more “sweet” (instead of sour) crude, the impact of future economic conditions, fuel conservation measures, alternative fuel requirements, government regulation or technological advances in fuel economy and energy generation devices, all of which could reduce demand for our services.
Our crude oil and natural gas transportation operations are dependent upon demand for crude oil by refiners, primarily in the Midwest and Gulf Coast, and the demand for natural gas.
Any decrease in this demand for crude oil by those refineries or connecting carriers to which, or for the natural gas, we deliver could adversely affect our cash flows. Those refineries’ demand for crude oil also is dependent on the competition from other refineries, the impact of future economic conditions, fuel conservation measures, alternative fuel requirements, government regulation or technological advances in fuel economy and energy generation devices, all of which could reduce demand for our services. The demand for natural gas is dependent on the impact of future economic conditions, fuel conservation measures, alternative fuel requirements and alternative fuel sources such as electricity, coal, fuel oils or nuclear energy, government regulation or technological advances in fuel economy and energy generation devices, all of which could reduce demand for our services.
We face intense competition to obtain crude oil, natural gas and refined products volumes.
Our competitors-gatherers, transporters, marketers, brokers and other aggregators-include integrated, large and small independent energy companies, as well as their marketing affiliates, who vary widely in size, financial resources and experience. Some of these competitors have capital resources many times greater than ours and control substantially greater supplies of crude oil, natural gas and refined products.
Even if reserves exist or refined products are produced in the areas accessed by our facilities, we may not be chosen by the refiners or producers to gather, refine, market, transport, store or otherwise handle any of these crude oil and natural gas reserves, NaHS, caustic soda or other refined products. We compete with others for any such volumes on the basis of many factors, including:
• | geographic proximity to the production and/or refineries; |
• | costs of connection; |
• | available capacity; |
• | rates; |
• | logistical efficiency in all of our operations; |
• | operational efficiency in our sulfur removal business; |
• | customer relationships; and |
• | access to markets. |
Additionally, on our onshore pipelines most of our third-party shippers do not have long-term contractual commitments to ship crude oil on our pipelines. A decision by a shipper to substantially reduce or cease to ship volumes of crude oil on our pipelines could cause a significant decline in our revenues. In Mississippi, we are dependent on interconnections with other pipelines to provide shippers with a market for their crude oil, and in Texas, we are dependent on interconnections with other pipelines to provide shippers with transportation to our pipeline. Any reduction of throughput available to our shippers on these interconnecting pipelines as a result of testing, pipeline repair, reduced operating pressures or other causes could result in reduced throughput on our pipelines that would adversely affect our cash flows and results of operations.
Fluctuations in demand for crude oil or natural gas or availability of refined products or NaHS, such as those caused by refinery downtime or shutdowns, can negatively affect our operating results. Reduced demand in areas we service with our pipelines, marine vessels, rail facilities and trucks can result in less demand for our transportation services.
Many of our crude oil and natural gas transportation customers are producers who’s drilling activity levels and spending for transportation have been, and may continue to be, impacted by the current deterioration in the commodity markets.
Many of our customers finance their drilling activities through cash flow from operations, the incurrence of debt or the issuance of equity. New credit facilities and other debt financing from institutional sources have generally become more difficult and expensive to obtain, and there may be a general reduction in the amount of credit available in the markets in which we conduct business. Additionally, many of our customers’ equity values have substantially declined. Adverse price changes put downward pressure on drilling budgets for crude oil and natural gas producers, which have resulted, and could continue to result, in lower volumes than we otherwise would have seen being transported on our pipeline and transportation systems, which could have a material negative impact on our revenues and prospects. For example, prices for crude oil and natural gas declined precipitously since late 2014 and have remained depressed in 2016 (which could continue further into 2017). As a
29
result, the onshore crude oil rig count in the U.S. has declined from 1,499 rigs at December 31, 2014 to 525 rigs at December 31, 2016.
Fluctuations in prices for crude oil, refined petroleum products, NaHS and caustic soda could adversely affect our business.
Because we purchase (or otherwise acquire) and sell crude oil, refined petroleum products, NaHS and caustic soda we are exposed to some direct commodity price risks. Prices for those commodities can fluctuate in response to changes in supply, market uncertainty and a variety of additional factors that are beyond our control, which could have an adverse effect on our cash flows, profit and/or Segment Margin. We attempt to limit those commodity price risks through back-to-back purchases and sales, hedges and other contractual arrangements; however, we cannot completely eliminate our commodity price risk exposure.
Our use of derivative financial instruments could result in financial losses.
We use derivative financial instruments and other hedging mechanisms from time to time to limit a portion of the effects resulting from changes in commodity prices. To the extent we hedge our commodity price exposure, we forego the benefits we would otherwise experience if commodity prices were to increase. In addition, we could experience losses resulting from our hedging and other derivative positions. Such losses could occur under various circumstances, including if our counterparty does not perform its obligations under the hedge arrangement, our hedge is imperfect, or our hedging policies and procedures are not followed.
Non-utilization of certain assets, such as our leased railcars, could significantly reduce our profitability due to the fixed costs incurred with respect to such assets.
From time to time in connection with our business, we may lease or otherwise secure the right to use certain third party assets (such as railcars, trucks, barges, pipeline capacity, storage capacity and other similar assets) with the expectation that the revenues we generate through the use of such assets will be greater than the fixed costs we incur pursuant to the applicable leases or other arrangements. However, when such assets are not utilized or are under-utilized, our profitability is negatively affected because the revenues we earn are either non-existent or reduced (in the event of under-utilization), but we remain obligated to continue paying any applicable fixed charges, in addition to incurring any other costs attributable to the non-utilization of such assets. For example, in connection with our rail operations, we lease all of our railcars that obligate us to pay the applicable lease rate without regard to utilization. If business conditions are such that we do not utilize a portion of our leased assets for any period of time, we will still be obligated to pay the applicable fixed lease rate. In addition, during the period of time that we are not utilizing such assets, we will incur incremental costs associated with the cost of storing such assets, and we will continue to incur costs for maintenance and upkeep. Our failure to utilize a significant portion of our leased assets and other similar assets could have a significant negative impact on our profitability and cash flows.
In addition, certain of our field and pipeline operating costs and expenses are fixed and do not vary with the volumes we gather and transport. These costs and expenses may not decrease ratably or at all should we experience a reduction in our volumes transported by truck, marine vessel or rail or transported by our pipelines. As a result, we may experience declines in our margin and profitability if our volumes decrease.
We cannot cause our joint ventures to take or not to take certain actions unless some or all of the joint venture participants agree.
Due to the nature of joint ventures, each participant (including us) in our material joint ventures has made substantial investments (including contributions and other commitments) in that joint venture and, accordingly, has required that the relevant charter documents contain certain features designed to provide each participant with the opportunity to participate in the management of the joint venture and to protect its investment in that joint venture, as well as any other assets which may be substantially dependent on or otherwise affected by the activities of that joint venture. These participation and protective features include a corporate governance structure that consists of a management committee composed of members, only some of which are appointed by us. In addition, many of our joint ventures are operated by our “partners” and have “stand-alone” credit agreements that limit their freedom to take certain actions. Thus, without the concurrence of the other joint venture participants and/or the lenders of our joint venture participants, we cannot cause our joint ventures to take or not to take certain actions, even though those actions may be in the best interest of the joint ventures or us.
The insolvency of an operator of our joint ventures, the failure of an operator of our joint ventures to adequately perform operations or an operator’s breach of applicable agreements could reduce our revenue and result in our liability to governmental authorities for compliance with environmental, safety and other regulatory requirements and to the operator’s suppliers and vendors. As a result, the success and timing of development activities of our joint ventures operated by others and the economic results derived therefrom depends upon a number of factors outside our control, including the operator’s timing and amount of capital expenditures, expertise and financial resources, and the inclusion of other participants.
30
In addition, joint venture participants may have obligations that are important to the success of the joint venture, such as the obligation to pay their share of capital and other costs of the joint venture. The performance and ability of third parties to satisfy their obligations under joint venture arrangements is outside our control. If these third parties do not satisfy their obligations under these arrangements, our business may be adversely affected.
We are exposed to the credit risk of our customers in the ordinary course of our business activities.
When we (or our joint ventures) market our products or services, we (or our joint ventures) must determine the amount, if any, of the line of credit. Since certain transactions can involve very large payments, the risk of nonpayment and nonperformance by customers, industry participants and others is an important consideration in our business.
For example, in those cases where we provide division order services for crude oil and natural gas purchased at the wellhead, we may be responsible for distribution of proceeds to all of the interest owners. In other cases, we pay all of or a portion of the production proceeds to an operator who distributes these proceeds to the various interest owners. These arrangements expose us to operator credit risk. As a result, we must determine that operators have sufficient financial resources to make such payments and distributions and to indemnify and defend us in case of a protest, action or complaint.
Additionally, we sell NaHS and caustic soda to customers in a variety of industries. Many of these customers are in industries that have been impacted by a decline in demand for their products and services. Even if our credit review and analytical procedures work properly, we have experienced, and we could continue to experience losses in dealings with other parties.
Further, many of our customers were impacted by the weakened economic conditions, and precipitous decline in commodity prices, such as crude oil, natural gas, copper, molybdenum, and aluminum experienced in recent years in a manner that influenced the need for our products and services and their ability to pay us for those products and services. It is uncertain if commodity prices will increase in the near future.
Our sulfur removal operations are dependent on contracts with less than ten refineries and much of its revenue is attributable to a few refineries.
If one or more of our refinery customers that, individually or in the aggregate, generate a material portion of our revenue from sulfur removal services experience financial difficulties or changes in their strategy for sulfur removal such that they do not need our services, our cash flows could be adversely affected. For example, in 2016, approximately 60% of our sulfur removal operations’ NaHS by-product volumes were attributable to Phillips 66’s refinery located in Westlake, Louisiana. That contract requires Phillips 66 to make available minimum volumes of sour natural gas to us (except during periods of force majeure). Although the current term of that contract extends through 2026, if, for any reason, Phillips 66 does not meet its obligations under that contract for an extended period of time, such non-performance could have a material adverse effect on our profitability and cash flow.
We may not be able to renew our marine transportation time charters and contracts when they expire at favorable rates or at all, which may increase our exposure to the spot market and lead to lower revenues and increased expenses.
During the year ended December 31, 2016, our marine transportation segment received approximately 62% of its revenue from time charters and other fixed contracts, which help to insulate us from revenue fluctuations caused by weather, navigational delays and short-term market declines. We earned approximately 38% of our marine transportation revenues from spot contracts, where competition is high and rates are typically volatile and subject to short-term market fluctuations, and where we bear the risk of vessel downtime due to weather and navigational delays. If we deploy a greater percentage of our vessels in the spot market, we may experience a lower overall utilization of our fleet through waiting time or ballast voyages, leading to a decline in our operating revenue and gross profit. There can be no assurance that we will be able to enter into future time charters or other fixed contracts on terms favorable to us. For further discussion of our marine transportation contracts, see “Marine Transportation-Customers”
Our operations are subject to federal and state environmental protection and safety laws and regulations.
Our operations are subject to the risk of incurring substantial environmental and safety related costs and liabilities. In particular, our operations are subject to increasingly stringent environmental protection and safety laws and regulations that restrict our operations, impose consequences of varying degrees for noncompliance, and require us to expend resources in an effort to maintain compliance. Moreover, our operations, including the transportation and storage of crude oil, natural gas and other commodities, involves a risk that crude oil, natural gas and related hydrocarbons or other substances may be released into the environment, which may result in substantial expenditures for a response action, significant government penalties, liability to government agencies for natural resources damages, liability to private parties for personal injury or property damages, and significant business interruption. These costs and liabilities could rise under increasingly strict environmental and safety laws, including regulations and enforcement policies, or claims for damages to property or persons resulting from our operations. If
31
we are unable to recover such resulting costs through increased rates or insurance reimbursements, our cash flows and distributions to our unitholders could be materially affected.
Climate change legislation and regulatory initiatives may decrease demand for the products we store, transport and sell and increase our operating costs.
In December 2009, the EPA published its findings that emissions of carbon dioxide, methane and other GHGs present an endangerment to human health and the environment because emissions of such gases are, according to the EPA, contributing to the warming of the earth's atmosphere and other climatic changes. These findings served as a statutory prerequisite for EPA to adopt and implement regulations that would restrict emissions of GHGs under existing provisions of the CAA. The EPA has adopted two sets of related rules, one which purports to regulate emissions of GHGs from motor vehicles and the other of which regulates emissions of GHGs from certain large stationary sources of emissions such as power plants or industrial facilities. The EPA finalized the motor vehicle rule in April 2010 and it became effective in July 2010. The EPA adopted the stationary source rule, also known as the "Tailoring Rule," in May 2010, and it became effective in January 2011. The tailoring rule established new GHG emissions thresholds that determine when stationary sources must obtain permits under the PSD and Title V programs of the Clean Air Act. On June 23, 2014, in Utility Air Regulatory Group v. EPA (“UARG v. EPA”), the Supreme Court held that stationary sources could not become subject to PSD or Title V permitting solely by reason of their GHG emissions. The Court ruled, however, that the EPA may require installation of best available control technology for GHG emissions at sources otherwise subject to the PSD and Title V programs. On December 19, 2014, EPA issued two memoranda providing initial guidance on GHG permitting requirements in response to the Court’s decision in UARG v. EPA. In its preliminary guidance, EPA indicated it would promulgate a rule to rescind any PSD permits issued under the portions of the Tailoring Rule that were vacated by the Court. In the interim, EPA issued a narrowly crafted “no action assurance” indicating it will exercise its enforcement discretion not to pursue enforcement of the terms and conditions relating to GHGs in an EPA-issued PSD permit, and for related terms and conditions in a Title V permit. On April 30, 2015, the EPA issued a final rule allowing permitting authorities to rescind PSD permits issued under the invalid regulations.
Additionally, in September 2009, the EPA issued a final rule requiring the reporting of GHG emissions from specified large GHG emission sources in the U.S. beginning in 2011 for emissions occurring in 2010. Further, in November 2010, the EPA expanded its existing GHG reporting rule to include onshore and offshore crude oil and natural gas production and onshore processing, transmission, storage and distribution facilities, which may include certain of our facilities, beginning in 2012 for emissions occurring in 2011. In October 2015, the EPA amended the GHG reporting rule to add the reporting of GHG emissions from gathering and boosting systems, completions and workovers of crude oil wells using hydraulic fracturing, and blowdowns of natural gas transmission pipelines. As a result of this continued regulatory focus, future GHG regulations of the crude oil and natural gas industry remain a possibility. The EPA has continued to adopt GHG regulations of other industries, such as its August 2015 adoption of three separate, but related, actions to address carbon dioxide pollution from power plants, including final Carbon Pollution Standards for new, modified and reconstructed power plants, a final Clean Power Plan to cut carbon dioxide pollution from existing power plants, and a proposed federal plan to implement the Clean Power Plan emission guidelines. Upon publication of the Clean Power Plan on October 23, 2015, more than two dozen States as well as industry and labor groups challenged the Clean Power Plan in the D.C. Circuit Court of Appeals.
Further, the U.S. Congress has considered various proposals to reduce GHG emissions that may impose a carbon emissions tax, a cap-and-trade program or other programs aimed at carbon reduction, and almost half of the states, either individually or through multi-state regional initiatives, have already taken legal measures to reduce GHG emissions, primarily through the planned development of GHG emission inventories and/or GHG cap-and-trade programs. The net effect of this legislation is to impose increasing costs on the combustion of carbon-based fuels such as crude oil, refined petroleum products and natural gas. Our compliance with any future legislation or regulation of GHGs, if it occurs, may result in materially increased compliance and operating costs.
In addition, in December 2015, the United States participated in the 21st Conference of the Parties, or COP-21, of the United Nations Framework Convention on Climate Change in Paris, France. The resulting Paris Agreement calls for the parties to undertake “ambitious efforts” to limit the average global temperature, and to conserve and enhance sinks and reservoirs of GHGs. The Agreement, if ratified, establishes a framework for the parties to cooperate and report actions to reduce GHG emissions.
The effect on our operations of CAA regulations, legislative efforts or related implementation regulations that regulate or restrict emissions of GHGs in areas that we conduct business could adversely affect the demand for the products that we transport, store and distribute and, depending on the particular program adopted, could increase our costs to operate and maintain our facilities by requiring that we, among other things, measure and report our emissions, install new emission controls on our facilities, acquire allowances to authorize our GHG emissions, pay any taxes related to our GHG emissions and administer and manage a GHG emissions program. We may be unable to include some or all of such increased costs in the rates charged by our pipelines or other facilities, and any such recovery may depend on events beyond our control, including the outcome of future rate proceedings before the FERC or state regulatory agencies and the provisions of any final legislation or
32
implementing regulations. Any GHG emissions legislation or regulatory programs applicable to power plants or refineries could also increase the cost of consuming, and thereby adversely affect demand for the crude oil and natural gas that we produce. Consequently, legislation and regulatory programs to reduce GHG emissions could have an adverse effect on our business, financial condition and results of operations. It is not possible at this time to predict with any accuracy the structure or outcome of any future legislative or regulatory efforts to address such emissions or the eventual costs to us of compliance.
Furthermore, claims have been made against certain energy companies alleging that GHG emissions from crude oil and natural gas operations constitute a public nuisance under federal and/or state common law. As a result, private individuals may seek to enforce environmental laws and regulations against us and could allege personal injury or property damages. While our business is not a party to any such litigation, we could be named in actions making similar allegations. An unfavorable ruling in any such case could adversely impact our business, financial condition and results of operations.
Regulation of the rates, terms and conditions of services and a changing regulatory environment could affect our financial position, results of operations or cash flow.
FERC regulates certain of our energy infrastructure assets engaged in interstate operations. Our intrastate pipeline operations are regulated by state agencies. Our railcar operations are subject to the regulatory jurisdiction of the Federal Railroad Administration of the DOT, the Occupational Safety and Health Administration, as well as other federal and state regulatory agencies. This regulation extends to such matters as:
• | rate structures; |
• | rates of return on equity; |
• | recovery of costs; |
• | the services that our regulated assets are permitted to perform; |
• | the acquisition, construction and disposition of assets; and |
• | to an extent, the level of competition in that regulated industry. |
In addition, some of our pipelines and other infrastructure are subject to laws providing for open and/or non-discriminatory access.
Given the extent of this regulation, the evolving nature of federal and state regulation and the possibility for additional changes, the current regulatory regime may change and affect our financial position, results of operations or cash flow.
A natural disaster, accident, terrorist attack or other interruption event involving us could result in severe personal injury, property damage and/or environmental damage, which could curtail our operations and otherwise adversely affect our assets and cash flow.
Some of our operations involve significant risks of severe personal injury, property damage and environmental damage, any of which could curtail our operations and otherwise expose us to liability and adversely affect our cash flow. Virtually all of our operations are exposed to the elements, including hurricanes, tornadoes, storms, floods and earthquakes. A significant portion of our operations are located along the U.S. Gulf Coast, and our offshore pipelines are located in the Gulf of Mexico. These areas can be subject to hurricanes.
If one or more facilities that are owned by us or that connect to us is damaged or otherwise affected by severe weather or any other disaster, accident, catastrophe or event, our operations could be significantly interrupted. Similar interruptions could result from damage to production or other facilities that supply our facilities or other stoppages arising from factors beyond our control. These interruptions might involve significant damage to people, property or the environment, and repairs might take from a week or less for a minor incident to six months or more for a major interruption. Any event that interrupts the fees generated by our energy infrastructure assets, or which causes us to make significant expenditures not covered by insurance, could reduce our cash available for paying our interest obligations as well as unitholder distributions and, accordingly, adversely impact the market price of our securities. Additionally, the proceeds of any property insurance maintained by us may not be paid in a timely manner or be in an amount sufficient to meet our needs if such an event were to occur, and we may not be able to renew it or obtain other desirable insurance on commercially reasonable terms, if at all.
On September 11, 2001, the U.S. was the target of terrorist attacks of unprecedented scale. Since the September 11 attacks, the U.S. government has issued warnings that energy assets, specifically the nation’s pipeline infrastructure, may be the future targets of terrorist organizations. These developments have subjected our operations to increased risks. Any future terrorist attack at our facilities, those of our customers and, in some cases, those of other pipelines, could have a material adverse effect on our business.
Our business could be negatively impacted by security threats, including cybersecurity threats, and related disruptions.
33
We rely on our information technology infrastructure to process, transmit and store electronic information, including information we use to safely operate our assets. While we believe that we maintain appropriate information security policies and protocols, we face cybersecurity and other security threats to our information technology infrastructure, which could include threats to our operational and safety systems that operate our pipelines, facilities and other assets. We could face unlawful attempts to gain access to our information technology infrastructure, including coordinated attacks from hackers, whether state-sponsored groups, “hacktivists,” or private individuals. The age, operating systems or condition of our current information technology infrastructure and software assets and our ability to maintain and upgrade such assets could affect our ability to resist cybersecurity threats.
Our information technology infrastructure is critical to the efficient operation of our business and essential to our ability to perform day-to-day operations. Breaches in our information technology infrastructure or physical facilities, or other disruptions, could result in damage to our assets, loss of intellectual property, impairment of our ability to conduct our operations, disruption of our customers’ operations, loss or damage to our customer data delivery systems, safety incidents, damage to the environment and could have a material adverse effect on our operations, financial position and results of operations. It is also possible that breaches to our systems could go unnoticed for some period of time.
Our business would be adversely affected if we failed to comply with the Jones Act foreign ownership provisions.
We are subject to the Jones Act and other federal laws that restrict maritime cargo transportation between points in the U.S. only to vessels operating under the U.S. flag, built in the U.S., at least 75% owned and operated by U.S. citizens (or owned and operated by other entities meeting U.S. citizenship requirements to own vessels operating in the U.S. coastwise trade and, in the case of limited partnerships, where the general partner meets U.S. citizenship requirements) and manned by U.S. crews. To maintain our privilege of operating vessels in the Jones Act trade, we must maintain U.S. citizen status for Jones Act purposes. To ensure compliance with the Jones Act, we must be U.S. citizens qualified to document vessels for coastwise trade. We could cease being a U.S. citizen if certain events were to occur, including if non-U.S. citizens were to own 25% or more of our equity interest or were otherwise deemed to control us or our general partner. We are responsible for monitoring ownership to ensure compliance with the Jones Act. The consequences of our failure to comply with the Jones Act provisions on coastwise trade, including failing to qualify as a U.S. citizen, would have an adverse effect on us as we may be prohibited from operating our vessels in the U.S. coastwise trade or, under certain circumstances, permanently lose U.S. coastwise trading rights or be subject to fines or forfeiture of our vessels.
Our business would be adversely affected if the Jones Act provisions on coastwise trade or international trade agreements were modified or repealed or as a result of modifications to existing legislation or regulations governing the crude oil and natural gas industry in response to the recent lifting of the crude oil export ban and the Deepwater Horizon drilling rig incident in the U.S. Gulf of Mexico and subsequent crude oil spill.
If the restrictions contained in the Jones Act were repealed or altered or certain international trade agreements were changed, the maritime transportation of cargo between U.S. ports could be opened to foreign flag or foreign-built vessels. The Secretary of the Department of Homeland Security, or the Secretary, is vested with the authority and discretion to waive the coastwise laws if the Secretary deems that such action is necessary in the interest of national defense. Any waiver of the coastwise laws, whether in response to natural disasters or otherwise, could result in increased competition from foreign product carrier and barge operators, which could reduce our revenues and cash available for distribution.
In December 2015, Congress voted to lift the four decade crude oil export ban. Although the impact of this legislation is not yet determinable, increased exports of U.S. crude oil may lead to increased calls to repeal or modify the Jones Act. Even before lifting the export ban, in the past several years, interest groups have lobbied Congress to repeal or modify the Jones Act to facilitate foreign-flag competition for trades and cargoes currently reserved for U.S. flag vessels under the Jones Act. Foreign-flag vessels generally have lower construction costs and generally operate at significantly lower costs than we do in U.S. markets, which would likely result in reduced charter rates. We believe that continued efforts will be made to modify or repeal the Jones Act. If these efforts are successful, foreign-flag vessels could be permitted to trade in the U.S. coastwise trade and significantly increase competition with our fleet, which could have an adverse effect on our business.
Events within the crude oil and natural gas industry, such as the April 2010 fire and explosion on the Deepwater Horizon drilling rig in the U.S. Gulf of Mexico and the resulting crude oil spill and moratorium on certain drilling activities in the U.S. Gulf of Mexico implemented by the Bureau of Ocean Energy Management, Regulation and Enforcement (formerly, the Minerals Management Service), may adversely affect our customers’ operations and, consequently, our operations. Such events may also subject companies operating in the crude oil and natural gas industry, including us, to additional regulatory scrutiny and result in additional regulations and restrictions adversely affecting the U.S. crude oil and natural gas industry.
A decrease in the cost of importing refined petroleum products could cause demand for U.S. flag product carrier and barge capacity and charter rates to decline, which would decrease our revenues and our ability to pay cash distributions on our units.
34
The demand for U.S. flag product carriers and barges is influenced by the cost of importing refined petroleum products. Historically, charter rates for vessels qualified to participate in the U.S. coastwise trade under the Jones Act have been higher than charter rates for foreign flag vessels. This is due to the higher construction and operating costs of U.S. flag vessels under the Jones Act requirements that such vessels be built in the U.S. and manned by U.S. crews. This has made it less expensive for certain areas of the U.S. that are underserved by pipelines or which lack local refining capacity, such as in the Northeast, to import refined petroleum products carried aboard foreign flag vessels than to obtain them from U.S. refineries. If the cost of importing refined petroleum products decreases to the extent that it becomes less expensive to import refined petroleum products to other regions of the East Coast and the West Coast than producing such products in the U.S. and transporting them on U.S. flag vessels, demand for our vessels and the charter rates for them could decrease.
An easing or lifting of the U.S. crude oil export ban could adversely impact our U.S. Flag Fleet.
In December 2015, Congress voted to lift the four decade crude oil export ban. Although the impact of this legislation on our U.S. Flag fleet’s operations is not determinable, the easing of the crude oil export ban could result in reduced coastwise transportation of crude oil, which may have an adverse impact on our U.S. Flag segment.
We face periodic dry-docking costs for our vessels, which can be substantial.
Vessels must be dry-docked periodically for regulatory compliance and for maintenance and repair. Our dry-docking requirements are subject to associated risks, including delay, cost overruns, lack of necessary equipment, unforeseen engineering problems, employee strikes or other work stoppages, unanticipated cost increases, inability to obtain necessary certifications and approvals and shortages of materials or skilled labor. A significant delay in dry-dockings could have an adverse effect on our marine transportation contract commitments. The cost of repairs and renewals required at each dry-dock are difficult to predict with certainty and can be substantial.
The U.S. inland waterway infrastructure is aging and may result in increased costs and disruptions to our marine transportation segment.
Maintenance of the U.S. inland waterway system is vital to our marine transportation operations. The system is composed of over 12,000 miles of commercially navigable waterway, supported by over 240 locks and dams designed to provide flood control, maintain pool levels of water in certain areas of the country and facilitate navigation on the inland river system. The U.S. inland waterway infrastructure is aging, with more than half of the locks over 50 years old. As a result, due to the age of the locks, scheduled and unscheduled maintenance outages may be more frequent in nature, resulting in delays and additional operating expenses. Failure of the federal government to adequately fund infrastructure maintenance and improvements in the future would have a negative impact on our ability to deliver products for its marine transportation customers on a timely basis.
Risks Related to Our Partnership Structure
Our significant unitholders may sell units or other limited partner interests in the trading market, which could reduce the market price of common units.
As of December 31, 2016, we have a number of significant unitholders. For example, certain members of the Davison family (including their affiliates) and management owned approximately 19 million or 15.9% of our common units. From time to time, we also may have other unitholders that have large positions in our common units. In the future, any such parties may acquire additional interest or dispose of some or all of their interest. If they dispose of a substantial portion of their interest in the trading markets, such sales could reduce the market price of common units. In connection with certain transactions, we have put in place resale shelf registration statements, which allow unit holders thereunder to sell their common units at any time (subject to certain restrictions) and to include those securities in any equity offering we consummate for our own account.
Individual members of the Davison family can exert significant influence over us and may have conflicts of interest with us and may be permitted to favor their interests to the detriment of our other unitholders.
James E. Davison and James E. Davison, Jr., each of whom is a director of our general partner, each own a significant portion of our common units, including our Class B Common Units, the holders of which elect our directors. Other members of the Davison family also own a significant portion of our common units. Collectively, members of the Davison family and their affiliates own approximately 10.5% of our Class A Common Units and 76.9% of our Class B Common Units and are able to exert significant influence over us, including the ability to elect at least a majority of the members of our board of directors and the ability to control most matters requiring board approval, such as material business strategies, mergers, business combinations, acquisitions or dispositions of assets, issuances of additional partnership securities, incurrences of debt or other financings and payments of distributions. In addition, the existence of a controlling group (if one were to form) may have the effect of making it difficult for, or may discourage or delay, a third party from seeking to acquire us, which may adversely affect the market price of our common units. Further, conflicts of interest may arise between us and other entities for which
35
members of the Davison family serve as officers or directors. In resolving any conflicts that may arise, such members of the Davison family may favor the interests of another entity over our interests.
Members of the Davison family own, control and have interests in diverse companies, some of which may (or could in the future) compete directly or indirectly with us. As a result, the interests of the members of the Davison family may not always be consistent with our interests or the interests of our other unitholders. Members of the Davison family could also pursue acquisitions or business opportunities that may be complementary to our business. Our organizational documents allow the holders of our units (including affiliates, like the Davisons) to take advantage of such corporate opportunities without first presenting such opportunities to us. As a result, corporate opportunities that may benefit us may not be available to us in a timely manner, or at all. To the extent that conflicts of interest may arise among us and any member of the Davison family, those conflicts may be resolved in a manner adverse to us or you. Other potential conflicts may involve, among others, the following situations:
• | our general partner is allowed to take into account the interest of parties other than us, such as one or more of its affiliates, in resolving conflicts of interest; |
• | our general partner may limit its liability and reduce its fiduciary duties, while also restricting the remedies available to our unitholders for actions that, without such limitations, might constitute breaches of fiduciary duty; |
• | our general partner determines the amount and timing of asset purchases and sales, capital expenditures, borrowings, issuance of additional partnership securities, reimbursements and enforcement of obligations to the general partner and its affiliates, retention of counsel, accountants and service providers and cash reserves, each of which can also affect the amount of cash that is distributed to our unitholders; and |
• | our general partner determines which costs incurred by it and its affiliates are reimbursable by us and the reimbursement of these costs and of any services provided by our general partner could adversely affect our ability to pay cash distributions to our unitholders. |
Our Class B Common Units may be transferred to a third party without unitholder consent, which could affect our strategic direction.
Unlike the holders of common stock in a corporation, our unitholders have only limited voting rights on matters affecting our business and, therefore, limited ability to influence management’s decisions regarding our business. Only holders of our Class B Common Units have the right to elect our board of directors. Holders of our Class B Common Units may transfer such units to a third party without the consent of the unitholders. The new holders of our Class B Common Units may then be in a position to replace our board of directors and officers of our general partner with its own choices and to control the strategic decisions made by our board of directors and officers.
Unitholders with registration rights have rights to require underwritten offerings that could limit our ability to raise capital in the public equity market.
Unitholders with registration rights have rights to require us to conduct underwritten offerings of our common units. If we want to access the capital markets (debt and equity), those unitholders’ ability to sell a portion of their common units could satisfy investor’s demand for our common units or may reduce the market price for our common units, thereby reducing the net proceeds we would receive from a sale of newly issued units.
We may issue additional common units without unitholder’s approval, which would dilute their ownership interests.
We may issue an unlimited number of limited partner interests of any type without the approval of our unitholders.
The issuance of additional common units or other equity securities of equal or senior rank will have the following effects:
• | our unitholders’ proportionate ownership interest in us will decrease; |
• | the amount of cash available for distribution on each unit may decrease; |
• | the relative voting strength of each previously outstanding unit may be diminished; and |
• | the market price of our common units may decline. |
Our general partner has a limited call right that may require unitholders to sell their units at an undesirable time or price.
If at any time our general partner and its affiliates own more than 80% of any class of our units, our general partner will have the right, but not the obligation, which it may assign to any of its affiliates, including any controlling unitholder, or to us, to acquire all, but not less than all, of the units held by unaffiliated persons at a price not less than their then-current market price. As a result, unitholders may be required to sell their units at an undesirable time or price and may not receive any return on their investment. Unitholders may also incur a tax liability upon a sale of their units.
36
The interruption of distributions to us from our subsidiaries and joint ventures could affect our ability to make payments on indebtedness or cash distributions to our unitholders.
We are a holding company. As such, our primary assets are the equity interests in our subsidiaries and joint ventures. Consequently, our ability to fund our commitments (including payments on our indebtedness) and to make cash distributions depends upon the earnings and cash flow of our subsidiaries and joint ventures and the distribution of that cash to us. Distributions from our joint ventures are subject to the discretion of their respective management committees. Further, certain joint ventures’ charter documents may vest in their management committees’ certain discretion regarding cash distributions. Accordingly, our joint ventures may not continue to make distributions to us at current levels or at all.
We do not have the same flexibility as other types of organizations to accumulate cash and equity to protect against illiquidity in the future.
Unlike a corporation, our partnership agreement requires us to make quarterly distributions to our unitholders of all available cash reduced by any amounts reserved for commitments and contingencies, including capital and operating costs and debt service requirements. The value of our units and other limited partner interests may decrease in direct correlation with decreases in the amount we distribute per unit. Accordingly, if we experience a liquidity problem in the future, we may not be able to issue more equity to recapitalize.
Unitholders may have liability to repay distributions that were wrongfully distributed to them.
Under certain circumstances, unitholders may have to repay amounts wrongfully returned or distributed to them. Under Section 17-607 of the Delaware Revised Uniform Limited Partnership Act, we may not make a distribution to you if the distribution would cause our liabilities to exceed the fair value of our assets. Delaware law provides that for a period of three years from the date of an impermissible distribution, limited partners who received the distribution and who knew at the time of the distribution that it violated Delaware law will be liable to the limited partnership for the distribution amount. Substituted limited partners are liable both for the obligations of the assignor to make contributions to the partnership that were known to the substituted limited partner at the time it became a limited partner and for those obligations that were unknown if the liabilities could have been determined from the partnership agreement. Neither liabilities to partners on account of their partnership interest nor liabilities that are non-recourse to the partnership are counted for purposes of determining whether a distribution is permitted.
Unitholder liability may not be limited if a court finds that unitholder action constitutes control of our business.
A general partner of a partnership generally has unlimited liability for the obligations of the partnership, except for those contractual obligations of the partnership that are expressly made without recourse to the general partner. Our partnership is organized under Delaware law, and we conduct business in other states. The limitations on the liability of holders of limited partner interests for the obligations of a limited partnership have not been clearly established in some states in which we do business or may do business in from time to time in the future. Unitholders could be liable for any and all of our obligations as if unitholders were a general partner if a court or government agency were to determine that:
• | we were conducting business in a state but had not complied with that particular state’s partnership statute; or |
• | unitholders right to act with other unitholders to remove or replace our general partner, to approve some amendments to our partnership agreement or to take other actions under our partnership agreement constitutes “control” of our business. |
Tax Risks to Common Unitholders
Our tax treatment depends on our status as a partnership for federal income tax purposes, as well as our not being subject to a material amount of entity-level taxation by individual states. A publicly-traded partnership can lose its status as a partnership for a number of reasons, including not having enough “qualifying income.” If the Internal Revenue Service, or IRS, were to treat us as a corporation or if we were to become subject to a material amount of entity-level taxation for state tax purposes, then our cash available for distribution to unitholders would be substantially reduced.
The anticipated after-tax economic benefit of an investment in our common units depends largely on our being treated as a partnership for federal income tax purposes. Section 7704 of the Internal Revenue Code provides that publicly traded partnerships will, as a general rule, be taxed as corporations. However, an exception, referred to in this discussion as the “Qualifying Income Exception,” exists with respect to publicly traded partnerships 90% or more of the gross income of which for every taxable year consists of “qualifying income.” If less than 90% of our gross income for any taxable year is “qualifying income” from transportation or processing of natural resources including crude oil, natural gas or products thereof, interest, dividends or similar sources, we will be taxable as a corporation under Section 7704 of the Internal Revenue Code for federal income tax purposes for that taxable year and all subsequent years. We have not requested, and do not plan to request, a ruling from the IRS with respect to our treatment as a partnership for federal income tax purposes.
37
The decision of the U.S. Court of Appeals for the Fifth Circuit in Tidewater Inc. v. U.S., 565 F.3d 299 (5th Cir. April 13, 2009) held that the marine time charter being analyzed in that case was a “lease” that generated rental income rather than income from transportation services for purposes of a foreign sales corporation provision of the Internal Revenue Code. Even though (i) the Tidewater case did not involve a publicly traded partnership and it was not decided under Section 7704 of the Internal Revenue Code relating to “qualifying income,” (ii) some experienced practitioners believe the decision was not well reasoned, (iii) the IRS stated in an Action on Decision (AOD 2010-01) that it disagrees with and will not acquiesce to the Fifth Circuit’s marine time charter analysis contained in the Tidewater case and (iv) the IRS has issued several favorable private letter rulings (which can be relied upon and cited as precedent by only the taxpayers that obtained them) relating to time charters since the Tidewater decision was issued, the Tidewater decision creates some uncertainty regarding the status of income from certain of our marine time charters as “qualifying income” under Section 7704 of the Internal Revenue Code. Notwithstanding the foregoing, the Tidewater case is relevant authority because it is the only case of which we and our outside tax counsel are aware directly analyzing whether a particular time charter would constitute a lease or service agreement for certain U.S. federal tax purposes. Due to the uncertainty created by the Tidewater decision, our outside tax counsel, Akin Gump Strauss Hauer & Feld, LLP, was required to change the standard in its opinion relating to our status as a partnership for federal income tax purposes to “should” from “will.”
Although we do not believe based upon our current operations that we are treated as a corporation for federal income tax purposes, a change in our business (or a change in current law) could cause us to be treated as a corporation for federal income tax purposes or otherwise subject us to taxation as an entity. If we were treated as a corporation for federal income tax purposes, we would pay federal income tax on our taxable income at the corporate tax rate, which is currently a maximum of 35% and would pay state income tax at varying rates. Distributions to our unitholders would generally be taxable to them again as corporate distributions and no income, gains, losses, or deductions would flow through to them. Because a tax would be imposed upon us as a corporation, our cash available for distribution to unitholders would be substantially reduced. Therefore, treatment of us as a corporation would result in a material reduction in the anticipated cash flow and after-tax return to our unitholders, likely causing a substantial reduction in the value of our common units.
At the state level, because of widespread state budget deficits and other reasons, several states are evaluating ways to subject partnerships to entity-level taxation through the imposition of state income, franchise and other forms of taxation. For example, we are required to pay Texas franchise tax on our gross income apportioned to Texas. Imposition of any such taxes on us by any other state would reduce the cash available for distribution to our unitholders.
Current law may change so as to cause us to be treated as a corporation for federal income tax purposes or otherwise subject us to entity-level taxation. Moreover, any modification to the federal income tax laws and interpretations thereof may or may not be applied retroactively. Any such changes could negatively impact the value of an investment in our common units. At the state level, because of widespread state budget deficits and other reasons, several states are evaluating ways to subject partnerships to entity-level taxation through the imposition of state income, franchise and other forms of taxation. For example, we are required to pay Texas franchise tax on our gross income apportioned to Texas. Imposition of any such taxes on us by any other state would reduce the cash available for distribution to our unitholders.
The tax treatment of publicly traded partnerships could be subject to potential legislative, judicial or administrative changes and differing interpretations, possibly on a retroactive basis.
The present U.S. federal income tax treatment of publicly traded partnerships, including us, may be modified by administrative, legislative or judicial interpretation at any time. Any modification to the U.S. federal income tax laws and interpretations thereof may or may not be applied retroactively and could make it more difficult or impossible to meet the exception for us to be treated as a partnership for U.S. federal income tax purposes that is not taxable as a corporation, affect or cause us to change our business activities, affect the tax considerations of an investment in us and change the character or treatment of portions of our income. For example, from time to time, the President and members of Congress propose and consider substantive changes to the existing U.S. federal income tax laws that would adversely affect the tax treatment of certain publicly traded partnerships, including the elimination of partnership tax treatment for publicly traded partnerships. Additionally, on January 19, 2017, the U.S. Treasury Department and the IRS issued final regulations regarding qualifying income under Section 7704(d)(1)(E) of the Code . We do not believe the final regulations affect our ability to qualify as a publicly traded partnership.
Any modifications to the U.S. federal income tax laws may be applied retroactively and could make it more difficult or impossible for us to meet the exception for certain publicly traded partnerships to be treated as partnerships for U.S. federal income tax purposes. We are unable to predict whether any of these changes, or other proposals, will ultimately be enacted. Any such changes could cause a material reduction in our anticipated cash flows and could cause us to be treated as an association taxable as a corporation for U.S. federal income tax purposes subjecting us to the entity-level tax and adversely affecting the value of our common units.
38
A successful IRS contest of the federal income tax positions we take may adversely affect the market for our common units, and the cost of any IRS contest will reduce our cash available for distribution to our unitholders and our general partner.
We have not requested, and do not plan to request, a ruling from the IRS with respect to our treatment as a partnership for federal income tax purposes or any other matter affecting us. The IRS may adopt positions that differ from the positions we take. It may be necessary to resort to administrative or court proceedings to sustain some or all of the positions we take. A court may not agree with some or all of the positions we take. Any contest with the IRS may materially and adversely impact the market for our common units and the price at which they trade. In addition, our costs of any contest with the IRS will be borne indirectly by our unitholders and our general partner because these costs will reduce our cash available for distribution.
Unitholders will be required to pay taxes on income (as well as deemed distributions, if any) from us even if they do not receive any cash distributions from us.
Unitholders will be required to pay any federal income taxes and, in some cases, state and local income taxes on their share of our taxable income (as well as deemed distributions, if any) even if unitholders receive no cash distributions from us. Unitholders may not receive cash distributions from us equal to their share of our taxable income (or deemed distributions, if any) or even the tax liability that results from that income (or deemed distribution).
Tax gain or loss on the disposition of our common units could be more or less than expected.
If unitholders sell their common units, they will recognize a gain or loss equal to the difference between the amount realized and their tax basis in those common units. Prior distributions to unitholders in excess of the total net taxable income unitholders were allocated for a common unit, which decreased their tax basis in that common unit, will, in effect, become taxable income to unitholders if the common unit is sold at a price greater than their tax basis in that common unit, even if the price they receive is less than their original cost. A substantial portion of the amount realized, whether or not representing gain, may be ordinary income due to potential recapture items, including depreciation recapture. In addition, because the amount realized includes a unitholder’s share of our non-recourse liabilities, if unitholders sell their units, they may incur a tax liability in excess of the amount of cash they receive from the sale.
Tax-exempt entities and non-U.S. persons face unique tax issues from owning our common units that may result in adverse tax consequences to them.
Investment in common units by tax-exempt entities, such as individual retirement accounts (known as IRAs), other retirement plans, and non-U.S. persons raises issues unique to them. For example, virtually all of our income allocated to organizations that are exempt from federal income tax, including IRAs and other retirement plans, will be unrelated business taxable income and will be taxable to them. Distributions to non-U.S. persons will be reduced by withholding taxes at the highest applicable effective tax rate and non-U.S. persons will be required to file U.S. federal income tax returns and pay tax on their share of our taxable income. Tax-exempt entities and non-U.S. persons should consult their tax advisors before investing in our common units.
We will treat each purchaser of our common units as having the same tax benefits without regard to the actual common units purchased. The IRS may challenge this treatment, which could adversely affect the value of our common units.
Because we cannot match transferors and transferees of our common units, we adopt depreciation and amortization conventions that may not conform to all aspects of existing Treasury Regulations and may result in audit adjustments to our unitholders’ tax returns without the benefit of additional deductions. A successful IRS challenge to those conventions could adversely affect the amount of tax benefits available to a common unitholder. It also could affect the timing of these tax benefits or the amount of gain from a sale of common units and could have a negative impact on the value of our common units or result in audit adjustments to the common unitholder’s tax returns.
Unitholders will likely be subject to state and local taxes in states where they do not live as a result of an investment in the common units.
In addition to federal income taxes, unitholders will likely be subject to other taxes, including foreign, state and local taxes, unincorporated business taxes and estate inheritance or intangible taxes that are imposed by the various jurisdictions in which we do business or own property, even if unitholders do not live in any of those jurisdictions. Unitholders will likely be required to file foreign, state, and local income tax returns and pay state and local income taxes in some or all of these jurisdictions. Further, unitholders may be subject to penalties for failure to comply with those requirements. We own assets and do business in more than 20 states including Texas, Louisiana, Mississippi, Alabama, Florida, Arkansas and Oklahoma. Many of the states we currently do business in impose a personal income tax. It is our unitholders’ responsibility to file all applicable U.S. federal, foreign, state and local tax returns.
39
We have subsidiaries that are treated as corporations for federal income tax purposes and subject to corporate-level income taxes.
We conduct a portion of our operations through subsidiaries that are, or are treated as, corporations for federal income tax purposes. We may elect to conduct additional operations in corporate form in the future. These corporate subsidiaries will be subject to corporate-level tax, which will reduce the cash available for distribution to us and, in turn, to our unitholders. If the IRS were to successfully assert that these corporate subsidiaries have more tax liability than we anticipate or legislation was enacted that increased the corporate tax rate, our cash available for distribution to our unitholders would be further reduced.
We prorate our items of income, gain, loss and deduction between transferors and transferees of our common units each month based upon the ownership of our common units on the first day of each month, instead of on the basis of the date a particular common unit is transferred.
We prorate our items of income, gain, loss, and deduction between transferors and transferees of our common units each month based upon the ownership of our common units on the first day of each month, instead of on the basis of the date a particular unit is transferred. The use of this proration method may not be permitted under existing Treasury Regulations. The Department of the Treasury and the IRS recently adopted the final Treasury regulations allowing a similar monthly simplifying convention for taxable years beginning on or after August 3, 2015. However, such regulations do not specifically authorize the use of the proration method we have adopted. Certain publicly traded partnerships, including us, may but are not required to apply the conventions provided by the Treasury regulations. If the IRS were to successfully challenge this method or new Treasury Regulations were issued, we may be required to change the allocation of items of income, gain, loss, and deduction among our unitholders.
A unitholder whose units are loaned to a “short seller” to cover a short sale of units may be considered as having disposed of those units. If so, such unitholder would no longer be treated for tax purposes as a partner with respect to those units during the period of the loan and may recognize gain or loss from the disposition.
Because a unitholder whose units are loaned to a “short seller” to cover a short sale of units may be considered as having disposed of the loaned units, such unitholder may no longer be treated for tax purposes as a partner with respect to those units during the period of the loan to the short seller and the unitholder may recognize gain or loss from such disposition. Moreover, during the period of the loan to the short seller, any of our income, gain, loss or deduction with respect to those units may not be reportable by the unitholder and any cash distributions received by the unitholder as to those units could be fully taxable as ordinary income. Unitholders desiring to assure their status as partners and avoid the risk of gain recognition from a loan to a short seller are urged to modify any applicable brokerage account agreements to prohibit their brokers from borrowing their units.
The sale or exchange of 50% or more of our capital and profits interests during any twelve-month period will result in the termination of our partnership for federal income tax purposes.
We will be considered to have terminated our partnership for federal income tax purposes if there is a sale or exchange of 50% or more of the total interests in our capital and profits within a twelve-month period. Our termination would, among other things, result in the closing of our taxable year for all unitholders, which would result in us filing two tax returns (and unitholders receiving two Schedule K-1s) for one fiscal year. Our termination could also result in a deferral of depreciation deductions allowable in computing our taxable income. In the case of a common unitholder reporting on a taxable year other than a fiscal year ending December 31, the closing of our taxable year may result in more than twelve months of our taxable income or loss being includable in his taxable income for the year of termination. Our termination currently would not affect our classification as a partnership for federal income tax purposes, but instead, we would be treated as a new partnership for tax purposes. If treated as a new partnership, we must make new tax elections and could be subject to penalties if we are unable to determine that a termination occurred. The IRS has announced a publicly traded partnership technical termination relief program whereby, if a publicly traded partnership that technically terminated requests relief and such relief is granted by the IRS, among other things, the partnership will only have to provide one Schedule K-1 to unitholders for the year notwithstanding two partnership tax years.
If the IRS makes audit adjustments to our income tax returns for tax years beginning after December 31, 2017, it may assess and collect any taxes (including any applicable penalties and interest) resulting from such audit adjustment directly from us, in which case our cash available for distribution to our unitholders might be substantially reduced.
Pursuant to the Bipartisan Budget Act of 2015, for tax years beginning after December 31, 2017, if the IRS makes audit adjustments to our income tax returns, it may assess and collect any taxes (including any applicable penalties and interest) resulting from such audit adjustment directly from us. Generally, we may elect to have our general partner and our unitholders take such audit adjustment into account in accordance with their interests in us during the tax year under audit, but there can be no assurance that such election will be effective in all circumstances and the manner in which the election is made and implemented has yet to be determined. If we are unable to have our general partner and our unitholders take such audit
40
adjustment into account in accordance with their interests in us during the tax year under audit, our current unitholders may bear some or all of the tax liability resulting from such audit adjustment, even if such unitholders did not own units in us during the tax year under audit. If, as a result of any such audit adjustment, we are required to make payments of taxes, penalties and interest, our cash available for distribution to our unitholders might be substantially reduced. These rules are not applicable to us for tax years beginning on or prior to December 31, 2017.
Item 1B. Unresolved Staff Comments
None.
Item 2. Properties
See Item 1. “Business.” We also have various operating leases for rental of office space, office and field equipment and vehicles. See “Commitments and Off-Balance Sheet Arrangements” in Management’s Discussion and Analysis of Financial Condition and Results of Operations, and Note 19 to our Consolidated Financial Statements in Item 8 for the future minimum rental payments. Such information is incorporated herein by reference.
Item 3. Legal Proceedings
We are involved from time to time in various claims, lawsuits and administrative proceedings incidental to our business. In our opinion, the ultimate outcome, if any, of such proceedings is not expected to have a material adverse effect on our financial condition, results of operations or cash flows. See Note 19 to our Consolidated Financial Statements in Item 8.
Item 4. Mine Safety Disclosures
Not applicable.
41
PART II
Item 5. Market for Registrant’s Common Equity, Related Unitholder Matters and Issuer Purchases of Equity Securities
Our Class A common units are listed on the New York Stock Exchange, or NYSE, under the symbol “GEL.” The following table sets forth, for the periods indicated, the high and low sale prices per common unit and the amount of cash distributions declared and paid per common unit.
Price Range | Cash Distributions (1) | ||||||||||
High | Low | ||||||||||
2015 | |||||||||||
1st Quarter | $ | 48.66 | $ | 38.65 | $ | 0.5950 | |||||
2nd Quarter | $ | 50.04 | $ | 43.44 | $ | 0.6100 | |||||
3rd Quarter | $ | 48.15 | $ | 27.40 | $ | 0.6250 | |||||
4th Quarter | $ | 44.32 | $ | 30.79 | $ | 0.6400 | |||||
2016 | |||||||||||
1st Quarter | $ | 37.35 | $ | 19.55 | $ | 0.6550 | |||||
2nd Quarter | $ | 40.35 | $ | 29.19 | $ | 0.6725 | |||||
3rd Quarter | $ | 40.90 | $ | 33.03 | $ | 0.6900 | |||||
4th Quarter | $ | 38.36 | $ | 31.80 | $ | 0.7000 | |||||
(1) | Cash distributions are shown in the quarter paid and are based on the prior quarter’s activities. |
At February 24, 2017, we had 117,939,221 Class A common units outstanding. As of December 31, 2016, the closing price of our common units was $36.02 and we had approximately 55,000 record holders of our Class A common units, which include holders who own units through their brokers “in street name.”
Available cash generally means, for each fiscal quarter, all cash on hand at the end of the quarter:
• | less the amount of cash reserves that our general partner determines in its reasonable discretion is necessary or appropriate to: |
• | provide for the proper conduct of our business; |
• | comply with applicable law, any of our debt instruments, or other agreements; or |
• | provide funds for distributions to our unitholders for any one or more of the next four quarters; |
• | plus all cash on hand on the date of determination of available cash for the quarter resulting from working capital borrowings. Working capital borrowings are generally borrowings that are made under our credit facility and in all cases are used solely for working capital purposes or to pay distributions to partners. |
The full definition of available cash is set forth in our partnership agreement and amendments thereto, which are incorporated by reference as an exhibit to this Form 10-K.
See Item 7. “Management’s Discussion and Analysis of Financial Condition and Results of Operations – Liquidity and Capital Resources – Capital Expenditures and Distributions Paid to our Unitholders” and Note 11 to our Consolidated Financial Statements in Item 8 for further information regarding restrictions on our distributions. See Item 12. “Security Ownership of Certain Beneficial Owners and Management and Related Unitholder Matters” for information regarding securities authorized for issuance under equity compensation plans.
42
Item 6. Selected Financial Data
The table below includes selected financial and other data for the Partnership for the years ended December 31, 2016, 2015, 2014, 2013 and 2012 (in thousands, except per unit and volume data). The selected financial data should be read in conjunction with our Consolidated Financial Statements and Item 7. “Management’s Discussion and Analysis of Financial Condition and Results of Operations.”
Year Ended December 31, | |||||||||||||||||||
2016 (1) | 2015 (1) | 2014 (1) | 2013 (1) | 2012 (1) | |||||||||||||||
Income Statement Data: | |||||||||||||||||||
Revenues: | |||||||||||||||||||
Offshore pipeline transportation | 334,679 | 140,230 | 3,296 | 3,923 | 5,508 | ||||||||||||||
Refinery services | 171,503 | 177,880 | 207,401 | 205,985 | 196,017 | ||||||||||||||
Marine transportation | 213,021 | 238,757 | 229,282 | 152,542 | 118,204 | ||||||||||||||
Supply and logistics | 993,290 | 1,689,662 | 3,406,185 | 3,772,380 | 3,047,632 | ||||||||||||||
Total revenues | $ | 1,712,493 | $ | 2,246,529 | $ | 3,846,164 | $ | 4,134,830 | $ | 3,367,361 | |||||||||
Equity of earnings of equity investees | $ | 47,944 | $ | 54,450 | $ | 43,135 | $ | 22,675 | $ | 14,345 | |||||||||
Income (loss) from continuing operations after income taxes | $ | 111,082 | $ | 421,585 | $ | 106,202 | $ | 84,004 | $ | 97,337 | |||||||||
Net income attributable to Genesis Energy, L.P. | $ | 113,249 | $ | 422,528 | $ | 106,202 | $ | 86,109 | $ | 96,319 | |||||||||
Net income (loss) attributable to Genesis Energy, L.P. per Common Unit: Basic and Diluted | $ | 1.00 | $ | 4.10 | $ | 1.18 | $ | 1.03 | $ | 1.23 | |||||||||
Cash distributions declared per Common Unit | $ | 2.7175 | $ | 2.4700 | $ | 2.2300 | $ | 2.0150 | $ | 1.8225 | |||||||||
Balance Sheet Data (at end of period): | |||||||||||||||||||
Current assets | $ | 359,569 | $ | 306,316 | $ | 355,366 | $ | 535,223 | $ | 404,034 | |||||||||
Total assets (2) | $ | 5,702,592 | $ | 5,459,599 | $ | 3,210,624 | $ | 2,848,528 | $ | 2,101,902 | |||||||||
Long-term liabilities (2) | $ | 3,321,739 | $ | 3,136,712 | $ | 1,618,276 | $ | 1,304,238 | $ | 872,756 | |||||||||
Partners' capital: | |||||||||||||||||||
Common unitholders | 2,130,331 | 2,029,101 | 1,229,203 | 1,097,737 | 916,495 | ||||||||||||||
Noncontrolling interests | (10,281 | ) | (8,350 | ) | — | — | — | ||||||||||||
Total partners’ capital | $ | 2,120,050 | $ | 2,020,751 | $ | 1,229,203 | $ | 1,097,737 | $ | 916,495 | |||||||||
Other Data: | |||||||||||||||||||
Volumes: | |||||||||||||||||||
Offshore crude oil pipeline (barrels per day) (3) | 657,105 | 579,977 | 446,548 | 404,787 | 359,387 | ||||||||||||||
Onshore crude oil pipeline (barrels per day) | 114,130 | 144,084 | 116,225 | 104,026 | 92,897 | ||||||||||||||
Natural gas transportation volumes (MMBtus/d) | 679,862 | 708,556 | — | — | — | ||||||||||||||
CO2 pipeline (Mcf per day) | 97,955 | 161,409 | 173,770 | 190,274 | 186,479 | ||||||||||||||
NaHS sales (DST) | 125,766 | 127,063 | 150,038 | 147,297 | 142,712 | ||||||||||||||
NaOH sales (DST) | 80,021 | 86,914 | 94,693 | 87,463 | 77,492 | ||||||||||||||
Crude oil and petroleum products sales (barrels per day) | 62,484 | 91,074 | 99,139 | 99,651 | 79,174 | ||||||||||||||
(1) | Our operating results and financial position have been affected by acquisitions. For additional information regarding our acquisitions and divestitures during 2016, 2015 and 2014, see Note 3 to our Consolidated Financial Statements included in Item 8. |
43
(2) | As relating to new accounting guidance issued by the FASB which we adopted in 2015, our long-term liabilities and total assets for all years presented reflect changes in presentation of debt issuance costs as a direct reduction of related debt liabilities with amortization of debt issuance costs reported as interest expense. |
(3) | Volume data is inclusive of the SEKCO pipeline. |
Item 7. Management’s Discussion and Analysis of Financial Condition and Results of Operations
Introduction
We are a growth-oriented master limited partnership formed in Delaware in 1996 and focused on the midstream segment of the crude oil and natural gas industry primarily in the Gulf Coast region of the United States and Wyoming. We have a diverse portfolio of assets, including pipelines, refinery-related plants, storage tanks and terminals, railcars, rail loading and unloading facilities, trucks, barges and a product tanker. We provide an integrated suite of services to refiners, crude oil and natural gas producers, and industrial and commercial enterprises. We currently have two distinct, complimentary types of operations: (i) our refinery-centric operations located primarily in the Gulf Coast region of the U.S., which focus on a suite of services primarily to refiners (as reported in our refinery services, marine transportation and supply and logistics business segments), and (ii) our offshore Gulf of Mexico crude oil and natural gas pipeline transportation and handling operations, which focus on providing a suite of services primarily to integrated and large independent energy companies who make intensive capital investments (often in excess of billions of dollars) to develop numerous large-reservoir, long-lived crude oil and natural gas properties. We conduct our operations and own our operating assets through our subsidiaries and joint ventures.
Included in Management’s Discussion and Analysis are the following sections:
• | Overview of 2016 Results |
• | Acquisitions, Divestitures and Growth Initiatives |
• | Results of Operations |
• | Other Consolidated Results |
• | Financial Measures |
• | Liquidity and Capital Resources |
• | Commitments and Off-Balance Sheet Arrangements |
• | Critical Accounting Policies and Estimates |
• | Recent Accounting Pronouncements |
Overview of 2016 Results
We reported Net Income Attributable to Genesis Energy, L.P. of $113.2 million, or $1.00 per common unit, in 2016 compared to Net Income Attributable to Genesis Energy, L.P. of $422.5 million, or $4.10 per common unit, in 2015. The large decrease was principally due to the $332.4 million non-cash gain we recognized during 2015 resulting from a step up in basis to fair value of our historical interests in certain of our equity investees (CHOPS and SEKCO) as a result of our acquiring the remaining interest in those equity investees when we completed our Enterprise acquisition in July 2015. Exclusive of that 2015 non-cash gain, our net income attributable to Genesis Energy, L.P. of $113.2 million for 2016 would be compared to net income attributable to Genesis Energy, L.P. of $90.1 million for 2015, representing an increase of $23.1 million, or 26%.
That $23.1 million increase in our net income (as well as Segment Margin) was principally due to increases attributable to our offshore pipeline transportation segment (primarily resulting from contributions from our offshore Gulf of Mexico assets we acquired from Enterprise in July 2015) as partially offset by smaller decreases in our other segments. In addition, a portion of the increase is attributable to a non-cash loss on debt extinguishment recognized during 2015 of $19.2 million, as well as a $19.4 million decrease in general and administrative expenses relating to certain third party costs in 2015 (primarily financing, legal and accounting) primarily related to financing the offshore Gulf of Mexico assets we acquired from Enterprise.
The above factors benefiting Net Income Attributable to Genesis Energy, L.P. were partially offset by a $39.4 million increase in interest expense attributable to additional long term debt outstanding and a $72.1 million increase in depreciation and amortization expense. Both of these items are the result of the effect of recently acquired and constructed assets placed in service (and the associated financing of these items), in particular those offshore pipelines and services assets acquired as a result of our Enterprise acquisition.
Cash flow from operating activities was $298.3 million for the 2016 compared to $289.5 million for 2015.
44
Available Cash before Reserves (as defined below in "Financial Measures") increased $52.8 million in 2016 to $384.2 million as compared to 2015 Available Cash before Reserves of $331.4 million. See "Financial Measures" below for additional information on Available Cash before Reserves.
Segment Margin (as defined below in "Financial Measures") was $569.6 million in 2016, an increase of $93.0 million, or 20%, as compared to 2015. Consistent with net income, this increase resulted primarily from increases attributable to our offshore pipeline transportation segment partially offset by smaller decreases in our other segments.
Given the continuing challenging operating environment in the energy midstream space, we continue to be pleased with the financial performance of our diversified, yet increasingly integrated, businesses.
Our significant infrastructure projects in the Baton Rouge area were substantially completed in the fourth quarter, and we anticipate completing our repurposing project in Texas in the second quarter of 2017. We would expect to see contributions from these projects to continue to ramp throughout this year and into 2018. At Raceland, we would expect to see volumes start to ramp in mid-2017 as we will be fully capable of receiving and terminaling heavy crudes via rail and medium sour crudes via pipeline.
While we are a bit behind schedule and might arguably have a slightly slower ramp from these major investments, we are very excited and have many reasons to believe that we will ultimately exceed our average base case economics across the projects. The momentum for the rest of this year and into 2018 positions us to do reasonably well even if things don’t improve in late 2017 or 2018. Given our recent and continuing actions to increase liquidity and strengthen our balance sheet, we believe we are well positioned to continue to deliver long term value to all of our stakeholders without ever losing our absolute commitment to safe, reliable and responsible operations.
Our primary objective continues to be to deliver the best value to our unitholders while never wavering from our commitment to safe and responsible operations. A lot has changed, we recognize, in how the market apparently values unit prices for MLPs or other midstream entities over the last year and a half to two years. The move to eliminate our IDR’s over six years ago and our track record of delivering annualized double-digit growth in distributions were historically rewarded. However, we have recently concluded the valuation metrics demanded by the markets have changed in recent times, especially in light of numerous freezes, cuts or total elimination of distributions over the recent energy business cycle by other entities in our space with which we compete commercially and/or for external capital.
We now believe the best way to promote unit price appreciation under current conditions is to exercise strong financial discipline designed primarily to maintain and enhance our financial flexibility across the business cycle. We believe prospectively we can naturally restore our financial flexibility with cash flows from operations. During 2016, we accelerated that process by issuing additional equity and lowering the future growth rate of quarterly distributions.
On July 27, 2016, we closed a public offering of 8,000,000 common units generating net proceeds of approximately $298.0 million. As a practical matter, we would have issued such additional equity a year ago at the time of closing our Enterprise acquisition had markets been stronger at that point. This 2016 equity raise instantly improved our liquidity and credit metrics.
We believe our increased liquidity and even stronger balance sheet resulting from such actions should combine to give us the flexibility to continue to pursue acquisitions and/or organic projects that we feel are consistent with delivering long term value to all of our stakeholders. We also believe that our improved credit profile has the potential to significantly lower the future costs of refinancing our public debt when certain tranches become due beginning in 2021 or callable beginning in 2017.
A more detailed discussion of our segment results and other costs is included below in "Results of Operations".
Distribution Increase
In January 2017, we declared our forty-sixth consecutive increase in our quarterly distribution to our common unitholders relative to the fourth quarter of 2016. In February 2017, we paid a distribution of $0.7100 per unit related to the fourth quarter of 2016, representing an 8.4% increase from our distribution of $0.6550 per unit related to the fourth quarter of 2015.
Segment Reporting Change
In the fourth quarter of 2016, we reorganized our operating segments as a result of the way our Chief Executive Officer, who is our chief operating decision maker, evaluates the performance of operations, develops strategy and allocates resources. The results of our onshore pipeline transportation segment, formerly reported under its own segment, are now reported in our supply and logistics segment. This change is consistent with the increasingly integrated nature of our onshore operations.
45
As a result of the above changes, we currently manage our businesses through four divisions that constitute our reportable segments - offshore pipeline transportation, refinery services, marine transportation, and supply and logistics. Our disclosures related to prior periods have been recast to reflect our reorganized segments.
Acquisitions, Divestitures and Growth Initiatives
Houston Area Crude Oil Pipeline and Terminal Infrastructure
We are constructing new, and expanding existing, crude oil pipeline and terminal facilities in Webster, Texas and Texas City, Texas as a result of expanding our crude oil pipeline and terminal infrastructure in the Houston area. We are constructing a new crude oil pipeline that will deliver crude oil received from upstream crude oil pipelines (including CHOPS, which delivers crude oil originating in the deepwater Gulf of Mexico to the Texas City area) to our new Texas City Terminal, which will ultimately connect to our existing 18-inch Webster to Texas City crude oil pipeline. Our new Texas City Terminal will initially include approximately 750,000 barrels of crude oil tankage. As a part of this project, we are also making the necessary upgrades on our existing 18-inch Webster to Texas City crude oil pipeline to reverse the direction of flow. The result of this expanded crude oil infrastructure will allow additional optionality to Houston and Baytown area refineries, including the ExxonMobil Baytown refinery, its largest refinery in the U.S.A., and provide additional delivery outlets for other crude oil pipelines. We expect these assets to become operational in the first half of 2017.
Raceland Terminal and Crude Oil Pipeline
We are constructing a new crude oil terminal and pipeline in Raceland, Louisiana that will be connected to existing midstream infrastructure that will provide further distribution to the Louisiana refining markets. Our new Raceland Terminal will consist of 515,000 barrels of crude oil tankage and unit train unloading facilities capable of unloading up to two unit trains per day. We are constructing a new crude oil pipeline that will deliver crude oil received from the Poseidon system, which currently delivers crude oil originating in the deepwater Gulf of Mexico to the Houma, Louisiana area, to our Raceland Terminal for further distribution. We expect these assets to become fully operational in the first half of 2017.
Inland Marine Barge Transportation Expansion
We ordered 28 new-build barges and 18 new-build push boats for our inland marine barge transportation fleet. We
have accepted delivery of 20 of those barges and 14 of those push boats through December 2016. We expect to take delivery of those remaining vessels periodically into 2017.
Baton Rouge Terminal
We constructed a new crude oil, intermediates and refined products import/export terminal in Baton Rouge that is located near the Port of Greater Baton Rouge and is pipeline-connected to the port's existing deepwater docks on the Mississippi River. We constructed approximately 1.1 million barrels of tankage for the storage of crude oil, intermediates and/or refined products with the capability to expand to provide additional terminaling services to our customers. In addition, we constructed a new pipeline from the terminal that will allow for deliveries to existing Exxon Mobil facilities in the area, as well as connect our previously constructed 17-mile line to the terminal allowing for receipts from the Scenic Station Rail Facility. Shippers to Scenic Station will have access to both the local Baton Rouge refining market, as well as the ability to access other attractive refining markets via our Baton Rouge Terminal. The Baton Rouge Terminal and related facilities became operational in the fourth quarter of 2016.
Wyoming Crude Oil Pipeline
In the third quarter of 2015, we completed construction of a new 60 mile crude oil pipeline to transport crude oil from new receipt point stations in Campbell County and Converse County, Wyoming to our existing Pronghorn Rail Facility. This new crude oil pipeline has an initial capacity of approximately 30,000 barrels per day and is supplied by truck volumes and third party gathering infrastructure in the Powder River Basin.
We also constructed a new 75 mile pipeline from our Pronghorn Rail Facility to a delivery point at our new Guernsey Station in Platte County, Wyoming. This Pronghorn to Guernsey pipeline has an initial capacity of approximately 45,000 barrels per day and will allow for connectivity to additional downstream pipeline markets at Guernsey, including regional refineries and Cushing, Oklahoma via the Pony Express Pipeline. This pipeline became operational in the first quarter of 2016.
Acquisition of Enterprise Offshore Pipelines and Services Business
In July 2015, we acquired the offshore pipeline and services business of Enterprise Products Partners, L.P. and its affiliates for approximately $1.5 billion, subject to certain adjustments. That business included interests in approximately 2,350 miles of offshore crude oil and natural gas pipelines and six offshore hub platforms that serve some of the most active drilling and development regions in the United States, including deepwater production fields in the Gulf of Mexico offshore Texas,
46
Louisiana, Mississippi and Alabama. That acquisition complemented and substantially expanded our existing offshore pipelines segment and was immediately accretive to Net Income, Segment Margin and Available Cash before Reserves.
Results of Operations
In the discussions that follow, we will focus on our revenues, expenses and net income, as well as two measures that we use to manage the business and to review the results of our operations-Segment Margin and Available Cash before Reserves. Segment Margin and Available Cash before Reserves are defined in the "Financial Measures" section below.
Revenues, Costs and Expenses and Net Income Attributable to Genesis Energy L.P.
Our revenues for the year ended December 31, 2016 decreased $534.0 million, or 24%, from the year ended December 31, 2015. Additionally, our costs and expenses decreased $583.6 million, or 28%, between the two periods.
A substantial majority of our revenues and costs are derived from the purchase and sale of crude oil and petroleum products through our supply and logistics segment. The significant decrease in our revenues and costs between the two years is primarily attributable to decreases in market prices for such purchases and sales. In general, we do not expect fluctuations in prices for crude oil and natural gas to materially affect our net income, Available Cash before Reserves or Segment Margin to the same extent they affect our revenues and costs. We have limited our direct commodity price exposure through the broad use of fee based service contracts, back-to-back purchase and sale arrangements, and hedges. As a result, changes in the price of oil would generally have a proportionate impact on both our revenues and our costs, with a disproportionately smaller net impact on our Segment Margin. The same correlation would be true in the case of higher crude oil and petroleum products prices.
As discussed throughout this document, we have some indirect exposure to certain changes in prices for oil and petroleum products, particularly if they are significant and extended. We tend to experience more demand for certain of our services when prices increase significantly over extended periods of time, and we tend to experience less demand for certain of our services when prices decrease significantly over extended periods of time. For additional information regarding certain of our indirect exposure to commodity prices, see our segment-by-segment analysis below and the previous section entitled “Risks Related to Our Business”.
Although prices of crude oil have partially recovered since December 31, 2015, prices were lower on average in the year ending on December 31, 2016 compared to the same period in 2015. The average closing prices for West Texas Intermediate ("WTI") crude oil on the New York Mercantile Exchange ("NYMEX") decreased 11% to $43.32 per barrel in 2016, as compared to $48.79 per barrel in 2015. We would expect changes in crude oil prices to continue to proportionately affect our revenues and costs attributable to our purchase and sale of crude oil and petroleum products, producing minimal direct impact on Segment Margin from those operations. However, due to the indirect exposure to changes in prices discussed above and in the discussion surrounding our supply and logistics segment, crude oil and petroleum product sales volumes decreased 31% in 2016 as compared to 2015.
We currently have two distinct, complementary types of operations: (i) our onshore-based refinery-centric crude oil and refined petroleum products transportation, supply and logistics, and handling operations, focusing predominantly on refinery-centric customers (as opposed to producers), and (ii) our offshore Gulf of Mexico crude oil and natural gas pipeline transportation and handling operations, focusing on integrated and large independent energy companies who make intensive capital investments (often in excess of billions of dollars) to develop numerous large reservoir, long-lived crude oil and natural gas properties. Refiners are the shippers of approximately 80% of the volumes transported on our onshore crude pipelines, and refiners contract for approximately 80% of the use of our inland barges, which are used primarily to transport intermediate refined products (not crude oil) between refining complexes. The shippers on our offshore pipelines are mostly integrated and large independent energy companies who have developed, and continue to explore for, numerous large-reservoir, long-lived crude oil properties whose production is ideally suited for the vast majority of refineries along the Gulf Coast, unlike the lighter crude oil and condensates produced from numerous onshore shale plays. Those large-reservoir properties and the related pipelines and other infrastructure needed to develop them are capital intensive and yet, we believe, economically viable, in most cases, even in this lower commodity price environment. Given these facts, we do not expect changes in commodity prices to impact our net income, Available Cash before Reserves or Segment Margin in the same manner in which they impact our revenues and costs derived from the purchase and sale of crude oil and petroleum products.
Net Income Attributable to Genesis Energy L.P. decreased $309.3 million in 2016 from 2015. See "Overview of 2016 Results" above for additional discussion, including discussion of the one-time $332.4 million gain recognized in 2015.
Revenues in 2015 decreased $1,599.6 million, or 42%, from 2014. Additionally, our costs and expenses from decreased $1,624.0 million, or 44%, between the two periods. The significant decrease in our revenues and costs between 2015 and 2014 is primarily attributable to the decrease in market prices for crude oil and petroleum products between the two periods. The average closing prices for WTI crude oil on the NYMEX decreased 48% to $48.79 per barrel in 2015, as compared
47
to $93.00 per barrel in 2014. Net Income Attributable to Genesis Energy L.P. increased $316.3 million in 2015 to $422.5 million from $106.2 million in 2014. The increase in net income during 2015 was primarily due to an increase in assets placed in service in both the offshore pipeline transportation and marine transportation segments, as well as the $332.4 million non-cash gain we recognized during 2015 resulting from a step up in basis to fair value of our historical interests in certain of our equity investees (CHOPS and SEKCO) as a result of our acquiring the remaining interest in those equity investees when we completed our Enterprise acquisition in July 2015.
Included below is additional detailed discussion of the results of our operations focusing on Segment Margin and other costs including general and administrative expenses, depreciation and amortization, interest and income taxes.
Segment Margin
The contribution of each of our segments to total Segment Margin in each of the last three years was as follows:
Year Ended December 31, | |||||||||||
2016 | 2015 | 2014 | |||||||||
(in thousands) | |||||||||||
Offshore pipeline transportation | 336,620 | 197,723 | 71,598 | ||||||||
Refinery services | 79,508 | 80,246 | 84,851 | ||||||||
Marine transportation | 70,079 | 103,222 | 86,239 | ||||||||
Supply and logistics | 83,364 | 95,394 | 104,576 | ||||||||
Total Segment Margin | $ | 569,571 | $ | 476,585 | $ | 347,264 | |||||
48
Year Ended December 31, 2016 Compared with Year Ended December 31, 2015
Offshore Pipeline Transportation Segment
Operating results and volumetric data for our offshore pipeline transportation segment are presented below:
Year Ended December 31, | |||||||
2016 | 2015 | ||||||
(in thousands) | |||||||
Offshore crude oil pipeline revenue | $ | 270,454 | $ | 115,640 | |||
Offshore natural gas pipeline revenue | 64,225 | 24,590 | |||||
Offshore pipeline operating costs, excluding non-cash expenses | (72,009 | ) | (39,685 | ) | |||
Distributions from equity investments | 84,321 | 94,361 | |||||
Other | (10,371 | ) | 2,817 | ||||
Offshore Pipeline Transportation Segment Margin(1) | $ | 336,620 | $ | 197,723 | |||
Volumetric Data 100% basis: | |||||||
Crude oil pipelines (average barrels/day unless otherwise noted): | |||||||
CHOPS | 204,533 | 172,647 | |||||
Poseidon | 262,829 | 259,568 | |||||
Odyssey | 106,933 | 72,958 | |||||
GOPL (2) | 7,468 | 13,038 | |||||
Total crude oil offshore pipelines | 581,763 | 518,211 | |||||
SEKCO (3) | 75,342 | 61,766 | |||||
Natural gas transportation volumes (MMBtus/d) (4) | 679,862 | 708,556 | |||||
Volumetric Data net to our ownership interest (5): | |||||||
Crude oil pipelines (average barrels/day unless otherwise noted): | |||||||
CHOPS | 204,533 | 124,928 | |||||
Poseidon | 168,211 | 115,219 | |||||
Odyssey | 31,011 | 21,158 | |||||
GOPL (2) | 7,468 | 13,038 | |||||
Total crude oil offshore pipelines | 411,223 | 274,343 | |||||
SEKCO (3) | 75,342 | 47,705 | |||||
Natural gas transportation volumes (MMBtus/d) (4) | 398,190 | 420,464 | |||||
(1) | Offshore Pipeline Transportation Segment Margin includes approximately $84 million and $94 million of distributions received from our offshore pipeline joint ventures accounted for under the equity method of accounting in 2016 and 2015, respectively. |
(2) | One of our wholly-owned subsidiaries (GEL Offshore Pipeline, LLC, or "GOPL") owns our undivided interest in the Eugene Island pipeline system. |
(3) | Though our SEKCO volumes flow through both SEKCO and Poseidon, we include those volumes only once in the table above. |
(4) | Represents volumes per day from the period the pipelines and related assets were acquired in July 2015. |
(5) | Volumes are the product of our effective ownership interest throughout the year, including changes in ownership interest, multiplied by the relevant throughput over the given year. |
Offshore Pipeline Transportation Segment Margin for 2016 increased $139 million, or 70%, from 2015. This increase is primarily due to our Enterprise acquisition, which closed on July 24, 2015. As a result of our Enterprise acquisition, we obtained interests in approximately 2,350 miles of offshore crude oil and natural gas pipelines (including increasing our
49
ownership interest in each of the Poseidon, SEKCO, and CHOPS pipelines) and six offshore hub platforms. The operating results of the offshore pipeline assets acquired from Enterprise continue to meet or exceed our expectations, with a net increase in volumes (compared to the year ended December 31, 2015) for the most significant of those offshore crude oil pipelines. In addition, this increase was partially the result of 2016 drilling activity which predominantly occurred near existing infrastructure due to the attractive economics in current pricing conditions. Our extensive pipeline network benefited ratably from this activity.
Refinery Services Segment
Operating results for our refinery services segment were as follows:
Year Ended December 31, | |||||||
2016 | 2015 | ||||||
Volumes sold (in Dry short tons "DST"): | |||||||
NaHS volumes | 125,766 | 127,063 | |||||
NaOH (caustic soda) volumes | 80,021 | 86,914 | |||||
Total | 205,787 | 213,977 | |||||
Revenues (in thousands): | |||||||
NaHS revenues | $ | 136,240 | $ | 137,825 | |||
NaOH (caustic soda) revenues | 39,413 | 42,746 | |||||
Other revenues | 5,012 | 6,686 | |||||
Total external segment revenues | $ | 180,665 | $ | 187,257 | |||
Segment Margin (in thousands) | $ | 79,508 | $ | 80,246 | |||
Average index price for NaOH per DST (1) | $ | 645 | $ | 581 | |||
(1) | Source: IHS Chemical |
Refinery Services Segment Margin for 2016 decreased $0.7 million, or 1%, from 2015. The significant components of this fluctuation were as follows:
• | During 2016, our NaHS business was able to realize more benefits from our favorable management of the purchasing (including economies of scale) and utilization of caustic soda in our (and our customers') operations and our logistics management capabilities, as compared to 2015. The fluctuation in NaHS revenues and volumes had a minimal impact on Segment Margin. |
• | Caustic soda revenues decreased 8% due to a decrease in caustic soda sales volumes. The impact on Segment Margin, compared to 2015, from these reduced caustic soda sales is approximately $2.4 million. |
• | Average index prices for caustic soda increased to $645 per DST during 2016 compared to $581 per DST during 2015. Those price movements affect the revenues and costs related to our sulfur removal services as well as our caustic soda sales activities. Typically, changes in caustic soda prices do not materially affect Segment Margin attributable to our sulfur processing services because the pricing in many of our sales contracts for NaHS typically includes adjustments for fluctuations in commodity benchmarks (primarily caustic soda), freight, labor, energy costs and government indexes. The frequency at which those adjustments are applied varies by contract, geographic region and supply point. The mix of NaHS sales volumes to which we are able to apply such adjustments may vary due to timing or other factors such as competitive pressures. To the extent we are unable to pass these caustic soda price changes onto our customers, Segment Margin may be impacted. Additionally, our bulk purchase and storage capabilities related to caustic soda allow us to somewhat mitigate the effects of changes in index prices for caustic soda on our operating costs. |
50
Marine Transportation Segment
Within our marine transportation segment, we own a fleet of 83 barges (74 inland and 9 offshore) with a combined transportation capacity of 2.9 million barrels, 43 push/tow boats (34 inland and 9 offshore), and a 330,000 barrel ocean going tanker, the M/T American Phoenix. Operating results for our marine transportation segment were as follows:
Year Ended December 31, | |||||||
2016 | 2015 | ||||||
Revenues (in thousands): | |||||||
Inland freight revenues | $ | 88,502 | $ | 95,588 | |||
Offshore freight revenues | 85,594 | 102,281 | |||||
Other rebill revenues (1) | 38,925 | 40,888 | |||||
Total segment revenues | $ | 213,021 | $ | 238,757 | |||
Operating costs, excluding non-cash charges for equity-based compensation and other non-cash expenses | $ | 142,942 | $ | 135,535 | |||
Segment Margin (in thousands) | $ | 70,079 | $ | 103,222 | |||
Fleet Utilization: (2) | |||||||
Inland Barge Utilization | 91.4 | % | 96.7 | % | |||
Offshore Barge Utilization | 90.5 | % | 98.7 | % | |||
(1) Under certain of our marine contracts, we "rebill" our customers for a portion of our operating costs.
(2) Utilization rates are based on a 365 day year, as adjusted for planned downtime and drydocking.
Marine Transportation Segment Margin for 2016 decreased $33.1 million, or 32%, from 2015. The decrease in Segment Margin is primarily due to a combination of lower utilization and lower day rates across our various marine asset classes, excepting the M/T American Phoenix which is under long term contract through September 2020. In our offshore barge fleet, as a number of our units have come off longer term contracts, we have chosen to primarily place them in spot service or short-term (less than a year) service, as we believe the day rates currently being offered by the market are at, or approaching, cyclical lows. In addition, our offshore barge fleet has experienced some volume cannibalization due to excess capacity issues that have arisen as new tankers and barges have been placed into service in anticipation of domestic crude oil volumes that have not yet and may not materialize. Such excess capacity may require a significant amount of time to resolve. In our inland fleet, we saw somewhat of a strengthening in utilization and stabilization in spot day rates towards the end of the year, especially in the black oil, or heavy, intermediate refined products trade, the trade to which we have almost exclusively committed our inland barges.
Supply and Logistics Segment
Our supply and logistics segment utilizes an integrated set of pipelines and terminals, as well as trucks, railcars, and barges to facilitate the movement of crude oil and refined products on behalf of producers, refiners and other customers. This segment includes crude oil and refined products pipelines, terminals, rail facilities and CO2 pipelines operating primarily within the United States Gulf Coast and Rocky Mountain crude oil markets. In addition, we utilize our railcar and trucking fleets that support the purchase and sale of gathered and bulk purchased crude oil, as well as purchased and sold refined products. This fleet includes approximately 200 trucks, 400 trailers, 523 railcars, and 4.6 million barrels of leased and owned storage capacity. Through these assets we offer our customers a full suite of services, including the following:
• | facilitating the transportation of crude oil from producers to refineries and from owned and third party terminals to refiners via pipelines; |
• | transporting CO2 from natural and anthropogenic sources to crude oil fields owned by our customers; |
• | shipping crude oil and refined products to and from producers and refiners via trucks, railcars and pipelines; |
• | loading and unloading railcars at our crude-by-rail terminals; |
• | storing and blending of crude oil and intermediate and finished refined products; |
51
• | purchasing/selling and/or transporting crude oil from the wellhead to markets for ultimate use in refining; and |
• | purchasing products from refiners, transporting those products to one of our terminals and blending those products to a quality that meets the requirements of our customers and selling those products (primarily fuel oil, asphalt and other heavy refined products) to wholesale markets; |
We also may use our terminal facilities to take advantage of contango market conditions for crude oil gathering and marketing and to capitalize on regional opportunities which arise from time to time for both crude oil and petroleum products.
Despite crude oil being considered a somewhat homogeneous commodity, many refiners are very particular about the quality of crude oil feedstock they process. Many U.S. refineries have distinct configurations and product slates that require crude oil with specific characteristics, such as gravity, sulfur content and metals content. The refineries evaluate the costs to obtain, transport and process their preferred feedstocks. That particularity provides us with opportunities to help the refineries in our areas of operation identify crude oil sources and transport crude oil meeting their requirements. The imbalances and inefficiencies relative to meeting the refiners’ requirements may also provide opportunities for us to utilize our purchasing and logistical skills to meet their demands. The pricing in the majority of our crude oil purchase contracts contains a market price component and a deduction to cover the cost of transportation and to provide us with a margin. Contracts sometimes contain a grade differential which considers the chemical composition of the crude oil and its appeal to different customers. Typically, the pricing in a contract to sell crude oil will consist of the market price components and the grade differentials. The margin on individual transactions is then dependent on our ability to manage our transportation costs and to capitalize on grade differentials.
In our refined products marketing operations, we supply primarily fuel oil, asphalt and other heavy refined products to wholesale markets and some end-users such as paper mills and utilities. We also provide a service to refineries by purchasing “heavier” petroleum products that are the residual fuels from gasoline production, transporting them to one of our terminals and blending them to a quality that meets the requirements of our customers.
52
Operating results for our supply and logistics segment were as follows:
Year Ended December 31, | |||||||
2016 | 2015 | ||||||
(in thousands) | |||||||
Gathering, marketing, and logistics revenue | $ | 930,347 | $ | 1,612,570 | |||
Crude oil and CO2 pipeline tariffs and revenues from direct financing leases of CO2 pipelines | 58,567 | 68,265 | |||||
Payments received under direct financing leases not included in income | 6,277 | 5,685 | |||||
Crude oil and products costs, excluding unrealized gains and losses from derivative transactions | (823,780 | ) | (1,479,972 | ) | |||
Operating costs, excluding non-cash charges for equity-based compensation and other non-cash expenses | (94,592 | ) | (116,842 | ) | |||
Other | 6,545 | 5,688 | |||||
Segment Margin | $ | 83,364 | $ | 95,394 | |||
Volumetric Data (average barrels/day unless otherwise noted): | |||||||
Onshore crude oil pipelines: | |||||||
Texas | 33,814 | 71,906 | |||||
Jay | 14,815 | 16,828 | |||||
Mississippi | 10,247 | 15,472 | |||||
Louisiana (1) | 44,295 | 32,481 | |||||
Wyoming (2) | 10,959 | 7,397 | |||||
Onshore crude oil pipelines total | 114,130 | 144,084 | |||||
CO2 pipeline (average Mcf/day): | |||||||
Free State | 97,955 | 161,409 | |||||
Crude oil and petroleum products sales: | |||||||
Total crude oil and petroleum products sales | 62,484 | 91,074 | |||||
Rail load/unload volumes (3) | 19,691 | 27,044 | |||||
(1) | Total daily volume for the twelve months ended December 31, 2016, includes 8,997 barrels per day of refined products associated with our new Port of Baton Rouge Terminal pipelines which became operational in the fourth quarter of 2016. |
(2) | Represents volumes per day from the period the pipeline began operations in August of 2015. |
(3) | Indicates total barrels for either loading or unloading at all rail facilities. |
Segment Margin for our supply and logistics segment decreased $12 million, or 13% , in 2016 as compared to 2015. The most significant components of this change are discussed below.
• | With respect to our crude oil and CO2 pipelines, revenues decreased $9.7 million, or 14%, principally due to a net decrease in throughput volumes of 29,954 barrels per day, or 21%. This was primarily the result of decreased volumes on our Texas pipeline system, particularly delivery volumes to the Texas City refining market. We believe such lower volumes to historical customers will last indefinitely as those customers have made alternative arrangements as a result of our endeavors to expand, extend and repurpose our facilities into longer lived, higher value service. This decrease was partially offset by an increase in volumes on our Louisiana system, as our new Port of Baton Rouge Terminal and Anchorage Tank Farm crude oil and refined products pipelines began flowing volumes during the fourth quarter of 2016. Volume variances on our other onshore pipeline systems had a less significant impact on the decrease in tariff revenues between the respective quarters due to a mix of tariff rates amongst these systems and less significant decreases in volumes. Although volumes on our Free State CO2 pipeline system decreased, that decrease had a much smaller effect on the contributions to Segment Margin by that pipeline given the “incentive” tariff on this system which results in fluctuations in volumes above a base level on our Free State CO2 pipeline system having a limited impact on Segment Margin. |
53
• | The decrease in our Segment Margin is also partially due to lower demand for our services in our historical back-to-back, or buy/sell, crude oil marketing business associated with aggregating and trucking crude oil from producers' leases to local or regional re-sale points. We have found it difficult to compete with certain participants in the market who are willing to lose money on local gathering because they are attempting to minimize their losses from minimum volume or take-or-pay commitments they previously made in anticipation of new production that has not yet and is unlikely to come online. |
• | These decreases were partially offset by the improved performance of our now right-sized heavy fuel oil business after reducing volumes and related infrastructure to match new market realities resulting from the general lightening of refineries' crude slates which has resulted in a better supply/demand balance between heavy refined bottoms and domestic coker and asphalt requirements. |
• | While rail volumes were down compared to 2015, these results had a less significant impact on Segment Margin due to minimum volume commitments on certain of our facilities and our results reflect a ramp up in the fourth quarter of 2016 following the emergence from a refinery turnaround during the third quarter of 2016 by a major refinery customer supported by our Baton Rouge facilities. |
Other Costs and Interest
General and administrative expenses
Year Ended December 31, | |||||||
2016 | 2015 | ||||||
(in thousands) | |||||||
General and administrative expenses not separately identified below: | |||||||
Corporate | $ | 35,841 | $ | 37,922 | |||
Segment | 3,264 | 3,608 | |||||
Equity-based compensation plan expense | 4,575 | 4,564 | |||||
Third party costs related to business development activities and growth projects | 1,945 | 18,901 | |||||
Total general and administrative expenses | $ | 45,625 | $ | 64,995 | |||
Total general and administrative expenses decreased $19 million between 2016 and 2015. This decrease was principally due to higher third party costs, primarily financing, legal and accounting, related to business development and growth activities (primarily related to third party costs incurred for business development activities surrounding our Enterprise acquisition) incurred during 2015.
Depreciation and amortization expense
Year Ended December 31, | |||||||
2016 | 2015 | ||||||
(in thousands) | |||||||
Depreciation on fixed assets | $ | 193,976 | $ | 124,207 | |||
Amortization of intangible assets | 24,310 | 20,044 | |||||
Amortization of CO2 volumetric production payments | 3,910 | 5,889 | |||||
Total depreciation and amortization expense | $ | 222,196 | $ | 150,140 | |||
Total depreciation and amortization expense increased $72 million between 2016 and 2015 primarily as a result of acquiring assets and placing constructed assets' in service during calendar 2015 (including the offshore pipelines and services assets acquired as a result of our Enterprise acquisition) and 2016.
Interest expense, net
54
Year Ended December 31, | |||||||
2016 | 2015 | ||||||
(in thousands) | |||||||
Interest expense, senior secured credit facility (including commitment fees) | $ | 41,948 | $ | 23,072 | |||
Interest expense, senior unsecured notes | 114,437 | 87,326 | |||||
Amortization and write-off of debt issuance costs and premium | 10,138 | 7,266 | |||||
Capitalized interest | (26,576 | ) | (17,068 | ) | |||
Net interest expense | $ | 139,947 | $ | 100,596 | |||
Net interest expense increased $39 million during 2016 primarily due to an increase in our average outstanding indebtedness associated with newly acquired and constructed assets, primarily related to additional debt outstanding as a result of financing our Enterprise acquisition. In July 2015, we issued an additional $750 million of aggregate principal amount of 6.75% senior unsecured notes to fund a portion of the purchase price for our Enterprise acquisition. Capitalized interest costs increased in 2016 due to our growth capital expenditures for projects still under construction when compared to the prior year.
Other Consolidated Results
Net income included an unrealized loss on derivative positions, excluding fair value hedges, of $1.3 million in 2016 and an unrealized gain of $1.0 million in 2015. Those amounts are included in supply and logistics product costs in the Condensed Consolidated Statement of Operations and are not a component of Segment Margin. Net income in 2016 also included a charge of $6.0 million for a non-cash valuation allowance related to the collectibility of certain disputed receivables and claims.
As a result of acquiring the remaining 50% interest in CHOPS and SEKCO in our Enterprise acquisition, we recognized a $332.4 million gain during 2015 relating to the effects of the re-measurement of our pre-acquisition historical interest (prior to that acquisition, we owned 50% of each of CHOPS and SEKCO) at fair value based on accounting guidance involving step acquisitions. A more detailed discussion of our enterprise acquisition is included under "Liquidity and Capital Resources".
2015 also includes a loss of approximately $19.2 million that was recognized in relation to the early retirement of $350 million of 7.875% senior unsecured notes.
Year Ended December 31, 2015 Compared with Year Ended December 31, 2014
Offshore Pipeline Transportation Segment
Operating results and volumetric data for our offshore pipeline transportation segment are presented below:
55
Year Ended December 31, | |||||||
2015 | 2014 | ||||||
(in thousands) | |||||||
Offshore crude oil pipeline revenue | $ | 115,640 | $ | 3,296 | |||
Offshore natural gas pipeline revenue | 24,590 | — | |||||
Offshore pipeline operating costs, excluding non-cash charges for equity-based compensation and other non-cash expenses | (39,685 | ) | (1,271 | ) | |||
Distributions from equity investments | 94,361 | 71,305 | |||||
Other | 2,817 | (1,732 | ) | ||||
Segment Margin (1) | $ | 197,723 | $ | 71,598 | |||
Volumetric Data 100% basis: | |||||||
Offshore crude oil pipelines (average barrels/day unless otherwise noted): | |||||||
CHOPS | 172,647 | 183,726 | |||||
Poseidon | 259,568 | 209,647 | |||||
Odyssey | 72,958 | 46,717 | |||||
GOPL(2) | 13,038 | 6,458 | |||||
Total crude oil offshore pipelines | 518,211 | 446,548 | |||||
SEKCO (3) | 61,766 | — | |||||
Natural gas transportation volumes (MMBtus/d) (4) | 708,556 | — | |||||
Volumetric Data net to our ownership interest (5): | |||||||
Offshore crude oil pipelines (average barrels/day unless otherwise noted): | |||||||
CHOPS | 124,928 | 91,863 | |||||
Poseidon | 115,219 | 58,701 | |||||
Odyssey | 21,158 | 13,548 | |||||
GOPL(2) | 13,038 | 6,458 | |||||
Total crude oil offshore pipelines | 274,343 | 170,570 | |||||
SEKCO (3) | 47,705 | — | |||||
Natural gas transportation volumes (MMBtus/d) (4) | 420,464 | — | |||||
(1) | Offshore Pipeline Transportation Segment Margin includes approximately $94 million and $71 million of distributions received from our offshore pipeline joint ventures accounted for under the equity method of accounting in 2015 and 2014, respectively. |
(2) | One of our wholly-owned subsidiaries (GEL Offshore Pipeline, LLC, or "GOPL") owns our undivided interest in the Eugene Island pipeline system. |
(3) | Our SEKCO pipeline was completed in June of 2014. Under the terms of SEKCO's transportation arrangements, its shippers commenced making minimum monthly payments at that time, even though they did not commence throughput of crude until January 2015. As our SEKCO volumes ultimately flow into Poseidon and thus are included within our Poseidon volume statistics, we have excluded them from our total for Offshore crude oil pipelines. |
(4) | Represents volumes per day from the period the pipelines and related assets were acquired in July 2015. |
(5) | Volumes are the product of our effective ownership interest throughout the year, including changes in ownership interest, multiplied by the relevant throughput over the given year. |
Offshore Pipeline Transportation Segment Margin for 2015 increased $126.1 million, or 176%, from 2014. This increase is primarily due to our Enterprise acquisition, which closed in July 2015.
56
Refinery Services Segment
Operating results for our refinery services segment were as follows:
Year Ended December 31, | |||||||
2015 | 2014 | ||||||
Volumes sold (in DST): | |||||||
NaHS volumes | 127,063 | 150,038 | |||||
NaOH (caustic soda) volumes | 86,914 | 94,693 | |||||
Total | 213,977 | 244,731 | |||||
Revenues (in thousands): | |||||||
NaHS revenues | $ | 137,825 | $ | 161,962 | |||
NaOH (caustic soda) revenues | 42,746 | 48,610 | |||||
Other revenues | 6,686 | 7,725 | |||||
Total external segment revenues | $ | 187,257 | $ | 218,297 | |||
Segment Margin (in thousands) | $ | 80,246 | $ | 84,851 | |||
Average index price for NaOH per DST (1) | $ | 581 | $ | 589 | |||
Raw material and processing costs as % of segment revenues | 39 | % | 43 | % | |||
(1) | Source: IHS Chemical |
Refinery services Segment Margin for 2015 increased $4.6 million, or 5%, from 2014. The significant components of this fluctuation were as follows:
• | NaHS revenues decreased 15% primarily due to a decrease in volumes. That decrease primarily resulted from lower total volumes than in 2015 attributable to the bankruptcy of one mining customer, reduced sales to a major customer as it works through an atypical ore seam as a result of a landslide, and increased prior year volumes generated from heavy turn around schedules at certain customers. |
• | We were able to realize benefits from our favorable management of the purchasing (including economies of scale) and utilization of caustic soda in our (and our customers') operations and our logistics management capabilities, which somewhat offset the effects on Segment Margin of decreased NaHS sales volumes. |
• | Caustic soda revenues decreased 12% due to a decrease in both caustic soda sales volumes and our sales price for caustic soda. Although caustic sales volumes may fluctuate, the contribution to Segment Margin from these sales is not a significant portion of our refinery services activities. |
• | Average index prices for caustic soda decreased to $581 per DST during 2015 compared to $589 per DST during 2014. Those price movements affect the revenues and costs related to our sulfur removal services as well as our caustic soda sales activities. However, generally changes in caustic soda index prices do not materially affect Segment Margin attributable to our sulfur processing services because we usually pass those costs through to our NaHS sales customers. Additionally, our bulk purchase and storage capabilities related to caustic soda allow us to somewhat mitigate the effects of changes in index prices for caustic soda on our operating costs. |
57
Marine Transportation Segment
Operating results for our marine transportation segment were as follows:
Year Ended December 31, | |||||||
2015 | 2014 | ||||||
Revenues (in thousands): | |||||||
Inland freight revenues | $ | 95,588 | $ | 92,311 | |||
Offshore freight revenues | 102,281 | 82,732 | |||||
Other rebill revenues (1) | 40,888 | 54,239 | |||||
Total segment revenues | $ | 238,757 | $ | 229,282 | |||
Operating Costs, excluding non-cash charges for equity-based compensation and other non-cash expenses | $ | 135,535 | $ | 143,043 | |||
Segment Margin (in thousands) | $ | 103,222 | $ | 86,239 | |||
Fleet Utilization: (2) | |||||||
Inland Barge Utilization | 96.7 | % | 97.5 | % | |||
Offshore Barge Utilization | 98.7 | % | 99.6 | % | |||
(1) Under certain of our marine contracts, we "rebill" our customers for a portion of our operating costs.
(2) Utilization rates are based on a 365 day year, as adjusted for planned downtime and drydocking.
Marine Transportation Segment Margin for 2015 increased $17.0 million, or 20% from 2014. The significant components of this fluctuation were as follows:
• | An increase in Segment Margin in 2015 due to a full year of operating results from the M/T American Phoenix (included as part of our offshore marine fleet), which we acquired in November 2014, and higher realized contract rates on several of our oceangoing barges. |
• | The expansion of our inland marine fleet in 2015, with "new builds" including the addition of 4 inland barges and 7 inland pushboat in 2015. |
Utilization rates on both our inland and offshore barge fleets did not change significantly in 2015 as compared to 2014. The decrease in operating costs, a large portion of which relate to fuel and other rebillable charges, was largely offset by the decrease in other rebill revenues.
58
Supply and Logistics Segment
Operating results for our supply and logistics segment were as follows:
Year Ended December 31, | |||||||
2015 | 2014 | ||||||
(in thousands) | |||||||
Gathering, marketing, and logistics revenue | $ | 1,612,570 | $ | 3,323,028 | |||
Crude oil and CO2 tariffs and revenues from direct financing leases of CO2 pipelines | 68,265 | 67,588 | |||||
Payments received under direct financing leases not included in income | 5,685 | 5,529 | |||||
Crude oil and products costs, excluding unrealized gains and losses from derivative transactions | (1,479,972 | ) | (3,167,749 | ) | |||
Operating costs, excluding non-cash charges for equity-based compensation and other non-cash expenses | (116,842 | ) | (133,416 | ) | |||
Other | 5,688 | 9,596 | |||||
Segment Margin | $ | 95,394 | $ | 104,576 | |||
Volumetric Data (average barrels/day unless otherwise noted): | |||||||
Onshore crude oil pipelines: | |||||||
Texas | 71,906 | 58,829 | |||||
Jay | 16,828 | 24,131 | |||||
Mississippi | 15,472 | 14,829 | |||||
Louisiana (1) | 32,481 | 18,436 | |||||
Wyoming (2) | 7,397 | — | |||||
Onshore crude oil pipelines total | 144,084 | 116,225 | |||||
CO2 pipeline (average Mcf/day): | |||||||
Free State | 161,409 | 173,770 | |||||
Crude oil and petroleum products sales: | |||||||
Total crude oil and petroleum products sales | 91,074 | 99,139 | |||||
Rail load/unload volumes (3) | 27,044 | 32,559 | |||||
(1) | Represents volumes per day from the period the pipeline began operations in the first quarter of 2014. |
(2) | Represents volumes per day from the period the pipeline began operations in August of 2015. |
(3) | Indicates total barrels for which fees were charged for either loading or unloading at all rail facilities. |
Segment Margin for our supply and logistics segment decreased $9 million, or 9%, in 2015 as compared to 2014. The most significant components of this change are discussed below.
• | In 2015 the decrease in our Segment Margin is primarily due to lower volumes in our historical back-to-back, or buy/sell, crude oil marketing business associated with aggregating and trucking crude oil from producers' leases to local or regional re-sale points. We find it difficult to compete with certain persons in the market who are willing to lose money on such local gathering because they are attempting to minimize their losses from minimum volume to take-or-pay commitments they previously made in anticipation of new production that has not yet come online. |
• | With respect to our crude oil and CO2 pipelines, revenues increased $0.7 million primarily due to a net increase in throughput volumes of 27,859 barrels per day, primarily from increases in volumes on our Texas and Louisiana pipeline systems as well as the addition of the Wyoming pipeline system. These increases were partially offset by volume variances on our other onshore pipeline systems. Due to a mix of tariff rates on our onshore pipelines, the impact on onshore crude oil tariffs and revenues from these volume variances largely offset each other. With respect to these pipelines, the increase in crude oil and CO2 pipeline tariff revenues was more than offset by a decrease in |
59
Segment Margin resulting from a decrease in crude oil pipeline loss allowance volumes collected and sold, which primarily resulted from the change in the market price of crude oil between the respective periods.
• | These items were partially offset by improved year to date performance in our recently right-sized heavy fuel oil business. |
Other Costs and Interest
General and administrative expenses
Year Ended December 31, | |||||||
2015 | 2014 | ||||||
(in thousands) | |||||||
General and administrative expenses not separately identified below: | |||||||
Corporate | $ | 37,922 | $ | 39,445 | |||
Segment | 3,608 | 3,606 | |||||
Equity-based compensation plan expense | 4,564 | 5,111 | |||||
Third party costs related to business development activities and growth projects | 18,901 | 2,530 | |||||
Total general and administrative expenses | $ | 64,995 | $ | 50,692 | |||
Total general and administrative expenses increased $14 million between 2015 and 2014, primarily due to higher third party costs, mostly financing, legal and accounting, related to business development and growth activities (particularly third party costs incurred for business development activities surrounding our Enterprise acquisition as previously discussed).
Depreciation and amortization expense
Year Ended December 31, | |||||||
2015 | 2014 | ||||||
(in thousands) | |||||||
Depreciation on fixed assets | $ | 124,207 | $ | 73,230 | |||
Amortization of intangible assets | 20,044 | 13,436 | |||||
Amortization of CO2 volumetric production payments | 5,889 | 4,242 | |||||
Total depreciation and amortization expense | $ | 150,140 | $ | 90,908 | |||
Total depreciation and amortization expense increased $59 million between 2015 and 2014 primarily as a result of placing newly acquired and constructed assets in service during calendar 2015 (including the offshore pipelines and services assets acquired as a result of our Enterprise acquisition).
Interest expense, net
Year Ended December 31, | |||||||
2015 | 2014 | ||||||
(in thousands) | |||||||
Interest expense, senior secured credit facility (including commitment fees) | $ | 23,072 | $ | 15,592 | |||
Interest expense, senior unsecured notes | 87,326 | 60,047 | |||||
Amortization and write-off of debt issuance costs and premium | 7,266 | 4,785 | |||||
Capitalized interest | (17,068 | ) | (13,785 | ) | |||
Net interest expense | $ | 100,596 | $ | 66,639 | |||
Net interest expense increased $34 million during 2015 primarily due to an increase in our average outstanding indebtedness from newly acquired and constructed assets, primarily related to additional debt outstanding as a result of financing our Enterprise acquisition. In May 2015, we issued an additional $400 million of aggregate principal amount of 6.00% senior unsecured notes to redeem our $350 million 7.875% senior unsecured notes (which were due in 2018) and in July 2015, we issued an additional $750 million of aggregate principal amount of 6.75% senior unsecured notes. Capitalized interest costs increased in 2015 due to our growth capital expenditures for projects when compared to the prior year.
Financial Measures
60
Overview
This Annual Report on Form 10-K includes the financial measure of Available Cash before Reserves, which is a “non-GAAP” measure because it is not contemplated by or referenced in generally accepted accounting principles in the United States of America (GAAP). We also present total Segment Margin as if it were a non-GAAP measure. Our Non-GAAP measures may not be comparable to similarly titled measures of other companies because such measures may include or exclude other specified items. The accompanying schedules provide reconciliations of these non-GAAP financial measures to their most directly comparable financial measures calculated in accordance with GAAP. A reconciliation of Segment Margin to net income is included in our segment disclosures in Note 12 to our Consolidated Financial Statements in Item 8. Our non-GAAP financial measures should not be considered (i) as alternatives to GAAP measures of liquidity or financial performance or (ii) as being singularly important in any particular context; they should be considered in a broad context with other quantitative and qualitative information. Our Available Cash before Reserves and total Segment Margin measures are just two of the relevant data points considered from time to time.
When evaluating our performance and making decisions regarding our future direction and actions (including making discretionary payments, such as quarterly distributions) our board of directors and management team has access to a wide range of historical and forecasted qualitative and quantitative information, such as our financial statements; operational information; various non-GAAP measures; internal forecasts; credit metrics; analyst opinions; performance, liquidity and similar measures; income; cash flow; and certain information regarding some of our peers. Additionally, our board of directors and management team analyze, and place different weight on, various factors from time to time. We believe that investors benefit from having access to the same financial measures being utilized by management, lenders, analysts and other market participants. We attempt to provide adequate information to allow each individual investor and other external user to reach her/his own conclusions regarding our actions without providing so much information as to overwhelm or confuse such investor or other external user. Our non-GAAP financial measures should not be considered as an alternative to GAAP measures such as net income, operating income, cash flow from operating activities or any other GAAP measure of liquidity or financial performance.
Segment Margin
We define Segment Margin as revenues less product costs, operating expenses (excluding non-cash gains and charges, such as depreciation and amortization), and segment general and administrative expenses, plus our equity in distributable cash generated by our equity investees. In addition, our Segment Margin definition excludes the non-cash effects of our legacy stock appreciation rights plan and includes the non-income portion of payments received under direct financing leases. Our chief operating decision maker (our Chief Executive Officer) evaluates segment performance based on a variety of measures including Segment Margin, segment volumes where relevant and capital investment.
A reconciliation of Segment Margin to net income is included in our segment disclosures in Note 12 to our Consolidated Financial Statements in Item 8.
Available Cash before Reserves
Purposes, Uses and Definition
Available Cash before Reserves, often referred to by others as distributable cash flow, is a quantitative standard used throughout the investment community with respect to publicly-traded partnerships and is commonly used as a supplemental financial measure by management and by external users of financial statements such as investors, commercial banks, research analysts and rating agencies, to aid in assessing, among other things:
(1) | the financial performance of our assets; |
(2) | our operating performance; |
(3) | the viability of potential projects, including our cash and overall return on alternative capital investments as compared to those of other companies in the midstream energy industry; |
(4) | the ability of our assets to generate cash sufficient to satisfy certain non-discretionary cash requirements, including interest payments and certain maintenance capital requirements; and |
(5) | our ability to make certain discretionary payments, such as distributions on our units, growth capital expenditures, certain maintenance capital expenditures and early payments of indebtedness. |
We define Available Cash before Reserves as net income as adjusted for specific items, the most significant of which are the addition of certain non-cash gains or charges (such as depreciation and amortization), the substitution of distributable cash generated by our equity investees in lieu of our equity income attributable to our equity investees, the elimination of gains
61
and losses on asset sales (except those from the sale of surplus assets), unrealized gains and losses on derivative transactions not designated as hedges for accounting purposes, the elimination of expenses related to acquiring or constructing assets that provide new sources of cash flows and the subtraction of maintenance capital utilized, which is described in detail below.
Disclosure Format Relating to Maintenance Capital
We have implemented a modified format relating to maintenance capital requirements because our maintenance capital expenditures have changed materially in nature (discretionary vs. non-discretionary), timing and amount from time to time. We believe that, without such modified disclosure, such changes in our maintenance capital expenditures could be confusing and potentially misleading to users of our financial information, particularly in the context of the nature and purposes of our Available Cash before Reserves measure. Our modified disclosure format provides those users with information in the form of our maintenance capital utilized measure (which we deduct to arrive at Available Cash before Reserves). Our maintenance capital utilized measure constitutes a proxy for non-discretionary maintenance capital expenditures and it takes into consideration the relationship among maintenance capital expenditures, operating expenses and depreciation from period to period.
Maintenance Capital Requirements
MAINTENANCE CAPITAL EXPENDITURES
Maintenance capital expenditures are capitalized costs that are necessary to maintain the service capability of our existing assets, including the replacement of any system component or equipment which is worn out or obsolete. Maintenance capital expenditures can be discretionary or non-discretionary, depending on the facts and circumstances.
Prior to 2014, substantially all of our maintenance capital expenditures have been (a) related to our pipeline assets and similar infrastructure, (b) non-discretionary in nature and (c) immaterial in amount as compared to our Available Cash before Reserves measure. Those historical expenditures were non-discretionary (or mandatory) in nature because we had very little (if any) discretion as to whether or when we incurred them. We had to incur them in order to continue to operate the related pipelines in a safe and reliable manner and consistently with past practices. If we had not made those expenditures, we would not have been able to continue to operate all or portions of those pipelines, which would not have been economically feasible. An example of a non-discretionary (or mandatory) maintenance capital expenditure would be replacing a segment of an old pipeline because one can no longer operate that pipeline safely, legally and/or economically in the absence of such replacement.
Beginning with 2014, we believe a substantial amount of our maintenance capital expenditures from time to time will be (a) related to our assets other than pipelines, such as our marine vessels, trucks and similar assets, (b) discretionary in nature and (c) potentially material in amount as compared to our Available Cash before Reserves measure. Those future expenditures will be discretionary (or non-mandatory) in nature because we will have significant discretion as to whether or when we incur them. We will not be forced to incur them in order to continue to operate the related assets in a safe and reliable manner. If we chose not make those expenditures, we would be able to continue to operate those assets economically, although in lieu of maintenance capital expenditures, we would incur increased operating expenses, including maintenance expenses. An example of a discretionary (or non-mandatory) maintenance capital expenditure would be replacing an older marine vessel with a new marine vessel with substantially similar specifications, even though one could continue to economically operate the older vessel in spite of its increasing maintenance and other operating expenses.
In summary, as we continue to expand certain non-pipeline portions of our business, we are experiencing changes in the nature (discretionary vs. non-discretionary), timing and amount of our maintenance capital expenditures that merit a more detailed review and analysis than was required historically. Management’s increasing ability to determine if and when to incur certain maintenance capital expenditures is relevant to the manner in which we analyze aspects of our business relating to discretionary and non-discretionary expenditures. We believe it would be inappropriate to derive our Available Cash before Reserves measure by deducting discretionary maintenance capital expenditures, which we believe are similar in nature in this context to certain other discretionary expenditures, such as growth capital expenditures, distributions/dividends and equity buybacks. Unfortunately, not all maintenance capital expenditures are clearly discretionary or non-discretionary in nature. Therefore, we developed a new measure, maintenance capital utilized, that we believe is more useful in the determination of Available Cash before Reserves.
MAINTENANCE CAPITAL UTILIZED
We believe our maintenance capital utilized measure is the most useful quarterly maintenance capital requirements measure to use to derive our Available Cash before Reserves measure. We define our maintenance capital utilized measure as that portion of the amount of previously incurred maintenance capital expenditures that we utilize during the relevant quarter,
62
which would be equal to the sum of the maintenance capital expenditures we have incurred for each project/component in prior quarters allocated ratably over the useful lives of those projects/components.
Our maintenance capital utilized measure constitutes a proxy for non-discretionary maintenance capital expenditures and it takes into consideration the relationship among maintenance capital expenditures, operating expenses and depreciation from period to period. Because we did not use our maintenance capital utilized measure before 2014, our maintenance capital utilized calculations will reflect the utilization of solely those maintenance capital expenditures incurred since December 31, 2013.
Available Cash before Reserves for the years ended December 31, 2016, 2015 and 2014 was as follows:
Year Ended December 31, | |||||||||||
2016 | 2015 | 2014 | |||||||||
(in thousands) | |||||||||||
Net income attributable to Genesis Energy, L.P. | $ | 113,249 | $ | 422,528 | $ | 106,202 | |||||
Depreciation, amortization and accretion | 230,563 | 155,081 | 91,397 | ||||||||
Cash received from direct financing leases not included in income | 6,277 | 5,685 | 5,529 | ||||||||
Cash effects of sales of certain assets and discontinued operations | 3,609 | 2,811 | 272 | ||||||||
Effects of distributable cash generated by equity method investees not included in income | 39,276 | 43,018 | 31,093 | ||||||||
Expenses related to acquiring or constructing growth capital assets | 1,945 | 18,901 | 2,528 | ||||||||
Unrealized loss (gain) on derivative transactions excluding fair value hedges, net of changes in inventory value | 1,790 | 1,674 | (1,413 | ) | |||||||
Maintenance capital utilized (1) | (7,696 | ) | (3,731 | ) | (922 | ) | |||||
Non-cash tax expense (benefit) | 2,142 | 2,787 | 1,745 | ||||||||
Gain on step up of historical basis | — | (332,380 | ) | — | |||||||
Loss on debt extinguishment | — | 19,225 | — | ||||||||
Differences in timing of cash receipts for certain contractual arrangements (2) | (13,253 | ) | (6,359 | ) | — | ||||||
Non-cash valuation allowance related to collectibility | 6,044 | — | — | ||||||||
Other items, net | 295 | 2,181 | (3,804 | ) | |||||||
Available Cash before Reserves | $ | 384,241 | $ | 331,421 | $ | 232,627 | |||||
(1) | For a description of the term "maintenance capital utilized," please see the definition of the term "Available Cash Before Reserves" previously discussed. Maintenance capital expenditures in 2016, 2015, and 2014 were $30.9 million, $45.2 million, and $15.0 million, respectively. |
(2) | Certain cash payments received from customers under certain of our minimum payment obligation contracts are not recognized as revenue under GAAP in the period in which such payments are received. |
63
Year Ended December 31, | |||||||||||
2016 | 2015 | 2014 | |||||||||
(in thousands) | |||||||||||
Cash Flows from Operating Activities | $ | 298,338 | $ | 289,536 | $ | 291,054 | |||||
Adjustments to reconcile net cash flow provided by operating activities to Available Cash before Reserves: | |||||||||||
Maintenance capital utilized (1) | (7,696 | ) | (3,731 | ) | (922 | ) | |||||
Proceeds from asset sales | 3,609 | 2,811 | 272 | ||||||||
Amortization and writeoff of debt issuance costs, including premiums and discounts | (10,138 | ) | (10,881 | ) | (4,785 | ) | |||||
Effects of available cash of equity method investees not included in operating cash flows | 21,353 | 25,645 | 17,064 | ||||||||
Net changes in components of operating assets and liabilities not included in calculation of Available Cash before Reserves | 90,650 | (5,372 | ) | (77,954 | ) | ||||||
Non-cash effect of equity based compensation expense | (7,316 | ) | (6,596 | ) | (7,871 | ) | |||||
Expenses related to acquiring or constructing assets that provide new sources of cash flow | 1,945 | 18,901 | 2,528 | ||||||||
Differences in timing of cash receipts for certain contractual arrangements (2) | (13,253 | ) | (6,359 | ) | — | ||||||
Other items, net | 6,749 | 27,467 | 13,241 | ||||||||
Available Cash before Reserves | 384,241 | 331,421 | 232,627 | ||||||||
(1) | For a description of the term "maintenance capital utilized," please see the definition of the term "Available Cash Before Reserves" previously discussed. Maintenance capital expenditures in 2016, 2015, and 2014 were $30.9 million, $45.2 million, and $15.0 million, respectively. |
(2) | Certain cash payments received from customers under certain of our minimum payment obligation contracts are not recognized as revenue under GAAP in the period in which such payments are received. |
Liquidity and Capital Resources
General
As of December 31, 2016, we believe our balance sheet and liquidity position remained strong, including $412.3 million of borrowing capacity available under our $1.7 billion senior secured revolving credit facility. We anticipate that our future internally-generated funds and the funds available under our credit facility will allow us to meet our ordinary course capital needs. Our primary sources of liquidity have been cash flows from operations, borrowing availability under our credit facility and the proceeds from issuances of equity and senior unsecured notes.
Our primary cash requirements consist of:
• | working capital, primarily inventories and trade receivables and payables; |
• | routine operating expenses; |
• | capital growth and maintenance projects; |
• | acquisitions of assets or businesses; |
• | interest payments related to outstanding debt; and |
• | quarterly cash distributions to our unitholders. |
Capital Resources
Our ability to satisfy future capital needs will depend on our ability to raise substantial amounts of additional capital from time to time — including through equity and debt offerings (public and private), borrowings under our credit facility and other financing transactions—and to implement our growth strategy successfully. No assurance can be made that we will be able to raise the necessary funds on satisfactory terms.
In July 2016, we issued 8,000,000 Class A common units in a public offering at a price of $37.90 per unit. We received proceeds, net of underwriting discounts and offering costs, of approximately $298.0 million from that offering. We used those
64
proceeds to repay a portion of the borrowings outstanding under our revolving credit facility, allowing us greater financial flexibility to fund future activities.
In April 2016, we amended our credit agreement to, among other things, (i) increase the committed amount under our revolving credit facility to $1.7 billion (from $1.5 billion), with the ability to increase the committed amount by an additional $300.0 million, subject to lender consent and (ii) permanently relax the maximum consolidated leverage ratio to 5.5 to 1.0.
The key terms for rates under our $1.7 billion senior secured credit facility, which are dependent on our leverage ratio (as defined in the credit agreement), are as follows:
• | The interest rate on borrowings may be based on an alternate base rate or a Eurodollar rate, at our option. The alternate base rate is equal to the sum of (a) the greatest of (i) the prime rate as established by the administrative agent for the credit facility, (ii) the federal funds effective rate plus 0.5% of 1% and (iii) the LIBOR rate for a one-month maturity plus 1% and (b) the applicable margin. The Eurodollar rate is equal to the sum of (a) the LIBOR rate for the applicable interest period multiplied by the statutory reserve rate and (b) the applicable margin. The applicable margin varies from 1.50% to 2.75% on Eurodollar borrowings and from 0.50% to 1.75% on alternate base rate borrowings, depending on our leverage ratio. Our leverage ratio is recalculated quarterly and in connection with each material acquisition. At December 31, 2016, the applicable margins on our borrowings were 1.50% for alternate base rate borrowings and 2.50% for Eurodollar rate borrowings. |
• | Letter of credit fees range from 1.50% to 2.50% based on our leverage ratio as computed under the credit facility. The rate can fluctuate quarterly. At December 31, 2016, our letter of credit rate was 2.50%. |
• | We pay a commitment fee on the unused portion of the $1.7 billion maximum facility amount. The commitment fee on the unused committed amount will range from 0.250% to 0.500% per annum depending on our leverage ratio (0.500% at December 31, 2016). |
• | Our credit facility contains a $300 million accordion feature, giving us the ability to expand the size of the facility up to $2.0 billion for acquisitions or growth projects, subject to lender consent. |
At December 31, 2016, we had $1.3 billion borrowed under our credit facility, with $74.5 million of the borrowed amount designated as a loan under the inventory sublimit. Our credit agreement allows up to $100 million of the capacity to be used for letters of credit, of which $9.5 million was outstanding at December 31, 2016. Due to the revolving nature of loans under our credit facility, additional borrowings and periodic repayments and re-borrowings may be made until the maturity date of July 28, 2019. Our credit facility does not include a “borrowing base” limitation except with respect to our inventory loans.
The total amount available for borrowings under our credit facility at December 31, 2016 was $412.3 million.
Our 2021, 2022, 2023 and 2024 Notes were co-issued by Genesis Energy Finance Corporation (which has no independent assets or operations) and are each fully and unconditionally guaranteed, subject to customary exceptions pursuant to the indentures governing our 2021, 2022, 2023 and 2024 Notes, as discussed below, jointly and severally, by certain of our wholly-owned subsidiaries. We have the right to redeem our 2021 Notes at any time after February 15, 2017, at a premium to the face amount of our 2021 Notes that varies based on the time remaining to maturity on our 2021 Notes. We have the right to redeem our 2022 Notes at any time after August 1, 2018, at a premium to the face amount of our 2022 Notes that varies based on the time remaining to maturity on our 2022 Notes. Prior to August 1, 2018, we may also redeem up to 35% of the principal amount of our 2022 Notes for 106.75% of the face amount with the proceeds from an equity offering of our common units. We have the right to redeem our 2023 Notes at any time after May 15, 2018, at a premium to the face amount of our 2023 Notes that varies based on the time remaining to maturity on our 2023 Notes. Prior to May 15, 2018, we may also redeem up to 35% of the principal amount of our 2023 Notes for 106% of the face amount with the proceeds from an equity offering of our common units. We have the right to redeem our 2024 Notes at any time after June 15, 2019, at a premium to the face amount of our 2024 Notes that varies based on the time remaining to maturity on our 2024 Notes. Prior to June 15, 2017, we may also redeem up to 35% of the principal amount of our 2024 Notes for 105.625% of the face amount with the proceeds from an equity offering of our common units.
At December 31, 2016, our long-term debt totaled $3.1 billion, consisting of $1.3 billion outstanding under our credit facility (including $74.5 million borrowed under the inventory sublimit tranche), $350 million of our 2021 Notes, $350 million of our 2024 Notes, $400 million of our 2023 Notes and $750 million of our 2022 Notes. There were no new notes issued during 2016. After completion of our organic growth capital projects this year, we would expect our leverage to decline as we use our excess available cash to reduce debt.
For additional information on our long-term debt and covenants see Note 10 to our Consolidated Financial Statements in Item 8.
Equity Distribution Program and Shelf Registration Statements
65
We expect to issue additional equity and debt securities to assist us in meeting our future liquidity requirements, including those related to opportunistically acquiring assets and businesses and constructing new facilities.
In 2016, we implemented an equity distribution program that will allow us to consummate "at the market" offerings of common units from time to time through brokered transactions, which should help mitigate certain adverse consequences of underwritten offerings, including the downward pressure on the market price of our common units and the expensive fees and other costs associated with such public offerings. We entered into an equity distribution agreement with a group of banks who will act as sales agents or principals for up to $400.0 million of our common units, if and when we should elect to issue additional common units from time to time, although there are limits to the amount of our "at the market" offerings the market can absorb from time to time. In connection, with implementing our equity distribution program, we filed a universal shelf registration statement (our "EDP Shelf") with the SEC. Our EDP Shelf allows us to issue up to $400.0 million of equity and debt securities, whether pursuant to our equity distribution program or otherwise. Our EDP Shelf will expire in August 2017. We expect to file a replacement universal shelf registration statement before our EDP Shelf expires. As of December 31, 2016, we have issued no additional units under this program.
We have another universal shelf registration statement (our "2015 Shelf") on file with the SEC. Our 2015 Shelf allows us to issue an unlimited amount of equity and debt securities in connection with certain types of public offerings. However, the receptiveness of the capital markets to an offering of equity and/or debt securities cannot be assured and may be negatively impacted by, among other things, our long-term business prospects and other factors beyond our control, including market conditions. Our 2015 Shelf will expire in April 2018. We expect to file a replacement universal shelf registration statement before our 2015 Shelf expires.
Cash Flows from Operations
We generally utilize the cash flows we generate from our operations to fund our distributions and working capital needs. Excess funds that are generated are used to repay borrowings under our credit facility and/or to fund a portion of our capital expenditures. Our operating cash flows can be impacted by changes in items of working capital, primarily variances in the carrying amount of inventory and the timing of payment of accounts payable and accrued liabilities related to capital expenditures.
We typically sell our crude oil in the same month in which we purchase it, so we do not need to rely on borrowings under our credit facility to pay for such crude oil purchases, other than inventory. During such periods, our accounts receivable and accounts payable generally move in tandem as we make payments and receive payments for the purchase and sale of crude oil.
In our petroleum products activities, we buy products and typically either move those products to one of our storage facilities for further blending or sell those products within days of our purchase. The cash requirements for these activities can result in short term increases and decreases in our borrowings under our credit facility.
The storage of our inventory of crude oil and petroleum products can have a material impact on our cash flows from operating activities. In the month we pay for the stored crude oil or petroleum products, we borrow under our credit facility (or use cash on hand) to pay for the crude oil or petroleum products, utilizing a portion of our operating cash flows. Conversely, cash flow from operating activities increases during the period in which we collect the cash from the sale of the stored crude oil or petroleum products. Additionally, we may be required to deposit margin funds with the NYMEX when commodity prices increase as the value of the derivatives utilized to hedge the price risk in our inventory fluctuates. These deposits also impact our operating cash flows as we borrow under our credit facility or use cash on hand to fund the deposits.
Net cash flows provided by our operating activities were $298.3 million and $289.5 million for 2016 and 2015, respectively. As discussed above, changes in the cash requirements related to payment for petroleum products or collection of receivables from the sale of inventory impact the cash provided by operating activities. Additionally, changes in the market prices for crude oil and petroleum products can result in fluctuations in our working capital and, therefore, our operating cash flows between periods as the cost to acquire a barrel of crude oil or petroleum products will require more or less cash. The increase in operating cash flow for 2016 compared to 2015 was primarily due to an increase in cash earnings, as partially offset by an increase in working capital needs.
Net cash flows provided by our operating activities were $289.5 million and $291.1 million for 2015 and 2014, respectively. The decrease in operating cash flow for 2015 compared to 2014 was primarily due to an increase in working capital needs.
Capital Expenditures and Distributions Paid to Our Unitholders
We use cash primarily for our operating expenses, working capital needs, debt service, acquisition activities, internal growth projects and distributions we pay to our unitholders. We finance maintenance capital expenditures and smaller internal growth projects and distributions primarily with cash generated by our operations. We have historically funded material growth
66
capital projects (including acquisitions and internal growth projects) with borrowings under our credit facility, equity issuances and/or the issuance of senior unsecured notes.
Capital Expenditures and Business and Asset Acquisitions
The following table summarizes our expenditures for fixed assets, business and other asset acquisitions in the periods indicated:
Years Ended December 31, | |||||||||||
2016 | 2015 | 2014 | |||||||||
(in thousands) | |||||||||||
Capital expenditures for fixed and intangible assets: | |||||||||||
Maintenance capital expenditures: | |||||||||||
Offshore pipeline transportation assets | $ | 3,530 | $ | 1,888 | $ | 1,543 | |||||
Refinery services assets | 2,274 | 1,555 | 1,963 | ||||||||
Marine transportation assets | 14,007 | 26,124 | 5,539 | ||||||||
Supply and logistics assets | 10,563 | 15,106 | 5,466 | ||||||||
Information technology systems | 547 | 515 | 474 | ||||||||
Total maintenance capital expenditures | 30,921 | 45,188 | 14,985 | ||||||||
Growth capital expenditures: | |||||||||||
Offshore pipeline transportation assets | $ | 7,657 | $ | 963 | $ | 20 | |||||
Refinery services assets | — | 40 | 422 | ||||||||
Marine transportation assets | 64,797 | 42,885 | 70,186 | ||||||||
Supply and logistics | 306,075 | 394,581 | 366,275 | ||||||||
Information technology systems | 7,056 | 2,243 | 2,165 | ||||||||
Total growth capital expenditures | 385,585 | 440,712 | 439,068 | ||||||||
Total capital expenditures for fixed and intangible assets | 416,506 | 485,900 | 454,053 | ||||||||
Capital expenditures for business combinations, net of liabilities assumed: | |||||||||||
Acquisition of American Phoenix | — | — | 157,000 | ||||||||
Acquisition of remaining interest in equity investment | 35,090 | — | — | ||||||||
Acquisition of offshore pipelines (1) | — | 1,521,569 | — | ||||||||
Total business combinations capital expenditures | 35,090 | 1,521,569 | 157,000 | ||||||||
Capital expenditures related to equity investees (2) | — | 2,900 | 36,076 | ||||||||
Total capital expenditures | $ | 451,596 | $ | 2,010,369 | $ | 647,129 | |||||
(1) | Amounts represent our purchase price (subject to adjustments) for our Enterprise acquisition. |
(2) | Amount represents our investment in the SEKCO pipeline equity investee prior to our Enterprise acquisition. |
Expenditures for capital assets to grow the partnership distribution will depend on our access to debt and equity capital. We will look for opportunities to acquire assets from other parties that meet our criteria for stable cash flows. We continue to pursue a long term growth strategy that may require significant capital.
Growth Capital Expenditures
We anticipate spending approximately $100 million, inclusive of capitalized interest, during 2017 for projects currently under construction. The most significant of our projects are described below.
Houston Area Crude Oil Pipeline and Terminal Infrastructure
We are constructing new, and expanding existing, crude oil pipeline and terminal facilities in Webster, Texas and Texas City, Texas as a result of expanding our crude oil pipeline and terminal infrastructure in the Houston area. We are constructing a new crude oil pipeline that will deliver crude oil received from upstream crude oil pipelines (including CHOPS, which delivers crude oil originating in the deepwater Gulf of Mexico to the Texas City area) to our new Texas City Terminal, which will ultimately connect to our existing 18-inch Webster to Texas City crude oil pipeline. Our new Texas City Terminal will initially include approximately 750,000 barrels of crude oil tankage. As a part of this project, we are also making the necessary upgrades
67
on our existing 18-inch Webster to Texas City crude oil pipeline to reverse the direction of flow. The result of this expanded crude oil infrastructure will allow additional optionality to Houston and Baytown area refineries, including the ExxonMobil Baytown refinery, its largest refinery in the U.S.A., and provide additional delivery outlets for other crude oil pipelines. We expect these assets to become operational in the first half of 2017.
Raceland Terminal and Crude Oil Pipeline
We are constructing a new crude oil terminal and pipeline in Raceland, Louisiana that will be connected to existing midstream infrastructure that will provide further distribution to the Louisiana refining markets. Our new Raceland Terminal will consist of 515,000 barrels of crude oil tankage and unit train unloading facilities capable of unloading up to two unit trains per day. We are constructing a new crude oil pipeline that will deliver crude oil received from the Poseidon system, which currently delivers crude oil originating in the deepwater Gulf of Mexico to the Houma, Louisiana area, to our Raceland Terminal for further distribution. We expect these assets to become fully operational in the first half of 2017.
Inland Marine Barge Transportation Expansion
We ordered 28 new-build barges and 18 new-build push boats for our inland marine barge transportation fleet. We
have accepted delivery of 20 of those barges and 14 of those push boats through December 31, 2016. We expect to take delivery of those remaining vessels periodically into 2017.
Baton Rouge Terminal
We constructed a new crude oil, intermediates and refined products import/export terminal in Baton Rouge that is located near the Port of Greater Baton Rouge and is pipeline-connected to the port's existing deepwater docks on the Mississippi River. We constructed approximately 1.1 million barrels of tankage for the storage of crude oil, intermediates and/or refined products with the capability to expand to provide additional terminaling services to our customers. In addition, we constructed a new pipeline from the terminal that will allow for deliveries to existing ExxonMobil facilities in the area, as well as connect our previously constructed 17 mile line to the terminal allowing for receipts from the Scenic Station Rail Facility. Shippers to Scenic Station will have access to both the local Baton Rouge refining market, as well as the ability to access other attractive refining markets via our Baton Rouge Terminal. Our Baton Rouge Terminal and related facilities became operational early in the fourth quarter of 2016.
Wyoming Crude Oil Pipeline
In the third quarter of 2015, we completed construction of a new 60 mile crude oil pipeline to transport crude oil from new receipt point stations in Campbell County and Converse County, Wyoming to our existing Pronghorn Rail Facility. This new crude oil pipeline has an initial capacity of approximately 30,000 barrels per day and is supplied by truck volumes and third party gathering infrastructure in the Powder River Basin.
We also constructed a new 75 mile pipeline from our Pronghorn Rail Facility to a delivery point at our new Guernsey Station in Platte County, Wyoming. This Pronghorn to Guernsey pipeline has an initial capacity of approximately 45,000 barrels per day and will allow for connectivity to additional downstream pipeline markets at Guernsey, including regional refineries and Cushing, Oklahoma via the Pony Express Pipeline. This pipeline became operational in the first quarter of 2016.
Maintenance Capital Expenditures
Maintenance capital expenditures have annually ranged between $15 million and $45 million. We have gone through the process of replacing many of our marine transportation vessels and barges in an effort to upgrade our fleet, so we do not expect to incur capital expenditures of this magnitude related to such items going forward in the foreseeable future. See previous discussion under "Available Cash before Reserves" for how such maintenance capital utilization is reflected in our calculation of Available Cash before Reserves.
Distributions to Unitholders
Our partnership agreement requires us to distribute 100% of our available cash (as defined therein) within 45 days after the end of each quarter to unitholders of record. Available cash generally means, for each fiscal quarter, all cash on hand at the end of the quarter:
• | less the amount of cash reserves that our general partner determines in its reasonable discretion is necessary or appropriate to: |
• | provide for the proper conduct of our business; |
• | comply with applicable law, any of our debt instruments, or other agreements; or |
• | provide funds for distributions to our unitholders for any one or more of the next four quarters; |
68
• | plus all cash on hand on the date of determination of available cash for the quarter resulting from working capital borrowings. Working capital borrowings are generally borrowings that are made under our credit facility and in all cases are used solely for working capital purposes or to pay distributions to partners. |
We have increased our distribution for each of the last forty-six quarters, including the distribution paid for the fourth quarter of 2016, as shown in the table below (in thousands, except per unit amounts). Each quarter, our board of directors determines the amount of our available cash and, consequently, our quarterly distribution rate per unit based upon various factors such as our operating performance, cash on hand, future cash requirements and the economic environment. As a result, the historical trend of distribution increases may not be a good indicator of future increases.
Distribution For | Date Paid | Per Unit Amount | Total Amount | |||||||
2014 | ||||||||||
4th Quarter | February 13, 2015 | $ | 0.5950 | $ | 56,542 | |||||
2015 | ||||||||||
1st Quarter | May 15, 2015 | $ | 0.6100 | $ | 60,774 | |||||
2nd Quarter | August 14, 2015 | $ | 0.6250 | $ | 68,737 | |||||
3rd Quarter | November 13, 2015 | $ | 0.6400 | $ | 70,387 | |||||
4th Quarter | February 12, 2016 | $ | 0.6550 | $ | 72,036 | |||||
2016 | ||||||||||
1st Quarter | May 13, 2016 | $ | 0.6725 | $ | 73,961 | |||||
2nd Quarter | August 12, 2016 | $ | 0.6900 | $ | 81,406 | |||||
3rd Quarter | November 14, 2016 | $ | 0.7000 | $ | 82,585 | |||||
4th Quarter | February 14, 2017 | (1) | $ | 0.7100 | $ | 83,765 | ||||
(1) | This distribution was paid on February 14, 2017 to unitholders of record as of January 31, 2017. |
Commitments and Off-Balance Sheet Arrangements
Contractual Obligations and Commercial Commitments
In addition to our credit facility discussed above, we have contractual obligations under operating leases as well as commitments to purchase crude oil and petroleum products. The table below summarizes our obligations and commitments at December 31, 2016.
Payments Due by Period | |||||||||||||||||||
Commercial Cash Obligations and Commitments | Less than one year | 1 - 3 years | 3 - 5 Years | More than 5 years | Total | ||||||||||||||
(in thousands) | |||||||||||||||||||
Contractual Obligations: | |||||||||||||||||||
Long-term debt (1) | $ | — | $ | 1,278,200 | $ | 345,837 | $ | 1,467,332 | $ | 3,091,369 | |||||||||
Estimated interest payable on long-term debt (2) | 181,543 | 334,221 | 211,266 | 111,070 | 838,100 | ||||||||||||||
Operating lease obligations | 25,275 | 41,166 | 26,929 | 62,163 | 155,533 | ||||||||||||||
Unconditional purchase obligations (3) | 132,441 | — | — | — | 132,441 | ||||||||||||||
Other Cash Commitments: | |||||||||||||||||||
Capital expenditure commitments(4) | 32,699 | — | — | — | 32,699 | ||||||||||||||
Asset retirement obligations (5) | 22,408 | 43,382 | — | 147,935 | 213,725 | ||||||||||||||
Total | $ | 394,366 | $ | 1,696,969 | $ | 584,032 | $ | 1,788,500 | $ | 4,463,867 | |||||||||
(1) | Our credit facility allows us to repay and re-borrow funds at any time through the maturity date of July 28, 2019. We have $350 million in aggregate principal amount of senior unsecured notes that mature on February 15, 2021(the "2021 Notes"), $750 million in aggregate principal amount of senior unsecured notes that mature on August 1, 2022 (the "2022 Notes"), $400 million in |
69
aggregate principal amount of senior unsecured notes that mature on May 15, 2023 (the "2023 Notes"), and $350 million in aggregate principal amount of senior unsecured notes that mature on June 15, 2024 (the "2024 Notes").
(2) | Interest on our long-term debt under our credit facility is at market-based rates. The interest rates on our 2021, 2022, 2023 and 2024 Notes are 5.75%, 6.75%. 6.00% and 5.625%, respectively. The amount shown for interest payments represents the amount that would be paid if the debt outstanding at December 31, 2016 under our credit facility remained outstanding through the final maturity date of July 28, 2019 and interest rates remained at the December 31, 2016 market levels through the final maturity date. Also included is the interest on our senior unsecured notes through their respective maturity dates. |
(3) | Unconditional purchase obligations include agreements to purchase goods and services that are enforceable and legally binding and specify all significant terms. Contracts to purchase crude oil and petroleum products are generally at market-based prices. For purposes of this table, estimated volumes and market prices at December 31, 2016 were used to value those obligations. The actual physical volumes and settlement prices may vary from the assumptions used in the table. Uncertainties involved in these estimates include levels of production at the wellhead, changes in market prices and other conditions beyond our control. |
(4) | Represents unconditional payment obligations for services to be rendered or products to be delivered in connection with our capital spending program. |
(5) | Represents the estimated future asset retirement obligations on a discounted basis. The recorded asset retirement obligation on our balance sheet at December 31, 2016 was $213.7 million and is further discussed in Note 6 to our Consolidated Financial Statements. |
Off-Balance Sheet Arrangements
We have no off-balance sheet arrangements, special purpose entities, or financing partnerships, other than as disclosed under “Contractual Obligations and Commercial Commitments” above.
Critical Accounting Policies and Estimates
The preparation of our consolidated financial statements in conformity with accounting principles generally accepted in the United States requires us to make estimates and assumptions that affect the reported amounts of assets and liabilities and disclosure of contingent assets and liabilities, if any, at the date of the consolidated financial statements and the reported amounts of revenues and expenses during the reporting period. We base these estimates and assumptions on historical experience and other information that are believed to be reasonable under the circumstances. Estimates and assumptions about future events and their effects cannot be determined with certainty, and, accordingly, these estimates may change as new events occur, as more experience is acquired, as additional information is obtained and as the business environment in which we operate changes. Significant accounting policies that we employ are presented in the Notes to our Consolidated Financial Statements in Item 8 (see Note 2 “Summary of Significant Accounting Policies”).
We have defined critical accounting policies and estimates as those that are most important to the portrayal of our financial results and positions. These policies require management’s judgment and often employ the use of information that is inherently uncertain. Our most critical accounting policies pertain to measurement of the fair value of assets and liabilities in business acquisitions, depreciation, amortization and impairment of long-lived assets, deferred maintenance on marine fixed assets, equity plan compensation accruals and contingent and environmental liabilities. We discuss these policies below.
Fair Value of Assets and Liabilities Acquired and Identification of Associated Goodwill and Intangible Assets
In conjunction with each acquisition we make, we must allocate the cost of the acquired entity to the assets and liabilities assumed based on their estimated fair values at the date of acquisition. As additional information becomes available, we may adjust the original estimates within a short time period subsequent to the acquisition. In addition, we are required to recognize intangible assets separately from goodwill. Determining the fair value of assets and liabilities acquired, as well as intangible assets that relate to such items as customer relationships, contracts, trade names and non-compete agreements involves professional judgment and is ultimately based on acquisition models and management’s assessment of the value of the assets acquired, and to the extent available, third party assessments. Intangible assets with finite lives are amortized over their estimated useful life as determined by management. Goodwill is not amortized but instead is periodically assessed for impairment. Uncertainties associated with these estimates include fluctuations in economic obsolescence factors in the area and potential future sources of cash flow. We cannot provide assurance that actual amounts will not vary significantly from estimated amounts. See Note 3 to our Consolidated Financial Statements in Item 8 regarding further discussion regarding our acquisitions.
70
Depreciation and Amortization of Long-Lived Assets and Intangibles
In order to calculate depreciation and amortization we must estimate the useful lives of our fixed assets at the time the assets are placed in service. We compute depreciation using the straight-line method based on these estimated useful lives. The actual period over which we will use the asset may differ from the assumptions we have made about the estimated useful life. We adjust the remaining useful life as we become aware of such circumstances.
Intangible assets with finite useful lives are required to be amortized over their respective estimated useful lives. If an intangible asset has a finite useful life, but the precise length of that life is not known, that intangible asset shall be amortized over the best estimate of its useful life. At a minimum, we will assess the useful lives and residual values of all intangible assets on an annual basis to determine if adjustments are required. We are recording amortization of our customer and supplier relationships, licensing agreements and trade names based on the period over which the asset is expected to contribute to our future cash flows. Generally, the contribution of these assets to our cash flows is expected to decline over time, such that greater value is attributable to the periods shortly after the acquisition was made. Our favorable lease and other intangible assets are being amortized on a straight-line basis over their expected useful lives.
Impairment of Long-Lived Assets including Intangibles and Goodwill
When events or changes in circumstances indicate that the carrying amount of a fixed asset or intangible asset with finite lives may not be recoverable, we review our assets for impairment. We compare the carrying value of the fixed asset to the estimated undiscounted future cash flows expected to be generated from that asset. Estimates of future net cash flows include estimating future volumes, future margins or tariff rates, future operating costs and other estimates and assumptions consistent with our business plans. If we determine that an asset’s unamortized cost may not be recoverable due to impairment; we may be required to reduce the carrying value and the subsequent useful life of the asset. Any such write-down of the value and unfavorable change in the useful life of an intangible asset would increase costs and expenses at that time. Goodwill represents the excess of the purchase prices we paid for certain businesses over their respective fair values. We do not amortize goodwill; however, we evaluate, and test if necessary, our goodwill (at the reporting unit level) for impairment on October 1 of each fiscal year, and more frequently, if indicators of impairment are present.
We may perform a qualitative assessment of relevant events and circumstances about the likelihood of goodwill impairment. If it is deemed more likely than not the fair value of the reporting unit is less than its carrying amount, we calculate the fair value of the reporting unit. Otherwise, further testing is not required. We may also elect to exercise our unconditional option to bypass this qualitative assessment, in which case we would also calculate the fair value of the reporting unit. The qualitative assessment is based on reviewing the totality of several factors, including macroeconomic conditions, industry and market considerations, cost factors, overall financial performance, other entity specific events (for example, changes in management) or other events such as selling or disposing of a reporting unit. The determination of a reporting unit’s fair value is predicated on our assumptions regarding the future economic prospects of the reporting unit. Such assumptions include (i) discrete financial forecasts for the assets contained within the reporting unit, which rely on management’s estimates of operating margins, (ii) long-term growth rates for cash flows beyond the discrete forecast period, (iii) appropriate discount rates and (iv) estimates of the cash flow multiples to apply in estimating the market value of our reporting units. If the fair value of the reporting unit (including its inherent goodwill) is less than its carrying value, a charge to earnings may be required to reduce the carrying value of goodwill to its implied fair value. If future results are not consistent with our estimates, we could be exposed to future impairment losses that could be material to our results of operations. We monitor the markets for our products and services, in addition to the overall market, to determine if a triggering event occurs that would indicate that the fair value of a reporting unit is less than its carrying value. One of our monitoring procedures is the comparison of our market capitalization to our book equity on a quarterly basis to determine if there is an indicator of impairment. As of December 31, 2016, our market capitalization exceeded the book value of our equity; therefore, since there were no events or changes in circumstances indicating impairment issues, we determined that it was not necessary to perform an interim assessment as of December 31, 2016. We did not have any goodwill impairments in 2016, 2015 or 2014.
For additional information regarding our goodwill, see Note 9 to our Consolidated Financial Statements in Item 8.
71
Deferred Charges on Marine Transportation Assets
Our marine vessels are required by US Coast Guard regulations to be re-certified after a certain period of time, usually every five years. The US Coast Guard states that vessels must meet specified "seaworthiness" standards to maintain required operating certificates. To meet such standards, vessels must undergo regular inspection, monitoring, and maintenance, referred to as "dry-docking." Typical dry-docking costs include costs incurred to comply with regulatory and vessel classification inspection requirements, blasting and steel coating, and steel replacement. We expense routine repairs and maintenance as they are incurred. For the major replacements and improvements we defer and amortize the costs over the length of time that the certification is supposed to last, which is generally the 5 year (60 month) internal inspection regulated by the US Coast Guard. Inherent in this process are judgments we make regarding whether the specific cost incurred is capitalizable and the period that the incurred cost will benefit.
Equity Compensation Plan Accrual
Our 2010 Long-Term Incentive Plan provides for grantees, which may include key employees and directors, to receive cash at the vesting of the phantom units equal to the average of the closing market price of our common units for the twenty trading days prior to the vesting date. Our phantom units are comprised of both service-based and performance-based awards. Until the vesting date, we calculate estimates of the fair value of the awards and record that value as compensation expense during the vesting period on a straight-line basis. These estimates are based on the current trading price of our common units and an estimate of the forfeiture rate we expect may occur. For our performance-based awards, our fair value estimates are weighted based on probabilities for each performance condition applicable to the award. At December 31, 2016, we had 664,462 phantom units outstanding and recorded $8.9 million of expense during 2016. The liability recorded for phantom units expected to vest fluctuates with the market price of our common units. At the date of vesting, any difference between the estimates recorded and the actual cash paid to the grantee will be charged to expense. At December 31, 2016, we estimated approximately $10.5 million of remaining compensation costs to be recognized over a weighted average period of approximately one and a half years for these awards. Changes in our assumptions may impact our liabilities and expenses related to these awards.
See Note 15 to our Consolidated Financial Statements in Item 8 for further discussion regarding our equity compensation plans.
Liability and Contingency Accruals
We accrue reserves for contingent liabilities including environmental remediation and potential legal claims. When our assessment indicates that it is probable that a liability has occurred and the amount of the liability can be reasonably estimated, we make accruals. We base our estimates on all known facts at the time and our assessment of the ultimate outcome, including consultation with external experts and counsel. We revise these estimates as additional information is obtained or resolution is achieved.
We also make estimates related to future payments for environmental costs to remediate existing conditions attributable to past operations. Environmental costs include costs for studies and testing as well as remediation and restoration. We sometimes make these estimates with the assistance of third parties involved in monitoring the remediation effort.
At December 31, 2016, we were not aware of any contingencies or liabilities that would have a material effect on our financial position, results of operations or cash flows.
Recent Accounting Pronouncements
Recently Issued and Recently Adopted
In May 2014, the FASB issued revised guidance on revenue from contracts with customers that will supersede most current revenue recognition guidance, including industry-specific guidance. The core principle of the revenue model is that an entity will recognize revenue to depict the transfer of promised goods or services to customers in an amount that reflects the consideration to which the entity expects to be entitled in exchange for those goods or services. The new standard provides a five-step analysis for transactions to determine when and how revenue is recognized. The guidance permits the use of either a full retrospective or a modified retrospective approach. In July 2015, the FASB approved a one year deferral of the effective date of this standard to December 15, 2017 for annual reporting periods beginning after that date. The FASB also approved early adoption of the standard, but not before the original effective date of December 15, 2016. While we do not believe there will be a material impact to our revenues upon adoption, we are continuing to evaluate the impacts of our pending adoption of this guidance and our preliminary assessments are subject to change.
In July 2015, the FASB issued guidance modifying the accounting for inventory. Under this guidance, the measurement principle for inventory will change from lower of cost or market value to lower of cost and net realizable value. The guidance defines net realizable value as the estimated selling price in the ordinary course of business, less reasonably
72
predictable costs of completion, disposal, and transportation. The guidance is effective for reporting periods after December 15, 2016, with early adoption permitted. We do not expect adoption to have a material impact on our consolidated financial statements.
In February 2016, the FASB issued guidance to improve the transparency and comparability among companies by requiring lessees to recognize a lease liability and a corresponding lease asset for virtually all lease contracts. The guidance also requires additional disclosure about leasing arrangements. The guidance is effective for interim and annual periods beginning after December 15, 2018 and requires a modified retrospective approach to adoption. Early adoption is permitted. We are currently evaluating this guidance.
In August 2016, the FASB issued guidance that addresses how certain cash receipts and payments are presented and classified in the statement of cash flows under Topic 230, Statement of Cash flow, and other Topics. The guidance is effective for annual reporting periods, and interim periods therein, beginning after December 15, 2017. We do not expect the adoption of this guidance to have a material impact on our consolidated financial statements.
Item 7a. Quantitative and Qualitative Disclosures About Market Risk
We are exposed to various market risks, primarily related to volatility in crude oil and petroleum products prices, NaHS and NaOH prices and interest rates. Our policy is to purchase only commodity products for which we have a market, and to structure our sales contracts so that price fluctuations for those products do not materially affect the Segment Margin we receive. We do not acquire and hold futures contracts or other derivative products for the purpose of speculating on price changes.
Our primary price risk relates to the effect of crude oil and petroleum products price fluctuations on our inventories and the fluctuations each month in grade and location differentials and their effect on future contractual commitments. Our risk management policies are designed to monitor our physical volumes, grades and delivery schedules to ensure our hedging activities address the market risks that are inherent in our gathering and marketing activities. We believe our hedging activities have been successful in helping to mitigate these risks.
We utilize NYMEX commodity based futures contracts and option contracts to hedge our exposure to these market price fluctuations as needed. All of our open commodity price risk derivatives at December 31, 2016 were categorized as non-trading. On December 31, 2016 we had entered into NYMEX future contracts that will settle between February and March 2017 and NYMEX options contracts that will settle during February and May 2017. This accounting treatment is discussed further in Note 17 to our Consolidated Financial Statements.
The table below presents information about our open derivative contracts at December 31, 2016. Notional amounts in barrels or gallons, the weighted average contract price, total contract amount and total fair value amount in U.S. dollars of our open positions are presented below. Fair values were determined by using the notional amount in barrels or gallons multiplied by the December 31, 2016 quoted market prices on the NYMEX. All of the hedge positions offset physical exposures to the cash market; none of these offsetting physical exposures are included in the table below.
73
Unit of Measure for Volume | Contract Volumes (in 000’s) | Unit of Measure for Price | Weighed Average Market Price | Contract Value (in 000’s) | Mark-to Market Change (in 000’s) | Settlement Value (in 000’s) | ||||||||||||||||
NYMEX Futures Contracts | ||||||||||||||||||||||
Sell (Short) Contracts: | ||||||||||||||||||||||
Crude Oil | Bbl | 2,708 | Bbl | $ | 50.23 | $ | 136,077 | $ | 10,846 | $ | 146,923 | |||||||||||
Crude Oil Swaps | Bbl | — | Bbl | $ | — | $ | — | $ | — | $ | — | |||||||||||
Diesel | Bbl | 13 | Gal | (1) | $ | 1.69 | $ | 923 | $ | 21 | $ | 944 | ||||||||||
#6 Fuel Oil | Bbl | 190 | Bbl | $ | 45.91 | $ | 8,722 | $ | 331 | $ | 9,053 | |||||||||||
Buy (Long) Contracts: | ||||||||||||||||||||||
Crude Oil | Bbl | 1,349 | Bbl | $ | 51.08 | $ | 68,904 | $ | 3,757 | $ | 72,661 | |||||||||||
Diesel | Bbl | — | Gal | (1) | $ | — | $ | — | $ | — | $ | — | ||||||||||
#6 Fuel Oil | Bbl | 20 | Bbl | 47.62 | 952 | 1 | $ | 953 | ||||||||||||||
NYMEX Option Contracts (2) | ||||||||||||||||||||||
Written Contracts: | ||||||||||||||||||||||
Crude Oil | Bbl | 35 | Bbl | $ | 1.57 | $ | 55 | $ | 21 | $ | 76 | |||||||||||
Purchased Contracts: | ||||||||||||||||||||||
Crude Oil | Bbl | 5 | Bbl | $ | 0.23 | $ | 1 | $ | — | $ | 1 | |||||||||||
(1) | Prices and volumes as presented as quoted on the NYMEX. To calculate the total contract value the price per unit in gallons should be multiplied by 42 gallons to convert into a price per barrel. |
(2) | Weighted average premium received/paid. |
We manage our risks of volatility in NaOH prices by indexing prices for the sale of NaHS to the market price for NaOH in most of our contracts.
We are also exposed to market risks due to the floating interest rates on our credit facility. Obligations under our senior secured credit facility bear interest at the LIBOR rate or alternate base rate (which approximates the prime rate), at our option, plus the applicable margin. We have not historically hedged our interest rates. On December 31, 2016, we had $1.3 billion of debt outstanding under our credit facility. For the year ended December 31, 2016, a 10% change in LIBOR would have resulted in approximately a $4.0 million change in net income.
Item 8. Financial Statements and Supplementary Data
The information required hereunder is included in this report as set forth in the “Index to Consolidated Financial Statements”.
Item 9. Changes in and Disagreements with Accountants on Accounting and Financial Disclosure
None.
Item 9A. Controls and Procedures
Evaluation of Disclosure Controls and Procedures
We maintain disclosure controls and procedures and internal controls designed to ensure that information required to be disclosed in our filings under the Securities Exchange Act of 1934 is recorded, processed, summarized and reported within the time periods specified in the Securities and Exchange Commission’s rules and forms. Our chief executive officer and chief financial officer, with the participation of our management, have evaluated our disclosure controls and procedures as of the end of the period covered by this Annual Report on Form 10-K and have determined that such disclosure controls and procedures are effective in providing assurance of the timely recording, processing, summarizing and reporting of information, and in accumulation and communication to management on a timely basis material information relating to us (including our consolidated subsidiaries) required to be disclosed in this Annual Report on Form 10-K.
74
Changes in Internal Controls over Financial Reporting
There were no changes during our last fiscal quarter that materially affected, or are reasonably likely to materially affect, our internal control over financial reporting.
Management’s Report on Internal Control over Financial Reporting
Management of the Partnership is responsible for establishing and maintaining effective internal control over financial reporting as defined in Rules 13a-15(f) under the Securities Exchange Act of 1934. The Partnership’s internal control over financial reporting is designed to provide reasonable assurance to the Partnership’s management and board of directors regarding the preparation and fair presentation of published financial statements.
Because of its inherent limitations, internal control over financial reporting may not prevent or detect misstatements. Also, projections of any evaluation of effectiveness to future periods are subject to the risk that controls may become inadequate because of changes in conditions, or that the degree of compliance with the policies or procedures may deteriorate.
Management assessed the effectiveness of the Partnership’s internal control over financial reporting as of December 31, 2016. In making this assessment, management used the criteria established in Internal Control – Integrated Framework issued by the Committee of Sponsoring Organizations of the Treadway Commission (2013 framework). Based on our assessment, we believe that, as of December 31, 2016, the Partnership’s internal control over financial reporting is effective based on those criteria.
Pursuant to Section 404 of the Sarbanes-Oxley Act of 2002, our management included a report of their assessment of the design and effectiveness of our internal controls over financial reporting as part of this Annual Report on Form 10-K for the fiscal year ended December 31, 2016. Deloitte & Touche LLP, the Partnership’s independent registered public accounting firm, has issued an attestation report on the effectiveness of the Partnership’s internal control over financial reporting. Deloitte & Touche’s attestation report on the Partnership’s internal control over financial reporting appears in Item 8. “Financial Statements and Supplementary Data.”
Item 9B. Other Information
None.
Part III
Item 10. Directors, Executive Officers and Corporate Governance
Management of Genesis Energy, L.P.
We are a Delaware limited partnership. We conduct our operations and own our operating assets through our subsidiaries and joint ventures. Our general partner, Genesis Energy, LLC, a wholly-owned subsidiary that owns a non-economic general partner interest in us, has sole responsibility for conducting our business and managing our operations. It also employs most of our personnel, including executive officers.
The board of directors of our general partner (which we refer to as “our board of directors”) must approve significant matters (such as material business strategies, mergers, business combinations, acquisitions or dispositions of assets, issuances of common units, incurrences of debt or other financings and the payments of distributions). The holders of our Class B Common Units are entitled to (i) vote in the election of our board of directors, subject to the Davison family’s rights under its unitholder rights agreement (described below), as well as (ii) vote on substantially all other matters on which our Class A holders are entitled to vote. The holders of our Class A Common Units are not entitled to vote in the election of directors, but they are entitled to vote in a very limited number of other circumstances, including our merger with another company. As is common with MLPs, our partnership structure does not grant our unitholders (in such capacity) the right to directly or indirectly participate in our management or operations other than through the exercise of their limited voting rights.
Collectively, members of the Davison family own approximately 10.5% of our Class A Common Units and 76.9% of our Class B Common Units, for a combined ownership percentage of 10.5% of total Common Units. Pursuant to its unitholder rights agreement, the Davison family is entitled to elect up to three of our directors based on its members’ collective ownership percentage of our outstanding common units: (i) with 15% or more ownership, they have the right to appoint three directors, (ii) with less than 15% ownership but more than 10%, they have the right to appoint two directors, and (iii) with less than 10% ownership, they have the right to appoint one director. That unitholder rights agreement also provides that, so long as the Davison family has the right to elect three directors thereunder, our board of directors cannot have more than 11 directors without the Davison family’s consent. In addition to their rights under that unitholder rights agreement, if the members of the Davison family act as a group, they have the ability to elect at least a majority of our directors because they own a majority of our Class B units.
75
Under our limited partnership agreement, the organizational documents of our general partner and indemnification agreements with our directors, subject to specified limitations, we will indemnify to the fullest extent permitted by Delaware law, from and against all losses, claims, damages or similar events, any director or officer, or while serving as director or officer, any person who is or was serving as a tax matters member or as a director, officer, tax matters member, employee, partner, manager, fiduciary or trustee of our partnership or any of our affiliates. Additionally, we will indemnify to the fullest extent permitted by law, from and against all losses, claims, damages or similar events, any person who is or was an employee (other than an officer) or agent of our general partner.
Our board of directors currently consists of Sharilyn S. Gasaway, James E. Davison, James E. Davison, Jr., Corbin J. Robertson III, Kenneth M. Jastrow II, Conrad P. Albert, Jack T. Taylor and Mr. Sims. Our board of directors has determined that each of Ms. Gasaway and Messrs. Robertson, Jastrow, Albert and Taylor is an independent director under the NYSE rules.
Board Leadership Structure and Risk Oversight
Board Leadership Structure
Our board of directors has no policy that requires the positions of the Chairman of the Board and the Chief Executive Officer to be held by the same or different persons or that we designate a lead or presiding independent director. Our board of directors believes it is important to retain the flexibility to make those determinations based on an assessment of the circumstances existing from time to time, including the composition, skills and experience of our board of directors and its members, specific challenges faced by the company or the industry in which it operates, and governance efficiency.
Presently, our board of directors believes that, because Mr. Sims is the director most familiar with our business and industry and the most capable of leading the discussion of, and executing on, our business strategy, he is best situated to serve as Chairman, regardless of the fact that he is the Chief Executive Officer of our general partner. Our board of directors also believes that the appointment of a lead independent director, who will preside over executive sessions of non-management directors of our board of directors, will facilitate teamwork and communication between the non-management directors and management. Our board of directors appointed Mr. Jastrow as our lead independent director because of his executive experience and service as a director of other companies. Our board of directors believes that the combined role of Chairman and Chief Executive Officer working with the lead independent director is currently in the best interest of unitholders, providing the appropriate balance between developing our strategy and overseeing management.
We are committed to sound principles of governance. Such principles are critical for us to achieve our performance goals and maintain the trust and confidence of investors, personnel, suppliers, business partners and stakeholders. We believe independent directors are a key element for strong governance, although we have reserved or exercised our right as a limited partnership under the listing standards of the NYSE not to comply with certain requirements of the NYSE. For example, although at least a majority of the members of our board of directors is independent under the NYSE rules, we reserve the right not to comply with Section 303A.01 of the NYSE Listed Company Manual in the future, which would require that our board of directors be comprised of at least a majority of independent directors. In addition, among other things, we have elected not to comply with Sections 303A.04 and 303A.05 of the NYSE Listed Company Manual, which would require our board of directors to maintain a nominating/corporate governance committee and a compensation committee, each consisting entirely of independent directors. Our corporate governance guidelines are available on our website (www.genesisenergy.com) free of charge. For further discussion of director independence, please see Item 13. "Certain Relationships and Related Transactions, and Director Independence—Director Independence."
Risk Oversight
We face a number of risks, including exposure to matters relating to the environment, regulation, competition, fluctuations in commodity prices and interest rates and severe weather. Management is responsible for the day-to-day management of the risks our company faces, although our board of directors, as a whole and through its committees, has responsibility for the oversight of risk management. In fulfilling its risk oversight role, our board of directors must determine whether risk management processes designed and implemented by our management are adequate and functioning as designed. Senior management regularly delivers presentations to our board of directors on strategic matters, operations, risk management and other matters, and are available to address any questions or concerns raised by our board of directors. Board of directors meetings also regularly include discussions with senior management regarding strategies, key challenges and risks and opportunities for our company.
Our board committees assist our board of directors in fulfilling its oversight responsibilities in certain areas of risk. For example, the audit committee assists with risk management oversight in the areas of financial reporting, internal controls and compliance with legal and regulatory requirements and our risk management policy relating to our hedging program. The governance, compensation and business development committee assists our board of directors with risk management relating to our compensation policies and programs.
76
Our board of directors believes that it is important to align (when practical) the interests of the members of our board of directors and certain of our officers with the interests of our long-term stakeholders. Our board of directors has adopted certain policies to further promote that alignment of interests. For example, among other things, our policies prohibit our directors and officers from (i) buying, selling or engaging in transactions with respect to our common units while they are aware of material non-public information and (ii) engaging in short sales of our securities. Certain of our directors and/or officers own substantial amounts of our units, some of which are pledged, including being held in broker margin accounts. See Item 12. "Security Ownership of Certain Beneficial Owners and Management and Related Unitholder Matters."
Audit Committee
The audit committee of our board of directors generally oversees our accounting policies and financial reporting and the audit of our financial statements. The audit committee assists our board of directors in its oversight of the quality and integrity of our financial statements and our compliance with legal and regulatory requirements. Our independent registered public accounting firm is given unrestricted access to the audit committee. Our board of directors has determined that the members of the audit committee meet the independence and experience standards established by NYSE and the Securities Exchange Act of 1934, as amended. In accordance with the NYSE rules and the Securities Exchange Act of 1934, as amended, our board of directors has named three of its members to serve on the audit committee—Sharilyn S. Gasaway, Conrad P. Albert and Jack T. Taylor. Ms. Gasaway is the chairperson. Our board of directors believes that Ms. Gasaway and Mr. Taylor qualify as audit committee financial experts as such term is used in the rules and regulations of the SEC. The charter of the audit committee is available on our website (www.genesisenergy.com) free of charge. Each member of the audit committee is an independent director under NYSE rules.
Governance, Compensation and Business Development Committee
The governance, compensation and business development committee, or G&C Committee, of our board of directors generally (i) monitors compliance with corporate governance guidelines, (ii) reviews and makes recommendations regarding board and committee composition, structure, size, compensation and related matters, and (iii) oversees compensation plans and compensation decisions for our employees. All the members of our board of directors, other than our CEO, serve as members of the G&C Committee. Mr. Jastrow is the chairperson. The charter of the G&C Committee is available on our website (www.genesisenergy.com) free of charge.
Conflicts Committee
To the extent requested by our board of directors, a conflicts committee of our board of directors would be appointed to review specific matters in connection with the resolution of conflicts of interest and potential conflicts of interest between any of our affiliates and us. If a specific review is requested by our board of directors, our conflicts committee would be formed by our Board and would be comprised solely of independent directors. See Item 13. “Certain Relationships and Related Transactions, and Director Independence—Review or Special Approval of Material Transactions with Related Persons.”
Executive Sessions of Non-Management Directors
Our board of directors holds executive sessions in which non-management directors meet without any members of management present in connection with regular board meetings. The purpose of these executive sessions is to promote open and candid discussion among the non-management directors. Mr. Jastrow, as the lead independent director, serves as the presiding director at those executive sessions. In accordance with NYSE rules, interested parties can communicate directly with non-management directors by mail in care of the General Counsel and Secretary or in care of the chairperson of the audit committee at 919 Milam, Suite 2100, Houston, TX 77002. Such communications should specify the intended recipient or recipients. Commercial solicitations or communications will not be forwarded. We have established a toll-free, confidential telephone hotline so that interested parties may communicate with the chairperson of the audit committee or with all the non-management directors as a group. All calls to this hotline are reported to the chairperson of the audit committee who is responsible for communicating any necessary information to the other non-management directors. The number of our confidential hotline is (800) 826-6762.
Directors and Executive Officers
Set forth below is certain information concerning our directors and executive officers, effective as of February 27, 2017.
77
Name | Age | Position | ||
Grant E. Sims | 61 | Director, Chairman of the Board, and Chief Executive Officer | ||
Conrad P. Albert | 70 | Director | ||
James E. Davison | 79 | Director | ||
James E. Davison, Jr. | 50 | Director | ||
Sharilyn S. Gasaway | 48 | Director | ||
Kenneth M. Jastrow II | 69 | Director | ||
Corbin J. Robertson III | 46 | Director | ||
Jack T. Taylor | 65 | Director | ||
Robert V. Deere | 62 | Chief Financial Officer | ||
Stephen M. Smith | 40 | Vice President | ||
Richard R. Alexander | 41 | Vice President | ||
Karen N. Pape | 58 | Senior Vice President and Controller | ||
Kristen O. Jesulaitis | 47 | General Counsel | ||
William S. Goloway | 56 | Vice President | ||
Garland G. Gaspard | 62 | Vice President | ||
Chad A. Landry | 53 | Vice President | ||
Ryan S. Sims | 33 | Vice President | ||
Grant E. Sims has served as a director and Chief Executive Officer of our general partner since August 2006 and Chairman of the Board of our general partner since October 2012. Mr. Sims was affiliated with Leviathan Gas Pipeline Partners, LP from 1992 to 1999, serving as the Chief Executive Officer and a director beginning in 1993 until he left to pursue personal interests, including investments. Leviathan (subsequently known as El Paso Energy Partners, L.P. and then GulfTerra Energy Partners, L.P.) was a NYSE listed master limited partnership. As of February 10, 2017, Mr. Sims is a director of one other public company, WildHorse Resources Development Corporation. Mr. Sims has an established track record of developing strong companies and has led his companies through a period of substantial growth while increasing geographic and operational diversity. Mr. Sims provides leadership skills, executive management experience and significant knowledge of our business environment, which he has gained through his vast experience with other MLPs.
Conrad P. Albert has served as a director of our general partner since July 2013. Mr. Albert is a private investor and was formerly a director of Anadarko Petroleum Corporation from 1986 to 2006. Mr. Albert also served as a director of DeepTech International, Inc. from 1992 to 1998. From 1969 to 1991, Mr. Albert served in various positions with Manufacturers Hanover Trust Company, ultimately serving as Executive Vice President in charge of worldwide energy lending and corporate finance. Mr. Albert’s extensive financial, executive and directorial experience and his service in various roles in the management of other energy-related companies will allow him to provide valuable expertise to our board of directors.
James E. Davison has served as a director of our general partner since July 2007. Mr. Davison served as chairman of the board of Davison Transport, Inc. for over 30 years. He also serves as President of Terminal Services, Inc. Mr. Davison has over forty years of experience in the energy-related transportation and refinery services businesses. Mr. Davison brings to our board of directors significant energy-related transportation and refinery services experience and industry knowledge.
James E. Davison, Jr. has served as a director of our general partner since July 2007. Mr. Davison is also a director of Origin Bancorp, Inc. and serves on its nominating and corporate governance, finance, and compensation committees. Mr. Davison is the son of James E. Davison. Mr. Davison’s executive and leadership experience enable him to make valuable contributions to our board of directors.
Sharilyn S. Gasaway has served as a director of our general partner since March 2010 and serves as chairperson of the audit committee. Ms. Gasaway is a private investor and was Executive Vice President and Chief Financial Officer of Alltel Corporation, a wireless communications company, from 2006 to 2009. She served as Controller of Alltel Corporation from 2002 through 2006. Ms. Gasaway is a director of two other public companies, JB Hunt Transport Services, Inc. and Waddell and Reed Financial, Inc., serving on the audit committee of each company. Additionally, Ms. Gasaway serves on the compensation and nominating committees of JB Hunt and the nominating and corporate governance committee and investment committees of Waddell and Reed. Ms. Gasaway provides our board of directors valuable management and financial expertise, including an understanding of the accounting and financial matters that we address on a regular basis.
Kenneth M. Jastrow II has served as a director of our general partner since March 2010 and serves as our lead independent director and the chairperson of the G&C Committee. Mr. Jastrow served as Chairman and Chief Executive Officer
78
of Temple-Inland, Inc., a manufacturing company and the former parent of Forestar Group, from 2000 to 2007. Prior to that, Mr. Jastrow served in various roles at Temple-Inland, including President and Chief Operating Officer, Group Vice President and Chief Financial Officer. Mr. Jastrow is also a director and serves on the compensation committee of KB Home and MGIC Investment Corporation. Mr. Jastrow formerly served as Non-Executive Chairman of Forestar Group, Inc. Mr. Jastrow’s executive experience and service as director of other companies enable him to make valuable contributions to our board of directors and particularly well suited to be the lead independent director.
Corbin J. Robertson III has served as a director of our general partner since February 2010. Mr. Robertson is a Managing Partner of LKCM Headwater Investments GP, LLC and LKCM Headwater Investments I, L.P., a private equity fund. Mr. Robertson is also an owner of various interests associated with the Robertson family holding company and Quintana Capital Group, an energy focused private equity firm he co-founded. Mr. Robertson currently serves on various boards of Quintana and LKCM Headwater affiliated portfolio companies. Mr. Robertson is a director of one other public company, Natural Resource Partners, LP. Previously, Mr. Robertson was a Vice President for Reservoir Capital Group, a New York-based investment firm, and prior to that, he worked for three years as a Vice President for Sandefer Capital Partners, an energy investment fund. We believe that Mr. Robertson's experience with investment in a variety of energy businesses provides a valuable resource to our board of directors.
Jack T. Taylor has served as a director of our general partner since July 2013. Mr. Taylor is currently a director of Sempra Energy and Murphy USA Inc. Additionally, Mr. Taylor currently serves on the audit committee of Sempra Energy and Murphy USA Inc. Mr. Taylor was a partner of KPMG LLP for 29 years, where from 2005 to 2010 he served as KPMG's Chief Operating Officer-Americas and Executive Vice Chair of U.S. Operations and from 2001 to 2005 he served as the Vice Chairman of U.S. Audit and Risk Advisory Services. Mr. Taylor’s extensive experience with financial and public accounting issues, his various leadership roles at KPMG LLP and his extensive knowledge of the energy industry make him a valuable resource to our board of directors.
Robert V. Deere has served as Chief Financial Officer of our general partner since October 2008. Mr. Deere served as Vice President, Accounting and Reporting at Royal Dutch Shell (Shell) from 2003 through 2008.
Stephen M. Smith has served as Vice President of our general partner since February 2010. Mr. Smith is responsible for the commercial aspects of our supply and logistics segment. Since 2009, Mr. Smith has served in various capacities within our commercial development and finance groups. He was a Principal for the energy investment banking group at Banc of America Securities from 2006 to 2009.
Richard R. Alexander has served as Vice President of our general partner since November 2014. Mr. Alexander is responsible for the commercial aspects of our marine transportation segment. Since 2008, Mr. Alexander has served in various capacities within our marine operations.
Karen N. Pape has served as Senior Vice President and Controller of our general partner since July 2007 and served as Vice President and Controller from May 2002 until July 2007.
Kristen O. Jesulaitis has served as an executive officer of our general partner since January 2017. Ms. Jesulaitis has served as our General Counsel since July 2011. She is responsible for all legal functions of Genesis, including acquisitions and commercial transactions, compliance and regulatory affairs, corporate governance, securities, and finance. Prior to joining Genesis, Ms. Jesulaitis was a partner at the law firm Akin Gump Strauss Hauer & Feld LLP principally engaged in the areas of corporate and securities law, with primary focus in the midstream energy sector.
William S. Goloway has served as Vice President of our general partner since January 2017. Mr. Goloway has been responsible for the commercial aspects of our offshore Gulf of Mexico assets from the time we acquired these offshore assets from Enterprise Products in 2015. Prior to this acquisition, Mr. Goloway served in various roles within the offshore group at Enterprise Products since 2005.
Garland G. Gaspard has served as Vice President of our general partner since January 2017 and is responsible for the operational aspects of our onshore and offshore pipelines, rail facilities, terminals, offshore facilities and assets, engineering, trucking and health, safety, security and environmental compliance. Mr. Gaspard joined Genesis in 2015 as a result of our acquisition of the offshore Gulf of Mexico assets from Enterprise Products and has had responsibility for the operational aspects of our offshore assets since that time. Prior to this acquisition, Mr. Gaspard served in various capacities within Enterprise Products' operations including underground gas storage, natural gas liquids, natural gas pipelines and offshore operations.
Chad A. Landry has served as Vice President of our general partner since January 2017. Mr. Landry joined Genesis in 2013 and since that time has been responsible for all operational and commercial aspects of our refinery services segment. Prior to joining Genesis, he spent 14 years at Axiall Corporation (Georgia Gulf), most recently as Vice President - Chlor-Alkali & Vinyls.
79
Ryan S. Sims has served as Vice President of our general partner since January 2017. Mr. Sims joined Genesis in 2011 and most recently was responsible for the operational and commercial aspects of our rail and terminals businesses. Prior to joining Genesis, Mr. Sims spent six years in the investment banking industry. Mr. Sims is the son of Grant E. Sims, our Chairman and Chief Executive Officer.
Common Unit Ownership by Directors and Executive Officers
We encourage our directors and officers to own our common units, although we do not feel it is necessary to require them to own a minimum number. Certain of our directors and officers own substantial amounts of our securities, although any (or all) of them may sell, pledge or otherwise dispose of all or a portion of those securities at any time, subject to any applicable legal and company policy requirements. See Item 10. “Directors, Executive Officers and Corporate Governance-Board Leadership Structure and Risk Oversight-Risk Oversight.”
Code of Ethics
We have adopted a Code of Business Conduct and Ethics that is applicable to, among others, the principal financial officer and the principal accounting officer. Our Code of Business Conduct and Ethics is posted at our website (www.genesisenergy.com), where we intend to report any changes or waivers.
Section 16(a) Beneficial Ownership Reporting Compliance
Section 16(a) of the Securities Exchange Act of 1934 requires our officers and directors of our general partner and persons who own more than ten percent of a registered class of our equity securities to file reports of ownership and changes in ownership with the SEC and the NYSE. Based solely on our review of the copies of such reports received by us, or written representations from certain reporting persons to us, we are aware of no filings that were not timely made, except for the following: Ms. Pape filed a Form 4 on April 25, 2016 for the issuance of phantom units on April 12, 2016 and Messrs. Albert and Taylor each filed a Form 4 on July 20, 2016 for the vesting of phantom units that occurred on July 15, 2016.
Item 11. Executive Compensation
The Compensation Discussion and Analysis below discusses our compensation process, objectives and philosophy with respect to our Named Executive Officers (“NEOs”), for the fiscal year ended December 31, 2016.
Compensation Discussion and Analysis
Named Executive Officers
Our NEOs for 2016 were:
• | Grant E. Sims, Chief Executive Officer; |
• | Robert V. Deere, Chief Financial Officer; |
• | Paul A. Davis, formerly Senior Vice President; |
• | Stephen M. Smith, Vice President; and |
• | Richard R. Alexander, Vice President. |
Board and Governance, Compensation and Business Development Committee
Our board of directors is responsible for, and effectively determines, compensation programs applicable to our NEOs and to the board itself. Our board of directors has delegated to the G&C Committee, of which a majority of the members are "independent," according to NYSE listing standards, the authority and responsibility to regularly analyze and evaluate our compensation policies, to determine the annual compensation of our NEOs, and to make recommendations to our board of directors with respect to such matters. As described in more detail below, the G&C Committee engaged BDO USA, LLP, or BDO, as its independent compensation adviser. We also utilize committees comprised solely of certain of our independent directors (i.e., the audit committee or special committees) to review and make recommendations with respect to certain matters such as obtaining exemptions from the “insider trading” rules under Section 16 of the Exchange Act in connection with certain acquisitions. Because the G&C Committee is comprised of all the members of our board of directors, excluding our CEO, determinations and recommendations by the G&C Committee are effectively determinations by our board of directors, which has approval authority for all such compensation matters. For a more detailed discussion regarding the purposes and composition of board committees, please see Item 10. “Directors, Executive Officers and Corporate Governance.”
Committee/Board Process
80
Following the end of each calendar year, our CEO reviews the compensation of all the other NEOs and makes a proposal to the G&C Committee regarding their compensation. The CEO's proposal is based on (among other things) our financial results for the prior year, the relevant executive’s areas of responsibility, market data provided by our independent compensation adviser and recommendations from the relevant executive’s supervisor (if other than our CEO). The G&C Committee reviews the compensation of our CEO and the proposal of our CEO regarding the compensation of the other NEOs and makes a final determination (and a recommendation to our board of directors) regarding the compensation of our NEOs. Depending on the nature and quantity of changes made to that proposal, there may be additional G&C Committee meetings and discussions with our CEO in advance of that determination. Our board of directors has final approval authority for all such compensation matters.
Committee/Board Approval
The G&C Committee determines salaries, annual cash incentives and long-term awards for executive officers, taking into consideration the CEO’s recommendation regarding the NEOs. In April, any applicable salary increases and long-term incentive awards are made or granted. Annual bonuses are paid by March 15th of the year following the year in which they are earned.
Role of Compensation Consultant and Peer Group Analysis
The G&C Committee’s charter authorizes the Committee to retain independent compensation consultants from time to time to serve as a resource in support of its efforts to carry out certain duties. In 2016, the G&C Committee engaged BDO, an independent compensation consultant, to assist the Committee in assessing and structuring competitive compensation packages for the executive officers that are consistent with our compensation philosophy. The G&C Committee assessed the independence of BDO pursuant to current exchange listing requirements and SEC guidance and concluded that no conflict of interest exists that would prevent BDO from serving as an independent consultant to the G&C Committee.
At the request of the G&C Committee, BDO reviewed and provided input on the compensation of our NEOs, trends in executive compensation, meeting materials circulated to the G&C Committee, and management’s recommendations of executive compensation plans. BDO also developed assessments of market levels of compensation through an analysis of peer data and information disclosed in our peer companies’ public filings, but did not determine or recommend the amount of compensation.
The peer group used for this market analysis in 2016 consisted of the following 15 companies in the energy industry: Buckeye Partners, Calumet Specialty Products Partners, Plains All American Pipeline, Enlink Midstream Partners (formerly known as Crosstex Energy Partners), DCP Midstream Partners, HollyFrontier Corporation, Magellan Midstream Partners, Delek US Holdings, NuStar Energy, NGL Energy Partners, Sunoco Logistics Partners, Targa Resources Partners, Spectra Energy Partners, Western Refining and Summit Midstream Partners. These companies were selected as the compensation peer group for any or all of the following reasons:
1) they reflect our industry competitors for products and services;
2) they operate in similar markets or have comparable geographical reach;
3) they are of similar size and maturity to us; or
4) they are companies that have similar credit profiles to us and/or their growth or capital programs are similar to ours.
The Committee reviews the peer group annually and may, from time to time, add or remove companies in order to assure the composition of the group meets the criteria outlined above. The 2016 peer group is different from the 2015 group due to the addition of Delek US Holdings, NGL Energy Partners and Spectra Energy Partners and the elimination of Atlas Pipeline Partners, Markwest Energy Partners, and Regency Energy Partners.
The information that BDO compiled included compensation trends for MLPs and levels of compensation for similarly-situated executive officers of companies within this peer group. We believe that compensation levels of executive officers in our peer group are relevant to our compensation decisions because we compete with those companies for executive management talent.
Compensation Objectives and Philosophy
The primary objectives of our compensation program are to:
• | encourage our executives to build and operate the partnership in a way that is aligned with our common unitholders’ interests, focusing on growing cash distributions and growing the asset base with an emphasis on maintaining a focus on the long-term stability of the enterprise so as to not promote inappropriate risk taking; |
81
• | offer near-term and long-term compensation opportunities that are consistent with industry norms; and |
• | provide appropriate levels of retention to the executive team to ensure long-term continuity and stability for the successful execution of key growth initiatives and projects. |
We strive to accomplish these objectives by providing all employees, including our NEOs, with a total compensation package that is market competitive and performance-based. In our assessment of the market competitiveness of compensation, we take into consideration the compensation offered by companies in our peer group described above, but we have not targeted a specific percentile of peer company pay as a target. Rather, we use market information as one consideration in setting compensation along with individual performance, our financial and operational performance and our safety performance.
We pay base salaries at levels that we feel are appropriate for the skills and qualities of the individual NEOs based on their past performance, current scope of responsibilities and future potential. The incentive-based components of each NEO’s compensation include annual cash incentive bonus opportunities and participation in the long-term incentive program. The annual cash bonus rewards incremental operational and financial achievements required to meet investor expectations in the short-term while the long-term component focuses rewards to the long-term stability of the enterprise. Both incentive components are generally linked to base salary and are consistent in general with our understanding of market practice and with our judgment regarding each individual’s role in the organization.
As described in more detail below, we believe that the combination of base salaries, cash bonuses and long-term incentive plans provide an appropriate balance of short and long-term incentives, cash and non-cash based compensation and alignment of the incentives for our executives, including our NEOs, with the interests of our common unitholders.
The amount of compensation contingent on performance is a significant percentage of total compensation, therefore ensuring business decisions and actions lead to the long-term growth and sustainability of the organization. Our bonus plan is driven by the generation of Available Cash before Reserves (which is an important metric of value for our unitholders) and our safety record. Our long term incentive plan is linked primarily to increases in the distribution rate on our common units and the appreciation in our common unit price, which we believe links pay with performance and creates an alignment of interest between our NEOs and our unitholders.
Elements of Our Compensation Program and Compensation Decisions for 2016
The primary elements of our compensation program are a combination of annual cash and long-term equity-based incentive compensation. For the year ended December 31, 2016, the elements of our compensation program for the NEOs consisted of the following:
• | annual base salary |
• | discretionary annual cash bonus awards |
• | annual grants under long-term incentive arrangements |
Additionally, in order to attract qualified executive personnel, we may make one-time new-hire awards of equity.
Base Salaries
We believe that base salaries should provide a fixed level of competitive pay that reflects the executive officer’s primary duties and responsibilities, and which provides a foundation for incentive opportunities and benefit levels. As discussed above, the base salaries of our NEOs are reviewed annually by the G&C Committee, taking into account recommendations from our CEO regarding NEOs other than himself. We pay base salaries at a level that we feel is appropriate for the skills and qualities of the individual NEOs based on their past performance, current scope of responsibilities and future potential. Base salaries may be adjusted to achieve what is determined to be a reasonably competitive level or to reflect promotions, the assignment of additional responsibilities, individual performance or company performance. Salaries are also periodically adjusted based on analysis of peer group practices as described above.
In April 2016, the G&C Committee reviewed the assessments of market levels of compensation developed by BDO in conjunction with a discussion of individual performance and responsibilities. As a result of and taking into account current market conditions, the base salaries of Messrs. Sims, Deere, Davis, Smith and Alexander were not increased from 2015 and remained unchanged in the amounts of $600,000, $450,000, $375,000, $325,000 and $325,000, respectively.
82
Bonuses
Our NEOs participate in a bonus program, or the Bonus Plan, in which substantially all company employees participate. As designed by the G&C Committee, each NEO has an annual bonus target based on a stated percentage of his base salary. The targeted amount for the NEOs is established based on the analysis of market practices of the peer group and consideration of the level of salary and targeted long-term incentives for each NEO. For 2016, the G&C Committee set each NEO’s bonus target as a percentage of salary as follows:
2016 | |
Name | Bonus Target (% of base salary) |
Grant E. Sims | 100% |
Robert V. Deere | 75% |
Paul A. Davis | 100% |
Stephen M. Smith | 100% |
Richard R. Alexander | 100% |
We believe the Bonus Plan generates bonus amounts that represent a meaningful level of compensation for the employee population and encourages employees to operate as a unified team to generate results that are aligned with the interests of our unitholders. The G&C Committee therefore designed the Bonus Plan to enhance our financial performance by rewarding our NEOs and other employees for achieving (i) financial performance and (ii) safety objectives. Attainment of these two goals is measured by, respectively, Available Cash before Reserves (before subtracting bonus expense and related employer tax burdens) and company-wide safety incident rates.
Available Cash before Reserves, which is a "non-GAAP" measure, is an important factor in determining the amount of distributions to our unitholders and is a significant factor in the market’s perception of the value of common units of an MLP (See Item 7. "Management's Discussion and Analysis of Financial Condition and Results of Operations" for a description of Available Cash before Reserves.) Safety objectives encourage our employees to focus on the impact their job performance has on the environment in which we operate. Both of these measures are used to calculate the recommended bonus payout (or general bonus pool) described below. However, bonuses are paid at the discretion of the G&C Committee based on quantitative and qualitative measures relating to: our financial and operational performance relative to our peers; industry expectations; progress in attaining strategic goals; and individual performance. Because the determination of whether bonuses will be paid each year and in what amounts they will be paid is determined by the G&C Committee on a company-wide basis, NEOs only receive bonuses if other employees receive bonuses.
As in prior years, the 2016 general bonus pool was weighted and calculated as follows: the level of Available Cash before Reserves generated for the year as a percentage of a target set by the G&C Committee was weighted 90% and the achieved level of the safety incident rate was weighted 10%. The sum of the weighted percentage achievement of these targets was multiplied by the eligible compensation and the target percentages established by the G&C Committee for the various levels of our employees to determine the maximum general bonus pool. However, because the G&C Committee also considered other subjective factors in determining the general bonus pool and individual award amounts, the amount of the general bonus pool and individual award amounts is not formulaic. Based on the G&C Committee's subjective review of our 2016 operational and financial performance, it was determined that our NEOs would not receive bonuses relating to 2016.
In addition, we have occasionally agreed to pay retention bonuses when it was necessary to attract or retain a key executive officer. In 2016, Messrs. Smith and Alexander were granted retention bonuses of $75,000 and $200,000 respectively. These retention bonuses are to be paid in equal installments in April 2017 and April 2018, contingent upon continued employment at those dates. Mr. Davis was awarded a retention bonus of similar terms in the amount of $93,750, which he has foregone given his January 6, 2017 resignation. See further discussion of the separation and release agreement relating to Mr. Davis below. We believe that these retention bonuses are an appropriate mechanism to incentivize key executives to remain with us so that we may benefit from their experience in the industry and other competitive opportunities available to them.
Long-Term Incentive Compensation
We provide equity-based, long-term compensation for employees, directors and other representatives through our 2010 Long-Term Incentive Plan, or the 2010 LTIP. The 2010 LTIP is designed to promote a sense of proprietorship and personal involvement in our development and financial success among our employees and directors through awards of phantom units and distribution equivalent rights, or DERs. The 2010 LTIP also allows for providing flexible incentives to
83
employees and directors. Prior to vesting or termination of the applicable restricted period, our officers cannot transfer (including sell, pledge or hedge) any of their LTIP Awards.
All long-term objectives for payments to participants in the 2010 LTIP are based upon measurable performance targets. These targets are based on specific increases in the distributions paid to unitholders. As a result, we believe that the 2010 Long-Term Incentive Plan strongly aligns the interests of management with those of our unitholders.
Phantom units are notional units representing unfunded and unsecured promises to pay to the participant a specified amount of cash based on the market value of our common units should specified vesting requirements be met. DERs are tandem rights to receive on a quarterly basis an amount of cash equal to the amount of distributions that would have been paid on outstanding phantom units had they been limited partner units issued by us.
The G&C Committee administers the 2010 LTIP. Under the 2010 LTIP, the G&C Committee (at its discretion) has the authority to determine the terms and conditions of any awards granted under the 2010 LTIP and to adopt, alter and repeal rules, guidelines and practices relating to the 2010 LTIP. The G&C Committee has full discretion to administer and interpret the 2010 LTIP and to establish such rules and regulations as it deems appropriate and to determine, among other things, the time or times at which the awards may be exercised and whether and under what circumstances an award may be exercised. The G&C Committee designates participants in the 2010 LTIP, determines the types of awards to grant to participants and determines the number of units to be covered by any award. Our board of directors can terminate the 2010 LTIP at any time.
Targeted grant values for the NEOs are established based on the analysis of market practices of the peer group and consideration of the level of salary and targeted bonus for each NEO. For 2016, the G&C Committee established the following long-term incentive target grant values for each of our NEOs:
2016 | |||
Name | Long-Term Incentive Target Grant Value | ||
Grant E. Sims | $ | 1,800,000 | |
Robert V. Deere | $ | 1,050,000 | |
Paul A. Davis | $ | 600,000 | |
Stephen M. Smith | $ | 600,000 | |
Richard R. Alexander | $ | 750,000 | |
In April 2016, phantom units were granted to each of our NEOs and certain employees under the 2010 LTIP. The number of units granted was determined by dividing the closing market price of our common units on the date of grant by the long-term incentive target amount. The phantom units will be paid in cash upon vesting based on the average closing price of the common units for the 20 trading days immediately prior to the date of vesting. The phantom units granted to our NEOs in April 2016 were all performance-based awards. For the minimum, target and maximum number of units award to our NEO’s for 2016, please refer to the table below entitled “Grants of Plan-Based Awards for Fiscal Year 2016.
Performance-based awards granted will vest on the third anniversary of issuance, in an amount ranging from 50% to 150% of the targeted number of phantom units, if certain quarterly cash distribution targets are achieved in the fourth quarter of 2018. In order to align the interests of our NEOs with our common unitholders and incentivize our NEOs to meet targeted distribution annual growth rates ranging between approximately 5% and 9% (which are deemed achievable growth rates by the G&C Committee) as compared to our distribution rate of $0.6725 per unit attributable to the quarter ending March 31, 2016, these awards will vest as follows:
(i) if the quarterly cash distribution on the common units for the fourth quarter of 2018 is $0.74 per unit, 50% of the target number of phantom units granted will vest, and the remainder will be forfeited;
(ii) if the quarterly cash distribution on the common units is $0.79 per unit, 100% of the target number of phantom units granted will vest; or
(iii) if the quarterly cash distribution on the common units is $0.85 per unit or greater, 150% of the target number of phantom units granted will vest.
If the quarterly cash distribution on the common units falls between the above ranges of $0.74 per unit and $0.85 per unit, the phantom units will vest on a proportionately adjusted basis (for example, if the quarterly cash distribution on the common units is $0.77 per unit, 75% of the phantom units targeted will vest or if the quarterly cash distribution on the common units is $0.82 per unit, 125% of the phantom units targeted will vest). If the quarterly cash distribution is below $0.74 per unit for the fourth quarter of 2018, all of the performance-based phantom units granted will be forfeited.
84
The phantom units also include distribution equivalent rights, or DERs, which are granted in tandem with all phantom units. DERs on all performance-based awards to our NEOs are paid quarterly based on the number of units corresponding to the number of units in the initial grant.
Other Compensation and Benefits
We offer certain other benefits to our NEOs, including medical, dental, disability and life insurance, and contributions on their behalf to our 401(k) plan. NEOs participate in these plans on the same basis as all other employees. Other than the 401(k) plan, we do not sponsor a pension plan, and we do not provide post-retirement medical benefits to our employees.
No perquisites of any material nature are provided to our NEOs.
Tax and Accounting Implications
Because we are a partnership and not a corporation for federal income tax purposes, we are not subject to the limitations of Internal Revenue Code Section 162(m) with respect to tax-deductible executive compensation. However, if such tax laws related to executive compensation change in the future, the G&C Committee will consider the implication of such changes to us.
For our equity-based compensation arrangements, we record compensation expense over the vesting period of the awards, as discussed further in Note 15 of our Consolidated Financial Statements in Item 8.
Compensation Committee Report
The G&C Committee has reviewed and discussed with management the Compensation Discussion and Analysis included above. Based on that review and discussion, the G&C Committee recommended to our board of directors that this Compensation Discussion and Analysis be included in this Form 10-K.
The foregoing report is provided by the following directors, who constitute the G&C Committee:
Kenneth M. Jastrow II, Chairman
James E. Davison
James E. Davison, Jr.
Sharilyn S. Gasaway
Corbin J. Robertson III
Conrad P. Albert
Jack T. Taylor
The information contained in this report shall not be deemed to be soliciting material or filed with the SEC or subject to the liabilities of Section 18 of the Exchange Act, except to the extent that we specifically incorporate it by reference into a document filed under the Securities Act or the Exchange Act.
Compensation Risk Assessment
Our board of directors does not believe that our compensation policies and practices for employees are reasonably likely to have a material adverse effect on us. We compensate all employees with a combination of competitive base salary and incentive compensation. Our board of directors believes that the mix and design of the elements of employee compensation do not encourage employees to assume excessive or inappropriate risk taking.
Our board of directors concluded that the following risk oversight and compensation design features guard against excessive risk-taking:
• | the company has strong internal financial controls; |
• | base salaries are consistent with employees’ responsibilities so that they are not motivated to take excessive risks to achieve a reasonable level of financial security; |
• | the determination of incentive awards is based on a review of a variety of indicators of performance as well as a meaningful subjective assessment of personal performance, thus diversifying the risk associated with any single indicator of performance; |
• | goals are appropriately set to avoid targets that, if not achieved, result in a large percentage loss of compensation; |
• | incentive awards are capped by the G&C Committee; |
• | compensation decisions include discretionary authority to adjust annual awards and payments, which further reduces any business risk associated with our plans; and |
85
• | long-term incentive awards are designed to provide appropriate awards for dedication to a corporate strategy that delivers long-term returns to unitholders. |
Summary Compensation Table
The following Summary Compensation Table summarizes the total compensation paid or accrued to our NEOs in 2016, 2015 and 2014.
Name & Principal Position | Year | Salary ($) | Bonus ($) | Stock Awards ($) (1) | All Other Compensation ($) (3) | Total ($) | |||||||||||||||
Grant E. Sims | 2016 | $ | 600,000 | $ | — | $ | 1,744,069 | $ | 274,531 | $ | 2,618,600 | ||||||||||
Chief Executive Officer | 2015 | 576,923 | — | 1,755,771 | 190,851 | 2,523,545 | |||||||||||||||
(Principal Executive Officer) | 2014 | 525,000 | — | 401,163 | 182,187 | 1,108,350 | |||||||||||||||
Robert V. Deere | 2016 | 450,000 | — | 1,017,376 | 162,940 | 1,630,316 | |||||||||||||||
Chief Financial Officer | 2015 | 450,000 | — | 658,448 | 108,449 | 1,216,897 | |||||||||||||||
(Principal Financial Officer) | 2014 | 450,000 | — | 401,163 | 102,482 | 953,645 | |||||||||||||||
Paul A. Davis (2) | 2016 | 375,000 | — | 581,367 | 132,333 | 1,088,700 | |||||||||||||||
formerly Senior Vice President | 2015 | 375,000 | 243,750 | 585,287 | 101,761 | 1,305,798 | |||||||||||||||
2014 | 359,615 | 350,000 | 601,718 | 63,838 | 1,375,171 | ||||||||||||||||
Stephen M. Smith | 2016 | 325,000 | — | 581,367 | 117,999 | 1,024,366 | |||||||||||||||
Vice President | 2015 | 317,308 | 225,000 | 438,966 | 85,268 | 1,066,542 | |||||||||||||||
2014 | 292,308 | 150,000 | 401,163 | 65,071 | 908,542 | ||||||||||||||||
Richard R. Alexander | 2016 | 325,000 | — | 726,693 | 154,883 | 1,206,576 | |||||||||||||||
Vice President | 2015 | 317,308 | 300,000 | 585,287 | 112,299 | 1,314,894 | |||||||||||||||
2014 | 295,192 | 300,000 | 300,859 | 54,619 | 950,670 | ||||||||||||||||
(1) | The amounts shown in this column represent the aggregate grant date fair value for each NEO’s phantom units granted under our 2010 Long-Term Incentive Plan. The grant date fair value of each award was determined in accordance with accounting guidance for equity-based compensation and is based on the probable outcome of any underlying performance conditions. Assumptions used in the calculation of these amounts are included in Note 15 to our Consolidated Financial Statements in Item 8. |
(2) | Mr. Davis resigned his position effective January 6, 2017. See further discussion of the separation and release agreement relating to Mr. Davis below. |
(3) | The following table presents the components of "All Other Compensation" for each NEO for the year ended December 31, 2016. |
Name | 401(k) Matching and Profit Sharing Contributions (a) | Insurance Premiums (b) | Other Compensation (c) | Totals | |||||||||||
Grant E. Sims | $ | 13,250 | $ | 1,458 | $ | 259,823 | $ | 274,531 | |||||||
Robert V. Deere | $ | 26,500 | $ | 1,458 | $ | 134,982 | $ | 162,940 | |||||||
Paul A. Davis | $ | 20,667 | $ | 1,458 | $ | 110,208 | $ | 132,333 | |||||||
Stephen M. Smith | $ | 26,500 | $ | 1,458 | $ | 90,041 | $ | 117,999 | |||||||
Richard R. Alexander | $ | 29,150 | $ | 1,458 | $ | 124,275 | $ | 154,883 | |||||||
The amounts in this table represent:
(a) | Contributions by us to our 401(k) plan on each NEO’s behalf. |
(b) | Term life insurance premiums paid by us on each NEO’s behalf. |
(c) | This column includes cash distributions paid in connection with granted DERs. |
86
Grants of Plan-Based Awards in Fiscal Year 2016
The following table shows equity incentive plan awards granted to our NEOs in 2016.
Estimated Future Payouts Under | |||||||||||||||||||
Equity Incentive Plan Awards (1) | |||||||||||||||||||
Name | Grant Date | Threshold | Target | Maximum | Market Price of Common Units on Award Date (2) | Grant Date Fair Value of Stock and Option Awards (3) | |||||||||||||
Grant E. Sims | 4/12/2016 | 28,545 | 57,089 | 85,634 | $ | 31.53 | $ | 1,744,069 | |||||||||||
Robert V. Deere | 4/12/2016 | 16,651 | 33,302 | 49,953 | $ | 31.53 | $ | 1,017,376 | |||||||||||
Paul A. Davis (4) | 4/12/2016 | 9,515 | 19,030 | 28,545 | $ | 31.53 | $ | 581,367 | |||||||||||
Stephen M. Smith | 4/12/2016 | 9,515 | 19,030 | 28,545 | $ | 31.53 | $ | 581,367 | |||||||||||
Richard R. Alexander | 4/12/2016 | 11,894 | 23,787 | 35,681 | $ | 31.53 | $ | 726,693 | |||||||||||
(1) | Represents the number of phantom units that each NEO can earn of grant awarded on April 12, 2016, if the company meets certain performance conditions (threshold, target and maximum) during the fourth quarter of 2018. See additional discussion in "Long-Term Incentive Compensation" above. |
(2) | Represents the closing market price of our common units on the date of the phantom unit award on April 12, 2016. |
(3) | The amounts in this column for each NEO represent the fair value of the award on the date of the grant (as calculated in accordance with accounting guidance for equity-based compensation) using the twenty day average closing price of our common units through the date of grant ($30.55) multiplied by the target number of units awarded. |
(4) | Mr. Davis resigned his position effective January 6, 2017. See further discussion of the separation and release agreement related to Mr. Davis below. |
Employment Agreements
Paul A. Davis
Mr. Davis entered into a letter agreement in March 2012 relating to his employment and providing for a base salary, which was subject to discretionary upward adjustments. The annual base salary of Mr. Davis as of December 31, 2016 was $375,000. That agreement provided that Mr. Davis was eligible to participate in all other benefit programs (e.g. health, dental, disability, life and/or other insurance plans) for which executive officers are generally eligible and severance benefits as disclosed in "Potential Payments upon Termination or Change of Control" below. As indicated above, Mr. Davis resigned his position effective January 6, 2017. See further discussion of the separation and release agreement relating to Mr. Davis below.
Richard R. Alexander
Mr. Alexander entered into an employment agreement in July 2008 relating to his employment and providing for a base salary which is subject to discretionary upward adjustments. Currently, the annual base salary of Mr. Alexander is $325,000. That agreement provides that Mr. Alexander is eligible to participate in all other benefit programs (e.g. health, dental, disability, life and/or other insurance plans) for which executive officers are generally eligible and severance benefits as disclosed in "Potential Payments upon Termination or Change of Control" below.
87
Outstanding Equity Awards at December 31, 2016
The following table presents the information regarding the outstanding equity awards to our NEOs at December 31, 2016.
Stock Awards | |||||||
Name | Grant Date | Equity Incentive Plan Awards: Number of Unearned Phantom Units That Have Not Vested (#) (1) | Equity Incentive Plan Awards: Market Value of Unearned Phantom Units That Have Not Vested ($) (2) | ||||
Grant E. Sims | 4/12/2016 | 85,634 | $ | 2,957,798 | |||
4/14/2015 | 57,705 | $ | 1,993,131 | ||||
4/8/2014 | 11,111 | $ | 383,774 | ||||
Robert V. Deere | 4/12/2016 | 49,953 | $ | 1,725,377 | |||
4/14/2015 | 21,641 | $ | 747,480 | ||||
4/8/2014 | 11,111 | $ | 383,774 | ||||
Paul A. Davis (4) | 4/12/2016 | 15,000 | $ | 518,100 | |||
4/14/2015 | 15,000 | $ | 518,100 | ||||
4/8/2014 | 16,665 | $ | 575,609 | ||||
Stephen M. Smith | 4/12/2016 | 28,545 | $ | 985,944 | |||
4/14/2015 | 14,427 | $ | 498,309 | ||||
4/8/2014 | 11,111 | $ | 383,774 | ||||
Richard R. Alexander (3) | 4/12/2016 | 35,681 | $ | 1,232,422 | |||
4/14/2015 | 19,236 | $ | 664,411 | ||||
4/8/2014 | 7,222 | $ | 249,448 | ||||
(1) | The number of performance units reflected in the table assumes a maximum performance payout based upon past achievement levels from the previous vesting period. Service based units held by Mr. Alexander do not specify threshold, target and maximum payouts levels. For additional information regarding Mr. Alexander's units, please see note 3 below. |
(2) | The amounts in this column were calculated by multiplying the closing market price of our units using the twenty day average at year-end by the number of applicable units outstanding. |
(3) | Phantom units outstanding for Mr. Alexander include 2,222 service based units for 2014. The remainder of the outstanding units held by Mr. Alexander and represented above are performance based units. |
(4) | Mr. Davis resigned his position effective January 6, 2017. The amounts above give effect to the terms of Mr. Davis' separation and release agreement, which is discussed in more detail below. |
88
Phantom Units Vested
The following table presents the information regarding the vesting of phantom units during the year ended December 31, 2016 with respect to our NEOs.
Phantom Unit Awards | |||||||
Name | Number of Phantom Units Vested (#) | Value Realized on Vesting ($) | |||||
Grant E. Sims | 39,861 | $ | 1,205,775 | ||||
Robert V. Deere | 15,945 | $ | 482,328 | ||||
Stephen M. Smith | 10,365 | $ | 313,536 | ||||
Richard R. Alexander | 6,910 | $ | 209,009 | ||||
Paul A. Davis (1) | 13,553 | $ | 409,956 | ||||
(1) | Mr. Davis resigned his position effective January 6, 2017. The amounts give effect to the terms of Mr. Davis' separation and release agreement, which is discussed in more detail below. |
The phantom unit awards granted to our NEOs in 2013 vested on April 9, 2016 and, pursuant to our 2010 Long Term Incentive Plan, the value realized upon vesting was computed by multiplying the average closing price of our common units for the 20 trading days immediately prior to the date of vesting by the number of units that vested. We achieved the maximum target for 2013 of a quarterly distribution to common unitholders of $0.63 per unit; therefore the number of phantom units vested in the table above represents 150% of the initial award. Those phantom unit awards were paid in cash.
Termination or Change of Control Benefits
We consider maintaining a stable and effective management team to be essential to protecting and enhancing the best interests of us and our unitholders. To that end, we recognize that the possibility of a change of control or other acquisition event may raise uncertainty and questions among management, and such uncertainty could adversely affect our ability to retain our key employees, which would be to our unitholders’ detriment. Because our management team was built over time, as described above, and our NEOs became NEOs under different circumstances, the compensation and benefits awarded to our individual NEOs in the event of termination or a change of control varies. The employment agreement for Mr. Alexander provides certain compensation and benefits as an incentive to remain in our employ, enhancing our ability to call on and rely upon him in the event of a change of control. Mr. Alexander would not be entitled to severance benefits if terminated for cause. In extending these benefits, we considered a number of factors, including the prevalence of similar benefits adopted by other publicly traded MLPs. See “Potential Payments Upon Termination or Change of Control” below for further discussion of these benefits, including the definitions of certain terms such as change of control and cause.
We believe that the interests of unitholders will best be served if the interests of our management and unitholders are aligned. We believe the termination and change of control benefits described above strike an appropriate balance between the potential compensation payable and the objectives described above.
Potential Payments upon Termination or Change of Control
Mr. Alexander is entitled under his employment agreement to specified severance benefits under certain circumstances as discussed above.
Under a change of control and certain termination circumstances, each of our NEOs also will vest in any outstanding awards under our 2010 LTIP. Under the 2010 LTIP, a change of control occurs upon, in general, any sale of substantially all of the assets of us or our general partner or a merger, conversion, consolidation of us or our general partner or any other transaction resulting in a change in the beneficial ownership of more than 50% of the voting equity interests in our general partner.
If Mr. Alexander terminates his employment for good reason or we terminate his employment without cause, he would be entitled to (i) company payment of his COBRA health benefits for 12 months and (ii) monthly payments of his annual base salary due for the remainder of the renewal term of his employment agreement.
As used in Mr. Alexander’s employment agreement, the terms “cause”, “change of control”, “good reason” and "renewal term" are generally described below:
• | “Cause” means, in general, if the executive commits theft, embezzlement, forgery, any other act of dishonesty relating the executive’s employment or violates our policies or any law, rule, or regulation applicable to us, is convicted of a felony or lesser crime having as its predicate element fraud, dishonesty, or misappropriation, fails |
89
to perform his duties under the employment agreement or commits an act or intentionally fails to act, which act or failure to act amounts to gross negligence or willful misconduct.
• | “Good Reason” means, in general, following a change of control which results in a substantial diminution of the executive’s duties, compensation, or benefits; executive’s removal from position as Vice President (other than for cause, death or disability, or being offered an equivalent position); or our failure to make any payment to the executive required under the terms of his employment agreement. |
• | “Change of control” means, in general, any sale of equity in us or our general partner or sale of substantially all of our assets; any merger, conversion or consolidation of us or our general partner; or any other event that, in each of the foregoing cases, results in any persons or entities having the ability to elect a majority of the members of our board of directors (other than one or more of our executive officers or affiliates). |
• | “Renewal term” means, in general, each one-year term of employment beginning on July 18 of each year, absent either the Company or the executive giving the other party at least 90 days advance written notice of its intent not to renew the employment agreement between them. |
Based upon a hypothetical termination date of December 31, 2016, the termination benefits for Messrs. Sims, Deere, Smith and Alexander for voluntary termination or termination for cause would be zero.
Based upon a hypothetical termination date of December 31, 2016, the termination benefits for Mr. Alexander for termination without cause (other than as a result of death or disability) or for good reason would have been:
Richard R. Alexander | |||
Severance pursuant to employment agreement | $ | 325,000 | |
Healthcare | 24,039 | ||
Total | $ | 349,039 | |
If termination occurs due to death or disability, Messrs. Sims, Deere, Smith, and Alexander would vest in outstanding phantom unit awards under our 2010 LTIP. Utilizing the closing price of our common units for the twenty trading days prior to December 31, 2016 would result in payments under the 2010 LTIP of the following amounts upon death or disability:
Grant E. Sims | $ | 3,581,314 | |
Robert V. Deere | $ | 1,904,397 | |
Stephen A. Smith | $ | 1,245,340 | |
Richard R. Alexander | $ | 1,456,414 | |
Based on a hypothetical simultaneous change of control and termination date of December 31, 2016, the change of control termination benefits for Messrs. Sims, Deere, Smith, and Alexander would have been as follows:
Grant E. Sims | Robert V. Deere | Stephen M. Smith | Richard R. Alexander | ||||||||||||
Severance pursuant to employment agreement | $ | — | $ | — | $ | — | $ | 325,000 | |||||||
Healthcare | — | — | — | 24,039 | |||||||||||
Cash payment for vested phantom units under 2010 LTIP | 3,581,314 | 1,904,397 | 1,245,340 | 1,456,414 | |||||||||||
Total | $ | 3,581,314 | $ | 1,904,397 | $ | 1,245,340 | $ | 1,805,453 | |||||||
Director Compensation in Fiscal Year 2016
The table below reflects compensation for our non-employee directors. Mr. Sims does not receive any compensation attributable to his status as a director.
90
Name | Fees Earned or Paid in Cash ($) (1) | Stock Awards ($) (2) (3) | All Other Compensation ($) (4) | Total | |||||||||||
James E. Davison | $ | 80,000 | $ | 100,000 | $ | 17,822 | $ | 197,822 | |||||||
James E. Davison, Jr. | $ | 80,000 | $ | 100,000 | $ | 17,822 | $ | 197,822 | |||||||
Sharilyn S. Gasaway | $ | 102,500 | $ | 112,500 | $ | 20,075 | $ | 235,075 | |||||||
Kenneth M. Jastrow II | $ | 92,500 | $ | 112,500 | $ | 20,049 | $ | 225,049 | |||||||
Corbin J. Robertson III | $ | 80,000 | $ | 100,000 | $ | 17,830 | $ | 197,830 | |||||||
Conrad P. Albert | $ | 92,500 | $ | 102,500 | $ | 17,978 | $ | 212,978 | |||||||
Jack T. Taylor | $ | 92,500 | $ | 102,500 | $ | 17,978 | $ | 212,978 | |||||||
(1) | Amounts include annual retainer fees and fees for attending meetings. |
(2) | Amounts in this column represent the fair value of the awards of phantom units under our 2010 LTIP on the date of grant, as calculated in accordance with accounting guidance for equity-based compensation. |
(3) | Outstanding awards to directors at December 31, 2016 consist of phantom units granted under our 2010 LTIP and stock appreciation rights pursuant to our Stock Appreciation Rights Plan. Messrs. James Davison and James Davison, Jr. each hold 6,906 outstanding phantom units and 1,000 stock appreciation rights. Messrs. Jastrow, Robertson, Albert, Taylor and Ms. Gasaway hold 7,775, 6,906, 7,079, 7,079 and 7,775 outstanding phantom units, respectively. |
(4) | Amounts in this column represent the amounts paid for tandem DERs related to outstanding phantom units granted under our 2010 LTIP. |
Directors who are not officers of our general partner are entitled to a base compensation of $180,000 per year, with $80,000 paid in cash and $100,000 paid in phantom units. Cash is paid, and phantom units are awarded, on the first day of each calendar quarter. The number of phantom units awarded is determined by dividing the closing market price of our units on the date of the award into the amount to be paid in phantom units. So long as he or she is a director on the relevant date of determination, each director will receive: (i) a quarterly distribution equal to the number of phantom units held by such director multiplied by the quarterly distribution amount we will pay in respect of each of our outstanding common units on such distribution date, and (ii) on the third anniversary of each award date for such director, an amount equal to the number of phantom units granted to such director on such award date multiplied by the average closing price of our common units for the 20 trading days ending on the day immediately preceding such anniversary date.
The lead director and chairpersons of the audit committee and G&C Committee receive an additional amount of base compensation split equally between cash and phantom units, which cash compensation is paid in equal quarterly installments. Such additional amount is $10,000 for the lead director, $25,000 for the chair of the audit committee and $15,000 for the chair of the G&C Committee.
In addition, each non-employee director receives additional cash compensation for each “Additional Meeting” (board and/or committee) in which he or she participates. Participation by a director in-person will entitle her/him to additional compensation of $2,500 per meeting, and participation by a director by means of telecommunication will entitle her/him to additional compensation of $2,000 per meeting. Such payments are made in conjunction with the quarterly payments of base compensation. Additional Meetings consist of (i) with respect to our board of directors any meetings (in-person or by telecommunication) other than (x) the four pre-set meetings of our board of directors for each calendar year and (y) brief follow-up telecommunication conferences relating to the Annual Report on Form 10-K or any Quarterly Report on Form 10-Q the company files with the SEC, and (ii) any committee meeting.
Compensation Changes Subsequent to December 31, 2016
Mr. Davis, our Senior Vice President, Business Development, Onshore Pipelines and Engineering, resigned his position effective January 6, 2017 to pursue other opportunities. There were no disagreements between Mr. Davis and our management or board of directors that influenced his decision to resign. Mr. Davis and our general partner have entered into a Separation and Release Agreement (the “Release Agreement”) relating to his resignation. Among other things, the Release Agreement provides that Mr. Davis will (a) receive severance payments totaling $375,000, payable in twelve monthly installments, (b) receive payment in accordance with its terms (as if he remained an employee) for 100% of his long-term incentive award granted in 2014 based on the 150% performance threshold, (c) remain eligible for vesting and payment in accordance with their terms (as if he remained an employee) for approximately 63% of the total phantom units and tandem distribution equivalent rights awards granted in 2015 and 2016 based on the performance thresholds provided in such awards, and (d) receive monthly payments equal to the monthly premium amounts he would have to pay under COBRA to continue to participate in our benefits plan through July 31, 2018, regardless of whether he elects to participate in our benefits plan.
91
Item 12. Security Ownership of Certain Beneficial Owners and Management and Related Unitholder Matters
Beneficial Ownership of Partnership Units
The following table sets forth certain information as of February 27, 2017, regarding the beneficial ownership of our units by beneficial owners of 5% or more by class of unit and by directors and the executive officers of our general partner and by all directors and executive officers as a group. This information is based on data furnished by the persons named.
Class A Common Units | Class B Common Units | |||||||||||
Name and Address of Beneficial Owner | Amount and Nature of Beneficial Ownership | (1) | Percent of Class | Amount and Nature of Beneficial Ownership | Percent of Class | |||||||
Conrad P. Albert | 5,000 | * | — | — | ||||||||
James E. Davison | 3,376,282 | (2) | 2.9 | % | 9,453 | 23.6 | % | |||||
James E. Davison, Jr. | 5,323,932 | (3) | 4.5 | % | 13,648 | 34.1 | % | |||||
Sharilyn S. Gasaway | 269,445 | * | 1,081 | 2.7 | % | |||||||
Kenneth M. Jastrow II | — | — | — | — | ||||||||
Corbin J. Robertson III | 1,814,567 | (4) | 1.5 | % | — | — | ||||||
Jack T. Taylor | 12,865 | * | — | — | ||||||||
Grant E. Sims | 2,955,737 | (5) | 2.5 | % | 7,087 | 17.7 | % | |||||
Robert V. Deere | 750,987 | * | 1,052 | 2.6 | % | |||||||
Stephen M. Smith | 416,144 | (6) | * | — | — | |||||||
Richard R. Alexander | 10,000 | (7) | * | — | — | |||||||
Karen N. Pape | 152,131 | * | ||||||||||
Kristen O. Jesulaitis | — | * | ||||||||||
Ryan S. Sims | — | * | ||||||||||
William S. Goloway | 2,400 | * | — | — | ||||||||
Garland G. Gaspard | 700 | * | — | — | ||||||||
Chad A. Landry | 10,000 | * | — | — | ||||||||
All directors and executive officers as a group (17 in total) | 15,100,190 | 12.8 | % | 32,321 | 80.8 | % | ||||||
Steven K. Davison | 2,061,839 | (8) | 1.7 | % | 7,676 | 19.2 | % | |||||
Chickasaw Capital Management, LLC | 7,092,444 | 6.0 | % | |||||||||
Tortoise Capital Advisors, L.L.C | 9,593,720 | 8.1 | % | — | ||||||||
OppenheimerFunds, Inc. | 10,279,709 | 8.7 | % | — | — | |||||||
Alerian MLP ETF | 6,950,045 | 5.9 | % | — | — | |||||||
Clearbridge Investments, LLC | 8,815,467 | 7.5 | % | |||||||||
* | Less than 1% |
(1) | The Class B Common Units, which also are included in the Class A Common Unit total, are identical in most respects to the Class A Common Units and have voting and distribution rights equivalent to those of the Class A Common Units. In addition, the Class B Common Units have the right to elect all of our board of directors and are convertible into Class A Common Units under certain circumstances, subject to certain exceptions. |
(2) | Mr. Davison pledged 1,049,406 of these Class A Common Units as collateral for a loan from a bank. In addition to his direct ownership interests, Mr. Davison is the sole stockholder of Terminal Services, Inc., which owns 1,010,835 Class A Common Units. |
(3) | Mr. Davison, Jr. pledged 1,164,370 of these Class A Common Units as collateral for a loan from a bank. 1,339,383 of these Class A Common Units are held by trusts for Mr. Davison's children. 187,856 of these Class A Common Units are held by the James E. and Margaret A. B. Davison Special Trust. |
(4) | Mr. Robertson pledged 1,012,555 of these Class A Common Units as collateral for margin accounts. Includes 198,785 Class A Common Units held by The Corbin J. Robertson III 2009 Family Trust and 5,743 Class A Common Units held by Corby & Brooke Robertson 2006 Family Trust. Also included are 20,000 Class A Common Units held by BHJ Investments, LP, whose members include Mr. Robertson, the Corby and Brooke Robertson 2014 Children's Trust, and Brooke Robertson as Mr. Robertson's wife. |
(5) | Mr. Sims pledged 1,450,000 of these Class A Common Units as collateral for loans from a bank. |
(6) | Mr. Smith pledged 350,000 Class A Common Units as collateral for margin brokerage accounts. |
92
(7) | Mr. Alexander pledged these 10,000 Class A Common Units as collateral for margin brokerage accounts. |
(8) | Includes 147,941 Class A Common units held by the Steven Davison Family Trust. |
Except as noted, each unitholder in the above table is believed to have sole voting and investment power with respect to the units beneficially held, subject to applicable community property laws.
The mailing address for Genesis Energy, LLC and all officers and directors is 919 Milam, Suite 2100, Houston, Texas, 77002.
Beneficial Ownership of General Partner Interest
Genesis Energy, LLC owns a non-economic general partner interest in us. Genesis Energy, LLC is our wholly-owned subsidiary.
Item 13. Certain Relationships and Related Transactions, and Director Independence
Transactions with Related Persons
Our CEO, Mr. Sims owns an aircraft, which is used by us for business purposes in the course of operations. We pay Mr. Sims a fixed monthly fee and reimburse the aircraft management company for costs related to our usage of the aircraft, including fuel and the actual out-of-pocket costs. In connection with this arrangement, we made payments to Mr. Sims totaling $0.7 million, during 2016. Based on current market rates for chartering of private aircraft under long-term, priority arrangements with industry recognized chartering companies, we believe that the terms of this arrangement are no worse than what we could have expected to obtain in an arms-length transaction.
Family members of certain of our executive officers and directors may work for us from time to time. In 2016, Mr. Sims (our CEO and a director) had two sons that worked - one as a vice president and the other as a manager in our supply and logistics department. Mr. James Davison, Sr. (a director) had one son (who is also a brother of James E. Davison, Jr., a director), that worked as a director in our supply and logistics department in 2016. In the aggregate, these family members received total W-2 compensation of less than $1,000,000.
Director Independence
Because we are a limited partnership, the listing standards of the NYSE do not require that we have a majority of independent directors (although at least a majority of the members of our board of directors is independent,as defined by the NYSE rules) or that we have either a nominating committee or a compensation committee of our board of directors. We are, however, required to have an audit committee consisting of at least three members, all of whom are required to be “independent” as defined by the NYSE.
Under NYSE rules, to be considered independent, our board of directors must determine that a director has no material relationship with us other than as a director. The rules specify the criteria by which the independence of directors will be determined, including guidelines for directors and their immediate family members with respect to employment or affiliation with us or with our independent public accountants. Our board of directors has determined that each of Ms. Gasaway and Messrs. Robertson, Jastrow, Albert and Taylor is an independent director under the NYSE rules. See Item 10. “Directors, Executive Officers and Corporate Governance” for additional discussion relating to our directors and director independence.
Item 14. Principal Accounting Fees and Services
The following table summarizes the fees for professional services rendered by Deloitte & Touche LLP for the years ended December 31, 2016 and 2015.
2016 | 2015 | ||||||
(in thousands) | |||||||
Audit Fees (1) | $ | 2,441 | $ | 3,496 | |||
Tax Fees (2) | 1,432 | 739 | |||||
All Other Fees (3) | 8 | 8 | |||||
Total | $ | 3,881 | $ | 4,243 | |||
(1) | Includes fees for the annual audit and quarterly reviews (including internal control evaluation and reporting), SEC registration statements and accounting and financial reporting consultations and research work regarding Generally Accepted Accounting Principles. |
(2) | Includes fees for tax return preparation and tax consultations. |
93
(3) | Includes fees associated with licenses for accounting research software. |
Pre-Approval Policy
The services by Deloitte in 2016 and 2015 were pre-approved in accordance with the pre-approval policy and procedures adopted by the audit committee. This policy describes the permitted audit, audit-related, tax and other services, which we refer to collectively as the Disclosure Categories that the independent auditor may perform. The policy requires that each fiscal year, a description of the services, or the Service List expected to be performed by the independent auditor in each of the Disclosure Categories in the following fiscal year be presented to the audit committee for approval.
Any requests for audit, audit-related, tax and other services not contemplated on the Service List must be submitted to the audit committee for specific pre-approval and cannot commence until such approval has been granted. Normally, pre-approval is provided at regularly scheduled meetings.
In considering the nature of the non-audit services provided by Deloitte in 2016 and 2015, the audit committee determined that such services are compatible with the provision of independent audit services. The audit committee discussed these services with Deloitte and management of our general partner to determine that they are permitted under the rules and regulations concerning auditor independence promulgated by the SEC to implement the Sarbanes-Oxley Act of 2002, as well as the American Institute of Certified Public Accountants.
94
Item 15. Exhibits and Financial Statement Schedules
(a)(1) Financial Statements
See “Index to Consolidated Financial Statements and Financial Statement Schedules”.
(a)(2) Financial Statement Schedules.
See “Index to Consolidated Financial Statements and Financial Statement Schedules”.
(a)(3) Exhibits
2.1 | Purchase and Sale Agreement, dated July 16, 2015, by and between Genesis Energy L.P. and Enterprise Products Operating, LLC (incorporated by reference to Exhibit 2.1 to the Company’s Current Report on Form 8-K/A dated July 16 2015, File No. 001-12295). | ||
3.1 | Certificate of Limited Partnership of Genesis Energy, L.P. (incorporated by reference to Exhibit 3.1 to Amendment No. 2 of the Registration Statement on Form S-1, File No. 333-11545). | ||
3.2 | Amendment to the Certificate of Limited Partnership of Genesis Energy, L.P. (incorporated by reference to Exhibit 3.2 to the Quarterly Report on Form 10-Q for the quarterly period ended June 30, 2011, File No. 001-12295). | ||
3.3 | Fifth Amended and Restated Agreement of Limited Partnership of Genesis Energy, L.P. (incorporated by reference to Exhibit 3.1 to the Company’s Current Report on Form 8-K dated January 3, 2011, File No. 001-12295). | ||
3.4 | Certificate of Conversion of Genesis Energy, Inc., a Delaware corporation, into Genesis Energy, LLC, a Delaware limited liability company (incorporated by reference to Exhibit 3.1 to Form 8-K dated January 7, 2009, File No. 001-12295). | ||
3.5 | Certificate of Formation of Genesis Energy, LLC (formerly Genesis Energy, Inc.) (incorporated by reference to Exhibit 3.2 to Form 8-K dated January 7, 2009, File No. 001-12295). | ||
3.6 | Second Amended and Restated Limited Liability Company Agreement of Genesis Energy, LLC dated December 28, 2010 (incorporated by reference to Exhibit 3.2 to Form 8-K dated January 3, 2011, File No. 001-12295). | ||
3.7 | Certificate of Incorporation of Genesis Energy Finance Corporation, dated as of November 26, 2006 (incorporated by reference to Exhibit 3.7 to Registration Statement on Form S-4 filed on September 26, 2011, File No. 333-177012). | ||
3.8 | Bylaws of Genesis Energy Finance Corporation (incorporated by reference to Exhibit 3.8 to Registration Statement on Form S-4 filed on September 26, 2011, File No. 333-177012). | ||
4.1 | Form of Unit Certificate of Genesis Energy, L.P. (incorporated by reference to Exhibit 4.1 to the Company’s Annual Report on Form 10-K for the year ended December 31, 2007, File No. 001-12295). | ||
4.2 | Form of Common Unit Certificate of Genesis Energy, L.P. (incorporated by reference to Exhibit 4.1 to Form 10-K filed on March 17, 2008, File No. 001-12295). | ||
4.3 | Davison Unitholder Rights Agreement dated July 25, 2007 (incorporated by reference to Exhibit 10.4 to the Company's Current Report on Form 8-K dated July 31, 2007, File No. 001-12295). | ||
4.4 | Amendment No. 1 to the Davison Unitholder Rights Agreement dated October 15, 2007 (incorporated by reference to Exhibit 10.2 to the Company's Current Report on Form 8-K dated October 19, 2007, File No. 001-12295). | ||
4.5 | Amendment No. 2 to the Davison Unitholder Rights Agreement dated December 28, 2010 (incorporated by reference to Exhibit 10.3 to the Company's Current Report on Form 8-K dated January 3, 2011, File No. 001-12295). | ||
4.6 | Davison Registration Rights Agreement dated July 25, 2007 (incorporated by reference to Exhibit 10.3 to the Company's Current Report on Form 8-K dated July 31, 2007, File No. 001-12295). | ||
4.7 | Amendment No. 1 to the Davison Registration Rights Agreement, dated October 15, 2007 (incorporated by reference to Exhibit 10.1 to the Company's Current Report on Form 8-K dated October 19, 2007, File No. 001-12295). | ||
4.8 | Amendment No. 2 to the Davison Registration Rights Agreement, dated December 6, 2007 (incorporated by reference to Exhibit 10.1 to the Company's Current Report on Form 8-K dated December 11, 2007, File No. 001-12295). | ||
4.9 | Amendment No. 3 to the Davison Registration Rights Agreement, dated as of December 28, 2010 (incorporated by reference to Exhibit 10.2 to the Company's Current Report on Form 8-K dated January 3, 2011, File No. 001-12295). | ||
95
4.10 | Registration Rights Agreement, dated as of December 28, 2010, by and among Genesis Energy, L.P. and the former unitholders of Genesis Energy, LLC (incorporated by reference to Exhibit 10.1 to the Company's Current Report on Form 8-k dated January 3, 2011, File No. 001-12295). | ||
4.11 | Indenture for 7.875% Senior Subordinated Notes due 2018, dated November 18, 2010 among Genesis Energy, L.P., Genesis Energy Finance Corporation, certain subsidiary guarantors named therein and U.S. Bank National Association, as trustee (incorporated by reference to Exhibit 4.1 to the Company’s Current Report on Form 8-K dated November 23, 2010, File No. 001-12295). | ||
4.12 | Supplemental Indenture for 7.875% Senior Subordinated Notes due 2018, dated as of November 24, 2010, by and among Genesis Energy, L.P., Genesis Energy Finance Corporation, the Guarantors named therein and U.S. Bank National Association, as trustee (incorporated by reference to Exhibit 4.2 to the Company’s Registration Statement on Form S-4 dated September 26, 2011, File No. 333-177012). | ||
4.13 | Second Supplemental Indenture for 7.875% Senior Subordinated Notes due 2018, dated as of December 27, 2010, by and among Genesis Energy, L.P., Genesis Energy Finance Corporation, the Guarantors named therein and U.S. Bank National Association, as trustee (incorporated by reference to Exhibit 4.3 to the Company’s Registration Statement on Form S-4 dated September 26, 2011, File No. 333-177012). | ||
4.14 | Third Supplemental Indenture for 7.875% Senior Subordinated Notes due 2018, dated as of February 28, 2011, by and among Genesis Energy, L.P., Genesis Energy Finance Corporation, the Guarantors named therein and U.S. Bank National Association, as trustee (incorporated by reference to Exhibit 4.4 to the Company’s Registration Statement on Form S-4 dated September 26, 2011, File No. 333-177012). | ||
4.15 | Fourth Supplemental Indenture for 7.875% Senior Subordinated Notes due 2018, dated as of June 30, 2011, by and among Genesis Energy, L.P., Genesis Energy Finance Corporation, the Guarantors named therein and U.S. Bank National Association, as trustee (incorporated by reference to Exhibit 4.5 to the Company’s Registration Statement on Form S-4 dated September 26, 2011, File No. 333-177012). | ||
4.16 | Fifth Supplemental Indenture for 7.875% Senior Subordinated Notes due 2018, dated as of September 13, 2011, by and among Genesis Energy, L.P., Genesis Energy Finance Corporation, the Guarantors named therein and U.S. Bank National Association, as trustee (incorporated by reference to Exhibit 4.6 to the Company’s Registration Statement on Form S-4 dated September 26, 2011, File No. 333-177012). | ||
4.17 | Sixth Supplemental Indenture for 7.875% Senior Subordinated Notes due 2018, dated as of September 22, 2011, by and among Genesis Energy, L.P., Genesis Energy Finance Corporation, the Guarantors named therein and U.S. Bank National Association, as trustee (incorporated by reference to Exhibit 4.7 to the Company’s Registration Statement on Form S-4 dated September 26, 2011, File No. 333-177012). | ||
4.18 | Seventh Supplemental Indenture for 7.875% Senior Subordinated Notes due 2018, dated as of December 5, 2011, by and among Genesis Energy, L.P., Genesis Energy Finance Corporation, the Guarantors named therein and U.S. Bank National Association, as trustee (incorporated by reference to Exhibit 4.9 to Form 10-K filed on February 29, 2012, File No. 001-12295). | ||
4.19 | Eighth Supplemental Indenture for 7.875% Senior Subordinated Notes due 2018, dated as of January 3, 2012, by and among Genesis Energy, L.P., Genesis Energy Finance Corporation, the Guarantors named therein and U.S. Bank National Association, as trustee (incorporated by reference to Exhibit 4.10 to Form 10-K filed on February 29, 2012, File No. 001-12295). | ||
4.20 | Ninth Supplemental Indenture for 7.875% Senior Subordinated Notes due 2018, dated as of January 27, 2012, by and among Genesis Energy, L.P., Genesis Energy Finance Corporation, the Guarantors named therein and U.S. Bank National Association, as trustee (incorporated by reference to Exhibit 4.11 to Form 10-K filed on February 29, 2012, File No. 001-12295). | ||
4.21 | Tenth Supplemental Indenture for 7.875% Senior Subordinated Notes due 2018, dated as of December 6, 2012, by and among Genesis Energy, L.P., Genesis Energy Finance Corporation, the Guarantors named therein and U.S. Bank National Association, as trustee (incorporated by reference to Exhibit 4.12 to Form 10-K filed on February 26, 2013, File No. 001-12295). | ||
4.22 | Eleventh Supplemental Indenture for 7.875% Senior Subordinated Notes due 2018, dated as of January 28, 2013, by and among Genesis Energy, L.P., Genesis Energy Finance Corporation, the Guarantors named therein and U.S. Bank National Association, as trustee (incorporated by reference to Exhibit 4.13 to Form 10-K filed on February 26, 2013, File No. 001-12295). | ||
4.23 | Twelfth Supplemental Indenture for 7.875% Senior Subordinated Notes due 2018, dated as of February 19, 2014, by and among Genesis Energy, L.P., Genesis Energy Finance Corporation, the Guarantors named therein and U.S. Bank National Association, as trustee (incorporated by reference to Exhibit 4.14 to Form 10-K filed on February 27, 2014, File No. 001-12295). | ||
4.24 | Thirteenth Supplemental Indenture for 7.875% Senior Subordinated Notes due 2018, dated as of May 7, 2014, by and among Genesis Energy, L.P., Genesis Energy Finance Corporation, the Guarantors named therein and U.S. Bank National Association, as trustee (incorporated by reference to Exhibit 4.19 to Form 10-K filed on February 27, 2015, File No. 001-12295). | ||
96
4.25 | Fourteenth Supplemental Indenture for 7.875% Senior Subordinated Notes due 2018, dated as of October 15, 2014, by and among Genesis Energy, L.P., Genesis Energy Finance Corporation, the Guarantors named therein and U.S. Bank National Association, as trustee (incorporated by reference to Exhibit 4.20 to Form 10-K filed on February 27, 2015, File No. 001-12295). | ||
4.26 | Fifteenth Supplemental Indenture for 7.875% Senior Subordinated Notes due 2018, dated as of December 17, 2014, by and among Genesis Energy, L.P., Genesis Energy Finance Corporation, the Guarantors named therein and U.S. Bank National Association, as trustee (incorporated by reference to Exhibit 4.21 to Form 10-K filed on February 27, 2015, File No. 001-12295). | ||
4.27 | Sixteenth Supplemental Indenture for 7.875% Senior Subordinated Notes due 2018, dated as of January 22, 2015, by and among Genesis Energy, L.P., Genesis Energy Finance Corporation, the Guarantors named therein and U.S. Bank National Association, as trustee (incorporated by reference to Exhibit 4.22 to Form 10-K filed on February 27, 2015, File No. 001-12295). | ||
4.28 | Seventeenth Supplemental Indenture for 7.875% Senior Subordinated Notes due 2018, dated as of February 19, 2015, by and among Genesis Energy, L.P., Genesis Energy Finance Corporation, the Guarantors named therein and U.S. Bank National Association, as trustee (incorporated by reference to Exhibit 4.23 to Form 10-K filed on February 27, 2015, File No. 001-12295). | ||
4.29 | Eighteenth Supplemental Indenture for 7.875% Senior Subordinated Notes due 2018, dated as of February 19, 2015, by and among Genesis Energy, L.P., Genesis Energy Finance Corporation, the Guarantors named therein and U.S. Bank National Association, as trustee (incorporated by reference to Exhibit 4.24 to Form 10-K filed on February 27, 2015, File No. 001-12295). | ||
4.30 | Indenture for 5.75% Senior Subordinated Notes due 2021, dated February 8, 2013 among Genesis Energy, L.P., Genesis Energy Finance Corporation, certain subsidiary guarantors named therein and U.S. Bank National Association, as trustee (incorporated by reference to Exhibit 4.1 to the Company's Current Report on Form 8-K dated February 11, 2013, File No. 001-12295). | ||
4.31 | First Supplemental Indenture for 5.75% Senior Subordinated Notes due 2021, dated as of February 19, 2014, by and among Genesis Energy, L.P., Genesis Energy Finance Corporation, the Guarantors named therein and U.S. Bank National Association, as trustee (incorporated by reference to Exhibit 4.14 to Form 10-K filed on February 27, 2014, File No. 001-12295). | ||
4.32 | Second Supplemental Indenture for 5.75% Senior Subordinated Notes due 2021, dated as of May 7, 2014, by and among Genesis Energy, L.P., Genesis Energy Finance Corporation, the Guarantors named therein and U.S. Bank National Association, as trustee (incorporated by reference to Exhibit 4.27 to Form 10-K filed on February 27, 2015, File No. 001-12295). | ||
4.33 | Third Supplemental Indenture for 5.75% Senior Subordinated Notes due 2021, dated as of October 15, 2014, by and among Genesis Energy, L.P., Genesis Energy Finance Corporation, the Guarantors named therein and U.S. Bank National Association, as trustee (incorporated by reference to Exhibit 4.28 to Form 10-K filed on February 27, 2015, File No. 001-12295). | ||
4.34 | Fourth Supplemental Indenture for 5.75% Senior Subordinated Notes due 2021, dated as of December 17, 2014, by and among Genesis Energy, L.P., Genesis Energy Finance Corporation, the Guarantors named therein and U.S. Bank National Association, as trustee (incorporated by reference to Exhibit 4.29 to Form 10-K filed on February 27, 2015, File No. 001-12295). | ||
4.35 | Fifth Supplemental Indenture for 5.75% Senior Subordinated Notes due 2021, dated as of January 22, 2015, by and among Genesis Energy, L.P., Genesis Energy Finance Corporation, the Guarantors named therein and U.S. Bank National Association, as trustee (incorporated by reference to Exhibit 4.30 to Form 10-K filed on February 27, 2015, File No. 001-12295). | ||
4.36 | Sixth Supplemental Indenture for 5.75% Senior Subordinated Notes due 2021, dated as of February 19, 2015, by and among Genesis Energy, L.P., Genesis Energy Finance Corporation, the Guarantors named therein and U.S. Bank National Association, as trustee (incorporated by reference to Exhibit 4.31 to Form 10-K filed on February 27, 2015, File No. 001-12295). | ||
4.37 | Seventh Supplemental Indenture for 5.75% Senior Subordinated Notes due 2021, dated as of February 19, 2015, by and among Genesis Energy, L.P., Genesis Energy Finance Corporation, the Guarantors named therein and U.S. Bank National Association, as trustee (incorporated by reference to Exhibit 4.32 to Form 10-K filed on February 27, 2015, File No. 001-12295). | ||
4.38 | Eighth Supplemental Indenture for 5.75% Senior Notes due 2021, dated as of June 26, 2015, among Genesis Energy, L.P., Genesis Energy Finance Corporation, the Guarantors named therein and U.S. Bank National Association, as trustee (incorporated by reference to Exhibit 4.8 to the Company's Quarterly Report on Form 10-Q for the quarter ended September 30, 2015, File No. 001-12295). | ||
4.39 | Ninth Supplemental Indenture for 5.75% Senior Notes due 2021, dated as of July 15, 2015, among Genesis Energy, L.P., Genesis Energy Finance Corporation, the Guarantors named therein and U.S. Bank National Association, as trustee (incorporated by reference to Exhibit 4.9 to the Company's Quarterly Report on Form 10-Q for the quarter ended September 30, 2015, File No. 001-12295). | ||
97
4.40 | Tenth Supplemental Indenture for 5.75% Senior Notes due 2021, dated as of September 22, 2015, among Genesis Energy, L.P., Genesis Energy Finance Corporation, the Guarantors named therein and U.S. Bank National association, as trustee (incorporated by reference to Exhibit 4.4 to the Company's Quarterly Report on Form 10-Q for the quarter ended September 30, 2015, File No. 001-12295). | ||
4.41 | Eleventh Supplemental Indenture for 5.75% Senior Notes due 2021, dated as of December 11, 2015, among Genesis Energy, L.P., Genesis Energy Finance Corporation, the Guarantors named therein and U.S. Bank National association, as trustee (incorporated by reference to Exhibit 4.41 to Form 10-K filed on February 26, 2016, File No. 001-12295). | ||
4.42 | Twelfth Supplemental Indenture for 5.75% Senior Notes due 2021, dated as of March 10, 2016, among Genesis Energy, L.P., Genesis Energy Finance Corporation, the Guarantors named therein and U.S. Bank National association, as trustee (incorporated by reference to Exhibit 4.4 to the Company's Quarterly Report on Form 10-Q for the quarter ended March 31, 2016, File No. 001-12295). | ||
4.43 | Indenture for 5.625% Senior Notes due 2024, dated May 15, 2014, among Genesis Energy, L.P., Genesis Energy Finance Corporation, certain subsidiary guarantors named therein and U.S. Bank National Association, as trustee (incorporated by reference to Exhibit 4.1 to the Company’s Current Report on Form 8-K dated May 15, 2014, File No. 001-12295). | ||
4.44 | Supplemental Indenture for the Issuer's 5.625% Senior Notes due 2024, dated as of May 15, 2014, by and among Genesis Energy, L.P., Genesis Energy Finance Corporation, the subsidiary guarantors named therein and U.S. Bank National Association, as trustee (incorporated by reference to Exhibit 4.2 to Form 10-K filed on May 15, 2014, File No. 001-12295). | ||
4.45 | Second Supplemental Indenture for 5.625% Senior Notes due 2024, dated as of October 15, 2014, by and among Genesis Energy, L.P., Genesis Energy Finance Corporation, the Guarantors named therein and U.S. Bank National Association, as trustee (incorporated by reference to Exhibit 4.35 to Form 10-K filed on February 27, 2015, File No. 001-12295). | ||
4.46 | Third Supplemental Indenture for 5.625% Senior Notes due 2024, dated as of December 17, 2014, by and among Genesis Energy, L.P., Genesis Energy Finance Corporation, the Guarantors named therein and U.S. Bank National Association, as trustee (incorporated by reference to Exhibit 4.36 to Form 10-K filed on February 27, 2015, File No. 001-12295). | ||
4.47 | Fourth Supplemental Indenture for 5.625% Senior Notes due 2024, dated as of January 22, 2015, by and among Genesis Energy, L.P., Genesis Energy Finance Corporation, the Guarantors named therein and U.S. Bank National Association, as trustee (incorporated by reference to Exhibit 4.37 to Form 10-K filed on February 27, 2015, File No. 001-12295). | ||
4.48 | Fifth Supplemental Indenture for 5.625% Senior Notes due 2024, dated as of February 19, 2015, by and among Genesis Energy, L.P., Genesis Energy Finance Corporation, the Guarantors named therein and U.S. Bank National Association, as trustee (incorporated by reference to Exhibit 4.38 to Form 10-K filed on February 27, 2015, File No. 001-12295). | ||
4.49 | Sixth Supplemental Indenture for 5.625% Senior Notes due 2024, dated as of February 19, 2015, by and among Genesis Energy, L.P., Genesis Energy Finance Corporation, the Guarantors named therein and U.S. Bank National Association, as trustee (incorporated by reference to Exhibit 4.39 to Form 10-K filed on February 27, 2015, File No. 001-12295). | ||
4.50 | Seventh Supplemental Indenture for 5.625% Senior Notes due 2024, dated as of June 26, 2015, among Genesis Energy, L.P., Genesis Energy Finance Corporation, the Guarantors named therein and U.S. Bank National Association, as trustee (incorporated by reference to Exhibit 4.6 to the Company's Quarterly Report on Form 10-Q for the quarter ended June 30, 2015, File No. 001-12295). | ||
4.51 | Eighth Supplemental Indenture for 5.625% Senior Notes due 2024, dated as of July 15, 2015, among Genesis Energy, L.P., Genesis Energy Finance Corporation, the Guarantors named therein and U.S. Bank National Association, as trustee (incorporated by reference to Exhibit 4.7 to the Company's Quarterly Report on Form 10-Q for the quarter ended June 30, 2015, File No. 001-12295). | ||
4.52 | Ninth Supplemental Indenture for 5.625% Senior Notes due 2024, dated as of September 22, 2015, among Genesis Energy, L.P., Genesis Energy Finance Corporation, the Guarantors named therein and U.S. Bank National Association, as trustee (incorporated by reference to Exhibit 4.3 to the Company's Quarterly Report on Form 10-Q for the quarter ended September 30, 2015, File No. 001-12295). | ||
4.53 | Tenth Supplemental Indenture for 5.625% Senior Notes due 2024, dated as of December 11, 2015, among Genesis Energy, L.P., Genesis Energy Finance Corporation, the Guarantors named therein and U.S. Bank National Association, as trustee (incorporated by reference to Exhibit 4.52 to Form 10-K filed on February 26, 2016, File No. 001-12295). | ||
4.54 | Eleventh Supplemental Indenture for 5.625% Senior Notes due 2024, dated as of March 10, 2016, among Genesis Energy, L.P., Genesis Energy Finance Corporation, the Guarantors named therein and U.S. Bank National Association, as trustee (incorporated by reference to Exhibit 4.4 to the Company's Quarterly Report on Form 10-Q for the quarter ended March 31, 2016, File No. 001-12295). | ||
4.55 | Indenture, dated May 21, 2015, among Genesis Energy, L.P., Genesis Energy Finance Corporation, the Guarantors named therein and U.S. Bank National Association, as trustee (incorporated by reference to Exhibit 4.1 to the Company's Current Report on Form 8-K dated May 21, 2015, File No. 001-12295). | ||
98
4.56 | Supplemental Indenture for the Issuers' 6.000% Senior Notes due 2023, dated May 21, 2015, among Genesis Energy, L.P., Genesis Energy Finance Corporation, the Guarantors named therein and U.S. Bank National Association, as trustee (including the form of the Notes) (incorporated by reference to Exhibit 4.2 to the Company's Current Report on Form 8-K dated May 21, 2015, File No. 001-12295). | ||
4.57 | Second Supplemental Indenture for 6.000% Senior Notes due 2023, dated as of June 26, 2015, among Genesis Energy, L.P., Genesis Energy Finance Corporation, the Guarantors named therein and U.S. Bank National Association, as trustee (incorporated by reference to Exhibit 4.4 to the Company's Quarterly Report on Form 10-Q for the quarter ended June 30, 2015, File No. 001-12295). | ||
4.58 | Third Supplemental Indenture for 6.000% Senior Notes due 2023, dated as of July 15, 2015, among Genesis Energy, L.P., Genesis Energy Finance Corporation, the Guarantors named therein and U.S. Bank National Association, as trustee (incorporated by reference to Exhibit 4.5 to the Company's Quarterly Report on Form 10-Q for the quarter ended June 30, 2015, File No. 001-12295). | ||
4.59 | Fourth Supplemental Indenture for 6.75% Senior Notes due 2022, dated as of July 23, 2015, among Genesis Energy, L.P., Genesis Energy Finance Corporation, the Guarantors named therein and U.S. Bank National Association, as trustee to the Indenture dated as of May 21, 2015, among Genesis Energy, L.P., Genesis Energy Finance Corporation, the subsidiary guarantors named therein and U.S. Bank National Association, as trustee (incorporated by reference to Exhibit 4.2 to the Company's Current Report on Form 8-K dated July 28, 2015, File No. 001-12295). | ||
4.60 | Fifth Supplemental Indenture for 6.000% Senior Notes due 2023 and 6.75% Senior Notes due 2022, dated as of September 22, 2015, among Genesis Energy, L.P., Genesis Energy Finance Corporation, the Guarantors named therein and U.S. Bank National Association, as trustee (incorporated by reference to Exhibit 4.2 to the Company's Quarterly Report on Form 10-Q for the quarter ended September 30, 2015, File No. 001-12295). | ||
4.61 | Sixth Supplemental Indenture for 6.000% Senior Notes due 2023 and 6.75% Senior Notes due 2022, dated as of December 11, 2015, among Genesis Energy, L.P., Genesis Energy Finance Corporation, the Guarantors named therein and U.S. Bank National Association, as trustee (incorporated by reference to Exhibit 4.59 to Form 10-K filed on February 26, 2016, File No. 001-12295). | ||
4.62 | Seventh Supplemental Indenture for 6.000% Senior Notes due 2023 and 6.75% Senior Notes due 2022, dated as of March 10, 2016, among Genesis Energy, L.P., Genesis Energy Finance Corporation, the Guarantors named therein and U.S. Bank National Association, as trustee (incorporated by reference to Exhibit 4.2 to the Company's Quarterly Report on Form 10-Q for the quarter ended March 31, 2016, File No. 001-12295). | ||
10.1 | Fourth Amended and Restated Credit Agreement, dated as of June 30, 2014, among Genesis Energy, L.P. as borrower, Wells Fargo Bank, National Association, as administrative agent, Bank of America, N.A. and Bank of Montreal as co-syndication agents, U.S. Bank National Association as documentation agent, and the lenders party thereto (incorporated by reference to Exhibit 10.1 to Form 8-K dated July 3, 2014, File No. 001-12295). | ||
10.2 | First Amendment to Fourth Amended and Restated Credit Agreement, dated August 25, 2014, among Genesis Energy, L.P. as borrower, Wells Fargo Bank, National Association, as administrative agent, Bank of America, N.A. and Bank of Montreal as co-syndication agents, U.S. Bank National Association as documentation agent and the lenders party thereto (incorporated by reference to Exhibit 10.1 to Form 8-K dated August 29, 2014, File No. 001-12295). | ||
10.3 | Second Amendment to Fourth Amended and Restated Credit Agreement and Joinder Agreement, dated as of July 17, 2015, among Genesis Energy, L.P. as borrower, Wells Fargo Bank, National Association, as administrative agent and issuing bank, Bank of America, N.A. and Bank of Montreal as co-syndication agents, U.S. Bank National Association as documentation agent, and the lenders party thereto (incorporated by reference to Exhibit 10.3 to Form 10-K filed on February 26, 2016, File No. 001-12295). | ||
10.4 | Third Amendment to Fourth Amended and Restated Credit Agreement, dated as of September 17, 2015, among Genesis Energy, L.P. as borrower, Wells Fargo Bank, National Association, as administrative agent and issuing bank, Bank of America, N.A. and Bank of Montreal as co-syndication agents, U.S. Bank National Association as documentation agent, and the lenders party thereto (incorporated by reference to Exhibit 10.1 to Form 8-K dated September 23, 2015, File No. 001-12295). | ||
10.5 | Fourth Amendment to Fourth Amended and Restated Credit Agreement and Joinder Agreement dated as of April 27, 2016 among Genesis Energy, L.P., as the borrower, Wells Fargo Bank, National Association, as administrative agent and issuing bank, Bank of America, N.A. and Bank of Montreal, as co-syndication agents, U.S. Bank National Association, as documentation agent, and the lenders party thereto. (incorporated by reference to Exhibit 10.1 to Form 8-K dated May 3, 2016, File No. 001-12295). | ||
10.6 | Form of Indemnity Agreement, among Genesis Energy, L.P., Genesis Energy, LLC and each of the Directors of Genesis Energy, LLC (incorporated by reference to Exhibit 10.1 to the Company’s Current Report on Form 8-K dated March 5, 2010, File No. 001-12295). | ||
99
10.7 | Equity Distribution Agreement, dated June 27, 2016, among Genesis Energy, L.P., RBC Capital Markets, LLC, BNP Paribas Securities Corp., Capital One Securities, Inc., Deutsche Bank Securities Inc., DNB Markets, Inc., Fifth Third Securities, Inc., Scotia Capital (USA) Inc. and SMBC Nikko Securities America, Inc. (incorporated by reference to Exhibit 1.1 to Form 8-K dated June 27, 2016, File No. 001-12295). | ||
10.8 | + | Genesis Energy, LLC First Amended and Restated Stock Appreciation Rights Plan (incorporated by reference to Exhibit 10.24 to the Company’s Annual Report on Form 10-K for the year ended December 31, 2008, File No. 001-12295). | |
10.9 | + | Form of Stock Appreciation Rights Plan Grant Notice (incorporated by reference to Exhibit 10.25 to the Company’s Annual Report on Form 10-K for the year ended December 31, 2008, File No. 001-12295). | |
10.10 | + | Genesis Energy, L.P. 2010 Long-Term Incentive Plan (incorporated by reference to Exhibit 10.1 to the Company’s Quarterly Report on Form 10-Q for the quarter ended March 31, 2010, File No. 001-12295). | |
10.11 | + | Genesis Energy, LLC 2010 Long-Term Incentive Plan Form of Directors Phantom Unit with DERs Agreement (incorporated by reference to Exhibit 10.1 to the Company’s Quarterly Report on Form 10-Q for the quarter ended March 31, 2013, File No. 001-12295). | |
10.12 | + | Genesis Energy, LLC 2010 Long-Term Incentive Plan Form of Executive Phantom Unit with DERs Award – Officers (incorporated by reference to Exhibit 10.1 to the Company’s Quarterly Report on Form 10-Q for the quarter ended June 30, 2011, File No. 001-12295). | |
10.13 | + | Genesis Energy, LLC 2010 Long-Term Incentive Plan Form of Employee Phantom Unit with DERs Agreement (incorporated by reference to Exhibit 10.3 to the Company’s Quarterly Report on Form 10-Q for the quarter ended March 31, 2010, File No. 001-12295). | |
10.14 | + | Employment Agreement by and between Genesis Energy, LLC and Paul A. Davis, dated March 5, 2012 (incorporated by reference to Exhibit 10.17 to the Company’s Annual Report on Form 10-K dated February 26, 2013, File No. 001-12295). | |
10.15 | + | Employment Agreement by and between DG Marine Transportation, LLC and Richard Alexander dated July 18, 2008 ((incorporated by reference to Exhibit 10.22 to the Company's Annual Report on Form 10-K dated February 27, 2015, File No. 001-12295). | |
11.1 | |||
* | 21.1 | Subsidiaries of the Registrant. | |
* | 23.1 | Consent of Deloitte & Touche LLP. | |
* | 23.2 | Consent of Deloitte & Touche LLP. | |
* | 31.1 | Certification by Chief Executive Officer Pursuant to Rule 13a-14(a) under the Securities Exchange Act of 1934. | |
* | 31.2 | Certification by Chief Financial Officer Pursuant to Rule 13a-14(a) under the Securities Exchange Act of 1934. | |
* | 32.1 | Certification by Chief Executive Officer Pursuant to Section 906 of the Sarbanes-Oxley Act of 2002. | |
* | 32.2 | Certification by Chief Financial Officer Pursuant to Section 906 of the Sarbanes-Oxley Act of 2002. | |
* | 101.INS | XBRL Instance Document. | |
* | 101.SCH | XBRL Schema Document. | |
* | 101.CAL | XBRL Calculation Linkbase Document. | |
* | 101.LAB | XBRL Label Linkbase Document. | |
* | 101.PRE | XBRL Presentation Linkbase Document. | |
* | 101.DEF | XBRL Definition Linkbase Document. | |
* | Filed herewith |
+ | A management contract or compensation plan or arrangement. |
100
101
SIGNATURES
Pursuant to the requirements of Section 13 or 15(d) of the Securities Exchange Act of 1934, the registrant has duly caused this report to be signed on its behalf by the undersigned, thereunto duly authorized.
GENESIS ENERGY, L.P. | |||||
(A Delaware Limited Partnership) | |||||
By: | GENESIS ENERGY, LLC, | ||||
as General Partner | |||||
Date: | February 27, 2017 | By: | /s/ GRANT E. SIMS | ||
Grant E. Sims | |||||
Chief Executive Officer | |||||
Pursuant to the requirements of the Securities Exchange Act of 1934, this report has been signed below by the following persons in the capacities and on the dates indicated.
NAME | TITLE | DATE |
(OF GENESIS ENERGY, LLC)* | ||
/s/ GRANT E. SIMS Grant E. Sims | Chairman of the Board, Director and Chief Executive Officer (Principal Executive Officer) | February 27, 2017 |
/s/ ROBERT V. DEERE Robert V. Deere | Chief Financial Officer, (Principal Financial Officer) | February 27, 2017 |
/s/ KAREN N. PAPE Karen N. Pape | Senior Vice President and Controller (Principal Accounting Officer) | February 27, 2017 |
/s/ CONRAD P. ALBERT Conrad P. Albert | Director | February 27, 2017 |
/s/ JAMES E. DAVISON James E. Davison | Director | February 27, 2017 |
/s/ JAMES E. DAVISON, JR. James E. Davison, Jr. | Director | February 27, 2017 |
/s/ SHARILYN S. GASAWAY Sharilyn S. Gasaway | Director | February 27, 2017 |
/s/ KENNETH M. JASTROW, II Kenneth M. Jastrow, II | Director | February 27, 2017 |
/s/ CORBIN J. ROBERTSON, III Corbin J. Robertson, III | Director | February 27, 2017 |
/s/ JACK T. TAYLOR Jack T. Taylor | Director | February 27, 2017 |
* | Genesis Energy, LLC is our general partner. |
102
Item 8. Financial Statements and Supplementary Data
GENESIS ENERGY, L.P.
INDEX TO CONSOLIDATED FINANCIAL STATEMENTS
AND FINANCIAL STATEMENT SCHEDULES
Page | |
Financial Statements of Significant Equity Investee — Poseidon Oil Pipeline Company, L.L.C. | |
103
REPORT OF INDEPENDENT REGISTERED PUBLIC ACCOUNTING FIRM
To the Board of Directors of Genesis Energy, LLC and Unitholders of
Genesis Energy, L.P.
Houston, Texas
We have audited the accompanying consolidated balance sheets of Genesis Energy, L.P. and subsidiaries (the "Partnership") as of December 31, 2016 and 2015, and the related consolidated statements of operations, partners’ capital, and cash flows for each of the three years in the period ended December 31, 2016. We also have audited the Partnership's internal control over financial reporting as of December 31, 2016, based on criteria established in Internal Control - Integrated Framework (2013) issued by the Committee of Sponsoring Organizations of the Treadway Commission. The Partnership's management is responsible for these financial statements, for maintaining effective internal control over financial reporting, and for its assessment of the effectiveness of internal control over financial reporting, included in the accompanying Management’s Report on Internal Control over Financial Reporting. Our responsibility is to express an opinion on these financial statements and an opinion on the Partnership's internal control over financial reporting based on our audits.
We conducted our audits in accordance with the standards of the Public Company Accounting Oversight Board (United States). Those standards require that we plan and perform the audit to obtain reasonable assurance about whether the financial statements are free of material misstatement and whether effective internal control over financial reporting was maintained in all material respects. Our audits of the financial statements included examining, on a test basis, evidence supporting the amounts and disclosures in the financial statements, assessing the accounting principles used and significant estimates made by management, and evaluating the overall financial statement presentation. Our audit of internal control over financial reporting included obtaining an understanding of internal control over financial reporting, assessing the risk that a material weakness exists, and testing and evaluating the design and operating effectiveness of internal control based on the assessed risk. Our audits also included performing such other procedures as we considered necessary in the circumstances. We believe that our audits provide a reasonable basis for our opinions.
A company's internal control over financial reporting is a process designed by, or under the supervision of, the company's principal executive and principal financial officers, or persons performing similar functions, and effected by the company's board of directors, management, and other personnel to provide reasonable assurance regarding the reliability of financial reporting and the preparation of financial statements for external purposes in accordance with generally accepted accounting principles. A company's internal control over financial reporting includes those policies and procedures that (1) pertain to the maintenance of records that, in reasonable detail, accurately and fairly reflect the transactions and dispositions of the assets of the company; (2) provide reasonable assurance that transactions are recorded as necessary to permit preparation of financial statements in accordance with generally accepted accounting principles, and that receipts and expenditures of the company are being made only in accordance with authorizations of management and directors of the company; and (3) provide reasonable assurance regarding prevention or timely detection of unauthorized acquisition, use, or disposition of the company's assets that could have a material effect on the financial statements.
Because of the inherent limitations of internal control over financial reporting, including the possibility of collusion or improper management override of controls, material misstatements due to error or fraud may not be prevented or detected on a timely basis. Also, projections of any evaluation of the effectiveness of the internal control over financial reporting to future periods are subject to the risk that the controls may become inadequate because of changes in conditions, or that the degree of compliance with the policies or procedures may deteriorate.
In our opinion, the consolidated financial statements referred to above present fairly, in all material respects, the financial position of Genesis Energy, L.P. and subsidiaries as of December 31, 2016 and 2015, and the results of their operations and their cash flows for each of the three years in the period ended December 31, 2016, in conformity with accounting principles generally accepted in the United States of America. Also, in our opinion, the Partnership maintained, in all material respects, effective internal control over financial reporting as of December 31, 2016, based on the criteria established in Internal Control - Integrated Framework (2013) issued by the Committee of Sponsoring Organizations of the Treadway Commission.
/s/ DELOITTE & TOUCHE LLP
Houston, Texas
February 27, 2017
F-1
GENESIS ENERGY, L.P.
CONSOLIDATED BALANCE SHEETS
(In thousands)
December 31, 2016 | December 31, 2015 | ||||||
ASSETS | |||||||
CURRENT ASSETS: | |||||||
Cash and cash equivalents | $ | 7,029 | $ | 10,895 | |||
Accounts receivable—trade, net | 224,682 | 219,532 | |||||
Inventories | 98,587 | 43,775 | |||||
Other | 29,271 | 32,114 | |||||
Total current assets | 359,569 | 306,316 | |||||
FIXED ASSETS, at cost | 4,763,396 | 4,310,226 | |||||
Less: Accumulated depreciation | (548,532 | ) | (378,247 | ) | |||
Net fixed assets | 4,214,864 | 3,931,979 | |||||
NET INVESTMENT IN DIRECT FINANCING LEASES, net of unearned income | 132,859 | 139,728 | |||||
EQUITY INVESTEES | 408,756 | 474,392 | |||||
INTANGIBLE ASSETS, net of amortization | 204,887 | 223,446 | |||||
GOODWILL | 325,046 | 325,046 | |||||
OTHER ASSETS, net of amortization | 56,611 | 58,692 | |||||
TOTAL ASSETS | $ | 5,702,592 | $ | 5,459,599 | |||
LIABILITIES AND PARTNERS’ CAPITAL | |||||||
CURRENT LIABILITIES: | |||||||
Accounts payable—trade | $ | 119,841 | $ | 140,726 | |||
Accrued liabilities | 140,962 | 161,410 | |||||
Total current liabilities | 260,803 | 302,136 | |||||
SENIOR SECURED CREDIT FACILITY | 1,278,200 | 1,115,000 | |||||
SENIOR UNSECURED NOTES, net of debt issuance costs | 1,813,169 | 1,807,054 | |||||
DEFERRED TAX LIABILITIES | 25,889 | 22,586 | |||||
OTHER LONG-TERM LIABILITIES | 204,481 | 192,072 | |||||
COMMITMENTS AND CONTINGENCIES (Note 19) | |||||||
PARTNERS’ CAPITAL: | |||||||
Common unitholders, 117,979,218 and 109,979,218 units issued and outstanding at December 31, 2016 and 2015, respectively | 2,130,331 | 2,029,101 | |||||
Noncontrolling interests | (10,281 | ) | (8,350 | ) | |||
Total partners' capital | 2,120,050 | 2,020,751 | |||||
TOTAL LIABILITIES AND PARTNERS’ CAPITAL | $ | 5,702,592 | $ | 5,459,599 | |||
The accompanying notes are an integral part of these consolidated financial statements.
F-2
GENESIS ENERGY, L.P.
CONSOLIDATED STATEMENTS OF OPERATIONS
(In thousands, except per unit amounts)
Year Ended December 31, | |||||||||||
2016 | 2015 | 2014 | |||||||||
REVENUES: | |||||||||||
Offshore pipeline transportation services | $ | 334,679 | $ | 140,230 | $ | 3,296 | |||||
Refinery services | 171,503 | 177,880 | 207,401 | ||||||||
Marine transportation | 213,021 | 238,757 | 229,282 | ||||||||
Supply and logistics | 993,290 | 1,689,662 | 3,406,185 | ||||||||
Total revenues | 1,712,493 | 2,246,529 | 3,846,164 | ||||||||
COSTS AND EXPENSES: | |||||||||||
Supply and logistics product costs | 823,524 | 1,481,619 | 3,166,336 | ||||||||
Supply and logistics operating costs | 101,103 | 121,189 | 140,212 | ||||||||
Marine transportation operating costs | 142,551 | 135,200 | 142,793 | ||||||||
Refinery services operating costs | 91,443 | 96,806 | 121,401 | ||||||||
Offshore pipeline transportation operating costs | 79,624 | 39,713 | 1,271 | ||||||||
General and administrative | 45,625 | 64,995 | 50,692 | ||||||||
Depreciation and amortization | 222,196 | 150,140 | 90,908 | ||||||||
Total costs and expenses | 1,506,066 | 2,089,662 | 3,713,613 | ||||||||
OPERATING INCOME | 206,427 | 156,867 | 132,551 | ||||||||
Equity in earnings of equity investees | 47,944 | 54,450 | 43,135 | ||||||||
Interest expense | (139,947 | ) | (100,596 | ) | (66,639 | ) | |||||
Gain on basis step up on historical interest | — | 332,380 | — | ||||||||
Other income/(expense), net | — | (17,529 | ) | — | |||||||
Income from operations before income taxes | 114,424 | 425,572 | 109,047 | ||||||||
Income tax expense | (3,342 | ) | (3,987 | ) | (2,845 | ) | |||||
NET INCOME | 111,082 | 421,585 | 106,202 | ||||||||
Net loss attributable to noncontrolling interests | 2,167 | 943 | — | ||||||||
NET INCOME ATTRIBUTABLE TO GENESIS ENERGY, L.P. | $ | 113,249 | $ | 422,528 | $ | 106,202 | |||||
BASIC AND DILUTED NET INCOME PER COMMON UNIT: | |||||||||||
Basic and Diluted | $ | 1.00 | $ | 4.10 | $ | 1.18 | |||||
WEIGHTED AVERAGE OUTSTANDING COMMON UNITS: | |||||||||||
Basic and Diluted | 113,433 | 103,004 | 90,060 | ||||||||
The accompanying notes are an integral part of these consolidated financial statements.
F-3
GENESIS ENERGY, L.P.
CONSOLIDATED STATEMENTS OF PARTNERS’ CAPITAL
(In thousands)
Number of Common Units | Partners' Capital | Noncontrolling Interest | Total | |||||||||||
December 31, 2013 | 88,691 | $ | 1,097,737 | $ | — | $ | 1,097,737 | |||||||
Net income | — | 106,202 | — | 106,202 | ||||||||||
Cash distributions to partners, net | — | (200,461 | ) | — | (200,461 | ) | ||||||||
Issuance of units for cash, net (Note 11) | 4,600 | 225,725 | — | 225,725 | ||||||||||
Conversion of waiver units | 1,738 | — | — | — | ||||||||||
December 31, 2014 | 95,029 | 1,229,203 | — | 1,229,203 | ||||||||||
Net income (loss) | — | 422,528 | (943 | ) | 421,585 | |||||||||
Noncontrolling interest from acquisition | — | — | (6,447 | ) | (6,447 | ) | ||||||||
Cash distributions to partners, net | — | (256,389 | ) | — | (256,389 | ) | ||||||||
Cash distributions to noncontrolling interests | — | — | (960 | ) | (960 | ) | ||||||||
Issuance of units for cash, net (Note 11) | 14,950 | 633,759 | — | 633,759 | ||||||||||
December 31, 2015 | 109,979 | 2,029,101 | (8,350 | ) | 2,020,751 | |||||||||
Net income (loss) | — | 113,249 | (2,167 | ) | 111,082 | |||||||||
Cash distributions to partners, net | — | (310,039 | ) | — | (310,039 | ) | ||||||||
Cash contributions from noncontrolling interests | — | — | 236 | 236 | ||||||||||
Issuance of common units for cash, net (Note 11) | 8,000 | 298,020 | — | 298,020 | ||||||||||
December 31, 2016 | 117,979 | $ | 2,130,331 | $ | (10,281 | ) | $ | 2,120,050 | ||||||
The accompanying notes are an integral part of these consolidated financial statements.
F-4
GENESIS ENERGY, L.P.
CONSOLIDATED STATEMENTS OF CASH FLOWS
(In thousands)
Year Ended December 31, | |||||||||||
2016 | 2015 | 2014 | |||||||||
CASH FLOWS FROM OPERATING ACTIVITIES: | |||||||||||
Net income | $ | 111,082 | $ | 421,585 | $ | 106,202 | |||||
Adjustments to reconcile net income to net cash provided by operating activities - | |||||||||||
Depreciation and amortization | 222,196 | 150,140 | 90,908 | ||||||||
Gain on basis step up on historical interest | — | (332,380 | ) | — | |||||||
Amortization and write-off of debt issuance costs and premium | 10,138 | 10,881 | 4,785 | ||||||||
Amortization of unearned income and initial direct costs on direct financing leases | (14,395 | ) | (14,979 | ) | (15,706 | ) | |||||
Payments received under direct financing leases | 20,672 | 20,664 | 21,235 | ||||||||
Equity in earnings of investments in equity investees | (47,944 | ) | (54,450 | ) | (43,135 | ) | |||||
Cash distributions of earnings of equity investees | 65,867 | 71,823 | 57,165 | ||||||||
Non-cash effect of equity-based compensation plans | 6,558 | 5,014 | 4,494 | ||||||||
Deferred and other tax benefits | 2,142 | 2,960 | 1,745 | ||||||||
Unrealized (gains) losses on derivative transactions | 1,287 | (1,009 | ) | (17,984 | ) | ||||||
Other, net | 11,385 | 3,915 | 3,391 | ||||||||
Net changes in components of operating assets and liabilities, net of acquisitions (See Note 14) | (90,650 | ) | 5,372 | 77,954 | |||||||
Net cash provided by operating activities | 298,338 | 289,536 | 291,054 | ||||||||
CASH FLOWS FROM INVESTING ACTIVITIES: | |||||||||||
Payments to acquire fixed and intangible assets | (463,100 | ) | (495,774 | ) | (443,482 | ) | |||||
Cash distributions received from equity investees—return of investment | 21,353 | 25,645 | 18,363 | ||||||||
Investments in equity investees | — | (3,045 | ) | (40,926 | ) | ||||||
Acquisitions | (25,394 | ) | (1,520,299 | ) | (157,000 | ) | |||||
Contributions in aid of construction costs | 13,374 | 3,179 | — | ||||||||
Proceeds from asset sales and discontinued operations | 3,609 | 2,811 | 272 | ||||||||
Other, net | (151 | ) | (1,976 | ) | (1,214 | ) | |||||
Net cash used in investing activities | (450,309 | ) | (1,989,459 | ) | (623,987 | ) | |||||
CASH FLOWS FROM FINANCING ACTIVITIES: | |||||||||||
Borrowings on senior secured credit facility | 1,115,800 | 1,525,050 | 1,839,900 | ||||||||
Repayments on senior secured credit facility | (952,600 | ) | (960,450 | ) | (1,872,300 | ) | |||||
Proceeds from issuance of senior unsecured notes, including discount | — | 1,139,718 | 350,000 | ||||||||
Repayment of senior unsecured notes | — | (350,000 | ) | — | |||||||
Debt issuance costs | (1,578 | ) | (28,901 | ) | (11,896 | ) | |||||
Issuance of common units for cash, net | 298,020 | 633,759 | 225,725 | ||||||||
Contributions (distributions) from (to) noncontrolling interests | 236 | (960 | ) | — | |||||||
Distributions to common unitholders | (310,039 | ) | (256,389 | ) | (200,461 | ) | |||||
Other, net | (1,734 | ) | (471 | ) | 2,561 | ||||||
Net cash provided by financing activities | 148,105 | 1,701,356 | 333,529 | ||||||||
Net increase (decrease) in cash and cash equivalents | (3,866 | ) | 1,433 | 596 | |||||||
Cash and cash equivalents at beginning of period | 10,895 | 9,462 | 8,866 | ||||||||
Cash and cash equivalents at end of period | $ | 7,029 | $ | 10,895 | $ | 9,462 | |||||
The accompanying notes are an integral part of these consolidated financial statements.
F-5
GENESIS ENERGY, L.P.
NOTES TO CONSOLIDATED FINANCIAL STATEMENTS
1. Organization
We are a growth oriented master limited partnership focused on the midstream segment of the crude oil and natural gas industry in the Gulf Coast region of the United States, Wyoming and the Gulf of Mexico. We have a diverse portfolio of assets, including pipelines, refinery-related plants, storage tanks and terminals, railcars, rail loading and unloading facilities, trucks, barges and a product tanker. We were formed in 1996 and are owned 100% by our limited partners. Genesis Energy, LLC, our general partner, is a wholly-owned subsidiary. Our general partner has sole responsibility for conducting our business and managing our operations. We conduct our operations and own our operating assets through our subsidiaries and joint ventures.
In the fourth quarter of 2016, we reorganized our operating segments as a result of the way our Chief Executive Officer, who is our chief operating decision maker, evaluates the performance of operations, develops strategy and allocates resources. The results of our onshore pipeline transportation segment, formerly reported under its own segment, are now reported in our supply and logistics segment. This change is consistent with the increasingly integrated nature of our onshore operations.
As a result of the above changes, we currently manage our businesses through four divisions that constitute our reportable segments - offshore pipeline transportation, refinery services, marine transportation, and supply and logistics. Our disclosures related to prior periods have been recast to reflect our reorganized segments.
These four divisions that constitute our reportable segments consist of the following:
• | Offshore pipeline transportation and processing of crude oil and natural gas in the Gulf of Mexico; |
• | Refinery services involving processing of high sulfur (or “sour”) gas streams for refineries to remove the sulfur, and selling the related by-product, sodium hydrosulfide (or “NaHS”, commonly pronounced “nash”); |
• | Marine transportation to provide waterborne transportation of petroleum products and crude oil throughout North America; and |
• | Supply and logistics services, which include terminaling, blending, storing, marketing, and transporting crude oil, petroleum products, and CO2. |
2. Summary of Significant Accounting Policies
Basis of Consolidation and Presentation
The accompanying financial statements and related notes present our consolidated financial position as of December 31, 2016 and 2015 and our results of operations, changes in partners’ capital and cash flows for the years ended December 31, 2016, 2015 and 2014. All intercompany balances and transactions have been eliminated. The accompanying Consolidated Financial Statements include Genesis Energy, L.P. and its subsidiaries.
Except per unit amounts, or as noted within the context of each footnote disclosure, the dollar amounts presented in the tabular data within these footnote disclosures are stated in thousands of dollars.
Joint Ventures
We participate in several joint ventures, including a 64% interest in Poseidon Oil Pipeline Company, L.L.C. (or "Poseidon"), a 25.7% interest in Neptune Pipeline Company, LLC and a 29% interest in Odyssey Pipeline L.L.C. (or "Odyssey"). We account for our investments in these joint ventures by the equity method of accounting. See Notes 3 and 8.
Use of Estimates
The preparation of our Consolidated Financial Statements requires us to make estimates and assumptions that affect the reported amounts of assets and liabilities and disclosure of contingent assets and liabilities, if any, at the date of the Consolidated Financial Statements and the reported amounts of revenues and expenses during the reporting period. We based these estimates and assumptions on historical experience and other information that we believed to be reasonable under the circumstances. Significant estimates that we make include: (1) liability and contingency accruals, (2) estimated fair value of assets and liabilities acquired and identification of associated goodwill and intangible assets, (3) estimates of future net cash flows from assets for purposes of determining whether impairment of those assets has occurred, and (4) estimates of future asset retirement obligations. Additionally, for purposes of the calculation of the fair value of awards under equity-based compensation plans, we make estimates regarding expected forfeiture rates of the rights and expected future distribution yield on our units. While we believe these estimates are reasonable, actual results could differ from these estimates. Changes in facts and circumstances may result in revised estimates.
F-6
Cash and Cash Equivalents
Cash and cash equivalents consist of all demand deposits and funds invested in highly liquid instruments with original maturities of three months or less. We have no requirement for compensating balances or restrictions on cash. We periodically assess the financial condition of the institutions where these funds are held and believe that our credit risk is minimal.
Accounts Receivable
We review our outstanding accounts receivable balances on a regular basis and record an allowance for amounts that we expect will not be fully recovered. Actual balances are not applied against the reserve until substantially all collection efforts have been exhausted.
Inventories
Our inventories are valued at the lower of cost or market. Cost is determined principally under the average cost method within specific inventory pools.
Fixed Assets
Property and equipment are carried at cost. Depreciation of property and equipment is provided using the straight-line method over the respective estimated useful lives of the assets. Asset lives are 5 to 40 years for pipelines and related assets, 20 to 30 years for marine vessels, 10 to 20 years for machinery and equipment, 3 to 7 years for transportation equipment, and 3 to 10 years for buildings and improvements, office equipment, furniture and fixtures and other equipment.
Interest is capitalized in connection with the construction of major facilities. The capitalized interest is recorded as part of the asset to which it relates and is amortized over the asset’s estimated useful life.
Maintenance and repair costs are charged to expense as incurred. Costs incurred for major replacements and upgrades are capitalized and depreciated over the remaining useful life of the asset. Certain volumes of crude oil and refined products are classified in fixed assets, as they are necessary to ensure efficient and uninterrupted operations of the gathering businesses. These crude oil and refined products volumes are carried at their weighted average cost.
Long-lived assets are reviewed for impairment. An asset is tested for impairment when events or circumstances indicate that its carrying value may not be recoverable. The carrying value of a long-lived asset is not recoverable if it exceeds the sum of the undiscounted cash flows expected to be generated from the use and ultimate disposal of the asset. If the carrying value is determined to not be recoverable under this method, an impairment charge equal to the amount the carrying value exceeds the fair value is recognized. Fair value is generally determined from estimated discounted future net cash flows.
Deferred Charges on Marine Transportation Assets
Our marine vessels are required by US Coast Guard regulations to be re-certified after a certain period of time, usually every five years. The US Coast Guard states that vessels must meet specified "seaworthiness" standards to maintain required operating certificates. To meet such standards, vessels must undergo regular inspection, monitoring, and maintenance, referred to as "dry-docking." Typical dry-docking costs include costs incurred to comply with regulatory and vessel classification inspection requirements, blasting and steel coating, and steel replacement. We defer and amortize these costs to maintenance and repair expense over the length of time that the certification is supposed to last.
Asset Retirement Obligations
Some of our assets have contractual or regulatory obligations to perform dismantlement and removal activities, and in some instances remediation, when the assets are abandoned. In general, our future asset retirement obligations relate to future costs associated with the removal of our crude oil and natural gas pipelines and platforms, CO2 pipelines, barge decommissioning, removal of equipment and facilities from leased acreage and land restoration. The fair value of a liability for an asset retirement obligation is recorded in the period in which it is incurred, discounted to its present value using our credit adjusted risk-free interest rate, and a corresponding amount capitalized by increasing the carrying amount of the related long-lived asset. The capitalized cost is depreciated over the useful life of the related asset. Accretion of the discount increases the liability and is recorded to expense. See Note 6.
Direct Financing Leasing Arrangements
For our direct financing leases, we record the gross finance receivable, unearned income and the estimated residual value of the leased pipelines. Unearned income represents the excess of the gross receivable plus the estimated residual value over the costs of the pipelines. Unearned income is recognized as financing income using the interest method over the term of the transaction and is included in supply and logistics revenue in the Consolidated Statements of Operations. The pipeline cost is not included in fixed assets.
We review our direct financing lease arrangements for credit risk. Such review includes consideration of the credit rating and financial position of the lessee. See Note 7.
F-7
Intangible and Other Assets
Intangible assets with finite useful lives are amortized over their respective estimated useful lives. If an intangible asset has a finite useful life, but the precise length of that life is not known, that intangible asset shall be amortized over the best estimate of its useful life. At a minimum, we will assess the useful lives and residual values of all intangible assets on an annual basis to determine if adjustments are required. We are amortizing our customer and supplier relationships, contract agreements, licensing agreements and trade name based on the period over which the asset is expected to contribute to our future cash flows. Generally, the contribution of these assets to our cash flows is expected to decline over time, such that greater value is attributable to the periods shortly after the acquisition was made. Intangible assets associated with lease or other items are being amortized on a straight-line basis.
We test intangible assets periodically to determine if impairment has occurred. An impairment loss is recognized for intangibles if the carrying amount of an intangible asset is not recoverable and its carrying amount exceeds its fair value. No impairment has occurred of intangible assets in any of the periods presented.
Costs incurred in connection with the issuance of long-term debt and certain amendments to our credit facilities have historically been capitalized and amortized using the straight-line method over the term of the related debt. Use of the straight-line method does not differ materially from the “effective interest” method of amortization. Certain of our capitalized debt issuance costs related to our respective issuances of notes are classified as reductions in long-term debt.
Goodwill
Goodwill represents the excess of purchase price over fair value of net assets acquired. We evaluate, and test if necessary, goodwill for impairment annually at October 1, and more frequently if indicators of impairment are present. During the evaluation, we may perform a qualitative assessment of relevant events and circumstances to determine the likelihood of goodwill impairment. If it is deemed more likely than not that the fair value of the reporting unit is less than its carrying amount, we calculate the fair value of the reporting unit. Otherwise, further testing is not necessary. We may also elect to exercise our unconditional option to bypass this qualitative assessment, in which case we would also calculate the fair value of the reporting unit. If the calculated fair value of the reporting unit exceeds its book value including associated goodwill amounts, the goodwill is considered to be unimpaired and no impairment charge is required. If the fair value of the reporting unit is less than its book value including associated goodwill amounts, a charge to earnings may be necessary to reduce the carrying value of the goodwill to its implied fair value. In the event that we determine that goodwill has become impaired, we will incur a charge for the amount of impairment during the period in which the determination is made. No goodwill impairment has occurred in any of the periods presented. See Note 9 for further information.
Environmental Liabilities
We provide for the estimated costs of environmental contingencies when liabilities are probable to occur and a reasonable estimate of the associated costs can be made. Ongoing environmental compliance costs, including maintenance and monitoring costs, are charged to expense as incurred.
Equity-Based Compensation
Our phantom units issued under our 2010 Long-Term Incentive Plan result in the payment of cash to our employees or directors of our general partner upon exercise or vesting of the related award. The fair value of our phantom units is equal to the market price of our common units. Our phantom units include both service-based and performance-based awards. For our performance-based awards, our fair value estimates are weighted based on probabilities for each performance condition applicable to the award. See Note 15 for more information on these plans.
Revenue Recognition
Product Sales—Revenues from the sale of crude oil, petroleum products and CO2 by our supply and logistics segment, and caustic soda and NaHS by our refinery services segment are recognized when title to the inventory is transferred to the customer, pricing is fixed and determinable, collectability is reasonably assured and there are no further significant obligations for future performance by us. Most frequently, title transfers upon our delivery of the inventory to the customer at a location designated by the customer, although in certain situations, title transfers when the inventory is loaded for transportation to the customer. Our crude oil and petroleum products are typically sold at prices based off daily or monthly published prices. Many of our contracts for sales of NaHS incorporate the price of caustic soda in the pricing formulas.
Marine Transportation—Revenues from the inland and offshore marine transportation of heavy refined petroleum products, including asphalt and crude oil, via our barges or vessels are recognized over the transit time of individual shipments as determined on an individual contract basis. Revenue from these contracts is typically based on a set day rate or a set fee per cargo movement. The costs of fuel and other specified operational costs are directly reimbursed by the customer under most of these contracts.
F-8
Rail Facility Loading and Unloading Revenues—Revenues based on a per barrel fee from the loading and/or unloading of crude oil at our rail facilities is recognized as the crude oil enters or exits the railcars.
Onshore Pipeline Transportation—Revenues from transportation of crude oil by our pipelines are based on actual volumes at a published tariff. Tariff revenues are recognized either at the point of delivery or at the point of receipt pursuant to the specifications outlined in our regulated tariffs. Income from direct financing leases is being recognized ratably over the term of the leases and is included in pipeline revenues.
Offshore Pipeline Transportation—Revenue from our offshore pipelines is generally based upon a fixed fee per unit of volume gathered or transported multiplied by the volume delivered. Transportation fees are based either on contractual arrangements or tariffs regulated by the FERC. Revenue associated with these fee-based contracts and tariffs is recognized when volumes have been delivered. Revenues from offshore platform services are primarily dependent upon the level of commodity charges and/or demand-type fees billable to customers. Revenues from offshore platform services are recognized in the period the services are provided. Revenue from commodity charges is based on a fee per unit of volume (typically per MMcf of natural gas or per barrel of crude oil) delivered to the platform multiplied by the total volume of each product delivered. Demand-type fees are similar to firm capacity reservation agreements for a pipeline in that they are charged to a customer regardless of the volume the customer actually delivers to the platform. Contracts for platform services often include both demand-type fees and commodity charges, but demand-type fees generally expire after a contractually fixed period of time and in some instances may be subject to cancellation by customers.
In order to compensate us for bearing the risk of volumetric losses in volumes that occur to crude oil in our pipelines (onshore and offshore) due to temperature, crude quality and the inherent difficulties of measurement of liquids in a pipeline, our tariffs and agreements include the right for us to make volumetric deductions from the shippers for quality and volumetric fluctuations. We refer to these deductions as pipeline loss allowances.
We compare these allowances to the actual volumetric gains and losses of the pipeline and the net gain or loss is recorded as revenue or a reduction of revenue, based on prevailing market prices at that time. When net gains occur, we have crude oil inventory. When net losses occur, we reduce any recorded inventory on hand and record a liability for the purchase of crude oil that we must make to replace the lost volumes. We reflect inventories in the Consolidated Financial Statements at the lower of the recorded value or the market value at the balance sheet date. We value liabilities to replace crude oil at current market prices. The crude oil in inventory can then be sold, resulting in additional revenue if the sales price exceeds the inventory value.
Cost of Sales and Operating Expenses
Supply and logistics costs and expenses include the cost to acquire the product and the associated costs to transport it to our terminal facilities, including storing, or to a customer for sale. Other than the cost of the products, the most significant costs we incur relate to transportation utilizing our fleet of trucks, railcars, terminals, barges and other vessels , including personnel costs, fuel and maintenance of our or third-party owned equipment. Additionally, costs to operate and maintain the integrity of our onshore pipelines are included herein.
When we enter into buy/sell arrangements concurrently or in contemplation of one another with a single counterparty, we reflect the amounts of revenues and purchases for these transactions on a net basis in our Consolidated Statements of Operations as supply and logistics revenues.
Marine operating costs consist primarily of employee and related costs to man the boats, barges, and vessels, maintenance and supply costs related to general upkeep of the boats, barges, and vessels, and fuel costs which are often rebillable and passed through to the customer.
The most significant operating costs in our refinery services segment consist of the costs to operate NaHS plants located at various refineries, caustic soda used in the process of processing the refiner’s sour gas, and costs to transport the NaHS and caustic soda.
Pipeline operating costs consist primarily of power costs to operate pumping and platform equipment, personnel costs to operate the pipelines and platforms, insurance costs and costs associated with maintaining the integrity of our pipelines.
Income Taxes
We are a limited partnership, organized as a pass-through entity for federal income tax purposes. As such, we do not directly pay federal income tax. Our taxable income or loss, which may vary substantially from the net income or net loss we report in our Consolidated Statements of Operations, is included in the federal income tax returns of each partner.
Some of our corporate subsidiaries pay U.S. federal, state, and foreign income taxes. Deferred income tax assets and liabilities for certain operations conducted through corporations are recognized for temporary differences between the assets and liabilities for financial reporting and tax purposes. Changes in tax legislation are included in the relevant computations in the period in which such changes are effective. Deferred tax assets are reduced by a valuation allowance for the amount of any
F-9
tax benefit not expected to be realized. Penalties and interest related to income taxes will be included in income tax expense in the Consolidated Statements of Operations.
Derivative Instruments and Hedging Activities
When we hold inventory positions in crude oil and petroleum products, we use derivative instruments to hedge exposure to price risk. Derivative transactions, which can include forward contracts and futures positions on the NYMEX, are recorded in the Consolidated Balance Sheets as assets and liabilities based on the derivative’s fair value. Changes in the fair value of derivative contracts are recognized currently in earnings unless specific hedge accounting criteria are met. We must formally designate the derivative as a hedge and document and assess the effectiveness of derivatives associated with transactions that receive hedge accounting. Accordingly, changes in the fair value of derivatives are included in earnings in the current period for (i) derivatives accounted for as fair value hedges; (ii) derivatives that do not qualify for hedge accounting and (iii) the portion of cash flow hedges that is not highly effective in offsetting changes in cash flows of hedged items. Changes in the fair value of cash flow hedges are deferred in Accumulated Other Comprehensive Income (“AOCI”) and reclassified into earnings when the underlying position affects earnings. See Note 17.
Fair Value of Current Assets and Current Liabilities
The carrying amount of other current assets and other current liabilities approximates their fair value due to their short-term nature.
Net Income Per Common Unit
Basic and diluted net income per common unit is determined by dividing net income attributable to limited partners by the weighted average number of outstanding common units during the period.
Recent and Proposed Accounting Pronouncements
In May 2014, the FASB issued revised guidance on revenue from contracts with customers that will supersede most current revenue recognition guidance, including industry-specific guidance. The core principle of the revenue model is that an entity will recognize revenue to depict the transfer of promised goods or services to customers in an amount that reflects the consideration to which the entity expects to be entitled in exchange for those goods or services. The new standard provides a five-step analysis for transactions to determine when and how revenue is recognized. The guidance permits the use of either a full retrospective or a modified retrospective approach. In July 2015, the FASB approved a one year deferral of the effective date of this standard to December 15, 2017 for annual reporting periods beginning after that date. The FASB also approved early adoption of the standard, but not before the original effective date of December 15, 2016. While we do not believe there will be a material impact to our revenues upon adoption, we are continuing to evaluate the impacts of our pending adoption of this guidance and our preliminary assessments are subject to change.
In July 2015, the FASB issued guidance modifying the accounting for inventory. Under this guidance, the measurement principle for inventory will change from lower of cost or market value to lower of cost and net realizable value. The guidance defines net realizable value as the estimated selling price in the ordinary course of business, less reasonably predictable costs of completion, disposal, and transportation. The guidance is effective for reporting periods after December 15, 2016, with early adoption permitted. We do not expect adoption to have a material impact on our consolidated financial statements.
In February 2016, the FASB issued guidance to improve the transparency and comparability among companies by requiring lessees to recognize a lease liability and a corresponding lease asset for virtually all lease contracts. The guidance also requires additional disclosure about leasing arrangements. The guidance is effective for interim and annual periods beginning after December 15, 2018 and requires a modified retrospective approach to adoption. Early adoption is permitted. We are currently evaluating this guidance.
In August 2016, the FASB issued guidance that addresses how certain cash receipts and payments are presented and classified in the statement of cash flows under Topic 230, Statement of Cash flow, and other Topics. The guidance is effective for annual reporting periods, and interim periods therein, beginning after December 15, 2017. We do not expect the adoption of this guidance to have a material impact on our consolidated financial statements.
3. Acquisitions
Acquisitions
Enterprise Offshore
On July 24, 2015, we acquired the offshore pipeline and services business of Enterprise Products Partners, L.P. and its affiliates for approximately $1.5 billion, subject to certain adjustments. That business includes interests in offshore crude oil and natural gas pipelines and six offshore hub platforms, including a 36% interest in the Poseidon Oil Pipeline System, a 50% interest in the Southeast Keathley Canyon Oil Pipeline System, and a 50% interest in the Cameron Highway Oil Pipeline
F-10
System. To finance that transaction, in July 2015, we issued 10,350,000 common units in a public offering that generated proceeds of $437.2 million net of underwriter discounts and $750 million aggregate principal amount of 6.75% senior unsecured notes due 2022 that generated net proceeds of $728.6 million net of issuance discount and underwriting fees. The remainder of that transaction was financed with borrowings under our senior secured credit facility.
We have reflected the financial results of the acquired business in our offshore pipeline transportation segment from the date of acquisition. The purchase price has been allocated to the assets acquired and liabilities assumed based on estimated preliminary fair values. Those fair values were developed by management with the assistance of a third-party valuation firm. The purchase price allocation for this transaction has been finalized. Our finalized purchase price allocation remains unchanged from what was disclosed in the financial statements included in our Annual Report on Form 10-K for the year ended December 31, 2015.
The allocation of the purchase price, as presented on our Consolidated Balance Sheet, is summarized as follows:
Cash | $ | 1,270 | |
Accounts receivable | 29,768 | ||
Inventories | 600 | ||
Other current assets | 10,432 | ||
Fixed assets | 1,225,685 | ||
Intangible assets | 79,050 | ||
Equity investees | 352,535 | ||
Other assets | 1,966 | ||
Accounts payable | (6,110 | ) | |
Accrued liabilities | (18,662 | ) | |
Other long-term liabilities | (161,412 | ) | |
Noncontrolling interest | 6,447 | ||
Total purchase price | $ | 1,521,569 | |
Fixed assets identified in connection with our valuation and purchase price allocation includes crude oil pipelines, natural gas pipelines and related assets. We will depreciate these assets on a straight line basis over estimated useful lives ranging from 2 to 35 years depending on the nature of each asset.
Intangible assets identified in connection with our valuation and purchase price allocation relate to customer contracts surrounding certain transportation agreements with producers in the Lucius production area in Southeast Keathley Canyon, which support our SEKCO pipeline. We will amortize these intangible assets on a straight line basis over an estimated useful life of 19 years.
In connection with our valuation and purchase price allocation, we have identified asset retirement obligations ("AROs") relating to the crude oil pipelines, natural gas pipelines and related assets with a preliminary fair value of $158.2 million. Of these AROs, $9.8 million of retirement costs were estimated to be incurred within the next year and thus were included in accrued liabilities in the table above, as well as on our Consolidated Balance Sheet at December 31, 2015. The remainder of the AROs recorded as a result of our Enterprise acquisition are included within "Other long-term liabilities" in the table above, as well as on our Consolidated Balance Sheet. See further discussion of AROs assumed as a result of our Enterprise acquisition in Note 6.
Noncontrolling interest as shown in the table above relates to the fair value assigned to the 20% ownership interest of our joint venture partner in Independence Hub, LLC, a consolidated subsidiary acquired as a result of our Enterprise acquisition in which we have an 80% ownership interest.
Our Consolidated Financial Statements include the results of our acquired offshore pipeline transportation business since July 24, 2015, the effective closing date of the acquisition. The following table presents selected financial information included in our Consolidated Financial Statements for the periods presented:
F-11
Year Ended December 31, | |||
2015 | |||
Revenues | $ | 101,444 | |
Net income | $ | 58,805 | |
The table below presents selected unaudited pro forma financial information incorporating the historical results of our newly acquired offshore pipeline transportation assets. The pro forma financial information below has been prepared as if the acquisition had been completed on January 1, 2014 and is based upon assumptions deemed appropriate by us and may not be indicative of actual results. This pro forma information was prepared using historical financial data of the Enterprise offshore pipelines and services businesses and reflects certain estimates and assumptions made by our management. Our unaudited pro forma financial information is not necessarily indicative of what our consolidated financial results would have been had our Enterprise acquisition been completed on January 1, 2014.
Year Ended December 31, | |||||||
Pro forma consolidated financial operating results: | 2015 | 2014 | |||||
Revenues | $ | 2,421,989 | $ | 4,135,964 | |||
Net Income Attributable to Genesis Energy L.P. | $ | 425,363 | $ | 132,682 | |||
Basic and diluted earnings per unit: | |||||||
As reported net income per unit | $ | 4.09 | $ | 1.18 | |||
Pro forma net income per unit | $ | 3.91 | $ | 1.32 | |||
As relating to our Enterprise acquisition, we incurred approximately $15 million in acquisition related costs through December 31, 2015 and incurred an additional $1 million during the year ended December 31, 2016. Such costs are included as "General and Administrative costs" on our Unaudited Condensed Consolidated Statement of Operations.
M/T American Phoenix
On November 13, 2014, we acquired the M/T American Phoenix from Mid Ocean Tanker Company for $157 million. The M/T American Phoenix is a modern double-hulled, Jones Act qualified tanker with 330,000 barrels of cargo capacity that was placed into service during 2012.
The purchase price of $157 million was paid to Mid Ocean Tanker Company in cash, as funded with proceeds from available and committed liquidity under our revolving credit facility. We have reflected the financial results of the acquired business in our marine transportation segment from the date of acquisition. We have recorded the assets acquired in the Consolidated Financial Statements at their fair values. Those fair values were developed by management.
The allocation of the purchase price, as presented on our Consolidated Balance Sheet, is summarized as follows:
Property and equipment | $ | 125,000 | |
Intangible assets | 32,000 | ||
Total purchase price | $ | 157,000 | |
F-12
Our Consolidated Financial Statements include the results of our acquired offshore marine transportation business since November 13, 2014, the effective closing date of the acquisition. The following table presents selected financial information included in our Consolidated Financial Statements for the periods presented:
Year Ended December 31, | |||
2014 | |||
Revenues | $ | 3,038 | |
Net income | $ | 454 | |
The table below presents selected unaudited pro forma financial information for us incorporating the historical results of the acquired M/T American Phoenix. The pro forma financial information below has been prepared as if the acquisition had been completed on January 1, 2013 and is based upon assumptions deemed appropriate by us and may not be indicative of actual results. Depreciation expense for the fixed assets acquired is calculated on a straight-line basis over an estimated useful life of approximately 30 years.
Year Ended December 31, | |||
2014 | |||
Pro forma earnings data: | |||
Revenues from continuing operations | $ | 3,863,745 | |
Net income | $ | 111,132 | |
4. Receivables
Accounts receivable – trade, net consisted of the following:
December 31, | |||||||
2016 | 2015 | ||||||
Accounts receivable - trade | $ | 231,187 | $ | 220,978 | |||
Allowance for doubtful accounts | (6,505 | ) | (1,446 | ) | |||
Accounts receivable - trade, net | $ | 224,682 | $ | 219,532 | |||
The following table presents the activity of our allowance for doubtful accounts for the periods indicated:
December 31, | |||||||||||
2016 | 2015 | 2014 | |||||||||
Balance at beginning of period | $ | 1,446 | $ | 2,973 | $ | 1,526 | |||||
Charged to costs and expenses | 6,463 | 1,242 | 1,447 | ||||||||
Amounts written off | (1,404 | ) | (2,769 | ) | — | ||||||
Balance at end of period | $ | 6,505 | $ | 1,446 | $ | 2,973 | |||||
F-13
5. Inventories
The major components of inventories were as follows:
December 31, | |||||||
2016 | 2015 | ||||||
Petroleum products | $ | 11,550 | $ | 14,235 | |||
Crude oil | 73,133 | 22,815 | |||||
Caustic soda | 4,593 | 3,964 | |||||
NaHS | 9,304 | 2,755 | |||||
Other | 7 | 6 | |||||
Total | $ | 98,587 | $ | 43,775 | |||
Inventories are valued at the lower of cost or market. The market value of inventories were not recorded below cost as of December 31, 2016 and were below recorded costs by approximately $0.9 million as of December 31, 2015; therefore we reduced the value of inventory in our Condensed Consolidated Financial Statements for this difference.
6. Fixed Assets and Asset Retirement Obligations
Fixed Assets
Fixed assets consisted of the following:
December 31, | |||||||
2016 | 2015 | ||||||
Crude oil pipelines and natural gas pipelines and related assets | $ | 2,901,202 | $ | 2,501,821 | |||
Machinery and equipment | 427,658 | 414,100 | |||||
Transportation equipment | 17,543 | 19,025 | |||||
Marine vessels | 863,199 | 794,508 | |||||
Land, buildings and improvements | 55,712 | 41,202 | |||||
Office equipment, furniture and fixtures | 9,654 | 7,540 | |||||
Construction in progress | 440,225 | 485,575 | |||||
Other | 48,203 | 46,455 | |||||
Fixed assets, at cost | 4,763,396 | 4,310,226 | |||||
Less: Accumulated depreciation | (548,532 | ) | (378,247 | ) | |||
Net fixed assets | $ | 4,214,864 | $ | 3,931,979 | |||
Depreciation expense was $194.0 million, $124.2 million and $73.2 million for the years ended December 31, 2016, 2015, and 2014, respectively.
F-14
Asset Retirement Obligations
We record AROs in connection with legal requirements to perform specified retirement activities under contractual arrangements and/or governmental regulations. As a result of our Enterprise acquisition of the offshore pipeline and services business of Enterprise Products Partners, L.P. on July 24, 2015, we recorded AROs based on the fair value measurement assigned during the preliminary purchase price allocation.
A reconciliation of our liability for asset retirement obligations is as follows:
December 31, 2014 | $ | 14,790 | |
AROs arising from our Enterprise acquisition | 158,230 | ||
AROs from the consolidation of historical interests in CHOPS and SEKCO | 1,988 | ||
Accretion expense | 4,941 | ||
Revisions in timing of expected settlement | 9,986 | ||
Settlements | (1,273 | ) | |
December 31, 2015 | 188,662 | ||
AROs arising from the acquisition and consolidation of a previously held equity method investment | 20,940 | ||
Accretion expense | 10,800 | ||
Revisions in timing and estimated costs of AROs | (2,254 | ) | |
Settlements | (4,422 | ) | |
December 31, 2016 | $ | 213,726 | |
At December 31, 2016 and December 31, 2015, $22.4 million and $9.8 million are included as current in "Accrued liabilities" on our Consolidated Balance Sheet, respectively. The remainder of the ARO liability at each period is included in "Other long-term liabilities" on our Consolidated Balance Sheet.
With respect to our AROs, the following table presents our forecast of accretion expense for the periods indicated:
2017 | $ | 11,117 | |
2018 | $ | 9,408 | |
2019 | $ | 8,619 | |
2020 | $ | 9,176 | |
2021 | $ | 9,772 | |
Certain of our unconsolidated affiliates have AROs recorded at December 31, 2016 relating to contractual agreements and regulatory requirements. These amounts are immaterial to our Consolidated Financial Statements.
7. Net Investment in Direct Financing Leases
Our direct financing leases include a lease of the Northeast Jackson Dome (“NEJD”) Pipeline. Under the terms of the agreement, we are paid quarterly payments, which commenced August 2008. These quarterly payments are fixed at approximately $20.7 million per year during the lease term at an interest rate of 10.25%. At the end of the lease term in 2028, we will convey all of our interests in the NEJD Pipeline to the lessee for a nominal payment. There are requirements in our leases that would provide credit support should the credit rating of our lessee fall to certain levels, and at December 31, 2016, the required credit support has been provided.
F-15
The following table lists the components of the net investment in direct financing leases:
December 31, | |||||||
2016 | 2015 | ||||||
Total minimum lease payments to be received | $ | 236,495 | $ | 257,111 | |||
Unamortized initial direct costs | 1,107 | 1,272 | |||||
Less unearned income | (97,822 | ) | (112,378 | ) | |||
Net investment in direct financing leases | 139,780 | 146,005 | |||||
Less current portion (included in other current assets) | (6,921 | ) | (6,277 | ) | |||
Long-term portion of net investment in direct financing leases | $ | 132,859 | $ | 139,728 | |||
At December 31, 2016, minimum lease payments to be received for each of the five succeeding fiscal years are $20.7 million.
8. Equity Investees
We account for our ownership in our joint ventures under the equity method of accounting (see Note 2 for a description of these investments). The price we pay to acquire an ownership interest in a company may exceed or be less than the underlying book value of the capital accounts we acquire. At December 31, 2016 and 2015, the unamortized differences in carrying value totaled $398.1 million and $414.0 million, respectively. We amortize the differences in carrying value as a change in equity earnings.
As part of our Enterprise acquisition, we increased our ownership interest in each of Cameron Highway Oil Pipeline Company ("CHOPS") and Southeast Keathley Canyon Pipeline Company, LLC ("SEKCO") from 50% to 100%. Consequently, these entities were reflected as equity investees until July 24, 2015, at which point they became fully consolidated wholly owned subsidiaries. Upon consolidation, we recorded a $332.4 million non-cash gain due to the step up in basis on our historical interest.
Also, as part of our Enterprise acquisition, our ownership interest in Poseidon Oil Pipeline Company, LLC ("Poseidon") increased from 28% to 64%. We also acquired a 50% ownership interest in Deepwater Gateway, LLC and a 25.7% interest in Neptune Pipeline Company, LLC. These additional interests were accounted for as equity investments from the acquisition date of July 24, 2015.
In the first quarter of 2016, we purchased the remaining 50% interest in Deepwater Gateway, LLC for approximately $26.0 million (including adjustments for working capital), increasing our ownership interest to 100%. Consequently, we now consolidate Deepwater Gateway, LLC instead of accounting for our interest under the equity method.
The following table presents information included in our Consolidated Financial Statements related to our equity investees.
Year Ended December 31, | |||||||||||
2016 | 2015 | 2014 | |||||||||
Genesis’ share of operating earnings | $ | 63,805 | $ | 17,157 | $ | 53,783 | |||||
Amortization of differences attributable to Genesis' carrying value of equity investments | (15,861 | ) | 37,293 | (10,648 | ) | ||||||
Net equity in earnings | $ | 47,944 | $ | 54,450 | $ | 43,135 | |||||
Distributions received | $ | 87,220 | $ | 97,468 | $ | 75,528 | |||||
F-16
The following tables present the combined balance sheet information for the last two years and income statement data for the last three years for our equity investees (on a 100% basis) including the effects of the change in our ownership interest due to the Enterprise and Deepwater acquisitions as previously discussed:
December 31, | |||||||
2016 | 2015 | ||||||
BALANCE SHEET DATA: | |||||||
Assets | |||||||
Current assets | $ | 35,375 | $ | 36,566 | |||
Fixed assets, net | 365,563 | 452,413 | |||||
Other assets | 3,177 | 2,040 | |||||
Total assets | $ | 404,115 | $ | 491,019 | |||
Liabilities and equity | |||||||
Current liabilities | $ | 23,928 | $ | 25,308 | |||
Other liabilities | 230,327 | 231,032 | |||||
Equity | 149,860 | 234,679 | |||||
Total liabilities and equity | $ | 404,115 | $ | 491,019 | |||
Year Ended December 31, | |||||||||||
2016 | 2015 | 2014 | |||||||||
INCOME STATEMENT DATA: | |||||||||||
Revenues | $ | 193,038 | $ | 189,941 | $ | 246,265 | |||||
Operating Income | $ | 122,836 | $ | 12,191 | $ | 146,760 | |||||
Net Income | $ | 118,175 | $ | 7,810 | $ | 142,754 | |||||
Poseidon's revolving credit facility
Borrowings under Poseidon’s revolving credit facilities, which was amended and restated in February 2015, are primarily used to fund spending on capital projects. The February 2015 credit facility is non-recourse to Poseidon’s owners and secured by its assets. The February 2015 credit facility contains customary covenants such as restrictions on debt levels, liens, guarantees, mergers, sale of assets and distributions to owners. A breach of any of these covenants could result in acceleration of the maturity date of Poseidon’s debt. Poseidon was in compliance with the terms of its credit agreement for all periods presented in these consolidated financial statements.
F-17
9. Intangible Assets, Goodwill and Other Assets
Intangible Assets
The following table reflects the components of intangible assets being amortized at December 31, 2016 and 2015:
December 31, 2016 | December 31, 2015 | ||||||||||||||||||||||||
Weighted Amortization Period in Years | Gross Carrying Amount | Accumulated Amortization | Carrying Value | Gross Carrying Amount | Accumulated Amortization | Carrying Value | |||||||||||||||||||
Refinery Services: | |||||||||||||||||||||||||
Customer relationships | 5 | $ | 94,654 | $ | 89,756 | $ | 4,898 | $ | 94,654 | $ | 86,285 | $ | 8,369 | ||||||||||||
Licensing agreements | 6 | 38,678 | 34,204 | 4,474 | 38,678 | 31,694 | 6,984 | ||||||||||||||||||
Segment total | 133,332 | 123,960 | 9,372 | 133,332 | 117,979 | 15,353 | |||||||||||||||||||
Supply & Logistics: | |||||||||||||||||||||||||
Customer relationships | 5 | 35,430 | 33,676 | 1,754 | 35,430 | 32,044 | 3,386 | ||||||||||||||||||
Intangibles associated with lease | 15 | 13,260 | 4,459 | 8,801 | 13,260 | 3,986 | 9,274 | ||||||||||||||||||
Segment total | 48,690 | 38,135 | 10,555 | 48,690 | 36,030 | 12,660 | |||||||||||||||||||
Marine contract intangibles | 5 | 27,000 | 6,300 | 20,700 | 27,000 | 900 | 26,100 | ||||||||||||||||||
Offshore pipeline contract intangibles | 19 | 158,101 | 11,788 | 146,313 | 158,101 | 3,467 | 154,634 | ||||||||||||||||||
Other | 5 | 28,569 | 10,622 | 17,947 | 22,819 | 8,120 | 14,699 | ||||||||||||||||||
Total | $ | 395,692 | $ | 190,805 | $ | 204,887 | $ | 389,942 | $ | 166,496 | $ | 223,446 | |||||||||||||
The licensing agreements referred to in the table above relate to the agreements we have with refiners to provide services. The supply and logistics lease relates to a terminal facility in Shreveport, Louisiana. The marine contract intangibles relate to the contracts we assumed in the purchase of the M/T American Phoenix in November 2014.
The offshore pipeline contract intangibles relate to customer contracts surrounding certain transportation agreements with producers in the Lucius production area in Southeast Keathley Canyon, which support our SEKCO pipeline identified in connection with our purchase price allocation surrounding the Enterprise Acquisition.
We are recording amortization of our intangible assets based on the period over which the asset is expected to contribute to our future cash flows. Generally, the contribution to our cash flows of the customer and supplier relationships, licensing agreements and trade name intangible assets is expected to decline over time, such that greater value is attributable to the periods shortly after the acquisition was made. The supply and logistics lease, marine contract, offshore pipeline contract intangibles and other intangible assets are being amortized on a straight-line basis. Amortization expense on intangible assets was $24.3 million, $20.0 million and $13.4 million for the years ended December 31, 2016, 2015 and 2014, respectively.
The following table reflects our estimated amortization expense for each of the five subsequent fiscal years:
2017 | 2018 | 2019 | 2020 | 2021 | |||||||||||||||
Refinery Services: | |||||||||||||||||||
Customer relationships | $ | 2,737 | $ | 2,161 | $ | — | $ | — | $ | — | |||||||||
Licensing agreements | 2,324 | 2,150 | — | — | — | ||||||||||||||
Supply and Logistics: | |||||||||||||||||||
Customer relationships | 1,407 | 41 | 39 | 38 | 37 | ||||||||||||||
Intangibles associated with lease | 474 | 474 | 474 | 474 | 474 | ||||||||||||||
Marine contract intangibles | 5,400 | 5,400 | 5,400 | 4,500 | — | ||||||||||||||
Offshore pipeline contract intangibles | 8,321 | 8,321 | 8,321 | 8,321 | 8,321 | ||||||||||||||
Other | 2,969 | 2,943 | 2,921 | 2,908 | 1,779 | ||||||||||||||
Total | $ | 23,632 | $ | 21,490 | $ | 17,155 | $ | 16,241 | $ | 10,611 | |||||||||
F-18
Goodwill
The carrying amount of goodwill by business segment at both December 31, 2016 and 2015 was $301.9 million in refinery services and $23.1 million in supply and logistics. We have not recognized any impairment losses related to goodwill for any of the periods presented.
Other Assets
Other assets consisted of the following:
December 31, | |||||||
2016 | 2015 | ||||||
CO2 volumetric production payments, net of amortization | $ | 3,503 | $ | 7,413 | |||
Deferred marine charges, net (1) | 27,710 | 23,646 | |||||
Other deferred costs and deposits | 25,398 | 27,633 | |||||
Other assets, net of amortization | $ | 56,611 | $ | 58,692 | |||
(1) | See discussion of deferred charges on marine transportation assets in the Summary of Accounting Policies (Note 2) |
The CO2 assets are being amortized on a units-of-production method. We recorded amortization of $3.9 million in 2016, $5.9 million in 2015 and $4.2 million in 2014.
10. Debt
At December 31, 2016 and 2015, our obligations under debt arrangements consisted of the following:
December 31, 2016 | December 31, 2015 | ||||||||||||||||||||||
Principal | Unamortized Discount and Debt Issuance Costs | Net Value | Principal | Unamortized Discount and Debt Issuance Costs | Net Value | ||||||||||||||||||
Senior secured credit facility | $ | 1,278,200 | $ | — | $ | 1,278,200 | $ | 1,115,000 | $ | — | 1,115,000 | ||||||||||||
6.000% senior unsecured notes | 400,000 | 6,758 | 393,242 | 400,000 | 7,825 | 392,175 | |||||||||||||||||
5.750% senior unsecured notes | 350,000 | 4,163 | 345,837 | 350,000 | 5,183 | 344,817 | |||||||||||||||||
5.625% senior unsecured notes | 350,000 | 6,614 | 343,386 | 350,000 | 7,510 | 342,490 | |||||||||||||||||
6.750% senior unsecured notes | 750,000 | 19,296 | 730,704 | 750,000 | 22,428 | 727,572 | |||||||||||||||||
Total long-term debt | $ | 3,128,200 | $ | 36,831 | $ | 3,091,369 | $ | 2,965,000 | $ | 42,946 | $ | 2,922,054 | |||||||||||
Senior Secured Credit Facility
In April 2016, we amended our credit agreement to, among other things, (i) increase the committed amount under our revolving credit facility to $1.7 billion (from $1.5 billion), with the ability to increase the committed amount by an additional $300.0 million, subject to lender consent and (ii) permanently relax the maximum consolidated leverage ratio to 5.5 to 1.0.
The key terms for rates under our $1.7 billion senior secured credit facility, which are dependent on our leverage ratio (as defined in the credit agreement), are as follows:
• | The interest rate on borrowings may be based on an alternate base rate or a Eurodollar rate, at our option. The alternate base rate is equal to the sum of (a) the greatest of (i) the prime rate as established by the administrative agent for the credit facility, (ii) the federal funds effective rate plus 0.5% of 1% and (iii) the LIBOR rate for a one-month maturity plus 1% and (b) the applicable margin. The Eurodollar rate is equal to the sum of (a) the LIBOR rate for the applicable interest period multiplied by the statutory reserve rate and (b) the applicable margin. The applicable margin varies from 1.50% to 2.75% on Eurodollar borrowings and from 0.50% to 1.75% on alternate base rate borrowings, depending on our leverage ratio. Our leverage ratio is recalculated quarterly and in connection with each material acquisition. At December 31, 2016, the applicable margins on our borrowings were 1.50% for alternate base rate borrowings and 2.50% for Eurodollar rate borrowings. |
• | Letter of credit fees range from 1.50% to 2.50% based on our leverage ratio as computed under the credit facility. The rate can fluctuate quarterly. At December 31, 2016, our letter of credit rate was 2.50%. |
F-19
• | We pay a commitment fee on the unused portion of the $1.7 billion maximum facility amount. The commitment fee on the unused committed amount will range from 0.25% to 0.50% per annum depending on our leverage ratio (0.50% at December 31, 2016). |
• | Our credit facility contains a $300 million accordion feature, giving us the ability to expand the size of the facility up to $2.0 billion for acquisitions or growth projects, subject to lender consent. |
Our credit facility contains customary covenants (affirmative, negative and financial) that could limit the manner in which we may conduct our business. As defined in our credit facility, we are required to meet three primary financial metrics—a maximum leverage ratio, a maximum senior secured leverage ratio and a minimum interest coverage ratio. Our credit agreement provides for the temporary inclusion of certain pro forma adjustments to the calculations of the required ratios following material acquisitions. In general, our leverage ratio calculation compares our consolidated funded debt (including outstanding notes we have issued) to EBITDA (as defined and adjusted in accordance with the credit facility) and cannot exceed 5.50 to 1.00. Our senior secured leverage ratio excludes outstanding debt under senior unsecured notes and cannot exceed 3.75 to 1.00. Our interest coverage ratio calculation compares EBITDA (as defined and adjusted in accordance with the credit facility) to interest expense and must be greater than 3.00 to 1.00 (2.75 to 1.00 during an acquisition period).
At December 31, 2016, we had $1.3 billion borrowed under our credit facility, with $74.5 million of the borrowed amount designated as a loan under the inventory sublimit. Our credit agreement allows up to $100 million of the capacity to be used for letters of credit, of which $9.5 million was outstanding at December 31, 2016. Due to the revolving nature of loans under our credit facility, additional borrowings and periodic repayments and re-borrowings may be made until the maturity date of July 28, 2019. The total amount available for borrowings under our credit facility at December 31, 2016 was $412.3 million. Our credit facility does not include a “borrowing base” limitation except with respect to our inventory loans.
Senior Unsecured Notes
In November 2010, we issued $250 million in aggregate principal amount of 7.875% senior unsecured notes due December 15, 2018 (the "2018 Notes"). Our 2018 Notes were sold at face value. Interest payments are due on June 15 and December 15 of each year. In February 2012, we issued an additional $100 million of aggregate principal amount of additional 2018 Notes. The additional 2018 Notes were issued at 101% of face value at an effective interest rate of 7.682%. The additional 2018 Notes have the same terms and conditions as the notes previously issued under the indenture. The issuance increased the total aggregate principal amount of our 2018 Notes to $350 million. These notes were redeemed upon the issuance of our $400 million unsecured notes issued on May 21, 2015 as discussed below.
On February 8, 2013, we issued $350 million of aggregate principal amount of 5.75% senior unsecured notes (the "2021 Notes"). Our 2021 Notes were sold at face value. Interest payments are due on February 15 and August 15 of each year. Our 2021 Notes mature on February 15, 2021. The net proceeds were used to repay borrowings under our credit facility and for general partnership purposes.
On May 15, 2014, we issued $350 million in aggregate principal amount of 5.625% senior unsecured notes (the "2024 Notes"). Our 2024 Notes were sold at face value. Interest payments are due on June 15 and December 15 of each year with the initial interest payment due December 15, 2014. Our 2024 Notes mature on June 15, 2024.
On May 21, 2015, we issued $400 million in aggregate principal amount of 6.0% senior unsecured notes (the "2023 Notes"). Interest payments are due on May 15 and November 15 of each year with the initial interest payment due November 15, 2015. Our 2023 Notes mature on May 15, 2023. We used a portion of the proceeds from those notes to effectively redeem all of our outstanding $350 million, 7.875% senior unsecured notes due 2018, using a combination of public tender offer and our redemption rights relating to those notes. The aggregate principal amount of the 7.875% notes totaling $300.1 million were tendered and the remaining $49.9 million were redeemed in full. A total loss of approximately $19.2 million for the tender and redemption of notes is recorded to "Other income/(expense), net" in our Consolidated Statements of Operations.
On July 23, 2015, we issued $750 million in aggregate principal amount of 6.75% senior unsecured notes (the "2022 Notes"). Interest payments are due on February 1 and August 1 of each year with the initial interest payment due February 1, 2016. Our 2022 Notes mature on August 1, 2022. That issuance generated net proceeds of $728.6 million net of issuance discount and underwriting fees. The net proceeds were used to fund a portion of the purchase price for our Enterprise acquisition.
Our 2021, 2022, 2023 and 2024 Notes were co-issued by Genesis Energy Finance Corporation (which has no independent assets or operations) and are each fully and unconditionally guaranteed, subject to customary exceptions pursuant to the indentures governing our 2021, 2022, 2023 and 2024 Notes, as discussed below, jointly and severally, by certain of our wholly-owned subsidiaries. We have the right to redeem our 2021 Notes at any time after February 15, 2017, at a premium to the face amount of our 2021 Notes that varies based on the time remaining to maturity on our 2021 Notes. We have the right to redeem our 2022 Notes at any time after August 1, 2018, at a premium to the face amount of our 2022 Notes that varies based on the time remaining to maturity on our 2022 Notes. Prior to August 1, 2018, we may also redeem up to 35% of the principal
F-20
amount of our 2022 Notes for 106.75% of the face amount with the proceeds from an equity offering of our common units. We have the right to redeem our 2023 Notes at any time after May 15, 2018, at a premium to the face amount of our 2023 Notes that varies based on the time remaining to maturity on our 2023 Notes. Prior to May 15, 2018, we may also redeem up to 35% of the principal amount of our 2023 Notes for 106% of the face amount with the proceeds from an equity offering of our common units. We have the right to redeem our 2024 Notes at any time after June 15, 2019, at a premium to the face amount of our 2024 Notes that varies based on the time remaining to maturity on our 2024 Notes. Prior to June 15, 2017, we may also redeem up to 35% of the principal amount of our 2024 Notes for 105.625% of the face amount with the proceeds from an equity offering of our common units.
Guarantees of our 2021, 2022, 2023 and 2024 Notes will be released under certain circumstances, including (i) in connection with any sale or other disposition of (a) all or substantially all of the properties or assets of a guarantor (including by way of merger or consolidation) or (b) all of the capital stock of such guarantor, in each case, to a person that is not a restricted subsidiary of the Partnership (ii) if the Partnership designates any restricted subsidiary that is a guarantor as an unrestricted subsidiary, (iii) upon legal defeasance, covenant defeasance or satisfaction and discharge of the applicable indenture, (iv) upon the liquidation or dissolution of such guarantor, or (v) at such time as such guarantor ceases to guarantee any other indebtedness of either of the issuers and any other guarantor.
Covenants and Compliance
Our credit agreement and the indenture governing the senior notes contain cross-default provisions. Our credit documents prohibit distributions on, or purchases or redemptions of, units if any default or event of default is continuing. In addition, those agreements contain various covenants limiting our ability to, among other things:
• | incur indebtedness if certain financial ratios are not maintained; |
• | grant liens; |
• | engage in sale-leaseback transactions; and |
• | sell substantially all of our assets or enter into a merger or consolidation. |
A default under our credit documents would permit the lenders thereunder to accelerate the maturity of the outstanding debt. As long as we are in compliance with our credit facility, our ability to make distributions of “available cash” is not restricted. As of December 31, 2016, we were in compliance with the financial covenants contained in our credit facility and indenture.
11. Partners’ Capital and Distributions
At December 31, 2016, our outstanding equity consisted of 117,939,221 Class A common units and 39,997 Class B common units. The Class A units are traditional common units in us. The Class B units are identical to the Class A units and, accordingly, have voting and distribution rights equivalent to those of the Class A units, and, in addition, the Class B units have the right to elect all of our board of directors and are convertible into Class A units under certain circumstances, subject to certain exceptions.
Distributions
Generally, we will distribute 100% of our available cash (as defined by our partnership agreement) within 45 days after the end of each quarter to unitholders of record. Available cash generally means, for each fiscal quarter, all cash on hand at the end of the quarter:
• | less the amount of cash reserves that our general partner determines in its reasonable discretion is necessary or appropriate to: |
• | provide for the proper conduct of our business; |
• | comply with applicable law, any of our debt instruments, or other agreements; or |
• | provide funds for distributions to our unitholders for any one or more of the next four quarters; |
• | plus all cash on hand on the date of determination of available cash for the quarter resulting from working capital borrowings. Working capital borrowings are generally borrowings that are made under our credit facility and in all cases are used solely for working capital purposes or to pay distributions to partners. |
F-21
We paid distributions in 2017, 2016 and 2015 as follows:
Distribution For | Date Paid | Per Unit Amount | Total Amount | ||||||
2014 | |||||||||
4th Quarter | February 13, 2015 | $ | 0.5950 | $ | 56,542 | ||||
2015 | |||||||||
1st Quarter | May 15, 2015 | $ | 0.6100 | $ | 60,774 | ||||
2nd Quarter | August 14, 2015 | $ | 0.6250 | $ | 68,737 | ||||
3rd Quarter | November 13, 2015 | $ | 0.6400 | $ | 70,387 | ||||
4th Quarter | February 12, 2016 | $ | 0.6550 | $ | 72,036 | ||||
2016 | |||||||||
1st Quarter | May 13, 2016 | $ | 0.6725 | $ | 73,961 | ||||
2nd Quarter | August 12, 2016 | $ | 0.6900 | $ | 81,406 | ||||
3rd Quarter | November 14, 2016 | $ | 0.7000 | $ | 82,585 | ||||
4th Quarter | February 14, 2017 | $ | 0.7100 | $ | 83,765 | ||||
Equity Issuances and Contributions
Our partnership agreement authorizes our general partner to cause us to issue additional limited partner interests and other equity securities, the proceeds from which could be used to provide additional funds for acquisitions or other needs.
On July 27, 2016, we issued 8,000,000 Class A common units in a public offering at a price of $37.90 per unit. We received proceeds, net of underwriting discounts and offering costs, of approximately $298.0 million from that offering. We used those proceeds to repay a portion of the borrowings outstanding under our credit facility.
On July 22, 2015, we issued 10,350,000 Class A common units in a public offering at a price of $43.77 per unit, which included the exercise by the underwriters of an option to purchase up to 1,350,000 additional common units from us. We received proceeds, net of underwriting discounts and offering costs, of approximately $437.2 million from that offering. We used the net proceeds to fund a portion of the purchase price for our Enterprise acquisition.
On April 10, 2015, we issued 4,600,000 Class A common units in a public offering at a price of $44.42 per unit, which included the exercise by the underwriters of an option to purchase up to 600,000 additional common units from us. We received proceeds, net of underwriting discounts and offering costs, of approximately $198.2 million from that offering. We used the net proceeds for general partnership purposes, including the repayment of a portion of the borrowings outstanding under our credit facility.
In September 2014, we issued 4,600,000 Class A common units in a public offering at a price of $50.71 per unit. We received proceeds, net of underwriting discounts and offering costs, of approximately $225.7 million from that offering. We used the net proceeds for general partnership purposes, including the repayment of outstanding borrowings under our credit facility.
The new common units issued in 2016, 2015 and 2014 to the public for cash were as follows:
Period | Purchaser of Common Units | Units | Gross Unit Price | Issuance Value | Costs | Net Proceeds | |||||||||||||
July 2016 | Public | 8,000 | $ | 37.90 | $ | 303,200 | $ | (4,748 | ) | $ | 298,452 | ||||||||
July 2015 | Public | 10,350 | $ | 43.77 | $ | 453,020 | $ | (15,856 | ) | $ | 437,164 | ||||||||
April 2015 | Public | 4,600 | $ | 44.42 | $ | 204,332 | $ | (6,164 | ) | $ | 198,168 | ||||||||
September 2014 | Public | 4,600 | $ | 50.71 | $ | 233,266 | $ | (7,541 | ) | $ | 225,725 | ||||||||
12. Business Segment Information
Our operations consist of four operating segments (see Note 1 for discussion of segment reporting change):
• | Offshore Pipeline Transportation – offshore transportation of crude oil and natural gas in the Gulf of Mexico; |
F-22
• | Refinery Services – processing high sulfur (or “sour”) gas streams as part of refining operations to remove the sulfur and selling the related by-product, NaHS; |
• | Marine Transportation – marine transportation to provide waterborne transportation of petroleum products and crude oil throughout North America and; |
• | Supply and Logistics – terminaling, blending, storing, marketing, and transporting crude oil, petroleum products (primarily fuel oil, asphalt, and other heavy refined products), and CO2. |
Substantially all of our revenues are derived from, and substantially all of our assets are located in, the United States.
We define Segment Margin as revenues less product costs, operating expenses (excluding non-cash charges, such as depreciation and amortization), and segment general and administrative expenses, plus our equity in distributable cash generated by our equity investees. In addition, our Segment Margin definition excludes the non-cash effects of our legacy stock appreciation rights plan and includes the non-income portion of payments received under direct financing leases.
Our chief operating decision maker (our Chief Executive Officer) evaluates segment performance based on a variety of measures including Segment Margin, segment volumes, where relevant, and capital investment.
Segment information for each year presented below is as follows:
Offshore Pipeline Transportation | Refinery Services | Marine Transportation | Supply & Logistics | Total | |||||||||||||||
Year Ended December 31, 2016 | |||||||||||||||||||
Segment Margin (a) | $ | 336,620 | $ | 79,508 | $ | 70,079 | $ | 83,364 | $ | 569,571 | |||||||||
Capital expenditures (b) | $ | 46,277 | $ | 2,274 | $ | 78,804 | $ | 316,638 | $ | 443,993 | |||||||||
Revenues: | |||||||||||||||||||
External customers | $ | 332,514 | $ | 180,665 | $ | 206,211 | $ | 993,103 | $ | 1,712,493 | |||||||||
Intersegment (c) | 2,165 | (9,162 | ) | 6,810 | 187 | $ | — | ||||||||||||
Total revenues of reportable segments | $ | 334,679 | $ | 171,503 | $ | 213,021 | $ | 993,290 | $ | 1,712,493 | |||||||||
Year Ended December 31, 2015 | |||||||||||||||||||
Segment Margin (a) | $ | 197,723 | $ | 80,246 | $ | 103,222 | $ | 95,394 | $ | 476,585 | |||||||||
Capital expenditures (b) | $ | 1,527,320 | $ | 1,595 | $ | 69,009 | $ | 409,687 | $ | 2,007,611 | |||||||||
Revenues: | |||||||||||||||||||
External customers | $ | 140,230 | $ | 187,257 | $ | 230,192 | $ | 1,688,850 | $ | 2,246,529 | |||||||||
Intersegment (c) | — | (9,377 | ) | 8,565 | 812 | $ | — | ||||||||||||
Total revenues of reportable segments | $ | 140,230 | $ | 177,880 | $ | 238,757 | $ | 1,689,662 | $ | 2,246,529 | |||||||||
Year Ended December 31, 2014 | |||||||||||||||||||
Segment Margin (a) | $ | 71,598 | $ | 84,851 | $ | 86,239 | $ | 104,576 | $ | 347,264 | |||||||||
Capital expenditures (b) | $ | 37,639 | $ | 2,385 | $ | 232,783 | $ | 371,741 | $ | 644,548 | |||||||||
Revenues: | |||||||||||||||||||
External customers | $ | 3,296 | $ | 218,297 | $ | 214,039 | $ | 3,410,532 | $ | 3,846,164 | |||||||||
Intersegment (c) | — | (10,896 | ) | 15,243 | (4,347 | ) | $ | — | |||||||||||
Total revenues of reportable segments | $ | 3,296 | $ | 207,401 | $ | 229,282 | $ | 3,406,185 | $ | 3,846,164 | |||||||||
Total assets by reportable segment were as follows:
December 31, 2016 | December 31, 2015 | December 31, 2014 | |||||||||
Offshore pipeline transportation | 2,575,335 | 2,623,478 | 645,668 | ||||||||
Refinery services | 395,043 | 394,626 | 403,703 | ||||||||
Marine transportation | 813,722 | 777,952 | 745,128 | ||||||||
Supply and logistics | 1,875,403 | 1,615,335 | 1,367,201 | ||||||||
Other assets | 43,089 | 48,208 | 48,924 | ||||||||
Total consolidated assets | $ | 5,702,592 | $ | 5,459,599 | $ | 3,210,624 | |||||
F-23
(a) | A reconciliation of total Segment Margin to net income attributable to Genesis Energy, L.P. for each year is presented below. |
(b) Capital expenditures include maintenance and growth capital expenditures, such as fixed asset additions (including enhancements to existing facilities and construction of growth projects) as well as acquisitions of businesses and contributions to equity investees related to same. In addition to construction of growth projects, capital spending in our offshore pipeline transportation segment included $35.1 million during the year ended December 31, 2016 related to the acquisition of the remaining 50% ownership in Deepwater Gateway. In 2015, there was $1.5 billion in capital spending to fund our Enterprise acquisition. Capital spending in this segment also included $2.5 million during the year ended December 31, 2015 representing capital contributions to our SEKCO pipeline to fund our share of the construction costs for its pipeline (as prior to our Enterprise acquisition in July 2015, we owned a 50% interest in the SEKCO pipeline with Enterprise owning the remaining 50%). During 2014, capital spending in our marine transportation segment included $157.0 million for our purchase of the M/T American Phoenix.
(c) Intersegment sales were conducted under terms that we believe were no more or less favorable than then-existing market conditions.
Reconciliation of total Segment Margin to net income attributable to Genesis Energy, L.P.:
Year Ended December 31, | |||||||||||
2016 | 2015 | 2014 | |||||||||
Total Segment Margin | $ | 569,571 | $ | 476,585 | $ | 347,264 | |||||
Corporate general and administrative expenses | (40,905 | ) | (61,370 | ) | (47,065 | ) | |||||
Depreciation, amortization and accretion | (230,563 | ) | (155,081 | ) | (91,397 | ) | |||||
Interest expense | (139,947 | ) | (100,596 | ) | (66,639 | ) | |||||
Adjustment to exclude distributable cash generated by equity investees not included in income and include equity in investees net income (1) | (39,276 | ) | (43,018 | ) | (31,093 | ) | |||||
Non-cash items not included in Segment Margin | (3,221 | ) | 2,809 | 3,506 | |||||||
Cash payments from direct financing leases in excess of earnings | (6,277 | ) | (5,685 | ) | (5,529 | ) | |||||
Gain on step up of historical basis | — | 332,380 | — | ||||||||
Loss on debt extinguishment | — | (19,225 | ) | — | |||||||
Differences in timing of cash receipts for certain contractual arrangements (2) | 13,253 | 6,359 | — | ||||||||
Non-cash valuation allowance related to collectibility | (6,044 | ) | — | — | |||||||
Other, net | — | (6,643 | ) | — | |||||||
Income tax expense | (3,342 | ) | (3,987 | ) | (2,845 | ) | |||||
Net income attributable to Genesis Energy, L.P. | $ | 113,249 | $ | 422,528 | $ | 106,202 | |||||
(1) Includes distributions attributable to the quarter and received during or promptly following such quarter.
(2) Certain cash payments received from customers under certain of our minimum payment obligation contracts are not recognized as revenue under GAAP in the period in which such payments are received.
F-24
13. Transactions with Related Parties
Sales, purchases and other transactions with affiliated companies, in the opinion of management, are conducted under terms no more or less favorable than then-existing market conditions. The transactions with related parties were as follows:
Year Ended December 31, | |||||||||||
2016 | 2015 | 2014 | |||||||||
Revenues: | |||||||||||
Sales of CO2 to Sandhill Group, LLC (1) | $ | 3,097 | $ | 3,259 | $ | 3,060 | |||||
Revenues from services and fees to Poseidon Oil Pipeline Company, LLC (2) | 10,844 | 4,536 | — | ||||||||
Expenses: | |||||||||||
Amounts paid to our CEO in connection with the use of his aircraft | $ | 660 | $ | 690 | $ | 630 | |||||
Charges for products purchased from Poseidon Oil Pipeline Company, LLC (2) | 1,007 | 464 | — | ||||||||
(1) | We own a 50% interest in Sandhill Group, LLC. |
(2) | We own a 64% interest in Poseidon Oil Pipeline Company, LLC. |
(3) | We owned a 50% interest in Deepwater Gateway, LLC until the first quarter of 2016 when we acquired the remaining 50%. |
Our CEO, Mr. Sims, owns an aircraft which is used by us for business purposes in the course of operations. We pay Mr. Sims a fixed monthly fee and reimburse the aircraft management company for costs related to our usage of the aircraft, including fuel and the actual out-of-pocket costs. Based on current market rates for chartering of private aircraft under long-term, priority arrangements with industry recognized chartering companies, we believe that the terms of this arrangement are no worse than what we could have expected to obtain in an arms-length transaction.
Amounts due from Related Parties
At December 31, 2016, and 2015, Sandhill Group, LLC owed us $0.2 million and $0.3 million, respectively, for purchases of CO2. Also, at December 31, 2016 Poseidon Oil Pipeline Company, LLC owed us $1.6 million for services rendered.
Transactions with Unconsolidated Affiliates
Poseidon
As part of our Enterprise acquisition, we became the operator of Poseidon in the third quarter of 2015. We provide management, administrative and pipeline operator services to Poseidon under an Operation and Management Agreement . Currently, that agreement renews automatically annually unless terminated by either party (as defined in the agreement). Our revenues for the year ended December 31, 2016 reflect $7.9 million of fees we earned through the provision of services under that agreement.
F-25
14. Supplemental Cash Flow Information
The following table provides information regarding the net changes in components of operating assets and liabilities:
Year Ended December 31, | |||||||||||
2016 | 2015 | 2014 | |||||||||
(Increase) decrease in: | |||||||||||
Accounts receivable | $ | (9,859 | ) | $ | 99,384 | $ | 95,014 | ||||
Inventories | (54,361 | ) | 3,811 | 38,501 | |||||||
Deferred charges | (3,902 | ) | (11,916 | ) | (8,935 | ) | |||||
Other current assets | 3,059 | 6,417 | 62,305 | ||||||||
Increase (decrease) in: | |||||||||||
Accounts payable | (17,426 | ) | (101,581 | ) | (73,307 | ) | |||||
Accrued liabilities | (8,161 | ) | 9,257 | (35,624 | ) | ||||||
Net changes in components of operating assets and liabilities | $ | (90,650 | ) | $ | 5,372 | $ | 77,954 | ||||
Payments of interest and commitment fees, net of amounts capitalized, were $157.4 million, $86.8 million and $74.8 million during the years ended December 31, 2016, 2015 and 2014, respectively. We capitalized interest of $26.6 million, $17.1 million and $13.8 million during the years ended December 31, 2016, 2015 and 2014.
During the years ended December 31, 2016, 2015 and 2014, we paid taxes of $1.3 million, $0.9 million and $0.8 million.
At December 31, 2016, 2015 and 2014, we had incurred liabilities for fixed and intangible asset additions totaling $33.7 million, $68.6 million and $61.2 million, respectively, which had not been paid at the end of the year. Therefore, these amounts were not included in the caption “Payments to acquire fixed and intangible assets” under Cash Flows from Investing Activities in the Consolidated Statements of Cash Flows.
At December 31, 2016, 2015, and 2014, we had incurred liabilities for other asset additions totaling $0.7 million, $0.3 million and $9.4 million, respectively, that had not been paid at the end of the year, and, therefore, were not included in the caption "Other, net" under Cash Flows from Investing Activities in the Consolidated Statements of Cash Flows.
During the year ended December 31, 2015, as a result of our Enterprise acquisition, we acquired the 50% ownership interest in each of CHOPS and SEKCO as previously held by Enterprise, resulting in 100% ownership interest by us in each of these subsidiaries. As a result, we recorded a one-time $332.4 million non-cash gain from the step up in basis in our historical 50% ownership interest in each of CHOPS and SEKCO to fair value (resulting from the fair value assigned to the 50% ownership interest in each of CHOPS and SEKCO that we acquired from Enterprise, as derived from the preliminary purchase price allocation). This also results in the consolidation of CHOPS and SEKCO by us, resulting in the inclusion of the operating assets and liabilities on our Consolidated Balance Sheet. As 50% of the operating assets and liabilities of CHOPS and SEKCO were based on our historical interest with no cash impact, these amounts relating to our historical interest were not included in net changes in components of operating assets and liabilities in the Consolidated Statements of Cash Flows in 2015.
15. Equity-Based Compensation Plans
2010 Long Term Incentive Plan
In 2010, we adopted the 2010 Long-Term Incentive Plan (the “2010 Plan”). The 2010 Plan provides for the awards of phantom units and distribution equivalent rights to members of our board of directors, and employees who provide services to us. Phantom units are notional units representing unfunded and unsecured promises to pay to the participant a specified amount of cash based on the market value of our common units should specified vesting requirements be met. Distribution equivalent rights (“DERs”) are tandem rights to receive on a quarterly basis a cash amount per phantom unit equal to the amount of cash distributions paid per common unit. The 2010 Plan is administered by the Governance, Compensation and Business Development Committee (the “G&C Committee”) of our board of directors. The G&C Committee (at its discretion) designates participants in the 2010 Plan, determines the types of awards to grant to participants, determines the number of units to be covered by any award, and determines the conditions and terms of any award including vesting, settlement and forfeiture conditions.
The compensation cost associated with the phantom units is re-measured each reporting period based on the market value of our common units, and is recognized over the vesting period. The liability recorded for the estimated amount to be paid to the participants under the 2010 LTIP is adjusted to recognize changes in the estimated compensation cost and vesting. Management’s estimates of the fair value of these awards granted in 2016 are adjusted for assumptions about expected
F-26
forfeitures of units prior to vesting. For our performance-based awards, our fair value estimates are weighted based on probabilities for each performance condition applicable to the award.
During 2016, we granted 339,584 phantom units with tandem DERs at a weighted average grant fair value of $30.71 per unit. During 2015, we granted 212,825 phantom units with tandem DERs at a weighted average grant date fair value of $44.95 per unit. The phantom units granted during 2016 and 2015 were both service-based and performance-based awards. The service-based awards vest on the third anniversary of the date of grant. Performance-based phantom unit awards granted in 2015 and 2016 will vest on the third anniversary of issuance, in an amount ranging from 50% to 150% of the targeted number of phantom units, if certain quarterly cash distribution per common unit targets are achieved in the fourth quarter of 2018 and 2019, respectively. If the quarterly cash distribution per common unit is below the threshold target, all of the performance-based phantom units granted will be forfeited.
During 2014, we granted 125,988 phantom units with tandem DERs at a weighted average grant date fair value of $54.14 per unit. These phantom units will vest in April 2017, the third anniversary of the date of grant, at 150% of the targeted number of phantom units due to the distribution per common unit target achieved in the fourth quarter of 2016.
A summary of our phantom unit activity for our service-based and performance-based awards is set forth below:
Service-Based Awards | Performance-Based Awards | ||||||||||||||||||||
Number of Phantom Units | Average Grant Date Fair Value | Total Value (in thousands) | Number of Phantom Units | Average Grant Date Fair Value | Total Value (in thousands) | ||||||||||||||||
Unvested at December 31, 2015 | 132,676 | $ | 48.09 | $ | 6,380 | 344,208 | $ | 47.78 | $ | 16,446 | |||||||||||
Granted | 84,997 | $ | 31.67 | 2,692 | 254,587 | $ | 30.38 | 7,734 | |||||||||||||
Forfeited | (3,117 | ) | $ | 45.88 | (143 | ) | (4,677 | ) | $ | 45.89 | (215 | ) | |||||||||
Settled | (33,326 | ) | $ | 47.19 | (1,573 | ) | (110,886 | ) | $ | 46.97 | (5,208 | ) | |||||||||
Unvested at December 31, 2016 | 181,230 | $ | 40.59 | $ | 7,356 | 483,232 | $ | 38.82 | $ | 18,757 | |||||||||||
At December 31, 2016, we estimated the unrecognized compensation cost of our phantom awards to be approximately $10.5 million to be recognized over a weighted average period of approximately 1.5 years. We recorded $8.9 million and $7.7 million of compensation expense for the years ended December 31, 2016 and 2015, respectively. Our liability for these awards totaled $13.6 million and $12.3 million at December 31, 2016 and 2015, respectively.
Equity-Based Compensation Plan Expense
Equity-based compensation expense from our continuing operations during the three years ended December 31, 2016 was as follows:
Expense Related to Equity-Based Compensation Plans | ||||||||||||
Consolidated Statement of Operations | 2016 | 2015 | 2014 | |||||||||
Supply and logistics operating costs | $ | 1,688 | $ | 1,185 | $ | 433 | ||||||
Marine transportation operating costs | 1,089 | 851 | 626 | |||||||||
Refinery services operating costs | 547 | 227 | (62 | ) | ||||||||
Offshore pipeline operating costs | 681 | 94 | — | |||||||||
General and administrative expenses | 4,575 | 4,565 | 5,824 | |||||||||
Total | $ | 8,580 | $ | 6,922 | $ | 6,821 | ||||||
F-27
16. Major Customers and Credit Risk
Due to the nature of our supply and logistics operations, a disproportionate percentage of our trade receivables constitute obligations of refiners, large crude oil producers and integrated oil companies. This industry concentration has the potential to impact our overall exposure to credit risk, either positively or negatively, in that our customers could be affected by similar changes in economic, industry or other conditions. However, we believe that the credit risk posed by this industry concentration is offset by the creditworthiness of our customer base. Our portfolio of accounts receivable is comprised in large part of accounts owed by integrated and large independent energy companies with stable payment histories. The credit risk related to contracts which are traded on the NYMEX is limited due to daily margin requirements and other NYMEX requirements.
We have established various procedures to manage our credit exposure, including initial credit approvals, credit limits, collateral requirements and rights of offset. Letters of credit, prepayments and guarantees are also utilized to limit credit risk to ensure that our established credit criteria are met.
During 2016, 2015 and 2014 our largest customer was Shell Oil Company, which accounted for 12% of total revenues for all years, respectively. The revenues from Shell Oil Company in all three years relate primarily to our supply and logistics operations.
17. Derivatives
Commodity Derivatives
We have exposure to commodity price changes related to our inventory and purchase commitments. We utilize derivative instruments (primarily futures and options contracts traded on the NYMEX) to hedge our exposure to commodity prices, primarily of crude oil, fuel oil and petroleum products. Our decision as to whether to designate derivative instruments as fair value hedges for accounting purposes relates to our expectations of the length of time we expect to have the commodity price exposure and our expectations as to whether the derivative contract will qualify as highly effective under accounting guidance in limiting our exposure to commodity price risk. Most of the petroleum products, including fuel oil that we supply cannot be hedged with a high degree of effectiveness with derivative contracts available on the NYMEX; therefore, we do not designate derivative contracts utilized to limit our price risk related to these products as hedges for accounting purposes. Typically we utilize crude oil and other petroleum products futures and option contracts to limit our exposure to the effect of fluctuations in petroleum products prices on the future sale of our inventory or commitments to purchase petroleum products, and we recognize any changes in fair value of the derivative contracts as increases or decreases in our cost of sales. The recognition of changes in fair value of the derivative contracts not designated as hedges for accounting purposes can occur in reporting periods that do not coincide with the recognition of gain or loss on the actual transaction being hedged. Therefore we will, on occasion, report gains or losses in one period that will be partially offset by gains or losses in a future period when the hedged transaction is completed.
We have designated certain crude oil futures contracts as hedges of crude oil inventory due to our expectation that these contracts will be highly effective in hedging our exposure to fluctuations in crude oil prices during the period that we expect to hold that inventory. We account for these derivative instruments as fair value hedges under the accounting guidance. Changes in the fair value of these derivative instruments designated as fair value hedges are used to offset related changes in the fair value of the hedged crude oil inventory. Any hedge ineffectiveness in these fair value hedges and any amounts excluded from effectiveness testing are recorded as a gain or loss in the Consolidated Statement of Operations.
In accordance with NYMEX requirements, we fund the margin associated with our loss positions on commodity derivative contracts traded on the NYMEX. The amount of the margin is adjusted daily based on the fair value of the commodity contracts. The margin requirements are intended to mitigate a party’s exposure to market volatility and the associated contracting party risk. We offset fair value amounts recorded for our NYMEX derivative contracts against margin funding as required by the NYMEX in Current Assets - Other in our Consolidated Balance Sheets.
F-28
At December 31, 2016, we had the following outstanding derivative commodity contracts that were entered into to economically hedge inventory or fixed price purchase commitments.
Sell (Short) Contracts | Buy (Long) Contracts | ||||||
Designated as hedges under accounting rules: | |||||||
Crude oil futures: | |||||||
Contract volumes (1,000 bbls) | 1,295 | — | |||||
Weighted average contract price per bbl | $ | 49.86 | — | ||||
Not qualifying or not designated as hedges under accounting rules: | |||||||
Crude oil futures: | |||||||
Contract volumes (1,000 bbls) | 1,413 | 1,349 | |||||
Weighted average contract price per bbl | $ | 50.61 | $ | 51.08 | |||
Crude oil swaps: | |||||||
Contract volumes (1,000 bbls) | — | — | |||||
Weighted average contract price per bbl | $ | — | — | ||||
Diesel futures: | |||||||
Contract volumes (1,000 bbls) | 13 | — | |||||
Weighted average contract price per gal | $ | 1.69 | $ | — | |||
#6 Fuel oil futures: | |||||||
Contract volumes (1,000 bbls) | 190 | 20 | |||||
Weighted average contract price per bbl | $ | 45.91 | $ | 47.62 | |||
Crude oil options: | |||||||
Contract volumes (1,000 bbls) | 35 | 5 | |||||
Weighted average premium received | $ | 1.57 | $ | 0.23 | |||
Financial Statement Impacts
The following table summarizes the accounting treatment and classification of our derivative instruments on our Consolidated Financial Statements.
Derivative Instrument | Hedged Risk | Impact of Unrealized Gains and Losses | ||||
Consolidated Balance Sheets | Consolidated Statements of Operations | |||||
Designated as hedges under accounting guidance: | ||||||
Crude oil futures contracts (fair value hedge) | Volatility in crude oil prices - effect on market value of inventory | Derivative is recorded in Other current assets (offset against margin deposits and offsetting change in fair value of inventory is recorded in Inventories | Excess, if any, over effective portion of hedge is recorded in Supply and logistics costs - product costs Effective portion is offset in cost of sales against change in value of inventory being hedged | |||
Not qualifying or not designated as hedges under accounting guidance: | ||||||
Commodity hedges consisting of crude oil, heating oil and natural gas futures and forward contracts and call options | Volatility in crude oil and petroleum products prices - effect on market value of inventory or purchase commitments | Derivative is recorded in Other current assets (offset against margin deposits) or Accrued liabilities | Entire amount of change in fair value of derivative is recorded in Supply and logistics costs - product costs | |||
Unrealized gains are subtracted from net income and unrealized losses are added to net income in determining cash flows from operating activities. To the extent that we have fair value hedges outstanding, the offsetting change recorded in the fair value of inventory is also eliminated from net income in determining cash flows from operating activities. Changes in margin deposits necessary to fund unrealized losses also affect cash flows from operating activities.
F-29
The following tables reflect the estimated fair value gain (loss) position of our derivatives at December 31, 2016 and 2015:
Fair Value of Derivative Assets and Liabilities
Fair Value | |||||||||||
Consolidated Balance Sheets Location | December 31, 2016 | December 31, 2015 | |||||||||
Asset Derivatives: | |||||||||||
Commodity derivatives—futures and call options (undesignated hedges): | |||||||||||
Gross amount of recognized assets | Current Assets - Other | $ | 443 | $ | 1,703 | ||||||
Gross amount offset in the Consolidated Balance Sheets | Current Assets - Other | (443 | ) | (388 | ) | ||||||
Net amount of assets presented in the Consolidated Balance Sheets | $ | — | $ | 1,315 | |||||||
Total asset derivatives | $ | — | $ | 1,315 | |||||||
Commodity derivatives—futures and call options (designated hedges): | |||||||||||
Gross amount of recognized assets | Current Assets - Other | $ | 3,321 | $ | — | ||||||
Gross amount offset in the Consolidated Balance Sheets | Current Assets - Other | (3,321 | ) | — | |||||||
Net amount of assets presented in the Consolidated Balance Sheets | $ | — | $ | — | |||||||
Liability Derivatives: | |||||||||||
Commodity derivatives—futures and call options (undesignated hedges): | |||||||||||
Gross amount of recognized liabilities | Current Assets - Other (1) | $ | (1,772 | ) | $ | (388 | ) | ||||
Gross amount offset in the Consolidated Balance Sheets | Current Assets - Other (1) | 1,772 | 388 | ||||||||
Net amount of liabilities presented in the Consolidated Balance Sheets | $ | — | $ | — | |||||||
Commodity derivatives—futures and call options (designated hedges): | |||||||||||
Gross amount of recognized liabilities | Current Assets - Other (1) | $ | (9,506 | ) | $ | (23 | ) | ||||
Gross amount offset in the Consolidated Balance Sheets | Current Assets - Other (1) | 7,589 | 23 | ||||||||
Net amount of liabilities presented in the Consolidated Balance Sheets | $ | (1,917 | ) | $ | — | ||||||
(1) | These derivative liabilities have been funded with margin deposits recorded in our Consolidated Balance Sheets under Current Assets - Other. |
Our accounting policy is to offset derivative assets and liabilities executed with the same counterparty when a master netting arrangement exists. Accordingly, we also offset derivative assets and liabilities with amounts associated with cash margin. Our exchange-traded derivatives are transacted through brokerage accounts and are subject to margin requirements as established by the respective exchange. On a daily basis, our account equity (consisting of the sum of our cash balance and the fair value of our open derivatives) is compared to our initial margin requirement resulting in the payment or return of variation margin. As of December 31, 2016, we had a net broker receivable of approximately $5.6 million (consisting of initial margin of $5.1 million increased by $0.5 million of variation margin). As of December 31, 2015, we had a net broker receivable of approximately $5.5 million (consisting of initial margin of $4.4 million increased by $1.1 million of variation margin). At December 31, 2016 and December 31, 2015, none of our outstanding derivatives contained credit-risk related contingent features that would result in a material adverse impact to us upon any change in our credit ratings.
F-30
Effect on Operating Results
Amount of Gain (Loss) Recognized in Income | |||||||||||
Supply & Logistics Product Costs | |||||||||||
Year Ended December 31, | |||||||||||
2016 | 2015 | 2014 | |||||||||
Commodity derivatives—futures and call options: | |||||||||||
Contracts designated as hedges under accounting guidance | $ | (13,195 | ) | $ | (1,101 | ) | $ | — | |||
Contracts not considered hedges under accounting guidance | (5,847 | ) | 16,026 | 35,468 | |||||||
Total derivatives | $ | (19,042 | ) | $ | 14,925 | $ | 35,468 | ||||
We have no derivative contracts with credit contingent features.
18. Fair-Value Measurements
We classify financial assets and liabilities into the following three levels based on the inputs used to measure fair value:
(1) Level 1 fair values are based on observable inputs such as quoted prices in active markets for identical assets and liabilities;
(2) Level 2 fair values are based on pricing inputs other than quoted prices in active markets for identical assets and liabilities and are either directly or indirectly observable as of the measurement date; and
(3) Level 3 fair values are based on unobservable inputs in which little or no market data exists.
As required by fair value accounting guidance, financial assets and liabilities are classified in their entirety based on the lowest level of input that is significant to the fair value measurement.
Our assessment of the significance of a particular input to the fair value requires judgment and may affect the placement of assets and liabilities within the fair value hierarchy levels.
The following table sets forth by level within the fair value hierarchy our financial assets and liabilities that were accounted for at fair value on a recurring basis as of December 31, 2016 and 2015.
December 31, 2016 | December 31, 2015 | ||||||||||||||||||||||
Recurring Fair Value Measures | Level 1 | Level 2 | Level 3 | Level 1 | Level 2 | Level 3 | |||||||||||||||||
Commodity derivatives: | |||||||||||||||||||||||
Assets | $ | 3,764 | $ | — | $ | — | $ | 1,703 | $ | — | $ | — | |||||||||||
Liabilities | $ | (11,278 | ) | $ | — | $ | — | $ | (411 | ) | $ | — | $ | — | |||||||||
Our commodity derivatives include exchange-traded futures and exchange-traded options contracts. The fair value of these exchange-traded derivative contracts is based on unadjusted quoted prices in active markets and is, therefore, included in Level 1 of the fair value hierarchy.
See Note 17 for additional information on our derivative instruments.
F-31
Nonfinancial Assets and Liabilities
We utilize fair value on a non-recurring basis to perform impairment tests as required on our property, plant and equipment, goodwill and intangible assets. Assets and liabilities acquired in business combinations are recorded at their fair value as of the date of acquisition. The inputs used to determine such fair value are primarily based upon internally developed cash flow models and would generally be classified in Level 3, in the event that we were required to measure and record such assets within our Consolidated Financial Statements. Additionally, we use fair value to determine the inception value of our asset retirement obligations. The inputs used to determine such fair value are primarily based upon costs incurred historically for similar work, as well as estimates from independent third parties for costs that would be incurred to restore leased property to the contractually stipulated condition, and would generally be classified in Level 3.
Other Fair Value Measurements
We believe the debt outstanding under our credit facility approximates fair value as the stated rate of interest approximates current market rates of interest for similar instruments with comparable maturities. At December 31, 2016 our senior unsecured notes had a carrying value of $1.8 billion and a fair value of $1.9 billion, compared to $1.8 billion and $1.5 billion, respectively at December 31, 2015. The fair value of the senior unsecured notes is determined based on trade information in the financial markets of our public debt and is considered a Level 2 fair value measurement.
Additionally, we recorded the fair value of net assets acquired and liabilities assumed in connection with our Enterprise acquisition as of the acquisition date of July 24, 2015. The fair value measurements were primarily based on significant unobservable inputs (Level 3) developed using company-specific information. See Note 3 for further information associated with the values recorded in our Enterprise acquisition.
Additionally, the fair value measurements, using unobservable (Level 3) inputs, used in recording the fair value of the net assets acquired and liabilities assumed of CHOPS and SEKCO (which we now own 100% interest in and consolidate given the respective 50% ownership interest acquired from Enterprise for each of these subsidiaries) as a result of our Enterprise acquisition were used to calculate the effects of the re-measurement of our pre-acquisition historical interest in CHOPS and SEKCO at fair value, based on accounting guidance involving step acquisitions as discussed in ASC 805-10-25.
19. Commitments and Contingencies
Commitments and Guarantees
Our office lease for our corporate headquarters extends until October 31, 2022. To transport products, we lease tractors, trailers and railcars. In addition, we lease tanks and terminals for the storage of crude oil, petroleum products, NaHS and caustic soda. Additionally, we lease a segment of pipeline where under the terms we make payments based on throughput. We have no minimum volumetric or financial requirements remaining on our pipeline lease.
The future minimum rental payments under all non-cancelable operating leases as of December 31, 2016, were as follows (in thousands):
Office Space | Transportation Equipment | Terminals and Tanks | Total | ||||||||||||
2017 | $ | 3,135 | $ | 12,119 | $ | 10,021 | $ | 25,275 | |||||||
2018 | 3,117 | 10,297 | 7,451 | 20,865 | |||||||||||
2019 | 3,064 | 9,731 | 7,506 | 20,301 | |||||||||||
2020 | 3,071 | 6,787 | 7,450 | 17,308 | |||||||||||
2021 | 2,302 | 2,166 | 5,153 | 9,621 | |||||||||||
2021 and thereafter | 2,256 | 2,622 | 57,285 | 62,163 | |||||||||||
Total minimum lease obligations | $ | 16,945 | $ | 43,722 | $ | 94,866 | $ | 155,533 | |||||||
Total operating lease expense from our continuing operations was as follows (in thousands):
Year Ended December 31, 2016 | $ | 41,906 | |
Year Ended December 31, 2015 | $ | 36,833 | |
Year Ended December 31, 2014 | $ | 37,941 | |
F-32
We are subject to various environmental laws and regulations. Policies and procedures are in place to monitor compliance and to detect and address any releases of crude oil from our pipelines or other facilities; however no assurance can be made that such environmental releases may not substantially affect our business.
Other Matters
Our facilities and operations may experience damage as a result of an accident or natural disaster. These hazards can cause personal injury or loss of life, severe damage to and destruction of property and equipment, pollution or environmental damage and suspension of operations. We maintain insurance that we consider adequate to cover our operations and properties, in amounts we consider reasonable. Our insurance does not cover every potential risk associated with operating our facilities, including the potential loss of significant revenues. The occurrence of a significant event that is not fully-insured could materially and adversely affect our results of operations. We believe we are adequately insured for public liability and property damage to others and that our coverage is similar to other companies with operations similar to ours. No assurance can be made that we will be able to maintain adequate insurance in the future at premium rates that we consider reasonable.
We are subject to lawsuits in the normal course of business and examination by tax and other regulatory authorities. We do not expect such matters presently pending to have a material effect on our financial position, results of operations or cash flows.
20. Income Taxes
We are not a taxable entity for federal income tax purposes. As such, we do not directly pay federal income taxes. Other than with respect to our corporate subsidiaries and the Texas Margin Tax, our taxable income or loss is includible in the federal income tax returns of each of our partners.
A few of our operations are owned by wholly-owned corporate subsidiaries that are taxable as corporations. We pay federal and state income taxes on these operations.
Our income tax (benefit) expense is as follows:
Year Ended December 31, | |||||||||||
2016 | 2015 | 2014 | |||||||||
Current: | |||||||||||
Federal | $ | — | $ | — | $ | — | |||||
State | 1,200 | 1,200 | 1,100 | ||||||||
Total current income tax expense (benefit) | $ | 1,200 | $ | 1,200 | $ | 1,100 | |||||
Deferred: | |||||||||||
Federal | $ | 1,862 | $ | 2,478 | $ | 1,508 | |||||
State | 280 | 309 | 237 | ||||||||
Total deferred income tax expense (benefit) | $ | 2,142 | $ | 2,787 | $ | 1,745 | |||||
Total income tax expense | $ | 3,342 | $ | 3,987 | $ | 2,845 | |||||
F-33
Deferred income taxes relate to temporary differences based on tax laws and statutory rates in effect at the balance sheet date. Deferred tax assets and liabilities consist of the following:
December 31, | |||||||
2016 | 2015 | ||||||
Deferred tax assets: | |||||||
Net operating loss carryforwards | $ | 10,787 | $ | 9,542 | |||
Total long-term deferred tax asset | 10,787 | 9,542 | |||||
Valuation allowances | (869 | ) | (787 | ) | |||
Total deferred tax assets | $ | 9,918 | $ | 8,755 | |||
Deferred tax liabilities: | |||||||
Long-term: | |||||||
Fixed assets | $ | (4,480 | ) | $ | (4,384 | ) | |
Intangible assets | (20,693 | ) | (17,473 | ) | |||
Other | (716 | ) | (729 | ) | |||
Total long-term liability | (25,889 | ) | (22,586 | ) | |||
Total deferred tax liabilities | $ | (25,889 | ) | $ | (22,586 | ) | |
Total net deferred tax liability | $ | (15,971 | ) | $ | (13,831 | ) | |
We record a valuation allowance when it is more likely than not that some portion or all of the deferred tax assets will not be realized. The ultimate realization of the deferred tax assets depends on the ability to generate sufficient taxable income of the appropriate character in the future and in the appropriate taxing jurisdictions.
Our income tax expense (benefit) varies from the amount that would result from applying the federal statutory income tax rate to income from continuing operations before income taxes as follows:
Year Ended December 31, | |||||||||||
2016 | 2015 | 2014 | |||||||||
Income from continuing operations before income taxes | $ | 114,424 | $ | 425,572 | $ | 109,047 | |||||
Partnership income not subject to tax | (109,111 | ) | (418,500 | ) | (104,751 | ) | |||||
Income subject to income taxes | $ | 5,313 | $ | 7,072 | $ | 4,296 | |||||
Tax expense at federal statutory rate | $ | 1,860 | $ | 2,475 | $ | 1,504 | |||||
State income taxes, net of federal tax | 949 | 928 | 992 | ||||||||
Return to provision, federal and state | (198 | ) | (193 | ) | (232 | ) | |||||
Other | 731 | 777 | 581 | ||||||||
Income tax expense | $ | 3,342 | $ | 3,987 | $ | 2,845 | |||||
Effective tax rate on income from continuing operations before income taxes | 3 | % | 1 | % | 3 | % | |||||
At December 31, 2016, 2015 and 2014, we had no uncertain tax positions.
F-34
21. Quarterly Financial Data (Unaudited)
The table below summarizes our unaudited quarterly financial data for 2016 and 2015.
2016 Quarters | |||||||||||||||
First | Second | Third | Fourth | ||||||||||||
Revenues from continuing operations | $ | 378,414 | $ | 445,976 | $ | 460,050 | $ | 428,053 | |||||||
Operating income | $ | 59,848 | $ | 47,988 | $ | 55,179 | $ | 43,412 | |||||||
Net income | $ | 35,177 | $ | 23,601 | $ | 31,983 | $ | 20,321 | |||||||
Net loss attributable to noncontrolling interest | $ | 126 | $ | 126 | $ | 118 | $ | 1,797 | |||||||
Net income attributable to Genesis Energy, L.P. | $ | 35,303 | $ | 23,727 | $ | 32,101 | $ | 22,118 | |||||||
Basic and diluted net income per common unit: | |||||||||||||||
Net income per common unit | $ | 0.32 | $ | 0.22 | $ | 0.28 | $ | 0.19 | |||||||
Cash distributions per common unit (1) | $ | 0.6550 | $ | 0.6725 | $ | 0.6900 | $ | 0.7000 | |||||||
2015 Quarters | |||||||||||||||
First | Second | Third | Fourth | ||||||||||||
Revenues from continuing operations | $ | 526,857 | $ | 656,327 | $ | 572,334 | $ | 491,011 | |||||||
Operating income | $ | 24,819 | $ | 29,380 | $ | 44,798 | $ | 57,870 | |||||||
Net income | $ | 20,215 | $ | 11,665 | $ | 363,409 | $ | 26,296 | |||||||
Net loss (income) attributable to noncontrolling interest | $ | — | $ | — | $ | (195 | ) | $ | 1,138 | ||||||
Net income attributable to Genesis Energy, L.P. | $ | 20,215 | $ | 11,665 | $ | 363,214 | $ | 27,434 | |||||||
Basic and diluted net income per common unit: | |||||||||||||||
Net income per common unit | $ | 0.21 | $ | 0.12 | $ | 3.38 | $ | 0.24 | |||||||
Cash distributions per common unit (1) | $ | 0.5950 | $ | 0.6100 | $ | 0.6250 | $ | 0.6400 | |||||||
(1) | Represents cash distributions declared and paid in the applicable period. |
22. Condensed Consolidating Financial Information
Our $1.8 billion aggregate principal amount of senior unsecured notes co-issued by Genesis Energy, L.P. and Genesis Energy Finance Corporation are fully and unconditionally guaranteed jointly and severally by all of Genesis Energy, L.P.’s current and future 100% owned domestic subsidiaries, except Genesis Free State Pipeline, LLC, Genesis NEJD Pipeline, LLC and certain other minor subsidiaries. Genesis NEJD Pipeline, LLC is 100% owned by Genesis Energy, L.P., the parent company. The remaining non-guarantor subsidiaries are owned by Genesis Crude Oil, L.P., a guarantor subsidiary. Genesis Energy Finance Corporation has no independent assets or operations. See Note 10 for additional information regarding our consolidated debt obligations.
The following is condensed consolidating financial information for Genesis Energy, L.P. and subsidiary guarantors:
F-35
Condensed Consolidating Balance Sheet | |||||||||||||||||||||||
December 31, 2016 | |||||||||||||||||||||||
Genesis Energy, L.P. (Parent and Co-Issuer) | Genesis Energy Finance Corporation (Co-Issuer) | Guarantor Subsidiaries | Non-Guarantor Subsidiaries | Eliminations | Genesis Energy, L.P. Consolidated | ||||||||||||||||||
ASSETS | |||||||||||||||||||||||
Current assets: | |||||||||||||||||||||||
Cash and cash equivalents | $ | 6 | $ | — | $ | 6,360 | $ | 663 | $ | — | $ | 7,029 | |||||||||||
Other current assets | 50 | — | 340,555 | 12,237 | (302 | ) | 352,540 | ||||||||||||||||
Total current assets | 56 | — | 346,915 | 12,900 | (302 | ) | 359,569 | ||||||||||||||||
Fixed Assets, at cost | — | — | 4,685,811 | 77,585 | — | 4,763,396 | |||||||||||||||||
Less: Accumulated depreciation | — | — | (524,315 | ) | (24,217 | ) | — | (548,532 | ) | ||||||||||||||
Net fixed assets | — | — | 4,161,496 | 53,368 | — | 4,214,864 | |||||||||||||||||
Goodwill | — | — | 325,046 | — | — | 325,046 | |||||||||||||||||
Other assets, net | 10,696 | — | 390,214 | 133,980 | (140,533 | ) | 394,357 | ||||||||||||||||
Advances to affiliates | 2,650,930 | — | — | 73,295 | (2,724,225 | ) | — | ||||||||||||||||
Equity investees and other investments | — | — | 408,756 | — | — | 408,756 | |||||||||||||||||
Investments in subsidiaries | 2,594,882 | — | 80,735 | — | (2,675,617 | ) | — | ||||||||||||||||
Total assets | $ | 5,256,564 | $ | — | $ | 5,713,162 | $ | 273,543 | $ | (5,540,677 | ) | $ | 5,702,592 | ||||||||||
LIABILITIES AND PARTNERS’ CAPITAL | |||||||||||||||||||||||
Current liabilities | $ | 34,864 | $ | — | $ | 211,591 | $ | 14,505 | $ | (157 | ) | $ | 260,803 | ||||||||||
Senior secured credit facilities | 1,278,200 | — | — | — | — | 1,278,200 | |||||||||||||||||
Senior unsecured notes | 1,813,169 | — | — | — | — | 1,813,169 | |||||||||||||||||
Deferred tax liabilities | — | — | 25,889 | — | — | 25,889 | |||||||||||||||||
Advances from affiliates | — | — | 2,724,224 | — | (2,724,224 | ) | — | ||||||||||||||||
Other liabilities | — | — | 165,266 | 179,592 | (140,377 | ) | 204,481 | ||||||||||||||||
Total liabilities | 3,126,233 | — | 3,126,970 | 194,097 | (2,864,758 | ) | 3,582,542 | ||||||||||||||||
Partners’ capital, common units | 2,130,331 | — | 2,586,192 | 89,727 | (2,675,919 | ) | 2,130,331 | ||||||||||||||||
Noncontrolling interests | — | — | — | (10,281 | ) | — | (10,281 | ) | |||||||||||||||
Total liabilities and partners’ capital | $ | 5,256,564 | $ | — | $ | 5,713,162 | $ | 273,543 | $ | (5,540,677 | ) | $ | 5,702,592 | ||||||||||
F-36
Condensed Consolidating Balance Sheet | |||||||||||||||||||||||
December 31, 2015 | |||||||||||||||||||||||
Genesis Energy, L.P. (Parent and Co-Issuer) | Genesis Energy Finance Corporation (Co-Issuer) | Guarantor Subsidiaries | Non-Guarantor Subsidiaries | Eliminations | Genesis Energy, L.P. Consolidated | ||||||||||||||||||
ASSETS | |||||||||||||||||||||||
Current assets: | |||||||||||||||||||||||
Cash and cash equivalents | $ | 6 | $ | — | $ | 8,288 | $ | 2,601 | $ | — | $ | 10,895 | |||||||||||
Other current assets | 50 | — | 285,313 | 10,422 | (364 | ) | 295,421 | ||||||||||||||||
Total current assets | 56 | — | 293,601 | 13,023 | (364 | ) | 306,316 | ||||||||||||||||
Fixed Assets, at cost | — | — | 4,232,641 | 77,585 | — | 4,310,226 | |||||||||||||||||
Less: Accumulated depreciation | — | — | (356,530 | ) | (21,717 | ) | — | (378,247 | ) | ||||||||||||||
Net fixed assets | — | — | 3,876,111 | 55,868 | — | 3,931,979 | |||||||||||||||||
Goodwill | — | — | 325,046 | — | — | 325,046 | |||||||||||||||||
Other assets, net | 13,140 | — | 394,294 | 140,409 | (125,977 | ) | 421,866 | ||||||||||||||||
Advances to affiliates | 2,619,493 | — | — | 47,034 | (2,666,527 | ) | — | ||||||||||||||||
Equity investees and other investments | — | — | 474,392 | — | — | 474,392 | |||||||||||||||||
Investments in subsidiaries | 2,353,804 | — | 90,741 | — | (2,444,545 | ) | — | ||||||||||||||||
Total assets | $ | 4,986,493 | $ | — | $ | 5,454,185 | $ | 256,334 | $ | (5,237,413 | ) | $ | 5,459,599 | ||||||||||
LIABILITIES AND PARTNERS’ CAPITAL | |||||||||||||||||||||||
Current liabilities | $ | 35,338 | $ | — | $ | 267,294 | $ | — | $ | (496 | ) | $ | 302,136 | ||||||||||
Senior secured credit facilities | 1,115,000 | — | — | — | — | 1,115,000 | |||||||||||||||||
Senior unsecured notes | 1,807,054 | — | — | — | — | 1,807,054 | |||||||||||||||||
Deferred tax liabilities | — | — | 22,586 | — | — | 22,586 | |||||||||||||||||
Advances from affiliates | — | — | 2,666,527 | — | (2,666,527 | ) | — | ||||||||||||||||
Other liabilities | — | — | 150,877 | 167,006 | (125,811 | ) | 192,072 | ||||||||||||||||
Total liabilities | 2,957,392 | — | 3,107,284 | 167,006 | (2,792,834 | ) | 3,438,848 | ||||||||||||||||
Partners' capital | 2,029,101 | — | 2,346,901 | 97,678 | (2,444,579 | ) | 2,029,101 | ||||||||||||||||
Noncontrolling interests | — | — | — | (8,350 | ) | — | (8,350 | ) | |||||||||||||||
Total liabilities and partners’ capital | $ | 4,986,493 | $ | — | $ | 5,454,185 | $ | 256,334 | $ | (5,237,413 | ) | $ | 5,459,599 | ||||||||||
F-37
Condensed Consolidating Statement of Operations | |||||||||||||||||||||||
Year Ended December 31, 2016 | |||||||||||||||||||||||
Genesis Energy, L.P. (Parent and Co-Issuer) | Genesis Energy Finance Corporation (Co-Issuer) | Guarantor Subsidiaries | Non-Guarantor Subsidiaries | Eliminations | Genesis Energy, L.P. Consolidated | ||||||||||||||||||
REVENUES: | |||||||||||||||||||||||
Offshore pipeline transportation services | $ | — | $ | — | $ | 334,679 | $ | — | $ | — | $ | 334,679 | |||||||||||
Refinery services | — | — | 171,389 | 7,873 | (7,759 | ) | 171,503 | ||||||||||||||||
Marine transportation | — | — | 213,021 | — | — | 213,021 | |||||||||||||||||
Supply and logistics | — | — | 972,794 | 20,496 | — | 993,290 | |||||||||||||||||
Total revenues | — | — | 1,691,883 | 28,369 | (7,759 | ) | 1,712,493 | ||||||||||||||||
COSTS AND EXPENSES: | |||||||||||||||||||||||
Supply and logistics costs | — | — | 923,567 | 1,060 | — | 924,627 | |||||||||||||||||
Marine transportation costs | — | — | 142,551 | — | — | 142,551 | |||||||||||||||||
Refinery services operating costs | — | — | 90,711 | 8,491 | (7,759 | ) | 91,443 | ||||||||||||||||
Offshore pipeline transportation operating costs | — | — | 68,791 | 10,833 | — | 79,624 | |||||||||||||||||
General and administrative | — | — | 45,625 | — | — | 45,625 | |||||||||||||||||
Depreciation and amortization | — | — | 219,696 | 2,500 | — | 222,196 | |||||||||||||||||
Total costs and expenses | — | — | 1,490,941 | 22,884 | (7,759 | ) | 1,506,066 | ||||||||||||||||
OPERATING INCOME | — | — | 200,942 | 5,485 | — | 206,427 | |||||||||||||||||
Equity in earnings of equity investees | — | — | 47,944 | — | — | 47,944 | |||||||||||||||||
Equity in earnings of subsidiaries | 253,048 | — | (6,744 | ) | — | (246,304 | ) | — | |||||||||||||||
Interest (expense) income, net | (139,799 | ) | — | 14,407 | (14,555 | ) | — | (139,947 | ) | ||||||||||||||
Income before income taxes | 113,249 | — | 256,549 | (9,070 | ) | (246,304 | ) | 114,424 | |||||||||||||||
Income tax expense | — | — | (3,337 | ) | (5 | ) | — | (3,342 | ) | ||||||||||||||
NET INCOME | 113,249 | — | 253,212 | (9,075 | ) | (246,304 | ) | 111,082 | |||||||||||||||
Net loss attributable to noncontrolling interest | — | — | — | 2,167 | — | 2,167 | |||||||||||||||||
NET INCOME ATTRIBUTABLE TO GENESIS ENERGY, L.P. | $ | 113,249 | $ | — | $ | 253,212 | $ | (6,908 | ) | $ | (246,304 | ) | $ | 113,249 | |||||||||
F-38
Condensed Consolidating Statement of Operations | |||||||||||||||||||||||
Year Ended December 31, 2015 | |||||||||||||||||||||||
Genesis Energy, L.P. (Parent and Co-Issuer) | Genesis Energy Finance Corporation (Co-Issuer) | Guarantor Subsidiaries | Non-Guarantor Subsidiaries | Eliminations | Genesis Energy, L.P. Consolidated | ||||||||||||||||||
REVENUES: | |||||||||||||||||||||||
Offshore pipeline transportation services | $ | — | $ | — | $ | 137,681 | $ | 2,549 | $ | — | $ | 140,230 | |||||||||||
Refinery services | — | — | 175,132 | 11,942 | (9,194 | ) | 177,880 | ||||||||||||||||
Marine transportation | — | — | 238,757 | — | — | 238,757 | |||||||||||||||||
Supply and logistics | — | — | 1,665,917 | 23,745 | — | 1,689,662 | |||||||||||||||||
Total revenues | — | — | 2,217,487 | 38,236 | (9,194 | ) | 2,246,529 | ||||||||||||||||
COSTS AND EXPENSES: | |||||||||||||||||||||||
Supply and logistics costs | — | — | 1,601,972 | 836 | — | 1,602,808 | |||||||||||||||||
Marine transportation costs | — | — | 135,200 | — | — | 135,200 | |||||||||||||||||
Refinery services operating costs | — | — | 94,241 | 11,759 | (9,194 | ) | 96,806 | ||||||||||||||||
Offshore pipeline transportation operating costs | — | — | 38,459 | 1,254 | — | 39,713 | |||||||||||||||||
General and administrative | — | — | 64,995 | — | — | 64,995 | |||||||||||||||||
Depreciation and amortization | — | — | 141,785 | 8,355 | — | 150,140 | |||||||||||||||||
Total costs and expenses | — | — | 2,076,652 | 22,204 | (9,194 | ) | 2,089,662 | ||||||||||||||||
OPERATING INCOME | — | — | 140,835 | 16,032 | — | 156,867 | |||||||||||||||||
Equity in earnings of equity investees | — | — | 54,450 | — | — | 54,450 | |||||||||||||||||
Equity in earnings of subsidiaries | 542,226 | — | 2,053 | — | (544,279 | ) | — | ||||||||||||||||
Interest (expense) income, net | (100,494 | ) | — | 15,042 | (15,144 | ) | — | (100,596 | ) | ||||||||||||||
Gain on basis step up on historical interest | — | — | 332,380 | — | — | 332,380 | |||||||||||||||||
Other income/(expense), net | (19,204 | ) | — | 1,675 | — | — | (17,529 | ) | |||||||||||||||
Income before income taxes | 422,528 | — | 546,435 | 888 | (544,279 | ) | 425,572 | ||||||||||||||||
Income tax benefit (expense) | — | — | (4,036 | ) | 49 | — | (3,987 | ) | |||||||||||||||
NET INCOME | 422,528 | — | 542,399 | 937 | (544,279 | ) | 421,585 | ||||||||||||||||
Net loss attributable to noncontrolling interest | — | — | — | 943 | — | 943 | |||||||||||||||||
NET INCOME ATTRIBUTABLE TO GENESIS ENERGY, L.P. | $ | 422,528 | $ | — | $ | 542,399 | $ | 1,880 | $ | (544,279 | ) | $ | 422,528 | ||||||||||
F-39
Condensed Consolidating Statement of Operations | |||||||||||||||||||||||
Year Ended December 31, 2014 | |||||||||||||||||||||||
Genesis Energy, L.P. (Parent and Co-Issuer) | Genesis Energy Finance Corporation (Co-Issuer) | Guarantor Subsidiaries | Non-Guarantor Subsidiaries | Eliminations | Genesis Energy, L.P. Consolidated | ||||||||||||||||||
REVENUES: | |||||||||||||||||||||||
Offshore pipeline transportation services | $ | — | $ | — | $ | 3,296 | $ | — | $ | — | $ | 3,296 | |||||||||||
Refinery services | — | — | 202,250 | 18,289 | (13,138 | ) | 207,401 | ||||||||||||||||
Marine transportation | — | — | 229,282 | — | — | 229,282 | |||||||||||||||||
Supply and logistics | — | — | 3,381,419 | 24,766 | — | 3,406,185 | |||||||||||||||||
Total revenues | — | — | 3,816,247 | 43,055 | (13,138 | ) | 3,846,164 | ||||||||||||||||
COSTS AND EXPENSES: | |||||||||||||||||||||||
Supply and logistics costs | — | — | 3,305,691 | 857 | — | 3,306,548 | |||||||||||||||||
Marine transportation costs | — | — | 142,793 | — | — | 142,793 | |||||||||||||||||
Refinery services operating costs | — | — | 117,788 | 17,393 | (13,780 | ) | 121,401 | ||||||||||||||||
Offshore pipeline transportation operating costs | — | — | 1,271 | — | — | 1,271 | |||||||||||||||||
General and administrative | — | — | 50,692 | — | — | 50,692 | |||||||||||||||||
Depreciation and amortization | — | — | 88,368 | 2,540 | — | 90,908 | |||||||||||||||||
Total costs and expenses | — | — | 3,706,603 | 20,790 | (13,780 | ) | 3,713,613 | ||||||||||||||||
OPERATING INCOME | — | — | 109,644 | 22,265 | 642 | 132,551 | |||||||||||||||||
Equity in earnings of equity investees | — | — | 43,135 | — | — | 43,135 | |||||||||||||||||
Equity in earnings of subsidiaries | 172,828 | — | 6,952 | — | (179,780 | ) | — | ||||||||||||||||
Interest (expense) income, net | (66,626 | ) | — | 15,662 | (15,675 | ) | — | (66,639 | ) | ||||||||||||||
Income before income taxes | 106,202 | — | 175,393 | 6,590 | (179,138 | ) | 109,047 | ||||||||||||||||
Income tax expense | — | — | (3,030 | ) | 185 | — | (2,845 | ) | |||||||||||||||
NET INCOME | $ | 106,202 | $ | — | $ | 172,363 | $ | 6,775 | $ | (179,138 | ) | $ | 106,202 | ||||||||||
F-40
Condensed Consolidating Statement of Cash Flows | |||||||||||||||||||||||
Year Ended December 31, 2016 | |||||||||||||||||||||||
Genesis Energy, L.P. (Parent and Co-Issuer) | Genesis Energy Finance Corporation (Co-Issuer) | Guarantor Subsidiaries | Non-Guarantor Subsidiaries | Eliminations | Genesis Energy, L.P. Consolidated | ||||||||||||||||||
Net cash (used in) provided by operating activities | $ | 179,853 | $ | — | $ | 398,320 | $ | 9,586 | $ | (289,421 | ) | $ | 298,338 | ||||||||||
CASH FLOWS FROM INVESTING ACTIVITIES: | |||||||||||||||||||||||
Payments to acquire fixed and intangible assets | — | — | (463,100 | ) | — | — | (463,100 | ) | |||||||||||||||
Cash distributions received from equity investees - return of investment | — | — | 21,353 | — | — | 21,353 | |||||||||||||||||
Investments in equity investees | (298,020 | ) | — | — | — | 298,020 | — | ||||||||||||||||
Acquisitions | — | — | (25,394 | ) | — | — | (25,394 | ) | |||||||||||||||
Intercompany transfers | (31,436 | ) | — | — | — | 31,436 | — | ||||||||||||||||
Repayments on loan to non-guarantor subsidiary | — | — | 6,113 | — | (6,113 | ) | — | ||||||||||||||||
Contributions in aid of construction costs | — | — | 13,374 | — | — | 13,374 | |||||||||||||||||
Proceeds from asset sales | — | — | 3,609 | — | — | 3,609 | |||||||||||||||||
Other, net | — | — | (151 | ) | — | — | (151 | ) | |||||||||||||||
Net cash (used in) provided by investing activities | (329,456 | ) | — | (444,196 | ) | — | 323,343 | (450,309 | ) | ||||||||||||||
CASH FLOWS FROM FINANCING ACTIVITIES: | |||||||||||||||||||||||
Borrowings on senior secured credit facility | 1,115,800 | — | — | — | — | 1,115,800 | |||||||||||||||||
Repayments on senior secured credit facility | (952,600 | ) | — | — | — | — | (952,600 | ) | |||||||||||||||
Debt issuance costs | (1,578 | ) | — | — | — | — | (1,578 | ) | |||||||||||||||
Intercompany transfers | — | — | 57,701 | (26,264 | ) | (31,437 | ) | — | |||||||||||||||
Issuance of common units for cash, net | 298,020 | — | 298,020 | — | (298,020 | ) | 298,020 | ||||||||||||||||
Distributions to partners/owners | (310,039 | ) | — | (310,039 | ) | — | 310,039 | (310,039 | ) | ||||||||||||||
Contributions from noncontrolling interest | — | — | — | 236 | — | 236 | |||||||||||||||||
Other, net | — | — | (1,734 | ) | 14,504 | (14,504 | ) | (1,734 | ) | ||||||||||||||
Net cash provided by financing activities | 149,603 | — | 43,948 | (11,524 | ) | (33,922 | ) | 148,105 | |||||||||||||||
Net decrease in cash and cash equivalents | — | — | (1,928 | ) | (1,938 | ) | — | (3,866 | ) | ||||||||||||||
Cash and cash equivalents at beginning of period | 6 | — | 8,288 | 2,601 | — | 10,895 | |||||||||||||||||
Cash and cash equivalents at end of period | $ | 6 | $ | — | $ | 6,360 | $ | 663 | $ | — | $ | 7,029 | |||||||||||
F-41
Condensed Consolidating Statement of Cash Flows | |||||||||||||||||||||||
Year Ended December 31, 2015 | |||||||||||||||||||||||
Genesis Energy, L.P. (Parent and Co-Issuer) | Genesis Energy Finance Corporation (Co-Issuer) | Guarantor Subsidiaries | Non-Guarantor Subsidiaries | Eliminations | Genesis Energy, L.P. Consolidated | ||||||||||||||||||
Net cash (used in) provided by operating activities | $ | (14,082 | ) | $ | — | $ | 308,144 | $ | 45,125 | $ | (49,651 | ) | $ | 289,536 | |||||||||
CASH FLOWS FROM INVESTING ACTIVITIES: | |||||||||||||||||||||||
Payments to acquire fixed and intangible assets | — | — | (495,774 | ) | — | — | (495,774 | ) | |||||||||||||||
Cash distributions received from equity investees - return of investment | 186,026 | — | 25,645 | — | (186,026 | ) | 25,645 | ||||||||||||||||
Investments in equity investees | (633,761 | ) | — | (3,045 | ) | — | 633,761 | (3,045 | ) | ||||||||||||||
Acquisitions | — | — | (1,520,299 | ) | — | — | (1,520,299 | ) | |||||||||||||||
Intercompany transfers | (1,240,973 | ) | — | — | — | 1,240,973 | — | ||||||||||||||||
Repayments on loan to non-guarantor subsidiary | — | — | 5,524 | — | (5,524 | ) | — | ||||||||||||||||
Contributions in aid of construction costs | — | — | 3,179 | — | — | 3,179 | |||||||||||||||||
Proceeds from assets sales | — | — | 2,811 | — | — | 2,811 | |||||||||||||||||
Other, net | — | — | (1,976 | ) | — | — | (1,976 | ) | |||||||||||||||
Net cash (used in) provided by investing activities | (1,688,708 | ) | — | (1,983,935 | ) | — | 1,683,184 | (1,989,459 | ) | ||||||||||||||
CASH FLOWS FROM FINANCING ACTIVITIES: | |||||||||||||||||||||||
Borrowings on senior secured credit facility | 1,525,050 | — | — | — | — | 1,525,050 | |||||||||||||||||
Repayments on senior secured credit facility | (960,450 | ) | — | — | — | — | (960,450 | ) | |||||||||||||||
Proceeds from issuance of senior unsecured notes, including premium | 1,139,718 | — | — | — | — | 1,139,718 | |||||||||||||||||
Repayment of senior unsecured notes | (350,000 | ) | — | — | — | — | (350,000 | ) | |||||||||||||||
Debt issuance costs | (28,901 | ) | — | — | — | — | (28,901 | ) | |||||||||||||||
Intercompany transfers | — | — | 1,299,830 | (58,857 | ) | (1,240,973 | ) | — | |||||||||||||||
Issuance of common units for cash, net | 633,759 | — | 633,759 | — | (633,759 | ) | 633,759 | ||||||||||||||||
Distributions to partners/owners | (256,389 | ) | — | (256,389 | ) | — | 256,389 | (256,389 | ) | ||||||||||||||
Contributions (distributions) to (from) noncontrolling interest | — | — | (960 | ) | — | — | (960 | ) | |||||||||||||||
Other, net | — | — | (471 | ) | 15,190 | (15,190 | ) | (471 | ) | ||||||||||||||
Net cash provided by (used in) financing activities | 1,702,787 | — | 1,675,769 | (43,667 | ) | (1,633,533 | ) | 1,701,356 | |||||||||||||||
Net increase (decrease) in cash and cash equivalents | (3 | ) | — | (22 | ) | 1,458 | — | 1,433 | |||||||||||||||
Cash and cash equivalents at beginning of period | 9 | — | 8,310 | 1,143 | — | 9,462 | |||||||||||||||||
Cash and cash equivalents at end of period | $ | 6 | $ | — | $ | 8,288 | $ | 2,601 | $ | — | $ | 10,895 | |||||||||||
F-42
Condensed Consolidating Statement of Cash Flows | |||||||||||||||||||||||
Year Ended December 31, 2014 | |||||||||||||||||||||||
Genesis Energy, L.P. (Parent and Co-Issuer) | Genesis Energy Finance Corporation (Co-Issuer) | Guarantor Subsidiaries | Non-Guarantor Subsidiaries | Eliminations | Genesis Energy, L.P. Consolidated | ||||||||||||||||||
Net cash (used in) provided by operating activities | $ | 96,868 | $ | — | $ | 317,520 | $ | 34,331 | $ | (157,665 | ) | $ | 291,054 | ||||||||||
CASH FLOWS FROM INVESTING ACTIVITIES: | |||||||||||||||||||||||
Payments to acquire fixed and intangible assets | — | — | (443,482 | ) | — | — | (443,482 | ) | |||||||||||||||
Cash distributions received from equity investees - return of investment | 42,755 | — | 18,363 | — | (42,755 | ) | 18,363 | ||||||||||||||||
Investments in equity investees | (225,725 | ) | — | (40,926 | ) | — | 225,725 | (40,926 | ) | ||||||||||||||
Acquisitions | — | — | (157,000 | ) | — | — | (157,000 | ) | |||||||||||||||
Intercompany transfers | (244,876 | ) | — | — | — | 244,876 | — | ||||||||||||||||
Repayments on loan to non-guarantor subsidiary | — | — | 4,993 | — | (4,993 | ) | — | ||||||||||||||||
Proceeds from asset sales | — | — | 272 | — | — | 272 | |||||||||||||||||
Other, net | — | — | (1,214 | ) | — | — | (1,214 | ) | |||||||||||||||
Net cash (used in) provided by investing activities | (427,846 | ) | — | (618,994 | ) | — | 422,853 | (623,987 | ) | ||||||||||||||
CASH FLOWS FROM FINANCING ACTIVITIES: | |||||||||||||||||||||||
Borrowings on senior secured credit facility | 1,839,900 | — | — | — | — | 1,839,900 | |||||||||||||||||
Repayments on senior secured credit facility | (1,872,300 | ) | — | — | — | — | (1,872,300 | ) | |||||||||||||||
Proceeds from issuance of senior unsecured notes | 350,000 | — | — | — | — | 350,000 | |||||||||||||||||
Debt issuance costs | (11,896 | ) | — | — | — | — | (11,896 | ) | |||||||||||||||
Intercompany transfers | — | — | 273,911 | (29,035 | ) | (244,876 | ) | — | |||||||||||||||
Issuance of ownership interests to partners for cash | 225,725 | — | 225,725 | — | (225,725 | ) | 225,725 | ||||||||||||||||
Distributions to partners/owners | (200,462 | ) | — | (200,462 | ) | — | 200,463 | (200,461 | ) | ||||||||||||||
Other, net | — | — | 2,560 | (4,949 | ) | 4,950 | 2,561 | ||||||||||||||||
Net cash provided by (used in) financing activities | 330,967 | — | 301,734 | (33,984 | ) | (265,188 | ) | 333,529 | |||||||||||||||
Net increase (decrease) in cash and cash equivalents | (11 | ) | — | 260 | 347 | — | 596 | ||||||||||||||||
Cash and cash equivalents at beginning of period | 20 | — | 8,050 | 796 | — | 8,866 | |||||||||||||||||
Cash and cash equivalents at end of period | $ | 9 | $ | — | $ | 8,310 | $ | 1,143 | $ | — | $ | 9,462 | |||||||||||
F-43
INDEPENDENT AUDITOR'S REPORT
To the Management Committee of
Poseidon Oil Pipeline Company, L.L.C.
Houston, Texas
We have audited the accompanying financial statements of Poseidon Oil Pipeline Company, L.L.C. (the "Company"), which comprise the balance sheets as of December 31, 2016 and 2015, and the related statements of operations, cash flows, and members' equity for each of the three years in the period ended December 31, 2016, and the related notes to the financial statements.
Management's Responsibility for the Financial Statements
Management is responsible for the preparation and fair presentation of these financial statements in accordance with accounting principles generally accepted in the United States of America; this includes the design, implementation, and maintenance of internal control relevant to the preparation and fair presentation of financial statements that are free from material misstatement, whether due to fraud or error.
Auditors' Responsibility
Our responsibility is to express an opinion on these financial statements based on our audits. We conducted our audits in accordance with auditing standards generally accepted in the United States of America. Those standards require that we plan and perform the audit to obtain reasonable assurance about whether the financial statements are free from material misstatement.
An audit involves performing procedures to obtain audit evidence about the amounts and disclosures in the financial statements. The procedures selected depend on the auditor’s judgment, including the assessment of the risks of material misstatement of the financial statements, whether due to fraud or error. In making those risk assessments, the auditor considers internal control relevant to the Company's preparation and fair presentation of the financial statements in order to design audit procedures that are appropriate in the circumstances, but not for the purpose of expressing an opinion on the effectiveness of the Company's internal control. Accordingly, we express no such opinion. An audit also includes evaluating the appropriateness of accounting policies used and the reasonableness of significant accounting estimates made by management, as well as evaluating the overall presentation of the financial statements.
We believe that the audit evidence we have obtained is sufficient and appropriate to provide a basis for our audit opinion.
Opinion
In our opinion, the financial statements referred to above present fairly, in all material respects, the financial position of Poseidon Oil Pipeline Company, L.L.C. as of December 31, 2016 and 2015, and the results of its operations and its cash flows for each of the three years in the period ended December 31, 2016 in accordance with accounting principles generally accepted in the United States of America.
/s/ DELOITTE & TOUCHE LLP
Houston, Texas
February 17, 2017
F-44
POSEIDON OIL PIPELINE COMPANY, L.L.C.
BALANCE SHEETS
(In thousands)
December 31, 2016 | December 31, 2015 | ||||||
ASSETS | |||||||
CURRENT ASSETS: | |||||||
Cash and cash equivalents | $ | 95 | $ | 619 | |||
Accounts receivable—trade | 12,501 | 13,491 | |||||
Accounts receivable—related parties | 2,377 | 3,525 | |||||
Crude oil inventory | 1,461 | 574 | |||||
Other current assets | 677 | 298 | |||||
Total current assets | 17,111 | 18,507 | |||||
FIXED ASSETS, net | 232,736 | 248,059 | |||||
OTHER ASSETS | 861 | 1,133 | |||||
TOTAL ASSETS | $ | 250,708 | $ | 267,699 | |||
LIABILITIES AND MEMBERS’ EQUITY | |||||||
CURRENT LIABILITIES: | |||||||
Accounts payable – trade | $ | 3,747 | $ | 2,966 | |||
Accounts payable – related parties | 1,771 | 2,142 | |||||
Deferred revenue | 13,258 | 13,282 | |||||
Other current liabilities | 1,951 | 4,066 | |||||
Total current liabilities | 20,727 | 22,456 | |||||
LONG-TERM DEBT | 202,050 | 197,250 | |||||
OTHER LIABILITIES | 17,594 | 6,264 | |||||
COMMITMENTS AND CONTINGENCIES (see Note 2) | |||||||
MEMBERS' EQUITY | 10,337 | 41,729 | |||||
TOTAL LIABILITIES AND MEMBERS' EQUITY | $ | 250,708 | $ | 267,699 | |||
The accompanying notes are an integral part of these consolidated financial statements.
F-45
POSEIDON OIL PIPELINE COMPANY, L.L.C.
STATEMENTS OF OPERATIONS
(In thousands, except per unit amounts)
Year Ended December 31, | |||||||||||
2016 | 2015 | 2014 | |||||||||
CRUDE OIL HANDLING REVENUES: | |||||||||||
Third parties | $ | 100,383 | $ | 97,977 | $ | 85,451 | |||||
Related parties | 19,899 | 25,769 | 24,044 | ||||||||
Total crude oil handling revenues | 120,282 | 123,746 | 109,495 | ||||||||
COSTS AND EXPENSES: | |||||||||||
Crude oil handling costs | |||||||||||
Third parties | 1,989 | 460 | 4,706 | ||||||||
Related parties | 3,788 | 1,554 | 4,142 | ||||||||
Total crude oil handling costs | 5,777 | 2,014 | 8,848 | ||||||||
Other operating costs and expenses | |||||||||||
Third parties | 1,238 | 2,800 | 6,386 | ||||||||
Related parties | 7,914 | 7,997 | 8,342 | ||||||||
Total other operating costs and expenses | 9,152 | 10,797 | 14,728 | ||||||||
Depreciation and accretion expenses | 15,615 | 15,619 | 13,381 | ||||||||
General and administrative costs | 101 | 129 | 95 | ||||||||
Total costs and expenses | 30,645 | 28,559 | 37,052 | ||||||||
OPERATING INCOME | 89,637 | 95,187 | 72,443 | ||||||||
Interest expense | 4,729 | 4,352 | 3,931 | ||||||||
NET INCOME | $ | 84,908 | $ | 90,835 | $ | 68,512 | |||||
The accompanying notes are an integral part of these consolidated financial statements.
F-46
POSEIDON OIL PIPELINE COMPANY, L.L.C.
STATEMENTS OF CASH FLOWS
(In thousands)
Year Ended December 31, | |||||||||||
2016 | 2015 | 2014 | |||||||||
CASH FLOWS FROM OPERATING ACTIVITIES: | |||||||||||
Net income | $ | 84,908 | $ | 90,835 | $ | 68,512 | |||||
Adjustments to reconcile net income to net cash provided by operating activities: | |||||||||||
Depreciation, amortization and accretion expenses | 15,887 | 15,935 | 13,641 | ||||||||
Loss on sale of assets | — | 194 | 624 | ||||||||
Effect of changes in operating accounts: | |||||||||||
Accounts receivable | 2,139 | (4,533 | ) | 9,965 | |||||||
Inventories | (887 | ) | (100 | ) | 6,525 | ||||||
Other current assets | (379 | ) | (248 | ) | (87 | ) | |||||
Accounts payable | 409 | 1,494 | (16,722 | ) | |||||||
Other liabilities | 9,082 | 9,909 | 6,968 | ||||||||
Net cash provided by operating activities | 111,159 | 113,486 | 89,426 | ||||||||
CASH FLOWS FROM INVESTING ACTIVITIES: | |||||||||||
Additions to fixed assets | (183 | ) | (2,244 | ) | (14,382 | ) | |||||
Proceeds from asset sales | — | 118 | 7,044 | ||||||||
Net cash used in investing activities | (183 | ) | (2,126 | ) | (7,338 | ) | |||||
CASH FLOWS FROM FINANCING ACTIVITIES: | |||||||||||
Borrowings under revolving credit facility | 85,900 | 73,750 | 49,000 | ||||||||
Repayments of principal | (81,100 | ) | (71,750 | ) | (37,000 | ) | |||||
Debt issuance costs | — | (1,360 | ) | — | |||||||
Cash distributions to Members | (116,300 | ) | (115,500 | ) | (93,000 | ) | |||||
Net cash used in financing activities | (111,500 | ) | (114,860 | ) | (81,000 | ) | |||||
Net increase (decrease) in cash and cash equivalents | (524 | ) | (3,500 | ) | 1,088 | ||||||
Cash and cash equivalents at beginning of period | 619 | 4,119 | 3,031 | ||||||||
Cash and cash equivalents at end of period | $ | 95 | $ | 619 | $ | 4,119 | |||||
SUPPLEMENTAL DISCLOSURE OF CASH FLOW INFORMATION | |||||||||||
Cash paid during the year for interest | $ | 4,402 | $ | 4,180 | $ | 3,619 | |||||
Current liabilities for capital expenditures at end of year | $ | — | $ | — | $ | 1,013 | |||||
The accompanying notes are an integral part of these consolidated financial statements.
F-47
POSEIDON OIL PIPELINE COMPANY, L.L.C.
STATEMENT OF MEMBERS' EQUITY
(In thousands)
Poseidon Pipeline Company, L.L.C. | Shell Oil Products U.S. | Shell Midstream Partners, L.P. | GEL Poseidon, LLC | Total | |||||||||||||||
January 1, 2014 | 32,718 | $ | 32,718 | $ | — | $ | 25,446 | $ | 90,882 | ||||||||||
Net income | 24,664 | 24,664 | — | 19,184 | 68,512 | ||||||||||||||
Cash distributions to members | (33,480 | ) | (33,480 | ) | — | (26,040 | ) | (93,000 | ) | ||||||||||
December 31, 2014 | 23,902 | 23,902 | — | 18,590 | 66,394 | ||||||||||||||
Net income (loss) | 32,700 | 16,178 | 16,522 | 25,435 | 90,835 | ||||||||||||||
Equity transfer | — | (20,640 | ) | 20,640 | — | — | |||||||||||||
Cash distributions to members | (41,580 | ) | (19,440 | ) | (22,140 | ) | (32,340 | ) | (115,500 | ) | |||||||||
December 31, 2015 | 15,022 | — | 15,022 | 11,685 | 41,729 | ||||||||||||||
Net income | 30,567 | — | 30,567 | 23,774 | 84,908 | ||||||||||||||
Cash distributions to members | (41,868 | ) | — | (41,868 | ) | (32,564 | ) | (116,300 | ) | ||||||||||
December 31, 2016 | $ | 3,721 | $ | — | $ | 3,721 | $ | 2,895 | $ | 10,337 | |||||||||
The accompanying notes are an integral part of these consolidated financial statements.
F-48
POSEIDON OIL PIPELINE COMPANY, L.L.C.
NOTES TO FINANCIAL STATEMENTS
1. Company Organization and Description of Business
Company Organization
Poseidon Oil Pipeline Company, L.L.C. (“Poseidon”) is a Delaware limited liability company formed in February 1996 to design, construct, own and operate an unregulated crude oil pipeline system located in the central Gulf of Mexico offshore Louisiana. Unless the context requires otherwise, references to “we”, “us”, “our” or “the Company” within these notes are intended to mean Poseidon.
At December 31, 2016 we were owned (i) 36% by Poseidon Pipeline Company, L.L.C. and (ii) 28% by GEL Poseidon, LLC, collectively ("Genesis") and (iii) 36% by Shell Midstream Partners, L.P. On July 1, 2015, Shell Oil Products U.S. sold its ownership interest in Poseidon to Shell Midstream Partners, L.P. On July 24, 2015, all of the ownership interest in Poseidon Pipeline Company, L.L.C., was transferred by Enterprise Products Partners, L.P. (“Enterprise”) to an affiliate of Genesis as part of the sale of Enterprise’s offshore business. Following such transfer, Poseidon Pipeline Company, L.L.C. continued to own a 36% ownership interest in Poseidon.
Description of Business
The Poseidon Oil Pipeline System (the “Pipeline”) gathers crude oil production from the outer continental shelf and deepwater areas of the Gulf of Mexico offshore Louisiana for delivery to onshore locations in south Louisiana. The system includes a pipeline junction platform located at South Marsh Island 205 (“SMI-205”). Manta Ray Gathering Company, L.L.C. (“Manta Ray”), a wholly owned subsidiary of Genesis acquired as part of Enterprise’s offshore business, serves as operator of the Pipeline.
2. Significant Accounting Policies
Our financial statements are prepared on the accrual basis of accounting in accordance with U.S. generally accepted accounting principles (“GAAP”).
Except as noted within the context of each footnote disclosure, dollar amounts presented in the tabular data within these footnote disclosures are stated in thousands of dollars.
In preparing these financial statements, the Company has evaluated subsequent events for potential recognition or disclosure through February 17, 2017, the issuance date of the financial statements.
Cash and Cash Equivalents
Cash and cash equivalents represent unrestricted cash on hand and may also include highly liquid investments with original maturities of less than three months from the date of purchase.
Contingency and Liability Accruals
We accrue reserves for contingent liabilities including environmental remediation and potential legal claims. When our assessment indicates that it is probable that a liability has occurred and the amount of the liability can be reasonably estimated, we make accruals. We base our estimates on all known facts at the time and our assessment of the ultimate outcome, including consultation with external experts and counsel. We revise these estimates as additional information is obtained or resolution is achieved.
We also make estimates related to future payments for environmental costs to remediate existing conditions attributable to past operations. Environmental costs include costs for studies and testing as well as remediation and restoration. We sometimes make these estimates with the assistance of third parties involved in monitoring the remediation effort.
At December 31, 2016, we were not aware of any contingencies or liabilities that would have a material effect on our financial position, results of operations or cash flows.
Crude Oil Handling Costs
Crude oil handling costs represent expenses we incur as a result of utilizing third party-owned pipelines in the provision of services.
Estimates
Preparing our financial statements in conformity with GAAP requires us to make estimates that affect amounts presented in the financial statements. Our most significant estimates relate to (i) the useful lives and depreciation methods used for fixed assets;
F-49
(ii) measurement of fair value and projections used in impairment testing of fixed assets; (iii) contingencies; (iv) revenue and expense accruals; and (v) estimates of future asset retirement obligations.
Actual results could differ materially from our estimates. On an ongoing basis, we review our estimates based on currently available information. Any changes in the facts and circumstances underlying our estimates may require us to update such estimates, which could have a material impact on our financial statements.
Fair Value Information
The carrying amounts of cash and cash equivalents, accounts receivable and accounts payable approximate their fair values based on their short-term nature.
Impairment Testing for Long-Lived Assets
Long-lived assets such as fixed assets are reviewed for impairment when events or changes in circumstances indicate that the carrying amount of such assets may not be recoverable. Long-lived assets with carrying values that are not expected to be recovered through future cash flows are written-down to their estimated fair values. The carrying value of a long-lived asset is deemed not recoverable if it exceeds the sum of undiscounted cash flows expected to result from the use and eventual disposition of the asset. If the asset’s carrying value exceeds the sum of its undiscounted cash flows, a non-cash asset impairment charge equal to the excess of the asset’s carrying value over its estimated fair value is recorded. Fair value is defined as the price that would be received to sell an asset or paid to transfer a liability in an orderly transaction between market participants at a specified measurement date. We measure fair value using market price indicators or, in the absence of such data, appropriate valuation techniques.
No asset impairment charges were recognized during the years ended December 31, 2016, 2015 or 2014.
Income Taxes
We are organized as a pass-through entity for federal income tax purposes. As a result, our financial statements do not provide for such taxes and our Members are individually responsible for their allocable share of our taxable income for federal income tax purposes.
Inventories
We take title to crude oil volumes we purchase from producers and volumes we obtain through contractual pipeline loss allowances. Timing and measurement differences between receipt and delivery volumes, as well as fluctuations in crude oil pricing, impact our inventory balances. Our inventory amounts are presented at the lower of average cost or market.
Due to fluctuating crude oil prices, we recognize lower of cost or market adjustments when the carrying value of our crude oil inventory exceeds its net realizable value. These non-cash charges are a component of “Crude oil handling costs” on our Statements of Operations in the period they are recognized. We did not recognized a lower of cost or net realizable value adjustment during 2016. We recognized $0.1 million and $0.5 million of lower of cost or net realizable value adjustments during 2015 and 2014, respectively.
Fixed Assets
Fixed assets are recorded at cost. Expenditures for additions, improvements and other enhancements to fixed assets are capitalized, and minor replacements, maintenance, and repairs that do not extend asset life or add value are charged to expense as incurred. When fixed assets are retired or otherwise disposed of, the related cost and accumulated depreciation is removed from the accounts and any resulting gain or loss is included in results of operations for the respective period.
In general, depreciation is the systematic and rational allocation of an asset’s cost, less its residual value (if any), to the reporting periods it benefits. Our fixed assets are depreciated using the straight-line method, which results in depreciation expense being incurred evenly over the life of an asset. Our estimate of depreciation expense incorporates management assumptions regarding the useful economic lives and residual values of our assets. Estimated useful lives are 10 to 30 years for our related fixed assets.
Asset retirement obligations (“AROs”) are legal obligations associated with the retirement of tangible long-lived assets that result from their acquisition, construction, development and/or normal operation. When an ARO is incurred, we record a liability for the ARO and capitalize an equal amount as an increase in the carrying value of the related long-lived asset. ARO amounts are measured at their estimated fair value using expected present value techniques. Over time, the liability is accreted to its present value (through accretion expense) and the capitalized amount is depreciated over the remaining useful life of the related long-term asset. We will incur a gain or loss to the extent that our ARO liabilities are not settled at their recorded amounts. See Note 3 for additional information regarding our fixed assets and related AROs.
Revenue Recognition
F-50
Crude oil handling revenues are generated from purchase and sale agreements whereby we purchase crude oil from producers at various receipt points along the Pipeline for a contractual fixed price (less a “handling fee”) and sell common stream crude oil back to the producers at various redelivery points at the same contractual fixed price (before the handling fee was applied). Since these purchase and sale transactions are with the same customer and entered into in contemplation of one another, the purchase and sales amounts are netted against one another and the residual handling fees are recognized as crude oil handling revenue. The intent of these buy-sell arrangements is to earn a fee for handling crude oil (a service to the producer) and not to engage in crude oil marketing activities. We also net the corresponding receivables and payables from such transactions on our Balance Sheets for consistency of presentation.
We have entered into long-term pipeline capacity reservation agreements with Anadarko Petroleum Corporation, Eni Petroleum Co. Inc., Exxon Mobil Corporation, Freeport-McMoRan Inc., Petrobras America Inc., and Teikoku Oil (North America) Co., Ltd., collectively the “Lucius producers”. The term of these agreements is 20 years (July 2014 through June 2034), which corresponds to the period of dedicated production from the Lucius producers under the agreements. The amount of pipeline capacity reserved each year for the Lucius producers is based on their expected production volumes for that period (as defined in the contract). The capacity reservation agreements require the Lucius producers to make scheduled minimum bill payments to us (as defined in the contract). We defer that portion of the minimum bill payments that relate to future performance obligations under the contract. We recognized $13.3 million, $13.3 million and $6.2 million of pipeline capacity reservation revenues from the Lucius producers during the years ended December 31, 2016, 2015 and 2014, respectively. At December 31, 2016 our deferred revenue attributable to the Lucius agreements totaled $28.4 million of which $13.3 million is expected to be recognized as revenue in 2017.
Recent and Proposed Accounting Pronouncements
In May 2014, the FASB issued revised guidance on revenue from contracts with customers that will supersede most current revenue recognition guidance, including industry-specific guidance. The core principle of the revenue model is that an entity will recognize revenue to depict the transfer of promised goods or services to customers in an amount that reflects the consideration to which the entity expects to be entitled in exchange for those goods or services. The new standard provides a five-step analysis for transactions to determine when and how revenue is recognized. The guidance permits the use of either a full retrospective or a modified retrospective approach. In July 2015, the FASB approved a one year deferral of the effective date of this standard to December 15, 2017 for annual reporting periods beginning after that date. The FASB also approved early adoption of the standard, but not before the original effective date of December 15, 2016. While we do not believe there will be a material impact to our revenues upon adoption, we are continuing to evaluate the impacts of our pending adoption of this guidance and our preliminary assessments are subject to change.
In July 2015, the FASB issued guidance modifying the accounting for inventory. Under this guidance, the measurement principle for inventory will change from lower of cost or market value to lower of cost and net realizable value. The guidance defines net realizable value as the estimated selling price in the ordinary course of business, less reasonably predictable costs of completion, disposal, and transportation. The guidance is effective for reporting periods after December 15, 2016, with early adoption permitted. We do not expect adoption to have a material impact on our financial statements.
In February 2016, the FASB issued guidance to improve the transparency and comparability among companies by requiring lessees to recognize a lease liability and a corresponding lease asset for virtually all lease contracts. The guidance also requires additional disclosure about leasing arrangements. The guidance is effective for interim and annual periods beginning after December 15, 2018 and requires a modified retrospective approach to adoption. Early adoption is permitted. We are currently evaluating this guidance.
In August 2016, the FASB issued guidance that addresses how certain cash receipts and payments are presented and classified in the statement of cash flows under Topic 230, Statement of Cash flow, and other Topics. The guidance is effective for annual reporting periods, and interim periods therein, beginning after December 15, 2017. We do not expect the adoption of this guidance to have a material impact on our financial statements.
3. Fixed Assets and Asset Retirement Obligations
Fixed Assets
Our fixed asset values and related accumulated depreciation balances were as follows at the dates indicated:
F-51
At December 31, | |||||||||||
2016 | 2015 | 2014 | |||||||||
Pipelines and facilities | $ | 433,105 | $ | 432,941 | $ | 431,988 | |||||
Construction in progress | 32 | 13 | 43 | ||||||||
Total | 433,137 | 432,954 | 432,031 | ||||||||
Less accumulated depreciation | (200,401 | ) | (184,895 | ) | (169,380 | ) | |||||
Fixed assets, net | $ | 232,736 | $ | 248,059 | $ | 262,651 | |||||
Depreciation expense was $15.5 million, $15.5 million and $13.5 million for the years ended December 31, 2016, 2015 and 2014, respectively
Asset retirement obligations
Our AROs result from regulatory requirements that would be triggered by the retirement of our offshore pipeline and platform assets. The following table presents information regarding our asset retirement liabilities for the periods indicated:
For the Year Ended December 31, | |||||||||||
2016 | 2015 | 2014 | |||||||||
ARO liability, beginning of period | $ | 1,405 | $ | 1,302 | $ | 1,587 | |||||
Liabilities settled | — | — | (172 | ) | |||||||
Accretion expense | 108 | 103 | 96 | ||||||||
Revisions in expected cash flows | — | — | (209 | ) | |||||||
ARO liability, end of period | $ | 1,513 | $ | 1,405 | $ | 1,302 | |||||
At December 31, 2016, our forecast of accretion expense is as follows for the next five years:
2017 | 2018 | 2019 | 2020 | 2021 | |||||||||
$ | 116 | $ | 126 | $ | 135 | $ | 146 | $ | 157 | ||||
4. Debt Obligation
April 2011 Credit Facility
In April 2011, we entered into a revolving bank credit facility that had an initial borrowing capacity of $125 million, which was increased over time to $225 million by August 2013. In addition, we paid commitment fees on the unused portion of the revolving credit facility at rates that varied from 0.25% to 0.375%.
The April 2011 credit facility included customary financial covenants that, if breached, would have accelerated the maturity date of the debt.
The April 2011 credit facility was set to mature in April 2015; however, the facility was terminated in February 2015 and its outstanding principal balance of $186.8 million was refinanced under the new February 2015 credit facility.
February 2015 Credit Facility
In February 2015, we entered into an amended and restated revolving credit agreement having an initial borrowing capacity of $225 million, with a provision that its borrowing capacity could be expanded to $275 million with additional commitments from the lenders. Amounts borrowed under the February 2015 credit facility mature in February 2020. We used $186.8 million of borrowing capacity under the new credit facility to refinance principal amounts that were outstanding under the April 2011 Credit Facility at termination. We incurred $1.3 million of debt issuance costs related to the February 2015 Credit Facility of which $0.9 million and $1.1 million is deferred within other assets on our Balance Sheet at December 31, 2016 and 2015, respectively.
The weighted-average variable interest rate charged under the February 2015 credit facility was approximately 2.2% and 2.1% for the years ended December 31, 2016 and 2015, respectively. Interest rates charged under the 2015 credit facility are dependent on certain quarterly financial ratios (as defined in the credit agreement). For Eurodollar loans where our leverage ratio is greater
F-52
than or equal to 1:1 and less than 2:1, the interest rate is the London Interbank Offered Rate (“LIBOR”) plus 1.75%, and for Base Rate loans (as defined in the credit agreement), the interest rate is 0.75% plus a variable base rate equal to the greater of (i) the prime rate, (ii) the federal funds rate plus 0.50% or (iii) LIBOR plus 1.00%. The interest rate on Eurodollar and Base Rate loans would increase by 0.25% if our leverage ratio increased to greater than 2:1 and would decrease by 0.25% if our leverage ratio decreased to less than or equal to 1:1. In addition, we pay commitment fees on the unused portion of the revolving credit facility at rates that vary from 0.25% to 0.375%.
The February 2015 credit facility is non-recourse to our Members and secured by our assets. The February 2015 credit facility also contains customary covenants such as restrictions on debt levels, liens, guarantees, mergers, sale of assets and distributions to Members. A breach of any of these covenants could result in acceleration of our debt financial obligations. We were in compliance with the covenants of our credit facility at December 31, 2016.
In general, if an Event of Loss occurs (as defined in the credit agreement), we are obligated to either repair the damage or use any insurance proceeds we receive to reduce debt principal outstanding.
5. Members’ Equity
As a limited liability company, our Members are not personally liable for any of our debts, obligations or other liabilities. Income or loss amounts are allocated to Members based on their respective membership interests. Cash contributions by and distributions to Members are also based on their respective membership interests.
Cash distributions to Members are determined by our Management Committee, which is responsible for conducting the Company’s affairs in accordance with our limited liability agreement.
6. Related Party Transactions
The following table summarizes our related party transactions for the period indicated:
For the Year Ended December 31, | ||||||||||||||
2016 | 2015 | 2014 | ||||||||||||
Crude oil handling revenues: | ||||||||||||||
Enterprise affiliates | $ | — | $ | 470 | $ | 84 | ||||||||
Genesis affiliates | 1,007 | 464 | — | |||||||||||
Shell affiliates | 18,892 | 24,835 | 23,960 | |||||||||||
Total | $ | 19,899 | $ | 25,769 | $ | 24,044 | ||||||||
Crude oil handling costs: | ||||||||||||||
Enterprise affiliates | — | 209 | 416 | |||||||||||
Genesis affiliates | 2,930 | 595 | — | |||||||||||
Shell affiliates | 858 | 750 | 3,726 | |||||||||||
Total | $ | 3,788 | $ | 1,554 | $ | 4,142 | ||||||||
Other operating costs and expenses: | ||||||||||||||
Enterprise affiliates | — | 4,056 | 8,342 | |||||||||||
Genesis affiliates | 7,914 | 3,941 | — | |||||||||||
Total | $ | 7,914 | $ | 7,997 | $ | 8,342 | ||||||||
Other operating costs and expenses include amounts charged to us by Manta Ray for operator fees and space on their SS-332A platform.
The following table summarizes our related party accounts receivable and accounts payable amounts at the dates indicated:
F-53
At December 31, | |||||||
2016 | 2015 | ||||||
Accounts receivable - related parties: | |||||||
Genesis affiliates | $ | — | $ | 114 | |||
Shell affiliates | 2,377 | 3,411 | |||||
Total accounts receivable - related parties | $ | 2,377 | $ | 3,525 | |||
Accounts payable - related parties: | |||||||
Genesis affiliates | 1,644 | 1,922 | |||||
Shell affiliates | 127 | 220 | |||||
Total accounts payable - related parties | $ | 1,771 | $ | 2,142 | |||
7. Significant Risks
Production and Credit Risk due to Customer Concentration
Offshore pipeline systems such as ours are directly impacted by exploration and production activities in the Gulf of Mexico for crude oil. Crude oil reserves are depleting assets. Our crude oil pipeline system must access additional reserves to offset either (i) the natural decline in production from existing connected wells or (ii) the loss of production to a competing takeaway pipeline. We actively seek to offset the loss of volumes due to depletion by adding connections to new customers and production fields.
In terms of percentage of total revenues, our largest customers for the years ended December 31, 2016 and 2015 were Anadarko Petroleum Corporation 16.8%, 12.1%, Shell Oil Company 15.9%, 20.4% and BHP Billiton Ltd. 9.7%, 9.3%, respectively. Our largest customers for the year ended December 31, 2014 were Shell Oil Company 24.0%, Repsol Trading USA 11.0% and BHP Billiton Petroleum 9.7%. Shell Oil Company is a marketing agent for numerous producers who are dedicated to us. The loss of any of these customers or a significant reduction in the crude oil volumes they have dedicated to us for handling would have a material adverse effect on our financial position, results of operations and cash flows.
F-54