Attached files
| file | filename |
|---|---|
| EX-32.2 - EXHIBIT 32.2 - Spectra Energy Partners, LP | sep-20161231exx322.htm |
| EX-32.1 - EXHIBIT 32.1 - Spectra Energy Partners, LP | sep-20161231exx321.htm |
| EX-31.2 - EXHIBIT 31.2 - Spectra Energy Partners, LP | sep-20161231exx312.htm |
| EX-31.1 - EXHIBIT 31.1 - Spectra Energy Partners, LP | sep-20161231exx311.htm |
| EX-24.1 - EXHIBIT 24.1 - Spectra Energy Partners, LP | sep-20161231exx241.htm |
| EX-23.1 - EXHIBIT 23.1 - Spectra Energy Partners, LP | sep-20161231exx231.htm |
| EX-21.1 - EXHIBIT 21.1 - Spectra Energy Partners, LP | sep-20161231exx211.htm |
| EX-12.1 - EXHIBIT 12.1 - Spectra Energy Partners, LP | sep-20161231exx121.htm |
| EX-3.2 - EXHIBIT 3.2 - Spectra Energy Partners, LP | sep-20161231exx32.htm |
UNITED STATES SECURITIES AND EXCHANGE COMMISSION
Washington, D.C. 20549
Form 10-K
x ANNUAL REPORT PURSUANT TO SECTION 13 OR 15(d) OF THE SECURITIES EXCHANGE ACT OF 1934
For the fiscal year ended December 31, 2016
or
¨ TRANSITION REPORT PURSUANT TO SECTION 13 OR 15(d) OF THE SECURITIES EXCHANGE ACT OF 1934
For the transition period from to
Commission file number 001-33556

SPECTRA ENERGY PARTNERS, LP
(Exact name of registrant as specified in its charter)
Delaware | 41-2232463 | |
(State or other jurisdiction of incorporation or organization) | (I.R.S. Employer Identification No.) | |
5400 Westheimer Court, Houston, Texas | 77056 | |
(Address of principal executive offices) | (Zip Code) | |
713-627-5400
(Registrant’s telephone number, including area code)
Securities registered pursuant to Section 12(b) of the Act:
Title of Each Class | Name of Each Exchange on Which Registered | |
Common Units Representing Limited Partner Interests | New York Stock Exchange | |
Securities registered pursuant to Section 12(g) of the Act: None.
Indicate by check mark if the registrant is a well-known seasoned issuer, as defined in Rule 405 of the Securities Act. Yes x No ¨
Indicate by check mark if the registrant is not required to file reports pursuant to Section 13 or Section 15(d) of the Act. Yes ¨ No x
Indicate by check mark whether the registrant (1) has filed all reports required to be filed by Section 13 or 15(d) of the Securities Exchange Act of 1934 during the preceding 12 months (or for such shorter period that the registrant was required to file such reports), and (2) has been subject to such filing requirements for the past 90 days. Yes x No ¨
Indicate by check mark whether the registrant has submitted electronically and posted on its corporate Web site, if any, every Interactive Data File required to be submitted and posted pursuant to Rule 405 of Regulation S-T (§232.405 of this chapter) during the preceding 12 months (or for such shorter period that the registrant was required to submit and post such files). Yes x No ¨
Indicate by check mark if disclosure of delinquent filers pursuant to Item 405 of Regulation S-K (§229.405 of this chapter) is not contained herein, and will not be contained, to the best of registrant’s knowledge, in definitive proxy or information statements incorporated by reference in Part III of this Form 10-K or any amendment to this Form 10-K. x
Indicate by check mark whether the registrant is a large accelerated filer, an accelerated filer, a non-accelerated filer, or a smaller reporting company. See the definitions of “large accelerated filer,” “accelerated filer” and “smaller reporting company” in Rule 12b-2 of the Exchange Act.
Large accelerated filer x | Accelerated filer ¨ | Non-accelerated filer ¨ | Smaller reporting company ¨ | |||
Indicate by check mark whether the registrant is a shell company (as defined in Rule 12b-2 of the Act). Yes ¨ No x
Estimated aggregate market value of the Common Units held by non-affiliates of the registrant at June 30, 2016: $3,396,000,000.
At January 31, 2017, there were 308,848,266 Common Units and 6,303,026 General Partner Units outstanding.
SPECTRA ENERGY PARTNERS, LP
FORM 10-K FOR THE YEAR ENDED
DECEMBER 31, 2016
TABLE OF CONTENTS
Item | Page | |
1. | ||
1A. | ||
1B. | ||
2. | ||
3. | ||
4. | ||
5. | ||
6. | ||
7. | ||
7A. | ||
8. | ||
9. | ||
9A. | ||
9B. | ||
10. | ||
11. | ||
12. | ||
13. | ||
14. | ||
15. | ||
2
CAUTIONARY STATEMENT REGARDING FORWARD-LOOKING INFORMATION
This document includes “forward-looking statements” within the meaning of Section 27A of the Securities Act of 1933 and Section 21E of the Securities Exchange Act of 1934. Forward-looking statements represent management’s intentions, plans, expectations, assumptions and beliefs about future events. These forward-looking statements are identified by terms and phrases such as: anticipate, believe, intend, estimate, expect, continue, should, could, may, plan, project, predict, will, potential, forecast, and similar expressions. Forward-looking statements are subject to risks, uncertainties and other factors, many of which are outside our control and could cause actual results to differ materially from the results expressed or implied by those forward-looking statements. Factors used to develop these forward-looking statements and that could cause actual results to differ materially from those indicated in any forward-looking statement include, but are not limited to:
• | state, provincial, federal and foreign legislative and regulatory initiatives that affect cost and investment recovery, have an effect on rate structure, and affect the speed at and degree to which competition enters the natural gas and oil industries; |
• | outcomes of litigation and regulatory investigations, proceedings or inquiries; |
• | weather and other natural phenomena, including the economic, operational and other effects of hurricanes and storms; |
• | the timing and extent of changes in interest rates and foreign currency exchange rates; |
• | general economic conditions, including the risk of a prolonged economic slowdown or decline, or the risk of delay in a recovery, which can affect the long-term demand for natural gas and oil and related services; |
• | potential effects arising from terrorist attacks and any consequential or other hostilities; |
• | changes in environmental, safety and other laws and regulations; |
• | the development of alternative energy resources; |
• | results and costs of financing efforts, including the ability to obtain financing on favorable terms, which can be affected by various factors, including credit ratings and general market and economic conditions; |
• | increases in the cost of goods and services required to complete capital projects; |
• | growth in opportunities, including the timing and success of efforts to develop U.S. and Canadian pipeline, storage, gathering and other related infrastructure projects and the effects of competition; |
• | the performance of natural gas transmission, storage and gathering facilities, and crude oil transportation and storage; |
• | the extent of success in connecting natural gas and oil supplies to transmission and gathering systems and in connecting to expanding gas and oil markets; |
• | the effects of accounting pronouncements issued periodically by accounting standard-setting bodies; |
• | conditions of the capital markets during the periods covered by forward-looking statements; and |
• | the ability to successfully complete merger, acquisition or divestiture plans; regulatory or other limitations imposed as a result of a merger, acquisition or divestiture; and the success of the business following a merger, acquisition or divestiture. |
In light of these risks, uncertainties and assumptions, the events described in the forward-looking statements might not occur or might occur to a different extent or at a different time than Spectra Energy Partners, LP has described. Spectra Energy Partners, LP undertakes no obligation to publicly update or revise any forward-looking statements, whether as a result of new information, future events or otherwise.
3
PART I.
Item 1. Business.
The terms “we,” “our,” “us” and “Spectra Energy Partners” as used in this report refer collectively to Spectra Energy Partners, LP and its subsidiaries unless the context suggests otherwise. These terms are used for convenience only and are not intended as a precise description of any separate legal entity within Spectra Energy Partners.
On September 6, 2016 Spectra Energy Corp (Spectra Energy) announced that they entered into a definitive merger agreement with Enbridge Inc. (Enbridge). Under this agreement, Enbridge and Spectra Energy will combine in a stock-for-stock merger transaction, which values Spectra Energy's stock at approximately $28 billion, based on the closing price of Enbridge common shares as of September 2, 2016. This transaction was approved by the boards of directors and shareholders of both Spectra Energy and Enbridge and has received all necessary regulatory approvals. The transaction is expected to close on February 27, 2017.
Upon completion of the proposed merger, Spectra Energy shareholders will receive 0.984 Enbridge common shares for each share of Spectra Energy stock they own. The consideration to be received is valued at $40.33 per Spectra Energy share, based on the closing price of Enbridge common shares as of September 2, 2016, representing an approximate 11.5% premium to the closing price of Spectra Energy stock as of September 2, 2016. Upon completion of the merger, Enbridge shareholders are expected to own approximately 57% of the combined company and Spectra Energy shareholders are expected to own approximately 43%.
As a result of this transaction, Enbridge and its subsidiaries will collectively own the interest in us currently held by Spectra Energy.
General
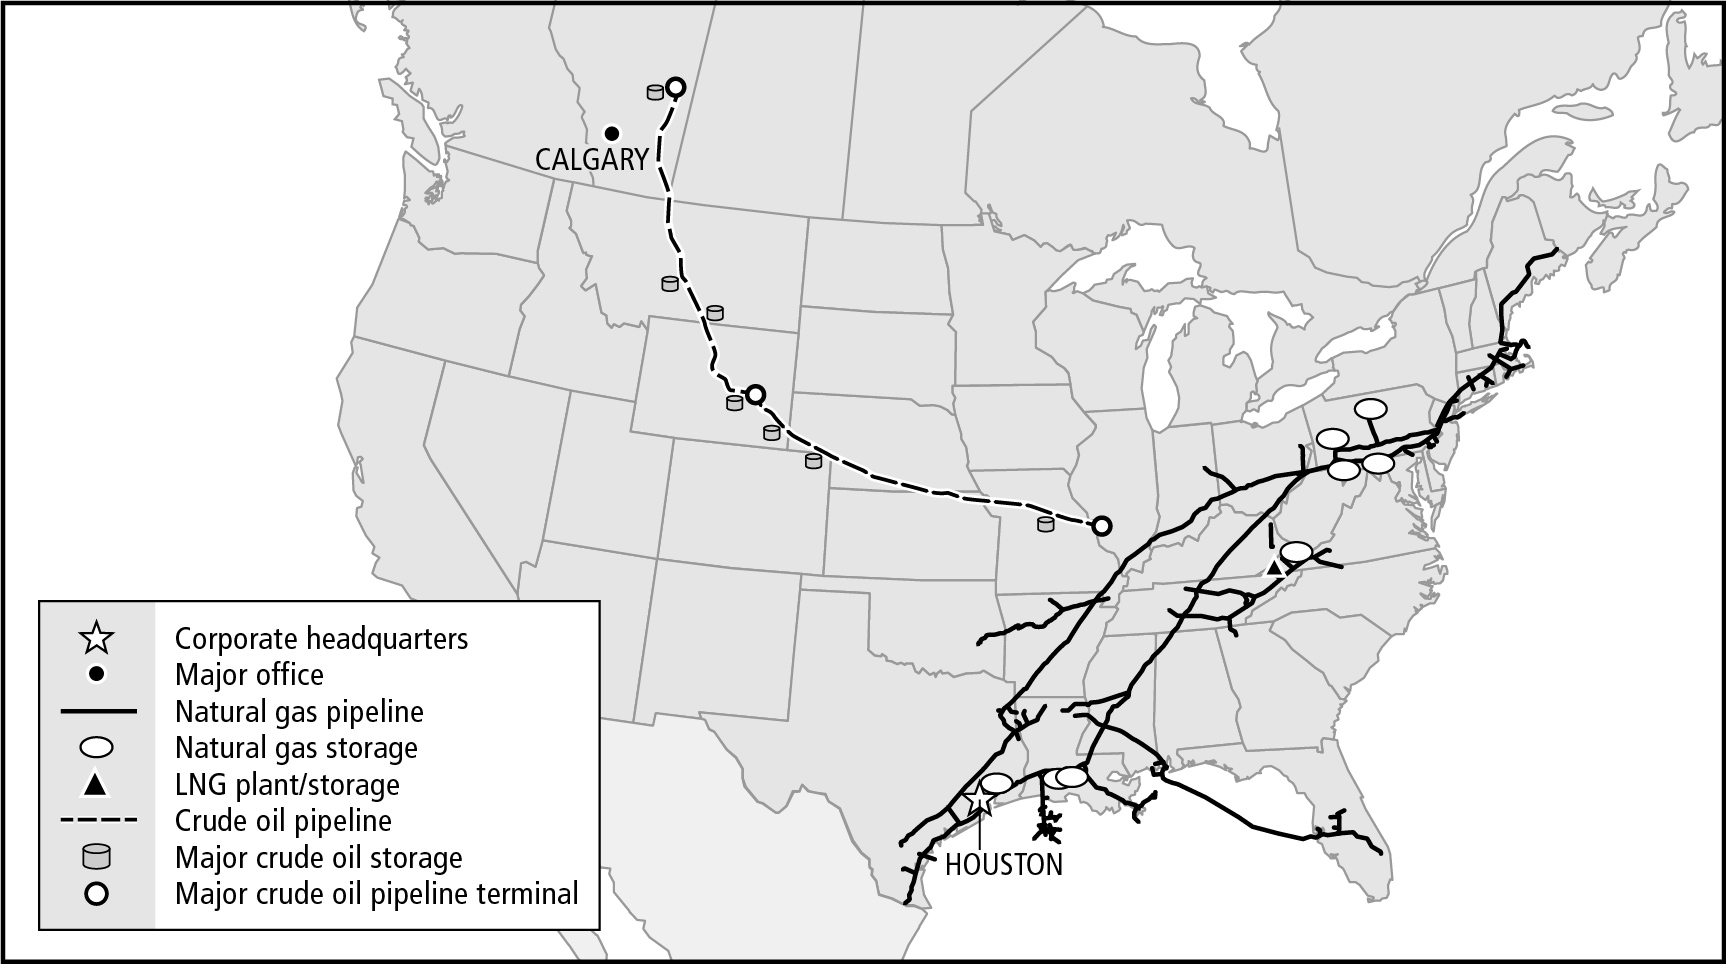
Spectra Energy Partners, LP, through its subsidiaries and equity affiliates, is engaged in the transmission, storage and gathering of natural gas, and the transportation and storage of crude oil, through interstate pipeline systems in the United States and Canada with over 15,000 miles of transmission and transportation pipelines, the storage of natural gas in underground facilities with aggregate working gas storage capacity of approximately 170 billion cubic feet (Bcf) and crude oil storage of approximately 5.6 million barrels.
We own and operate natural gas transmission, gathering and storage assets, and crude oil transportation and storage assets in central, southern and eastern United States as well as western Canada. Our assets are strategically located in geographic
4
regions of the United States and Canada where demand, primarily for natural gas used in electricity generation, and crude oil, is expected to increase steadily. We have a broad mix of customers, including local gas distribution companies (LDC), municipal utilities, interstate and intrastate pipelines, direct industrial users, electric power generators, marketers and producers, oil refineries, and exploration and production companies. Our interstate gas transmission pipeline and storage operations and our crude oil transportation and storage operations are regulated by either the Federal Energy Regulatory Commission (FERC), the U.S. Department of Transportation (DOT), or the National Energy Board (NEB) with the exception of Moss Bluff intrastate storage operations and Ozark gathering facilities, which are subject to oversight by various state commissions.
Our operations and activities are managed by our general partner, Spectra Energy Partners (DE) GP, LP, which in turn is managed by its general partner, Spectra Energy Partners GP, LLC, (the General Partner). The General Partner is wholly owned by a subsidiary of Spectra Energy. Spectra Energy is a separate entity, the common stock of which trades on the New York Stock Exchange (NYSE) under the symbol “SE.” As of December 31, 2016, Spectra Energy and its subsidiaries collectively owned 75% of us and the remaining 25% was publicly owned.
In March 2013, Spectra Energy acquired 100% of the ownership interests in the Express-Platte crude oil pipeline system (Express-Platte) from third-parties. Later in 2013, we acquired a 40% ownership interest in the U.S. portion of Express-Platte (Express US) and a 100% ownership interest in the Canadian portion of Express-Platte (Express Canada) (collectively, Express-Platte) from subsidiaries of Spectra Energy (the Express-Platte acquisition).
In November 2013, we acquired substantially all of Spectra Energy’s remaining U.S. transmission, storage and liquids assets, including Spectra Energy’s remaining 60% interest in Express US (the U.S. Assets Dropdown). The pipeline systems include Texas Eastern Transmission, LP (Texas Eastern), Algonquin Gas Transmission, LLC (Algonquin), the remaining ownership interest in Express US, an additional 39% interest in Maritimes & Northeast Pipeline, L.L.C (M&N U.S.), 33% interests in both DCP Sand Hills Pipeline, LLC (Sand Hills) and DCP Southern Hills Pipeline, LLC (Southern Hills), an additional 1% interest in Gulfstream Natural Gas System, L.L.C. (Gulfstream) and a 24.95% interest in Southeast Supply Header, LLC (SESH). The natural gas and crude oil storage businesses include Bobcat Gas Storage (Bobcat), the remaining 50% interest in Market Hub Partners Holding, LLC (Market Hub), a 49% interest in Steckman Ridge, LP (Steckman Ridge), and Texas Eastern's and Express-Platte's storage facilities.
In November 2014, we completed the second of the three planned transactions related to the U.S. Assets Dropdown. This transaction consisted of acquiring an additional 24.95% ownership interest in SESH and an additional 1% interest in Steckman Ridge from Spectra Energy.
The final transaction related to the U.S. Assets Dropdown occurred in November 2015, and consisted of the acquisition of Spectra Energy's remaining 0.1% interest in SESH.
The U.S. Assets Dropdown has been accounted for as an acquisition under common control, resulting in the recast of our prior results. See Note 2 of Notes to Consolidated Financial Statements for further discussion of the transaction.
In October 2015, Spectra Energy acquired our 33.3% ownership interests in Sand Hills and Southern Hills.
Businesses
We manage our business in two reportable segments: U.S. Transmission and Liquids. The remainder of our business operations is presented as “Other,” and consists mainly of certain corporate costs. The following sections describe the operations of each of our businesses. For financial information on our business segments, see Note 4 of Notes to Consolidated Financial Statements.
U.S. Transmission
Our U.S. Transmission business primarily provides transmission, storage, and gathering of natural gas for customers in various regions of the northeastern and southeastern United States. Our pipeline systems consist of approximately 14,000 miles of pipelines with eight primary transmission systems: Texas Eastern, Algonquin, East Tennessee Natural Gas, LLC (East Tennessee), M&N U.S., Ozark Gas Transmission, L.L.C. (Ozark Gas Transmission), Big Sandy Pipeline, LLC (Big Sandy), Gulfstream and SESH. The pipeline systems in our U.S. Transmission business receive natural gas from major North American producing regions for delivery to their respective markets. A majority of contracted transportation volumes are under long-term firm service agreements, where customers reserve capacity in the pipeline. Interruptible services, where customers can use capacity if it is available at the time of the request, are provided on a short-term or seasonal basis.
U.S. Transmission provides natural gas storage services through Saltville Gas Storage Company L.L.C. (Saltville), Market Hub, Steckman Ridge, Bobcat and Texas Eastern’s facilities. Gathering services are provided through Ozark Gas
5
Gathering, L.L.C. (Ozark Gas Gathering). In the course of providing transportation services, U.S. Transmission also processes natural gas on our Texas Eastern system.
Demand on the natural gas pipeline and storage systems is seasonal, with the highest throughput occurring during colder periods in the first and fourth quarters, and storage injections occurring primarily during the summer periods. Actual throughput and storage injections/withdrawals do not have a significant effect on revenues or earnings.
Most of U.S. Transmission’s pipeline and storage operations are regulated by the FERC and are subject to the jurisdiction of various federal, state and local environmental agencies.
Texas Eastern
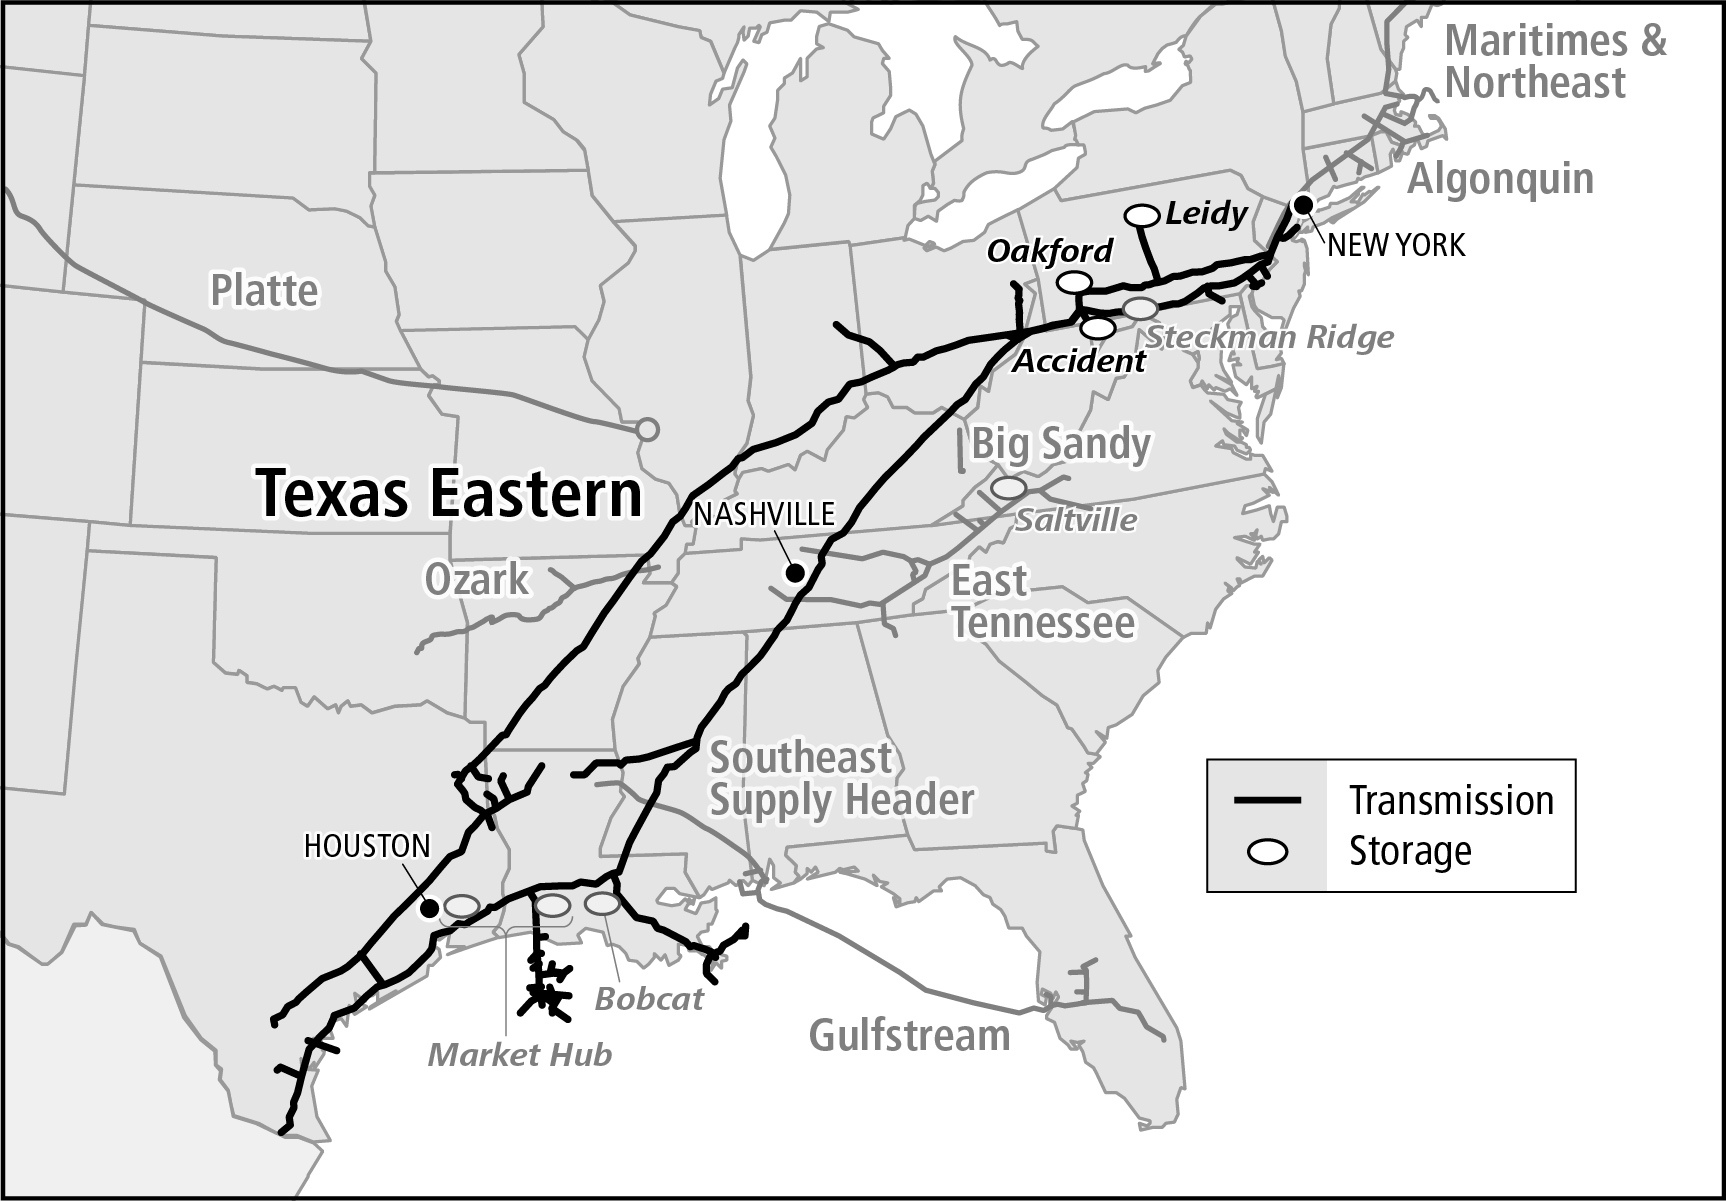
The Texas Eastern natural gas transmission system extends approximately 1,700 miles from producing fields in the Gulf Coast region of Texas and Louisiana to Ohio, Pennsylvania, New Jersey and New York. It consists of two parallel systems, the first of which has one to four large-diameter parallel pipelines and the other with one to three large-diameter pipelines. Texas Eastern’s onshore system consists of approximately 8,700 miles of pipeline and associated compressor stations (facilities that increase the pressure of gas to facilitate its pipeline transmission). Texas Eastern also owns and operates two offshore Louisiana pipeline systems, which extend approximately 100 miles into the Gulf of Mexico and include approximately 400 miles of pipeline. Texas Eastern has two storage facilities in Pennsylvania held through joint ventures and one 100%-owned and operated storage facility in Maryland. Texas Eastern’s total working joint venture capacity in these three facilities is 74 Bcf. In addition, Texas Eastern’s system is connected to Steckman Ridge, a 12 Bcf joint venture storage facility in Pennsylvania, and three affiliated storage facilities in Texas and Louisiana, aggregating 75 Bcf, owned by Market Hub and Bobcat.
6
Algonquin
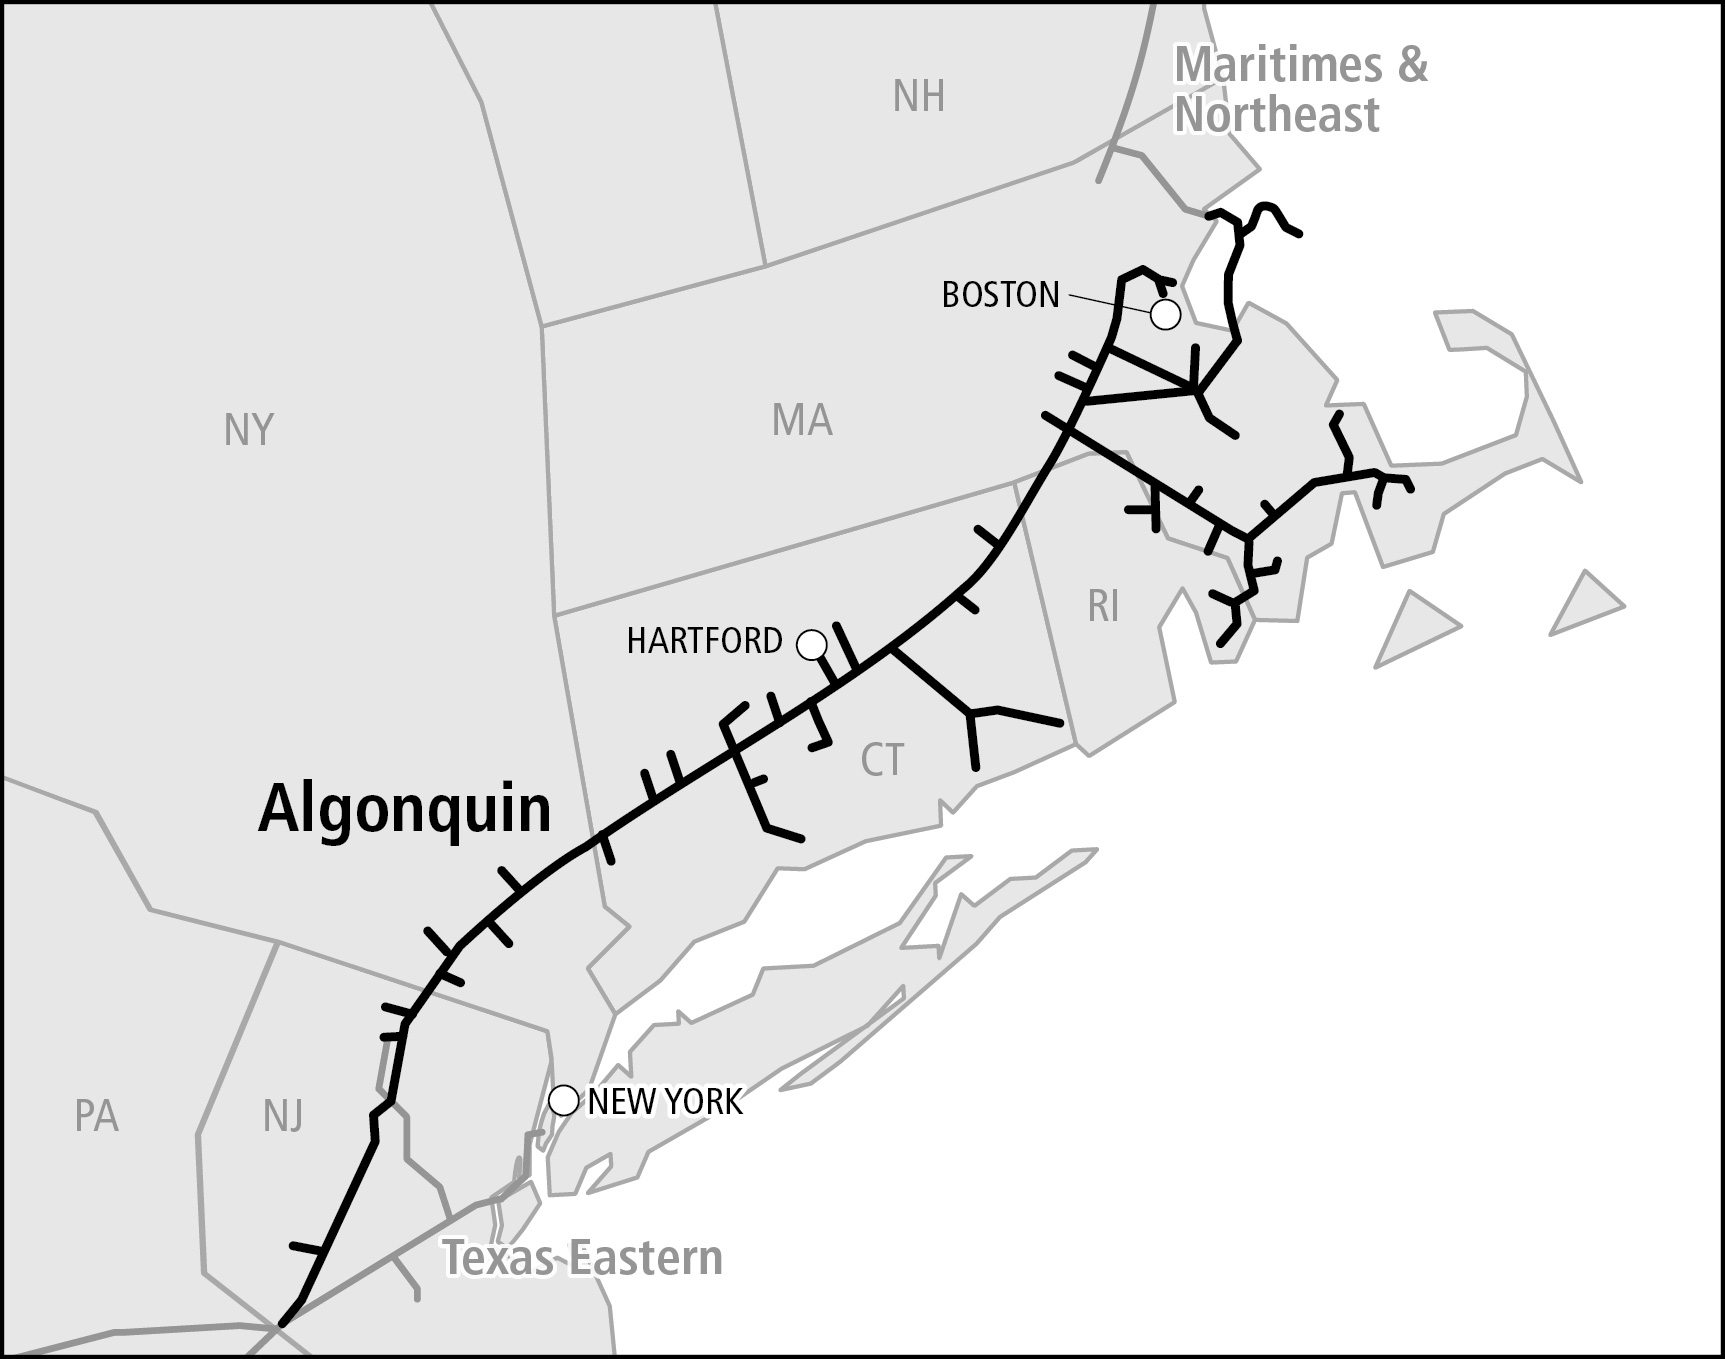
The Algonquin natural gas transmission system, which we directly own 91%, connects with Texas Eastern’s facilities in New Jersey and extends approximately 250 miles through New Jersey, New York, Connecticut, Rhode Island and Massachusetts where it connects to M&N U.S. The system consists of approximately 1,130 miles of pipeline with associated compressor stations.
7
East Tennessee
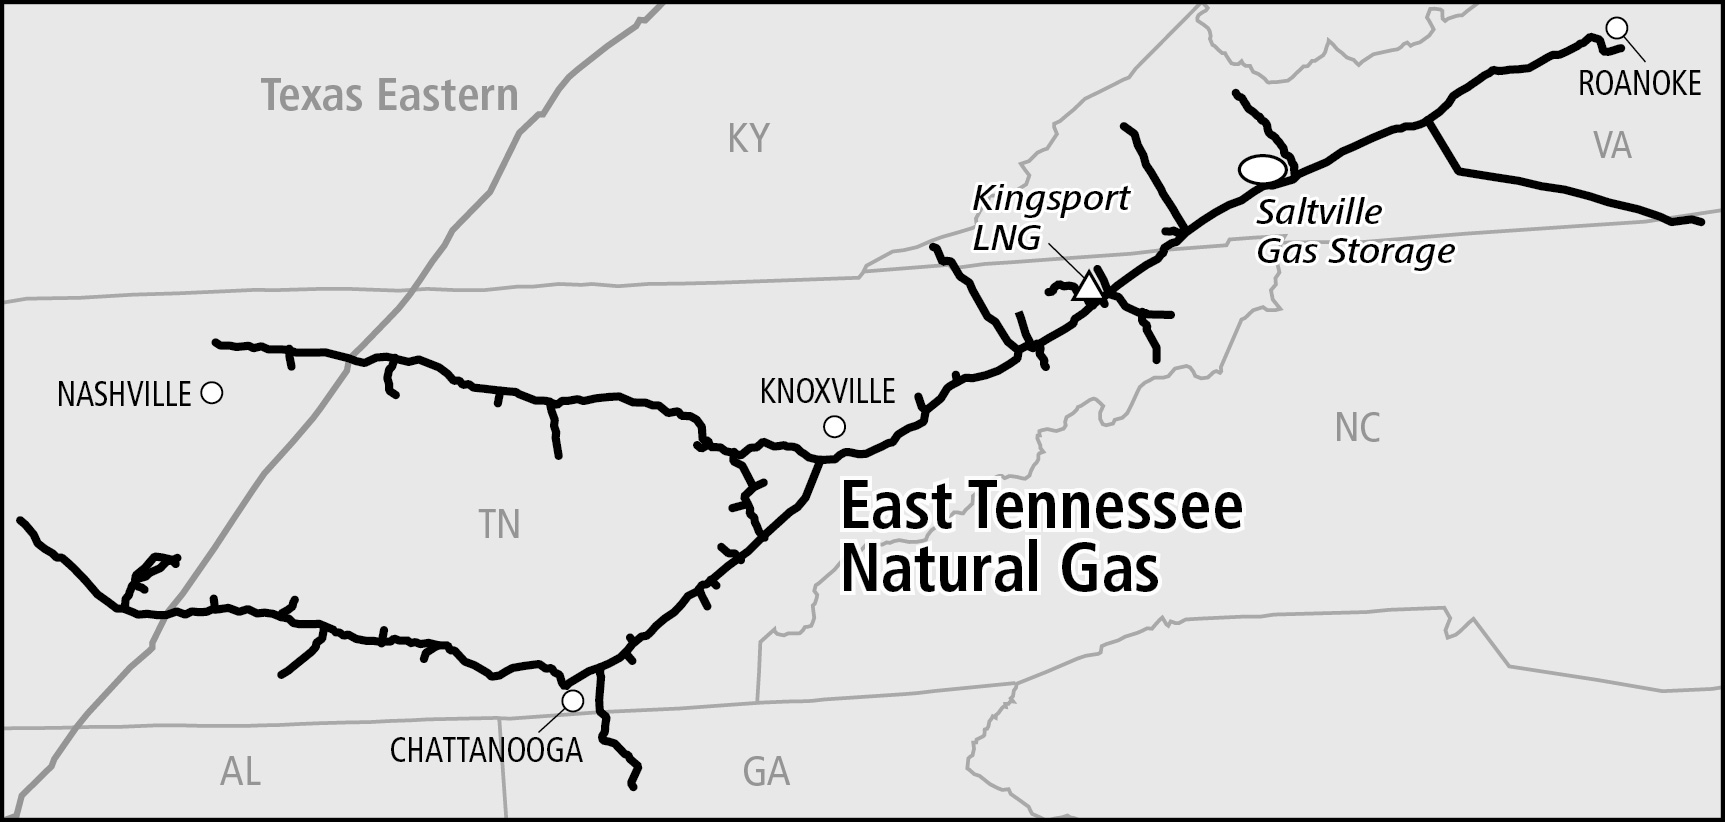
East Tennessee’s natural gas transmission system crosses Texas Eastern’s system at two locations in Tennessee and consists of two mainline systems totaling approximately 1,500 miles of pipeline in Tennessee, Georgia, North Carolina and Virginia, with associated compressor stations. East Tennessee has a liquefied natural gas, (LNG), natural gas that has been converted to liquid form, storage facility in Tennessee with a total working capacity of 1 Bcf. East Tennessee also connects to the Saltville storage facilities in Virginia that have a working gas capacity of approximately 5 Bcf.
8
Maritimes & Northeast Pipeline
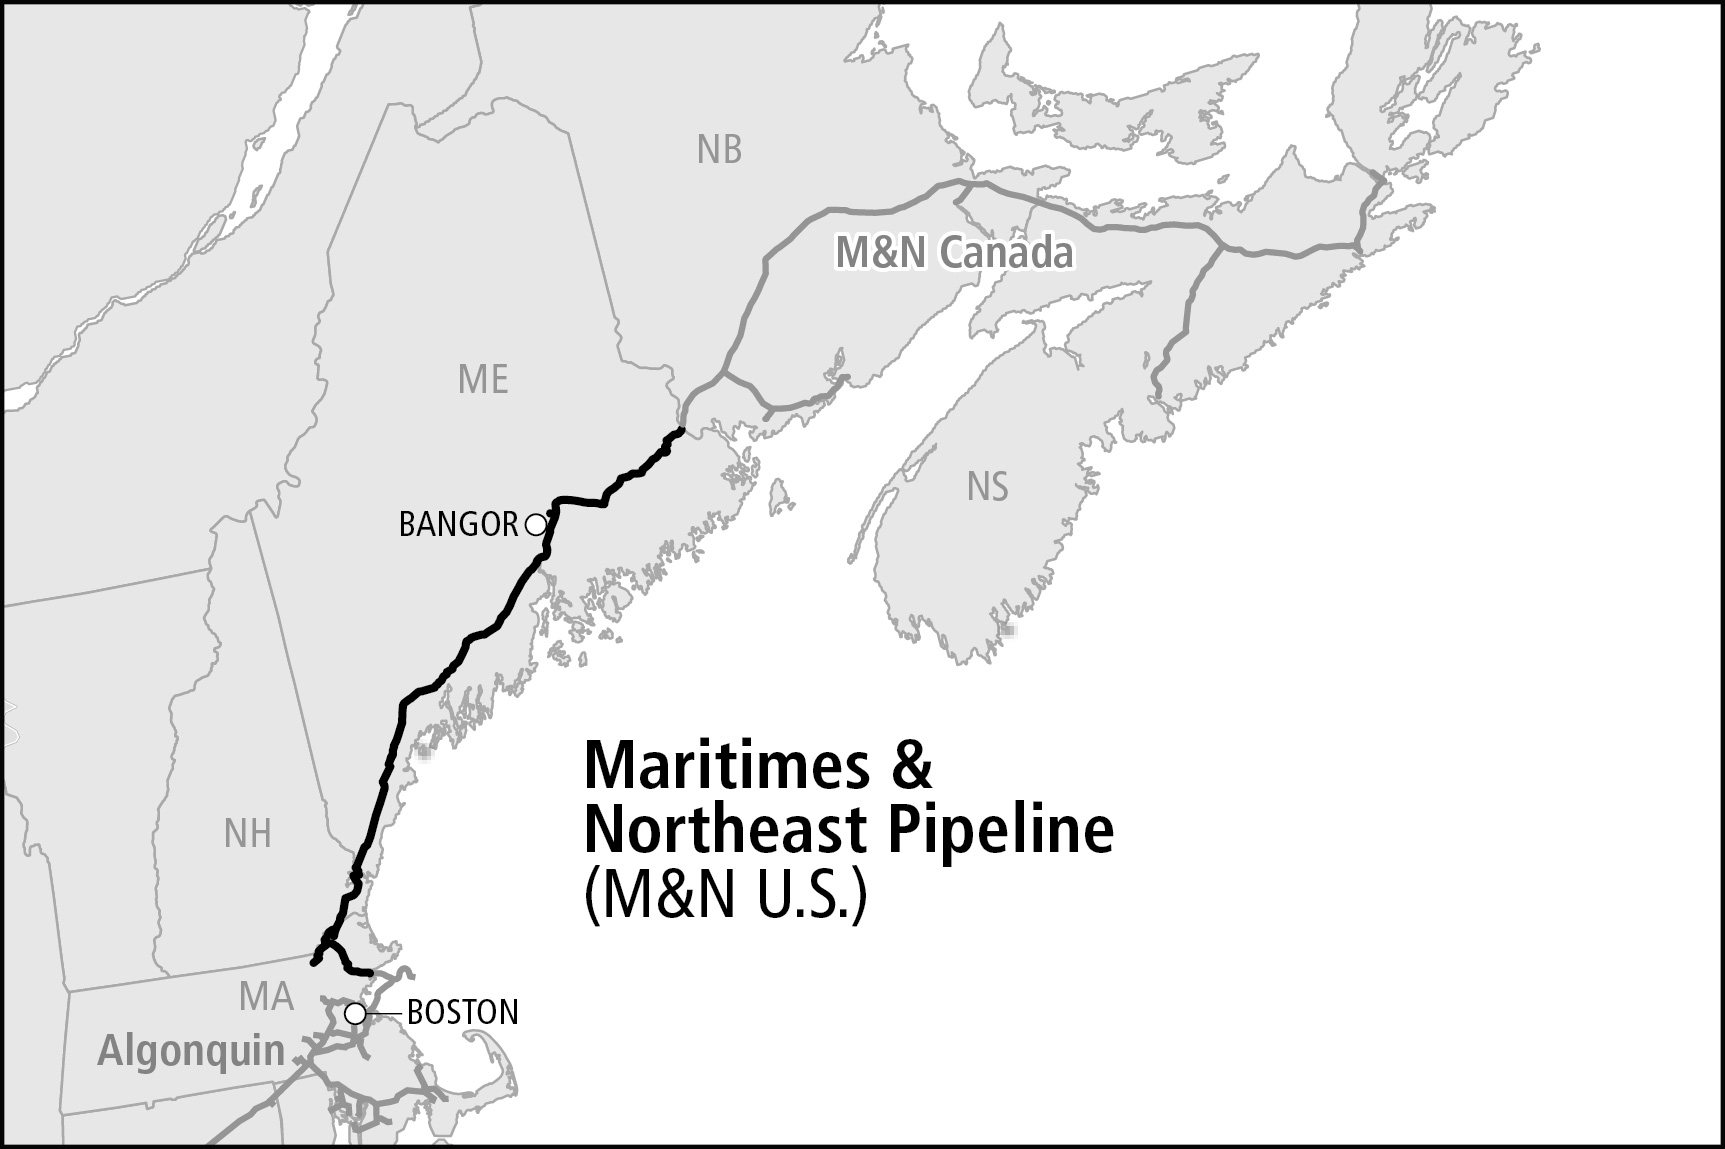
M&N U.S. is owned 78% directly by us, with affiliates of Emera, Inc. and Exxon Mobil Corporation directly owning the remaining 13% and 9% interests, respectively. M&N U.S. is an approximately 350-mile mainline interstate natural gas transmission system which extends from the border of Canada near Baileyville, Maine to northeastern Massachusetts. M&N U.S. is connected to the Canadian portion of the Maritimes & Northeast Pipeline system, Maritimes & Northeast Pipeline Limited Partnership (M&N Canada), which is owned 78% by Spectra Energy. M&N U.S. facilities include compressor stations, with a market delivery capability of approximately 0.8 billion cubic feet per day (Bcf/d) of natural gas. The pipeline’s location and key interconnects with our transmission system link regional natural gas supplies to the northeast U.S. markets.
9
Ozark
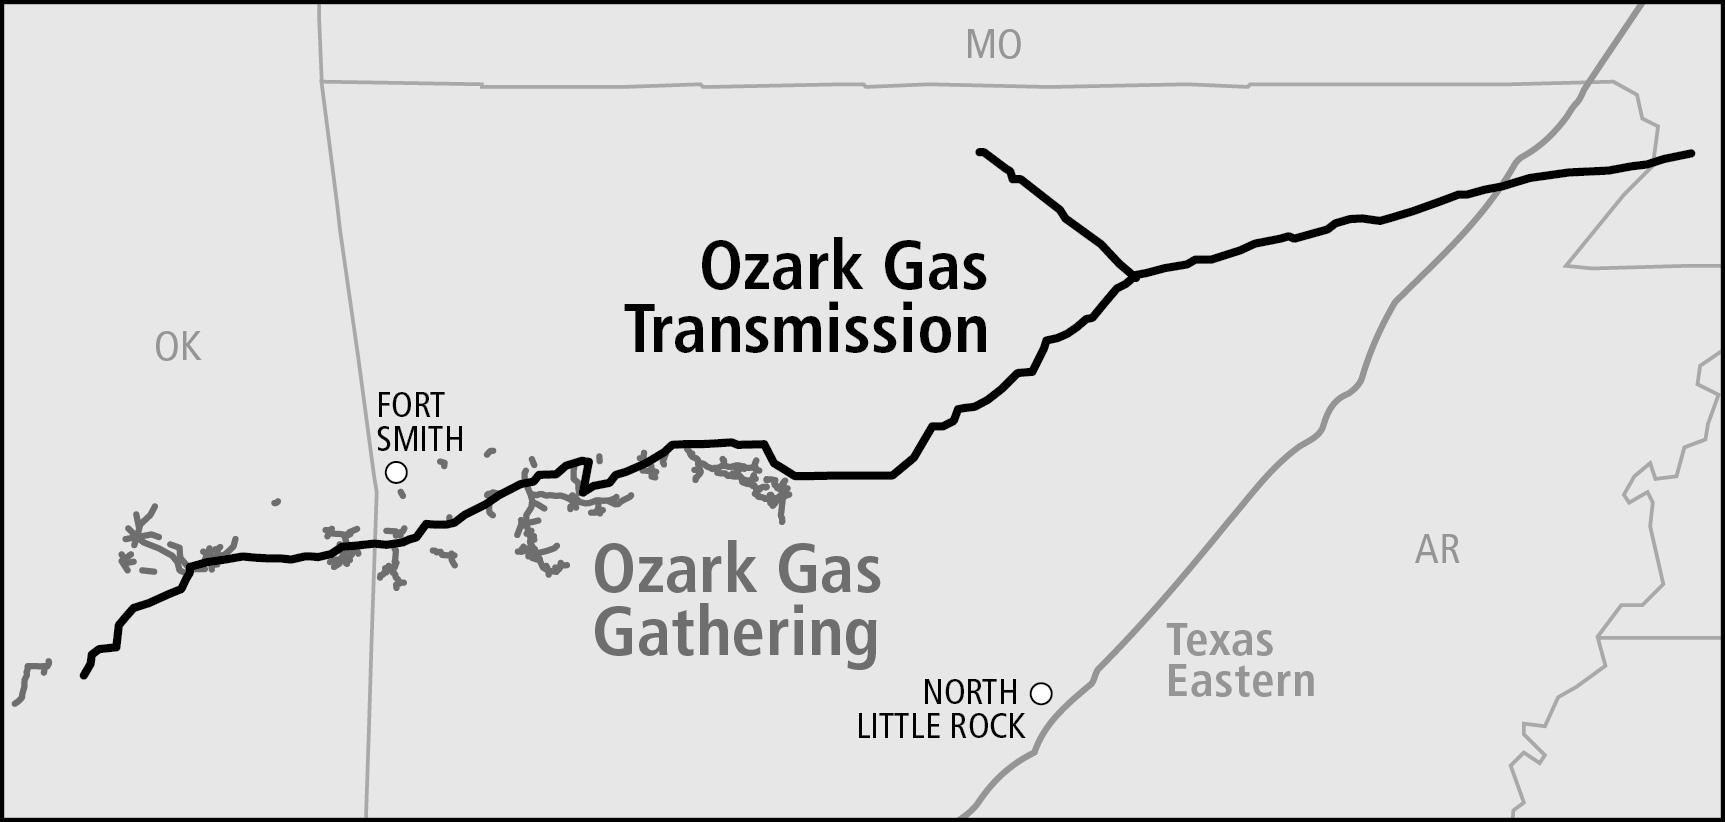
Ozark Gas Transmission consists of an approximately 365-mile natural gas transmission system extending from southeastern Oklahoma through Arkansas to southeastern Missouri. Ozark Gas Gathering consists of an approximately 330-mile natural gas gathering system, with associated compressor stations, that primarily serves Arkoma basin producers in eastern Oklahoma.
10
Big Sandy
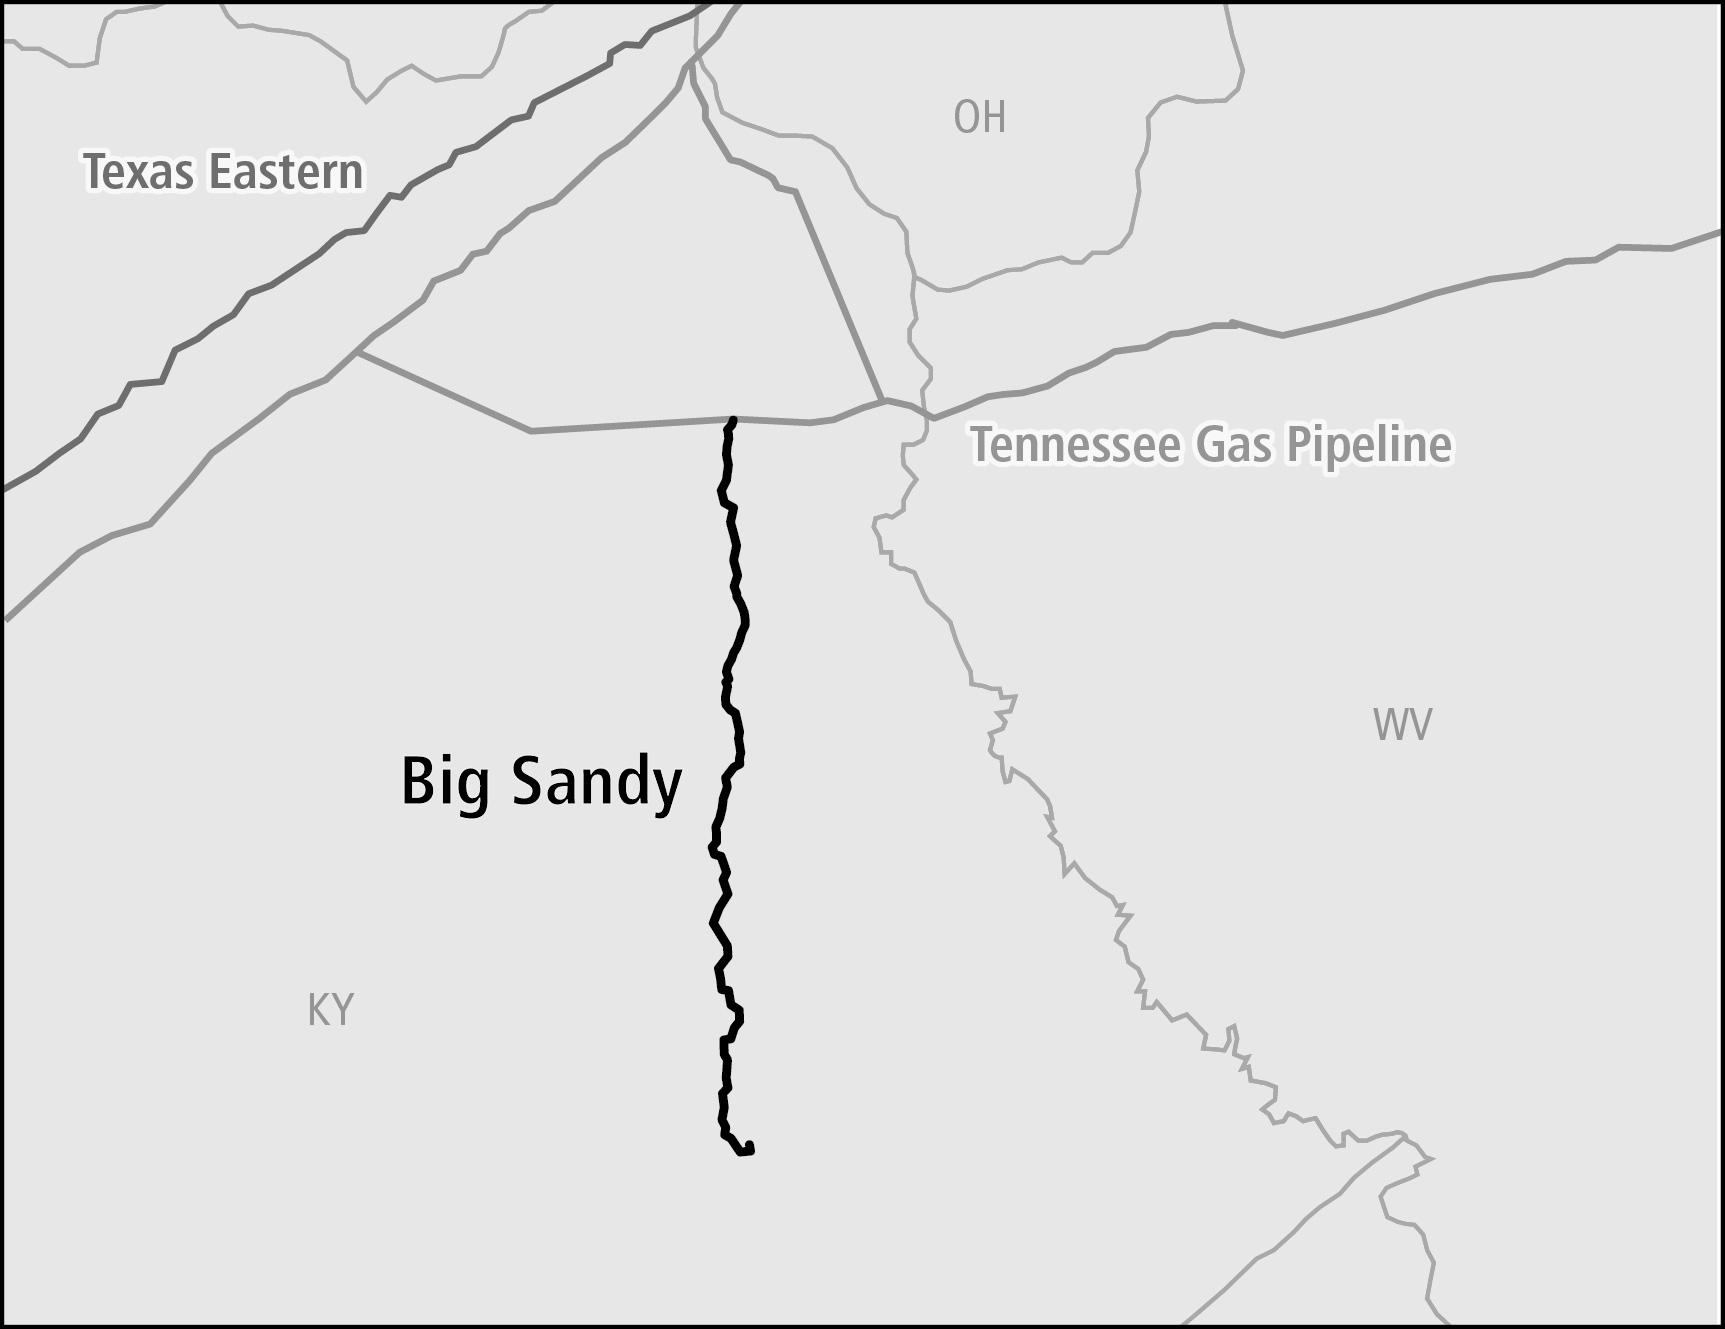
Big Sandy is an approximately 70-mile natural gas transmission system, with associated compressor stations, located in eastern Kentucky. Big Sandy’s interconnection with the Tennessee Gas Pipeline system links the Huron Shale and Appalachian Basin natural gas supplies to the mid-Atlantic and northeast markets.
11
Gulfstream
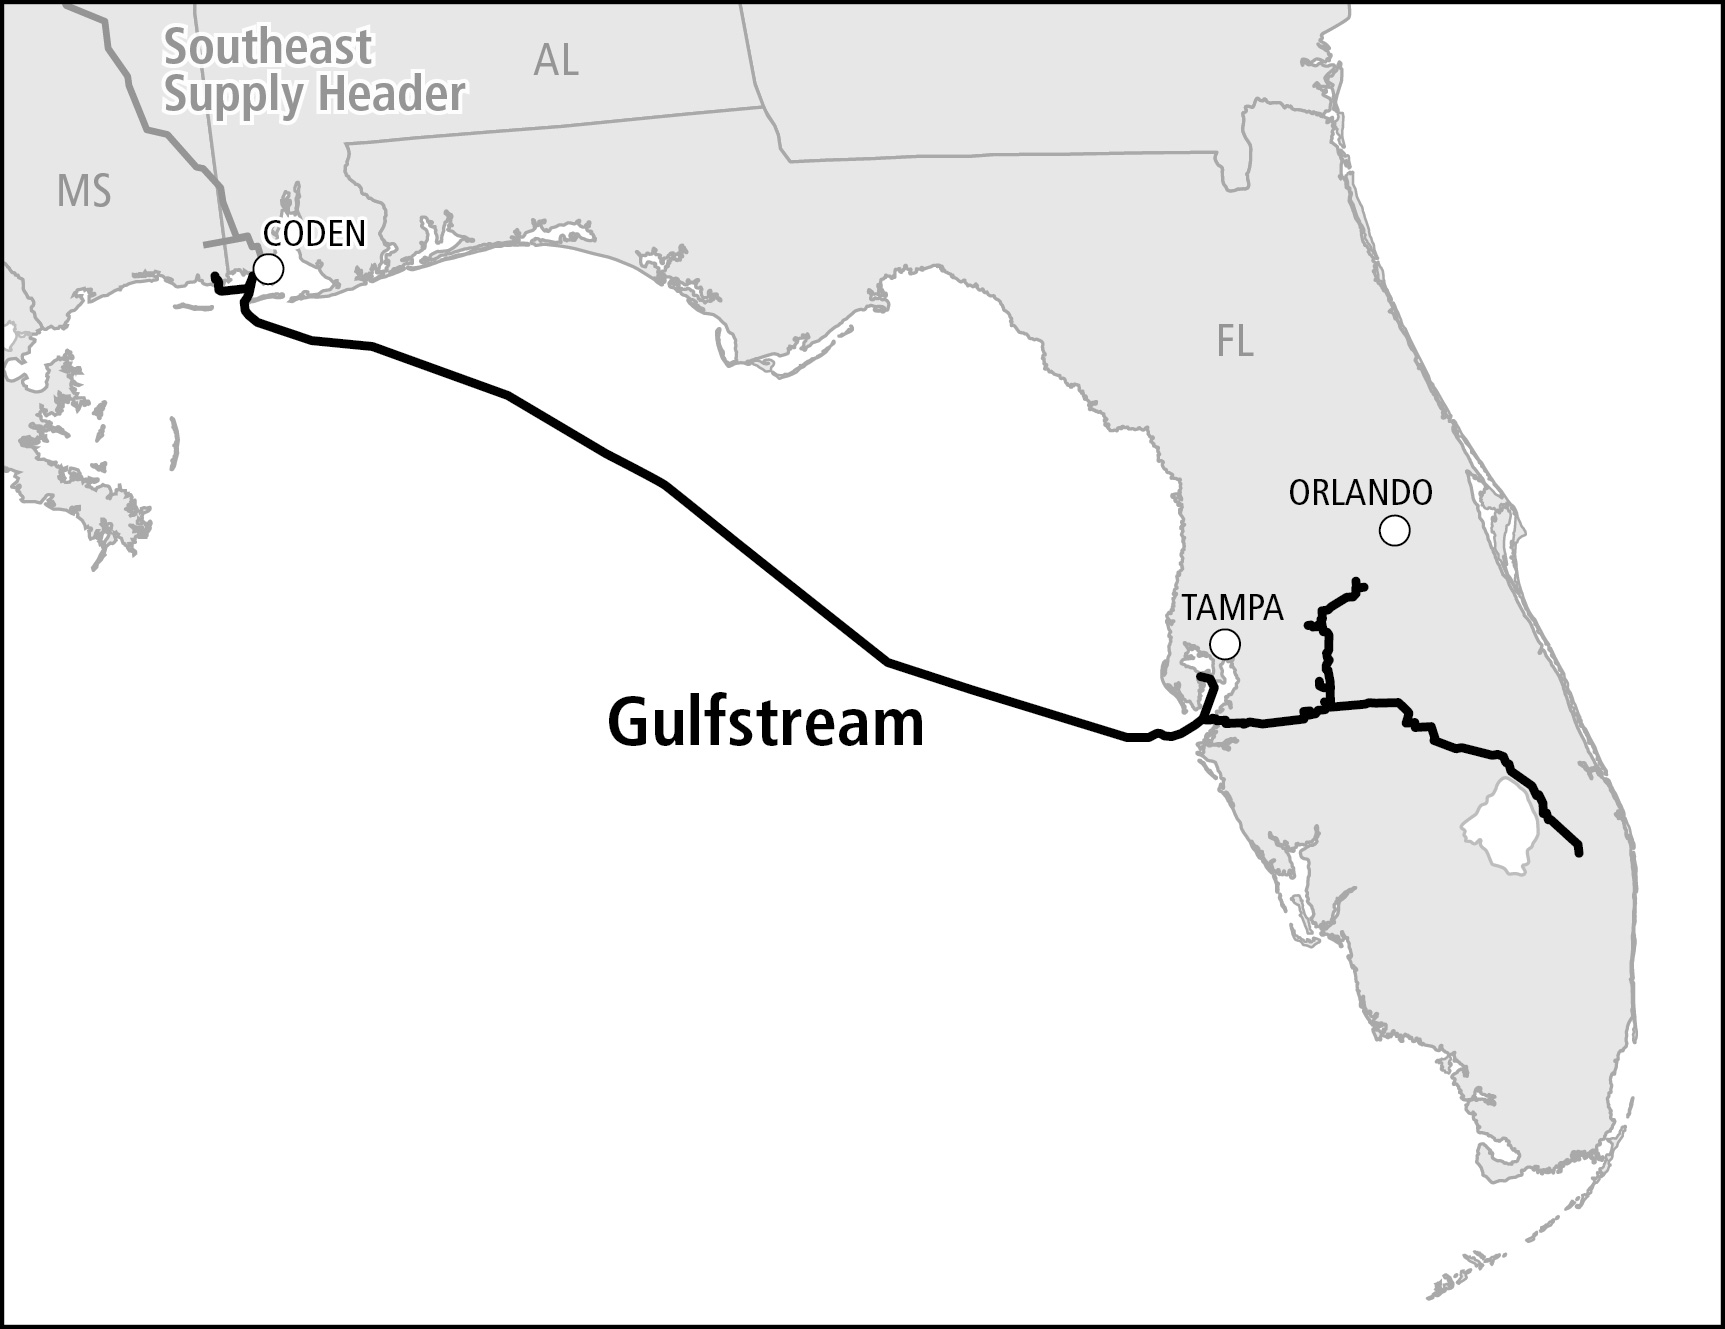
Gulfstream is an approximately 745-mile interstate natural gas transmission system, with associated compressor stations, operated jointly by us and The Williams Companies, Inc. (Williams). Gulfstream transports natural gas from Mississippi, Alabama, Louisiana and Texas, crossing the Gulf of Mexico to markets in central and southern Florida. Gulfstream is owned 50% directly by us and 50% by affiliates of Williams. Our investment in Gulfstream is accounted for under the equity method of accounting.
12
SESH
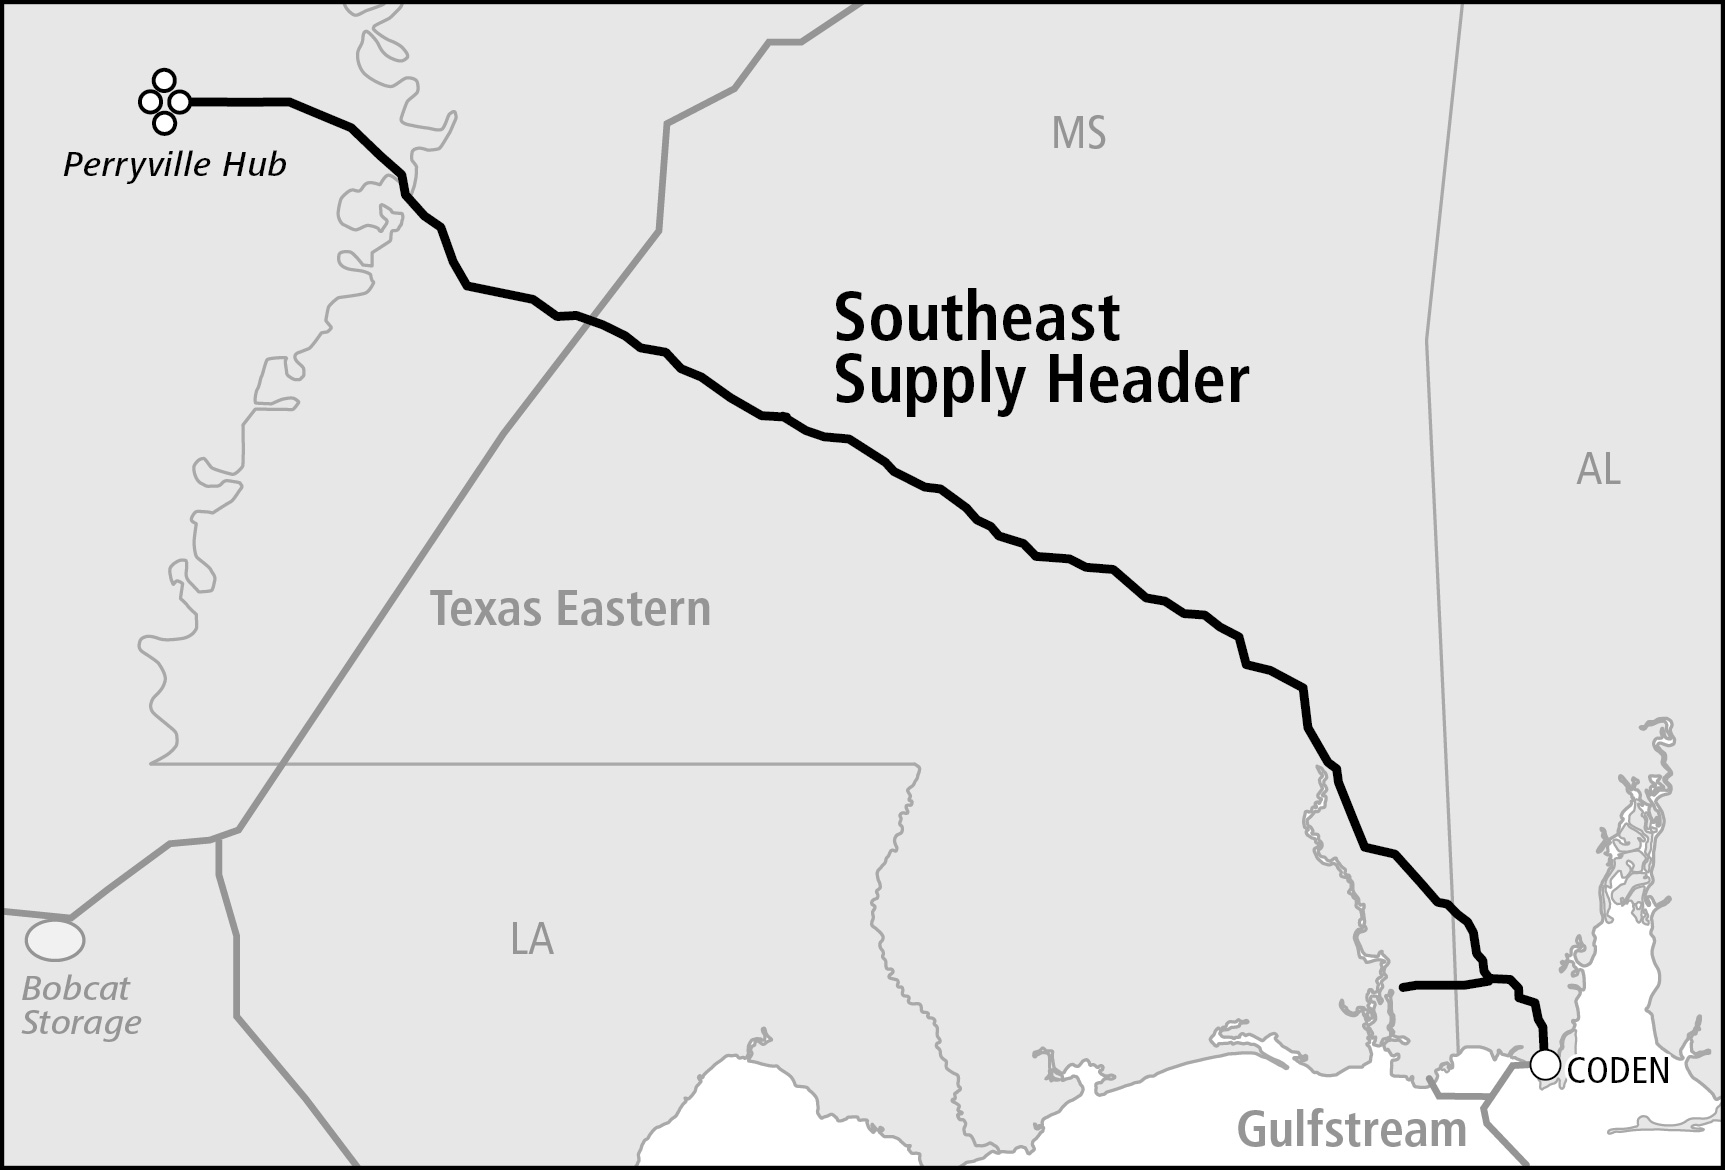
SESH, an approximately 290-mile natural gas transmission system, with associated compressor stations, is operated jointly by Spectra Energy and CenterPoint Energy Southeastern Pipelines Holding, LLC (CenterPoint). SESH extends from the Perryville Hub in northeastern Louisiana where the emerging shale gas production of eastern Texas, northern Louisiana and Arkansas, along with conventional production, is reached from six major interconnections. SESH extends to Alabama, interconnecting with 14 major north-south pipelines and three high-deliverability storage facilities. SESH is owned 50% directly by us and 50% by Enable Midstream Partners, LP, collectively. Our investment in SESH is accounted for under the equity method of accounting.
13
Market Hub
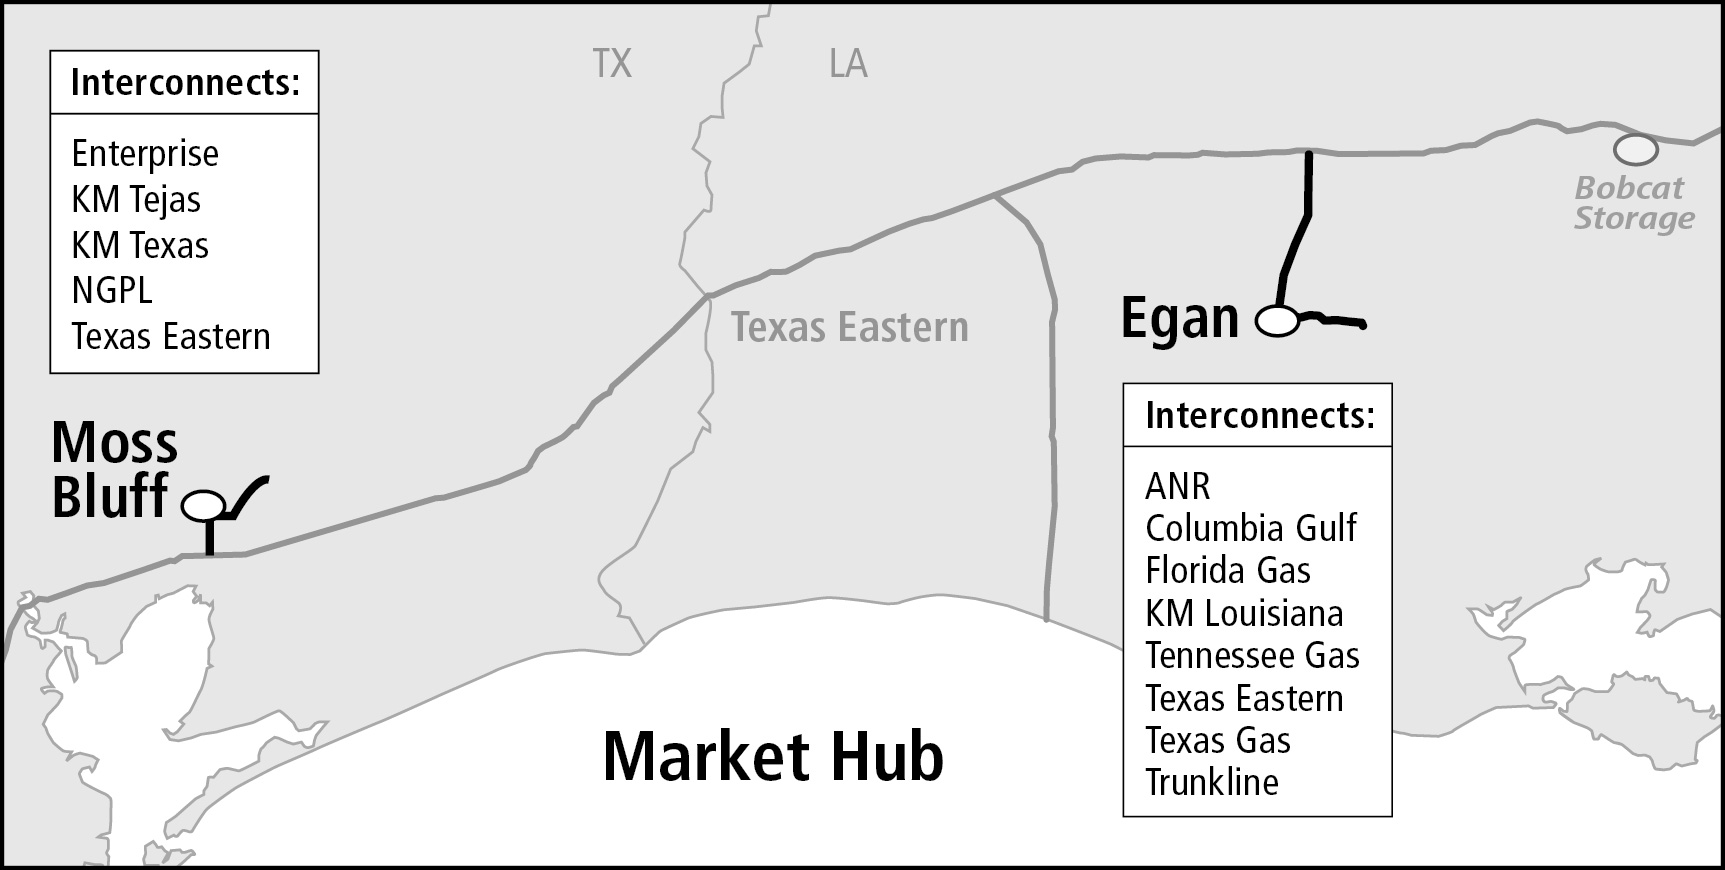
Market Hub owns and operates two natural gas storage facilities, Moss Bluff and Egan, with a total storage capacity of approximately 46 Bcf. The Moss Bluff facility consists of four salt dome storage caverns located in southeast Texas, with access to five pipeline systems including the Texas Eastern system. The Egan facility consists of four salt dome storage caverns located in south central Louisiana, with ten interconnections serving eight pipeline systems, including the Texas Eastern system.
Saltville
Saltville owns and operates natural gas storage facilities in Virginia with a total storage capacity of approximately 5 Bcf, interconnecting with East Tennessee’s system. This salt cavern facility offers high-deliverability capabilities and is strategically located near markets in Tennessee, Virginia and North Carolina.
Bobcat
Bobcat, an approximately 29 Bcf salt dome facility, is strategically located on the Gulf Coast near Henry Hub, interconnecting with five major interstate pipelines, including Texas Eastern.
Steckman Ridge
Steckman Ridge is an approximately 12 Bcf depleted reservoir storage facility located in south central Pennsylvania that interconnects with the Texas Eastern and Dominion Transmission, Inc. systems. Steckman Ridge is owned 50% by us and 50% by NJR Steckman Ridge Storage Company. Our investment in Steckman Ridge is accounted for under the equity method of accounting.
Competition
Our natural gas transmission and storage businesses compete with similar facilities that serve our supply and market areas in the transmission and storage of natural gas. The principal elements of competition are location, rates, terms of service, flexibility and reliability of service.
The natural gas transported in our transmission business competes with other forms of energy available to our customers and end-users, including electricity, coal, propane and fuel oils. Factors that influence the demand for natural gas include price changes, the availability of natural gas and other forms of energy, levels of business activity, long-term economic conditions, conservation, legislation, governmental regulations, the ability to convert to alternative fuels, weather and other factors.
14
Customers and Contracts
In general, our natural gas pipelines provide transmission and storage services for LDCs (companies that obtain a major portion of their revenues from retail distribution systems for the delivery of natural gas for ultimate consumption), electric power generators, exploration and production companies, and industrial and commercial customers, as well as energy marketers. Transmission and storage services are generally provided under firm agreements where customers reserve capacity in pipelines and storage facilities. The vast majority of these agreements provide for fixed reservation charges that are paid monthly regardless of the actual volumes transported on the pipelines or injected or withdrawn from our storage facilities, plus a small variable component that is based on volumes transported, injected or withdrawn, which is intended to recover variable costs.
We also provide interruptible transmission and storage services where customers can use capacity if it is available at the time of the request. Interruptible revenues depend on the amount of volumes transported or stored and the associated rates for this interruptible service. New projects placed into service may initially have higher levels of interruptible services at inception. Storage operations also provide a variety of other value-added services including natural gas parking, loaning and balancing services to meet our customers’ needs.
Liquids
Our Liquids business provides transportation and storage of crude oil for customers in central United States and Canada. Our Liquids pipeline system consists of Express-Platte.
Most of Liquids’ pipeline and storage operations are regulated by the FERC and the NEB, and are subject to the jurisdiction of various federal, state and local environmental agencies.
15
Express-Platte
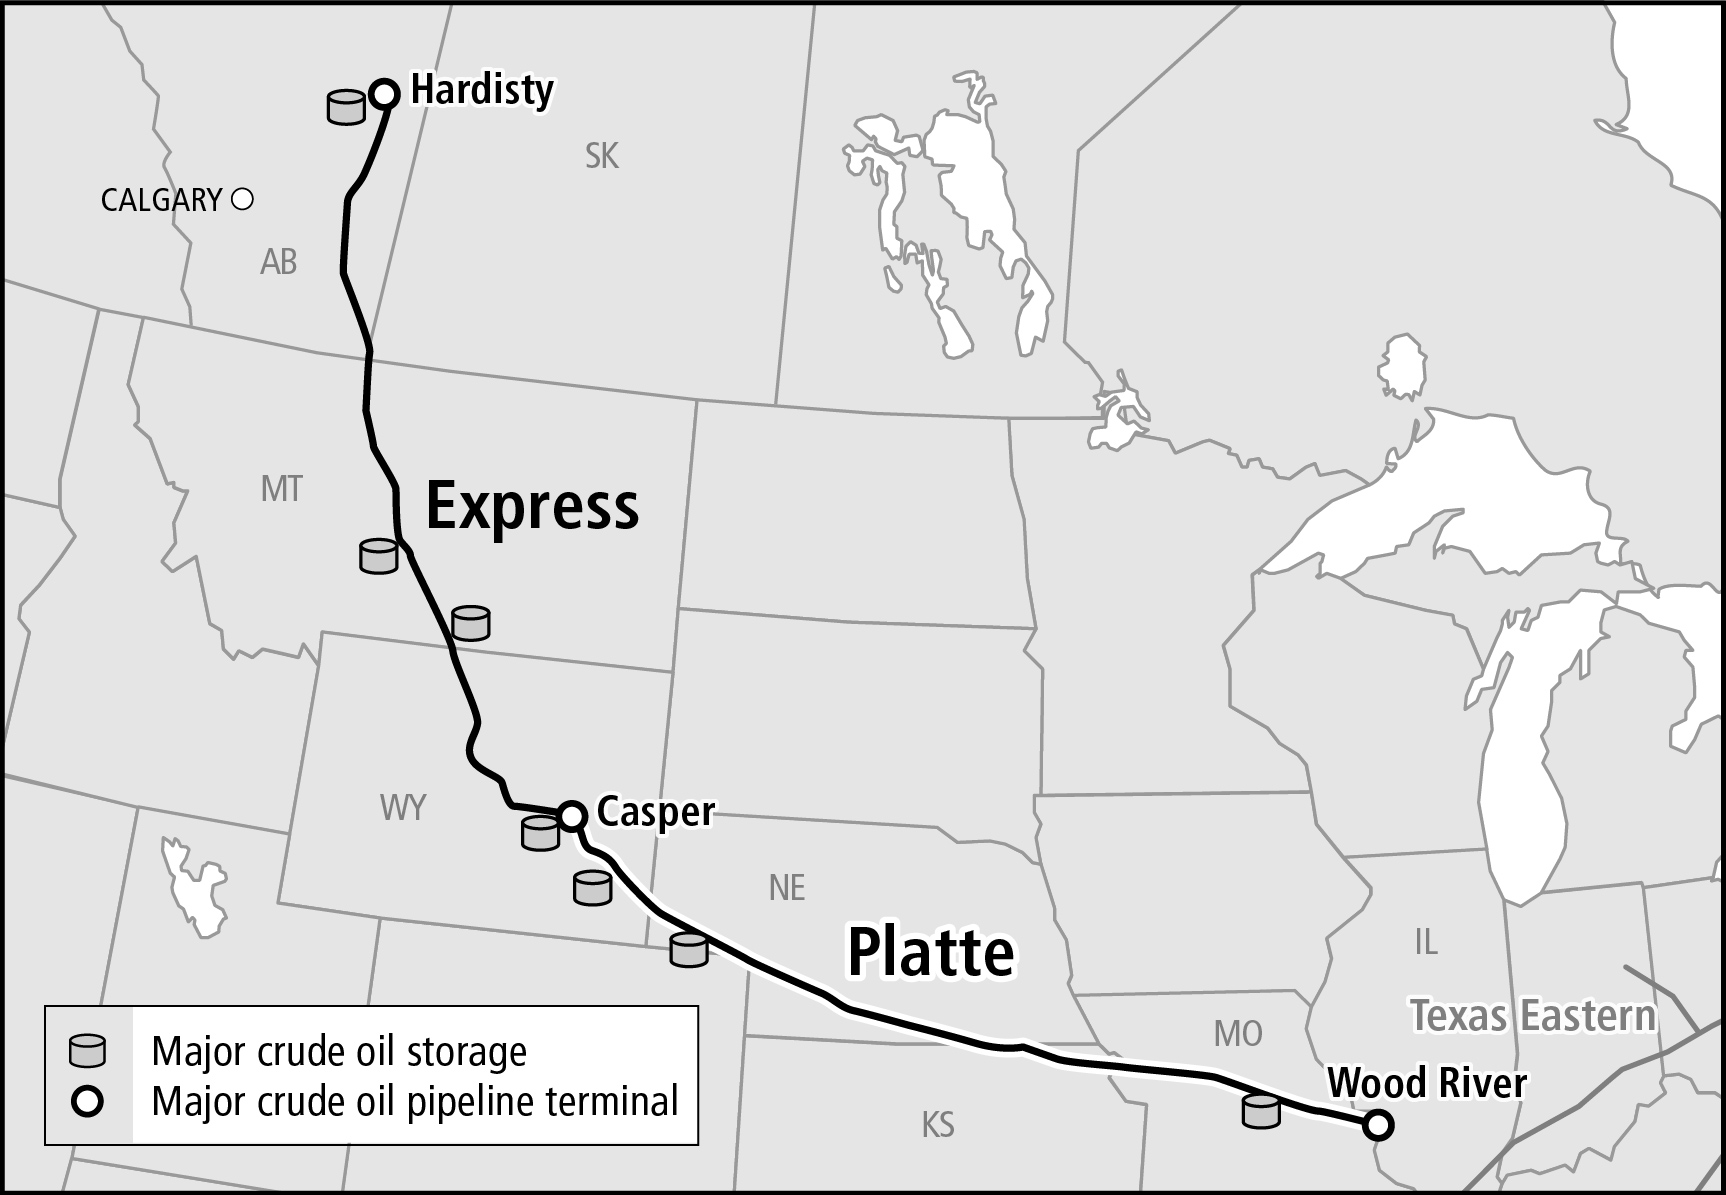
The Express-Platte pipeline system, an approximately 1,700-mile crude oil transportation system, which begins in Hardisty, Alberta, and terminates in Wood River Illinois, is comprised of both the Express and Platte crude oil pipelines and crude oil storage of approximately 5.6 million barrels. The Express pipeline carries crude oil to U.S. refining markets in the Rockies area, including Montana, Wyoming, Colorado and Utah. The Platte pipeline, which interconnects with the Express pipeline in Casper, Wyoming transports crude oil predominantly from the Bakken shale and western Canada to refineries in the Midwest.
Competition
Our crude oil transportation business competes with pipelines, rail, truck and barge facilities that transport crude oil from production areas to refinery markets. The principal elements of competition are location, rates, terms of service, flexibility and reliability of service.
Customers and Contracts
Customers on the Express-Platte system are primarily refineries located in the Rocky Mountain and Midwestern states of the United States. Other customers include oil producers and marketing entities. Express capacity is typically contracted under long-term committed contracts where customers reserve capacity and pay commitment charges based on a contracted volume even if they do not ship. A small amount of Express capacity and all Platte capacity is used by uncommitted shippers who only pay for the pipeline capacity that is actually used in a given month.
Supplies and Raw Materials
We purchase a variety of manufactured equipment and materials for use in operations and expansion projects. The primary equipment and materials utilized in operations and project execution processes are steel pipe, compression engines, pumps, valves, fittings, gas meters and other consumables.
16
We utilize Spectra Energy’s supply chain management function which operates a North American supply chain management network. The supply chain management group uses the economies-of-scale of Spectra Energy to maximize the efficiency of supply networks where applicable. The price of equipment and materials may vary however, perhaps substantially, from year to year.
Regulations
Most of our U.S. gas transmission, crude oil pipeline and storage operations are regulated by the FERC. The FERC regulates natural gas transmission and crude oil transportation in U.S. interstate commerce including the establishment of rates for services. The FERC also regulates the construction of U.S. interstate natural gas pipelines and storage facilities, including the extension, enlargement and abandonment of facilities. In addition, certain operations are subject to oversight by state regulatory commissions. To the extent that the natural gas intrastate pipelines that transport or store natural gas in interstate commerce provide services under Section 311 of the Natural Gas Policy Act of 1978, they are subject to FERC regulations. The FERC may propose and implement new rules and regulations affecting interstate natural gas transmission and storage companies, which remain subject to the FERC’s jurisdiction. These initiatives may also affect certain transmission of gas by intrastate pipelines.
Our gas transmission and storage operations are subject to the jurisdiction of the Environmental Protection Agency (EPA) and various other federal, state and local environmental agencies. See “Environmental Matters” for a discussion of environmental regulation. Our interstate natural gas pipelines are also subject to the regulations of the DOT concerning pipeline safety.
Express-Platte pipeline system rates and tariffs are subject to regulation by the NEB in Canada and the FERC in the United States. In addition, the Platte pipeline also operates as an intrastate pipeline in Wyoming and is subject to jurisdiction by the Wyoming Public Service Commission.
17
Environmental Matters
We are subject to various U.S. federal, state and local laws and regulations, as well as Canadian federal and provincial regulations regarding air and water quality, hazardous and solid waste disposal and other environmental matters.
Environmental laws and regulations affecting our U.S. based operations include, but are not limited to:
• | The Clean Air Act (CAA) and the 1990 amendments to the CAA, as well as state laws and regulations affecting air emissions (including State Implementation Plans related to existing and new national ambient air quality standards), which may limit new sources of air emissions. Our natural gas transmission, storage and gathering assets are considered sources of air emissions and are thereby subject to the CAA. Owners and/or operators of air emission sources, like us, are responsible for obtaining permits for existing and new sources of air emissions and for annual compliance and reporting. |
• | The Federal Water Pollution Control Act (Clean Water Act), which requires permits for facilities that discharge wastewaters into the environment. The Oil Pollution Act (OPA) amended parts of the Clean Water Act and other statutes as they pertain to the prevention of and response to oil spills. The OPA imposes certain spill prevention, control and countermeasure requirements. Although we are primarily a natural gas business, the OPA affects our business primarily because of the presence of liquid hydrocarbons (condensate) in our offshore pipelines. |
• | The Comprehensive Environmental Response, Compensation and Liability Act (CERCLA), which imposes liability for remediation costs associated with environmentally contaminated sites. Under CERCLA, any individual or entity that currently owns or in the past owned or operated a disposal site can be held liable and required to share in remediation costs, as well as transporters or generators of hazardous substances sent to a disposal site. Because of the geographical extent of our operations, we have disposed of waste at many different sites and therefore have CERCLA liabilities. |
• | The Solid Waste Disposal Act, as amended by the Resource Conservation and Recovery Act, which requires certain solid wastes, including hazardous wastes, to be managed pursuant to a comprehensive regulatory regime. As part of our business, we generate solid waste within the scope of these regulations and therefore must comply with such regulations. |
• | The Toxic Substances Control Act, which requires that polychlorinated biphenyl (PCB) contaminated materials be managed in accordance with a comprehensive regulatory regime. Because of the historical use of lubricating oils containing PCBs, the internal surfaces of some of our pipeline systems are contaminated with PCBs, and liquids and other materials removed from these pipelines must be managed in compliance with such regulations. |
• | The National Environmental Policy Act, which requires federal agencies to consider potential environmental effects in their decisions, including site approvals. Many of our capital projects require federal agency review, and therefore the environmental effects of proposed projects are a factor in determining whether we will be permitted to complete proposed projects. |
Environmental laws and regulations affecting our Canadian-based operations include, but are not limited to:
• | The Canadian Environmental Protection Act, which, among other things, requires the reporting of greenhouse gas (GHG) emissions from our operations in Canada. Additional regulations to be promulgated under this Act may require the reduction of GHGs, nitrogen oxides, sulphur oxides, volatile organic compounds and particulate matter. |
• | The Canadian Environmental Assessment Act, 2012 (CEAA 2012) requires the NEB to consider potential environmental effects in its decisions for designated projects. The NEB under its enabling statute also conducts environmental assessments for projects that are not specifically designated under CEAA 2012. In either case, prior to receiving an approval to construct or operate a federally-regulated pipeline or facility, the NEB must consider a series of environmental factors, in particular whether the project has the potential to have adverse environmental effects. These types of assessments occur in relation to both maintenance and capital projects. |
For more information on environmental matters, including possible liability and capital costs, see Part II. Item 8. Financial Statements and Supplementary Data, Notes 5 and 16 of Notes to Consolidated Financial Statements.
Except to the extent discussed in Notes 5 and 16, compliance with international, federal, state, provincial and local provisions regulating the discharge of materials into the environment, or otherwise protecting the environment, is incorporated into the routine cost structure of our partnership and is not expected to have a material effect on our competitive position or consolidated results of operations, financial position or cash flows.
18
Geographic Regions
For a discussion of our Canadian operations and the risks associated with them, see Notes 4 and 15 of Notes to Consolidated Financial Statements.
Employees
We do not have any employees. We are managed by the directors and officers of our general partner. As of December 31, 2016, our general partner and its affiliates have approximately 2,500 employees performing services for our operations, and are solely responsible for providing the employees and other personnel necessary to conduct our operations.
Our Partnership Agreement
Set forth below is a summary of the material provisions of our partnership agreement that relate to available cash and operating surplus:
Available Cash. For any quarter ending prior to liquidation:
(a) the sum of:
(1) all cash and cash equivalents of the partnership and our subsidiaries on hand at the end of that quarter; and
(2) if our general partner so determines, all or a portion of any additional cash or cash equivalents of our partnership and our subsidiaries on hand on the date of determination of Available Cash for that quarter;
(b) less the amount of cash reserves established by our general partner to:
(1) provide for the proper conduct of the business of the partnership and our subsidiaries (including reserves for future capital expenditures and for future credit needs of the partnership and our subsidiaries) after that quarter;
(2) comply with applicable law or any debt instrument or other agreement or obligation to which we or any of our subsidiaries or a part of our assets are subject; and
(3) provide funds for minimum quarterly distributions and cumulative common unit arrearages for any one or more of the next four quarters;
provided, however, that our general partner may not establish cash reserves pursuant to clause (b)(3) immediately above unless our general partner has determined that the establishment of reserves will not prevent us from distributing the minimum quarterly distribution on all common units and any cumulative common unit arrearages thereon for that quarter; and provided, further, that disbursements made by us or any of our subsidiaries or cash reserves established, increased or reduced after the end of that quarter but on or before the date of determination of Available Cash for that quarter shall be deemed to have been made, established, increased or reduced, for purposes of determining Available Cash, within that quarter if our general partner so determines.
Operating Surplus. For any period prior to liquidation, on a cumulative basis and without duplication:
(a) the sum of:
(1) an amount equal to the sum of (A) two times the amount needed for any one quarter for us to pay the minimum quarterly distribution on all units (including the general partner units) and (B) two times the amount in excess of the minimum quarterly distribution for any quarter to pay a distribution on all Common Units at the same per unit amount as was distributed on the Common Units in excess of the minimum quarterly distribution in the immediately preceding quarter, provided the amount in (B) will be deemed to be Operating Surplus only to the extent that the distribution paid in respect of such amounts is paid on Common Units, and
(2) all cash receipts of our partnership and our subsidiaries for the period beginning on the closing date of our initial public offering and ending with the last day of the period, other than cash receipts from interim capital transactions; less
(b) the sum of:
19
(1) operating expenditures for the period beginning on the closing date of our initial public offering and ending with the last day of that period; and
(2) the amount of cash reserves (or our proportionate share of cash reserves in the case of subsidiaries that are not wholly owned) established by our general partner to provide funds for future operating expenditures; provided however, that disbursements made (including contributions to us or our subsidiaries or disbursements on behalf of us or our subsidiaries) or cash reserves established, increased or reduced after the end of that period but on or before the date of determination of Available Cash for that period shall be deemed to have been made, established, increased or reduced for purposes of determining operating surplus, within that period if our general partner so determines.
Additional Information
We were formed on March 19, 2007 as a Delaware master limited partnership. Our principal executive offices are located at 5400 Westheimer Court, Houston, Texas 77056 and our telephone number is 713-627-5400. We electronically file various reports with the Securities and Exchange Commission (SEC), including annual reports on Form 10-K, quarterly reports on Form 10-Q, current reports on Form 8-K and amendments to such reports. The public may read and copy any materials that we file with the SEC at the SEC’s Public Reference Room at 100 F Street, N.E., Washington, D.C. 20549. The public may obtain information on the operation of the Public Reference Room by calling the SEC at 1-800-SEC-0330. The SEC also maintains an internet site that contains reports and information statements, and other information regarding issuers that file electronically with the SEC at http://www.sec.gov. Additionally, information about us, including our reports filed with the SEC, is available through our website at http://www.spectraenergypartners.com. Such reports are accessible at no charge through our website and are made available as soon as reasonably practicable after such material is filed with or furnished to the SEC. Our website and the information contained on that site, or connected to that site, are not incorporated by reference into this report.
20
Item 1A. Risk Factors.
Discussed below are the material risk factors relating to us.
Risks Related to our Business
We may not have sufficient cash from operations to enable us to make cash distributions to common unitholders.
In order to make cash distributions at our minimum distribution rate of $0.30 per common unit per quarter, or $1.20 per unit per year, we will require Available Cash of approximately $95 million per quarter, or $378 million per year, depending on the actual number of common units outstanding. We may not have sufficient Available Cash from operating surplus each quarter to enable us to make cash distributions at the minimum distribution rate. The amount of cash we can distribute on our units principally depends upon the amount of cash we generate from operations, which will fluctuate based on, among other things:
• | the rates charged to, and the volumes contracted by customers for natural gas transmission, storage and gathering services and crude oil transportation; |
• | the overall demand for natural gas in the southeastern, mid-Continent, and Northeast regions of the United States, and the quantities of natural gas available for transport, especially from the Gulf of Mexico, Appalachian and mid-Continent areas, as well as the overall demand for crude oil in central United States and Canada; |
• | regulatory action affecting the demand for natural gas and crude oil, the supply of natural gas and crude oil, the rates we can charge, contracts for services, existing contracts, operating costs and operating flexibility; |
• | changes in environmental, safety and other laws and regulations; |
• | regulatory and economic limitations on the development of import and export LNG terminals in the Gulf Coast region; and |
• | the level of operating and maintenance, and general and administrative costs. |
In addition, the actual amount of Available Cash will depend on other factors, some of which are beyond our control, including:
• | the level of capital expenditures to complete construction projects; |
• | the cost and form of payment of acquisitions; |
• | debt service requirements and other liabilities; |
• | fluctuations in working capital needs; |
• | the ability to borrow funds and access capital markets; |
• | restrictions on distributions contained in debt agreements; and |
• | the amount of cash reserves established by our general partner. |
Our subsidiaries and equity investments conduct operations and own our operating assets, which may affect our ability to make distributions to our unitholders. In addition, we cannot control the amount of cash that will be received from our equity investments, and we may be required to contribute significant cash to fund their operations.
We are a partnership holding company and our operating subsidiaries conduct all of our operations and own all of our operating assets. We have no significant assets other than the ownership interests in our subsidiaries and our equity investments. As a result, our ability to make distributions to our unitholders depends on the performance of these subsidiaries and equity investments and their ability to distribute funds to us. The ability of our subsidiaries and equity investments to make distributions to us may be restricted by, among other things, the provisions of existing and future indebtedness, applicable state partnership and limited liability company laws and other laws and regulations, including FERC policies.
Our equity investments generated approximately 13% of our distributable cash flow in 2016. Spectra Energy operates Steckman Ridge. Spectra Energy shares operations of SESH with CenterPoint and shares operations of Gulfstream with Williams. Accordingly, we do not control the amount of cash distributed to us nor do we control ongoing operational decisions, including the incurrence of capital expenditures that we may be required to fund.
Our lack of control over the operations of our equity investments may mean that we do not receive the amount of cash we expect to be distributed to us. In addition, we may be required to provide additional capital, and these contributions may be material. The equity investments are not prohibited from incurring indebtedness by the terms of their respective limited liability
21
company agreement and general partnership agreements. If they were to incur significant additional indebtedness, it could inhibit their respective abilities to make distributions to us. This lack of control may significantly and adversely affect our ability to distribute cash.
Our natural gas transmission pipeline systems, crude oil transportation pipeline systems and certain of our storage facilities and related assets are subject to regulation by the FERC and the NEB, which could have an adverse effect on our ability to establish transmission, transportation, storage and gathering rates that would allow us to recover the full cost of operating our pipelines, including a reasonable return, and our ability to make distributions.
Our natural gas transmission pipeline systems, crude oil transportation pipeline systems and certain of our storage facilities and related assets are subject to regulation by the FERC and the NEB. The regulators have authority to regulate natural gas pipeline transmission and crude oil pipeline transportation services, including; the rates charged for the services, terms and conditions of service, certification and construction of new facilities, the extension or abandonment of services and facilities, the maintenance of accounts and records, the acquisition and disposition of facilities, the initiation and discontinuation of services, and various other matters.
Action by the FERC and the NEB on currently pending regulatory matters as well as matters arising in the future could adversely affect our ability to establish or charge rates that would cover future increase in their costs, such as additional costs related to environmental matters including any climate change regulation, or even to continue to collect rates that cover current costs, including a reasonable return. We cannot assure unitholders that our pipeline systems will be able to recover all of their costs through existing or future rates.
In addition, we cannot give assurance regarding the likely future regulations under which we will operate our natural gas transmission, crude oil transportation, storage and gathering businesses or the effect such regulation could have on our business, financial condition, results of operations or cash flows, including our ability to make distributions.
Certain transmission services are subject to long-term, fixed-price “negotiated rate” contracts that are not subject to adjustment, even if our cost to perform services exceeds the revenues received from such contracts, and, as a result, our costs could exceed our revenues received under such contracts.
Under FERC policy, a regulated service provider and a customer may mutually agree to sign a contract for service at a “negotiated rate” which may be above or below the FERC-regulated “recourse rate” for that service. For 2016, 51% of U.S. Transmission’s firm revenues were derived from such negotiated rate contracts. These negotiated rate contracts are not subject to adjustment for increased costs which could be produced by inflation or other factors relating to the specific facilities being used to perform the services. It is possible that the costs to perform services under these negotiated rate contracts will exceed the negotiated rates. If this occurs, it could decrease cash flows from U.S. Transmission.
Increased competition from alternative natural gas transmission, storage and gathering options and alternative fuel sources could have a significant financial effect on us.
We compete primarily with other interstate and intrastate pipelines, storage and gathering facilities in the transmission, storage and gathering of natural gas. Some of these competitors may expand or construct transmission, storage and gathering systems that would create additional competition for the services we provide to our customers. Moreover, Spectra Energy and its affiliates are not limited in their ability to compete with us. Further, natural gas also competes with other forms of energy available to our customers, including electricity, coal and fuel oils.
The principal elements of competition among natural gas transmission, storage and gathering assets are location, rates, terms of service, access to natural gas supplies, flexibility and reliability. The FERC’s policies promoting competition in natural gas markets are having the effect of increasing the natural gas transmission, storage and gathering options for our traditional customer base. As a result, we could experience some “turnback” of firm capacity as existing agreements expire. If our pipelines and storage facilities are unable to remarket this capacity or can remarket it only at substantially discounted rates compared to previous contracts, they may have to bear the costs associated with the turned back capacity. Increased competition could reduce the volumes of natural gas transported, stored or gathered by our systems or, in cases where we do not have long-term fixed rate contracts, could force us to lower our transmission, storage or gathering rates. Competition could intensify the negative effect of factors that significantly decrease demand for natural gas in the markets served by our pipeline systems, such as competing or alternative forms of energy, a recession or other adverse economic conditions, higher fuel costs and taxes or other governmental or regulatory actions that directly or indirectly increase the cost or limit the use of natural gas. Our ability to renew or replace existing contracts at rates sufficient to maintain current revenues and cash flows could be adversely affected by the activities of our competitors. All of these competitive pressures could have an adverse effect on our business, results of operations, financial condition or cash flows, including our ability to make distributions.
22
The lack of availability of natural gas and oil resources may cause customers to seek alternative energy resources, which could materially affect our revenues, earnings and cash flows.
Our natural gas and oil businesses are dependent on the continued availability of natural gas and oil production and reserves. Prices for natural gas and oil, regulatory limitations on the development of natural gas and oil supplies or a shift in supply sources could adversely affect development of additional reserves and production that are accessible by our pipeline and gathering assets. Lack of commercial quantities of natural gas and oil available to these assets could cause customers to seek alternative energy resources, thereby reducing their reliance on our services, which in turn would materially affect our revenues, earnings and cash flows, including our ability to make distributions.
We may be unable to secure renewals of long-term transportation agreements, which could expose our transportation volumes and revenues to increased volatility.
We may be unable to secure renewals of long-term transportation agreements in the future for our natural gas transmission and crude oil transportation businesses as a result of economic factors, lack of commercial gas supply available to our systems, changing gas supply flow patterns in North America, increased competition or changes in regulation. Without long-term transportation agreements, our revenues and contract volumes would be exposed to increased volatility. The inability to secure these agreements would materially affect our business, earnings, financial condition and cash flows.
If third-party pipelines and other facilities interconnected to our pipelines become unavailable to transport natural gas, our revenues and Available Cash could be adversely affected.
We depend upon third-party pipelines and other facilities that provide delivery options to and from our pipelines and storage facilities. Because we do not own these third-party pipelines or facilities, their continuing operation is not within our control. If these or any other pipeline connection were to become unavailable for current or future volumes of natural gas due to repairs, damage to the facility, lack of capacity or any other reason, our ability to operate efficiently and continue shipping natural gas to end-markets could be restricted, thereby reducing revenues. Any temporary or permanent interruption at any key pipeline interconnect could have an adverse effect on our business, results of operations, financial condition or cash flows, including our ability to make distributions.
If we do not complete expansion projects or make and integrate acquisitions our future growth may be limited.
A principal focus of our strategy is to continue to grow the cash distributions on our units by expanding our business. Our ability to grow depends on our ability to complete expansion projects and make acquisitions that result in an increase in cash generated. We may be unable to complete successful, accretive expansion projects or acquisitions for any of the following reasons:
• | an inability to identify attractive expansion projects or acquisition candidates or we are outbid by competitors; |
• | an inability to obtain necessary rights-of-way or government approvals, including regulatory agencies; |
• | an inability to successfully integrate the businesses we build or acquire; |
• | we are unable to raise financing for such expansion projects or acquisitions on economically acceptable terms; |
• | incorrect assumptions about volumes, reserves, revenues and costs, including synergies and potential growth; or |
• | we are unable to secure adequate customer commitments to use the newly expanded or acquired facilities. |
We rely on access to short-term and long-term capital markets to finance capital requirements and support liquidity needs, and access to those markets can be affected, particularly if we or our rated subsidiaries are unable to maintain an investment-grade credit rating, which could affect our cash flows or restrict business.
Our business is financed to a large degree through debt. The maturity and repayment profile of debt used to finance investments often does not correlate to cash flows from assets. Accordingly, we rely on access to both short-term and long-term capital markets as a source of liquidity for capital requirements not satisfied by cash flows from operations and to fund investments originally financed through debt. Our senior unsecured long-term debt is currently rated investment-grade by various rating agencies. If the rating agencies were to rate us or our rated subsidiaries below investment-grade, our borrowing costs would increase, perhaps significantly. Consequently, we would likely be required to pay a higher interest rate in future financings and our potential pool of investors and funding sources could decrease.
We maintain a revolving credit facility to provide back-up for our commercial paper program, for borrowings and/or letters of credit. This facility requires us to maintain a consolidated leverage ratio of consolidated indebtedness to consolidated earnings from continuing operations before interest, taxes, and depreciation and amortization (EBITDA), as defined in the
23
agreement. Failure to maintain this covenant could preclude us from issuing commercial paper or letters of credit or borrowing under the revolving credit facility which could affect cash flows or restrict business. Furthermore, if Spectra Energy Partner’s short-term debt rating were to be below tier 2 (for example, A-2 for Standard and Poor’s, P-2 for Moody’s Investor Service and F2 for Fitch Ratings), access to the commercial paper market could be significantly limited. Although this would not affect our ability to draw under our credit facility, borrowing costs could be significantly higher.
If we are not able to access capital at competitive rates, our ability to finance operations and implement our strategy may be affected. Restrictions on our ability to access financial markets may also affect our ability to execute our business plan as scheduled. An inability to access capital may limit our ability to pursue improvements or acquisitions that we may otherwise rely on for future growth. Any downgrade or other event negatively affecting the credit ratings of our subsidiaries could make their costs of borrowing higher or access to funding sources more limited, which in turn could increase our need to provide liquidity in the form of capital contributions or loans to such subsidiaries, thus reducing the liquidity and borrowing availability of the consolidated group.
We may incur significant costs and liabilities as a result of pipeline integrity management program testing and any necessary pipeline repair or preventative or remedial measures.
The DOT has adopted regulations requiring pipeline operators to develop integrity management programs for transmission pipelines located where a leak or rupture could do the most harm in “high consequence areas.” The regulations require operators to:
• | perform ongoing assessments of pipeline integrity; |
• | identify and characterize applicable threats to pipeline segments that could affect a high consequence area; |
• | improve data collection, integration and analysis; |
• | repair and remediate the pipeline as necessary; and |
• | implement preventive and mitigating actions. |
Our actual implementation costs may be affected by industry-wide demand for the associated contractors and service providers. Additionally, should we fail to comply with DOT regulations, we could be subject to penalties and fines.
Our operations are subject to pipeline safety laws and regulations, compliance with which may require significant capital expenditures, increase our cost of operations and affect or limit our business plans.
Our interstate pipeline operations are subject to pipeline safety laws and regulations administered by the Pipeline and Hazardous Materials Safety Administration (PHMSA) of the DOT. These laws and regulations require us to comply with a significant set of requirements for the design, construction, maintenance and operation of our interstate pipelines. These regulations, among other things, include requirements to monitor and maintain the integrity of our pipelines. The regulations determine the pressures at which our pipelines can operate.
PHMSA is designing an Integrity Verification Process intended to create standards to verify maximum allowable operating pressure, and to improve and expand integrity management processes. Additionally, PHMSA will establish standards for storage facilities. There remains uncertainty as to how these standards will be implemented, but it is expected that the changes will impose additional costs on new pipeline projects as well as on existing operations. In this climate of increasingly stringent regulation, pipeline failures or failures to comply with applicable regulations could result in reduction of allowable operating pressures as authorized by PHMSA, which would reduce available capacity on our pipelines. Should any of these risks materialize, it may have an adverse effect on our operations, earnings, financial condition or cash flows.
In Canada, our pipeline operations are subject to pipeline safety regulations overseen by the NEB. Applicable legislation and regulation require us to comply with a significant set of requirements for the design, construction, maintenance and operation of our pipeline. Among other obligations, this regulatory framework imposes requirements to monitor and maintain the integrity of our pipelines.
As in the U.S., several legislative changes addressing pipeline safety in Canada have recently come into force. The changes evidence an increased focus on the implementation of management systems to address key areas such as emergency management, integrity management, safety, security and environmental protection. Other legislative changes have created authority for the NEB to impose administrative monetary penalties for non-compliance with the regulatory regime it
administers.
Compliance with these legislative changes may impose additional costs on new Canadian pipeline projects as well as on
24
existing operations. Failure to comply with applicable regulations could result in a number of consequences which may have an adverse effect on our operations, earnings, financial condition and cash flows.
Restrictions in our credit facility may limit our ability to make distributions and may limit our ability to capitalize on acquisition and other business opportunities.
The operating and financial restrictions and covenants in our credit facility and any future financing agreements could restrict our ability to finance future operations or capital needs or to expand or pursue business activities associated with our subsidiaries and equity investments. Our credit facility contains covenants that restrict or limit our ability to:
• | make distributions if any default or event of default, as defined, occurs; |
• | make other restricted distributions or dividends on account of the purchase, redemption, retirement, acquisition, cancellation or termination of partnership interests; |
• | incur additional indebtedness or guarantee other indebtedness; |
• | grant liens or make certain negative pledges; |
• | make certain loans or investments; |
• | engage in transactions with affiliates; |
• | make any material change to the nature of our business from the midstream energy business; |
• | make a disposition of assets; or |
• | enter into a merger, consolidate, liquidate, wind up or dissolve. |
The credit facility contains covenants requiring us to maintain certain financial ratios and tests. The ability to comply with the covenants and restrictions contained in the credit facility may be affected by events beyond our control, including prevailing economic, financial and industry conditions. If market or other economic conditions deteriorate, our ability to comply with these covenants may be impaired. If we violate any of the restrictions, covenants, ratios or tests in our credit facility, the lenders will be able to accelerate the maturity of all borrowings under the credit facility and demand repayment of amounts outstanding, the lenders’ commitment to make further loans to us may terminate, and the operating partnership may be prohibited from making any distributions. We might not have, or be able to obtain, sufficient funds to make these accelerated payments. Any subsequent replacement of our credit facility or any new indebtedness could have similar or greater restrictions.
The credit and risk profile of our general partner and its owner, Spectra Energy, could adversely affect our credit ratings and risk profile, which could increase our borrowing costs or hinder our ability to raise capital.
The credit and business risk profiles of our general partner and Spectra Energy may be factors considered in credit evaluations of us. This is because our general partner controls our business activities, including our cash distribution policy, acquisition strategy and business risk profile. Another factor that may be considered is the financial condition of Spectra Energy, including the degree of its financial leverage and its dependence on cash flow from the partnership to service its indebtedness.
Our credit rating could be adversely affected by the leverage of our general partner or Spectra Energy, as credit rating agencies may consider the leverage and credit profile of Spectra Energy and its affiliates because of their ownership interest in and control of us, and the strong operational links between Spectra Energy and us. Any adverse effect on our credit rating would increase our cost of borrowing or hinder our ability to raise financing in the capital markets, which would impair our ability to grow our business and make distributions.
We are involved in numerous legal proceedings, the outcome of which are uncertain, and resolutions adverse to us could negatively affect our earnings, financial condition and cash flows.
We are subject to numerous legal proceedings. Litigation is subject to many uncertainties, and we cannot predict the outcome of individual matters with assurance. It is reasonably possible that the final resolution of some of the matters in which we are involved could require additional expenditures, in excess of established reserves, over an extended period of time and in a range of amounts that could have a material effect on our earnings and cash flows.
Protecting against potential terrorist activities, including cyber-terrorism, requires significant capital expenditures and a successful terrorist attack could affect our business.
Acts of terrorism and any possible reprisals as a consequence of any action by the U.S. and its allies could be directed against companies operating in the U.S. This risk is particularly relevant for companies, like ours, operating in any energy
25
infrastructure industry that handles volatile gaseous and liquid hydrocarbons. The potential for terrorism, including cyber-terrorism, has subjected our operations to increased risks that could have an adverse effect on our business. In particular, we may experience increased capital and operating costs to implement increased security for our facilities and pipelines, such as additional physical facility and pipeline security, and additional security personnel. Moreover, any physical damage to high profile facilities resulting from acts of terrorism may not be covered, or covered fully, by insurance. We may be required to expend material amounts of capital to repair any facilities, the expenditure of which could adversely affect our business and cash flows. A cyber attack could also lead to a significant interruption in our operations or unauthorized release of confidential or otherwise protected information, which could damage our reputation or lead to financial losses.
Changes in the insurance markets attributable to terrorist attacks may make certain types of insurance more difficult for us to obtain. Moreover, the insurance that may be available to us may be significantly more expensive than our existing insurance coverage. Instability in the financial markets as a result of terrorism or war could also affect our ability to raise capital.
Reductions in demand for natural gas and oil and low market prices of commodities adversely affect our operations and cash flows.
Our regulated businesses are generally economically stable; they are not significantly affected in the short term by changing commodity prices. However, our businesses can all be negatively affected in the long-term by sustained downturns in the economy or long-term conservation efforts, which could affect long-term demand and market prices for natural gas and oil. These factors are beyond our control and could impair the ability to meet long-term goals.
Most of our revenues are based on regulated tariff rates, which include the recovery of certain fuel costs. However, lower overall economic output could reduce the volume of natural gas transported or gathered, and the volume of oil transported, resulting in lower earnings and cash flows. Transmission revenues could be affected by long-term economic declines, resulting in the non-renewal of long-term contracts at the time of expiration. Lower demand, along with lower prices for natural gas and oil, could result from multiple factors that affect the markets where we operate, including:
• | weather conditions, such as abnormally mild winter or summer weather, resulting in lower energy usage for heating or cooling purposes, respectively; |
• | supply of and demand for energy commodities, including any decrease in the production of natural gas and oil could negatively affect our processing and transmission businesses due to lower throughput; and |
• | capacity and transmission service into, or out of, our markets. |
Our business is subject to extensive regulation that affects our revenues, operations and costs.
Our U.S. assets and operations are subject to regulation by various federal, state and local authorities, including regulation by the FERC and by various authorities under federal, state and local environmental laws. Our operations in Canada are subject to regulation by the NEB, and by federal and provincial authorities under environmental laws. Regulation affects almost every aspect of our business, including, among other things, the ability to determine terms and rates for services provided by some of our businesses, make acquisitions, construct, expand and operate facilities, issue equity or debt securities, and make distributions.
In addition, regulators in the U.S. have taken actions to strengthen market forces in the gas pipeline industry, which have led to increased competition. In a number of key markets, natural gas pipeline and storage operators are facing competitive pressure from a number of new industry participants, such as alternative suppliers, as well as traditional pipeline competitors. Increased competition driven by regulatory changes could have a material effect on our business, earnings, financial condition and cash flows.
Execution of our capital projects subjects us to construction risks, increases in labor and material costs, and other risks that may affect our financial results.
A significant portion of our growth is accomplished through the construction of new pipelines and storage facilities as well as the expansion of existing facilities. Construction of these facilities is subject to various regulatory, development, operational and market risks, including:
• | the ability to obtain necessary approvals and permits by regulatory agencies on a timely basis and on acceptable terms and to maintain those approvals and permits issued and satisfy the terms and conditions imposed therein; |
• | the availability of skilled labor, equipment and materials to complete expansion projects; |
26
• | potential changes in federal, state and local statutes and regulations, including environmental requirements, that may prevent a project from proceeding or increase the anticipated cost of the project; |
• | impediments on our ability to acquire rights-of-way or land rights on a timely basis and on acceptable terms; and |
• | the ability to construct projects within anticipated costs, including the risk of cost overruns resulting from inflation or increased costs of equipment, materials or labor, weather, geologic conditions or other factors beyond our control, that may be material; and |
•general economic factors that affect the demand for natural gas infrastructure.
Any of these risks could prevent a project from proceeding, delay its completion or increase its anticipated cost. As a result, new facilities may not achieve their expected investment return, which could affect our earnings, financial position and cash flows.
Market-based storage operations are subject to commodity price risk, which could result in a decrease in our earnings and reduced cash flows.
We have market-based rates for some of our storage operations and sell our storage services based on natural gas market spreads and volatility. If natural gas market spreads or volatility deviate from historical norms or there is significant growth in the amount of storage capacity available to natural gas markets relative to demand, our approach to managing our market-based storage contract portfolio may not protect us from significant variations in storage revenues, including possible declines, as contracts renew.
Our operations are subject to numerous environmental laws and regulations, compliance with which may require significant capital expenditures, increase our cost of operations and affect or limit our business plans, or expose us to environmental liabilities.
We are subject to numerous environmental laws and regulations affecting many aspects of our present and future operations, including air emissions, water quality, wastewater discharges, solid waste and hazardous waste. These laws and regulations can result in increased capital, operating and other costs. These laws and regulations generally require us to obtain and comply with a wide variety of environmental licenses, permits, inspections and other approvals. Compliance with environmental laws and regulations can require significant expenditures, including expenditures for cleanup costs and damages arising out of contaminated properties. In particular, compliance with major Clean Air Act regulatory programs is likely to cause us to incur significant capital expenditures to obtain permits, evaluate offsite impacts of our operations, install pollution control equipment, and otherwise assure compliance. Some states in which we operate are implementing new emissions limits to comply with 2008 ozone standards regulated under the National Ambient Air Quality Standards. In 2015, the ozone standards were lowered even further from 75 parts per billion (ppb) to 70 ppb, which may require states to implement additional emissions regulations. The precise nature of these compliance obligations at each of our facilities has not been finally determined and may depend in part on future regulatory changes. In addition, compliance with new and emerging environmental regulatory programs is likely to significantly increase our operating costs compared to historical levels.
In the U.S., climate change action is evolving at state, regional and federal levels. The Supreme Court decision in Massachusetts v. EPA in 2007 established that GHGs were pollutants subject to regulation under the Clean Air Act. Pursuant to federal regulations, we are currently subject to an obligation to report our GHG emissions at our largest emitting facilities, but are not generally subject to limits on emissions of GHGs, (except to the extent that some GHGs consist of volatile organic compounds and nitrous oxides that are subject to emission limits). In addition, a number of Canadian provinces and U.S. states have joined regional GHG initiatives, and a number are developing their own programs that would mandate reductions in GHG emissions. Public interest groups and regulatory agencies are increasingly focusing on the emission of methane associated with natural gas development and transmission as a source of GHG emissions. However, as the key details of future GHG restrictions and compliance mechanisms remain undefined, the likely future effects on our business are highly uncertain.
For its part, Canada has reaffirmed its strong preference for a harmonized approach with that of the United States. While federal GHG related regulatory design details remain forthcoming, provincial authorities have been actively pursuing related initiatives.
Failure to comply with environmental regulations may result in the imposition of fines, penalties and injunctive measures affecting our operating assets. In addition, changes in environmental laws and regulations or the enactment of new environmental laws or regulations could result in a material increase in our cost of compliance with such laws and regulations. We may not be able to obtain or maintain all required environmental regulatory approvals for our operating assets or development projects. If there is a delay in obtaining any required environmental regulatory approvals, if we fail to obtain or comply with them or if environmental laws or regulations change or are administered in a more stringent manner, the operations
27
of facilities or the development of new facilities could be prevented, delayed or become subject to additional costs. We expect that costs we incur to comply with environmental regulations in the future will have a significant effect on our earnings and cash flows.
Due to the speculative outlook regarding any U.S. federal and state policies, we cannot estimate the potential effect of proposed GHG policies on our future consolidated results of operations, financial position or cash flows. However, such legislation or regulation could materially increase our operating costs, require material capital expenditures or create additional permitting, which could delay proposed construction projects.
Natural gas transmission and storage and crude oil transportation and storage activities involve numerous risks that may result in accidents or otherwise affect our operations.
There are a variety of hazards and operating risks inherent in natural gas gathering and processing, transmission and storage activities, and crude oil transportation and storage, such as leaks, explosions, mechanical problems, activities of third parties and damage to pipelines, facilities and equipment caused by hurricanes, tornadoes, floods, fires and other natural disasters, that could cause substantial financial losses. In addition, these risks could result in significant injury, loss of life, significant damage to property, environmental pollution and impairment of operations, any of which could result in substantial losses. For pipeline and storage assets located near populated areas, including residential areas, commercial business centers, industrial sites and other public gathering areas, the level of damage resulting from these risks could be greater. Therefore, should any of these risks materialize, it could have a material effect on our business, earnings, financial condition and cash flows.
We do not maintain insurance coverage against all of these risks and losses, and any insurance coverage we might maintain may not fully cover the damages caused by those risks and losses. We may elect to self insure a portion of our asset portfolio. Moreover, we do not maintain offshore business interruption insurance. Therefore, should any of these risks materialize, it could have a material effect on our business, earnings, financial condition, results of operations or cash flows, including our ability to make distributions.
We are exposed to the credit risk of our customers.
We are exposed to the credit risk of our customers in the ordinary course of our business. Generally, our customers are rated investment-grade, are otherwise considered creditworthy or provide us security to satisfy credit concerns. A significant amount of our credit exposures for transmission, storage and gathering services are with customers who have an investment-grade rating (or the equivalent based on our evaluation) or are secured by collateral. However, we cannot predict to what extent our business would be impacted by deteriorating conditions in the economy, including possible declines in our customers’ creditworthiness. As a result of future capital projects for which natural gas and oil producers may be the primary customer, our credit exposure with below investment-grade customers may increase. While we monitor these situations carefully and take appropriate measures when deemed necessary, it is possible that customer payment defaults, if significant, could have a material effect on our earnings and cash flows.
Risks Inherent in an Investment in Us
Spectra Energy controls our general partner, which has sole responsibility for conducting our business and managing our operations. Our general partner and its affiliates, including Spectra Energy, have conflicts of interest with us and limited fiduciary duties, and may favor their own interests to the detriment of us.
Spectra Energy owns and controls our general partner. Some of our general partner’s directors, and some of its executive officers, are directors or officers of Spectra Energy or its affiliates. Although our general partner has a fiduciary duty to manage us in a manner beneficial to Spectra Energy and our unitholders, the directors and officers of our general partner have a fiduciary duty to manage our general partner in a manner beneficial to Spectra Energy. Therefore, conflicts of interest may arise between Spectra Energy and its affiliates, including our general partner, on the one hand, and us and our unitholders, on the other hand. In resolving these conflicts of interest, our general partner may favor its own interests and the interests of its affiliates over the interests of our unitholders. These conflicts include, among others, the following situations:
• | neither our partnership agreement nor any other agreement requires Spectra Energy to pursue a business strategy that favors us. Spectra Energy’s directors and officers have a fiduciary duty to make these decisions in the best interests of the owners of Spectra Energy, which may be contrary to our interests; |
• | our general partner is allowed to take into account the interests of parties other than us, such as Spectra Energy and its affiliates, in resolving conflicts of interest; |
• | Spectra Energy and its affiliates are not limited in their ability to compete with us; |
28
• | our general partner may make a determination to receive a quantity of our Class B units in exchange for resetting the target distribution levels related to its incentive distribution rights without the approval of the Conflicts Committee of our general partner or our unitholders; |
• | some officers of Spectra Energy who provide services to us also devote significant time to the business of Spectra Energy and will be compensated by Spectra Energy for the services rendered to it; |
• | our general partner has limited its liability and reduced its fiduciary duties, and has also restricted the remedies available to our unitholders for actions that, without the limitations, might constitute breaches of fiduciary duty. By purchasing common units, unitholders will be deemed to have consented to some actions and conflicts of interest that might otherwise constitute a breach of fiduciary or other duties under applicable law; |
• | our general partner determines the amount and timing of asset purchases and sales, borrowings, issuances of additional partnership securities and reserves, each of which can affect the amount of cash that is distributed to unitholders; |
• | our general partner determines the amount and timing of any capital expenditures and, based on the applicable facts and circumstances, whether a capital expenditure is classified as a maintenance capital expenditure (which reduces operating surplus) or an expansion capital expenditure (which does not reduce operating surplus). This determination can affect the amount of cash that is distributed to our unitholders; |
• | our general partner determines which costs incurred by it and its affiliates are reimbursable by us; |
• | in some instances, our general partner may cause us to borrow funds in order to permit the payment of cash distributions, even if the purpose or effect of the borrowing is to make incentive distributions; |
• | our partnership agreement does not restrict our general partner from causing us to pay it or our affiliates for any services rendered to us or entering into additional contractual arrangements with any of these entities on our behalf; |
• | our general partner intends to limit its liability regarding our contractual and other obligations and, in some circumstances, is entitled to be indemnified by us; |
• | our general partner may exercise its limited right to call and purchase common units if it and its affiliates own more than 80% of the common units; |
• | our general partner controls the enforcement of obligations owed to us by our general partner and its affiliates; and |
• | our general partner decides whether to retain separate counsel, accountants or others to perform services for us. |
Affiliates of our general partner, including Spectra Energy, DCP Midstream, LLC and DCP Midstream Partners, LP, are not limited in their ability to compete with us, which could limit commercial activities or our ability to acquire additional assets or businesses.
Neither our partnership agreement nor the omnibus agreement among us, Spectra Energy and others prohibits affiliates of our general partner, including Spectra Energy, DCP Midstream, LLC and DCP Midstream Partners, LP, from owning assets or engaging in businesses that compete directly or indirectly with us. In addition, Spectra Energy and its affiliates may acquire, construct or dispose of additional transmission, storage and gathering or other assets in the future, without any obligation to offer us the opportunity to purchase or construct any of those assets. Each of these entities is a large, established participant in the midstream energy business and each has significantly greater resources and experience than we have, which may make it more difficult for us to compete with these entities with respect to commercial activities as well as for acquisition candidates. As a result, competition from these entities could adversely affect our results of operations and available cash.
If a unitholder is not an Eligible Holder, such unitholder will not be entitled to receive distributions or allocations of income or loss on common units and those common units will be subject to redemption at a price that may be below the current market price.
In order to comply with certain FERC rate-making policies applicable to entities that pass through taxable income to their owners, we have adopted certain requirements regarding those investors who may own our common and subordinated units. Eligible Holders are individuals or entities subject to United States federal income taxation on the income generated by us or entities not subject to United States federal income taxation on the income generated by us, so long as all of the entity’s owners are subject to such taxation. If a unitholder is not a person who fits the requirements to be an Eligible Holder, such unitholder may not receive distributions or allocations of income and loss on the unitholder’s units and the unitholder runs the risk of having the units redeemed by us at the lower of the unitholder’s purchase price cost or the then-current market price. The redemption price will be paid in cash or by delivery of a promissory note, as determined by our general partner.
29
Cost reimbursements to our general partner and its affiliates for services provided, which will be determined by our general partner, will be substantial and will reduce our distributable cash flow.
Pursuant to an omnibus agreement we entered into with Spectra Energy, our general partner and certain of their affiliates, Spectra Energy will receive reimbursement from us for the payment of operating expenses related to our operations and for the provision of various general and administrative services for our benefit, including costs for rendering administrative staff and support services, and overhead allocated to us. These amounts will be determined by our general partner in its sole discretion. Payments for these services will be substantial and will reduce the amount of distributable cash flow. In addition, under Delaware partnership law, our general partner has unlimited liability for our obligations, such as our debts and environmental liabilities, except for contractual obligations that are expressly made without recourse to our general partner. To the extent our general partner incurs obligations on our behalf, we are obligated to reimburse or indemnify it. If we are unable or unwilling to reimburse or indemnify our general partner, our general partner may take actions to cause us to make payments of these obligations and liabilities. Any such payments could reduce the amount of our cash otherwise available for distribution.
Our partnership agreement limits our general partner’s fiduciary duties to holders of our common units, and restricts the remedies available to holders of our common units for actions taken by our general partner that might otherwise constitute breaches of fiduciary duty.
Our partnership agreement contains provisions that reduce the fiduciary standards to which our general partner would otherwise be held by state fiduciary duty laws. For example, our partnership agreement:
• | permits our general partner to make a number of decisions in its individual capacity, as opposed to in its capacity as our general partner. This entitles our general partner to consider only the interests and factors that it desires, and it has no duty or obligation to give any consideration to any interest of, or factors affecting us, our affiliates or any limited partner; |
• | provides that our general partner will not have any liability to us or our unitholders for decisions made in its capacity as a general partner so long as it acted in good faith, meaning it believed the decision was in the best interests of our partnership; |
• | generally provides that affiliated transactions and resolutions of conflicts of interest not approved by the Conflicts Committee of the board of directors of our general partner acting in good faith and not involving a vote of unitholders must be on terms no less favorable to us than those generally being provided to or available from unrelated third parties or must be “fair and reasonable” to us, as determined by our general partner in good faith. In determining whether a transaction or resolution is “fair and reasonable,” the general partner may consider the totality of the relationships between the parties involved, including other transactions that may be particularly advantageous or beneficial to unitholders; |
• | provides that our general partner and its officers and directors will not be liable for monetary damages to us, our limited partners or assignees for any acts or omissions unless there has been a final and non-appealable judgment entered by a court of competent jurisdiction determining that the general partner or those other persons acted in bad faith or engaged in fraud or willful misconduct or, in the case of a criminal matter, acted with knowledge that the conduct was criminal; and |
• | provides that in resolving conflicts of interest, it will be presumed that in making its decision the general partner or its Conflicts Committee acted in good faith, and in any proceeding brought by or on behalf of any limited partner or us, the person bringing or prosecuting such proceeding will have the burden of overcoming such presumption. |
Our general partner may elect to cause us to issue Class B units to the general partner in connection with a resetting of the target distribution levels related to the general partner’s incentive distribution rights without the approval of the Conflicts Committee of the general partner or holders of our common units and subordinated units. This may result in lower distributions to holders of our common units in certain situations.
Our general partner has the right, at a time when there are no subordinated units outstanding and it has received incentive distributions at the highest level to which it is entitled (48%) for each of the prior four consecutive fiscal quarters, to reset the initial cash target distribution levels at higher levels based on the distribution at the time of the exercise of the reset election. Following a reset election by our general partner, the minimum quarterly distribution amount will be reset to an amount equal to the average cash distribution amount per common unit for the two fiscal quarters immediately preceding the reset election (such amount is referred to as the “reset minimum quarterly distribution”) and the target distribution levels will be reset to correspondingly higher levels based on percentage increases above the reset minimum quarterly distribution amount.
30
In connection with resetting these target distribution levels, our general partner will be entitled to receive a number of Class B units. The Class B units will be entitled to the same cash distributions per unit as our common units and will be convertible into an equal number of common units. The number of Class B units to be issued will be equal to that number of common units whose aggregate quarterly cash distributions equaled the average of the distributions to our general partner on the incentive distribution rights in the prior two quarters. We anticipate that our general partner would exercise this reset right in order to facilitate acquisitions or internal growth projects that would not be sufficiently accretive to cash distributions per common unit without such conversion; however, it is possible that our general partner could exercise this reset election at a time when it is experiencing, or may be expected to experience, declines in the cash distributions it receives related to its incentive distribution rights and may therefore desire to be issued our Class B units, which are entitled to receive cash distributions from us on the same priority as our common units, rather than retain the right to receive incentive distributions based on the initial target distribution levels. As a result, a reset election may cause our common unitholders to experience dilution in the amount of cash distributions that they would have otherwise received had we not issued new Class B units to our general partner in connection with resetting the target distribution levels related to our general partner incentive distribution rights.
Holders of our common units have limited voting rights and are not entitled to elect our general partner or its directors, which could reduce the price at which the common units will trade.
Unlike the holders of common stock in a corporation, unitholders have only limited voting rights on matters affecting our business and, therefore, limited ability to influence management’s decisions regarding our business. Unitholders will not elect our general partner or its board of directors, and will have no right to elect our general partner or board of directors on an annual or other continuing basis. The board of directors of our general partner, including the independent directors, will be chosen entirely by its owners and not by the unitholders. Furthermore, if the unitholders were dissatisfied with the performance of the general partner, they will have little ability to remove the general partner. As a result of these limitations, the price at which the common units will trade could be diminished because of the absence or reduction of a takeover premium in the trading price.
Even if holders of our common units are dissatisfied, they cannot presently remove our general partner without its consent.
The unitholders will be unable to remove our general partner without its consent because the general partner and its affiliates own sufficient units to be able to prevent its removal. The vote of the holders of at least 66 2/3% of all outstanding units voting together as a single class is required to remove our general partner. As of January 31, 2017, our general partner and its affiliates own 75% of our aggregate outstanding common units.
Our partnership agreement restricts the voting rights of unitholders owning 20% or more of our common units.
Our partnership agreement restricts unitholders’ voting rights by providing that any units held by a person that owns 20% or more of any class of units then outstanding, other than our general partner, its affiliates, their transferees and persons who acquired such units with the prior approval of the board of directors of our general partner, cannot vote on any matter. Our partnership agreement also contains provisions limiting the ability of unitholders to call meetings or to acquire information about our operations, as well as other provisions limiting the unitholders’ ability to influence the manner or direction of management.
If we are deemed an “investment company” under the Investment Company Act of 1940, it would adversely affect the price of our common units and could have an adverse effect on our business.
Our assets include 100% ownership interests in various pipelines, as well as 50% equity interests in Gulfstream, SESH and Steckman Ridge. If a sufficient amount of our assets that are comprised of equity investments, other assets acquired in the future, are deemed to be “investment securities” within the meaning of the Investment Company Act of 1940, we would either have to register as an investment company under the Investment Company Act, obtain exemptive relief from the SEC or modify the organizational structure or contract rights to fall outside the definition of an investment company. Although general partner interests are typically not considered “securities” or “investment securities,” there is a risk that our 50% general partner interest in Steckman Ridge could be deemed to be an investment security. In that event, it is possible that our ownership of this interest, combined with all of our current equity investments or assets acquired in the future, could result in us being required to register under the Investment Company Act if we were not successful in obtaining exemptive relief or otherwise modifying the organizational structure or applicable contract rights. Registering as an investment company could, among other things, materially limit our ability to engage in transactions with affiliates, including the purchase and sale of certain securities or other property to or from our affiliates, restrict our ability to borrow funds or engage in other transactions involving leverage and
31
require us to add additional directors who are independent of us or our affiliates. The occurrence of some or all of these events would adversely affect the price of the common units and could have an adverse effect on our business.
Control of our general partner may be transferred to a third party without common unitholder consent.
Our general partner may transfer its general partner interest to a third party in a merger or in a sale of all or substantially all of its assets without the consent of the unitholders. Furthermore, our partnership agreement does not restrict the ability of the owners of our general partner or its parent from transferring all or a portion of their respective ownership interest in the general partner or its parent to a third party. The new owners of our general partner or its parent would then be in a position to replace the board of directors and officers of its parent with its own choices and thereby influence the decisions taken by the board of directors and officers.
Increases in interest rates could adversely affect our unit price and our ability to issue additional equity to make acquisitions, incur debt or for other purposes.
In recent years, the U.S. credit markets have experienced 50-year record lows in interest rates. Interest rates on future credit facilities and debt offerings could be higher than current levels, causing our financing costs to increase accordingly. As with other yield-oriented securities, our unit price is affected by the level of our cash distributions and implied distribution yield. Therefore, changes in interest rates may affect the yield requirements of investors who invest in our units, and a rising interest rate environment could have an adverse effect on our unit price and the ability to issue additional equity to make acquisitions, to incur debt or for other purposes.
We may issue additional units without our common unitholders’ approval, which would dilute our existing common unitholders’ ownership interests.
Our partnership agreement does not limit the number of additional limited partner interests that we may issue at any time without the approval of our unitholders. The issuance by us of additional common units or other equity securities of equal or senior rank will have the following effects:
• | each unitholder’s proportionate ownership interest in us will decrease; |
• | the amount of distributable cash flow on each unit may decrease; |
• | the ratio of taxable income to distributions may increase; |
• | the relative voting strength of each previously outstanding unit may be diminished; and |
• | the market price of the common units may decline. |
Spectra Energy and its affiliates may sell units in the public or private markets, which sales could have an adverse effect on the trading price of the common units.
As of January 31, 2017, Spectra Energy and its affiliates hold an aggregate of 230,489,862 common units. The sale of any of these units in the public or private markets could have an adverse effect on the price of the common units or on any trading market that may develop.
Our general partner has a limited call right that may require our common unitholder to sell the units at an undesirable time or price.
If at any time our general partner and its affiliates own more than 80% of the common units, our general partner will have the right, but not the obligation, which it may assign to any of its affiliates or to us, to acquire all, but not less than all, of the common units held by unaffiliated persons at a price not less than their then-current market price. As a result, our common unitholders may be required to sell their common units at an undesirable time or price and may not receive any return on their investment. A common unitholder may also incur a tax liability upon a sale of their units. As of January 31, 2017, our general partner and its affiliates own approximately 75% of our outstanding common units.
Our common unitholders’ liability may not be limited if a court finds that unitholder action constitutes control of our business.
A general partner of a partnership generally has unlimited liability for the obligations of the partnership, except for those contractual obligations of the partnership that are expressly made without recourse to the general partner. We are organized under Delaware law and conduct business in a number of other states. The limitations on the liability of holders of limited partner interests for the obligations of a limited partnership have not been clearly established in some of the states in which we
32
do business. Our common unitholders could be liable for any and all of our obligations as if our common unitholders were a general partner if a court or government agency determined that:
• | we were conducting business in a state but had not complied with that particular state’s partnership statute; or |
• | our common unitholders’ right to act with other unitholders to remove or replace the general partner, to approve some amendments to our partnership agreement or to take other actions under our partnership agreement constitutes “control” of our business. |
Unitholders may have liability to repay distributions that were wrongfully distributed to them.
Under certain circumstances, unitholders may have to repay amounts wrongfully returned or distributed to them. Under Section 17-607 of the Delaware Revised Uniform Limited Partnership Act, we may not make a distribution to the unitholder if the distribution would cause our liabilities to exceed the fair value of our assets. Delaware law provides that for a period of three years from the date of the impermissible distribution, limited partners who received the distribution and who knew at the time of the distribution that it violated Delaware law will be liable to the limited partnership for the distribution amount. Substituted limited partners are liable for the obligations of the assignor to make contributions to the partnership that are known to the substituted limited partner at the time it became a limited partner and for unknown obligations if the liabilities could be determined from the partnership agreement.
Liabilities to partners on account of their partnership interest and liabilities that are non-recourse to the partnership are not counted for purposes of determining whether a distribution is permitted.
Tax Risks to Common Unitholders
Our tax treatment depends on our status as a partnership for federal income tax purposes, as well as not being subject to a material amount of entity-level taxation. If the Internal Revenue Service (IRS) treats us as a corporation or we otherwise become subject to a material amount of entity-level taxation for federal and state tax purposes, it would substantially reduce the amount of distributable cash flow.
The anticipated after-tax economic benefit of an investment in our common units depends largely on us being treated as a partnership for federal income tax purposes and not becoming subject to a material amount of federal or state taxation. We have not requested, and do not plan to request, a ruling from the IRS on this or any other tax matter affecting us.
If we were treated as a corporation for federal income tax purposes, we would pay federal income tax on our taxable income at the corporate tax rate, which is currently a maximum of 35% and would likely pay state income tax at varying rates. Distributions would generally be taxed again as corporate distributions, and no income, gains, losses or deductions would flow through to the common unitholders. Because a tax would be imposed upon us as a corporation, our distributable cash flow would be substantially reduced. Therefore, treatment of us as a corporation would result in a material reduction in the anticipated cash flow and after-tax return to a common unitholder, likely causing a substantial reduction in the value of our common units.
Under current law, for taxable years beginning after December 31, 2017, we may be required to pay federal income tax as the result of an audit adjustment (as further described below). Furthermore, current law may change so as to cause us to be treated as a corporation for federal income tax purposes or otherwise subject us to other entity-level taxation. In addition, because of widespread state budget deficits and other reasons, several states are evaluating ways to subject partnerships to entity-level taxation through the imposition of state income, franchise and other forms of taxation.
Our partnership agreement provides that if a law is enacted or existing law is modified or interpreted in a manner that subjects us to taxation as a corporation or otherwise subjects us to entity-level taxation for federal, state or local income tax purposes, the minimum quarterly distribution amount and the target distribution levels may be adjusted to reflect the effect of that law.
The U.S. federal income tax treatment of publicly traded partnerships or an investment in our common units could be subject to potential legislative, judicial, or administrative changes and differing interpretations, possibly on a retroactive basis.
The present federal income tax treatment of publicly traded partnerships, including us, or an investment in our common units may be modified by administrative or legislative action or judicial interpretation at any time. For example, from time to time, members of the U.S. Congress, the Treasury Department and the IRS propose and consider substantive changes to the existing federal income tax laws that affect publicly traded partnerships. These changes could eliminate the Qualifying Income Exception upon which we rely for our treatment as a partnership for U.S. federal income tax purposes. We are unable to predict
33
whether any such legislative or regulatory changes or other proposals will ultimately be enacted or adopted. However, it is possible that a change in the law could affect us and may be applied retroactively. Any such changes could negatively impact the value of an investment in our units. Moreover, while we believe the income that we treat as qualifying income satisfies the requirements for qualifying income under applicable legal requirements, including the recently-finalized qualifying income Treasury Regulations, the IRS could take a position that is contrary to our interpretation of (a) Section 7704 of the Internal Revenue Code, (b) the final qualifying income Treasury Regulations, or (c) other applicable guidance.
If for any reason we are taxable as a corporation in any taxable year, our items of income, gain, loss and deduction would be taken into account by us, in determining the amount of our liability for federal income tax, rather than being passed through to our unitholders. Our taxation as a corporation would materially reduce the cash available for distribution to unitholders and thus would likely substantially reduce the value of our units. Any distribution made to a unitholder at a time we are treated as a corporation would be (i) a taxable dividend to the extent of our current or accumulated earnings and profits, then (ii) a nontaxable return of capital to the extent of the unitholder's adjusted tax basis in its units (determined separately for each unit), and thereafter (iii) taxable capital gain.
If the IRS makes audit adjustments to our income tax returns for tax years beginning after December 31, 2017, it may assess and collect any taxes (including any applicable penalties and interest) resulting from such audit adjustment directly from us, in which case our cash available for distribution to our unitholders might be substantially reduced.
Pursuant to the Bipartisan Budget Act of 2015, for tax years beginning after December 31, 2017, if the IRS makes audit adjustments to our income tax returns, it may assess and collect any taxes (including any applicable penalties and interest) resulting from such audit adjustment directly from us. Generally, we expect to elect to have our unitholders take such audit adjustment into account in accordance with their interests in us during the tax year under audit, but there can be no assurance that such election will be effective in all circumstances. If we are unable to have our unitholders take such audit adjustment into account in accordance with their interests in us during the tax year under audit, our current unitholders may bear some or all of the tax liability resulting from such audit adjustment, even if such unitholders did not own units in us during the tax year under audit. If, as a result of any such audit adjustment, we are required to make payments of taxes, penalties and interest, our cash available for distribution to our unitholders might be substantially reduced. These rules are not applicable for tax years beginning on or prior to December 31, 2017.
If the tax authorities contest the federal income tax positions we take, it may adversely affect the market for our common units, and the cost of any tax authority contest would reduce our distributable cash flow.
We have not requested a ruling from the IRS with respect to our treatment as a partnership for federal income tax purposes or any other matter. The IRS may adopt positions that differ from our conclusions. It may be necessary to resort to administrative or court proceedings to sustain some or all of our counsel’s conclusions or the positions we take. A court may not agree with all of our conclusions or positions we take. Any contest with the IRS may materially and adversely affect the market for our common units and the price at which they trade. In addition, the costs of any contest with the IRS would be borne indirectly by the unitholders and our general partner because the costs would reduce our distributable cash flow.
The unitholder may be required to pay taxes on the unitholder’s share of our income even if the unitholder does not receive any cash distributions.
Because the unitholders are treated as partners to whom we allocate taxable income which could be different in amount than the cash distributed, common unitholders are required to pay any federal income taxes and, in some cases, state and local income taxes on the common unitholder’s share of taxable income even if the common unitholders receive no cash distributions from us. The common unitholder may not receive cash distributions from us equal to the unitholder’s share of taxable income or even equal to the actual tax liability that results from that income.
Tax gain or loss on disposition of our common units could be more or less than expected.
If the common unitholder sells its common units, the unitholder will recognize a gain or loss equal to the difference between the amount realized and the common unitholder’s tax basis in those common units. Because distributions in excess of the common unitholder’s allocable share of our net taxable income decrease the common unitholder’s tax basis in the common units, the amount, if any, of such prior excess distributions with respect to the units the unitholder sells will, in effect, become taxable income to the unitholder if the unitholder sells such units at a price greater than the tax basis, even if the price the unitholder receives is less than the original cost. Furthermore, a substantial portion of the amount realized, whether or not representing gain, may be taxed as ordinary income due to potential recapture items, including depreciation recapture. In addition, because the amount realized includes the share of our nonrecourse liabilities, if the common unitholder sells the units, the common unitholder may incur a tax liability in excess of the amount of cash the unitholder receives from the sale.
34
Tax-exempt entities and foreign persons face unique tax issues from owning common units that may result in adverse tax consequences to them.
Investment in common units by tax-exempt entities, such as individual retirement accounts (IRAs), other retirement plans and non-U.S. persons raises issues unique to them. For example, virtually all of our income allocated to organizations that are exempt from federal income tax, including IRAs and other retirement plans, will be unrelated business taxable income and will be taxable to them. Distributions to non-U.S. persons will be reduced by withholding taxes at the highest applicable effective tax rate, and non-U.S. persons will be required to file United States federal tax returns and pay tax on their share of our taxable income. If the unitholder is a tax-exempt entity or a foreign person, the unitholder should consult a tax advisor before investing in our common units.
We treat each purchaser of our common units as having the same tax benefits without regard to the actual common units purchased. The IRS may challenge this treatment, which could adversely affect the value of the common units.
Because we cannot match transferors and transferees of common units and because of other reasons, we have adopted depreciation and amortization positions that may not conform to all aspects of existing U.S. Treasury Regulations. A successful IRS challenge to those positions could adversely affect the amount of tax benefits available to the common unitholder. It also could affect the timing of these tax benefits or the amount of gain from the sale of our common units and could have a negative effect on the value of our common units or result in audit adjustments to the tax returns.
We have adopted certain valuation methodologies that may result in a shift of income, gain, loss and deduction between the general partner and the unitholders. The IRS may challenge this treatment, which could adversely affect the value of the common units.
When we issue additional units or engage in certain other transactions, we determine the fair market value of our assets and allocate any unrealized gain or loss attributable to our assets to the capital accounts of the unitholders and our general partner. Our methodology may be viewed as understating the value of our assets. In that case, there may be a shift of income, gain, loss and deduction between certain unitholders and the general partner, which may be unfavorable to such unitholders. Moreover, subsequent purchasers of common units may have a greater portion of their Internal Revenue Code Section 743(b) adjustment allocated to our tangible assets and a lesser portion allocated to our intangible assets. The IRS may challenge our valuation methods, or our allocation of the Section 743(b) adjustment attributable to tangible and intangible assets, and allocations of income, gain, loss and deduction between the general partner and certain of the unitholders.
A successful IRS challenge to these methods or allocations could adversely affect the amount of taxable income or loss being allocated to the unitholders. It also could affect the amount of gain from the unitholders’ sale of common units and could have a negative effect on the value of the common units or result in audit adjustments to unitholders’ tax returns without the benefit of additional deductions.
The sale or exchange of 50% or more of our capital and profits interests during any twelve-month period will result in the termination of the partnership for federal income tax purposes.
We will be considered to have terminated the partnership for federal income tax purposes if there is a sale or exchange of 50% or more of the total interests in our capital and profits within a twelve-month period. Our termination would, among other things, result in the closing of the taxable year for all unitholders and could result in a deferral of depreciation deductions allowable in computing our taxable income.
We prorate our items of income, gain, loss and deduction between transferors and transferees of our units each month based upon the ownership of our units on the first day of each month, instead of on the basis of the date a particular unit is transferred. The IRS may challenge this treatment, which could change the allocation of items of income, gain, loss and deduction among our unitholders.
We prorate our items of income, gain, loss and deduction for federal income tax purposes between transferors and transferees of our units each month based upon the ownership of our units on the first day of each month, instead of on the basis of the date a particular unit is transferred. The U.S. Department of the Treasury and the IRS issued final Treasury Regulations in 2015 that permit publicly traded partnerships to use a monthly simplifying convention that is similar to ours, but those regulations do not specifically authorize all aspects of the proration method we have adopted. If the IRS were to challenge this method, we could be required to change the allocation of items of income, gain, loss and deduction among our unitholders.
A unitholder whose units are loaned to a “short seller” to cover a short sale of units may be considered as having disposed of those units. If so, the unitholder would no longer be treated for tax purposes as a partner with respect to those units during the period of the loan and may recognize gain or loss from the disposition.
35
Because a unitholder whose units are loaned to a “short seller” to cover a short sale of units may be considered as having disposed of the loaned units, the unitholder may no longer be treated for tax purposes as a partner with respect to those units during the period of the loan to the short seller and the unitholder may recognize gain or loss from such disposition. Moreover, during the period of the loan to the short seller, any of our income, gain, loss or deduction with respect to those units may not be reportable by the unitholder and any cash distributions received by the unitholder as to those units could be fully taxable as ordinary income. Unitholders desiring to assure their status as partners and avoid the risk of gain recognition from a loan to a short seller are urged to modify any applicable brokerage account agreements to prohibit their brokers from borrowing and lending their units.
A common unitholder will likely be subject to state and local taxes and return filing requirements in states where the common unitholder does not live as a result of investing in our common units.
In addition to federal income taxes, a common unitholder will likely be subject to other taxes, including foreign, state and local taxes, unincorporated business taxes and estate, inheritance or intangible taxes that are imposed by the various jurisdictions in which we do business or own property, even if the common unitholder does not live in any of those jurisdictions. The common unitholder will likely be required to file foreign, state and local income tax returns and pay state and local income taxes in some or all of these jurisdictions. Further, the common unitholder may be subject to penalties for failure to comply with those requirements. It is the common unitholder’s responsibility to file all United States federal, foreign, state and local tax returns. Our counsel has not rendered an opinion on the foreign, state or local tax consequences of an investment in the common units.
Item 1B. Unresolved Staff Comments.
None.
Item 2. Properties.
At December 31, 2016, we had over 100 primary facilities located in the United States and Canada. We generally own sites associated with our major pipeline facilities, such as compressor stations. However, we generally operate our transmission pipelines using rights of way pursuant to easements to install and operate pipelines, but we do not own the land. Except as described in Part II. Item 8. Financial Statements and Supplementary Data, Note 13 of Notes to Consolidated Financial Statements, none of our properties were secured by mortgages or other material security interests at December 31, 2016.
Our principal executive offices are located at 5400 Westheimer Court, Houston, Texas 77056, which is a facility leased by Spectra Energy. We also maintain offices in, among other places, Calgary, Alberta. For a description of our material properties, see Item 1. Business.
Item 3. Legal Proceedings.
We have no material pending legal proceedings that are required to be disclosed hereunder. See Note 16 of Notes to Consolidated Financial Statements for discussions of other legal proceedings.
Item 4. Mine Safety Disclosures.
Not applicable.
36
PART II.
Item 5. Market for Registrant’s Common Equity, Related Unitholder Matters and Issuer Purchases of Equity Securities.
Our common units are listed on the NYSE under the symbol “SEP.” The following table sets forth the high and low intra-day sales prices for our common units during the periods indicated, as reported by the NYSE, and the amount of the quarterly cash distributions we paid on each of our common units.
Common Unit Data by Quarter
Distributions Paid in the Quarter per Common Unit | Unit Price Range (a) | ||||||||||
High | Low | ||||||||||
2016 | |||||||||||
First Quarter | $ | 0.63875 | $ | 50.48 | $ | 39.53 | |||||
Second Quarter | 0.65125 | 50.43 | 44.22 | ||||||||
Third Quarter | 0.66375 | 49.45 | 42.58 | ||||||||
Fourth Quarter | 0.67625 | 46.46 | 40.19 | ||||||||
2015 | |||||||||||
First Quarter | $ | 0.58875 | $ | 58.56 | $ | 49.13 | |||||
Second Quarter | 0.60125 | 55.95 | 45.51 | ||||||||
Third Quarter | 0.61375 | 52.49 | 38.25 | ||||||||
Fourth Quarter | 0.62625 | 47.98 | 36.21 | ||||||||
__________
(a) Unit prices represent the intra-day high and low price.
As of January 31, 2017, there were approximately 32 holders of record of our common units. A cash distribution to unitholders of $0.68875 per limited partner unit was declared on February 7, 2017 and is payable on February 28, 2017, which is a $0.0125 per limited partner unit increase over the cash distribution of $0.67625 per limited partner unit paid on November 29, 2016.
37
Unit Performance Graph
The following graph reflects the comparative changes in the value from January 1, 2012 through December 31, 2016 of $100 invested in (1) Spectra Energy Partners’ common units, (2) the Standard & Poor’s 500 Stock Index, and (3) the Alerian MLP Index. The amounts included in the table were calculated assuming the reinvestment of distributions, at the time distributions were paid.
January 1, 2012 | December 31, | |||||||||||||||||||||||
2012 | 2013 | 2014 | 2015 | 2016 | ||||||||||||||||||||
Spectra Energy Partners | $ | 100.00 | $ | 103.85 | $ | 158.74 | $ | 208.19 | $ | 183.16 | $ | 186.74 | ||||||||||||
S&P 500 Stock Index | 100.00 | 116.00 | 153.57 | 174.60 | 177.01 | 198.18 | ||||||||||||||||||
Alerian MLP Index | 100.00 | 104.80 | 133.70 | 140.13 | 94.46 | 111.75 | ||||||||||||||||||
Distributions of Available Cash
General. Our partnership agreement requires that, within 60 days after the end of each quarter, we distribute all of our Available Cash, as defined in the partnership agreement, to unitholders of record on the applicable record date.
Minimum Quarterly Distribution. The Minimum Quarterly Distribution, as set forth in the partnership agreement, is $0.30 per limited partner unit per quarter, or $1.20 per limited partner unit per year. The quarterly distribution as of February 7, 2017 is $0.68875 per limited partner unit, or $2.755 per limited partner unit annualized. There is no guarantee that this distribution rate will be maintained or that we will pay the Minimum Quarterly Distribution on the units in any quarter. Even if our cash distribution policy is not modified or revoked, the amount of distributions paid under our policy and the decision to make any distribution is determined by our general partner, taking into consideration the terms of the partnership agreement.
General Partner Interest and Incentive Distribution Rights. Our general partner is entitled to 2% of all quarterly distributions since inception. This general partner interest is represented by 6,293,744 general partner units. Our general partner has the right, but not the obligation, to contribute a proportionate amount of capital to us to maintain its current general partner interest. The general partner’s initial 2% interest in these distributions will be reduced if we issue additional units in the future and our general partner does not contribute a proportionate amount of capital to maintain its 2% general partner interest. Our general partner contributed $22 million in 2016, $11 million in 2015 and $7 million in 2014 to maintain its 2% interest.
Our general partner also currently holds incentive distribution rights that entitle it to receive increasing percentages of the cash we distribute from operating surplus in excess of $0.345 per unit per quarter, up to a maximum of 50%. The maximum incentive distribution right of 50% was achieved in 2016, 2015, and 2014. The maximum distribution of 50% includes distributions paid to our general partner on its 2% general partner interest and assumes that our general partner maintains its general partner interest at 2%. The maximum distribution of 50% does not include any distributions that our general partner may receive on common units that it owns.
38
As a result of the sale of our interests in Sand Hills and Southern Hills to Spectra Energy, there will be a reduction in the aggregate quarterly distributions, if any, to Spectra Energy, (as holder of incentive distribution rights), by $4 million per quarter for a period of 12 consecutive quarters commencing with the quarter ending on December 31, 2015 and ending on September 30, 2018. See Note 2 in the Notes to Consolidated Financial Statements for more information.
Equity Compensation Plans
For information related to our equity compensation plans, see Item 12. Security Ownership of Certain Beneficial Owners and Management and Related Unitholder Matters.
Item 6. Selected Financial Data.
The following selected financial data should be read in conjunction with Item 7. Management’s Discussion and Analysis of Financial Condition and Results of Operations and Item 8. Financial Statements and Supplementary Data.
The U.S. Assets Dropdown has been accounted for as an acquisition under common control, resulting in the recast of our prior results. See Note 2 of Notes to Consolidated Financial Statements for further discussion of the transaction.
Years Ended December 31, | |||||||||||||||||||
2016 | 2015 | 2014 | 2013 | 2012 | |||||||||||||||
(in millions, except per-unit amounts) | |||||||||||||||||||
Statements of Operations | |||||||||||||||||||
Operating revenues | $ | 2,533 | $ | 2,455 | $ | 2,269 | $ | 1,965 | $ | 1,754 | |||||||||
Operating income | 1,228 | 1,273 | 1,136 | 973 | 897 | ||||||||||||||
Net income—noncontrolling interests | 78 | 40 | 23 | 16 | 15 | ||||||||||||||
Net income—controlling interests (a) | 1,161 | 1,225 | 1,004 | 1,070 | 580 | ||||||||||||||
Limited Partner Unit Data | |||||||||||||||||||
Net income per limited partner unit—basic and diluted (b) | $ | 2.84 | $ | 3.30 | $ | 2.84 | $ | 4.25 | $ | 1.69 | |||||||||
Distributions paid per limited partner unit | 2.63 | 2.43 | 2.245 | 2.02125 | 1.93 | ||||||||||||||
_________
(a) | Includes a $354 million benefit related to the elimination of accumulated deferred income tax liabilities in 2013. |
(b) | Earnings related to the U.S. Assets Dropdown for periods prior to November 1, 2013 were allocated entirely to the general partner in calculating net income per limited partner unit. |
December 31, | |||||||||||||||||||
2016 | 2015 | 2014 | 2013 | 2012 | |||||||||||||||
(in millions) | |||||||||||||||||||
Balance Sheets | |||||||||||||||||||
Total assets | $ | 21,606 | $ | 18,851 | $ | 17,778 | $ | 16,776 | $ | 13,871 | |||||||||
Long-term debt, less current maturities | 6,223 | 5,845 | 5,134 | 5,160 | 3,091 | ||||||||||||||
Notes payable—affiliates | — | — | — | — | 4,185 | ||||||||||||||
39
Item 7. Management’s Discussion and Analysis of Financial Condition and Results of Operations.
INTRODUCTION
Management’s Discussion and Analysis should be read in conjunction with Item 8. Financial Statements and Supplementary Data.
EXECUTIVE OVERVIEW
We reported net income from controlling interests of $1,161 million in 2016 compared with $1,225 million in 2015 mainly due to expansion projects, more than offset by pipeline inspection and repair costs related to the Texas Eastern incident near Delmont, Pennsylvania, lower processing revenues and crude oil transportation revenues due to lower volumes, and a one-time property tax accrual adjustment in 2015. Distributable cash flow was $1,187 million in 2016 compared with $1,205 million in 2015.
We increased our quarterly cash distribution each quarter in 2016, from $0.63875 per limited partner unit for the fourth quarter of 2015 which was paid in February 2016, to $0.68875 per unit for the fourth quarter of 2016 which is payable on February 28, 2017. Our expectation is that we will increase our quarterly distribution by one and a quarter cents per unit each quarter through 2017. The declaration and payment of distributions is subject to the sole discretion of our Board of Directors and depends upon many factors, including the financial condition, earnings and capital requirements of our operating subsidiaries, covenants associated with certain debt obligations, legal requirements, regulatory constraints, our partnership agreement and other factors deemed relevant by our Board of Directors.
We invested $2.6 billion of capital and investment expenditures in 2016, including $2.3 billion of expansion and investment capital expenditures. We continue to foresee significant capital spending over the next several years, with approximately $2.8 billion planned for 2017, excluding contributions from noncontrolling interests. We will rely upon cash flows from operations, including cash distributions received from our equity investments, and various financing transactions, which may include issuances of short-term and long-term debt, to fund our liquidity and capital requirements for 2017. Given that we expect to continue to pursue expansion opportunities over the next several years, capital resources will continue to include long-term borrowings and possibly unit issuances. We expect to maintain an investment-grade capital structure and liquidity profile that supports our strategic objectives. Therefore, we will continue to monitor market requirements and our liquidity, and make adjustments to these plans, as needed.
We are committed to an investment-grade balance sheet and continued prudent financial management of our capital structure. Therefore, financing these growth activities will continue to be based on our strong and growing fee-based earnings and cash flows as well as the issuances of debt and/or equity securities. As of December 31, 2016, we have access to a $2.5 billion revolving credit facility which is used principally as a back-stop for our commercial paper program.
Our Strategy. Our strategy is to create superior and sustainable value for our investors, customers, employees and communities by delivering natural gas and crude oil to premium markets. We will grow our business by way of organic growth, greenfield expansions and strategic acquisitions, with a steadfast focus on safety, reliability, customer responsiveness and profitability. We intend to accomplish this by:
•Building off the strength of our asset base.
•Maximizing that base through sector leading operations and service.
•Effectively executing the projects we have secured.
•Securing new growth opportunities that add value for our investors within each of our business segments.
•Expanding our value chain participation into complementary infrastructure assets.
Natural gas supply dynamics continue to evolve, and there is general recognition that natural gas can be an effective solution for meeting the energy needs of North America and beyond. This causes us to be optimistic about future growth opportunities. Identified opportunities include growth in gas-fired power generation and industrial markets, LNG exports from North America, growth related to moving new sources of gas supplies to markets (including exports) and significant new liquids pipeline infrastructure. With our advantage of providing continuous access from leading supply regions through to the last mile of pipe in growing markets, we expect to continue expanding our assets and operations to meet the evolving needs of our customers.
40
Crude oil supply dynamics continue to evolve as North American oil production has shifted from growth to decline. In recent years, growing North American crude oil production has displaced imports from overseas and led to increased demand for crude oil transportation and logistics. Although depressed global crude oil prices resulted in declining North American oil production, we expect a return to attractive pricing and a growing North American production outlook. Thus, we remain confident about long-term growth in North American oil production and our ability to capture crude oil pipeline business.
Successful execution of our strategy will depend on maintaining our reputation and leadership as a safe and reliable operator and the effective execution of our capital projects. Continued growth and new opportunities will be determined by key factors, such as the continued growth and production of natural gas and crude oil within North America and our ability to provide creative solutions to meet the markets' evolving energy needs in both North America and beyond.
We continue to be actively engaged in the national discussions in both the United States and Canada regarding energy policy and have taken a lead role in shaping policy as it relates to pipeline safety and operations.
Significant Economic Factors For Our Business. Our regulated businesses are generally economically stable and are not significantly affected in the short-term by changing commodity prices. However, all of our businesses can be negatively affected in the long term by sustained downturns in the economy or prolonged decreases in the demand for crude oil and/or natural gas, all of which are beyond our control and could impair our ability to meet long-term goals.
Most of our revenues are based on regulated tariff rates, which include the recovery of certain fuel costs. Lower overall economic output would reduce the volume of natural gas transmitted and gathered and processed at our plants, and the volume of crude oil transported, resulting in lower earnings and cash flows. This decline would primarily affect gathering revenues, potentially in the short term. Transmission revenues could be affected by long-term economic declines resulting in the non-renewal of long-term contracts at the time of expiration. Pipeline transmission and storage customers continue to renew most contracts as they expire.
Our combined key natural gas markets—the northeastern and the southeastern United States—are projected to continue to exhibit higher than average annual growth in natural gas demand versus the North American and continental United States average growth rates through 2020. This demand growth is primarily driven by the natural gas-fired electricity generation sector, including regional Gulf Coast exports of LNG. The natural gas industry is currently experiencing a significant shift in the sources of supply, and this dramatic change is affecting our growth strategies. Traditionally, supply to our markets has come from the Gulf Coast region, both onshore and offshore. The national supply profile still includes significant production from traditional sources in the Rockies, Midcontinent, and the U.S. Gulf Coast and is augmented by significant resource growth in Appalachia and West Texas. These supply shifts are shaping the growth strategies that we pursue, and therefore, will affect the nature of the projects anticipated in the capital and investment expenditure increases discussed below in “Liquidity and Capital Resources.” Recent social and environmental activism and political pressures have arisen around the production processes associated with extracting natural gas from the shale basins with the construction of new pipelines. Although we continue to believe that natural gas will remain a viable energy solution for the U.S., these pressures could increase costs and/or cause uncertainty on timing of permitting and execution of new projects.
Our key crude oil markets include the Rocky Mountain and Midwest states. Growth in our business is dependent on incremental crude oil supply from North American sources and the ability of that supply to compete with imported crude oil from overseas. Lower crude oil prices over the past two years have adversely affected the availability and cost-competitiveness of North American crude oil supply. This has not adversely affected our crude oil pipeline business, but sustained low oil prices could have a negative impact on our current business and associated growth opportunities although producers have adapted to and improved their competitiveness despite lower oil prices.
While the dramatic supply increase has been largely positive for midstream companies, lower price dynamics and shifting preferences on producing basins have resulted in other uneconomic impacts, which in the longer-term may impact some of our businesses and pipelines. Furthermore our storage business is adversely impacted by the contraction of price spreads historically seen between the summer and winter months. As a result, the value of storage assets and contracts has declined in recent years, and while this has impacted our business, significant increases in demand on the Gulf Coast, particularly for exports should improve the value of our storage service. However, this may also expose our business to cyclical, economic and demand issues in other parts of the world.
Our businesses in the United States and Canada are subject to laws and regulations on the federal, state and provincial levels. Regulations applicable to the natural gas transmission, crude oil transportation and storage industries have a significant effect on the nature of the businesses and the manner in which they operate. Changes to regulations are ongoing and we cannot predict the future course of changes in the regulatory environment or the ultimate effect that any future changes will have on our businesses.
41
These laws and regulations can result in increased capital, operating and other costs. Environmental laws and regulations generally require us to obtain and comply with a wide variety of environmental licenses, permits, inspections and other approvals. Compliance with environmental laws and regulations can require significant expenditures, including expenditures for cleanup costs and damages arising out of contaminated properties. In particular, compliance with major Clean Air Act regulatory programs may cause us to incur significant capital expenditures to obtain permits, evaluate offsite impacts of our operations, install emissions control equipment, and otherwise assure compliance.
Our interstate pipeline operations are subject to pipeline safety laws and regulations administered by PHMSA of the U.S. Department of Transportation. These laws and regulations require us to comply with a significant set of requirements for the design, construction, maintenance and operation of our interstate pipelines.
PHMSA is designing an Integrity Verification Process intended to create standards to verify maximum allowable operating pressure, and to improve and expand integrity management processes. There remains uncertainty as to how these standards will be implemented, but it is expected that the changes will impose additional costs on new pipeline projects as well as on existing operations. In this climate of increasingly stringent regulation, pipeline failures or failures to comply with applicable regulations could result in reduction of allowable operating pressures as authorized by PHMSA, which would reduce available capacity on our pipelines. Should any of these risks materialize, it may have an adverse effect on our operations, earnings, financial condition or cash flows. Additionally, PHMSA issued an interim final rule effective January 2017 that addresses safety issues related to underground natural gas storage facilities. We believe our existing storage facilities conform to the majority of the requirements of the new rule.
In light of the changing environmental and safety laws and regulations described above, we are evaluating efforts required to maintain compliance with such laws and regulations and, in addition, are assessing ways to improve overall system integrity, efficiency and reliability. The capital costs to effectively modernize our pipelines in this way will be substantial and will be incurred over several years.
Additionally, investments and projects located in Canada expose us to risks related to Canadian laws, taxes, economic conditions, fluctuations in currency rates, political conditions and policies of the Canadian government. During the past several years, the Canadian dollar has fluctuated compared to the U.S. dollar, which affected earnings to varying degrees for brief periods. Changes in the exchange rate or any other factors are difficult to predict and may affect our future results.
Our strategic objectives include a critical focus on capital expansion projects that will require access to capital markets. An inability to access capital at competitive rates could affect our ability to implement our strategy. Market disruptions or a downgrade in our credit ratings may increase the cost of borrowings or affect our ability to access one or more sources of liquidity.
During the past few years, capital expansion projects have been exposed to cost pressures associated with the availability of skilled labor, the pricing of materials and challenges associated with ensuring the protection of our environment and continual safety enhancements to our facilities. We maintain a strong focus on project management activities to address these pressures as we move forward with planned expansion opportunities. We have also experienced increased scrutiny placed on the permitting and construction of new projects from social and environmental activism, which can sometimes impact the timing of when constructions activities, and ultimate completion of a project, can occur relative to the expected timeline. Significant cost increases could negatively affect the returns ultimately earned on current and future expansions.
For further information related to management’s assessment of our risk factors, see Part I. Item 1A. Risk Factors.
42
RESULTS OF OPERATIONS
2016 | 2015 | 2014 | |||||||||
(in millions) | |||||||||||
Operating revenues | $ | 2,533 | $ | 2,455 | $ | 2,269 | |||||
Operating expenses | 1,305 | 1,182 | 1,133 | ||||||||
Operating income | 1,228 | 1,273 | 1,136 | ||||||||
Earnings from equity investments | 127 | 167 | 133 | ||||||||
Other income and expenses, net | 126 | 76 | 31 | ||||||||
Interest expense | 224 | 239 | 238 | ||||||||
Earnings before income taxes | 1,257 | 1,277 | 1,062 | ||||||||
Income tax expense | 18 | 12 | 35 | ||||||||
Net income | 1,239 | 1,265 | 1,027 | ||||||||
Net income—noncontrolling interests | 78 | 40 | 23 | ||||||||
Net income—controlling interests | $ | 1,161 | $ | 1,225 | $ | 1,004 | |||||
2016 Compared to 2015
Operating Revenues. The $78 million increase was driven by:
• | revenues from expansion projects, primarily on Texas Eastern and Algonquin, |
• | storage revenues due to new contracts at higher rates, and |
• | higher crude oil transportation revenues due to the Express Enhancement expansion project placed into service in October 2016, partially offset by |
• | lower recoveries of electric power and other costs passed through to gas transmission customers, |
• | lower processing revenues primarily due to lower volumes, |
• | lower crude oil transportation revenues, as a result of lower volumes primarily on the Platte pipeline, substantially offset by increased tariff rates mainly on the Express pipeline, and |
• | lower natural gas transportation revenues mainly from interruptible transportation on Texas Eastern and M&N U.S., and short-term firm transportation on Algonquin. |
Operating Expenses. The $123 million increase was driven mainly by:
• | pipeline inspection and repair costs related to the Texas Eastern incident near Delmont, Pennsylvania, |
• | higher costs related to expansion, and |
• | higher property tax accruals due to the absence of a 2015 tax benefit, partially offset by |
• | lower electric power and other costs passed through to gas transmission customers, |
• | a prior year non-cash impairment charge on Ozark Gas Gathering, |
• | lower operating costs primarily due to employee benefit costs, |
• | lower maintenance costs, |
• | lower power costs due to lower usage on the Express and Platte pipelines, and |
• | lower project development costs. |
Earnings from Equity Investments. The $40 million decrease was primarily attributable to the absence of equity earnings from Sand Hills and Southern Hills owned until October 2015.
Other Income and Expenses, Net. The $50 million increase was mainly attributable to higher allowance for funds used during construction (AFUDC) due to higher capital spending on expansion projects.
43
Interest Expense. The $15 million decrease was driven mainly by higher capitalized interest due to higher capital spending on expansion projects, partially offset by higher average long-term debt balances.
Income Tax Expense. The $6 million increase mainly reflects an increase in Canadian earnings at Express-Platte.
2015 Compared to 2014
Operating Revenues. The $186 million increase was driven by:
• | revenues from expansion projects, primarily on Texas Eastern and East Tennessee, |
• | higher crude oil transportation revenues, as a result of increased tariff rates mainly on the Express pipeline and higher volumes on both the Express and Platte pipelines, and |
• | higher recoveries of electric power and other costs passed through to gas transmission customers, partially offset by |
• | lower processing revenues primarily due to lower prices, net of higher volumes, |
• | lower inventory settlement revenues due to sales of excess tank oil in 2014 and lower crude oil prices on the Express and Platte pipelines, |
• | lower natural gas transportation revenues mainly from short-term firm and interruptible transportation on Texas Eastern and other revenue on East Tennessee, net of higher firm transportation on Algonquin, and |
• | lower storage revenues due to lower rates. |
Operating Expenses. The $49 million increase was driven mainly by:
• | higher electric power and other costs passed through to gas transmission customers, |
• | a non-cash impairment charge on Ozark Gas Gathering, |
• | higher operating costs, and |
• | higher power costs due to higher usage, net of lower rates on the Express pipeline, partially offset by |
• | lower ad valorem tax accruals, |
• | lower employee benefit costs, and |
• | lower project development costs. |
Earnings from Equity Investments. The $34 million increase was mainly attributable to higher earnings from Sand Hills due to increased volumes and the dropdown of an additional 24.95% ownership interest in SESH in November 2014.
Other Income and Expenses, Net. The $45 million increase was mainly attributable to higher AFUDC from higher capital spending on expansion projects.
Interest Expense. The $1 million increase was driven mainly by higher average long-term debt balances, mostly offset by higher capitalized interest due to higher capital spending on expansion projects and lower average interest rates.
Income Tax Expense. The $23 million decrease mainly reflects a 2014 adjustment to deferred income tax liabilities, as a result of the final purchase price adjustments related to the acquisition of Express-Platte.
For a more detailed discussion of earnings drivers, see the segment discussions that follow.
Segment Results
Management evaluates segment performance based on EBITDA. Cash, cash equivalents and investments are managed centrally, so the gains and losses on foreign currency remeasurement, and interest and dividend income, are excluded from the segments’ EBITDA. We consider segment EBITDA to be a good indicator of each segment’s operating performance from its continuing operations, as it represents the results of our operations without regard to financing methods or capital structures. Our segment EBITDA may not be comparable to similarly titled measures of other companies because other companies may not calculate EBITDA in the same manner.
Our U.S. Transmission business primarily provides transmission and storage of natural gas for customers in various regions of the northeastern and southeastern United States. Our Liquids business provides transportation of crude oil for customers in central United States and Canada.
44
Segment EBITDA is summarized in the following table. Detailed discussions follow.
EBITDA by Business Segment
2016 | 2015 | 2014 | |||||||||
(in millions) | |||||||||||
U.S. Transmission | $ | 1,639 | $ | 1,599 | $ | 1,415 | |||||
Liquids | 237 | 283 | 240 | ||||||||
Total reportable segment EBITDA | 1,876 | 1,882 | 1,655 | ||||||||
Other | (82 | ) | (66 | ) | (64 | ) | |||||
Total reportable segment and other EBITDA | 1,794 | 1,816 | 1,591 | ||||||||
Depreciation and amortization | 314 | 295 | 288 | ||||||||
Interest expense | 224 | 239 | 238 | ||||||||
Interest income and other | 1 | (5 | ) | (3 | ) | ||||||
Earnings before income taxes | $ | 1,257 | $ | 1,277 | $ | 1,062 | |||||
The amounts discussed below are after eliminating intercompany transactions.
U.S. Transmission
2016 | 2015 | Increase (Decrease) | 2014 | Increase (Decrease) | |||||||||||||||
(in millions) | |||||||||||||||||||
Operating revenues | $ | 2,167 | $ | 2,087 | $ | 80 | $ | 1,939 | $ | 148 | |||||||||
Operating expenses | |||||||||||||||||||
Operating, maintenance and other | 779 | 680 | 99 | 647 | 33 | ||||||||||||||
Other income and expenses | 251 | 192 | 59 | 123 | 69 | ||||||||||||||
EBITDA | $ | 1,639 | $ | 1,599 | $ | 40 | $ | 1,415 | $ | 184 | |||||||||
2016 Compared to 2015
Operating Revenues. The $80 million increase was driven by:
• | a $113 million increase due to expansion projects, primarily on Texas Eastern and Algonquin, and |
• | a $7 million increase in storage revenues due to new contracts at higher rates, partially offset by |
• | a $16 million decrease in recoveries of electric power and other costs passed through to gas transmission customers, |
• | a $15 million decrease in processing revenues primarily due to lower volumes, and |
• | a $9 million decrease in natural gas transportation revenues mainly from interruptible transportation on Texas Eastern and M&N U.S., and short-term firm transportation on Algonquin. |
Operating Expenses. The $99 million increase was driven by:
• | an $80 million increase due to pipeline inspection and repair costs related to the Texas Eastern incident near Delmont, Pennsylvania, |
• | a $47 million increase in costs related to expansion, and |
• | an $11 million increase in property tax accruals due to the absence of a 2015 tax benefit, partially offset by |
• | a $16 million decrease in electric power and other costs passed through to gas transmission customers, |
• | a $9 million decrease due to a non-cash impairment charge on Ozark Gas Gathering in 2015, |
• | an $8 million decrease in operating costs, and |
• | a $4 million decrease in project development costs. |
Other Income and Expenses. The $59 million increase was mainly due to higher AFUDC resulting from higher capital spending on expansion projects.
45
2015 Compared to 2014
Operating Revenues. The $148 million increase was driven by:
• | a $137 million increase due to expansion projects, primarily on Texas Eastern and East Tennessee, and |
• | a $43 million increase in recoveries of electric power and other costs passed through to customers, partially offset by |
• | a $22 million decrease in processing revenues primarily due to lower prices, net of higher volumes, |
• | an $8 million decrease in natural gas transportation revenues mainly from short-term firm and interruptible transportation on Texas Eastern and other revenue on East Tennessee, net of higher firm transportation on Algonquin, and |
• | a $6 million decrease in storage revenues due to lower rates. |
Operating Expenses. The $33 million increase was driven by:
• | a $43 million increase in electric power and other costs passed through to customers, |
• | a $9 million increase due to a non-cash impairment charge on Ozark Gas Gathering, and |
• | an $8 million increase in operating costs, net of employee benefit costs, partially offset by |
• | a $21 million decrease in ad valorem tax accruals, and |
• | a $5 million decrease from project development costs expensed in 2014. |
Other Income and Expenses. The $69 million increase was mainly due to higher AFUDC from higher capital spending on expansion projects and higher equity earnings mainly due to the dropdown of an additional 24.95% interest in SESH in November 2014.
Matters Affecting Future U.S. Transmission Results
We plan to grow our earnings through capital efficient projects, such as transportation and storage expansion to support a two-pronged “supply push” / “market pull” strategy, as well as continued focus on optimizing the performance of the existing operations through organizational efficiencies and cost control. “Supply push” is when producers agree to pay to transport specified volumes of natural gas in order to support the construction of new pipelines or the expansion of existing pipelines. “Market pull” is taking gas away from established liquid supply points and building pipeline transportation capacity to satisfy end-user demand in new markets or demand growth in existing markets. Future earnings growth will be dependent on the success of our expansion plans in both the market and supply areas of the pipeline network, which includes, among other things, shale gas exploration and development areas, the ability to continue renewing service contracts and continued regulatory stability. Natural gas storage prices have recently been challenged as a result of increasing natural gas supply and narrower seasonal price spreads.
Gas supply and demand dynamics continue to change as a result of the development of non-conventional shale gas supplies. The increase in natural gas supply has resulted in declines in the price of natural gas in North America. As a result, a shift occurred to extraction of gas in richer, “wet” gas areas with higher natural gas liquids content which depressed activity in “dry” fields like the Fayetteville Shale formation where our Ozark assets are located. This, in turn, contributed to a resulting over-supply of pipeline take-away capacity in these areas. As the balance of supply and demand evolves, we expect activity in these areas to push prices higher. However, should supply and demand not come into balance, our businesses there may be subject to further possible impairment. The supply increase has also had a negative impact on the seasonal price spreads historically seen between the summer and winter months. The value of storage assets and contracts has declined in recent years, negatively affecting the results of our storage facilities. While we expect storage values to stabilize and strengthen in the future, should these market factors continue to keep downward pressure on the seasonality spread and re-contracting, we could be subject to further reduced value and impairment of our storage assets.
Our businesses in the United States are subject to laws and regulations on the federal and state levels. Regulations applicable to the natural gas transmission and storage industries have a significant effect on the nature of the businesses and the manner in which they operate. Changes to regulations are ongoing and we cannot predict the future course of changes in the regulatory environment or the ultimate effect that any future changes will have on our businesses.
FERC’s current policy permits pipelines and storage companies to include a tax allowance in the cost-of-service used as the basis for calculating their regulated rates. For pipelines and storage companies owned by partnerships or limited liability company interests, the current tax allowance policy reflects the actual or potential income tax liability on the FERC jurisdictional income attributable to all partnership or limited liability company interests if the ultimate owner of the interest
46
has an actual or potential income tax liability on such income. On December 15, 2016, FERC issued a Notice of Inquiry requesting energy industry input on how the FERC should address income tax allowances in cost-based rates proposed by pipeline companies organized as part of a master limited partnership. This Notice of Inquiry was issued in response to a remand from the U.S. Court of Appeals for the D.C. Circuit in United Airlines v. FERC, in which the court determined that FERC had not justified its conclusion that an oil pipeline organized as a partnership would not “double recover” its taxes under the current policy by both including a tax allowance in its cost-based rates and earning a return on equity calculated on a pre-tax basis. We cannot predict whether the FERC will successfully justify its conclusion that there is no double recovery of taxes under these circumstances or whether the FERC will modify its current policy on either income tax allowances or return on equity calculations for pipeline companies organized as part of a master limited partnership. However, any modification that reduces or eliminates an income tax allowance for pipeline companies organized as a part of a master limited partnership or decreases the return on equity for such pipelines could result in an adverse impact on our revenues associated with the transportation and storage services we provide pursuant to cost-based rates. We believe any changes would be prospective from the date of any FERC determination for our regulated entities. Some entities have authority to charge market-based rates and therefore this tax allowance issue does not affect the rates that they charge their customers.
These laws and regulations can result in increased capital, operating and other costs. Environmental laws and regulations generally require us to obtain and comply with a wide variety of environmental licenses, permits, inspections and other approvals. Compliance with environmental laws and regulations can require significant expenditures, including expenditures for cleanup costs and damages arising out of contaminated properties. In particular, compliance with major Clean Air Act regulatory programs may cause us to incur significant capital expenditures to obtain permits, evaluate offsite impacts of our operations, install pollution control equipment, and otherwise assure compliance.
Our interstate pipeline operations are subject to pipeline safety regulations administered by PHMSA of the DOT. These laws and regulations require us to comply with a significant set of requirements for the design, construction, maintenance and operation of our interstate pipelines.
PHMSA is designing an Integrity Verification Process intended to create standards to verify maximum allowable operating pressure, and to improve and expand integrity management processes. There remains uncertainty as to how these standards will be implemented, but it is expected that the changes will impose additional costs on new pipeline projects as well as on existing operations. In this climate of increasingly stringent regulation, pipeline failures or failures to comply with applicable regulations could result in a reduction of allowable operating pressures as authorized by PHMSA, which would reduce available capacity on our pipelines. Should any of these risks materialize, it may have an adverse effect on our operations, earnings, financial condition or cash flows. Additionally, PHMSA issued an interim final rule effective January 2017 that addresses safety issues related to underground natural gas storage facilities. We believe our existing storage facilities conform to the majority of the requirements of the new rule.
In light of the changing environmental and safety laws and regulations described above, we are evaluating efforts required to maintain compliance with such laws and regulations and, in addition, are assessing ways to improve overall system integrity, efficiency and reliability. The capital costs to effectively modernize our pipelines in this way will be substantial and will be incurred over several years.
Liquids
2016 | 2015 | Increase (Decrease) | 2014 | Increase (Decrease) | |||||||||||||||
(in millions) | |||||||||||||||||||
Operating revenues | $ | 366 | $ | 368 | $ | (2 | ) | $ | 330 | $ | 38 | ||||||||
Operating expenses | |||||||||||||||||||
Operating, maintenance and other | 130 | 141 | (11 | ) | 134 | 7 | |||||||||||||
Other income and expenses | 1 | 56 | (55 | ) | 44 | 12 | |||||||||||||
EBITDA | $ | 237 | $ | 283 | $ | (46 | ) | $ | 240 | $ | 43 | ||||||||
Express pipeline revenue receipts, MBbl/d (a) | 241 | 239 | 2 | 223 | 16 | ||||||||||||||
Platte PADD II deliveries, MBbl/d | 130 | 162 | (32 | ) | 170 | (8 | ) | ||||||||||||
_________
(a) Thousand barrels per day.
In October, 2015, Spectra Energy acquired our 33.3% ownership interests in Sand Hills and Southern Hills. Results presented herein include Sand Hills and Southern Hills through October 30, 2015, the date of Spectra Energy's acquisition.
47
2016 Compared to 2015
Operating Revenues. The $2 million decrease in operating revenues was driven by:
• | a $10 million decrease in crude oil transportation revenues, as a result of lower volumes primarily on the Platte pipeline, substantially offset by increased tariff rates mainly on the Express pipeline, partially offset by |
• | a $7 million increase in crude oil transportation revenues due to the Express Enhancement expansion project placed into service in October 2016. |
Operating Expenses. The $11 million decrease in operating expenses was driven by:
• | a $6 million decrease in maintenance costs, and |
• | a $5 million decrease in power costs due to lower usage in 2016 on the Express and Platte pipelines. |
Other Income and Expenses. The $55 million decrease was primarily due to the absence of equity earnings from Sand Hills and Southern Hills owned until October 30, 2015.
2015 Compared to 2014
Operating Revenues. The $38 million increase in operating revenues was driven by:
• | a $54 million increase in crude oil transportation revenues, as a result of increased tariff rates mainly on the Express pipeline and higher volumes on both the Express and Platte pipelines, partially offset by |
• | an $18 million decrease in inventory settlement revenues due to sales of excess tank oil in 2014 and lower crude oil prices on the Express and Platte pipelines. |
Operating Expenses. The $7 million increase in operating expenses was primarily driven by higher ad valorem taxes and power costs.
Other Income and Expenses. The $12 million increase was primarily due to higher earnings from Sand Hills due to increased volumes, partially offset by the disposition of Sand Hills and Southern Hills on October 30, 2015.
Matters Affecting Future Liquids Results
We plan to grow our earnings by maximizing throughput on all sections of the pipeline systems. This entails connecting, where possible, to downstream pipelines, rail or barge terminals to extend the market reach of the pipeline to refinery-customers beyond the end of the pipeline. This also includes optimizing pipeline and storage operations and expanding terminal operations where appropriate.
Future earnings growth will be dependent on the success in renewing existing contracts or in securing new supply and market for all pipelines. This will require ongoing increases in supply of crude oil and continued access to attractive markets.
See Matters Affecting Future U.S. Transmission Results for discussions of pipeline safety, regulatory certainty and the PHMSA, which are also applicable to the Liquids segment.
Other
2016 | 2015 | Increase (Decrease) | 2014 | Increase (Decrease) | |||||||||||||||
(in millions) | |||||||||||||||||||
Operating expenses | $ | 82 | $ | 66 | $ | 16 | $ | 64 | $ | 2 | |||||||||
EBITDA | $ | (82 | ) | $ | (66 | ) | $ | (16 | ) | $ | (64 | ) | $ | (2 | ) | ||||
2016 Compared to 2015
Operating Expenses. The $16 million increase was driven by higher allocated governance costs.
2015 Compared to 2014
Operating Expenses. The $2 million increase was driven by higher direct costs, mostly offset by lower allocated governance costs.
48
Distributable Cash Flow
We define Distributable Cash Flow as EBITDA plus
• | distributions from equity investments, |
• | other non-cash items affecting net income, less |
• | earnings from equity investments, |
• | interest expense, |
• | equity AFUDC, |
• | net cash paid for income taxes, |
• | distributions to noncontrolling interests, and |
• | maintenance capital expenditures. |
Distributable Cash Flow does not reflect changes in working capital balances. Distributable Cash Flow should not be viewed as indicative of the actual amount of cash that we plan to distribute for a given period.
Distributable Cash Flow is the primary financial measure used by our management and by external users of our financial statements to assess the amount of cash that is available for distribution.
Distributable Cash Flow is a non-GAAP measure and should not be considered an alternative to Net Income, Operating Income, cash from operations or any other measure of financial performance or liquidity presented in accordance with generally accepted accounting principles (GAAP) in the United States. Distributable Cash Flow excludes some, but not all, items that affect Net Income and Operating Income and these measures may vary among other companies. Therefore, Distributable Cash Flow as presented may not be comparable to similarly titled measures of other companies.
Significant drivers of variances in Distributable Cash Flow between the periods presented are substantially the same as those previously discussed under Results of Operations. Other drivers include the timing of certain cash outflows, such as capital expenditures for maintenance.
49
Reconciliation of Net Income to Non-GAAP “Distributable Cash Flow”
2016 | 2015 | 2014 | |||||||||
(in millions) | |||||||||||
Net Income | $ | 1,239 | $ | 1,265 | $ | 1,027 | |||||
Add: | |||||||||||
Interest expense | 224 | 239 | 238 | ||||||||
Income tax expense | 18 | 12 | 35 | ||||||||
Depreciation and amortization | 314 | 295 | 288 | ||||||||
Foreign currency loss | 1 | 6 | 3 | ||||||||
Less: | |||||||||||
Interest income | 2 | 1 | — | ||||||||
EBITDA | 1,794 | 1,816 | 1,591 | ||||||||
Add: | |||||||||||
Earnings from equity investments | (127 | ) | (167 | ) | (133 | ) | |||||
Distributions from equity investments (a) | 160 | 207 | 165 | ||||||||
Non-cash impairment at Ozark Gas Gathering | — | 9 | — | ||||||||
Other | 13 | 12 | 8 | ||||||||
Less: | |||||||||||
Interest expense | 224 | 239 | 238 | ||||||||
Equity AFUDC | 121 | 76 | 33 | ||||||||
Net cash paid for income taxes | 10 | 12 | 6 | ||||||||
Distributions to noncontrolling interests | 30 | 31 | 29 | ||||||||
Maintenance capital expenditures | 268 | 314 | 270 | ||||||||
Distributable Cash Flow | $ | 1,187 | $ | 1,205 | $ | 1,055 | |||||
________
(a) Excludes $403 million and $129 million of distributions from equity investments for the 2015 and 2014 periods, respectively.
CRITICAL ACCOUNTING POLICIES AND ESTIMATES
The application of accounting policies and estimates is an important process that continues to evolve as our operations change and accounting guidance is issued. We have identified a number of critical accounting policies and estimates that require the use of significant estimates and judgments.
We base our estimates and judgments on historical experience and on other assumptions that we believe are reasonable at the time of application. These estimates and judgments may change as time passes and more information becomes available. If estimates are different than the actual amounts recorded, adjustments are made in subsequent periods to take into consideration the new information. We discuss our critical accounting policies and estimates and other significant accounting policies with our Audit Committee.
Regulatory Accounting
We account for certain of our operations under accounting for regulated entities. As a result, we record assets and liabilities that result from the regulated ratemaking process that may not be recorded under GAAP for non-regulated entities. Regulatory assets generally represent incurred costs that have been deferred because such costs are probable of future recovery in customer rates. Regulatory liabilities generally represent obligations to make refunds to customers or for instances where the regulator provides current rates that are intended to recover costs that are expected to be incurred in the future. We continually assess whether the regulatory assets are probable of future recovery by considering factors such as applicable regulatory changes and recent rate orders to other regulated entities. Based on this assessment, we believe our existing regulatory assets are probable of recovery. This assessment reflects the current political and regulatory climate at the state and federal levels, and is subject to change in the future. If future recovery of costs ceases to be probable, regulatory asset write-offs would be required
50
to be recognized. Additionally, regulatory agencies can provide flexibility in the manner and timing of the depreciation of property, plant and equipment and amortization of regulatory assets. Total regulatory assets were $376 million as of December 31, 2016 and $326 million as of December 31, 2015. Total regulatory liabilities were $61 million as of December 31, 2016 and $25 million as of December 31, 2015.
Annual Goodwill Impairment Test
We had goodwill balances of $3,234 million at December 31, 2016 and $3,232 million at December 31, 2015. The increase in goodwill in 2016 was the result of foreign currency translation. See Note 1 of Notes to Consolidated Financial Statements for further discussion.
As permitted under the accounting guidance on testing goodwill for impairment, we perform either a qualitative assessment or a quantitative assessment of each of our reporting units based on management’s judgment. With respect to our qualitative assessments, we consider events and circumstances specific to us, such as macroeconomic conditions, industry and market considerations, cost factors and overall financial performance, when evaluating whether it is more likely than not that the fair values of our reporting units are less than their respective carrying amounts.
In connection with our quantitative assessments, we primarily use a discounted cash flow analysis to determine fair values of those reporting units. Key assumptions in the determination of fair value include the use of an appropriate discount rate and estimated future cash flows. In estimating cash flows, we incorporate expected long-term growth rates in key markets served by our operations, regulatory stability, the ability to renew contracts, commodity prices (where appropriate) and foreign currency exchange rates, as well as other factors that affect our reporting units’ revenue, expense and capital expenditure projections.
We performed either a quantitative assessment or a qualitative assessment for each of our reporting units to determine whether it is more likely than not that the respective fair values of these reporting units are less than their carrying amounts, including goodwill as of April 1, 2016 (our annual testing date). Based on that assessment, we determined that this condition, for each reporting unit, does not exist. As such, performing the first step of the two-step impairment test for these units was unnecessary. No triggering events occurred during the period from April 1, 2016 through December 31, 2016 that warranted re-testing for goodwill impairment.
Revenue Recognition
Revenues from the transmission, storage and gathering of natural gas, and from the transportation of crude oil are generally recognized when the service is provided. Revenues related to these services provided but not yet billed are estimated each month. These estimates are generally based on contract data, regulatory information, and preliminary throughput and allocation measurements. Final bills for the current month are billed and collected in the following month. Differences between actual and estimated revenues are immaterial.
LIQUIDITY AND CAPITAL RESOURCES
Known Trends and Uncertainties
As of December 31, 2016, we had negative working capital of $1,119 million. This balance includes commercial paper liabilities totaling $574 million, and current maturities of long-term debt of $416 million. We will rely upon cash flows from operations, including cash distributions received from our equity affiliates, and various financing transactions, which may include debt and/or equity issuances, to fund our liquidity and capital requirements for 2017. We have access to a revolving credit facility, with available capacity of $1.9 billion at December 31, 2016. This facility is used principally as a back-stop for our commercial paper program, which is used to manage working capital requirements and for temporary funding of capital expenditures. We expect to be self-funding and plan to continue to pursue expansion opportunities over the next several years. Capital resources may continue to include commercial paper, short-term borrowings under our current credit facility and possibly securing additional sources of capital including debt and/or equity.
Cash flows from operations are fairly stable given that substantially all of our revenues and those of our equity investments are derived from operations under firm contracts. However, total operating cash flows are subject to a number of factors, including, but not limited to, contract renewal rates and cash distributions from our equity investments. The amount of cash distributed to us by our equity investments and the amount of cash we may be required to fund, is determined by our equity investments based on their operating cash flows and other factors as determined by their management. While we participate on the management committees of these equity investments, determination of the amount of distributions and contributions, if any, are not within our control. We received total distributions from equity investments of $160 million in
51
2016, $610 million in 2015 and $294 million in 2014. See Item 1A. Risk Factors for discussion of other factors that could affect our cash flows.
As a result of our ongoing strong earnings performance expected in existing operations, we expect to maintain a capital structure and liquidity profile that supports our strategic objectives. We will continue to monitor market requirements and our liquidity and make adjustments to these plans, as needed.
Cash Flow Analysis
The following table summarizes the changes in cash flows for each of the periods presented:
Years Ended December 31, | |||||||||||
2016 | 2015 | 2014 | |||||||||
(in millions) | |||||||||||
Net cash provided by (used in): | |||||||||||
Operating activities | $ | 1,462 | $ | 1,522 | $ | 1,333 | |||||
Investing activities | (2,754 | ) | (1,830 | ) | (1,077 | ) | |||||
Financing activities | 1,340 | 336 | (237 | ) | |||||||
Net increase in cash and cash equivalents | 48 | 28 | 19 | ||||||||
Cash and cash equivalents at beginning of the period | 168 | 140 | 121 | ||||||||
Cash and cash equivalents at end of the period | $ | 216 | $ | 168 | $ | 140 | |||||
Operating Cash Flows
Net cash provided by operating activities decreased $60 million to $1,462 million in 2016 compared to 2015. This decrease was driven primarily by the absence of distributions from Sand Hills and Southern Hills owned until October 2015.
Net cash provided by operating activities increased $189 million to $1,522 million in 2015 compared to 2014. This increase was driven primarily by higher earnings, partially offset by changes in working capital.
Investing Cash Flows
Net cash flows used in investing activities increased $924 million to $2,754 million in 2016 compared to 2015. This increase was driven mainly by:
• | a $578 million increase in capital and investment expenditures, and |
• | a $396 million distribution received from Gulfstream with proceeds from a Gulfstream debt offering in 2015, partially offset by |
• | a $148 million distribution of debt proceeds back to Gulfstream for payment of its matured debt in 2016, compared to $248 million distributed in 2015. |
Net cash flows used in investing activities increased $753 million to $1,830 million in 2015 compared to 2014. This increase was driven mainly by a $766 million net increase in capital and investment expenditures.
Capital and Investment Expenditures by Business Segment
Years Ended December 31, | |||||||||||
2016 | 2015 | 2014 | |||||||||
(in millions) | |||||||||||
U.S. Transmission | $ | 2,514 | $ | 1,952 | $ | 1,160 | |||||
Liquids | 71 | 55 | 81 | ||||||||
Total consolidated | $ | 2,585 | $ | 2,007 | $ | 1,241 | |||||
Capital and investment expenditures for 2016 totaled $2,585 million and included $2,317 million for expansion projects, and $268 million for maintenance and other projects.
52
We project 2017 capital and investment expenditures of approximately $2.8 billion, including $2.5 billion of expansion capital expenditures and $0.3 billion for maintenance and upgrades of existing plants, pipelines and infrastructure to serve growth. These projections exclude contributions from noncontrolling interests. Expansion capital expenditures may vary significantly based on investment opportunities.
In October 2015, Spectra Energy acquired our 33.3% ownership interests in Sand Hills and Southern Hills. In consideration for this transaction, we retired 21,560,000 of our common units and 440,000 of our general partner units held by Spectra Energy resulting in a reduction of any associated distributions payable to Spectra Energy. As a result of the transaction, there is a reduction in the aggregate quarterly distributions, if any, to Spectra Energy, (as holder of incentive distribution rights), by $4 million per quarter for a period of 12 consecutive quarters ending on September 30, 2018. See Note 2 of Notes to Consolidated Financial Statements for further discussion.
In November 2015, we acquired the remaining 0.1% ownership interest in SESH from Spectra Energy. Total consideration was 17,114 newly issued common units. In addition, we issued 342 general partner units to Spectra Energy in exchange for the same amount of common units in order to maintain Spectra Energy's 2% general partner interest. This was the last of three planned transactions related to the U.S. Assets Dropdown. See Note 2 of Notes to Consolidated Financial Statements for further discussion.
In November 2014, we completed the second of the three planned transactions related to the U.S. Assets Dropdown. This transaction consisted of acquiring an additional 24.95% ownership interest in SESH and the remaining 1% ownership interest in Steckman Ridge. Total consideration was approximately 4.3 million newly issued common units and 86,000 general partner units to Spectra Energy. See Note 2 of Notes to Consolidated Financial Statements for further discussion.
Capital expansion projects are developed and executed using results-proven project management processes. We evaluate the strategic fit and commercial and execution risks, and continuously measure performance compared to plan. Ongoing communications between project teams and senior leadership ensure we maintain the right focus and deliver the expected results. We expect that significant natural gas infrastructure, including both natural gas transportation and storage with links to growing gas supplies and markets, will be needed over time to serve growth in gas-fired power generation, oil-to-gas conversions, industrial development and attachments to new gas supply.
Expansion capital expenditures included several key projects placed into service in 2016, including:
• | Algonquin Incremental Market (AIM) - A 342 million cubic feet per day (MMcf/d) expansion of the Algonquin system consisting of replacement pipeline, new pipeline, new and modified meter station facilities and additional compression at existing stations. The project is designed to transport gas from existing interconnects in New Jersey and New York to LDC markets in the northeast. 72% of the project was placed in-service in the fourth quarter of 2016 with the remainder to go in-service in the first quarter of 2017. |
• | Ozark Conversion - The project includes abandonment of portions of the Ozark Gas Transmission system from natural gas service and leasing of the abandoned lines to Magellan Midstream Partners, L.P. (Magellan) to transport approximately 75,000 barrels per day of refined products. Completion of Spectra Energy's scope of work occurred during the third quarter of 2015. Completion of Magellan's scope of work and system in-service occurred during the third quarter of 2016. |
• | Gulf Market Expansion - This Texas Eastern system expansion project connects growth markets (Gulf Coast LNG and industrials) with diverse, growing shale supply. The project consists of installing reverse-compression capability at six compressor stations to provide up to 650 MMcf/d. The project will be executed in two phases. Phase 1 was placed into service in the fourth quarter of 2016, and provides north to south compression at five stations. Phase 2, due to go in-service in the second half of 2017, will provide north to south compression at one station and new compression at one existing compressor station and one new compressor station. |
• | Loudon Expansion - This project will provide a customer with 39 MMcf/d of incremental capacity. The project was placed in-service during the third quarter of 2016. |
• | Salem Lateral - An expansion of the Algonquin system for delivery of 115 MMcf/d of natural gas to the Footprint Salem Harbor Power Station in Salem, Massachusetts. The project was placed in-service during the fourth quarter of 2016. |
• | Express Enhancement - This project will increase system capacity by 21,000 barrels per day. Facilities include the addition of tank storage at Hardisty, Alberta and Buffalo, Montana and additional pumps at Buffalo, Montana. The project was placed in-service during the third quarter of 2016. |
53
In addition to the remaining work mentioned above, significant 2017 expansion projects expenditures are also expected to include:
• | Sabal Trail - 1,100 MMcf/d of new capacity to access onshore shale gas supplies. Facilities include a new 465-mile pipeline, laterals and various compressor stations. This project is expected to be in-service during the first half of 2017. |
• | NEXUS - Greenfield path to transport 1.5 Bcf/d from Spectra Energy's Texas Eastern pipeline to the Union Gas hub in Ontario, Canada. The facilities will consist of approximately 255 miles of 36-inch pipeline across northern Ohio to the Detroit, Michigan area, the addition of four new compressor stations totaling 130,000 horsepower (HP), and six meter stations. The project is expected to be in-service during the second half of 2017. |
• | Access South / Adair Southwest / Lebanon Extension - This project combined is designed to attach emerging Ohio Marcellus and Utica natural gas supplies to new markets in the Midwest and Southeast along Texas Eastern’s existing footprint totaling 622 MMcf/d of gas deliveries to customers. The project is expected to be in-service during the second half of 2017. |
• | Atlantic Bridge - This project is an expansion of the Algonquin system to transport 131 MMcf/d of natural gas to the New England Region. Addition or expansion of pipelines, compressor stations and meter stations will be required. The project is expected to be in-service during the second half of 2017. |
• | Texas Eastern Appalachian Lease (TEAL) - This project is designed to create a gas path from the Texas Eastern mainline system in Monroe County, Ohio, utilizing the Ohio Pipeline Energy Network (OPEN) pipeline, to deliver gas northward to NEXUS at Kensington, Ohio. The pipeline portion of the project is due to go in service during the second half of 2017, and the compressor station portion is due to go in service during the second half of 2018. |
• | South Texas Expansion - The project will expand the Texas Eastern facilities in order to deliver 400 MMcf/d gas supplies from east of Vidor, Texas to high demand markets in south Texas with a single delivery point in Petronila. The project is expected to be in-service during the second half of 2018. |
• | Bayway Lateral - This project will deliver up 296 MMcf/d to two new customers at the Bayway Refinery site in Linden, New Jersey. The project consists of a tap into Texas Eastern Line 38, a new 2,300 foot 24-inch lateral and two new meter stations. The project will deliver approximately 231 MMcf/d to Linden Cogen and approximately 65 MMcf/d to Phillips 66. The project is expected to be in-service during the first half of 2018. |
• | PennEast - A 1,000 MMcf/d 36-inch pipeline with scalable facilities and two compressor stations that runs 105 miles from Northeast, Pennsylvania production to Texas Eastern- Lambertville and Transco-Woodbridge. The project is expected to be in-service during the second half of 2018. |
• | Stratton Ridge - This project will deliver 322 MMcf/d of gas from Stratton Ridge Storage to Freeport LNG Train 3. The project scope also consists of additional compression, piping, and metering and regulation work on the Angleton Compressor Station and Angleton Line, as well as work on the Brazoria Interconnector Gas (B.I.G) Pipeline and Mont Belvieu, Joaquin, Huntsville, Hempstead, and Provident City Station Sites. The project is expected to be in-service during the first half of 2019. |
Financing Cash Flows
Net cash provided by financing activities increased $1,004 million to $1,340 million in 2016 compared to 2015. This increase was driven mainly by:
• | $98 million of net issuances of commercial paper in 2016, compared to $431 million of net redemptions in 2015, |
• | a $522 million increase in proceeds from issuances of units, and |
• | a $495 million increase in contributions from noncontrolling interests, partially offset by |
• | $520 million in net issuances of long-term debt in 2016, compared to $962 million in net issuances of long-term debt in 2015, and |
• | a $100 million increase in distributions to partners. |
54
Net cash provided by financing activities totaled $336 million in 2015 compared to $237 million used in financing activities in 2014. This $573 million change was driven mainly by:
• | $962 million of net issuances of long-term debt in 2015, compared to $441 million of net redemptions in 2014, |
• | $431 million of net redemptions of commercial paper in 2015, compared to $569 million of net issuances in 2014 |
• | a $224 million increase in proceeds from issuances of units, and |
• | a $103 million increase in contributions from noncontrolling interests, partially offset by |
• | a $146 million increase in distributions to partners. |
Significant Financing Activities—2016
Debt Issuances. On October 17, 2016, we issued $800 million aggregate principal amount of senior unsecured notes, comprised of $600 million of 3.375% senior notes due in 2026 and $200 million of 4.50% senior notes due in 2045. The new 2045 notes are an additional issuance of our 4.50% senior notes issued in March 2015. Net proceeds from the offering were used to repay a portion of outstanding commercial paper, to fund capital expenditures and for general partnership purposes.
Common Unit Issuances. In April 2016, we issued 10.4 million common units and 0.2 million general partner units to Spectra Energy in a private placement transaction. Total net proceeds were approximately $489 million. We used the proceeds from this purchase for general partnership purposes, including the funding of our current expansion capital plan.
In 2016, we issued 12.8 million common units to the public under our at-the-market program and approximately 262,000 general partner units to Spectra Energy. Total net proceeds were $591 million, including approximately $12 million of proceeds from Spectra Energy. The net proceeds were used for general partnership purposes, which may have included debt repayment, capital expenditures and/or additions to working capital. In 2017, we have issued 0.5 million common units to the public under our at-the-market program and approximately 9,000 general partner units to Spectra Energy, for total net proceeds of approximately $21 million, including $0.4 million of proceeds from Spectra Energy.
Significant Financing Activities—2015
Debt Issuances. On March 12, 2015, we issued $1.0 billion aggregate principal amount of senior unsecured notes, comprised of $500 million of 3.50% senior notes due in 2025 and $500 million of 4.50% senior notes due in 2045. Net proceeds from the offering were used to repay a portion of outstanding commercial paper, to fund capital expenditures and for general partnership purposes.
Common Unit Issuances. On November 4, 2015, we issued 17,114 common units in connection with the U.S. Assets Dropdown, valued at $1 million. In addition, we issued 342 general partner units to Spectra Energy in exchange for the same amount of common units in order to maintain Spectra Energy's 2% general partner interest. See Note 2 of Notes to Consolidated Financial Statements for further discussion.
In March 2015, we entered into an equity distribution agreement under which we may sell and issue common units up to an aggregate offering price of $500 million, and in December 2015 we replaced the equity distribution agreement. The terms of this new equity distribution agreement are substantially similar to those in our previous agreements and allow us to sell and issue up to an aggregate offering price of $1 billion of common units. This at-the-market offering program allows us to offer and sell common units at prices deemed appropriate through a sales agent. Sales of common units, if any, will be made by means of ordinary brokers’ transactions on the NYSE, in block transactions, or as otherwise agreed to between the sales agent and us.
We issued 12 million common units to the public in 2015 under our at-the-market program, and approximately 245,000 general partner units to Spectra Energy. Total net proceeds were $557 million, including approximately $11 million of proceeds from Spectra Energy.
Significant Financing Activities—2014
Common Unit Issuances. In November 2014, we issued 4.3 million common units and 86,000 general partner units to Spectra Energy in connection with the U.S. Assets Dropdown, valued at $186 million. See Note 2 of Notes to Consolidated Financial Statements for further discussion of this transaction.
In 2014, we issued 6.4 million common units to the public under our at-the-market program and 132,000 general partner units to Spectra Energy. Total net proceeds were $334 million, including $7 million of proceeds from Spectra Energy.
55
Available Credit Facility and Restrictive Debt Covenants
Expiration Date | Total Credit Facility Capacity | Commercial Paper Outstanding at December 31, 2016 | Available Credit Facility Capacity | ||||||||||
(in millions) | |||||||||||||
Spectra Energy Partners, LP | 2021 | $ | 2,500 | $ | 574 | $ | 1,926 | ||||||
On April 29, 2016, we amended our credit agreement. The total capacity was increased to $2.5 billion and the expiration date was extended to April 2021.
The issuances of commercial paper, letters of credit and revolving borrowings reduce the amount available under the credit facility. As of December 31, 2016, there were no letters of credit issued or revolving borrowings outstanding under the credit facility.
The credit agreements contain various covenants, including the maintenance of consolidated leverage ratio, as defined in the agreements. Failure to meet those covenants beyond applicable grace periods could result in accelerated due dates and/or termination of the agreements. As of December 31, 2016, we were in compliance with those covenants. In addition, the credit agreements allow for acceleration of payments or termination of the agreements due to nonpayment, or in some cases, due to the acceleration of other significant indebtedness of us or of some of our subsidiaries. Our credit agreements do not contain provisions that trigger an acceleration of indebtedness based solely on the occurrence of a material adverse change in our financial condition or results of operations.
As noted above, the terms of the credit agreements require us to maintain a ratio of total Consolidated Indebtedness-to- Consolidated EBITDA, as defined in the agreements, of 5.0 to 1 or less. As of December 31, 2016 this ratio was 3.8 to 1.
Cash Distributions. The partnership agreement requires that, within 60 days after the end of each quarter, we distribute all of our Available Cash, as defined, to unitholders of record on the applicable record date.
We increased the quarterly cash distributions each quarter of 2016 from $0.63875 per limited partner unit for the fourth quarter of 2015 to $0.68875 per limited partner unit for the fourth quarter of 2016. The cash distribution for the fourth quarter of 2016 was declared on February 7, 2017 and is payable on February 28, 2017.
Our Board of Directors evaluates each individual quarterly distribution decision based on an assessment of growth in cash available to make distributions. Growth in our cash available to make distributions over time is dependent on incremental organic growth expansion, third-party acquisitions or acquisitions from Spectra Energy. Our amount of Available Cash depends primarily upon our cash flows, including cash flow from financial reserves and working capital or other borrowings, and not solely on profitability, which will be affected by non-cash items. As a result, we may make cash distributions during periods when we record a net loss for financial accounting purposes and may not make cash distributions during periods when we record net earnings for financial accounting purposes.
Other Financing Matters. We have an effective shelf registration statement on file with the SEC to register the issuance of unlimited amounts of limited partner common units and various debt securities and another registration statement on file with the SEC to register the issuance of $1 billion, in the aggregate, of limited partner common units and various debt securities over time. This registration statement has $359 million available as of December 31, 2016.
Off Balance Sheet Arrangements
We enter into guarantee arrangements in the normal course of business to facilitate commercial transactions with third parties. These arrangements include financial guarantees, stand-by letters of credit, surety bonds and indemnifications. See Note 17 of Notes to Consolidated Financial Statements for further discussion of guarantee arrangements.
Most of the guarantee arrangements that we enter into enhance the credit standings of certain subsidiaries, non-consolidated entities or less than 100%-owned entities, enabling them to conduct business. As such, these guarantee arrangements involve elements of performance and credit risk which are not included on our Consolidated Balance Sheets. The possibility of us having to honor our contingencies is largely dependent upon the future operations of our subsidiaries, investees and other third parties, or the occurrence of certain future events.
56
We do not have any off-balance sheet financing entities or structures, except for normal operating lease arrangements, guarantee arrangements and financings entered into by our equity investments. These debt obligations do not contain provisions requiring accelerated payment of the related obligation in the event of specified declines in credit ratings.
Contractual Obligations
We enter into contracts that require payment of cash at certain periods based on certain specified minimum quantities and prices. The following table summarizes our contractual cash obligations for each of the periods presented. The table below excludes all amounts classified as Total Current Liabilities on the December 31, 2016 Consolidated Balance Sheet other than Current Maturities of Long-Term Debt. It is expected that the majority of Total Current Liabilities will be paid in cash in 2017.
Contractual Obligations as of December 31, 2016
Payments Due by Period | |||||||||||||||||||
Total | 2017 | 2018 & 2019 | 2020 & 2021 | 2022 & Beyond | |||||||||||||||
(in millions) | |||||||||||||||||||
Long-term debt (a) | $ | 9,843 | $ | 691 | $ | 1,389 | $ | 1,101 | $ | 6,662 | |||||||||
Operating leases (b) | 212 | 17 | 39 | 34 | 122 | ||||||||||||||
Purchase obligations (c) | 3,980 | 908 | 364 | 291 | 2,417 | ||||||||||||||
Total contractual cash obligations | $ | 14,035 | $ | 1,616 | $ | 1,792 | $ | 1,426 | $ | 9,201 | |||||||||
_________
(a) | See Note 13 of Notes to Consolidated Financial Statements. Amounts include principal payments and estimated scheduled interest payments over the life of the associated debt. |
(b) | See Note 16 of Notes to Consolidated Financial Statements. |
(c) | Purchase obligations reflected in the Consolidated Balance Sheets have been excluded from the above table. |
Quantitative and Qualitative Disclosures About Market Risk
We are exposed to market risks associated with interest rates and credit exposure. We have established comprehensive risk management policies to monitor and manage these market risks. Spectra Energy is responsible for the overall governance of managing our interest rate risk and credit risk, including monitoring exposure limits.
Credit Risk
Credit risk represents the loss that we would incur if a counterparty fails to perform under its contractual obligations. Our exposure generally relates to receivables and unbilled revenue for services provided, as well as volumes owed by customers for imbalances or gas loaned by us generally under park and loan services and no-notice services. Our principal customers for natural gas transmission and storage services are industrial end-users, marketers, exploration and production companies, LDCs and utilities located throughout the United States and Canada. Customers on the Express-Platte system are primarily refineries located in the Rocky Mountain and Midwestern states of the United States. Other customers include oil producers and marketing entities. We have concentrations of receivables from these industry sectors. These concentrations of customers may affect our overall credit risk in that risk factors can negatively affect the credit quality of the entire sector.
Where exposed to credit risk, we analyze the customers’ financial condition prior to entering into an agreement, establish credit limits and monitor the appropriateness of those limits on an ongoing basis. We also obtain parental guarantees, cash deposits or letters of credit from customers to provide credit support, where appropriate, based on our financial analysis of the customer and the regulatory or contractual terms and conditions applicable to each contract. A significant amount of our credit exposures for transmission, storage and gathering services are with customers who have an investment-grade rating (or the equivalent based on an evaluation by Spectra Energy), or are secured by collateral. However, we cannot predict to what extent our business would be impacted by deteriorating conditions in the economy, including possible declines in our customers’ creditworthiness.
Based on our policies for managing credit risk, our current exposures and our credit and other reserves, we do not anticipate a material effect on our consolidated financial position or results of operations as a result of non-performance by any customer.
Interest Rate Risk
We are exposed to risk resulting from changes in interest rates as a result of our issuance of variable and fixed-rate debt and commercial paper. We manage our interest rate exposure by limiting our variable-rate exposures to percentages of total debt
57
and by monitoring the effects of market changes in interest rates. We also enter into financial derivative instruments, including, but not limited to, interest rate swaps to manage and mitigate interest rate risk exposure. See also Notes 1, 14 and 15 of Notes to Consolidated Financial Statements.
As of December 31, 2016, we had interest rate hedges in place for various purposes. We are party to “pay floating—receive fixed” interest rate swaps with a total notional amount of $900 million to hedge against changes in the fair value of our fixed-rate debt that arise as a result of changes in market interest rates. These swaps also allow us to transform a portion of the underlying interest payments related to our long-term fixed-rate debt securities into variable-rate interest payments in order to achieve our desired mix of fixed and variable-rate debt.
Based on a sensitivity analysis as of December 31, 2016, it was estimated that if short-term interest rates average 100 basis points higher (lower) in 2017 than in 2016, interest expense, net of offsetting interest income, would fluctuate by $17 million before tax. Comparatively, based on a sensitivity analysis as of December 31, 2015, had short-term interest rates averaged 100 basis points higher (lower) in 2016 than in 2015, it was estimated that interest expense, net of offsetting interest income, would have fluctuated by approximately $16 million. These amounts were estimated by considering the effect of the hypothetical interest rates on variable-rate debt outstanding, adjusted for interest rate hedges, short-term investments, and cash and cash equivalents outstanding as of December 31, 2016 and 2015.
OTHER ISSUES
For information on other issues, see Notes 5 and 16 of Notes to Consolidated Financial Statements.
New Accounting Pronouncements
See Note 1 of Notes to Consolidated Financial Statements for discussion.
Item 7A. Quantitative and Qualitative Disclosures About Market Risk.
See Item 7. Management’s Discussion and Analysis of Financial Condition and Results of Operations — Quantitative and Qualitative Disclosures About Market Risk for discussion.
58
Item 8. Financial Statements and Supplementary Data.
Management’s Annual Report on Internal Control over Financial Reporting
The management of our General Partner is responsible for establishing and maintaining an adequate system of internal control over financial reporting, as such term is defined in Exchange Act Rules 13a-15(f) and 15d-15(f). Our internal control system was designed to provide reasonable assurance regarding the reliability of financial reporting and the preparation of financial statements for external purposes, in accordance with generally accepted accounting principles. Because of inherent limitations, internal control over financial reporting may not prevent or detect misstatements. Also, projections of any evaluation of effectiveness to future periods are subject to the risk that controls may become inadequate because of changes in conditions, or that the degree of compliance with policies and procedures may deteriorate.
The management of our General Partner, including our Chief Executive Officer and Chief Financial Officer, has conducted an evaluation of the effectiveness of our internal control over financial reporting as of December 31, 2016 based on the criteria established in Internal Control — Integrated Framework (2013) issued by the Committee of Sponsoring Organizations of the Treadway Commission. Based on that evaluation, management concluded that our internal control over financial reporting was effective at the reasonable assurance level as of December 31, 2016.
Deloitte & Touche LLP, our independent registered public accounting firm, has audited and issued a report on the effectiveness of our internal control over financial reporting. Their report is included herein.
59
REPORT OF INDEPENDENT REGISTERED PUBLIC ACCOUNTING FIRM
To the Board of Directors of Spectra Energy Partners GP, LLC and Unitholders of Spectra Energy Partners, LP:
Houston, Texas
We have audited the accompanying consolidated balance sheets of Spectra Energy Partners, LP and subsidiaries (the "Partnership") as of December 31, 2016 and 2015, and the related consolidated statements of operations, comprehensive income, cash flows and equity for each of the three years in the period ended December 31, 2016. We also have audited the Partnership's internal control over financial reporting as of December 31, 2016 based on criteria established in Internal Control - Integrated Framework (2013) issued by the Committee of Sponsoring Organizations of the Treadway Commission. The Partnership’s management is responsible for these financial statements, for maintaining effective internal control over financial reporting, and for its assessment of the effectiveness of internal control over financial reporting, included in the accompanying Management’s Annual Report on Internal Control over Financial Reporting. Our responsibility is to express an opinion on these financial statements and an opinion on the Partnership's internal control over financial reporting based on our audits.
We conducted our audits in accordance with the standards of the Public Company Accounting Oversight Board (United States). Those standards require that we plan and perform the audit to obtain reasonable assurance about whether the financial statements are free of material misstatement and whether effective internal control over financial reporting was maintained in all material respects. Our audits of the financial statements included examining, on a test basis, evidence supporting the amounts and disclosures in the financial statements, assessing the accounting principles used and significant estimates made by management, and evaluating the overall financial statement presentation. Our audit of internal control over financial reporting included obtaining an understanding of internal control over financial reporting, assessing the risk that a material weakness exists, and testing and evaluating the design and operating effectiveness of internal control based on the assessed risk. Our audits also included performing such other procedures as we considered necessary in the circumstances. We believe that our audits provide a reasonable basis for our opinions.
A company's internal control over financial reporting is a process designed by, or under the supervision of, the company's principal executive and principal financial officers, or persons performing similar functions, and effected by the company's board of directors, management, and other personnel to provide reasonable assurance regarding the reliability of financial reporting and the preparation of financial statements for external purposes in accordance with generally accepted accounting principles. A company's internal control over financial reporting includes those policies and procedures that (1) pertain to the maintenance of records that, in reasonable detail, accurately and fairly reflect the transactions and dispositions of the assets of the company; (2) provide reasonable assurance that transactions are recorded as necessary to permit preparation of financial statements in accordance with generally accepted accounting principles and that receipts and expenditures of the company are being made only in accordance with authorizations of management and directors of the company; and (3) provide reasonable assurance regarding prevention or timely detection of unauthorized acquisition, use, or disposition of the company's assets that could have a material effect on the financial statements.
Because of the inherent limitations of internal control over financial reporting, including the possibility of collusion or improper management override of controls, material misstatements due to error or fraud may not be prevented or detected on a timely basis. Also, projections of any evaluation of the effectiveness of the internal control over financial reporting to future periods are subject to the risk that the controls may become inadequate because of changes in conditions, or that the degree of compliance with the policies or procedures may deteriorate.
In our opinion, the consolidated financial statements referred to above present fairly, in all material respects, the financial position of Spectra Energy Partners, LP and subsidiaries as of December 31, 2016 and 2015, and the results of their operations and their cash flows for each of the three years in the period ended December 31, 2016, in conformity with accounting principles generally accepted in the United States of America. Also, in our opinion, the Partnership maintained, in all material respects, effective internal control over financial reporting as of December 31, 2016, based on the criteria established in Internal Control - Integrated Framework (2013) issued by the Committee of Sponsoring Organizations of the Treadway Commission.
/s/ DELOITTE & TOUCHE LLP
Houston, Texas
February 24, 2017
60
SPECTRA ENERGY PARTNERS, LP
CONSOLIDATED STATEMENTS OF OPERATIONS
(In millions, except per-unit amounts)
Years Ended December 31, | |||||||||||
2016 | 2015 | 2014 | |||||||||
Operating Revenues | |||||||||||
Transportation of natural gas | $ | 1,951 | $ | 1,858 | $ | 1,685 | |||||
Transportation of crude oil | 359 | 357 | 302 | ||||||||
Storage of natural gas and other | 223 | 240 | 282 | ||||||||
Total operating revenues | 2,533 | 2,455 | 2,269 | ||||||||
Operating Expenses | |||||||||||
Operating, maintenance and other | 822 | 750 | 690 | ||||||||
Depreciation and amortization | 314 | 295 | 288 | ||||||||
Property and other taxes | 169 | 137 | 155 | ||||||||
Total operating expenses | 1,305 | 1,182 | 1,133 | ||||||||
Operating Income | 1,228 | 1,273 | 1,136 | ||||||||
Other Income and Expenses | |||||||||||
Earnings from equity investments | 127 | 167 | 133 | ||||||||
Other income and expenses, net | 126 | 76 | 31 | ||||||||
Total other income and expenses | 253 | 243 | 164 | ||||||||
Interest Expense | 224 | 239 | 238 | ||||||||
Earnings Before Income Taxes | 1,257 | 1,277 | 1,062 | ||||||||
Income Tax Expense | 18 | 12 | 35 | ||||||||
Net Income | 1,239 | 1,265 | 1,027 | ||||||||
Net Income—Noncontrolling Interests | 78 | 40 | 23 | ||||||||
Net Income—Controlling Interests | $ | 1,161 | $ | 1,225 | $ | 1,004 | |||||
Calculation of Limited Partners’ Interest in Net Income: | |||||||||||
Net income—Controlling Interests | $ | 1,161 | $ | 1,225 | $ | 1,004 | |||||
Less: General partner’s interest in net income | 311 | 249 | 187 | ||||||||
Limited partners’ interest in net income | $ | 850 | $ | 976 | $ | 817 | |||||
Weighted average limited partners units outstanding — basic and diluted | 299 | 296 | 288 | ||||||||
Net income per limited partner unit — basic and diluted | $ | 2.84 | $ | 3.30 | $ | 2.84 | |||||
Distributions paid per limited partner unit | $ | 2.63 | $ | 2.43 | $ | 2.245 | |||||
See Notes to Consolidated Financial Statements.
61
SPECTRA ENERGY PARTNERS, LP
CONSOLIDATED STATEMENTS OF COMPREHENSIVE INCOME
(In millions)
Years Ended December 31, | |||||||||||
2016 | 2015 | 2014 | |||||||||
Net Income | $ | 1,239 | $ | 1,265 | $ | 1,027 | |||||
Other comprehensive income (loss): | |||||||||||
Foreign currency translation adjustments | 5 | (29 | ) | (14 | ) | ||||||
Reclassification of cash flow hedges into earnings | — | (1 | ) | (1 | ) | ||||||
Total other comprehensive income (loss) | 5 | (30 | ) | (15 | ) | ||||||
Total Comprehensive Income | 1,244 | 1,235 | 1,012 | ||||||||
Less: Comprehensive Income—Noncontrolling Interests | 78 | 40 | 23 | ||||||||
Comprehensive Income—Controlling Interests | $ | 1,166 | $ | 1,195 | $ | 989 | |||||
See Notes to Consolidated Financial Statements.
62
SPECTRA ENERGY PARTNERS, LP
CONSOLIDATED BALANCE SHEETS
(In millions)
December 31, | |||||||
2016 | 2015 | ||||||
ASSETS | |||||||
Current Assets | |||||||
Cash and cash equivalents | $ | 216 | $ | 168 | |||
Receivables (net of allowance for doubtful accounts of $6 and $3 at December 31, 2016 and 2015, respectively) | 380 | 272 | |||||
Inventory | 40 | 37 | |||||
Fuel tracker | 6 | 41 | |||||
Other | 18 | 26 | |||||
Total current assets | 660 | 544 | |||||
Investments and Other Assets | |||||||
Investments in and loans to unconsolidated affiliates | 1,127 | 904 | |||||
Goodwill | 3,234 | 3,232 | |||||
Other | 108 | 44 | |||||
Total investments and other assets | 4,469 | 4,180 | |||||
Property, Plant and Equipment | |||||||
Cost | 19,958 | 17,491 | |||||
Less accumulated depreciation and amortization | 3,866 | 3,654 | |||||
Net property, plant and equipment | 16,092 | 13,837 | |||||
Regulatory Assets and Deferred Debits | 385 | 290 | |||||
Total Assets | $ | 21,606 | $ | 18,851 | |||
See Notes to Consolidated Financial Statements.
63
SPECTRA ENERGY PARTNERS, LP
CONSOLIDATED BALANCE SHEETS
(In millions)
December 31, | |||||||
2016 | 2015 | ||||||
LIABILITIES AND EQUITY | |||||||
Current Liabilities | |||||||
Accounts payable | $ | 441 | $ | 322 | |||
Commercial paper | 574 | 476 | |||||
Taxes accrued | 76 | 60 | |||||
Interest accrued | 79 | 72 | |||||
Current maturities of long-term debt | 416 | 283 | |||||
Other | 193 | 258 | |||||
Total current liabilities | 1,779 | 1,471 | |||||
Long-term Debt | 6,223 | 5,845 | |||||
Deferred Credits and Other Liabilities | |||||||
Deferred income taxes | 42 | 38 | |||||
Regulatory and other | 158 | 151 | |||||
Total deferred credits and other liabilities | 200 | 189 | |||||
Commitments and Contingencies | |||||||
Equity | |||||||
Partners’ Capital | |||||||
Common units (308.4 million and 285.1 million units issued and outstanding at December 31, 2016 and 2015, respectively) | 11,650 | 10,527 | |||||
General partner units (6.3 million and 5.8 million units issued and outstanding at December 31, 2016 and 2015, respectively) | 452 | 336 | |||||
Accumulated other comprehensive loss | (45 | ) | (50 | ) | |||
Total partners’ capital | 12,057 | 10,813 | |||||
Noncontrolling interests | 1,347 | 533 | |||||
Total equity | 13,404 | 11,346 | |||||
Total Liabilities and Equity | $ | 21,606 | $ | 18,851 | |||
See Notes to Consolidated Financial Statements.
64
SPECTRA ENERGY PARTNERS, LP
CONSOLIDATED STATEMENTS OF CASH FLOWS
(In millions)
Years Ended December 31, | |||||||||||
2016 | 2015 | 2014 | |||||||||
CASH FLOWS FROM OPERATING ACTIVITIES | |||||||||||
Net income | $ | 1,239 | $ | 1,265 | $ | 1,027 | |||||
Adjustments to reconcile net income to net cash provided by operating activities: | |||||||||||
Depreciation and amortization | 320 | 304 | 296 | ||||||||
Deferred income tax expense | 4 | 3 | 27 | ||||||||
Earnings from equity investments | (127 | ) | (167 | ) | (133 | ) | |||||
Distributions from equity investments | 110 | 160 | 131 | ||||||||
Decrease (increase) in: | |||||||||||
Receivables | (26 | ) | 8 | (18 | ) | ||||||
Other current assets | 5 | 5 | (5 | ) | |||||||
Increase (decrease) in: | |||||||||||
Accounts payable | (20 | ) | 27 | 6 | |||||||
Taxes accrued | 16 | (3 | ) | 19 | |||||||
Other current liabilities | 58 | (6 | ) | (7 | ) | ||||||
Other, assets | (127 | ) | (70 | ) | (26 | ) | |||||
Other, liabilities | 10 | (4 | ) | 16 | |||||||
Net cash provided by operating activities | 1,462 | 1,522 | 1,333 | ||||||||
CASH FLOWS FROM INVESTING ACTIVITIES | |||||||||||
Capital expenditures | (2,334 | ) | (1,883 | ) | (1,081 | ) | |||||
Investments in and loans to unconsolidated affiliates | (251 | ) | (124 | ) | (160 | ) | |||||
Purchase of intangible, net | (80 | ) | — | — | |||||||
Distributions from equity investments | 50 | 450 | 163 | ||||||||
Distributions to equity investment | (148 | ) | (248 | ) | — | ||||||
Purchases of held-to-maturity securities | (39 | ) | (44 | ) | (43 | ) | |||||
Proceeds from sales and maturities of held-to-maturity securities | 39 | 44 | 43 | ||||||||
Purchases of available-for-sale securities | (714 | ) | (95 | ) | — | ||||||
Proceeds from sales and maturities of available-for-sale securities | 715 | 84 | — | ||||||||
Other changes in restricted funds | 9 | (14 | ) | — | |||||||
Other | (1 | ) | — | 1 | |||||||
Net cash used in investing activities | (2,754 | ) | (1,830 | ) | (1,077 | ) | |||||
CASH FLOWS FROM FINANCING ACTIVITIES | |||||||||||
Proceeds from issuance of long-term debt | 800 | 994 | — | ||||||||
Payments for the redemption of long-term debt | (280 | ) | (32 | ) | (441 | ) | |||||
Net increase (decrease) in commercial paper | 98 | (431 | ) | 569 | |||||||
Distributions to noncontrolling interests | (30 | ) | (31 | ) | (29 | ) | |||||
Contributions from noncontrolling interests | 743 | 248 | 145 | ||||||||
Proceeds from the issuances of units | 1,080 | 558 | 334 | ||||||||
Distributions to partners | (1,061 | ) | (961 | ) | (815 | ) | |||||
Other | (10 | ) | (9 | ) | — | ||||||
Net cash provided by (used in) financing activities | 1,340 | 336 | (237 | ) | |||||||
Net increase in cash and cash equivalents | 48 | 28 | 19 | ||||||||
Cash and cash equivalents at beginning of the period | 168 | 140 | 121 | ||||||||
Cash and cash equivalents at end of the period | $ | 216 | $ | 168 | $ | 140 | |||||
Supplemental Disclosures | |||||||||||
Cash paid for interest, net of amount capitalized | $ | 209 | $ | 218 | $ | 232 | |||||
Cash paid for income taxes | 10 | 12 | 6 | ||||||||
Property, plant and equipment noncash accruals | 247 | 140 | 94 | ||||||||
Units issued as partial consideration for acquisitions | — | 1 | 186 | ||||||||
See Notes to Consolidated Financial Statements.
65
SPECTRA ENERGY PARTNERS, LP
CONSOLIDATED STATEMENTS OF EQUITY
(In millions)
Partners’ Capital | Noncontrolling Interests | Total | |||||||||||||||||||
Common | General Partner | Accumulated Other Comprehensive Income (Loss) | |||||||||||||||||||
December 31, 2013 | $ | 9,778 | $ | 241 | $ | (5 | ) | $ | 127 | $ | 10,141 | ||||||||||
Net income | 817 | 187 | — | 23 | 1,027 | ||||||||||||||||
Other comprehensive loss | — | — | (15 | ) | — | (15 | ) | ||||||||||||||
Purchase price under net acquired assets in Express-Platte acquisition | 10 | — | — | — | 10 | ||||||||||||||||
Excess purchase price over net acquired assets in U.S. Assets Dropdown | (10 | ) | — | — | — | (10 | ) | ||||||||||||||
Net transfer from parent | 16 | — | — | — | 16 | ||||||||||||||||
Attributed deferred tax benefit | — | 16 | — | 2 | 18 | ||||||||||||||||
Issuances of units | 509 | 11 | — | — | 520 | ||||||||||||||||
Distributions to partners | (644 | ) | (171 | ) | — | — | (815 | ) | |||||||||||||
Contributions from noncontrolling interests | — | — | — | 145 | 145 | ||||||||||||||||
Distributions to noncontrolling interests | — | — | — | (29 | ) | (29 | ) | ||||||||||||||
Other, net | (2 | ) | — | — | — | (2 | ) | ||||||||||||||
December 31, 2014 | 10,474 | 284 | (20 | ) | 268 | 11,006 | |||||||||||||||
Net income | 976 | 249 | — | 40 | 1,265 | ||||||||||||||||
Other comprehensive loss | — | — | (30 | ) | — | (30 | ) | ||||||||||||||
Retirement of units | (794 | ) | (15 | ) | — | — | (809 | ) | |||||||||||||
Consideration over net disposed assets | 51 | 1 | — | — | 52 | ||||||||||||||||
Attributed deferred tax benefit | — | 39 | — | 8 | 47 | ||||||||||||||||
Issuances of units | 547 | 11 | — | — | 558 | ||||||||||||||||
Distributions to partners | (728 | ) | (233 | ) | — | — | (961 | ) | |||||||||||||
Contributions from noncontrolling interests | — | — | — | 248 | 248 | ||||||||||||||||
Distributions to noncontrolling interests | — | — | — | (31 | ) | (31 | ) | ||||||||||||||
Other, net | 1 | — | — | — | 1 | ||||||||||||||||
December 31, 2015 | 10,527 | 336 | (50 | ) | 533 | 11,346 | |||||||||||||||
Net income | 850 | — | 311 | — | — | 78 | 1,239 | ||||||||||||||
Other comprehensive income | — | — | 5 | — | 5 | ||||||||||||||||
Attributed deferred tax benefit | — | 59 | — | 23 | 82 | ||||||||||||||||
Issuances of units | 1,058 | 22 | — | — | 1,080 | ||||||||||||||||
Distributions to partners | (785 | ) | (276 | ) | — | — | (1,061 | ) | |||||||||||||
Contributions from noncontrolling interests | — | — | — | 743 | 743 | ||||||||||||||||
Distributions to noncontrolling interests | — | — | — | (30 | ) | (30 | ) | ||||||||||||||
December 31, 2016 | $ | 11,650 | — | $ | 452 | — | $ | (45 | ) | $ | 1,347 | $ | 13,404 | ||||||||
See Notes to Consolidated Financial Statements.
66
SPECTRA ENERGY PARTNERS, LP
Notes to Consolidated Financial Statements
INDEX
Page | ||
1. | ||
2. | ||
3. | ||
4. | ||
5. | ||
6. | ||
7. | ||
8. | Variable Interest Entities | |
9. | Intangible Asset | |
10. | ||
11. | ||
12. | ||
13. | ||
14. | ||
15. | ||
16. | ||
17. | Guarantees | |
18. | ||
19. | ||
20. | ||
1. Summary of Operations and Significant Accounting Policies
The terms “we,” “our,” “us” and “Spectra Energy Partners” as used in this report refer collectively to Spectra Energy Partners, LP and its subsidiaries unless the context suggests otherwise. These terms are used for convenience only and are not intended as a precise description of any separate legal entity within Spectra Energy Partners.
Nature of Operations. Spectra Energy Partners, through its subsidiaries and equity investments, is engaged in the transmission, storage and gathering of natural gas and the transportation and storage of crude oil through interstate pipeline systems. We are a Delaware master limited partnership (MLP). As of December 31, 2016, Spectra Energy Corp (Spectra Energy) and its subsidiaries collectively owned 75% of us and the remaining 25% was publicly owned.
On September 6, 2016, Spectra Energy announced that they entered into a definitive merger agreement with Enbridge Inc. (Enbridge). Under this agreement, Enbridge and Spectra Energy will combine in a stock-for-stock merger transaction, which values Spectra Energy's stock at approximately $28 billion, based on the closing price of Enbridge common shares as of September 2, 2016. This transaction was approved by the boards of directors and shareholders of both Spectra Energy and Enbridge and has received all necessary regulatory approvals. The transaction is expected to close on February 27, 2017.
Upon completion of the proposed merger, Spectra Energy shareholders will receive 0.984 Enbridge common shares for each share of Spectra Energy stock they own. The consideration to be received is valued at $40.33 per Spectra Energy share, based on the closing price of Enbridge common shares as of September 2, 2016, representing an approximate 11.5% premium to the closing price of Spectra Energy stock as of September 2, 2016. Upon completion of the merger, Enbridge shareholders are expected to own approximately 57% of the combined company and Spectra Energy shareholders are expected to own approximately 43%.
67
As a result of this transaction, Enbridge and its subsidiaries will collectively own the interest in us currently held by Spectra Energy.
Basis of Presentation. The accompanying Consolidated Financial Statements include our accounts and the accounts of our majority-owned subsidiaries, after eliminating intercompany transactions and balances.
During 2013, we acquired substantially all of Spectra Energy's U.S. transmission, storage and liquid assets (U.S. Assets Dropdown), excluding a 25.05% ownership interest in Southeast Supply Header, LLC (SESH) and a 1% ownership interest in Steckman Ridge, LP (Steckman Ridge).
In November 2014, we acquired an additional 24.95% ownership interest in SESH and the remaining 1% interest in Steckman Ridge from Spectra Energy.
In November 2015, we acquired the remaining 0.1% ownership interest in SESH from Spectra Energy.
Our costs of doing business have been reflected in our financial accounting records for the periods presented. These costs include direct charges and allocations from Spectra Energy and its affiliates for business services, such as payroll, accounts payable and facilities management; corporate services, such as finance and accounting, legal, human resources, investor relations, public and regulatory policy, and senior executives; and pension and other post-retirement benefit costs.
Use of Estimates. To conform with generally accepted accounting principles (GAAP) in the United States, we make estimates and assumptions that affect the amounts reported in the Consolidated Financial Statements and Notes to Consolidated Financial Statements. Although these estimates are based on our best available knowledge at the time, actual results could differ.
Fair Value Measurements. We measure the fair value of financial assets and liabilities by maximizing the use of observable inputs and minimizing the use of unobservable inputs. Fair value is the exchange price that would be received for an asset or paid to transfer a liability (an exit price) in the principal or most advantageous market for the asset or liability in an orderly transaction between market participants on the measurement date.
Cost-Based Regulation. The economic effects of regulation can result in a regulated company recording assets for costs that have been or are expected to be approved for recovery from customers or recording liabilities for amounts that are expected to be returned to customers or for instances where the regulator provides current rates that are intended to recover costs that are expected to be incurred in the future. Accordingly, we record assets and liabilities that result from the regulated ratemaking process that may not be recorded under GAAP for non-regulated entities. We continually assess whether regulatory assets are probable of future recovery by considering factors such as applicable regulatory changes and recent rate orders to other regulated entities. Based on this assessment, we believe our existing regulatory assets are probable of recovery. These regulatory assets and liabilities are mostly classified in the Consolidated Balance Sheets as Regulatory Assets and Deferred Debits and Current Liabilities. We evaluate our regulated assets, and consider factors such as regulatory changes and the effect of competition. If cost-based regulation ends or competition increases, we may have to reduce our asset balances to reflect a market basis less than cost and write-off the associated regulatory assets and liabilities. See Note 5 for further discussion.
Foreign Currency Translation. The Canadian dollar has been determined to be the functional currency of the Canadian portion of the Express-Platte pipeline system (Express Canada) based on an assessment of the economic circumstances of those operations. Assets and liabilities of Express Canada are translated into U.S. dollars at current exchange rates. Translation adjustments resulting from fluctuations in exchange rates are included as a separate component of Other Comprehensive Income (Loss) on the Consolidated Statements of Comprehensive Income. Revenue and expense accounts of these operations are translated at average monthly exchange rates prevailing during the periods. Gains and losses arising from transactions denominated in currencies other than the functional currency are included in the results of operations of the period in which they occur. Foreign currency transaction losses totaled $1 million, $6 million, and $3 million in 2016, 2015, and 2014 respectively and are included in Other Income and Expenses, Net on the Consolidated Statements of Operations.
Revenue Recognition. Revenues from the transmission, storage and gathering of natural gas, and from the transportation of crude oil are generally recognized when the service is provided. Revenues related to these services provided but not yet billed are estimated each month. These estimates are generally based on contract data, regulatory information and preliminary throughput and allocation measurements. Final bills for the current month are billed and collected in the following month. Differences between actual and estimated revenues are immaterial. There were no customers accounting for 10% or more of consolidated revenues during 2016, 2015 or 2014. We also have certain customer contracts with billed amounts that decline annually over the terms of the contracts. Differences between the amounts billed and recognized are deferred on the Consolidated Balance Sheets.
68
Allowance for Funds Used During Construction (AFUDC). AFUDC, which represents the estimated debt and equity costs of capital funds necessary to finance the construction and expansion of certain new regulated facilities, consists of two components, an equity component and an interest expense component. After construction is completed, we are permitted to recover these costs through inclusion in the rate base and in the depreciation provision. AFUDC is capitalized as a component of Property, Plant and Equipment - Cost in the Consolidated Balance Sheets, with offsetting credits to the Consolidated Statements of Operations through Other Income and Expenses, Net for the equity component and Interest Expense for the interest expense component. The total amount of AFUDC included in the Consolidated Statements of Operations was $168 million in 2016 (an equity component of $121 million and an interest expense component of $47 million), $95 million in 2015 (an equity component of $76 million and an interest expense component of $19 million) and $42 million in 2014 (an equity component of $33 million and an interest expense component of $9 million). The equity component of AFUDC, a non-cash item, is included as a reconciling item to net income within Cash Flows from Operating Activities - Other, Assets in the Consolidated Statements of Cash Flows.
Income Taxes. As a result of our MLP structure, we are not subject to federal income tax. Our federal taxable income or loss is reported on the respective income tax returns of our partners. However, we are subject to Canadian income tax and Tennessee and New Hampshire income tax. Spectra Energy Partners is liable to Spectra Energy for Texas income (margin) tax under a tax sharing agreement. As of December 31, 2016, the difference between the tax basis and the reported amounts of Spectra Energy Partners’ assets and liabilities is $15.2 billion.
We are subject to cost-based regulation and consequently record a regulatory tax asset in connection with the tax gross up of AFUDC equity. The corresponding deferred tax liability is recognized as an Attributed Deferred Tax Benefit in the Consolidated Statements of Equity since we are a pass-through entity.
In the first quarter of 2014, we recorded $23 million of income tax expense due to the adjustment to deferred income tax liabilities (eliminated and recorded as an income tax benefit in 2013 in connection with the U.S. Assets Dropdown and resulting changes in tax status of certain entities) as a result of the final purchase price allocation adjustments.
Cash and Cash Equivalents. Highly liquid investments with original maturities of three months or less at the date of acquisition are considered cash equivalents, except for the investments that were pledged as collateral against long-term debt as discussed in Note 13 and any investments that are considered restricted funds.
Inventory. Inventory consists of natural gas retained from shippers for fuel and also includes materials and supplies. Natural gas is recorded at the lower of cost or market. Materials and supplies are recorded at cost, using the average cost method.
Natural Gas Imbalances. The Consolidated Balance Sheets include in-kind balances as a result of differences in gas volumes received and delivered for customers. Since settlement of certain imbalances is in-kind, changes in the balances do not have an effect on our Consolidated Statements of Operations or Consolidated Statements of Cash Flows. Receivables include $99 million and $36 million as of December 31, 2016 and December 31, 2015, respectively, and Other Current Liabilities include $74 million and $32 million as of December 31, 2016 and December 31, 2015, respectively, related to all gas imbalances. Most natural gas volumes owed to or by us are valued at natural gas market index prices as of the balance sheet dates.
Cash Flow and Fair Value Hedges. We have entered into interest rate swaps which were designated as either a hedge of a forecasted transaction (cash flow hedge) or a hedge of a recognized asset, liability or firm commitment (fair value hedge). For all hedge contracts, we prepare documentation of the hedge in accordance with accounting standards and assess whether the hedge contract is highly effective using regression analysis, both at inception and on a quarterly basis, in offsetting changes in cash flows or fair values of hedged items.
Changes in the fair value of a derivative designated and qualified as a cash flow hedge, to the extent effective, are included in the Consolidated Statements of Comprehensive Income as Other Comprehensive Income (Loss) until earnings are affected by the hedged item. We discontinue hedge accounting prospectively when we have determined that a derivative no longer qualifies as an effective hedge or when it is no longer probable that the hedged forecasted transaction will occur. When hedge accounting is discontinued because the derivative no longer qualifies as an effective hedge, the derivative is subject to the mark-to-market model of accounting prospectively. Gains and losses related to discontinued hedges that were previously accumulated in accumulated other comprehensive income (AOCI) remain in AOCI until the underlying transaction is reflected in earnings, unless it is probable that the hedged forecasted transaction will not occur at which time associated deferred amounts in AOCI are immediately recognized in current earnings.
69
For derivatives designated as fair value hedges, we recognize the gain or loss on the derivative instrument, as well as the offsetting gain or loss on the hedged item in earnings, to the extent effective, in the current period. In the event the hedge is not effective, there is no offsetting gain or loss recognized in earnings for the hedged item. All derivatives designated and accounted for as hedges are classified in the same category as the item being hedged in the Consolidated Statements of Cash Flows. All components of each derivative gain or loss are included in the assessment of hedge effectiveness.
Investments. We may actively invest a portion of our available cash and restricted funds balances in various financial instruments, including taxable or tax-exempt debt securities. In addition, we invest in short-term money market securities, some of which are restricted due to debt collateral requirements. Investments in available-for-sale (AFS) securities are carried at fair value and investments in held-to-maturity (HTM) securities are carried at cost. Investments in money market securities are also accounted for at fair value. Realized gains and losses, and dividend and interest income related to these securities, including any amortization of discounts or premiums arising at acquisition, are included in earnings. The costs of securities sold are determined using the specific identification method. Purchases and sales of AFS and HTM securities are presented on a gross basis within Cash Flows from Investing Activities in the accompanying Consolidated Statements of Cash Flows. See also Notes 10 and 14 for additional information.
Goodwill. We perform our goodwill impairment test annually and evaluate goodwill when events or changes in circumstances indicate that its carrying value may not be recoverable. No impairments of goodwill were recorded in 2016, 2015 or 2014.
We perform our annual review for goodwill impairment at the reporting unit level, which is identified by assessing whether the components of our operating segments constitute businesses for which discrete financial information is available, whether segment management regularly reviews the operating results of those components and whether the economic and regulatory characteristics are similar. We determined that our reporting units are equivalent to our reportable segments.
As permitted under accounting guidance on testing goodwill for impairment, we perform either a qualitative assessment or a quantitative assessment of each of our reporting units based on management’s judgment. With respect to our qualitative assessments, we consider events and circumstances specific to us, such as macroeconomic conditions, industry and market considerations, cost factors and overall financial performance, when evaluating whether it is more likely than not that the fair values of our reporting units are less than their respective carrying amounts.
In connection with our quantitative assessments, we primarily use a discounted cash flow analysis to determine the fair values of those reporting units. Key assumptions in the determination of fair value included the use of an appropriate discount rate and estimated future cash flows. In estimating cash flows, we incorporate expected long-term growth rates in key markets served by our operations, regulatory stability, the ability to renew contracts, commodity prices (where appropriate) and foreign currency exchange rates, as well as other factors that affect our reporting units’ revenue, expense and capital expenditure projections. If the carrying amount of the reporting unit exceeds its fair value, a comparison of the fair value and carrying value of the goodwill of that reporting unit needs to be performed. If the carrying value of the goodwill of a reporting unit exceeds the implied fair value of that goodwill, an impairment loss is recognized in an amount equal to the excess. Additional impairment tests are performed between the annual reviews if events or changes in circumstances make it more likely than not that the fair value of a reporting unit is below its carrying amount.
We had goodwill balances of $3,234 million at December 31, 2016 and $3,232 million at December 31, 2015. The increase in goodwill in 2016 was the result of foreign currency translation.
Property, Plant and Equipment. Property, plant and equipment is stated at historical cost less accumulated depreciation. We capitalize all construction-related direct labor and material costs, as well as indirect construction costs. Indirect costs include general engineering, taxes, administrative and general costs, and the cost of funds used during construction. The costs of renewals and betterments that extend the useful life or increase the expected output of property, plant and equipment are also capitalized. The costs of repairs, replacements and major maintenance projects that do not extend the useful life or increase the expected output of property, plant and equipment are expensed as incurred. Depreciation is generally computed over the asset’s estimated useful life using the straight-line method.
When we retire property, plant and equipment, we charge the original cost plus the cost of retirement, less salvage value, to accumulated depreciation and amortization. When we sell entire regulated operating units, or retire or sell certain non-regulated properties, the cost is removed from the property account and the related accumulated depreciation and amortization accounts are reduced. Any gain or loss is recorded in earnings, unless otherwise required by the applicable regulatory body.
Preliminary Project Costs. Project development costs, including expenditures for preliminary surveys, plans, investigations, environmental studies, regulatory applications and other costs incurred for the purpose of determining the
70
feasibility of capital expansion projects, are capitalized for rate-regulated enterprises when it is determined that recovery of such costs through regulated revenues of the completed project is probable. Any inception-to-date costs of the projects that were initially expensed are reversed and capitalized as Property, Plant and Equipment.
Long-Lived Asset Impairments. We evaluate whether long-lived assets, excluding goodwill, have been impaired when circumstances indicate the carrying value of those assets may not be recoverable. For such long-lived assets, an impairment exists when its carrying value exceeds the sum of estimates of the undiscounted cash flows expected to result from the use and eventual disposition of the asset. When alternative courses of action to recover the carrying amount of a long-lived asset are under consideration, a probability-weighted approach is used in developing estimates of future undiscounted cash flows. If the carrying value of the long-lived asset is not recoverable based on these estimated future undiscounted cash flows, an impairment loss is measured as the excess of the asset’s carrying value over its fair value, such that the asset’s carrying value is adjusted to its estimated fair value.
We assess the fair value of long-lived assets using commonly accepted techniques, and may use more than one source. Sources to determine fair value include, but are not limited to, recent third-party comparable sales, internally developed discounted cash flow analyses and analyses from outside advisors. Significant changes in market conditions resulting from events such as changes in natural gas available to our systems, the condition of an asset, a change in our intent to utilize the asset or a significant change in contracted revenues or regulatory recoveries would generally require us to reassess the cash flows related to the long-lived assets.
We recorded a $9 million non-cash impairment charge on Ozark Gas Gathering, L.L.C. in the first quarter of 2015 included in Operating, Maintenance and Other on the Consolidated Statements of Operations.
Asset Retirement Obligations (AROs). We recognize asset retirement obligations for legal commitments associated with the retirement of long-lived assets that result from the acquisition, construction, development and/or normal use of the asset and conditional AROs in which the timing or method of settlement are conditional on a future event that may or may not be within our control. The fair value of a liability for an ARO is recognized in the period in which it is incurred if a reasonable estimate of fair value can be made and is added to the carrying amount of the associated asset. This additional carrying amount is depreciated over the estimated useful life of the asset.
Unamortized Debt Premium, Discount and Expense. Premiums, discounts, and expenses incurred with the issuance of outstanding long-term debt are amortized over the terms of the debt issued. Any call premiums or unamortized expenses associated with refinancing higher-cost debt obligations to finance regulated assets and operations are amortized consistent with regulatory treatment of those items, where appropriate.
Environmental Expenditures. We expense environmental expenditures related to conditions caused by past operations that do not generate current or future revenues. Environmental expenditures related to operations that generate current or future revenues are expensed or capitalized, as appropriate. Undiscounted liabilities are recorded when the necessity for environmental remediation becomes probable and the costs can be reasonably estimated, or when other potential environmental liabilities are reasonably estimable and probable.
Segment Reporting. Operating segments are components of an enterprise for which separate financial information is available and evaluated regularly by the chief operating decision maker in deciding how to allocate resources and evaluate performance. Two or more operating segments may be aggregated into a single reportable segment provided certain criteria are met. There is no such aggregation within our defined business segments. A description of our reportable segments consistent with how business results are reported internally to management, and the disclosure of segment information is presented in Note 4.
Consolidated Statements of Cash Flows. Cash received from insurance proceeds are classified depending on the activity that resulted in the insurance proceeds. For example, business interruption insurance proceeds are included as a component of operating activities while insurance proceeds from damaged property are included as a component of investing activities. With respect to cash overdrafts, book overdrafts are included within operating cash flows while bank overdrafts, if any, are included within financing cash flows.
Distributions from Equity Investments. We consider distributions received from equity investments which do not exceed cumulative equity in earnings subsequent to the date of investment to be a return on investment and classify these amounts as Cash Flows from Operating Activities within the accompanying Consolidated Statements of Cash Flows. Cumulative distributions received in excess of cumulative equity in earnings subsequent to the date of investment are considered to be a return of investment and are classified as Cash Flows from Investing Activities.
71
New Accounting Pronouncements. The following new Accounting Standards Updates (ASUs) were adopted during 2016 and the effects of such adoptions, if any, are presented in the accompanying Consolidated Financial Statements:
In June 2014, the Financial Accounting Standards Board (FASB) issued ASU No. 2014-10, “Development Stage Entities (Topic 915): Elimination of Certain Financial Reporting Requirements, Including an Amendment to Variable Interest Entities Guidance in Topic 810, Consolidation,” which amends the consolidation guidance around reporting entities that invest in development stage entities. We adopted the consolidation guidance of this amendment on January 1, 2016 and applied it retrospectively with no material effect on our consolidated results of operations, financial position, or cash flows. This ASU did result in certain of our entities being classified as a variable interest entity (VIE). See Note 8 for discussion of our Variable Interest Entities.
In February 2015, the FASB issued ASU No. 2015-02, “Consolidation (Topic 810): Amendments to the Consolidation Analysis,” which makes changes to both the variable interest model and the voting model. These changes required reevaluation of certain entities for consolidation and required us to revise our documentation regarding the consolidation or deconsolidation of such entities. We adopted this standard on January 1, 2016 with no material effect on our consolidated operations, financial position, or cash flows.
In September 2015, the FASB issued ASU No. 2015-16, “Business Combinations (Topic 805): Simplifying the Accounting for Measurement-Period Adjustments,” to simplify accounting for adjustments made to provisional amounts recognized in a business combination and to eliminate the retrospective accounting for those adjustments. We adopted this standard on January 1, 2016 with no material effect on our consolidated operations, financial position, or cash flows.
Pending. The following new ASUs have been issued but not yet adopted:
In May 2014, the FASB issued ASU No. 2014-09, “Revenue from Contracts with Customers (Topic 606),” in an effort to improve revenue recognition practices across entities and industries. The ASU introduces a single, principle-based revenue recognition model which centers on the core principle of an entity recognizing revenue in a manner that depicts the transfer of goods and services to customers at an amount that reflects the consideration to which the entity expects to be entitled in exchange for those goods and services. Since its release, the FASB has issued multiple amendments clarifying and/or amending ASU No. 2014-09. We have substantially completed a review of contracts with customers in relation to the requirements of ASU No. 2014-09. While we have not identified any material difference in the amount or timing of revenue recognition for the categories we have reviewed to date, our evaluation is not complete and we have not concluded on the overall impacts of adopting this standard. In addition, we are in the process of implementing appropriate changes to our business processes, systems and controls to support the recognition and disclosure requirements under the new standard. ASU No. 2014-09 is effective for us January 1, 2018 and allows for either full retrospective or modified retrospective adoption.
In July 2015, the FASB issued ASU No. 2015-11, “Inventory (Topic 330): Simplifying the Measurement of Inventory,” which simplifies the subsequent measurement of inventory by requiring inventory to be measured at the lower of cost and net realizable value. This ASU is effective for us January 1, 2017. This ASU is not expected to have a material impact on our consolidated results of operations, financial position, or cash flows.
In January 2016, the FASB issued ASU No. 2016-01,“Financial Instruments - Overall (Subtopic 825-10): Recognition and Measurement of Financial Assets and Financial Liabilities,” which amends the classification and measurement of financial instruments. Changes primarily affect the accounting for equity investments, financial liabilities under the fair value option, and the presentation and disclosure requirements for financial instruments. This ASU is effective for us on January 1, 2018. Early adoption is not permitted. We are currently evaluating this ASU and its potential impact on us.
In February 2016, the FASB issued ASU No. 2016-02, “Leases (Topic 842),” to improve the financial reporting around leasing transactions. The new guidance requires companies to begin recording assets and liabilities arising from those leases classified as operating leases under previous guidance. Furthermore, the new guidance will require significant additional disclosures about the amount, timing and uncertainty of cash flows from leases. Topic 842 retains a distinction between finance leases and operating leases. The classification criteria for distinguishing between finance leases and operating leases are substantially similar to the classification criteria for distinguishing between capital leases and operating leases in previous guidance. The result of retaining a distinction between finance leases and operating leases is that under the lessee accounting model in Topic 842, the effect of leases in the statement of comprehensive income and the statement of cash flows is largely unchanged from previous guidance. This ASU is effective for us January 1, 2019. We are currently evaluating this ASU and its potential impact on us.
72
In March 2016, the FASB issued ASU No. 2016-05, “Derivatives and Hedging (Topic 815): Effect of Derivative Contract Novations on Existing Hedge Accounting Relationships,” which clarifies the hedge accounting impact when there is a change in one of the counterparties to the derivative contract (i.e. novation). This ASU is effective for us January 1, 2017. This ASU is not expected to have a material impact on our consolidated results of operations, financial position or cash flow.
In March 2016, the FASB issued ASU No. 2016-06, “Derivatives and Hedging (Topic 815): Contingent Put and Call Options in Debt Instruments,” which simplifies the embedded derivative analysis for debt instruments containing contingent call or put options. This ASU is effective for us January 1, 2017. This ASU is not expected to have a material impact on our consolidated results of operations, financial position or cash flow.
In March 2016, the FASB issued ASU No. 2016-07, “Investments—Equity Method and Joint Ventures (Topic 323): Simplifying the Transition to the Equity Method of Accounting,” which eliminates the requirement to apply the equity method of accounting retrospectively when a reporting entity obtains significant influence over a previously held investment. This ASU is effective for us January 1, 2017. This ASU is not expected to have a material impact on our consolidated results of operations, financial position or cash flows.
In June 2016, the FASB issued ASU No. 2016-13, “Financial Instruments—Credit Losses (Topic 326): Measurement of Credit Losses on Financial Instruments,” to replace the incurred loss impairment methodology with a methodology that reflects expected credit losses and requires the consideration of a broader range of reasonable and supportable information to inform credit loss estimates. This ASU is effective for us on January 1, 2020. We are currently evaluating this ASU and its potential impact on us.
In August 2016, the FASB issued ASU No. 2016-15,“Statement of Cash Flows (Topic 230): Classification of Certain Cash Receipts and Cash Payments,” to provide guidance on specific cash flow issues with the objective of reducing the existing diversity in practice. This ASU is effective for us on January 1, 2018. We are currently evaluating this ASU and its potential impact on us.
In October 2016, the FASB issued ASU No. 2016-17,“Consolidation (Topic 810): Interests Held through Related Parties That Are under Common Control,” to amend the consolidation guidance on how a reporting entity that is the single decision maker of a VIE should treat indirect interests in the entity held through related parties that are under common control with the reporting entity when determining whether it is the primary beneficiary of that VIE. This ASU is effective for us on January 1, 2017. This ASU is not expected to have a material impact on our consolidated results of operations, financial position or cash flows.
In November 2016, the FASB issued ASU No. 2016-18, “Statement of Cash Flows (Topic 230): Restricted Cash,” to address the diversity in the classification and presentation of changes in restricted cash and restricted cash equivalents on the statement of cash flows. The update requires that restricted cash and restricted cash equivalents be included with cash and cash equivalents when reconciling the beginning-of-period and end-of-period total amounts shown on the statement of cash flows. This ASU is effective for us on January 1, 2018. We are currently evaluating this ASU and its potential impact on us.
In January 2017, the FASB issued ASU No. 2017-01, “Business Combinations (Topic 805): Clarifying the Definition of a Business,” which revises the definition of a business. This ASU is effective for us on January 1, 2018. We are currently evaluating this ASU and its potential impact on us.
In January 2017, the FASB issued ASU No. 2017-04, “Intangibles—Goodwill and Other (Topic 350): Simplifying the Test for Goodwill Impairment,” to simplify the subsequent measurement of goodwill. The guidance eliminates Step 2 from the goodwill impairment test which required computing an implied fair value to measure the amount of the goodwill impairment. A goodwill impairment will now be the amount by which a reporting unit's carrying value exceeds its fair value, not to exceed the carrying amount of goodwill. This ASU is effective for us on January 1, 2020. Early adoption is permitted for interim or annual goodwill impairment tests performed on testing dates after January 1, 2017. We are currently evaluating this ASU and its potential impact on us.
The following ASUs were adopted in 2015 and the effect of such adoptions, if any, are presented in the accompanying Consolidated Financial Statements:
In April 2015, the FASB issued ASU No. 2015-03, “Interest-Imputation of Interest (Subtopic 835-30): Simplifying the Presentation of Debt Issuance Costs,” which requires that debt issuance costs be presented in the balance sheet as a direct deduction from the carrying amount of the related debt liability, rather than as a deferred charge asset. We adopted the provisions of this ASU as of December 31, 2015. The adoption of this ASU resulted in the presentation of $21 million of debt issuance costs as a reduction of Long-term Debt on our December 31, 2015 Consolidated Balance Sheet.
73
In April 2015, the FASB issued ASU No. 2015-06, “Earnings Per Share (Topic 260): Effects on Historical Earnings per Unit of Master Limited Partnership Dropdown Transactions,” which applies to master limited partnerships that receive net assets through a dropdown transaction. ASU 2015-06 specifies that for purposes of calculating historical earnings per unit under the two-class method, the earnings (losses) of a transferred business before the date of a dropdown transaction should be allocated entirely to the general partner. Qualitative disclosures about how the rights to the earnings (losses) differ before and after the dropdown transaction occurs for purposes of computing earnings per unit under the two-class method also are required. We adopted the provisions of this ASU as of December 31, 2015. The adoption of this ASU had no material effect for the years presented on our consolidated operations, financial position, or cash flows.
There were no significant accounting pronouncements adopted in 2014 that had a material impact on our consolidated results of operations, financial position or cash flows.
2. Acquisitions and Dispositions
U.S. Assets Dropdown. During 2013, we completed the closing of substantially all of the U.S. Assets Dropdown, excluding a 25.05% ownership interest in SESH and a 1% ownership interest in Steckman Ridge. This was the first of three planned transactions.
In November 2014, we completed the second of the three planned transactions related to the U.S. Assets Dropdown. This transaction consisted of acquiring an additional 24.95% ownership interest in SESH and the remaining 1% ownership interest in Steckman Ridge from Spectra Energy. Total consideration was approximately 4.3 million newly issued common units. Also in connection with this transaction, we issued approximately 86,000 general partner units to Spectra Energy in exchange for the same amount of common units in order to maintain Spectra Energy's 2% general partner interest.
In November 2015, we acquired the remaining 0.1% ownership interest in SESH from Spectra Energy. Total consideration was 17,114 newly issued common units. This was the last of three planned transactions related to the U.S. Assets Dropdown. Also in connection with this transaction, we issued 342 general partner units to Spectra Energy in exchange for the same amount of common units in order to maintain Spectra Energy's 2% general partner interest.
Disposition. In October 2015, Spectra Energy acquired our 33.3% ownership interests in DCP Sand Hills Pipeline, LLC (Sand Hills) and DCP Southern Hills Pipeline, LLC (Southern Hills). In consideration for this transaction, we retired 21,560,000 of our common units and 440,000 of our general partner units held by Spectra Energy, which will result in the reduction of distributions payable to Spectra Energy for the related units retired. Additional consideration consisted of a reduction in the aggregate quarterly distributions, if any, to Spectra Energy, as holder of incentive distribution rights, by $4 million per quarter for a period of 12 consecutive quarters commencing with the quarter ending on December 31, 2015 and ending with the quarter ending on September 30, 2018. The total reduction of distributions to Spectra Energy was $16 million for the year ended December 31, 2016. This transfer of assets between entities under common control is included as a non-cash transaction in the Consolidated Statements of Cash Flows.
3. Transactions with Affiliates
In the normal course of business, we provide natural gas transmission, storage and other services to Spectra Energy and its affiliates.
In addition, pursuant to an agreement with Spectra Energy, Spectra Energy and its affiliates perform centralized corporate functions for us, including legal, accounting, compliance, treasury and other areas. We reimburse Spectra Energy for the expenses to provide these services as well as other expenses it incurs on our behalf, such as salaries of personnel performing services for our benefit and the cost of employee benefits and general and administrative expenses associated with such personnel, capital expenditures, maintenance and repair costs, taxes and direct expenses, including operating expenses and certain allocated operating expenses associated with the ownership and operation of the contributed assets. Spectra Energy and its affiliates charge such expenses based on the cost of actual services provided or using various allocation methodologies based on our percentage of assets, employees, earnings or other measures, as compared to Spectra Energy’s other affiliates.
74
Transactions with affiliates are summarized in the tables below:
Consolidated Statements of Operations
2016 | 2015 | 2014 | |||||||||
(in millions) | |||||||||||
Operating revenues | $ | 34 | $ | 53 | $ | 88 | |||||
Operating, maintenance and other expenses | 310 | 457 | 317 | ||||||||
We are party to an agreement with DCP Midstream, LLC (DCP Midstream), an equity investment of Spectra Energy, in which DCP Midstream processes certain of our customers' gas to meet quality specifications in order to be transported on our system. DCP Midstream processes the gas and sells the natural gas liquids that are extracted from the gas. A portion of the proceeds from those sales are retained by DCP Midstream and the balance is remitted to us. We recognized revenues of $31 million, $46 million and $79 million in 2016, 2015 and 2014, respectively, related to those services, classified as Storage of Natural Gas and Other in our Consolidated Statements of Operations.
We recorded natural gas transmission revenues from DCP Midstream and its affiliates totaling $1 million in 2016, $4 million in 2015 and $7 million in 2014, classified as Transportation of Natural Gas in our Consolidated Statements of Operations.
In addition to the above, we recorded other revenues from DCP Midstream and its affiliates totaling $2 million in 2016, $3 million in 2015 and $2 million in 2014, classified as Storage of Natural Gas and Other in our Consolidated Statements of Operations.
Consolidated Balance Sheets
December 31, | |||||||
2016 | 2015 | ||||||
(in millions) | |||||||
Receivables | $ | 22 | $ | 17 | |||
Current assets — other | 2 | 3 | |||||
Accounts payable | 27 | 45 | |||||
Current liabilities — other | 10 | 152 | |||||
Transactions billed from affiliates, included within Property, Plant and Equipment in the Consolidated Balance Sheets, were $46 million in 2016 and $51 million in 2015.
Gulfstream. During the third quarter of 2015, Gulfstream Natural Gas System, LLC (Gulfstream) issued unsecured debt of $800 million to fund the repayment of its current debt. Gulfstream distributed $396 million, our proportionate share of proceeds, to us, classified as Cash Flows from Investing Activities - Distributions from Equity Investments, of which we contributed $248 million back to Gulfstream in the fourth quarter of 2015 and the remaining $148 million, classified as Cash Flows from Investing Activities - Distributions to Equity Investment, in the second quarter of 2016.
SESH. In 2014, SESH issued unsecured debt of $400 million to fund the repayment of its current debt. SESH distributed $99 million of proceeds to us, classified as Cash Flows from Investing Activities - Distributions from Equity Investments, of which we contributed $94 million back to SESH during 2014, classified as Cash Flows from Investing Activities - Investments in and Loans to Unconsolidated Affiliates, as the current debt matured.
See also Notes 1, 7 and 14 for discussion of specific related party transactions.
75
4. Business Segments
We manage our business in two reportable segments: U.S. Transmission and Liquids. The remainder of our business operations is presented as “Other,” and consists of certain corporate costs.
Our chief operating decision maker regularly reviews financial information about both segments in deciding how to allocate resources and evaluate performance. There is no aggregation of segments within our reportable business segments.
The U.S. Transmission segment provides interstate transmission and storage of natural gas. Substantially all of our operations are subject to the Federal Energy Regulatory Commission (FERC) and the Department of Transportation’s (DOT’s) rules and regulations. Our investments in Gulfstream, SESH and Steckman Ridge are included in U.S. Transmission.
The Liquids segment provides transportation of crude oil. The Express-Platte pipeline system (Express-Platte) is a crude oil pipeline system that connects Canadian and U.S. producers to refineries in the U.S. Rocky Mountain and Midwest regions. These operations are primarily subject to the rules and regulations of the FERC and the National Energy Board (NEB). We held direct one-third ownership interests in Sand Hills and Southern Hills until October 30, 2015.
Our reportable segments offer different products and services and are managed separately as business units. Management evaluates segment performance based on earnings before interest, taxes, and depreciation and amortization (EBITDA). Cash, cash equivalents and investments are managed centrally, so the gains and losses on foreign currency remeasurement, and interest and dividend income, are excluded from the segments’ EBITDA. Our segment EBITDA may not be comparable to similarly titled measures of other companies because other companies may not calculate EBITDA in the same manner.
76
Business Segment Data
Total Revenues | Segment EBITDA/ Consolidated Earnings Before Income Taxes | Depreciation and Amortization | Capital and Investment Expenditures | Assets | |||||||||||||||
(in millions) | |||||||||||||||||||
2016 | |||||||||||||||||||
U.S. Transmission | $ | 2,167 | $ | 1,639 | $ | 285 | $ | 2,514 | $ | 19,747 | |||||||||
Liquids | 366 | 237 | 29 | 71 | 1,841 | ||||||||||||||
Total | 2,533 | 1,876 | 314 | 2,585 | 21,588 | ||||||||||||||
Other | — | (82 | ) | — | — | 18 | |||||||||||||
Depreciation and amortization | — | 314 | — | — | — | ||||||||||||||
Interest expense | — | 224 | — | — | — | ||||||||||||||
Interest income and other | — | 1 | — | — | — | ||||||||||||||
Total consolidated | $ | 2,533 | $ | 1,257 | $ | 314 | $ | 2,585 | $ | 21,606 | |||||||||
2015 | |||||||||||||||||||
U.S. Transmission | $ | 2,087 | $ | 1,599 | $ | 264 | $ | 1,952 | $ | 17,050 | |||||||||
Liquids | 368 | 283 | 31 | 55 | 1,778 | ||||||||||||||
Total | 2,455 | 1,882 | 295 | 2,007 | 18,828 | ||||||||||||||
Other | — | (66 | ) | — | — | 23 | |||||||||||||
Depreciation and amortization | — | 295 | — | — | — | ||||||||||||||
Interest expense | — | 239 | — | — | — | ||||||||||||||
Interest income and other | — | (5 | ) | — | — | — | |||||||||||||
Total consolidated | $ | 2,455 | $ | 1,277 | $ | 295 | $ | 2,007 | $ | 18,851 | |||||||||
2014 | |||||||||||||||||||
U.S. Transmission | $ | 1,939 | $ | 1,415 | $ | 256 | $ | 1,160 | $ | 15,174 | |||||||||
Liquids | 330 | 240 | 32 | 81 | 2,567 | ||||||||||||||
Total | 2,269 | 1,655 | 288 | 1,241 | 17,741 | ||||||||||||||
Other | — | (64 | ) | — | — | 37 | |||||||||||||
Depreciation and amortization | — | 288 | — | — | — | ||||||||||||||
Interest expense | — | 238 | — | — | — | ||||||||||||||
Interest income and other | — | (3 | ) | — | — | — | |||||||||||||
Total consolidated | $ | 2,269 | $ | 1,062 | $ | 288 | $ | 1,241 | $ | 17,778 | |||||||||
Geographic Data
U.S. | Canada | Consolidated | ||||||||||
(in millions) | ||||||||||||
2016 | ||||||||||||
Consolidated revenues | $ | 2,456 | $ | 77 | $ | 2,533 | ||||||
Consolidated long-lived assets | 19,580 | 215 | 19,795 | |||||||||
2015 | ||||||||||||
Consolidated revenues | $ | 2,383 | $ | 72 | $ | 2,455 | ||||||
Consolidated long-lived assets | 18,104 | 203 | 18,307 | |||||||||
2014 | ||||||||||||
Consolidated revenues | $ | 2,205 | $ | 64 | $ | 2,269 | ||||||
Consolidated long-lived assets | 16,987 | 236 | 17,223 | |||||||||
77
5. Regulatory Matters
We record assets and liabilities that result from the regulated ratemaking process that would not be recorded under GAAP for non-regulated entities. See Note 1 for further discussion.
The following items are reflected in the consolidated balance sheets. All regulatory assets and liabilities are excluded from rate base unless otherwise noted below.
Recovery/Refund Period Ends | December 31, | ||||||||
2016 | 2015 | ||||||||
(in millions) | |||||||||
Regulatory Assets (a) | |||||||||
Regulatory asset related to income taxes (b) | Various | $ | 297 | $ | 221 | ||||
Vacation accrual | Various | 19 | 19 | ||||||
Deferred debt expense/premium | Various | 18 | 23 | ||||||
Asset retirement obligations | Various | 17 | 2 | ||||||
Under-recovery of fuel costs (c,d) | — | 6 | 41 | ||||||
Project development costs | Through 2036 | 9 | 9 | ||||||
Other | — | 10 | 11 | ||||||
Total Regulatory Assets | $ | 376 | $ | 326 | |||||
Regulatory Liabilities | |||||||||
Over-recovery of fuel costs (d,e) | — | $ | 38 | $ | 1 | ||||
Pipeline rate credit (f) | Life of associated liability | 23 | 24 | ||||||
Total Regulatory Liabilities | $ | 61 | $ | 25 | |||||
________
(a)Included in Regulatory Assets and Deferred Debits, unless otherwise noted.
(b) Relates to tax gross-up of the AFUDC equity portion. All amounts are expected to be included in future rate filings.
(c) Included in Fuel Tracker.
(d) | Includes amounts settled in cash annually through transportation rates in accordance with FERC gas tariffs. |
(e) Included in Other Current Liabilities.
(f) Included in Deferred Credits and Other Liabilities.
6. Net Income Per Limited Partner Unit and Cash Distributions
The following table presents our net income per limited partner unit calculations:
2016 | 2015 | 2014 | |||||||||
(in millions, except per-unit amounts) | |||||||||||
Net income—controlling interests | $ | 1,161 | $ | 1,225 | $ | 1,004 | |||||
Less: | |||||||||||
General partner’s interest in net income—2% | 23 | 24 | 20 | ||||||||
General partner’s interest in net income attributable to incentive distribution rights | 288 | 225 | 167 | ||||||||
Limited partners’ interest in net income | $ | 850 | $ | 976 | $ | 817 | |||||
Weighted average limited partner units outstanding—basic and diluted | 299 | 296 | 288 | ||||||||
Net income per limited partner unit—basic and diluted | $ | 2.84 | $ | 3.30 | $ | 2.84 | |||||
Our partnership agreement requires that, within 60 days after the end of each quarter, we distribute all of our Available Cash, as defined, to unitholders of record on the applicable record date.
Available Cash. Available Cash, for any quarter, consists of all cash and cash equivalents on hand at the end of that quarter:
• | less the amount of cash reserves established by the general partner to: |
78
• | provide for the proper conduct of business, |
• | comply with applicable law, any debt instrument or other agreement, or |
• | provide funds for minimum quarterly distributions to the unitholders and to the general partner for any one or more of the next four quarters, |
• | plus, if the general partner so determines, all or a portion of cash and cash equivalents on hand on the date of determination of Available Cash for the quarter. |
Incentive Distribution Rights. The general partner holds incentive distribution rights beyond the first target distribution in accordance with the partnership agreement as follows:
Total Quarterly Distribution | Marginal Percentage Interest in Distributions | ||||||
Target Per-Unit Amount | Common Unitholders | General Partner | |||||
Minimum Quarterly Distribution | $0.30 | 98 | % | 2 | % | ||
First Target Distribution | up to $0.345 | 98 | % | 2 | % | ||
Second Target Distribution | above $0.345 up to $0.375 | 85 | % | 15 | % | ||
Third Target Distribution | above $0.375 up to $0.45 | 75 | % | 25 | % | ||
Thereafter | above $0.45 | 50 | % | 50 | % | ||
To the extent these incentive distributions are made to the general partner, there will be more Available Cash proportionately allocated to the general partner than to holders of common units. A cash distribution of $0.68875 per limited partner unit was declared on February 7, 2017 and is payable on February 28, 2017 to unitholders of record at the close of business on February 17, 2017.
As a result of the sale of our interests in Sand Hills and Southern Hills to Spectra Energy, there is a reduction in the aggregate quarterly distributions, if any, to Spectra Energy, (as holder of incentive distribution rights), by $4 million per quarter for a period of 12 consecutive quarters ending on September 30, 2018. See Note 2 for more information.
7. Investments in and Loans to Unconsolidated Affiliates
Investments in affiliates for which we are not the primary beneficiary, but over which we have significant influence, are accounted for using the equity method. As of December 31, 2016 and 2015, the carrying amounts of investments in affiliates approximated the amounts of underlying equity in net assets. We received distributions from our equity investments of $160 million in 2016, $610 million in 2015 and $294 million in 2014. Cumulative undistributed earnings from equity investments totaled $15 million in 2016 and $5 million in 2015. There were no cumulative undistributed earnings from equity investments in 2014.
U.S. Transmission. Investments are comprised of a 50% interest in Gulfstream, a 50% interest in SESH and a 50% interest in Steckman Ridge.
We have a loan outstanding to Steckman Ridge in connection with the construction of its storage facilities. The loan carries market-based interest rates and is due the earlier of October 1, 2023 or coincident with the closing of any long-term financings by Steckman Ridge. The loan receivable from Steckman Ridge, including accrued interest, totaled $71 million at both December 31, 2016 and 2015.
Liquids. Investments were comprised of 33.3% interests in Sand Hills and Southern Hills. The Sand Hills and Southern Hills pipelines were placed in service in the second quarter of 2013 and acquired by Spectra Energy in the fourth quarter of 2015.
79
Earnings from Equity Investments
2016 | 2015 | 2014 | |||||||||
(in millions) | |||||||||||
U.S. Transmission | $ | 127 | $ | 112 | $ | 90 | |||||
Liquids | — | 55 | 43 | ||||||||
Total | $ | 127 | $ | 167 | $ | 133 | |||||
Summarized Combined Financial Information of Unconsolidated Affiliates (Presented at 100%)
Statements of Operations
2016 | 2015 | 2014 | |||||||||
(in millions) | |||||||||||
Operating revenues | $ | 430 | $ | 702 | $ | 648 | |||||
Operating expenses | 118 | 229 | 227 | ||||||||
Operating income | 312 | 473 | 421 | ||||||||
Net income | 253 | 380 | 328 | ||||||||
Balance Sheets
December 31, | |||||||
2016 | 2015 | ||||||
(in millions) | |||||||
Current assets | $ | 154 | $ | 434 | |||
Non-current assets | 3,665 | 3,038 | |||||
Current liabilities | 112 | 345 | |||||
Non-current liabilities | 1,678 | 1,677 | |||||
Equity | $ | 2,029 | $ | 1,450 | |||
8. Variable Interest Entities
Sabal Trail. On April 1, 2016, NextEra Energy, Inc. (NextEra) purchased a 9.5% interest in Sabal Trail Transmission, LLC (Sabal Trail) from us. Consideration for this transaction consisted of approximately $110 million cash, $102 million of which is classified as Cash Flows from Financing Activities — Contributions from Noncontrolling Interests. See Note 9 for additional information related to this transaction. As of December 31, 2016, we owned a 50% interest in Sabal Trail, a joint venture that is constructing a natural gas pipeline to transport natural gas to Florida. Sabal Trail is a variable interest entity (VIE) due to insufficient equity at risk to finance its activities. We determined that we are the primary beneficiary because we direct the activities of Sabal Trail that most significantly impact its economic performance and we consolidate Sabal Trail in our financial statements. The current estimate of the total remaining construction cost is approximately $1.2 billion.
80
The following summarizes assets and liabilities for Sabal Trail as of December 31, 2016 and December 31, 2015, respectively:
Consolidated Balance Sheets | December 31, | ||||||
2016 | 2015 | ||||||
(in millions) | |||||||
Assets | |||||||
Current assets | $ | 165 | $ | 118 | |||
Net property, plant and equipment | 1,942 | 773 | |||||
Regulatory assets and deferred debits | 79 | 25 | |||||
Total Assets | $ | 2,186 | $ | 916 | |||
Liabilities and Equity | |||||||
Current liabilities | $ | 239 | $ | 84 | |||
Equity | 1,947 | 832 | |||||
Total Liabilities and Equity | $ | 2,186 | $ | 916 | |||
Nexus. We own a 50% interest in Nexus Gas Transmission, LLC (Nexus), a joint venture that is constructing a natural gas pipeline from Ohio to Michigan and continuing on to Ontario, Canada. Nexus is a VIE due to insufficient equity at risk to finance its activities. We determined that we are not the primary beneficiary because the power to direct the activities of Nexus that most significantly impact its economic performance is shared. We account for Nexus under the equity method. Our maximum exposure to loss is $1.0 billion. We have an investment in Nexus of $356 million and $90 million as of December 31, 2016 and December 31, 2015, respectively, classified as Investments in and Loans to Unconsolidated Affiliates on our Consolidated Balance Sheets.
On December 29, 2016, we issued performance guarantees to a third party and an affiliate on behalf of Nexus. See Note 17 for further discussion of the guarantee arrangement.
9. Intangible Asset
During the first quarter of 2016 we entered into a project coordination agreement (PCA) with NextEra, Duke Energy Corporation and Williams Partners L.P. In accordance with the agreement, payments will be made, based on our proportional ownership interest in the Sabal Trail project, as certain milestones of the project are met. During the first quarter of 2016, the first milestone was achieved and paid, consisting of $48 million.
On April 1, 2016, NextEra purchased an additional 9.5% interest in Sabal Trail, reducing our ownership interest in Sabal Trail to 50%. Upon purchase of the additional ownership interest, NextEra reimbursed us $8 million for NextEra’s proportional share of the first milestone payment, which reduced our total milestone payments to $40 million as of June 30, 2016.
During the third quarter of 2016, the second milestone was achieved and paid, consisting of an additional payment of $40 million, for total milestone payments of $80 million as of December 31, 2016. Both payments are classified as Cash Flows from Investing Activities — Purchase of Intangible, Net. This PCA is an intangible asset and is classified as Investments and Other Assets — Other on our Condensed Consolidated Balance Sheet. The intangible asset will be amortized over a period of 25 years beginning at the time of in-service of Sabal Trail, which is expected to occur during the first half of 2017.
10. Marketable Securities and Restricted Funds
We routinely invest excess cash and various restricted balances in securities such as commercial paper, corporate debt securities, and other money market securities in the United States, as well as equity securities in Canada. We do not purchase marketable securities for speculative purposes, therefore, we do not have any securities classified as trading securities. While we do not routinely sell marketable securities prior to their scheduled maturity dates, some of our investments may be held and restricted for the purposes of funding future capital expenditures and NEB regulatory requirements, so these investments are classified as AFS marketable securities as they may occasionally be sold prior to their scheduled maturity dates due to the unexpected timing of cash needs. Initial investments in securities are classified as purchases of the respective type of securities (AFS marketable securities or HTM marketable securities). Maturities of securities are classified within proceeds from sales and maturities of securities in the Consolidated Statements of Cash Flows.
81
AFS Securities. We had $10 million and $11 million of AFS securities classified as Investments and Other Assets — Other on Consolidated Balance Sheets as of December 31, 2016 and December 31, 2015, respectively. As December 31, 2016, these investments include $9 million of restricted funds related to certain construction projects and $1 million are restricted funds held and collected from customers for Canadian pipeline abandonment in accordance with the NEB's regulatory requirements. The balance as of December 31, 2015 is all related to certain construction projects.
At December 31, 2016, the weighted-average contractual maturity of outstanding AFS securities was less than one year.
There were no material gross unrecognized holding gains or losses associated with investments in AFS securities at December 31, 2016 or December 31, 2015.
HTM Securities. All of our HTM securities are restricted funds. We had $3 million of money market securities classified as Current Assets — Other on the Consolidated Balance Sheets as of December 31, 2016 and December 31, 2015. These securities are restricted pursuant to certain Express-Platte debt agreements.
At December 31, 2016, the weighted-average contractual maturity of outstanding HTM securities was less than one year.
There were no material gross unrecognized holding gains or losses associated with investments in HTM securities at December 31, 2016 or December 31, 2015.
Interest income. We had interest income of $2 million in 2016 and $1 million in 2015, which is included in Other Income and Expenses, Net on the Consolidated Statements of Operations. We had no interest income in 2014.
Other Restricted Funds. In addition to the AFS and HTM securities that were restricted funds as described above, we had other restricted funds totaling $5 million and $14 million classified as Investments and Other Assets — Other on the Consolidated Balance Sheets at December 31, 2016 and December 31, 2015, respectively. These restricted funds are related to certain construction projects.
Changes in restricted balances are presented within Cash Flows from Investing Activities on our Consolidated Statements of Cash Flows.
11. Property, Plant and Equipment
Estimated Useful Life | December 31, | |||||||||
2016 | 2015 | |||||||||
(years) | (in millions) | |||||||||
Plant | ||||||||||
Natural gas transmission | 2-100 | $ | 13,702 | $ | 12,424 | |||||
Natural gas storage | 17-122 | 1,638 | 1,617 | |||||||
Gathering and processing facilities | 10-40 | 3 | 3 | |||||||
Crude oil transportation and storage | 5-75 | 1,321 | 1,206 | |||||||
Land rights and rights of way | 10-122 | 510 | 474 | |||||||
Other buildings and improvements | 5-75 | 37 | 37 | |||||||
Equipment | 3-75 | 81 | 80 | |||||||
Vehicles | 3-15 | 12 | 12 | |||||||
Land | — | 75 | 71 | |||||||
Construction in process | — | 2,494 | 1,484 | |||||||
Software | 5-15 | 11 | 12 | |||||||
Other | 15-82 | 74 | 71 | |||||||
Total property, plant and equipment | 19,958 | 17,491 | ||||||||
Total accumulated depreciation | (3,741 | ) | (3,533 | ) | ||||||
Total accumulated amortization | (125 | ) | (121 | ) | ||||||
Total net property, plant and equipment | $ | 16,092 | $ | 13,837 | ||||||
We had no capital leases at December 31, 2016 or December 31, 2015.
82
Approximately 86% of our property, plant and equipment is regulated with estimated useful lives based on rates approved by the FERC. Composite weighted-average depreciation rates were 2% for 2016, 2015 and 2014.
Amortization expense of intangible assets totaled $9 million in 2016 and $10 million in both 2015 and 2014. Estimated amortization expense for the next five years follows:
Estimated Amortization Expense | |||
(in millions) | |||
2017 | $ | 11 | |
2018 | 11 | ||
2019 | 11 | ||
2020 | 10 | ||
2021 | 8 | ||
12. Asset Retirement Obligations
Our AROs relate mostly to the retirement of offshore pipelines and certain onshore assets, obligations related to right-of-way agreements and contractual leases for land use. However, we have determined that a significant portion of our assets have an indeterminate life, and as such, the fair values of those associated retirement obligations are not reasonably estimable. These assets include onshore and some offshore pipelines, and certain storage facilities, whose retirement dates will depend mostly on the various natural gas supply sources that connect to our systems and the ongoing demand for natural gas usage in the markets we serve. We expect these supply sources and market demands to continue for the foreseeable future, therefore we are unable to estimate retirement dates that would result in asset retirement obligations.
AROs are adjusted each period for liabilities incurred or settled during the period, accretion expense and any revisions made to the estimated cash flows. 2015 revisions mainly include a reduction in the remaining estimated life of certain Texas Eastern Transmission, LP (Texas Eastern) offshore facilities, and resulted in a net increase to ARO liabilities of $27 million.
Reconciliation of Changes in Asset Retirement Obligation Liabilities
2016 | 2015 | ||||||
(in millions) | |||||||
Balance at Beginning of year | $ | 48 | $ | 20 | |||
Accretion expense | 2 | 1 | |||||
Revisions in estimated cash flows | (4 | ) | 27 | ||||
Balance at the end of the year (a) | $ | 46 | $ | 48 | |||
_________
(a) | Amounts included in Deferred Credits and Other Liabilities in the Consolidated Balance Sheets. |
83
13. Debt and Credit Facility
Summary of Debt and Related Terms
December 31, | |||||||
2016 | 2015 | ||||||
(in millions) | |||||||
Spectra Energy Partners, LP 2.95% senior unsecured notes due June 2016 | $ | — | $ | 250 | |||
Spectra Energy Partners, LP 2.95% senior unsecured notes due September 2018 | 500 | 500 | |||||
Spectra Energy Partners, LP variable-rate senior unsecured term loan due November 2018 | 400 | 400 | |||||
Spectra Energy Partners, LP 4.60% senior unsecured notes due June 2021 | 250 | 250 | |||||
Spectra Energy Partners, LP 4.75% senior unsecured notes due March 2024 | 1,000 | 1,000 | |||||
Spectra Energy Partners, LP 3.50% senior unsecured notes due March 2025 | 500 | 500 | |||||
Spectra Energy Partners, LP 3.375% senior unsecured notes due October 2026 | 600 | — | |||||
Spectra Energy Partners, LP 5.95% senior unsecured notes due September 2043 | 400 | 400 | |||||
Spectra Energy Partners, LP 4.50% senior unsecured notes due March 2045 | 700 | 500 | |||||
Texas Eastern 6.00% senior unsecured notes due September 2017 | 400 | 400 | |||||
Texas Eastern 4.125% senior unsecured notes due December 2020 | 300 | 300 | |||||
Texas Eastern 2.80% senior unsecured notes due October 2022 | 500 | 500 | |||||
Texas Eastern 7.00% senior unsecured notes due July 2032 | 450 | 450 | |||||
Algonquin Gas Transmission 3.51% senior unsecured notes due July 2024 | 350 | 350 | |||||
East Tennessee Natural Gas, LLC 3.10% senior unsecured notes due December 2024 | 200 | 200 | |||||
Express-Platte 6.09% senior secured notes due January 2020 | 110 | 110 | |||||
Express-Platte 7.39% subordinated secured notes due 2017 to 2019 | 12 | 42 | |||||
Long-term debt principal (including current maturities) | 6,672 | 6,152 | |||||
Change in fair value of debt hedged | 4 | 9 | |||||
Unamortized debt discount, net | (11 | ) | (12 | ) | |||
Unamortized debt expenses | (26 | ) | (21 | ) | |||
Commercial paper (a) | 574 | 476 | |||||
Total debt | 7,213 | 6,604 | |||||
Current maturities of long-term debt | (416 | ) | (283 | ) | |||
Commercial paper (b) | (574 | ) | (476 | ) | |||
Total long-term debt | $ | 6,223 | $ | 5,845 | |||
_________
(a)The weighted-average days to maturity were 17 days as of December 31, 2016 and 13 days as of December 31, 2015.
(b) | Weighted-average rates outstanding on commercial paper were 1.12% as of December 31, 2016 and 0.96% as of December 31, 2015. |
Secured Debt. Secured debt, totaling $122 million as of December 31, 2016, includes project financings for Express-Platte. The notes are secured by the assignment of the Express-Platte transportation receivables and by the Express Canada assets.
Floating Rate Debt. Debt included approximately $974 million of floating-rate debt as of December 31, 2016 and $876 million as of December 31, 2015. The weighted average interest rate of borrowings outstanding that contained floating rates was 1.44% at December 31, 2016 and 1.22% at December 31, 2015.
84
Annual Maturities
December 31, 2016 | |||
(in millions) | |||
2017 | $ | 412 | |
2018 | 900 | ||
2019 | — | ||
2020 | 410 | ||
2021 | 250 | ||
Thereafter | 4,700 | ||
Total long-term debt, including current maturities (a) | $ | 6,672 | |
_________
(a)Excludes commercial paper of $574 million.
We have the ability under certain debt facilities to repay the obligations prior to scheduled maturities. Therefore, the actual timing of future cash repayments could be materially different than presented above.
Credit Facility
Expiration Date | Total Credit Facility Capacity | Commercial Paper Outstanding at December 31, 2016 | Available Credit Facility Capacity | ||||||||||
(in millions) | |||||||||||||
Spectra Energy Partners, LP | 2021 | $ | 2,500 | $ | 574 | $ | 1,926 | ||||||
On April 29, 2016, we amended our credit agreement. The total capacity was increased to $2.5 billion and the expiration date was extended to April 2021.
The issuances of commercial paper, letters of credit and revolving borrowings reduce the amount available under the credit facility. As of December 31, 2016, there were no letters of credit issued or revolving borrowings outstanding under the credit facility.
Our credit agreements contain various covenants, including the maintenance of a consolidated leverage ratio, as defined in the agreements. Failure to meet those covenants beyond applicable grace periods could result in accelerated due dates and/or termination of the agreements. As of December 31, 2016, we were in compliance with those covenants. In addition, our credit agreements allow for acceleration of payments or termination of the agreements due to nonpayment, or in some cases, due to the acceleration of our other significant indebtedness or other significant indebtedness of some of our subsidiaries. Our credit agreements do not contain provisions that trigger an acceleration of indebtedness based solely on the occurrence of a material adverse change in our financial condition or results of operations.
As noted above, the terms of our credit agreements require us to maintain a ratio of total Consolidated Indebtedness-to-Consolidated EBITDA, as defined in the agreements, of 5.0 to 1 or less. As of December 31, 2016, this ratio was 3.8 to 1.
85
14. Fair Value Measurements
The following presents, for each of the fair value hierarchy levels, assets that are measured at fair value on a recurring basis as of December 31, 2016 and December 31, 2015.
Consolidated Balance Sheet Caption | December 31, 2016 | |||||||||||||||
Description | Total | Level 1 | Level 2 | Level 3 | ||||||||||||
(in millions) | ||||||||||||||||
Corporate debt securities | Cash and cash equivalents | $ | 145 | $ | — | $ | 145 | $ | — | |||||||
Corporate debt securities | Investments and other assets — other | 9 | — | 9 | — | |||||||||||
Canadian equity securities | Investments and other assets — other | 1 | 1 | — | — | |||||||||||
Interest rate swaps | Investments and other assets — other | 9 | — | 9 | — | |||||||||||
Total Assets | $ | 164 | $ | 1 | $ | 163 | $ | — | ||||||||
Consolidated Balance Sheet Caption | December 31, 2015 | |||||||||||||||
Description | Total | Level 1 | Level 2 | Level 3 | ||||||||||||
(in millions) | ||||||||||||||||
Corporate debt securities | Cash and cash equivalents | $ | 112 | $ | — | $ | 112 | $ | — | |||||||
Corporate debt securities | Investments and other assets — other | 11 | — | 11 | — | |||||||||||
Interest rate swaps | Investments and other assets — other | 14 | — | 14 | — | |||||||||||
Total Assets | $ | 137 | $ | — | $ | 137 | $ | — | ||||||||
Level 1
Level 1 valuations represent quoted unadjusted prices for identical instruments in active markets.
Level 2 Valuation Techniques
Fair values of our financial instruments that are actively traded in the secondary market, including our long-term debt, are determined based on market-based prices. These valuations may include inputs such as quoted market prices of the exact or similar instruments, broker or dealer quotations, or alternative pricing sources that may include models or matrix pricing tools, with reasonable levels of price transparency.
For interest rate swaps, we utilize data obtained from a third-party source for the determination of fair value. Both the future cash flows for the fixed-leg and floating-leg of our swaps are discounted to present value.
Level 3 Valuation Techniques
Level 3 valuation techniques include the use of pricing models, discounted cash flow methodologies or similar techniques where at least one significant model assumption or input is unobservable. Level 3 financial instruments also include those for which the determination of fair value requires significant management judgment or estimation.
Financial Instruments. The fair values of financial instruments that are recorded and carried at book value are summarized in the following table. Judgment is required in interpreting market data to develop the estimates of fair value. These estimates are not necessarily indicative of the amounts we could have realized in current markets.
December 31, 2016 | December 31, 2015 | ||||||||||||||
Consolidated Balance Sheet Caption | Book Value | Approximate Fair Value | Book Value | Approximate Fair Value | |||||||||||
(in millions) | |||||||||||||||
Note receivable, noncurrent (a) | $ | 71 | $ | 71 | $ | 71 | $ | 71 | |||||||
Long-term debt, including current maturities (b) | 6,672 | 6,855 | 6,152 | 5,906 | |||||||||||
________
(a)Included within Investments in and Loans to Unconsolidated Affiliates.
(b)Excludes unamortized items and fair value hedge carrying value adjustments.
86
The fair value of long-term debt is determined based on market-based prices as described in the Level 2 valuation technique described above and are classified as Level 2.
The fair values of cash and cash equivalents, restricted cash, short-term investments, accounts receivable, note receivable-noncurrent, accounts payable, commercial paper and short-term money market securities are not materially different from their carrying amounts because of the short-term nature of these instruments or because the stated rates approximate market rates.
During the 2016 and 2015 periods, there were no material adjustments to assets and liabilities measured at fair value on a nonrecurring basis.
15. Risk Management and Hedging Activities
Interest Rate Swaps. Changes in interest rates expose us to risk as a result of our issuance of variable and fixed-rate debt and commercial paper. We manage our interest rate exposure by limiting our variable-rate exposures to percentages of total debt and by monitoring the effects of market changes in interest rates. We also enter into financial derivative instruments including, but not limited to, interest rate swaps to manage and mitigate interest rate risk exposure. For interest rate derivative instruments that are designated and qualify as fair value hedges, the gain or loss on the derivative as well as the offsetting loss or gain on the hedged item attributable to the hedged risk is recognized in the Consolidated Statements of Operations. There were no significant amounts of gains or losses recognized in net income in 2016, 2015 or 2014.
At December 31, 2016, we had “pay floating — receive fixed” interest rate swaps outstanding with a total notional amount of $900 million to hedge against changes in the fair value of our fixed-rate debt that arise as a result of changes in market interest rates. These interest rate swaps expire in 2018 and thereafter. These swaps also allow us to transform a portion of the underlying interest payments related to our long-term fixed-rate debt securities into variable-rate interest payments in order to achieve our desired mix of fixed and variable-rate debt.
Information about our interest rate swaps that had netting or rights of offset arrangements are as follows:
December 31, 2016 | December 31, 2015 | ||||||||||||||||||||||
Gross Amounts Presented in the Consolidated Balance Sheets | Amounts Not Offset in the Consolidated Balance Sheets | Net Amount | Gross Amounts Presented in the Consolidated Balance Sheets | Amounts Not Offset in the Consolidated Balance Sheets | Net Amount | ||||||||||||||||||
Description | (in millions) | ||||||||||||||||||||||
Assets | $ | 9 | $ | — | $ | 9 | $ | 14 | $ | — | $ | 14 | |||||||||||
Our floating-to-fixed interest rate swaps expired or were terminated in 2011 in conjunction with the pay down of our credit facility and were designated and qualified as cash flow hedges. The reclassifications from Other Comprehensive Income into income on derivatives are as follows:
Derivatives | Consolidated Statements of Operations Caption | 2016 | 2015 | 2014 | ||||||||||
(in millions) | ||||||||||||||
Interest rate swaps | Interest expense | $ | — | $ | (1 | ) | $ | (1 | ) | |||||
Foreign Currency Risk. We are exposed to minimal foreign currency risk from our Express Canada operations.
Credit Risk. Our principal customers for natural gas transmission and storage services are local distribution companies, industrial end-users, and natural gas marketers located throughout the United States and Canada. Customers on the Express-Platte system are primarily refineries located in the Rocky Mountain and Midwestern states of the United States. Other customers include oil producers and marketing entities. We have concentrations of receivables from these sectors throughout these regions. These concentrations of customers may affect our overall credit risk in that risk factors can negatively affect the credit quality of the entire sector. Where exposed to credit risk, we analyze the customers’ financial condition prior to entering into an agreement, establish credit limits and monitor the appropriateness of those limits on an ongoing basis. We also obtain parental guarantees, cash deposits, or letters of credit from customers to provide credit support, where appropriate, based on our financial analysis of the customer and the regulatory or contractual terms and conditions applicable to each contract.
87
16. Commitments and Contingencies
General Insurance
We are insured through Spectra Energy’s master insurance program for insurance coverages consistent with companies engaged in similar commercial operations with similar type properties. Our insurance program includes: (1) commercial general and excess liability insurance for liabilities to third parties for bodily injury and property damage resulting from our operations; (2) workers’ compensation liability coverage to required statutory limits; (3) automobile liability insurance for all owned, non-owned and hired vehicles covering liabilities to third parties for bodily injury and property damage; (4) directors and officers liability insurance; and (5) onshore replacement value property insurance, including machinery breakdown, business interruption and extra expense. All coverages are subject to certain deductibles, terms, exclusions, and conditions common for companies with similar types of operations.
Environmental
We are subject to various federal, state and local laws and regulations regarding air and water quality, hazardous and solid waste disposal and other environmental matters. These laws and regulations can change from time to time, imposing new obligations on us.
Like others in the energy industry, we and our affiliates are responsible for environmental remediation at various contaminated sites. These include some properties that are part of our ongoing operations, sites formerly owned or used by us, and sites owned by third parties. Remediation typically involves management of contaminated soils and may involve groundwater remediation. Managed in conjunction with relevant federal, state/provincial and local agencies, activities vary with site conditions and locations, remedial requirements, complexity and sharing of responsibility. If remediation activities involve statutory joint and several liability provisions, strict liability, or cost recovery or contribution actions, we or our affiliates could potentially be held responsible for contamination caused by other parties. In some instances, we may share liability associated with contamination with other potentially responsible parties, and may also benefit from contractual indemnities that cover some or all cleanup costs. All of these sites generally are managed in the normal course of business or affiliated operations.
Litigation
Litigation and Legal Proceedings. We are involved in legal, tax and regulatory proceedings in various forums arising in the ordinary course of business, including matters regarding contract and payment claims, some of which involve substantial monetary amounts. We have insurance coverage for certain of these losses should they be incurred. We believe that the final disposition of these proceedings will not have a material effect on our consolidated results of operations, financial position or cash flows.
Legal costs related to the defense of loss contingencies are expensed as incurred. We had no material reserves for legal matters recorded as of December 31, 2016 or 2015 related to litigation.
Operating Lease Commitments
We lease assets in various areas of our operations. Consolidated rental expense for operating leases classified in Net Income was $22 million in 2016, $23 million in 2015 and $21 million in 2014, which is included in Operating, Maintenance and Other on the Consolidated Statements of Operations. The following is a summary of future minimum lease payments under operating leases which at inception had noncancellable terms of more than one year. We had no capital lease commitments at December 31, 2016.
88
Long-term Operating Leases | |||
(in millions) | |||
2017 | $ | 17 | |
2018 | 20 | ||
2019 | 19 | ||
2020 | 18 | ||
2021 | 16 | ||
Thereafter | 122 | ||
Total future minimum lease payments | $ | 212 | |
17. Guarantees
We have various financial guarantees which are issued in the normal course of business. We enter into these arrangements to facilitate a commercial transaction with a third party by enhancing the value of the transaction to the third party. To varying degrees, these guarantees involve elements of performance and credit risk, which are not included on our Consolidated Balance Sheets. The possibility of having to perform under these guarantees is largely dependent upon future operations of various subsidiaries, investees and other third parties, or the occurrence of certain future events.
On December 29, 2016, we issued performance guarantees to a third party and an affiliate on behalf of an equity method investee. These guarantees were issued to enable the equity method investee to enter into long-term transportation contracts with the third party. While the likelihood is remote, the maximum potential amount of future payments we could have been required to make as of December 31, 2016 was $50 million. These performance guarantees expire in 2032.
As of December 31, 2016, the amounts recorded for the guarantees described above are not material, both individually and in the aggregate.
18. Issuances of Common Units
In April 2016, we issued 10.4 million common units and 0.2 million general partner units to Spectra Energy in a private placement transaction. Total net proceeds were $489 million, including $10 million for general partner units in order to maintain Spectra Energy's 2% general partner interest. We used the proceeds from this purchase for general partnership purposes, including the funding of our current expansion capital plan.
In November 2015, we issued 17,114 common units in connection with the U.S. Assets Dropdown, valued at $1 million. In addition, we issued 342 general partner units to Spectra Energy in exchange for the same amount of common units in order to maintain Spectra Energy's 2% general partner interest.
In November 2014, we issued 4.3 million common units and 86,000 general partner units to Spectra Energy in connection with the U.S. Assets Dropdown, valued at $186 million. See Note 2 for further discussion of this transaction.
We have entered into equity distribution agreements for our at-the-market offering program, pursuant to which we may offer and sell, through sales agents, common units representing limited partner interests at prices we deem appropriate having aggregate offering prices ranging from $400 million to up to $1 billion. Sales of common units, if any, will be made by means of ordinary brokers’ transactions on the New York Stock Exchange (NYSE), in block transactions, or as otherwise agreed to between the sales agent and us. We intend to use the net proceeds from sales under the program for general partnership purposes, which may include debt repayment, future acquisitions and capital expenditures.
During the year ended December 31, 2016, we issued 12.8 million common units to the public under this program, and approximately 262,000 general partner units to Spectra Energy. Total net proceeds were $591 million, including approximately $12 million of proceeds from Spectra Energy.
During the year ended December 31, 2015, we issued 12.0 million common units to the public under this program, and 245,000 general partner units to Spectra Energy. Total net proceeds were $557 million, including $11 million of proceeds from Spectra Energy.
89
During the year ended December 31, 2014, we issued 6.4 million common units to the public under this program, and 132,000 general partner units to Spectra Energy. Total net proceeds were $334 million, including $7 million of proceeds from Spectra Energy.
19. Equity-Based Compensation
Phantom units are granted under a Long-Term Incentive Plan to certain employees of Spectra Energy and vest over three years. We did not award phantom units in 2016, 2015 or 2014. The remaining 7,500 units vested in 2015. There were no units vested in 2014.
We account for the phantom units as liability awards. Compensation expense for these awards was not significant in 2016, 2015 or 2014.
20. Quarterly Financial Data (Unaudited)
First Quarter | Second Quarter | Third Quarter | Fourth Quarter | Total | |||||||||||||||
(in millions, except per-unit amounts) | |||||||||||||||||||
2016 | |||||||||||||||||||
Operating revenues | $ | 624 | $ | 618 | $ | 628 | $ | 663 | $ | 2,533 | |||||||||
Operating income | 324 | 305 | 280 | 319 | 1,228 | ||||||||||||||
Net income | 311 | 305 | 296 | 327 | 1,239 | ||||||||||||||
Net income—controlling interests | 298 | 287 | 275 | 301 | 1,161 | ||||||||||||||
Net income per limited partner unit (a) | 0.80 | 0.71 | 0.64 | 0.70 | 2.84 | ||||||||||||||
2015 | |||||||||||||||||||
Operating revenues | $ | 606 | $ | 603 | $ | 612 | $ | 634 | $ | 2,455 | |||||||||
Operating income | 311 | 322 | 319 | 321 | 1,273 | ||||||||||||||
Net income | 301 | 316 | 331 | 317 | 1,265 | ||||||||||||||
Net income—controlling interests | 293 | 307 | 321 | 304 | 1,225 | ||||||||||||||
Net income per limited partner unit (a) | 0.80 | 0.83 | 0.85 | 0.82 | 3.30 | ||||||||||||||
(a) | Quarterly net income per limited partner unit amounts are stand-alone calculations and may not be additive to full-year amounts due to rounding and changes in outstanding units. |
90
Item 9. Changes in and Disagreements with Accountants on Accounting and Financial Disclosure.
None.
Item 9A. Controls and Procedures.
Evaluation of Disclosure Controls and Procedures
Disclosure controls and procedures are controls and other procedures that are designed to ensure that information required to be disclosed by us in the reports we file or submit under the Securities Exchange Act of 1934 (Exchange Act) is recorded, processed, summarized, and reported within the time periods specified by the SEC’s rules and forms. Disclosure controls and procedures include, without limitation, controls and procedures designed to provide reasonable assurance that information required to be disclosed by us in the reports we file or submit under the Exchange Act is accumulated and communicated to management, including the Chief Executive Officer and Chief Financial Officer, as appropriate to allow timely decisions regarding required disclosure.
Under the supervision and with the participation of the management of Spectra Energy Partners (DE) GP, LP (our General Partner), including the Chief Executive Officer and Chief Financial Officer, we have evaluated the effectiveness of our disclosure controls and procedures (as such term is defined in Rules 13a-15(e) and 15d-15(e) under the Exchange Act) as of December 31, 2016, and, based upon this evaluation, the Chief Executive Officer and Chief Financial Officer have concluded that these controls and procedures are effective at the reasonable assurance level.
Changes in Internal Control over Financial Reporting
Under the supervision and with the participation of the management of our General Partner, including the Chief Executive Officer and Chief Financial Officer, we have evaluated changes in internal control over financial reporting (as such term is defined in Rules 13a-15(f) and 15d-15(f) under the Exchange Act) that occurred during the fiscal quarter ended December 31, 2016 and found no change that has materially affected, or is reasonably likely to materially affect, internal control over financial reporting.
Management’s Annual Report on Internal Control over Financial Reporting
The report of management required under this Item 9A is contained in Item 8. Financial Statements and Supplementary Data, Management’s Annual Report on Internal Control over Financial Reporting.
Attestation Report of Independent Registered Public Accounting Firm
The attestation report required under this Item 9A is contained in Item 8. Financial Statements and Supplementary Data, Report of Independent Registered Public Accounting Firm.
Item 9B. Other Information.
None.
91
PART III
Item 10. Directors, Executive Officers and Corporate Governance.
Management of Spectra Energy Partners, LP
We do not have directors or officers, which is commonly the case with publicly traded partnerships. Our operations and activities are managed by our general partner, Spectra Energy Partners (DE) GP, LP, which in turn is managed by its general partner, Spectra Energy Partners GP, LLC, (the General Partner). The General Partner is wholly owned by a subsidiary of Spectra Energy. The officers and directors of the General Partner are responsible for managing us. All of the directors of the General Partner are elected annually by Spectra Energy and all of the officers of the General Partner serve at the discretion of the directors. Unitholders are not entitled to participate, directly or indirectly, in management or operations.
Board of Directors and Officers
The Board of Directors of the General Partner currently has seven members, three of whom are independent as defined under the independence standards established by the New York Stock Exchange (NYSE). The NYSE does not require a listed limited partnership to have a majority of independent directors on its general partner’s Board of Directors or to establish a compensation committee or a nominating committee. However, the Board of Directors of the General Partner has established an audit committee (the Audit Committee) and a conflicts committee (the Conflicts Committee) to address conflict situations. The Audit Committee consists of Nora Mead Brownell, Fred J. Fowler and J.D. Woodward, III, and the Conflicts Committee consists of Nora Mead Brownell and J.D. Woodward, III.
The Board of Directors of the General Partner annually reviews the independence of directors and affirmatively makes a determination that each director expected to be independent has no material relationship with the General Partner, either directly or indirectly as a partner, unitholder or officer of an organization that has a relationship with the General Partner. The members of the Audit Committee each meet the independence and experience standards established by the NYSE and the Securities Exchange Act of 1934 (Exchange Act) as amended, to serve on an audit committee of a board of directors.
The officers of the General Partner manage the day-to-day affairs of our business. All of our executive management personnel are employees of Spectra Energy and devote a portion of their time to our business and affairs. We also utilize a significant number of employees of Spectra Energy to operate our business and provide general and administrative services. We reimburse Spectra Energy for allocated expenses of operational personnel who perform services for our benefit and for allocated general and administrative expenses.
The General Partner does not receive any management fee or other compensation for its management of our partnership under the amended and restated omnibus agreement with Spectra Energy (Omnibus Agreement) or otherwise. Under the terms of the Omnibus Agreement, we reimburse Spectra Energy for the provision of various general and administrative services for our benefit. We also reimburse Spectra Energy for direct expenses incurred on our behalf. The partnership agreement provides that the General Partner will determine the expenses that are allocable to us.
Directors and Executive Officers
The following table shows information regarding the current directors and executive officers of the General Partner. Directors are elected for one-year terms.
Name | Age | Position with Spectra Energy Partners GP, LLC | ||
Gregory L. Ebel | 52 | President, Chief Executive Officer and Chairman | ||
J. Patrick Reddy | 64 | Chief Financial Officer | ||
Reginald D. Hedgebeth | 49 | General Counsel | ||
Fred J. Fowler | 70 | Director | ||
Dorothy M. Ables | 59 | Director | ||
Nora Mead Brownell | 69 | Director | ||
Julie A. Dill | 57 | Director | ||
J.D. Woodward, III | 67 | Director | ||
William T. Yardley | 52 | Director | ||
92
Directors of Spectra Energy Partners GP, LLC hold office until the earlier of their death, resignation, removal or disqualification or until their successors have been elected and qualified. Officers serve at the discretion of the Board of Directors. There are no family relationships among any of our directors or executive officers.
Gregory L. Ebel was appointed President, Chief Executive Officer and Chairman of the Board of Spectra Energy Partners GP, LLC in November 2013. He is also Chairman, President and Chief Executive Officer of Spectra Energy. Mr. Ebel served as Group Executive and Chief Financial Officer of Spectra Energy from January 2007 until assuming his current position at Spectra Energy in January 2009. Prior to that time, Mr. Ebel served as President of Union Gas Limited from January 2005 until January 2007 and Vice President, Investor & Shareholder Relations of Duke Energy from November 2002 until January 2005. Mr. Ebel joined Duke Energy in March 2002 as Managing Director of Mergers and Acquisitions in connection with Duke Energy’s acquisition of Westcoast Energy Inc. Mr. Ebel also serves on the Board of Directors for DCP Midstream, LLC, a joint venture between Spectra Energy and Phillips 66, and also on the Board of Directors for the The Mosaic Company.
J. Patrick Reddy was appointed Chief Financial Officer of Spectra Energy Partners GP, LLC in March 2013. He is also Spectra Energy’s Chief Financial Officer, a position he assumed in January 2009. As Spectra Energy's Chief Financial Officer, he leads the financial function, which includes the controller’s office, financial planning and analysis, treasury, tax, risk management and insurance. He also serves on the Board of Directors for DCP Midstream, LLC, a joint venture between Spectra Energy and Phillips 66, and also on the Board of Directors for Paragon Offshore PLC.
Reginald D. Hedgebeth was appointed General Counsel of Spectra Energy Partners GP, LLC in December 2013. He is also Spectra Energy's General Counsel and Chief Ethics and Compliance Officer. Mr. Hedgebeth joined Spectra Energy in March 2009. Prior to joining Spectra Energy, he served as Senior Vice President, General Counsel and Secretary with Circuit City Stores, Inc., a role he assumed in 2005. Mr. Hedgebeth also serves on the Board of Directors of The Brink’s Company.
Fred J. Fowler was appointed to the Board of Directors of Spectra Energy Partners GP, LLC as its Chairman in December 2008, a position he held until November 1, 2013. Mr. Fowler serves on our Audit Committee. He retired as President and Chief Executive Officer of Spectra Energy in December 2008, a position he held since its inception in January 2007. Mr. Fowler previously served as Group Executive and President of Duke Energy Gas Transmission from April 2006. He was President and Chief Operating Officer from November 2002 to April 2006. Mr. Fowler also serves on the Board of Directors of EnCana Corp, Pacific Gas and Electric Company and DCP Midstream Partners LP. Mr. Fowler was elected to serve as a director because of his extensive knowledge and experience of the energy industry and its participants, as well as a deep understanding of our assets, customers and regulatory environments.
Dorothy M. Ables was appointed to the Board of Directors of Spectra Energy Partners GP, LLC in December 2013. She was named Chief Administrative Officer for Spectra Energy in November 2008, responsible for the company's human resources, information technology, supports services and community relations functions. Prior to then, she served as Spectra Energy's Vice President of Audit Services and Chief Ethics and Compliance Officer from 2007. Ms. Ables was appointed to the board because of her broad leadership experience with the company's natural gas transmission business, primarily in the strategic planning and financial areas and the areas of information technology, human resources, community relations and public affairs. Ms. Ables also serves on the Board of Directors of Cabot Oil Gas Corporation.
Nora Mead Brownell was appointed to the Board of Directors of Spectra Energy Partners GP, LLC in May 2007 and serves on our Audit Committee and the Conflicts Committee. In May 2001, Ms. Brownell was confirmed as Commissioner of the Federal Energy Regulatory Commission (FERC) where she served until the expiration of her term in June 2006. Prior to the FERC, Ms. Brownell served as a member of the Pennsylvania Public Utility Commission from 1997 to 2001. Ms. Brownell also currently serves on the Board of Directors of National Grid plc and Tangent Energy Solutions, a private next generation energy services resource. Ms. Brownell is co-founder and principal of ESPY Energy Solutions, LLC, a woman-owned independent energy consulting company. Ms. Brownell was elected to serve as a director because she brings a diverse background that includes experience in business, finance and the regulatory arenas.
Julie A. Dill was appointed to the Board of Directors of Spectra Energy Partners GP, LLC in January 2012. Ms. Dill is Chief Communications Officer of Spectra Energy. Prior to assuming her current role in January 2014, Ms. Dill served as President and Chief Executive Officer of Spectra Energy Partners GP, LLC and Group Vice President of Strategy for Spectra Energy. Ms. Dill served as Chair and President of Union Gas Limited from December 2006 through December 2011. Ms. Dill was Vice President of Investor Relations from 2004 and 2006 for Duke Energy. She served as Group Executive - Investor Relations and Chief Communications Officer from April 2006 until assuming her position with Union Gas in December 2006. Ms. Dill also serves on the Board of Directors for QEP Resources, Inc. Ms. Dill was appointed to the board because of her over 32 years of energy experience.
93
William T. Yardley was appointed to the Board of Directors of Spectra Energy Partners GP, LLC in August 2012. Mr. Yardley is President of Spectra Energy’s U.S. Transmission and Storage business, responsible for the company’s extensive network of natural gas infrastructure across the company. Mr. Yardley joined the company in 2000 as General Manager of Marketing for one of Spectra Energy’s predecessor subsidiaries, Duke Energy Gas Transmission. He later served as Vice President of Marketing and Business Development and as Group Vice President of the company’s northeastern U.S. assets and operations. He was named to his current position in January 2013. Mr. Yardley currently serves on the board of the Northeast Gas Association and is a member of the Leadership Council of the American Gas Association. Mr. Yardley brings his business and industry expertise to the board as well as his knowledge of our assets.
J.D. Woodward, III was appointed to the Board of Directors of Spectra Energy Partners GP, LLC in September 2009 and serves on the Conflicts Committee as Chairman and on the Audit Committee as Chairman. Mr. Woodward is a managing member of Woodward-Apple Springs, LLC, an owner and operator of natural gas midstream assets in East Texas, and a managing member of OGP Trinity, LLC, an owner of gas production properties and various leasehold interests in East Texas. He retired in 2006 from Atmos Energy as Senior Vice President of Non-Utility Operations. Mr. Woodward was selected to serve as a director because he understands the operations of a large corporation, with a particular focus on customer issues. Mr. Woodward is an experienced senior executive in the energy industry.
Section 16(a) Beneficial Ownership Reporting Compliance
Section 16(a) of the Exchange Act requires the General Partner’s directors and executive officers, and persons who own more than 10% of any class of our equity securities to file with the Securities and Exchange Commission (SEC) and the NYSE initial reports of ownership and reports of changes in ownership of our common units and other equity securities. Spectra Energy prepares and files these reports on behalf of the General Partner’s directors and executive officers. To our knowledge, all Section 16(a) reporting requirements applicable to the General Partner’s directors and executive officers were complied with during 2016.
Audit Committee
The Board of Directors of the General Partner has a standing audit committee composed of Nora Mead Brownell, Fred J. Fowler and J.D. Woodward, III, each of whom is able to understand fundamental financial statements and at least one of whom has past experience in accounting or related financial management experience. The Board has determined that each member of the Audit Committee is independent under Section 303A.02 of the NYSE listing standards and Section 10A(m)(3) of the Exchange Act, as amended. In making the independence determination, the Board considered the requirements of the NYSE. The Audit Committee has adopted a charter, which has been ratified and approved by the Board of Directors. Messrs. Fowler and Woodward have been designated by the Board of Directors as the Audit Committee’s financial experts meeting the requirements promulgated by the SEC based upon their education and employment experience.
The Audit Committee assists the Board of Directors in its oversight of the integrity of our financial statements and compliance with legal and regulatory requirements and corporate policies and controls. The Audit Committee has the sole authority to retain and terminate our independent registered public accounting firm, approve all auditing services and related fees and terms thereof, and pre-approve any non-audit services to be rendered by our independent registered public accounting firm. The Audit Committee is also responsible for confirming the independence and objectivity of our independent registered public accounting firm. Our independent registered public accounting firm has unrestricted access to the Audit Committee.
Conflicts Committee
The Board of Directors has a standing Conflicts Committee, which is comprised of Nora Mead Brownell and J.D. Woodward, III. The Conflicts Committee reviews specific matters that the Board of Directors believes may involve conflicts of interest. The Conflicts Committee will determine if the resolution of the conflict of interest is in the best interest of our partnership. The members of the Conflicts Committee may not be officers, employees or security holders of the General Partner, or directors, officers or employees of its affiliates. Any matters approved by the Conflicts Committee in good faith will be conclusively deemed to be fair and reasonable to us, approved by all of our partners, and not a breach by the General Partner of any duties it may owe us or our unitholders.
Principles for Corporate Governance and Code of Business Ethics
We have adopted Corporate Governance Guidelines that outline the important policies and practices regarding our governance. We have also adopted the Spectra Energy Code of Business Ethics applicable to persons serving as the General Partner’s officers and directors.
94
Copies of the Corporate Governance Guidelines, the Code of Business Ethics and the Audit Committee Charter are available online at www.spectraenergypartners.com. Copies of these items are also available free of charge in print to any unitholder who sends a request to the office of Investor Relations of our partnership at 5400 Westheimer Court, Houston, Texas 77056, (713) 627-4963.
Executive Sessions of the Board of Directors
As set forth in our Corporate Governance Guidelines and in accordance with NYSE listing standards, the Board of Directors of the General Partner holds executive sessions on a regular basis without the presence of management. Mr. Woodward, a non-management director, presides over all executive sessions.
Communications by Unitholders
Unitholders and other interested parties may communicate with any and all members of the Board of Directors, including non-management directors, by transmitting correspondence by mail or facsimile addressed to one or more directors by name or to the chairman of the Board of Directors or any committee of the Board of Directors at the following address and fax number; Name of the Director(s), c/o Corporate Secretary, Spectra Energy Partners, LP, 5400 Westheimer Court, Houston, Texas 77056 fax: (713) 989-1818.
95
Item 11. Executive Compensation.
COMPENSATION DISCUSSION AND ANALYSIS
Compensation Discussion and Analysis
References below to “Spectra Energy Partners,” “we,” “our,” “us,” or similar terms refer to Spectra Energy Partners, LP.
This compensation discussion and analysis is intended to provide information about the design and purpose of compensation programs applicable to the officers of the general partner of our partnership listed in the Summary Compensation Table. We do not directly employ any of the persons responsible for managing our business and we do not have a compensation committee. We are managed by our general partner, the executive officers of which are employees of Spectra Energy. Our reimbursement for the compensation of executive officers is governed by the Omnibus Agreement and is generally based on time allocated to us during a period.
Our principal executive officer, together with our principal financial officer and our general counsel, are our “named executive officers.” Mr. Gregory L. Ebel is our Chief Executive Officer (our principal executive officer), Mr. J. Patrick Reddy is our Chief Financial Officer (our principal financial officer), and Mr. Reginald D. Hedgebeth is our General Counsel (our general counsel). Compensation paid or awarded by us in 2016 to our named executive officers reflects the total compensation paid by Spectra Energy, which includes compensation that is allocated to us pursuant to Spectra Energy’s allocation methodology and subject to the terms of the Omnibus Agreement. The Board of Directors of Spectra Energy, upon recommendation of the Compensation Committee of the Board of Directors of Spectra Energy (Compensation Committee), approves targeted compensation levels for the Chief Executive Officer. The Compensation Committee has ultimate decision making authority with respect to the compensation of all remaining named executive officers other than with respect to awards of equity in our partnership, for which our Board retains control. Any awards under our long-term incentive plan are recommended by the Compensation Committee and approved by the Board of Directors of Spectra Energy Partners GP, LLC. The elements of compensation discussed below, and Spectra Energy’s decisions with respect to determinations on payments, was approved by the Compensation Committee, and was not subject to approvals by the Board of Directors of our general partner.
With respect to compensation objectives and decisions regarding our named executive officers for 2016, the Compensation Committee approved the cash compensation and equity based compensation of our named executive officers based on its compensation philosophy, which includes rewarding both continued employment and performance through a combination of short-term cash incentives and long-term equity compensation. Senior management of Spectra Energy typically utilizes compensation consultants and reviews market data to determine relevant compensation levels and compensation program elements through the review of and, in certain cases, participation in, various relevant compensation surveys. Senior management then submits a proposal to the Compensation Committee for the compensation to be paid or awarded to executives and employees for consideration. Spectra Energy consulted with compensation consultants with respect to determining 2016 compensation for the named executive officers in a manner consistent with its current compensation philosophy. All compensation determinations are discretionary and are, as noted above, subject to Spectra Energy’s decision-making authority. A full discussion of the compensation policies and programs will be included in the Executive Compensation Discussion and Analysis section of Spectra Energy Corp's Form 10-K for the fiscal year ended December 31, 2016 which will be available upon its filing on the SEC's website at www.sec.gov and on Spectra Energy's website at www.spectraenergy.com at the “Investors - Publications and SEC Filings” tab.
The elements of Spectra Energy’s compensation program discussed below are intended to provide a compensation package designed to drive performance and reward contributions in support of the business strategies of Spectra Energy and its affiliates at the corporate, partnership and individual levels. Accordingly, a significant portion of the compensation provided to our executive officers has been in the form of short-term and long-term incentives.
Committee Advisors
Since 2007, the Compensation Committee has retained ExeQuity, LLP (ExeQuity) as its independent compensation consultant. ExeQuity reports directly to the Compensation Committee on matters related to executive compensation, advises it on best practices and analyzes meeting materials prepared by management. It confers, independently of management, with the Committee’s Chair and with the full Committee, although it may discuss compensation matters with management on a limited basis at the Committee’s direction. As needed, ExeQuity meets with the Committee in executive sessions at which no one from Spectra Energy’s management is present. ExeQuity performs no other services for the Company.
96
In 2016, ExeQuity prepared materials for the Compensation Committee, reviewed materials provided to the Compensation Committee by management, consulted with the Chair prior to meetings regarding agenda items, and attended Committee meetings.
In retaining ExeQuity, the Compensation Committee considered the six factors set forth in Section 303A.05(c)(iv) of the NYSE Listed Company Manual concerning potential conflicts of interest. In addition, after a review of information provided by each member of the Compensation Committee, as well as information provided by ExeQuity, the Compensation Committee determined that there are no conflicts of interest raised by ExeQuity’s work with the Compensation Committee.
Factors Considered In Determining Total Compensation
Compensation Peer Group Comparison The Compensation Committee sets salaries and short-term and long-term incentive target levels based in part on what it determines to be the market median of compensation available to our executives in the market. The market for highly talented executives is competitive, and we believe our success depends on our ability to attract and retain executives who are qualified to successfully execute our short-term and long-term objectives. We believe that our hiring objectives cannot be achieved unless we offer compensation opportunities that are competitive in the marketplace. We would prefer to define the market median based on the practices of a sizeable peer group of companies with market capitalizations and revenues comparable to ours and with lines of business similar to ours. However, there are not enough companies meeting this description to allow us to assemble such a peer group. Therefore, in setting compensation targets, the Compensation Committee considers data from published compensation surveys as well as information from the public filings of representative companies in the markets where we compete for executive talent and capital - which we refer to as the Compensation Peer Group. Companies included in the Compensation Peer Group are shown to the right. | Compensation Peer Group CenterPoint Energy, Inc. Dominion Resources, Inc. DTE Energy Company Enbridge Inc. EQT Corporation Kinder Morgan, Inc.* Sempra Energy TransCanada Corporation Williams Companies, Inc. Energy Transfer Partners* Enterprise Products NextEra Energy Plains All American* *For these companies, the CEO compensation design is significantly different than ours; therefore, these companies are primarily used for other Named Executive Officers. |
The Compensation Committee also considers trends in the broader market as shown in general industry surveys. Specifically, the Compensation Committee has used the Aon Hewitt Total Compensation Management Database because it believes this survey provides a reliable indication of compensation practices in companies with revenues comparable to ours and of similar size.
External Market Conditions and Individual Factors
In addition to using benchmark survey data, the Compensation Committee takes into account external market conditions and individual factors when establishing the total compensation of each named executive officer. Individual factors include the executive’s performance, level of experience, tenure, responsibilities and position. External market conditions include competitive pressures for the executive’s particular position within the industry, economic developments, the condition of labor markets, and the financial and market performance of Spectra Energy. To assist in its evaluation, the Compensation Committee uses tally sheets that provide the details of an executive’s historical and proposed compensation. Finally, the Compensation Committee considers internal equity when evaluating the compensation of our named executive officers relative to one another.
Risk Considerations in the Compensation Program
In addition to reviewing market factors, the Compensation Committee reviews the alignment of the executive compensation program components with the interests of Spectra Energy’s shareholders. The overall mix and design of our executives’ short- and long-term incentive compensation opportunities are balanced to mitigate undue risk and promote the health of Spectra Energy.
To drive long-term decision-making, our total incentive opportunities place greater emphasis on long-term goals. In the short-term program, no more than 30% of a named executive officer’s targeted award is dependent on any one performance measure. Short-term measures are chosen to balance the importance of generating short-term earnings and cash with the efficiency and effectiveness of employed capital. Seventy (70) percent of each executive’s long-term opportunity is contingent on the performance of Spectra Energy’s stock on an absolute and relative basis, and each
97
executive is required to own certain amounts of Spectra Energy stock, which provides continued alignment with Spectra Energy’s shareholders’ interests in the long-term growth of Spectra Energy.
Elements of the Compensation Program
The objective of the compensation program is to link total compensation to individual and company performance on both a short-term and long-term basis. To carry out this objective, the program is structured to include short-term incentives that reward the achievement of predetermined performance objectives and long-term incentives that reward stock performance and encourage our executives to align their interests with those of shareholders.
PRINCIPAL COMPENSATION COMPONENTS FOR NAMED EXECUTIVE OFFICERS
Component | Rationale | Structure |
Salary | Provides compensation for performing day-to-day responsibilities Creates a framework for incentive awards, which are structured as a percentage of base salary | Paid in cash at regular intervals throughout the year. |
Short-Term Incentive | Makes significant percentage of cash compensation contingent on specific financial targets and operational performance goals. Employs performance goals that are appropriate short-term measures of the business imperatives necessary to build financial success and operational excellence in the long term. | Annual cash payment based on the achievement of defined financial and operational performance goals: •80% based on financial goals (DCF, EBITDA and Return on Capital Employed (ROCE)) for our core businesses •20% based on operational and safety goals |
Long-Term Incentive | Aligns the interests of executives with those of shareholders by rewarding long-term Company stock performance Builds our executives’ equity ownership stake and provides a retention incentive | Performance share units (50% of target award value) •Payouts depend on TSR compared with our Peer Group over a three year measurement period •Payouts can range from 0% to 200% of target •Once earned, the units are converted to common stock •Dividend equivalents are accumulated from grant date but paid only upon vesting Phantom units (30% of target award value) •Time-based; vest after three years •Once earned, units are paid in cash •Dividend equivalents are accumulated from grant date but paid only upon vesting Non-qualified Stock Options (20% of target award value) •Vest ratably over three years (1/3 each year) •10 year term •Exercise price based on fair market value of Spectra Energy common stock on the date of grant |
Retirement | Provides retention incentives, rewards service through retirement-related payments, and provides savings opportunities Comparable to market; important tool for attracting and retaining executives | Company-sponsored retirement and savings plans (401(k), deferred compensation, defined-benefit plans) |
98
2016 Compensation
Pay Mix
An executive’s total compensation opportunity is the sum of annual base salary, annual cash incentive target and the target value of his annual long-term incentive grant. The opportunity established for each of our named executive officers is intended to provide total target compensation that falls in the median range for individuals who hold comparable positions in the markets in which we compete for executive talent.
For 2016, the total target pay opportunity, in aggregate, was at the market median for our named executive officers.
Salary and Total Pay Opportunities
Chief Executive Officer
The Compensation Committee made no change to Mr. Ebel’s 2016 total compensation opportunity due to his target compensation being in line with overall general industry survey data and in recognition of industry market conditions at the time his compensation was reviewed in February 2016.
Other Named Executive Officers
In February 2016, the Compensation Committee reviewed the 2015 total target pay opportunities of our named executive officers and considered factors such as job responsibilities, levels of experience, individual performance, the salaries of executives in comparable positions as obtained from market surveys, internal comparisons and current market conditions. The Compensation Committee also reviewed the 2015 total target pay opportunities for our executives to see how those opportunities compare with pay opportunities at companies with which we compete for talent, and no changes were made to our named executive officers total target pay opportunities.
The following table shows the 2016 target pay opportunities for each named executive officer.
2016 Target Pay Opportunities | ||||||||
Name | Salary | STI Target Opportunity | LTI Target Opportunity | Total Target Pay Opportunity | ||||
Gregory L. Ebel | $ | 1,133,000 | $ 1,246,300 (110%) | $ 4,815,250 (425%) | $ | 7,194,550 | ||
J. Patrick Reddy | 640,000 | 480,000 (75%) | 1,152,000 (180%) | 2,272,000 | ||||
Reginald D. Hedgebeth | 570,800 | 399,560 (70%) | 856,200 (150%) | 1,826,560 | ||||
Short-Term Incentive Opportunities
The 2016 short-term incentive opportunities under the Spectra Energy Executive Short-Term Incentive (STI) Plan were designed to compensate executives based on Spectra Energy’s 2016 financial and operational performance against goals set at the beginning of the year, and also on each executive’s overall individual performance during the year. The Compensation Committee established threshold, target and maximum incentive opportunities for each participant, expressed as a percentage of base salary. Target STI awards for our named executive officers in 2016 are reflected in the 2016 Target Pay Opportunities table above.
Under guidelines adopted for the 2016 STI program, the Compensation Committee set a maximum payment opportunity on 2016 short-term incentive payments for all of our executives equal to 200% of their STI target. In order to meet requirements relating to Spectra Energy’s tax deduction under Section 162(m) of the Internal Revenue Code, annual incentive payouts are initially set at this maximum level to the extent that performance against any one of the Spectra Energy, Spectra Energy Transmission or business unit financial goals meets the threshold level of performance. To determine actual payouts, however, the Compensation Committee then applies negative discretion by reducing awards through the application of the framework described below in conjunction with actual performance against Spectra Energy’s financial and operational measures and consideration of individual performance.
The maximum that could be earned for performance on financial and operational measures was 200% of target. The amount that could be paid for performance at a specified minimum level for any measure was 50% of the target amount. 100% of the target amount would be paid for performance at the target level. No compensation was to be earned if performance fell below a specified minimum level.
99
As shown in the following table, STI payments for our named executive officers were based on the achievement of financial and operational objectives related to management responsibilities for Spectra Energy, including Spectra Energy’s DCF, EBITDA and business unit ROCE, achievement of certain Environmental, Health and Safety (EHS) and operational goals, with an additional review based on an overall assessment of individual performance during the year.
2016 STI Performance Measures | |
Measure | Percentage |
Spectra Energy DCF | 25% |
Spectra Energy Transmission EBITDA | 30 |
Spectra Energy Transmission ROCE | 25 |
EHS and Operations Scorecard | 20 |
Spectra Energy Ongoing DCF is a measure regarding cash generation. The Compensation Committee replaced the EPS metric used in 2015 with ongoing DCF for 2016 to place greater focus on cash generation and to better align with how Spectra Energy’s shareholder's measure the Spectra Energy’s performance. Target performance was set at $1,369 million, a level that matched Spectra Energy’s corporate forecasts. Maximum payout was set at $1,574 million, a level judged to be difficult to achieve, and minimum performance was set at $1,180 million, the lowest level that would justify a payout.
Spectra Energy Transmission EBITDA is a measure of the effectiveness of the core business’s ability to generate cash without depreciation, interest or taxes, excluding Spectra Energy’s joint venture, DCP Midstream, LLC (DCP Midstream). In determining this measure, the impact of certain factors have been eliminated in order to make this measure a clearer gauge of the performance of Spectra Energy’s four core business units, including among others, the elimination of the effect of commodity price changes, the effect of exchange rate fluctuations in Canadian currency and the impact of weather at Spectra Energy’s distribution business unit. Target performance was set at $2,902 million, a level that matched Spectra Energy’s corporate forecasts. Maximum performance was set at $3,134 million, and minimum performance was set at $2,786 million, levels deemed by the Compensation Committee to be significant challenges or minimally acceptable, respectively.
Spectra Energy Transmission ROCE reflects the efficiency and effectiveness of capital deployment in Spectra Energy’s core business. Spectra Energy’s business is capital-intensive and depends on the effective execution of projects. The ability to achieve targeted returns on these projects is vital to the success of Spectra Energy’s business. Spectra Energy Transmission ROCE is one of the 2016 STI performance measures used for all of our named executive officers. We define Spectra Energy Transmission ROCE as Spectra Energy’s EBIT (excluding results from DCP Midstream) divided by Spectra Energy’s annual average total debt plus equity minus cash on hand and Spectra Energy’s investment in DCP Midstream. Target performance was set at 8.92%, a level consistent with corporate forecasts. Maximum performance was set at 9.81%, and minimum performance was set at 8.47%. Similar to other measures, maximum and minimum performance were set at levels deemed by the Compensation Committee to be significant challenges or minimally acceptable, respectively.
An EHS and Operations Scorecard was designed given the importance of safe and reliable operations and was designed to provide alignment and a common culture in all Spectra Energy’s field and office locations. The importance of a zero-injury culture was emphasized by measuring improvement in frequency rates for recordable employee and contractor injury and preventable vehicle incidents. Annual targets in these areas are set to achieve incremental improvement in performance over prior years’ results.
Reliable operations were emphasized by measuring reliability of performance at Spectra Energy’s compressor stations, processing plants, and liquid transmission system. Asset safety for the gas and liquid transmission assets was also a focus.
Determination of 2016 Short-Term Incentive Payments
At the end of the 2016 cycle, management prepared a report on the achievement of the financial and EHS/operational goals under our STI plan. The Compensation Committee reviewed and approved these results, along with any proposed adjustments based on individual performance for each named executive officer. In the case of named executive officers other than our Chief Executive Officer, the Chief Executive Officer made recommendations to the Compensation Committee regarding any adjustments based on individual performance. In the case of our Chief Executive Officer, the Compensation Committee reviewed and approved his performance against financial and operational objectives and his overall individual performance. Following this process, the Compensation Committee approved the final performance results and payment of incentives to all named executive officers.
100
The table below shows the level of performance needed to achieve the threshold, target and maximum payouts established for each financial goal, as well as the actual 2016 results and actual payout percentages. As discussed above, for each goal, achievement of the threshold, target and maximum amounts would result in corresponding payout percentages of 50%, 100% and 200%, respectively, of the target level.
For example, an executive’s short-term incentive payment associated with Spectra Energy’s ongoing DCF results was calculated as 25% of the executive’s target cash incentive opportunity (25% being the weighting assigned to the DCF measure) multiplied by the actual 2016 payout percentage for the DCF measure, which was 106.83%.
2016 Performance Levels and Payouts | ||||||||||||||
Measure | Threshold | Target | Maximum | Actual | Payout Percent Achieved | |||||||||
Spectra Energy DCF (in millions) | $ | 1,180 | $ | 1,369 | $ | 1,574 | $ | 1,383 | 106.83 | % | ||||
Spectra Energy Transmission EBITDA (in millions) | 2,786 | 2,902 | 3,134 | 2,854 | 79.47 | % | ||||||||
Spectra Energy Transmission ROCE | 8.47 | % | 8.92 | % | 9.81 | % | 8.83 | % | 90.00 | % | ||||
EHS and Operations Scorecard | — | — | — | — | 132.25 | % | ||||||||
In determining the final award amounts, the Compensation Committee also considered other factors, including Mr. Ebel’s leadership in driving strong company performance in 2016, enhancing the company’s financial strength, delivering record capital expansion projects in service and securing new projects. The Compensation Committee also included in its final determination of awards, Mr. Reddy’s and Mr. Hedgebeth's performance related to the success of the items noted above.
2016 STI AWARDS | |||||
Name | Actual Short-Term Incentive Payout | Payout as a Percent of STI Target Opportunity | |||
Gregory L. Ebel | $ | 2,486,350 | 199 | % | |
J. Patrick Reddy | 957,593 | 199 | |||
Reginald D. Hedgebeth | 797,116 | 199 | |||
2016 Long-Term Incentive Opportunities
Spectra Energy provides long-term incentive opportunities to its executive officers to achieve an alignment of executive and shareholder interests. These opportunities are designed to incentivize executives to achieve strategic goals that will maximize long-term shareholder value.
The Compensation Committee decided that the long-term incentive program for the named executive officers should consist of a time-based element and performance-based elements on both an absolute and relative basis. It believes that combining these three forms of awards, with the heaviest weighting on the performance elements, is an effective means of creating a focus on shareholder return and helping Spectra Energy retain its executive talent in a competitive market.
Phantom units
Phantom units make up 30% of the annual Long-Term Incentive (LTI) grant value. These units generally vest at the end of three years if the grantee remains continuously employed by the Spectra Energy/affiliates, at which time they are paid in cash, based on the fair market value of Spectra Energy common stock at the time of vesting. Dividend equivalents are accumulated from the date of grant and paid (in cash) only on the number of phantom units that actually vest.
Stock options
Non-qualified stock options make up 20% of the annual LTI grant value. These options generally vest ratably over three years if the grantee remains continuously employed by the Spectra Energy/affiliates, at which time they become exercisable. The stock options have an exercise price based on the fair market value of Spectra Energy common stock on the date of grant and generally have a ten-year term.
101
Performance share units
For 2016, performance share unit awards continued to make up the remaining 50% of the target value of annual long-term compensation. These units are earned based on how Spectra Energy performs over a three-year period relative to its LTI Peer Group, which was revised to reflect changes in Spectra Energy’s industry and to better align industry results with the performance of Spectra Energy. The LTI Peer Group is made up of (1) companies in the S&P 500 Energy Index; (2) companies in the Alerian MLP Index, excluding DCP Midstream Partners LP (DCP) and us, and (3) Enbridge Inc. and TransCanada Corporation.
The LTI Peer Group differs from the Compensation Peer Group (see Compensation Peer Group Comparison) because the two groups serve two different purposes. The Compensation Peer Group provides an informal benchmark of compensation practices of companies with which Spectra Energy competes for executive talent, while the LTI Peer Group provides a measure of Spectra Energy’s performance compared to companies with which Spectra Energy competes for capital.
The vesting of performance share unit awards depends on how the TSR of Spectra Energy’s common stock (a performance metric under the long-term incentive program) compares to TSR results of the LTI Peer Group over a three-year measurement period, as shown below:
Relative TSR Performance vs. Vesting of Performance Share Units | |
Relative TSR Performance Results | Percentage of Target Performance Share Units Vesting |
80th Percentile or Higher | 200% |
50th Percentile (Target) | 100 |
30th Percentile | 50 |
Below 30th Percentile | — |
The Compensation Committee approved these percentages after reviewing similar programs adopted by many of the companies in the LTI Peer Group, reviewing the historical returns of the LTI Peer Group as well as indices that track energy company performance, and consulting with its independent compensation consultant.
Once earned, the performance share units are converted to shares of Spectra Energy common stock at the time of vesting. Dividend equivalents are accumulated from the date of grant and paid (in cash) only on the number of performance share units that actually vest.
The table below shows long-term incentive awards granted to our named executive officers in 2016:
2016 LTI GRANTS | |||||||||
Name | Expected Value of LTI/Equity Grants (as a % of Base Salary) | Number of Phantom Units Granted | Number of Stock Options Granted | Number of Performance Share Units Granted | |||||
Gregory L. Ebel | 425 | % | 56,700 | 412,000 | 99,800 | ||||
J. Patrick Reddy | 180 | 13,550 | 98550 | 23,850 | |||||
Reginald D. Hedgebeth | 150 | 10,100 | 73,250 | 17,750 | |||||
102
Determination of 2014-2016 Performance Share Unit Awards
The 2014 performance unit cycle commenced on January 1, 2014 and ended on December 31, 2016. Performance share units vest based on our TSR for this three-year period as compared to the TSR for companies in Spectra Energy’s 2014 Peer Group for LTI (which included Centerpoint Energy Inc., Consolidated Edison Inc., Dominion Resources Inc., DTE Energy Company, Enbridge Inc., Equitable Resources Inc., Kinder Morgan Inc., National Fuel Gas Company, Nisource Inc., ONEOK Inc., PG&E Corp., Public Service Enterprise Group Inc., Sempra Energy, TransCanada Corp, Williams Companies Inc. and Xcel Energy Inc.). The final TSR for the three-year period was 38.07%, which is at the 62.70 percentile of the 2014 Peer Group for LTI. This resulted in a payout percentage of 142.33%. The following table lists the resulting number of 2014-2016 performance shares that vested and the total value realized including associated dividend equivalents:
Original 2014 PSU Grant | Final 2014 PSU Results | |||||||||||
Name | Number of Shares at Target | Value of Grant | Number of Shares at Vest | Value Realized | ||||||||
Gregory L. Ebel | $ | 90,500 | $ | 4,170,240 | $ | 128,809 | $ | 5,921,144 | ||||
J. Patrick Reddy | 20,600 | 949,248 | 29,320 | 1,347,794 | ||||||||
Reginald D. Hedgebeth | 15,600 | 718,848 | 22,204 | 1,028,933 | ||||||||
Retirement and Other Benefits
Retirement Benefits
Spectra Energy provides our executives with retirement benefits under the Spectra Energy Retirement Savings Plan, the Spectra Energy Executive Savings Plan, the Spectra Energy Retirement Cash Balance Plan and the Spectra Energy Executive Cash Balance Plan. The Compensation Committee has determined that, based on market surveys, these plans are comparable to the benefits provided by our peers and provide an important tool for attracting and retaining our executives. Please refer to “Compensation Tables” for disclosure of the amounts paid to our named executive officers under these plans.
The Spectra Energy Retirement Savings Plan, a “401(k) plan,” is generally available to all employees in the United States. It is a tax-qualified retirement plan that provides a means for employees to save for retirement on a tax-deferred basis and to receive an employer matching contribution. Earnings on amounts credited to the plan depend on each participant’s investment choices (which may include a Spectra Energy common stock fund).
The Spectra Energy Executive Savings Plan enables executives to defer compensation, and receive employer matching contributions, in excess of the limits of the Internal Revenue Code that apply to qualified retirement plans such as the Spectra Energy Retirement Savings Plan. Investment choices under this plan are similar to those offered to all employees under the Spectra Energy Retirement Savings Plan.
The Spectra Energy Retirement Cash Balance Plan provides a defined benefit beginning at retirement, the amount of which is based on a participant’s cash balance account balance, which grows with monthly pay and interest credits.
The Spectra Energy Executive Cash Balance Plan provides executives with the retirement benefits to which they would be entitled under the Spectra Energy Retirement Cash Balance Plan in the absence of the Internal Revenue Code limits.
Perquisites and Personal Benefits
At the direction of the Board, Mr. Ebel uses the Company aircraft for personal travel in limited circumstances, primarily for business efficiency. Mr. Ebel’s family and guests may accompany him on business and personal trips. Other executive officers are not allowed to initiate personal trips on corporate or chartered aircraft. However, they are permitted to invite their spouses or guests to accompany them on business trips when space is available. When an executive officer’s use of aircraft or a guest’s travel does not meet the Internal Revenue Service’s standard for business use, the cost of that travel is imputed as income to the officer even if it did not result in incremental cost to Spectra Energy.
103
Compensation Tables
This section provides information regarding the compensation of our named executive officers for 2014 through 2016.
Summary Compensation Table | |||||||||||||||||||||||||
Name and Principal Position | Year | Salary | Bonus | Stock Awards(a) | Option Awards(a) | Non-Equity Incentive Plan Compensation(b) | Change in Pension Value and Nonqualified Deferred Compensation Earnings(c) | All Other Compensation (d) | Total | ||||||||||||||||
Gregory L. Ebel (e) | 2016 | $ | 1,133,000 | $ | — | $ | 6,856,766 | $ | 1,112,400 | $ | 2,486,350 | $ | 1,186,940 | $ | 307,582 | $ | 13,083,038 | ||||||||
President and Chief Executive Officer | 2015 | 1,133,000 | — | 6,664,813 | — | 1,889,001 | 313,525 | 342,321 | 10,342,660 | ||||||||||||||||
2014 | 1,127,500 | — | 6,285,224 | — | 1,784,594 | 756,627 | 311,110 | 10,265,055 | |||||||||||||||||
J. Patrick Reddy | 2016 | 640,000 | — | 1,638,615 | 266,085 | 957,593 | 287,097 | 153,103 | 3,942,493 | ||||||||||||||||
Chief Financial Officer | 2015 | 634,900 | — | 1,595,076 | — | 749,016 | 162,207 | 96,312 | 3,237,511 | ||||||||||||||||
2014 | 606,443 | — | 1,430,768 | — | 719,902 | 164,158 | 95,228 | 3,016,499 | |||||||||||||||||
Reginald D. Hedgebeth | 2016 | 570,800 | — | 1,219,958 | 197,775 | 797,116 | 262,043 | 98,861 | 3,146,553 | ||||||||||||||||
General Counsel and Chief Ethics & Compliance Officer | 2015 | 568,033 | — | 1,184,285 | — | 573,548 | 73,150 | 74,850 | 2,473,866 | ||||||||||||||||
2014 | 551,507 | — | 1,675,599 | — | 611,046 | 139,007 | 71,549 | 3,048,708 | |||||||||||||||||
__________
(a) | Stock Awards column reflects the aggregate grant date fair value of performance share units and phantom units awards granted each year as shown in the “2016 Grants of Plan-Based Awards” table, and computed in accordance with the provisions of FASB ASC Topic 718. Option Awards column reflects the aggregate dollar amount recognized for financial statement reporting purposes for 2016 with respect to outstanding stock options. The aggregate dollar amounts were determined without regard to any estimate of forfeitures related to service-based vesting conditions. See Spectra Energy Corp's Form 10-K Notes to Consolidated Financial Statements for the year ended December 31, 2016 regarding assumptions underlying the valuation of equity awards. If the performance share units vested at the maximum level, the following represents the maximum value that would be payable on the performance share units granted in 2016, based on the closing stock price of our common stock on the grant date of these awards for Messrs. Ebel, Reddy, and Hedgebeth: $5,668,640, $1,354,680, and $1,008,200, respectively. |
(b) | Non-Equity Incentive Plan Compensation column includes amounts payable under the Spectra Energy Executive STI Plan with respect to the 2016, 2015 and 2014 performance periods. After the shareholder vote to approve the proposed merger with Enbridge Inc. (the Merger), a portion of the 2016 amounts for Messrs. Ebel, Reddy, and Hedgebeth were paid in December 2016 to mitigate potential after-tax parachute costs to Spectra Energy and/or the executive under Section 280G and 4999 of the Internal Revenue Code. All remaining amounts, unless deferred, were paid, respectively, in February 2017, February 2016 and March 2015. |
104
(c) | Change in Pension Value and Nonqualified Deferred Compensation Earnings represents the change in value during the twelve-month period ending on December 31 of each year. These changes were as follows for each named executive officer: |
Gregory L. Ebel | J. Patrick Reddy | Reginald D. Hedgebeth | |||||||
Change in actuarial present value of accumulated benefit under the Spectra Energy Retirement Cash Balance Plan | $ | 53,811 | $ | 33,466 | $ | 40,726 | |||
Change in actuarial present value of accumulated benefit under the Spectra Energy Executive Cash Balance Plan | 578,037 | 253,631 | 221,317 | ||||||
Change in actuarial present value of accumulated benefit under the Pension Choices Plan for Employees of Westcoast Energy Inc. and Affiliated Companies | 26,784 | — | — | ||||||
Change in actuarial present value of accumulated benefit under the Spectra Energy Supplemental Pension Plan | 528,308 | — | — | ||||||
Total | $ | 1,186,940 | $ | 287,097 | $ | 262,043 | |||
(d) All Other Compensation column includes the following for 2016:
Gregory L. Ebel | J. Patrick Reddy | Reginald D. Hedgebeth | |||||||
Matching contributions under the Spectra Energy Retirement Savings Plan | $ | 15,900 | $ | 15,900 | $ | 15,900 | |||
Make-whole matching contribution credits under the Spectra Energy Corp Executive Savings Plan | 226,559 | 119,939 | 70,596 | ||||||
Premiums for life insurance coverage provided under life insurance plans | 2,622 | 7,524 | 1,710 | ||||||
Matching charitable contributions made in the name of the executive under Spectra Energy's matching gift policy(1) | 8,225 | 7,500 | 9,500 | ||||||
Personal use of Company aircraft(2) | 51,878 | 2,240 | 1,155 | ||||||
Tax return preparation services | 2,398 | — | — | ||||||
Total | $ | 307,582 | $ | 153,103 | $ | 98,861 | |||
__________
(1) Amounts represent Spectra Energy-matched charitable contributions during 2016.
(2) | The amounts shown as “Personal use of Company aircraft” reflect the personal use of Spectra Energy’s aircraft by the named executive officers. When travel costs did not meet the IRS standard for “business use,” income was imputed to the officer even though such travel may not have resulted in incremental cost to Spectra Energy. The methodology used to compute the incremental cost of this benefit was based on the hourly variable cost for the use of the aircraft, plus any tax-deduction disallowance. |
(e) | A portion of Mr. Ebel’s pension value for 2016, 2015 and 2014 was provided in Canadian dollars and has been converted to U.S. dollars using the Bloomberg spot rate of $0.7440 on December 31, 2016, $0.7226 on December 31, 2015 and $0.8605 on December 31, 2014. |
105
2016 Grants of Plan-Based Awards | ||||||||||||||||
Name | Grant Date | Committee Approval Date | Estimated Possible Payouts Under Non-Equity Incentive Plan Awards (a) | Estimated Future Payouts Under Equity Incentive Plan Awards (b)(c) | All Other Stock Awards: Number of Shares of Stock or Units (b)(c) (#) | All Other Option Awards: Number of Securities Underlying Options (#) | Exercise or Base Price of Option Awards ($/Sh) | Grant Date Fair Value of Stock and Option Awards ($)(d) | ||||||||
Threshold ($) | Target ($) | Maximum ($) | Threshold (#) | Target (#) | Maximum (#) | |||||||||||
Gregory L.Ebel | 623,150 | 1,246,300 | 2,492,600 | |||||||||||||
Gregory L.Ebel | 2/16/2016 | 2/15/2016 | 49,900 | 99,800 | 199,600 | 5,246,486 | ||||||||||
Gregory L.Ebel | 2/16/2016 | 2/15/2016 | 56,700 | 1,610,280 | ||||||||||||
Gregory L.Ebel | 2/16/2016 | 2/15/2016 | 412,000 | 28.40 | 1,112,400 | |||||||||||
J. Patrick Reddy | 240,000 | 480,000 | 960,000 | |||||||||||||
J. Patrick Reddy | 2/16/2016 | 2/15/2016 | 11,925 | 23,850 | 47,700 | 1,253,795 | ||||||||||
J. Patrick Reddy | 2/16/2016 | 2/15/2016 | 13,550 | 384,820 | ||||||||||||
J. Patrick Reddy | 2/16/2016 | 2/15/2016 | 98,550 | 28.40 | 266,085 | |||||||||||
Reginald D. Hedgebeth | 199,780 | 399,560 | 799,120 | |||||||||||||
Reginald D. Hedgebeth | 2/16/2016 | 2/15/2016 | 8,875 | 17,750 | 35,500 | 933,118 | ||||||||||
Reginald D. Hedgebeth | 2/16/2016 | 2/15/2016 | 10,100 | 286,840 | ||||||||||||
Reginald D. Hedgebeth | 2/16/2016 | 2/15/2016 | 73,250 | 28.40 | 197,775 | |||||||||||
__________
(a) | This column shows the potential payout opportunities established for the 2016 performance period under the terms of the Spectra Energy Executive STI Plan. The actual amounts paid to each executive under the plan for 2016 are disclosed in the Summary Compensation Table. |
(b) | Awards were made in units of Spectra Energy common stock and were granted under the terms of the Spectra Energy Corp 2007 Long-Term Incentive Plan, as amended and restated. |
(c) | All performance share units are earned based on how the Company performs relative to our Peer Group over a three year performance period (January 1, 2016 to December 31, 2018). |
(d) | All awards reflected in this column were computed in accordance with FASB ASC Topic 718. The per-share full grant date fair value of the phantom units, performance share units and stock options granted on February 16, 2016 were $28.40, $52.57 and $2.70, respectively. |
106
Outstanding Equity Awards at 2016 Fiscal Year-End | |||||||||||||||
Option Awards | Stock Awards | ||||||||||||||
Name | Number of Securities Underlying Unexercised Options (#) Exercisable | Number of Securities Underlying Unexercised Options (#) Unexercisable | Option Exercise Price (a) | Option Expiration Date | Number of Shares or Units of Stock That Have Not Vested (#)(b) | Market Value of Shares or Units of Stock That Have Not Vested | Equity Incentive Plan Awards: Number of Unearned Shares, Units or Other Rights That Have Not Vested (#)(c) | Equity Incentive Plan Awards: Market or Payout Value of Unearned Shares, Units or Other Rights That Have Not Vested | |||||||
Gregory L. Ebel | — | 412,000 | $ | 28.40 | 2/16/2026 | 116,450 | $ | 4,784,931 | 227,800 | $ | 9,360,302 | ||||
J. Patrick Reddy | — | 98,550 | 28.40 | 2/16/2026 | 40,750 | 1,674,418 | 92,700 | 3,809,043 | |||||||
Reginald D. Hedgebeth | — | 73,250 | 28.40 | 2/16/2026 | 44,450 | 1,826,451 | 68,900 | 2,831,101 | |||||||
__________
(a) | For options expiring on February 16, 2026, the exercise price is equal to the closing price of our common stock on the date of grant. |
(b) | Messrs. Ebel, Reddy, and Hedgebeth received Spectra Energy phantom units on February 16, 2016, February 17, 2015, and February 18, 2014 which, subject to certain exceptions, vest on the third anniversary of the date of grant. |
(c) | Messrs. Ebel, Reddy, and Hedgebeth received performance share units on February 16, 2016 and February 17, 2015 which, subject to certain exceptions, are eligible for vesting on December 31, 2018 and December 31, 2017, respectively. As directed by Instruction 3 to Item 402(f)(2) of the SEC’s Regulation S-K, performance share units are listed at the maximum number of units. |
2016 Option Exercises and Stock Vested | ||||||||||
Name | Option Awards | Stock Awards | ||||||||
Number of Shares Acquired on Exercise (#) | Value Realized on Exercise | Number of Shares Acquired on Vesting (#)(a)(b) | Value Realized on Vesting (c) | |||||||
Gregory L. Ebel | 76,700 | $ | 1,162,772 | 400,709 | $ | 17,291,220 | ||||
J. Patrick Reddy | — | — | 44,920 | 1,859,551 | ||||||
Reginald D. Hedgebeth | — | — | 34,704 | 1,438,996 | ||||||
__________
(a) | In order to mitigate potential after-tax parachute costs to Spectra Energy and/or the executive under Section 280G and 4999 of the Internal Revenue Code, after the shareholder vote to approve the Merger, the vesting of a portion of the outstanding awards held by Messrs. Ebel and Reddy were accelerated and these awards were settled in December 2016. |
(b) | All shares included in this column are settled in shares, with the exception 56,700 shares for Mr. Ebel, which are settled in cash. |
(c) | Calculated based on the closing price of a share of common stock on the respective vesting date; includes the following cash payments for dividend equivalents on vested awards: $1,269,709 to Mr. Ebel; $186,515 to Mr. Reddy; and $144,112 to Mr. Hedgebeth. |
Pension Benefits
This section contains information regarding benefits available to our named executive officers under Spectra Energy’s pension and retirement plans.
Spectra Energy Retirement Cash Balance Plan and Executive Cash Balance
Spectra Energy provides pension benefits that are intended to assist its retirees with their retirement income needs. This section contains a detailed description of the plans that make up Spectra Energy’s pension program.
Spectra Energy Partners executive officers actively participated in pension plans sponsored by Spectra Energy or an affiliate in 2016. This included the Spectra Energy Retirement Cash Balance Plan (RCBP), a noncontributory, defined-benefit retirement plan that is intended to qualify under Section 401(a) of the Internal Revenue Code. The RCBP generally
107
covers non-bargaining employees of Spectra Energy and its affiliates, and provides benefits under a “cash balance account” formula.
Each of the named executive officers who participates in the RCBP has satisfied the requirements for receiving the account benefit upon termination of employment. The RCBP benefit is payable in the form of a lump sum in the amount credited to the hypothetical account at the time of benefit commencement. Payment is also available in the form of an annuity based on the actuarial equivalent of the account balance.
The amount credited to the hypothetical account is increased with monthly pay credits, as follows:
Age and service | Percentage of eligible monthly compensation (a) |
Participants with combined age and service of less than 35 points | 4% |
Participants with combined age and service of 35 to 49 points | 5 |
Participants with combined age and service of 50 to 64 points | 6 |
Participants with combined age and service of 65 or more points | 7 |
__________
(a) | For the RCBP, eligible monthly compensation is equal to Form W-2 wages, plus elective deferrals under a 401(k) or cafeteria plan. It does not include severance pay (including payment for unused vacation), expense reimbursements, allowances, cash or noncash fringe benefits, moving expenses, bonuses for performance periods in excess of one year, transition pay, long-term incentive compensation (including income resulting from any stock-based awards such as stock options, stock appreciation rights, phantom stock or restricted stock) and certain other compensation items. |
If the participant earns more than the Social Security wage base, the account is credited with additional pay credits equal to 4% of eligible compensation above the Social Security wage base. Interest credits are credited monthly. The interest rate is determined quarterly based upon the 30-year Treasury rate, but with a 4% minimum and a 9% maximum.
A participant’s RCBP benefit may not be less than the amount determined under certain prior benefit formulas (including optional forms). In addition, the benefit is subject to benefit and compensation limits under the Internal Revenue Code.
Each of our named executive officers was also eligible to participate in the Spectra Energy Executive Cash Balance Plan (ECBP), a noncontributory, defined-benefit retirement plan that is not intended to satisfy the requirements for qualification under Section 401(a) of the Internal Revenue Code. Benefits earned under the ECBP are attributable to (a) compensation in excess of the Internal Revenue Code’s annual compensation limit ($265,000 for 2016) for the determination of pay credits under the RCBP; (b) restoration of benefits in excess of a defined-benefit plan maximum annual benefit limit ($210,000 for 2016) under the Internal Revenue Code that applies to the RCBP; and (c) supplemental benefits granted to a particular participant. Generally, benefits earned under the RCBP and the ECBP vest upon completion of three years of service and, with certain exceptions, vested benefits generally become payable upon termination of employment with Spectra Energy.
We have established a grantor trust that is subject to the claims of our creditors into which funds related to the ECBP are deposited. Funds deposited into the trust are managed by an independent trustee subject to guidelines provided by Spectra Energy.
Pension Choices Plan for Employees of Westcoast Energy Inc. and Spectra Energy Supplemental Pension Plan
Mr. Ebel participated in the Pension Choices Plan for Employees of Westcoast Energy Inc. and Affiliated Companies (Pension Plan) and the Spectra Energy Supplemental Executive Retirement Plan (SERP) while he resided in Canada prior to 2007. The Pension Plan is registered under the Income Tax Act and under the Pension Benefits Act (Ontario). The executive component of the Pension Plan is a non-contributory defined-benefit plan that provides a pension based on 2% of the annualized average of the executive’s highest consecutive 36 months’ salary and cash incentive multiplied by his years of service while located in Canada. The Income Tax Act imposes a limit on the amount of benefits that can be paid from a registered pension plan.
The SERP is primarily intended to restore benefits under the Pension Plan to the level that would be available absent this limit. Mr. Ebel’s benefit accruals related to the Duke SERP were transferred to the Spectra Energy SERP effective with the spin-off. SERP benefits are paid from the general revenues of Spectra Energy generally as a life annuity. Effective with his transfer to the United States, Mr. Ebel began participating in the Spectra Energy RCBP, and his active participation in
108
the Pension Plan was suspended, although compensation (but not additional service) with Spectra Energy will be used in the calculation of his Pension Plan and SERP benefit. The table below provides information, determined as of December 31, 2016, about each plan that provides for payments or other benefits to our named executives officers at, following or in connection with retirement:
Pension Benefits Table | ||||||||
Name | Plan Name | Number of Years of Credited Service (#) | Present Value of Accumulated Benefit | Payments During Last Fiscal Year | ||||
Gregory L. Ebel | Spectra Energy Retirement Cash Balance Plan | 19.00 | $ | 327,466 | $ | — | ||
Gregory L. Ebel | Spectra Energy Executive Cash Balance Plan | 19.00 | 2,009,622 | — | ||||
Gregory L. Ebel | Pension Choices Plan for Employees of Westcoast Energy Inc. | 6.48 | 170,794 | — | ||||
Gregory L. Ebel | Spectra Energy Supplemental Pension Plan | 6.48 | 3,356,400 | — | ||||
J. Patrick Reddy | Spectra Energy Retirement Cash Balance Plan | 8.00 | 207,095 | — | ||||
J. Patrick Reddy | Spectra Energy Executive Cash Balance Plan | 8.00 | 904,355 | — | ||||
Reginald D. Hedgebeth | Spectra Energy Retirement Cash Balance Plan | 7.76 | 187,692 | — | ||||
Reginald D. Hedgebeth | Spectra Energy Executive Cash Balance Plan | 7.76 | 674,640 | — | ||||
Spectra Energy Executive Savings Plan
Under the Spectra Energy Executive Savings Plan, participants can elect to defer a portion of their base salary, short-term incentive compensation and long-term incentive compensation (other than stock options). Participants also receive a company matching contribution in excess of the contribution limits prescribed by the IRS under the Spectra Energy Retirement Savings Plan. In general, payments are made following termination of employment or death in the form of a lump sum or installments, as selected by the participant. Participants may request an accelerated distribution upon an “unforeseeable emergency.” In general, participants may direct the deemed investment of base salary deferrals, short-term incentive deferrals and matching contributions among investment options available under the Spectra Energy Retirement Savings Plan, including in a Spectra Energy Common Stock Fund. Deferrals of equity awards are credited with earnings and losses based on the performance of the Spectra Energy Common Stock Fund. Spectra Energy has established a grantor trust that is subject to the claims of its creditors into which funds related to the Spectra Energy Executive Savings Plan are deposited; an independent trustee manages these funds under guidelines provided by Spectra Energy.
Nonqualified Deferred Compensation | |||||||||||||||
Name | Executive Contributions in Last FY (a) | Company Contributions in Last FY (b) | Aggregate Earnings in Last FY | Aggregate Withdrawals/ Distribution | Aggregate Balance at Last FYE | ||||||||||
Gregory L. Ebel | $ | 399,189 | $ | 226,559 | $ | 351,858 | $ | — | $ | 3,480,604 | |||||
J. Patrick Reddy | 111,839 | 119,939 | 2,446,697 | — | 5,748,401 | ||||||||||
Reginald D. Hedgebeth | 68,496 | 70,596 | 105,234 | — | 975,527 | ||||||||||
__________
(a) | The table reflects contributions made to the Spectra Energy Executive Savings Plan. Executive contributions credited to the plan in 2016 include amounts reported as “Salary” in the Summary Compensation Table as well as “Non-Equity Incentive Plan Compensation” paid in 2016 but reported in the table as compensation earned in 2015. Amounts may also include elective deferrals of awards earned under our Long-Term Incentive Plan and payable in 2016. |
(b) | Reflects matching contribution credits made in 2016 under the plan with respect to elective salary deferrals made by executives during 2016. |
Potential Payments upon Termination of Employment or Change in Control
Under certain circumstances, each named executive officer would be entitled to compensation if the executive’s employment were to terminate. The amount of compensation is contingent upon a variety of factors, including the circumstances of the termination. The agreements and terms of awards affecting this type of compensation are described below, followed by a table that estimates the amount that would become payable to each named executive officer as a result of a change in control or a termination of employment, assuming a termination was effective as of December 31,
109
2016. The actual amounts that would be paid can be determined only at the time of the named executive officer’s termination of employment.
Effect of Termination on Long-Term Incentive Awards
The following table summarizes the consequences that would occur in the event of a change in control or the termination of employment of a named executive officer under Spectra Energy’s long-term incentive award agreements, without giving effect to the change in control agreements described below.
Event | Consequences |
Change in Control | Stock Options and Phantom Units - continue to vest. Performance Share Units - For awards granted in 2015, the award vests upon change in control and for awards granted in 2016, awards continue to vest. For both awards, at the time of change in control, goal achievement is determined based on actual TSR results for Spectra Energy and its Peer Group for a truncated performance period (i.e., the beginning of the performance period through the date of the change in control). |
Termination with cause | Stock Options, Phantom and Performance Share Units - executive’s right to unvested portion of award terminates immediately. |
Voluntary termination (not retirement eligible) | Stock Options, Phantom and Performance Share Units - executive’s right to unvested portion of award terminates immediately. |
Involuntary termination without cause (not retirement eligible) | Stock Options and Phantom Units - prorated portion of award vests. Performance Share Units - prorated portion of award vests based on actual performance after performance period ends. |
Voluntary termination or involuntary termination without cause (retirement eligible) | Stock Options and Phantom Units - prorated portion of award continues to vest. Performance Share Units - prorated portion of award vests based on actual performance after performance period ends. |
Involuntary termination without cause after a Change in Control | Stock Options and Phantom Units - award vests. Performance Share Units - award vests, with goal achievement determined based on actual TSR results for Spectra Energy and its Peer Group for a truncated performance period (i.e., the beginning of the performance period through the date of the change in control). |
Termination due to Death or Disability | Stock Options and Phantom Units - award vests. Performance Share Units - award vests based on target performance. |
Change in Control Agreements
Each named executive officer has entered into a change in control agreement with Spectra Energy. The agreements have an initial term of two years, and automatically extend for a year starting on the first anniversary of the date of the agreements. Spectra Energy or the named executive officers can terminate the agreements following the initial two-year term, after providing six months advance written notice.
The change in control agreements provide for payments and benefits to the executive in the event of termination of employment within two years after a “change in control” of Spectra Energy, other than termination: (1) by Spectra Energy for “cause;” (2) by reason of death or disability; or (3) of the executive for other than “good reason” (each such term as defined in the agreements).
For 2016, payments and benefits included:
• | a lump-sum cash payment equal to a pro-rata amount of the executive’s target cash incentive for the year in which the termination occurs; |
• | a lump-sum cash payment equal to three times for the Chief Executive Officer and two times for all other named executive officers the sum of the executive’s annual base salary and target annual cash incentive opportunity in effect immediately prior to termination or, if higher, in effect immediately prior to the first occurrence of an event or circumstance constituting “good reason”; |
• | continued medical, dental and basic life insurance coverage for a two-year period (which can also be provided through a third-party insurer); and |
110
• | a lump-sum cash payment representing the amount Spectra Energy would have allocated or contributed to the executive’s qualified and nonqualified defined-benefit pension plan and defined contribution savings plan accounts during the two years following the termination date, plus the unvested portion, if any, of the executive’s accounts as of the date of termination that would have vested during such two-year period. |
In addition, under certain circumstances, the agreements may provide for continued vesting of certain long-term incentive awards for two additional years.
Under the change in control agreements, each named executive officer also is entitled to $30,000 for outplacement services and reimbursement of up to $100,000 for the cost of certain legal fees incurred in connection with claims under the agreements. In the event that any of the payments or benefits provided for in the change in control agreement otherwise would constitute an “excess parachute payment” (as defined in Section 280G of the Internal Revenue Code), the amount of payments or benefits would be reduced to the maximum level that would not result in excise tax under Section 4999 of the Internal Revenue Code, if this reduction would cause the executive to receive a larger after-tax amount than if no reduction were made. In the event a named executive officer becomes entitled to payments and benefits under a change in control agreement, the executive would be subject to a one-year non-competition and non-solicitation provision from the date of termination, in addition to certain confidentiality and cooperation provisions.
111
Potential Payments Upon Termination of Employment or a Change in Control Table
The amounts listed in the following table have been estimated based on a variety of assumptions, and the actual amounts to be paid out can only be determined at the time of each named executive officer’s termination of employment. Amounts shown do not include compensation to which each named executive officer would be entitled without regard to termination of employment, including (a) base salary and short-term incentives that have been earned but not yet paid, and (b) amounts that have been earned, but not yet paid, under the terms of the plans listed under the “Pension Benefits” and “Nonqualified Deferred Compensation” tables.
With respect to a named executive officer who is covered by a change in control agreement, the amounts shown do not reflect any reduction in payments that might be made so that the excise tax under Section 4999 of the Internal Revenue Code would not apply.
Name and Triggering Event (a) | Cash Severance Payment (b) | Incremental Retirement Plan Benefit (c) | Welfare and Similar Benefits (d) | Stock Awards (e) | Option Awards | Total | ||||||||||||
Gregory L. Ebel | ||||||||||||||||||
Change in Control | $ | — | $ | — | $ | — | $ | 1,235,724 | $ | — | $ | 1,235,724 | ||||||
Voluntary termination or termination with cause | — | — | — | — | — | — | ||||||||||||
Involuntary termination without cause | — | — | — | 4,172,462 | 1,597,530 | 5,769,992 | ||||||||||||
Involuntary or good reason termination after a CIC | 7,137,900 | 820,975 | 45,521 | 14,863,152 | 5,228,280 | 28,095,828 | ||||||||||||
Death or Disability | — | — | — | 10,023,251 | 5,228,280 | 15,251,531 | ||||||||||||
J. Patrick Reddy | ||||||||||||||||||
Change in Control | $ | — | $ | — | $ | — | $ | 1,971,900 | $ | — | $ | 1,971,900 | ||||||
Termination with cause | — | — | — | — | — | — | ||||||||||||
Voluntary or involuntary termination without cause | — | — | — | 1,182,937 | 382,128 | 1,565,065 | ||||||||||||
Involuntary or good reason termination after a CIC | 2,240,000 | 380,836 | 36,586 | 5,773,315 | 1,250,600 | 9,681,337 | ||||||||||||
Death or Disability | — | — | — | 3,778,391 | 1,250,600 | 5,028,991 | ||||||||||||
Reginald D. Hedgebeth | ||||||||||||||||||
Change in Control | $ | — | $ | — | $ | — | $ | 1,463,588 | $ | — | $ | 1,463,588 | ||||||
Voluntary termination or termination with cause | — | — | — | — | — | — | ||||||||||||
Involuntary termination without cause | — | — | — | 1,381,289 | 284,027 | 1,665,316 | ||||||||||||
Involuntary or good reason termination after a CIC | 1,940,720 | 308,289 | 45,521 | 4,926,815 | 929,543 | 8,150,888 | ||||||||||||
Death or Disability | — | — | — | 3,340,100 | 929,543 | 4,269,643 | ||||||||||||
__________
(a) | Amounts in the table represent obligations of the Company under agreements currently in place, and valued as of December 31, 2016. |
(b) | Amounts payable under the terms of the named executive officer’s change in control agreement, not including accrued salary and cash incentive payments earned but not paid through December 31, 2016 (these amounts are reflected in the Summary Compensation Table, however). |
(c) | Pursuant to the named executive officers’ change in control agreements, this column represents the additional amounts that would be credited and vested in respect of the Spectra Energy Retirement Cash Balance Plan, Spectra Energy Executive Cash Balance Plan, Spectra Energy Retirement Savings Plan and the Spectra Energy Executive Savings Plan if the named executive officer continued to be employed by Spectra Energy for two additional years, at the rate of base salary plus target bonus percentage as in effect on December 31, 2016. |
(d) | Amounts include the amount that would be paid to each named executive officer who has entered into a change in control agreement in lieu of providing continued welfare benefits for 24 months. |
112
(e) | Amounts that would result from accelerated vesting of previously awarded stock and any associated dividend equivalent payments due upon vesting. |
The amounts shown above with respect to Spectra Energy’s outstanding stock awards were calculated based on a variety of assumptions, including the following: (a) the named executive officer terminated employment on the last day of 2016; (b) a stock price for our common stock equal to $41.09, which was the closing price on the last trading day of 2016; (c) the continuation of our dividend at the rate in effect on December 31, 2016; and (d) at actual performance through December 31, 2016 for awards granted in 2015 and 2016.
Current Equity Compensation Plan Information
The following table summarizes information about Spectra Energy Partners’ equity compensation plan as of December 31, 2016.
Plan Category | Number of securities to be issued upon exercise of outstanding options, warrants and rights | Weighted-average exercise price of outstanding options, warrants and rights | Number of securities remaining available under equity compensation plans (excluding securities reflected in column (a) | ||
Equity compensation plans approved by unitholders | — | n/a | — | ||
Equity compensation plans not approved by unitholders | — | n/a | 754,676 | ||
Total | — | n/a | 754,676 | ||
__________
(a)The long-term incentive plan currently permits the grant of awards covering an aggregate of 900,000 units.
113
DIRECTORS’ COMPENSATION
The following section provides information regarding payments to members of the board of directors of our general partner. Members of the board who are also employees of affiliates of our general partner do not receive additional compensation for serving on the board. The following is a description of the compensation program for non-employee directors of our general partner for 2016.
Director Compensation Program. Under the director compensation program approved by our general partner, each director receives an annual cash retainer of $70,000 and a grant of a number of common units equal to $80,000 divided by the closing price of our common units on the NYSE on the date of grant. Each Committee Chair also receives an annual cash retainer of $20,000.
Charitable Giving Program. Members of the board of our general partner are eligible to participate in the Spectra Energy Foundation Matching Gifts Program under which Spectra Energy will match contributions to qualifying institutions of up to $7,500 per director per calendar year. In 2016, the Spectra Energy Foundation made matching charitable contributions on behalf of Mr. Woodward of $5,000.
Expense Reimbursement. Non-employee directors are reimbursed for expenses reasonably incurred in connection with attendance and participation at Board and Committee meetings.
The following table describes the compensation earned during 2016 by each individual who served as an outside director during 2016.
DIRECTOR COMPENSATION
Name | Fees Earned or Paid in Cash ($) | Stock Awards ($)(1) | All Other Compensation ($)(2) | Total ($) | ||||
Nora Mead Brownell | 70,000 | 80,040 | — | 150,040 | ||||
Fred J. Fowler | 70,000 | 80,040 | — | 150,040 | ||||
J.D. Woodward, III | 110,000 | 80,040 | 5,000 | 195,040 | ||||
________
(1) | This column reflects the aggregate grant date fair value of the equity awarded computed in accordance with FASB ASC Topic 718. |
(2) | The value of all perquisites and other personal benefits or property received by each director in 2016 was less than $1,000 and are not included in the above table. |
Item 12. Security Ownership of Certain Beneficial Owners and Management and Related Unitholder Matters.
The following table sets forth the beneficial ownership of Spectra Energy Partners’ units as of January 31, 2017 and beneficial ownership of Spectra Energy's common stock as of January 31, 2017 held by:
• | all of the directors of the General Partner; |
• | each named executive officer of the General Partner; and |
• | all directors and officers of the General Partner as a group. |
114
Name of Beneficial Owner (1) | Common Units Beneficially Owned | Spectra Energy Shares Beneficially Owned | Percentage of Common Units or Common Stock Beneficially Owned | ||||||
Spectra Energy Corp (2) | 236,792,888 | — | 75.1 | % | |||||
Spectra Energy Transmission, LLC | 171,570,734 | — | 54.4 | % | |||||
Spectra Energy Southeast Supply Header | 8,701,329 | — | 2.8 | % | |||||
Spectra Energy Partners (DE) GP, LP | 56,520,825 | — | 17.9 | % | |||||
Dorothy M. Ables | 4,353 | 184,835 | * | ||||||
Julie A. Dill | 5,599 | 83,376 | * | ||||||
Gregory L. Ebel | 22,295 | 606,295 | * | ||||||
J. Patrick Reddy | — | 171,188 | * | ||||||
Fred J. Fowler | 37,393 | 178,868 | * | ||||||
Reginald D. Hedgebeth | — | 169,331 | * | ||||||
William T. Yardley | 540 | 105,231 | * | ||||||
Nora Mead Brownell | 25,276 | — | * | ||||||
J.D. Woodward, III | 44,999 | 17,500 | * | ||||||
All directors and executive officers as a group (ten persons) | 144,866 | 1,533,923 | * | ||||||
________
(*) | Less than 1% of units or common stock outstanding. |
(1) | Unless otherwise indicated, the address for all beneficial owners in this table is 5400 Westheimer Court, Houston, TX 77056. |
(2) | Spectra Energy is the ultimate parent company of each of Spectra Energy Transmission, LLC, Spectra Energy Southeast Supply Header and Spectra Energy Partners (DE) GP, LP and may, therefore, be deemed to beneficially own the units held by each of these entities. |
Item 13. Certain Relationships and Related Transactions, and Director Independence.
Spectra Energy and its affiliates own 230,489,862 common units as of December 31, 2016, representing an aggregate 75% limited partner interest in Spectra Energy Partners. In addition, the General Partner owns a 2% general partner interest in Spectra Energy Partners and all of the incentive distribution rights.
Distributions and Payments to The General Partner and its Affiliates
The following table summarizes the distributions and payments made or to be made by Spectra Energy Partners to the General Partner and its affiliates in connection with the ongoing operation and any liquidation of Spectra Energy Partners. These distributions and payments were determined by and among affiliated entities and, consequently, are not the result of arm’s-length negotiations.
Operational Stage
Distributions of Available Cash to the General Partner and its affiliates | Spectra Energy Partners generally makes cash distributions of 98% to its unitholders pro rata, including the General Partner and its affiliates, as the holders of an aggregate 230,489,862 common units, and 2% to the General Partner. In addition, if distributions exceed the minimum quarterly distribution and other higher target distribution levels, the General Partner will be entitled to increasing percentages of the distributions, up to 50% of the distributions above the highest target distribution level. There will be a reduction in the aggregate quarterly distributions, if any, to Spectra Energy, (as holder of incentive distribution rights), by $4 million per quarter for a period of 12 consecutive quarters commencing with the quarter ending on December 31, 2015 and ending with the quarter ending on September 30, 2018 as a result of the sale of our interests in Sand Hills and Southern Hills to Spectra Energy. |
115
Payments to the General Partner and its affiliates | Spectra Energy Partners reimburses Spectra Energy and its affiliates for the payment of certain operating expenses and for the provision of various general and administrative services for the benefit of Spectra Energy Partners. |
Withdrawal or removal of the General Partner | If the General Partner withdraws or is removed, its general partner interest and its incentive distribution rights will either be sold to the new general partner for cash or converted into common units, in each case for an amount equal to the fair market value of those interests. |
Liquidation Stage
Liquidation | Upon Spectra Energy Partners’ liquidation, the partners, including the General Partner, will be entitled to receive liquidating distributions according to their respective capital account balances. |
Omnibus Agreement
Spectra Energy Partners has entered into the Omnibus Agreement with Spectra Energy, its general partner and the general partner of its general partner. The Omnibus Agreement, addresses the following matters:
• | Spectra Energy Partners’ obligation to reimburse Spectra Energy for the payment of direct operating expenses it incurs on Spectra Energy Partners’ behalf in connection with Spectra Energy Partners’ business and operations; |
• | Spectra Energy Partners’ obligation to reimburse Spectra Energy for providing it allocated corporate, general and administrative services; and |
• | Spectra Energy’s obligation to indemnify Spectra Energy Partners for certain liabilities and Spectra Energy Partners’ obligation to indemnify Spectra Energy for certain liabilities. |
The General Partner and its affiliates also receive payments from Spectra Energy Partners pursuant to the contractual arrangements described below under the caption “Contracts with Affiliates.”
Any or all of the provisions of the Omnibus Agreement, other than the indemnification provisions described below, is terminable by Spectra Energy at its option if the General Partner is removed without cause and units held by the General Partner and its affiliates are not voted in favor of that removal. The Omnibus Agreement (other than the indemnification provisions) will also terminate in the event of a change of control of Spectra Energy Partners, its general partner or the general partner of its general partner.
Reimbursement of Operating and General and Administrative Expense
Under the Omnibus Agreement, Spectra Energy Partners reimburses Spectra Energy for the payment of certain operating expenses and for the provision of various corporate, general and administrative services for Spectra Energy Partners’ benefit.
Pursuant to these arrangements, Spectra Energy performs centralized corporate functions for Spectra Energy Partners, including legal, accounting, compliance, treasury, insurance, risk management, health, safety and environmental, human resources, credit, payroll, internal audit and tax. Spectra Energy Partners reimburses Spectra Energy for the expenses to provide these services as well as other expenses it incurs on Spectra Energy Partners’ behalf, such as salaries of personnel performing services for Spectra Energy Partners’ benefit and the cost of Spectra Energy employee benefits and general and administrative expenses associated with such personnel; capital expenditures; maintenance and repair costs; taxes; and direct expenses, including operating expenses and certain allocated operating expenses, associated with the ownership and operation of the contributed assets.
Competition
Neither Spectra Energy nor any of its affiliates is restricted, under either Spectra Energy Partners’ partnership agreement or the Omnibus Agreement, from competing with Spectra Energy Partners. Spectra Energy and any of its affiliates may acquire,
116
construct or dispose of additional transportation and storage or other assets in the future without any obligation to offer Spectra Energy Partners the opportunity to purchase or construct those assets.
Indemnification
Under the Omnibus Agreement, Spectra Energy Partners agreed to indemnify Spectra Energy against certain potential environmental and toxic tort claims, and certain losses and expenses associated with certain Spectra Energy Partners assets. Additionally, Spectra Energy Partners will indemnify Spectra Energy for all federal, state and local income tax liabilities attributable to the ownership or operations of certain assets, and losses associated with the operations of certain assets.
Disposition
On October 30, 2015, Spectra Energy acquired our 33.3% ownership interests in Sand Hills and Southern Hills. In consideration for this transaction, we retired 21,560,000 of our common units and 440,000 of our general partner units held by Spectra Energy, which will result in the reduction of any associated distribution payable to Spectra Energy, beginning in 2016. There will also be a reduction in the aggregate quarterly distributions, if any, to Spectra Energy, (as holder of incentive distribution rights), by $4 million per quarter for a period of 12 consecutive quarters commencing with the quarter ending on December 31, 2015 and ending with the quarter ending on September 30, 2018.
Storage and Transportation Related Arrangements
Spectra Energy Partners charges transportation and storage fees to Spectra Energy and its respective affiliates. Management anticipates continuing to provide these services to Spectra Energy and its respective affiliates in the ordinary course of business.
Board Leadership and Risk Oversight
The board of our General Partner is currently led by our Chairman, Mr. Ebel. In exercising its duties to our unitholders, our board members should not be conflicted in any way and we have procedures that are specified in our partnership agreement to address potential conflicts, which include referring transactions that present a conflict to our Conflicts Committee. We believe that this board leadership structure is appropriate in maximizing the effectiveness of our board oversight and in providing perspective to our business.
The board has responsibility for oversight of our risk management process and receives regular reports from our executives and from Spectra Energy regarding the risks faced in our business. The board exercises its risk oversight responsibilities through the Audit Committee, with respect to financial reporting and compliance risks. In addition, the Compensation Committee of Spectra Energy provides oversight with respect to risks that may be created by our compensation programs. Spectra Energy’s management has undertaken, and the Compensation Committee has reviewed, an evaluation of the incentives to its employees to take risk that are created by its compensation programs. Based upon that evaluation, Spectra Energy has concluded that its compensation programs do not create risks that are reasonably likely to result in a material adverse effect on the Company.
Director Independence
See Item 10. Directors, Executive Officers and Corporate Governance for information about the independence of the General Partner’s board of directors and its committees.
117
Item 14. Principal Accounting Fees and Services.
The following table presents fees for professional services rendered by Deloitte & Touche LLP, and the member firms of Deloitte Touche Tohmatsu and their respective affiliates (collectively, Deloitte) for us for 2016 and 2015:
Type of Fees | 2016 | 2015 | ||||||
(in millions) | ||||||||
Audit Fees (a) | $ | 4 | $ | 4 | ||||
Audit-Related Fees (b) | 1 | 1 | ||||||
Total Fees | $ | 5 | $ | 5 | ||||
________
(a) | Audit Fees are fees billed or expected to be billed by Deloitte for professional services for the audit of our Consolidated Financial Statements included in our annual report on Form 10-K and review of financial statements included in our quarterly reports on Form 10-Q, services that are normally provided by Deloitte in connection with statutory, regulatory or other filings or engagements or any other service performed by Deloitte to comply with generally accepted auditing standards. Audit Fees also includes fees billed or expected to be billed by Deloitte for professional services for the audit of our internal controls under the requirements of Section 404 of the Sarbanes-Oxley Act of 2002 and related regulations. |
(b) | Audit-Related Fees are fees billed by Deloitte for assurance and related services that are reasonably related to the performance of an audit or review of our financial statements, including assistance with acquisitions and divestitures and internal control reviews. Audit-Related Fees also include comfort and consent letters in connection with SEC filings and financing transactions. |
To safeguard the continued independence of the independent auditor, the Audit Committee adopted a policy that prevents our independent auditor from providing services to us that are prohibited under Section 10A(g) of the Exchange Act, as amended. This policy also provides that independent auditors are only permitted to provide services to us and our subsidiaries that have been pre-approved by the Audit Committee. Pursuant to the policy, all audit services require advance approval by the Audit Committee. All other services by the independent auditor that fall within certain designated dollar thresholds, both per engagement as well as annual aggregate, have been pre-approved under the policy. Different dollar thresholds apply to the three categories of pre-approved services specified in the policy (Audit-Related services, Tax services and Other services). All services that exceed the dollar thresholds must be approved in advance by the Audit Committee. Pursuant to applicable provisions of the Exchange Act, as amended, the Audit Committee has delegated approval authority to the Chairman of the Audit Committee. The Chairman has presented all approval decisions to the full Audit Committee. All engagements performed by the independent auditor since July 2, 2007 were approved by the Audit Committee pursuant to its pre-approval policy.
118
PART IV
Item 15. Exhibits, Financial Statement Schedules.
(a) Consolidated Financial Statements, Supplemental Financial Data and Supplemental Schedules included in Part II of this annual report are as follows:
Spectra Energy Partners, LP:
Report of Independent Registered Public Accounting Firm
Consolidated Statements of Operations
Consolidated Statements of Comprehensive Income
Consolidated Balance Sheets
Consolidated Statements of Cash Flows
Consolidated Statements of Equity
Notes to Consolidated Financial Statements
All schedules are omitted because they are not required or because the required information is included in the Consolidated Financial Statements or Notes.
(b) Exhibits — See Exhibit Index at the end of this Annual Report on Form 10-K.
119
SIGNATURES
Pursuant to the requirements of Section 13 or 15(d) of the Securities Exchange Act of 1934, the registrant has duly caused this report to be signed on its behalf by the undersigned, thereunto duly authorized.
SPECTRA ENERGY PARTNERS, LP | ||||
By: | Spectra Energy Partners (DE) GP, LP, its general partner | |||
By: | Spectra Energy Partners GP, LLC, its general partner | |||
Date: February 24, 2017 | /s/ GREGORY L. EBEL | |||
Gregory L. Ebel President and Chief Executive Officer Spectra Energy Partners GP, LLC | ||||
Date: February 24, 2017 | /s/ J. PATRICK REDDY | |||
J. Patrick Reddy Chief Financial Officer Spectra Energy Partners GP, LLC | ||||
Pursuant to the requirements of the Securities Exchange Act of 1934, this report has been signed below by the following persons on behalf of the registrant and in the capacities and on the date indicated.
Gregory L. Ebel*
President, Chief Executive Officer and Chairman (Principal Executive Officer and Director)
J. Patrick Reddy*
Chief Financial Officer (Principal Financial Officer and Principal Accounting Officer)
Dorothy M. Ables*
Director
Fred J. Fowler*
Director
Nora Mead Brownell*
Director
William T. Yardley*
Director
Julie A. Dill*
Director
J.D. Woodward, III*
Director
Date: February 24, 2017
J. Patrick Reddy, by signing his name hereto, does hereby sign this document on behalf of the registrant and on behalf of each of the above-named persons previously indicated by asterisk pursuant to a power of attorney duly executed by the registrant and such persons, filed with the Securities and Exchange Commission as an exhibit hereto.
By: | /s/ J. PATRICK REDDY | |
J. Patrick Reddy | ||
Attorney-In-Fact | ||
120
Exhibit Index
Exhibit No. | Exhibit Description | |
2.1 | Asset Purchase Agreement, dated December 13, 2007, between Spectra Energy Virginia Pipeline Company and East Tennessee Natural Gas, LLC (filed as Exhibit 10.2 to Spectra Energy Partners, LP’s Form 8-K dated December 14, 2007). | |
2.2 | Securities Purchase Agreement, dated as of April 7, 2009, among Spectra Energy Partners OLP, LP, Atlas Pipeline Mid-Continent LLC, Atlas Pipeline Partners, L.P, solely as guarantor of Atlas Pipeline Mid-Continent LLC, and Spectra Energy Partners, L.P., solely as guarantor of Spectra Energy Partners OLP, LP (filed as Exhibit 10.1 to Spectra Energy Partners, LP’s Form 8-K dated April 8, 2009). | |
2.3 | Contribution Agreement, dated November 30, 2010, by and among Spectra Energy Partners, LP, Spectra Energy Partners (DE) GP, LP and Spectra Energy Southeast Pipeline Corporation (filed as Exhibit No. 2.1 to Spectra Energy Partners, LP’s Form 8-K dated November 30, 2010). | |
2.4 | Purchase and Sale Agreement dated as of May 11, 2011, by and among Equitrans, L.P. and, solely for the purpose of Sections 1.8, 1.9, 4.17 and 9.15, EQT Corporation, Spectra Energy Partners, LP and, solely for the purpose of Section 9.16, Spectra Energy Capital, LLC (Filed as Exhibit No. 2.1 to Spectra Energy Partners, LP’s Form 8-K dated May 11, 2011). | |
2.5 | First Amendment to Purchase and Sale Agreement, dated as of June 30, 2011, by and among Equitrans, L.P. and, solely for the purpose of Sections 1.8, 1.9, 4.17 and 9.15, EQT Corporation, Spectra Energy Partners, LP and, solely for the purpose of Section 9.16, Spectra Energy Capital, LLC (Filed as Exhibit No. 2.1 to Spectra Energy Partners, LP’s Form 8-K dated July 1, 2011). | |
2.6 | Contribution Agreement, dated October 23, 2012, by and between Spectra Energy Partners, LP and Spectra Energy Partners (DE) GP, LP. (filed as Exhibit 2.1 to Spectra Energy Partners, LP’s Form 8-K dated October 23, 2012). | |
2.7 | Contribution Agreement, dated as of May 2, 2013, by and between Spectra Energy Partners, LP and Spectra Energy Partners (DE) GP, LP (filed as Exhibit 2.1 to Spectra Energy Partners, LP’s Form 8-K dated May 3, 2013). | |
2.8 | First Amendment to Contribution Agreement, dated August 1, 2013, by and between Spectra Energy Partners, LP and Spectra Energy Partners (DE) GP, LP (filed as Exhibit 2.1 to Spectra Energy Partners, LP’s Form 8-K dated August 2, 2013). | |
2.9 | Securities Purchase Agreement, dated May 2, 2013, by and among Spectra Energy Partners, LP, Spectra Energy Express Pipeline (Canada), Inc. and Spectra Energy Capital Funding, Inc. (filed as Exhibit 2.2 to Spectra Energy Partners, LP’s Form 8-K dated May 3, 2013). | |
2.10 | First Amendment to Securities Purchase Agreement, dated as of August 1, 2013, by and among Spectra Energy Partners, LP, Spectra Energy Express Pipeline (Canada), Inc. and Spectra Energy Capital Funding, Inc. (filed as Exhibit 2.4 to Spectra Energy Partners, LP’s Form 10-Q dated August 7, 2013). | |
2.11 | Contribution Agreement by and between Spectra Energy Corp and Spectra Energy Partners, LP, dated as of August 5, 2013 (filed as Exhibit 2.1 to Spectra Energy Partners, LP’s Form 8-K dated August 6, 2013). | |
2.12 | First Amendment to Contribution Agreement by and between Spectra Energy Corp and Spectra Energy Partners, LP, dated as of October 31, 2013 (filed as Exhibit 2.1 to Spectra Energy Partners, LP’s Form 8-K dated November 1, 2013). | |
2.13 | Exchange and Redemption Agreement between Spectra Energy Partners, LP and Spectra Energy Corp, dated as of October 18, 2015 (filed as Exhibit 2.1 to Spectra Energy Partners, LP's Form 8-K dated October 19, 2015). | |
3.1 | Certificate of Limited Partnership of Spectra Energy Partners, LP (filed as Exhibit 3.1 to Spectra Energy Partner, LP’s Form S-1 on March 30, 2007, file no. 333-141687). | |
*3.2 | Third Amended and Restated Agreement of Limited Partnership of Spectra Energy Partners (DE) GP, LP, dated as of January 4, 2017. | |
3.3 | Certificate of Limited Partnership of Spectra Energy Partners (DE) GP, LP (filed as Exhibit 3.3 to Spectra Energy Partner, LP’s Form S-1 on March 30, 2007, file no. 333-141687). | |
3.4 | Certificate of Formation of Spectra Energy Partners GP, LLC (filed as Exhibit 3.5 to Spectra Energy Partner, LP’s Form S-1 on March 30, 2007, file no. 333-141687). | |
121
Exhibit No. | Exhibit Description | |
3.5 | Second Amended and Restated Agreement of Limited Partnership of Spectra Energy Partners, LP, as amended as of October 30, 2015. | |
3.6 | Fifth Amended and Restated Limited Liability Company Agreement of Spectra Energy Partners GP, LLC, dated as of December 31, 2015. | |
4.1 | Indenture, dated as of June 9, 2011, between Spectra Energy Partners, LP, as Issuer and Wells Fargo Bank, National Association, as Trustee (Filed as Exhibit No. 4.1 to Spectra Energy Partners, LP’s Form 8-K dated June 9, 2011). | |
4.2 | First Supplemental Indenture, dated as of June 9, 2011, between Spectra Energy Partners, LP, as Issuer and Wells Fargo Bank, National Association, as Trustee (Filed as Exhibit No. 4.2 to Spectra Energy Partners, LP’s Form 8-K dated June 9, 2011). | |
4.3 | Second Supplemental Indenture, dated September 25, 2013, between Spectra Energy Partners, LP, as Issuer and Wells Fargo Bank, National Association, as Trustee (filed as Exhibit 4.2 to Spectra Energy Partners, LP’s Form 8-K dated September 25, 2013). | |
4.4 | Third Supplemental Indenture, dated June 30, 2014, between Spectra Energy Partners, LP, as Issuer and Wells Fargo Bank, National Association, as Trustee (filed as Exhibit No. 4.1 to Spectra Energy Partners, LP's Form 10-Q dated August 7, 2014). | |
4.5 | Fourth Supplemental Indenture, dated March 12, 2015, between Spectra Energy Partners, LP, as Issuer and Wells Fargo Bank, National Association, as Trustee (filed as Exhibit 4.3 to Spectra Energy Partners, LP's Form 8-K dated March 12, 2015). | |
4.6 | Fifth Supplemental Indenture, dated as of October 17, 2016, between Spectra Energy Partners, LP, as Issuer and Wells Fargo Bank, National Association, as Trustee (filed as Exhibit 4.4 to Spectra Energy Partners, LP's Form 8-K dated October 17, 2016). | |
4.7 | Form of 2.95% Senior Notes due 2016 (Included in Exhibit 4.2 to Spectra Energy Partners, LP’s Form 8-K dated June 9, 2011). | |
4.8 | Form of 4.60% Senior Notes due 2021 (Included in Exhibit 4.2 to Spectra Energy Partners, LP’s Form 8-K dated June 9, 2011). | |
4.9 | Form of 2.950% Senior Notes due 2018 (filed in Exhibit 4.3 to Spectra Energy Partners, LP’s Form 8-K dated September 25, 2013). | |
4.10 | Form of 4.750% Senior Notes due 2024 (filed in Exhibit 4.4 to Spectra Energy Partners, LP’s Form 8-K dated September 25, 2013). | |
4.11 | Form of 5.950% Senior Notes due 2043 (filed in Exhibit 4.5 to Spectra Energy Partners, LP’s Form 8-K dated September 25, 2013). | |
4.12 | Form of 3.50% Senior Notes due 2025 (included in Exhibit 4.3 to Spectra Energy Partners, LP’s Form 8-K dated March 12, 2015). | |
4.13 | Form of 4.50% Senior Notes due 2045 (included in Exhibit 4.3 to Spectra Energy Partners, LP’s Form 8-K dated March 12, 2015). | |
4.14 | Form of 3.375% Senior Notes due 2026 (included in Exhibit 4.4 to Spectra Energy Partners, LP's Form 8-K dated October 17, 2016). | |
4.15 | Form of 4.50% Senior Notes due 2045 (filed in Exhibit 4.5 to Spectra Energy Partners, LP’s Form 8-K dated March 12, 2015). | |
10.1 | Contribution, Conveyance and Assumption Agreement, dated July 2, 2007, by and among Spectra Energy Partners, LP, Spectra Energy Partners OLP, LP, Spectra Energy Partners GP, LLC, Spectra Energy Partners OLP GP, LLC, Spectra Energy Partners (DE) GP, LP, Spectra Energy Transmission, LLC, Spectra Energy Southeast Pipeline Corporation, East Tennessee Natural Gas, LLC, Egan Hub Storage, LLC, Moss Bluff Hub, LLC and Market Hub Partners Holding, LLC (filed as Exhibit 10.1 to Spectra Energy Partners, LP’s Form 8-K dated July 9, 2007). | |
10.2 | Omnibus Agreement, dated July 2, 2007, by and among Spectra Energy Partners, LP, Spectra Energy Partners (DE) GP, LP, Spectra Energy Partners GP, LLC and Spectra Energy Corp (filed as Exhibit 10.2 to Spectra Energy Partners, LP’s Form 8-K dated July 9, 2007). | |
+10.3 | Long Term Incentive Plan of Spectra Energy Partners, LP (filed as Exhibit 10.3 to Spectra Energy Partners, LP’s Form 8-K dated July 9, 2007). | |
122
Exhibit No. | Exhibit Description | |
+10.4 | Form of Phantom Unit Award Agreement under the Spectra Energy Partners, LP Long-Term Incentive Plan (filed as Exhibit 4.3 to Spectra Energy Partners, LP’s Form S-8 on July 2, 2007). | |
10.5 | General Partnership Agreement of Market Hub Partners Holding (filed as Exhibit 10.4 to Spectra Energy Partners, LP’s Form 8-K dated July 9, 2007). | |
10.6 | Contribution Agreement, dated December 13, 2007, by and among Spectra Energy Transmission, LLC, Spectra Energy Partners (DE) GP, LP and Spectra Energy Partners, LP (filed as Exhibit 10.8 to Spectra Energy Partners, LP’s 10-K/A on May 14, 2009). | |
10.7 | Gulfstream Natural Gas System, L.L.C. Indenture dated October 26, 2005 relating to $500,000,000 of its 5.56% Senior Notes due 2015 and $350,000,000 of its 6.19% Senior Notes due 2025 (filed as Exhibit 10.4 to Spectra Energy Partners, LP’s Form S-1/A on June 13, 2007, file no. 333-141687). | |
10.8 | Second Amended and Restated Limited Liability Company Agreement of Gulfstream Natural Gas System, L.L.C. (filed as Exhibit 10.6 to Spectra Energy Partners, LP’s Form S-1/A on June 4, 2007, file no. 333-141687). | |
10.9 | East Tennessee Natural Gas, LLC Note Purchase Agreement dated December 15, 2002 relating to $150,000,000 of its 5.71% Senior Notes due 2012 (filed as Exhibit 10.11 to Spectra Energy Partners, LP’s Form 10-K/A on May 14, 2009). | |
10.10 | Amendment No. 1, dated as of April 4, 2008, to the Omnibus Agreement entered into and effective as of July 2, 2007 (filed as Exhibit 10.12 to Spectra Energy Partners, LP’s Form 10-K on February 28, 2011). | |
10.11 | Amendment No. 1, dated as of June 1, 2010, to the Omnibus Agreement entered into and effective as of July 2, 2007 (filed as Exhibit No. 10.1 to Spectra Energy Partners, LP’s Form 8-K dated June 4, 2010). | |
10.12 | Amendment to Limited Liability Company Agreement of Gulfstream Natural Gas System, L.L.C., dated as of March 22, 2010 (filed as Exhibit No. 10.14 to Spectra Energy Partners, LP’s Form 10-K on February 28, 2011). | |
10.13 | Credit Agreement, dated as of October 18, 2011, among Spectra Energy Partners, LP, the Initial Lenders and Issuing Banks named therein, and Citibank, N.A., as Administrative Agent (filed as Exhibit No. 10.1 to Form 8-K of Spectra Energy Partners, LP on October 20, 2011). | |
10.14 | Second Amendment to Limited Liability Company Agreement of Gulfstream Natural Gas System, L.L.C., dated as of September 9, 2011 (filed as Exhibit No. 10.2 to Spectra Energy Partners, LP’s Form 10-Q on November 8, 2011). | |
10.15 | Amended and Restated Omnibus Agreement, dated November 1, 2013, by and among Spectra Energy Partners, LP, Spectra Energy Partners (DE) GP, LP, Spectra Energy Partners GP, LLC and Spectra Energy Corp (filed as Exhibit 10.1 to Spectra Energy Partners, LP’s Form 8-K dated November 1, 2013). | |
10.16 | Amended and Restated Credit Agreement, dated as of November 1, 2013, by and among Spectra Energy Partners, LP, as Borrower, Citibank, N.A., as Administrative Agent, and the lenders party thereto (filed as Exhibit 10.2 to Spectra Energy Partners, LP’s Form 8-K dated November 1, 2013). | |
10.17 | Credit Agreement, dated as of November 1, 2013, by and among Spectra Energy Partners, LP, as Borrower, The Bank of Tokyo-Mitsubishi UFJ, LTD, as Administrative Agent, and the lenders party thereto (filed as Exhibit 10.3 to Spectra Energy Partners, LP’s Form 8-K dated November 1, 2013). | |
10.18 | Equity Distribution Agreement dated as of March 25, 2015, among Spectra Energy Partners, LP, Spectra Energy Partners (DE) GP, LP, Spectra Energy Partners GP, LLC, Citigroup Global Markets Inc., Credit Suisse Securities (USA) LLC, Deutsche Bank Securities Inc., J.P. Morgan Securities LLC, Mitsubishi UFJ Securities (USA), Inc., SunTrust Robinson Humphrey, Inc., UBS Securities LLC and Wells Fargo Securities, LLC (filed as Exhibit 1.1 to Spectra Energy Partners, LP's Form 8-K dated March 25, 2015). | |
10.19 | Amendment No. 1 dated December 11, 2014 to Amended and Restated Credit Agreement, dated November 1, 2013, by and among Spectra Energy partners, LP, as Borrower, Citibank, N.A., as Administrative Agent, and the lenders party thereto (filed as Exhibit No. 10.1 to Spectra Energy Partners, LP's Form 8-K dated December 16, 2014). | |
10.20 | Amendment No. 2 to Amended and Restated Credit Agreement and Commitment Increase Agreement dated as of April 29, 2016 by and among Spectra Energy Partners, LP, as Borrower, Citibank, N.A., as Administrative Agent, and the lenders party thereto (filed as Exhibit No. 10.1 to Spectra Energy Partners, LP ‘s Form 8-K on May 2, 2016). | |
10.21 | Third Amendment to Second Amended and Restated Limited Liability Company Agreement of Gulfstream Natural Gas System, L.L.C. (filed as Exhibit No. 10.1 to Spectra Energy Partners, LP’s Form 10-Q on May 5, 2016). | |
123
Exhibit No. | Exhibit Description | |
*12.1 | Computation of Ratio of Earnings to Fixed Charges. | |
*21.1 | Subsidiaries of the Registrant. | |
*23.1 | Consent of Deloitte & Touche LLP related to Spectra Energy Partners, LP. | |
*24.1 | Power of Attorney. | |
*31.1 | Certification Pursuant to Section 302 of the Sarbanes-Oxley Act of 2002. | |
*31.2 | Certification Pursuant to Section 302 of the Sarbanes-Oxley Act of 2002. | |
*32.1 | Certification Pursuant to 18 U.S.C. Section 1350, as Adopted Pursuant to Section 906 of the Sarbanes-Oxley Act of 2002. | |
*32.2 | Certification Pursuant to 18 U.S.C. Section 1350, as Adopted Pursuant to Section 906 of the Sarbanes-Oxley Act of 2002. | |
*101.INS | XBRL Instance Document. | |
*101.SCH | XBRL Taxonomy Extension Schema. | |
*101.CAL | XBRL Taxonomy Extension Calculation Linkbase. | |
*101.DEF | XBRL Taxonomy Extension Definition Linkbase. | |
*101.LAB | XBRL Taxonomy Extension Label Linkbase. | |
*101.PRE | XBRL Taxonomy Extension Presentation Linkbase. | |
* | Filed herewith. |
+ | Denotes management contract or compensatory plan or arrangement. |
The total amount of securities of the registrant or its subsidiaries authorized under any instrument with respect to long-term debt not filed as an exhibit does not exceed 10% of the total assets of the registrant and its subsidiaries on a consolidated
basis. The registrant agrees, upon request of the Securities and Exchange Commission, to furnish copies of any or all of such
instruments to it.
124