Attached files
| file | filename |
|---|---|
| EX-31.2 - EXHIBIT 31.2 - SP Plus Corp | sp12312016ex312.htm |
| EX-10.10.3 - EXHIBIT 10.10.3 - SP Plus Corp | sp12312016ex10103.htm |
| EX-31.3 - EXHIBIT 31.3 - SP Plus Corp | sp12312016ex313.htm |
| EX-31.1 - EXHIBIT 31.1 - SP Plus Corp | sp12312016ex311.htm |
| EX-32 - EXHIBIT 32 - SP Plus Corp | sp12312016ex32.htm |
| EX-23 - EXHIBIT 23 - SP Plus Corp | sp12312016ex23.htm |
| EX-21 - EXHIBIT 21 - SP Plus Corp | sp12312016ex21.htm |
| EX-10.12.1 - EXHIBIT 10.12.1 - SP Plus Corp | sp12312016ex10121.htm |
| EX-10.6.6 - EXHIBIT 10.6.6 - SP Plus Corp | sp12312016ex1066.htm |
UNITED STATES
SECURITIES AND EXCHANGE COMMISSION
Washington, D.C. 20549
____________________________________________________________________________
FORM 10-K
ý | ANNUAL REPORT PURSUANT TO SECTION 13 OR 15(d) OF THE SECURITIES EXCHANGE ACT OF 1934 | |
For the fiscal year ended December 31, 2016 | ||
Or | ||
o | TRANSITION REPORT PURSUANT TO SECTION 13 OR 15(d) OF THE SECURITIES EXCHANGE ACT OF 1934 | |
For the transition period from to | ||
Commission file number: 000-50796
____________________________________________________________________________

SP PLUS CORPORATION
(Exact Name of Registrant as Specified in Its Charter)
Delaware (State or Other Jurisdiction of Incorporation or Organization) | 16-1171179 (I.R.S. Employer Identification No.) | |
200 E. Randolph Street, Suite 7700
Chicago, Illinois 60601-7702
(Address of Principal Executive Offices, Including Zip Code)
(312) 274-2000
(Registrant's Telephone Number, Including Area Code)
Securities registered pursuant to Section 12(b) of the Act:
COMMON STOCK, PAR VALUE $0.001 PER SHARE
(Title of Each Class)
The NASDAQ Stock Market LLC
(Name of Each Exchange on which Registered)
Securities registered pursuant to Section 12(g) of the Act: NONE
____________________________________________________________________________
Indicate by check mark if the registrant is a well-known seasoned issuer, as defined in Rule 405 of the Securities Act. Yes o No ý
Indicate by check mark if the registrant is not required to file reports pursuant to Section 13 or Section 15(d) of the Act. Yes o No ý
Indicate by check mark whether the registrant: (1) has filed all reports required to be filed by Section 13 or 15(d) of the Securities Exchange Act of 1934 during the preceding 12 months (or for such shorter periods that the registrant was required to file such reports), and (2) has been subject to such filing requirements for the past 90 days. Yes ý No o
Indicate by check mark whether the registrant has submitted electronically and posted on its corporate Web site, if any, every Interactive Data File required to be submitted and posted pursuant to Rule 405 of Regulation S-T (§ 232.405 of this chapter) during the preceding 12 months (or for such shorter period that the registrant was required to submit and post such files). Yes ý No o
Indicate by check mark if disclosure of delinquent filers pursuant to Item 405 of Regulation S-K is not contained herein, and will not be contained, to the best of registrant's knowledge, in definitive proxy or information statements incorporated by reference in Part III of this Form 10-K or any amendment to this Form 10-K. o
Indicate by check mark whether the registrant is a large accelerated filer, an accelerated filer, a non-accelerated filer, or a smaller reporting company. See the definitions of "large accelerated filer," "accelerated filer" and "smaller reporting company" in Rule 12b-2 of the Exchange Act. (Check one):
Large accelerated filer o | Accelerated filer ý | Non-accelerated filer o (Do not check if a smaller reporting company) | Smaller reporting company o | |||
Indicate by check mark whether the registrant is a shell company (as defined in Rule 12b-2 of the Act). Yes o No ý
As of June 30, 2016, the aggregate market value of the voting and non-voting common stock held by nonaffiliates of the registrant was approximately $504.8 million. Solely for purposes of this disclosure, shares of common stock held by executive officers and directors of the registrant as of such date have been excluded because such persons may be deemed to be affiliates. This determination of executive officers and directors as affiliates is not necessarily a conclusive determination for any other purposes.
As of February 22, 2017, there were 22,356,586 shares of common stock of the registrant outstanding.
____________________________________________________________________________
DOCUMENTS INCORPORATED BY REFERENCE
Portions of the registrant's definitive proxy statement to be delivered to stockholders in connection with the Annual Meeting of Stockholders to be held on May 9, 2017 are incorporated by reference into Part III of this Form 10-K.
SP PLUS CORPORATION
TABLE OF CONTENTS
1
The Business section and other parts of this Annual Report on Form 10-K ("Form 10-K") contain forward-looking statements, within the meaning of the Private Securities Litigation Reform Act of 1995 that involve risks and uncertainties. Many of the forward-looking statements are located in "Management's Discussion and Analysis of Financial Condition and Results of Operations." Forward-looking statements provide current expectations of future events based on certain assumptions and include any statement that does not directly relate to any historical or current fact. Forward-looking statements can also be identified by words such as "future," "anticipates," "believes," "estimates," "expects," "intends," "plans," "predicts," "will," "would," "could," "can," "may," and similar terms. Forward-looking statements are not guarantees of future performance and the Company's actual results may differ significantly from the results discussed in the forward-looking statements. Factors that might cause such differences include, but are not limited to, those discussed in Part I, Item 1A. of this Form 10-K under the heading "Risk Factors," which are incorporated herein by reference. Each of the terms the "Company" and "SP Plus" as used herein refers collectively to SP Plus Corporation and its wholly owned subsidiaries, unless otherwise stated. The Company assumes no obligation to revise or update any forward-looking statements for any reason, except as required by law.
PART I
Item 1. Business
Our Company
We are one of the leading providers of parking management, ground transportation and other ancillary services to commercial, institutional and municipal clients in urban markets and airports across the United States, Puerto Rico and Canada. Our services include a comprehensive set of on-site parking management and ground transportation services, which include facility maintenance, event logistics services, training, scheduling and supervising all service personnel as well as providing customer service, marketing, and accounting and revenue control functions necessary to facilitate the operation of our clients' facilities or events. We also provide a range of ancillary services such as airport and municipal shuttle operations, valet services, taxi and livery dispatch services, security services and municipal meter revenue collection and enforcement services.
Acquisitions, Investment in Joint Venture and Sale of Business
In October 2012, we completed our acquisition (the "Central Merger") of Central Parking Corporation ("Central") for 6,161,332 shares of our common stock and the assumption of $217.7 million of Central's debt, net of cash acquired. Our consolidated results of operations for the twelve months ended December 31, 2016, 2015, 2014 and 2013 include Central's results of operations for the entire year and our consolidated results of operations for the year ended December 31, 2012 include Central's results of operations for the period October 2, 2012 through December 31, 2012.
In October 2014, we entered into an agreement to establish a joint venture with Parkmobile USA, Inc. ("Parkmobile USA") and contributed all of the assets and liabilities of our proprietary Click and Park® parking prepayment business in exchange for a 30 percent interest in the newly formed legal entity called Parkmobile, LLC ("Parkmobile"). Parkmobile is a leading provider of on-demand and prepaid transaction processing for on- and off-street parking and transportation services. The Parkmobile joint venture combines two parking transaction engines, with SP Plus contributing the Click and Park® parking prepayment systems, which enables consumers to reserve and pay for parking online in advance and Parkmobile USA contributing its on demand transaction engine that allows consumers to transact real-time payment for parking privileges in both on- and off-street environments. We account for our investment in the joint venture with Parkmobile under the equity method of accounting.
In August 2015, we signed an agreement to sell and subsequently sold portions of our security business primarily operating in the Southern California market to a third-party for a gross sales price of $1.8 million, which resulted in a gain on sale of business of $0.5 million, net of legal and other expenses. The pretax profit for the operations of the security business was not significant to the periods presented herein.
Our Operations
Our history and resulting experience have allowed us to develop and standardize a rigorous system of processes and controls that enable us to deliver consistent, transparent, value-added and high-quality parking facility management services. We serve a variety of industries and have industry vertical specific specialization in airports, healthcare facilities, hotels, municipalities and government facilities, commercial real estate, residential communities, retail operations, and colleges and universities.
We operate our clients' facilities through two primary types of arrangements: management contracts and leases.
• | Under a management contract, we typically receive a base monthly fee for managing the facility, and we may also receive an incentive fee based on the achievement of facility performance objectives. We also receive fees for ancillary services. Typically, all of the underlying revenue and expenses under a standard management contract flow through to our client rather than to us. |
• | Under a lease, we generally pay to the property owner either a fixed annual rent, a percentage of gross customer collections, or a combination of both. Under a lease, we collect all revenue and are responsible for most operating expenses, but typically are not responsible for major maintenance, capital expenditures or real estate taxes. |
2
As of December 31, 2016, we operated approximately 81% of our locations under management contracts, and approximately 19% of our locations under leases. We held a partial ownership interest in two parking facilities (one leased and one managed) as of December 31, 2016 and three parking facilities (two leased and one managed) as of December 31, 2015.
Our revenue is derived from a broad and diverse group of clients, industry vertical markets and geographies. Our clients include some of North America's largest private and public owners, municipalities, managers and developers of major office buildings, residential properties, commercial properties, shopping centers and other retail properties, sports and special event complexes, hotels, and healthcare facilities. No single client accounted for more than 9% of our revenue, net of reimbursed management contract revenue, or more than 3% of our gross profit for the year ended December 31, 2016. Additionally, we have built a diverse geographic footprint that as of December 31, 2016 included operations in 45 states, the District of Columbia and Puerto Rico, and municipalities, including New York, Los Angeles, Chicago, Boston, Washington D.C. and Houston, among others, and three Canadian provinces. Our strategy is focused on building scale and leadership positions in large, strategic markets in order to leverage the advantages of scale across a larger number of parking locations in a single market.
While a large share of our operating arrangements are fixed-fee management contracts, we continue to grow our lease and management contract businesses. Generally, management contracts provide us with insulation from economic cycles and enhance our earnings visibility because our management contract revenue does not fluctuate materially in relation to variations in parking volumes; our lease contracts may experience variability, as revenues typically increase in periods of improving macroeconomic conditions through increased parking volumes and typically decrease during periods of deteriorating macroeconomic conditions through reduced parking volumes.
Our ability to innovate operations by integrating and incorporating appropriate technologies into our service lines allows us to further strengthen our relationships with clients, improve cost efficiency, enhance customer service and introduce new customer facing services. We also innovate through application of our in-house interactive marketing expertise and digital advertising to increase parking demand, development of electronic payment tools to increase customer convenience and streamline revenue processes, the use of advanced video and intercom services to enhance customer service to parking patrons 24-hours-a-day, the creation of our remote management services technology and operating center that enables us to remotely monitor facilities and parking operations, the use of our License Plate Recognition (LPR) system and video analytics for car counting, on-street enforcement and enhanced security and our proprietary MPM Plus® monthly parker management and billing system provides comprehensive and reliable billing of the parking-related provisions of multi-year commercial tenant leases.
We continue to be the market leader in the implementation of remote parking management services using technology that enables us to monitor parking operations from a remote, off-site location and provide 24-hour-a-day customer assistance. In addition, we provide subject matter expertise and other consulting services related to revenue control equipment. We also utilize mobile payment technology, including mobile payment apps, providing our customers with flexibility to meet their parking needs. Finally, we continue to utilize and provide leading on-demand and prepaid transaction processing technology for on- and off-street parking and transportation services.
As of December 31, 2016, we managed 3,686 parking facility locations containing approximately 2.0 million parking spaces in 357 cities, operated 78 parking-related service centers serving 73 airports, operated a fleet of approximately 700 shuttle buses carrying approximately 42.3 million passengers per year, operated 652 valet locations and employed a professional staff of approximately 22,500 people.
Services
As a professional parking management company, we provide a comprehensive, turn-key package of parking services to our clients. Under a typical management contract structure, we are responsible for providing and supervising all personnel necessary to facilitate daily parking operations including cashiers, porters, valet attendants, managers, bookkeepers, and a variety of maintenance, marketing, customer service, and accounting and revenue control functions.
Beyond the conventional parking facility management services described above, we also offer an expanded range of ground transportation and ancillary services. For example:
• | We provide shuttle bus vehicles and the drivers to operate, for example; through on-airport car rental operations as well as private off-airport parking locations. |
• | We provide ground transportation services, such as taxi and livery dispatch services, as well as concierge-type ground transportation information and support services for arriving passengers |
• | We provide on-street parking meter collection and other forms of parking enforcement services. |
• | We provide remote parking management services using technology that enables us to monitor parking operations from a remote, off-site location and provide 24-hour-a-day customer assistance (including remedying equipment malfunctions). |
• | We provide innovative and environmentally compliant facility maintenance services, including power sweeping and washing, painting and general repairs, as well as cleaning and seasonal services. |
• | We provide comprehensive security services including the training and hiring of security officers and patrol, as well as customized services and technology that are efficient and appropriate for the property involved. |
3
• | We provide multi-platform marketing services including SP+ branded websites which offer clients a unique platform for marketing their facilities, mobile apps, search marketing, email marketing and social media campaigns. |
Industry Overview
Overview
The parking industry is large and fragmented and includes companies that provide temporary parking spaces for vehicles on an hourly, daily, weekly, or monthly basis along with providing various ancillary services. A substantial number of companies in the industry offer parking services as a non-core operation in connection with property management or ownership, and the vast majority of companies in the industry are small, private and operate a limited number of parking facilities. Additionally, technological advancements are having an impact on both consumer behavior and parking services technology. Accordingly, the industry remains highly fragmented and dynamic. From time to time, smaller operators find they lack the financial resources, economies of scale and/or management techniques required to compete for the business of increasingly sophisticated clients or family owners face difficult generational transfers. We expect this trend to continue and will provide larger parking management companies with opportunities to expand their businesses and acquire smaller operators. We also expect that small new operators will continue to enter the market as they have for the past several decades.
Industry Operating Arrangements
Parking facilities operate under three general types of arrangements:
• | management contract; |
• | lease; and |
• | ownership. |
The general terms and benefits of these three types of arrangements are as follows:
Management Contract
Under a management contract, the facility operator generally receives a base monthly fee for managing the facility and may receive an incentive fee based on the achievement of facility performance objectives. Facility operators also generally charge fees for various ancillary services such as accounting support services, equipment leasing and consulting. Primary responsibilities under a management contract include hiring, training and staffing parking personnel, and providing revenue collection, accounting, record-keeping, insurance and facility marketing services. The facility owner usually is responsible for operating expenses associated with the facility's operation, such as taxes, license and permit fees, insurance costs, payroll and accounts receivable processing and wages of personnel assigned to the facility, although some management contracts, typically referred to as "reverse" management contracts, require the facility operator to pay certain of these cost categories but provide for payment to the operator of a larger management fee. Under a management contract, the facility owner usually is responsible for non-routine maintenance and repairs and capital improvements, such as structural and significant mechanical repairs. Management contracts are typically for a term of one to three years (although the contracts may often be terminated, without cause, on 30-days' notice or less) and may contain renewal clauses.
Lease
Under a lease, the parking facility operator generally pays to the property owner a fixed base rent, percentage rent that is tied to the facility's financial performance, or a combination of both. The parking facility operator collects all revenue and is responsible for most operating expenses, but typically is not responsible for major maintenance, capital expenditures or real estate taxes. In contrast to management contracts, leases typically are for terms of three to ten years, often contain a renewal term, and provide for a fixed payment to the facility owner regardless of the facility's operating earnings. Many of these leases may be canceled by the client for various reasons, including development of the real estate for other uses and other leases may be canceled by the client on as little as 30 days' notice without cause. Leased facilities generally require larger capital investment by the parking facility operator than do managed facilities and therefore tend to have longer contract periods.
Ownership
Ownership of parking facilities, either independently or through joint ventures entails greater potential risks and rewards than either managed or leased facilities. All owned facility revenue flows directly to the owner, and the owner has the potential to realize benefits of appreciation in the value of the underlying real estate. Ownership of parking facilities usually requires large capital investments, and the owner is responsible for all obligations related to the property, including all structural, mechanical and electrical maintenance and repairs and property taxes.
4
Industry Growth Dynamics
A number of industry trends should facilitate growth for larger outsourced commercial parking facility management providers, including the following:
Opportunities From Large Property Managers, Owners and Developers. As a result of past industry consolidation, there is a significant number of national property managers, owners and developers that own or manage multiple locations. Sophisticated property owners consider parking a profit center that experienced parking facility management companies can maximize. This dynamic generally favors larger parking facility operators that can provide specialized, value-added professional services with nationwide coverage.
Outsourcing of Parking Management and Related Services. Growth in the parking management industry has resulted from a general trend by parking facility owners to outsource the management of their parking and related operations to independent operators. We believe that entities such as large property managers, owners and developers, as well as cities, municipal authorities, hospitals and universities, in an effort to focus on their core competencies, reduce operating budgets and increase efficiency and profitability, will continue and perhaps increase the practice of retaining parking management companies to operate facilities and provide related services, including shuttle bus operations, municipal meter collection and valet parking.
Vendor Consolidation. Based on interactions with our clients, we believe that many parking facility owners and managers are evaluating the benefits of reducing the number of parking facility management relationships they maintain. We believe this is a function of the desire to reduce costs associated with interacting with a large number of third-party suppliers coupled with the desire to foster closer inter-company relationships. By limiting the number of outsourcing vendors, companies will benefit from suppliers who will invest the time and effort to understand every facet of the client's business and industry and who can effectively manage and handle all aspects of their daily requirements. We believe a trend towards vendor consolidation can benefit a company like ours, given our national footprint and scale, extensive experience, broad process capabilities and a demonstrated ability to create value for our clients.
Industry Consolidation. The parking management industry is highly fragmented, with hundreds of small regional or local operators. We believe national parking facility operators have a competitive advantage over local and regional operators by reason of their:
• | broad product and service offerings; |
• | deeper and more experienced management; |
• | efficient cost structure due to economies of scale; and |
• | financial resources to invest in infrastructure and information systems. |
General Business Trends
We believe that sophisticated commercial real estate developers and property managers and owners recognize the potential for parking and related services to be a profit generator rather than a cost center. Often, the parking experience makes both the first and the last impressions on their properties' tenants and visitors. By outsourcing these services, they are able to capture additional profit by leveraging the unique operational skills and controls that an experienced parking management company can offer. Our ability to consistently deliver a uniformly high level of parking and related services, including the use of various technological enhancements, allows us to maximize the profit to our clients and improves our ability to win contracts and retain existing locations.
Our Competitive Strengths
We believe we have the following key competitive strengths:
A Leading Market Position with a Unique Value Proposition. We are one of the leading providers of parking management, ground transportation and other ancillary services, to commercial, institutional, and municipal clients in the United States, Puerto Rico and Canada. We market and offer many of our services under our SP+ brand, which reflects our ability to provide customized solutions and meet the varied demands of our diverse client base and their wide array of property types. We can augment our parking services by providing our clients with related services through our SP+ Facility Maintenance, SP+ GAMEDAY, SP+ Transportation, SP+ Event Logistics and, in certain sections of the country and Canada, SP+ Security service lines, thus enabling our clients to efficiently address various needs through a single vendor relationship. We believe our ability to offer a comprehensive range of services on a national basis is a significant competitive advantage and allows our clients to attract, service and retain customers, gain access to the breadth and depth of our service and process expertise, leverage our significant technology capabilities and enhance their parking facility revenue, profitability and cash flow.
Our Scale and Diversification. Expanding our client base, industry vertical markets and geographic locations has enabled us to significantly enhance our operating efficiency over the past several years by standardizing processes and managing overhead.
• | Client Base. Our clients include some of the nation's largest private and public owners, municipalities, managers and developers of major office buildings, residential properties, commercial properties, shopping centers and other retail properties, sports and special event complexes, hotels, and hospitals and medical centers. |
5
• | Industry Vertical Markets. We believe that our industry vertical market diversification, such as colleges and universities, healthcare, municipalities, hospitality and event services, allows us to minimize our exposure to industry-specific seasonality and volatility. We believe that the breadth of end-markets we serve and the depth of services we offer to those end-markets provide us with a broader base of customers that we can target. |
• | Geographic Locations. We have a diverse geographic footprint that includes operations in 45 states, the District of Columbia, Puerto Rico and three Canadian provinces as of December 31, 2016. |
Stable Client Relationships. We have a track record of providing our clients and parking customers with a consistent, value-added and high quality parking facility management experience, as reflected by our high location retention rates. Managers, property owners and developers continue to outsource the management of their parking operations and look to consolidate the number of their outsourcing providers; we believe this trend has meaningful benefits to companies like ours, which has a national footprint and scale, extensive industry experience, broad process capabilities, and a demonstrated ability to create value for our clients.
Established Platform for Future Growth. We have invested resources and developed a national infrastructure and technology platform that is complemented by significant management expertise, which enables us to scale our business for future growth effectively and efficiently. We have the ability to transition into a new location very quickly, from the simplest to the most complex operation, and have experience working with incumbent facility managers to effect smooth and efficient takeovers and integrate new locations seamlessly into our operations.
Visible and Predictable Business Model. We believe that our business model provides us with a measure of insulation from broader economic cycles, because a significant portion of our combined locations operates on fixed-fee and reverse management fee management contracts that for the most part are not dependent upon the level of utilization of those parking facilities. Additionally, because we only have a partial ownership interest in two parking facilities, we have limited the risks of real estate ownership. We benefit further from visibility provided by a recurring revenue model reinforced by high location retention rates.
Highly Capital Efficient Business with Attractive Cash Flow Characteristics. Our business generates attractive cash flow due to negative working capital dynamics and our low capital expenditure requirements.
Focus on Operational Excellence and Human Capital Management. Our culture and training programs place a continuing focus on excellence in the execution of all aspects of day-to-day parking facility operation. This focus is reflected in our ability to deliver to our clients a professional, high-quality product through well-trained, service-oriented personnel, which we believe differentiates us from our competitors. To support our focus on operational excellence, we manage our human capital through a comprehensive, structured program that evaluates the competencies and performance of all of our key operations and administrative support personnel on an annual basis. We have also dedicated significant resources to human capital management, providing comprehensive training for our employees, delivered primarily through the use of our web-based SP+ University™ learning management system, which promotes customer service and client retention in addition to providing our employees with continued training and career development opportunities.
Our focus on customer service and satisfaction is a key driver of our high location retention rate, which, after excluding the impact of certain facilities that were sold as part of the security business in 2015, was approximately 87% and 88% for the years ended December 31, 2016 and 2015, respectively.
Focus on Operational Safety Initiatives. Our culture and training programs continue to place a focus on various safety initiatives throughout the organization, as we continue to develop an integrated approach for continuous improvement in our risk and safety programs. We have also dedicated significant resources to our risk and safety programs by providing comprehensive training for our employees, delivered primarily through the use of our web-based SP+ University™ learning management system and our SP+irit in Safety newsletters.
Our Growth Strategy
Building on these competitive strengths, we believe we are well positioned to execute on the following growth strategies:
Grow Our Portfolio of Contracts in Existing Geographic Markets. Our strategy is to capitalize on economies of scale and operating efficiencies by expanding our contract portfolio in our existing geographic markets, especially in our core markets. As a given geographic market achieves a threshold operational size, we typically will establish a local office in order to promote increased operating efficiency by enabling local managers to use a common staff for recruiting, training and human resources support. This concentration of operating locations allows for increased operating efficiency and superior levels of customer service and retention through the accessibility of local managers and support resources.
Increase Penetration in Our Current Industry Vertical Markets. We believe that a significant opportunity exists for us to further expand our presence into certain industry vertical markets, such as colleges and universities, healthcare, and municipalities hospitality and events services. In order to effectively target these new markets, we have implemented a go-to-market strategy of aligning our business by industry vertical markets and branding our domain expertise through our SP+ operating division designations to highlight the specialized expertise, competencies and services that we provide to meet the needs of each particular industry and customer. Our developed SP+ brand, which emphasizes our specialized market expertise and distinguishes our ancillary service lines from traditional parking, includes a broad array of our operating divisions such as, SP+ Airport Services, SP+ GAMEDAY, SP+ Healthcare Services, SP+ Hotel Services, SP+ Municipal Services, SP+ Office Services, SP+ Residential Services, SP
6
+ Retail Services and SP+ University Services, which further highlight the market-specific subject matter expertise that enables our professionals to meet the varied parking and transportation-related demands of those specific property types. Because our capabilities range beyond parking facility management, our SP+ Transportation, SP+ Facility Maintenance, and SP+ Event Logistics brands more clearly distinguish those service lines from the traditional parking services that we provide under our SP+ Parking, Standard Parking, Central Parking and USA Parking brands.
Expand and Cross-Sell Additional Services to Drive Incremental Revenue. We believe we have significant opportunities to further strengthen our relationships with existing clients, and to attract new clients, by continuing to cross-sell value-added services that complement our core parking operations. These services include shuttle bus operations, taxi and livery dispatch services, valet services, concierge-type ground transportation, on-street parking meter collection and enforcement, facility maintenance services, remote management, parking consulting and billing services.
Expand Our Geographic Platform. We believe that opportunities exist to further develop new geographic markets through new contracts, acquisitions, alliances, joint ventures or partnerships. Clients who outsource the management of their parking operations often have a presence in a variety of urban markets and seek to outsource the management of their parking facilities to a national provider. We continue to focus on leveraging relationships with existing clients that have locations in multiple markets as one potential entry point into developing new core markets.
Focus on Operational Efficiencies to Further Improve Profitability. We have invested substantial resources in information technology and continually seek to consolidate various corporate functions where possible in order to improve our processes and service offerings. In addition, we will continue to evaluate and improve our human capital management to ensure a consistent and high-level of service for our clients. The initiatives undertaken to date in these areas have improved our cost structure and enhanced our financial strength, which we believe will continue to yield future benefits. SP+ Remote Management Services allows us to provide remote parking management services, whereby personnel are able to monitor revenue and other aspects of a parking operation and provide 24-hour-a-day customer assistance (including remedying equipment malfunctions). After consolidating remote operations, we have begun expanding the locations where our remote management technology is installed. We expect this business to grow as clients focus on improving the profitability of their parking operations by decreasing labor costs at their locations through remote management.
Pursue Opportunistic, Strategic Acquisitions. The outsourced parking management industry remains highly fragmented and presents a significant opportunity for us. Given the scale in our existing operating platform, we have a demonstrated ability to successfully identify, acquire and integrate strategic acquisitions and investments, such as Central in 2012 and our minority interest investment in Parkmobile in 2014. We will continue to selectively pursue acquisitions and joint venture investment opportunities that help us acquire scale or further enhance our service capabilities.
Grow the Hospitality Business. SP+ is a leader in the valet industry, and management continues to believe there is significant opportunity to use SP+'s capabilities to develop a national valet business. Our objective is to focus on the most important aspects of the valet business promptly upon obtaining a new location, from the first contact with a potential customer to the execution of our services. Given the importance of neat, clean and polite service, the success of our valet business is dependent upon ensuring that its valet associates deliver excellent service every day. To accomplish this objective, our SP+ University™ provides training to its valet associates. SP+ University™ continuously provides training to our valet professionals to become an integrated extension of our clients' staff and blend seamlessly into the overall hospitality experience.
Business Development
Our efforts to attract new clients are primarily concentrated in and coordinated by a dedicated business development group, whose background and expertise is in the field of sales and marketing, and whose financial compensation is determined to a significant extent by their business development success. This business development group is responsible for forecasting sales, maintaining a pipeline of prospective and existing clients, initiating contacts with such clients, and then following through to coordinate meetings involving those clients and the appropriate members of our operations hierarchy. By concentrating our sales efforts through this dedicated group, we enable our operations personnel to focus on achieving excellence in our parking facility operations and maximizing our clients' parking profits and our own profitability.
We also place a specific focus on marketing and client relationship efforts that pertain to those clients having a large regional or national presence. Accordingly, we assign a dedicated executive to those clients to manage the overall client relationship, address any existing portfolio issues as well as to reinforce existing and develop new account relationships, and to take any other action that may further our business development interests.
Competition
The parking industry is fragmented and highly competitive. We face direct competition for additional facilities to manage or lease, while our facilities themselves compete with nearby facilities for our parking customers and in the labor market generally for qualified employees. There are only a few national parking management companies that compete with us. However, we also face competition from numerous smaller, locally owned independent parking operators, as well as from developers, hotels, national financial services companies and other institutions that manage their own parking facilities as well as facilities owned by others. Many municipalities and other governmental entities also operate their own parking facilities. Additionally, technological factors which improve ride-sharing capabilities and increase the use of parking aggregators can impact our business. Some of our present and potential competitors have or may obtain greater financial and marketing resources than we have, which may negatively impact our ability
7
to retain existing contracts and gain new contracts. We also face significant competition in our efforts to provide ancillary services such as shuttle bus services and on-street parking enforcement because a number of large companies specialize in these services.
We believe that we compete for management clients based on a variety of factors, including fees charged for services, ability to generate revenues and control expenses for clients, accurate and timely reporting of operational results, quality of customer service, and ability to anticipate and respond to industry changes. Factors that affect our ability to compete for leased locations include the ability to make financial commitments, long-term financial stability, and the ability to generate revenues and control expenses. Factors affecting our ability to compete for employees include wages, benefits and working conditions.
Support Operations
We maintain regional and city offices throughout the United States, Puerto Rico and Canada in order to support approximately 22,500 employees and 3,686 locations. These offices serve as the centralized locations through which we provide the employees to staff our parking facilities as well as the on-site and support management staff to oversee those operations. Our administrative staff accountants are based in those same offices and facilitate the efficient, accurate and timely production and delivery of client deliverables, such as monthly reporting, etc. Having these all-inclusive operations and accounting teams located in regional and city offices throughout the United States, Puerto Rico and Canada allows us to add new locations seamlessly and in a cost-efficient manner.
Our overall basic corporate functions in the areas of finance, human resources, risk management, legal, purchasing and procurement, general administration, strategy and information and technology are based in our Chicago corporate office and Nashville support office.
Clients and Properties
Our client base includes a diverse cross-section of public and private owners of commercial, institutional and municipal real estate.
Employees
As of December 31, 2016, we employed 22,490 individuals, including 13,743 full-time and 8,747 part-time employees and as of December 31, 2015, we employed 21,974 individuals, including 13,187 full-time and 8,787 part-time employees. Approximately 31% of our employees are covered by collective bargaining agreements and represented by labor unions. Various union locals represent parking attendants and cashiers in the following cities: Atlanta, Akron (OH), Baltimore, Boston, Buffalo, Chicago, Cleveland, Dallas, Denver, Detroit, Jersey City, Kansas City, Las Vegas, Long Beach (CA), Los Angeles, Manchester (NH), Miami, New York City, Newark, Philadelphia, Pittsburgh, Portland, Rochester, San Francisco, San Jose, San Juan (Puerto Rico), Santa Monica, Seattle, Syracuse and Washington, DC.
We are frequently engaged in collective bargaining negotiations with various union locals. No single collective bargaining agreement covers a material number of our employees. We believe that our employee relations are generally good.
Insurance
We purchase comprehensive liability insurance covering certain claims that occur in the operations that we lease or manage including coverage for general/garage liability, garage keepers legal liability, and auto liability. In addition, we purchase workers' compensation insurance for all eligible employees and umbrella/excess liability coverage. Under our various liability and workers' compensation insurance policies, we are obligated to pay directly or reimburse the insurance carrier for the deductible / retention amount for each loss covered by our general/garage liability, our automobile liability, our workers' compensation, and our garage keepers legal liability policy. As a result, we are effectively self-insured for all claims up to the deductible / retention amount for each loss. We also purchase property insurance that provides coverage for loss or damage to our property and in some cases our clients' property, as well as business interruption coverage for lost operating income and certain associated expenses. Because of the size of the operations covered and our claims experience, we purchase insurance policies at prices that we believe represent a discount to the prices that would typically be charged to parking facility owners on a stand-alone basis. The clients for whom we operate parking facilities pursuant to management contracts have the option of purchasing their own liability insurance policies (provided that we are named as an additional insured party), but historically most of our clients have chosen to obtain insurance coverage by being named as additional insureds under our master liability insurance policies. Pursuant to our management contracts, we charge those clients an allocated portion of our insurance-related costs.
We provide group health insurance with respect to eligible full-time employees (whether they work at leased facilities, managed facilities or in our support offices). We self-insure the cost of the medical claims for these participants up to a stop-loss limit. Pursuant to our management contracts, we charge those clients an allocated portion of our insurance-related costs.
8
Regulation
Our business is subject to numerous federal, state and local laws and regulations, and in some cases, municipal and state authorities directly regulate parking facilities. Our facilities in New York City are, for example, subject to extensive governmental restrictions concerning automobile capacity, pricing, structural integrity and certain prohibited practices. Many cities impose a tax or surcharge on parking services, which generally range from 10% to 50% of revenues collected. We collect and remit sales/parking taxes and file tax returns for and on behalf of our clients and ourselves. We are affected by laws and regulations that may impose a direct assessment on us for failure to remit sales/parking taxes or to file tax returns for ourselves and on behalf of our clients.
Under various federal, state and local environmental laws, ordinances and regulations, a current or previous owner or operator of real property may be liable for the costs of removal or remediation of hazardous or toxic substances on, under or in such property. Such laws typically impose liability without regard to whether the owner or operator knew of, or was responsible for, the presence of such hazardous or toxic substances. In connection with the operation of parking facilities, we may be potentially liable for any such costs.
Several state and local laws have been passed in recent years that encourage car-pooling and the use of mass transit or impose certain restrictions on automobile usage. These types of laws have adversely affected our revenues and could continue to do so in the future. For example, the City of New York imposed restrictions in the wake of the September 11 terrorist attacks, which included street closures, traffic flow restrictions and a requirement for passenger cars entering certain bridges and tunnels to have more than one occupant during the morning rush hour. It is possible that cities could enact additional measures such as higher tolls, increased taxes and vehicle occupancy requirements in certain circumstances, which could adversely impact us. We are also affected by zoning and use restrictions and other laws and regulations that are common to any business that deals with real estate.
In addition, we are subject to laws generally applicable to businesses, including but not limited to federal, state and local regulations relating to wage and hour matters, employee classification, mandatory healthcare benefits, unlawful workplace discrimination, human rights laws and whistle blowing. Several cities in which we have operations either have adopted or are considering the adoption of so-called "living wage" ordinances, which could adversely impact our profitability by requiring companies that contract with local governmental authorities and other employers to increase wages to levels substantially above the federal minimum wage. In addition, we are subject to provisions of the Occupational Safety and Health Act of 1970, as amended ("OSHA"), and related regulations. Any actual or alleged failure to comply with any regulation applicable to our business or any whistle-blowing claim, even if without merit, could result in costly litigation, regulatory action or otherwise harm our business, financial condition and results of operations.
In connection with certain transportation services provided to our clients, including shuttle bus operations, we provide the vehicles and the drivers to operate these transportation services. The U.S. Department of Transportation and various state agencies exercise broad powers over these transportation services, including, licensing and authorizations, safety and insurance requirements. Our employee drivers must also comply with the safety and fitness regulations promulgated by the Department of Transportation, including those related to drug and alcohol testing and service hours. We may become subject to new and more restrictive federal and state regulations. Compliance with such regulations could hamper our ability to provide qualified drivers and increase our operating costs.
We are also subject to consumer credit laws and credit card industry rules and regulations relating to the processing of credit card transactions, including the Fair and Accurate Credit Transactions Act and the Payment Card Data Security Standard. These laws and these industry standards impose substantial financial penalties for non-compliance.
Various other governmental regulations affect our operation of parking facilities, both directly and indirectly, including the Americans with Disabilities Act (the "ADA"). Under the ADA, all public accommodations, including parking facilities, are required to meet certain federal requirements related to access and use by disabled persons. For example, the ADA requires parking facilities to include handicapped spaces, headroom for wheelchair vans, attendants' booths that accommodate wheelchairs and elevators that are operable by disabled persons. When negotiating management contracts and leases with clients, we generally require that the property owner contractually assume responsibility for any ADA liability in connection with the property. There can be no assurance, however, that the property owner has assumed such liability for any given property and there can be no assurance that we would not be held liable despite assumption of responsibility for such liability by the property owner. Management believes that the parking facilities we operate are in substantial compliance with ADA requirements.
Regulations by the Federal Aviation Administration (the "FAA") may affect our business. The FAA generally prohibits parking within 300 feet of airport terminals during times of heightened alert. The 300 foot rule and new regulations may prevent us from using a number of existing spaces during heightened security alerts at airports. Reductions in the number of parking spaces may reduce our gross profit and cash flow for both our leased facilities and those facilities we operate under management contracts.
9
Intellectual Property
SP Plus® and the SP+® and the SP+ logo, SP+ GAMEDAY®, Innovation In Operation®, Standard Parking® and the Standard Parking logo, CPC®, Central Parking System®, Central Parking Corporation®, USA Parking®, Focus Point Parking® and Allright Parking® are service marks registered with the United States Patent and Trademark Office. In addition, we have registered the names and, as applicable, the logos of all of our material subsidiaries and divisions as service marks with the United States Patent and Trademark Office or the equivalent state registry. We invented the Multi-Level Vehicle Parking Facility musical Theme Floor Reminder System. We have also registered the copyright rights in our proprietary software, such as Client View©, Hand Held Program©, License Plate Inventory Programs© and ParkStat© with the United States Copyright Office. We also own the URL parking.com.
Corporate Information
Our Annual Report on Form 10-K, quarterly reports on Form 10-Q, current reports on Form 8-K and amendments to those reports filed or furnished pursuant to Section 13(a) or 15(d) of the Securities Exchange Act of 1934 are available free charge at www.spplus.com as soon as reasonably practicable after we file such material with, or furnish it to, the Securities and Exchange Commission ("SEC"). We provide references to our website for convenience, but our website is not incorporated into this or any of our other filings with the SEC.
10
Item 1A. Risk Factors
The following discussion of risk factors contains forward-looking statements. These risk factors may be important to understanding any statement in this Form 10-K or elsewhere. The following information should be read in conjunction with Part II, Item 7. "Management's Discussion and Analysis of Financial Condition and Results of Operations" and the Consolidated Financial Statements and related notes in Part IV, Item 15. "Exhibits and Financial Statement Schedules" of this Form 10-K.
The business, financial condition and operating results of the Company can be affected by a number of factors, whether currently known or unknown, including but not limited to those described below. Any one or more of such factors could directly or indirectly cause the Company's actual results of operations and financial condition to vary materially from past or anticipated future results of operations and financial condition. Any of these factors, in whole or in part, could materially and adversely affect the Company's business, financial condition, results of operations and stock price.
Because of the following factors, as well as other factors affecting the Company's financial condition and operating results, past financial performance should not be considered to be a reliable indicator of future performance, and investors should not use historical trends to anticipate results or trends in future periods.
We are subject to intense competition that could constrain our ability to gain business and adversely impact our profitability.
We believe that competition is intense in the parking facility management, valet, transportation services and event management businesses, including other ancillary services that we offer. The low cost of entry into the parking facility management, valet, transportation services and event management businesses have led to a strongly competitive, fragmented markets consisting of various sized entities, ranging from small local or single lot operators to large regional and national businesses and multi-facility operators, as well as governmental entities that choose not to outsource their parking operations. Competitors may be able to adapt more quickly to changes in customer requirements, devote greater resources to the promotion and sale of their services or develop technology that is as or more successful than our proprietary technology. We provide nearly all of our services under contracts, many of which are obtained through competitive bidding, and many of our competitors also have long-standing relationships with our clients. Providers of parking facility management services have traditionally competed on the basis of cost and quality of service. As we have worked to establish ourselves as principal members of the industry, we compete predominately on the basis of high levels of service and strong relationships. We may not be able to, or may choose not to, compete with certain competitors on the basis of price. As a result, a greater proportion of our clients may switch to other service providers or self-manage. Furthermore, these strong competitive pressures could impede our success in bidding for profitable business and our ability to increase prices even as costs rise, thereby reducing margins.
Changing consumer preferences may lead to a decline in parking demand, which could have a material adverse impact on our business, financial condition and results of operations.
Ride sharing services such as Uber and Lyft and car sharing services like Zipcar, along with the potential for driverless cars, may lead to a decline in parking demand in cities and urban areas. While we devote considerable effort and resources to analyze and respond to consumer preferences and changes to consumer preferences and the markets in which we operate, consumer preferences cannot be predicted with certainty and can change rapidly. Additionally, changes in consumer behaviors by using mobile phone applications and on-line parking reservation services that help drivers reserve parking with garage, lots and individual owner spaces cannot be predicted with certainty and could change current customers' parking preferences. If we are unable to anticipate and respond to trends in the consumer marketplace and the industry, including but not limited to market displacement by livery service companies, car sharing companies and changing technologies, it could constrain our business and have a material and adverse impact on our business, financial condition and results of operations.
We may have difficulty obtaining coverage for certain insurable risks or obtaining coverage for certain insurable risks at a reasonable cost and are subject to volatility associated with our high deductible / retention insured and self-insured programs including the possibility that changes in estimates of ultimate insurance losses could result in a material change against our operating results.
We use a combination of insured and self-insured programs to cover workers compensation, general liability, automobile liability, property damage and other insurable risks and provide liability and workers' compensation insurance coverage consistent with our obligations to our clients under our various management contracts and leases. We are responsible for claims in excess of our retained limits under our insurance policies, and while we endeavor to purchase insurance coverage that is appropriate to our assessment of risk, we are unable to predict with certainty the frequency, nature or magnitude of claims or direct or consequential damages. We are obligated to reimburse our insurance carriers for, or pay directly, each loss incurred up to the amount of a specified deductible or self-insured retention amount. We also purchase property insurance that provides coverage for loss or damage to our property, and in some cases our clients' property, as well as business interruption coverage for lost operating income and certain associated expenses. The deductible or retention applicable to any given loss under the property insurance policies varies based upon the insured values and the peril that causes the loss. Our financial statements reflect our funding of all such obligations based upon guidance and evaluation received from third-party insurance professionals. There can be no assurance, however, that the ultimate amount of our obligations will not exceed the amount presently funded or accrued, in which case we would need to set aside additional funds to reserve for any such excess. We also purchase property insurance that provides coverage for loss or damage to our property, and in some cases our clients' property, as well as business interruption coverage for lost operating income and certain associated expenses. The deductible applicable to any given loss under the property insurance policies varies based
11
upon the insured values and the peril that causes the loss. Our financial statements reflect our funding of all such obligations based upon guidance and evaluation received from third-party insurance professionals. There can be no assurance, however, that the ultimate amount of our obligations will not exceed the amount presently funded or accrued, in which case we would need to set aside additional funds to reserve for any such excess.
The determination of required insurance reserves is dependent upon significant actuarial judgments. We use the results of actuarial studies to estimate insurance rates and insurance reserves for future periods and adjust reserves as appropriate for the current year and prior years. Changes in insurance reserves as a result of periodic evaluations of the liabilities can cause swings in operating results that may not be indicative of the operations of our ongoing business. Actual experience related to our insurance reserves can cause us to change our estimates for reserves and any such changes may materially impact results, causing significant volatility in our operating results. Additionally, our obligations could increase if we receive a greater number of insurance claims, or if the severity of, or the administrative costs associated with, those claims generally increases.
Recent consolidation of entities in the insurance industry could impact our ability to obtain or renew policies at competitive rates. Should we be unable to obtain or renew our excess, umbrella, or other commercial insurance policies at competitive rates, it could have a material adverse impact on our business, as would the incurrence of catastrophic uninsured claims or the inability or refusal of our insurance carriers to pay otherwise insured claims. Further, to the extent that we self-insure our losses, deterioration in our loss control and/or continuing claim management efforts could increase the overall costs of claims within our retained limits. A material change in our insurance costs due to changes in frequency of claims, the severity of claims, the costs of excess/umbrella premiums, regulatory changes, or consolidation of entities within the insurance industry could have a material adverse effect on our financial position, results of operations, or cash flows.
Our management contracts and leases expose us to certain risks.
The loss or renewal on less favorable terms of a substantial number of management contracts or leases could have a material adverse effect on our business, financial condition and results of operations. A material reduction in the operating income associated with the integrated services we provide under management contracts and leases could have a material adverse effect on our business, financial condition and results of operations. Our management contracts are typically for a term of one to three years, although the contracts may often be terminated, without cause, on 30-days' notice or less, giving clients regular opportunities to attempt to negotiate a reduction in fees or other allocated costs. Any loss of a significant number of clients could in the aggregate materially adversely affect our operating results.
We are particularly exposed to increases in costs for locations that we operate under leases because we are generally responsible for all the operating expenses of our leased locations. During the first and fourth quarters of each year, seasonality generally impacts our performance with regard to moderating revenues, with the reduced levels of travel most clearly reflected in the parking activity associated with our airport and hotel businesses as well as increases in certain costs of parking services, such as snow removal, all of which negatively affects gross profit.
Deterioration in economic conditions in general could reduce the demand for parking and ancillary services and, as a result, reduce our earnings and adversely affect our financial condition.
Adverse changes in global, national and local economic conditions could have a negative impact on our business. In addition, our business operations tend to be concentrated in large urban areas. Many of our customers are workers who commute by car to their places of employment in these urban centers. Our business could be materially adversely affected to the extent that weak economic conditions or demographic factors have resulted in the elimination of jobs and high unemployment in these large urban areas. In addition, increased unemployment levels, the movement of white-collar jobs from urban centers to suburbs or out of North America entirely, increased office vacancies in urban areas, movement toward home office alternatives or lower consumer spending could reduce consumer demand for our services.
Adverse changes in economic conditions could also lead to a decline in parking at airports and commercial facilities, including facilities owned by retail operators and hotels. In particular, reductions in parking at leased facilities can lower our profit because a decrease in revenue would be exacerbated by fixed costs that we must pay under our leases.
If adverse economic conditions reduce discretionary spending, business travel or other economic activity that fuels demand for our services, our earnings could be reduced. Adverse changes in local and national economic conditions could also depress prices for our services or cause clients to cancel their agreements to purchase our services.
We are increasingly dependent on information technology, and potential disruption, cyber-attacks, cyber terrorism and security breaches present risks that could harm our business.
We are increasingly centralized and dependent on automated information technology systems to manage and support a variety of business processes and activities. In addition, a portion of our business operations is conducted electronically, increasing the risk of attack or interception that could cause loss or misuse of data, system failures or disruption of operations. Improper activities by third parties, exploitation of encryption technology, new data-hacking tools and discoveries and other events or developments may result in a future compromise or breach of our networks, payment card terminals or other payment systems. In particular, the techniques used by criminals to obtain unauthorized access to sensitive data change frequently and often are not recognized until launched against a target; accordingly, we may be unable to anticipate these techniques or implement adequate preventative measures. Additionally, our systems are subject to damage or interruption from system conversions, power outages, computer or
12
telecommunications failures, computer viruses and malicious attack, security breaches and catastrophic events. If our systems are damaged or fail to function properly, we may incur substantial repair and/or replacement costs, experience data loss or theft and impediments to our ability to manage customer transactions, which could adversely affect our operations and our results of operations. In addition, there is a risk of business interruption, reputational damage and potential legal liability damages from leakage of confidential information. The occurrence of acts of cyber terrorism such as website defacement, denial of automated payment services, sabotage of our proprietary on-demand technology or the use of electronic social media to disseminate unfounded or otherwise harmful allegations to our reputation, could have a material adverse effect on our business. Any business interruptions or damage to our reputation could negatively impact our financial condition and results of operations. While we maintain insurance coverage that may, subject to policy terms and conditions, cover certain aspects of cyber risks, such insurance coverage may be insufficient to cover all losses potentially incurred and would not remedy damage to our reputation. We have also implemented additional security measures including, for example, forcing our vendors to use two-factor authentication for remote access.
We do not have control over security measures taken by third-party vendors hired by our clients to prevent unauthorized access to electronic and other confidential information. There can be no assurance that other third-party payment processing vendors will not suffer a similar attack in the future, that unauthorized parties will not gain access to personal financial information, or that any such incident will be discovered in a timely manner.
Adverse litigation judgments or settlements resulting from legal proceedings in which we may be involved in the normal course of business could affect our operations and financial condition.
In the normal course of business, we are from time to time involved in various legal proceedings. The outcome of these legal proceedings cannot be predicted. It is possible that an unfavorable outcome of some or all of the matters could cause us to incur substantial liabilities that may have a material adverse effect upon our financial condition and results of operations. Any significant adverse litigation, judgments or settlements could have a negative effect on our business, financial condition and results of operations. In addition, we are subject to a number of ongoing legal proceedings, and we may incur substantial expenses defending such matters and may have judgments levied against us that are substantial and may not be covered by previously established reserves.
We have incurred indebtedness that could adversely affect our financial condition.
As of December 31, 2016, we had total outstanding indebtedness against the Restated Credit Facility of $196.3 million (excluding debt discount of $1.2 million and deferred financing costs of $1.6 million). This level of indebtedness and any potential increases in outstanding indebtedness:
• | could require us to dedicate a significant percentage of our cash flow from operations to payments on our debt, thereby reducing the availability of cash flow to fund capital expenditures, pursue other acquisitions or investments in new technologies, make stock repurchases, pay dividends and for general corporate purposes; |
• | could increase our vulnerability to general adverse economic conditions, including increases in interest rates if the borrowings bear interest at variable rates or if such indebtedness is refinanced at a time when interest rates are higher; and |
• | could limit our flexibility in planning for, or reacting to, changes in or challenges relating to our business and industry, creating competitive disadvantages compared to other competitors with lower debt levels and borrowing costs. |
Failure to comply with covenants or meet payment obligations under our credit facility could result in the event of default which, if not cured or waived, could result in the acceleration of outstanding debt obligations.
We may incur additional indebtedness in the future, which could cause the related risks to intensify. We may need to refinance all or a portion of our indebtedness on or before their respective maturities. We cannot assure you that we will be able to refinance any of our indebtedness, including indebtedness under our Restated Credit Facility, on commercially reasonable terms or at all. If we are unable to refinance our debt, we may default under the terms of our indebtedness, which could lead to an acceleration of debt repayment. We do not expect that we could repay all of our outstanding indebtedness if the repayment of such indebtedness was accelerated.
We must comply with public and private regulations that may impose significant costs on us.
Under various federal, state and local environmental laws, ordinances and regulations, current or previous owners or operators of real property may be liable for the costs of removal or remediation of hazardous or toxic substances on, under or in their properties. This applies to properties we either own or operate. These laws typically impose liability without regard to whether the owner or operator knew of, or was responsible for, the presence of such hazardous or toxic substances. We may be potentially liable for such costs as a result of our operation of parking facilities. Additionally, we hold a partial ownership interest in four of these parking facilities and companies that we acquired in previous years may have owned a large number of properties that we did not acquire. We may now be liable for such costs as a result of such previous and current ownership. In addition, from time to time we are involved in environmental issues at certain locations or in connection with our operations. The cost of defending against claims of liability, or remediation of a contaminated property, could have a material adverse effect on our business, financial condition and results of operations. In addition, several state and local laws have been passed in recent years that encourage carpooling and the use of mass transit. Laws and regulations that reduce the number of cars and vehicles being driven could adversely impact our business.
13
In connection with certain transportation services provided to our clients, including shuttle bus operations, we provide the vehicles and the drivers to operate these transportation services. The U.S. Department of Transportation and various state agencies exercise broad powers over these transportation services, including, licensing and authorizations, safety and insurance requirements. Our employee drivers must also comply with the safety and fitness regulations promulgated by the U.S. Department of Transportation, including those related to drug and alcohol testing and service hours. We may become subject to new and more restrictive federal and state regulations. Compliance with such regulations could hamper our ability to provide qualified drivers and increase our operating costs.
We are also subject to consumer credit laws and credit card industry rules and regulations relating to the processing of credit card transactions, including the Fair and Accurate Credit Transactions Act and the Payment Card Data Security Standard. These laws and these industry standards impose substantial financial penalties for non-compliance.
In addition, we are subject to laws generally applicable to businesses, including but not limited to federal, state and local regulations relating to wage and hour matters, employee classification, mandatory healthcare benefits, unlawful workplace discrimination and whistle blowing. Any actual or alleged failure to comply with any regulation applicable to our business or any whistle-blowing claim, even if without merit, could result in costly litigation, regulatory action or otherwise harm our business, financial condition and results of operations.
We collect and remit sales/parking taxes and file tax returns for and on behalf of ourselves and our clients. We are affected by laws and regulations that may impose a direct assessment on us for failure to remit sales/parking taxes and filing of tax returns for ourselves and on behalf of our clients.
We cannot predict changes in laws and regulations made by the U.S. President, the U.S. President's Administration, or the current and future U.S. Congress, but we will monitor developments regarding legislation changes and regulatory shifts.
The financial difficulties or bankruptcy of one or more of our major clients could adversely affect our results.
Future revenue and our ability to collect accounts receivable depend, in part, on the financial strength of our clients. We estimate an allowance for accounts we do not consider collectible, and this allowance adversely impacts profitability. In the event that our clients experience financial difficulty, become unable to obtain financing or seek bankruptcy protection, our profitability would be further impacted by our failure to collect accounts receivable in excess of the estimated allowance. Additionally, our future revenue would be reduced by the loss of these clients or by the cancellation of leases or management contracts by clients in bankruptcy.
Our risk management and safety programs may not have the intended effect of allowing us to reduce our insurance costs for our insurance programs.
We continually attempt to mitigate the aforementioned risk that our insurance coverage may be inadequate through the implementation of company-wide safety and loss control efforts designed to decrease the incidence of accidents or events that might increase our exposure or liability.
Labor disputes could lead to loss of revenues or expense variations.
When one or more of our major collective bargaining agreements becomes subject to renegotiation or when we face union organizing drives, we may disagree with the union on important issues that, in turn, could lead to a strike, work slowdown or other job actions. There can be no assurance that we will be able to renew existing labor union contracts on acceptable terms. In such cases, there are no assurances that we would be able to staff sufficient employees for our short-term needs. A strike, work slowdown or other job action could in some cases disrupt us from providing services, resulting in reduced revenues. If declines in client service occur or if our clients are targeted for sympathy strikes by other unionized workers, contract cancellations could result. The result of negotiating a first time agreement or renegotiating an existing collective bargaining agreement could result in a substantial increase in labor and benefits expenses that we may be unable to pass through to clients. In addition, potential legislation could make it significantly easier for union organizing drives to be successful and could give third-party arbitrators the ability to impose terms of collective bargaining agreements upon us and a labor union if we are unable to agree with such union on the terms of a collective bargaining agreement. At December 31, 2016, approximately 31% of our employees were represented by labor unions and approximately 46% of our collective bargaining contracts are up for renewal in 2017, representing approximately 27% of our employees. In addition, at any given time, we may face a number of union organizing drives.
In addition, we make contributions to multi-employer benefit plans on behalf of certain employees covered by collective bargaining agreements and could be responsible for paying unfunded liabilities incurred by such benefit plans, which amount could be material.
Our business success depends on retaining senior management and attracting and retaining qualified personnel.
Our future performance depends on the continuing services and contributions of our senior management to execute on our acquisition and growth strategies and to identify and pursue new opportunities. Our future success also depends, in large degree, on our continued ability to attract and retain qualified personnel. Any unplanned turnover in senior management or inability to attract and retain qualified personnel could have a negative effect on our results of operations.
14
Negative or unexpected tax consequences could adversely affect our results of operations.
Adverse changes in underlying profitability and financial outlook of our operations could lead to changes in valuation allowances against our deferred tax assets on our consolidated balance sheet, which could materially and adversely affect our results of operations. Additionally, changes in U.S. tax laws or state tax laws or our interpretation of existing laws in states where we have significant operations could have an adverse effect on deferred tax assets and liabilities on our consolidated balance sheets and results of operations. We are also subject to tax audits by governmental authorities in the United States and Canada. Negative unexpected results from one or more such tax audits or our failure to sustain our reporting positions on examination could have an adverse effect on our results of operations and our effective tax rate.
We have investments in joint ventures and may be subject to certain financial and operating risks with our joint venture investments.
We have acquired or invested in a number of joint ventures, and may acquire or enter into joint ventures with additional companies. These transactions create risks such as: (i) additional operating losses and expenses in the businesses acquired or joint ventures in which we have made investments, (ii) the dependence on the investee's accounting, financial reporting and similar systems, controls and processes of other entities whose financial performance is incorporated into our financial results due to our investment in that entity, (iii) potential unknown liabilities associated with a company we may acquire or in which we invest, (iv) requirements or obligations to commit and provide additional capital, equity, or credit support as required by the joint venture agreements, (v) the joint venture partner may be unable to perform its obligations as a result of financial or other difficulties or be unable to provide for additional capital, equity or credit support under the joint venture agreements and (vi) disruption of our ongoing business, including loss of management focus on the business. As a result of future acquisitions or joint ventures in which we may invest, we may need to issue additional equity securities, spend our cash, or incur debt and contingent liabilities, any of which could reduce our profitability and harm our business. In addition, valuations supporting our acquisitions or investments in joint ventures could change rapidly given the global economic environment and climate. We could determine that such valuations have experienced impairments, resulting in other-than-temporary declines in fair value which could adversely impact our financial results.
Weather conditions, including natural disasters, or acts of terrorism could disrupt our business and services.
Weather conditions, including fluctuations in temperatures, hurricanes, snow or severe weather storms, earthquakes, drought, heavy flooding, natural disasters or acts of terrorism may result in reduced revenues and gross profit. Weather conditions, natural disasters and acts of terrorism may also cause economic dislocations throughout the country. Weather conditions, including natural disasters, could lead to reduced levels of travel and require increase in certain costs of parking services of which could negatively affect gross profit. In addition, terrorist attacks have resulted in, and may continue to result in, increased government regulation of airlines and airport facilities, including imposition of minimum distances between parking facilities and terminals, resulting in the elimination of currently managed parking facilities. We derive a significant percentage of our gross profit from parking facilities and parking related services in and around airports. The Federal Aviation Administration generally prohibits parking within 300 feet of airport terminals during periods of heightened security. While the prohibition is not currently in effect, there can be no assurance that this governmental prohibition will not again be reinstated. The existing regulations governing parking within 300 feet of airport terminals or future regulations may prevent us from using certain parking spaces. Reductions in the number of parking spaces and air travelers may reduce our revenue and cash flow for both our leased facilities and those facilities we operate under management contracts.
Because our business is affected by weather related trends, typically in the first and fourth quarters of each year, our results may fluctuate from period to period, which could make it difficult to evaluate our business.
Weather conditions, including fluctuations in temperatures, snow or severe weather storms, heavy flooding, hurricanes or natural disasters, can negatively impact portions of our business. We periodically have experienced fluctuations in our quarterly results arising from a number of factors, including the following:
• | reduced levels of travel during and as a result of severe weather conditions, which is reflected in lower revenue from urban, airport and hotel parking; and |
• | increased costs of parking services, such as snow removal. |
These factors have typically had negative impacts to our gross profit in the first quarter and could cause gross profit reductions in the future, either in the first quarter or other quarters. As a result of these seasonal affects, our revenue and earnings in the second, third and fourth quarters generally tend to be higher than revenue and earnings in the first quarter. Accordingly, you should not consider our first quarter results as indicative of results to be expected for any other quarter or for any full fiscal year. Fluctuations in our results could make it difficult to evaluate our business or cause instability in the market price of our common stock.
15
Risks relating to our acquisition strategy may adversely impact our results of operations.
In the past, a significant portion of our growth has been generated by acquisitions, and we expect to continue to acquire businesses in the future as part of our growth strategy. A slowdown in the pace or size of our acquisitions could lead to a slower growth rate. There can be no assurance that any acquisition we make in the future will provide us with the benefits that we anticipate when entering into the transaction. The process of integrating an acquired business may create unforeseen difficulties and expenses. The areas in which we may face risks in connection with any potential acquisition of a business include, but are not limited to:
• | management time and focus may be diverted from operating our business to acquisition integration; |
• | clients or key employees of an acquired business may not remain, which could negatively impact our ability to grow that acquired business; |
• | integration of the acquired business’s accounting, information technology, human resources, and other administrative systems may fail to permit effective management and expense reduction; |
• | implementing internal controls, procedures, and policies appropriate for a public company in an acquired business that lacked some of these controls, procedures, and policies may fail; |
• | additional indebtedness incurred as a result of an acquisition may impact our financial position, results of operations, and cash flows; and |
• | unanticipated or unknown liabilities may arise relating to the acquired business. |
Goodwill impairment charges could have a material adverse effect on our financial condition and results of operations.
Goodwill represents the excess purchase price of acquired businesses over the fair values of the assets acquired and liabilities assumed. We have elected to make the first day of our fiscal fourth quarter, October 1st, the annual impairment assessment date for goodwill. However, we could be required to evaluate the recoverability of goodwill prior to the annual assessment if we experience a significant under-performance relative to expected historical or projected future operating results, significant changes in the use of acquired assets or our business strategy, and significant negative industry or economic trends. If the fair value of one of our reporting units is less than its carrying value, we would record impairment for the excess of the carrying amount over the estimated fair value. The valuation of our reporting units requires significant judgment in evaluation of recent indicators of market activity and estimated future cash flows, discount rates, and other factors. Any impairment could have a material adverse effect on our reported financial results for the period in which the charge is taken.
Impairment of long-lived assets may adversely affect our operating results.
We evaluate our long-lived assets for impairment whenever events or changes in circumstances indicate that the carrying amount of such assets may not be recoverable. These events and circumstances include, but are not limited to, a current expectation that a long-lived asset will be disposed of significantly before the end of its previously estimated useful life, a significant adverse change in the extent or manner in which we use a long-lived asset or a change in its physical condition. When this occurs, a recoverability test is performed that compares the projected undiscounted cash flows from the use and eventual disposition of an asset or asset group to its carrying amount. If as a result of this test we conclude that the projected undiscounted cash flows are less than the carrying amount, impairment would be recorded for the excess of the carrying amount over the estimated fair value. The amount of any impairment could have a material adverse effect on our reported financial results for the period in which the charge is taken.
State and municipal government clients may sell or enter into long-term leases of parking-related assets with our competitors or property owners and developers may redevelop existing locations for alternative uses.
In order to raise additional revenue, a number of state and municipal governments have either sold or entered into long-term leases of public assets or may be contemplating such transactions. The assets that are the subject of such transactions have included government-owned parking garages located in downtown commercial districts and parking operations at airports. The sale or long-term leasing of such government-owned parking assets to our competitors or clients of our competitors could have a material adverse effect on our business, financial condition and results of operations.
Additionally, property owners and developers may elect to redevelop existing locations for alternative uses other than parking or significantly reduce the number of existing spaces used for parking at those facilities in which we either lease or operate through a management contract. Reductions in the number of parking spaces or potential loss of contracts due to redevelopment by property owners may reduce our gross profit and cash flow for both our leased facilities and those facilities in which we operate under management contracts.
Our ability to expand our business will be dependent upon the availability of adequate capital.
The rate of our expansion will depend in part on the availability of adequate capital, which in turn will depend in large part on cash flow generated by our business and the availability of equity and debt capital. In addition, our Restated Credit Facility contains provisions that restrict our ability to incur additional indebtedness and/or make substantial investments or acquisitions. As a result, we cannot assure you that we will be able to finance our current growth strategies.
16
The sureties for our performance bond program may elect not to provide us with new or renewal performance bonds for any reason.
As is customary in the industry, a surety provider can refuse to provide a bond principal with new or renewal surety bonds. If any existing or future surety provider refuses to provide us with surety bonds, either generally or because we are unwilling or unable to post collateral at levels sufficient to satisfy the surety's requirements, there can be no assurance that we would be able to find alternate providers on acceptable terms, or at all. Our inability to provide surety bonds could also result in the loss of existing contracts. Failure to find a provider of surety bonds, and our resulting inability to bid for new contracts or renew existing contracts, could have a material adverse effect on our business and financial condition.
Federal health care reform legislation may adversely affect our business and results of operations.
In March 2010, the Patient Protection and Affordable Care Act and the Health Care and Education Reconciliation Act of 2010 were signed into law in the U.S. (collectively, the "Health Care Reform Laws"). The Health Care Reform Laws require large employers to provide a minimum level of health insurance for all qualifying employees or pay penalties for not providing such coverage. In addition, the Health Care Reform Laws establish new regulations on health plans. Accordingly, we could incur costs associated with: (i) providing additional health insurance benefits; (ii) the payment of penalties if the minimum level of coverage is not provided; and (iii) the filing of additional information with the Internal Revenue Service to comply with these laws.
We cannot predict with certainty what additional healthcare initiatives, if any, will be implemented at the federal or state level, or what the ultimate effect of The Health Care Reform Laws or any future legislation or regulation will have on us. In addition, it is possible that the new U.S. President's Administration and U.S. Congress may seek to modify, repeal or otherwise invalidate all, or certain provisions of, the current health care reform legislation. Further, regardless of the prevailing political environment in the United States, if we are unable to raise the rates we charge our clients to cover expenses incurred due to the Health Care Reform Laws or other additional healthcare initiatives, our operating profit could be negatively impacted.
We do not maintain insurance coverage for all possible risks.
We maintain a comprehensive portfolio of insurance policies to help protect us against loss or damage incurred from a wide variety of insurable risks. Each year, we review with our professional insurance advisers whether the insurance policies and associated coverages that we maintain are sufficient to adequately protect us from the various types of risk to which we are exposed in the ordinary course of business. That analysis takes into account various pertinent factors such as the likelihood that we would incur a material loss from any given risk, as well as the cost of obtaining insurance coverage against any such risk. There can be no assurance that we may not sustain a material loss for which we do not maintain any, or adequate, insurance coverage.
Our business success depends on our ability to preserve long-term client relationships.
We primarily provide services pursuant to agreements that are cancelable by either party upon 30-days’ notice. As we generally incur higher initial costs on new contracts, our business associated with long-term client relationships is generally more profitable than short-term client relationships. If we lose a significant number of long-term clients, our profitability could be negatively impacted, even if we gain equivalent revenues from new clients.
Actions of activist investors could disrupt our business.
Public companies have been the target of activist investors. In the event that a third-party, such as an activist investor, proposes to change our governance policies, board of directors, or other aspects of our operations, our review and consideration of such proposals may create a significant distraction for our management and employees. This could negatively impact our ability to execute our long-term growth plan and may require our management to expend significant time and resources. Such proposals may also create uncertainties with respect to our financial position and operations and may adversely affect our ability to attract and retain key employees.
Item 1B. Unresolved Staff Comments
Not applicable.
17
Item 2. Properties
Parking Facilities
We operate parking facilities in 45 states and the District of Columbia in the United States, Puerto Rico and three provinces of Canada. The following table summarizes certain information regarding facilities in which we operate as of December 31, 2016:
# of Locations | # of Spaces | |||||||||||||||||||
States/Provinces | Airports and Urban Cities | Airport | Urban | Total | Airport | Urban | Total | |||||||||||||
Alabama | Airport, Birmingham, and Mobile | 1 | 46 | 47 | 1,074 | 8,500 | 9,574 | |||||||||||||
Alberta | Calgary, Edmonton and Sherwood Park | — | 9 | 9 | — | 1,348 | 1,348 | |||||||||||||
Arizona | Glendale, Phoenix, Scottsdale and Tempe | — | 22 | 22 | — | 19,267 | 19,267 | |||||||||||||
California | Airports, Fresno, Glendale, Long Beach, Los Angeles, Newport Beach, Oakland, Riverside, Sacramento, San Francisco, San Jose, Santa Monica Stockton and other various cities | 19 | 580 | 599 | 28,756 | 241,532 | 270,288 | |||||||||||||
Colorado | Airport, Aurora, Boulder, Broomfield, Colorado Springs, Denver, Golden, Greenwood Village, Lakewood, Lone Tree, Westminster and other various cities | 10 | 161 | 171 | 42,056 | 72,813 | 114,869 | |||||||||||||
Connecticut | Airport, Bridgeport, Hartford, and Stamford | 8 | 5 | 13 | 7,941 | 3,329 | 11,270 | |||||||||||||
Delaware | Wilmington | — | 5 | 5 | — | 1,634 | 1,634 | |||||||||||||
District of Columbia | Washington | — | 73 | 73 | — | 16,054 | 16,054 | |||||||||||||
Florida | Airports, Coral Gables, Ft. Lauderdale, Jacksonville, Miami, Miami Beach, Orlando, South Miami, St. Petersburg, Tampa, West Palm Beach and other various cities | 24 | 209 | 233 | 46,602 | 78,002 | 124,604 | |||||||||||||
Georgia | Airport, Athens, Atlanta, Decatur, and Duluth | 16 | 73 | 89 | 35,367 | 42,780 | 78,147 | |||||||||||||
Hawaii | Airport, Aiea, Honolulu, Kihei, Lahaina, Wailuku and Waipahu | 1 | 42 | 43 | 1,663 | 13,907 | 15,570 | |||||||||||||
Idaho | Airport | 1 | — | 1 | 883 | — | 883 | |||||||||||||
Illinois | Airport, Chicago, Elgin, Evanston, Harvey, Lake County, North Chicago, Oak Park, Rosemont, Schaumburg and other various cities | 13 | 349 | 362 | 37,366 | 137,910 | 175,276 | |||||||||||||
Indiana | Indianapolis and South Bend | — | 2 | 2 | — | 570 | 570 | |||||||||||||
Kansas | Lawrence and Topeka | — | 3 | 3 | — | 1,342 | 1,342 | |||||||||||||
Kentucky | Airport, Covington, Louisville, Frankfort and Lexington | 6 | 39 | 45 | 16,807 | 15,578 | 32,385 | |||||||||||||
Louisiana | Airports, Baton Rouge, Gretna, New Orleans, Shreveport and Westwego | 7 | 66 | 73 | 10,324 | 18,512 | 28,836 | |||||||||||||
Maine | Airports and Portland | 3 | 7 | 10 | 3,081 | 2,759 | 5,840 | |||||||||||||
Maryland | Airport, Annapolis, Baltimore, Bethesda, Chevy Chase, Ellicott City, Landover, Oxon Hill, Rockville and Towson | 6 | 65 | 71 | 27,700 | 62,018 | 89,718 | |||||||||||||
Massachusetts | Attleboro, Boston, Cambridge, Charlestown, Chelsea, Lawrence, Roxbury, Somerville, Springfield, Worcester and various other cities | — | 99 | 99 | — | 33,675 | 33,675 | |||||||||||||
Michigan | Airports, Birmingham, Detroit, Pontiac, Royal Oak and Warren | 14 | 31 | 45 | 34,816 | 14,429 | 49,245 | |||||||||||||
Minnesota | Minneapolis and St. Paul | — | 36 | 36 | — | 9,626 | 9,626 | |||||||||||||
Mississippi | Jackson | — | 11 | 11 | — | 3,288 | 3,288 | |||||||||||||
Missouri | Airports, Clayton, Kansas City, and St. Louis | 7 | 71 | 78 | 24,876 | 29,802 | 54,678 | |||||||||||||
Montana | Airports | 5 | — | 5 | 3,801 | — | 3,801 | |||||||||||||
Nebraska | Airport and Omaha | 2 | 12 | 14 | 1,307 | 2,441 | 3,748 | |||||||||||||
New Hampshire | Airport | 5 | — | 5 | 6,236 | — | 6,236 | |||||||||||||
New Jersey | Atlantic City, Bayonne, Camden, East Rutherford, Jersey City, New Brunswick, Newark, Paterson, Wayne, Weehawken and various other cities | — | 90 | 90 | — | 68,163 | 68,163 | |||||||||||||
New Mexico | Airport and Albuquerque | 1 | 8 | 9 | — | 3,777 | 3,777 | |||||||||||||
18
# of Locations | # of Spaces | |||||||||||||||||||
States/Provinces | Airports and Urban Cities | Airport | Urban | Total | Airport | Urban | Total | |||||||||||||
New York | Airports, Bronx, Brooklyn, Buffalo, Flushing, Hamburg, Long Island City, Manhattan, Queens, Syracuse, White Plains and other various cities | 7 | 263 | 270 | 11,810 | 65,361 | 77,171 | |||||||||||||
Nevada | Las Vegas | — | 21 | 21 | — | 35,630 | 35,630 | |||||||||||||
North Carolina | Airports, Albemarle, Asheville, Carolina Beach, Charlotte, Durham, Greensboro, Wilmington, and Winston Salem | 9 | 89 | 98 | 17,208 | 23,348 | 40,556 | |||||||||||||
North Dakota | Airport | 1 | — | 1 | 2,131 | — | 2,131 | |||||||||||||
Ohio | Airports, Akron, Cincinnati, Cleveland, Columbus, Dayton, Lakewood, and Westerville | 17 | 162 | 179 | 17,655 | 97,171 | 114,826 | |||||||||||||
Oklahoma | Oklahoma City and Tulsa | — | 30 | 30 | — | 7,530 | 7,530 | |||||||||||||
Ontario | Brampton, Cambridge, Kitchener, Mississauga, North York, Oshawa, Ottawa, Sault Ste. Marie, Toronto and various other cities | — | 78 | 78 | — | 33,406 | 33,406 | |||||||||||||
Oregon | Airports, Corvallis, and Portland | 8 | 17 | 25 | 19,133 | 9,353 | 28,486 | |||||||||||||
Pennsylvania | Airports, Chester, Harrisburg, Lancaster, Norristown, Philadelphia, and Pittsburgh | 4 | 65 | 69 | 6,664 | 54,325 | 60,989 | |||||||||||||
Puerto Rico | Caguas, Carolina, Dorado, Guaynabo, Ponce, Rio Grande and San Juan | — | 39 | 39 | — | 18,047 | 18,047 | |||||||||||||
Quebec | Gatineau | — | 8 | 8 | — | 4,647 | 4,647 | |||||||||||||
Rhode Island | Airport, Newport, and Providence | 7 | 6 | 13 | 9,027 | 1,484 | 10,511 | |||||||||||||
South Carolina | Beaufort and Columbia | — | 8 | 8 | — | 1,199 | 1,199 | |||||||||||||
South Dakota | Airport | 1 | — | 1 | 1,800 | — | 1,800 | |||||||||||||
Tennessee | Airports, Germantown, Knoxville, Memphis and Nashville | 4 | 67 | 71 | 10,197 | 15,844 | 26,041 | |||||||||||||
Texas | Airports, Addison, Austin, Dallas, Ft. Worth, Houston, Irving, San Antonio, Waco, Woodlands and other various cities | 42 | 209 | 251 | 53,903 | 132,323 | 186,226 | |||||||||||||
Utah | Airport, Park City and Salt Lake City | 10 | 16 | 26 | 14,769 | 5,536 | 20,305 | |||||||||||||
Virginia | Airports, Arlington, Fairfax, Manassas, Newport News, Norfolk, Richmond, Vienna and various other cities | 7 | 79 | 86 | 11,280 | 35,169 | 46,449 | |||||||||||||
Washington | Airports, Bellevue, Seattle, and other various cities | 2 | 87 | 89 | 2,348 | 35,101 | 37,449 | |||||||||||||
West Virginia | Charleston and South Charleston | — | 17 | 17 | — | 2,950 | 2,950 | |||||||||||||
Wisconsin | Airports, Lacrosse, Madison, Menomonee Falls and Milwaukee | 12 | 31 | 43 | 17,605 | 14,065 | 31,670 | |||||||||||||
Totals | 280 | 3,406 | 3,686 | 526,186 | 1,495,545 | 2,021,731 | ||||||||||||||
For additional information on our properties, see also Part II, Item 7. "Management's Discussion and Analysis of Financial Condition and Results of Operations—Summary of Operating Facilities" and the notes to the Consolidated Financial Statements included in Part II, Item 8. "Financial Statements and Supplementary Data."
Office Leases
We lease approximately 35,000 square feet for our corporate offices in Chicago, Illinois and 25,000 square feet for our support office in Nashville, Tennessee. We believe that these spaces will be adequate to our meet current and foreseeable future needs. We also lease regional offices in various cities in the United States and Canada. These lease agreements generally include renewal and expansion options, and we believe that these facilities are adequate to meet our current and foreseeable future needs.
19
Item 3. Legal Proceedings
General
We are subject to litigation in the normal course of our business. The outcomes of legal proceedings and claims brought against us and other loss contingencies are subject to significant uncertainty. We accrue a charge against income when our management determines that it is probable that an asset has been impaired or a liability has been incurred and the amount of loss can be reasonably estimated. In addition, we accrue for the authoritative judgments or assertions made against us by government agencies at the time of their rendering regardless of our intent to appeal. In addition, we are from time-to-time party to litigation, administrative proceedings and union grievances that arise in the normal course of business, and occasionally pay non-material amounts to resolve claims or alleged violations of regulatory requirements. There are no "normal course" matters that separately or in the aggregate, would, in the opinion of management, have a material adverse effect on our operations, financial condition or cash flow.
In determining the appropriate loss contingencies, we consider the likelihood of loss or impairment of an asset or the incurrence of a liability, as well as our ability to reasonably estimate the amount of potential loss. We regularly evaluate current information available to us to determine whether an accrual should be established or adjusted. Estimating the probability that a loss will occur and estimating the amount of a potential loss or a range of potential loss involves significant estimation and judgment.
Settlement with Former Central Stockholders
On December 15, 2016, we settled disputes involving our acquisition on October 2, 2012 of 100% of the outstanding common shares of KCPC Holdings, Inc., which was the ultimate parent of Central with, among other parties, each of Kohlberg CPC Rep, L.L.C., KOCO Investors V, L.P., Kohlberg Offshore Investors V, L.P., Kohlberg Investors V, L.P., Kohlberg Partners V, L.P., and Kohlberg TE Investors V, L.P. (collectively, the “Kohlberg Entities”); and each of Versa Capital Fund I, L.P. and Versa Capital Fund I Parallel, L.P. (collectively, the “Versa Entities”); and each of Lubert-Adler Real Estate Fund V, L.P. and Lubert-Adler Real Estate Parallel Fund V, L.P. (collectively, “Lubert-Adler Entities”). As of February 22, 2017, the Kohlberg Entities collectively own approximately 16.2% of our common stock, the Versa Entities collectively own approximately 2.3% of our common stock, and the Lubert-Adler Entities collectively own approximately 6.0% of our common stock. In addition, Paul Halpern, who resigned as a director on December 14, 2016, is affiliated with the Versa Entities; and directors Seth H. Hollander, Jonathan P. Ward and Gordon H. Woodward are affiliated with the Kohlberg Entities.
The Agreement and Plan of Merger related to the Central Merger (“Merger Agreement”) provided that Central’s former stockholders were entitled to receive cash consideration in the amount equal to $27.0 million three years after closing, subject to indemnification obligations of Central’s former stockholders and other adjustments. Post-closing claims and disputes arose between the parties, including as to indemnification matters and obligations. On September 27, 2016, the Company and Central's former stockholders agreed-upon non-binding terms to settle all outstanding matters between the parties relating to the Central Merger, and on December 15, 2016 the Company and Central's former stockholders executed a settlement agreement ("Settlement Agreement") to settle all outstanding matters between the parties relating to the Central Merger. Pursuant to the Settlement Agreement, we paid Central's former stockholders $2.5 million in aggregate, which effectively reduced the $27.0 million cash consideration that would have been payable by us to Central's former stockholders under the Merger Agreement by $24.5 million. As a result of the Settlement Agreement, we recorded $0.8 million ($0.5 million, net of tax) within General and administrative expense in the Consolidated Statements of Income during the third quarter 2016. Additionally and pursuant to the Settlement Agreement, the parties fully released one another for claims relating to the Central Merger, and therefore we have no further obligation to pay any additional Cash Consideration Amount to Central's former stockholders. See also Note 2. Central Merger and Restructuring, Merger and Integration Costs to our Consolidated Financial Statements included in Part IV, Item 15. "Exhibits and Financial Statement Schedules" of this Form 10-K.
Holten Settlement
See Note 19. Legal Proceedings to the Condensed Consolidated Financial Statements included in Item 15. "Exhibits and Financial Statement Schedules" for disclosures related to the Holten Settlement reached in March 2016.
Item 4. Mine Safety Disclosures
Not applicable.
20
PART II
Item 5. Market for Registrant's Common Equity, Related Stockholder Matters and Issuer Purchases of Equity Securities
Market Information
Our common stock is listed on the NASDAQ Stock Market LLC under the symbol "SP". The following sets forth the high and low intraday sales prices of our common stock on the NASDAQ Stock Market LLC during each quarter of the two most recent calendar years.
Sales Price | ||||||||||||||||
2016 | 2015 | |||||||||||||||
Quarter Ended | High | Low | High | Low | ||||||||||||
March 31 | $ | 25.00 | $ | 20.67 | $ | 25.39 | $ | 19.71 | ||||||||
June 30 | $ | 24.38 | $ | 20.41 | $ | 27.33 | $ | 21.62 | ||||||||
September 30 | $ | 26.02 | $ | 22.47 | $ | 27.41 | $ | 18.50 | ||||||||
December 31 | $ | 30.30 | $ | 22.60 | $ | 26.39 | $ | 21.66 | ||||||||
Dividends
We did not pay a cash dividend in respect of our common stock in 2016 or 2015. By the terms of our Restated Credit Agreement, we can pay cash dividends on our capital stock while such facility is in effect. Any future dividends will be determined based on earnings, capital requirements, financial condition, and other factors considered relevant by our Board of Directors. There are no restrictions on the ability of our wholly owned subsidiaries to pay cash dividends to us.
Holders
As of February 22, 2017, there were 22,328,578 holders of our common stock, based on the number of record holders of our common stock.
Securities Authorized for Issuance Under Equity Compensation Plans
Plan Category | Number of Securities to be Issued Upon Exercise of Outstanding Options, Warrants and Rights (Column A) | Weighted- Average Exercise Price of Outstanding Options, Warrants and Rights (Column B) | Number of Securities Remaining Available for Future Issuance Under Equity Compensation Plans (Excluding Securities Reflected in Column A) | ||||||
Equity compensation plans approved by securities holders | 666,718 | $ | — | 285,521 | |||||
Equity compensation plans not approved by securities holders | — | — | — | ||||||
Total | 666,718 | $ | — | 285,521 | |||||
21
Stock Repurchases
In May 2016, our Board of Directors authorized us to repurchase, on the open market, shares of our outstanding common stock in an amount not to exceed $30.0 million in aggregate. Purchases of our common stock may be made in open market transactions effected through a broker-dealer at prevailing market prices, in block trades, or by other means in accordance with Rule 10b-18 and 10b5-1under the Securities Exchange Act of 1934 ("Exchange Act"). The share repurchase program does not obligate us to repurchase any particular amount of common stock, and has no fixed termination date. Under this program, we repurchased 305,183 shares of common stock through December 31, 2016. The following table summarizes share repurchase activity during the three months ended December 31, 2016.
Period | Total Number of Shares Repurchased | Average Price Paid (per Share) | Cumulative Number of Shares Purchased as Part of the Current Program | Dollar Value of Shares that May Yet be Purchased Under the Program (in millions) | |||||||||
October 1, 2016 through October 31, 2016 | 63,488 | $ | 24.42 | 285,726 | |||||||||
November 1, 2016 through November 30, 2016 | 19,457 | $ | 24.95 | 305,183 | |||||||||
December 1, 2016 through December 31,2016 | — | $ | — | 305,183 | |||||||||
Total | 82,945 | $ | 22.5 | ||||||||||
Stock Performance Graph
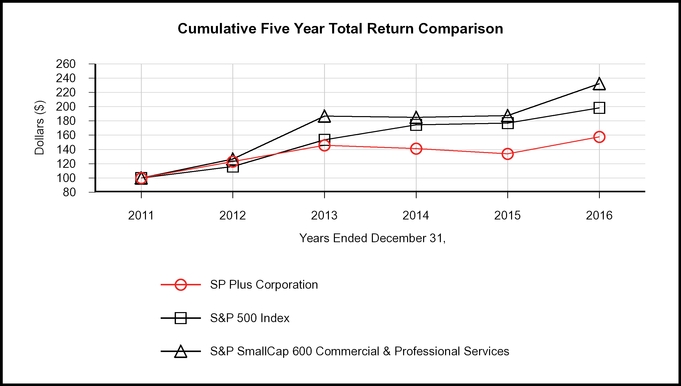
Years Ended December 31, | ||||||||||||||||||
Company / Index | 2011 | 2012 | 2013 | 2014 | 2015 | 2016 | ||||||||||||
SP Plus Corporation | $ | 100.00 | $ | 123.06 | $ | 145.72 | $ | 141.19 | $ | 133.74 | $ | 157.53 | ||||||
S&P 500 Index | $ | 100.00 | $ | 116.00 | $ | 153.57 | $ | 174.60 | $ | 177.01 | $ | 198.18 | ||||||
S&P SmallCap 600 Commercial & Professional Services | $ | 100.00 | $ | 126.37 | $ | 186.71 | $ | 184.98 | $ | 187.37 | $ | 232.24 | ||||||
The performance graph above shows the cumulative total stockholder return of our common stock for the period starting on December 31, 2011 to December 31, 2016. This performance is compared with the cumulative total returns over the same period of the Standard & Poor's 500 Index and the Standard & Poor's SmallCap 600 Commercial and Professional Services Index, which includes our direct competitor, ABM Industries Incorporated. The graph assumes that on December 31, 2011, $100 was invested in each of the other two indices, and assumes reinvestment of dividends. The stock performance shown in the graph represents past performance and should not be considered indication of future performance.
22
Item 6. Selected Financial Data
The following selected consolidated data should be read in conjunction with the consolidated financial statements and the notes thereto, which are included in Item 15. "Exhibits and Financial Statement Schedules" and the information contained in Item 7. "Management's Discussion and Analysis of Financial Condition and Results of Operations." The results of operations for the historical periods are not necessarily indicative of the results to be expected for future periods. See Item 1A. "Risk Factors" of this Annual Report on Form 10-K for a discussion of risk factors that could impact our future results.
Our consolidated results of operations for the years ended December 31, 2016, 2015, 2014 and 2013 include Central's results of operations for the entire year. Our consolidated results of operations for the year ended December 31, 2012 include Central's results of operations for the period October 2, 2012 through December 31, 2012.
Year Ended December 31, | |||||||||||||||||||
(millions) | 2016 | 2015 | 2014 | 2013 | 2012 | ||||||||||||||
Statement of Income | |||||||||||||||||||
Parking services revenue | |||||||||||||||||||
Lease contracts | $ | 545.0 | $ | 570.9 | $ | 496.6 | $ | 489.6 | $ | 250.3 | |||||||||
Management contracts | 346.8 | 350.3 | 338.3 | 347.3 | 230.5 | ||||||||||||||
891.8 | 921.2 | 834.9 | 836.9 | 480.8 | |||||||||||||||
Reimbursed management contract revenue | 723.7 | 694.7 | 679.8 | 629.9 | 473.1 | ||||||||||||||
Total parking services revenue | 1,615.5 | 1,615.9 | 1,514.7 | 1,466.8 | 953.9 | ||||||||||||||
Cost of parking services | |||||||||||||||||||
Lease contracts | 505.6 | 532.8 | 455.7 | 456.1 | 231.8 | ||||||||||||||
Management contracts | 209.8 | 218.3 | 207.9 | 208.7 | 141.9 | ||||||||||||||
715.4 | 751.1 | 663.6 | 664.8 | 373.7 | |||||||||||||||
Reimbursed management contract expense | 723.7 | 694.7 | 679.8 | 629.9 | 473.1 | ||||||||||||||
Total cost of parking services | 1,439.1 | 1,445.8 | 1,343.4 | 1,294.7 | 846.8 | ||||||||||||||
Gross profit | |||||||||||||||||||
Lease contracts | 39.4 | 38.1 | 40.9 | 33.5 | 18.6 | ||||||||||||||
Management contracts | 137.0 | 132.0 | 130.4 | 138.6 | 88.5 | ||||||||||||||
Total gross profit | 176.4 | 170.1 | 171.3 | 172.1 | 107.1 | ||||||||||||||
General and administrative expenses | 90.0 | 97.3 | 101.5 | 98.9 | 86.5 | ||||||||||||||
Depreciation and amortization | 33.7 | 34.0 | 30.3 | 31.2 | 13.5 | ||||||||||||||
Operating income | 52.7 | 38.8 | 39.5 | 42.0 | 7.1 | ||||||||||||||
Other expense (income) | |||||||||||||||||||
Interest expense | 10.5 | 12.7 | 17.8 | 19.0 | 8.6 | ||||||||||||||
Interest income | (0.5 | ) | (0.2 | ) | (0.4 | ) | (0.6 | ) | (0.3 | ) | |||||||||
Gain on sale of business | — | (0.5 | ) | — | — | — | |||||||||||||
Gain on contribution of a business to an unconsolidated entity | — | — | (4.1 | ) | — | — | |||||||||||||
Equity in losses from investments in unconsolidated entity | 0.9 | 1.7 | 0.3 | — | — | ||||||||||||||
Total other expense (income) | 10.9 | 13.7 | 13.6 | 18.4 | 8.3 | ||||||||||||||
Earnings (loss) before income taxes | 41.8 | 25.1 | 25.9 | 23.6 | (1.2 | ) | |||||||||||||
Income tax expense (benefit) | 15.8 | 4.8 | (0.2 | ) | 8.8 | (3.6 | ) | ||||||||||||
Net income | 26.0 | 20.3 | 26.1 | 14.8 | 2.4 | ||||||||||||||
Less: Net income attributable to noncontrolling interest | 2.9 | 2.9 | 3.0 | 2.7 | 1.0 | ||||||||||||||
Net income attributable to SP Plus Corporation (1) | $ | 23.1 | $ | 17.4 | $ | 23.1 | $ | 12.1 | $ | 1.4 | |||||||||
Balance sheet data (at end of year) | |||||||||||||||||||
Cash and cash equivalents | $ | 22.2 | $ | 18.7 | $ | 18.2 | $ | 23.2 | $ | 28.5 | |||||||||
Total assets (2) (4) | 778.6 | 784.1 | 823.1 | 858.5 | 900.0 | ||||||||||||||
Total debt (3) (4) | 195.1 | 225.1 | 250.8 | 284.8 | 305.3 | ||||||||||||||
Total SP Plus Corporation stockholders' equity (5) | $ | 268.4 | $ | 250.1 | $ | 229.8 | $ | 203.1 | $ | 186.2 | |||||||||
(1) | Net income attributable to SP Plus Corporation for 2012 includes the following significant amounts from the Central Merger: Total revenue, excluding reimbursed revenue, of $127.8 million; total cost of parking services, excluding reimbursed expense, of $190.0 million; and general and administrative expenses of $24.6 million. |
(2) | Total assets as of December 31, 2012 includes the impact of assets acquired in the Central Merger of $624.9 million. |
(3) | Total long-term debt, including current portion as of December 31, 2012, includes $217.7 million of debt, net of cash acquired, assumed in the Central Merger. |
(4) | Total assets and total debt for the years ended December 31, 2015, 2014, 2013 and 2012 have been adjusted for the adoption of ASU 2015-03. |
(5) | Total SP Plus Corporation stockholders' equity as of December 31, 2012 includes approximately $140.7 million related to the issuance of our common stock in the Central Merger. |
23
Item 7. Management's Discussion and Analysis of Financial Condition and Results of Operations
This Item 7. "Management's Discussion and Analysis of Financial Condition and Results of Operations," and other parts of this Form 10-K contain forward-looking statements, within the meaning of the Private Securities Litigation Reform Act of 1995, that involve risks and uncertainties. Forward-looking statements provide current expectations of future events based on certain assumptions and include any statement that does not directly relate to any historical or current fact. Forward-looking statements can also be identified by words such as "future," "anticipates," "believes," "estimates," "expects," "intends," "plans," "predicts," "will," "would," "could," "can," "may," and similar terms. Forward-looking statements are not guarantees of future performance and the Company's actual results may differ significantly from the results discussed in the forward-looking statements. Factors that might cause such differences include, but are not limited to, those discussed in Part I, Item 1A. "Risk Factors" of this Form 10-K, which are incorporated herein by reference. The following discussion should be read in conjunction with the consolidated financial statements and notes thereto included in Part II, Item 8. "Financial Statements and Supplementary Data" of this Form 10-K. Each of the terms the "Company" and "SP Plus" as used herein refers collectively to SP Plus Corporation and its wholly owned subsidiaries, unless otherwise stated. The Company assumes no obligation to revise or update any forward-looking statements for any reason, except as required by law.
Overview
Our Business
We provide parking management, ground transportation and other ancillary services to commercial, institutional and municipal clients in urban markets and airports across the United States, Puerto Rico and Canada. Our services include a comprehensive set of on-site parking management and ground transportation services, which include facility maintenance, security services, training, scheduling and supervising all service personnel as well as providing customer service, marketing, and accounting and revenue control functions necessary to facilitate the operation of our clients' facilities or events. We also provide a range of ancillary services such as airport shuttle operations, valet services, taxi and livery dispatch services and municipal meter revenue collection and enforcement services. We typically enter into contractual relationships with property owners or managers as opposed to owning facilities.
We operate our clients' properties through two types of arrangements: management contracts and leases. Under a management contract, we typically receive a base monthly fee for managing the facility, and we may also receive an incentive fee based on the achievement of facility performance objectives. We also receive fees for ancillary services. Typically, all of the underlying revenues and expenses under a standard management contract flow through to our clients rather than to us. However, some management contracts, which are referred to as "reverse" management contracts, usually provide for larger management fees and require us to pay various costs. Under lease arrangements, we generally pay to the property owner either a fixed annual rent, a percentage of gross customer collections or a combination thereof. We collect all revenues under lease arrangements and we are responsible for most operating expenses, but we are typically not responsible for major maintenance, capital expenditures or real estate taxes. Margins for lease contracts vary significantly, not only due to operating performance, but also due to variability of parking rates in different cities and varying space utilization by parking facility type and location. As of December 31, 2016, we operated 81% of our locations under management contracts and 19% under leases.
In evaluating our financial condition and operating performance, management's primary focus is on our gross profit and total general and administrative expense. Although the underlying economics to us of management contracts and leases are similar, the manner in which we are required to account for them differs. Revenue from leases includes all gross customer collections derived from our leased locations (net of local parking taxes), whereas revenue from management contracts only includes our contractually agreed upon management fees and amounts attributable to ancillary services. Gross customer collections at facilities under management contracts, therefore, are not included in our revenue. Accordingly, while a change in the proportion of our operating agreements that are structured as leases versus management contracts may cause significant fluctuations in reported revenue and expense of parking services, that change will not artificially affect our gross profit. For example, as of December 31, 2016, 81% of our locations were operated under management contracts and 78% of our gross profit for the year ended December 31, 2016 was derived from management contracts. Only 39% of total revenue (excluding reimbursed management contract revenue), however, was from management contracts because under those contracts the revenue collected from parking customers belongs to our clients. Therefore, gross profit and total general and administrative expense, rather than revenue, are management's primary focus.
Investment in Joint Venture and Sale of Business
In October 2014, we entered into an agreement to establish a joint venture with Parkmobile USA and contributed all of the assets and liabilities of our proprietary Click and Park® parking prepayment business in exchange for a 30 percent interest in the newly formed legal entity called Parkmobile, LLC. Parkmobile is a leading provider of on-demand and prepaid transaction processing for on- and off-street parking and transportation services. The Parkmobile joint venture combines two parking transaction engines, with SP Plus contributing the Click and Park® parking prepayment systems, which enables consumers to reserve and pay for parking online in advance and Parkmobile USA contributing its on demand transaction engine that allows consumers to transact real-time payment for parking privileges in both on- and off-street environments. We account for our investment in the joint venture with Parkmobile under the equity method of accounting.
In August 2015, we sold portions of our security business primarily operating in the Southern California market to a third-party for a gross sales price of $1.8 million, which resulted in a gain on sale of business of $0.5 million, net of legal and other expenses. The pre-tax profit for the operations of the sold business was not significant to the periods presented herein.
24
Summary of Operating Facilities
The following table reflects our facilities operated at the end of the years indicated:
December 31, | ||||||||
2016 | 2015 | 2014 | ||||||
Leased facilities (1) | 688 | 713 | 774 | |||||
Managed facilities (1) (2) | 2,998 | 3,161 | 3,348 | |||||
Total facilities | 3,686 | 3,874 | 4,122 | |||||
(1) | Includes partial ownership in one managed facility and one leased facility for 2016 and 2015, and two managed facilities and one leased facility acquired in the Central Merger for 2014. |
(2) | Adjusted to exclude managed facilities related to the security business primarily operating in the Southern California market for December 31, 2015 and 2014. |
Revenue
We recognize parking services revenue from lease and management contracts as the related services are provided. Substantially all of our revenues come from the following two sources:
• | Parking services revenue—lease contract. Parking services revenues related to lease contracts consist of all revenue received at a leased facility, including parking receipts (net of parking tax), consulting and real estate development fees, gains on sales of contracts and payments for exercising termination rights. |
• | Parking services revenue—management contract. Management contract revenue consists of management fees, including both fixed and performance-based fees, and amounts attributable to ancillary services such as accounting, equipment leasing, payments received for exercising termination rights, consulting, development fees, gains on sales of contracts, insurance and other value-added services with respect to managed locations. We believe we generally purchase required insurance at lower rates than our clients can obtain on their own because we effectively self-insured for all liability, worker's compensation and health care claims by maintaining a large per-claim deductible. As a result, we have generated operating income on the insurance provided under our management contracts by focusing on our risk management efforts and controlling losses. Management contract revenues do not include gross customer collections at the managed locations as these revenues belong to the property owners rather than to us. Management contracts generally provide us with management fees regardless of the operating performance of the underlying facilities. |
Conversions between type of contracts, lease or management, are typically determined by our clients and not us. Although the underlying economics to us of management contracts and leases are similar, the manner in which we account for them differs substantially.
Reimbursed Management Contract Revenue
Reimbursed management contract revenue consists of the direct reimbursement from the property owner for operating expenses incurred under a management contract, which is reflected in our revenue.
Cost of Parking Services
Our cost of parking services consists of the following:
• | Cost of parking services—lease contract. The cost of parking services under a lease arrangement consists of contractual rental fees paid to the facility owner and all operating expenses incurred in connection with operating the leased facility. Contractual fees paid to the facility owner are generally based on either a fixed contractual amount or a percentage of gross revenue or a combination thereof. Generally, under a lease arrangement we are not responsible for major capital expenditures or real estate taxes. |
• | Cost of parking services—management contract. The cost of parking services under a management contract is generally the responsibility of the facility owner. As a result, these costs are not included in our results of operations. However, our reverse management contracts, which typically provide for larger management fees, do require us to pay for certain costs. |
Reimbursed Management Contract Expense
Reimbursed management contract expense consists of direct reimbursed costs incurred on behalf of property owners under a management contract, which is reflected in our cost of parking services.
Gross Profit
Gross profit equals our revenue less the cost of generating such revenue. This is the key metric we use to examine our performance because it captures the underlying economic benefit to us of both lease contracts and management contracts.
25
General and Administrative Expenses
General and administrative expenses include salaries, wages, benefits, payroll taxes, insurance, travel and office related expenses for our headquarters, field offices, supervisory employees, and board of directors.
Depreciation and Amortization
Depreciation is determined using a straight-line method over the estimated useful lives of the various asset classes or in the case of leasehold improvements, over the initial term of the operating lease or its useful life, whichever is shorter. Intangible assets determined to have finite lives are amortized over their estimated remaining useful life.
Results of Operations
Segments
An operating segment is defined as a component of an enterprise that engages in business activities from which it may earn revenue and incur expenses, and about which separate financial information is regularly evaluated by our chief operating decision maker ("CODM"), in deciding how to allocate resources. Our CODM is our president and chief executive officer.
Effective January 1, 2016, we began certain organizational and executive leadership changes to align with how our CODM reviews performance and makes decisions in managing the Company and as a result, changed internal operating segment information reported to the CODM. The operating segments are internally reported as Region One (Urban), Region Two (Airport Transportation) and Region Three (other reporting units of USA Parking and event planning and transportation services), and "Other." All prior periods presented have been restated to reflect the new internal reporting to the CODM.
• | Region One (Urban) encompasses our services in healthcare facilities, municipalities, including meter revenue collection and enforcement services, government facilities, hotels, commercial real estate, residential communities, retail, colleges and universities, as well as ancillary services such as shuttle and transportation services, valet services, taxi and livery dispatch services. |
• | Region Two (Airport transportation) encompasses our services at all major airports as well as ancillary services, which includes shuttle and transportation services and valet services. |
• | Region Three encompasses other operating segments including USA Parking and event planning, including shuttle and transportation services. |
• | "Other" consists of ancillary revenue that is not specifically identifiable to a region and certain unallocated insurance reserves adjustments. |
26
Fiscal 2016 Compared to Fiscal 2015
The following tables are a summary of revenues (excluding reimbursed management contract revenue), cost of parking services (excluding reimbursed management contract expense) and gross profit by regions for the comparable years ended December 31, 2016 and 2015.
Segment revenue information is summarized as follows:
Year Ended December 31, | ||||||||||||||||||||||||||||||||||||||||||||||
Region One | Region Two | Region Three | Other | Total | Variance | |||||||||||||||||||||||||||||||||||||||||
(millions) | 2016 | 2015 | 2016 | 2015 | 2016 | 2015 | 2016 | 2015 | 2016 | 2015 | Amount | % | ||||||||||||||||||||||||||||||||||
Lease contract revenue | ||||||||||||||||||||||||||||||||||||||||||||||
New location | $ | 19.5 | $ | 4.2 | $ | 75.5 | $ | 71.7 | $ | 0.6 | $ | — | $ | — | $ | — | $ | 95.6 | $ | 75.9 | $ | 19.7 | 26.0 | % | ||||||||||||||||||||||
Contract expirations | 14.6 | 62.5 | 1.6 | 5.4 | 0.7 | 1.2 | — | — | 16.9 | 69.1 | (52.2 | ) | (75.5 | )% | ||||||||||||||||||||||||||||||||
Same location | 363.4 | 355.2 | 47.6 | 46.7 | 3.4 | 3.0 | — | — | 414.4 | 404.9 | 9.5 | 2.3 | % | |||||||||||||||||||||||||||||||||
Conversions | 17.0 | 20.8 | — | — | 1.1 | 0.2 | — | — | 18.1 | 21.0 | (2.9 | ) | (13.8 | )% | ||||||||||||||||||||||||||||||||
Total lease contract revenue | $ | 414.5 | $ | 442.7 | $ | 124.7 | $ | 123.8 | $ | 5.8 | $ | 4.4 | $ | — | $ | — | $ | 545.0 | $ | 570.9 | $ | (25.9 | ) | (4.5 | )% | |||||||||||||||||||||
Management contract revenue | ||||||||||||||||||||||||||||||||||||||||||||||
New location | $ | 35.1 | $ | 9.0 | $ | 13.7 | $ | 0.9 | $ | 5.4 | $ | 0.8 | $ | — | $ | — | $ | 54.2 | $ | 10.7 | $ | 43.5 | 406.5 | % | ||||||||||||||||||||||
Contract expirations | 6.9 | 27.0 | 16.0 | 45.4 | 4.7 | 9.1 | — | — | 27.6 | 81.5 | (53.9 | ) | (66.1 | )% | ||||||||||||||||||||||||||||||||
Same location | 158.6 | 154.4 | 58.4 | 54.3 | 34.1 | 34.9 | 13.0 | 13.9 | 264.1 | 257.5 | 6.6 | 2.6 | % | |||||||||||||||||||||||||||||||||
Conversions | 0.6 | 0.5 | — | — | 0.3 | 0.1 | — | — | 0.9 | 0.6 | 0.3 | 50.0 | % | |||||||||||||||||||||||||||||||||
Total management contract revenue | $ | 201.2 | $ | 190.9 | $ | 88.1 | $ | 100.6 | $ | 44.5 | $ | 44.9 | $ | 13.0 | $ | 13.9 | $ | 346.8 | $ | 350.3 | $ | (3.5 | ) | (1.0 | )% | |||||||||||||||||||||
Parking services revenue—lease contract
Lease contract revenue decreased $25.9 million, or 4.5%, to $545.0 million for the year ended December 31, 2016, compared to $570.9 million for the year-ago period. The decrease resulted primarily from decreases in revenue from contract expirations and locations that converted from management contracts during the year, partially offset by increases in revenue from new locations and same locations. Same location revenue increased $9.5 million, or 2.3%, primarily due to monthly parking revenue and transient revenue.
From a reporting segment perspective, lease contract revenue decreased primarily due to contract expirations in all three operating regions, and conversions in region one. This was partially offset by increases in revenue from new and same locations in all three operating regions, and conversions in region three. Same location revenue increases for the aforementioned regions were primarily due to increases in monthly parking revenue and transient revenue.
Revenue associated with contract expirations relates to contracts that have expired, however, we were operating the facility in the comparative period.
Parking services revenue—management contract
Management contract revenue decreased $3.5 million, or 1.0%, to $346.8 million for the year ended December 31, 2016, compared to $350.3 million for the year-ago period. The decrease resulted primarily from decreases in revenue from contract expirations, partially offset by increases in revenue from new locations, same locations and locations that converted from lease contracts. Same location revenue increased $6.6 million, or 2.6%, primarily due to an increase in fees from ancillary services.
From a reporting segment perspective, management contract revenue decreased primarily due to contract expirations in all three operating regions, same locations in region three and other. This was partially offset by increases in new locations in all three operating regions, same locations in regions one and two, and conversions in regions one and three. The other region amounts in same location represent revenues not specifically identifiable to a region.
Revenue associated with contract expirations relates to contracts that have expired, however, we were operating the facility in the comparative period.
Reimbursed management contract revenue
Reimbursed management contract revenue increased $29.0 million, or 4.2%, to $723.7 million for the year ended December 31, 2016, compared to $694.7 million in the year-ago period. This increase resulted primarily from an increase in reimbursements for costs incurred on behalf of owners.
27
Segment cost of parking services information is summarized as follows:
Year Ended December 31, | ||||||||||||||||||||||||||||||||||||||||||||||
Region One | Region Two | Region Three | Other | Total | Variance | |||||||||||||||||||||||||||||||||||||||||
(millions) | 2016 | 2015 | 2016 | 2015 | 2016 | 2015 | 2016 | 2015 | 2016 | 2015 | Amount | % | ||||||||||||||||||||||||||||||||||
Cost of parking services lease contracts: | ||||||||||||||||||||||||||||||||||||||||||||||
New location | $ | 19.0 | $ | 3.9 | $ | 73.8 | $ | 70.2 | $ | 0.6 | $ | — | $ | — | $ | — | $ | 93.4 | $ | 74.1 | $ | 19.3 | 26.0 | % | ||||||||||||||||||||||
Contract expirations | 14.5 | 59.3 | 1.6 | 5.2 | 0.7 | 1.2 | — | — | 16.8 | 65.7 | (48.9 | ) | (74.4 | )% | ||||||||||||||||||||||||||||||||
Same location | 332.4 | 324.5 | 43.6 | 42.9 | 2.8 | 2.7 | (0.3 | ) | 3.5 | 378.5 | 373.6 | 4.9 | 1.3 | % | ||||||||||||||||||||||||||||||||
Conversions | 16.0 | 19.2 | — | — | 0.9 | 0.2 | — | — | 16.9 | 19.4 | (2.5 | ) | (12.9 | )% | ||||||||||||||||||||||||||||||||
Total cost of parking services lease contracts | $ | 381.9 | $ | 406.9 | $ | 119.0 | $ | 118.3 | $ | 5.0 | $ | 4.1 | $ | (0.3 | ) | $ | 3.5 | $ | 505.6 | $ | 532.8 | $ | (27.2 | ) | (5.1 | )% | ||||||||||||||||||||
Cost of parking services management contracts: | ||||||||||||||||||||||||||||||||||||||||||||||
New location | $ | 22.0 | $ | 5.7 | $ | 12.5 | $ | 0.6 | $ | 3.5 | $ | 0.5 | $ | — | $ | — | $ | 38.0 | $ | 6.8 | $ | 31.2 | 458.8 | % | ||||||||||||||||||||||
Contract expirations | 4.8 | 17.0 | 16.1 | 44.5 | 3.7 | 7.5 | — | — | 24.6 | 69.0 | (44.4 | ) | (64.3 | )% | ||||||||||||||||||||||||||||||||
Same location | 87.8 | 83.2 | 34.3 | 31.0 | 24.3 | 25.2 | 0.5 | 2.9 | 146.9 | 142.3 | 4.6 | 3.2 | % | |||||||||||||||||||||||||||||||||
Conversions | — | 0.1 | — | — | 0.3 | 0.1 | — | — | 0.3 | 0.2 | 0.1 | 50.0 | % | |||||||||||||||||||||||||||||||||
Total cost of parking services management contracts | $ | 114.6 | $ | 106.0 | $ | 62.9 | $ | 76.1 | $ | 31.8 | $ | 33.3 | $ | 0.5 | $ | 2.9 | $ | 209.8 | $ | 218.3 | $ | (8.5 | ) | (3.9 | )% | |||||||||||||||||||||
Cost of parking services—lease contracts
Cost of parking services for lease contracts decreased $27.2 million, or 5.1%, to $505.6 million for the year ended December 31, 2016, compared to $532.8 million for the year-ago period. The decrease resulted primarily from decreases in costs from contract expirations, and locations that converted from management contracts during the year, partially offset by increases in costs from new locations and same locations. Same location costs increased $4.9 million, or 1.3%, primarily due to an increase in rent expense as a result of higher revenues for same locations, partially offset by a decrease in structural and repair costs related to certain lease contracts acquired in the Central Merger.
From a reporting segment perspective, cost of parking services for lease contracts decreased primarily due to contract expirations in all three operating regions, same locations in other, and conversions in region one. This was partially offset by increases in new locations in all three operating regions, same locations in all three operating regions and conversions in region three. The other region amounts represent structural repair cost related to certain lease contracts acquired in the Central Merger and other costs that are not specifically identifiable to a region.
Cost of parking services associated with contract expirations relates to contracts that have expired, however, we were operating the facility in the comparative period presented.
Cost of parking services—management contracts
Cost of parking services for management contracts decreased $8.5 million, or 3.9%, to $209.8 million for the year ended December 31, 2016, compared to $218.3 million for the year-ago period. The decrease resulted primarily from decreases in costs from contract expirations, partially offset by increases in new locations, same locations and locations that converted from lease contracts. Same locations costs increased $4.6 million, or 3.2%, primarily due to increased revenues from ancillary services, partially offset by decreased costs relating to certain unallocated insurance reserve adjustments.
From a reporting segment perspective, cost of parking services for management contracts decreased primarily due to contract expirations in all three operating regions, same locations in region three and other. This was partially offset by increases in new locations in all three operating regions, same locations in regions one and two, and conversions in regions one and three. The other region amounts represent prior year insurance reserve adjustments and other costs that are not specifically identifiable to a region.
Cost of parking services associated with contract expirations relates to contracts that have expired, however, we were operating the facility in the comparative period presented.
Reimbursed management contract expense
Reimbursed management contract expense increased $29.0 million, or 4.2%, to $723.7 million for the year ended December 31, 2016, compared to $694.7 million in the year-ago period. This increase resulted primarily from an increase in reimbursements for costs incurred on behalf of owners.
28
Segment gross profit/gross profit percentage information is summarized as follows:
Year Ended December 31, | ||||||||||||||||||||||||||||||||||||||||||||||
Region One | Region Two | Region Three | Other | Total | Variance | |||||||||||||||||||||||||||||||||||||||||
(millions) | 2016 | 2015 | 2016 | 2015 | 2016 | 2015 | 2016 | 2015 | 2016 | 2015 | Amount | % | ||||||||||||||||||||||||||||||||||
Gross profit lease contracts: | ||||||||||||||||||||||||||||||||||||||||||||||
New location | $ | 0.5 | $ | 0.3 | $ | 1.7 | $ | 1.5 | $ | — | $ | — | $ | — | $ | — | $ | 2.2 | $ | 1.8 | $ | 0.4 | 22.2 | % | ||||||||||||||||||||||
Contract expirations | 0.1 | 3.2 | — | 0.2 | — | — | — | — | 0.1 | 3.4 | (3.3 | ) | (97.1 | )% | ||||||||||||||||||||||||||||||||
Same location | 31.0 | 30.7 | 4.0 | 3.8 | 0.6 | 0.3 | 0.3 | (3.5 | ) | 35.9 | 31.3 | 4.6 | 14.7 | % | ||||||||||||||||||||||||||||||||
Conversions | 1.0 | 1.6 | — | — | 0.2 | — | — | — | 1.2 | 1.6 | (0.4 | ) | (25.0 | )% | ||||||||||||||||||||||||||||||||
Total gross profit lease contracts | $ | 32.6 | $ | 35.8 | $ | 5.7 | $ | 5.5 | $ | 0.8 | $ | 0.3 | $ | 0.3 | $ | (3.5 | ) | $ | 39.4 | $ | 38.1 | $ | 1.3 | 3.4 | % | |||||||||||||||||||||
(Percentages) | ||||||||||||||||||||||||||||||||||||||||||||||
Gross profit percentage lease contracts: | ||||||||||||||||||||||||||||||||||||||||||||||
New location | 2.6 | % | 7.1 | % | 2.3 | % | 2.1 | % | — | % | — | % | — | % | — | % | 2.3 | % | 2.4 | % | ||||||||||||||||||||||||||
Contract expirations | 0.7 | % | 5.1 | % | — | % | 3.7 | % | — | % | — | % | — | % | — | % | 0.6 | % | 4.9 | % | ||||||||||||||||||||||||||
Same location | 8.5 | % | 8.6 | % | 8.4 | % | 8.1 | % | 17.6 | % | 10.0 | % | — | % | — | % | 8.7 | % | 7.7 | % | ||||||||||||||||||||||||||
Conversions | 5.9 | % | 7.7 | % | — | % | — | % | 18.2 | % | — | % | — | % | — | % | 6.6 | % | 7.6 | % | ||||||||||||||||||||||||||
Total gross profit percentage | 7.9 | % | 8.1 | % | 4.6 | % | 4.4 | % | 13.8 | % | 6.8 | % | — | % | — | % | 7.2 | % | 6.7 | % | ||||||||||||||||||||||||||
Gross profit management contracts: | ||||||||||||||||||||||||||||||||||||||||||||||
New location | $ | 13.1 | $ | 3.3 | $ | 1.2 | $ | 0.3 | $ | 1.9 | $ | 0.3 | $ | — | $ | — | $ | 16.2 | $ | 3.9 | $ | 12.3 | 315.4 | % | ||||||||||||||||||||||
Contract expirations | 2.1 | 10.0 | (0.1 | ) | 0.9 | 1.0 | 1.6 | — | — | 3.0 | 12.5 | (9.5 | ) | (76.0 | )% | |||||||||||||||||||||||||||||||
Same location | 70.8 | 71.2 | 24.1 | 23.3 | 9.8 | 9.7 | 12.5 | 11.0 | 117.2 | 115.2 | 2.0 | 1.7 | % | |||||||||||||||||||||||||||||||||
Conversions | 0.6 | 0.4 | — | — | — | — | — | — | 0.6 | 0.4 | 0.2 | 50.0 | % | |||||||||||||||||||||||||||||||||
Total gross profit management contracts | $ | 86.6 | $ | 84.9 | $ | 25.2 | $ | 24.5 | $ | 12.7 | $ | 11.6 | $ | 12.5 | $ | 11.0 | $ | 137.0 | $ | 132.0 | $ | 5.0 | 3.8 | % | ||||||||||||||||||||||
(Percentages) | ||||||||||||||||||||||||||||||||||||||||||||||
Gross profit percentage management contracts: | ||||||||||||||||||||||||||||||||||||||||||||||
New location | 37.3 | % | 36.7 | % | 8.8 | % | 33.3 | % | 35.2 | % | 37.5 | % | — | % | — | % | 29.9 | % | 36.4 | % | ||||||||||||||||||||||||||
Contract expirations | 30.4 | % | 37.0 | % | -0.6 | % | 2.0 | % | 21.3 | % | 17.6 | % | — | % | — | % | 10.9 | % | 15.3 | % | ||||||||||||||||||||||||||
Same location | 44.6 | % | 46.1 | % | 41.3 | % | 42.9 | % | 28.7 | % | 27.8 | % | 96.2 | % | 79.1 | % | 44.4 | % | 44.7 | % | ||||||||||||||||||||||||||
Conversions | 100.0 | % | 80.0 | % | — | % | — | % | — | % | — | % | — | % | — | % | 66.7 | % | 66.7 | % | ||||||||||||||||||||||||||
Total gross profit percentage | 43.0 | % | 44.5 | % | 28.6 | % | 24.4 | % | 28.5 | % | 25.8 | % | 96.2 | % | 79.1 | % | 39.5 | % | 37.7 | % | ||||||||||||||||||||||||||
Gross profit—lease contracts
Gross profit for lease contracts increased $1.3 million, or 3.4%, to $39.4 million for the year ended December 31, 2016, compared to $38.1 million for year-ago period. Gross profit percentage for lease contracts was 7.2% for the year ended December 31, 2016 compared to 6.7% for the year-ago period. Gross profit lease contracts increased primarily due to new locations and same locations, partially offset by contract expirations and locations that converted from management contracts during the year. Gross profit on same locations increased primarily due to an increase in revenue by monthly parkers and transient, partially offset by an increase in operating costs, primarily driven by an increase in rent costs.
From a reporting segment perspective, gross profit for lease contracts increased primarily due to new locations in regions one and two, same locations in all three operating regions and other, and conversions in region three. This was partially offset by decreases in contract expirations in regions one and two, and conversions in region one.
Gross profit associated with contract expirations relates to contracts that have expired, however, we were operating the facility in the comparative period presented.
Gross profit—management contracts
Gross profit for management contracts increased $5.0 million, or 3.8%, to $137.0 million for the year ended December 31, 2016, compared to $132.0 million in for the year-ago period. Gross profit for management contracts increases were primarily the result of new locations, same locations and locations that converted from lease contracts, partially offset by decreases in contract expirations. Gross profit management contracts increased on same locations primarily as the result of increased revenues, partially offset by increased operating costs.
From a reporting segment perspective, gross profit for management contracts increased primarily due new locations in all three operating regions, same locations in regions two and three and other and conversions in region one. This was partially offset by decreases in contract expirations in all three operating regions and same locations in region one.
29
Gross profit associated with contract expirations relates to contracts that have expired, however, we were operating the facility in the comparative period presented.
General and administrative expenses
General and administrative expenses decreased $7.3 million, or 7.5%, to $90.0 million for year ended December 31, 2016, compared to $97.3 million for the year-ago period. The decrease in General and administrative expenses primarily related to a decrease in compensation and benefit costs, merger and integration costs, and overall better expense control, partially offset by increases in expected pay-out under our performance based compensation and long-term incentive compensation programs, a $0.8 million charge related to the settlement of all outstanding matters between the Company and Central's former stockholders relating to the Central Merger and a $1.5 million charge, net of insurance recoveries, related to settling previous litigation with former indirect controlling shareholder of the Company.
Interest expense
Interest expense decreased $2.2 million, or 17.3%, to $10.5 million for the year ended December 31, 2016, as compared to $12.7 million for the year-ago period. This decrease resulted primarily from a decrease in average borrowing rates and reductions in borrowings under our Restated Credit Facility and Senior Credit Facility.
Interest income
Interest income increased a nominal amount of $0.2 million, or 100.0%, to $0.4 million for the year ended December 31, 2016, as compared to $0.2 million in the year-ago period.
Gain on sale of a business
During the third quarter 2015, we recognized a $0.5 million gain on the sale of a portion of our security business primarily operating in the Southern California market.
Equity in losses from investment in unconsolidated entity
Equity in losses from investment in unconsolidated entity relates to our investment in the joint venture with Parkmobile accounted for under the equity method of accounting and our share of equity earnings in the Parkmobile joint venture. Equity in losses from investment in unconsolidated entity was $0.9 million for the year ended December 31, 2016, as compared to $1.7 million in the year-ago period.
Income tax expense
For the year ended December 31, 2016, we recognized income tax expense of $15.8 million on pre-tax earnings of $41.8 million compared to a $4.8 million income tax expense on pre-tax earnings of $25.1 million for the year ended December 31, 2015. Our effective tax rate was 37.7% for the year ended December 31, 2016 compared to 19.1% for the year ended December 31, 2015. The $11.0 million increase in income tax expense was primarily due to a decrease in valuation allowance reversals recognized for historical net operating losses for the year ended December 31, 2015, compared to the year ended December 31, 2016, and an increase in the pre-tax income of the Company for the year ended December 31, 2016, compared to the year ended December 31, 2015.
30
Fiscal 2015 Compared to Fiscal 2014
The following tables are a summary of revenues (excluding reimbursed management contract revenue), cost of parking services (excluding reimbursed management contract expense) and gross profit by regions for the comparable years ended 2015 and 2014.
Segment revenue information is summarized as follows:
Year Ended December 31, | ||||||||||||||||||||||||||||||||||||||||||||||
Region One | Region Two | Region Three | Other | Total | Variance | |||||||||||||||||||||||||||||||||||||||||
(millions) | 2015 | 2014 | 2015 | 2014 | 2015 | 2014 | 2015 | 2014 | 2015 | 2014 | Amount | % | ||||||||||||||||||||||||||||||||||
Lease contract revenue: | ||||||||||||||||||||||||||||||||||||||||||||||
New location | $ | 20.1 | $ | 6.9 | $ | 81.8 | $ | 4.5 | $ | 0.4 | $ | — | $ | — | $ | — | $ | 102.3 | $ | 11.4 | $ | 90.9 | 797.4 | % | ||||||||||||||||||||||
Contract expirations | 11.2 | 43.2 | 2.4 | 5.0 | 0.2 | 0.2 | — | — | 13.8 | 48.4 | (34.6 | ) | (71.5 | )% | ||||||||||||||||||||||||||||||||
Same location | 398.9 | 386.5 | 39.6 | 39.0 | 2.0 | 2.3 | — | 1.7 | 440.5 | 429.5 | 11.0 | 2.6 | % | |||||||||||||||||||||||||||||||||
Conversions | 12.5 | 7.1 | — | — | 1.8 | 0.2 | — | — | 14.3 | 7.3 | 7.0 | 95.9 | % | |||||||||||||||||||||||||||||||||
Total lease contract revenue | $ | 442.7 | $ | 443.7 | $ | 123.8 | $ | 48.5 | $ | 4.4 | $ | 2.7 | — | $ | 1.7 | $ | 570.9 | $ | 496.6 | $ | 74.3 | 15.0 | % | |||||||||||||||||||||||
Management contract revenue: | ||||||||||||||||||||||||||||||||||||||||||||||
New location | $ | 30.0 | $ | 9.0 | $ | 2.7 | $ | 0.8 | $ | 7.1 | $ | 1.4 | $ | — | $ | — | $ | 39.8 | $ | 11.2 | $ | 28.6 | 255.4 | % | ||||||||||||||||||||||
Contract expirations | 13.7 | 39.8 | 13.4 | 18.1 | 6.2 | 5.8 | — | — | 33.3 | 63.7 | (30.4 | ) | (47.7 | )% | ||||||||||||||||||||||||||||||||
Same location | 147.0 | 143.9 | 84.5 | 84.4 | 31.5 | 22.5 | 13.9 | 12.2 | 276.9 | 263.0 | 13.9 | 5.3 | % | |||||||||||||||||||||||||||||||||
Conversions | 0.2 | 0.3 | — | — | 0.1 | 0.1 | — | — | 0.3 | 0.4 | (0.1 | ) | (19.4 | )% | ||||||||||||||||||||||||||||||||
Total management contract revenue | $ | 190.9 | $ | 193.0 | $ | 100.6 | $ | 103.3 | $ | 44.9 | $ | 29.8 | $ | 13.9 | $ | 12.2 | $ | 350.3 | $ | 338.3 | $ | 12.0 | 3.6 | % | ||||||||||||||||||||||
Parking services revenue—lease contracts
Lease contract revenue increased $74.3 million, or 15.0%, to $570.9 million for the year ended December 31, 2015, compared to $496.6 million for the year-ago period. The increase resulted primarily from increases in revenue from new locations, locations that converted from management contracts during the year and same location revenue, partially offset by decreases in revenue from contract expirations. The increase in same location revenue of $11.0 million, or 2.6%, was primarily due to increases in short-term parking revenue and monthly parking revenue.
From a reporting segment perspective, lease contract revenue increased primarily due to new locations in all three operating regions, same locations in regions one and two and conversions in regions one and three. This was partially offset by decreases in revenue from contract expirations in regions one and two and same locations in region three and other. Same location revenue increases for the aforementioned regions were primarily due to increases in short-term parking revenue and monthly parking revenue. The other region amounts in same location represent revenues not specifically identifiable to a region.
Revenue associated with contract expirations relates to contracts that have expired, however, we were operating the facility in the comparative period presented.
Parking services revenue—management contracts
Management contract revenue increased $12.0 million, or 3.6%, to $350.3 million for the year ended December 31, 2015, compared to $338.3 million for the year-ago period. The increase resulted primarily from increases in revenue from new locations and same locations, partially offset by decreases in revenue from contract expirations and locations that converted from lease contracts during the year. Same location revenue increased by $13.9 million, or 5.3%, primarily due to an increase in fees from ancillary services.
From a reporting segment perspective, management contract revenue increased primarily from increases in revenue from new locations in all three operating regions, contract expirations in region three and same locations in all three operating regions and other. This was partially offset by decreases in revenue from contract expirations in regions one and two and conversions in region one. The other region amounts in same location represent values not specifically identifiable to a region.
Revenue associated with contract expirations relates to contracts that have expired, however, we were operating the facility in the comparative period presented.
Reimbursed management contract revenue
Reimbursed management contract revenue increased $14.9 million , or 2.2%, to $694.7 million for the year ended December 31, 2015, compared to $679.8 million in the year-ago period. This increase resulted primarily from an increase in reimbursements for costs incurred on behalf of owners.
31
Segment cost of parking services information is summarized as follows:
Year Ended December 31, | ||||||||||||||||||||||||||||||||||||||||||||||
Region One | Region Two | Region Three | Other | Total | Variance | |||||||||||||||||||||||||||||||||||||||||
(millions) | 2015 | 2014 | 2015 | 2014 | 2015 | 2014 | 2015 | 2014 | 2015 | 2014 | Amount | % | ||||||||||||||||||||||||||||||||||
Cost of parking services lease contracts: | ||||||||||||||||||||||||||||||||||||||||||||||
New location | $ | 17.4 | $ | 6.0 | $ | 79.2 | $ | 4.0 | $ | 0.4 | $ | — | $ | — | $ | — | $ | 97.0 | $ | 10.0 | $ | 87.0 | 870.0 | % | ||||||||||||||||||||||
Contract expirations | 9.5 | 34.6 | 2.3 | 4.9 | 0.3 | 0.3 | — | — | 12.1 | 39.8 | (27.7 | ) | (69.6 | )% | ||||||||||||||||||||||||||||||||
Same location | 368.9 | 356.1 | 36.8 | 35.9 | 1.8 | 2.1 | 3.5 | 1.5 | 411.0 | 395.6 | 15.4 | 3.9 | % | |||||||||||||||||||||||||||||||||
Conversions | 11.1 | 10.2 | — | — | 1.6 | 0.1 | — | — | 12.7 | 10.3 | 2.4 | 23.3 | % | |||||||||||||||||||||||||||||||||
Total cost of parking services lease contracts | $ | 406.9 | $ | 406.9 | $ | 118.3 | $ | 44.8 | $ | 4.1 | $ | 2.5 | 3.5 | $ | 1.5 | $ | 532.8 | $ | 455.7 | $ | 77.1 | 16.9 | % | |||||||||||||||||||||||
Cost of parking services management contracts: | ||||||||||||||||||||||||||||||||||||||||||||||
New location | $ | 20.8 | $ | 6.3 | $ | 1.8 | $ | 0.5 | $ | 5.3 | $ | 0.8 | $ | — | $ | — | $ | 27.9 | $ | 7.6 | $ | 20.3 | 267.1 | % | ||||||||||||||||||||||
Contract expirations | 10.1 | 26.7 | 13.7 | 17.1 | 5.5 | 4.1 | — | — | 29.3 | 47.9 | (18.6 | ) | (38.8 | )% | ||||||||||||||||||||||||||||||||
Same location | 75.0 | 73.9 | 60.6 | 59.4 | 22.4 | 13.0 | 2.9 | 6.0 | 160.9 | 152.3 | 8.6 | 5.6 | % | |||||||||||||||||||||||||||||||||
Conversions | 0.1 | 0.0 | — | — | 0.1 | 0.1 | — | — | 0.2 | 0.1 | 0.1 | 100.0 | % | |||||||||||||||||||||||||||||||||
Total cost of parking services management contracts | $ | 106.0 | $ | 106.9 | $ | 76.1 | $ | 77.0 | $ | 33.3 | $ | 18.0 | $ | 2.9 | $ | 6.0 | $ | 218.3 | $ | 207.9 | $ | 10.4 | 5.0 | % | ||||||||||||||||||||||
Cost of parking services—lease contracts
Cost of parking services for lease contracts increased $77.1 million, or 16.9%, to $532.8 million for the year ended December 31, 2015, compared to $455.7 million for the year-ago period. The increase resulted primarily from increases in costs from new locations, same locations and locations that converted from management contracts during the year, which was partially offset by a decrease in costs from contract expirations. Same location costs increased $15.4 million, or 3.9%, primarily due to higher rent expense as a result of higher revenues for same locations, an increase in health and benefit costs and higher structural repair costs related to certain lease contracts acquired in the Central Merger.
From a reporting segment perspective, cost of parking services for lease contracts increased primarily due to new locations in all three operating regions, same locations in regions one and two and other, and conversions in regions one and three, partially offset by decreases in contract expirations in regions one and two and same locations in region three. The other region amounts represent structural repair costs related to certain lease contracts acquired in the Central Merger and other costs not specifically identifiable to a region.
Cost of parking services associated with contract expirations relates to contacts that have expired, however, we were operating the facility in the comparative period presented.
Cost of parking services—management contracts
Cost of parking services for management contracts increased $10.4 million, or 5.0%, to $218.3 million for the year ended December 31, 2015, compared to $207.9 million for the year-ago period. The increase resulted primarily from increases in costs from new locations, same locations and locations that converted from lease contracts during the year, partially offset by a decrease in cost from contract expirations. Same locations costs increased $8.6 million, or 5.6%, primarily due to increased revenues from ancillary services, partially offset primarily by decreased costs relating to certain unallocated insurance reserve adjustments.
From a reporting segment perspective, cost of parking services for management contracts increased due to new locations in all three operating regions, contract expirations in region three, same locations in all three operating regions and conversions in region one, partially offset by decreases in contract expirations in regions one and two and same locations in other. The other region amounts represent prior year insurance reserve adjustments and other costs that are not specifically identifiable to a region.
Cost of parking services associated with contract expirations relates to contacts that have expired, however, we were operating the facility in the comparative period presented.
Reimbursed management contract expense
Reimbursed management contract expense increased $14.9 million, or 2.2%, to $694.7 million for the year ended December 31, 2015, compared to $679.8 million in the year-ago period. This increase resulted from an increase in reimbursements for costs incurred on behalf of owners.
32
Segment gross profit/gross profit percentage information is summarized as follows:
Year Ended December 31, | ||||||||||||||||||||||||||||||||||||||||||||||
Region One | Region Two | Region Three | Other | Total | Variance | |||||||||||||||||||||||||||||||||||||||||
(millions) | 2015 | 2014 | 2015 | 2014 | 2015 | 2014 | 2015 | 2014 | 2015 | 2014 | Amount | % | ||||||||||||||||||||||||||||||||||
Gross profit lease contracts: | ||||||||||||||||||||||||||||||||||||||||||||||
New location | $ | 2.7 | $ | 0.9 | $ | 2.6 | $ | 0.5 | $ | — | $ | — | $ | — | $ | — | $ | 5.3 | $ | 1.4 | $ | 3.9 | (269.0 | )% | ||||||||||||||||||||||
Contract expirations | 1.7 | 8.6 | 0.1 | 0.1 | (0.1 | ) | (0.1 | ) | — | — | 1.7 | 8.6 | (6.9 | ) | (80.2 | )% | ||||||||||||||||||||||||||||||
Same location | 30.0 | 30.4 | 2.8 | 3.1 | 0.2 | 0.2 | (3.5 | ) | 0.2 | 29.5 | 33.9 | (4.4 | ) | (13.0 | )% | |||||||||||||||||||||||||||||||
Conversions | 1.4 | (3.1 | ) | — | — | 0.2 | 0.1 | — | — | 1.6 | (3.0 | ) | 4.6 | (153.4 | )% | |||||||||||||||||||||||||||||||
Total gross profit lease contracts | $ | 35.8 | $ | 36.8 | $ | 5.5 | $ | 3.7 | $ | 0.3 | $ | 0.2 | $ | (3.5 | ) | $ | 0.2 | $ | 38.1 | $ | 40.9 | $ | (2.8 | ) | (6.9 | )% | ||||||||||||||||||||
(Percentages) | ||||||||||||||||||||||||||||||||||||||||||||||
Gross profit percentage lease contracts: | ||||||||||||||||||||||||||||||||||||||||||||||
New location | 13.4 | % | 13.0 | % | 3.2 | % | 11.1 | % | — | % | — | % | — | % | — | % | 5.2 | % | 12.6 | % | ||||||||||||||||||||||||||
Contract expirations | 15.2 | % | 19.9 | % | 4.2 | % | 2.0 | % | -50.0 | % | -50.0 | % | — | % | — | % | 12.3 | % | 17.8 | % | ||||||||||||||||||||||||||
Same location | 7.5 | % | 7.9 | % | 7.1 | % | 7.9 | % | 10.0 | % | 8.7 | % | — | % | 11.8 | % | 6.7 | % | 7.9 | % | ||||||||||||||||||||||||||
Conversions | 11.2 | % | -43.7 | % | — | % | — | % | 11.1 | % | 50.0 | % | — | % | — | % | 11.2 | % | -41.1 | % | ||||||||||||||||||||||||||
Total gross profit percentage | 8.1 | % | 8.3 | % | 4.4 | % | 7.6 | % | 6.8 | % | 7.4 | % | — | % | 11.8 | % | 6.7 | % | 8.2 | % | ||||||||||||||||||||||||||
Gross profit management contracts: | ||||||||||||||||||||||||||||||||||||||||||||||
New location | $ | 9.2 | $ | 2.7 | $ | 0.9 | $ | 0.3 | $ | 1.8 | $ | 0.6 | $ | 0.0 | $ | 0.0 | $ | 11.9 | $ | 3.6 | $ | 8.3 | 230.6 | % | ||||||||||||||||||||||
Contract expirations | 3.6 | 13.1 | (0.3 | ) | 1.0 | 0.7 | 1.7 | 0.0 | 0.0 | 4.0 | 15.8 | (11.8 | ) | (74.7 | )% | |||||||||||||||||||||||||||||||
Same location | 72.2 | 70.0 | 23.9 | 25.0 | 8.9 | 9.5 | 11.0 | 6.2 | 116.0 | 110.7 | 5.3 | 4.8 | % | |||||||||||||||||||||||||||||||||
Conversions | 0.1 | 0.3 | 0.0 | 0.0 | 0.0 | 0.0 | 0.0 | 0.0 | 0.1 | 0.3 | (0.2 | ) | (66.7 | )% | ||||||||||||||||||||||||||||||||
Total gross profit management contracts | $ | 85.1 | $ | 86.1 | $ | 24.5 | $ | 26.3 | $ | 11.4 | $ | 11.8 | $ | 11.0 | $ | 6.2 | $ | 132.0 | $ | 130.4 | $ | 1.6 | 1.2 | % | ||||||||||||||||||||||
(Percentages) | ||||||||||||||||||||||||||||||||||||||||||||||
Gross profit percentage management contracts: | ||||||||||||||||||||||||||||||||||||||||||||||
New location | 30.7 | % | 30.0 | % | 33.3 | % | 37.5 | % | 25.4 | % | 42.9 | % | — | % | — | % | 29.9 | % | 32.1 | % | ||||||||||||||||||||||||||
Contract expirations | 26.3 | % | 32.9 | % | (2.2 | )% | 5.5 | % | 11.3 | % | 29.3 | % | — | % | — | % | 12.0 | % | 24.8 | % | ||||||||||||||||||||||||||
Same location | 49.1 | % | 48.6 | % | 28.3 | % | 29.6 | % | 28.3 | % | 42.2 | % | 79.1 | % | 50.8 | % | 41.9 | % | 42.1 | % | ||||||||||||||||||||||||||
Conversions | 50.0 | % | 100.0 | % | — | % | — | % | — | % | — | % | — | % | — | % | 33.3 | % | 75.0 | % | ||||||||||||||||||||||||||
Total gross profit percentage | 44.6 | % | 44.6 | % | 24.4 | % | 25.5 | % | 25.4 | % | 39.6 | % | 79.1 | % | 50.8 | % | 37.7 | % | 38.5 | % | ||||||||||||||||||||||||||
Gross profit—lease contracts
Gross profit for lease contracts decreased $2.8 million, or 6.9%, to $38.1 million for the year ended December 31, 2015, compared to $40.9 million for year-ago period. Gross profit percentage for lease contracts was 6.7% for the year ended December 31, 2015, compared to 8.2% for the year ago-period. Gross profit lease contracts decreases were the result of contract expirations and same locations, partially offset by increases from new locations and locations that converted from management contracts during the year. Gross profit for lease contracts on same locations decreased primarily due to an increase in operating costs, driven primarily by an increase in health and benefit costs and an increase in structural repair costs related to certain lease contracts acquired in the Central Merger, partially offset by an increase in revenue.
From a reporting segment perspective, gross profit for lease contracts decreased primarily due contract expirations in region one, same locations in regions one, two and other, partially offset by increases in new locations in regions one and two and conversions in regions one and three.
Gross profit associated with contract expirations relates to contracts that have expired, however, we were operating the facility in the comparative period presented.
33
Gross profit—management contracts
Gross profit for management contracts increased $1.6 million or 1.2%, to $132.0 million for the year ended December 31, 2015, compared to $130.4 million for the year-ago period. Gross profit percentage for management contracts decreased to 37.7% for the year ended December 31, 2015 compared to 38.5% for the year-ago period. Gross profit for management contracts increases were primarily the result of new locations and same locations, partially offset by decreases in contract expirations and locations that converted from lease contracts during the year. Gross profit management contracts increased on same locations primarily as the result of increased revenues, partially offset by increased costs primarily related to ancillary services.
From a reporting segment perspective, gross profit for management contracts increased primarily due to new locations in all three operating regions, same locations in region one and other, partially offset by decreases in contract expirations in all three operating regions and same locations in regions two and three.
Gross profit associated with contract expirations relates to contracts that have expired, however, we were operating the facility in the comparative period presented.
General and administrative expenses
General and administrative expenses decreased $4.2 million, or 4.1%, to $97.3 million for year ended December 31, 2015, compared to $101.5 million for the year-ago period. The decrease in General and administrative expenses primarily related to a decrease in compensation and benefit costs, merger and integration costs, including severance and benefit expenses, and overall better expense control, partially offset by increases in expected pay-out under our performance based compensation and long-term incentive compensation programs and a $1.6 million charge related to our dispute with Central's former stockholders over Net Debt Working Capital indemnity claims.
Interest expense
Interest expense decreased $5.1 million, or 28.7%, to $12.7 million for the year ended December 31, 2015, as compared to $17.8 million in the year-ago period. This decrease resulted primarily from a decrease in average borrowing rates and reductions in borrowings under our Restated Credit Facility and Senior Credit Facility.
Interest income
Interest income decreased by $0.2 million, or 50.0%, to $0.2 million for the year ended December 31, 2015, as compared to $0.4 million in the year-ago period.
Gain on sale of a business
During the third quarter of 2015, we recognized a $0.5 million gain on the sale of a portion of our security business primarily operating in the Southern California market.
Equity in losses from investment in unconsolidated entity
Equity in losses from investment in unconsolidated entity relates to our investment in the Parkmobile joint venture accounted for under the equity method of accounting and our share of equity earnings in the Parkmobile joint venture. Equity in losses from investment in unconsolidated entity was $1.7 million for the year ended December 31, 2015, as compared to $0.3 million for the year ended December 31, 2014.
Income tax expense
For the year ended December 31, 2015, we recognized income tax expense of $4.8 million on pre-tax earnings of $25.1 million compared to a $0.2 million income tax benefit on pre-tax earnings of $25.9 million for the year ended December 31, 2014. Our effective tax rate was 19.1% for the year ended December 31, 2015, compared to a benefit of 0.8% for the year ended December 31, 2014. The $5.0 million increase in income tax expense was primarily due to a decrease in valuation allowance reversals recognized for historical net operating losses for the year ended December 31, 2014, when compared to the year ended December 31, 2015, unfavorable adjustments to deferred taxes for the year ended December 31, 2015, when compared to favorable adjustments to deferred taxes for the year ended December 31, 2014, partially offset by a deferred tax liability established in 2014 relating to our equity investment in an unconsolidated entity.
34
Liquidity and Capital Resources
General
We continually project anticipated cash requirements for our operating, investing, and financing needs as well as cash flows generated from operating activities available to meet these needs. Our operating needs can include, among other items, commitments for cost of parking services, operating leases, payroll payments, insurance claims payments, interest payments, leases acquired in the Central Merger, which include provisions allocating to us responsibility for all structural repair payments required on the property (see also "Lease Commitments" below for additional discussion on certain lease contracts acquired in the Central Merger), and legal settlements. Our investing and financing spending can include payments for acquired businesses, joint ventures, capital expenditures, cost of contracts purchased, commitments for capital leases, distributions to noncontrolling interests, payments on our outstanding indebtedness and to a much lesser extent, cash from sales of non-core assets.
Outstanding Indebtedness
As of December 31, 2016, we had total indebtedness of approximately $195.1 million, a decrease of $30.0 million from December 31, 2015. The $195.1 million includes:
• | $193.4 million under our Restated Credit Facility (as defined below); and |
• | $1.7 million of other debt including capital lease obligations, obligations on seller notes and other indebtedness. |
Senior Credit Facility
In October 2012, the Company entered into a credit agreement ("Credit Agreement") with Bank of America, N.A. ("Bank of America"), as administrative agent, Wells Fargo Bank, N.A. ("Wells Fargo Bank") and JPMorgan Chase Bank, N.A., as co-syndication agents, U.S. Bank National Association, First Hawaiian Bank and General Electric Capital Corporation, as co-documentation agents, Merrill Lynch, Pierce, Fenner & Smith Inc., Wells Fargo Securities, LLC and J.P. Morgan Securities LLC, as joint lead arrangers and joint book managers, and the lenders party thereto.
The Credit Agreement provided us with a secured Senior Credit Facility (the "Senior Credit Facility") that permitted aggregate borrowings of $450.0 million consisting of (i) a revolving credit facility of up to $200.0 million at any time outstanding, which included a letter of credit facility that is limited to $100.0 million at any time outstanding, and (ii) a term loan facility of $250.0 million. The Senior Credit Facility was due to mature on October 2, 2017.
Amended and Restated Credit Facility
In February 2015 ("Restatement Date"), we entered into an Amended and Restated Credit Agreement (the "Restated Credit Agreement") with Bank of America, as administrative agent, an issuing lender and swing-line lender; Wells Fargo Bank, as an issuing lender and syndication agent; U.S. Bank National Association, First Hawaiian Bank and BMO Harris Bank N.A., as co-documentation agents; Merrill Lynch, Pierce, Fenner & Smith Incorporated and Wells Fargo Securities, LLC, as joint lead arrangers and joint book managers; and the lenders party thereto (the "Lenders"). The Restated Credit Agreement reflects modifications to, and an extension of, the Credit Agreement.
Pursuant to the terms, and subject to the conditions, of the Restated Credit Agreement, the Lenders have made available to the Company a senior secured credit facility (the "Restated Credit Facility") that permits aggregate borrowings of $400.0 million consisting of (i) a revolving credit facility of up to $200.0 million at any time outstanding, which includes a $100.0 million sublimit for letters of credit and a $20.0 million sublimit for swing-line loans, and (ii) a term loan facility of $200.0 million (reduced from $250.0 million). The Company may request increases of the revolving credit facility in an aggregate additional principal amount of $100.0 million. The Restated Credit Facility matures on February 20, 2020.
The entire amount of the term loan portion of the Restated Credit Facility had been drawn by the Company as of the Restatement Date (including approximately $10.4 million drawn on such date) and is subject to scheduled quarterly amortization of principal as follows: (i) $15.0 million in the first year, (ii) $15.0 million in the second year, (iii) $20.0 million in the third year, (iv) $20.0 million in the fourth year, (v) $20.0 million in the fifth year and (vi) $110.0 million in the sixth year. The Company also had outstanding borrowings of $147.3 million (including $53.4 million in letters of credit) under the revolving credit facility as of the Restatement Date.
Borrowings under the Restated Credit Facility bear interest, at the Company's option, (i) at a rate per annum based on the Company's consolidated total debt to EBITDA ratio for the 12-month period ending as of the last day of the immediately preceding fiscal quarter, determined in accordance with the pricing levels set forth in the Restated Credit Agreement (the "Restatement Applicable Margin"), plus LIBOR or (ii) the Restatement Applicable Margin plus the highest of (x) the federal funds rate plus 0.5%, (y) the Bank of America prime rate and (z) a daily rate equal to LIBOR plus 1.0%. (the highest of (x), (y) and (z), the "Base Rate"), except that all swing-line loans will bear interest at the Base Rate plus the Applicable Margin.
Under the terms of the Restated Credit Agreement, the Company is required to maintain a maximum consolidated total debt to EBITDA ratio of not greater than 4.0 to 1.0 as of the end of any fiscal quarter ending during the period from the Restatement Date through September 30, 2015, (ii) 3.75 to 1.0 as of the end of any fiscal quarter ending during the period from October 1, 2015 through September 30, 2016, and (iii) 3.5 to 1.0 as of the end of any fiscal quarter ending thereafter. In addition, the Company is required to maintain a minimum consolidated fixed charge coverage ratio of not less than 1:25:1.0.
35
Events of default under the Restated Credit Agreement include failure to pay principal or interest when due, failure to comply with the financial and operational covenants, the occurrence of any cross default event, non-compliance with the other loan documents, the occurrence of a change of control event, and bankruptcy and other insolvency events. If an event of default occurs and is continuing, the Lenders holding a majority of the commitments and outstanding term loan under the Restated Credit Agreement have the right, among others, to (i) terminate the commitments under the Restated Credit Agreement, (ii) accelerate and require the Company to repay all the outstanding amounts owed under the Restated Credit Agreement and (iii) require the Company to cash collateralize any outstanding letters of credit.
Each wholly owned domestic subsidiary of the Company (subject to certain exceptions set forth in the Restated Credit Agreement) has guaranteed all existing and future indebtedness and liabilities of the other guarantors and the Company arising under the Restated Credit Agreement. The Company's obligations under the Restated Credit Agreement and such domestic subsidiaries' guaranty obligations are secured by substantially all of their respective assets.
We believe that our cash flow from operations, combined with additional borrowing capacity under our Restated Credit Facility, will be sufficient to enable us to pay our indebtedness, or to fund other liquidity needs. We may need to refinance all or a portion of our indebtedness on or before their respective maturities. We believe that we will be able to refinance our indebtedness on commercially reasonable terms.
We were in compliance with all our covenants as of December 31, 2016.
As of December 31, 2016, we had $114.1 million of borrowing availability under the Restated Credit Agreement, of which we could have borrowed $114.1 million on December 31, 2016 and remained in compliance with the above described covenants as of such date. Our borrowing availability under the Restated Credit Agreement is limited only as of our fiscal quarter-end by the covenant restrictions described above. At December 31, 2016, we had $59.6 million letters of credit outstanding under the Restated Credit Facility and borrowings against the Restated Credit Facility aggregated $196.3 million (excluding debt discount of $1.2 million and deferred financing costs of $1.6 million).
Interest Rate Swaps
In October 2012, we entered into Interest Rate Swap transactions (collectively, the "Interest Rate Swaps") with each of JPMorgan Chase Bank, N.A., Bank of America, N.A. and PNC Bank, N.A. in an initial aggregate Notional Amount of $150.0 million (the "Notional Amount"). The Interest Rate Swaps have a termination date of September 30, 2017. The Interest Rate Swaps effectively fix the interest rate on an amount of variable interest rate borrowings under our credit agreements, originally equal to the Notional Amount at 0.7525% per annum plus the applicable margin rate for LIBOR loans under our credit agreements determined based upon our consolidated total debt to EBITDA ratio. The Notional Amount is subject to scheduled quarterly amortization that coincides with quarterly prepayments of principal under our credit agreements. These Interest Rate Swaps are classified as cash flow hedges, and we calculate the effectiveness of the hedge on a monthly basis. The ineffective portion of the cash flow hedge is recognized in earnings as an increase of interest expense. As of December 31, 2016, no ineffective portion of the cash flow has been recognized in earnings within interest expense. The fair value of the Interest Rate Swaps at December 31, 2016 and 2015 was a $0.1 million and $0.2 million asset, respectively, and included in the line item "Other assets, net" within the Consolidated Balance Sheet.
We do not enter into derivative instruments for any purpose other than cash flow hedging purposes.
Stock Repurchases
In May 2016, our Board of Directors authorized us to repurchase, on the open market, shares of our outstanding common stock in an amount not to exceed $30.0 million in aggregate. Purchases of our common stock may be made in open market transactions effected through a broker-dealer at prevailing market prices, in block trades, or by other means in accordance with Rule 10b-18 and 10b5-1under the Securities Exchange Act of 1934 ("Exchange Act"). The share repurchase program does not obligate us to repurchase any particular amount of common stock, and has no fixed termination date. Under this program, we repurchased 305,183 shares of common stock through December 31, 2016 at an average price of $24.43 per share, resulting in $7.5 million in year-to-date and program-to-date repurchases.
Letters of Credit
We had provided letters of credit totaling $52.6 million and $45.3 million to our casualty insurance carriers to collateralize our casualty insurance program as of December 31, 2016 and 2015, respectively.
We had provided $7.0 million and $7.1 million in letters of credit to collateralize other obligations as of December 31, 2016 and 2015, respectively.
Deficiency Payments
Pursuant to our obligations with respect to the parking garage operations at Bradley International Airport, we are required to make certain deficiency payments for the benefit of the State of Connecticut and for holders of special facility revenue bonds. The deficiency payments represent contingent interest bearing advances to the trustee to cover operating cash flow requirements. As of December 31, 2016, we had made $9.9 million of cumulative deficiency payments to the trustee, net of reimbursements. Deficiency payments made are recorded as increases to cost of parking services and deficiency repayments are recorded as reductions to cost of parking services. We believe these advances to be fully recoverable and will recognize the principal, interest and premium payments related to these deficiency payments when they are received. We do not directly guarantee the payment of any principal or interest on any debt obligations of the State of Connecticut or the trustee.
36
The total deficiency repayments (net of payments made), interest and premium received and recorded for the years ended 2016, 2015 and 2014 are as follows:
Year Ended December 31 | |||||||||||
(millions) | 2016 | 2015 | 2014 | ||||||||
Deficiency repayments | $ | 1.7 | $ | 1.8 | $ | 1.3 | |||||
Interest | $ | 0.5 | $ | 0.4 | $ | 0.5 | |||||
Premium | $ | 0.2 | $ | 0.2 | $ | 0.1 | |||||
Lease Commitments
We have minimum lease commitments of $225.2 million for fiscal 2017. The leased properties generate sufficient cash flow to meet the base rent payment.
Certain lease contracts acquired in the Central Merger include provisions allocating to us responsibility for the cost of certain structural and other repairs required to be made to the leased property, including improvement and repair costs arising as a result of ordinary wear and tear. During the year ended December 31, 2016, 2015 and 2014, we recorded $0.7 million, $4.6 million, and $1.3 million, respectively, of costs (net of our expected recoveries through the applicable indemnity discussed further in Note 2. Central Merger and Restructuring, Merger and Integration Costs of our Consolidated Financial Statements) in Cost of parking services-Lease contracts within the Consolidated Statements of Income for structural and other repair costs related to these lease contracts, whereby we have expensed repair costs and engaged third-party general contractors to complete structural and other repair projects, and other indemnity-related costs. We expect to incur additional costs for certain structural and other repair costs pursuant to the contractual requirements of certain lease contracts acquired in the Central Merger ("Structural and Repair Costs"). Based on information available at this time, we currently expect to incur additional Structural and Repair Costs of $0.2 million. While we are unable to estimate with certainty when such remaining costs will be incurred, it is expected that a substantial majority of these costs will be incurred in early 2017. Additionally and as further described in Note 2. Central Merger and Restructuring, Merger and Integration, we settled all outstanding matters between the former Central stockholders and us and are therefore unable to recover any additional Structural and Repair Costs yet to be incurred by us through the indemnity.
Daily Cash Collections
As a result of day-to-day activity at our parking locations, we collect significant amounts of cash. Lease contract revenue is generally deposited into our local bank accounts, with a portion remitted to our clients in the form of rental payments according to the terms of the leases. Under management contracts, clients may require us to deposit the daily receipts into one of our local bank accounts, with the cash in excess of our operating expenses and management fees remitted to the clients at negotiated intervals, may require us to deposit the daily receipts into client designated bank accounts and the clients then reimburse us for operating expenses and pay our management fee subsequent to month-end or may require segregated bank accounts for the receipts and disbursements at locations. Our working capital and liquidity may be adversely affected if a significant number of our clients require us to deposit all parking revenues into their respective accounts.
Our liquidity also fluctuates on an intra-month and intra-year basis depending on the contract mix and timing of significant cash payments. Additionally, our ability to utilize cash deposited into our local accounts is dependent upon the availability and movement of that cash into our corporate accounts. For all these reasons, from time to time, we carry a significant cash balance, while also utilizing our senior credit facility.
Cash and Cash Equivalents
We had cash and cash equivalents of $22.2 million at December 31, 2016, compared to $18.7 million at December 31, 2015. The cash balances reflect our ability to utilize funds deposited into our local bank accounts. Availability, timing of deposits and the subsequent movement of cash into our corporate bank accounts may result in significant changes to our cash balances.
37
Summary of Cash Flows
Years ended December 31, | |||||||||||
(millions) | 2016 | 2015 | 2014 | ||||||||
Net cash provided by operating activities | $ | 59.7 | $ | 43.6 | $ | 51.6 | |||||
Net cash used in investing activities | $ | 13.8 | $ | 11.8 | $ | 14.9 | |||||
Net cash used in financing activities | $ | 42.1 | $ | 30.6 | $ | 41.5 | |||||
Operating Activities
Our primary sources of funds are cash flows from operating activities and changes in operating assets and liabilities.
Net cash provided by operating activities totaled $59.7 million for 2016, compared to $43.6 million for 2015. Cash provided during 2016 included $61.1 million from operations, partially offset by changes in operating assets and liabilities that resulted in a cash use of $1.4 million. The net decrease in operating assets and liabilities resulted primarily from: (i) a net increase in notes and accounts receivable of $15.9 million due to timing of collections, (ii) a net increase in prepaid expenses and other of $1.5 million, partially offset by (iii) a net increase in accounts payable and accrued liabilities of $16.0 million, which primarily resulted from the timing on payments to our clients as described under "Daily Cash Collections" and vendors and increases in amount of book overdrafts included in accounts payable.
Net cash provided by operating activities totaled $43.6 million for 2015, compared to $51.6 million for 2014. Cash provided during 2015 included $49.9 million from operations, partially offset by changes in operating assets and liabilities that resulted in a cash use of $6.3 million. The net decrease in operating assets and liabilities resulted primarily from: (i) a net decrease in accounts payable and accrued liabilities of $17.9 million, which primarily resulted from the timing on payments to our clients as described under "Daily Cash Collection" and vendors and decreases in the amount of book overdrafts included in accounts payable, partially offset by (ii) a net decrease in notes and accounts receivable of $3.5 million due to timing of collections, and (iii) a net decrease in prepaid expenses and other of $8.1 million by managing the cash outlay for future expenses yet to be incurred.
Net cash provided by operating activities totaled $51.6 million for 2014, compared to $34.9 million for 2013. Cash provided during 2014 included $45.6 million from operations and changes in operating assets and liabilities of $6.0 million. The net increase in operating assets and liabilities resulted primarily from: (i) a net decrease in notes and accounts receivables of $5.4 million due to timing of collections, (ii) a net decrease in prepaid expenses and other of $2.1 million by managing cash outlay for future expenses yet to be incurred, (iii) a decrease in accounts payable and accrued liabilities of $1.5 million, which primarily resulted from the timing on payments to our clients as described under ‘‘Daily Cash Collections’’ and incurred expenses towards the later part of the year.
Investing Activities
Net cash used in investing activities totaled for $13.8 million for 2016, compared to $11.8 million in 2015. Cash used in investing activities in 2016 included capital expenditures of $13.0 million for capital investments needed to secure and/or extend leased facilities and investments in information system enhancements and infrastructure and $3.8 million for cost of contract purchases; partially offset by $3.0 million of proceeds from the sale of assets and contract terminations.
Net cash used in investing activities totaled $11.8 million for 2015, compared to $14.9 million in 2014. Cash used in investing activities in 2015 included capital expenditures of $9.6 million for capital investments needed to secure and/or extend leased facilities and investments in IT projects, cost of contract purchased for $3.7 million, partially offset by proceeds from the sale of a business of $1.0 million, net, and sale of equipment and contract terminations of $0.5 million.
Net cash used in investing activities totaled $14.9 million for 2014, compared to $13.3 million in 2013. Cash used in investing activities in 2014 included capital expenditures of $13.5 million for capital investments needed to secure and/or extend leased facilities and investments in IT projects, cost of contract of contract purchased for $2.3 million, partially offset by proceeds from the sale of equipment and contract terminations of $0.9 million.
Financing Activities
Net cash used in financing activities totaled $42.1 million in 2016, compared to $30.6 million in 2015. Cash used in financing activities for 2016 included net payments on the Restated Credit Facility of $31.0 million, distributions to noncontrolling interests of $3.3 million, payments on other long-term borrowings of $0.3 million, and $7.5 million on the repurchase of common stock.
Net cash used in financing activities totaled $30.6 million in 2015, compared to $41.5 million in 2014. Cash used in financing activities for 2015 included net payments on the Senior Credit Facility and Restated Credit Facility of $36.4 million, distributions to noncontrolling interests of $3.1 million, payments of debt issuance costs and original discount on borrowings of $1.4 million, and payments on other long-term borrowings of $0.3 million, partially offset by proceeds from the Restated Credit Facility of $10.4 million, tax benefits related to the vesting of restricted stock units of $0.3 million and $0.1 million for a contingency obligation for businesses acquired.
Net cash used in financing activities totaled $41.5 million in 2014, compared to $26.4 million in 2013. Cash used in financing activities for 2014 included $1.8 million for businesses acquired, net payments on the Senior Credit Facility of $36.9 million, distributions on noncontrolling interests of $2.9 million, partially offset by $0.2 million of proceeds from other other long-term borrowings and a $0.1 million excess tax expense.
38
Summary Disclosures about Contractual Obligations and Commercial Commitments
The following summarizes certain of our contractual obligations at December 31, 2016 and the effect such obligations are expected to have on our liquidity and cash flow in future periods. The nature of our business is to manage parking facilities and as a result, we do not have significant short-term purchase obligations.
Payments Due by Period | |||||||||||||||||||
Total | 2017 | 2018 - 2019 | 2020 -2021 | 2022 and thereafter | |||||||||||||||
(millions) | |||||||||||||||||||
Contractual obligations | |||||||||||||||||||
Operating leases (1) | $ | 956.7 | $ | 225.2 | $ | 357.6 | $ | 159.5 | $ | 214.4 | |||||||||
Capital leases | 0.2 | 0.1 | 0.1 | — | — | ||||||||||||||
Total contractual obligations | $ | 956.9 | $ | 225.3 | $ | 357.7 | $ | 159.5 | $ | 214.4 | |||||||||
Other Long-Term Liabilities | |||||||||||||||||||
Deferred Compensation | $ | 8.3 | $ | 0.9 | $ | 2.8 | $ | 1.4 | $ | 3.2 | |||||||||
Other long-term liabilities (2) | 56.4 | 21.3 | 22.3 | 8.8 | 4.0 | ||||||||||||||
Total other long-term liabilities | $ | 64.7 | $ | 22.2 | $ | 25.1 | $ | 10.2 | $ | 7.2 | |||||||||
Commercial Commitments | |||||||||||||||||||
Restated Senior Credit Facility (3) | $ | 196.3 | $ | 20.0 | $ | 40.0 | $ | 136.3 | $ | — | |||||||||
Other Debt (3) | 1.5 | 1.4 | 0.1 | — | — | ||||||||||||||
Interest payments on debt and long-term liabilities | 19.8 | 7.3 | 12.2 | 0.3 | — | ||||||||||||||
Letters of credit (4) | 59.6 | 59.6 | — | — | — | ||||||||||||||
Total commercial commitments | $ | 277.2 | $ | 88.3 | $ | 52.3 | $ | 136.6 | $ | — | |||||||||
Total | $ | 1,298.8 | $ | 335.8 | $ | 435.1 | $ | 306.3 | $ | 221.6 | |||||||||
(1) | Represents minimum rental commitments, excluding (i) contingent rent provisions under all non-cancelable leases; and (ii) sublease income of $43.6 million. |
(2) | Represents customer deposits, insurance claims and obligation related to acquisitions. |
(3) | Represents principal amounts. See Note 11. Borrowing Arrangements to the consolidated financial statements included in Item 15."Exhibits and Financial Statements Schedules." |
(4) | Represents aggregate amount of currently issued letters of credit at their maturities. |
We made contingent payments for business acquired (earn-outs) of $nil, $0.1 million and $1.8 million for each of the years ended 2016, 2015 and 2014, respectively. In addition, we received deficiency repayments (net of deficiency payments made) related to the Bradley Agreement of $1.7 million, $1.8 million and $1.3 million for the years ended December 31, 2016 and 2015 and 2014, respectively.
The above schedule does not include any amounts for expected deficiency payments in the "less than one year" category or any other "payments due by period" category, as we concluded that the potential for future deficiency payments did not meet the criteria of both probable and estimable.
39
Critical Accounting Policies
The preparation of financial statements in conformity with accounting principles generally accepted in the United States requires management to make estimates and judgments that affect the reported amounts of assets and liabilities, revenues and expenses and related disclosures of contingent assets and liabilities in the consolidated financial statements and accompanying notes. The SEC has defined a company's critical accounting policies as the ones that are most important to the portrayal of the company's financial condition and results of operations, and which require the company to make its most difficult and subjective judgments, often as a result of the need to make estimates of matters that are inherently uncertain. Based on this definition, we have identified the critical accounting policies and judgments addressed below. We base these estimates and judgments on historic experience and on various other assumptions that are believed to be reasonable under the circumstances, the results of which form the basis for making judgments about carrying values of assets and liabilities that are not readily apparent from other sources. Certain accounting estimates are particularly sensitive because of their complexity and the possibility that future events affecting them may differ materially from our current judgments and estimates.
This listing of critical accounting policies is not intended to be a comprehensive list of all of our accounting policies. We also have other key accounting policies, which involve the use of estimates, judgments, and assumptions that are significant to understanding our results, which are included in Note 1. Significant Accounting Policies and Practices of the notes to the consolidated financial statements included in Part IV, Item 15. "Exhibits and Financial Statement Schedules."
Goodwill and Other Intangibles
Goodwill represents the excess of purchase price paid over the fair value of net assets acquired. In accordance with the Financial Accounting Standards Board's ("FASB") authoritative accounting guidance on goodwill, we do not amortize goodwill but rather evaluate it for impairment on an annual basis, or more often if events or circumstances change that could cause goodwill to become impaired. We have elected to assess the impairment of goodwill annually on the first day of our fiscal fourth quarter, or at an interim date if there is an event or change in circumstances indicate the carrying value may not be recoverable. Factors that could trigger an impairment review include significant under-performance relative to expected historical or projected future operating results, significant changes in the use of acquired assets or our business strategy, a change in reportable segments and significant negative industry or economic trends.
A multi-step impairment test is performed on goodwill. For our fourth quarter 2016 goodwill impairment test, we utilized the option to evaluate various qualitative factors to determine the likelihood of impairment and if it was more likely than not that the fair value of the reporting units were less than the carrying value of the reporting unit. We concluded there was no impairment of goodwill at any of the reporting units.
If we do not elect to perform a qualitative assessment, we can voluntarily proceed directly to Step 1. We performed a Step 1 goodwill test as of January 1, 2016 due to a change in reporting units. In Step 1, we perform a quantitative analysis to compare the fair value of the reporting unit to its carrying value including goodwill. If the fair value of the reporting unit exceeds the carrying value of the net assets assigned to that unit, goodwill is not considered impaired, and we are not required to perform further testing. If the carrying value of the net assets assigned to the reporting unit exceeds the fair value of the reporting unit, then we must perform Step 2 of the impairment test in order to determine the implied fair value of the reporting unit's goodwill. If the carrying value of a reporting unit's goodwill exceeds its implied fair value, then we would record an impairment loss equal to the difference.
The goodwill impairment test is performed at the reporting unit level; our reporting units represent our operating segments, which are comprised of our four operating segments. Management determines the fair value of each of its reporting units by using a discounted cash flow approach and a market approach using multiples of EBITDA of comparable companies to estimate market value. In addition, we compare our derived enterprise value on a consolidated basis to our market capitalization as of its test date to ensure its derived value approximates our market value when taken as a whole.
In conducting our goodwill impairment quantitative assessments, we analyzed actual and projected growth trends of the reporting units, gross margin, operating expenses and EBITDA (which also includes forecasted five-year income statement and working capital projections, a market-based weighted average cost of capital and terminal values after five years). We also assess critical areas that may impact our business including economic conditions, market related exposures, competition, changes in product offerings and changes in key personnel. As part of the 2016 and 2015 goodwill assessments, we engaged a third party to evaluate our reporting units' fair values.
We continue to perform a goodwill impairment test as required on an annual basis and on an interim basis, if certain conditions exist. Factors we consider important, which could result in changes to our estimates, include underperformance relative to historical or projected future operating results and declines in acquisitions and trading multiples. Due to the diverse customer base, we do not believe our future operating results will vary significantly relative to its historical and projected future operating results. However, future events may indicate differences from our judgments and estimates that could, in turn, result in impairment charges in the future. Future events that may result in impairment charges include increases in interest rates, which would impact discount rates, unfavorable economic conditions or other factors that could decrease revenues and profitability of existing locations and changes in the cost structure of existing facilities. Factors that could potentially have an unfavorable economic effect on our judgments and estimates include, among others: changes imposed by governmental and regulatory agencies, such as property condemnations and assessment of parking-related taxes; construction or other events that could change traffic patterns; and terrorism or other catastrophic events.
Intangible assets with finite lives are amortized over their estimated useful lives and reviewed for impairment when circumstances change that would create a triggering event. Intangible assets with finite lives are amortized on a straight-line basis over their estimated useful lives. We evaluate the remaining useful life of the other intangible assets on a periodic basis to determine whether events or circumstances warrant a revision to the remaining useful life. Assumptions and estimates about future values and remaining useful lives of our intangible and other long-
40
lived assets are complex and subjective. They can be affected by a variety of factors, including external factors such as industry and economic trends, and internal factors, such as changes in our business strategy and internal forecasts. Although management believes the historical assumptions and estimates are reasonable and appropriate, different assumptions and estimates could materially impact our reported financial results.
Long-Lived Assets
We evaluate long-lived asset groups whenever events or circumstances indicate that the carrying value of an asset may not be recoverable. Events or circumstances that would result in an impairment review primarily include a significant change in the use of an asset, or the planned sale or disposal of an asset. Recoverability of assets to be held and used is measured by a comparison of the carrying amount of the asset to future undiscounted cash flows expected to be generated by the asset group. If it is determined to be impaired, the impairment recognized is measured by the amount by which the carrying value of the asset exceeds its fair value. Our estimates of future cash flows from such assets could be impacted if it underperforms relative to historical or projected future operating results.
Assumptions and estimates used to determine cash flows in the evaluation of impairment and the fair values used to determine the impairment are subject to a degree of judgment and complexity. Any changes to the assumptions and estimates resulting from changes in actual results or market conditions from those anticipated may affect the carrying value of long-lived assets and could result in an impairment charge.
Insurance Reserves
We purchase comprehensive casualty insurance (including, without limitation, general liability, automobile liability, garage-keepers legal liability, worker's compensation and umbrella/excess liability insurance) covering certain claims that arise in connection with our operations. Under our various liability and workers' compensation insurance policies, we are obligated to pay directly or reimburse the insurance carrier for the deductible / retention amount of each loss covered by our general/garage liability, automobile liability policies, and workers' compensation and garage keepers legal liability policies. As a result, we are effectively self-insured for all claims up to the deductible / retention amount for each loss. It is our policy to record our self-insurance liabilities based on claims filed and an estimate of claims incurred but not yet reported. We utilize historical claims experience and actuarial methods which consider a number of factors to estimate our ultimate cost of losses incurred in determining the required level of insurance reserves and timing of expense recognition associated with claims against us. This determination requires the use of judgment in both the estimation of probability when determining the required insurance reserves and amount to be recognized as an expense. Future information regarding historical loss experience may require changes to the level of insurance reserves and could result in increased expense recognition in the future.
Allowance for Doubtful Accounts
We report accounts receivable, net of an allowance for doubtful accounts, to represent our estimate of the amount that ultimately will be realized in cash. In determining the adequacy of the allowance for doubtful accounts, we primarily use the review of specific accounts but also use historical collection trends and aging of receivables and make adjustments in the allowance as necessary. Changes in economic conditions or other circumstances could have an impact on the collection of existing receivable balances or future allowance for doubtful account considerations.
Income Taxes
Income tax expense involves management judgment as to the ultimate resolution of any tax issues. Historically, our assessments of the ultimate resolution of tax issues have been reasonably accurate. The current open issues are not dissimilar from historical items.
Deferred income taxes are computed using the asset and liability method, such that deferred tax assets and liabilities are recognized for the expected future tax consequences of temporary differences between financial reporting amounts and the tax bases of existing assets and liabilities based on currently enacted tax laws and tax rates in effect for the periods in which these temporary differences are expected to reverse or be settled. Income tax expense is the tax payable for the period plus the change during the period in deferred income taxes. We have certain state net operating loss carry forwards which expire in 2036. We consider a number of factors in our assessment of the recoverability of our state net operating loss carryforwards including their expiration dates, the limitations imposed due to the change in ownership as well as future projections of income. Future changes in our operating performance along with these considerations may significantly impact the amount of net operating losses ultimately recovered, and our assessment of their recoverability.
When evaluating our tax positions, we account for uncertainty in income taxes in our consolidated financial statements. The evaluation of a tax position is a two-step process, the first step being recognition. We determine whether it is more-likely-than-not that a tax position will be sustained upon tax examination, including resolution of any related appeals or litigation, based on only the technical merits of the position. If a tax position does not meet the more-likely-than-not threshold, the benefit of that position is not recognized in our financial statements. The second step is measurement. The tax position is measured as the largest amount of benefit that is more-likely-than-not of being realized upon ultimate resolution with a taxing authority.
Legal and Other Contingencies
We are subject to claims and litigation in the normal course of our business. The outcomes of claims and legal proceedings brought against us and other loss contingencies are subject to significant uncertainty. We accrue a charge when our management determines that it is probable that an asset has been impaired or a liability has been incurred and the amount of loss can be reasonably estimated. When a loss is probable, we record an accrual based on the reasonably estimable loss or range of loss. When no point of loss is more likely than another, we record the lowest amount in the estimated range of loss and disclose the estimated range. We do not record liabilities for reasonably possible loss
41
contingencies, but do disclose a range of reasonably possible losses if they are material and we are able to estimate such a range. If we cannot provide a range of reasonably possible losses, we explain the factors that prevent us from determining such a range. In addition, we accrue for the authoritative judgments or assertions made against us by government agencies at the time of their rendering regardless of our intent to appeal. We regularly evaluate current information available to us to determine whether an accrual should be established or adjusted. Estimating the probability that a loss will occur and estimating the amount of a loss or a range of loss involves significant estimation and judgment.
Item 7A. Quantitative and Qualitative Disclosures About Market Risk
Interest Rates
Our primary market risk exposure consists of risk related to changes in interest rates. We use the variable rate Restated Credit Facility, discussed previously, to finance our operations. This Restated Credit Facility exposes us to variability in interest payments due to changes in interest rates. If interest rates increase, interest expense increases and conversely, if interest rates decrease, interest expense also decreases. We believe that it is prudent to limit our exposure to an increase in interest rates.
In October 2012, we entered into interest rate swap transactions (collectively, the "Interest Rate Swaps") with each of JPMorgan Chase Bank, Bank of America and PNC Bank, N.A. in an initial aggregate notional amount of $150.0 million (the "Notional Amount"). The Interest Rate Swaps have an effective date of October 31, 2012 and a termination date of September 30, 2017. The Interest Rate Swaps effectively fix the interest rate on an amount of variable interest rate borrowings under our credit agreements, originally equal to the Notional Amount at 0.7525% per annum plus the applicable margin rate for LIBOR loans under our credit agreements determined based upon SP Plus's consolidated total debt to EBITDA ratio. The Notional Amount is subject to scheduled quarterly amortization that coincides with quarterly prepayments of principal under our credit agreements. These Interest Rate Swaps are classified as cash flow hedges, and we calculate the effectiveness of the hedge on a monthly basis. The ineffective portion of the cash flow hedge is recognized in earnings as an increase of interest expense. For the year ended December 31, 2016 and 2015, no ineffective portion of the cash flow was recognized as interest expense. See Note 10. Fair Value Measurement for the fair value of the Interest Rate Swaps for the year ended December 31, 2016 and 2015.
We do not enter into derivative instruments for any purpose other than cash flow hedging purposes.
In February 2015, we entered into a Restated Credit Agreement. Pursuant to the terms, and subject to the conditions, of the Restated Credit Agreement, as described in Note 11, Borrowing Arrangements within our Consolidated Financial Statements, the Lenders have made available to us a Restated Credit Facility that permits aggregate borrowings of $400.0 million consisting of (i) a revolving credit facility of up to $200.0 million at any time outstanding, which includes a letter of credit facility that is limited to $100.0 million at any time outstanding, and (ii) a term loan facility of $200.0 million, subject to securing additional commitments from the Lenders or new lending institutions. Interest expense on such borrowings is sensitive to changes in the market rate of interest. If we were to borrow the entire non-hedged variable rate debt of $114.9 million available under the revolving credit facility, a 1 percent (%) increase in the average market rate would result in an increase in our annual interest expense of $1.2 million. This amount is determined by considering the impact of the hypothetical interest rates on our borrowing cost, but does not consider the effects of the reduced level of overall economic activity that could exist in such an environment. Due to the uncertainty of the specific changes and their possible effects, the foregoing sensitivity analysis assumes no changes in our financial structure.
Foreign Currency Risk
Substantially all of our operations are conducted in the United States and, as such, are not subject to material foreign currency exchange risk. All foreign investments are denominated in U.S. dollars, with the exception of Canada. We had approximately $1.2 million of Canadian dollar denominated cash instruments at December 31, 2016, and no debt instruments denominated in Canadian dollar at December 31, 2016. We do not hold any hedging instruments related to foreign currency transactions.
We monitor foreign currency positions and may enter into certain hedging instruments in the future should we determine that exposure to foreign exchange risk has increased.
42
Item 8. Financial Statements and Supplementary Data
The consolidated financial statements and related notes and schedules required by this Item are incorporated into this Form 10-K and set forth in Part IV, Item 15. "Exhibits and Financial Statement Schedules" herein.
Item 9. Changes in and Disagreements with Accountants on Accounting and Financial Disclosure
None.
Item 9A. Controls and Procedures
Evaluation of Disclosure Controls and Procedures
Prior to the filing of our Annual Report on Form 10-K for the fiscal year ended December 31, 2016 and under the supervision and with the participation of our management, including our Chief Executive Officer, Chief Financial Officer and Corporate Controller, we carried out an evaluation of the effectiveness of the design and operation of our disclosure controls and procedures (the "Evaluation") at a reasonable assurance level as of the last day of the period covered by this Form 10-K.
Disclosure controls and procedures are defined by Rules 13a-15(e) and 15d-15(e) of the Securities Exchange Act of 1934 (the "Exchange Act") as controls and other procedures that are designed to ensure that information required to be disclosed in the reports that we file or submit under the Exchange Act is recorded, processed, summarized and reported within the time periods specified by the SEC's rules and forms. Disclosure controls and procedures include, without limitation, controls and procedures designed to ensure that information required to be disclosed in the reports that we file or submit under the Exchange Act is accumulated and communicated to our management, including our Chief Executive Officer, Chief Financial Officer and Corporate Controller, to allow timely decisions regarding required disclosures.
Based upon the Evaluation, our Chief Executive Officer, Chief Financial Officer and Corporate Controller concluded that our disclosure controls and procedures were effective at the reasonable assurance level as of December 31, 2016.
Inherent Limitations of the Effectiveness of Internal Control
Our internal control over financial reporting is designed to provide reasonable assurance regarding the reliability of financial reporting and the preparation of financial statements for external purposes in accordance with U.S. generally accepted accounting principles ("GAAP"). Our internal control over financial reporting includes those policies and procedures that:
(i) | pertain to the maintenance of records that, in reasonable detail, accurately and fairly reflect the transactions and dispositions of the Company's assets; |
(ii) | provide reasonable assurance that transactions are recorded as necessary to permit preparation of financial statements in accordance with GAAP, and that the Company's receipts and expenditures are being made only in accordance with authorizations of the Company's management and directors; and |
(iii) | provide reasonable assurance regarding prevention or timely detection of unauthorized acquisition, use, or disposition of the Company's assets that could have a material effect on the financial statements. |
Management, including our Chief Executive Officer, Chief Financial Officer and Corporate Controller, does not expect that our internal controls will prevent or detect all errors and all fraud. A control system, no matter how well designed and operated, can provide only reasonable, not absolute, assurance that the objectives of the control system are met. Further, the design of a control system must reflect the fact that there are resource constraints, and the benefits of controls must be considered relative to their costs. Because of the inherent limitations in all control systems, no evaluation of internal controls can provide absolute assurance that all control issues and instances of fraud, if any, have been detected. Also, any evaluation of the effectiveness of controls in future periods are subject to the risk that those internal controls may become inadequate because of changes in business conditions, or that the degree of compliance with the policies or procedures may deteriorate.
Management's Annual Report on Internal Control over Financial Reporting
Our management is responsible for establishing and maintaining adequate internal control over financial reporting. Our internal control system was designed to provide reasonable assurance to our management and Board of Directors regarding the preparation and fair presentation of our published financial statements.
Prior to the filing of our Annual Report on Form 10-K for the fiscal year ended December 31, 2016, our management assessed the effectiveness of our internal control over financial reporting as of the last day of the period covered by the report. In making this assessment, our management used the criteria set forth by the Committee of Sponsoring Organizations of the Treadway Commission ("COSO") in Internal Control—Integrated Framework (2013 Framework). Based on our Evaluation under the COSO Framework, our management concluded that our internal control over financial reporting was effective as of December 31, 2016.
43
Ernst & Young LLP has audited the Consolidated Financial Statements included in this Annual Report on Form 10-K and, as part of its audit, has issued an attestation report, included herein, on the effectiveness of our internal control over financial reporting.
Changes in Internal Control over Financial Reporting
There were no changes in our internal control over financial reporting during the fourth quarter of 2016, which were identified in connection with the Evaluation, that have materially affected, or are reasonably likely to materially affect, our internal control over financial reporting.
Item 9B. Other Information
None.
PART III
Item 10. Directors, Executive Officers and Corporate Governance
Information required by this item with respect to our directors and compliance by our directors, executive officers and certain beneficial owners of our common stock with Section 16(a) of the Exchange Act is incorporated by reference to all information under the captions entitled "Board Matters—Nominees for Director," "Board Matters—Nomination Process," "Our Corporate Governance Practices—Codes of Conduct and Ethics," "Board Committees and Meetings," "Executive Officers" and "Section 16(a) Beneficial Ownership Reporting Compliance" included in our 2017 Proxy Statement.
We have adopted a code of ethics as part of our compliance program. The code of ethics applies to our Chief Executive Officer (Principal Executive Officer), Chief Financial Officer (Principal Financial Officer) and Corporate Controller (Principal Accounting Officer). In addition we have adopted a code of business conduct that applies to all of our officers and employees. Any amendments to, or waivers from, our code of ethics will be posted on our website www.spplus.com. A copy of these codes of conduct and ethics will be provided to you without charge upon request to investor_relations@spplus.com.
Item 11. Executive Compensation
Information required by this item is incorporated by reference to all information under the caption entitled "Compensation Discussion and Analysis," "Compensation Committee Report," "Executive Compensation," and "Non-Employee Director Compensation," included in our 2017 Proxy Statement.
Item 12. Security Ownership of Certain Beneficial Owners and Management and Related Stockholder Matters
Information required by this item is incorporated by reference to all information under the caption entitled "Equity Compensation Plan Information" and "Security Ownership" included in our 2017 Proxy Statement.
Item 13. Certain Relationships and Related Transactions and Director Independence
Information required by this item is incorporated by reference to all information under the caption "Board Matters—Nomination Process—Board Designees," "Our Corporate Governance Practices—Director Independence," "Our Corporate Governance Practices—Related-Party Transaction Policy," and "Transactions with Related Persons and Control Persons" included in our 2017 Proxy Statement.
Item 14. Principal Accountant Fees and Services
Information required by this item is incorporated by reference to all information under the caption "Audit Committee Disclosure—Principal Accounting Fees and Services," and "Audit Committee Disclosure—Procedures for Audit Committee Pre-Approval of Audit and Permissible Non-Audit Services of our Independent Registered Public Accounting Firm" included in our 2017 Proxy Statement.
44
PART IV
Item 15. Exhibits and Financial Statement Schedules
(a) Financial Statements and Schedules
1. Financial Statements
Audited Consolidated Financial Statements | |
For the years ended December 31, 2016, 2015 and 2014 | |
2. Financial Statement Schedule
The following financial statement schedule is included in this report and should be read in conjunction with the financial statements and Report of Independent Registered Public Accounting Firm referred to above.
Other schedules are omitted since the required information is not present or is not present in amounts sufficient to require submission of the schedule, or because the information required is included in the consolidated financial statements or the notes thereto.
(b) Exhibits Required by Item 601 of Regulation S-K
The information required by this item is set forth on the exhibit index that follows the signature page of this report.
45
Report of Independent Registered Public Accounting Firm
The Board of Directors and Stockholders of SP Plus Corporation
We have audited the accompanying consolidated balance sheets of SP Plus Corporation as of December 31, 2016 and 2015, and the related consolidated statements of income, comprehensive income, stockholders' equity and cash flows for each of the three years in the period ended December 31, 2016. Our audits also included the financial statement schedule listed in the Index at Item 15. These financial statements and schedule are the responsibility of the Company's management. Our responsibility is to express an opinion on these financial statements and schedule based on our audits.
We conducted our audits in accordance with the standards of the Public Company Accounting Oversight Board (United States). Those standards require that we plan and perform the audit to obtain reasonable assurance about whether the financial statements are free of material misstatement. An audit includes examining, on a test basis, evidence supporting the amounts and disclosures in the financial statements. An audit also includes assessing the accounting principles used and significant estimates made by management, as well as evaluating the overall financial statement presentation. We believe that our audits provide a reasonable basis for our opinion.
In our opinion, the financial statements referred to above present fairly, in all material respects, the consolidated financial position of SP Plus Corporation at December 31, 2016 and 2015, and the consolidated results of its operations and its cash flows for each of the three years in the period ended December 31, 2016, in conformity with U.S. generally accepted accounting principles. Also in our opinion, the related financial statement schedule, when considered in relation to the basic financial statements taken as a whole, presents fairly in all material respects the information set forth therein.
We also have audited, in accordance with the standards of the Public Company Accounting Oversight Board (United States), SP Plus Corporation's internal control over financial reporting as of December 31, 2016, based on criteria established in Internal Control—Integrated Framework issued by the Committee of Sponsoring Organizations of the Treadway Commission (2013 framework) and our report dated February 23, 2017, expressed an unqualified opinion thereon.
/s/ ERNST & YOUNG LLP | |
Chicago, Illinois
February 23, 2017
46
Report of Independent Registered Public Accounting Firm
The Board of Directors and Stockholders of SP Plus Corporation
We have audited SP Plus Corporation's internal control over financial reporting as of December 31, 2016, based on criteria established in Internal Control—Integrated Framework issued by the Committee of Sponsoring Organizations of the Treadway Commission (2013 framework) (the COSO criteria). SP Plus Corporation's management is responsible for maintaining effective internal control over financial reporting, and for its assessment of the effectiveness of internal control over financial reporting included in the accompanying Management's Annual Report on Internal Control over Financial Reporting. Our responsibility is to express an opinion on the company's internal control over financial reporting based on our audit.
We conducted our audit in accordance with the standards of the Public Company Accounting Oversight Board (United States). Those standards require that we plan and perform the audit to obtain reasonable assurance about whether effective internal control over financial reporting was maintained in all material respects. Our audit included obtaining an understanding of internal control over financial reporting, assessing the risk that a material weakness exists, testing and evaluating the design and operating effectiveness of internal control based on the assessed risk, and performing such other procedures as we considered necessary in the circumstances. We believe that our audit provides a reasonable basis for our opinion.
A company's internal control over financial reporting is a process designed to provide reasonable assurance regarding the reliability of financial reporting and the preparation of financial statements for external purposes in accordance with generally accepted accounting principles. A company's internal control over financial reporting includes those policies and procedures that (1) pertain to the maintenance of records that, in reasonable detail, accurately and fairly reflect the transactions and dispositions of the assets of the company; (2) provide reasonable assurance that transactions are recorded as necessary to permit preparation of financial statements in accordance with generally accepted accounting principles, and that receipts and expenditures of the company are being made only in accordance with authorizations of management and directors of the company; and (3) provide reasonable assurance regarding prevention or timely detection of unauthorized acquisition, use, or disposition of the company's assets that could have a material effect on the financial statements.
Because of its inherent limitations, internal control over financial reporting may not prevent or detect misstatements. Also, projections of any evaluation of effectiveness to future periods are subject to the risk that controls may become inadequate because of changes in conditions, or that the degree of compliance with the policies or procedures may deteriorate.
In our opinion, SP Plus Corporation maintained, in all material respects, effective internal control over financial reporting as of December 31, 2016, based on the COSO criteria.
We also have audited, in accordance with the standards of the Public Company Accounting Oversight Board (United States), the consolidated balance sheets of SP Plus Corporation as of December 31, 2016 and 2015, and the related consolidated statements of income, comprehensive income, stockholders' equity, and cash flows for each of the three years in the period ended December 31, 2016, and our report dated February 23, 2017 expressed an unqualified opinion thereon.
/s/ ERNST & YOUNG LLP | |
Chicago, Illinois
February 23, 2017
47
SP Plus Corporation
Consolidated Balance Sheets
December 31, | |||||||
(millions, except for share and per share data) | 2016 | 2015 | |||||
Assets | |||||||
Cash and cash equivalents | $ | 22.2 | $ | 18.7 | |||
Notes and accounts receivable, net | 120.7 | 105.1 | |||||
Prepaid expenses and other | 13.7 | 13.9 | |||||
Total current assets | 156.6 | 137.7 | |||||
Leasehold improvements, equipment, land and construction in progress, net | 30.9 | 34.6 | |||||
Other assets | |||||||
Advances and deposits | 4.3 | 5.0 | |||||
Other intangible assets, net | 61.3 | 75.9 | |||||
Favorable acquired lease contracts, net | 30.0 | 38.1 | |||||
Equity investments in unconsolidated entities | 18.5 | 19.0 | |||||
Other assets, net | 16.3 | 14.9 | |||||
Deferred taxes | 17.9 | 15.7 | |||||
Cost of contracts, net | 11.4 | 11.9 | |||||
Goodwill | 431.4 | 431.3 | |||||
Total other assets | 591.1 | 611.8 | |||||
Total assets | $ | 778.6 | $ | 784.1 | |||
Liabilities and stockholders' equity | |||||||
Accounts payable | $ | 109.9 | $ | 95.1 | |||
Accrued rent | 21.7 | 22.9 | |||||
Compensation and payroll withholdings | 25.7 | 21.0 | |||||
Property, payroll and other taxes | 7.6 | 8.6 | |||||
Accrued insurance | 18.1 | 19.4 | |||||
Accrued expenses | 25.5 | 25.4 | |||||
Current portion of long-term obligations under Restated Credit Facility and other long-term borrowings | 20.4 | 15.2 | |||||
Total current liabilities | 228.9 | 207.6 | |||||
Long-term borrowings, excluding current portion | |||||||
Obligations under Restated Credit Facility | 174.5 | 209.4 | |||||
Other long-term borrowings | 0.2 | 0.5 | |||||
174.7 | 209.9 | ||||||
Unfavorable acquired lease contracts, net | 40.2 | 50.3 | |||||
Other long-term liabilities | 66.4 | 66.2 | |||||
Total noncurrent liabilities | 281.3 | 326.4 | |||||
Stockholders' equity | |||||||
Preferred Stock, par value $0.01 per share; 5,000,000 shares authorized as of December 31, 2016 and 2015; no shares issued | — | — | |||||
Common stock, par value $0.001 per share; 50,000,000 shares authorized as of December 31, 2016 and 2015; 22,356,586 and 22,328,578 shares issued and outstanding as of December 31, 2016 and 2015, respectively | — | — | |||||
Treasury stock, 305,183 at cost; shares at December 31, 2016 and nil shares at December 31, 2015 | (7.5 | ) | — | ||||
Additional paid-in capital | 251.2 | 247.9 | |||||
Accumulated other comprehensive loss | (1.4 | ) | (1.1 | ) | |||
Retained earnings | 25.9 | 2.8 | |||||
Total SP Plus Corporation stockholders' equity | 268.2 | 249.6 | |||||
Noncontrolling interest | 0.2 | 0.5 | |||||
Total shareholders' equity | 268.4 | 250.1 | |||||
Total liabilities and stockholders' equity | $ | 778.6 | $ | 784.1 | |||
See Notes to Consolidated Financial Statements.
48
SP Plus Corporation
Consolidated Statements of Income
Years Ended December 31, | |||||||||||
(millions, except for share and per share data) | 2016 | 2015 | 2014 | ||||||||
Parking services revenue | |||||||||||
Lease contracts | $ | 545.0 | $ | 570.9 | $ | 496.6 | |||||
Management contracts | 346.8 | 350.3 | 338.3 | ||||||||
891.8 | 921.2 | 834.9 | |||||||||
Reimbursed management contract revenue | 723.7 | 694.7 | 679.8 | ||||||||
Total parking services revenue | 1,615.5 | 1,615.9 | 1,514.7 | ||||||||
Cost of parking services | |||||||||||
Lease contracts | 505.6 | 532.8 | 455.7 | ||||||||
Management contracts | 209.8 | 218.3 | 207.9 | ||||||||
715.4 | 751.1 | 663.6 | |||||||||
Reimbursed management contract expense | 723.7 | 694.7 | 679.8 | ||||||||
Total cost of parking services | 1,439.1 | 1,445.8 | 1,343.4 | ||||||||
Gross profit | |||||||||||
Lease contracts | 39.4 | 38.1 | 40.9 | ||||||||
Management contracts | 137.0 | 132.0 | 130.4 | ||||||||
Total gross profit | 176.4 | 170.1 | 171.3 | ||||||||
General and administrative expenses | 90.0 | 97.3 | 101.5 | ||||||||
Depreciation and amortization | 33.7 | 34.0 | 30.3 | ||||||||
Operating income | 52.7 | 38.8 | 39.5 | ||||||||
Other expense (income) | |||||||||||
Interest expense | 10.5 | 12.7 | 17.8 | ||||||||
Interest income | (0.5 | ) | (0.2 | ) | (0.4 | ) | |||||
Gain on sale of a business | — | (0.5 | ) | — | |||||||
Gain on contribution of a business to an unconsolidated entity | — | — | (4.1 | ) | |||||||
Equity in losses from investment in unconsolidated entity | 0.9 | 1.7 | 0.3 | ||||||||
Total other expenses (income) | 10.9 | 13.7 | 13.6 | ||||||||
Earnings before income taxes | 41.8 | 25.1 | 25.9 | ||||||||
Income tax expense (benefit) | 15.8 | 4.8 | (0.2 | ) | |||||||
Net income | 26.0 | 20.3 | 26.1 | ||||||||
Less: Net income attributable to noncontrolling interest | 2.9 | 2.9 | 3.0 | ||||||||
Net income attributable to SP Plus Corporation | $ | 23.1 | $ | 17.4 | $ | 23.1 | |||||
Common stock data | |||||||||||
Net income per common share | |||||||||||
Basic | $ | 1.04 | $ | 0.78 | $ | 1.05 | |||||
Diluted | $ | 1.03 | $ | 0.77 | $ | 1.03 | |||||
Weighted average shares outstanding | |||||||||||
Basic | 22,238,021 | 22,189,140 | 22,009,800 | ||||||||
Diluted | 22,528,122 | 22,511,759 | 22,407,343 | ||||||||
See Notes to Consolidated Financial Statements.
49
SP Plus Corporation
Consolidated Statements of Comprehensive Income
Years Ended December 31, | |||||||||||
(millions) | 2016 | 2015 | 2014 | ||||||||
Net income | $ | 26.0 | $ | 20.3 | $ | 26.1 | |||||
Other comprehensive expense | (0.3 | ) | (0.9 | ) | (0.3 | ) | |||||
Comprehensive income | 25.7 | 19.4 | 25.8 | ||||||||
Less: Comprehensive income attributable to noncontrolling interest | 2.9 | 2.9 | 3.0 | ||||||||
Comprehensive income attributable to SP Plus Corporation | $ | 22.8 | $ | 16.5 | $ | 22.8 | |||||
See Notes to Consolidated Financial Statements.
50
SP Plus Corporation
Consolidated Statements of Stockholders' Equity
Common Stock | ||||||||||||||||||||||||||||||
(millions, except for share and per share data) | Number of Shares | Par Value | Additional Paid-In Capital | Accumulated Other Comprehensive Income (Loss) | Retained Earnings (Accumulated Deficit) | Treasury Stock | Noncontrolling Interest | Total | ||||||||||||||||||||||
Balance (deficit) at December 31, 2013 | 21,977,311 | $ | — | $ | 240.7 | $ | 0.1 | $ | (37.7 | ) | $ | 0.6 | $ | 203.7 | ||||||||||||||||
Net income | 23.1 | 3.0 | 26.1 | |||||||||||||||||||||||||||
Foreign currency translation adjustments | (0.2 | ) | (0.2 | ) | ||||||||||||||||||||||||||
Effective portion of cash flow hedge | (0.2 | ) | (0.2 | ) | ||||||||||||||||||||||||||
Issuance of stock grants | 19,336 | 0.5 | 0.5 | |||||||||||||||||||||||||||
Vested restricted stock units | 131,078 | — | ||||||||||||||||||||||||||||
Non-cash stock-based compensation related to restricted stock units | 2.8 | 2.8 | ||||||||||||||||||||||||||||
Tax benefit from exercise of stock options | (0.1 | ) | (0.1 | ) | ||||||||||||||||||||||||||
Distribution to noncontrolling interest | (2.9 | ) | (2.9 | ) | ||||||||||||||||||||||||||
Balance (deficit) at December 31, 2014 | 22,127,725 | $ | — | $ | 243.9 | $ | (0.2 | ) | $ | (14.6 | ) | $ | — | $ | 0.7 | $ | 229.8 | |||||||||||||
Net income | 17.4 | 2.9 | 20.3 | |||||||||||||||||||||||||||
Foreign currency translation adjustments | (0.7 | ) | (0.7 | ) | ||||||||||||||||||||||||||
Effective portion of cash flow hedge | (0.2 | ) | (0.2 | ) | ||||||||||||||||||||||||||
Issuance of stock grants | 29,305 | — | 0.7 | 0.7 | ||||||||||||||||||||||||||
Vested restricted stock units | 164,447 | — | — | — | ||||||||||||||||||||||||||
Proceeds from exercise of stock options | 7,101 | — | — | — | ||||||||||||||||||||||||||
Non-cash stock-based compensation related to restricted stock units and performance share units | 3.0 | 3.0 | ||||||||||||||||||||||||||||
Tax benefit from vesting of restricted stock | 0.3 | 0.3 | ||||||||||||||||||||||||||||
Distribution to noncontrolling interest | (3.1 | ) | (3.1 | ) | ||||||||||||||||||||||||||
Balance (deficit) at December 31, 2015 | 22,328,578 | $ | — | $ | 247.9 | $ | (1.1 | ) | $ | 2.8 | $ | — | $ | 0.5 | $ | 250.1 | ||||||||||||||
Net income | 23.1 | 2.9 | 26.0 | |||||||||||||||||||||||||||
Foreign currency translation adjustments | (0.2 | ) | (0.2 | ) | ||||||||||||||||||||||||||
Effective portion of cash flow hedge | (0.1 | ) | (0.1 | ) | ||||||||||||||||||||||||||
Issuance of stock grants | 26,593 | — | 0.6 | 0.6 | ||||||||||||||||||||||||||
Vested restricted stock units | 1,415 | — | — | |||||||||||||||||||||||||||
Non-cash stock-based compensation related to restricted stock units and performance share units | 2.7 | 2.7 | ||||||||||||||||||||||||||||
Treasury stock | (7.5 | ) | (7.5 | ) | ||||||||||||||||||||||||||
Distribution to noncontrolling interest | (3.3 | ) | (3.3 | ) | ||||||||||||||||||||||||||
Balance (deficit) at December 31, 2016 | 22,356,586 | $ | — | $ | 251.2 | $ | (1.4 | ) | $ | 25.9 | $ | (7.5 | ) | $ | 0.2 | $ | 268.4 | |||||||||||||
See Notes to Consolidated Financial Statements.
51
SP Plus Corporation
Consolidated Statements of Cash Flows
Year Ended December 31, | |||||||||||
(millions) | 2016 | 2015 | 2014 | ||||||||
Operating activities | |||||||||||
Net income | $ | 26.0 | $ | 20.3 | $ | 26.1 | |||||
Adjustments to reconcile net income to net cash provided by operating activities: | |||||||||||
Depreciation and amortization | 34.2 | 34.1 | 30.4 | ||||||||
Net accretion of acquired lease contracts | (1.8 | ) | (0.9 | ) | (1.0 | ) | |||||
(Gain) loss on sale of equipment | (0.3 | ) | 0.4 | (0.3 | ) | ||||||
Net gain on sale of business | — | (0.5 | ) | — | |||||||
Amortization of debt issuance costs | 0.8 | 1.1 | 1.3 | ||||||||
Amortization of original discount on borrowings | 0.5 | 1.0 | 1.2 | ||||||||
Non-cash stock-based compensation | 3.4 | 3.7 | 3.3 | ||||||||
Provision for losses on accounts receivable | 0.4 | 0.7 | 0.7 | ||||||||
Excess tax (benefit) expense related to vesting of restricted stock units | — | (0.3 | ) | 0.1 | |||||||
Gain on contribution of a business to an unconsolidated entity | — | — | (4.1 | ) | |||||||
Deferred income taxes | (2.1 | ) | (9.7 | ) | (12.1 | ) | |||||
Changes in operating assets and liabilities | |||||||||||
Notes and accounts receivable | (15.9 | ) | 3.5 | 5.4 | |||||||
Prepaid assets | (1.0 | ) | 3.7 | 2.6 | |||||||
Other assets | (0.5 | ) | 4.4 | (0.5 | ) | ||||||
Accounts payable | 14.8 | (11.4 | ) | (9.0 | ) | ||||||
Accrued liabilities | 1.2 | (6.5 | ) | 7.5 | |||||||
Net cash provided by operating activities | 59.7 | 43.6 | 51.6 | ||||||||
Investing activities | |||||||||||
Purchase of leasehold improvements and equipment | (13.0 | ) | (9.6 | ) | (13.5 | ) | |||||
Proceeds from sale of equipment and contract terminations | 3.0 | 0.5 | 0.9 | ||||||||
Cash received from sale of business, net | — | 1.0 | — | ||||||||
Cost of contracts purchased | (3.8 | ) | (3.7 | ) | (2.3 | ) | |||||
Net cash used in investing activities | (13.8 | ) | (11.8 | ) | (14.9 | ) | |||||
Financing activities | |||||||||||
Contingent payments for businesses acquired | — | (0.1 | ) | (1.8 | ) | ||||||
Payments on senior credit facility revolver (Senior Credit Facility and Restated Credit Facility) | (401.0 | ) | (460.9 | ) | (572.6 | ) | |||||
Proceeds from senior credit facility revolver (Senior Credit Facility and Restated Credit Facility) | 385.0 | 439.5 | 568.0 | ||||||||
Proceeds from term loan (Restated Credit Facility) | — | 10.4 | — | ||||||||
Payments on term loan (Senior Credit Facility and Restated Credit Facility) | (15.0 | ) | (15.0 | ) | (32.3 | ) | |||||
Proceeds from (payments on) other long-term borrowings | (0.3 | ) | (0.3 | ) | 0.2 | ||||||
Distribution to noncontrolling interest | (3.3 | ) | (3.1 | ) | (2.9 | ) | |||||
Payments of debt issuance costs and original discount on borrowings | — | (1.4 | ) | — | |||||||
Excess tax (benefit) expense related to vesting of restricted stock units | — | 0.3 | (0.1 | ) | |||||||
Repurchase of common stock | (7.5 | ) | — | — | |||||||
Net cash used in financing activities | (42.1 | ) | (30.6 | ) | (41.5 | ) | |||||
Effect of exchange rate changes on cash and cash equivalents | (0.3 | ) | (0.7 | ) | (0.2 | ) | |||||
Increase (decrease) in cash and cash equivalents | 3.5 | 0.5 | (5.0 | ) | |||||||
Cash and cash equivalents at beginning of year | 18.7 | 18.2 | 23.2 | ||||||||
Cash and cash equivalents at end of year | $ | 22.2 | $ | 18.7 | $ | 18.2 | |||||
Supplemental Disclosures | |||||||||||
Cash paid during the period for | |||||||||||
Interest | $ | 9.2 | $ | 10.7 | $ | 13.9 | |||||
Income taxes, net | $ | 17.6 | $ | 18.1 | $ | 1.3 | |||||
See Notes to Consolidated Financial Statements.
52
SP PLUS CORPORATION
NOTES TO CONSOLIDATED FINANCIAL STATEMENTS
(millions, except share and per share data)
1. Significant Accounting Policies and Practices
The Company
SP Plus Corporation (the "Company") provides parking management, ground transportation and other ancillary services to commercial, institutional and municipal clients in urban markets and airports across the United States, Puerto Rico and Canada. These services include a comprehensive set of on-site parking management and ground transportation services, which include facility maintenance, training, scheduling and supervising all service personnel as well as providing customer service, marketing, and accounting and revenue control functions necessary to facilitate the operation of clients' facilities. The Company also provides a range of ancillary services such as airport shuttle operations, valet services, taxi and livery dispatch services, security services and municipal meter revenue collection and enforcement services.
Principles of Consolidation
The consolidated financial statements include the accounts of the Company, its wholly owned subsidiaries, and Variable Interest Entities ("VIEs") in which the Company is the primary beneficiary. All significant intercompany profits, transactions and balances have been eliminated in consolidation.
Use of Estimates
The preparation of financial statements in conformity with accounting principles generally accepted in the United States requires management to make estimates and assumptions that affect the amounts reported in the financial statements and accompanying notes. Actual results could differ from those estimates. Management evaluates its estimates and assumptions on an ongoing basis using historical experience and other factors, including the current environment.
Foreign Currency Translation
The functional currency of the Company's foreign operations is the local currency. Accordingly, assets and liabilities of the Company's foreign operations are translated from foreign currencies into U.S. dollars at the rates in effect on the balance sheet date while income and expenses are translated at the weighted-average exchange rates for the year. Adjustments resulting from the translations of foreign currency financial statements are accumulated and classified as a separate component of stockholders' equity.
Cash and Cash Equivalents
Cash equivalents represent funds temporarily invested in money market instruments with maturities of three months or less. Cash equivalents are stated at cost, which approximates fair value. Cash and cash equivalents that are restricted as to withdrawal or use under the terms of certain contractual agreements was $0.3 million and $0.9 million as of December 31, 2016 and 2015, respectively, and are included within Cash and cash equivalents within the Consolidated Balance Sheet.
Allowance for Doubtful Accounts
Accounts receivable, net of the allowance for doubtful accounts, represents the Company's estimate of the amount that ultimately will be realized in cash. Management reviews the adequacy of its allowance for doubtful accounts on an ongoing basis, using historical collection trends, aging of receivables, and a review of specific accounts, and makes adjustments in the allowance as necessary. Changes in economic conditions or other circumstances could have an impact on the collection of existing receivable balances or future allowance considerations. As of December 31, 2016 and 2015, the Company's allowance for doubtful accounts was $0.4 million and $0.9 million, respectively.
Leasehold Improvements, Equipment, Land and Construction in Progress, net
Leasehold improvements, equipment, software, vehicles, and other fixed assets are stated at cost less accumulated depreciation and amortization. Equipment is depreciated on the straight-line basis over the estimated useful lives ranging from 2 to 10 years. Expenditures for major renewals and improvements that extend the useful life of property and equipment are capitalized. Leasehold improvements are amortized on the straight-line basis over the terms of the respective leases or the service lives of the improvements, whichever is shorter (weighted average remaining life of approximately 8.4 years).
Certain costs associated with directly obtaining, developing or upgrading internal-use software are capitalized and amortized over the estimated useful life of software.
Cost of Contracts
Cost of contracts represents the cost of obtaining contractual rights associated with providing parking services at a managed or leased facility. Cost of parking contracts are amortized over the estimated life of the contracts, including anticipated renewals and terminations. Estimated lives are based on the contract life or anticipated lives of the contract.
53
Goodwill and Other Intangibles
Goodwill represents the excess of purchase price paid over the fair value of net assets acquired. In accordance with the Financial Accounting Standards Board's ("FASB") authoritative accounting guidance on goodwill, the Company does not amortize goodwill but rather evaluates it for impairment on an annual basis, or more often if events or circumstances change that could cause goodwill to become impaired. The Company has elected to assess the impairment of goodwill annually on the first day of its fiscal fourth quarter, or at an interim date if there is an event or change in circumstances indicate the carrying value may not be recoverable. Factors that could trigger an impairment review include significant under-performance relative to expected historical or projected future operating results, significant changes in the use of acquired assets or its business strategy, and significant negative industry or economic trends.
A multi-step impairment test is performed on goodwill. For the fourth quarter 2016 goodwill impairment test, the Company utilized the option to evaluate various qualitative factors to determine the likelihood of impairment and if it was more likely than not that the fair value of the reporting units were less than the carrying value of the reporting unit. The Company concluded there was no impairment of goodwill at any of the reporting units.
If the Company does not elect to perform a qualitative assessment, it can voluntarily proceed directly to Step 1. The Company performed a Step 1 goodwill test as of January 1, 2016 due to a change in reporting units. In Step 1, the Company performs a quantitative analysis to compare the fair value of the reporting unit to its carrying value including goodwill. If the fair value of the reporting unit exceeds the carrying value of the net assets assigned to that unit, goodwill is not considered impaired, and the Company's is not required to perform further testing. If the carrying value of the net assets assigned to the reporting unit exceeds the fair value of the reporting unit, then the Company must perform Step 2 of the impairment test in order to determine the implied fair value of the reporting unit's goodwill. If the carrying value of a reporting unit's goodwill exceeds its implied fair value, then the Company would record an impairment loss equal to the difference.
The goodwill impairment test is performed at the reporting unit level; the Company's reporting units represent its operating segments, consisting of the Urban reporting unit, Airport transportation services reporting unit, USA Parking reporting unit and event planning and transportation services reporting unit. The December 31, 2016 goodwill balances by reportable segment are presented in detail in Note. 9 Goodwill. Management determines the fair value of each of its reporting units by using a discounted cash flow approach and a market approach using multiples of EBITDA of comparable companies to estimate market value. In addition, the Company compares its derived enterprise value on a consolidated basis to the Company's market capitalization as of its test date to ensure its derived value approximates the market value of the Company when taken as a whole.
In conducting its goodwill impairment quantitative assessment, the Company analyzed actual and projected growth trends of the reporting unit, gross margin, operating expenses and EBITDA (which also includes forecasted five-year income statement and working capital projections, a market-based weighted average cost of capital and terminal values after five years). The Company also assesses critical areas that may impact its business including economic conditions, market related exposures, competition, changes in product offerings and changes in key personnel for each of its reporting unit's. As part of the 2016 and 2015 annual goodwill assessments, the Company engaged a third party to evaluate its reporting unit's fair values.
The Company will continue to perform a goodwill impairment test as required on an annual basis and on an interim basis, if certain conditions exist. Factors the Company considers important, which could result in changes to its estimates, include under-performance relative to historical or projected future operating results and declines in acquisitions and trading multiples. Due to the broad customer base, the Company does not believe its future operating results will vary significantly relative to its historical and projected future operating results. However, future events may indicate differences from its judgments and estimates which could, in turn, result in impairment charges in the future. Future events that may result in impairment charges include increases in interest rates, which would impact discount rates, and unfavorable economic conditions or other factors which could decrease revenues and profitability of existing locations and changes in the cost structure of existing facilities. Factors that could potentially have an unfavorable economic effect on management's judgments and estimates include, among others: changes imposed by governmental and regulatory agencies, such as property condemnations and assessment of parking-related taxes; and construction or other events that could change traffic patterns; and terrorism or other catastrophic events.
Intangible assets with finite lives are amortized over their estimated useful lives and reviewed for impairment when circumstances change that would create a triggering event. Intangible assets with finite lives are amortized on a straight-line basis over their estimated useful lives. The Company evaluates the remaining useful life of the other intangible assets on a periodic basis to determine whether events or circumstances warrant a revision to the remaining useful life. Assumptions and estimates about future values and remaining useful lives of its intangible and other long-lived assets are complex and subjective. They can be affected by a variety of factors, including external factors such as industry and economic trends, and internal factors, such as changes in its business strategy and internal forecasts. Although management believes the historical assumptions and estimates are reasonable and appropriate, different assumptions and estimates could materially impact its reported financial results.
Long-Lived Assets
The Company evaluates long-lived asset groups whenever events or circumstances indicate that the carrying value of an asset or asset group may not be recoverable. Events or circumstances that would result in an impairment review primarily include a significant change in the use of an asset, or the planned sale or disposal of an asset. Recoverability of assets to be held and used is measured by a comparison of the carrying amount of the asset to future undiscounted cash flows expected to be generated by the asset
54
group. If it is determined to be impaired, the impairment recognized is measured by the amount by which the carrying value of the asset exceeds its fair value. The Company's estimates of future cash flows from such assets could be impacted if it underperforms relative to historical or projected future operating results.
Assumptions and estimates used to determine cash flows in the evaluation of impairment and the fair values used to determine the impairment are subject to a degree of judgment and complexity. Any changes to the assumptions and estimates resulting from changes in actual results or market conditions from those anticipated may affect the carrying value of long-lived assets and could result in an impairment charge.
Debt Issuance Costs
The costs of obtaining financing are capitalized and amortized as interest expense over the term of the respective financing using the effective interest method. Pursuant to ASU 2015-03, Interest - Imputation of Interest (Subtopic 835-30), adopted by the Company on December 31, 2015, debt issuance costs of $1.6 million and $2.4 million at December 31, 2016, and 2015, respectively, are recorded as a direct deduction from the carrying amount of the Company's debt balance within the Consolidated Balance Sheets and are reflected net of accumulated amortization of $9.0 million and $8.2 million respectively. Amortization expense related to debt issuance costs and included in interest expense within the Consolidated Statements of Income was $0.8 million, $0.9 million and $1.3 million for the years ended December 31, 2016, 2015 and 2014, respectively.
Financial Instruments
The carrying values of cash, accounts receivable and accounts payable approximate their fair value due to the short-term nature of these financial instruments. Book overdrafts of $36.5 million and $25.8 million are included within Accounts payable within the Consolidated Balance Sheets as of December 31, 2016, and 2015, respectively. Long-term debt has a carrying value that approximates fair value because these instruments bear interest at variable market rates.
Insurance Reserves
The Company purchases comprehensive casualty insurance covering certain claims that arise in connection with its operations. In addition, the Company purchases umbrella/excess liability coverage. Under the various liability and workers' compensation insurance policies, the Company is obligated to pay directly or reimburse the insurance carrier for the deductible / retention amount of each loss covered by its general/garage liability or automobile liability policies and its workers' compensation and garage keepers legal liability policies. As a result, the Company is, in effect, self-insured for all claims up to the deductible / retention amount of each loss. The Company applies the provisions as defined in the guidance related to accounting for contingencies, in determining the timing and amount of expense recognition associated with claims against the Company. The expense recognition is based upon the Company's determination of an unfavorable outcome of a claim being deemed as probable and capable of being reasonably estimated, as defined in the guidance related to accounting for contingencies. This determination requires the use of judgment in both the estimation of probability and the amount to be recognized as an expense. The Company utilizes historical claims experience along with regular input from third party insurance advisers in determining the required level of insurance reserves. Future information regarding historical loss experience may require changes to the level of insurance reserves and could result in increased expense recognition in the future.
Legal and Other Commitments and Contingencies
The Company is subject to litigation in the normal course of its business. The Company applies the provisions as defined in the guidance related to accounting for contingencies in determining the recognition and measurement of expense recognition associated with legal claims against the Company.
Management uses guidance from internal and external legal counsel on the potential outcome of litigation in determining the need to record liabilities for potential losses and the disclosure of pending legal claims.
Certain lease contracts acquired in the Central Merger include provisions allocating to the Company responsibility for the cost of certain structural and other repairs required to be made to the leased property, including improvement and repair costs arising as a result of ordinary wear and tear. The Company recorded $0.7 million, $4.6 million and $1.3 million for the year ended December 31, 2016, 2015 and 2014 respectively, of costs (net of expected recoveries of the total cost recognized by the Company through the applicable indemnity discussed further in Note 2. Central Merger and Restructuring, Merger and Integration Costs) in Cost of parking services-Lease contracts within the Consolidated Statements of Income for structural and other repair costs related to certain lease contracts acquired in the Central Merger, whereby the Company has expensed repair costs for certain leases and engaged third-party general contractors to complete certain structural and other repair projects, and other indemnity related costs. The Company currently expects to incur additional costs for certain structural and other repair costs pursuant to the contractual requirements of certain lease contracts acquired in the Central Merger ("Structural and Repair Costs"). Based on information available at this time, the Company currently expects to incur additional Structural and Repair Costs of $0.2 million. While the Company is unable to estimate with certainty when such remaining costs will be incurred, it is expected that a substantial majority of these costs will be incurred in early 2017. Additionally and as further described in Note 2. Central Merger and Restructuring, Merger and Integration, the Company settled all outstanding matters between the former Central stockholders and the Company and is therefore unable to recover any additional Structural and Repair Costs yet to be incurred by the Company through the indemnity.
55
Interest Rate Swaps
In October 2012, the Company entered into Interest Rate Swap transactions (collectively, the "Interest Rate Swaps") with each of JPMorgan Chase Bank, N.A., Bank of America, N.A. and PNC Bank, N.A. in an initial aggregate Notional Amount of $150.0 million (the "Notional Amount"). The Interest Rate Swaps have a termination date of September 30, 2017. The Interest Rate Swaps effectively fix the interest rate on an amount of variable interest rate borrowings under the Company's credit agreements, originally equal to the Notional Amount at 0.7525% per annum plus the applicable margin rate for LIBOR loans under the Company's credit agreements determined based upon the Company's consolidated total debt to EBITDA ratio. The Notional Amount is subject to scheduled quarterly amortization that coincides with quarterly prepayments of principal under the credit agreements. These Interest Rate Swaps are classified as cash flow hedges, and the Company calculates the effectiveness of the hedge on a monthly basis. The ineffective portion of the cash flow hedge is recognized in earnings as an increase to interest expense. As of December 31, 2016, no ineffective portion of cash flow hedges has been recognized in interest expense. See Note 10. Fair Value Measurement for the fair value of the Interest Rate Swaps for the year ended December 31, 2016 and 2015.
The Company does not enter into derivative instruments for any purpose other than cash flow hedging purposes.
Parking Services Revenue
The Company's revenues are primarily derived from leased locations, managed properties and the providing of ancillary services, such as accounting, payments received for exercising termination rights, consulting development fees, gains on sales of contracts, insurance (general, workers' compensation and health care) and other value-added services. In accordance with the guidance related to revenue recognition, revenue is recognized when persuasive evidence of an arrangement exists, the fees are fixed or determinable, and collectability is reasonably assured and as services are provided. The Company recognizes gross receipts (net of taxes collected from customers) as revenue from leased locations, and management fees for parking services, as the related services are provided. Ancillary services are earned from management contract properties and are recognized as revenue as those services are provided.
Cost of Parking Services
The Company recognizes costs for leases, non-reimbursed costs from managed facilities and reimbursed expense as cost of parking services. Cost of parking services consists primarily of rent and payroll related costs.
Reimbursed Management Contract Revenue and Expense
The Company recognizes as both revenues and expenses, in equal amounts, costs incurred by the Company that are directly reimbursed from its management clients. The Company has determined it is the principal in these transactions, as defined in Accounting Standard Codification (ASC) 605-45 Principal Agent Considerations, based on the indicators of gross revenue reporting. As the principal, the Company is the primary obligor in the arrangement, has latitude in establishing price, discretion in supplier selection, and the Company assumes credit risk.
Advertising Costs
Advertising costs are expensed as incurred and are included in General and administrative expenses within the Consolidated Statements of Income. Advertising expenses aggregated $1.2 million, $1.6 million, and $1.3 million for 2016, 2015, and 2014, respectively.
Stock-Based Compensation
Share based payments to employees including grants of employee stock options, restricted stock units and performance-based share units are measured at the grant date, based on the estimated fair value of the award, and the related expense is recognized over the requisite employee service period or performance period (generally the vesting period) for awards expected to vest (considering estimated forfeitures).
Equity Investment in Unconsolidated Entities
The Company has ownership interests in 29 active partnerships, joint ventures or similar arrangements that operate parking facilities, of which 21 are consolidated under the VIE or voting interest models and 8 are unconsolidated where the Company’s ownership interests range from 30-50 percent and for which there are no indicators of control. The Company accounts for such investments under the equity method of accounting, and its underlying share of each investee’s equity is included in Equity investments in unconsolidated entities within the Condensed Consolidated Balance Sheets. As the operations of these entities are consistent with the Company’s underlying core business operations, the equity in earnings of these investments are included in Parking services revenue—Lease contracts within the Condensed Consolidated Statements of Income. The equity earnings in these related investments were $2.4 million, $2.0 million, and $1.9 million for the year ended December 31, 2016, 2015 and 2014, respectively.
In October 2014, the Company entered into an agreement to establish a joint venture with Parkmobile USA, Inc. and contributed all of the assets and liabilities of its proprietary Click and Park parking prepayment business in exchange for a 30 percent interest in the newly formed legal entity called Parkmobile, LLC ("Parkmobile"). The joint venture of Parkmobile provides on-demand and prepaid transaction processing for on- and off-street parking and transportation services. The contribution of the Click and Park
56
business in the joint venture resulted in a loss of control of the business, and therefore it was deconsolidated from the Company's financial statements. As a result of the deconsolidation, the Company recognized a pre-tax gain of $4.1 million, which was measured as the fair value of the consideration received in the form of a 30 percent interest in Parkmobile less the carrying amount of the former business' net assets, including goodwill. The pre-tax gain is reflected in Gain on a sale of business within the Consolidated Statements of Income. The Company accounts for its investment in the Parkmobile joint venture using the equity method of accounting, and its underlying share of equity in Parkmobile is included in Equity investments in unconsolidated entities within the Consolidated Balance Sheets. The equity earnings in the Parkmobile joint venture are included in Equity Investments in Unconsolidated Entities within the Consolidated Statements of Income.
Non-Controlling Interests
Noncontrolling interests represent the noncontrolling holders' percentage share of income or losses from the subsidiaries in which the Company holds a majority, but less than 100 percent, ownership interest and the results of which are consolidated and included within in our consolidated financial statements.
Sale of Business
During the third quarter 2015, the Company signed an agreement to sell and subsequently sold portions of the Company’s security business primarily operating in the Southern California market to a third-party for a gross sales price of $1.8 million, which resulted in a gain on sale of business of $0.5 million, net of legal and other expenses. The pre-tax gain is reflected in Gain on sale of a business within the Consolidated Statements of Income. The assets under the sale agreement met the definition of a business as defined by ASU 805-10-55-4. Cash consideration received during the third quarter 2015, net of legal and other expenses, was $1.0 million with the remaining consideration for the sale of the business being classified as contingent consideration, which per the sale agreement is based on the performance of the business and retention of current customers over an eighteen-month period, and due from the buyer in February 2017. The buyer has sixty days from February 2017 to calculate and remit the remaining consideration. The contingent consideration was valued at fair value as of the date of sale of the business and resulted in the Company recognizing a contingent consideration receivable from the buyer in the amount of $0.5 million. The pre-tax profit for the operations of the sold business was not significant to prior periods presented. See Note 10. Fair Value Measurement for the fair value of the contingent consideration receivable as of December 31, 2016 and 2015.
Income Taxes
Income tax expense involves management judgment as to the ultimate resolution of any tax issues. Historically, our assessments of the ultimate resolution of tax issues have been reasonably accurate. The current open issues are not dissimilar from historical items.
Deferred income taxes are computed using the asset and liability method, such that deferred tax assets and liabilities are recognized for the expected future tax consequences of temporary differences between financial reporting amounts and the tax bases of existing assets and liabilities based on currently enacted tax laws and tax rates in effect for the periods in which these temporary differences are expected to reverse or settle. Income tax expense is the tax payable for the period plus the change during the period in deferred income taxes. The Company has certain state net operating loss carry forwards which expire in 2036. The Company considers a number of factors in its assessment of the recoverability of its net operating loss carryforwards including their expiration dates, the limitations imposed due to the change in ownership as well as future projections of income. Future changes in the Company's operating performance along with these considerations may significantly impact the amount of net operating losses ultimately recovered, and its assessment of their recoverability.
When evaluating our tax positions, the Company accounts for uncertainty in income taxes in its consolidated financial statements. The evaluation of a tax position is a two-step process, the first step being recognition. The Company determines whether it is more-likely-than-not that a tax position will be sustained upon tax examination, including resolution of any related appeals or litigation, based on only the technical merits of the position. If a tax position does not meet the more-likely-than-not threshold, the benefit of that position is not recognized in our financial statements. The second step is measurement. The tax position is measured as the largest amount of benefit that is more-likely-than-not of being realized upon ultimate resolution with a taxing authority.
Recent Accounting Pronouncements
Adopted Accounting Pronouncements
In November 2015, the Financial Accounting Standards Board ("the FASB") issued Accounting Standards Update ("ASU") No. 2015-17, Income Taxes (Topic 740): Balance Sheet Classification of Deferred Taxes. ASU 2015-17 requires entities to present deferred tax assets and liabilities as noncurrent on the balance sheet. This ASU simplifies current guidance which requires entities to separately classify deferred tax assets and liabilities as current or noncurrent on the balance sheet. The new guidance will be effective for public business entities in fiscal years beginning after December 15, 2016, including interim periods within those years. The guidance may be applied either prospectively, for all deferred tax assets and liabilities, or retrospectively (i.e., by reclassifying the comparative balance sheet). If applied prospectively, entities are required to include a statement that prior periods were not retrospectively adjusted. If applied retrospectively, entities are also required to include quantitative information about the effects of the change on prior periods. The Company adopted the provisions of ASU 2015-17 retrospectively in the fourth quarter of 2016. Upon adoption, $12.3 million of deferred taxes previously classified as a component of current assets in the Condensed Consolidated Balance Sheet as of December 31, 2015 have been reclassified as a component of long-term deferred tax assets. The adoption
57
of ASU 2015-17 did not have an impact on the Company's results of operations or cash flows. See Note 14. Income Taxes for further details of the impact of ASU 2015-17.
In September 2015, the FASB issued ASU No. 2015-16, Business Combinations (Topic 805): Simplifying the Accounting for Measurement-Period Adjustments. ASU 2015-16 requires that an acquirer in a business combination recognize adjustments to provisional amounts that are identified during the measurement period in the reporting period in which the adjustment amounts are determined. The amendment requires that the acquirer record, in the same period’s financial statements, the effect on earnings of changes in depreciation, amortization, or other income effects, if any, as a result of the change to the provisional amounts, calculated as if the accounting had been completed at the acquisition date. The ASU also requires an entity to present separately on the face of the income statement or disclose in the notes the portion of the amount recorded in current-period earnings by line item that would have been recorded in previous reporting periods if the adjustment to the provisional amounts had been recognized as of the acquisition date. ASU 2015-16 is effective for interim and annual reporting periods beginning after December 15, 2015. The Company adopted the standard as of March 2016 on a prospective basis, as required. The adoption of this standard did not have an impact on the Company's financial position, results of operations, cash flows, and financial statement disclosures.
In February 2015, the FASB issued ASU No. 2015-02, Consolidation (Topic 810): Amendments to the Consolidation Analysis. ASU 2015-2 amends certain aspects of the consolidation guidance under U.S. GAAP. It modifies the evaluation of whether limited partnerships and similar legal entities are variable interest entities (“VIEs”) or voting interest entities and also eliminates the presumption that a general partner should consolidate a limited partnership. The guidance also affects the consolidation analysis as it relates to interests in VIEs, particularly those that have fee arrangements and related party relationships. ASU 2015-02 is effective for interim and annual reporting periods beginning after December 15, 2015 and retrospective adoption is required either through a modified retrospective approach by recording a cumulative-effect adjustment to equity as of the beginning of the year of adoption or retrospectively for all comparative periods. The Company adopted the standard as of March 2016. The Company evaluated the latest consolidation analysis under ASU 2015-02, which was performed as of December 2015. The Company also evaluated updates to entity arrangements after December 2015. The adoption of this standard did not have an impact on the Company's financial position, results of operations, cash flows, and financial statement disclosures.
In January 2015, the FASB issued ASU No. 2015-01, Income Statement - Extraordinary and Unusual Items (Subtopic 225-20): Simplifying Income Statement Presentation by Eliminating the Concept of Extraordinary Items. ASU 2015-1 eliminates from GAAP the concept of extraordinary items. The amendments in this Update are effective for fiscal years, and interim periods within those fiscal years, beginning after December 15, 2015. The Company adopted the standard as of March 2016. The adoption of this standard did not have an impact on the Company's financial position, results of operations, cash flows, and financial statement disclosures.
In June 2014, the FASB issued ASU No. 2014-12 Compensation - Stock Compensation (Topic 718): Accounting for Share Based Payments When the Terms of an Award Provide That a Performance Target Could Be Achieved after the Requisite Service Period. A performance target in a share-based payment that affects vesting and that could be achieved after the requisite service period should be accounted for as a performance condition under Accounting Standards Codification (ASC) 718, Compensation—Stock Compensation. As a result, the target is not reflected in the estimation of the award’s grant date fair value. Compensation cost would be recognized over the required service period, if it is probable that the performance condition will be achieved. The guidance is effective for annual periods beginning after December 15, 2015 and interim periods within those annual periods. The Company adopted the standard as of March 2016. The Company reviewed current stock compensation award programs and noted the adoption of ASU 2014-12 did not have an impact on the Company's financial position, results of operations, cash flows, and financial statement disclosures.
In April 2015, the FASB issued ASU No. 2015-03, Interest - Imputation of Interest (Subtopic 835-30): Simplifying the Presentation of Debt Issuance Costs. ASU 2015-03 requires that debt issuance costs related to a recognized debt liability be presented in the balance sheet as a direct deduction from the carrying amount of the related debt liability instead of being presented as an asset. ASU 2015-03 requires retrospective application and represents a change in accounting principle. ASU 2015-03 is effective for fiscal years beginning after December 15, 2015 with early adoption being permitted for financial statements that have not been previously issued. The Company adopted ASU 2015-03 as of December 2015 on a retrospective basis and reclassified debt issuance costs from Other assets to a direct reduction from the carrying amount of the (i) Current portion of obligations under the Restated Senior Credit Facility borrowings and (ii) Long-term obligations under the Restated Credit Facility borrowings within the Condensed Consolidated Balance Sheets. See Note 11. Borrowing Arrangements for further detail on the Company's debt instruments.
Accounting Pronouncements to be Adopted
In January 2016, the FASB issued ASU 2017-04, Intangibles - Goodwill and Other - Simplifying the Test for Goodwill Impairment (Topic 350). ASU 2017-04 eliminates the requirement to calculate the implied fair value of goodwill (i.e., Step 2 under current goodwill impairment test rules) to measure a goodwill impairment charge. Instead, entities will record an impairment charge based on the excess of a reporting unit’s carrying amount over its fair value (i.e., measure the charge based on the Step 1 analysis under current guidance). The standard will be applied prospectively and is effective for annual and interim impairment tests performed in periods beginning after December 15, 2019 for public business entities (PBEs) that meet the definition of a Securities and Exchange Commission (SEC) filer (i.e., for any impairment test performed by calendar-year entities in 2020), December 15, 2020 for PBEs that are not SEC filers (i.e., for any impairment test performed by calendar-year entities in 2021), and December 15, 2021
58
for all other entities (i.e., for any impairment test performed by calendar-year entities in 2022). Early adoption is permitted for annual and interim goodwill impairment testing dates after 1 January 2017. The Company is currently assessing the impact of adopting this standard on the Company’s financial position, results of operations, cash flows and financial statement disclosures.
In January 2016, the FASB issued ASU 2017-01, Business Combinations - Clarifying the Definition of a Business (Topic 805). Under ASU 2017-01, an entity first determines whether substantially all of the fair value of the gross assets acquired is concentrated in a single identifiable asset or a group of similar identifiable assets. If this threshold is met, the set is not a business. If it’s not met, the entity then evaluates whether the set meets the requirement that a business include, at a minimum, an input and a substantive process that together significantly contribute to the ability to create outputs. Under current guidance, a business consists of (1) inputs, (2) processes applied to those inputs and (3) the ability to create outputs. ASU 2017-01 is effective for public business entities for fiscal years beginning after December 15, 2017, and interim periods within those years. For all other entities, it is effective for fiscal years beginning after December 15, 2018, and interim periods within fiscal years beginning after December 15, 2019. The ASU will be applied prospectively to any transactions occurring within the period of adoption. The Company is currently assessing the impact of adopting this standard on the Company’s financial position, results of operations, cash flows and financial statement disclosures.
In November 2016, the FASB issued ASU No. 2016-18, Statement of Cash Flows - Restricted Cash (Topic 230). ASU 2016-18 clarifies how entities should present restricted cash and restricted cash equivalents in the statement of cash flows. The guidance requires entities to show the changes in the total of cash, cash equivalents, restricted cash and restricted cash equivalents in the statement of cash flows. As a result, entities will no longer present transfers between cash and cash equivalents and restricted cash and restricted cash equivalents in the statement of cash flows. The guidance, which is based on a consensus of the Emerging Issues Task Force (EITF), is effective for fiscal years beginning after December 15, 2017, and interim periods within those years. For all other entities, it is effective for fiscal years beginning after December 15, 2018, and interim periods within fiscal years beginning after December 15, 2019. Early adoption is permitted. The Company is currently assessing the impact of adopting this standard on the Company’s financial position, results of operations, cash flows and financial statement disclosures.
In August 2016, the FASB issued ASU No. 2016-15, Statement of Cash Flows - Classification of Certain Cash Receipts and Cash Payments (Topic 230). ASU 2016-15 amends the guidance in ASC 230 related to the classification of certain cash receipts and payments in the statement of cash flows. The primary purpose of the ASU is to reduce the diversity in practice that has resulted from the lack of consistent principles on this topic. The amendment adds or clarifies several statement of cash flow classification issues including: (i) debt prepayment or debt extinguishment costs, (ii) settlement of certain zero-coupon debt instruments, (iii) contingent consideration payments, (iv) proceeds from the settlement of insurance claims, (v) proceeds from the settlement of corporate-owned life insurance policies, (vi) distributions received from equity method investments, (vii) beneficial interest in securitization transactions, and (viii) separately identifiable cash flows and application of the predominance principle. The standard is effective for interim and annual reporting periods beginning after December 15, 2017. The Company is currently assessing the impact of adopting this standard on the Company’s financial position, results of operations, cash flows and financial statement disclosures.
In June 2016, the FASB issued ASU No. 2016-13, Credit Losses - Measurement of Credit Losses on Financial Instruments (Topic 326). The standard significantly changes how entities will measure credit losses for most financial assets and certain other instruments that aren’t measured at fair value through net income. The standard will replace today’s “incurred loss” approach with an “expected loss” model for instruments measured at amortized cost. For available-for-sale debt securities, entities will be required to record allowances rather than reduce the carrying amount, as they do today under the other-than-temporary impairment model. Entities will apply the standard’s provisions as a cumulative-effect adjustment to retained earnings as of the beginning of the first reporting period in which the guidance is effective. The standard is effective for interim and annual reporting periods beginning after December 15, 2019. The Company is currently assessing the impact of adopting this standard on the Company’s financial position, results of operations, cash flows and financial statement disclosures.
In March 2016, the FASB issued ASU No. 2016-09, Compensation - Stock Compensation (Topic 718): Improvements to Employee Share-Based Payment Accounting. ASU 2016-09 simplifies several aspects of the accounting for share-based payment award transactions and their presentation in the financial statements. The new guidance will require all income tax effects of awards to be recognized in the income statement when the awards vest or are settled, eliminating APIC pools. The guidance will also require companies to elect whether to account for forfeitures of share-based payments by (1) recognizing forfeitures of awards as they occur (e.g., when an award does not vest because the employee leaves the company) or (2) estimating the number of awards expected to be forfeited and adjusting the estimate when it is likely to change, as is currently required. These and other requirements of ASU No. 2016-09 are effective for interim and annual reporting periods beginning after December 15, 2016. Early adoption is permitted in any annual or interim period for which financial statements haven't been issued or made for issuance. However, all aspects of the guidance must be adopted in the same period. If an entity early adopts the guidance in an interim period, any adjustments must be reflected as of the beginning of the fiscal year that includes that interim period. The Company does not expect a material impact of adopting this standard on the Company’s financial position, results of operations, cash flows and financial statement disclosures.
59
In March 2016, the FASB issued ASU No. 2016-07, Investments - Equity Method and Joint Ventures (Topic 323): Simplifying the Transition to Equity Method of Accounting, which eliminates the requirements to apply the equity method of accounting retrospectively when a reporting entity obtains significant influence over a previously held investment. Under ASU 2016-08, the equity method of accounting should be applied prospectively from the date significant influence is obtained. The new standard also provides specific guidance for available-for-sale securities that become eligible for the equity method of accounting. In those cases, any unrealized gain or loss recorded within accumulated other comprehensive income should be recognized in earnings at the date the investment initially qualifies for the use of the equity method. The new standard is effective for interim and annual periods beginning after December 15, 2016. Early adoption is permitted. The Company does not expect a material impact of adopting this standard on the Company’s financial position, results of operations, cash flows and financial statement disclosures.
In March 2016, the FASB issued ASU No. 2016-05, Derivatives and Hedging (Topic 815): Effect of Derivative Contract Novations on Existing Hedge Accounting Relationships. The new guidance clarifies that a change in the counterparty to a derivative contract, in and of itself, does not require the dedesignation of a hedging relationship. An entity will, however, still need to evaluate whether it is probable that the counterparty will perform under contract as part of its ongoing effectiveness assessment for hedge accounting. Therefore, a novation of a derivative to a counterparty with a sufficiently high credit risk could still result in the dedesignation of the hedging relationship. ASU 2016-05 is effective in fiscal years beginning after December 15, 2016, including interim periods within those years. Early adoption is permitted and entities have the option to adopt the new ASU on a prospective basis to new derivative contract novations or on a modified retrospective basis. The Company does not expect a material impact of adopting this standard on the Company’s financial position, results of operations, cash flows and financial statement disclosures.
In February 2016, the FASB issued ASU No. 2016-02, Leases (Topic 842). ASU 2016-2 requires lessees to move most leases to the balance sheet and recognize expense, similar to current accounting guidance, on the income statement. Additionally, the classification criteria and the accounting for sales-type and direct financing leases is modified for lessors. Under ASU 2016-2, all entities will classify leases to determine: (i) lease-related revenue and expense and (ii) for lessors, amount recorded on the balance sheet. Entities are required to use a modified retrospective approach for leases that exist or are entered into after the beginning of the earliest comparative period in the financial statements, with full retrospective application being prohibited. ASU 2016-2 is effective for interim and annual reporting periods beginning after December 15, 2018. These and other changes to accounting for leases under ASU 2016-2 are currently being evaluated by the Company for impacts to the Company's financial position, results of operations, cash flows and financial statement disclosures.
In January 2016, the FASB issued ASU No. 2016-01, Financial Instruments - Overall (Subtopic 825-10): Recognition and Measurement of Financial Assets and Financial Liabilities. ASU 2016-1 amends various areas of the accounting for financial instruments. Key provisions of the amendment currently being evaluated by the Company requires (i) equity investments to be measured at fair value (except those accounted for under the equity method), (ii) the simplification of equity investment impairment determination, (iii) certain changes to the fair value measurement of financial instruments measured at amortized cost, (iv) the separate presentation, in other comprehensive income, the portion of the total change in the fair value of a liability resulting from a change in the instrument-specific credit risk (given certain conditions), and (v) the evaluation for a valuation allowance on a deferred tax asset related to available-for-sale securities in combination with the Company's other deferred tax assets. ASU 2016-1 is effective for interim and annual reporting periods beginning after December 15, 2017. These provisions and others of ASU 2016-1 are currently being assessed by the Company for impacts on the Company's financial position, results of operations, cash flows and financial statement disclosures.
In May 2014, the FASB issued ASU No. 2014-09, Revenue from Contracts with Customers (Topic 606). Since the release of ASU 2014-9, the FASB has issued the following additions ASUs updating the topic:
• | In May 2016, the FASB issued ASU No. 2016-12, Revenue from Contracts with Customers (Topic 606): Narrow-Scope Improvements and Practical Expedients |
• | In April 2016, the FASB issued ASU No. 2016-10, Revenue from Contracts with Customers (Topic 606): Identifying Performance Obligations and Licensing |
• | In March 2016, the FASB issued ASU No. 2016-08, Revenue from Contracts with Customers (Topic 606): Principal versus Agent Considerations (Reporting Revenue Gross versus Net). |
• | In August 2015, the FASB issued ASU No. 2015-14, Revenue from Contracts with Customers (Topic 606): Deferral of the Effective Date |
Collectively these standards create new accounting guidance for revenue recognition that supersedes most existing revenue recognition rules, including most industry specific revenue recognition guidance. The core principle of the guidance is that an entity should recognize revenue to depict the transfer of promised goods or services to customers in an amount that reflects the consideration to which the entity expects to be entitled in exchange for those goods and services. Topic 606 also provides new guidance on the recognition of certain costs related to customer contracts, and changes the FASB guidance for revenue-related issues, such as how an entity is required to consider whether revenue should be reported gross or net basis. The amendments are effective for fiscal years and interim periods within those fiscal years beginning on or after December 15, 2017.
60
The Company's process for implementing Topic 606 includes, but is not limited to, identifying contracts within the scope of the standard, identifying distinct performance obligations within each contract, and applying the new guidance for measuring and recognizing revenue, to each performance obligation. The Company expects to complete the assessment in the second half of 2017, which will include an evaluation of the impact of adopting the guidance either through the modified-retrospective method or full retrospective method.
2. Central Merger and Restructuring, Merger and Integration Costs
Central Merger
On October 2, 2012 ("Closing Date"), the Company completed the acquisition (the "Central Merger" or "Merger") of 100% of the outstanding common shares of KCPC Holdings, Inc., which was the ultimate parent of Central Parking Corporation (collectively, "Central"), for 6,161,332 shares of Company common stock and the assumption of approximately $217.7 million of Central's debt, net of cash acquired. Additionally, the Agreement and Plan of Merger dated February 28, 2012 with respect to the Central Merger ("Merger Agreement") provided that Central's former stockholders were entitled to receive cash consideration (the "Cash Consideration") in the amount equal to $27.0 million plus, if and to the extent the Net Debt Working Capital (as defined below) was less than $275.0 million (the "Lower Threshold") as of September 30, 2012, the amount by which the Net Debt Working Capital was below such amount (such sum, the "Cash Consideration Amount") to be paid three years after closing, to the extent the $27.0 million was not used to satisfy indemnity obligations pursuant to the Merger Agreement.
Pursuant to the Merger Agreement, the Company was entitled to indemnification from Central's former stockholders (i) if and to the extent Central's combined net debt and the absolute value of Central's working capital (as determined in accordance with the Merger Agreement) (the "Net Debt Working Capital") exceeded $285.0 million (the "Upper Threshold") as of September 30, 2012 and (ii) for certain defined adverse consequences as set forth in the Merger Agreement (including with respect to Structural and Repair Costs). Pursuant to the Merger Agreement, Central's former stockholders were required to satisfy certain indemnity obligations, which were capped at the Cash Consideration Amount (the "Capped Items") only through a reduction of the Cash Consideration. For certain other indemnity obligations set forth in the Merger Agreement, which were not capped at the Cash Consideration Amount (the "Uncapped Items"), including the Net Debt Working Capital indemnity obligations described above, Central's former stockholders had the ability to satisfy any amount payable pursuant to such indemnity obligations as follows (provided that the Company reserved the right to reject the cash and stock alternatives available to the Company and choose to reduce the Cash Consideration):
• | Central's former stockholders elect to pay such amount with cash; |
• | Central's former stockholders elect to pay such amount with the Company's common stock (valued at $23.64 per share, the market value as of the closing date of the Merger Agreement); or |
• | Central's former stockholders elect to reduce the $27.0 million cash consideration by such amount, subject to the condition that the cash consideration remains at least $17.0 million to cover Capped Items. |
Under the Merger Agreement, all post-closing claims and disputes, including as to indemnification matters, were ultimately subject to resolution through binding arbitration or, in the case of a dispute as to the calculation of Net Debt Working Capital, resolution by an independent public accounting firm.
Since the Closing Date, the Company periodically provided Central’s former stockholders notice regarding indemnification matters, including with respect to the calculation of Net Debt Working Capital, and made adjustments for known matters as they arose, although Central’s former stockholders did not agree to the aggregate of such adjustments made by the Company. During such time, Central’s former stockholders continually requested additional documentation supporting the Company’s indemnification claims, including with respect to the Company’s calculation of Net Debt Working Capital. Furthermore, following the Company's notices of indemnification matters, the representative of Central's former stockholders indicated that they may make additional inquiries and raise issues with respect to the Company's indemnification claims (including, specifically, as to Structural and Repair Costs) and that they may assert various claims of their own relating to the Merger Agreement.
The Company previously determined and submitted notification to Central’s former stockholders, that (i) the Net Debt Working Capital was $296.3 million as of September 30, 2012 and that, accordingly, the Net Debt Working Capital exceeded the Upper Threshold by $11.3 million; and (ii) the Company had indemnity claims of $23.4 million for certain defined adverse consequences (including indemnity claims with respect to Structural and Repair Costs incurred through December 31, 2015) and as set forth in an October 1, 2015 notification letter to Central's former stockholders' that certain indemnification claims for Structural and Repair Costs yet to be incurred met the requirements of the indemnification provisions established in the Merger Agreement.
In early 2015, the Company and Central’s former stockholders engaged an independent public accounting firm for ultimate resolution, through binding arbitration, regarding its dispute as to the Company’s calculation of Net Debt Working Capital. On April 30, 2015, with respect to the Company's Net Debt Working Capital calculation, the representative of Central's former stockholders submitted specific objections to the Company's calculation, asserting that the Net Debt Working Capital as of September 30, 2012 was $270.8 million ($4.2 million below the Lower Threshold) and on September 21, 2015 submitted a revised calculation, asserting that the Net Debt Working Capital as of September 30, 2012 was $278.0 million ($3.0 million above the Lower Threshold) and therefore no amounts are due to the Company given calculated net Debt Working Capital is between the Lower Threshold and the Upper Threshold. On October 1, 2015, the Company provided notification to Central's former stockholders that the aggregate amount of
61
the Company's (i) Net Debt Working Capital claim of $11.3 million as of September 30, 2012 and (ii) indemnity claims for certain defined adverse consequences as set forth in the Merger Agreement (including with respect to Structural and Repair Costs), exceeded the $27.0 million Cash Consideration and therefore the Company would not be making any Cash Consideration payment pursuant to Section 3.7 of the Merger Agreement. On October 20, 2015, Central's former stockholders provided notification that they deemed the Company's refusal to pay the $27.0 million Cash Consideration to be a violation of the terms of the Merger Agreement.
On February 19, 2016, the Company and Central’s former stockholders received a non-appealable and binding decision from the independent public accounting firm indicating that Net Debt Working Capital as of September 30, 2012 was $291.6 million, or $6.6 million above the Upper Threshold. Furthermore, as part of the independent public accounting firm’s decision over the calculation of Net Debt Working Capital as of September 30, 2012, it was determined by the independent public accounting firm and the Company that $1.5 million of Net Debt Working Capital claims were more appropriately claimable as an adverse consequence indemnification claim, as defined in the Merger Agreement. As such and in conjunction with the independent public accounting firm’s decision on Net Debt Working Capital, the Company (i) reclassified $1.5 million of indemnification claims from the Net Debt Working Capital calculation to indemnification claims for certain adverse consequences; and (ii) recognized an expense of $1.6 million ($0.9 million, net of tax) in General and administrative expenses for certain of the other amounts disallowed under the Net Debt Working Capital calculation as of and for the year ended December 31, 2015, respectively. The independent public accounting firm also determined that an additional $1.6 million of Net Debt Working Capital claims were disallowed; however, these Net Debt Working Capital amounts claimed by the Company were not previously recognized by the Company as a cost recovery given their contingent nature and since these claims were not previously recognized as an expense by the Company, and therefore the independent public accounting firm’s decision to disallow these claims had no impact to the Company's consolidated financial statements as of and for the year ended December 31, 2015.
As a result of the independent public accounting firm’s decision on the calculation of Net Debt Working Capital, the Company revised its indemnity claims for certain defined adverse consequences from $23.4 million to $24.9 million. On March 11, 2016, the Company provided notification to Central's former stockholders of an additional indemnity claim of $1.6 million and further provided notification that its indemnity claims for certain defined adverse consequences aggregated to $26.5 million. The additional $1.6 million of indemnity claim made by the Company in the March 11, 2016 letter was not recognized as a cost recovery given the contingent nature and since this claim was not previously recognized by the Company as an expense.
As previously discussed in Note 1. Significant Accounting Policies and Practices, certain lease contracts acquired in the Central Merger include provisions allocating to the Company responsibility for all or a defined portion of the costs of certain structural and other repair costs required on the property, including improvement and repair costs arising as a result of ordinary wear and tear. The Company reduced the Cash Consideration Amount by $6.6 million, representing the amount Net Debt Working Capital exceeded the Upper Threshold, and $18.8 million, representing the amount of indemnified claims for certain adverse consequences (including but not limited to Structural and Repair Costs) recognized by the Company as of September 30, 2016. Additionally, the Company submitted $7.7 million of additional indemnity claims for certain adverse consequences (including but not limited to Structural and Repair Costs) to Central's former stockholders, including claims as set forth in the March 11, 2016 letter, but did not recognize these indemnity claims as a receivable or offset to the Cash Consideration Amount with a corresponding gain or reduction of costs incurred by the Company, as these claims were contingent in nature or represent costs which the Company had not yet incurred but which met the requirements of the indemnification provisions established in the Merger Agreement.
On September 27, 2016, the Company and Central's former stockholders agreed-upon non-binding terms to settle all outstanding matters between the parties relating to the Central Merger ("Settlement Terms") and on December 15, 2016 the Company and Central's former stockholders executed a settlement agreement ("Settlement Agreement") to settle all outstanding matters between the parties relating to the Central Merger (including the Company's claims as described above). Pursuant to the Settlement Agreement, the Company paid Central's former stockholders $2.5 million in aggregate, which effectively reduced the $27.0 million of Cash Consideration that would have been payable by the Company to Central's former stockholders under the Merger Agreement by $24.5 million. As a result of the Settlement Terms, the Company recorded $0.8 million ($0.5 million, net of tax) in General and administrative expense within the Consolidated Statements of Income in the third quarter 2016. Additionally and pursuant to the Settlement Agreement, the parties fully released one another for claims relating to the Central Merger, and therefore the Company has no further obligation to pay any additional Cash Consideration Amount to Central's former stockholders.
The Central Merger has been accounted for using the acquisition method of accounting (in accordance with the provisions of Accounting Standards Codification ("ASC") 805, Business Combinations), which requires, among other things, that most assets acquired and liabilities assumed be recognized at their fair values as of the acquisition date. The purchase price has been allocated based on the estimated fair value of net assets acquired and liabilities assumed at the date of the date of acquisition. The Company finalized the purchase price allocation during the third quarter of 2013.
62
Restructuring, Merger and Integration Costs
Since the Central Merger, the Company has incurred certain restructuring, acquisition and integration costs associated with the transaction that were expensed as incurred. These costs are reflected in General and administrative expenses and Depreciation and amortization. Depreciation and amortization includes costs related to the write-off of certain fixed assets and the acceleration of certain software assets directly as a result of the Central Merger. Additionally, in the fourth quarter of 2016, the Company initiated a series of workforce reductions to increase organizational effectiveness and provide cost savings that can be reinvested in the Company's growth initiatives. As a result of these workforce reductions, the Company recognized $3.3 million of severance and other benefits-related charges in General and administrative expenses within the Consolidated Statements of Income during the three months ended December 31, 2016.
The aggregate costs associated with the restructuring, merger and integration costs (including those incurred in 2016 for workforce reductions) are summarized in the following table:
Year Ended December 31, | |||||||||||
(millions) | 2016 | 2015 | 2014 | ||||||||
General and administrative expenses | $ | 4.5 | $ | 6.2 | $ | 8.5 | |||||
Depreciation and amortization | 2.4 | 1.0 | — | ||||||||
Total | $ | 6.9 | $ | 7.2 | $ | 8.5 | |||||
3. Net Income per Common Share
Basic net income per common share is computed by dividing net income attributable to SP Plus Corporation by the weighted average number of shares of common stock outstanding during the period. Diluted net income per common share is based upon the weighted average number of shares of common stock outstanding at period end, consisting of incremental shares assumed to be issued upon exercise of stock options and the incremental shares assumed to be issued under performance share and restricted stock unit arrangements, using the treasury-stock method.
A reconciliation of the basic weighted average common shares outstanding to diluted weighted average common shares outstanding is as follows:
Year Ended December 31, | |||||||||||
(millions, except share and per share data) | 2016 | 2015 | 2014 | ||||||||
Net income attributable to SP Plus Corporation | $ | 23.1 | $ | 17.4 | $ | 23.1 | |||||
Basic weighted average common shares outstanding | 22,238,021 | 22,189,140 | 22,009,800 | ||||||||
Dilutive impact of share-based awards | 290,101 | 322,619 | 397,543 | ||||||||
Diluted weighted average common shares outstanding | 22,528,122 | 22,511,759 | 22,407,343 | ||||||||
Net income per common share | |||||||||||
Basic | $ | 1.04 | $ | 0.78 | $ | 1.05 | |||||
Diluted | $ | 1.03 | $ | 0.77 | $ | 1.03 | |||||
As of December 31, 2016, the weighted average number of performance-based shares units related to the 2014 awards were also included for the purposes of determining diluted net income per share as all performance goals were achieved as of this date. The 2015 and 2016 performance-based awards have been excluded for purposes of determining diluted net income per share for the year ended December 31, 2016, as all performance goals are not achieved relating to these awards as of December 31, 2016.
There are no additional securities that could dilute basic earnings per share in the future that were not included in the computation of diluted earnings per share, other than those disclosed.
4. Stock-Based Compensation
The Company measures stock-based compensation expense at the grant date, based on the estimated fair value of the award, and the expense is recognized over the requisite employee service period or performance period (generally the vesting period) for awards expected to vest (considering estimated forfeitures).
The Company has an amended and restated long-term incentive plan (the "Plan") that was adopted in conjunction with its initial public offering in 2004. In February 2008, the Board of Directors approved an amendment to the Plan, subject to stockholder approval, that increased the maximum number of shares of common stock available for awards under the Plan from 2,000,000 to 2,175,000 and extended the Plan's termination date. Company stockholders approved this Plan amendment on April 22, 2008, and the Plan now terminates twenty years from the date of such approval, or April 22, 2028. On March 13, 2013, the Board approved an amendment to the Plan, subject to stockholder approval, that increased the number of shares of common stock available for
63
awards under the Plan from 2,175,000 to 2,975,000. Company stockholders approved this Plan amendment on April 24, 2013. Forfeited and expired options under the Plan become generally available for reissuance. At December 31, 2016, 285,521 shares remained available for award under the Plan.
Stock Options and Grants
There were no options granted during the years ended December 31, 2016, 2015 and 2014. The Company recognized no stock-based compensation expense related to stock options for the years ended December 31, 2016, 2015 and 2014 as all options previously granted are fully vested.
The following is a summary of Company authorized vested stock grants to certain directors for the year ended December 31, 2016, 2015 and 2014. Stock-based compensation expense related to vested stock grants are included in General and administrative expenses within the Condensed Consolidated Statements of Income.
Year Ended December 31, | |||||||||||
(millions, except stock grants) | 2016 | 2015 | 2014 | ||||||||
Vested stock grants | 32,180 | 32,357 | 19,336 | ||||||||
Stock-based compensation expense | $ | 0.7 | $ | 0.7 | $ | 0.5 | |||||
A summary of the status of the stock option plans as of December 31, 2016, and changes during the years ended December 31, 2016, 2015 and 2014, are presented below:
Number of Shares | Weighted Average Exercise Price | Weighted Average Remaining Contractual Term (Years) | Aggregate Intrinsic Value | ||||||||||
Outstanding at December 31, 2013 | 7,101 | $ | 5.75 | ||||||||||
Granted | — | n/a | |||||||||||
Exercised | — | n/a | |||||||||||
Expired | — | n/a | |||||||||||
Outstanding at December 31, 2014 | 7,101 | $ | 5.75 | ||||||||||
Granted | — | n/a | |||||||||||
Exercised | (7,101 | ) | 5.75 | ||||||||||
Expired | — | n/a | |||||||||||
Outstanding at December 31, 2015 | — | $ | 5.75 | ||||||||||
Granted | — | n/a | |||||||||||
Exercised | — | n/a | |||||||||||
Expired | — | n/a | |||||||||||
Vested and Exercisable at December 31, 2016 | — | $ | — | — | $ | — | |||||||
The total intrinsic value of options exercised during the year ended December 31, 2013 was $0.1 million. There were no nonvested options as of December 31, 2016, 2015 and 2014.
Restricted Stock Units
During the year ended December 31, 2016, the Company authorized certain one-time grants of 4,020 restricted stock units to certain executives that vest five years from date of issuance. The restricted stock unit agreement is designed to reward performance over a five-year period.
During the year ended December 31, 2015, the Company authorized certain one-time grants of 3,963 restricted stock units to certain executives that vest three years from date of issuance. The restricted stock unit agreements are designed to reward performance over a three-year period.
During the year ended December 31, 2014, the Company authorized a one-time grant of 31,099 restricted stock units to executives that joined the Company in connection with the Central Merger. These restricted stock units vest on December 3, 2018. The restricted stock unit agreements are designed to reward performance over a five-year period. Additionally, the Company authorized a one-time grant of 4,247 restricted stock units to an executive which vested in June 2016.
The fair value of restricted stock units is determined using the market value of Company common stock on the date of the grant, and compensation expense is recognized over the vesting period. The Company estimates forfeitures at the time of the grant and
64
revises those estimates in subsequent periods if actual forfeitures differ from those estimates. The Company uses historical data to estimate pre-vesting forfeitures and records stock-based compensation expense only for those awards that are expected to vest.
A summary of the status of the restricted stock units as of December 31, 2016, and changes during the year ended December 31, 2016, 2015 and 2014, are presented below:
Shares | Weighted Average Grant-Date Fair Value | |||||
Nonvested at December 31, 2013 | 704,751 | $ | 20.00 | |||
Issued | 31,099 | 22.20 | ||||
Vested | (145,421 | ) | 22.41 | |||
Forfeited | (34,729 | ) | 23.88 | |||
Nonvested at December 31, 2014 | 555,700 | $ | 19.57 | |||
Issued | 12,589 | 23.65 | ||||
Vested | (150,073 | ) | 20.77 | |||
Forfeited | (16,500 | ) | 19.45 | |||
Nonvested at December 31, 2015 | 401,716 | $ | 19.25 | |||
Issued | 4,020 | 24.87 | ||||
Vested | (54,215 | ) | 18.33 | |||
Forfeited | (17,324 | ) | 19.68 | |||
Nonvested at December 31, 2016 | 334,197 | $ | 19.45 | |||
The table below shows the Company's stock-based compensation expense related to the restricted stock units for the years ended December 31, 2016, 2015 and 2014, and is included in General and administrative expenses within the Condensed Consolidated Statements of Income.
Year Ended December 31, | |||||||||||
(millions) | 2016 | 2015 | 2014 | ||||||||
Stock-based compensation expense | $ | 0.9 | $ | 1.6 | $ | 2.4 | |||||
Unrecognized stock-based compensation expense, net of estimated forfeitures, related to the restricted stock units for the years ended December 31, 2016, 2015 and 2014, is shown in the table below, along with the weighted average periods in which the expense will be recognized.
Year Ended December 31, | |||||||||||
(millions) | 2016 | 2015 | 2014 | ||||||||
Unrecognized stock-based compensation | $ | 1.7 | $ | 2.7 | $ | 4.4 | |||||
Weighted Average Years | 2.8 years | 3.8 years | 4.0 years | ||||||||
Performance Share Units
In September 2014, the Board of Directors authorized a performance-based incentive program under the Company's Long-Term Incentive Plan ("Performance-Based Incentive Program"), whereby the Company will issue performance share units to certain executive management individuals that represent shares potentially issuable in the future. The objective of the performance-based incentive program is to link compensation to business performance, encourage ownership of Company stock, retain executive talent, and reward executive performance. The Performance-Based Incentive Program provides participating executives with the opportunity to earn vested common stock if certain performance targets for pre-tax free cash flow are achieved over the cumulative three-year period and recipients satisfy service-based vesting requirements. The stock-based compensation expense associated with unvested performance-based incentives are recognized on a straight-line basis over the shorter of the vesting period or minimum service period and dependent upon the probable outcome of the number of shares that will ultimately be issued based on the achievement of pre-tax free cash flow over the cumulative three-year period.
In March 2016, the Board of Directors authorized another performance-based incentive program under the Company's Long-Term Incentive Plan ("2016 Performance-Based Incentive Program"). The 2016 Performance-Based Incentive Program is similar to the 2014 and 2015 Performance-Based Incentive Program, with the exception of the number of shares ultimately to be issued is based on the achievement of pre-tax free cash flow over the cumulative three-year period of 2016 through 2018.
65
During 2016, certain participating executives became vested in Performance-Based Incentive Program shares based on retirement eligibility and as a result $0.1 million of stock-based compensation related to 2,083 shares were recognized in General and administrative expenses, and which continue to be subject to achieving cumulative pre-tax free cash flow over the respective three-year periods. Additionally, participating executives became vested in the Performance-Based Incentive Program shares based on meeting eligibility for vesting at the end of the three-year performance period of 2014 through 2016. As a result, 82,334 shares were vested to these participating executives as of December 31, 2016.
In April 2015, the Board of Directors authorized another performance-based incentive program under the Company's Long-Term Incentive Plan ("2015 Performance-Based Incentive Program"). The 2015 Performance-Based Incentive Program is similar to the 2014 Performance-Based Incentive Program, with the exception of the number of shares ultimately to be issued is based on the achievement of pre-tax free cash flow over the cumulative three-year period of 2015 through 2017.
During 2015, certain participating executives became vested in Performance-Based Incentive Program shares based on retirement eligibility and as a result $0.1 million of stock-based compensation related to 6,915 shares were recognized in General and administrative expenses, and which continue to be subject to achieving cumulative pre-tax free cash flow over the respective three-year periods.
During 2014, certain participating executives became vested in the Performance-Based Incentive Program shares based on retirement eligibility and as a result $0.2 million of stock-based compensation related to 9,687 shares were recognized in General and administrative expenses within the Consolidated Statement of Income, and which continue to be subject to achieving cumulative pre-tax free cash flow over the three-year period of 2014 through 2016.
A summary of the status of the performance share units as of December 31, 2016, and changes during the year ended December 31, 2016 and 2015 are presented below:
Shares | Weighted Average Grant-Date Fair Value | |||||
Nonvested at December 31, 2014 | 79,430 | $ | 18.96 | |||
Issued | 125,392 | 21.64 | ||||
Vested | (6,915 | ) | 19.91 | |||
Forfeited | (24,056 | ) | 20.30 | |||
Nonvested at December 31, 2015 | 173,851 | 20.63 | ||||
Issued | 99,466 | 23.72 | ||||
Vested | (84,417 | ) | 19.15 | |||
Forfeited | (29,423 | ) | 22.52 | |||
Nonvested at December 31, 2016 | 159,477 | $ | 22.99 | |||
The table below shows the Company's stock-based compensation expense related to the Performance-Based Incentive Program for the years ended December 31, 2016, 2015 and 2014, and is included in General and administrative expenses within the Condensed Consolidated Statements of Income.
Year Ended December 31, | |||||||||||
(millions) | 2016 | 2015 | 2014 | ||||||||
Stock-based compensation | $ | 1.8 | $ | 1.3 | $ | 0.3 | |||||
During the years ended December 31, 2016 and 2015, respectively, 29,423 and 24,056 performance-based shares were forfeited under the Long-Term Incentive Program and became available for reissuance. During the year ended December 31, 2014, no performance-based shares were forfeited.
Future compensation expense for currently outstanding awards under the Performance-Based Incentive Program could reach a maximum of $5.6 million. Stock-based compensation for the Performance-Based Incentive Program is expected to be recognized over a weighted average period of 1.7 years. There was no such program in place during 2013.
66
5. Leasehold Improvements, Equipment, Land and Construction in Progress, net
Leasehold improvements, equipment, and construction in progress and related accumulated depreciation and amortization is as follows:
December 31 | |||||||||
(millions) | Ranges of Estimated Useful Life | 2016 | 2015 | ||||||
Equipment | 2 - 10 Years | $ | 38.6 | $ | 34.5 | ||||
Software | 3 - 10 Years | 30.9 | 27.0 | ||||||
Vehicles | 4 Years | 8.8 | 8.7 | ||||||
Other | 10 Years | 0.5 | 0.4 | ||||||
Leasehold improvements | Shorter of lease term or economic life up to 10 years | 21.7 | 20.2 | ||||||
Construction in progress | 3.3 | 3.6 | |||||||
103.8 | 94.4 | ||||||||
Less accumulated depreciation and amortization | (72.9 | ) | (59.8 | ) | |||||
Leasehold improvements, equipment, land and construction in progress, net | $ | 30.9 | $ | 34.6 | |||||
Asset additions are recorded at cost, which includes interest on significant projects. Depreciation is provided in amounts sufficient to relate the cost of depreciable assets to operations over their estimated useful lives or over the terms of the respective leases, whichever is shorter, and depreciated principally on the straight-line basis. The costs and accumulated depreciation of assets sold or disposed of are removed from the accounts and the resulting gain or loss is reflected in earnings. Plant and equipment are reviewed for impairment when conditions indicate an impairment or future impairment; the assets are either written down or the useful life is adjusted to the remaining period of estimated useful life.
Depreciation expense for the years ended December 31, 2016, 2015 and 2014 was $16.2 million, $15.9 million and $12.0 million, respectively.
6. Cost of Contracts, net
Cost of contracts, net, is comprised of the following:
December 31, | |||||||
(millions) | 2016 | 2015 | |||||
Cost of contracts | $ | 30.4 | $ | 31.3 | |||
Accumulated amortization | (19.0 | ) | (19.4 | ) | |||
Cost of contracts, net | $ | 11.4 | $ | 11.9 | |||
The expected future amortization of cost of contracts is as follows:
(millions) | Cost of Contract | ||
2017 | $ | 3.1 | |
2018 | 2.7 | ||
2019 | 2.0 | ||
2020 | 1.0 | ||
2021 | 0.5 | ||
2022 and Thereafter | 2.1 | ||
Total | $ | 11.4 | |
Amortization expense related to cost of contracts was $3.4 million, $3.1 million and $3.2 million for the years ended December 31, 2016, 2015 and 2014 respectively. The weighted average remaining life was 9.6 years, 9.0 years and 9.5 years as of December 31, 2016, 2015 and 2014, respectively.
67
7. Other Intangible Assets, Net
The following presents a summary of other intangible assets:
December 31, | |||||||||||||||||||||||||
2016 | 2015 | ||||||||||||||||||||||||
(millions) | Weighted Average Life (Years) | Acquired Intangible Assets, Gross (1) | Accumulated Amortization | Acquired Intangible Assets, Net | Acquired Intangible Assets, Gross(1) | Accumulated Amortization | Acquired Intangible Assets, Net | ||||||||||||||||||
Covenant not to compete | 2.0 | $ | 0.9 | $ | (0.9 | ) | $ | — | $ | 0.9 | $ | (0.9 | ) | $ | — | ||||||||||
Trade names and trademarks | 2.5 | 9.8 | (9.6 | ) | 0.2 | 9.8 | (7.8 | ) | 2.0 | ||||||||||||||||
Proprietary know how | 0.4 | 34.7 | (32.6 | ) | 2.1 | 34.7 | (25.0 | ) | 9.7 | ||||||||||||||||
Management contract rights | 11.9 | 81.0 | (22.0 | ) | 59.0 | 81.0 | (16.8 | ) | 64.2 | ||||||||||||||||
Acquired intangible assets, net (2) | 11.5 | $ | 126.4 | $ | (65.1 | ) | $ | 61.3 | $ | 126.4 | $ | (50.5 | ) | $ | 75.9 | ||||||||||
(1) Excludes the original cost and accumulated amortization on fully amortized intangible assets.
(2) Intangible assets have estimated remaining lives between one and 15 years.
Amortization expense related to intangible assets included in depreciation and amortization expense was $14.6 million, $15.1 million and $15.2 million for the years ended December 31, 2016, 2015 and 2014, respectively. The expected future amortization of intangible assets as of December 31, 2016 is as follows:
(millions) | Intangible asset amortization | ||
2017 | $ | 7.2 | |
2018 | 5.3 | ||
2019 | 5.2 | ||
2020 | 5.2 | ||
2021 | 5.2 | ||
2022 and Thereafter | 33.2 | ||
Total | $ | 61.3 | |
68
8. Favorable and Unfavorable Acquired Lease Contracts, net
Favorable and unfavorable acquired lease contracts represent the acquired fair value of lease contracts in connection with the Central Merger. Favorable and unfavorable acquired lease contracts are being amortized over the contract term, including anticipated renewals and terminations.
The following presents a summary of favorable and unfavorable lease contracts:
Favorable | Unfavorable | ||||||||||||||
December 31, | December 31, | ||||||||||||||
(millions) | 2016 | 2015 | 2016 | 2015 | |||||||||||
Acquired fair value of lease contracts | $ | 73.0 | $ | 74.0 | $ | (82.6 | ) | $ | (88.2 | ) | |||||
Accumulated (amortization) accretion | (43.0 | ) | (35.9 | ) | 42.4 | 37.9 | |||||||||
Total acquired fair value of lease contracts, net | $ | 30.0 | $ | 38.1 | $ | (40.2 | ) | $ | (50.3 | ) | |||||
Amortization for acquired lease contracts, net of favorable lease contracts, was $1.8 million and $0.9 million for the years ended December 31, 2016 and 2015, respectively, and is recognized as an increase to Cost of parking services - Lease contract.
For the year ended December 31, 2016, the weighted average life for favorable and unfavorable acquired lease contracts was 11.9 years and 10.5 years, respectively. For the year ended December 31, 2015, the weighted average life for favorable and unfavorable acquired lease contracts was 11.1 years and 10.1 years, respectively. For the year ended December 31, 2014, the weighted average life for favorable and unfavorable acquired lease contracts was 10.8 years and 9.8 years, respectively.
The expected future amortization (accretion) of acquired lease contracts is as follows:
(millions) | Favorable | Unfavorable | Unfavorable, Net | ||||||||
2017 | $ | 6.4 | $ | (9.0 | ) | $ | (2.6 | ) | |||
2018 | 4.0 | (7.3 | ) | (3.3 | ) | ||||||
2019 | 3.6 | (4.8 | ) | (1.2 | ) | ||||||
2020 | 3.1 | (3.7 | ) | (0.6 | ) | ||||||
2021 | 2.4 | (2.7 | ) | (0.3 | ) | ||||||
2022 and Thereafter | 10.5 | (12.7 | ) | (2.2 | ) | ||||||
Total | $ | 30.0 | $ | (40.2 | ) | $ | (10.2 | ) | |||
69
9. Goodwill
The amounts for goodwill and changes to carrying value by reportable segment are as follows:
(millions) | Region One | Region Two | Region Three | Total | |||||||||||
Balance as of December 31, 2014 | $ | 339.1 | $ | 62.7 | $ | 31.1 | $ | 432.9 | |||||||
Foreign currency translation | (0.7 | ) | — | — | (0.7 | ) | |||||||||
Disposals (1) | (0.9 | ) | — | — | (0.9 | ) | |||||||||
Balance as of December 31, 2015 | $ | 337.5 | $ | 62.7 | $ | 31.1 | $ | 431.3 | |||||||
Foreign currency translation | 0.1 | — | — | 0.1 | |||||||||||
Balance as of December 31, 2016 | $ | 337.6 | $ | 62.7 | $ | 31.1 | $ | 431.4 | |||||||
(1) In August 2015, certain assets, which met the definition of a business, were sold to a third-party in an arms-length transaction (see also Note 1. Significant Accounting Policies and Practices and Note 10. Fair Value for further detail on the sale of the business). The sale resulted in the disposal of specifically identifiable goodwill associated with the business of $0.9 million from Region One.
The Company tests goodwill at least annually for impairment (the Company has elected to annually test for potential impairment of goodwill on the first day of the fourth quarter) and tests more frequently if indicators are present or changes in circumstances suggest that impairment may exist. The indicators include, among others, declines in sales, earning or cash flows or the development of a material adverse change in business climate. The Company assesses goodwill for impairment at the reporting unit level, which is defined as an operating segment or one level below an operating segment, referred to as a reporting unit. See Note 1. Significant Accounting Policies and Practices for additional detail on the Company's policy for assessing goodwill for impairment.
Due to a change in the Company’s segment reporting effective January 1, 2016, the goodwill allocated to previous reporting units have been reallocated to new reporting units based on the relative fair value of the new reporting units. See also Note 20. Domestic and Foreign Operations for further disclosure on the Company’s change in reporting segments effective January 1, 2016.
As a result of the change in internal reporting segment information, the Company completed a quantitative test (Step One) of goodwill impairment as of January 1, 2016 and concluded that the estimated fair values of each of the Company’s reporting units exceeded its carrying amount of net assets assigned to that reporting unit and therefore no further testing was required (Step Two). In conducting the January 1, 2016 goodwill impairment quantitative test (Step One), the Company analyzed actual and projected growth trends of the reporting units, gross margin, operating expenses and Earnings Before Interest, Taxes, Depreciation and Amortization (“EBITDA”) (which also includes forecasted five-year income statement and working capital projection, a market-based weighted average cost of capital and terminal values after five years). The Company also assesses critical areas that may impact its business including economic conditions, market related exposures, competition, changes in service offerings and changes in key personnel. As part of the January 1, 2016 goodwill assessment, the Company engaged a third-party to evaluate its reporting units’ fair values. No impairment was recorded as a result of the goodwill impairment test performed.
The Company completed its annual goodwill impairment test as of October 1, 2016, using a qualitative test (Step Zero), to determine the likelihood of impairment and if it was more likely than not that the fair value of the reporting units were less than the carrying value of the reporting unit. The Company concluded that the estimated fair values of each of the Company's reporting units exceeded its carrying amount of net assets assigned to that reporting unit and, therefore, no further testing was required (Step One). Generally, the more-likely-than-not threshold is a greater than a 50% likelihood that the fair value of a reporting unit is greater than the carrying value. As part of the October 1, 2016 goodwill assessment, the Company engaged a third-party to estimate a discount rate, which is a primary driver in the valuation of the Company's reporting units' fair values.
The reporting units are reported as Region One (Urban), Region Two (Airport Transportation) and Region Three (other reporting units of USA Parking and event planning and transportation services). For purposes of reportable segments, goodwill in Region Three is attributable to USA Parking and event planning reporting units.
10. Fair Value Measurement
Fair Value Measurements-Recurring Basis
In determining fair value, the Company uses various valuation approaches within the fair value measurement framework. Fair value measurements are determined based on the assumptions that market participants would use in pricing an asset or liability. Applicable accounting literature establishes a hierarchy for inputs used in measuring fair value that maximizes the use of observable inputs and minimizes the use of unobservable inputs by requiring that the most observable inputs be used when available. The fair value hierarchy is based on observable or unobservable inputs to valuation techniques that are used to measure fair value. Observable inputs reflect assumptions market participants would use in pricing an asset or liability based on market data obtained from independent sources while unobservable inputs reflect a reporting entity's pricing based upon its own market assumptions. Applicable accounting literature defines levels within the hierarchy based on the reliability of inputs as follows:
• | Level 1: Inputs are quoted prices in active markets for identical assets or liabilities. |
70
• | Level 2: Inputs are quoted prices for similar assets or liabilities in an active market, quoted prices for identical or similar assets or liabilities in markets that are not active, and inputs other than quoted prices that are observable and market-corroborated inputs, which are derived principally from or corroborated by observable market data. |
• | Level 3: Inputs that are derived from valuation techniques in which one or more significant inputs or value drivers are unobservable. |
The following table sets forth the Company's financial assets measured at fair value on a recurring basis and the basis of measurement at December 31, 2016 and 2015:
Fair Value at December 31, 2016 | Fair Value at December 31, 2015 | ||||||||||||||||||||||
(millions) | Level 1 | Level 2 | Level 3 | Level 1 | Level 2 | Level 3 | |||||||||||||||||
Assets | |||||||||||||||||||||||
Prepaid expenses and other | |||||||||||||||||||||||
Contingent consideration receivable | $ | — | $ | — | $ | 0.5 | $ | — | $ | — | $ | 0.5 | |||||||||||
Interest Rate Swaps | — | 0.1 | — | — | 0.2 | — | |||||||||||||||||
Total | $ | — | $ | 0.1 | $ | 0.5 | $ | — | $ | 0.2 | $ | 0.5 | |||||||||||
Liabilities | |||||||||||||||||||||||
Accrued expenses | |||||||||||||||||||||||
Contingent consideration obligation | $ | — | $ | — | $ | — | $ | — | $ | — | $ | — | |||||||||||
Other long term liabilities | |||||||||||||||||||||||
Contingent consideration obligation | — | — | — | — | — | — | |||||||||||||||||
Total | $ | — | $ | — | — | $ | — | — | $ | — | |||||||||||||
Interest Rate Swaps
The Company seeks to minimize risks from interest rate fluctuations through the use of interest rate swap contracts and hedge only exposures in the ordinary course of business. Interest rate swaps are used to manage interest rate risk associated with our floating rate debt. The Company accounts for its derivative instruments at fair value provided it meets certain documentary and analytical requirements to qualify for hedge accounting treatment. Hedge accounting creates the potential for a Consolidated Statements of Income match between the changes in fair values of derivatives and the changes in cost of the associated underlying transactions, in this case interest expense. Derivatives held by us are designated as hedges of specific exposures at inception, with an expectation that changes in the fair value will essentially offset the change in the underlying exposure. Discontinuance of hedge accounting is required whenever it is subsequently determined that an underlying transaction is not going to occur, with any gains or losses recognized in the Consolidated Statements of Income at such time, with any subsequent changes in fair value recognized currently in earnings. Fair values of derivatives are determined based on quoted prices for similar contracts. The effective portion of the change in fair value of the interest rate swap is reported in accumulated other comprehensive income, a component of stockholders' equity, and is being recognized as an adjustment to interest expense or other (expense) income, respectively, over the same period the related expenses are recognized in earnings. Ineffectiveness would occur when changes in the market value of the hedged transactions are not completely offset by changes in the market value of the derivative and those related gains and losses on derivatives representing hedge ineffectiveness or hedge components excluded from the assessment of effectiveness are recognized currently in earnings when incurred. No ineffectiveness was recognized during 2016, 2015 or 2014.
71
Contingent Consideration Receivable
During the third quarter of 2015, certain assets, which met the definition of a business, were sold to a third-party in an arms-length transaction (see also Note 1. Significant Accounting Policies and Practices for further detail on the sale of the business). Under the sales agreement, 40% of the sale proceeds from the buyer is contingent in nature and scheduled to be received by the Company in February 2017, or eighteen months from the date of the transaction. The buyer has 60 days from this date to calculate and remit the remaining consideration. The contingent consideration amount expected to be received by the Company is based on the financial and operational performance of the business sold. The significant inputs used to derive the Level 3 fair value contingent consideration receivable is the probability of reaching certain revenue growth of the business and retention of current customers over the eighteen month period. The fair value of the contingent consideration receivable for the year ended December 31, 2016 was $0.5 million.
Contingent Consideration Obligation
The significant inputs used to derive the fair value of the contingent consideration obligation include financial forecasts of future operating results, the probability of reaching the forecast and the associated discount rate. The contingent acquisition obligation remaining for the year ended December 31, 2016 was not significant.
The following table provides a reconciliation of the beginning and ending balances for the contingent consideration obligation measured at fair value using significant unobservable inputs (Level 3):
(millions) | Due to Seller | ||
Balance at December 31, 2013 | $ | (1.5 | ) |
Increase related to new acquisitions | — | ||
Payment of contingent consideration | 1.8 | ||
Change in fair value | (0.5 | ) | |
Balance at December 31, 2014 | $ | (0.3 | ) |
Increase related to new acquisitions | — | ||
Payment of contingent consideration | 0.1 | ||
Change in fair value | 0.2 | ||
Balance at December 31, 2015 | $ | — | |
Increase related to new acquisitions | — | ||
Payment of contingent consideration | — | ||
Change in fair value | — | ||
Balance at December 31, 2016 | $ | — | |
Note: Amounts may not foot due to rounding.
For the year ended December 31, 2016, no material changes occurred in the far value measurement of the contingent consideration obligation. For the year ended December 31, 2015, the Company recognized a benefit of $0.2 million in General and administrative expenses within the Consolidated Statements of Income due to the change in fair value measurements using a level three valuation technique. For the year ended December 31, 2014, the Company recognized an expense $0.5 million in General and administrative expenses due to the change in fair value measurements using a level three valuation technique. These adjustments were the result of using revised forecasts to operating results, updates to the probability of achieving the revised forecasts and updated fair value measurements that revised the Company's contingent consideration obligations related to the purchase of these businesses.
Nonrecurring Fair Value Measurements
Certain assets are measured at fair value on a nonrecurring basis; that is, the assets are measured at fair value on an ongoing basis but are subject to fair value adjustments only in certain circumstances (for example, when there is evidence of impairment). Non-financial assets such as goodwill, intangible assets, and leasehold improvements, equipment land and construction in progress are subsequently measured at fair value when there is an indicator of impairment and recorded at fair value only when an impairment is recognized. The Company assesses the impairment of intangible assets annually or whenever events or changes in circumstances indicate that the carrying amount of an intangible asset may not be recoverable. The fair value of its goodwill and intangible assets is not estimated if there is no change in events or circumstances that indicate the carrying amount of an intangible asset may not be recoverable. The Company has not recorded impairment charges related to its business acquisitions. The purchase price of business acquisitions is primarily allocated to the tangible and identifiable intangible assets acquired and liabilities assumed based on their estimated fair values on the acquisition dates, with the excess recorded as goodwill. The Company utilizes Level 3 inputs in the determination of the initial fair value.
72
Financial Instruments not Measured at Fair Value
The following table presents the carrying amounts and estimated fair values of financial instruments not measured at fair value in the Consolidated Balance Sheet at December 31, 2016 and 2015:
2016 | 2015 | ||||||||||
(millions) | Carrying Amount | Fair Value | Carrying Amount | Fair Value | |||||||
Cash and cash equivalents | 22.2 | 22.2 | 18.7 | 18.7 | |||||||
Long-term borrowings | |||||||||||
Restated Credit Facility, net of original discount on borrowings and deferred financing costs | 193.4 | 193.4 | 223.1 | 223.1 | |||||||
Other obligations | 1.7 | 1.7 | 2.0 | 2.0 | |||||||
The carrying value of cash and cash equivalents approximates their fair value due to the short-term nature of these financial instruments and would be classified as a Level 1. The fair value of the Restated Credit Facility and Other obligations were estimated to not be materially different from the carrying amount and are generally measured using a discounted cash flow analysis based on current market interest rates for similar types of financial instruments and would be classified as a Level 2.
11. Borrowing Arrangements
Long-term borrowings, in order of preference, consisted of the following:
Amount Outstanding | |||||||||
December 31, | |||||||||
(millions) | Maturity Date | 2016 | 2015 | ||||||
Restated Credit Facility, net of original discount on borrowings and deferred financing costs | February 20, 2020 | $ | 193.4 | $ | 223.1 | ||||
Other borrowings | Various | 1.7 | 2.0 | ||||||
Total obligations under Restated Credit Facility and other borrowings | 195.1 | 225.1 | |||||||
Less: Current portion of obligations under Restated Credit Facility and other borrowings | 20.4 | 15.2 | |||||||
Total long-term obligations under Restated Credit Facility and other borrowings | $ | 174.7 | $ | 209.9 | |||||
Aggregate minimum principal maturities of long-term borrowings for the fiscal years following December 31, 2016, are as follows:
(millions) | |||
2017 | $ | 21.5 | |
2018 | 20.1 | ||
2019 | 20.0 | ||
2020 | 136.3 | ||
2021 | — | ||
Thereafter | — | ||
Total debt | 197.9 | ||
Less: Current portion, including debt discount | 20.4 | ||
Less: Original discount on borrowings | 1.2 | ||
Less: Deferred financing costs | 1.6 | ||
Total long-term portion, obligations under credit facility and other borrowings | $ | 174.7 | |
Senior Credit Facility
On October 2, 2012, the Company entered into a credit agreement ("Credit Agreement") with Bank of America, N.A. ("Bank of America"), as administrative agent, Wells Fargo Bank, N.A. ("Wells Fargo Bank") and JPMorgan Chase Bank, as co-syndication agents, U.S. Bank National Association, First Hawaiian Bank and General Electric Capital Corporation, as co-documentation agents, Merrill Lynch, Pierce, Fenner & Smith Inc., Wells Fargo Securities, LLC and J.P. Morgan Securities LLC, as joint lead arrangers and joint book managers, and the lenders party thereto.
73
Pursuant to the terms, and subject to the conditions, of the Credit Agreement, the Lenders made available to the Company a secured senior credit facility (the "Senior Credit Facility") that permitted aggregate borrowings of $450.0 million consisting of (i) a revolving credit facility of up to $200.0 million at any time outstanding, which includes a letter of credit facility that is limited to $100.0 million at any time outstanding, and (ii) a term loan facility of $250.0 million. The Senior Credit Facility was due to mature on October 2, 2017.
Amended and Restated Credit Facility
On February 20, 2015 (“Restatement Date”), the Company entered into an Amended and Restated Credit Agreement (the “Restated Credit Agreement”) with Bank of America, N.A. (“Bank of America”), as administrative agent, an issuing lender and swing-line lender; Wells Fargo Bank, N.A., as an issuing lender and syndication agent; U.S. Bank National Association, First Hawaiian Bank and BMO Harris Bank N.A., as co-documentation agents; Merrill Lynch, Pierce, Fenner & Smith Incorporated and Wells Fargo Securities, LLC, as joint lead arrangers and joint book managers; and the lenders party thereto (the “Lenders”). The Restated Credit Agreement reflects modifications to, and an extension of, the Senior Credit Agreement.
Pursuant to the terms, and subject to the conditions, of the Restated Credit Agreement, the Lenders have made available to the Company a senior secured credit facility (the “Restated Credit Facility”) that permits aggregate borrowings of $400.0 million consisting of (i) a revolving credit facility of up to $200.0 million at any time outstanding, which includes a $100.0 million sublimit for letters of credit and a $20.0 million sublimit for swing-line loans, and (ii) a term loan facility of $200.0 million (reduced from $250.0 million under the Senior Credit Facility). The Company may request increases of the revolving credit facility in an aggregate additional principal amount of $100.0 million. The Restated Credit Facility matures on February 20, 2020.
The entire amount of the term loan portion of the Restated Credit Facility had been drawn by the Company as of the Amended and Restatement Date (including approximately $10.4 million drawn on such date) and is subject to scheduled quarterly amortization of principal as follows: (i) $15.0 million in the first year, (ii) $15.0 million in the second year, (iii) $20.0 million in the third year, (iv) $20.0 million in the fourth year, (v) $20.0 million in the fifth year and (vi) $110.0 million in the sixth year. The Company also had outstanding borrowings of $147.3 million (including $53.4 million in letters of credit) under the revolving credit facility as of the Restatement Date.
Borrowings under the Restated Credit Facility bear interest, at the Company’s option, (i) at a rate per annum based on the Company’s consolidated total debt to EBITDA ratio for the 12-month period ending as of the last day of the immediately preceding fiscal quarter, determined in accordance with the pricing levels set forth in the Restated Credit Agreement (the “ Applicable Margin”), plus LIBOR or (ii) the Applicable Margin plus the highest of (x) the federal funds rate plus 0.5%, (y) the Bank of America prime rate and (z) a daily rate equal to LIBOR plus 1.0% (the highest of (x), (y) and (z), the “Base Rate”), except that all swing-line loans will bear interest at the Base Rate plus the Applicable Margin.
Under the terms of the Restated Credit Agreement, the Company is required to maintain a maximum consolidated total debt to EBITDA ratio of not greater than 4.0 to 1.0 as of the end of any fiscal quarter ending during the period from the Amended and Restatement Date through September 30, 2015, (ii) 3.75 to 1.0 as of the end of any fiscal quarter ending during the period from October 1, 2015 through September 30, 2016, and (iii) 3.5 to 1.0 as of the end of any fiscal quarter ending thereafter. In addition, the Company is required to maintain a minimum consolidated fixed charge coverage ratio of not less than 1.25:1.0.
Events of default under the Restated Credit Agreement include failure to pay principal or interest when due, failure to comply with the financial and operational covenants, the occurrence of any cross default event, non-compliance with the other loan documents, the occurrence of a change of control event, and bankruptcy and other insolvency events. If an event of default occurs and is continuing, the Lenders holding a majority of the commitments and outstanding term loan under the Restated Credit Agreement have the right, among others, to (i) terminate the commitments under the Restated Credit Agreement, (ii) accelerate and require the Company to repay all the outstanding amounts owed under the Restated Credit Agreement and (iii) require the Company to cash collateralize any outstanding letters of credit.
Each wholly owned domestic subsidiary of the Company (subject to certain exceptions set forth in the Restated Credit Agreement) has guaranteed all existing and future indebtedness and liabilities of the other guarantors and the Company arising under the Restated Credit Agreement. The Company’s obligations under the Restated Credit Agreement and such domestic subsidiaries’ guaranty obligations are secured by substantially all of their respective assets.
The Company was in compliance with all of its covenants as of December 31, 2016.
The weighted average interest rate on our Senior Credit Facility and Restated Credit Facility was 2.8% and 2.6% for the years ended December 31, 2016 and 2015, respectively. The rate includes all outstanding LIBOR contracts, cash flow hedge effectiveness effect and letters of credit. The weighted average interest rate on outstanding borrowings, not including letters of credit, was 3.0% and 2.7%, respectively, at December 31, 2016 and December 31, 2015.
At December 31, 2016, the Company had $114.1 million of borrowing availability under the Restated Credit Agreement, of which the Company could have borrowed $114.1 million on December 31, 2016 and remained in compliance with the above described covenants as of such date. The Company's borrowing availability under the Restated Credit Agreement is limited only as of the Company's fiscal quarter end by the covenant restrictions described above. At December 31, 2016, the Company had $59.6 million
74
of letters of credit outstanding under the Restated Credit Agreement with aggregate borrowings against the Restated Credit Agreement of $196.3 million (excluding debt discount of $1.2 million and deferred financing cost of $1.6 million).
In connection with and effective upon the execution and delivery of the Restated Credit Agreement on February 20, 2015, the Company recorded losses on extinguishment of debt, relating to debt discount and debt issuance costs, of $0.6 million.
See Note 1. Significant Accounting Policies and Practices for additional information regarding the treatment of debt issuance costs under ASU 2015-3, which requires such costs to be a direct deduction from the carrying amount of the related debt liability.
Subordinated Convertible Debentures
The Company acquired Subordinated Convertible Debentures ("Convertible Debentures") as a result of the acquisition of Central. The subordinated debenture holders have the right to redeem the Convertible Debentures for $19.18 per share upon their stated maturity (April 1, 2028) or upon acceleration or earlier repayment of the Convertible Debentures. There were $0.0 million and $0.1 million during the years ended December 31, 2016 and 2015, respectively. The approximate redemption value of the Convertible Debentures outstanding at December 31, 2016 and December 31, 2015 is $1.1 million and $1.1 million, respectively.
12. Share Repurchase Plan
In May 2016, the Company's Board of Directors authorized the Company to repurchase, on the open market, shares of its outstanding common stock in an amount not to exceed $30.0 million in aggregate. Purchases of the Company's common stock may be made in open market transactions effected through a broker-dealer at prevailing market prices, in block trades, or by other means in accordance with Rule 10b-18 and 10b5-1under the Securities Exchange Act of 1934 ("Exchange Act"). The share repurchase program does not obligate the Company to repurchase any particular amount of common stock, and has no fixed termination date
Under this program, the Company has repurchased 305,183 shares of common stock through December 31, 2016. The following tables summarize share repurchase activity during the year ended December 31, 2016.
(millions, except for share and per share data) (unaudited) | December 31, 2016 | ||
Total number of shares repurchased | 305,183 | ||
Average price paid per share | $ | 24.43 | |
Total value of shares repurchased | $ | 7.5 | |
(millions) (unaudited) | December 31, 2016 | ||
Total authorized repurchase amount | $ | 30.0 | |
Total value of shares repurchased | $ | 7.5 | |
Total remaining authorized repurchase amount | $ | 22.5 | |
13. Leases and Contingencies
The Company operates parking facilities under operating leases expiring on various dates. Certain of the leases contain options to renew at the Company's discretion. Total future annual rent expense is not determinable as a portion of such future rent is contingent based on revenues of the parking facilities.
At December 31, 2016, the Company's minimum rental commitments, excluding contingent rent provisions and sublease income under all non-cancellable operating leases, are as follows:
(millions) | |||
2017 | $ | 225.2 | |
2018 | 192.1 | ||
2019 | 165.5 | ||
2020 | 92.0 | ||
2021 | 67.5 | ||
2022 and thereafter | 214.4 | ||
Total | $ | 956.7 | |
(1)$15.8 is included in 2017 minimum commitments for leases that expire in less than one year.
75
Rent expense, including contingent rents, was $384.0 million, $400.3 million and $330.8 million in 2016, 2015 and 2014, respectively. Contingent rent expense was $140.0 million, $186.2 million and $139.7 million in 2016, 2015 and 2014, respectively. Contingent rent expense consists primarily of percentage rent payments, which will cease at various times as certain leases expire. Future sublease income under all non-cancellable operating leases was $43.6 million as of December 31, 2016.
The Company accrued no contingent payment obligations outstanding under the previous business combination accounting pronouncement for the year ended December 31, 2016. The Company has recorded a contingency obligation for acquisitions subsequent to the adoption of the most recent guidance on business combinations, in the amount of nil and $0.1 million, as of December 31, 2016 and 2015, respectively.
The Company has contractual provisions under certain lease contracts to complete structural or other improvements to leased properties and incurs repair costs, including improvements and repairs arising as a result of ordinary wear and tear. The Company evaluates the nature of those costs when incurred and either capitalizes the costs as leasehold improvements, as applicable, or recognizes the costs as repair expenses within Cost of Parking Services-Leases within the Consolidated Statements of Income.
14. Income Taxes
For financial reporting purposes, earnings before income taxes includes the following components:
Year Ended December 31, | |||||||||||
(millions) | 2016 | 2015 | 2014 | ||||||||
United States | $ | 38.9 | $ | 21.7 | $ | 23.5 | |||||
Foreign | 2.9 | 3.4 | 2.4 | ||||||||
Total | $ | 41.8 | $ | 25.1 | $ | 25.9 | |||||
The components of income tax expense (benefit) for the years ended December 31, 2016, 2015, and 2014 are as follows:
Year Ended December 31, | |||||||||||
(millions) | 2016 | 2015 | 2014 | ||||||||
Current provision | |||||||||||
U.S. federal | $ | 13.9 | $ | 11.5 | $ | 9.5 | |||||
Foreign | 1.4 | 1.2 | 0.8 | ||||||||
State | 2.6 | 1.8 | 1.6 | ||||||||
Total current | 17.9 | 14.5 | 11.9 | ||||||||
Deferred provision | |||||||||||
U.S. federal | (2.5 | ) | (4.9 | ) | (1.5 | ) | |||||
Foreign | (0.4 | ) | 0.1 | 0.1 | |||||||
State | 0.8 | (4.9 | ) | (10.7 | ) | ||||||
Total deferred | (2.1 | ) | (9.7 | ) | (12.1 | ) | |||||
Income tax expense (benefit) | $ | 15.8 | $ | 4.8 | $ | (0.2 | ) | ||||
Deferred income taxes reflect the net effects of temporary differences between the carrying amounts of assets and liabilities for financial reporting purposes and the amount used for income tax purposes.
Significant components of the Company's deferred tax assets and liabilities are as follows:
76
December 31, | |||||||
(millions) | 2016 | 2015 | |||||
Deferred tax assets | |||||||
Net operating loss carry forwards | $ | 19.3 | $ | 20.6 | |||
Accrued expenses | 30.7 | 34.1 | |||||
Accrued compensation | 12.8 | 12.1 | |||||
Book over tax cost unfavorable acquired lease contracts | 16.1 | 20.6 | |||||
Other | 1.2 | 0.7 | |||||
Total gross deferred tax assets | 80.1 | 88.1 | |||||
Less: valuation allowance | (6.6 | ) | (6.8 | ) | |||
Total deferred tax assets | 73.5 | 81.3 | |||||
Deferred tax liabilities | |||||||
Prepaid expenses | (0.4 | ) | (0.4 | ) | |||
Undistributed foreign earnings | (0.9 | ) | (1.0 | ) | |||
Tax over book depreciation and amortization | (6.4 | ) | (11.0 | ) | |||
Tax over book goodwill amortization | (28.0 | ) | (28.7 | ) | |||
Tax over book cost favorable acquired lease contracts | (11.9 | ) | (15.6 | ) | |||
Equity investments in unconsolidated entities | (8.0 | ) | (8.8 | ) | |||
Other | — | (0.1 | ) | ||||
Total deferred tax liabilities | (55.6 | ) | (65.6 | ) | |||
Net deferred tax asset | $ | 17.9 | $ | 15.7 | |||
As discussed in Note. 1 Significant Accounting Policies and Practices, the Company adopted ASU 2015-17, which requires entities to present deferred tax assets and liabilities as noncurrent on the balance sheet. Upon adoption, $12.3 million of deferred taxes previously classified as a component of current assets in the Condensed Consolidated Balance Sheet as of December 31, 2015 have been reclassified as a component of long-term deferred tax assets.
The accounting guidance for accounting for income taxes requires that the Company assess the realisability of deferred tax assets at each reporting period. These assessments generally consider several factors including the reversal of existing temporary differences, projected future taxable income, and potential tax planning strategies. The Company has valuation allowances totaling $6.6 million and $6.8 million at December 31, 2016 and 2015, respectively, primarily related to our state Net Operating Loss carryforwards ("NOLs") and state tax credits that the Company believes are not likely to be realized based on upon its estimates of future taxable income, limitations on the uses of its state NOLs, and the carryforward life over which the state tax benefit is realized. The Company recognized a $0.2 million benefit for the reversal of a valuation allowance for deferred tax assets established for the historical net operating losses. The Company has $18.6 million of tax-effected state net operating loss carryforwards as of December 31, 2016, which will expire in years 2017 through 2036.
Since 2005, the Company has treated its investment in its Canadian subsidiary as non-permanent in duration and provided taxes on the undistributed Canadian earnings. As of December 31, 2016, the Company treats approximately $2.9 million of Canadian earnings as permanently reinvested to meet the Canadian subsidiary's working capital requirements. The amount of tax that may be payable on the distribution of such earnings to the United States is approximately $1.1 million. Generally, such amounts will become subject to U.S. taxation upon the remittance of dividends and under certain other circumstances. The Company has provided taxes for the remaining undistributed earnings of its Canadian subsidiary in excess of the permanently reinvested amount. The Company is treating its cumulative earnings of $6.2 million in its Puerto Rico subsidiary as permanent in duration to satisfy current working capital requirements. The amount of tax that may be payable on a distribution of such earnings is $2.7 million.
A reconciliation of the Company's reported income tax provision (benefit) to the amount computed by multiplying book income before income taxes by the statutory United States federal income tax rate is as follows:
77
Year Ended December 31, | |||||||||||
(millions) | 2016 | 2015 | 2014 | ||||||||
Tax at statutory rate | $ | 14.6 | $ | 8.8 | $ | 9.1 | |||||
Permanent differences | 0.8 | 1.4 | 1.0 | ||||||||
State taxes, net of federal benefit | 1.3 | 0.3 | 0.8 | ||||||||
Effect of foreign tax rates | — | (0.1 | ) | — | |||||||
Minority interest | (1.0 | ) | (1.0 | ) | (1.1 | ) | |||||
Equity investments in unconsolidated entities | — | — | 2.4 | ||||||||
Current year adjustment to deferred taxes | 1.3 | 1.5 | (1.3 | ) | |||||||
Recognition of tax credits | (1.4 | ) | (1.2 | ) | (1.5 | ) | |||||
Other | 0.4 | 0.6 | (0.5 | ) | |||||||
16.0 | 10.3 | 8.9 | |||||||||
Change in valuation allowance | (0.2 | ) | (5.5 | ) | (9.1 | ) | |||||
Income tax (benefit) expense | $ | 15.8 | $ | 4.8 | $ | (0.2 | ) | ||||
Taxes paid, which are for United States federal income tax, certain state income taxes, and foreign income taxes were $17.6 million, $18.1 million, and $1.3 million in 2016, 2015 and 2014, respectively.
As of December 31, 2016, 2015 and 2014 the Company had not identified any uncertain tax positions that would have a material impact on the Company's financial position.
The Company recognizes potential interest and penalties related to uncertain tax positions, if any, in income tax expense. The tax years that remain subject to examination for the Company's major tax jurisdictions as of December 31, 2016 are shown below:
2013 - 2016 | United States - federal income tax |
2007 - 2016 | United States - state and local income tax |
2012 - 2016 | Foreign - Canada and Puerto Rico |
15. Benefit Plans
Deferred Compensation Arrangements
The Company offers deferred compensation arrangements for certain key executives. Subject to their continued employment by the Company, certain employees are offered supplemental pension arrangements in which the employees will receive a defined monthly benefit upon attaining age 65. At December 31, 2016 and 2015, the Company has accrued $3.6 million and $3.7 million, respectively, representing the present value of the future benefit payments. Expenses related to these plans amounted to $0.2 million, $0.2 million and $0.4 million in 2016, 2015 and 2014, respectively.
The Company also has agreements with certain former key executives that provide for aggregate annual payments for periods ranging from 10 years to life, beginning when the executive retires or upon death or disability. Under certain conditions, the amount of deferred benefits can be reduced. Compensation cost for the year ended December 31, 2016 was a benefit of $0.6 million and an expense of $0.1 million and $1.0 million for the years ended December 31, 2015 and 2014, respectively. The Company had recorded a liability of $2.7 million and $3.8 million associated with these agreements as of December 31, 2016 and 2015, respectively.
Life insurance contracts with a face value of approximately $6.7 million and $6.9 million as of December 31, 2016 and 2015 have been purchased to fund, as necessary, the benefits under the Company's deferred compensation agreements. The cash surrender value of the life insurance contracts is approximately $3.9 million and $3.9 million as of December 31, 2016 and 2015, respectively, and classified as non-current assets and included in Other assets, net within the Consolidated Balance Sheet. The plan is a non-qualified plan and is not subject to ERISA funding requirements.
Defined Contribution Plans
The Company sponsored two savings and retirement plans whereby the participants may elect to contribute a portion of their compensation to the plans. The two plans merged effective January 1, 2014 into a single plan. The plan is a qualified defined contribution plan 401(k). The Company contributes an amount in cash or other property as a Company match equal to 50% of the first 6% of contributions as they occur. Expenses related to the Company's 401(k) match amounted to $1.9 million, $2.1 million, and $1.8 million in 2016, 2015 and 2014, respectively.
The Company also offers a non-qualified deferred compensation plan to those employees whose participation in its 401(k) plan is limited by statute or regulation. This plan allows certain employees to defer a portion of their compensation, limited to a maximum of $0.1 million per year, to be paid to the participants upon separation of employment or distribution date selected by employee. To support the non-qualified deferred compensation plan, the Company has elected to purchase Company Owned Life Insurance ("COLI") policies on certain plan participants. The cash surrender value of the COLI policies is designed to provide a source for
78
funding the non-qualified deferred compensation liability. As of December 31, 2016 and 2015, the cash surrender value of the COLI policies is $12.2 million and $10.9 million, respectively and classified as non-current assets in Other Assets, net within the Consolidated Balance Sheet. The liability for the non-qualified deferred compensation plan is included in Other long-term liabilities on the Consolidated Balance Sheet and was $14.7 million and $12.5 million as of December 31, 2016 and 2015, respectively.
Multi-Employer Defined Benefit and Contribution Plans
The Company contributes to a number of multiemployer defined benefit plans under the terms of collective-bargaining agreements that cover its union-represented employees. The risks of participating in these multiemployer plans are different from single-employer plans in the following aspects:
• | Assets contributed to the multiemployer plan by one employer may be used to provide benefits to employees of other participating employers. |
• | If a participating employer stops contributing to the plan, the unfunded obligations of the plan may be borne by the remaining participating employers. |
• | If the Company chooses to stop participating in one of its multiemployer plans, it may be required to pay the plan an amount based on the underfunded status of the plan, referred to as withdrawal liability. |
The Company's contributions represented more than 5% of total contributions to the Teamsters Local Union No. 727 and Local 272 Labor Management Benefit Funds for the plan year ending February 29, 2016 and November 30, 2016, respectively. The Company does not represent more than five percent to any other fund. The Company's participation in this plan for the annual periods ended December 31, 2016, 2015 and 2014, is outlined in the table below. The "EIN/Pension Plan Number" column provides the Employee Identification Number ("EIN") and the three-digit plan number, if applicable. The zone status is based on information that the Company received from the plan and is certified by the plan's actuary. Among other factors, plans in the red zone are generally less than 65 percent funded, plans in the yellow zone are less than 80 percent funded, and plans in the green zone are at least 80 percent funded. The "FIP/RP Status Pending/Implemented" column indicates plans for which a Financial Improvement Plan ("FIP") or a Rehabilitation Plan ("RP") is either pending or has been implemented.
The "Expiration Date of Collective Bargaining Agreement" column lists the expiration dates of the agreements to which the plans are subject.
EIN/ Pension Plan Number | Pension Protection Zone Status | FIP/FR Pending Implementation | Contributions (millions) | Zone Status as of the Most Recent Annual Report | Expiration Date of Collective Bargaining Agreement | ||||||||||||||||||||||
Pension | 2016 | 2015 | 2014 | 2016 | 2015 | 2014 | Surcharge Imposed | ||||||||||||||||||||
Teamsters Local Union 727 | 36-61023973 | Green | Green | Green | N/A | $ | 3.5 | $ | 3.5 | $ | 3.3 | No | 2016 | 10/31/2021 | |||||||||||||
Local 272 Labor Management | 13-5673836 | Green | Green | N/A | N/A | $ | 1.5 | $ | 2.2 | $ | 2.0 | No | 2016 | 3/5/2021 | |||||||||||||
Net expenses for contributions not reimbursed by clients and related to multiemployer defined benefit and defined contribution benefit plans were $3.3 million, $4.6 million and $2.7 million in 2016, 2015 and 2014, respectively.
In the event that the Company decides to cease participating in these plans, the Company could be assessed a withdrawal liability. The Company currently does not have any intentions to cease participating in these multiemployer pension plans and therefore would not trigger the withdrawal liability.
16. Management Contracts and Related Arrangements with Affiliates
Closing Agreements
In connection with the Central Merger, on February 28, 2012, the Company entered into initial Closing Agreements (the "Initial Closing Agreements") with each of Lubert-Adler Real Estate Fund V, L.P. and Lubert-Adler Real Estate Parallel Fund V, L.P. (collectively, "Lubert-Adler Entities"); each of Kohlberg Investors V, L.P., Kohlberg TE Investors V, L.P., Kohlberg Partners V, L.P., Kohlberg Offshore Investors V, L.P., and KOCO Investors V, L.P. (collectively, the "Kohlberg Entities"); and each of Versa Capital Fund I, L.P. and Versa Capital Fund I Parallel, L.P. (collectively, the "Versa Entities"). As of the most recent filings with the Securities and Exchange Commission, the Lubert-Adler Entities collectively own approximately 6.0% of our common stock, the Kohlberg Entities collectively own approximately 16.2% of our common stock, and the Versa Entities collectively own approximately 2.3% of our common stock. In addition, Paul Halpern, who resigned as director on December 14, 2016, is affiliated with the Versa Entities; and directors Seth H. Hollander, Jonathan P. Ward and Gordon H. Woodward are affiliated with Kohlberg Entities.
79
Under the Initial Closing Agreements, the Lubert-Adler, Kohlberg and Versa Entities (collectively, the "Central Stockholders") agreed, among other things, to vote their shares of our common stock in accordance with the Board's recommendations or, in specified cases, in proportion to the votes made by the Company's other stockholders, until October 2, 2015.
Additionally, the Initial Closing Agreements provide that each Central Stockholder will be subject to a four-year "standstill period" following the closing of the Merger, during which each such Central Stockholder will not, among other things, (i) acquire any additional voting securities of the Company, (ii) seek or propose a merger, acquisition, tender offer or other extraordinary transaction with respect to the Company, (iii) call a meeting of Company stockholders or initiate a stockholder proposal, or (iv) form a "group" with any person with respect to Company securities.
The Initial Closing Agreements also impose certain restrictive covenants on some of the Central Stockholders, including, among others, (i) non-compete covenants, (ii) non-solicitation covenants, (iii) confidentiality obligations and (iv) non-disparagement requirements.
The foregoing description of the Initial Closing Agreements does not purport to be complete and is qualified in its entirety by reference to the Closing Agreements, copies of which are attached to the Company's Current Report on Form 8-K filed on February 29, 2012 as Exhibits 10.2 through 10.4 and incorporated by reference herein.
In connection with the Central Merger, on October 2, 2012, the Company entered into Additional Closing Agreements (the "Additional Closing Agreements") with the Central Stockholders. Pursuant to the terms of the Additional Closing Agreements, the Kohlberg, Lubert-Adler and Versa Entities have each agreed that, until October 2, 2015 and for so long as it owns in the aggregate (together with its affiliates, all other Central stockholders and their respective affiliates and any other persons with which any of the foregoing form a "group") beneficially or of record more than 10% of Company issued and outstanding common stock, to cause the shares of our common stock held by them to be counted as present at any meeting of Company stockholders and to vote, in person or by proxy, all of such shares of Company common stock as follows:
From October 2, 2013 until October 2, 2014:
• | with respect to the election of directors to the Company's Board, "for" any nominees recommended by the Board; and |
• | with respect to all other matters submitted for a vote of Company stockholders, in accordance with the recommendation of the Board with respect to such matters. |
From October 2, 2014 until October 2, 2015:
• | with respect to the election of directors to the Board, "for" any nominees recommended by our Board; and |
• | with respect to all other matters submitted for a vote of Company stockholders, in proportion to the votes cast by all of the Company's other stockholders. |
The Additional Closing Agreements also provide that the Kohlberg, Lubert-Adler and Versa Entities were subject to a four-year standstill period following the Closing Date, during which time, such Central Stockholder will not, among other things, (i) acquire or agree to acquire any additional voting securities of the Company, (ii) seek or propose a merger, acquisition, tender offer or other extraordinary transaction with or involving the Company or any of its subsidiaries or their respective securities or assets, (iii) call a meeting of the stockholders of the Company or initiate a stockholder proposal or (iv) form a "group" (as defined in Section 13(d)(3) of the Securities Exchange Act of 1934) with any person (other than an affiliate of such Central Stockholder) with respect to the acquisition or voting of any of the Company's voting securities.
The Additional Closing Agreements impose certain restrictive covenants on the Kohlberg and Versa Entities, including (i) confidentiality obligations with respect to the Company confidential information and (ii) non- disparagement requirements. The Lubert-Adler Entity is subject to confidentiality obligations with respect to its confidential information pursuant to the terms of its Additional Closing Agreement.
The foregoing description of the Additional Closing Agreements does not purport to be complete and is qualified in its entirety by reference to the Additional Closing Agreements, copies of which are attached as Exhibits 10.2 through 10.8 to the Company's Current Report on Form 8-K filed with the SEC on October 2, 2012.
17. Bradley Agreement
The Company entered into a 25-year agreement with the State of Connecticut ("State") that expires on April 6, 2025, under which it operates the surface parking and 3,500 garage parking spaces at Bradley International Airport ("Bradley") located in the Hartford, Connecticut metropolitan area.
The parking garage was financed through the issuance of State of Connecticut special facility revenue bonds and provides that the Company deposits, with the trustee for the bondholders, all gross revenues collected from operations of the surface and garage parking. From these gross revenues, the trustee pays debt service on the special facility revenue bonds outstanding, operating and capital maintenance expense of the surface and garage parking facilities, and specific annual guaranteed minimum payments to the state. Principal and interest on the Bradley special facility revenue bonds increase from approximately $3.6 million in contract year 2002 to approximately $4.5 million in contract year 2025. Annual guaranteed minimum payments to the State increase from
80
approximately $8.3 million contract year 2002 to approximately $13.2 million in contract year 2024. The annual minimum guaranteed payment to the State by the trustee for the twelve months ended December 31, 2016 and 2015 was $11.3 million and $11.0 million, respectively. All of the cash flow from the parking facilities are pledged to the security of the special facility revenue bonds and are collected and deposited with the bond trustee. Each month the bond trustee makes certain required monthly distributions, which are characterized as "Guaranteed Payments." To the extent the monthly gross receipts generated by the parking facilities are not sufficient for the trustee to make the required Guaranteed Payments, the Company is obligated to deliver the deficiency amount to the trustee, with such deficiency payments representing interest bearing advances to the trustee. The Company does not directly guarantee the payment of any principal or interest on any debt obligations of the State of Connecticut or the trustee.
The following is the list of Guaranteed Payments:
• | Garage and surface operating expenses, |
• | Principal and interest on the special facility revenue bonds, |
• | Trustee expenses, |
• | Major maintenance and capital improvement deposits; and |
• | State minimum guarantee. |
To the extent sufficient funds exist, the trustee is then directed to reimburse the Company for deficiency payments up to the amount of the calculated surplus, with the Company having the right to be repaid the principal amount of any and all deficiency payments, together with actual interest and premium, not to exceed 10% of the initial deficiency payment. The Company calculates and records interest and premium income along with deficiency principal repayments as a reduction of cost of parking services in the period the associated deficiency repayment is received from the trustee. The Company believes these advances to be fully recoverable as the Bradley Agreement places no time restriction on the Company's right to reimbursement. The total deficiency repayments, net of payments, as of December 31, 2016, 2015 and 2014 are as follows:
December 31, | |||||||||||
2016 | 2015 | 2014 | |||||||||
Balance at beginning of year | $ | 11.6 | $ | 13.3 | $ | 14.6 | |||||
Deficiency payments made | 0.2 | 0.1 | — | ||||||||
Deficiency repayment received | (1.9 | ) | (1.8 | ) | (1.3 | ) | |||||
Balance at end of year | $ | 9.9 | $ | 11.6 | $ | 13.3 | |||||
The total deficiency repayments (net of payments made), interest and premium received and recorded for the years ended December 31, 2016, 2015 and 2014 are as follows:
Year Ended December 31 | |||||||||||
(millions) | 2016 | 2015 | 2014 | ||||||||
Deficiency repayments | $ | 1.7 | $ | 1.8 | $ | 1.3 | |||||
Interest | $ | 0.5 | $ | 0.4 | $ | 0.5 | |||||
Premium | $ | 0.2 | $ | 0.2 | $ | 0.1 | |||||
Deficiency payments made are recorded as an increase in cost of parking services and deficiency repayments, interest and premium received are recorded as reductions to cost of parking services. The reimbursement of principal, interest and premium are recognized when received.
There were no amounts of estimated deficiency payments accrued as of December 31, 2016 and 2015, as the Company concluded that the potential for future deficiency payments did not meet the criteria of both probable and estimable.
In addition to the recovery of certain general and administrative expenses incurred, the Bradley Agreement provides for an annual management fee payment, which is based on operating profit tiers. The annual management fee is further apportioned 60% to the Company and 40% to an un-affiliated entity and the annual management fee will be paid to the extent funds are available for the trustee to make distribution, and are paid after Guaranteed Payments (as defined in the Bradley Agreement) repayment of all deficiency payments, including interest and premium. Cumulative management fees of approximately $16.7 million and $15.7 million have not been recognized as of December 31, 2016 and 2015, respectively, and no management fees were recognized as revenue during 2016, 2015 or 2014.
81
18. Accumulated Other Comprehensive Income (Loss)
The components of accumulated other comprehensive income (loss) is comprised of unrealized gains (losses) on cash flow hedges and foreign currency translation adjustments. The components of changes in accumulated comprehensive income (loss), net of taxes, were as follows:
(millions) | Foreign Currency Translation Adjustments | Effective Portion of Unrealized Gain (Loss) on Derivative | Total Accumulated Other Comprehensive Income (Loss) | ||||||||
Balance as of December 31, 2013 | $ | (0.4 | ) | $ | 0.5 | $ | 0.1 | ||||
Change in other comprehensive income (loss) | (0.2 | ) | (0.2 | ) | (0.3 | ) | |||||
Balance as of December 31, 2014 | (0.5 | ) | 0.3 | (0.2 | ) | ||||||
Change in other comprehensive income (loss) | (0.7 | ) | (0.2 | ) | (0.9 | ) | |||||
Balance as of December 31, 2015 | (1.2 | ) | 0.1 | (1.1 | ) | ||||||
Change in other comprehensive income (loss) | (0.2 | ) | (0.1 | ) | (0.3 | ) | |||||
Balance as of December 31, 2016 | $ | (1.4 | ) | $ | — | $ | (1.4 | ) | |||
Note: Amounts may not foot due to rounding.
19. Legal Proceedings
The Company is subject to litigation in the normal course of its business. The outcomes of legal proceedings and claims brought against it and other loss contingencies are subject to significant uncertainty. The Company accrues a charge against income when its management determines that it is probable that an asset has been impaired or a liability has been incurred and the amount of loss can be reasonably estimated. In addition, the Company accrues for the authoritative judgments or assertions made against it by government agencies at the time of their rendering regardless of its intent to appeal. In addition, the Company is from time-to-time party to litigation administrative proceedings and union grievances that arise in the normal course of business, and occasionally pays non-material amounts to resolve claims or alleged violations of regulatory requirements. There are no "normal course" matters that separately or in the aggregate, would, in the opinion of management, have a material adverse effect on its operation, financial condition or cash flow.
In determining the appropriate accounting for loss contingencies, the Company considers the likelihood of loss or impairment of an asset or the incurrence of a liability, as well as its ability to reasonably estimate the amount of loss. The Company regularly evaluates current information available to determine whether an accrual should be established or adjusted. Estimating the probability that a loss will occur and estimating the amount of a loss or a range of loss involves significant judgment.
Holten Settlement
In March 2010, John V. Holten, a former indirect controlling shareholder of the Company, filed a lawsuit against the Company in the United States District Court, District of Connecticut. Mr. Holten was terminated as the Company's chairman in October 2009. The lawsuit alleged breach of his employment agreement and claimed that the agreement entitled Mr. Holten to payments worth more than $3.8 million. The Company filed an answer and counterclaim to Mr. Holten's lawsuit in 2010.
In March 2016, the Company and Mr. Holten settled all claims in connection with the original lawsuits ("Holten Settlement"). Per the settlement, the Company paid Mr. Holten $3.4 million of which $1.9 million was recovered by the Company through the Company's directors and officers liability insurance policies. The Company recognized an expense, net of insurance recoveries, related to the Holten Settlement of $1.5 million for the year ended December 31, 2016.
20. Domestic and Foreign Operations
Business Unit Segment Information
Segment information is presented in accordance with a "management approach," which designates the internal reporting used by the chief operating decision maker for making decisions and assessing performance as the source of the Company's reportable segments. The Company's segments are organized in a manner consistent with which separate financial information is available and evaluated regularly by the chief operating decision-maker ("CODM") in deciding how to allocate resources and in assessing the Company's overall performance.
An operating segment is defined as a component of an enterprise that engages in business activities from which it may earn revenue and incur expenses, and about which separate financial information is regularly evaluated by the CODM. The CODM is the Company's president and chief executive officer. The business is managed based on regions administered by executive vice presidents. Each of the operating segments is directly responsible for revenue and expenses related to their operations including direct regional administrative costs. Finance, information technology, human resources, and legal are shared functions that are not allocated back to the four operating segments. The CODM assesses the performance of each operating segment using information about its
82
revenue and operating income (loss) before interest, taxes, and depreciation and amortization, but does not evaluate operating segments using discrete asset information. There are no inter-segment transactions and the Company does not allocate interest and other income, interest expense, depreciation and amortization or taxes to operating segments. The accounting policies for segment reporting are the same as for the Company as a whole.
Effective January 1, 2016, the Company began certain organizational and executive leadership changes to align with how our CODM reviews performance and makes decisions in managing the Company and therefore, changed internal operating segment information reported to the CODM. The operating segments are internally reported as Region One (Urban), Region Two (Airport Transportation) and Region Three (other reporting units of USA Parking and event planning and transportation services). All prior periods presented have been restated to reflect the new internal reporting to the CODM.
• | Region One (Urban) encompasses our services in healthcare facilities, municipalities, including meter revenue collection and enforcement services, government facilities, hotels, commercial real estate, residential communities, retail, colleges and universities, as well as ancillary services such as shuttle and transportation services, valet services, taxi and livery dispatch services. |
• | Region Two (Airport transportation) encompasses our services at all major airports as well as ancillary services, which includes shuttle and transportation services and valet services. |
• | Region Three encompasses other operating segments including USA Parking and event planning, including shuttle and transportation services. |
• | Other consists of ancillary revenue that is not specifically identifiable to a region and certain unallocated insurance reserve adjustments. |
The following is a summary of revenues (excluding reimbursed management contract revenue) and gross profit by operating segment for the years ended December 31, 2016, 2015 and 2014:
Year Ended December 31, | ||||||||||||||||||||
(millions) | 2016 | Gross Margin | 2015 | Gross Margin | 2014 | Gross Margin | ||||||||||||||
Parking services revenue (a) | ||||||||||||||||||||
Region One | ||||||||||||||||||||
Lease contracts | $ | 414.5 | $ | 442.7 | $ | 443.7 | ||||||||||||||
Management contracts | 201.2 | 190.9 | 193.0 | |||||||||||||||||
Total Region One | 615.7 | 633.6 | 636.7 | |||||||||||||||||
Region Two | ||||||||||||||||||||
Lease contracts | 124.7 | 123.8 | 48.5 | |||||||||||||||||
Management contracts | 88.1 | 100.6 | 103.3 | |||||||||||||||||
Total Region Two | 212.8 | 224.4 | 151.8 | |||||||||||||||||
Region Three | ||||||||||||||||||||
Lease contracts | 5.8 | 4.4 | 2.7 | |||||||||||||||||
Management contracts | 44.5 | 44.9 | 29.8 | |||||||||||||||||
Total Region Three | 50.3 | 49.3 | 32.5 | |||||||||||||||||
Other | ||||||||||||||||||||
Lease contracts | — | — | 1.7 | |||||||||||||||||
Management contracts | 13.0 | 13.9 | 12.2 | |||||||||||||||||
Total Other | 13.0 | 13.9 | 13.9 | |||||||||||||||||
Reimbursed management contract revenue | 723.7 | 694.7 | 679.8 | |||||||||||||||||
Total Revenues | $ | 1,615.5 | $ | 1,615.9 | $ | 1,514.7 | ||||||||||||||
Gross Profit | ||||||||||||||||||||
Region One | ||||||||||||||||||||
Lease contracts | 32.6 | 8 | % | 35.8 | 8 | % | $ | 36.8 | 8 | % | ||||||||||
Management contracts | 86.6 | 43 | % | 85.1 | 44 | % | 86.1 | 45 | % | |||||||||||
Total Region One | 119.2 | 120.9 | 122.9 | |||||||||||||||||
Region Two | ||||||||||||||||||||
Lease contracts | 5.7 | 5 | % | 5.5 | 4 | % | 3.7 | 8 | % | |||||||||||
Management contracts | 25.2 | 29 | % | 24.5 | 24 | % | 26.3 | 26 | % | |||||||||||
Total Region Two | 30.9 | 30.0 | 30.0 | |||||||||||||||||
Region Three | ||||||||||||||||||||
83
Year Ended December 31, | ||||||||||||||||||||
(millions) | 2016 | Gross Margin | 2015 | Gross Margin | 2014 | Gross Margin | ||||||||||||||
Lease contracts | 0.8 | 14 | % | 0.3 | 7 | % | 0.2 | 9 | % | |||||||||||
Management contracts | 12.7 | 29 | % | 11.4 | 26 | % | 11.8 | 40 | % | |||||||||||
Total Region Three | 13.5 | 11.7 | 12.0 | |||||||||||||||||
Region Other | ||||||||||||||||||||
Lease contracts | 0.3 | — | % | (3.5 | ) | — | % | 0.2 | 12 | % | ||||||||||
Management contracts | 12.5 | 96 | % | 11.0 | 79 | % | 6.2 | 51 | % | |||||||||||
Total Other | 12.8 | 7.5 | 6.4 | |||||||||||||||||
Total gross profit | 176.4 | 170.1 | 171.3 | |||||||||||||||||
General and administrative expenses | 90.0 | 97.3 | 101.5 | |||||||||||||||||
General and administrative expense percentage of gross profit | 51 | % | 57 | % | 59 | % | ||||||||||||||
Depreciation and amortization | 33.7 | 34.0 | 30.3 | |||||||||||||||||
Operating income | 52.7 | 38.8 | 39.5 | |||||||||||||||||
Other expenses (income): | ||||||||||||||||||||
Interest expense | 10.5 | 12.7 | 17.8 | |||||||||||||||||
Interest income | (0.5 | ) | (0.2 | ) | (0.4 | ) | ||||||||||||||
Gain on sale of business | — | (0.5 | ) | — | ||||||||||||||||
Gain on contribution of a business to an unconsolidated entity | — | — | (4.1 | ) | ||||||||||||||||
Equity in losses from investment in unconsolidated entity | 0.9 | 1.7 | 0.3 | |||||||||||||||||
Total other expenses | 10.9 | 13.7 | 13.6 | |||||||||||||||||
Earnings before income taxes | 41.8 | 25.1 | 25.9 | |||||||||||||||||
Income tax expense (benefit) | 15.8 | 4.8 | (0.2 | ) | ||||||||||||||||
Net income | 26.0 | 20.3 | 26.1 | |||||||||||||||||
Less: Net income attributable to noncontrolling interest | 2.9 | 2.9 | 3.0 | |||||||||||||||||
Net income attributable to SP Plus Corporation | $ | 23.1 | $ | 17.4 | $ | 23.1 | ||||||||||||||
84
In the first quarter of 2017, the Company changed its internal reporting segment information reported to its CODM. The Company will prospectively report on the following regions beginning in 2017 and restate prior periods presented to reflect the internal reporting to the CODM:
• | Region One (Commercial) encompasses our services in healthcare facilities, municipalities, including meter revenue collection and enforcement services, government facilities, hotels, commercial real estate, residential communities, retail, colleges and universities, as well as ancillary services such as shuttle and transportation services, valet services, taxi and livery dispatch services and event planning, including shuttle and transportation services. |
• | Region Two (Airports) encompasses our services at all major airports as well as ancillary services, which includes shuttle and transportation services and valet services. |
• | Other consists of ancillary revenue that is not specifically identifiable to a region and certain unallocated insurance reserve adjustments. |
21. Unaudited Quarterly Results
The following table sets forth the Company's unaudited quarterly consolidated statement of income data for the years ended December 31, 2016 and December 31, 2015. The unaudited quarterly information has been prepared on the same basis as the annual financial information and, in management's opinion, includes all adjustments (consisting only of normal recurring adjustments) necessary to present fairly the information for the quarters presented. Historically, the Company's operating results have varied from quarter to quarter and are expected to continue to fluctuate in the future. These fluctuations have been due to a number of factors, including: general economic conditions in its markets; acquisitions; additions of contracts; expiration and termination of contracts; conversion of lease contracts to management contracts; conversion of management contracts to lease contracts and changes in terms of contracts that are retained and timing of general and administrative expenditures.
The operating results for any historical quarter are not necessarily indicative of results for any future period.
85
2016 | 2015 | ||||||||||||||||||||||||||||||
(millions, except for share and per share data) | First Quarter | Second Quarter | Third Quarter | Fourth Quarter | First Quarter | Second Quarter | Third Quarter | Fourth Quarter | |||||||||||||||||||||||
(Unaudited) | (Unaudited) | ||||||||||||||||||||||||||||||
Parking services revenue | |||||||||||||||||||||||||||||||
Lease contracts | $ | 138.5 | $ | 135.7 | $ | 136.1 | $ | 134.7 | $ | 135.8 | $ | 146.4 | $ | 146.6 | $ | 142.1 | |||||||||||||||
Management contracts | 91.2 | 86.7 | 84.1 | 84.8 | 94.1 | 88.3 | 85.8 | 82.1 | |||||||||||||||||||||||
Reimbursed management contract revenue | 167.9 | 180.2 | 188.9 | 186.7 | 174.3 | 170.9 | 168.3 | 181.2 | |||||||||||||||||||||||
Total revenue | 397.6 | 402.6 | 409.1 | 406.2 | 404.2 | 405.6 | 400.7 | 405.4 | |||||||||||||||||||||||
Cost of parking services | |||||||||||||||||||||||||||||||
Lease contracts | 130.6 | 124.0 | 125.8 | 125.2 | 128.7 | 134.5 | 136.0 | 133.6 | |||||||||||||||||||||||
Management contracts | 60.7 | 51.4 | 50.5 | 47.2 | 60.0 | 53.8 | 53.6 | 50.9 | |||||||||||||||||||||||
Reimbursed management contract expense | 167.9 | 180.2 | 188.9 | 186.7 | 174.3 | 170.9 | 168.3 | 181.2 | |||||||||||||||||||||||
Total cost of parking services | 359.2 | 355.6 | 365.2 | 359.1 | 363.0 | 359.2 | 357.9 | 365.7 | |||||||||||||||||||||||
Gross profit | |||||||||||||||||||||||||||||||
Lease contracts | 7.9 | 11.7 | 10.3 | 9.5 | 7.1 | 11.9 | 10.6 | 8.5 | |||||||||||||||||||||||
Management contracts | 30.5 | 35.3 | 33.6 | 37.6 | 34.1 | 34.5 | 32.2 | 31.2 | |||||||||||||||||||||||
Total gross profit | 38.4 | 47.0 | 43.9 | 47.1 | 41.2 | 46.4 | 42.8 | 39.7 | |||||||||||||||||||||||
General and administrative expenses | 24.6 | 22.1 | 20.3 | 23.0 | 25.7 | 24.7 | 23.8 | 23.1 | |||||||||||||||||||||||
Depreciation and amortization | 9.2 | 9.8 | 7.8 | 6.9 | 7.9 | 8.2 | 8.2 | 9.7 | |||||||||||||||||||||||
Operating income | 4.6 | 15.1 | 15.8 | 17.2 | 7.6 | 13.5 | 10.8 | 6.9 | |||||||||||||||||||||||
Other expense (income) | |||||||||||||||||||||||||||||||
Interest expense | 2.8 | 2.6 | 2.7 | 2.4 | 4.0 | 3.0 | 3.0 | 2.7 | |||||||||||||||||||||||
Interest income | (0.2 | ) | (0.1 | ) | (0.1 | ) | (0.1 | ) | (0.1 | ) | — | — | (0.1 | ) | |||||||||||||||||
Gain on sale of business | — | — | — | — | — | — | (0.5 | ) | — | ||||||||||||||||||||||
Equity in losses (income) from investment in unconsolidated entity | 0.5 | 0.3 | 0.4 | (0.3 | ) | 0.5 | 0.3 | 0.4 | 0.5 | ||||||||||||||||||||||
Total other expenses (income) | 3.1 | 2.8 | 3.0 | 2.0 | 4.4 | 3.3 | 2.9 | 3.1 | |||||||||||||||||||||||
Earnings (loss) before income taxes | 1.5 | 12.3 | 12.8 | 15.2 | 3.2 | 10.2 | 7.9 | 3.8 | |||||||||||||||||||||||
Income tax expense (benefit) | 0.9 | 4.9 | 5.1 | 4.9 | 1.3 | (0.4 | ) | 3.5 | 0.4 | ||||||||||||||||||||||
Net income | 0.6 | 7.4 | 7.7 | 10.3 | 1.9 | 10.6 | 4.4 | 3.4 | |||||||||||||||||||||||
Less: Net income attributable to noncontrolling interest | 0.6 | 0.9 | 0.7 | 0.7 | 0.5 | 0.8 | 0.8 | 0.8 | |||||||||||||||||||||||
Net income attributable to SP Plus Corporation | $ | — | $ | 6.5 | $ | 7.0 | $ | 9.6 | $ | 1.4 | $ | 9.8 | $ | 3.6 | $ | 2.6 | |||||||||||||||
Common stock data | |||||||||||||||||||||||||||||||
Net income per share* | |||||||||||||||||||||||||||||||
Basic | $ | — | $ | 0.29 | $ | 0.31 | $ | 0.44 | $ | 0.06 | $ | 0.44 | $ | 0.17 | $ | 0.11 | |||||||||||||||
Diluted | $ | — | $ | 0.29 | $ | 0.31 | $ | 0.43 | $ | 0.06 | $ | 0.43 | $ | 0.16 | $ | 0.11 | |||||||||||||||
Weighted average shares outstanding | |||||||||||||||||||||||||||||||
Basic | 22,328,578 | 22,344,898 | 22,208,139 | 22,071,865 | 22,127,725 | 22,145,190 | 22,205,707 | 22,276,763 | |||||||||||||||||||||||
Diluted | 22,593,505 | 22,625,471 | 22,497,111 | 22,398,045 | 22,528,608 | 22,521,832 | 22,548,166 | 22,486,888 | |||||||||||||||||||||||
* Basic and diluted earnings per share are computed independently for each of the quarters presented. As a result, the sum of quarterly basic and diluted per share information may not equal annual basic and diluted earnings per share.
86
SIGNATURES
Pursuant to the requirements of Section 13 or 15(d) of the Securities Exchange Act of 1934, the registrant has duly caused this report to be signed on its behalf by the undersigned, thereunto duly authorized.
SP PLUS CORPORATION | ||||
Date: February 23, 2017 | By: | /s/ VANCE C. JOHNSTON | ||
Vance C. Johnston | ||||
Executive Vice President, | ||||
Chief Financial Officer and Treasurer | ||||
(Principal Financial Officer) | ||||
Pursuant to the requirements of the Securities Exchange Act of 1934, this report has been signed below by the following persons on behalf of the Registrant and in the capacities and on the dates indicated.
Signature | Title | Date | ||
/s/ G MARC BAUMANN | Director, President and Chief Executive Officer (Principal Executive Officer) | February 23, 2017 | ||
G Marc Baumann | ||||
/s/ KAREN M. GARRISON | Director and Non-Executive Chairman | February 23, 2017 | ||
Karen M. Garrison | ||||
/s/ SETH H. HOLLANDER | Director | February 23, 2017 | ||
Seth H. Hollander | ||||
/s/ ROBERT S. ROATH | Director | February 23, 2017 | ||
Robert S. Roath | ||||
/s/ WYMAN T. ROBERTS | Director | February 23, 2017 | ||
Wyman T. Roberts | ||||
/s/ DOUGLAS R. WAGGONER | Director | February 23, 2017 | ||
Douglas R. Waggoner | ||||
/s/ JONATHAN P. WARD | Director | February 23, 2017 | ||
Jonathan P. Ward | ||||
/s/ JAMES A. WILHELM | Director | February 23, 2017 | ||
James A. Wilhelm | ||||
/s/ GORDON H. WOODWARD | Director | February 23, 2017 | ||
Gordon H. Woodward | ||||
/s/ VANCE C. JOHNSTON | Executive Vice President, Chief Financial Officer and Treasurer (Principal Financial Officer) | February 23, 2017 | ||
Vance C. Johnston | ||||
/s/ KRISTOPHER H. ROY | Senior Vice President, Corporate Controller and Assistant Treasurer (Principal Accounting Officer and Duly Authorized Officer) | February 23, 2017 | ||
Kristopher H. Roy | ||||
87
SP PLUS CORPORATION
SCHEDULE II—VALUATION AND QUALIFYING ACCOUNTS
Description | Balance at Beginning of Year | Additions Charged to Costs and Expenses | Reductions (1) | Balance at End of Year | |||||||||||
(millions) | |||||||||||||||
Allowance for doubtful accounts | |||||||||||||||
Year ended December 31, 2016 | $ | 0.9 | $ | 0.5 | $ | (1.0 | ) | $ | 0.4 | ||||||
Year ended December 31, 2015 | 1.0 | 0.7 | (0.8 | ) | 0.9 | ||||||||||
Year ended December 31, 2014 | $ | 0.7 | $ | 0.7 | $ | (0.5 | ) | $ | 1.0 | ||||||
Tax valuation account | |||||||||||||||
Year ended December 31, 2016 | $ | 6.8 | — | (0.2 | ) | $ | 6.6 | ||||||||
Year ended December 31, 2015 | 12.3 | — | (5.5 | ) | $ | 6.8 | |||||||||
Year ended December 31, 2014 | $ | 21.3 | — | (9.0 | ) | $ | 12.3 | ||||||||
(1) | Represents uncollectible accounts written off and reversal of provision. |
88
INDEX TO EXHIBITS
Exhibit Number | Description | |
3.1 | Second Amended and Restated Certificate of Incorporation of the Company filed on June 2, 2004 (incorporated by reference to exhibit 3.1 of the Company's Annual Report on Form 10-K filed on March 13, 2009). | |
3.1.1 | Certificate of Amendment of Second Amended and Restated Certificate of Incorporation of the Company effective as of January 7, 2008 (incorporated by reference to exhibit 3.1.1 of the Company's Annual Report on Form 10-K filed on March 13, 2009). | |
3.1.2 | Certificate of Amendment of Second Amended and Restated Certificate of Incorporation of the Company effective as of April 29, 2010 (incorporated by reference to exhibit 3.1.3 of the Company's Quarterly Report on Form 10-Q filed on August 6, 2010). | |
3.1.3 | Certificate of Amendment of Second Amended and Restated Certificate of Incorporation of the Company effective as of May 6, 2010 (incorporated by reference to exhibit 3.1.4 of the Company's Quarterly Report on Form 10-Q filed on August 6, 2010). | |
3.1.4 | Certificate of Ownership and Merger, as filed with the Secretary of State of the State of Delaware on November 25, 2013, effective as of December 2, 2013 (incorporated by reference to exhibit 3.1 of the Company's Current Report on Form 8-K filed on December 2, 2013). | |
3.2 | Fourth Amended and Restated Bylaws of the Company dated January 1, 2010 (incorporated by reference to exhibit 3.1 of the Company's Quarterly Report on Form 10-Q filed on November 3, 2016). | |
3.2.1 | Amendment to Fourth Amended and Restated Bylaws of the Company dated February 19, 2016 (incorporated by reference to exhibit 3.1.1 of the Company's Quarterly Report on Form 10-Q filed on November 3, 2016). | |
3.2.2 | Amendment to Fourth Amended and Restated Bylaws of the Company dated August 5, 2016 (incorporated by reference to exhibit 3.1.2 of the Company's Quarterly Report on Form 10-Q filed on November 3, 2016). | |
4.1 | Specimen common stock certificate (incorporated by reference to exhibit 4.1 of the Company's Annual Report on Form 10-K filed on March 1, 2016). | |
10.1 | ^ | Amended and Restated Credit Agreement, dated as of February 20, 2015, by and among the Company, Bank of America, N.A., as administrative agent, an issuing lender and wing-line lender; Wells Fargo Bank, N.A., as an issuing lender and syndication agent; U.S. Bank National Association, First Hawaiian Bank and BMO Harris Bank N.A., as co-documentation agents; Merrill Lynch, Pierce, Fenner & Smith Incorporated, Wells Fargo Securities LLC and J.P. Morgan Securities LLC, as joint lead arrangers and joint book managers, and the lenders party thereto (incorporated by reference to exhibit 10.1.2 of the Company's Annual Report on Form 10-K filed for on March 6, 2015). |
10.1.1 | Amendment No. 1 to Restated Credit Agreement, dated as of April 29, 2015, by and among the Company, Bank of America, N.A., as administrative agent, an issuing lender and wing-line lender; Wells Fargo Bank, N.A., as an issuing lender and syndication agent; U.S. Bank National Association, First Hawaiian Bank and BMO Harris Bank N.A., as co-documentation agents; Merrill Lynch, Pierce, Fenner & Smith Incorporated, Wells Fargo Securities LLC and J.P. Morgan Securities LLC, as joint lead arrangers and joint book managers, and the lenders party thereto (incorporated by reference to exhibit 10.1 of the Company's Current Report on Form 8-K filed on May 1, 2015). | |
10.2 | Confirmation of Interest Rate Swap Transaction, dated as of October 25, 2012, between the Company and Bank of America, N.A. (incorporated by reference to exhibit 10.4 of the Company's Quarterly Report on Form 10-Q filed for September 30, 2012). | |
10.3 | Confirmation of Interest Rate Swap Transaction, dated as of October 25, 2012, between the Company and JPMorgan Chase Bank, N.A. (incorporated by reference to exhibit 10.5 of the Company's Quarterly Report on Form 10-Q filed for September 30, 2012). | |
10.4 | Confirmation of Interest Rate Swap Transaction, dated as of October 25, 2012, between the Company and PNC Bank, N.A. (incorporated by reference to exhibit 10.6 of the Company's Quarterly Report on Form 10-Q filed for September 30, 2012). | |
10.5 | + | Deferred Compensation Agreement dated as of August 1, 1999, between the Company and James A. Wilhelm (incorporated by reference to exhibit 10.7 of the Company's Annual Report on Form 10-K filed on March 15, 2012). |
10.5.1 | + | First Amendment to Deferred Compensation Agreement dated January 25, 2012, between the Company and James A. Wilhelm (incorporated by reference to exhibit 10.7.1 of the Company's Annual Report on Form 10-K filed on March 15, 2012). |
10.6 | + | Employment Agreement dated May 18, 1998 between the Company and Robert N. Sacks (incorporated by reference to exhibit 10.24 of the Company's Annual Report on Form 10-K filed for December 31, 2001). |
89
Exhibit Number | Description | |
10.6.1 | + | First Amendment to Employment Agreement dated as of November 7, 2001 between the Company and Robert N. Sacks (incorporated by reference to exhibit 10.25 of the Company's Annual Report on Form 10-K filed for December 31, 2001). |
10.6.2 | + | Second Amendment to Employment Agreement dated as of August 1, 2003 between the Company and Robert N. Sacks (incorporated by reference to exhibit 10.7.2 of the Company's Registration Statement on Form S-1, File No. 333-112652, filed on February 10, 2004). |
10.6.3 | + | Third Amendment to Employment Agreement dated as of April 1, 2005 between the Company and Robert N. Sacks (incorporated by reference to exhibit 10.7.3 of the Company's Annual Report on Form 10-K filed on March 13, 2009). |
10.6.4 | + | Fourth Amendment to Employment Agreement dated as of December 29, 2008 between the Company and Robert N. Sacks (incorporated by reference to exhibit 10.7.4 of the Company's Annual Report on Form 10-K filed on March 13, 2009). |
10.6.5 | + | Fifth Amendment to Employment Agreement dated as of January 28, 2009 between the Company and Robert N. Sacks (incorporated by reference to exhibit 10.7.5 of the Company's Annual Report on Form 10-K filed on March 13, 2009). |
10.6.6 | +* | Sixth Amendment to Employment Agreement dated as of February 16, 2017 between the Company and Robert N. Sacks. |
10.7 | + | Amended and Restated Executive Employment Agreement dated as of December 1, 2002 between the Company and John Ricchiuto (incorporated by reference to exhibit 10.22.2 of the Company's Annual Report on Form 10-K filed for December 31, 2002). |
10.7.1 | + | First Amendment to Amended and Restated Executive Employment Agreement dated as of April 11, 2005, between the Company and John Ricchiuto (incorporated by reference to exhibit 10.3 of the Company's Current Report on Form 8-K filed on March 7, 2005). |
10.7.2 | + | Second Amendment to Employment Agreement dated as of December 28, 2008 between the Company and John Ricchiuto (incorporated by reference to exhibit 10.10.2 to the Company's Annual Report on Form 10-K filed for December 31, 2012). |
10.7.3 | + | Third Amendment to Employment Agreement dated as of April 2, 2012 between the Company and John Ricchiuto (incorporated by reference to exhibit 10.8 to the Company's Quarterly Report on Form 10-Q filed for June 30, 2012). |
10.8 | + | Amended and Restated Executive Employment Agreement between the Company and G Marc Baumann dated November 19, 2014 effective as of January 1, 2015 (incorporated by reference to exhibit 10.12 of the Company's Annual Report on Form 10-K filed on March 6, 2015). |
10.9 | + | Amended and Restated Executive Employment Agreement dated as of March 1, 2005, between the Company and Thomas L. Hagerman (incorporated by reference to exhibit 10.1 of the Company's Current Report on Form 8-K filed on March 7, 2005). |
10.9.1 | + | First Amendment to Amended and Restated Executive Employment Agreement dated October 1, 2007 between the Company and Thomas Hagerman (incorporated by reference to exhibit 10.1 to the Company's Quarterly Report on Form 10-Q filed for September 30, 2007). |
10.9.2 | + | Second Amendment to Employment Agreement dated as of December 29, 2008 between the Company and Thomas L. Hagerman (incorporated by reference to exhibit 10.14.2 to the Company's Annual Report on Form 10-K filed for December 31, 2012). |
10.9.3 | + | Third Amendment to Employment Agreement dated as of April 2, 2012 between the Company and Thomas L. Hagerman (incorporated by reference to exhibit 10.7 to the Company's Quarterly Report on Form 10-Q filed for June 30, 2012). |
10.10 | + | Executive Employment Agreement dated March 15, 2005 between the Company and Gerard M. Klaisle (incorporated by reference to exhibit 10.14 of the Company's Annual Report on Form 10-K filed on March 12, 2010). |
10.10.1 | + | First Amendment to Amended and Restated Executive Employment Agreement dated December 29, 2008 between the Company and Gerard M. Klaisle (incorporated by reference to exhibit 10.14.1 of the Company's Annual Report on Form 10-K filed on March 12, 2010). |
90
Exhibit Number | Description | |
10.10.2 | + | Second Amendment to Amended and Restated Executive Employment Agreement dated July 28, 2011 between the Company and Gerald M. Klaisle (incorporated by reference to exhibit 10.3 to the Company's Quarterly Report on Form 10-Q filed on November 7, 2011). |
10.10.3 | +* | Third Amendment to Amended and Restated Executive Employment Agreement dated February 16, 2017 between the Company and Gerald M. Klaisle. |
10.11 | + | Employment Agreement, dated as of September 10, 2012, between the Company and William Bodenhamer (incorporated by reference to exhibit 10.7 to the Company's Quarterly Report on Form 10-Q filed for September 30, 2012). |
10.12 | + | Employment Agreement, dated as of February 15, 2017, between the Company and Rob Toy (incorporated by reference to exhibit 10.9 to the Company's Quarterly Report on Form 10-Q filed for September 30, 2012). |
10.12.1 | +* | Employment Agreement, dated as of September 10, 2012, between the Company and Rob Toy. |
10.13 | + | Employment Agreement effective as of March 3, 2014 by and between the Company and Vance C. Johnston (incorporated by reference to exhibit 10.1 of the Company's Current Report on Form 1-K/A filed on March 31, 2014). |
10.14 | + | Employment Agreement between the Company and Hector Chevalier dated July 14, 2014 and made effective as of July 1, 2014 (incorporated by reference to exhibit 10.1 of the Company's Current Report on Form 8-K filed on July 17, 2014). |
10.15 | + | Long-Term Incentive Plan dated as of May 1, 2004 (incorporated by reference to exhibit 10.12 of Amendment No. 1 to the Company's Registration Statement on Form S-1, File No. 333-112652, filed on May 10, 2004). |
10.15.1 | + | Long-Term Incentive Plan Amendment effective as of April 22, 2008 (incorporated by reference to Appendix B of the Company's 2008 Proxy on Form DEF 14A, filed on April 1, 2008). |
10.16 | + | Form of Performance Share Agreement between the Company and Recipient (incorporated by reference to exhibit 4.1 of the Company's Annual Report on Form 10-K filed on March 1, 2016). |
10.17 | + | Form of the Company's Restricted Stock Unit Agreement dated as of July 1, 2008 (incorporated by reference to exhibit 10.1 of the Company's Current Report on Form 8-K filed on July 2, 2008). |
10.17.1 | + | First Amendment to Form of the Company's Restricted Stock Unit Agreement (incorporated by reference to exhibit 10.1 of the Company's Current Report on Form 8-K as filed on August 6, 2009). |
10.17.2 | + | Second Amendment to Form of the Company's Restricted Stock Unit Agreement dated May 27, 2011 (incorporated by reference to exhibit 10.1 of the Company's Current Report on Form 8-K filed on June 2, 2011). |
10.18 | Office Lease dated as of October 31, 2012 between the Company and Piedmont—Chicago Center Owner, LLC (incorporated by reference to exhibit 10.23 of the Company's Annual Report on Form 10-K filed for December 31, 2013). | |
10.19 | Office Lease dated as of October 17, 2013 between the Company and Riverview Business Center I & II, LLC (incorporated by reference to exhibit 10.23 of the Company's Annual Report on Form 10-K filed for December 31, 2013). | |
10.20 | Form of Property Management Agreement (incorporated by reference to exhibit 10.30 of the Company's Annual Report on Form 10-K filed on March 10, 2006). | |
10.21 | Guaranty Agreement of APCOA/Standard Parking, Inc. dated as of March 2000 to and for the benefit of the State of Connecticut, Department of Transportation (incorporated by reference to exhibit 10.27 of the Company's Annual Report on Form 10-K filed on March 13, 2009). | |
10.22 | Construction, Financing and Operating Special Facility Lease Agreement dated as of March 2000 between the State of Connecticut Department of Transportation and APCOA Bradley Parking Company, LLC (incorporated by reference to exhibit 10.28 of the Company's Annual Report on Form 10-K filed on March 13, 2009). | |
10.23 | Trust Indenture dated March 1, 2000 between State of Connecticut and First Union National Bank as Trustee (incorporated by reference to exhibit 10.29 of the Company's Annual Report on Form 10-K filed on March 13, 2009). | |
10.24 | Agreement and Plan of Merger, dated February 28, 2012, by and among the Company, Hermitage Merger Sub, Inc., KCPC Holdings, Inc. and Kohlberg CPC Rep., L.L.C. (incorporated by reference to exhibit 10.1 of the Company's Current Report on Form 8-K filed on February 29, 2012). The schedules and exhibits to the Agreement and Plan of Merger have been omitted from this filing pursuant to Item 601(b)(2) of Regulation S-K but will be provided supplemental to the SEC upon request. | |
91
Exhibit Number | Description | |
10.25 | The Closing Agreements, dated February 28, 2012, between the Company and each of Lubert-Adler Real Estate Fund V, L.P. and Lubert-Adler Real Estate Parallel Fund V, L.P. (incorporated by reference to exhibit 10.2 of the Company's Current Report on Form 8-K filed on February 29, 2012). | |
10.26 | The Closing Agreements, dated February 28, 2012, between the Company and each of Kohlberg Investors V, L.P., Kohlberg TE Investors V, L.P., Kohlberg Partners V, L.P., Kohlberg Offshore Investors V, L.P. and KOCO Investors V, L.P. (incorporated by reference to exhibit 10.3 of the Company's Current Report on Form 8-K filed on February 29, 2012). | |
10.27 | The Closing Agreements, dated February 28, 2012, between the Company and each of Versa Capital Fund I, L.P. and Versa Capital Fund I Parallel, L.P. (incorporated by reference to exhibit 10.4 of the Company's Current Report on Form 8-K filed on February 29, 2012). | |
10.28 | Closing Agreement, dated as of October 2, 2012, between the Company and Kohlberg CPC Rep, LLC (incorporated by reference to exhibit 10.2 of the Company's Current Report on Form 8-K filed on October 2, 2012). | |
10.29 | Closing Agreement, dated as of October 2, 2012, between the Company and 2929 CPC HoldCo, LLC (incorporated by reference to exhibit 10.3 of the Company's Current Report on Form 8-K filed on October 2, 2012). | |
10.30 | Closing Agreement, dated as of October 2, 2012, between the Company and VCM STAN-CPC Holdings, LLC (incorporated by reference to exhibit 10.4 of the Company's Current Report on Form 8-K filed on October 2, 2012). | |
10.31 | Closing Agreement, dated as of October 2, 2012, between the Company and West-FSI, LLC (incorporated by reference to exhibit 10.5 of the Company's Current Report on Form 8-K filed on October 2, 2012). | |
10.32 | Closing Agreement, dated as of October 2, 2012, between the Company and Sailorshell and Co. (incorporated by reference to exhibit 10.6 of the Company's Current Report on Form 8-K filed on October 2, 2012). | |
10.33 | Closing Agreement, dated as of October 2, 2012, between the Company and CP Klaff Equity LLC (incorporated by reference to exhibit 10.7 of the Company's Current Report on Form 8-K filed on October 2, 2012). | |
10.34 | Closing Agreement, dated as of October 2, 2012, between the Company and Jumpstart Development LLC (Worldwide) (incorporated by reference to exhibit 10.8 of the Company's Current Report on Form 8-K filed on October 2, 2012). | |
10.35 | Settlement Agreement, dated as of December 15, 2016, between the Company and Kohlberg CPC Rep, L.L.C., KOCO Investors V, L.P., Kohlberg Offshore Investors V, L.P., Kohlberg Investors V, L.P., Kohlberg Partners V, L.P., Kohlberg TE Investors V, L.P., Versa Capital Fund I, L.P., Versa Capital Fund I Parallel, L.P., Lubert-Adler Real Estate Fund V, L.P., Lubert-Adler Real Estate Parallel Fund V, L.P., and other former Central stockholders (incorporated by reference to exhibit 10.1 of the Company's Current Report on Form 8-K filed on January 17, 2017). | |
14.1 | Code of Ethics (incorporated by reference to exhibit 14.1 of the Company's Annual Report on Form 10-K for December 31, 2002). | |
21 | * | Subsidiaries of the Company. |
23 | * | Consent of Independent Registered Public Accounting Firm dated as of February 23, 2017. |
31.1 | * | Section 302 Certification dated February 23, 2017 for G Marc Baumann, Director, President and Chief Executive Officer (Principal Executive Officer). |
31.2 | * | Section 302 Certification dated February 23, 2017 for Vance C. Johnston, Executive Vice President, Chief Financial Officer and Treasurer (Principal Financial Officer). |
31.3 | * | Section 302 Certification dated February 23, 2017 for Kristopher H. Roy, Vice President Corporate Controller and Assistant Treasurer (Principal Accounting Officer and Duly Authorized Officer). |
32 | ** | Certification pursuant to 18 USC Section 1350, as adopted pursuant to Section 906 of the Sarbanes-Oxley Act of 2002, dated February 23, 2017. |
101.INS | * | XBRL Instance Document. |
101.SCH | * | XBRL Taxonomy Extension Schema. |
101.CAL | * | XBRL Taxonomy Extension Calculation Linkbase. |
101.DEF | * | XBRL Taxonomy Extension Definition Linkbase. |
101.LAB | * | XBRL Taxonomy Extension Label Linkbase. |
92
Exhibit Number | Description | |
101.PRE | * | XBRL Taxonomy Extension Presentation Linkbase. |
_______________________________________________________________________________
* Filed herewith.
** Furnished herewith.
+ Management contract or compensation plan, contract or agreement.
^ Confidential treatment has been granted with respect to certain portions of this Exhibit pursuant to a confidential treatment order granted by the Securities and Exchange Commission. Omitted portions have been separately filed with the Securities and Exchange Commission.
93